Proceedings of the 4th International Multi-Conference on Society, Cybernetics, and Informatics...
328
Transcript of Proceedings of the 4th International Multi-Conference on Society, Cybernetics, and Informatics...


Copyright and Reprint Permission: Abstracting is permitted with credit to
the source. Libraries are permitted to photocopy for private use.
Instructors are permitted to photocopy, for private use, isolated articles
for non-commercial classroom use without fee. For other copies, reprint,
or republication permission, write to IIIS Copyright Manager, 13750
West Colonial Dr Suite 350 – 408, Winter Garden, Florida 34787, U.S.A.
All rights reserved. Copyright 2010. © by the International Institute of
Informatics and Systemics.
The papers of this book comprise the proceedings of the conference
mentioned on the title and the cover page. They reflect the authors’
opinions and, with the purpose of timely disseminations, are published as
presented and without change. Their inclusion in these proceedings does
no necessarily constitute endorsement by the editors.
ISBN-13: 978-1-936338-04-7 (Collection) ISBN-13: 978-1-936338-05-4 (Volume I)
COPYRIGHT
Alvarado Moore, Karla University of Central Florida USA Chen, Chie Bein Takming University of Science and Technology Taiwan Chiang, Miao-Chen Tamkang University Taiwan Ganchev, Ivan University of Limerick Ireland Hass, Douglas A. Image Stream USA Jones-Woodham, Greer The University of the West Indies Trinidad and Tobago Lin, Jyh-Jiuan Tamkang University Taiwan Machotka, Jan University of South Australia Australia Nedic, Zorica University of South Australia Australia Petit, Frédéric École Polytechnique de Montréal Canada Powers, Tina Abilene Christian University USA Rauch, Allen G. Molloy college USA Robert, Benoît École Polytechnique de Montréal Canada Schiering, Marjorie S. Mlolloy College USA Suzuki, Motoyuki Tohoku University Japan Tait, Bill COLMSCT UK Tucker, Gary R. Abilene Christian University USA Zaretsky, Esther Academic College for Education Givat Washington Israel
Abdel-Qader, Ikhlas Western Michigan University USA Amaral, Luis Universidade do Minho Portugal Brooom, Mark University of Glamorgan UK Cordeiro, Paula Universidade Técnica de Lisboa Portugal Cost, Richard Johns Hopkins University Applied Physics Laboratory USA El-Gamily, Hamdy Kuwait Institute for Scientific Research Kuwait Elías Hardy, Lidia Lauren Instituto Superior de Tecnologías y Ciencias Aplicadas Cuba Fillion, Gerard University of Moncton Canada Guo, Gongde Fujian Normal University China Huang, Hsiu-Mei National Taichung Institute of Technology Taiwan Hussain, Aini University Kebangsaan Malaysia Jonson, Mark University of New Mexico USA Josanov, Borislav Novi Sad Higher School of Professional Business Studies Serbia
The 4th International Multi-Conference on Society, Cybernetics and Informatics: IMSCI 2010
HONORARY PRESIDENT William Lesso
GENERAL CHAIRS
Nagib Callaos Andrés Tremante
ORGANIZING COMMITTEE CHAIRS
Angel Oropeza José Vicente Carrasquero
PROGRAM COMMITTEE Chair(s): Freddy Malpica (Venezuela) Friedrich Welsch (Venezuela)
ADDITIONAL REVIEWERS

Khechine, Hager Laval University Canada Kim, E-Jae LG Electronics Institute of Technology South Korea Lasmanis, Aivars University of Latvia Latvia Lawler, James Pace University USA Lind, Nancy Illinois State University USA Mihaita, Niculae University of Economics Studies Romania Mitchell, Charles Grambling State University USA Mondéjar-J., Juan-Antonio University of Castilla-La Mancha Spain Olatokun, Wole University of Botswana Botswana Orsitto, Fulvio University of Connecticut USA Potorac, Alin Dan University of Suceava Romania Sala, Nicoletta Universitá della Svizzera Italiana Italy Snow, Richard Embry-Riddle Aeronautical University USA Toledo, Cheri Illinios State University USA Tucker, Gary R Abilene Christian University USA Vandeyar, Thiru University of Pretoria South Africa Welsch, Friedrich Universidad Simón Bolívar Venezuela Yu, Chong Ho University of California USA
Anderson, Lisa Arizona State University USA Bárcena Madera, Elena UNED Spain Biswas, Rakesh People`s College of Medical Sciences India Bjorndal, Cato R. P. University of Tromsoe Norway Bouseh, Sheila McMaster University Canada Chayawan, Chirasil King Monkut University of Technology at Thonburi Taiwan Debono, Carl J. University of Malta Malta Garcia, Kimberly McMaster University Canada Grand, Balu University of Botswana Botswana Iovan, Stefan Romanian Railway IT Company Romania Jorosi, Boemo University of Botswana Botswana Lasmanis, Aivars University of Latvia Latvia Livemore, Celia Romm Wayne State University USA Mondéjar-J., Juan-A University of Castilla-La Mancha Spain Noruzi, Alireza Tehran University Iran Ortega Sánchez, Isabel UNED Spain Popentiu, Florin University of Oradea Denmark Sarbadhikari, Supten Institute of Medical Science and Research India Sjoevoll, Jarle Bodoe University College Norway Sosa, Juan University of Turabo Puerto Rico Stanescu, Emil National Institute for Research and Development in
Informatics Romania
ADDITIONAL REVIEWERS FOR THE NON-BLIND REVIEWING

Aguirre-Muñoz, Zenaida Texas Tech University USA Alvarado Moore, Karla University of Central Florida USA Belcher, E. Christina Trinity Western University Canada Bennett, Leslie University of Louisville USA Bidarra, José Universidade Aberta Portugal Burke, David Robert Morris University USA Burnett, Andrea University of the West Indies Barbados Carter, Roger Rösjöskolan Sweden Desa, Shakinaz Universiti Pendidikan Sultan Idris Malaysia Diehl, Lori University of Cincinnati USA Dosi, Vasiliki University of Ioannnina Greece Dunning, Jeremy Indiana University USA Edwards, Stephen H. Virginia Tech USA Eye, John Southern Utah University USA Fisher, Wendy The Open University UK Fox, Kelly Texas Tech University USA Ganchev, Ivan University of Limerick Ireland Goulding, Tom Daniel Webster College USA Grincewicz, Amy University of Cincinnati USA Hendel, Russell Jay Towson University USA Henninger, Michael PH Weingarten Germany Herget, Josef University of Applied Sciences Switzerland Hodge, Diane M. Radford University USA Ito, Akinori Tohoku University Japan Jones, Paul University of Cincinnati USA Joordens, Steve University of Toronto Scarborough Canada Karamat, Parwaiz The Open Polytechnic of New Zealand New Zealand Krakowska, Monika Jagiellonian University Poland Kutter, Anna K. PH Weingarten Germany Livne, Nava L. University of Utah USA Livne, Oren E. University of Utah USA Lowe, John University of Bath UK Lowry, Pam Lawrence Technological University USA Machotka, Jan University of South Australia Australia Mackrill, Duncan University of Sussex UK Marino, Mark Erie County Community College USA Mehrabian, Ali University of Central Florida USA Nahmens, Isabelina University of South Florida USA Nave, Felecia M. Prairie View A & M University USA Nedic, Zorica University of South Australia Australia Olla, Phillip Madonna University USA Ozdemir, Ahmet S. Marmara University Turkey
PROGRAM COMMITTEE
Chairs: Friedrich Welsch (Venezuela)
José Vicente Carrasquero (Venezuela)

Paré, Dwayne E. University of Toronto Scarborough Canada Pfeifer, Michael Technical University of Dortmund Germany Phillips, C. Dianne NorthWest Arkansas Community College USA Salazar, Dora Texas Tech University USA Schrader, P. G. University of Nevada USA Sert, Yasemin University of South Florida USA Shaw, Jill The Open University UK Soeiro, Alfredo University Porto Portugal Suzuki, Motoyuki Tohoku University Japan Swart, William East Carolina University USA Tait, Bill COLMSCT UK Taylor, Stephen Sussex University UK Teng, Chia-Chi Brigham Young University USA Traum, Maria Johannes Kepler University Austria Vaughn, Rayford B. Mississippi State University USA Voss, Andreas Dortmund University of Technology Germany Wells, Harvey King's College London UK Woodthorpe, John The Open University UK Yu, Xin University of Bath UK Zaretsky, Esther Academic College for Education Givat Washington Israel Zydney, Janet Mannheimer University of Cincinnati USA

Abar, Celina Pontifical Catholic University of São Paulo Brazil Abdel Hafez, Hoda Suez Canal University Egypt Adoghe, Loretta Miami Dade College USA Agbonlahor, Rosemary University of Ibadan Nigeria Akbari M., Ayyoub Universiti Putra Malaysia Malaysia Ali, Naglaa American Educational Research Association Egypt Ally, Mohamed Athabasca University Canada An, Shuhua California State University USA Andone, Ioan University of Iasi Romania Andreopoulou, Z. Aristlote University of Thessaloniki Greece Annamalai, Jagan Invensys Process Systems USA Ariton, Viorel Danubius University Romania Arsov, Silyan University of Ruse Bulgaria Auer, Michael E. Carinthia Tech Institute Austria Bahieg, Hatem Ain Shams University Egypt Balicki, Jerzy Marian Technology University of Gdansk Poland Bang, Jørgen Aarhus University Denmark Barreiras, Alcinda ISEP Polythecnic School of Engineer Portugal Batovski, Dobri A. Assumption University Thailand Baturay, Meltem Huri Gazi University Turkey Baysal, Ugur Hacettepe University Turkey Beierschmitt, Penny Lockheed Martin Corporation USA Belderrain, Carmen Instituto Tecnológico de Aeronáutica Brazil Beligiannis, Grigorios University of Ioannina Greece Berge, Zane UMBC USA Bernsteiner, Reinhard Management Center Innsbruck Austria Beycioglu, Kadir Inonu University Turkey Bhuvaneswaran, R. S. Anna University India Bohemia, Erik Northumbria University UK Bolyard, John University of West Florida USA Bonicoli, Marie Paule Groupe ESC Rouen France Bordogna, Roberto Istituto Superiore di Studi Avanzati Italy Boumedine, Marc University of the Virgin Islands Virgin Islands (U.S.) Braga G., Tânia Maria Universidade Federal do Paraná Brazil Breczko, Teodor University of Bialystok Poland Brodnik, Andrej Andy University of Primorska Slovenia Bruciati, Antoinette Sacred Heart University USA Buglione, Luigi Université du Québec à Montréal Canada Byrne, Roxanne University of Colorado USA Cakir, Mustafa Anadolu University Turkey Caldararu, Florin ECOSEN Ltd. Romania Camilleri, Mario University of Malta Malta Canalda, Philippe l'Université de Franche-Comté France Caner, Mustafa Academician at Anadolu University Turkey Cardona, Cristina M. University of Alicante Spain Castaneda, Sandra Autonomus University of Mexico Mexico Chang, Chi-Cheng Lunghwa University of Science and Technology Taiwan Chang, Maiga Chung-Yuan Christian University Taiwan
ADDITIONAL REVIEWERS

Chang, Wei-Chih Alec Ursuline College of Foreign Languages Taiwan Chau, K. W. Hong Kong Polytechnic University Hong Kong Chaudhry, Abdus Kuwait University Kuwait Chen, Chau-Kuang Meharry Medical College USA Cheng, Tsung-Chi National Chengchi University Taiwan Cheung, Yin Ling Purdue University USA Chiang, Chia-Chu University of Arkansas at Little Rock USA Chu, Louis The Hong Kong Polytechnic University Hong Kong Comi, Giorgio Swiss Federal Institute Vocational Educational and Training Switzerland Coppola, Jean Pace University USA Costa, Mónica Polytechnic Institute of Castelo Branco Portugal Cubukcu, Feryal Dokuz Eylul University Turkey Del Valle, María Universidad de Concepción Chile Delgado, Alberto National University of Colombia Colombia Demiray, Ugur Anadolu University Turkey Deng, Hepu RMIT University Australia Devlin, Marie Newcastle University UK Dingu-Kyrklund, Elena Stockholm University Sweden Du, Hongliu Caterpillar Inc. USA Duhaney, Devon State University of New York USA Duignan, Sean Galway-Mayo Institute of Technology Ireland Dukic, Darko Josip Juraj Strossmayer University Croatia Dukic, Gordana Abacus Tuition Croatia Edwards-H., Anna-M. The University of the West Indies Trinidad and Tobago Ekstrom, Joseph Brigham Young University USA El Kashlan, Ahmed Academy for Science and Technology Egypt Encabo, Eduardo Universidad de Murcia Spain Erbacher, Robert Utah State University USA Escudeiro, Nuno Instituto Superior de Engenharia do Porto Portugal Esperancini, Maura Universidade Estadual Paulista Brazil Eze, Uchenna Nanyang Technological University Singapore Faggiano, Eleonora University of Bari Italy Federici, Stefano University of Perugia Italy Fernández-R., Florentino University of Vigo Spain Fischer, Jerry University of Texas-Pan American USA Fitzgerald, Alan Kingston University UK Flores, Juan University of Michoacan Mexico Florescu, Gabriela ICI Romania Fonseca F., Nuno M. Institute of Engineering of Coimbra Portugal Fougeres, Alain-Jerome Université de Technologie de Belfort-Montbéliard France Frizell, Sherri Prairie View AM University USA Frosch-Wilke, Dirk University of Applied Sciences Germany Fuster-Sabater, Amparo Institute of Applied Physics Spain Gallego A., María Jesús Universidad de Granada Spain Ganeshan, Kathiravelu Unitec New Zealand New Zealand Garcia-Otero, Singli Virginia State University USA Garrity, Edward Canisius College USA Ghaddar, Nesreen American University of Beirut Lebanon Gharsallah, Ali Laboratoire d'Electronique Tunisia Ghislandi, Patrizia University of Trento Italy Giurgiu, Mircea Technical University of Cluj-Napoca Romania Goldberg, Robert CUNY USA González, Fermín Public University of Navarra Spain Goodwin, Dave National Energy Research Scientific Computing USA Gorge, Najah Technical University Komsomolisky USA Grange, Teresa Università della Valle d`Aosta Italy Guasch, Teresa Open University of Catalonia Spain

Hadjerrouit, Said University of Agder Norway Hansen, Paul University of Otago New Zealand Harichandan, D. University of Mumbai India Hart, Alexis Virginia Military Institute USA Hartley, Roger Leeds University UK Hasnaoui, Salem ENIT Tunisia Hellstern, Gerd M. University Kassel Germany Herrera, Oriel Universidad Católica de Temuco Chile Ho, Imran Universiti Kebangsaan Malaysia Malaysia Holifield, David University of Wales Institute Cardiff UK Hou, Jianjun Peking University China Hovakimyan, Anna Yerevan State University Armenia Hsieh, Kun-Lin Johnny Nanhua University Taiwan Hsu, Meihua Chang Gung Institute of Technology Taiwan Huang, Hsiu-Mei Amy National Taichung Institute of Technology Taiwan Hudson, Clemente Valdosta State University USA Hussain, Aini University Kebangsaan Malaysia Ibrahim, Hamidah Universiti Putra Malaysia Idowu, Adebayo Peter Obafemi Awolowo University Nigeria Ikeguchi, Cecilia Tsukuba Gakuin University Japan Ionita, Angela Romanian Academy Romania Ismail, Maizatul Akmar University of Malaya Malaysia Ismail, Zuraini University Technology of Malaysia Malaysia Izydorczyk, Jacek Silesian University of Technology Poland Jääskeläinen, Anssi Lappeenranta University of Technology Finland Jackson, Stoney Western New England College USA Janota, Ales Žilinská Univerzita Slovakia Jara Guerrero, Salvador University of Michoacan Mexico Jelinek, Ivan Czech Technical University in Prague Czech Republic Jong, BinShyan Chung Yuan Christian University Taiwan Juárez-Ramírez, Reyes Universidad Autónoma de Baja California Mexico Juiz, Carlos University of Balearic Islands Spain Kaino, Luckson University of Botswana Botswana Kalwinsky, Bob New Media at Middle Tennessee State University USA Kang, Haijun Jackson State University USA Kaur, Kiran University of Malaya Malaysia Kilic, Eylem Middle East Technical University Turkey Kim, Dongsik Hanyang University South Korea Kim, E-Jae LG Electronics Institute of Technology South Korea Kim, Hanna DePaul University USA Koc, Mustafa Suleyman Demirel University Turkey Komar, Meir Jerusalem College of Technology Israel Koshy, Swapna University of Wollongong in Dubai UAE Kourik, Janet Webster University USA Kropid, Wendy University of Wisconsin USA Kruger, Marlena University of Johannesburg South Africa Kundu, Anirban West Bengal University of Technology India Kurlyandskaya, Galina Basque Country University Spain Kurubacak, Gulsun Anadolu University Turkey Lakhan, Shaheen Global Neuroscience Initiative Foundation USA Lam, Ineke Utrecht University IVLOS Netherlands Lara, Soni University of Navarra Spain Laverick, De Anna Indiana University of Pennsylvania USA Law, Rob Hong Kong Polytechnic University Hong Kong Lawler, James Pace University USA Leng, Ho Keat Republic Polytechnic Singapore Letia, Tiberiu Technical University of Cluj-Napoca Romania

Li, Hongyan Peking University China Li, Jingyi University of Maryland USA Liaw, Shu-Sheng China Medical University Taiwan Liu, Eric Zhi-Feng National Central University Taiwan Lizano-DiMare, Maria Sacred Heart University USA Logan, Kerina Massey University New Zealand Loidl, Susanne Johannes Kepler University Linz Austria López-Cuadrado, Javier University of the Basque Country Spain Lowes, Susan Columbia University USA Macianskiene, Nemira Vytautas Magnus University Lithuania Madsen, Leza Western Washington University USA Mahanti, Prabhat University of New Brunswick Canada Maldonado, Calixto Universidad Empresarial Siglo 21 Argentina Manias, Elizabeth University of Melbourne Australia Marchisio, Susana Universidad Nacional de Rosario Argentina Martin, José F. Comisión Nacional de Evaluación y Acreditación Universitaria Argentina Martinez, Liliana Inés UNICEN Argentina Maurino, Paula Farmingdale State College USA Mbale, Jameson University of Namibia Namibia McConnell, Rodney University of Idaho USA McKay, Elspeth RMIT University Australia McMahon, Ellen National-Louis University USA McWright, Mac Nova Southeastern University USA Meisalo, Veijo University of Helsinki Finland Mendoza-H., Juana New Mexico State University USA Meneses, Jorge University of California USA Meskens, Ad Artesis Hogeschool Antwerpen Belgium Mhlolo, Michael Marang Centre for Mathematics South Africa Michaelides, Panagiotis University of Crete Greece Mihir, Fnu Southeastern Louisiana University USA Miller, Karen Hughes University of Louisville USA Miller, Margery Gallaudet University USA Moch, Peggy Valdosta State University USA Mohamed, Jedra University in Rabat Morocco Monney Paiva, Joao Polytechnic of Viseu Portugal Morgado, Lina Universidade Aberta Portugal Moses, Mbangwana Educational Research Network for West and Central Africa Cameroon Mueller, Julie Wilfrid Laurier University Canada Mullins, Michael University of Aalborg Denmark Muraszkiewicz, M. University of Warsaw Poland Nickerson, Matt Southern Utah University USA Nicu, Bizon University of Pitesti Romania Nikolarea, Ekaterini University of the Aegean Greece Noordin, Nooreen Universiti Putra Malaysia Malaysia Norton, Lin Liverpool Hope University UK Nugraheni, Cecilia E. Parahyangan Catholic University Indonesia O`Meara, Peter Charles Sturt University Australia Ok, Ahmet Middle East Technical University Turkey Olatokun, Wole University of Botswana Botswana Olivetti B., Marta Università di Roma Italy Omar, Nasiroh Universiti Teknologi Mara Malaysia Orsitto, Fulvio California State University USA Osunade, Seyitan University of Ibadan Nigeria Panke, Stefanie Institut fuer Wissensmedien Germany Parsell, Mitch Macquarie University Australia Pereira, Claudia T. UNICEN Argentina Pérez R., Marta Universidade de Vigo Spain

Pessoa, Fernando Federal University of Rio de Janeiro Brazil Pester, Andreas Carinthia Tech Institute Austria Pettigrew, François Télé-Université Canada Pinkwart, Niels Clausthal University of Technology Germany Pinto Ferreira, Eduarda Polytechnic Institute of Porto Portugal Piu, Carmelo University of Calabria Italy Poobrasert, Onintra National Electronics and Computer Technology Center Thailand Popescu, Diana University Politehnica of Bucharest Romania Post, Paul The Ohio State University USA Potorac, Alin Dan University of Suceava Romania Prata, Alcina Universidade Autónoma de Lisboa Portugal Precup, Radu-Emil Politehnica University of Timisoara Romania Prodan, Augustin Iuliu Hatieganu University Romania Quintanar, Daniel Tucson Water Department USA Rabe, Vlasta University of Hradec Kralove Czech Republic Rahman, Hakikur Institute of Computer Management and Science Bangladesh Rahman, Mohammad University of Alberta Canada Rajamony, Bhuvenesh University Malaysia Perlis Malaysia Reis, Rosa Instituto Politecnico do Porto Portugal Resta, Marina University of Genova Italy Reyes, Maria Elena The University of Texas Pan American USA Reyes-M., Jorge Joel Universidad Autónoma Metropolitana Mexico Riihentaus, Juhani University of Oulu Finland Rimbau Gilabert, Eva Open University of Catalonia Spain Rizzo, Rosalba University of Messina Italy Rodi, Anthony California University of Pennsylvania USA Rodrigues, Teles Instituto Politécnico de Setúbal Portugal Roehrig, Christof University of Applied Sciences Dortmund Germany Roessling, Guido Darmstadt University Germany Rudd, Lauren Middle Tennessee State University USA Rutkowski, Jerzy Silesian University of Technology Poland Sabaliauskas, Tomas Vytautas Magnus University Lithuania Sami, Mariagiovanna Politecnico di Milano Italy Sanchis, Javier Universidad Politécnica de Valencia Spain Sanger, Patrick Alvin Community College USA Sanz-González, José L. Universidad Politécnica de Madrid Spain Sasaki, Hitoshi Takushoku University Japan Schoenacher, Sheryl Farmingdale State College USA Sh Adbullah, Siti A. University Technology Mara Malaysia Shabazz, Abdulalim Grambling State University USA Shieh, Meng-Dar National Cheng University Taiwan Sicilia, Miguel-Angel University of Alcala Spain Silber, Kevin Staffordshire University UK Skolud, Bozena Silesian University of Technology Poland Snow, Richard Embry-Riddle Aeronautical University USA Soutsas, Konstantinos Technological Educational Institution of Larissa Greece Spiteri, Louise Dalhousie University Canada Stefanov, Krassen Sofia University Bulgaria Stein, Sarah University of Otago New Zealand Stronck, David California State University USA Strydom, Esmarie North West University South Africa Sulema, Yevgeniya National Technical University of Ukraine Ukraine Suviniitty, Jaana Helsinki University of Technology Finland Svingby, Gunilla Malmö University Sweden Sweitzer, Emily California University of Pennsylvania USA Tan, Nusret Inonu University Turkey Tan, Ying Peking University China

Taylor, Stephen Army Learning Support Centre Canada Terziyan, Vagan University of Jyvaskyla Finland Thirunarayanan, M. O. Florida International University USA Thompson, Cecelia University of Arkansas USA Thorsos, Nilsa Azusa Pacific University USA Tobos, Valentina Lawrence Technological University USA Toledo, Cheri Illinios State University USA Torrisi-S., Geraldine Griffith University Australia Touma, Georges University of Ottawa Canada Tsaur, Woei-Jiunn Da-Yeh University Taiwan Tsoi, Mun Fie Nanyang Technological University Singapore Tuzun, Hakan Hacettepe University Turkey Ulovec, Andreas University of Vienna Austria Urtel, Mark Indiana University USA Vaida, Mircea-Florin Technical University of Cluj-Napoca Romania Valova, Irena University of Rousse Bulgaria Varner, Lynn Delta State University USA Varughese, Joe Northern Alberta Institute of Technology Canada Vemuri, Siva Ram Charles Darwin University Australia Venter, Elmarie University of Pretoria South Africa Verma, Lalji K Indian Society of Hospital Waste Management India Vintere, Anna Latvia University of Agriculture Latvia Von Pamel, Oscar Universidad Nacional de Rosario Argentina Wan Ali, Wan Zah University of Putra Malaysia Malaysia Wang, Ching-Huang National Formosa University Taiwan Wang, Feng-Hsu Ming-Chuan University Taiwan Wang, Jau-Shyong Shu-Te University Taiwan Wang, Jing Purdue University Indianapolis USA Wang, Yiqun Tianjin University China Wang, Zhigang Fort Valley State University USA Whatley, Janice University of Salford UK Williams V. R., Shahron George Mason University USA Williams, Christopher University of Foggia Italy Williams, Greg University of Maryland USA Wiriyasuttiwong, W. Srinakharinwirot University Thailand Wolfinger, Bernd E. University of Hamburg Germany Wu, Chu-Chu Georgia Southwestern State University USA Wu, Sean Tung-Xiung Shih Hsin University Taiwan Xenos, Michalis Hellenic Open University Greece Xia, Shunren Zhejiang University China Xie, Haiyan University of Arkansas at Little Rock USA Yildirim, Soner Middle East Technical University Turkey Yin, Peng-Yeng National Chi-Nan University Taiwan Yu, Chien Mississippi State University USA Yueh, Hsiu-Ping National Taiwan University Taiwan Zahran, Sami IBM Global Services UK Zainon H., Zaitul Azma Universiti Putra Malaysia Malaysia Zaliwski, Andrew City University of New York USA Zamora, Inmaculada Universidad del País Vasco Spain Zwaneveld, Bert Open University Netherlands

A. Aboueissa, AbouEl-M. University of Southern Maine USA Abbas, Suleiman Atlas Publishing International Iran Abd. Rahman, Fadzilah University Putra Malaysia Malaysia Abed Al Haq, Fawaz Al Al Bayt University Jordan Aberšek, Boris University of Maribor Slovenia Ahearn, Eileen M. National Association of State Directors of Special Education USA Ajidahun, Clement Adekunle Ajasin University UK Akbari M., Ayyoub Universiti Putra Malaysia Malaysia Al-Belsuhi, Taisira Sultan Qaboos University Oman Albon, Nerissa Monash University Australia Al-Hamadi, Ayoub University Magdeburg Germany Ali, Saqib Sultan Qaboos University Oman Alvarez, Miguel University of Guadalajara Mexico Ariton, Viorel Danubius University Romania Asif, Zaheeruddin Institute of Business Administration Pakistan Atwell, Ron University of Central Florida USA Auer, Michael E. Carinthia Tech Institute Austria Avis, James University of Huddersfield UK Backhouse, Judy Council on Higher Education South Africa Bahieg, Hatem Ain Shams University Egypt Baker, Susan Sacramento State University USA Balicki, Jerzy Marian Technology University of Gdansk Poland Bamberger, Honi Towson University USA Bandele, Samuel The University of Education Ghana Barcena, Elena Universidad Nacional de Educación a Distancia Spain Beabout, Brian University of New Orleans USA Beauford, Judith University of the Incarnate Word USA Beer, Martin Sheffield Hallam University UK Beierschmitt, Penny Lockheed Martin Corporation USA Bellamy, Al Eastern Michigan University USA Berger, Jean-Louis IFFP Switzerland Bhatkar, Vijay ETH India Bidarra, José Universidade Abierta Portugal Blair, Kristine Bowling Green State University USA Blatt, Inge University of Hamburg Germany Blaylock, Brian Brigham Young University USA Brand, Jeffrey E. Bond University Australia Bunker, Deborah University of Sydney Australia Campbell, Robert University of British Columbia Canada Carter, Beverly-Anne The University of the West Indies Trinidad and Tobago Cassidy, Arlene Stony Brook Southampton State University of NY USA Cavkaytar, Atilla Anadolu University Turkey Chayawan, Chirasil King Monkut University of Technology at Thonburi Thailand Chen, Alice Ching-Hui Ming Chuan University Taiwan Chen, Wenli Nanyang Technological University Singapore Cheng, An Oklahoma State University USA Cho, Jonathan National Cancer Institute USA Chou, Tung-Shan National Dong Hwa University Taiwan Cipollone, Piero Invalsi Italy Clark, Ted The University of Melbourne Australia Cohen, Sheila SUNY USA
ADDITIONAL REVIEWERS FOR THE NON-
BLIND REVIEWING

Connolly, Sally University of Houston USA Correa, Jose Miguel University of Pais Vasco Spain Costa, Manuel University Minho Portugal Courtney, James College of Business USA Curtis, Aaron Brigham Young University Hawaii USA Dahlgren, Lars-Ove Linköping University Sweden Davies, Bronwyn Melbourne University Australia Davies, Larry Miami Dade College USA Davis, Timothy Australian Catholic University Australia de Vries, Marc J. Delft University of Technology Netherlands Demetriou, Cynthia University of North Carolina USA Dennen, Vanessa Florida State University USA Devlin-Scherer, Roberta Seton Hall University USA Dostal, Petr Brno University of Technology Czech Republic Draper, Geoff Brigham Young University USA Duignan, Sean Galway-Mayo Institute of Technology Ireland Dunning, Jeremy Indiana University USA Edwards-H., Anna-May University of the West Indies Trinidad and Tobago El Gibali, Alaa University of Maryland USA Eriksson, Bengt Erik Tema Department Sweden Fabian, Myroslava Uzhgorod National University of Ukraine Russian Federation Fahiniai, Fatemah University of Tehran Iran Falorsi, Stefano ISTAT Italy Federman, Fran Farmingdale State College USA Fernandez, Eduardo Florida Atlantic University USA Ferrari, Pier Luigi Università degli Studi del Piemonte Orientale "Amedeo Avogadro" Italy Ferreira, Jo-Anne The University of the West Indies Trinidad and Tobago Fibi, Hans University of Teacher Education Austria Fitzgerald, Alan Kingston University UK Fortuny, Josep Mª Universitat Autònoma de Barcelona Spain Fregeau, Laureen University of South Alabama USA Gadd, Ian Bath Spa University UK Giovino, William Microcontroller USA Glazzard, Jonathan University of Huddersfield UK Guerra, Luigi Bologna University Italy Guo, Ruth Buffalo State College USA Hamlyn, Mike Staffordshire University UK Hanzalekj, Zdenek CTU Prague Czech Republic Hassan, Aminuddin University Putra Malaysia Malaysia Hasson, Tama UCLA USA Hernandez, Anita California Polytechnic State University USA Hockemeyer, Cord Cognitive Science Section Austria Hodell, Chuck University of Maryland USA Holmqvist, Mona Kristianstad University College Sweden Huang, Yu-Huang CTUST Taiwan Hubball, Harry University of British Columbia Canada Ishino, Masanori Yahoo! Japan Japan Izydorczyk, Jacek Silesian University of Technology Poland Jafarzadeh, Hamed University of New South Wales Australia Jensen, Marianne M. DHI Denmark Johnson, Lynn University of Colorado Denver USA Johnson, Rebekah Pace University USA Johnson, Tristan Florida State University USA Kang, David Kyungwoo Middle Georgia College USA Karran, Terence University of Lincoln UK Kayed, Ahmad Fahad Bin Sultan University Saudi Arabia Keengwe, Sagini J. University of North Dakota USA Kelly, Larry Texas A & M University USA Kilic, Eylem Middle East Technical University Turkey Kim, Ohoe Towson University USA

Klosowski, Piotr Silesian University of Technology Poland Koizumi, Rie Tokiwa University Japan Kravar Baksa, Marija PLIVA Croatia Kulba, Vladimir Institute of Management of Russian Academy of Science Russian Federation Lam, Ineke Utrecht University IVLOS Netherlands Lang, Fred Office of the Secretary US Department of the Commerce USA LaPorta, Madeline National Cancer Institute USA Laughlin, Daniel NASA USA Laverick, De Anna Indiana University of Pennsylvania USA Law, Rob The Hong Kong Polytechnic Hong Kong Li, Jen-Yi Nanyang Technological University Singapore Li, Xiaosong Unitec New Zealand New Zealand Libati, Hasting Copperbelt University Zambia Lin, Tzu-Bin Nanyang Technological University Singapore Liu, Yanheng Jilin University China Lonchamp, Jacques LORIA France Maboshe Libati, Hastings Copperbelt University Zambia Mahadevan, Venkatesh Swinburne University of Technology Australia Makita, Yuki Takushoku University Japan Maksimov, Nikolay National Research Nuclear University Russian Federation Mandl, Heinz Ludwig-Maximilians-University Germany Mark, Ole DHI Denmark Marrone, Dan Farmingdale State College UK Martin, John The University of Texas USA Masrek, Mohamad N. MARA University of Technology Puncak Perdana Malaysia Mazzoni, Elvis Università di Bologna Italy McBarron, Ellen Australian Catholic University Australia Meskens, Ad Artesis University College Antwerp Belgium Metallo, Concetta Parthenope University Italy Miller, Ilyne Nuclear Regulatory Commission USA Miller, Michael University of Arkansas USA Minor, Michael University of Texas Pan American USA Mokhtar, Salimah University Malaya Malaysia Monkman, Karen Depaul University USA Mvuma, Alfred University of Dodoma Tanzania Mwinyiwiwa, Bakari M. University of Dar Es Salaam Tanzania Nahodil, Pavel Czech Technical University in Prague Czech Republic Nandigam, Jagadeesh GVSU USA Neumajer, Ondrej The Research Institute of Education Czech Republic Niegemann, Helmut The University of Erfurt Germany Nishimura, Tomoyuki Kushiro Public University of Economics Japan Nurse, Angus University of Lincoln UK Nydl, Vaclav University of South Bohemia Czech Republic O`Connor, Bridget N. New York University USA O`Meara, Peter Charles Sturt University Australia Omekwu, Charles University of Nigeria Nigeria Orsitto, Fulvio California State University USA Owoyele, Jimoh Olawale Tai Solarin University of Education Ijagun Ogun State Nigeria Panke, Stefanie Institut fuer Wissensmedien Germany Papatheodorou, Theodora Anglia Ruskin University UK Parker, Gaylynn The University of Southern Mississippi USA Pauly, Martin Tsukuba University Japan Pettai, Elmo Tallinn University of Technology Estonia Pioro, Barbara North Carolina Agricultural USA Potorac, Alin Dan University of Suceava Romania Pritchard, Rosalind University of Ulster UK Rampazzo T., Gorana Wien University Austria Ravelli, Bruce Mount Royal University Canada Reed, Catherine California State University East Bay USA Rens, Kevin University of Colorado Denver USA

Rezaee, Saeed University of Alzahra Iran Rios, Francisco University of Guadalajara Mexico Rogg, Steven Aurora University USA Romero, Margarita ESADE Spain Rubio, Enrique Universidad de Las Palmas Spain Russo, Marcello Parthenope University Italy Rutkowski, Jerzy Silesian University of Technology Poland Saito, Zenkyu Dokkyo University Japan Sanders, Mark Virginia Tech. USA Sano, Hiroshi Tokyo University of Foreign Studies Japan Saremi, Hamed McMaster University Canada Sathu, Hira Unitec New Zealand New Zealand Schunn, Christian D. University of Pittsburgh USA Seghers, Jan Katholieke Universiteit Leuven Belgium Serra, Bartomeu J. Universidad Islas Baleares Spain Serwatka, Judy Ann Purdue University North Central USA Shaw, Jenny Yorkshire and Humber East LLN UK Shukla, Ranjana Unitec New Zealand New Zealand Simkin, Victor Federal Institute of Educational Measurement Russian Federation Simui, Francis University of Zambia Zambia Skogh, Inga-Britt Stockholm University Sweden Smyrnova, Eugenia University of Silesia Poland Snyder, Bill Columbia University Japan Speelman, Pamela Eastern Michigan University USA Stewart, Mary Learn Canada Stiles, Mark Staffordshire University UK Stoops, Luk Artesis University College Antwerp Belgium Stronck, David California State University East Bay USA Subervi, Federico Texas State University USA Tan, Felix AUT University New Zealand Tan, Michael Nanyang Technological University Singapore Taplin, Stephen National Cancer Institute USA Tolar, Robert Echo Group Inc. USA Tono, Yukio Tokyo University of Foreign Studies Japan Trombley, Carrie Laforge North America USA Tullgren, Charlotte Kristianstad University College Sweden Tupy, Jaroslav Tomas Bata University Czech Republic Valdez, Emiliano University of Connecticut USA Valtanen, Pasi-Waltteri Satakunta University of Applied Sciences Finland VanSlyke, Craig Saint Louis University USA Verma, Lalji K Indian Society of Hospital Waste Management India Wan Ali, Wan Zah Universiti Putri Malaysia Malaysia Wheat, Meegie University of South Alabama USA Whiteley, Robert University of British Columbia USA Whitelock, Denise The Open University UK Yueh, Hsiu-Ping National Taiwan University Taiwan Zan, Rosetta University of Pisa Italy Zhong, Shaochun Institute of Ideal Information Technology China Zwaneveld, Bert Open University Netherlands

HONORARY PRESIDENT Freddy Malpica
PROGRAM COMMITTEE CHAIRS
Friedrich Welsch José Vicente Carrasquero
GENERAL CHAIR
Andrés Tremante
ORGANIZING COMMITTEE CHAIRS Angel Oropeza Belkis Sánchez
SUBMISSIONS QUALITY CONTROL SUPPORT
Leonardo Contreras
CONFERENCES PROGRAM MANAGER /
HARDCOPY PROCEEDINGS PRODUCTION CHAIR Maria Sánchez
TECHNICAL CONSULTANT ON COMPUTING SYSTEMS /
CD PROCEEDINGS PRODUCTION CHAIR Juan Manuel Pineda
SYSTEMS DEVELOPMENT, MAINTENANCE AND DEPLOYMENT
Dalia Sánchez Keyla Guédez Nidimar Diaz
Yosmelin Marquez
OPERATIONAL ASSISTANTS Marcela Briceño
Cindi Padilla
HELP DESK Riad Callaos Louis Barnes
Katerim Cardona Arlein Viloria
Pedro Martínez
META-REVIEWERS SUPPORT Maria Sánchez Dalia Sánchez


Number of Papers Included in these Proceedings per Country (The country of the first author was the one taken into account for these statistics)
Country # Papers % TOTAL 121 100.00
United States 39 32.23
Spain 12 9.92
Italy 7 5.79
Sweden 7 5.79
Australia 6 4.96
Japan 5 4.13
Taiwan 4 3.31
United Kingdom 4 3.31
Czech Republic 3 2.48
Romania 3 2.48
Belgium 2 1.65
China 2 1.65
Denmark 2 1.65
Norway 2 1.65
Russian Federation 2 1.65
South Korea 2 1.65
Switzerland 2 1.65
Thailand 2 1.65
Trinidad and Tobago 2 1.65
Turkey 2 1.65
Bahrain 1 0.83
Canada 1 0.83
Hong Kong 1 0.83
Jordan 1 0.83
New Zealand 1 0.83
Oman 1 0.83
Portugal 1 0.83
Puerto Rico 1 0.83
Saudi Arabia 1 0.83
Singapore 1 0.83
Slovenia 1 0.83


Foreword
Informatics and Cybernetics (communication and control) are having an increasing
impact on societies and in the globalization process that is integrating them. Societies are
trying to regulate this impact, and adapt it to their respective cultural infra-structures.
Societies and cultures are in reciprocal co-adaptations with Information and
Communication Technologies. Synergic relationships might emerge in this co-adaptation
process by means of positive and negative feedback loops, as well as feedforward ones.
This would make the whole larger than the sum of its parts, generating emergent
properties in the parts involved as well as in the whole coming forth. The academic,
private, and public sectors are integrating their activities; multi-disciplinary groups and
inter-disciplinary teams are being formed, and collaborative research and development
projects are being organized in order to facilitate and adequately orient the design and
implementation of the feedback and the feedforward loops, so the synergic relationships
are socially positive and personally human.
One of the main purposes of the 4th
International Multi-Conference on Society,
Cybernetics and Informatics (IMSCI 2010) is to bring together academics, professionals,
and managers from the private and the public sectors, so they can share ideas, results of
research, and innovative services or products, in a multi-disciplinary and multi-sector
forum.
Educational technologies, socio-economic organizations, and socio-political processes
are essential domains among those involved in the evolving co-adaptation and co-
transformation between societies and cultures on the one hand, and between informatics
and cybernetics (communication and control) on the other hand. Consequently, the main
conferences in the context of the IMSCI 2010 Multi-Conference are the following:
• 8th
International Conference on Education and Information Systems, Technologies
and Applications: EISTA 2010
• 6th
International Conference on Social and Organizational Informatics and
Cybernetics: SOIC 2010
• 8th
International Conference on Politics and Information Systems, Technologies
and Applications: PISTA 2010
These three conferences are related to each other and, as a whole, are producing or might
produce synergic relationships with Information and Communication Technologies. This
is why the Organizing Committees of the three of them have the purpose of combining
their efforts in a way that would lead to the organization of an adequate joint event,
where academics, researchers, consultants, professionals, innovators, and practitioners
from the three areas might relate and interact with each other in the same event. These
types of interaction might generate possibilities of cross-fertilization and analogical
thinking, as well as possibilities of new working hypothesis, ideas, and reflections on the
impact, significance, and usefulness of Informatics and Cybernetics in important

dimensions of educational, socio-political, and socio-economical processes, services, and
products.
The relationship between education/training and Information and Communication
Technologies (ICT) is quickly intensifying and sometimes appears in unexpected forms
and in combination with original ideas, innovative tools, methodologies, and synergies.
Accordingly, the primary purpose of the 8th
International Conference on Education and
Information Systems, Technologies and Applications (EISTA 2010) has been to bring
together researchers and practitioners from both areas together to support the emerging
bridge between education/training and the ICT communities.
The 6th
International Conference on Social and Organizational Informatics and
Cybernetics (SOIC 2010) and The 8th
International Conference on Politics and
Information Systems, Technologies and Applications (PISTA 2010) have been organized
and collocated with EISTA 2010 and the proceedings of the three conferences have been
collected in the same volumes under the general title of Society, Cybernetics and
Informatics because significant relationships were found among the three of them.
In the context of EISTA 2010, practitioners and consultants were invited to present case
studies and innovative solutions. Corporations were invited to present education/training
information systems and software-based solutions. Teachers and professors were invited
to present case studies, specifically developed information systems, and innovative ideas
and designs. Educational scientists and technologists were invited to present research or
position papers on the impact and the future possibilities of ICT in educational systems,
training processes, and methodologies. Managers of educational organizations and
training consultants were invited to present problems that might be solved by ICT or
solutions that might be improved by different approaches and designs in ICT.
EISTA 2010 provides a forum for the presentation of solutions and problems in the
application of ICT in the fields of education/training. Authors of the papers included in
the proceedings provided diverse answers to the following questions:
• What is the impact of ICT in education and training?
• How are ICTs affecting and improving education and training? What networks
and models are emerging?
• How are universities, schools, corporations and other educational/training
organizations making use of ICT?
• What electronic tools are there to facilitate e-learning, distance education and co-
operative training?
In the context of PISTA 2010/SOIC 2010, Information and Communication Technologies
(ICTs) are transforming our societies and our governments at a remarkable speed.
Government departments are seeing the importance of delivering services electronically.

Political parties have begun using ICT in their processes. Yet, despite this increased need,
we find, as John Harvey-Jones calls it, a Dialogue of the Deaf between politicians and the
ICT community. Politicians need to understand the potential role of the Internet in
politics and the ICT community needs a better understanding of politics if this Dialogue
of the Deaf is to be transformed into a mutually comprehensive dialogue and a synergic
relationship. The purpose of the International Conference on Politics and Information
Systems, Technologies and Applications (PISTA 2010) is to contribute to this emerging
dialogue and to aid in bridging the gap between the two communities.
In order to contribute to the creation of relationships between ICT and Sociopolitical
communities, ICT researchers and professionals were invited to present their experience
and research as it pertains to the application of ICT in politics, governmental action, and
political science. Practitioners and consultants were invited to present case studies and
innovative solutions. Corporations were invited to present political information systems
and software-based solutions to political issues. Public servants were invited to present
case studies requiring technology: information systems, innovative ideas, and designs that
were developed with political purposes in mind. Political and social scientists were
invited to present research or position papers on the impact and future possibilities of ICT
in social systems and political processes. Politicians and political consultants were invited
to present problems that might be solved by means of ICTs or solutions that might be
improved by different approaches and designs in ICT.
The main objective of PISTA 2010 has been to provide a forum for the presentation of
both the solutions and problems of ICT applications in politics and society. The following
questions need answers from a variety of different perspectives:
• How do ICTs impact society?
• How are ICTs affecting democracy and the potential to make joint and collective
decisions in government?
• What networks and models are emerging to provide support for political decision
systems?
• How are political parties, governments, and campaign groups using IT systems and
electronic communications in particular?
• What electronic tools already exist to facilitate democratic discussions and decision-
making processes?
• What ethical and legal issues will be a part of the social transformation produced by
the ICTs?
On behalf of the Organizing Committees, I extend our heartfelt thanks to:

1. the 135 members of the Program Committees (18 members of the IMSCI 2010´s
PC and 135 members of the PCs related to the conferences and symposia
organized in the context of IMSCI 2010) from 36 countries;
2. the 431 additional reviewers, from 71 countries, for their double-blind peer
reviews;
3. the 289 reviewers, from 57 countries, for their efforts in making the non-blind
peer reviews. (Some reviewers supported both: non-blind and double-blind
reviewing for different submissions)
A total of 1751 reviews made by 720 reviewers (who made at least one review)
contributed to the quality achieved in IMSCI 2010. This means an average of 5.45
reviews per submission (321 submissions were received). Each registered author had
access, via the conference web site, to the reviews that recommended the acceptance of
their respective submissions. Each registered author could get information about: 1) the
average of the reviewers evaluations according to 8 criteria, and the average of a global
evaluation of his/her submission; and 2) the comments and the constructive feedback
made by the reviewers, who recommended the acceptance of his/her submission, so the
author would be able to improve the final version of the paper.
In the organizational process of IMSCI 2010, about 321 papers/abstracts were submitted.
These pre-conference proceedings include about 121 papers, from 31 countries, that were
accepted for presentation. I extend our thanks to the invited sessions’ organizers for
collecting, reviewing, and selecting the papers that will be presented in their respective
sessions. The submissions were reviewed as carefully as time permitted; it is expected
that most of them will appear in a more polished and complete form in scientific journals.
This information about IMSCI 2010 is summarized in the following table, along with the
other collocated conferences:
Conference # of
submissions received
# of reviewers that made at
least one review
# of reviews made
Average of reviews per
reviewer
Average of reviews per submission
# of papers included in
the proceedings
% of submissions
included in the proceedings
WMSCI 2010 711 1841 3586 1.95 5.04 211 29.68%
IMETI 2010 425 1124 2480 2.21 5.84 126 29.65%
IMSCI 2010 321 720 1751 2.43 5.45 121 37.69%
CISCI 2010 622 1174 3321 2.83 5.34 194 31.19%
TOTAL 2079 4859 11138 2.29 5.36 652 31.36%
We also extend our gratitude to the co-editors of these proceedings, for the hard work,
energy and eagerness they shown preparing their respective sessions. We express our
intense gratitude to Professor William Lesso for his wise and opportune tutoring, for his
eternal energy, integrity, and continuous support and advice, as the Program Committee
Chair of past conferences, and as Honorary President of WMSCI 2010, as well as for
being a very caring old friend and intellectual father to many of us. We also extend our
gratitude to Professor Belkis Sanchez, who brilliantly managed the organizing process.

We also express our immense gratitude to Professor Freddy Malpica for distinguishing
this conference by accepting the position of Honorary Chair of EISTA 2010 and the past
conferences of PISTA and SOIC; to Professors Friedrich Welsch for serving as the
Program Co-Chair of EISTA 2010 and SOIC 2010, to José Vicente Carrasquero for co-
chairing the Program committee of EISTA 2010 and PISTA 2010, to Angel Oropeza for
Co-Chairing the EISTA 2010 Organizing Committee, and to Andrés Tremante for
serving as the General Chair of EISTA 2010. We also extend our gratitude to Professor
Belkis Sánchez, for her relentless support in the organizing process.
We extend our gratitude to Drs. W. Curtiss Priest, Louis H. Kauffman, Leonid Perlovsky,
Stuart A. Umpleby, Eric Dent, Thomas Marlowe, Ranulph Glanville, Karl H. Müller, and
Shigehiro Hashimoto, for accepting to address the audience of the General Joint Plenary
Sessions with keynote conferences, as well as to Drs. Ronald C. Thomas, Jr., Christopher
Dreisbach and Roxanne Byrne for accepting our invitation as Keynote Speakers at the
Plenary Session of IMSCI 2010.
We also extend our gratitude to Maria Sanchez, Juan Manuel Pineda, Leonisol Callaos,
Dalia Sánchez, Keyla Guédez, Riad Callaos, Marcela Briceño and Mabel Escobar Ortiz
for their knowledgeable effort in supporting the organizational process and for producing
the hard copy and CD versions of the proceedings. We would also like to thank the
support and the secretariat staff that helped in the troubleshooting activities.
Professors Andrés Tremante and Nagib Callaos IMSCI 2010 General Co-Chairs

i
IMSCI 2010
The 4th International Multi-Conference on Society, Cybernetics and Informatics
The 8th International Conference on Education and Information Systems, Technologies and
Applications: EISTA 2010
VOLUME I
CONTENTS
Contents i
Generative Learning Developed by the Use of Learning Studies Based on
Variation Theory - How to Use a Theoretical Tool to Design Powerful Learning
Situations - Invited Session Organizer: Mona Holmqvist and Wai Ming Cheung (Sweden)
Cheung, Wai-Ming (Hong Kong): ''Soaring Creativity across the Writing Sky through Systematic Use of Variation and Invariance'' 1
Holmqvist, Mona; Tullgren, Charlotte; Brante, Göran (Sweden): ''Defining an Object of Learning and the Forms it Appears in: The Intended, Enacted and Lived Object of Learning in a Learning Situation''
2
Holmqvist, Mona; Tullgren, Charlotte; Brante, Göran (Sweden): ''Using Variation Theory to Analyze What Preschool Children Experience Exemplified by Wholes and Parts as the Object of Learning''
8
Magnusson, Andreas; Holmqvist, Mona (Sweden): ''The Rock Cycle - A Complex Object of Learning'' 12
Olteanu, Constanta (Sweden): ''Defining a Non-Complex Learning Object from Preschool to Upper Secondary School'' 18
Wennås Brante, Eva (Sweden): ''Identifying Critical Aspects from Learners’ Perspective'' 24
Transforming Assessment in Education Implementing the Instructional Decision
Support System of the AEFIS Solution Platform - Invited Session Organizer: Donald McEachron and Mustafa Sualp (USA)
Alsorook, Metta (USA): ''Creating and Sustaining Change: Assessment of Student Learning Outcomes'' 30
Bach, Craig; Mceachron, Donald (USA): ''Drexel EduApps: Freeing Faculty for Innovative Teaching'' 35
Bach, Craig (USA): ''Learning Analytics: Targeting Instruction, Curricula and Student Support'' 40

ii
Mceachron, Donald; Torres, Antoinette (USA): ''Instructional Decision Support Systems: A New Approach to Integrating Assessment, Teaching and Learning'' 45
Papazoglou, Elisabeth; Allen, Fred (USA): ''An Iterative Mapping Strategy for Improved Curriculum Design and Assessment'' 51
Action Research Bollaert, Hiram (Belgium): ''Holistic Embedding of Interaction Generating Learning Objects'' 57
Falorsi, P. D.; Centra, M.; Gualtieri, V.; Linfante, G. (Italy): ''The Skills and Transitions from School to Work: Sampling Strategy for a Longitudinal Survey in Italy'' 62
Trna, Josef; Trnova, Eva (Czech Republic): ''ICT-Based Collaborative Action Research in Science Education'' 68
Application of Education Technologies Blair, Risa; Hartman, Sheryl (USA): ''Using Free Web 2.0 Media Tools to Promote Student Engagement and Instructor Presence in Online Classes'' 71
Byrne, Roxanne; Tang, Michael; Tranduc, John; Tang, Matthew (USA): ''eGrader, a Software Application that Automatically Scores Student Essays: With a Postscript on Ethical Complexities''
74
Fombona Cadavieco, Javier *; Álvarez García, María Concepción *; Pando Cerra, Pablo *; Mampaso Desbrow, Joanne *; Pascual Sevillano, María Ángeles *; Iribarren, Jacinto F. ** (* Spain, ** USA): ''Transparent Institutions''
80
Gore, David; Lee, Marie; Wassus, Kenny (USA): ''Variable Data Printing (VDP): New Applications of IT & Communications Technology'' 84
Ikeguchi, Cecilia (Japan): ''Moodle and Collaborative Learning in the ESL Classroom'' 89
Mideros, Diego; Roberts, Nicole (Trinidad, Tobago): ''Post it notes”: Students’ Perceptions on Assessment and Reflective Learning in the Foreign Language Learning Process Using Wikis'' 94
Selezneva, Elena; Veiga, Alberto (USA): ''Developing Intercultural Competence and Foreign Language Skills with Web-Based Tools'' 100
Styron, Jr., Ronald A.; Styron, Jennifer (USA): ''Connecting Technology with Student Achievement: The Use of Technology by Blue Ribbon School Principals'' 106
Cognitive, Social, and Motivational Processes in Education Bardelle, Cristina; Ferrari, Pier Luigi (Italy): ''The Potential of e-Learning Platforms to Communicate Mathematics'' 112
Bardelle, Cristina (Italy): ''Effects of Student-Computer Interaction on Math Educational Outcomes'' 118

iii
Maurino, Paula San Millan (USA): ''Student Perceptions of Online Discussions: Is there Agreement between Students and Faculty?'' 124
Mejang, Samran (Thailand): ''Developing a Causal Relationship Model of the Characteristics of Scientifically Talened Students: A Mixed Research Methodology'' 130
Sanz, Markus (Switzerland): ''New Teaching Experiments for New Learning Strategies the Key Role of Beliefs'' 134
Education and Training Systems and Technologies Burr, Kevin L. (USA): ''A Case Study: Student-Centered Course Development for a Sustainable Building/BIM Class'' 140
Hara, Yohei; Ohta, Tsutomu; Sano, Toshio; Ono, Shuichiro; Ono, Hiroyuki (Japan): ''Categorization of Creative Processes Based on Case Study'' 141
Kostolányová, Kateřina; Šarmanová, Jana; Takács, Ondřej (Czech Republic): ''The Use of Adaptive Individualized e-Learning at Teaching'' 147
Li, Jeen-Fong *; Hor, Shu *; Li, Fan ** (* Taiwan, ** Australia): ''The Association between Enterprise-Academic Experience and Teaching Ability in Chinese-Mandarin Teachers'' 153
Li, Jeen-Fong *; Hor, Shu *; Wu, Ming-Jenn *; Kuo, Chin-Guo *; Lai, Xi-Nan *; Li, Fan ** (* Taiwan, ** Australia): ''The Relationship of Industry Experience and Research Ability of Teachers in Automotive Engineering''
159
Mellado Miller, Ronald; Tsui, Yoko H. W.; Dearden, Thomas; Lincoln Wolthuis, Stuart; Stanley, Timothy (USA): ''Learning and Human Computer Interactions: Does Wii Bowling Transfer to Real Bowling?''
164
Menezes, Maria Helena; Tomé, Vitor (Portugal): ''Overcoming the Digital Gap between Students and Teachers: Teacher Training in Media Education in Portugal'' 168
Swarz, Jeffrey; Ousley, Anita; Johnson, Lenora; Kwon, Harry; Magro, Adriane (USA): ''CancerSPACE: An Interactive e-Learning Tool for Healthcare Professionals'' 172
Unalan, H. Turgay (Turkey): ''The Teachers and the Students Related to Graphic Design Lesson at Fine Arts Schools'' 178
Educational Measurement, Psychometrics, and Assessment Anselmi, Pasquale; Robusto, Egidio; Stefanutti, Luca (Italy): ''Assessing Learning Processes with a Gain-Loss Model'' 180
Boyle, Malcolm; Williams, Brett; Brown, Ted; McKenna, Lisa; Molloy, Liz; Lewis, Belinda (Australia): ''Attitudes Towards Patients by Undergraduate Health Students'' 184
Smith, Linda J. (USA): ''Inside the Black Box: Exploring Mental Models in the Learning Environment'' 189

iv
Educational Research, Theories, Practice and Methodologies Arvide Cambra, Luisa María (Spain): ''Training Ways of Arabic in American Universities'' 195
Borka, Michael J. (USA): ''Technology and Teacher Education: Integration in Context'' 197
Butrous, Nasir (Australia): ''Online Access Patterns and Students’ Performance'' 202
Chadha, Anita; Branham, David (USA): ''Classroom Technology, Interior Infrastructure and the Perception of Learning Effectiveness at the University Level'' 208
Chen, Der-Thanq "Victor"; Wu, Jing (Singapore): ''Deconstructing New Media: From Computer Literacy to New Media Literacy'' 213
Corfield, Fleur (UK): ''Supporting an Innovative Curriculum in a Traditional HE Environment. Developing a Winning Strategy to Support Change at Staffordshire University'' 218
Gherardi, Massimo; Vianello, Gilmo; Vittori Antisari, Livia; Zamboni, Nicoletta (Italy): ''Example of a Lifelong Learning Programme: The Summer School in the Bologna Apennine'' 224
Guasch, Teresa; Espasa, Anna (Spain): ''University Teachers’ Conceptions and Competencies about Educational Supports in an Online Learning Environment'' 230
Hus, Vlasta (Slovenia): ''Constructivism and Textbook Sets at Environmental Studies Subject'' 236
Iserbyt, Peter (Belgium): ''Peer Tutoring: The Effect of Being a Tutor for Learning Cardiopulmonary Resuscitation (CPR) with Task Cards'' 241
Morley, Graham (UK): ''Is Gender, Age or Experience a Problem? Issues for Primary Teachers with ICT'' 243
Nail, Allan (USA): ''Providing Online Support for Beginning Teachers to Facilitate Transfer of Pedagogical Theory to Practice'' 247
Reinertsen, Anne (Norway): ''Quality Oriented – Or “Slow Research” Conversations about Assessment in Schools or Building Dynamics into Both Design and Result'' 248
Steele, Godfrey A. (Trinidad, Tobago): ''Self and Peer Assessment in an Undergraduate Communication Research Class Using Mixed Methods'' 253
Suzuki, Akiyoshi (Japan): ''“The Fact Speaks for Itself”: Humanistic English Education with “e-job 100” Internet Project'' 259
Wu, Jui-Han; Liu, Chih-Che (Taiwan): ''Significant Factors in Students’ Motivation to Learn English – A Case Study at One Private University in Southern Taiwan'' 265
Higher Education Garrard, Greg; Head, Anthony; Bevan, Andy (UK): ''Poetiks: A JISC-Funded Project to Enhance the Learning and Teaching of Poetic Technique'' 271

v
Kinash, Shelley; Hives, Lauren; Knight, Diana (Australia): ''eTEVAL Pilot Project: Migrating Teacher Evaluations to the Online Environment'' 274
Mendoza, Antonette; Stern, Linda; Carroll, Jennie (Australia): ''“Learnability” as a Positive Influence on Technology Use'' 280
Sowden, David P. (UK): ''Delivering User-Centric eSystems'' 285
Williams, Greg (USA): ''Academic Integrity and Instructional Design - What Can they Possibly Have in Common?'' 291
Authors Index 295


Soaring Creativity Across the Writing Sky through Systematic Use of
Variation and Invariance (Article submitted for presentation only)
Wai-Ming Cheung
The University of Hong Kong
Pokfulam, Hong Kong
1. INTRODUCTION
Creativity is an important ability that students need to
acquire in the 21st Century. Ways to incorporate
creativity into teaching by Chinese Language teachers
are limited because of a lack of understanding and
practice. Literature shows that creativity can be
trained. In this study, we set out to do exactly this: we
reflected on the first question “How can creativity be
advanced?”, and we might reflect on a second
question, namely “How can we find out to what
extent we are capable of advancing creativity?”.
2. THEORETICAL ASSUMPTIONS
This study was to explore the pedagogical perspective
of enhancing creativity in Chinese writing through the
systematic use of variations and invariance and to
evaluate the effectiveness of this approach in
enhancing students’ creativity in Chinese writing. The
first point of departure is to open up the space in a
certain dimension which is strategically chosen in
relation to the domain in which creativity is located.
The second point of departure is that the combination
of what teachers do, how students learn, and theories
about teaching and learning is crucial for attempts to
enhance creativity. This study focused on the process
by which teachers design writing instruction in
particular contexts and on a particular method of
teaching writing strategies based on the learning
Theory of Variation [1,2 and 3].
3. METHOD
A controlled experimental trial was conducted. Two
seventy-seven students aged eight and eight teachers
were recruited and randomly allocated into the target
group (137 students and four teachers) and
comparison group (140 students and four teachers).
The target group joined learning study for one year.
The comparison group used the traditional way of
teaching and learning writing. Outcome assessment
including a measure of the creativity of the texts
produced by the pupils (Chinese Creative Writing
Scale) was used together with a phenomenographic
analysis of the process of classroom teaching.
4. RESULTS
Students in the target group significantly
outperformed those in the comparison group. The
overall effect of the Chinese Creative Writing Scale
was significant in fluency (F = 28.64, df = (2,260), p
< 0.0125); originality (F = 25.67, df = (2,260), p <
0.0125); and the total score (F = 24.87, df = (2,259), p
< 0.0125). However, the overall effect was not
significant for flexibility (F = 2.65, df = (2,259), p >
0.0125). The creativity score was boosted through the
systematic use of variations and invariance in the
teaching of Chinese writing. Students of the target
group developed the capability of writing adventurous
story by contrasting their own story with others and
fused the feedback of their teachers and classmates on
the web to review their story ending. It is concluded
that this novel methodological approach leads to a
richer and more comprehensive understanding of
creativity in Chinese writing. The patterns of contrast
and fusion variation widen writing space of students
like a heavenly horse soaring across the writing sky.
[1] M. Holmqvist, L. Gustavsson & A. Wernberg,
Generative learning. Learning beyond the learning
situation. Educational Action Research, vol 15,
no 2, June 2007, pp 181-208.
[2] F. Marton & S. Booth, Learning and awareness.
Mahwah, NJ: Erlbaum Assosiates, 1997.
[3] F. Marton & M.F. Pang, On some necessary
conditions of learning. Journal of the Learning
Sciences, vol 15, no 2, 2006, pp. 193-220.
1
Proceedings of The 4th International Multi-Conference on Society, Cybernetics and Informatics (IMSCI 2010)

Defining an object of learning and the forms it appears in: the intended,
enacted and lived object of learning in a learning situation.
Holmqvist, Mona
Tullgren, Charlotte
Brante, Göran
Kristianstad University
Sweden
ABSTRACT
The aim of this study is to describe in what ways the
object of learning changes shape during its way from
the intended (planned), enacted (offered) and lived
(discerned) object of learning. The study is based on
variation theory, and learning study is used as a
model. A total of three preschool teachers, 39
children aged 4-5 years and three researchers
participated in the study. Three interventions were
carried out in three different groups of children (A, B
and C) by three preschool teachers. The data consist
of video-documented meetings with the preschool
teachers and researchers, interviews with the children
in the form of pre-, post- and delayed post-tests and
video-documented interventions (3). The results show
(a) how the teachers’ focus on aspects concerning the
object of learning and aspects not concerning the
object of learning affects learning possibilities. The
results also show (b) a discrepancy between the
children’s possibilities to learn and what the
preschool teachers intend to offer them to learn.
Finally, the results show (c) how the preschool
teachers’ understanding of children’s learning
sometimes makes them use other words than the
appropriate ones to make the intervention funnier or
more interesting.
Keywords: variation theory, learning study, pre-
school.
1. INTRODUCTION
According to variation theory [1] the focus in learning
situations should be on the learning of something and
not on how to teach, or what learning is, as the
relationship between what is going to be learnt and
the learner is necessary for learning. It is not the
conditions of learning that cause learning, as
conditions only make it possible for learners to learn
certain things [2]. Instead we have to direct our focus
on the relationship between the person and the
phenomenon. These phenomena are called objects of
learning,
In every institutional instructional setting an
ability or a phenomenon is intended to be developed
or understood by the learners. It is the teachers’ or the
instructors’ task to make it possible for learners to
learn. Objects of learning have a direct or specific
aspect, that is, the concrete object of learning is to
understand: how to read, the rock cycle, division in
mathematics, progressive creativity, and the
difference between number and size. But objects also
have an indirect or general aspect, that is, what you
are able to do when you have developed knowledge
about the object of learning. Learners and teachers
have a different focus on the object of learning, as
teachers should focus on both the direct and indirect
aspects, while pupils mostly focus on the direct aspect
of the object of learning. The object of learning
appears in three ways in a learning situation: the
intended (what the teachers plan to offer the pupils to
learn), the enacted (how it is offered the learners in
the learning situation), and the lived (what knowledge
the learners have achieved) [2].
Teachers, and their intentions concerning the
object of learning, are the crucial part of any lesson.
The intended object of learning is the teachers’
perspective on what is to be learnt — their thoughts
and intentions with the learning situation. It is the
teacher who delimits the object of learning. By
deciding what is possible to discern, and what is not
possible to discern, the pupils are offered different
aspects to experience. It is possible to get a view of
the intended object of learning by what teachers do
and say in accordance with how the object of learning
is offered in the classroom. Thus, teachers’ statements
and actions concerning the object of learning
establish the possibilities and limitations for learners
to learn in a given situation.
Secondly we have the enacted object of learning.
This can be said to consist of how the teacher
structures the conditions of learning, and how the
object of learning is shaped by the teacher and pupils
in cooperation. The researcher is able to observe the
enacted object of learning. The result is an analytical
description of what necessary conditions, and to what
extent, an object of learning becomes visible for
learners, or what limitations for learning a certain
2
Proceedings of The 4th International Multi-Conference on Society, Cybernetics and Informatics (IMSCI 2010)

situation has. The enacted object of learning is a
relation between the possibilities that are offered by
the teacher and the possibilities that are utilized by
the learners in a given situation. Accordingly, the
intended object of learning could change as the
pupils’ participation in the classroom discussion
might contribute dimensions not planned or offered
by the teacher.
Finally, the lived object of learning is the
knowledge the pupils have developed during a
learning situation, i.e. if their abilities or knowledge
about the targeted object of learning have developed
during the learning session. That is, what the pupils
actually have learned. This can be analyzed both on
individual and group level.
In this research project we have studied the
different shapes of the object of learning during its
three phases: the intended, the enacted and the lived,
what implications differences in focus between these
forms have on the learning outcomes, and hence what
teachers learn from a learning study.
The data material obtained in the study consists
of: a) video-taped discussions with the teachers
before, between and after the lessons, b) video-taped
interviews with the children before and after the
learning situation (pre-, post- and delayed post-tests)
and c) video-taped activities (lessons) in preschool.
This study is a part of a major research project
funded by the Swedish Research Council — “The
Pedagogy of Learning”. All studies carried out in the
project are based on variation theory.
2. THEORETICAL ASSUMPTIONS
The theoretical assumptions of this study rest on
variation theory, which assumes that variation is
needed to discern aspects of an object of learning not
previously discerned by learners. By the use of
variation and simultaneity between aspects brought
up, the pupil can learn in new ways [2]. Here the
theory’s corner-concepts of discernment, simultaneity
and variation will be discussed.
To be able to discern something you have to
discern what features it consists of. If someone tells
us about a round, green ball that bounces well, we
have no difficulty visualizing it. This is because we
already have knowledge of shapes, colours and how
balls should function. Thus, to be able to discern
something you have to have experienced variation in
a corresponding dimension of the aspect. That is, to
be able to discern green, you need to discern other
colours. In a more complex setting, you have to
discern features and values of things, but also parts of
wholes and wholes in different contexts [2]. For
instance, to be able to discern a chair you have to be
able to discern the various parts of the chair. If you
leave out the back of the chair, you have a stool [3].
To be able to see an animal in the forest, you need to
be able to discern the difference between the context
(branches, leaves and so on) and the animal (legs, fur,
face and more). We have to discern the start and the
end of many different aspects of the context (what a
forest consists of) that belong together to be able to
sort out what does not fit in this whole - the animal -
as it consists of other things than are represented by
the aspects of the forest [1]. This means we can
discern the animal as a contrast to the forest and
define it as a different phenomenon than the forest.
And finally, we must be able not only to see the
variation between different aspects belonging to the
same phenomenon (for instance colour and size of a
cat – parts of the whole), but also be able to discern
what the object is not (a dog is not a cat – the
differences between wholes based on a lack of certain
aspects).
Variation theory also claims that aspects must be
considered simultaneously . That is, as we see the
colour green we simultaneously discern it from all
the colours we have experienced through life, our
non-visual representations from earlier experiencing.
This is called diachronic simultaneity, and can be
defined as the necessity to recall earlier experiences
of a dimension of aspects at the same time [2]. But
things also have different features, like the ball’s
shape, colour and functionality. This makes it
necessary to be able to discern different co-existing
aspects of the same thing at the same time, so-called
synchronic simultaneity [2]. That is, we discern
shapes, colours and available functions at the same
time within the object. The difference between
aspects and features is referred to in this article
thusly: an aspect is a specified feature of an object,
but a feature is a general value that could be an aspect
of several objects. If we say this apple is green, it is
an aspect of the specified object, but green as such
can be a feature in several other aspects.
What happens is that all the aspects of wholes,
parts and contexts are present to us, in several
different ways, and we are aware of them in our own
individual way. The discernment changes over time
and in different situations, and in relation to what
other aspects are offered in a situation. This makes it
essential for teachers to be aware of how the aspects
offered in a learning situation affect the possibilities
to learn. Most important is to hold on to the intended
object of learning during a learning situation, instead
of opening up dimensions of variation not related to
the intended object of learning.
The learning situation may thus not be either too
difficult or too simplified. If things are simplified too
much, children open up their own dimensions of
variation and make up their own rather complicated
3
Proceedings of The 4th International Multi-Conference on Society, Cybernetics and Informatics (IMSCI 2010)

systems and explanations because they do not discern
all the aspects of a phenomenon. This can make
learning even harder in the future if they have to
reconsider their understanding in learning situations.
In this case they have to replace their own created
aspects with those they had not discerned before. If
the level of complication is too high, they do not have
the capacity to see what is crucial and do not discern
the aspects even if they are offered for discernment. It
is like when we learn a new language. If we are only
offered the words we already know, we cannot talk
about such phenomena, or, like a child, produce our
own words. On the other hand, if we are offered the
new language in a way that native speakers speak it –
we do not understand the conversation and lose
interest. Teachers have to be careful to consider how
and by what means they give opportunities for
children to understand in relation both to what they
already know and what aspects of an object of
learning are offered. Using this theoretically
grounded design includes consideration of
discernment, simultaneity and variation, concurrently.
The theoretical assumption is that variation is needed
to discern aspects of an object of learning not
previously discerned by the pupil.
3. METHOD
Combining lesson study [4, 5] and variation theory
yields learning study. Learning study is a kind of
action research, as it intends to develop practice, and
it includes different steps where researchers and
teachers work together discussing and developing
practice while collecting data [6,7].
Learning study [8] is the method used in this
research paper to collect data on an object of learning
and how it differs in its three shapes (intended,
enacted and lived), and to describe if and how the
different dimensions of variation affect the learning
outcome. The setting for the study is a preschool with
children 4-5 years old, The object of learning is that
the children develop knowledge about the difference
between the concepts many (number) and much
(size). The study also includes discussions about
planning and analysing the object of learning before,
during and after the learning situation.
The participants in the study were three pre-
school teachers who represented different levels of
work experience; three researchers, who represented
scientific knowledge; and 39 children (Table 1), who
were respondents in this learning study. The children
belonged to three different but comparable groups
who were exposed to one learning situation each per
group, concerning the same object of learning.
Table 1. Data about the children in the three groups.
Group A
(n=12)
Group B
(n=12)
Group C
(n=15)
Mean age
(months)
61 59 59
Min – max
age (months)
53-67 52-67 47-69
Girls 7 8 7
Boys 5 4 8
A learning study consists of two or more micro-
cycles that form a macro-learning study cycle. In this
case there are three micro-cycles. A micro-cycle
consists of at least three parts, that is pre-test,
intervention (at school lesson, at preschool activity)
and post-test. It is also possible to include a
screening, where you scan what could be the difficult
parts to understand for children concerning the object
of learning. In addition you can end the study with a
delayed post-test. A delayed post-test’s purpose is to
enable the research team to see whether the changes
in knowledge are a long-term result or only a short-
term effect of the lesson. The aim of a learning study
is to develop sustainable learning rather than to
achieve short-term learning successes, and tests
given directly after the lesson are not indicators of
long-term change in children’s experience. If
children’s way of looking at the phenomenon has
changed, it should sustain or even develop a long
time after the learning situation. This is called
“generative learning” [7], which is a kind of transfer.
All learning studies start with a discussion where
the teachers and the researchers analyze all possible
aspects of the intended object of learning, and the
experiences the teachers have from previous teaching.
These discussions result in the planning of the first
activity, as well as in the design of the tests that are
used throughout the study. The activity plan is rather
detailed, especially concerning what aspects should
be made possible to discern. Special attention is paid
to the importance of focusing on a specific content
when planning instruction, and in what way this has
an impact on the children’s learning with respect to
this particular content [9].
The pupils in group A (the first group of children and
the first planned activity) do the pre-test. It consists of
different choices of “where they find most items”.
The children are here exposed to variation concerning
the concepts many (number) and much (size), by
being showed different objects (Table 2). The
children have seven different tasks to decide upon
where there are most items (greatest number).
Table 2. Test material
Test Test material
4
Proceedings of The 4th International Multi-Conference on Society, Cybernetics and Informatics (IMSCI 2010)

A Geometric blocks; 2 thick
Geometric blocks; 3 thin
B 3 Potatoes
4 Hazelnuts
C 2 Full bottles
3 Empty bottles
D 3 Hot dogs
4 Small frying sausages
5 Meatballs
E 3 Hazelnuts
4 Hazelnuts
5 Hazelnuts
F 3 Bikes
4 Roses
5 Chickens
G 5 Children
10 Trees
20 Fishes
After the pre-test the children are exposed to the
planned activity. The preschool teacher of group A
gives the children the opportunity to discern the
differences between the concepts of many and much
in two varied parts. The first part is composed of a
game where the children imagine that they are
swimming in the sea and suddenly see sharks in the
water, but the children can save themselves by
running to large rings that represent islands. Then the
teacher asks the children how many they are in each
ring, and also in which ring there are the greatest
number of children. This part is the same in all three
groups (A, B and C). In the second part the teacher
place items of different sizes (balls, small bean-bags
and wooden blocks), and numbers inside the rings,
and let the children count the items. The teacher
exposes the children to differences in number and
size, and offers them to understand that number and
size are different phenomena. Finally they give the
children opportunity to discern the difference between
the concepts many and much. In Swedish we differ
between most when we address greatest number
(flest) and greatest size (mest), by the use of different
words.
When the activity is completed it is time for the
post-test, which is identical to the pre-test. After four
weeks the children are given the delayed post-test,
which is identical to the pre- and post-test. This ends
the first micro-cycle.
The second micro-cycle starts after the first
groups’ post-test, with discussions between the pre-
school teachers and the researchers concerning how
the children reacted to the first planned activity, in
combination with the results of the children in group
A at the pre- and post-test. The discussion focuses on
what another design might have given the children for
opportunities to discern the object of learning. The
pupils in group B do the pre-test, which is exactly the
same as for group A. In the second activity (B) the
first part is the same, that is, the shark game is played.
In the second part of the activity the items placed in
the rings are different and consist of one huge teddy-
bear, ten small teddy-bears and three dolls. Here the
teddy-bears provide opportunities to put one small
teddy-bear together with the huge one (variation in
size), to be able to count them as two, although one of
them is bigger than all the other teddy-bears put
together. The teacher informs the children that it is
possible to count the items when asked about greatest
number (flest), but not when asked about where there
is greatest size (mest). The teacher presents the
concepts of greatest number and greatest size on a
number of occasions. The activity is followed by the
post-test, and in a couple of weeks the delayed post-
test will be administered, and so the second micro-
cycle is complete.
The third micro-cycle follows the same pattern,
but now it is group C and their preschool teacher who
are involved. The teachers and researchers discuss the
first (A) and second (B) interventions, what happened
and what could be done in another design. After pre-
test and the shark game, it is time for the part where
items are put in the rings. Now the items are the
same, they all consist of cotton wads (invariation of
material). These are arranged in one huge, three big
and ten small cotton wads. This time it is possible to
put the different wads together, or to divide a bigger
wad into a number of smaller ones. The teacher
elucidates the difference between greatest size and
greatest number, and also that, it in the case of
number, is possible to count the items. The two
concepts are heavily focused by the teacher. And
finally group C completes the post-test, and the
delayed post-test. These three micro-cycles put
together form the macro-cycle on which the results
are based.
4. RESULTS
The results are divided into two parts. First, we can
notice an increased learning outcome in all three
groups (Table 2). It is clear that the children have
increased their learning through the intervention, and
also that in two cases they have increased their
understanding of the concepts of many and most over
time, an indicator of generative learning. It is also
possible to distinguish that learning seems to increase
more from a lower origin, when comparing the results
of group A and B with group C. The only initial
difference we have found among the three groups is
based on how the groups are composed. Groups A
and B include children of different ages in their
ordinary activities, but in the study we have only
5
Proceedings of The 4th International Multi-Conference on Society, Cybernetics and Informatics (IMSCI 2010)

included children 4-5 years old. In group C no
children younger than 47 months are included in their
ordinary activities.
Table 2. Mean results of pre-, post- and delayed post-
test (max 7.0).
Group A B C
Pre test 3.7 3.5 5.3
Post test 4.3 4.8 5.9
Delayed post test 4.7 4.9 5.9
Comparing group B with group A also shows that
there is a difference between the dimensions of
variation that are presented in the different activities.
This difference is based on the contrast between
greatest number and greatest size, which was mostly
focused upon in design B, and the representations
were more similar in design B (different sizes of
bears and dolls). Even though the results at the pre-
test are high in group C, the children in this group
develop their knowledge further and keep it in a long
term perspective.
Secondly we can observe that the teachers’
learning consists of an increased ability to discern the
critical features of a learning object in relation to
pupils’ capability to learn. This is shown through the
increased scores by the groups (A, B and C). The use
of learning study, based on variation theory, therefore
enhances teacher’s abilities to predict in what way the
object of learning should be offered to children they
meet in a learning situation. This result is clarified by
the interviews with the preschool teachers. In these
we can distinguish a difference between teachers’
expectations of the children’s learning, compared
with what they actually learned in this study. This
was shown through the combination of interviews,
both before and after the micro-cycles, with the
teachers and the results of the tests (interviews) with
the children before and after the interventions. The
teachers’ expectations on individual children’s
learning were in many cases wrong. Instead of giving
reasons connected to the interventions or the targeted
object of learning, they discussed the individual
children’s personal features (he might not want to do
it …, I mean a bit uninterested), language problems
(because she can be a little distracted sometimes, and
she has a bit of a language problem) and that the
researchers were unknown persons for the children
(you are new people coming in, it is a new situation).
This means they did not express their understanding
of the connection between the learner and the targeted
object of learning.
This in turn indicates that there is an obvious risk
that teachers’ expectations, whether too high or too
low, affect children's ability to learn. Even if the
teachers have, in fact, developed an ability to find the
crucial differences in how to present the critical
aspects of the object of learning to the children, the
expectations that they are unaware of can affect the
learning outcome. This difference was highlighted by
using the learning study model, as the teachers in this
model are analysing the learning outcome in relation
to what actually was offered the children to discern in
the intervention. This discernment seems to be crucial
for understanding what it takes to learn.
Teachers’ expectations are also shown in the
enacted object of learning, as the communication
sometimes is childish “play-talk”. When this happens,
the children focus on aspects not belonging to the
object of learning itself, and the object of learning is
not discerned during this part of the intervention.
When one small teddy-bear was put beside the huge
teddy-bear the teacher said: “Now they can be
friends”. This was problematic as it could direct the
children’s focus to friendship instead of numbers and
size. Thus, it opens up a dimension of variation not
intended (for example the feelings of teaching
materials, why there has been a conflict and so on).
This could have been prevented by using an
educational discussion in a playful way, but not in a
childish conversation about other aspects of the object
of learning than those critical for understanding it.
This example also highlights adults’ views on
children’s learning. If teachers diminish the object of
learning to a predetermined childish “level” there is a
risk for a depreciation of children’s learning.
Furthermore, in the discussion concerning the
intended object of learning we found some different
perspectives between teachers and researchers. The
researchers focused on the object of learning and how
it is offered the pupils through the activity. The
teachers on the other hand were worried, as they
perceived different difficulties that the children could
experience during the exercises in the intervention —
for instance that not every child will find room in the
rings during the shark play, and consequently get a
feeling of being left behind.
That teachers and researchers have different
expectations therefore indicates two things to be
attentive to previous to an action research. It is
necessary to discuss the different expectations that the
included parties have, and how they individually
regard the important aspects in the different parts a
study. Even so, this study does not have the intention
to focus on differences between teachers’ and
researchers’ experiences, but on how the object of
learning changes shape during its three phases
(intended, enacted and lived object of learning).
However, the results are more general concerning
learning as such. The preschool study is only chosen
to exemplify what happens when the object of
learning is intended, enacted and lived – regardless of
6
Proceedings of The 4th International Multi-Conference on Society, Cybernetics and Informatics (IMSCI 2010)

the learning situation. The results can help us
understand how to design more powerful learning
situations in different types of schools and learning
environments (face-to-face and virtual).
5. CONCLUSIONS
The object of learning must be exposed to variation
for learning to be achieved, which can be
accomplished through discernment, simultaneity, and
awareness. Learning study as a method has proved to
be functional for variation. Learning studies have
been carried out in different settings, including
different objects of learning and different learning
contexts. The aim was to carry through a learning
study in a preschool context, and in this paper to
describe what implications for learning a different
focus on the object of learning has in the intended,
enacted and lived phases of the learning object. It also
meant to study what teachers learned by participation.
We propose that learning study as a model can be
used in preschool settings to provide learning, which
is confirmed as all three groups of children increased
their results (group A 3.7 to 4.7; B 3.5 to 4.9; C 5.3 to
5.9), and two of the groups also increased their results
between post-test and delayed post-test (A 4.3 to 4.7;
B 4.8 to 4.9) while the third kept their knowledge
intact. We also submit that teachers’ participation
made them aware of the difference between children’s
abilities and the teachers’ own expectations.
[1] F. Marton & S. Booth, Learning and awareness.
Mahwah, NJ: Earlbaum Associates, 1997.
[2] F. Marton & A. Tsui. Classroom
discourse and the space of learning. Mahwah,
N.J.: Lawrence Erlbaum
[3] M. Holmqvist (2006). Lärande i skolan.
Learning study som skolutvecklingsmodell.
[Learning in School. Learning study as developing
model for schools]. Lund, Sweden:
Studentlitteratur.
[4] J. Hiebert, & J. Stiegler (2005). The teaching
gap. New York: Free press.
[5] C. C. Lewis, & I. Tsuchida (1998). A lesson is
like a swiftly flowing river. American Educator.
12-17, 50-52
[6] Holmqvist, M. Gustavsson, L. & Wernberg, A.
(2007). Generative learning. Learning beyond the
learning situation. Educational Action Research,
vol 15, no 2, June 2007, pp 181-208.
[7] Holmqvist, M.; Brante, G. & Tullgren, C. (2009).
Learning Study in pre-school. Teachers’ expectations
for children’s learning and what they actually learn
[8] M. Holmqvist & J. Mattisson (2009). Contrasting
cases and their impact on learning: A replication of
a learning study confirming the impact of
contrasts. Problems of Education in the 21st
Century, vol 10, pp 38-46.
[9]M. Holmqvist, C. Lövdahl & L. Strömberg (2008).
Using Variation Theory to explain a complex
mathematical phenomenon. In Welsch, F.,
Malpica, F., Tremante, A.., Carrasquero, J. V., &
Oropeza, A. (Eds.) Proceedings 2nd
International
Multi-Conference on Society, Cybernetics and Informatics, Vol. IV, Post-Conference Issue, pp
163-168. Florida: International Institute of
Informatics and Systematics.
7
Proceedings of The 4th International Multi-Conference on Society, Cybernetics and Informatics (IMSCI 2010)
Using Variation Theory to Analyze what Preschool Children Experience
Exemplified by Wholes and Parts as the Object of Learning
Holmqvist, Mona
Tullgren, Charlotte
Brante, Göran
Kristianstad University
Sweden
ABSTRACT
Preschool children’s learning isthe subject of this
study. Three children aged 4, 5 and 6 participated.
The data consist of individual interviews with the
children before and after the intervention and a
videotaped intervention. Our results show that
children seem to see a whole as something that is not
cut into pieces, no matter what it looks like. They do
not necessarily refer to the whole when they see a
half, nor do they imagine the halves or quarters in a
whole that is not cut into pieces. On the other hand, if
they see halves they do not have any difficulty putting
them together into a whole, but this happens when
they can see the material in front of them. The results
reveal some interesting findings, pointing at the
natural flexibility small children have in discerning a
half in relation to a whole instead of in relation to a
representation (like a full circle). On the other hand –
the children show difficulties in seeing what parts a
whole can be divided into. This is the other way
around, as children in higher grades with a view of
the circle as the correct representation of a whole,
which sometimes makes it hard to manage problem
solving at higher grades where flexibility in how to
understand proportions is needed.
Keywords: variation theory, preschool, learning
study, mathematical concepts
1. INTRODUCTION
Familiarity and novelty have crucial effects on
remembering. In a normal situation we recognise the
appearance of those who are close to us irrespective
of circumstance or situation. However, if one is to
recall an unfamiliar phenomenon it must stand out in
some way to be noticed and remembered (Stenberg,
2006). What implications do such findings have on
instructional learning, face-to-face or virtual? In this
research project we have studied what it takes to
develop learning sustainability outside the classroom
– learning that develops further learning. This
phenomenon we call generative learning [1]. One
important concern for creating this kind of learning
seems to be contrasts. Even Thorndike [2] indicates,
“/…/man is originally attentive to sudden change and
sharp contrasts…” (p. 14). Thus in order to discern
something, we focus on some features and not on
others. To focus on specific features, they must
be distinguishable from an invariant background,
i.e. variation is necessary for discerning,
discerning is necessary for experiencing. The
contrasts between what varies, and what does not,
result in a discernible pattern. Our point of
departure in this study is to find out what kinds of
variation young children, aged 4-6, seem to
discern and what kinds of contrasts seem to
enhance learning at preschool. The object of
learning in this study is wholes, halves and
quarters. The research question is how small
children understand these concepts, and how that
is similar to or differs from the understanding
held by older children and adults.
2. THEORETICAL ASSUMPTIONS
Variation theory is based on the concepts
discernment, simultaneity and variation [3, 4].
The theory can be used as a guiding principle in
designing instruction [5, 6]. However, the design
of variation is very important when identifying
what aspects are critical for discernment by the
child/learner. This means that important aspects
of an object of learning might not be critical if the
learner has already discerned them. If a child is
going to develop learning about cats, it would not
be the most powerful approach to design a
learning situation where only one cat is presented.
The representation of different kinds of cats is
necessary to understand the concept cats, instead
of naming a single phenomenon. It is also
important to be offered to understand what a cat
is not, for example by contrasting cats and dogs.
The theoretical principle is the same for more
complex objects of learning from pre-school to
higher education at universities. However, when
children learn Mathematics, formal understanding
(to see a half circle as a half even if we do not see
both parts or that a circle must be complete to be
“whole”) can be problematic if something is
referred to as a whole that looks like a half, but
serves to mark something that in fact is whole.
One such example is when a child assumes the
second example in Figure 1 is incorrect.
8
Proceedings of The 4th International Multi-Conference on Society, Cybernetics and Informatics (IMSCI 2010)

75% 100%
Figure. 1. Representations of three quarters and a
whole.
This child has not learnt to grasp the meaning of
percent, per hundred, as a general concept. Instead,
such children assume 100 % is a whole, and as they
refer to whole as a complete circle they cannot
understand why the second representation is just as
correct as the first one. Previous research on small
children’s awareness of variation [8] shows that even
small children need to experience variation in order to
discern. If children do not experience variation they
are unable to understand the concept. If they had met
other kinds of representations than circle-shaped
pizzas, cakes, balls, i.e. figures like the second one
representing 100%, they would have had to consider
percent as per hundred rather than a complete circle.
To find out if the assumption that a whole is a
complete circle is something we have learnt, or
something we take for granted from when we are very
small, we have interviewed children and made an
intervention on the topic.
3. METHOD
The method used here is learning study [7], a model
in the field of action research. The first step is to scan
what kind of understanding the participants have
about the object of learning. In this study we made a
qualitative interview with three children aged 4, 5 and
6. After that we designed an intervention where the
object of learning (wholes, halves and quarters) was
offered to the children. Three different kinds of
representation were used (cakes, apples and pears) to
make the children discern the concepts whole and
halves as general concepts not connected only to the
cakes (as whole circles). After the instructional
session the children were interviewed once again to
study whether the children’s understanding had
changed, and if so how. The interviews were analysed
qualitatively.
4. RESULTS
Pre-interviews
The children were offered to discern wholes, halves
and quarters in the interviews by giving them whole,
half and quarter circles made of paper. The interviews
made before the session showed several kinds of
explanations about what the children thought it was.
None of them referred to whole, half or quarter, or
built a whole of the parts in the beginning of the
interview. Instead, Tilda (4 years), referred to
parts of the body, and Sanna (5 years) talked
about rings and halves, referring to both halves
and quarter. William (6 years) named the shapes
red circles. During the interviews the children
were introduced to the concepts, but it was hard
for them to separate halves from quarters as both
were called halves. The first was half from a
whole circle and the second half from a half.
They talked instead about shape and colour or
completely different things.
I: Have you seen this sort of thing before? What do you
think it is? S: Mm.
I: What do you think it could be?
S: Round ring. (Sanna, 5)
I: So you’ll just get to look at these, and then you’ll tell me what you think it is. [Shows a whole circle]
W: I don’t know.
I: No, but you can decide yourself. If you get to decide,
what would it be?
W: Well… It's just red. A round circle with red.
I: Mm. We’ll have some other things. There. We’ve got
to have these. These ones, what are they then? [Shows
half circles]
W: Well…. It’s also that completely red thing. (William, 6)
Their thinking was indeed creative, suggesting
that the paper representations were symbols for
different parts of the body and so on. Tilda
discerns the parts as the parts of a body, and the
different sizes which she discerns simultaneously
and the variation of sizes makes her think of
different parts of the body.
I: Now you’ll have to look at these. [Puts two circles on
the table] What can you - what do you think this is?
T: Don’t know. I: No. What would you, if you could guess, if you could
decide what it is, what would you call it then? It can be
anything, right? T: Mm. But, the red might look like blood.
I: Mm, it could look like blood, it could.
T: [turns the circle and looks at the white underside] And the other are perhaps the bone in the body.
I: It could be that.
T: And there is, are our bones, where the blood flows.
I: Aha, I think I know what you’re thinking of. Now
you’ll get to look at a few other items. [Puts four half-
circles on the table] What could this be?
T: Ehm... It looks as if this would be in the arms. And
the blood flows here [indicates her own arm], it’s for the
fingers. I: So it's a little smaller?
T: So the blood will go there too [points at her
fingertips] I: Mm. You’ll get another thing [puts four quarters on
the table]. And what about this?
T: It could be in the stomach. (Tilda 4)
Tilda discerns the red colour and refers to blood.
She also looks at size, colour and shape
simultaneously, and she puts the parts together
9
Proceedings of The 4th International Multi-Conference on Society, Cybernetics and Informatics (IMSCI 2010)

into the shape of a body. Her whole is referred to a
person. During the pre-interviews, all children
discerned the circle as a whole and the halves as a
half of a whole, but the quarters are referred to as
parts and seem to have no connection to the whole or
the halves.
Intervention
During the instructional session their discernment of
the concept also showed how they did not see halves
as a half as soon as the whole was divided. The half
became immediately whole instead, as the children do
not seem to have the representation of a full circle as
a whole yet. They also had some problems in
transforming the concepts into new representations.
[Three apples on the table, two whole apples and one apple in
two pieces.]
Ia: How many did we get from the whole one? [pointing at the two halves]
T: Eight
S: Eight.
W: Eight.
Ia: Do you want to suggest more alternatives? Perhaps you
could count how many halves there are. [Ib begins to share
the second apple]
T: One, two, three, four [counting the pieces]
S: One, two, three, four, five [counting the pieces and the whole apple]
The children are encouraged to count halves in order
to know how many halves you can get out of three
apples. Sanna counts to five because the parts and the
whole apple are equivalent to her, as if the halves are
wholes as soon as they are divided.
The children have also some problems to discern
the halves and quarters inside the whole, before the
item is cut. During the intervention they start to
experience whole and halves simultaneously in the
relation big to small. But they do not see them in the
opposite way. William is counting quarters inside
three uncut cakes.
W: One, two, three, four five, six, seven, eight, nine, ten,
eleven, twelve
Ib: What did you count, William? W: Twelve.
Ib: What became twelve?
W: Well, all of them.
Ib: Mhm. Did you count [makes a circle around the cake]
W: I didn’t count like that [pointing several times at each
cake]
Ib: No. You counted them four times?
W: Yeah, so.
[…] W: I’ll have to count again. One, two, three, four, five, six,
seven, eight, nine, ten, eleven, twelve. [Counts each cake four
times, counts the quarters of the cake] Ib: Now I know what you did. You counted the quarters,
didn’t you?
W: [nods] Ia: Mm, that's right, there are twelve quarters on the table
now.
When the cake is whole it is possible for the children
to discern the parts inside the whole. As soon as the
item is cut into two pieces the parts are referred to
as whole. And as a half circle becomes a whole,
the quarters become half as well – in fact a half
half. They had some problems in transforming the
concepts into new representations, and were not
sure if it was possible to cut a pear into halves
and quarters.
Ia: When you divide in two, halves. Halves, and then
you get quarters. Is it the same with the small apples? Is
it the same?
S: A-ha
W: M-hm. Ib: Can you get halves from this? [holds up a small
apple]
S: No. Ib: You don’t think so?
Ia: We’ll have to check it. We'll see.
W: Yes, it can. […]
Ia: Would the same thing happen to the pears?
Ib: What do you think?
Ia: Could it be the same?
Ib: Could you get pear halves?
[The children do not answer, they are all watching the
interviewer cutting pears]
The variation of the objects in size and shape
made the children uncertain about what would
happen next. For the children, the knowledge
developed in one situation is not obviously
transferred to another context or situation.
Post-interviews
However, the interviews after the session show
how the children had developed a new way of
understanding the concepts. They know the
words for the shapes being introcuded.
I: And it was, you say, a ... [points at a whole]?
S: Whole. I: And it was [pointing at a half]?
S: Half -
I: And it was a ...? [pointing to a quarter] S: Fourth.
(Sanna, 5)
In the post-interviews the children express their
ability to discern whole and parts simultaneously,
something they did not do in the pre-test.
[Two halves on the table]
I: And if we had divided them again, like this
[demonstrates on the halves, across them]. How many
pieces would you have had then? S: [counts twice in each half, counting quarters] One,
two, three, four.
(Sanna, 5)
The relation between wholes and parts is thus
sometimes still unclear.
I: Yes, how many of those parts did you need to get a
whole?
T: You just take them like this and put them together.
I: Yes, how many parts did you need to have to get that
10
Proceedings of The 4th International Multi-Conference on Society, Cybernetics and Informatics (IMSCI 2010)

one, to get one that looks like the whole?
T: Two.
I: Yes, how many are there? T: It is four.
I: Yes. And what did you say, what we called those parts?
T: Quarters. I: Mm. And how many of these did you need to get a whole?
T: Two.
(Tilda, 4)
The girl knows how to construct a whole from
quarters but she can not express the relation between
whole and quarters in words. Another explanation
could be that she still sees one complete piece as a
whole, and does not refer to the whole to which the
parts belong.
The use of variation theory in the analysis offers
a possibility to discover the critical aspects discerned
by the children. It also makes it possible to show how
the children discern two aspects (whole and parts) of
the concept simultaneously.
Conclusions
The findings can explain how learning as such is
developed and what variation is needed to make a
powerful instructional design. However, the
interviews after the session show how the children
had developed a new way of understanding the
concepts. By the use of different representations, not
only circles, to explain the concepts, variation made
the children discern the same concept in different
objects. This was done to make them understand that
the concepts are not connected only to one special
object.
In the interviews with the children, the critical
aspects found were that halves are a part of a whole
and that a whole becomes two halves no matter the
form of representation. This is not common
knowledge for the children. In this particular study, it
is worth discussing if the way older children have
learnt to discern wholes as a complete circle is the
most powerful way to discern, or if the more flexible
way these children see it is preferable. The results
show that the children’s understanding of what a half
is refers to the whole, and a complete circle is often
presented as the representation of a whole in which
they can image both halves and quarters or other parts
of a whole. They had some problems imaging the
whole if they saw a half. This means that when we
see a half circle we simultaneously refer to the whole,
even if we do not actually see the other half. It seems
the children have not developed this ability. Their
more flexible way of referring to whether the object is
cut or not makes them change perspective more easily
than those children with formal knowledge.
REFERENCES
[1] M. Holmqvist, L. Gustavsson & A. Wernberg,
Generative learning. Learning beyond the
learning
situation. Educational Action Research, vol
15,
no 2, June 2007, pp 181-208.
[2]E. Thorndike (1914). Educational
psychology: briefer course. New York:
Teachers College, Columbia University.
[3] F. Marton & S. Booth, (1997) Learning and
awareness. Mahwah, NJ: Earlbaum
Associates.
[4] F. Marton & M.F. Pang, On some necessary
conditions of learning. Journal of the
Learning Sciences, vol 15, no 2, 2006, pp.
193-220.
[5] M. Holmqvist & J. Mattisson (2008).
Variation theory – A tool to analyse and
develop learning at school. Problems of
Education in the 21st Century, vol 7, 2008,
pp 31-38.
[6] M. Holmqvist, L. Gustavsson & A. Wernberg
(2008). Variation Theory. An organizing
principle to guide design research in
education. In Kelly, A.E., & Lesh, R. (2008).
Handbook of design research methods in education, pp 111-130. Mahwah, NJ:
Erlbaum.
[7] F. Marton & A. Tsui (2004). Classroom
discourse and the space of learning.Mahwah, N.J.: Lawrence Erlbaum.
[8] C. Björklund (2008). Bland bollar och
klossar. Matematik för de yngsta i förskolan. [Among balls and bricks.
Mathematics for the youngest in preschool.]
Lund: Studentlitteratur.
11
Proceedings of The 4th International Multi-Conference on Society, Cybernetics and Informatics (IMSCI 2010)

The Rock Cycle - a complex object of learning
Master’s Degree student Andreas Magnusson Ass Prof/PhD Mona Holmqvist Kristianstad University College, SE- 291 88 Kristianstad, Sweden
ABSTRACT
In this article a learning study is presented, and the object of learning is sedimentary rocks’ formation and decomposition, a part of the rock-cycle. The study included 5 lessons in 5 different groups of 5th grade pupils. 85 students and 7 teachers participated in the study. The lessons were 40 minutes each and the teacher and location of all classes remained constant. 4 lessons were planned based on variation theory, while one lesson served as control. The results show that the way the teacher presents the aspects of the object of learning has a great impact on the pupils’ learning outcome. The contrast between the rock-cycle and the water-cycle made the results increase, but the contrast between the rock-cycle and the organic cycle did not affect the learning outcome in a positive way. As the pupils had an understanding about the water-cycle, this understanding seems to help them understand the rock-cycle, a kind of transfer from a known phenomenon to an unknown phenomenon. .
Keywords: variation theory, learning study. Complex object of learning, rock- cycle, sedimentary rocks’ formation and decomposition
1. INTRODUCTION
This study focuses on how a complex object of learning can be defined and how its aspects can be offered for pupils’ discernment by the use of variation and simultaneity. To exemplify a complex object of learning we have chosen the example of the rock cycle because the knowledge has to be a kind of system instead of finding one or a limited number of correct answers. Even if the study is conducted in a face-to-face learning situation, the examples can be used in virtual educational settings. In order to understand our environment and how the earth is constituted, a holistic approach and system thinking are required. One of the keys to understanding the world around us is to know and understand the formative processes of our landscape. Since the various forming concepts of our landscape and their processes are part of a larger system of the rock cycle (in which the different processes affect each another), system thinking is an important element for understanding the formative processes of the landscape holistically. To understand the cycle it is very important to be able to discern and understand the different concepts, relationships and processes of the rock cycle. This study aims to describe what it takes to learn a system instead of single phenomenon (on a more or less detailed level), and ask whether the assumptions made in previous studies [1, 2, 3, 4] are also valid when complex objects of learning are focused upon.
The object of learning is the sedimentary rocks’ formation and decomposition, i.e. a part of the rock cycle (Figure 1) [14,15,16]. From now on, the object of learning in this study is defined as this particular part of the rock cycle. The rock cycle is a complex object of learning, since it includes many different kinds of concepts and relationships. System thinking is defined as having the ability to identify a system’s components and see the connections between them and the aspects of the whole system [10]. The teaching of geology is based on system thinking, in which a variety of perspectives are highlighted at different times, in changed contexts and with different purposes. It is also possible to see the system as different “levels of performance” [12], i.e. levels that describe/explain a system of many
Different rock types at the earth’s
surface
Sediment
Sedimentary rock
Metamorphic rock
Magma (Melted rock)
Igneousrock
Extrucive igneous
rock, cools quickly
Weathering and eroison
Cementation
Heating and pressure
Additional heating
Cooling
Heating
Figure 1 The rock cycle and the learned object (marked with a triangle
12
Proceedings of The 4th International Multi-Conference on Society, Cybernetics and Informatics (IMSCI 2010)

interacting entities/concepts. To understand how the whole system works, the student has to understand all levels and the connections between them. The results of a study about the global carbon cycle [10] showed that students find it difficult to see the cyclical processes (cycles). Instead, students use a sort of linear process. In this case the earth is seen as an inexhaustible resource for coal and the atmosphere is seen as an unlimited drain on coal. Students also show difficulties in seeing the systems’ constant changes, as these are only observable in a historical perspective. Researchers [10] argue that the lack of models in schools makes it difficult for students to acquire “level-thinking”. The computer is a useful tool to illustrate systems, and it is available at most schools. There have been several studies in which students have to use computers to simulate various systems (simple ecosystems, the movements of particles of gas) through various programs. That allows students to enter the system (program) and change the criteria to see how that affects the system; students can thus obtain “level-thinking”.
”… that understanding the reciprocal relationships within and between each of these systems in necessary for informed decision making concerning environmental issues.” (Kali, Orion, Eylon, 2003, p. 545)
Using a systems approach is considered to be an important ability in technology and science, as well as in everyday life [11]. And to predict the consequences of alternative decisions in environmental issues, it is important to consider the relationships between the various systems. In one study specifically on systems thinking in a scientific context, the point of departure in an educational situation was the rock cycle [11]. Respondents were children in junior high school. After a lesson based on the customary pedagogical practices, the students took a test. The results clearly showed that students generally lacked a broader systems approach. After that, they were asked to work with activities that integrated different subjects, and the teacher was more a supervisor than a lecturer. The results of the test taken after this activity showed a marked increase in systemic thinking.
Kali et al.’s [11] results showed that students rarely integrate parts into a whole by themselves. It is therefore important that the teacher plan and implement activities in which this occurs. The aim is to get students to work on a task following the lesson, and feel enticed/forced to reflection. In this way, students can connect their experiences to a context. But we do not see the role of the teacher changing from a lecturer to a supervisor as the important variable. We have used the same method, but different ways of designing how the content of the object of learning is organized.
“Why can we not study ecology indoors and transfer the knowledge to the authentic world out-of-doors. According to transfer studies and variation theory there have to be certain basic similarities between the situations for transfer to be possible.” p.54 “As I have noted earlier the key is not the outdoor context itself and it does not have to be the larger part of instruction but they have to be well planned and executed… Instructions for reading nature must include field work but it is not necessary to conduct all teaching outdoors… As I see it we need to help the future teachers to know how to look, what to discern in nature but also help them to link what they see to some models of ecosystems functioning. “p.65 [13]
2. THEORETICAL ASSUMPTIONS
One previous study about complex objects of learning has been carried out within the research project “The Pedagogy of Learning” funded by the Swedish Research Council. In this study the object of learning was historical awareness, which can be seen as a kind of ability [5]. All studies included in the research project are based on the same theoretical concept, variation theory [6, 7]. Each individual study aims, on a general level, to test the theory in different circumstances to see if its assumptions are valid. The assumptions are that variation is needed to discern aspects of an object of learning that are critical for learning. Presenting the aspects to the students via variation both of single aspects and several aspects simultaneously makes it possible to discern the object’s aspects. However, the student also has a kind of individual dimension of variation through discerning the aspects in relation to her or his previous knowledge or experiences. Hence the design of instruction or information on a web site is crucial for what learning is possible, as the teacher has to take into consideration both the object of learning and the students’ previous understanding.
Variation theory is based on the concepts discernment, simultaneity and variation. However, the variation is not about methods, but how the different aspects of an object of learning are offered the students in a learning situation. Thus when we teach about the rock cycle we can choose different aspects to present. Such aspects can be the influence water has on the process of turning stones into sand, what soil consists of (whether it is minerals or organic material) and so on. When teaching about a complex object of learning there are several choices to make when deciding what to offer the students (what can be discerned), what is offered simultaneously and how to vary the aspects of the object of learning. By analysing what happens in the learning situation, the results show what seems to be powerful and what seems to be irrelevant according to the students’ learning outcomes.
13
Proceedings of The 4th International Multi-Conference on Society, Cybernetics and Informatics (IMSCI 2010)

3. METHOD
The method used is learning study with semi-parallel lessons [2, 3, 8]. Learning study is a hybrid of lesson study from Japan and design experiment. It is a kind of action research [9] at school done in cooperation between teachers and researchers. In this study the lessons are conducted in two cycles, with two parallel lessons in each cycle. The design of the first lessons (A1 and A2) was based on interviews and screenings. The remaining two parallel lessons’ (B1 and B2) design was based on the analysis of the lessons and learning outcomes in the previous parallel lessons (A1 and A2). This means there are four lessons in the learning study. In addition, two control lessons (C 1 and C2) have been conducted. However, one of the teachers misunderstood the researcher’s instruction and taught the students the content before the research lessons. Hence we had to exclude the data from this lesson (C2) from the result.
The study was conducted in 2009 in Sweden, and included 6 lessons in 6 different groups of 5th grade pupils. A total of 109 students and 8 teachers participated in the study. As one group (C2) was excluded (see above), 85 students and 7 teachers remain. For practical reasons, the selection of students was from schools in the neighbourhood. The lessons were 40 minutes each and the location of all classes remained constant. 4 lessons were planned based on variation theory, while two lessons served as controls. Since the location was an important component of the study, a sandy beach in Åhus (Sweden) with a beach view was selected.
To examine the pre-understanding and experience of the object of learning, the study started with interviews with 6 students. After that, a screening was carried out including 37 students, aiming to find the critical aspects of the object of learning, or what it takes to learn the chosen content. The lessons’ design was planned based on the results of the interviews and the screening. Since the lessons were carried out on three different days (two lessons on each occasion), lessons 1 and 2 were given first, and after an analysis lessons 3 and 4 were planned, designed and implemented. The empirical data were collected through written tests and video recordings. Each pupil took the same test before the lesson, directly afterwards, and with a delay of 4-5 weeks. The test consisted of one question, namely: “Draw and/or write what sand is, what it has been and what it can be in the future, and what happens when it changes”. The four experimental classes were carried out with the same content and methods, but the aspects of the object of learning were presented a bit differently.
Data
The qualitative data material from the tests are converted to a quantitative measurement. If the student responded fully to the question in the test, the student could get 16 points. Each point corresponds to a particular concept/process of the response that is relevant to the issue. The concepts/processes must be used in the right context, to receive one point for each concept/process.
The concept of weathering:
Water (rain, waves) 1 Wind 2 Ice (frost shattering) 3 Glacier 4 Rock against rock 5
The concept of erosion: Transport (water, wind, ice) 6Soil (org. material-stone, sand, clay) 7 Sorting 8
The concept of cementation:
Sediment (layer on layer) 9 Pressure 10 Heat 11
The concept of circulation:
Cycle/circulation/round and round again 12 The concept of size (shape):
Mountain 13 Stone 14 Sand 15 Clay 16
Lesson A1
The discussion of the lesson was based on pictures representing different concepts in the rock cycle. The pictures were presented one by one, structured in a sequence starting with a mountain. The second level was weathering and erosion, and this was represented by rain, wind, ice (frost shattering) and watercourses. The third level showed the shapes of the material after weathering. The fourth level showed the erosion, the transportation of the materials and how mineral and organic materials are mixed and sorted during the transportation. The last level, the fifth, was the concepts of sedimentation and cementation (Fig.2). The unvaried aspect in the first lesson was the cycle presented to the students, but presented linearly (not cyclically). The varied aspects were the representations of the weathering and erosion and the different shapes the material may appear in.
14
Proceedings of The 4th International Multi-Conference on Society, Cybernetics and Informatics (IMSCI 2010)

Lesson A2
The difference between the first (A1) and the second (A2) lessons in the semi-parallel learning study was essentially the structure and the use of contrast. The structure was changed from a sequence to a simultaneous presentation of the rock cycle and the organic and water cycles. All three cycles were presented in circles and not, as in lesson A1, in a linear structure. All cycles were visible immediately at the start of the lesson (Fig.3). The varied aspects in the second lesson (A2) were the same as in lesson A1 concerning the rock cycle. However, this time the cycle was also represented as a visual cycle. Another varied aspect was the three different cycles — the rock, organic and water cycles (Fig. 2), presented at the same time (simultaneously). The invariant aspect was how the three different cycles were presented.
Lesson B1
The results of the first two lessons (A1 and A2) were analysed, and the remaining difficulties were discussed before lessons B1 and B2 were designed.
We found that the students did not discern the difference between organic and mineral material. They could not differentiate between clay and soil, which shows they confuse the organic and rock cycles. On the other hand, they did not seem to find the water cycle problematic. Hence we decided to focus on only two cycles in the two remaining lessons, the rock and organic cycles. The pictures of the rock cycle were presented, as well as the organic cycle as a contrast. In the lesson the teacher made a more explicit clarification of the difference between clay and soil.
Lesson B2 The lesson was based on the pictures below (Figure 5), showing the rock cycle and the organic cycle simultaneously, as contrasts. A clarification was made of the difference in clay and soil. The term mineral
was introduced to show that rock, sand and clay are the same material but in different representations (Figure 6).
SoilOrg. material, stone, sand, clay Tree
Decompose
Sorting Cementation
Weathering,erosion
The plant use the nutrition in the earth
Organic material
Stone, sand, clay
Mountain
Figure 2 The rock cycle (linear, pictures presented one at a time)
Figure 3 The three cycles together (rock cycle, organic cycle and water cycle)
Figure 4 Two cycles together (Rock cycle and organic cycle)
Figure 5 The rock cycle’s relationship to the organic cycle
15
Proceedings of The 4th International Multi-Conference on Society, Cybernetics and Informatics (IMSCI 2010)

4. RESULTS
The results show that the concepts on which variation theory is based are also true for learning involving complex objects of learning. The results also support previous findings that the lowest achievers gain most when they are offered instruction based on variation theory. Different forms of contrasts were used to develop the pupils’ knowledge, which was powerful, and the results could be explained by the instruction offered during the lessons. The results were analysed both on an individual level and a group level and are described in Table 1.
Table 1. Mean scores in the six different groups. Group/Lesson Pre Post D Post
A1 2,55 4,65 4,10 A2 2,44 5,13 4,63 B1 2,53 5,12 4,35 B2 2,71 4,79 4,43 C1 1,69 3,15 2,92
The different outcomes also show that the environment is not crucial for the learning result, as all six groups were located at the same area during the lessons. The same teacher taught four of the groups, so the teacher is also an independent variable. However, the analysis of the learning outcome in combination with the analysis of the video recordings show how differences in what aspects are offered in the learning situation affect the learning outcome. First of all, the four research classes developed more than the control group. And, in line with previous studies, the group with the lowest result (A2) is the one of the research groups that gained most. However, the control group had in fact the lowest result on the pre-test but developed less than the classes in the research groups. The concept of circulation (12) increased from seven in lesson A1 to 14 in the lesson A2. Lesson (A1) presented a linear rock cycle, and pictures of the concepts were presented one at a time. In lesson A2 two contrasting cycles were used. This was done by using a contrast
to the rock, water and organic cycles, which are familiar to the students. The results point out that if the learner sees the similarities between the rock cycle and the water cycle, that the process is the same (cyclic) as well as the differences between the concepts they are composed of, the learning situation seems to be more powerful. The water cycle seem to be the cycle that had most impact on the students’ learning outcome, as the groups that got the organic cycle instead did not develop as much. The excerpt below, from lesson A2, shows how important the teacher’s way of offering the students the object of learning is for their learning outcome:
T: Then there is what is the smallest, almost like, what it is almost like?
S: Powder. T: Yes, powder, or like…? S: Dust. T: Yes, dust, almost. T: Flour, almost, it feels like. And what is it, then? S: But we can not try to take this kind of sand here? T: Yes, that kind of sand. S: Like this? T: Yes, let’s see. I'll take this little powder into my hand, then
we put some water on it. Now, let's see what happens. [The teacher puts water on the powder he has in his hand.] S: Quag! It just becomes clay! T: It becomes clay, I have to take a little bit more. S: You take powder. T: Yes, I take powder. What is it now? Feel it! S: Like a kind of cement. T: Or like…? Does it become soil, or what is it now? Almost
like cement. S: That was what I said! T: Yes, but it is not. Can anyone of you find out what it is? T: What is it? It is possible to roll it up. S: I know! A kind of dough. T: What did you say? Someone said something..? S: Ceramic or clay T: Clay! That's exactly what it is! It's clay! That is what is the
finest of sand, or of the mountain. So it is clay, the finest parts. It's the clay, which once has actually been rock.
In the post-test of the second lesson (A2), we find student replies like: "To get clay you have to mix it with water.” “It rains on the sand so it will be clay.” “There will be clay with the aid of water." Students have misunderstood what clay is, thanks to the way the teacher presents the phenomenon as if it is water mixed with sand, which become clay. In lesson B1, the teacher presents clay like this:
T: And then there is another one which is almost like a very white powder.
S: Like dust. T: Like dust, yes. T: What can it be, then? What is it that have smaller size than
sand, do you think? S: Dust. T: Anyone who can guess? S: Dust. T: Dust? This is actually clay. S: What?
Figure 6 Minerals in different sizes and shapes
16
Proceedings of The 4th International Multi-Conference on Society, Cybernetics and Informatics (IMSCI 2010)

T: Yes, it is clay. T: Maybe not in the way you recognize it, as it is dry, but if we
now pouring in some water… [The teacher pours some water on the clay particles.] T: ... you may recognize it better, [The teacher mixes clay with water, takes more clay from the students’ sieve.] T: If I can borrow some of yours, too. T: Let's see if we can do a little clay here. If you feel there now,
or look at it, feel with your hand. [The students touch the clay.]
T: Do you feel it? Do you recognize the clay now? Right? I’ll come to you too. .
T: Back, back, I’ll come to you. Here you can see it is clay. S: Mm. T: Mm. Can you see it is clay? Or, it was in fact clay before, but
you recognize it again when it gets wet, right? S: Yes. T: Mm. So clay is the material that is the very smallest.
In this group, most of the students did not claim that clay is sand mixed with water. The differences in the way the teacher offers the students to understand what clay is are important for their understanding. The missed important information that clay is clay even if there is no water was not given in lesson A2.
5. DISCUSSION
The results of this study show many interesting things. As it was the same person teaching all targeted groups (A1, A2, B1 and B2) and the same environment (outdoor classes) those variables are invariant and the differences in learning outcomes cannot be caused due to these variables. And even if the control group (C) was taught by another teacher, who did not teach based on variation theory, the learning environment was the same. Instead, the differences we can see that have implications on the students’ results are the way the teacher organizes and presents the object of learning as what it actually is and what it is not. To do so, contrasts with other cycles were used, and the contrast with water seems to have been most powerful. Also the sharpness in the verbal presentation was important, e.g. to understand that
clay is the smallest particles and not only clay if it is mixed with water.
References
[1] Marton, F. & Booth, S. (1997). Learning and
Awareness. New Jersey: Lawrence Erlbaum Associates, Publishers. [2] Marton, F., Runesson, U. & Tsui, A.B.M. (2004). The space of learning. In F. Marton and A.B.M. Tsui (Eds.), Classroom discourse and
the space of learning (pp.3-42). New Jersey: Lawrence Erlbaum Associates, Publishers. [3] M. Holmqvist & J. Mattisson (2009). Contrasting cases and their impact on learning: A replication of a learning study confirming the impact of contrasts. Problems of Education in
the 21st Century, vol 10, pp 38-46.
[4] M. Holmqvist, C. Lövdahl & L. Strömberg (2008). Using Variation Theory to explain a complex mathematical phenomenon. In Welsch, F., Malpica, F., Tremante, A. Carrasquero, J. V., & Oropeza, A. (Eds.) Proceedings 2nd
International Multi-Conference on Society, Cybernetics and Informatics, Vol. IV, Post-Conference Issue, pp. 163-168. Florida: International Institute of Informatics and Systematics.
[5] M. Holmqvist, K. Björkman, & M Ohlin, (2010)(submitted). Differences between learning facts and complex phenomena. A learning study in history based on the variation theory.
[6] F. Marton & S. Booth, (1997). Learning and Awareness.
Mahwah, NJ: Earlbaum Associates.[7] F. Marton & A. Tsui. (2004). Classroom Discourse
and the Space of Learning. Mahwah, N.J.: Lawrence Erlbaum [8] M. Holmqvist, L. Gustavsson & A. Wernberg (2008).
Variation Theory – An Organizing Principle to Guide Design Research in Education. In Kelly, A.E., Lesh, R., &. Baek J. (eds) Handbook of Design Research Methods in
Education, pp, 111-130. New York: Routledge. [9] M. Holmqvist, L. Gustavsson & A. Wernberg, (2007). Generative learning. Learning beyond the Learning situation. Educational Action
Research, vol 15, no 2, June 2007, pp. 181-208.
[10] Hildebrandt, Kristin & Bayrhuber, Horst (2002). System
thinking and multiperspective in the carbon cycle context.
Paper presented at 3rd ERIDOB conference in Tolouse 2-5 September. Kiel Germany: Leibniz Institute for Science Education.
[11] Kali, Yael. Orion, Nir & Eylon, Bat-Cheva (2003). Effect of Knowledge Integration Activities on Students ́ Perception of the Earth’s Crust as a Cyclic System. The Journal of
Research in Science Teaching, Vol. 41 issue 6 pp. 546-565. Denver USA: John Wiley and Sons.
[12] Wilensky, Uri & Resnick, Mitchel (1999). Thinking in
levels: A dynamic systems approach to making sense of the
world. Article published in Journal of Science Education and Technology, Vol. 8, Nr. 1 pp. 3-19. Plenum Publishing Corporation.
[13] O. Magntorn (2007). Reading Nature. Developing
Ecological Literacy through Teaching. Norrköping: Linköping University
[14) Stephansson, Ove m.fl. (1988). Jord, berg, luft, vatten.
Stockholm: Utbildningsradion AB [15] Palmer, Douglas m.fl. (2005), Jorden – Illustrerade
uppslagsverk. Stockholm: Globe. [16] Lundqvist, Jan (2001), Geologi – processer-utveckling-
tillämpning. Lund: Studentlitteratur.
Figure 7 One girl suddenly turns around with sand in her hands and says “so this sand has been stone before!”
17
Proceedings of The 4th International Multi-Conference on Society, Cybernetics and Informatics (IMSCI 2010)

Defining a non-complex learning object from preschool to upper secondary school
PhD Constanta Olteanu
Linnaeus University
SE-391 82 Kalmar, Sweden
Assoc Prof/PhD Mona Holmqvist
Kristianstad University,
SE- 291 88 Kristianstad, Sweden
ABSTRACT
The aim of this article is to analyse the aspects that
teachers intend to focus on in teaching mathematics
and the students' needs, i.e. what is critical for student
learning. The article develops an argument for the
importance of identifying the “critical aspects” as a
basis for the teachers to promote student learning of
Mathematics from preschool to upper secondary
school. The article concludes that what teachers
believe that students need to be offered concerning a
specific content of Mathematics does not correspond
to students' needs. Gaps between the intended and the
enacted object of learning show that both the way the
object of learning is offered and the way this is
communicated in a teaching situation could be
improved.
Keywords: Mathematics, aspects, critical aspects,
variation theory
1. INTRODUCTION
This article is the first part of a longitudinal study that
focuses on what happens with a learning object and
students' learning in Mathematics from preschool to
upper secondary school. This study started with
examining what must be changed in instruction in
Mathematics to improve the students’ learning
possibilities. Data of various kinds are collected:
samples, pictures, videos and sound recordings, and
documentation such as the teachers' written reports
and essays. The analysis of collected data is based on
variation theory. The results show there are
differences between what the teacher intends to focus
on and what students need to be offered to make
learning happen. The results show that the teachers
intend to focus on the object of learning’s whole or on
its separate parts, but do not focus on the relationships
between those parts and how they can be related to
each other in more than one way. Secondly, the
results show that the learning object should be
presented in greater detail and with more variation
between its aspects thoroghou the school system, to
make the learning situation as fruitful as possible. By
describing how a non-complex object of learning (an
object that has a correct answer and thus can be
defined in terms of right or wrong) is presented in
instruction from preschool to upper secondary school,
we can ascertain how aspects of an object of learning
can be handled to promote learning.
2. THEORETICAL ASSUMPTIONS
Because of the aims of the paper, we will mainly
focus on one major theoretical development, namely
variation theory [1, 2], which relates the students’
comprehension of a specific content to the experience
of the pedagogical situation in which it is met.
Runesson [3] specifies that variation theory “is not a
theory of the mechanisms of learning but a theory of
the relation between the object of learning and the
learner” (p.406). The object of learning is broadly
regarded as “the complex of different ways of
experiencing the phenomenon to be learned about” [1,
p.162]. The objects of learning are the ends toward
which learning activities are directed and how
learners understand them. Variation theory focuses on
the way in which a phenomenon is made visible in a
teaching context. The main idea is that in order to
discern a difference, we must have experienced a
variation from our previous experience. To learn
means to experience, while to experience means to be
aware of certain aspects in a given context and relate
them to this context. Discernment of these aspects
varies, and receives attention as a result of different
ways individuals experience things. Moreover, simply
experiencing variation, which is a decisive condition
for learning, can evoke discernment of these aspects.
However, not all the aspects are significant for
learning. A critical aspect of the object of learning
contributes to a particular meaning in the learner’s
18
Proceedings of The 4th International Multi-Conference on Society, Cybernetics and Informatics (IMSCI 2010)
awareness. Only variation in the critical aspects is an
essential condition for learning [e.g. 1]. To help
students learn such topics, teachers must be able to
understand why students may experience difficulties
in discerning their critical features or aspects. In the
teaching context, the teacher develops the teaching
material with a perception of the content, that is, an
“intended object of learning”. Marton et al. [2] argue
that the object of learning is defined by “its critical
features, that is, the features that must be discerned in
order to constitute the meaning aimed for” (p.22). A
critical feature is a way of “distinguishing one way of
thinking from another” (p.24). The teacher can use
appropriate variations within the identified space of
learning to enact the object of learning [2]. What
teachers/students learn constitutes the lived object of
learning.
3. METHOD
In this project both quantitative and qualitative
methods are combined and used. The results in this
article are drawn from the students' tests and
discussions, and aim to identify the aspects students
discern when they solve various tasks. This means
that aspects are identified and described as critical or
not on the basis of the student groups from preschool
to high school. The teachers' essays are analyzed to
determine the presumptive critical aspects for the
students’ learning. The collected data are analyzed
from two perspectives, the intended and the lived
objects of learning. The teachers' essays consist of
mathematical texts and tasks that focus on one or
more learning objects. The analysis focused on
identifying which aspects of the content teachers want
to emphasise in the teaching situation, and to what
extent these aspects focus on the relationships
between parts and whole. Secondly, the analysis
focused on identifying which aspects of the content
are critical in student learning, and to what extent
these aspects focus on the relationships between parts
and whole. In total, 24 teachers and 245 students have
participated.
4. RESULTS
The analysis was done in four steps. It started with
identifying what delimited objects of learning (seen
as wholes) the teacher intends to offer (Step 1). For
example, one teacher found it necessary to focus on
"Relationship between division and multiplication"
(L7). This means that the teacher intended to focus on
two objects of learning (division and multiplication)
and the relationships between them. Then the parts of
the object of learning are identified (Step 2). For
example, one teacher (L8) writes about the negative
numbers that "students do not see the difference
between arithmetical operation and sign". This means
that there is a difference between positive and
negative numbers, and that the minus or plus signs
indicate the figures’ value. The next step was to
analyze how the parts relate to each other, and
whether it is necessary to relate the parts to each other
in a different way to make learning come about (Step
3). For example, one teacher (L9) indicates that a
critical aspect is the "Problems with the sorting of
positive and negative numbers, namely 3 - 5 and 3 - (-
5) or when signs indicate both arithmetical operation
and value”. Thereafter, the analysis focused on
identifying when teachers mention the way in which
elements are related to the whole object of learning
(Step 4). For example, one teacher (L20) identifies
"Relationship between mathematical operations and
variables (for example, simplify the expression 3x + 2
or 2 (x + 5)" as a critical aspect. In each step it was
possible to describe the focused aspects of the object
of learning in percentages between how the teacher
handled them in parts, relationship between parts, the
parts related to each other in different ways, the parts
related to the whole and the relationship between
multiple wholes.
The students' tests and discussions have focused
on whether the presumptive critical aspects of the
object of learning in fact were critical for their
learning outcome. This means the focused learning
objects were the same for teachers and students. To
identify the critical aspects of the students’ learning,
the analysis focused on ascertaining if the students
have discerned the object of learning in parts,
relationship between its parts, the parts related to each
other in different ways, the parts related to the whole
and the relationship between multiple wholes. This
analysis has been done in the same four steps used in
the analysis of the data from the teachers. The results
show how the learning develops from a less detailed
description of the object of learning to more and more
refined knowledge. The concept figures and numbers
(preschool) have been included in more advanced
objects of learning throughout the school system:
mathematical operations with natural numbers (class
1-3), mathematical operations with natural numbers
and decimal numbers (class 4-6), operations with
rational numbers, algebraic expressions and formulas
(class 7-9) to equations, functions, derivatives,
irrational numbers and so on (upper secondary
school) [4, 5]. The way aspects of the original
concepts (figures and numbers) have been
progressively specified and developed during the
school years is presented to describe how learning in
Mathematics comes about at different school levels.
19
Proceedings of The 4th International Multi-Conference on Society, Cybernetics and Informatics (IMSCI 2010)

The aspects of the object of learning the teachers
planned to focus on were classified in six levels: (a)
parts, (b) single relations between parts, (c) variation
in relation between different parts, (d) relation
between parts-wholes, (e) wholes or (f) relation
between wholes. The results are presented in Figure
1.
0
50
100
a b c d e f
preschool grade 4-6 grade 7-9
mathematics A mathematics B mathematics C
Figure 1. Classification of aspects (teachers)
Figure 1 shows how the teachers in grades 3 to 6 and
in Mathematics course A intends to focus the parts (a)
that constitutes the objects of learning. This
phenomenon is less priority in grades 7 to 9. An
example of the consequences this has for the learning
outcome is Marcus (Figure 3). The question is:
“Malin saves money to buy a bike that costs 525
Swedish Kronor. She has 378 Swedish Kronor. How
much more does she need before she can buy the
bike?” His solution (253) shows a lack of
understanding between the parts and the whole. He
writes: 500 – 300 = 200; 70 – 20 = 50 and 8 – 3 = 5.
As he only sees the parts, he doesn’t see the
importance of the order of the numbers and how these
are related to a whole, and thus he writes 70-20, and
then he just adds the parts and gets a sum that is not
correct. This is also observed in Figure 4. By focusing
on different kinds of numbers (natural numbers up to
100, negative numbers or decimals), the parts should
to be more experienced than the whole.
In Mathematics courses B and C the teachers
intend to focus on the whole (e) and the relationship
between wholes (f). Examples of such complexes are
equations, functions, derivatives and different
relationships between these wholes.
Relationships between parts (b) are focused on
mainly in grades 3-6 and Mathematics courses A and
C, but this focus is not represented in preschool and
only to a certain extent in grades 7-9 and in
Mathematics course B. The most interesting
observation is that regardless of the stage, the less
focused aspect is to relate the parts to each other in
different ways (c) – variation is not frequently
intended or focused on in Swedish instruction in
Mathematic. This area is not at all represented in
preschool. In addition, focus on the relationship part-
whole (d) and the whole (e) diminishes from
preschool to 9th grade. The variation of different
ways to experience the parts — by themselves,
together or in relation to one or more whole —
aiming to gain a generalized understanding of the
phenomenon, is not intended to be used or used to a
high degree.
Lived object of learning
The participating teachers conducted tests and
interviews at the end of the year that focused on the
selected items for learning. The test included 74 items
that were analyzed and classified using the same
criteria as described in the previous section. During
this period, the teachers have been working with the
content in the classroom as they customarily did, that
is, without making any changes in their way of
dealing with the content. This means that teachers'
practice focused on aspects that they believed to be
necessary to achieve better learning.
The results in Figure 2 show that we can conclude
that the teachers thought the students in all courses
had a need to understand the relationships between
parts (b), that the parts can be related to each other in
different ways (c) and how the parts are related to the
whole (d), but this is most evident in grades 3-9 and
in Mathematics course C. Moreover, we note that the
teachers who taught students in Mathematics course
A thought they had a need to understand the way in
which various parts are related to each other (c), but
as Figure 1 shows, this was not seen in their
intentions when planning their lessons.
0
50
100
a b c d e f
preschool grade 4-6 grade 7-9
mathematics A mathematics B mathematics C
Figure 2. Critical aspects (students’ perspective)
The detailed analysis of the children's work at
preschool shows that they to a considerable extent
discern the relationship between parts (b), relate the
parts to the whole (d) and relations between wholes
(f), but to a lesser extent distinguish the parts (a), and
how the parts can relate to each other in different
ways (c). Furthermore, children do not distinguish
how different parts can be related in other ways (c).
20
Proceedings of The 4th International Multi-Conference on Society, Cybernetics and Informatics (IMSCI 2010)

One example is when the children were asked how
many stones they had. They got seven stones, in two
sequences – first five and then two more. First, they
counted to five but when they saw five and two more
they did not continue counting “six, seven”. Instead,
82% started over again and counted “one, two”. This
indicates the children have not learned that the last
numeral indicates the total number of objects.
The analysis of students' tests in grades 3-6 shows
that when several mathematical methods exist in a
single task, the students experience great difficulty
even though the numbers that they work with are
natural numbers. Regarding addition and subtraction
of two natural numbers, it becomes difficult for
students to identify relationships between parts (b)
and relate parts to each other in a different way (c).
The following example (mentioned earlier) illustrates
this.
Malin saves money to buy a bike that costs 525
Swedish Kronor. She has 378 Swedish Kronor.
How much more does she need before she can
buy the bike?
Figure 3. Markus (student grade 4)
Markus shows that he understands the text and sees
how the 378 is related to 525. In addition, Markus
identifies parts (a) that constitute each number, but
cannot relate those parts to each other (b) and to the
whole (d). The analysis shows that in grades 7-9 the
students still find it hard to identify the parts and the
relationships between the parts when they work with
natural numbers and multiple mathematical methods
in the same task. This is seen in the following
example:
Figure 4. Maria (student in grade 8)
The first step in Maria's solution shows that she can
identify the parts (a) and how those elements relate to
each other (b), but cannot relate the new parts to each
other in a different way (c). When students are
working with whole numbers, there is a significant
difference between how they distinguish the manner
in which the parts relate to each other (b) and to the
whole (d).
Figure 5. Hanna (student in grade 8)
Hanna did not distinguish what meaning the negative
signs have in this task, even though she sees that the
task is about negative numbers. She believes that the
negative sign, which means subtraction, together with
the minus sign to mark negative numbers, yields
positive characters. In addition, she believes that it is
the minus sign (before 3) that is to be addressed in the
response.
Solving the problems in which numbers appear in
decimal form and the mathematical methods of
multiplication and division occurring simultaneously
is very problematic for the students. We propose that
the reason for this is that these students do not
distinguish between parts and how these parts relate
to the whole. Consequently they do not discern how
the parts relate to each other (b). The following
examples illustrate this:
Figure 6. Johanna (student in grade 8)
In Mathematics course A, which is said to be a
repetition of compulsory-school Mathematics, more
critical aspects were found concerning how students
discern the type of relationship between the parts that
constitute the whole, how the parts can be related to
each other, and to identify the whole. Furthermore, a
large proportion of students show that they cannot
relate two wholes to each other. Students were tested
including the following tasks:
1. 4 + 2·3 – 7 – 5 =
2. Solve the equation: x – 11 = 7
The first task deals with a numerical expression and
the other a first degree equation. There are students
who solve the first task as follows:
1. 4 + 2·3 – 7 – 5 =
a) 4 + 2 = 6
6·3 = 18
18 – 12 = 6
b) 4 + 2 = 6
3 – 7 = - 4
6 – 4 – 5 = - 3
In these examples we can see that there are students
who distinguish parts that constitute the numerical
expression, but they cannot relate those parts to each
other in different ways.
21
Proceedings of The 4th International Multi-Conference on Society, Cybernetics and Informatics (IMSCI 2010)

When it comes to solving a first degree equation,
there are students who demonstrate that the same
phenomenon remains, and even more how the
consequence of this leads to mathematical aberration
(see Figure 7).
Figure 7. Karl (student studying MaA)
In Mathematics course B, the proportion of students
who cannot discern the parts (a), the relationship
between the parts (b), the parts relate to each other in
a different way (c) increases. This increase is even
higher in Mathematics course C. In this course,
students have to factorize an expression of the third
degree and to solve the corresponding equation of
third degree. The expression was in the form:
a3(a + b) – c(a + b)
and the students were supposed to understand that
(a + b) could be factorized to get (a + b)(a3 – c). No
student could factorize properly, which meant that the
solution rate was 0%. Many others simplified the
expression by creating an expression of the fourth
degree. Three students felt that the term was already
factored. In the second part of the task the equation
a3(a + b) – c(a + b) = 0
was to be solved. The students who created a fourth
degree equation could not do this. Since no one
solved the factorization the zero product method
could not be used. Thus, no student solved this task.
One disadvantage of the task was to solve a third
degree of expression where all roots are real.
Another task was to determine the value of x from
a given expression in the limiting area A(x) that gives
the least restriction area. It was not explicit in the task
that it is a min/max problem, solved by the function
derivative, so the students themselves should
understand this. 55% of the students understood the
relationship between the given function and the
function's derivative.
The last example is physics data from the Physics
A, where the students got the description "A stone
thrown straight up, turns and falls to the ground.".
Then the students had to choose which of six graphs
described the stone's acceleration. If you draw an s-t
graph and understand that acceleration is the second
derivative, i.e. a(t) = s´´(t) it is possible to
mathematically obtain the graph of the acceleration.
There was only one graph that had constant
acceleration. The solution rate was only 3%, despite
the fact that the students have been taught accelerated
motion in Physic A. One disadvantage of the task was
perhaps that the reference direction in the graph was
such that the acceleration was positive. Normally,
increased height is drawn in the positive direction of
the s-t graph and this would then give a negative
value of acceleration.
We note that there are important differences
between what teachers think students need to learn in
a teaching situation and what students need to be
offered in such a situation. The analysis shows that
teachers from preschool to upper secondary school
plan to focus on the object of learning as a whole and
the parts that constitute the whole, but they take it for
granted that the students should see the relations
between different parts and see if the parts can be
related to each other in a different way. The result
shows that it is exactly these relations the students
need to understand, and be guided to focus upon in
the learning situation.
5. DISCUSSION
The results presented in this article show that what
teachers believe that students need to be offered
concerning a specific content of Mathematics does
not correspond to students' needs. Gaps between the
intended and the enacted object of learning show that
both the way the object of learning is offered and the
way it is communicated in a teaching situation can be
improved. The analysis of the lived objects of
learning shows that, in order to improve the
mathematical communication, teachers may need to
focus more on the parts that constitute the whole, the
relationship between these parts, and to relate parts to
each other in different ways to convey a general
mathematical principle.
In the case of arithmetic and algebraic expressions,
we note that it is the way the parts relate to each other
that cause problems for students. Students seem to
recognize parts and wholes, but cannot relate the parts
to each other in different ways, which poses
difficulties when they meet new tasks and problems.
6. REFERENCES
[1] Marton, F. & Booth, S. (1997). Learning and
Awareness . New Jersey: Lawrence Erlbaum
Associates, Publishers.
[2] Marton, F., Runesson, U. & Tsui, A.B.M.
(2004). The space of learning. In F. Marton and
A.B.M. Tsui (Eds.), Classroom Discourse and
the Space of Learning (pp.3-42). New Jersey:
Lawrence Erlbaum Associates, Publishers.
[3] Runesson, U. (2006). What is it possible to
learn? On variation as a necessary condition
for learning. Scandinavian Journal of
Educational Research, 50(4), 397-410
22
Proceedings of The 4th International Multi-Conference on Society, Cybernetics and Informatics (IMSCI 2010)

[4] Olteanu, C., & Holmqvist, M. (2009). The
Concept of Function - Critical Aspects Induced
by Teaching and Textbook. In Callaos, N.,
Carrasquero, J., V., Oropeza, A., Tremante, A.,
& Welsch, F. (Eds.) Proceedings 3rd
International Multi-Conference on Society,
Cybernetics and Informatics, Vol. II, pp 195-
200. Florida: International Institute of
Informatics and Systematics.
[5] Olteanu, C., Holmqvist, M., Holgersson, I., &
Ottosson, T. (accepted). Differences in solving
second-degree equations due to differences in
classroom instruction. Educational Studies in
Mathematics Vol. X, No. X, Month 200X, pp.
000–000
23
Proceedings of The 4th International Multi-Conference on Society, Cybernetics and Informatics (IMSCI 2010)

Identifying Critical Aspects from Learners’ Perspective
Eva Wennås Brante Kristianstad University College SE-29188 Kristianstad, Sweden
ABSTRACT
This paper discusses what it takes to identify critical aspects from learners’ perspectives. The critical aspect is a vital component of variation theory, and can be described as “a particular way of seeing something … defined by the aspects discerned, that is, the critical features of what is seen” [1]. In order to experience reading, for example, you have to discern all the aspects in reading, such as the shapes of letters, the sounds in different contexts, the meaning of a word and the direction of a text as well as the semantic value of a word. Without discerning these aspects of the phenomenon ‘reading’, it is not possible to experience reading. That is made possible by discerning aspects when they vary, like letters that in a way are similar, but yet have different shapes. For someone with impaired reading, all aspects are not discerned. The difference between aspects and critical aspects is that the latter are those needed to develop learning.
In the current study, respondents with dyslexia describe what they experience when they read. From this data as well as from earlier studies using variation theory, the focus turns to whether it is possible to identify each person’s potential critical aspects. In this study the object of learning is reading ability. The questions the paper responds to are:
• How do the respondents themselves explain their reading deficit?
• What potential critical aspects could be found by analyzing what the respondents already have discerned?
Keywords: critical aspects, variation theory, reading ability, dyslexia.
1. INTRODUCTION
Variation theory concerns what it takes to learn; it is not a theory of how to teach. Learning is defined by variation theory as a new way to experience — an ability to see something from another perspective [2]. To obtain this shift in perspectives, aspects that need to be varied and discerned are called critical [3]. Critical aspects are not possible to find by the learner her- or himself: as soon as the learner discerns such an aspect it is not critical anymore because the learner has gained learning about it. And before the learner has discerned them, that person cannot be aware of them.
One example is how to find the critical aspect for a child who confuses the letters b and d. What is it actually that separates the letter b from the letter dand what similarities do children see when they don’t see the differences? Both letters consist of a half circle and a straight line, but the critical aspect is in which direction the half circle is pointed. For the learning child, the importance of the direction is not obvious. The child sees the parts of the letter but might not discern the critical aspect for naming it either b or d, especially if the child only knows one of the letters, e.g. the letter d. And as a chair is still a chair, even if it is turned around, why is a d not a dif it turns around into a b? If the learning child wants to use the letter to make others perceive it correctly, the critical aspect of the direction of the half circle has to be discerned, as well as the difference between b and d. Another person, let us say a teacher, by contrasting the two letters can steer the child’s awareness towards the two half circles’ directions, preferably by presenting them at the same time. If the child doesn’t discern the critical aspect, it might very well think b and write d; the difference in direction of the half circle is not experienced, only the components the letter consists of. So, a more knowledgeable person, by studying a learning person, can start to consider what the critical aspects might be. What can’t this person discern yet, what is it s/he has to discern to fully
24
Proceedings of The 4th International Multi-Conference on Society, Cybernetics and Informatics (IMSCI 2010)

understand this phenomenon? In other words, what is the critical aspect and how can it be found for each person and each learning situation? To know what something is you also have to know what it is not. A d is a d, but a d is not a b.
These questions will be elaborated more thoroughly in this paper through an example of interviews with respondents diagnosed with dyslexia. The results will try to explain what aspects the respondents discern and what aspects have yet to be discerned.
To read is to experience several aspects of the letters (recognition, sound, semantic) at the same time, which gives the letters a meaning. A person who experiences this has discerned aspects of the phenomenon in focus, aspects that are critical to understand the phenomenon. The scribblings become more than mere scribbling: they become revealed and filled with a meaning. For persons with dyslexia some of these aspects are not clearly discerned.
Dyslexia is a diagnosis with a broad and so-called continuous definition [4], which makes it hard to establish the exact transmission from poor reader to dyslexic reader. Dyslexia can be expressed differently within different individuals. However, there are findings showing a common pattern of reading capacities and strategies in some areas. A study from Canada [5] of dyslexic and non-dyslexic readers at university and college level used self-evaluating questionnaires to find out if the participants from these groups were learners with a deep or a superficial approach [6]. The results showed that dyslexic readers had problems finding the main ideas in a text and preparing for tests. Furthermore, eye-tracking studies concerning differences in eye-movements between dyslexic readers and skilled readers have shown that fixations for dyslexic readers last longer and are more numerous; meanwhile saccades tend to be shorter in length than saccades performed by skilled readers. The dyslexic readers make more regressive eye movements [7, 8].
All the above findings show some common reading patterns, but since the diagnosis can have several causes and is more or less severe within different people, it is still essential to find out more exactly what each person’s reading ability consists of, that is, to identify that individual’s critical aspects concerning reading and the difficulties they have
with reading. Identifying critical aspects of an object of learning, that is what shall be discerned and varied simultaneously to experience that object of learning, needs to be grounded in empirical data, as the learner discerns the object of learning. The critical aspects can be found by neither the learner nor the teacher themselves.
2. THEORETICAL ASSUMPTIONS
Reading is a culturally developed skill in which a person combines signs with sounds, puts sounds together to make meaningful words, and interprets them in the context in which they are found, and at the same time uses the context to correctly interpret the phonemes. A person who is reading a text processes it visually, phonologically and semantically simultaneously. It is possible to mechanically encode letters without transforming them into words and filling them with meaning, but that capacity is not discussed here. Reading is here understood as both encoding letters and grasping the meaning of a text.
Drawing on variation theory about how knowledge is attained, a person who is reading needs simultaneously to experience the parts and the whole. This seems to be a problem for many weak readers or readers diagnosed with dyslexia [9]. Their reading deficit aggravates some of the needed processes, and they tend to focus almost exclusively on parts — sounds or signs, or a part of a text or a word, and thereby fail to assemble the parts into a meaningful whole and understand the parts by a conception of the wholeness. Using the concept critical aspect, vital in variation theory, is one way to elucidate what an individual needs to discern when experiencing an object of learning. When a person shall read a word, it is necessary at the same time to understand the word, hear the sounds the word is made up of, know how to represent these sounds with the help of established signs, understand the concept of both books and texts and have an intention with the reading. All these aspects need to be discerned at the same time to be able to read the planned word. When one or two of these aspects cannot be discerned, the person has not fully experienced the phenomenon.
Asking a person why he or she can’t read or write properly is useless. If the person already knew what it was s/he could not discern, s/he would already had
25
Proceedings of The 4th International Multi-Conference on Society, Cybernetics and Informatics (IMSCI 2010)

discerned it and know it. Identifying the critical aspects, what is not discerned or what is not discerned simultaneously, is therefore necessary. Since we all perceive situations differently according to previous experiences and knowledge, critical aspects for a certain learning object cannot be presupposed to be transformed from one individual to another.
There is some resemblance between the concept of critical aspects and Vygotskij’s zone of proximal development (ZPD) [10]. Vygotskij talked about the possibility for an individual to gain new knowledge if s/he met the right artefacts and could mediate knowledge from them. The artefacts could be a more knowledgeable person or some material at the right level for the learner, helping the learning individual to do something that s/he will be able to perform on its own when s/he has gained the knowledge needed. This is a more obtuse reasoning than the concepts of variation theory, in which the teacher tries to find the critical aspects for a specific object of learning – what needs to be experienced and discerned simultaneously to fully understand that object of learning for a specific student group. The ZPD of Vygotskij could be understood as unsharpened knives, and the critical aspects of variation theory as sharp-edged knives. Once identified, they are used with precision to carve out the learning object and make it possible to see it from different perspectives — to fully experience it.
An earlier study [11] shows that teachers, when using their pre-understanding, often fail in identifying their students’ critical aspects of an object of learning; they misjudge the students’ comprehension of the object of learning. When the teachers are confronted with the learning outcomes of the students, they reconsider their understanding of what the critical aspects are [11]. In learning studies [12, 13] the procedure normally includes several steps; teachers jointly choose one object of learning, and then carefully interview students concerning their experience of that particular object of learning [14, 15]. Thereafter the teachers construct a pre-test, and analyse the results from the pre-test to try to find out what the critical aspects are. Teachers then jointly plan a lesson, conduct it and give a post-test. The whole procedure is done twice more with new students groups, to refine and sharpen the design of the instructions and really capture the critical aspects students need to discern.
In one way the learning study procedure could be described as looking at the pupils’ current knowledge and understanding of the chosen learning object from a ”back-door”. What mistakes do the students make? Why? What is it that they don’t see, that causes them to make these mistakes? What is it the teacher must clarify and present in a varied way to pinpoint exactly that the aspects needed to be
discerned are in fact discerned?
It is not a question about “telling“the pupils, it is a question of arranging the content in such a way that it enables the students to discern the pattern and the critical aspects and thereby experiences the object of learning. This procedure has proven to have a good impact for students’ deep understanding of the object of learning, as well as for teachers’ understanding of what critical aspects can be [11, 16]. It has also proven to be powerful concerning the students’ learning outcomes [17, 18]. This paper is based upon six in-depth interviews with dyslexic readers who themselves try to express how they read and what the problems are with their reading abilities.
3. METHOD
The interviews were performed during spring 2009. The respondents (n=6) were found through a webpage (n=1), through personal contacts (n=2) and through a reading counsellor at a University College in Sweden (n=3). Two of the respondents had an academic degree; four of them were students at the time for the interviews. Two of them had comorbidity with ADHD. The respondents were all adults and had long experience of reading, which was important for receiving rich and developed answers. They had all continued to study after upper secondary school, which means they had had to deal with their reading deficiency and probably thought a lot about it, which was also a good condition for sophisticated answers. All respondents came forward voluntarily. Since dyslexic readers often have bad school experiences, and can be traumatised, it was ethically important they freely volunteered. As it turned out in the interviews, all six had experienced bullying and/or feelings of being strange and left out. Table 1 presents data concerning the respondents: age, sex, when the dyslexia was diagnosed and the duration of the interview.
26
Proceedings of The 4th International Multi-Conference on Society, Cybernetics and Informatics (IMSCI 2010)

Name Age Sex Diagnosed
at
Interview
duration
Pete 23 years
Male 10 years 00:53:09
Jeanie 24 years
Female 19 years 00:44:58
Sarah 57 years
Female 8 years 00:45:51
Mary 47 years
Female 30 years 00:44:50
Cathy 35 years
Female 34 years 01:03:49
Eddie 24 years
Male 10 years 00:49:08
Table 1. Data concerning respondents.
The method used to collect the data was qualitative interviews [19]. Questions were designed to get in-depth answers in detail regarding reading and how text is perceived, for example how words are read out and how sounds are discerned. The interviews were conducted by telephone and in face to face. They were recorded via a digital tape recorder and thereafter transcribed and analyzed. The analysis in the first step was based on phenomenography [20] and in the second step on Variation Theory [21]. The answers were categorised based on phenomenography, constituted by the qualitatively different ways the respondents expressed their understanding of the phenomenon “reading” [20]. The individuals’ expressions were grouped into categories, but as dyslexia is a broad diagnosis, which can express itself in several ways, it is of importance to understand each individual’s specific problem. In phenomenography we seek as many different experiences as possible and hence the divergence is important. The categories in the second step are analyzed based on Variation Theory [21] to understand what kind of critical aspects are not yet discerned. The critical aspects concerning reading must be discerned and kept in focal awareness simultaneously in order to be able to read.
4. RESULTS
Many studies concerning dyslexia are made from a first order perspective [20] in which statements or opinions about reality are made. In contrast to such studies, this one departs from the respondents’ expressions. They are interviewed about how they experience reading.
To analyze and interpret interviews in a phenomenographic approach means to "search for and describe the critical differences in the ability of people to experience the phenomenon we are interested in” [20, p.161]. It is not about pairing one way to experience a phenomenon with one individual; the intention is to reveal the variation in how the phenomenon can be differently expressed. Thereafter categorizations of the different variations are made. This will allow a deeper understanding of how the phenomenon can be understood — in this case the aim is to better understand how people with dyslexia experience reading. Phenomenographic studies often have a small numbers of respondents and do not claim to uncover all the variations of a phenomenon, but the goal is that the categories should reflect the examined groups’ experiences [20].
The categories are composed of the expressed qualitative differences concerning the respondents’ problem with reading. They express how their reading is impaired, not what the impairment consists of. Five categories were found in the interviews — I don’t discern letters, I don’t discern sounds, I mix up words and syllables, I don’t find words, I don’t remember. All of the categories describe in one way or another difficulties with reading, why reading does not take place. Even with the same diagnosis, the description of the respondents’ capacities and impairments differ from one another and, of course, in some sense, differ for the same individual. The categories co-operate with each other in a negative way: if an individual has problems with remembering combinations of letters, that will obstruct the possibility to discern a word. If the word is not discerned, it is harder to know how a specific letter shall be pronounced, since the context sometimes determinates pronunciation. So, even if the core impairment, according to the respondent is, for example, “I don’t discern sounds” this does not mean that the other categories are not relevant at all. In fact, one person could express meanings in several categories. Cathy, for example, has troubles with word order and grammar, but she also forgets words.
Another way to describe the difference between the six respondents’ expressions is described in Figure 1. “Easy” should here be understood as relative, since neither reading nor writing is easy for a person without dyslexia. Nevertheless, the results stem
27
Proceedings of The 4th International Multi-Conference on Society, Cybernetics and Informatics (IMSCI 2010)

from their utterances and some express a difference in these capacities.
Reading easy Reading hard
Writing easy Mary
Writing hard Cathy Pete Jeanie Eddie Sarah
Figure 1
The respondents know that their reading is impaired, but have difficulty finding the reason and thereby identifying the critical aspects. Mary, for example, thought her capacity to recognise words had improved, but a recent test showed she was still guessing many words”. So I had to put that aside,
my reading problem couldn’t be explained according to that,” she concludes. Eddie gives another example; “Some days I can’t read a text. Quite impossible. . It, it just doesn’t work…I don’t know what happens…I can see the words but I don’t
understand them.”
However, the main issue in this study is to describe and discuss in what way it is possible to identify critical aspects (the second step of the analysis) from a learners’ perspective in combination with the perspective of the already learned. This will be illustrated by an example.
Pete is a young man of 23 years who got his diagnosis at the age of 10. His reading problem became obvious in grade four. He could not and cannot read his own handwriting. Pete expresses both that he does not discern letters and that he does not find words. He has to read a word letter by letter “I read up the word in my head, the whole word, I
have to take it letter by letter”. This takes quite a long time, so Pete guesses a lot on words, but sometimes he notices in the context that his guess was wrong and then “I have to go back to the word, and, ah, it was that!” Pete is aware of that this is a bigger problem when he meets new words; “completely new words that I read take a really long time to read and, yes, the context gets
incredibly important”. Pete is trying to understand what is happening when he is reading, but he cannot see what he cannot do. He says also “lately I have understood that people without dyslexia can seeconstellations of letters and directly understand
them, so to speak”. It is obvious that he has not this ability. He is touching upon what could be a critical
aspect, but he cannot define it and does not know what he has to discern to acquire that capacity. Where shall he start? What shall he do to obtain the capability others have to automatically read a word? For him words do not pop-out of the text. If he sees a text he can refrain from reading it. It is actually the other way round; to read is an active decision, whereas people without dyslexia have problems NOT reading a text placed in front of them. It’s like having to think about every movement when you walk. When Pete describes his reading ability, it is done with blunt knives — he is stuck in a cul-de-sac. It is impossible for him to discern the critical aspects. It is also impossible for the researcher or teacher to find an object of learning’s critical aspects without the connection between the learner and the object of learning. In this case, we can guess that Pete would need teaching to enhance his phonological skills as well as his vocabulary, but not merely teaching as such. He needs instruction that pinpoints the aspects critical for his understanding. The result from the interviews shows the respondents’ awareness of their impairments, but not how their knowledge can be developed, as they do not know the missing information. Both the teacher and the person who is going to learn need to make joint input for identifying the critical aspects. The interviews contribute information about how the object of learning is perceived, and show why it is impossible for the learner alone to identify what must be learned. An identified critical aspect is only the first step to new learning: of great importance is the way the critical aspect is presented and offered to the learner. Small differences in the way the critical aspects are varied, contrasted and made possible to discern have shown to have big impact on students’ outcomes [22, 23]. Learning is not a simple activity; it is a complicated process about how we acquire possibilities to see the phenomena around us.
5. CONCLUSIONS
Locating critical aspects of an object of learning requires collaboration between the learner and the object of learning. The learners themselves have a hard time finding out what they don’t know. But if they knew, they had already gained the needed knowledge. Critical aspects cannot be found solely through theoretical studies, nor can they be transformed without careful interaction between one person and another; critical aspects are learning dynamite that reveals new learning when found, and
28
Proceedings of The 4th International Multi-Conference on Society, Cybernetics and Informatics (IMSCI 2010)

they need to be empirically grounded and vigorously sought.
6. ACKNOWLEDGEMENT
I would like to thank the respondents for giving of their time and sharing their thoughts. I will also thank Paul Strand, Kristianstad University College, for putting me in contact with some of the informants.
7. REFERENCES
[1] Marton, F. & Tsui, A. B. M. (2004). Classroom Discourse
and the Space of Learning. (p.9) London: Lawrence Erlbaum Associates.
[2] Marton, F., Runesson, U., & Tsui, A. B. M. (2004). The space of learning. I F. Marton & A. B. M. Tsui (Eds.), Classroom discourse and the space of learning (pp. 3–40). Mahwah, NJ: Erlbaum.
[3] Holmqvist, M. (red.) (2006). Lärande i skolan:
learning study som skolutvecklingsmodell. [Learning in School: learning study as schooldeveloping] Lund: Studentlitteratur.
[4] Myrberg, M. (2007). Dyslexi: en kunskapsöversikt. [Dyslexia : a review] Stockholm: Vetenskapsrådet
[5] Kirby, J.,Silvestri, R., Allingham, B., Parrila, R. & La Fave, C. (2008). Learning Strategies and Study Approaches of Postsecondary Students With Dyslexia. Journal of
Learning Disabilities. Vol 41 Number 1 p. 85-96. [6] Marton, F. & Saljo, R. (1976). On qualitative differences in
learning: Outcomes and process. British Journal of
Educational Psychology, 46, 4-11. [7] Hutzler, F. & Wimmer, H. (2004). Eye movements of
dyslexic children when reading in a regular orthography. Brain and Language 89 (2004) 235–242.
[8] Rayner, K. (1998). Eye Movements in Reading and Information Processing: 20 Years of Research. In Psychological Bulletin, 1998, Vol. 124, No 3, 372-422.
[9] Kere, J. & Finer, D. (2008). Dyslexi. Stavfel i generna.
[Dyslexia. Spelling mistake in the genes.] Stockholm: Karolinska Institutet University Press.
[10] Vygotskij, L. S. Mind in Society: Development of Higher
Psychological Processes. Cambridge, Mass.: Harvard U.P[11] Gustavsson, L. (2008). Att bli bättre lärare: hur
undervisningsinnehållets behandling blir till samtalsämne
lärare emellan. [To become a better teacher; how to make the teaching content a conversation subject between teachers.] Diss. Umeå : Umeå universitet, 2008
[12] Holmqvist, M. (2002). Lärandets pedagogik. Forskningsansökan till
vetenskapsrådets utbildningsvetenskapliga kommitté. Kristianstad:Högskolan Kristianstad.
[13] Marton, F. (2003) Utbildningsvetenskap - ett begrepp och dess sammanhang: Forskning av denna världen –
praxisnära forskning inom utbildningsvetenskap. Stockholm: Vetenskapsrådet. (115 s). ISBN 91-7307-020-3
[14] Magnusson, A. & Holmqvist, M. (2010). The Rock Cycle -
a complex learning object. Paper presented at 8th
International Conference on Education and Information Systems, Technologies and Applications: EISTA, June 29 – July 2, 2010, Orlando, USA.
[15] Kong, H.Y., (2009). Tackling Student’s Learning Difference:
A Learning Study Mathematics Case. Paper presented at the 3rd Redesigning Pedagogy International Conference, National Institute of Education, Singapore, 1-3 June 2009.
[16] Holmqvist, M. (accepted). Teachers’ learning in a learning study. Instructional Science, Vol. X, No. X, Month 2009,
pp. 000-000.
[17] Holmqvist, M., Gustavsson, L., & Wernberg, A. (2007). Generative learning. Learning beyond the learning situation. Educational Action Research, Vol 15, no 2, pp
181-208.
[18] Holmqvist, M., Mattisson, J. (2009). Contrasting cases and their impact on learning: A replication of a learning study confirming the impact of contrasts. Problems of Education in the 21st Century, Vol 10, pp 38-46.
[19] Kvale, S. (1996). Interviews: an introduction to qualitative
research interviewing. Thousand Oaks: SAGE [20] Marton, F. & Booth, S. (2000). Om lärande. [Learning and
awareness.] Lund: Studentlitteratur.
[21] Holmqvist, M., Gustavsson, L. & Wernberg, A. (2008) Variation Theory – An Organizing Principle to Guide Design Research in Education. In Kelly, A.E., Lesh, R., &. Baek J. (Eds) Handbook of design research methods in education, pp 111-130. New York: Routledge.
[22] Wernberg, A. (2009). Lärandets objekt: vad elever
förväntas lära sig, vad görs möjligt för dem att lära och
vad de faktiskt lär sig under lektionerna. [The object of Learning; what pupils are expected to learn, what is made possible for them to learn and what they actually learn during lessons.] Diss. Umeå, Kristianstad: Umeå universitet, Högskolan Kristianstad, 2009. Umeå, Kristianstad.
[23] Holmqvist, M., Tullgren, C. & Brante, G. Defining an
object of learning and
the forms it appears in; the intended, enacted and lived
object of learning in a learning situation. Paper presented at 8th International Conference on Education and Information Systems, Technologies and Applications: EISTA, June 29 – July 2, 2010, Orlando, USA.
29
Proceedings of The 4th International Multi-Conference on Society, Cybernetics and Informatics (IMSCI 2010)

Creating and Sustaining Change: Assessment of Student Learning Outcomes
Metta ALSOROOK Office o f Student Success and Assessment, University o Texas at Dallas
Richardson, TX 75080, USA ABSTRACT
Change is a constant condition within
organizations, due to the introduction of new technologies, market place demands, external fo rces, and pressures to improve organizational effectiveness. However, large-scale organizational change efforts tend to fail more than 70 percent of the t ime. One of the recent large-scale movements within higher education institutions is towards accountability and assessment on student learning outcomes, which is higher education institutions should assess whether students learn what they should and retain the knowledge once learned. In addition, assessment findings should become a feedback mechanis m to improve students’ education experiences. In this paper the author describe a change effort with in a research university for compliance with regional accrediting commission requirements and program specific (engineering) accreditation requirements and procedures in defining and implementing assessment of student learning outcomes. The main issue is not just introducing new contents to the member of the facu lty, but making sure that the assessment effort is meaningful. Issues arrived and solutions in creating and sustaining the change effort will be discussed.
Keywords: Higher Education, Outcomes Assessment, Learn ing, Assessment, Change Effort, Student Learning Outcomes. 1. INTRODUCTION
In 2006, the Commission on the Future of Higher Education (Spellings Commission) issued a report about the future of American higher education. The report stated that American h igher education needs to demonstrate accountability and to show improvement especially in student learning outcomes [13]. According to Lubinescu, Ratcliff and Gaffney [7] , federal and state government are concerned about assessment of student learning outcomes and accreditation because they want to ensure that the funding given to higher education institutions is used effectively. In addition, higher education institutions, as organizations that receive funding from tax payers, must demonstrate that they are
producing the outcomes that align with their mission statement which is to educate students. Therefore, accreditation agencies and the states are adopting assessment practices to increase public accountability, ensuring universities and colleges’
performance, identify ing new funding criteria for h igher education institutions, and increasing the quality of higher education so they can compete within the nation and internationally [8]. As the middle g round between the policy makers and institutions, accrediting agencies support the demand for accountability and improvement by demanding new accreditation criteria and rev iew by introducing the institutional effectiveness concept. Institutions should engage in ongoing processes for improvement and demonstrate how they fulfill their missions [11] [3]. Hence, each academic program must conduct assessments to determine whether students learn what they should and retained it effectively. The University of Texas at Dallas (UT Dallas) is accredited by the Southern Association of Colleges and Schools (SACS) and some programs within UT Dallas are accredited by specialized accrediting agencies , such as ABET for undergraduate engineering programs, AACSB for programs within business schools, AUD for audiology program, etc. In addition, UT Dallas also must comply with the state regulations; for example, recently Texas legislature enacted House Bill 2504 that requires every public higher education institution within the state of Texas to post informat ion online regard ing course instructions, faculty credentials, course evaluations, and course syllabi. One of the major changes that the SACS requires higher education institutions to have is a process of assessment of student learning outcomes within their academic programs service units, and general education core curriculum courses. SACS reaffirmation comes once every ten years, and the last UT Dallas SACS accreditation was completed in 2008. Consequently, UT Dallas started its university-wide assessment process in 2006 making for a tight schedule, because SACS mandates every institutions collect at least two years worth of data. This paper discusses assessment as a change effort at UT Dallas within academic programs.
30
Proceedings of The 4th International Multi-Conference on Society, Cybernetics and Informatics (IMSCI 2010)

ASSESS MENT PROCESS In June 2006, the UT Dallas Vice Provost, created an assessment team with mandates to work with program heads, unit directors, and faculty who teach general education core courses to create assessments of student learning outcomes. Assessment of student learning is not considered new within higher education institutions; every faculty assesses what students know and can do. The difference with the assessment that SACS requires is that it is a program assessment and not a course assessment. Program assessment needs collaboration among program faculty and each program has to define its program mission, create student learning outcomes, and map the core courses within the program to the student learning outcomes. Program assessment should look like a road map, and it can be used not just by the program facu lty but also for students with in the program [14]. With a clear road map all facu lty know how their courses contribute to the overall program objectives and learning outcomes. UT Dallas also mandated new regulations regarding course syllabi: all faculty must create syllabi for every class they teach and state the learning outcomes for the courses. Starting a university-wide program assessment process proved to be difficult as it had never done before at UT Dallas. Furthermore, in 2006 UT Dallas had a large number of academic programs; there were 145 programs ranging from bachelors degree to doctoral degree programs. Support and participation from faculty and staff were important in implementing this new institutional change; therefore, members of the faculty had to own the activity and process to make the assessment process successful [4] [12]. Nichols [9] argues, that the primary factors that can hinder the assessment implementation are: lack of faculty and/or staff commitment; lack o f credence from faculty and staff that assessment activities will result in departmental improvements or in student learning improvements; the need for budgetary constraint such as faculty release time to do assessment; and difficulties integrating the assessment process with other campus processes . According to Slevin [12], the reason why members of the faculty tend to distance themselves from the assessment process is because they do not find connections with what they do and the program assessment process. In addition, members of faculty perceive the assessment process as a threat to their academic freedom. The method used to start the assessment process at UT Dallas was for the assessment team to work one on one and have good working relationships with each program head. In addition, the institution decided to buy a web-based assessment tool to organize the assessment contents. There are seven schools/colleges within UT Dallas and each assessment staff member was responsible for two to three schools (there were three assessment staff at that time). The work was very tedious
and took a lot of time, because the assessment team had to educate the program heads and program faculty about the assessment process, concepts, and content before creating program assessments. Program assessments contained program mission statements, student learning outcomes, measurements, and criteria o f success. One of the concepts that was introduced is Bloom’s Taxonomy and degree programs that have bachelors degree, masters degree, and doctoral degree had to be able to show progressive curriculum. Several university-wide meet ings regarding issues arose were held alongside the weekly one-on-one meetings with program heads and program faculty. The institution decided to create an in-house web-based assessment tool to amend problems encountered with the current tool, after using the old assessment tool (bought from a vendor) for a semester. The new web-based tool took the concept and the look of the old tool with additional features such as the ability for the rev iewer to add comments to the system; allowing faculty to read comments from the reviewers within the tool then make adjustments on their assessments.
EVALUATING THE ASS ESSMENT PROCESS
In 2007 the author sent out a survey to the UT Dallas faculty and staff to find how they perceived the assessment process and solicit ways to improve the process. The research data was surprisingly not as negative as the researchers expected. The data revealed that half of the respondents stated that assessment is important for institution’s improvement. The researcher
used survey questions employing both the likert -scale and open-ended questions through a web-based survey. There was a 42.3 percent response rate from the program heads and 64.2 percent response rate from faculty who taught general education courses. The percentage of program heads and core course faculty who strongly agree/agree that assessment will improve teaching and improve student learning is almost the same. Seventy percent of the program heads agreed with the statement that assessment is important in shaping academic priorities and 57 percent of the core course faculty agreed that assessment helps improve student learning. The number of respondents who had a negative view for the assessment process in average was 41 percents and only a small percentage stated that the assessment processes should be eliminated. Based on current literature and studies, the researcher expected more respondents to have negative views of the assessment process. Astin [1] makes an interesting argument about academic games, which can be used to explain the faculty’s
response toward the assessment process: rationalization (avoiding taking action based on the findings by stating
31
Proceedings of The 4th International Multi-Conference on Society, Cybernetics and Informatics (IMSCI 2010)

that the actions have been implemented or that they are in the process of being implemented), passing the buck (saying there is a need for further study before we can take real action), obfuscation (creating the impression of genuine concern and interest by invoking high sounding generalizations that lead to nowhere), recitation (making comments that the assessment results are not coherent, therefore there is no action to be taken), and displacement and rejection (questioning the assessment findings by commenting that the measures are not reliable). An assessment process that does not yield meaningful assessment findings can be the reason why members of the faculty feel that the assessment process wastes their time [16]. Therefore, UT Dallas’ assessment team should
consider changing the academic program assessment approach to make it more meaningful. In addit ion, comments about the assessment process reveal that there is a need for clear and regular communicat ions about the assessment process, assessment findings, and improvement from the assessment team, institution leaders, such as the provost and the deans. Creating a communicat ion plan for a new effort is important and the assessment team can use theories on how humans perceive change and methods to influence people to create an effective communication plan [10]. Explaining the importance of the assessment process in rigorous ways such as: why (why do we need to do the continuous assessment), what (what are the outcomes of the assessment process and the benefit of doing it), who (who will be affected by the new effort and who should be involved in the assessment process), how (how to do the assessment), and when (what is the time frame and when the message about assessment findings and improvement can be communicated) will make the new process be more successful [10]. Leaders’ commitment is important for successful
strategic planning [5]. Hence, there is the need to enhance the leaders’ involvement in the assessment process to
make it successful and to communicate, verbally and in print, the importance of assessment and using assessment findings for improvement [6]. In addition, the university should acknowledge the concerns people have about doing assessment. Thirty-two percent of respondents from academic programs and 16 percent of respondents from support services stated that they were concerned that assessment findings would be used against their programs or their departments. The university administration should address this perception of the potential use of assessment findings in order to facilitate a genuine assessment process for program improvement [9] [17]. SUSTAINING THE ASSESS MENT PROCESS
In 2009 UT Dallas started a new process for program assessment. Instead of making each program do a yearly assessment, program heads, with program faculty
approval, can choose the timeline for each academic program assessment. This program will run for five years and within five years each academic program will be comprehensively assessed, reviewed, and revamped at least one time. The assessment is divided into three phases: planning, collecting data, and closing the loop. After the third phase, the process returns to the first. The process is called a five-year assessment loop. For example the Criminology Department with in the School of Economic, Political and Policy Sciences (EPPS) which has a B.S., M.S., and PhD. in Criminology, chooses to do the planning for the B.S in Criminology in year one and then in year two they will plan the assessment for M.S in Criminology while collecting assessment data for the B.S in Criminology. In year three, they will create an assessment plan for the PhD in Criminology, collecting data for M.S in Criminology, and analyzing data and making improvements for the B.S in Criminology. This process has proven to work well and faculty members have less stress because the new process encompasses a program’s and school’s culture. However, this process cannot be done if the person in charge of the program does not support the assessment effort because this process needs thorough assessment effo rts including the use of assessment findings for program improvement, the alignment of the program curriculum, and continuity. Better organizat ional structure within each school/colleges is also important. Furthermore, support from the schools’ leadership is needed to make the
process successful. Another change within the assessment process is to make the assessment process aligned with the university program review process. Consequently, the in-house web-based assessment tool is also being revamped to match the new process. The new assessment tool will have a different look from the old assessment tool. The UT Dallas assessment coordinator submitted the new look and content for the web-based assessment tool and it was accepted by the associate provosts and assistant provosts who oversee the UT Dallas academic program review and new program submission. The tool is still being built by the university programmer and planned to be launched for a test in the summer 2010 semester.
ASSESS MENT WITHIN THE ENGINEERING
SCHOOL
The School of Engineering (ECS) is the second largest school at UT Dallas, with about 3,000 students in fall 2009. Its undergraduate programs are accredited by ABET, which is an international accreditation commission for applied science, computing, engineering and technology education programs. The UT Dallas ABET accred itation is due in 2010. ABET is considered as the leading accreditation agency in terms of assessment of student learning outcomes. Recently, they have reinvigorated their regulations on program
32
Proceedings of The 4th International Multi-Conference on Society, Cybernetics and Informatics (IMSCI 2010)
assessment. Each program now has to create its program educational objectives and student learning outcomes encompassing the ABET a to k learning outcomes (and courses within the program must align with the program performance criteria [14]. In short, a program’s curriculum should be mapped and aligned. The new requirements create new challenges for the ECS School. Hence, the school has decided to adopt a new tool, produced by Untra Corporation called the Academic Evaluation, Feedback and Intervention System--AEFIS, to help them with the new process. The UT Dallas assessment staff and the school ABET staff work together to make sure that the new effort is compliance with not only ABET but also SACS and state requirements. The ECS will adopt the customizable AEFIS Solution Platform over the in-house tool, as it will better suit its assessment needs . The use of a new tool creates different challenges within the ECS school faculty. First, there are issues on implementing the new tool in the school’s server and connecting it to the university system and database. This process took longer than anticipated. Then, there are issues with introducing the new tool to the ECS’ faculty
and ECS’ students . Creating a process for effective assessment cannot be done using a whole-sale process. It needs to be tailored to the departments ’ culture to make it work.
CONCLUS ION
The assessment process at UT Dallas is a changing process that needs time to become established. The process and concept were forced upon the institution’s stakeholders because of the pressing SACS accreditation due date. The old process proved successful in collecting assessment data, but it failed to make the point that assessment should be meaningfu l. Furthermore, members of the faculty must to support the assessment effort to make it meaningful. To sustain its assessment effort, the institution should recognize schools’ and programs’ cultures and efforts should be communicated effectively to gain faculty support. Changing the process from yearly assessment to a five-year process is an effective idea for pursuing better assessment feedback. In addition, aligning other accreditation requirements and university programs review into one process will make the assessment most effective. REFERENCE
[1] Astin, Alexander.W. Assessment for excellence: The philosophy and practice of assessment and evaluation in higher education. New York: Macmillan, 1991.
[2] Dugan, Robert.E. “Institutional Perspectives.” Outcomes Assessment in Higher Education: Views and Perspectives. Ed. Peter. Heron and Robert E. Dugan. Westport: Libraries Unlimited, 2004. 235-245.
[3] Ewel, Peter T. “Strengthening Assessment for Academic Quality Improvement.” Planning and Management for a Changing Environment: A Handbook on Redesigning Postsecondary Institutions. Ed. Marv in W. Peterson, David D. Dill and Lisa A. Mets. San Francisco: Josey Bass, 1997. 360-381.
[4] ____, Peter.T. Assessing Assessment: Success, Failures, and the Future. Assessment Conference - 2007 Assessment Institute at IUPUI. Indianapolis. IN.
[5] Keller, G. “Examin ing What Works in Strategic Planning.” Planning and Management for a Changing Environment: A Handbook on Redesigning Postsecondary Institution. Ed. M.W Peterson, D. D. Dill, L. Mets, & Associate (Eds .), San Francisco: Jossey-Bass, 1997. 158-170 .
[6] Loacker, G. & Mentkowski, M. “Creat ing a Culture Where Assessment Improves Learn ing.” In R. Banta, et al. (Eds.), Making a difference: Outcomes of a decade of assessment in higher education. San Francisco: Jossey-Bass Publishers. 1993. 5-39.
[7] Lubinescu, Edwards S., James L. Ratcliff, and Maureen A. Gaffney.” Two Continuums Collide: Accred itation and Assessment.” How accreditation influences assessment. Ed. James L. Ratcliff and Edwards. 2001. 5-22.
[8] Nettles, Michael, John Cole, and Sally Sharp. “Benchmarking Assessment: Assessment of Teaching and Learning in Higher Education and Public Accountability – State Govern ing, Coordinating Board and Regional Accreditation Association Policies and Pract ices.” Reports, 1997. ERIC Document Reproduction Service ED 492 520
[9] Nichols, J.O. Assessment Case Studies: Common Issues in Implementation with Various Campus Approach to Resolution. New York: Agathon Press. 1999
[10] Palmer, Ian, Richard Dunford, and Gib Akin. Managing Organizational Change: A Multiple Perspectives Approach. New Delhi: McGraww-Hill Companies. 2006
[11] SACS-COCS. Handbooks for reaffirmation of accreditation. Southern Association of Colleges and Schools. http://www.sacscoc.org/pdf/handbooks/Exhibit%2027.Reaffirmat ionOfAccreditation.pdf. (accessed November 18, 2008). 2004
[12] Slevin, J.F. “Engaging intellectual work: The facu lty’s role in assessment.” College English. 63.3. 2001: 288-305 [13] Spellings, Margaret. A test of Leadership: Charting
the future of U.S. higher education. Department of Education. Retrieved November 8, 2007, from
33
Proceedings of The 4th International Multi-Conference on Society, Cybernetics and Informatics (IMSCI 2010)

http://www.ed.gov/about/bdscomm/list/hiedfuture/reports/final-report.pdf. 2006
[14] Spurlin, Joni, Sarah Rajala, and Jerome Lavelle. “Assessing Student Learn ing: Ensuring Undergraduate Students Are Learning What We Want Them to Learn.” Designing Better Engineering Education through Assessment. Ed. Joni E. Spurlin, Sarah A Rajala and Jerome P. Lavelle. Sterling: Stylus, 2008. 23-58.
[15] Suskie, Linda. “Understanding the Nature and Purpose of Assessment.” Designing Better
Engineering Education through Assessment. Ed. Joni E. Spurlin, Sarah A Rajala and Jerome P. Lavelle. Sterling: Sty lus, 2008. 3-22.
[16] Vos, H. How to Assess for Improvement of Learn ing. European Journal of Engineering Education. 25.3, 2000. 227-233
[17] Walleri, R.D., & Seybert, J.A. “Demonstrating and Enhancing Community Colleges Effectiveness.” Making a Difference: Outcomes of a Decade of Assessment in Higher Education. Ed. R. Banta, et al. San Francisco: Jossey-Bass Publishers. 1993. 87-120.
34
Proceedings of The 4th International Multi-Conference on Society, Cybernetics and Informatics (IMSCI 2010)

Drexel EduApps: Freeing Faculty for Innovative Teaching
Craig BACH Office of the Provost, Drexel University
Philadelphia, PA 19104, USA
Donald MCEACHRON School of Biomedical Engineering, Science and Health Systems, Drexel University
Philadelphia, PA 19104
ABSTRACT
Too often, innovative designs for educational enhancement fail to achieve desired outcomes because they embodied the unintended consequence of built-in obsolescence. This ineffectiveness results from several issues, including a static view of learning and teaching styles, significant personnel dependence, an inability to manage changes in program size, and/or a lack of portability and adoption by the larger educational community. To counter these problems, faculty members at Drexel University are developing a system to disseminate innovative teaching (instructional, curricular, assessment, and operational) methodologies and support tools to automate manual processes. The approach is similar to Apple, Inc.’s highly successful iPhone approach. Drexel University’s EduApps Portal collects, evaluates and disseminates novel approaches to educational situations. By creating a Web-based applications portal, Drexel University ensures that new innovations are critically evaluated and widely disseminated in a useable format that provides for ongoing feedback and continuous improvement. This paper outlines the EduApps approach, discusses several examples and provides a blueprint for implementation. Keywords: Higher Education, Faculty Development, Application Development, Outcomes Assessment, Knowledge Management, Teaching and Learning
1. INTRODUCTION Recently, there has been much attention paid to the growing “app culture” [2, 12]. Most of the current effort has been focused on a literal imaging of what kinds of apps (for phones, laptops, eReaders, TiVO sets) would support a range of activities. This focus on a specific type of technology limits the power of the approach unnecessarily. The Drexel EduApps Portal is founded on
a broader reading of the approach that focuses on the key drivers of its success: user collaboration, quality control, ease-of-use, efficient learning curves, and targeted solutions to real problems, and an appreciation of the complexities and nuances of the context in which the tools are used. These key drivers form the core criteria that are informing the development of the EduApps project as a faculty support project at an institution of higher education. Creating an environment to better support faculty development and the adoption of innovative teaching and learning methods is a tall order [5, 15]. The success of these efforts is premised on two conditions – opportunity and reward – each influencing the probability of success in interconnected ways. Changing the reward structure is an administrative task and not the focus of the EduApps project. Our concern here is opportunity. Many current faculty are trapped by the results of the current lecture-based teaching model and the emphasis on research output. The time and expertise needed to develop new models of education seem beyond reach, especially to young tenure-track faculty, and even scanning the educational literature appears too great a task [1, 9, 11, 12]. How do they choose an appropriate model? How do they know what does and does not work? What is a student learning outcome? Under such circumstances, most faculty will fall back on their own educational experiences – usually based upon the lecture motif – and thus perpetuate a defective model. In addition, for a given innovation to generate a significant impact, it must be successful in a wide range of applications. To do this, an innovation must be available to a broad audience, easily understood and readily applied with a minimum of additional effort. The iPhone applications model shows that the system that delivers applications can, in and of itself, result in a significant impact in a particular area. The success of the iPhone is not simply the result of innovative applications
35
Proceedings of The 4th International Multi-Conference on Society, Cybernetics and Informatics (IMSCI 2010)

– many of the applications are not, in fact, particularly novel- but rather in the nature of system that delivers them. A map is not very novel and even an electronic map is not all that innovative. Having a use-friendly map tied in to a GPS with a query system delivered to a touch-sensitive portable phone – that is game-changing. Drexel’s EduApps Portal provides a simple, efficient and effective method for faculty to disseminate and use innovations. By providing proven methodologies for specific issues, faculty can easily download and use new techniques without going through an exhaustive search of the educational literature. In addition, EduApps can be designed with embedded assessment tools, ensuring that evaluation and feedback are part of the approach. Thus, when faculty have a question related to teaching – for example, how do I educate students to search the published literature to find specific information? – a faculty member need not act in isolation. Instead, they can access the Portal and discover that indeed, we have an EduApp for that! EduApps can be used for multiple purposes, from automating simple manual processes to implementing novel instructional methods. As an example of the former, consider the faculty member who wishes to form multidisciplinary groups for discussion or laboratory purposes. A common approach is to download the class list, analyze the list for the relevant characteristic – major, ethnic group, gender, etc. – and then manually create the desired groupings. This is a process easily automated. The EduApp downloads the class list, requests for the sorting characteristic(s) and then creates the optimal groupings. A process which could take a faculty member upwards of 1-2 hours, depending on class size, is reduced to seconds. While this may not seem particularly high impact, the time savings can free faculty for more intellectually rewarding pursuits – such as the development of new teaching methodologies. Thus, EduApps can help create an opportunity for high impact innovation by freeing up faculty time in order to develop and implement new, high impact techniques. One important requirement for an EduApp is a modular design. EduApps are small, transferrable and modular educational applications that do not require a significant learning curve in order for faculty to implement them. This makes them far different from complex electronic teaching systems – such as Blackboard and BbVista – where considerable time can be spent learning the complexities of the interface. Given the environment of higher education where time is a significantly limited resource, EduApps provide a easily implemented and rapidly deployable system of educational enhancements. It should be noted that EduApps need not be technological in nature. A downloadable set of instructions for a specific instructional methodology which does not rely on technology is a perfectly accepted
EduApp. The key characteristics of an EduApp is that the EduApp responds to a specific educational need and can be easily understood and implemented by a faculty instructor without significant additional investment of time and or resources. The impact of any idea or innovation cannot rest solely upon its potential but rather upon the extent to which the idea effects its environment. No matter how exceptional an idea or innovation is in theory, its impact in fact rests upon the ability of the idea to be implemented. The impact of Drexel’s EduApps Portal on higher education is as a modular electronic support system designed to provide additional time for faculty to focus on teaching while providing implementable techniques for enhancing that teaching. The iPhone and the Apple Apps Store generated a revolution is how cell phones impact daily life. We expect the Drexel EduApps Portal to generate a similar revolution in how educational innovation (including high impact practices) is delivered to, and implemented by, faculty in higher education.
2. DEVELOPMENT AND IMPLEMENTATION The user interface and user-facing content items are yet to be developed and identified; however, the structure of information that is needed to support the goals of the tools has been developed. This structure sits behind each EduApp and is the focus of current development efforts. The following figures outline these structures and provide an outline of the project’s workflow.
Figure 1. EduApp Development
36
Proceedings of The 4th International Multi-Conference on Society, Cybernetics and Informatics (IMSCI 2010)

Figure 2. EduApp Support Materials
The six pilot projects (see next section) will help the team further refine and better support the development process so as to encourage faculty members to engage in the development of EduApps.
3. DREXEL EDUAPP EXAMPLES The Drexel team has identified six EduApps for initial proof-of-concept deployment and to pilot the development and evaluation process. A brief outline of each of these EduApps follows. Student Response
Several faculty members at Drexel University are using student response systems (clickers) in their classes. Their expertise is informing the development of an EduApp. The tool will provide a concise guide to accessing the technology, implementation guidelines, and a means to document the evaluation of its use in the classroom. The tool also links directly resources, including the expert clicker users at the institution. The goal of the Student Response EduApp is to support an efficient and quick need-to-use-to-evaluation path [13, 14].
SCAA DocPrep
The SCAA DocPrep EduApp is an online tool that supports faculty and academic administrators who are preparing materials for submission to the faculty senate for approval. The process is detailed and scheduled. It is the goal of the EduApp to make the process easier to complete while integrating the process more closing with the Microsoft SharePoint solution use to manage the approval process. Rubric Writer The Rubric Writer EduApp is being developed to support, as the name suggests, the creation of rubrics to support learning outcomes assessment. The tool will provide a customizable rubric frame, collaboration tools, and a rubric quality checklist/guide. In addition, the tool will provide a structure to guide and document reliability testing of the created rubric, as well as a means to align to existing department, program or institutional rubrics. Expert resources will be linked to the tool, including a library of existing and vetted rubrics. The Learning Syllabus
To support the development and use of syllabi that align to the university’s syllabus template [7, 8], the Drexel team is developing The Learning Syllabus EduApp. The tool will lead users through a process focused around a set of articulated learning outcomes for the course (i.e., possible developed with the Outcomes Creator EduApp) and guide them in the addition of syllabus items aligned to the stated outcomes. The tool will clearly delineate required, optional, and suggested items, as well as support a range of decision points to determine the length of the syllabus and what other, if any, related documents are created to supplement the syllabus. The EduApp also will provide a visioning tool that guides and captures conversations among faculty members as they envision what evidence of learning might look like for various levels of achievement of the outcome. The process has been successfully used to support improved communication goals and higher quality rubrics, and is modeled after the tuning process conducted as part of the Bologna initiative. Expert resources will be linked to the tool and the EduApp will provide an easy means to collect feedback and usage data about the developed syllabi. Outcomes Creator The anchor of Drexel’s learning assessment plan is the development of clear, concise and measurable learning outcomes. The Outcomes Creator EduApp will guide users through a series of questions and suggestions as
37
Proceedings of The 4th International Multi-Conference on Society, Cybernetics and Informatics (IMSCI 2010)

they develop individual learning outcomes, align them to existing higher level outcomes, and then step back and evaluate and refine the set of outcomes (e.g., for a course or program). The tool will integrate both the original and revised Bloom’s taxonomies. As with the other EduApps, expert resources will be linked to the tool and the EduApp will provide an easy means to collect feedback and usage data about tool. Survey Questions
One key piece of Drexel University’s learning assessment plan is to support faculty members in the development of short surveys to provide them with focused, meaningful feedback during and after a course. To support that goal, an EduApp is being developed to help faculty members improve their ability to write good survey questions. The Survey Questions EduApp will embody the survey construction expertise of faculty and outside experts. The tool will guide users through a series of questions and suggestions as they develop survey questions, align them to the purposes identified for developing the survey, and then evaluation and refining the set of questions in total. The tool will also link users to the survey tools supported by the university and a list of expert resources. The EduApp will provide an easy means to collect feedback and usage data about tool. Loop Closings
To support and encourage faculty members to explore the impact of engaging in full-circle learning assessment, as well as to document the extent to which this is being done, the team is developing the Loop Closings EduApp. The tool will guide, support and document the process of faculty members identifying learning outcomes, developing and implementing a means to assess student achievement of them, collecting data and then using the information to inform curricular, instructional and operational decisions about their courses. The EduApp is a process support [3, 4] and documentation tool and does not support any efforts to rank, score or evaluate the performance of the course or the faculty member. Expert resources will be linked to the tool as well as a means to evaluate the EduApp.
4. AN INSTRUCTIONAL DECISION SUPPORT SYSTEM (IDSS)
The success of the EduApp concept depends heavily on the achievement of two goals: 1. Aligning the applications as just-in-time solutions to
educational problems – real problems faced by instructors the resolution of which is key to accomplishing a desired instructional task For example, to support better use of end-of-term student course surveys, EduApps can be developed
to help faculty respond to specific kinds of results on these surveys. Or, if a campus is running the National Survey of Student Engagement (NSSE), a series of EduApps can be developed to support appropriate interventions based on specific survey results.
2. Making educational innovations and the results of
the best research on education available to the faculty in ways that they can use efficiently and effectively with minimal start-up effort.
The translation of research to changes in instruction can be difficult. For example, a series of studies may support the importance of distinguishing student learning styles in order to better support student achievement of learning goals. However, it is difficult for the average faculty member to determine how to use such information. What does the discovery that the majority of your students are active learners actually mean in terms of deploying new pedagogies? Just having the raw data is not sufficient – one needs an interpretation and the ability to act on that analysis easily, efficiently and effectively. EduApps can help support these translations.
While there are many other cases where EduApps can be aligned to specific instructional contexts, or help translate research to action, each of these examples are single event or single instrument solutions. The authors propose to develop an EduApps Portal in the context of a broad knowledge management platform – the Instructional Decision Support System (IDSS). Health care professionals often use decision support systems to provide data on current diagnostic and disease criteria in an effort to improve patient care. According to the US Department of Health and Human Services, such systems provide “clinicians, staff, patients, and other individuals with knowledge and person-specific information, intelligently filtered and presented at appropriate times, to enhance health and health care’ (Clinical Decision Support Systems: State of the Art, Agency for Healthcare Research and Quality, US Department of Health and Human Services). Given the similarity of the two situations – clinicians needing to perform individual diagnoses using vast amounts of data without the ability to interact long enough with patients to understand their individual characteristics and teachers having to understand their own vast subject areas and be able to impart this knowledge in an meaningful way to large numbers of students in a relatively short periods of time without the opportunity to mentor students individually –a similar approach would seem appropriate. Elsewhere in this session, we have described this new approach as a knowledge management (KM) structure for education – the Instructional Decision Support System or
38
Proceedings of The 4th International Multi-Conference on Society, Cybernetics and Informatics (IMSCI 2010)

IDSS. An IDSS is an “interactive computer-based information system which links student characteristics, student performance, instructor characteristics, learning outcomes, and instructional methods to inform faculty decisions on the appropriate educational pedagogy to improve student learning.”[6] Such an adaptive KM system will continually process various relevant data - such as student characteristics, prior student performance, workload, etc. - to provide the faculty instructors with current data necessary to match pedagogy and course learning outcomes with student profiles. By linking the IDSS with a storehouse of innovations in a standard format (the EduApps Portal), faculty will be able to make use of educational innovations in the context of their own specific teaching and learning situations.
5. CONCLUSION The EduApps Portal promises to be a powerful vehicle for transmitting, supporting and engaging faculty members in research-based innovations in teaching and learning. The focus on creating the most efficient and faculty-centered means for providing this support is the key to the EduApps approach. The approach avoids many of the standard professional development pitfalls and steps around barriers that often prevent adoption of new pedagogical and curricular improvements, while at the same time creating a space to highlight the creative, collaborative work of faculty members from across the institution.
5. REFERENCES [1] “Faculty Inquiry in Action”, The Carnegie
Foundation for the Advancement of Teaching, 2008.
[2] B. Chen, “How the iPhone Could Reboot Education”, Wired. Retrieved from http://www.wired.com/gadgetlab/2009/12/iphone-university-abilene/#ixzz0dpoTzOK1, 2009.
[3] G. Fenstermacher, “On Making Determinations of Quality in Teaching”, Teachers College Record, 107(1), 186-213, 2005.
[4] H. Hubball, J. Collins, & D. Pratt, “Enhancing Reflective Teaching Practices: Implications for Faculty Development Programs”, Journal of Higher Education, XXXV(3), 57-82, 2005.
[5] D. Lieberman, “Beyond Faculty Development: How Centers for Teaching and Learning Can Be Laboratories for Learning”, New Directions for Higher Education, (131), 87-99, 2005.
[6] D.L. McEachron & A. Torres, Instructional Decision Support Systems: A New Approach to Integrating Assessment, Teaching and Learning”
[7] D. Meyer, “OptAssign—A Web-Based Tool for Assigning Students to Groups”, Computers & Education, 53(4), 1104-1119, 2009.
[8] S. Gambescia, “Syllabus Construction with a Commitment to Shared Governance”, The Journal of Continuing Higher Education, 54(1), 20-27, 2006
[9] H. Shim & G. Roth, “Expert Teaching Professors: Sharing Their Expertise”, International Journal for the Scholarship of Teaching and Learning, 3(2), 2009.
[10] M. Sorcinelli, “Faculty Development: The Challenge Going Forward”, Peer Review, Fall, 4-8, 2007.
[11] M. Stigmar, “Faculty Development through an Educational Action Programme”, Higher Education, 27(2), 107-120, 2008.
[12] L. Villar & O. Alegre, “Measuring Faculty Learning in Curriculum and Teaching Competence for Online Courses”, Interactive Learning Environments, 16(2), 169-181, 2008.
[13] R. Walker, “Dreaming of EDU Apps”, Inside Higher Ed. Retrieved from http://m.insidehighered.com/blogs/technology_and_learning/dreaming_of_edu_apps, 2009.
[14] R. Walker & G. Barwell, “Click or Clique? Using Educational Technology to Address Students' Anxieties about Peer Evaluation”, International Journal for the Scholarship of Teaching and Learning, 3(1), 1-21, 2009.
[15] W. Weiner, “Establishing a Culture of Assessment”, Academe Online, 2009.
39
Proceedings of The 4th International Multi-Conference on Society, Cybernetics and Informatics (IMSCI 2010)

Learning Analytics: Targeting Instruction, Curricula and Student Support
Craig Bach Office of the Provost, Drexel University
Philadelphia, PA 19104, USA
ABSTRACT
For several decades, major industries have implemented advanced analytics and decision support structures to advance and support their goals. More recently, institutions of higher education are starting to adapt these methods to target fund raising, inform enrollment decisions, target marketing efforts, improve student support processes, and to better understand retention/persistence patterns. Separately, regional, national, and specialized accreditors, as well as the federal government, are ratcheting up expectations around learning outcomes assessment (e.g., articulation of measurable learning outcomes, assessment of student achievement of those outcomes, and the use of resulting data). Both threads, weaving their way through institutions of higher education, are coming together in the area of learning analytics (or, academic analytics). This paper outlines a conceptual framework for the development of learning analytics, highlighting lessons learned from industry, limitations of the approach, and important ethical issues involved in the application of these methods to educational contexts. Keywords: Higher Education, Analytics, Predictive Modeling, Outcomes Assessment, Learning, Decision Support, Knowledge Management
1. INTRODUCTION Predictive modeling (e.g., logistic regression, neural networks, decision trees, support vector machines, survival analysis) and segmentation modeling techniques (e.g., clustering analysis, categorization analyses) have been used extensively in a range of industries to target resources and support goal achievement. In the insurance industry, for example, these techniques are regularly used to target and customize direct mailing campaigns in order to reduce mailing costs and increase yield, or to predict customer retention [12]. The pharmaceutical industry uses advanced modeling techniques to determine the efficacy of drug interventions and predict patient survival rates.
While the specific techniques differ depending on context and the intended goals of the modeling effort, the general approaches of segmentation and predictive modeling are straightforward. The main goal of segmentation modeling is to separate a population into groups that, in aggregate, behave significantly differently with respect to a desired behavior (i.e., buying a particular insurance policy), or conversely, who look similar based on key demographic, psychographic, or behavioral variables. Predictive modeling is used to identify the likelihood that members of a population achieve an identified end, make a decision, or take a particular action – attaching a probability to each member of the population. The end user is then able to set appropriate cut levels that determine ranges of actions (i.e., population members with attached 75% probability of responding to a tailored mailing, will get sent the mailing). The predictive model optimally combines the factors in the data set that drive the desired action. Some techniques (e.g., logistic regression, decision trees) specifically identify those combinations of factors and can inform the end user about the relations among variables that support an action. Other techniques (e.g., neural networks, support vector machines) score individuals, but do not provide the relations among variables that determine a score. In the main, the models are developed based on historical data and then used to score (attach probabilities to) individuals in the decision-targeted population (e.g., potential customers, patients, or policy holders). The resulting scoring provides insight into the new population that helps target resources while improving returns.
2. TRANSFERRING PRACTICE TO EDUCATIONAL CONTEXTS
One of the biggest challenges in using data to inform improvements in learning is the sheer volume of available data. Basically, there is far more data available than can meaningfully be used. Attempts to filter data and focus collection efforts are ongoing challenges and it
40
Proceedings of The 4th International Multi-Conference on Society, Cybernetics and Informatics (IMSCI 2010)

is often left to end-users to sift through data to find those specific tidbits that are meaningful to them. Support for these decisions is often provided by benchmarking data, highlighting specific results, or running basic tests of significance. But, we need to be much smarter about this effort – here is where learning analytics provides an indispensible tool. Higher education has been slow to adopt analytics. Initial use in academe was focused on areas most closely aligned to their business counterparts (e.g., marketing, enrollment qua customer insight). However, as Campbell and Oblinger point out [3], the application of advanced modeling techniques is being used to support more core academic functions. Currently, most of this effort is focused on better understanding retention/persistence (particularly first-year retention) and enrollment yields. More broadly, the development of analytic capabilities and the use of these techniques to drive decision-making are most often focused in just a few areas of the institution. Figure 1 displays these areas and their relationships to each other in the context of discussing institutional effectiveness in achieving a mission.
Figure 1. Areas of Analytic Concentration
The areas along the left side of the diagram are the main business areas of the institution with evidenced use of advanced modeling or analytics. In the case of operations, these may be process improvement efforts (e.g., six sigma) that form part of larger modeling work. These areas are usually the drivers of institutional effectiveness and advanced modeling techniques have been used successfully to support and document this effectiveness. Educational effectiveness is one part (arguably the most important part) of the overall institutional effectiveness of the institution. Historically, educational effectiveness
has been measured by broad outputs (graduation rates, mean GPAs, graduate school acceptance rates, employment rates) and inputs (SAT/ACT scores of incoming fist-year students). It is probably not a coincidence that these areas have been the main focus analytic efforts. Less attention has been paid to borrowing analytic methods from operations to improve student-facing processes even though these service and support areas have been shown to have a large impact on student success However, the current expectation among accreditors is to measure educational effectiveness through learning outcomes assessment. Learning outcomes assessment involves: The articulation of measurable learning outcomes, The identification of where articulated learning
outcomes are supported (e.g., in the curriculum, in other educational activities),
A method of assessing student achievement of the articulated outcomes, and
The use of assessment data to make improvements to instruction, curricula and learning.
Learning analytics involves the use of advanced modeling techniques integrated with learning outcomes assessment to better understand student learning and more efficiently and meaningfully target instruction, curricula and support. This area is one of the least developed and most promising areas of analytic work.
3. LEARNING ANALYTICS Learning analytics is defined as the use of predictive modeling and other advanced analytic techniques to help target instructional, curricular and support resources to support the achievement of specific learning goals. One of the key data items involved in learning analytics is learning outcome achievement data. As such, the success of a learning analytics effort is dependent upon the quality of the learning outcomes assessment data available and the reliability of the measurements used to collect those data1. However, learning analytics also make use of a wide range of other kinds of learner characteristic data often used in other modeling efforts. In fact, learning analytics can be seen as the refinement of enrollment, retention, persistence, and graduation models with the introduction
aracteristic data. of learning outcomes and learning ch
1 This is not to say that learning analytics cannot be
implemented with less than ideal outcomes data (something I will discuss later in this paper).
41
Proceedings of The 4th International Multi-Conference on Society, Cybernetics and Informatics (IMSCI 2010)

Other data types include: Test scores (e.g, ACT, SAT) Class grades Demographic, psychographic data Learning styles, characteristics or preferences data LMS/CMS activity data Survey data
The possible data points are rich and diverse and much of the work is exploratory (identifying new variable groups to develop and run through the process). As with most analytic work, the main goal is to identify the most relevant and actionable drivers of learning outcome(s) achievement. Application Opportunities Learning analytics can be applied to address a range of questions and provide insight to a diverse set of learning situations. The following are explanatory examples: Predicting Outcome Achievement
Using testing, outcome achievement (from previous courses), survey data, learning styles, demographic data, and LMS activity data to attach a probability (scoring) to student achievement of an individual outcome or set of outcomes prior to entering a program or course. The data could be used to target interventions on areas of greatest challenge. Course and Program Dashboards
Develop course dashboards2 informed by model scoring to provide professors, students and advisors with a targeted view of students’ “probability to achieve” selected outcomes prior to the start of a class, or use modeling to identify areas of challenge and strength rolled up for the entire course related to a set of course outcomes to help direct faculty to specific instructional techniques or content remediation. Develop a pre-term program-level dashboard informed by predictive model scoring that identifies areas of potential challenge for students and helps target interventions across a program.
2 Dashboards are being implemented by Untra Corporation’s
Academic Evaluation, Feedback and Intervention System (AEFIS) as part of an Instructional Decision Support Systems (IDSS) approach. The IDSS is an interactive computer-based information system which links student characteristics, student performance, instructor characteristics, learning outcomes, and instructional methods to inform faculty decisions on the appropriate educational pedagogy and materials to improve student learning.
Curricular Evaluation Use modeling techniques to identify supporting relations among learning outcomes in order to define data-evidenced pre-requisites. Use the data to refine curricular sequencing to maximize student success. Develop a complexity index for each outcome or set of outcomes that allows academic teams to focus resources on areas of greatest challenge for students, and so with specific learning and learner data correlated to the achievement of those outcomes (i.e., with the data in hand to be able to target interventions). Prioritize Learning Outcomes
Identify learning outcomes or sets of outcomes the achievement of which most strongly correlates to retention, persistence and graduation. Use the data to identify at-risk students and support targeted interventions across the institution that are informed at the level of student learning and student learner characteristics. Set Course and Instructional Policies
Identify the data from the learning management systems that are the strongest drivers of student learning and success. Set curricular and instructional policies aligned to these findings and identify targeted points of intervention (e.g., phone calls, meetings) to better support retention and learning. Defining Academic Quality
Develop research initiatives to identify those practices, curricular structure and pedagogies that best support achievement of selected learning outcomes. Use findings to set and insure compliance with quality benchmarks.
4. LIMITATIONS
The main limitation of deploying learning analytics is the reliability and validity of the learning outcomes and learner characteristic data used in the models. Or, more simply, the availability of, and appropriate granularity of outcomes data from which models can be developed. Although accreditors have been focusing on learning outcomes assessment for over 10 years, for most institutions the effort is still in its infancy. One method to address this limitation is to develop disciplinary consortia similar to those developed to support the tuning process in the Bologna paradigm. The consortia could develop a consistent articulation of a focused set of learning outcomes and identify methods for assessing them. The underlying data set would be comprised of data from across all member institutions. In this way, data sets become large enough to become analytically viable.
42
Proceedings of The 4th International Multi-Conference on Society, Cybernetics and Informatics (IMSCI 2010)

A second limitation is the need to communicate modeling results in an efficient and meaningful way to end-users who are able to understand and use the data, and the current ability of most institutions to address the problems inherent in developing appropriate technologies. J. Campbell has made huge strides in this area at Purdue with the Signals tool [4]. In addition, the Academic Evaluation, Feedback and Intervention System (AEFIS) solution platform with its instructional decision support system approach offers a strong approach to the communication problem as well as the possibility to support disciplinary consortia.
5. ETHICAL CONSIDERATIONS
There are several ethical considerations to be addressed when deploying learning analytics methods, or academic analytics more broadly. These issues include: What data is appropriate to collect about students?
What data is inappropriate? Who should be able to access the data and view
results? Which data should be reported anonymously? Which can be tagged to students for educational purposes?
What is the impact of showing faculty modeling results? Do any of the data bias faculty instruction and evaluation of students?
The answer to these questions most often depends on the culture of the institution and its IRB, but there are overlapping legal concerns around FERPA, USDE policies, federal mandates and privacy laws. Given the nascent nature of learning analytics as a field of inquiry, an institution can expect to address many similar, but unforeseen, questions as the program moves forward. As such, any institution engaging in these kinds of modeling activities should plan on developing a concurrent, and systematic, conversation that addresses for the institution how it approaches the ethical and legal issues that might arise along the entire modeling process (from data collection to data usage).
6. CONCLUSIONS The convergence of two major efforts in higher education – the application of analytics and the development of learning outcomes assessment – holds a great deal of promise for helping educators and institutions better understand student learning and the factors that support student success, and more efficiently target instructional, curricular and support resources to improving student learning. In addition, the strength of the most successful analytics approaches comes from an institution-wide approach to knowledge management that is focused on
what the institution strives to achieve in its mission (the goals and purposes that define the institution). In this sense, learning analytics will provide one piece of educational effectiveness in a larger analytics program supporting institutional effectiveness. The real strength of the approach is in the sharing of insights (not to mention data and model equations) from across all sectors of the institution focused on a coherent, informed and collaborative vision. In addition, thinking more broadly, the analytics approach, and specifically learning analytics, offers an opportunity and structure to develop relationships across institutions of higher education focused on student learning. The opportunities offer rich paths for improving higher education both here and abroad.
7. REFERENCES [1] L. Baer, J. Leonard, L. Pugliese & P. Lefrere,
“Action Analytics: Measuring and Improving Performance that Matters in Higher Education”, Educause Review, 2008.
[2] L. Briggs, “Data-Driven Decision-Making: Data Pioneers”, Campus Technology, 20(3), 2-30, 2006.
[3] J. Campbell & D. Oblinger, “Academic Analytics”, Educause Quarterly, (October), 1-20, 2007.
[4] J. Campbell, P. DeBlois, & D. Oblinger, “Academic Analytics: A New Tool for a New Era”, Educause Review, (July/August), 40-57, 2007.
[5] P. Goldstein, “Academic Analytics: The Uses of Management Information and Technology in Higher Education”, Educause Center for Applied Research, 2005.
[6] J. Gonzalez & S.L. DesJardins, “Artificial Neural Networks: A New Approach for Predicting Application Behavior”, Proceedings of the Association for Institutional Research (AIR) 41st Annual Forum (pp. 1-39). Long Beach, CA: Association for Institutional Research, 2001.
[7] A. Karmon, “‘Institutional Organization of Knowledge’: The Missing Link in Educational Discourse”, Teachers College Record, 109(3), 603-634, 2007.
[8] J. Kidwell, K. Vander Linde, & S. Johnson, “Applying Corporate Knowledge Management Practices in Higher Education”, Educause Quarterly, (4), 28-33, 2000.
[9] C. Lee, “Diagnostic, Predictive and Compositional Modeling with Data Mining in Integrated Learning Environments. Computers & Education, 49(3), 562-580, 2007.
[10] P.C. Liezl van Dyk, “Creating Business Intelligence from Course Management Systems”, Campus-Wide Information Systems, 24(2), 120-133, 2007.
43
Proceedings of The 4th International Multi-Conference on Society, Cybernetics and Informatics (IMSCI 2010)

[11] D. Norris, J. Leonard, L. Pugliese, L. Baer, & P. Lefrere, “Framing Action Analytics and Putting Them to Work”, Educause Review, 43(1), 1-8, 2008.
[12] K. Poulin & A. Freeman, “Developing a Marketing Geographic Segmentation System Using SAS® Software”, SAS Users Group International Proceedings, Seattle, WA, 2003.
[13] G.E. Steele & K.C. Thurmond, “Academic Advising in a Virtual University”, New Directions for Higher Education, (146), 85-95, 2004.
[14] G. Swan, “Tools for Data-Driven Decision Making in Teacher Education: Designing a Portal to Conduct Field Observation Inquiry”, Journal of Computing in Teacher Education, 25(3), 107-113, 2009.
[15] H. Tolley & B. Shulruf, “From Data to Knowledge: The Interaction between Data Management Systems in Educational Institutions and the Delivery of Quality Education”, Computers & Education, 53(4), 1199-1206, 2009.
44
Proceedings of The 4th International Multi-Conference on Society, Cybernetics and Informatics (IMSCI 2010)

Instructional Decision Support Systems: A New Approach to Integrating Assessment, Teaching and Learning
Donald MCEACHRON
School of Biomedical Engineering, Science, and Health Systems Philadelphia, PA 19104, USA
Antoinette TORRES
Office of the Provost, Drexel University Philadelphia, PA 19104, USA
ABSTRACT Decision support systems (DSS) are effective currently used in business and medical fields to allow professionals to make evidence-based decisions. Such methodology can be applied to education to enable continuous improvement to curriculum and teaching strategies. This implementation will take great planning efforts and development of current technologies, in addition to support from resistant faculty. DDS methodology in education will allow for “closing the loop”—effectively organizing information collected for accreditation processes to be used in real-time. The Drexel University School of Biomedical Engineering, Science, and Health Systems is working collaboratively with Untra Corporation to develop the first Instructional Decision Support System (IDSS), the Academic Evaluation, Feedback and Intervention System—AEFIS. In this paper the authors will discuss the value of the IDSS and its effects on the educational environment. Keywords: Decision Support System, Closing the Loop, Outcomes-Based Assessment
INTRODUCTION
Imagine you are a faculty member in higher education assigned to a class. Although you have received considerable training in your subject area, you have received almost no formal training in the art or science of teaching and learning. In addition, the information provided to you as you begin the task of creating the organization and teaching elements of this course consists of a brief description of the course in the University catalog, vague, generalized and most likely out-of-date and, if you are lucky, an old syllabus. Thus, with little or training and virtually no support, you set out to teach this class. How do you respond to this challenge? If you are like most college instructors, especially those in research universities where tenure and promotion are based primarily on research activity and not on teaching effectiveness, you fall back on what you know and what is easily available. What you know is both your own subject area and techniques of the instructors with whom you yourself learned the most effectively. What is easily available are textbooks and Internet references. So what you do is use a textbook’s table of contents to organize your course, set out the topics and the order, and then you present that material based upon those techniques which were used to present to you when you were a student. You include a few observations from your own personal experiences and some Internet sources and proceed. The first time you teach the course is most likely a bit of disaster, but as you teach the course over several times, you get more comfortable, learn about your students, add more of your own personality to the course and so on. For several years afterwards, the course appears to succeed.
This does not last, however. As you proceed with your career, the students appear to change. The tried-and-true techniques of the past seem to work less and less often. Again, if you are like many harried and over-committed university faculty, you blame the deteriorating situation on the new generation of students. They are ill-prepared, less motivated, have too great a sense of entitlement, etc. Logically, the problem cannot be with the instructional techniques – you are the same as you were before and those techniques worked previously so it must be the students. Frustrated, you seek to avoid teaching, concentrate on your research activities and let the next generation of faculty take on teaching this new generation of students. They are, of course, no better suited to the task than you were originally and so the cycle begins again. This is a common cycle on a micro-scale, the scale of the individual faculty instructor and academic program. On a macro-scale, higher education appears to go through phases of self-examination, where it is recognizes at some level that things are not working well. Undergraduate students are discovered to be less than adequately qualified at graduation and various actions are recommended. The problem is studied, analyzed and answered are suggested. However, even when implemented, these answers seem to have a marginal utility. Much like the situation at the individual instructor level, these cyclic educational reform movements work well initially and for selected populations but the success fades over time and thus reform must be periodically reinitiated. In fact, the higher educational system appears to almost be organizationally fractal – the same kinds of cycles appearing at both the micro- and macro-scales. We believe that part of the reason behind these cycles is the static and uniform approach embodied in many educational innovations. Continuous changes in student learning styles, attitudes and personalities are not incorporated into the innovations, despite clear evidence that students do change from generation to generation. In addition, educational research is not well-suited to recognize individual differences. If many, or even most, students are currently active learners, for example, this does not mean that active learning techniques will work well for all students, including those who are reflective learners. By focusing on the average or majority, educational research tends to obscure individual differences, limiting the effectiveness of new techniques and approaches. If the lack of ability to incorporate continuous changes is adding in to the lack of recognition of individual differences, it becomes clear that many educational innovations incorporate a kind of built-in obsolescence which helps to explain these continuing cycles of educational reform.
45
Proceedings of The 4th International Multi-Conference on Society, Cybernetics and Informatics (IMSCI 2010)

THE OUTCOMES-BASED APPROACH In recognition of the problems occurring in higher education, many accrediting bodies, both specialized and regional, have begun to adopt outcomes-based approaches for evaluating programs in higher education. Outcomes (also called Student Learning Outcomes - SLOs). Outcomes are characteristics of students at the time of graduation. These characteristics can include knowledge, skills, attitudes, etc. Some examples are given below (source in parentheses)
1. An ability to design and conduct experiments, as well as to analyze and interpret data (Engineering Programs, ABET, Inc. http://www.abet.org/)
2. Understand accounting and business terminology used in business scenarios, and be proficient with commonly used office software programs (Butte College, Business Education Program http://www.butte.edu/departments/careertech/businessed/slos.html)
3. To think philosophically about our existence in the world and to demonstrate a philosophic approach to ethical issues (Seattle University http://www.seattleu.edu/assessment/SLO.asp)
4. Communication Skills Learning Goal: Students graduating with a BADM degree will be able to effectively present information orally and in writing (California State University, Chico – College of Business http://www.csuchico.edu/cob/_documents/learningGoals_BADM.pdf )
5. The ability to analyze and evaluate artwork from various perspectives and to receive responsively suggestions about and criticisms of his or her own work from others. (Dickinson State University Bachelor of Arts degree in Art http://www.dsu.nodak.edu/Catalog/fine_arts/art_majors_minors.htm)
6. Recognize the relationship between structure and function at all levels: molecular, cellular, and organismal. (University of San Francisco Bachelor of Science degree in Biology http://www.usfca.edu/biology/outcomes.htm)
Programs and organizations are then evaluated on how while their students reach specific SLOs. Specialized accrediting bodies, such as ABET, Inc often supply fairly specific SLOs while regional accreditors, such as the Middles States Commission on Higher Education, provide more general outcomes. Both kinds of accreditors are interested in determining the extent to which students are reaching the program’s or institution’s SLOs and thus, in the assessment of student learning. This new emphasis on assessment in accreditation has both positive and negative consequences for educational reform. The positive is that accreditation can provide a motive for examining programs and their effectiveness in promoting student learning. SLOs provide targets that programs can strive to reach and, as described in the paper on mapping being presenting here, can lead to curricular reform through the developmental mapping of SLOs into specific educational experiences in an appropriate temporal context. However, the link between assessment and accreditation often leads to elaborate assessment systems and production of large amounts of data with little or no explicit
linkage to actual instruction. This has been characterized as the problem of ‘closing the loop’ – actually using assessment results to generate construction change in instructional delivery. In addition, the close association between assessment and accreditation has lead many faculty in higher education to dismiss both as mere bureaucratic hoops to jump thorough. Assessment has becomes the means to gain accreditation rather than as a means to generate educational reform and the latter connection suffers as a result. In summary, there are several problems to be addressed to generate sustainable educational improvements in higher education. Students must be recognized as a diverse and moving target. It is unlikely that any particular educational approach will work with all students and even if this were to occur, students will change over the generations and the approach is likely become obsolete over time. There are numerous innovative educational approaches being developed but it is not clear how to associate various approaches with specific students. The predictive validity for many approaches for specific student populations has not been established. Nor is it clear how faculty are to locate and use these innovations. Most faculty in higher education have difficult time keeping up in their own specialized fields, much less searching through the educational literature. Finally, the outcomes-based assessment movement has led to the generation of reams of data, much of which is under-utilized if it is used at all. What can be done about these issues? DEVELOPMENT OF AN INSTRUCTIONAL DECISION
SUPPORT SYSTEM (IDSS) We believe that aspects of product and process quality management can be adapted to the task of continuous quality improvement in engineering education. In a manufacturing model, it is vital to understand the characteristics of the raw materials with which one is working, how these materials react to the various processes to which they are subjected and how these reactions can be precisely controlled to reliably generate the desired end product. This requirement to understand the raw materials and their reactions to the various manufacturing processes and procedures is, if anything, even more critical in education since the ‘raw materials’ in this case are living human beings which must assist in their own ‘manufacture’ if the desired end point – an innovative and productive graduate able to compete successfully in a competitive global environment – is to be reliably obtained. In medicine, ‘clinical decision support (CDS) systems provide clinicians, staff, patients, and other individuals with knowledge and person-specific information, intelligently filtered and presented at appropriate times, to enhance health and health care’ (Clinical Decision Support Systems: State of the Art, Agency for Healthcare Research and Quality, US Department of Health and Human Services). We believe that many aspects of current medical practice are similar to those encountered in modern education, such as the need to access vast amounts of data in an understandable format and the need to make individual diagnoses using this data without the opportunity to thoroughly interact with each individual patient. We are currently developing and implementing a new category of knowledge management system – the Instructional Decision Support System. We define the Instructional Decision Support Systems (IDSS) as the interactive computer-based information system which links student characteristics, student performance, instructor
46
Proceedings of The 4th International Multi-Conference on Society, Cybernetics and Informatics (IMSCI 2010)

characteristics, learning outcomes, and instructional methods to inform faculty decisions on the appropriate educational pedagogy to improve student learning. This adaptive system continually processes real-time data to constantly adjust the information being presented to the faculty instructor. In its initial iteration, the IDSS will provide each faculty instructor with three interactive forms in addition to an electronic syllabus. These forms are the:
1. Incoming Student/Course Profile (ISCP) This form will provide information to instructors on the attributes, characteristics and prior performance of students about to take any given course. Student characteristics include such variables as learning styles, intelligence types, personality types, etc. that have been shown relevant to student learning. Links will be provided to explain how each characteristic is thought to influence student learning. Performance criteria to be covered in the course are provided and suggestions for best practices in teaching these types of students these specific performance or learning outcomes are given. Embedded links provide access to specific teaching methodologies. The previous performance of the incoming students on relevant performance criteria in other classes or educational experiences (assessment data) is also provided in aggregate form. Individual data can be assessed as well should instructors wish to investigate the factors influencing performance of any particular student.
2. Course Rationale and History Profile (CRHP) This form will show how each course fits into the curriculum, not only highlighting pre-requisite and following courses, but also the expected developmental stage of learning that students are expected to have entering the course and attain upon completing course materials. The association of learning outcomes and class assignments for previous class offerings are provided. Summaries of faculty and student comments on the success or failure of different teaching approaches can be accessed through specific embedded links.
3. Evaluation Results: Notes and Recommendations (ERNR) This form provides a summary of student and faculty course evaluations (which is linked to the Course Rationale and History Profile), trend analysis of student performance over several iterations of the course, a historical listing of recommendations for improvement and the measured effects of those recommendations when implemented.
UTILITY OF THE IDSS APPROACH
Although it is difficult to characterize students in a manner that assists in designing educational paradigms, evidence from numerous sources indicates that such characterizations can be obtained and successfully applied to improve student learning [3, 5, 6, 7, 9, 10, 11, 15, 18, 22, 23, 29, 30]. With so many studies supporting the importance of understanding students’ personality and learning styles for effective learning, why have these approaches not achieved more widespread application in education? We believe there are three key reasons for this limited implementation.
1. Characterization of the instructional system has been limited to only a few variables measured simultaneously. Some studies measure learning styles, others motivation, some teaching styles, others aspects of curricular organization but none to date have measured all these variables simultaneously [3, 6, 7, 8, 11, 16, 19, 21] [23, 24, 31]. Using the IDSS approach, multiple parameters are measured on students, instructors and curricular design to overcome this limitation as well as investigate interactions between the various parameters;
2. Previous studies focused primarily on results rather than
process. Thus, it has been difficult to determine the extent to which these data were generally applicable and no systematic method for determining if the data were replicable to new programs, students, institutions and/or situations is available. In contrast, the IDSS approach is primarily process-driven integrating instructional (student, instructor, course, curriculum) measurements and analysis with assessment of student learning outcomes. Thus, a major advantage of the IDSS approach is that it is transferrable to other programs who would then be able to monitor their own instructional environments and develop and test their own educational innovations;
3. Ease of use. A key trade-off in the utility of any
innovation is the time and resources needed to implement it versus the benefits which result from the implementation (in this case, improved student learning). Since prior studies focused on results and not processes, the cost/benefit assessments for implementing a system to make use of the studies’ conclusions were not considered. Such analysis is inherent in the present proposal with methods for systematic implementation a key element of the IDSS methodology. The end result is expected to be a systems approach that can be implemented in any educational program with any student body.
REVISITING THE NEW INSTRUCTOR DILEMMA
WITH AN IDSS Let us now return to our hypothetical faculty instructor assigned to a specific course. In the previous iteration, the instructor was provided with little or no tangible support. A course description and previous syllabus, if available, were all the instructor had to orient themselves and set about the task of course construction. Left to his or her own devices, our hypothetical faculty member employs the teaching techniques most familiar to them – ones that worked for them when they were students – selects an appropriate text and begins the process of trying to facilitate student learning. Contrast this with the activity of an instructor given access to the proposed multi-form IDSS. Once assigned to a course, the faculty can access the Course History and Rationale Profile (CHRP) to determine how this course fits into the overall curriculum design. The student learning outcomes associated with the course are provided along with embedded links to instructional strategies that have been used to facilitate student achievement on those outcomes in the past (See paper in this session on DrexelEdApps). A graphical analysis shows how pre-requisite courses contribute to the course-specific learning outcomes as well as the developmental stage of learning expected of students when they complete your course. The courses subsequent to this class are provided as well, allowing
47
Proceedings of The 4th International Multi-Conference on Society, Cybernetics and Informatics (IMSCI 2010)

the instructor to understand the developmental flow of student knowledge and skills within the overall curriculum and how his or her course facilitates this process. After familiarizing themselves with the roles this course is expected to play in student development within the curriculum, the instructor may now access data showing how well that expectation was actually met in the past. The Evaluation Results: Notes and Recommendations (ERNR) form provides the instructor with trend analysis of previous student populations related to assigned learning outcomes, along with an archive of pervious recommendations and instructional activities combined with assessment data on how well those instructional methods met expectations in terms of student learning. Lastly, our hypothetical instructor will access the Incoming Student/Course Profile (ISCP) to examine the characteristics of the incoming students in terms of relevant variables associated with learning (learning styles, etc.) as well as the specific performance on learning metrics in previous courses. He or she will examine graphical summaries of student characteristics associated with embedded links to definitions and descriptions of the meaning of the data in terms of student learning as well as to suggested instructional methodologies. The instructor can compare trend data from the ERNR with data on the same learning outcomes for his or her incoming class. In theory, this will allow the instructor to select from a variety of instructional methods those most appropriate to the learning outcomes, incoming level of student achievement, and student learning characteristics of his or her incoming class. As a very preliminary example, consider the following example from the School of Biomedical Engineering, Science and Health Systems at Drexel University in Philadelphia. According to data collected using the Index of Learning Styles [Felder and Spurlin, 2005], the majority of students in the School are sequential, as opposed to global, learners (62% vs. 38%). The instructor involved in the senior sequence in biomaterials, Dr. Elisabeth Papazoglou, however, is a global thinker and took that approach in her instructional delivery. One apparent result of this instructor-student mismatch was poor student course evaluations –when the global approach was being used, 42% of registered students gave the initial biomaterials course low scores on organization and 35% complained that it took them 4-5 lectures to understand how to approach the class. After recognizing the students’ learning style, Dr. Papazoglou altered her instructional lessons to be more sequential, using a step-by-step approach to cover the material. This initial implementation of this methodology resulted in reduction in the number of students scoring the course low on organization (26% down from the original 42%) and the complete elimination of complaints that the course was difficult to follow (down from 35%). By the second iteration, the number of students indicating poor course organization was down to 10% and student participation had substantially increased. Thus, having the information about the specific learning styles of her students in time to adjust her instructional delivery enabled Dr. Papazoglou to enhance those students’ educational experience. Using the IDSS approach, these results would be archived in the both the CRHP and ERNR databases for this course. Thus, should another instructor teach this course, they would be able to access Dr. Papazoglou’s experiences, revisions, the reasons for those revisions (students as sequential vs global learners) and the results of implementing those revisions. The new instructor could then examine the incoming student profile for consistency with these revisions. If
incoming students are sequential, then perhaps the approach pioneered by Dr. Papazoglou will continue to work. If, on the other hand, the incoming students are more global thinkers, a new approach may be needed. The impact of having all three forms is that instructors will be able to access methods which worked in the past, understand why they worked, and be able to anticipate whether or not they will continue to work with new students.
REQUIREMENTS AND FUNCTIONS OF THE IDSS An IDSS is not a stand-alone application – it requires, for example, the student learning outcomes or their related measureable components be developed and then associated with various educational experiences (See paper on mapping, this session). Assessment tools and metrics are needed (See papers on assessment and mapping, this session) which must be rigorously applied to generate the data needed to support the IDSS forms. In addition, educational methods and innovative instructional techniques must be made available in an understandable and east-to-use format so that the embedded links within the forms enable faculty to put these innovations to use with minimal additional effort (See papers on learning analytics and DrexelEdApps, this session). Finally, student, instructor and curricular data must be continuously collected and updated to ensure that the IDSS forms are providing the correct evidence with which to support instructor choices. Thus, the IDSS serves as a linking mechanism associating student characteristics, assessment data, curricular structure, and student performance in such a manner as to facilitate decisions on instructional methodology. We are currently working on development of the IDSS with Untra Corporation as part of their overall AEFIS curriculum management system. AEFIS – Academic Evaluation, Feedback and Intervention System – is providing the mapping, assessment design, survey management and curriculum design tools around which we are creating the IDSS system.
Figure 1 AEFIS IDSS Implementation Diagram—The syllabus serves as the aggregate view for data collected from students, faculty, administrators, and alumni.
The current approach is primarily a ‘pull’ system – although instructors will be provided with the IDSS forms, they will have to decide to use them. This justifies the effort places in making the forms as simple and easy-to-use as possible. Any significant impediment to accessing the data will limit the use to which the instructors put the IDSS knowledge base. At the same time, added a tracking component will allow system administrators – such as curriculum committees and/or program directors – to
48
Proceedings of The 4th International Multi-Conference on Society, Cybernetics and Informatics (IMSCI 2010)
monitor the use of the IDSS forms by various instructors and related to various classes. In this way, the utility of the IDSS can be assessed and data on the use or disuse of various links determined. Eventually, an expert system component can be added which uses the data on student achievement on specific learning outcomes, instructor uses of various links and instructional approaches and survey data to make stronger suggestions as to the probability of success of various instructional approaches for specific student populations and learning situations. In effect, we are creating a learning system to help students learn.
CONCLUSION: WILL IT WORK? Decision support systems (DSS) are fairly common software applications in business [20, 27, 28] and clinical [1, 14, 17, 25] environments. However, despite evidence of the utility of such systems [4, 14, 17], DSS have not achieved as widespread an effectiveness as might be imagined in either business [26] or clinical [2] environments. In analyzing resistance to the effective implementation, Setzekorn and colleagues [26] listed numerous factors as relevant, some of the major factors included: the motivation and attitude of users; the complexity of the system; the utility of the system as perceived by users and the management of the implementation process. Berner [2] comes to somewhat similar conclusions concerning clinical decision support systems, cited the motivation of clinicians, interface design, proper fitting of the DSS to the clinical workflow, and management issues as major impediments. These same factors will affect the impact and implementation of the IDSS system. We hope to overcome these problems by working closely with faculty on interface design, creating feedback on the utility of the IDSS in terms of student performance and implementing the system in a phased approach providing for maximum user feedback in the design and implementation.
REFERENCES [1] Berlin, A., Sorani, M. and Sim, I. (2006). “A taxonomic
description of computer-based clinical decision support systems.” Journal of Biomedical Informatics, 39: 656-667.
[2] Berner, E (2009). “Clinical Decision Support Systems:
State of the Art.” AHRQ Publication No. 09-0069-EF. Downloaded from http://healthit.ahrq.gov/images/jun09cdsreview/09_0069_ef.html
[3] Borg, M. and Stranahan, H. (2002). “Personality type and student performance in upper-level economics courses: The importance of race and gender.” Journal of Economics Education, 33: 3-14.
[4] Cascante, L., Plaisent, M., Maguirraga, L. and Bernard, P. (2002). “The impact of expert decision support systems on the performance of new employees.” Information Resources Management Journal, 15(4): 64-78
[5] Cole, J. and Denzine, G. (2004). “’I’m not doing as well in this class as I’d like to’: Exploring achievement, motivation and personality.” Journal of College Reading and Learning, 34: 29-44.
[6] DiMuro, P. and Terry, M. (2007). “A matter of style: Applying Kolb’s learning style model to college mathematics teaching practices.” Journal of College Reading and Learning, 38: 53-60.
[7] Dunn, R. and Stevenson, J. (1997). “Teaching diverse
college students to study with a learning-styles prescription.” College Student Journal, 31: 333-339.
[8] Entwistle, N. aand McCune, V. (2004). “The conceptual basis of study strategy inventories.” Educational Psychology Review, 16: 325-345.
[9] Felder, R and Spurlin, J, (2005). “Applications, reliability and validity of the index of learning styles.” International Journal of Engineering Education, 21: 103-112.
[10] Felder, R. (1995). “A longitudinal study of engineering student performance and retention. IV. Instructional methods and student responses to them.” Journal of Engineering Education, 84: 361-367.
[11] Felder, R. and Silverman, L. (1988). “Learning and teaching styles in engineering education.” Engineering Education, 78: 674-681.
[12] Felder, R., Felder, G., and Dietz, E.J. (1998). “A longitudinal study of engineering student performance and retention: V. Comparisons with traditionally-taught students.” Journal of Engineering Education, 87: 469-480.
[13] Felder, R.M., Felder, G. and Dietz, E.J. (2002). “The effects of personality type on engineering student performance and attitudes.” Journal of Engineering Education, 91, 3-17.
[14] Garg, A., Adhikari, N., McDonald, H., Rosas-Arellano, M.P., Devereaux, P., Beyene, J., Sam, J. and Haynes, R.B. (2005). “Effects of computerized clinical decision support systems on practitioner performance and patient outcomes.” Journal of the American Medical Association, 293: 1223-1238.
[15] Graff, M. (2003). “Learning from web-based instructional systems and cognitive style.” British Journal of Educational Technology, 34: 407-418.
[16] Hoyt, D. and Lee, E.-J. (2002). “Teaching ‘styles’ and learning outcomes.” IDEA Research Report #4. Downloaded from: http://www.idea.ksu.edu/reports/research4.pdf
[17] Hunt, D., Haynes, R.B., Hanna, S. and Smith, K. (1998). “Effects of computer-based clinical decision support systems on physician performance and patient outcomes.” Journal of the American Medical Association, 280: 1339-1346.
[18] Ishiyama, J. (2005). “The structure of an undergraduate major and student learning: A cross-institutional study of political science programs at thirty-two colleges and universities.” The Social Science Journal, 42: 359-366.
49
Proceedings of The 4th International Multi-Conference on Society, Cybernetics and Informatics (IMSCI 2010)

[19] Kunzman, R. (2002). “Extracurricular activities: Learning from the margin to rethink the whole.” Knowledge Quest, 30: 22-25.
[20] Liu, S., Duffy, A., Whitfield, R., Boyle, I. and McKenna, I. (2009). “Towards the realization of an integrated decision support environment for organizational decision making.” International Journal of Decision Support System Technology, 1(4): 38-58.
[21] Litzinger, T, Lee, S. H., Wise, J., and Felder, R. (2007). “A psychometric study of the index of learning styles.” Journal of Engineering Education, 96: 309-319.
[22] Martin, G.P. (2000). “Maximizing multiple intelligences through multimedia: A real application of Gardner’s theories.” Multimedia Schools, 7: 28-33.
[23] McCoog, I.J. (2007). “Integrated instruction: Multiple intelligences and technology.” The Clearing House, 81: 25-28.
[24] Noble, T. (2004). “Integrating the revised Bloom’s taxonomy with multiple intelligences: A planning tool for curriculum differentiation.” Teachers College Record, 106: 193-211.
[25] Raghupathi, W. (2007). “Designing clinical decision support systems in health care: A systemic view.” International Journal of Healthcare Information Systems and Informatics, 2(1): 44-53.
[26] Setzekorn, K., Sugumaran, V. and Patnayakuni, N. (2002). “A comparison of implementation resistance factors for DMSS versus other information systems.” Information Resources Management Journal, 15(4): 48-63.
[27] Singh, R. (2007). “A multi-agent decision support architecture for knowledge representation and exchange.” International Journal of Intelligent Information Technologies, 3(1): 37-59.
[28] Steiger, D. (2010). “Decision support as knowledge creation: A business intelligence design theory.” International Journal of Business Intelligence Research, 1(1): 29-47.
[29] Terry, M. (2001). “Translating learning style theory into university teaching practices: An article based on Kolb’s experiential learning model.” Journal of College Reading and Learning, 32: 68-85.
[30] Trianatafillou, E., Pomportsis, A., Demetriadis, S. and
Georgiadou, E. (2004). “The value of adaptivity based upon cognitive style: An empirical study.” British Journal of Educational Technology, 35: 95-106.
[31] Van der Hulst, M. and Jansen, E. (2002). “Effects of curriculum organization on study progress in engineering studies.” Higher Education, 43: 489-506.
50
Proceedings of The 4th International Multi-Conference on Society, Cybernetics and Informatics (IMSCI 2010)

An Iterative Mapping Strategy for Improved Curriculum Design and Assessment Elisabeth PAPAZOGLOU
School of Biomedical Engineering, Science and Health Systems, Drexel University Philadelphia, PA 19104, USA
Fred ALLEN School of Biomedical Engineering, Science and Health Systems, Drexel University
Philadelphia, PA 19104, USA
ABSTRACT
The impact of curriculum design on student learning has not been as well studied as other aspects of higher education. Research studies on student learning typically focus on the interplay between student personality and/or cognitive factors and instructional delivery systems within the context of a single course or a course sequence. Such studies provide results related primarily to student achievement within that specific course or sequence. Curricula, however, are complex systems of courses and activities with significant dependencies and interactions. This paper details the methodology used by the School of Biomedical Engineering, Science and Health Systems at Drexel University in collaboration with Untra Corporation to develop a performance criteria-driven alignment and integration of our courses into a competency-based curriculum. Keywords: Assessment, Mapping, Outcomes, Performance Criteria, Objectives, Rubrics, Bloom’s Taxonomy
INTRODUCTION The processes of assessment and evaluation when applied to higher education are often viewed with considerable angst by participating faculty1. Attitudes can become increasingly negative when the process is viewed as imposed by outside forces, such as when it is driven by the accrediting process exemplified by ABET’s approach to engineering programs. However, properly understood and applied, assessment and evaluation systems can lead to substantial improvements in curricular design and implementation. Since preliminary research indicates that overall curriculum design is an important factor in student academic achievement2,3, processes that improve curriculum design can be of vital importance in ensuring program success. The purpose of this paper is to discuss the mapping of performance criteria into a curriculum, a process which is often considered as particularly onerous, and to provide a practical method of its implementation. This paper will also discuss the effectiveness of Untra Corporation’s Academic Evaluation, Feedback and Intervention System —AEFIS software that enacts mapping strategies and tracks students’ performance.
BASIS DEFINITIONS AND TERMINOLOGY Following the example of one of the greatest teachers of all time, Socrates, we will begin with definitions of selected key terms to ensure consistent communication and therefore achieve common understanding.
Assessment is the process by which one determines the current state of an individual, course, program, curriculum, academic unit, or institution. Assessment is primarily concerned with the collection and organization of data. These data can be
quantitative, qualitative or both. Data can be in any format – test scores, written documents, portfolios, external reviews, etc.
Evaluation is the process of making value judgments based upon the assessment data. Taken together, assessment and evaluation are key elements of the design process. To design a course, curriculum, or program, it is necessary to establish the goals and objectives to be obtained. Creating an assessment plan during the design process helps define these goals and objectives in measurable terms. By having a preliminary decision matrix in place to guide evaluation, the goals and objectives can be further refined and better understood by all the stakeholders.
Modes of Assessment. There are several modes in which assessment can be done. These are:
1. Institutional; 2. Programmatic; 3. Course/Activity; 4. Instructor; 5. Student
Broadly speaking, these can be categorized as Institutional (#1) and Academic (#2-5). Institutional assessment refers to the entire entity and how resources are obtained and allocated in relationship to the mission and strategic plans of the institution. For example, if an institutional goal is to raise the SAT scores of incoming freshmen by 20 points over 2 years, the effectiveness of programs in the Undergraduate Admissions Office to accomplish this task can be assessed. What programs were initiated, what was the cost in terms of various investments, and what was the result in terms of SAT scores are typical questions to be assessed in this scenario. Once that data is available, decisions are made about the efficacy of those approaches and the return-on-investment. The latter are value judgments and form the evaluation part of the process. Academic assessment is a subset of institutional assessment in education. Clearly, a major goal of any institution of learning is to educate students and prepare them for future activities. Thus, academic assessment is necessary for a complete valuation of any institution of higher learning. This paper is only concerned, moreover, with academic assessment and not with other aspects of institutional metrics. This is not to say these other aspects are not vital to the health of a college or university – they are – but rather that this paper is more narrowly focused on academic concerns. The levels of assessment presented above are in order of size, not importance. The hierarchy does seem to imply a cascading assessment approach, where each level is subsumed within the
51
Proceedings of The 4th International Multi-Conference on Society, Cybernetics and Informatics (IMSCI 2010)

level above it. To a certain extent this is true and forms an important aspect of assessment planning. For example, Drexel University has an academic mission, the College of Engineering has a mission, the Department of Electrical and Computer Engineering has a mission as does the BS program in electrical engineering and finally the telecommunications/ Digital Signal Processing track. Each mission must incorporate the goals of the level above while providing additional academic criteria. Thus, a student in the telecommunications track is simultaneously an undergraduate electrical engineer in the Department of Electrical and Computer Engineering, a member of College of Engineering and a Drexel University student and therefore, all the individual academic missions apply to him or her. On the other hand, what is the final endpoint, the ultimate goal of any academic enterprise? A student educated to the level and in a manner consistent with all the applicable academic missions. Thus, assessment should focus on student performance and achievement. This is the true measure of the success of any educational enterprise. In the final analysis, it does not matter how many students graduate or how many are retained if those students are inadequately prepared to contribute productively to their communities upon graduation. The average SAT scores of incoming freshman may be a factor in a college or university ranking in the US News and World Report, but what really determines the actual lasting contribution that a college or university is making to the world. is the value added to each student’s capabilities. The importance of institutional assessment notwithstanding, such data can be grossly misleading if not balanced with clear academic assessment which is both student-centered and evidence-based.
Objectives (also called Program Objectives). Objectives are characteristics of individuals who graduate from a specific program, academic unit and institution as measured post-graduation. The measurements are taken usually 3 and 5 years after graduation, although there is no set protocol. An example of an objective (from the School of Biomedical Engineering, Science and Health Systems) is: The majority of graduates are engaged in some form of continuous learning and/or professional development. A majority in this instance was defined as 67% or more. Each program must generate its own objectives in line with that program’s expectations for their graduates.
Outcomes (also called Student Learning Outcomes -
SLOs). Outcomes are characteristics of students at the time of graduation4. These characteristics can include knowledge, skills, attitudes, etc. Some examples are given below (source in parentheses) 1. An ability to design and conduct experiments, as well as to
analyze and interpret data (Engineering Programs, ABET, Inc. http://www.abet.org/)
2. Understand accounting and business terminology used in business scenarios, and be proficient with commonly used office software programs (Butte College, Business Education Program http://www.butte.edu/departments/careertech/businessed/slos.html)
3. To think philosophically about our existence in the world and to demonstrate a philosophic approach to ethical issues (Seattle University http://www.seattleu.edu/assessment/SLO.asp)
Performance Criteria are the constituent elements of a student learning objective5. While SLOs are a useful set of requirements
by which to define success of an educational program, they are not always easy to measure. Two examples of such SLOs are: a. Ability to function on multidisciplinary teams (ABET d); b. Understanding of Professional and Ethical Responsibilities
(ABET f) Performance criteria need to be developed for such difficult to measure SLO’s to allow evaluation of achievement. Rubrics create categories of student achievement within a given performance criterion6-8. The number of levels varies between 3 and 5 depending on the resolution one wishes to achieve. In Figure 1, the relationships between an SLO, its associated performance criteria and rubrics are displayed. Rubrics are categories or levels of achievement within a given performance criterion. Performance criteria 1-4 are components of the SLO.
Figure 1 Relationships between Student Learning Outcome, Performance Criteria and Rubrics.
Standards or Benchmarks are terms used in countless different ways. In this case, a standard or benchmark is the overall level of achievement determining success for a given criterion. In Figure 1, a level of 70% of students achieving at the x.2 level or higher on all four performance criteria could be used to indicate that this specific student learning outcome has been attained by the program.
Mapping is the process by which performance criteria are associated with specific events within a program or curriculum. Performance criteria differ from course grades in two somewhat paradoxical ways. First, they are specific performance metrics whereas course grades are usually a combination of many different metrics. Performance criteria provide superior resolution which cannot be achieved using class grades. Second, they are general characteristics of students that should be applicable in multiple different situations and environments. Thus, while a course grade is measured within the context of a specific course, performance criteria can be measured across courses, in extra-curricular activities, during employment and service activity, as well as within particular courses. They can be tracked during a student’s progression through the academic program and will provide key intervention points in curricular re-design.
THE MAPPING PROCESS The question that concerns us is how to create accurate and user friendly curricular maps. Although many kinds of mappings are possible, two specific types of maps often provide the most useful information: 1) a coverage map and 2) a tracking map. A coverage map associates each performance criterion with a specific course or courses or other curricular event (s) (ex. Co-operative education). The assessment approach is described, along with the timing of data collection and most important, a plan for intervention. In the coverage map, all educational experiences related to the performance criterion are listed to the
52
Proceedings of The 4th International Multi-Conference on Society, Cybernetics and Informatics (IMSCI 2010)

extent possible but only one or two are selected for data collection. The second type of map is a tracking map. Tracking maps chart performance criteria over a curriculum or program in terms of when and how proficiency in each criterion is imparted to the student..Our goal is to create and implement maps that provide critical reflection of a student’s progress and will be fully utilized by teaching and advising faculty.
There is a temptation to try and convert tracking maps directly into coverage maps, especially after all the effort that goes in to creating tracking maps for a curriculum. However, it would be a
mistake to attempt such a direct conversion. Simply because a performance criterion has been mapped to a specific academic experience does not mean it must be assessed within that experience. After all, the purpose of the experience is to create a permanent enhancement of student performance – theoretically, this could be assessed at any time after student participation in that experience. Practically speaking, assessments should be so timed as to allow faculty to determine if the various academic experiences were successful or need to be revised. It is in this phase of mapping that quality management techniques and statistical design and analysis approaches for quality control are applied.Most of the rest of this paper concerns the creation and iterative re-design of a curriculum using those maps
INITIAL STAGES
Prior to beginning the mapping process, outcomes must be established, performance criteria created and rubrics developed by which the criteria can be measured. Untra Corporation’s web-based solution software, Academic Evaluation, Feedback and Intervention—AEFIS, was developed in collaboration with the School of Biomedical Engineering, Science and Health Systems to maintain the best practices for assessment management. Engineering programs have an advantage in this regard since ABET provides a list of general and program outcomes as a starting point. Thus, engineering faculty do not have to start completely from scratch in developing program outcomes. Moreover, there is a wealth of knowledge and experience in creating performance metrics and rubrics in the field of engineering from which faculty can draw examples that can be refined for use in specific programs. Our experience at the School of Biomedical Engineering, Science and Health Systems found that performance criteria and rubrics found through Web searching proved to be very useful starting points from which our final criteria and metrics were derived. After several months of deliberations, the Undergraduate Curriculum Committee proposed and the faculty accepted 14 program outcomes composed of approximately 70 performance criteria. Additional outcomes were created for our specific concentration areas: neuroengineering, biomedical informatics, biomechanics and human performance engineering, biomedical devices and imaging, and biomaterials and tissue engineering. AEFIS enabled our School to organize the mapping process by linking outcomes, performance criteria, and rubrics to programs and
courses.
INITIAL ASSIGNMENTS
Once performance criteria have been created and accepted, they must be initially assigned to specific parts of the curriculum. Our experience at the School of Biomedical Engineering Science and Health Systems at Drexel University suggests that this activity is best done by a small committee of faculty using course syllabi. Providing individual faculty with a list of 70 performance criteria and asking them to assign the appropriate criteria to their specific courses proved to be unworkable. It takes some time to become familiar with the criteria and faculty found it difficult to work through all the criteria to select those most appropriate to their courses. Moreover, many courses taught to engineering students are provided by academic units
outside of engineering whose faculty are not entirely familiar with this type of assessment process. The varied backgrounds and attitudes of the faculty involved created an uneven application of the criteria making it more difficult to ascertain the accuracy of the assignments. In our case, the Undergraduate Curriculum Committee, consisting of 5 faculty members working together with a common understanding of the criteria, was able to create a reasonable initial assignment by matching course objectives and descriptions with the appropriate criteria. These preliminary assignments were then forwarded to the faculty instructors to verify the accuracy of each assignment. Operating in this manner allows faculty instructors to edit the assignments rather than create them de novo and provided for a more effective use of the faculty’s time. Although it is possible to proceed from this initial assignment of criteria to a first curricular map, we suggest an additional refinement be undertaken before proceeding further. Learning is a developmental process and student performance on the criteria should improve as he or she progresses through the curriculum.
Figure 2 AEFIS Criteria Detail Manager
Figure 3 AEFIS Performance Criteria Mapping Tool
53
Proceedings of The 4th International Multi-Conference on Society, Cybernetics and Informatics (IMSCI 2010)

One should not expect the same level of accomplishment in solving engineering problems from freshmen and seniors! In order for a curricular map to be useful, it should reflect this developmental learning process. Therefore, it seems reasonable to assign developmental or application levels to the criteria. One such set of levels is: Introduce; Reinforce and Emphasize. Another possible set could be: Introduce; Practice; Review; Utilize. There are many different ways of creating these levels and no one absolute best method. The method you choose should be one that reflects the developmental approaches to learning involved in your program while simultaneously maximizing the understanding and buy-in from your faculty. The initial levels should be relatively simple to facilitate the mapping process. They can – and will – be refined later. An examination of the initial curricular mapping can be surprisingly revealing. Unfortunately, educational curricula often seem to have more in common with biological evolution than intelligent design. Courses and sequences are often created for reasons that were more applicable to past situations than present circumstances. Resource availability (especially in terms of faculty) often dictates what courses are taught and what
subjects are emphasized. The individualistic nature of the academic process, while advantageous to students in terms of providing various unique perspectives, can create a disadvantage in terms of a curriculum that lacks coherence and does not achieve overall program outcomes. Nothing reveals these problems faster than curricular maps. Engaging faculty in assessment processes by use of AEFIS facilitates “closing the loop” to best implement educational goals—to improve student learning.
APPLYING BLOOM’S TAXONOMY As a further refinement to the maps and to aid in revising the curriculum to a more developmentally appropriate dynamic, we
created a translational matrix between the levels we used in the maps and Bloom’s cognitive taxonomy9,10. This required that the basic three levels of Introduce; Reinforce and Emphasize be further subdivided to map to the appropriate levels in the taxonomy. For example, when a performance criterion is originally introduced, it was mapped to Bloom’s knowledge level. In our original maps, a criterion might be introduced in several different courses. After 2-3 ‘introductions’, the level for the criterion is moved up in the taxonomy to Bloom’s comprehension level and so on. We use this matrix to determine the appropriate levels of performance expected at each developmental stage in the curriculum and then applied this to the distribution of student performance on the rubrics for each criterion. It is possible, of course, to move directly from the distribution of Introductions, Reinforcements, and opportunities for Emphasis directly to revised distributions on the rubrics for each performance criterion but we do not recommend such an approach. The use of Bloom’s taxonomy helps to clarify the expectations at each developmental stage and makes it easier for faculty to understand what is expected in terms of student learning on each criterion mapped to their specific courses. Using the taxonomy also reinforces the idea that a student’s progress through the academic curriculum is a developmental process, with each step depending on those preceding it. Assessment should be geared to a gradual increase in student achievement in performance as indicated by greater numbers of students attaining higher rubric categories as they proceed from freshman to senior status and eventual graduation. Our initial matrix is displayed in Table 1. For those possibly unfamiliar with Bloom’s Taxonomy and its current revisions, Benjamin Bloom and a group of educational psychologists created a hierarchy in 1956 to emphasize the cognitive results of education9-11.
The idea was to reform educational processes to generate a greater emphasis on developing higher order thinking among students. The approach was hierarchical in the sense that each step up in the system required mastery of the processes below it. For example, understanding requires knowledge while application requires both understanding and knowledge and so on. Figure 4 is a graphical display of the six levels of the original cognitive taxonomy. There is a certain degree of arbitrariness to all of this insofar as this represents the design phase of a process – we have not yet established that the maps we have created are accurate. What is placed on syllabi and what is taught in a course do not necessarily match and no data has yet been collected in the process we have been describing to determine to what extent the syllabi are a true representation of the students’ learning experiences. This is, of course, the reason for assessing the
Mapping Level
Bloom’s Learning Domain and Associated Abilities
Basic Introduction (I)
Knowledge: Ability to recall information or data
Advanced Introduction (2I-3I)
Comprehension: Ability to determine and understand the meaning of instructions or problems and able to translate this information into one’s own terms/words.
Basic Reinforcement (R)
Application: Ability to use a concept in a new situation or circumstance and/or ability to apply learned material in novel situations
Intermediate Reinforcement (2R-3R)
Analysis: Ability to decompose material and/or concepts into constituent parts and determine their relationship and overall structure. Ability to distinguish between facts and inferences.
Advanced Reinforcement (> 3R)
Synthesis: Ability to construct a new structure or pattern from diverse elements
Emphasize (E) Evaluation: Ability to make value judgments concerning ideas, materials, products, processes, etc.
Table 1 Matrix Relating Level at Which Performance Criteria are Presented to Bloom’s Learning (Cognitive) Domains
Figure 4 Graphic Display of Bloom’s Taxonomy of Educational Objectives (redrawn from 12)
54
Proceedings of The 4th International Multi-Conference on Society, Cybernetics and Informatics (IMSCI 2010)

process and determining actual student performance. However, there is a subtle problem in analyzing performance data in order to determine the accuracy of these tracking maps. Student performance is assessed and evaluated in order to ascertain if the curriculum is successful in reaching student learning outcomes for the participants. To be effective, students should be assessed at several different stages in the program so that timely intervention can be conducted. Early detection is not just preferable in the case of medical problems but in all cases where an intervention is planned. However, when a problem is observed, what does that actually mean? There are at least two possibilities. Either the academic experience associated with creating the expected level of student performance has not achieved its objective or the mapping of these performance criteria into that experience is incorrect. If the mapping itself is incorrect, then adjusting the academic experience will not necessarily have the desired effect on student performance. One method to check on the accuracy of the mapping process is to use student evaluations. Many student course evaluations request that students measure their learning on course objectives. The School uses a version of such evaluations where students rate their state of knowledge on each objective on the syllabus before and after participating in the specific course. We have been able to use these data to monitor the success of various courses in reaching their objectives and this allows for revisions in the course syllabi. AEFIS allows us to develop complete and efficient surveys quickly. They can be deployed automatically through the web-based portal. Our School uses a rewards system to encourage students to get involved.
The advantage of using student evaluations is that they can become a regular part of any assessment system with minimum additional overhead in terms of labor or cost. Our experience has shown that the data is quite reliable when applied to course objectives and we have every reason to believe it can be applied to performance criteria with equal efficacy. One can expect changes in the matrix presented in Table 1 as well. The table represents a first pass at the association between mapping levels and expected cognitive achievement and is by no means intended to be the final word on the matter. This association may need revision as the outcomes of assessment indicate how students are really progressing through the curriculum. This again reflects the iterative nature of curriculum mapping, assessment, and re-design – the process should be viewed as continuous improvement.
FROM TRACKING TO ASSESSMENT
The tracking maps discussed allow faculty and administrators to determine when and where (and occasionally if) performance criteria are being taught, track the developmental stages of student learning and performance and revise the curriculum if needed to provide an enhanced learning experience. By providing maps of pathways by which student performance on specific criteria develops, the expectations for student performance can be more clearly defined, for both students and faculty. This should provide a more coherent and understandable experience for students and provide some reasonable response to student inquires such as ‘Why I am learning this?’; ‘When will I ever use this?’; and ‘What is this for?’. However, tracking maps do not, by themselves, generate useful assessments. Their function is to show how performance criteria are supposed to be learned and at what levels - such maps do not demonstrate that the actual learning is taking place. In addition, simply because a performance criterion is mapped to a particular course or other academic experience does not mean that assessment of that criterion must take place there. If every performance criterion were assessed at every location in the curriculum in which it was mapped, the amount of data generated would be unmanageable. Tracking maps do, however, provide insights as to where critical development occurs in sets of performance criteria and thus highlight potential assessment locations. For example, Biomedical Engineering Courses ENGR 101, ENGR 202 and Senior Design all have large numbers of performance criteria associated with them. This indicates that critical levels of student learning should be taking place within these course experiences. Thus, some form of assessment should be located close to the time when these courses have been completed. In the case of Senior Design, the School has arranged for external reviewers to evaluate student performance. In other cases, we are creating faculty review boards for writing assignments at different locations within the curriculum and are developing embedded problems to be added to assignments and examinations for assessment purposes. We are also creating a second year examination and revising our co-operative education employer survey to reflect those performance criteria associated with co-op experiences. AEFIS also has the ability to issue external surveys to industry and alumni to aggregate professional input. An additional idea under consideration is an ePortfolio tracking system from freshman through sophomore to junior and senior design classes to track the development of critical engineering perspectives and this particular skill set.
CONCLUSION
Assessment is often considered as a ‘necessary evil’ by faculty and administrators forced to engage in the process as a requirement of accreditation. However, properly applied, the design of assessment and evaluation systems can provide considerable insight into curriculum design. The mapping of performance criteria into a curriculum presents faculty the opportunity to create a developmentally sound and rational educational process in order to obtain the desired student learning outcomes. The iterative process of mapping, design, re-mapping, and re-design, although tedious, is surprisingly revealing. If faculty work with the process, benefits include significant improvement in the coherence of the curriculum with a concomitant enhancement of student learning.
Figure 5 AEFIS Continuous Quality Improvement (CQI) Report
55
Proceedings of The 4th International Multi-Conference on Society, Cybernetics and Informatics (IMSCI 2010)
REFERENCES
[1] Meirovich, G. & Romar, E.J. (2006). The difficulty in implementing TQM in higher education instruction. Quality Assurance in Education, 14: 324-337.
[2] Ishiyama, J. (2005). The structure of an undergraduate
major and student learning: A cross-institutional study of political science programs at thirty-two colleges
and universities. The Social Science Journal, 42: 359-366.
[3] Van der Hulst, M. and Jansen, E. (2002). Effects of
curriculum organization on study progress in engineering studies. Higher Education, 43: 489-506.
[4] Besterfield-Sacre, M., Shuman, L.J., Wolfe, H., Atman, C.J., McGourty, J. Miller, R.L., Olds, B.M., & Rogers, G.M. (2000). Defining the Outcomes: A framework for EC-2000. IEEE Transactions on Education, 43: 100-110.
[5] Duerden, S. & Garland, J. (1998). Goals, objectives,
and performance criteria: A useful assessment tool for students and teachers. Frontiers in Education Conference, 1998, FIE’98, 28th Annual, 2, 773-777.
[6] Mertler, C.A. (2001). Designing scoring rubrics for
your classroom. Practical Assessment, Research & Evaluation, 7(25) . Retrieved September 27, 2006 from http://PAREonline.net. Getvn.asp?v=7&n=25.
[7] Moskal, B.M. (2000). Scoring rubrics: What, when
and how? Practical Assessment, Research & Evaluation, 7(3) . Retrieved September 27, 2006 from http://PAREonline.net. Getvn.asp?v=7&n=3.
[8] Moskal, B.M. & Leydens, J.A. (2000). Scoring rubric
development, validity and reliability. Practical Assessment, Research & Evaluation, 7(10) . Retrieved September 27, 2006 from http://PAREonline.net. Getvn.asp?v=7&n=10.
[9] Bloom, B.S. (Ed.), Engelhart, M.D., Furst, E.J., Hill,
W.H. and Krathwohl, D.R. (1956). Taxonomy of educational objectives: The classification of educational goals. Handbook 1: Cognitive domain. David McKay: New York.
[10] Anderson, L.W. (Ed.), Krathwohl, D.R. (Ed.),
Airasian, P.W., Cruikshank, K.A., Mayer, R.E., Pintrich, P.R., Raths, J. and Wittrock, M.C. (2001). A taxonomy for learning, teaching and assessing: A revision of Bloom’s Taxonomy of Educational Objectives. Longman: New York.
[11] Krathwohl, D.R. (2002). A revision of Bloom’s
taxonomy: An overview. Theory into Practice, 41: 212-218.
[12] Forehand, M. (2005). Bloom’s taxonomy: Original
and revised. In M. Orey (Ed.), Emerging perspectives on learning, teaching, and technology. Retrieved February 5, 2009, from http://projects.coe.uga.edu/epltt/index.php?title=Bloom%27s_Taxonomy
56
Proceedings of The 4th International Multi-Conference on Society, Cybernetics and Informatics (IMSCI 2010)

Holistic Embedding of Interaction Generating Learning Objects
Hiram Bollaert, Department of Business Studies, Teacher Training and Social Work,
Artesis University College
Antwerp, Belgium
ABSTRACT
Active participation in education and combining this with
his/her other five lives, that’s the quest of today’s student.
Optimizing education and motivating students with limited
resources, that’s the teachers’ quest. This position paper
describes the creation and the use of learning objects by and for
students and teachers, stimulating all members of the school
community to collaborate in the process. The application of the
described concept generates a dynamic flow of interaction
generating learning objects, through which education keeps
track of the ever faster changing world. Student are being
prepared for lifelong learning, teachers are motivated to engage
in this process of change and ICT is used to facilitate, enhance
and support learning and education.
Keywords: e-learning, interaction , learning objects
1. INTRODUCTION
To keep up with an ever faster changing world, to engage and
activate students, to assist and sustain teachers, to effectively
facilitate education using limited resources, the learning
community needs to be creative in approaching the
implementation of the powerful uses [7] of information and
communication technology (ICT).
Updating learning content and transforming it into
pedagogically well-designed interactive learning objects is a
time- consuming and an ongoing multidisciplinary task [1] in an
environment in which time and resources are very limited.
Including students [8] in this process of creating learning
objects for other students and embedding this process in the
pedagogical system, induces a whole range of opportunities and
consequences worth investigating.
The abundant internet provides all information and tools needed
to enable active learning. Active means to search and retrieve
relevant information, to practise and assess, to communicate and
collaborate, to actively engage with the learning material. ICT
enables all these actions, in synchronous and asynchronous
ways.
Consider the concept of interaction generating learning objects
(I’GLOs), learning content wrapped in interactivity, including
assessment and embedded in a virtual learning environment
(VLE). The holistic approach of implanting the creation and
application of these objects in the learning community and its
pedagogical culture, generates a dynamic flow of new I’GLOs
and interaction. The creator of the I’GLO interacts with the
learning content during the process of creation. The creator will
interact with the feedback on the quality of the I’GLO, given by
its users. The user needs to interact with the I’GLO to activate
the object (press a button, give an answer, … in order to
proceed). The user also needs to interact with the environment
in which the I’GLO is published to evaluate the object, to assess
and reflect on his/her learning (did the I’GLO transfer any
knowledge?). And to complete the cycle, the user will express
his/her comprehension by becoming the creator of new I’GLOs.
Embedded in the pedagogical structure, creating and applying
I’GLOs causes formal and informal learning.
In this paper we define the I’GLO, present the different roles of
the creators and users, and outline the implementation of the
concept by grass-root projects to enable action research.
2. DEFINITION OF AN I’GLO
The interaction generating learning object (I’GLO) is a digital
(readable and editable by computers) object or a set of objects.
The basis of an I’GLO is the dynamic presentation of learning
content combined with an assessment embedded in a VLE.
These are some examples:
- A series of short (not longer than 5 minutes) movies combined
with contextual questions controlled by buttons enabling the
viewer to proceed or to switch between picture and questions.
- A branched lesson in a VLE where the student follows an
adaptive path. The path changes in function of the responses of
the student.
- A sharable content object reference model (SCORM) package,
where all kinds of interactive features (like drag and drop) are
available, that can be embedded in a VLE.
The apostrophe in the acronym leads the reader to pronounce
the acronym as ‘I glow’ referring to the emotion one
experiences when succeeding in explaining or understanding
something clearly, emanating comprehension (aha-erlebnis,
eureka effect), rather than referring to a snow house.
An I’GLO is essentially dynamic, comprised of learning content
and assessment, and embedded in the VLE and the pedagogical
system.
Dynamical
The dynamical properties of the I’GLO; the presence of buttons
to click, drag and drop functionality, invites its user to interact.
The digital nature of the I’GLO should imply a more vivid
publishing of learning content (where material on paper remains
static).
Assessment
The included assessment encourages the user to interact
consciously. The assessment generates scores, grades, ratings
(not only questions on the content are asked, but also the
opinion of the user on the quality of the content and the way it is
published). The assessment could also affect the VLE, resulting
in the adaptation of the way other learning content is presented
or in the generation of specific feedback.
Embedded
The embedding of the I’GLO in a (VLE) or in a virtual
community implies that these interactions are logged. It also
facilitates communication and discussion on the I’GLO and its
57
Proceedings of The 4th International Multi-Conference on Society, Cybernetics and Informatics (IMSCI 2010)

content or usability. Feedback, ratings and scores can be
published generating an atmosphere of competition.
Smart metering, quality control and communities of practices
emerge from the holistic embedding.
Smart metering: Smart metering is a concept used in the
energy consumption industry to aggregate and accumulate data.
This continuous stream of data, depicting the use of energy
(hourly, daily, by region, …)[9], enables improvement of
services and the raise of profit for all parties. The same idea
could be transposed onto learning. Continuous measuring of the
learning process generates data which outline a picture of how
and when learning takes place. This learning graph provides
student and teacher with crucial information on the evolution of
the learning and the quality of the teaching.
Quality control: The automated process of logging
activities in the VLE provides the data for describing the use of
the I’GLOs. This data enables a quality control that filters
I’GLOs into different categories (bad, good, excellent, easy,
difficult, adapted to specific learning styles, useful for students
with dysfunctions, …).
Communities of practice: The embedding in a VLE
implies the wider use of the I’GLO, across different
departments. This facilitates the start and growth of
communities of practice amongst the users and the creators of
the I’GLOs.
Holistic: The concept of the I’GLO becomes valuable when
it is embedded in the pedagogical system. Apart from the
embedding of the object or set of objects in a VLE, the concept
must also find its way to the community and its pedagogical
culture. The aim of this concept is to boost the dynamics of the
learning community and this can only be achieved by involving
all its members into creating, evaluating, rating, … I’GLOs.
3. ROLES
The I’GLO must be a tool with several purposes and one goal.
The goal is to bring people together in an ongoing learning
process stimulating them to communicate and to collaborate.
The digital character of the I’GLO enables this in a synchronous
and asynchronous way. The purpose of the I’GLO depends on
the role of the person working with the I’GLO.
Two distinguished roles are that of the creator and that of the
user.
Creators
By writing a paper a student evaluates and synthesizes his/her
understanding of some subjects. The result is static text with
still pictures or graphs which will only be reviewed by a small
group of people.
By inviting the student to produce an I’GLO, the student is
encouraged to be creative, to draw from his/her own
experiences in life, to combine several skills and to produce
something for a far more wider and more critical public.
Understanding the purpose of the I’GLO, knowing that it will
be published and used as a learning object, the creator will be
persuaded to reconstruct and manipulate material into a
meaningful product. In the authoring process the student needs
to ask the right questions to evaluate his/her content expertise,
and the student is stimulated to pick up some pedagogical and
ICT skills. The process of creating an I’GLO will confront the
student with the world of knowledge management [5][10]. And
the creator can add the outcome to his/her personal learning
environment.
I’GLOs can vary in ‘size’ and usability. Starting from a theme,
a group of students can be assembled in order to produce a suite
of I’GLOs to span a complete course (instead of a chapter or
one subject).
As an example: An incoming student needs to receive and
assimilate a lot of information about school regulations, the
library, social services, … In order to enhance retention and
eliminate the redundant and resource-full task of delivering this
information (as students keep entering the system from August
until November), a team of students is asked to produce a suite
of I’GLOs that covers all this information.
Preferably, teams consist of members who master different
disciplines. A broad range of disciplines enlarges the pool of
resources from which the group can extract techniques, ideas,
knowledge, to build a well considered I’GLO or even reusable
learning objects [6] . Working together in a multi-disciplinary
environment implies contact with other disciplines and their
specific ‘languages’ (mentality, way of thinking, technical
terms, …). Synergy occurs when different disciplines work
together congruently. The participants have a mutual goal,
deliver a fantastic looking I’GLO that works efficiently.
Working with teams improves the collaboration skills of the
team members.
These are all characteristics shared by high quality learning
programs [7].
Users
Although creating it is an important link in the chain of actions
concerning the I’GLO, the use of it actuates more dynamics.
Teachers need to evaluate the expertise of the creator and the
quality of the I’GLO. Students need to set the I’GLO in motion
so they can learn something and comment on the way the
learning material is presented to them.
Teachers, pre-admitted students and admitted students
impersonate the user.
The teacher: The teacher facilitates and monitors the
production of I’GLOs and evaluates the content and the way it
is presented.
The teacher not only uses the I’GLO as an assessment. The
teacher can also use this material to support his/her teaching.
Even bad I’GLOs can be used. Bad examples sometimes are
clearer than good examples, as learning consists of
understanding the difference (between right and wrong, between
approaches, …).
This newly produced teaching material uses the language and
the paradigm of the authoring student. Therefore, the language,
the examples, the references, the associations used in the I’GLO
are more easily assimilated by the younger student. And, as the
teacher is confronted with this paradigm, he too will learn more
about the culture of the students. Working with I’GLOs will
stimulate the collaboration between all grades and teachers,
generating more intriguing questions and therefore motivating
the teacher as an expert and as a facilitator.
As the creation of learning material is very time consuming and
an ongoing process, the teacher should benefit from the fact that
part of this job is done by students. The creation of an I’GLO
should not be expensive as its half-life (the amount of time that
needs to elapse before half of the knowledge in a particular area
is superseded or shown to be untrue) is relatively short. The
value of the content is degrading rapidly [4] and the technology
(html, java script, flash, flex…[6]) wrapping the content is
58
Proceedings of The 4th International Multi-Conference on Society, Cybernetics and Informatics (IMSCI 2010)

evolving apace. Also the digital environment embedding the
I’GLO is swiftly changing, making it difficult to reuse the
object in a compatible system.
Pre-admitted students : Pre-admitted students are
encouraged to start their new studies by creating a temporary
account on the VLE so they can participate in the virtual
community. This gives the potential student the ability to
review and assess his/her basic skills using the available
I’GLOs, and in this way prepare him/herself for the new
training. This preparation gives the potential student a better
insight in whether the training and the school’s vision fits
his/her personality or his/her goal in life. And by accessing the
I’GLOs about school, its surroundings, its facilities and its
services, the potential student also prepares him/herself for daily
life in and around the school. By presenting every new student,
who has successfully completed the I’GLOs disclosing the
school, a small gift like a school T-shirt or school mug, the
school awards the student. This merchandising is another step in
binding the student to the school. All this preparation and this
association with the school and with the training enhances the
students motivation, adjusts his/her attitude and improves
his/her chances of success.
Admitted students: Admitted students can use the I’GLOs
as learning objects. As the I’GLO always includes an
assessment, the I’GLO can be used to learn and understand
through exercises, rehearse or remediate material. Because the
student does these actions in a VLE, the actions are logged,
making it possible for the student to reflect on his/her actions.
The student should also have the possibility to assess the I’GLO
on its quality (correctness, dynamics, …). The student should
also have the possibility to comment or discuss on the content
of the I’GLO, in a forum and in class.
By reviewing a lot of I’GLOs the student develops a skill that
will help him/her evaluating other I’GLOs. And the student gets
the appetite to make it better, to create I’GLOs himself. Later in
training, making I’GLOs becomes obligatory.
Not only the school’s VLE is a source of interesting material.
The abundant internet needs to be explored for other content
specific material and for authoring tools. Students can
aggregate, validate, qualify all the digital information they find.
And the web also presents an abundance of tools ‘for dummies’
and experts to generate new digital content. Students can
evaluate these tools, learn to work with them. Some tools seem
to work very intuitively, others require more training, …
According to Bloom’s taxonomy, knowledge and skill retention
should be high when students are evaluating, comparing,
creating.
4. IMPLEMENTATION
Different grass-root projects are being defined to enable action
research on this concept of the holistic embedding of interaction
generating learning objects. The basic idea remains the same,
the scale and the community vary.
The scales range from big over medium to small.
Big scale
Projects of this scale invite partner schools spread over Europe
to participate in the development and dissemination of the
outcome.
GGULIVRR: Generic Game for Ubiquitous Learning in
Virtual and Real realities, inviting people to explore the real
world. This project proposal consists of building a suite of four
parts. A game editor, a game player, one (or more) basic
game(s) and a game cloud. The game cloud represents a virtual
community which brings together players and authors, enabling
them to share and evaluate games. The game editor enables the
creation of new games and the game player is software that
enables the game to be played. The game uses the blend of the
real world with virtual information leading the user via different
interactions towards a specific goal. This blending is enabled by
the use of radio frequency identification (RFID) labels and
readers in mobile devices. Using this enhancement of the real
world with virtual information and interaction in connection
with a virtual community in a game setting, implies contextual
and ubiquitous learning.
The creation and implementation of the GGULIVRR game in a
certain neighbourhood depend on the inter-disciplinary
collaboration of younger and older students, elderly people, city
services, …Publishing the game in the GGULIVRR cloud
invites everybody to interactively explore this neighbourhood,
getting to know its history, its daily life and its inhabitants.
Medium scale
This scale covers projects that cross the borders of departments.
AdAW and EA&SI are two projects in this scale.
AdAW: Anticipating the Abundant Web, is a project
supported by the platform of the European Project Semester [3],
in which students of different disciplines and different
nationalities are invited to work together on a theme. Using the
theme as base they will aggregate and validate digital content.
As a result a quality matrix is produced, enabling students and
teacher to query the structured data and to find digital content
on the subject according to their wishes on the ‘interactability’
of the content, the language of the content, the target learning
style, …
Students will be motivated to search the web for authoring tools
and to construct new digital content according to the I’GLO
concept.
The congruent collaboration of different disciplines should
imply synergy and a high quality of the outcome where the use
of different media, the use of colours and styles, the interaction,
are well considered.
EA&SI: Educational Animation & Synergy
Interdepartmental / Interdisciplinary, is a three-year project in
which the department of Health Care, the department of Teacher
Training, the department of Applied Informatics, the department
of Digital Media and the library are collaborating in order to
produce series of I’GLOs. The aim of EA&SI is to outline the
constraints and conditions necessary to enable
Interdisciplinary/Interdepartmental collaboration that facilitates
students in different trainings with different skills to work
together synchronously (at the same time, possibly in the same
place) and asynchronously (at different times), maybe via
project work; motivates students to deliver fantastic material (by
grading the students, by explaining that the outcome will be
published and used by other students); provides students with
all the necessary tools and training to create interaction
generating learning objects (I’GLOs). Collaboration,
interdisciplinary as well interdepartmental, is not obvious. Point
of view and terminology are important obstacles when diverse
disciplines come together. Working across departments
typically produces logistical and organizational problems. In
59
Proceedings of The 4th International Multi-Conference on Society, Cybernetics and Informatics (IMSCI 2010)

addition EA&SI examines the results of implementing this
collaboration and the production and use of I’GLOs. Are the
competencies, that students need to acquire and practice,
sufficiently activated through working together in creating and
using I’GLOs; Are students capable to deliver actual usable
learning objects; In which way do students benefit from the
creation and the use of these I’GLOs.
For this project the following themes are presented:
- Virtual workshops on specific health problems experienced by
professional dancers. Dancers and physiotherapists should be
able to access this material during and after their studies.
- Introduction pack for incoming students in the midwifery
training program. The Department of Health Care wants to
optimize the preparation of these students for their exercises
with anatomical models.
- Information pack for incoming students about the working of
the library. Students must be able to learn independently and in
their own time about the library services.
Small scale
The offspring of two small projects on e-learning and m-
learning exists of technical expertise on VLE, SCORMS and
authoring tools like MSCAPE [2]. This expertise is being used
to introduce individual students or small groups of students in
their second or third year of training with ICT as a tool in
education.
Two projects fit this scale: McFrançois and MoUse
McFrançois: To assess his/her content expertise, a student
in the second year of teacher training is invited to build
SCORM packages using the software tool Exe-learning. This
software has a very low threshold and enables anybody to
quickly produce interactive learning objects. The student needed
to produce ‘digestible’ chunks of information on conjugations
in French combined with self-testing exercises. The packages
are then presented to first year students to practice. As the
SCORM packages are embedded in the VLE, the scores of the
students are automatically transferred in the grade book of the
VLE.
MoUse: MObile USEage is a running project on the use of
mobile devices to enable contextual learning. During this
research, MSCAPE was used to demonstrate the concept of m-
learning. MSCAPE is a platform that enables everybody to
generate a mobile game. Using GPS localization the game
enhances the reality with rich media and interactivity. A small
group of students with little ICT skills in their second year of
teacher training, are going to construct a mobile game localized
around the Museum of Fine Arts in Antwerp, Belgium. They
will use the neighbourhood, surrounding the museum, as a
context. Playing this game, the user will explore this
neighbourhood and learn about ecological applications that can
improve the livability of this neighbourhood.
A detailed look at implementation
The lifecycle of an I’GLO breaks down into three parts:
specification, building and evaluation\application. In the first
part, specification, the demand for learning objects is examined
resulting in a list of specifications defining the desired I’GLOs.
The list describes the properties of each I’GLO; what content
should it contain, what functionalities are necessary, what
didactics are to be used, what is the target group and so on.
In the building stage, a student or a group of students creates the
I’GLOs and during the last part, evaluation\application, teachers
and students will evaluate and apply the resulting learning
objects.
Since we need a continuous flow of new I’GLOs, the
constituent parts appear as three cycles. The initiation of such
dynamic flow of I’GLOs is described in detail for the EA&SI
project.
EA&SI First Year: During the first year, co-workers
(lecturers from the participating departments) learn all about
creating and using I’GLOs resulting in an initial set of I’GLOs
explaining “How to build an I’GLO”. In the second year of the
project, students will use this set as instructive material.
Also, the specification cycle will start and a series of I’GLOs
that need to be built are defined.
EA&SI Second Year: In this year the building cycle starts.
Students will be assigned to projects in order to create I’GLOs,
using the “How to…”-set. The specification cycle will build on
experiences from the first year and define new I’GLOs. At the
end of this year the evaluation cycle can start as the first
generation of I’GLOs will be delivered.
EA&SI Third Year: At the start of the last project year
incoming students will apply the available I’GLOs for learning.
A third generation of I’GLOs is being defined, the second
generation of I’GLOs is being created.
5. CONCLUSION
The holistic embedding of I’GLOs, facilitating, empowering
and requesting students to create these objects, implanting the
use of these objects in the pedagogical system, inducing
interesting opportunities and consequences, is a good idea worth
investigating. And this idea is nourished by several projects and
project proposals presenting ideas on how to implement the
concept [7].
Although difficulties already arisen, as bringing together
colleagues from different departments is not evident and the gap
between teachers and ICT, with all its new applications, is
widening, the described grass-root projects will enable action
research revealing the pitfalls of the concept and expose
whether we can facilitate, empower and request students to
create usable (suitable, applicable) I’GLOs.
In case these projects prove that students do create usable
I’GLOs, the next question arises: will students learn more
efficiently and more effectively when creating and using these
I’GLOs?
6. REFERENCES
[1] Boyle Tom. Design Principles for Authoring Dynamic,
Reusable Learning Objects, 2003 Australian Journal of
Educational Technology (19(1):46-58, 2003)
[2] Clayton Ben, Hull Richard, Melamed Tom, Hawkes
Rycharde, An Extensible Toolkit for Context-aware
Mobile Applications, 2009 International Symposium on
Wearable Computers
[3] EPS http://europeanprojectsemester.org
[4] Knight Peter, The Half-Life of Knowledge and Structural
Reform of the Education Sector for the Global
60
Proceedings of The 4th International Multi-Conference on Society, Cybernetics and Informatics (IMSCI 2010)
Knowledge-Based Economy, revised and expanded draft
20/07/97, Knight - Moore http://www.knight-moore.com/
[5] Li Yan, Jiumin Yang, Weijun Wang, Using Web 2.0 for
Knowledge Management in Higher Education, 2008
International Symposium on Knowledge Acquisition and
Modeling
[6] Peng Han, Krämer Bernd J., Generating Interactive
Learning Objects from Configurable Samples, 2009
International Conference on Mobile, Hybrid, and On-line
Learning
[7] Scott Geoff., Effective Change Management in Higher
Education, EDUCAUSE review 2003
[8] Sepulveda J., Servidio R., Petrone M., Ali G., Project
Based Approach to Content Creation, 2009 International
Conference on Education Technology and Computer
[9] Siderius Hans Paul, Dijkstra Aldo, Smart Metering for
Households: Cost and Benefits for the Netherlands,
SenterNovem
[10] Wu Kebao, Dai Junxun, Knowledge Management
Technologies in Education, 2008 International Symposium
on Knowledge Acquisition and Modeling
7. GLOSSARY
AdAW Anticipating the Abundant Web
One of the EPS programmes offered by Artesis
Artesis Artesis Unviersity College of Antwerp
www.artesis.be
EA&SI Educational Animation & Synergy
Interdepartmental / Interdisciplinary
Project-based research across several departments of
Artesis, implementing the I’GLO concept.
EPS European Project Semester
This is a one-semester project-based training programme
for students on bachelor’s degree programmes. It is
designed to equip engineering and business students with
all the necessary skills to face the challenges of today’s
world economy. International student teams work on
interdisciplinary projects. EPS is worth 30 ECTS and it
can be academically recognised in different ways, for
example as a final project or as an international practical
placement. The language of communication is English.
GGULIVRR Generic Game for Ubiquitous Learning In Virtual
and Real Realities
Project proposal to build a software suite for generating
context aware mobile games
GPS Global Positioning System
A space-based global navigation satellite system that
provides reliable location and time information in all
weather and at all times and anywhere on or near the Earth
where there is an unobstructed line of sight to four or more
GPS satellites.
ICT Information and Communication Technology
or IT (Information technology) is "the study, design,
development, implementation, support or management of
computer-based information systems, particularly software
applications and computer hardware", dealing with the use
of electronic computers and computer software to convert,
store, protect, process, transmit, and securely retrieve
information.
I'GLO Interaction Generating Learning Object
This is a dynamical learning object (or set of learning
objects ), comprised of learning content and assessment,
and embedded in the VLE and the pedagogical system.
Learning Object
This is a resource, digital in this context, that can be used
and re-used to support learning, providing small, self-
contained, re-usable units of learning.
MSCAPE MediaSCAPE
Mscape (mobile media gaming platform under
development by Hewlett Packard) is used to create
mediascapes, interactive experiences made up of video,
audio, images, and text. Mscape stores the digital media
files in a structure that associates them with positions from
a GPS system. Players play mediascapes on a Windows
Mobile device that's GPS enabled. As players move
around, the device senses their position and activates the
appropriate media files.
RFID Radio Frequency Identification
This is the use of an object (typically referred to as an
RFID tag) applied to or incorporated into a product,
animal, or person for the purpose of identification and
tracking using radio waves. Radio-frequency identification
comprises interrogators (also known as readers), and tags
(also known as labels).
SCORM Sharable Content Object Reference Model
This is a collection of standards and specifications for
web-based e-learning. It defines communications between
client side content and a host system called the run-time
environment, which is commonly supported by a learning
management system.
VLE Virtual Learning Environment
This is a software system designed to support teaching and
learning in an educational setting, as distinct from a
Managed Learning Environment, (MLE) where the focus
is on management. A VLE will normally work over the
Internet and provide a collection of tools such as those for
assessment (particularly of types that can be marked
automatically, such as multiple choice), communication,
uploading of content, return of students' work, peer
assessment, administration of student groups, collecting
and organizing student grades, questionnaires, tracking
tools, etc. New features in these systems include wikis,
blogs, RSS and 3D virtual learning spaces.
61
Proceedings of The 4th International Multi-Conference on Society, Cybernetics and Informatics (IMSCI 2010)

The skills and transitions from school to work: sampling strategy for a longitudinal survey in Italy
P. D. Falorsi
Italian National Institute of Statistics (ISTAT), Via C. Balbo 16,
Rome, 00184, Italy
M. Centra
Institute for the development of vocational training of workers (ISFOL), Via Lancisi 29,
Rome, 00161, Italy
V. Gualtieri
Institute for the development of vocational training of workers (ISFOL), Via Lancisi 29,
Rome, 00161, Italy
G. Linfante
Institute for the development of vocational training of workers (ISFOL), Via Lancisi 29,
Rome, 00161, Italy
ABSTRACT
This paper describes the sample strategy developed for the
"longitudinal school-work transitions survey", which was
designed to follow cohorts of youth over time.
The main objective of the paper is to describe the main aspects
of the sampling strategy being used for the first wave of the TSL
survey. This contribution provides a concrete demonstration of
a research strategy that involves a rigorous approach to the
resolution of a series of issues, including: i) the linkage between
two surveys having different sampling designs and purposes; ii)
the potential for using these sampling schemes to generate
accurate estimates; iii) the feasibility in terms of costs and
organizational/logistical constraints.
Keyword: OECD-PISA survey, balanced sampling, population
cohorts, municipalities, schools and training centres.
1. INTRODUCTION
The "longitudinal school-work transition survey " (TSL, from
the Italian Transizione Scuola Lavoro), is aiming to provide a
response to most of the typical statistical questions regarding
the condition of the youth population. The main themes covered
by the survey concern educational paths, performance at school,
skills developed during the years of study, return on education,
transition to the labour market, skill-based training during the
initial years at work, and career paths. These topics are
addressed by the project through a panel survey that will
generate data and information useful for sector operators,
school-related policy-making and vocational training programs.
While other Countries may have accumulated extensive
experience with surveys of this type1, this kind of project is
especially crucial for Italy, where there is a lack of longitudinal
data regarding the young population.
The longitudinal structure of the survey will allow accurate
estimates of scholastic records, educational paths, occupational
outcomes, entryways to the labour market, and career
progressions over time. A particularly lasting panel will also
make it possible to account for every aspect that directly or
indirectly determines educational and training paths,
1 Such as the National Longitudinal Surveys of Youth
conducted in the United States by the Bureau of Labor Statistics; the
National longitudinal survey of children and youth, which is conducted
in Canada; the National Education Longitudinal Study, conducted by
the Department of Education in the United States.
occupational outcomes and career profiles. Finally, this will
lead to estimates the return on households’ educational and
human capital investments. The general form of the survey is
conducted on annual basis. The complete panel will cover a
population aged 16-25 and enables the study of cross-sectional
(for single time periods) and longitudinal (for multiple time
periods) phenomena that are closely associated to status changes
(or transitions).
An important dimension of this study concerns its connection to
the OECD-PISA survey2 (Programme for International Student
Assessment) conducted for Italy by Invalsi (National Institute
for the Evaluation of the Educational System), which employed
cognitive testing to study the skills acquired by 15 year old
students in reading, mathematics and the sciences. The TSL-
OECD-PISA survey linkage involves the transposition of a sub-
sample from the OECD-PISA survey into the TSL sample. This
makes it possible to relate the individual educational and work
outcomes measured in the TSL survey to the individual
competences measured in the cognitive tests of the PISA
survey.
This paper describes the sampling strategy being used for the
first wave of the TSL survey, which is particularly complex
given the operational and budget constraints.
The paper is organized into seven sections. Section 2 illustrates
the overall structure of the survey as well as the reference
population, and defines the parameters of interest. Section 3
summarizes the sampling design. Sections 4, 5 and 6 examine
specific aspects of the design in greater detail. Section 7
describes the algorithms used to determine the sample size and
the probabilities of inclusion during the different stages and
phases of selection.
2. THE DESIGN, DEVELOPMENT AND
IMPLEMENTATION OF THE RESERCH
The phenomena of interest are observed on an annual basis and,
once the panel will be complete, individuals will be first
interviewed at age 16 and then in the following waves until they
reach age 25. During each wave of the survey, a retrospective
study is conducted to detect status changes (and related
surrounding conditions) from the previous wave. The
questionnaire is divided into distinct sections, each designed to
2 http://www.pisa.oecd.org
62
Proceedings of The 4th International Multi-Conference on Society, Cybernetics and Informatics (IMSCI 2010)

focus on the characteristics of specific transitions. The first
interview for each single individual in the sample is carried out
with the CAPI technique (Computer Assisted Personal
Interview), and all the subsequent interviews use the CATI
technique (Computer Assisted Telephone Interviews).
The first wave of the survey, which will take place in October
2010, will investigate cohorts of individuals born in the calendar
years of 1993, 1990 and 1987. These individuals will be
surveyed during subsequent waves of the survey until they
reach 25 years of age. The second wave (year 2011) will add in
individuals born in the years 1994, 1991 and 1988, and so on.
The survey will be phased in progressively until the year 2013,
when all 10 cohorts of interest, with individuals between the
ages of 16 and 25, will be under observation.
The TSL survey for 2010 begins by interviewing a sub-sample
of individuals born in 1993 who participated in the OECD-PISA
survey. This will enrich the survey on school-work transitions,
which is conducted on a three-year basis, with information
concerning the cognitive capacity of each interviewee as
measured by the OECD-PISA questionnaires. From the
longitudinal standpoint, this makes it possible to assess the
predictive capacity of these human capital indicators and relate
them to educational and occupational outcomes on an individual
basis. Individuals born in 1990 and 1987 who were not involved
in the OECD-PISA sample will instead be selected from
municipal registers for student enrolment.
Survey interviews are conducted in different locations and
include different types of content, depending on the age of the
individuals involved. In the first wave of the survey, those born
in 1993 will be interviewed in schools/training centres, whereas
the remaining cohorts will be interviewed at home.
2.1. Logical definition of the populations and domains
The term survey population is used to denote the group of
individuals to which the sampling estimates refer (…individuals
on which sampling estimates are calculated). The first wave of
the survey has three distinct survey populations (or cohorts),
referred to hereinafter (also referred to in the paper as) as age-
class populations, which consist of survey eligible individuals
born in the 1993, 1990 and 1987 calendar years In the paper,
such age-class populations are referred to as 16, 19 and 22 year
olds, respectively.
An eligible individual is defined as follows:
- an individual of age 19 or 22 is eligible if he/she belongs to
the population of current residents;
- an individual of age 16 is eligible if he/she belongs to the
population of current residents and was included in an
educational (enrolled in a relevant school type) or training
(enrolled in a training course) system in the year 2009.
In addition to the three populations mentioned above, the
following represent additional objects of interest: (i) the
combined population consisting of all three age-class
populations; (ii) various subgroups of the age-class populations
or the combined population, referred to hereinafter as domains.
From a definitional perspective, in other words, the age-class
populations also represent domains of the combined population.
Domains are defined on the basis of 5 variables (i) geographic
region (20 modalities); (ii) municipality type (3 modalities:
municipalities that are metropolitan or belong to a metropolitan
area, non-metropolitan municipalities with more than 10,000
inhabitants, municipalities with fewer than 10,000 inhabitants);
(iii) gender; (iv) legal status of the school (2 modalities: state
owned, non state owned); (v) type of school (5 modalities: high
school, technical school, professional school, training centre and
lower secondary school). Each of the 5 variables listed above
represents a specific domain type. For each of the populations in
question, each domain type defines a partition of the population
by subdividing it into a number of domains (or sub-groups)
equal to the number of modalities for the variable that defines
the domain type. Lastly, it should be noted that domain types (i)
and (ii) describe domains of the combined population, domain
types (iv) and (v) describe domains of the 16 year old
population, and domain type (iii) describes the combined
population of 19 and 22 year olds.
2.2. Symbols and target parameters
Let r denote a specific age (being r=1 for the subpopulation of
16 year olds, r=2 for the subpopulation of 19 year olds and
r=3 for the subpopulation of 22 year olds; let rQ , indicate the
r-th age-class population, of size rM ; let U3
1==
r rQQ , denote
the combined population, of size M.
Furthermore, let indicate with: U the set, of size N, of the Italian
municipalities; i the municipality identifier; riQ , the set, of size
riM , , of individuals of the r-th age class in the i-th
municipality; ,.iQ the set, of size ,iM , of individuals in the
i-th municipality, obtained as the union of the age class-
subpopulations.
Let, furthermore denote, with: d (d=1,…,5) the specific domain
type; j ( dJj ,...,1= ), the domain identifier of the d-th domain
type; djQ , the j-th domain of the d-th domain type , including
djM eligible individuals; djiQ , the j-th domain of the d-th
domain type in the i-th municipality, including djiM , ; rdjiQ ,
the subset of djiQ , , of size rdjiM , , including individuals
belonging to the r-th age class.
Hence, there are 35 different domains for the three age-class
populations that represent a partitioning of the combined
population.
The subscript k refers to a generic individual from one of the
reference populations, and ky indicates the corresponding value
of the specific variable of interest y. For example, if occupation
is the variable of interest y, the variable ky assumes the value 1
if the individual is employed and 0 otherwise. In terms of the
generic y variable, the following 36 sums represent parameters
of interest for the first round of the survey: the total population
by age class (3 totals), the total combined population (1 total)
and the total sums for each domain (32 totals / sums), defined
respectively as:
- ∑=rQ kr yY (r =1,2,3),
- 321 YYYyYQ k ++==∑
- ∑=djQ kdj yY (d=1,…,5; dJj ,...,1= ),
where A denotes a generic group of individuals, ∑A ky
indicates the sum of the values of the variables of interest for all
individual members of A.
3. GENERAL DESCRIPTION OF THE SAMPLING
DESIGN
To make estimations for the parameters of interest, a random
sample of individuals is selected through a complex sampling
design with multiple stages and selection phases.
63
Proceedings of The 4th International Multi-Conference on Society, Cybernetics and Informatics (IMSCI 2010)

Two different types of sampling designs are employed. One for
the population of 16 year old individuals and the other for the
populations of 19 and 22 year old individuals.
The complexity of the sampling technique employed is partially
attributable to various statistical and economic-operational
constraints, which are described as follows.
- The total number m of sampled individuals is set to 10,500.
- The number of sampled individuals rm (r=1,2,3), for each
age-class population is set to 3,500.
- The number of sampled individuals djm (d=1,…,5;
dJj ,...,1= ) by specific domain j of type d is set so as to
obtain sufficiently reliable estimations with respect to the
domain itself.
- The sampled individuals to be interviewed must be drawn
from 100 different municipalities. The 21 regional capitals
are automatically included in the sample, and are referred to
as Self Representative (AR) municipalities. The remaining
79 municipalities are selected via random sampling of the
total population of municipalities. These are referred to as
Non Self Representative (NAR) municipalities.
- The sampled individuals of age 16 must represent a sub-
group of those interviewed in the OECD-PISA 2009 survey
(Program for International Student Assessment) from the
previous year, hereinafter referred to as the PISA 2009
survey3. With the exception of students enrolled in lower
secondary school in 2009, the remainder of the 16 year olds
to be included in the sample must be drawn from 120
different schools (upper secondary school or training
centres) and represent a sub-group of the schools involved
in the PISA 2009 survey.
- The sampling method employed is strictly probabilistic in
nature. This allows to make sufficiently robust and
scientifically rigorous inferences with no subjective
influence from the sampler, and sampling errors to be
calculated afterwards, even if they are pure approximations.
3.1. Sixteen year old individuals
Sixteen year old individuals were selected using a multi-phase
sampling design.
First sampling phase: PISA 2009 Survey
The first sampling phase comes from the PISA 2009 survey.
The sampling design of PISA 2009 involves two different
selection stages. The first stage selects the schools and training
centres and the second stage selects the individuals.
First stage
The first-stage sample is stratified with selection in strata with
variable probabilities and no replacement. The strata are defined
by concatenating the variables for region and type of school.
Within each stratum, schools are first ranked by size, as defined
by the number of eligible students (i.e. those born in 1993)
enrolled in that school. Systematic sampling is subsequently
used to select a pre-determined number of schools using
probabilities proportionally to the size of the schools
themselves.
Second stage
The second stage of selection is based on systematic sampling
with equal probabilities for individuals born in 1993. As a
baseline , 35 individuals are selected from each school. If fewer
than 35 students from a given school were born in 1993, the
entire group is included in the sample.
3 INVALSI (2009)
Second sampling phase: Sampling Municipalities
The second phase involves the selection of municipalities
having one or more of the schools involved in the PISA 2009
survey. Municipalities are sub-divided into two sub-groups:
- the 21 AR municipalities are automatically included in the
sample, because in each of these municipalities is located at
least one school involved in the PISA 2009 survey.
- The remaining NAR municipalities are selected using
variable probabilities without replacement by means of a
balanced sampling design (Deville J-C. and Tille Y. (2004);
Falorsi P.D. and Righi P. (2008)).
As described in greater detail in section 4, the sample of
municipalities is defined in a way that ensures the following
features:
- The sampled municipalities are selected as a sampling base
for the survey of 16 year olds as well as the surveys for 19
and 22 year olds.
- The only sub-group of sampled municipalities that is used
for the 16 year old population sample consists of those with
one or more institutions involved in the PISA 2009 survey.
- The sub-group of sampled municipalities serving as the
sampling base for the 16 year old population is selected in a
way that meets the sample size requirements for the final
sample of 16 year old individuals.
Third sampling phase: Sampling of Institutes
The third phase adopts a two-stage sampling design, where
schools (selected during the first two sampling phases) are
further selected in the first stage and the individuals included in
the sample are selected in the second stage.
First stage
Schools selected from the sampled municipalities are
subdivided into two strata.
- Level A stratum consisting of lower secondary schools,
which are automatically included in the second-stage
sampling;
- The remaining schools are grouped together and jointly
referred to as secondary institutes. This stratum includes
upper secondary schools and training centres. These are
selected using variable probabilities without replacement by
means of a balanced sampling design, as described in
section 5. This sample is selected in a way that meets the
sample size requirements defined for the final sample of 16
year old individuals.
Second stage
Students in each secondary school are selected using simple
random sampling without replacement. The interviews are
conducted at the school.
3.2. Nineteen and twenty-two year olds
Nineteen and twenty-two year old individuals are selected using
a two-stage sampling design, in which municipalities are the
primary sampling units and individuals are the secondary units.
First sampling stage
Municipalities are divided into two sub-groups:
- AR municipalities are automatically included in the sample;
- the remaining NAR municipalities are selected with variable
probabilities without replacement using a balanced
sampling design.
Second sampling stage
In each of the sampled municipalities, the enrolment registry for
each of the two age classes in question is used separately to
select a pre-determined number of individuals from each of the
two age classes in question (19 and 22 year olds) using
systematic sampling.
The interviews are conducted at their homes.
64
Proceedings of The 4th International Multi-Conference on Society, Cybernetics and Informatics (IMSCI 2010)

4. MUNICIPALITIES SAMPLE
With the aim of displaying the municipalities’ sample, the
following notation has been chosen.
- n (n=100) is the size of the municipalities’ sample;
- )3500,3500,500.3(),,( 321)( ′=′= mmmrz is the vector of
age groups’ sample sizes;
- )...,,( 11 ′= −ddJdd mmz (d=1,…,5) is the
1−dJ components vector, including a fixed number of
sampled individuals for all the domains of type d, except
from the last one;
- ),...,,,( 51)( ′′′′= zzzz rn is a 32-element vector, which
contains the number of sampled municipalities and the
sample size for age groups and domain.
With reference to the i municipality, let:
- 1,iM&& be the number of OECD-PISA surveyed pupils;
- djiM 1,&& be the number of OECD-PISA surveyed pupils
belonging to the j domain of d type (d=1,…,5;
dJj ,...,1= );
- 3,2,1,, iiii MMMM ++= &&&& ;
- djidjidjidji MMMM 3,2,1,, ++= &&&& ;
- rim , is the fixed theoretical number (see paragraph 6) of
sampled individuals for each age group (r=1,2,3) with
1,1, ii Mm &&≤ and riri Mm ,, ≤ (with r=2,3);
- djim , is the fixed theoretical number (see paragraph 6) of
sampled individuals belonging to j domain of d type, with
djidji Mm ,,&&≤ ;
- ),,( 3,2,1,)(, ′= iiiri mmmz is the vector of the sample sizes
for each age group;
- )...,,( 1,1,, ′= −ddJididi mmz is the vector, with 1−dJ
components, containing the fixed sampling size for all the
domains of type d, except from the last one;
- ),...,,,1( 5,1,),( ′′′′= iirii zzzz is a 32-element vector, which
contains the value 1 and the sampling sizes by age group
and domains.
A sample s with size n from N municipalities of U is selected
without replacement and variable probabilities of inclusion iπ
(calculated following the methodology defined in paragraph 5).
The municipalities belonging to U are divided into two groups,
the AR group with 1=iπ , and the NAR group with 1<iπ .
Then, the U group is divided into two subgroups:
NARAR UUU ∪= where the ARU size is 21=ARN .
Consequently, the s sample is divided into two subgroups
NARAR sUs ∪= , where the NARs size is NARn =79.
Therefore, ARz and NARz are defined as following:
∑=ARU iAR zz ; NARNAR zzz −= (1)
where the first elements are respectively ARn e NARn .
The inclusion probabilities iπ are determined trough an
iterative procedure for calibration displayed in paragraph 6
(phase 8).
Let define the initial inclusion probabilities as follows:
∈
∈
=NAR
NAR
i
NAR
AR
i UiM
Mn
Ui
if
if1
,π&&& , (2)
where ∑=NARU iNAR MM , .
The final inclusion probabilities iπ ,are calculated by solving
the following constrained minimisation problem:
∈≤<
∈==
=
=
∑∑
∈
∈
NARi
ARii
Ui NARii
Ui ii
Ui
Ui
D
NAR
if10
if1
min),(
π
ππ
π
ππ
&&&
&&&
zz
, (3)
where ),( iiD ππ&&& is a distance function between the
probabilities iπ&&& and iπ .
In problem (3), the objective function is the expression
∑∈=
Ui iiD min),( ππ&&& , while the last three expressions define
32+N constraints, NARN of which are expressed as inequalities.
By jointly considering the formula (1) and the second
expression of system (3), it is straightforward to prove that the
expected value of the municipalities’ sample size respects the
following:
∑∑∑ ∈∈∈=+=+=
NARAR Ui NARARiiUi iUi ii zzzzzz ππ . (4)
The sample s is selected through a Cube procedure (INSEE,
2009), according to, at least approximately, according to the
balancing equations (5) balancing equations. They ensure that
the selected municipalities sample respects the fixed sample
size:
∑ =s i
i
zxπ
1, (5)
being iii πzx = .
5. SAMPLE OF SECONDARY SCHOOLS
5.2. Formal description
To display the sampling design in a formal way, the following
notation has been chosen.
- d&& ( d&& =1,…,4) is the generic type of domain of interest for
secondary schools - where d&& =1 stands for the geographic
area (with 5 domains), d&& =2 stands for the type of
municipality (with 3 domains), d&& =3 stands for the legal
status of the school (with 2 domains), d&& =4 stands for the
type of school (with 4 domains);
- j&& (d
Jj &&&& ,...,1= ), is the subscript which identifies the
specific domain of typology d&& ;
- ),...,...,,(11
′=−
dJdjddd
mmm&&
&&&&&&&&&&&&z (with d&& =1,…,4) is the
1−d
J && component vector, which contains the fixed number
of sampled secondary schools for all the domains of
typology d&& , except from the last one;
- ),...,,,( 41 ′′′= zzz &&&&&& Fn is a 11-element vector, which contains
the number of sampled secondary schools on the aggregate
and for each of the domains of interest;
- k is the subscript that identifies the generic secondary school
included in F, selected by the OECD-PISA survey and
located in one of the 48 municipalities selected in the first
phase of sampling (with FNk ,...,1= ).
65
Proceedings of The 4th International Multi-Conference on Society, Cybernetics and Informatics (IMSCI 2010)

With reference to the k secondary school, the chosen notation is:
- kM&& stands for the number of pupils surveyed by the
OECD-PISA survey;
-jdk &&&&,
δ is a dummy variable that takes on the value of 1 if the
school k belongs to the domain j&& and type d&& , and the
value 0 otherwise;
- )...,,(1,1,,
′=−
dJdkdkdk &&&&&&&&&& δδz is the 1−
dJ && component vector
of dummy variables jdk &&&&,
δ for all the domains of type d&& ,
except from the last one;
- ),...,,1( 4,1, ′′′= kkk zzz &&&&&& is the 11 component vector containing
the value 1 and the dummy variables for each domain.
A sample Fs with size Fn from FN schools of F is selected
with variable probabilities of inclusion kπ&& , and calculated
through an iterative procedure for calibration as a result of the
following problem of constrained minimisation:
=≤<
=
=
∑∑
∈
∈
Fk
Fk kk
Fk kk
Nk
D
,...,110
min),(
π
π
ππ
&&
&&&&&&
&&&&&
zz , (6)
where ),( kkD ππ &&&&& is a distance function between kπ&& , and the
initial probability FFk Nn /=π&&& of uniform type. In the system
(6), the function ∑ ∈=
Fk kkD min),( ππ &&&&& is the objective
function; while the last 2 expressions are a system of 11+ FN
constraints.
The sample Fs is selected through a Cube procedure (INSEE,
2009), according, at least approximately, to the following
balancing equations (7). They ensure that the selected schools
sample respects the fixed sample size:
∑ =Fs k
k
zx &&&&&&π
1, (7)
where kkk π&&&&&& zx = .
6. DETERMINATION OF INCLUSION PROBABILITY
AND SAMPLING SIZE AT VARIOUS STAGES AND
SELECTION PHASES
The determination of rim , , djim , , iπ e kπ&& is defined through
a procedure articulated in the following phases.
6.1. Phase 1
The size of the rm (r=1,2,3) sample is equal to 3,500. The m
overall sample size is set equal to 500,103500,3 =×=m .
The sample for each domain is set through the following
function:
=−+
=−+
=
5,4for)1(
3,2,1for)1(
1
1
1
1 dJ
m
M
Mm
dJ
m
M
Mm
m
d
d
j
d
d
d
dj
d
dj
αα
αα, (8)
in which 10 ≤< dα (d=1,…,5).
As result of a series of empirical analyses, the value of dα has
been set equal to 0.75.
6.2. Phase 2
The ARU group is formed by all those municipalities that are
regional capitals; the NARU group by the remaining
municipalities . Therefore, the municipalities of the ARU group
have an initial inclusion probability 1=iπ&&& , while the
remaining municipalities have an initial inclusion probability
equal to
NAR
iARi
M
MNn )( −=π&&& . (9)
6.3. Phase 3
The sample sizes rARm , , djARm , , rNARm , and djNARm , are
determined through the following functions:
r
rARrrAR
M
Mmm
,, = ,
dj
djARdjdjAR
M
Mmm
,, = ,
rARrr
rNARrrNAR mm
M
Mmm ,
,, −== ,
djARdjdj
djNARdjdjNAR mm
M
Mmm ,
,, −== . (10)
6.4. Phase 4
Determination of the rim , and djim , sampling sizes for the
ARU is as follows
r
rirri
M
Mmm
,, = ,
dj
djidjdji
M
Mmm
,, = for ARUi ∈ . (11)
6.5. Phase 5
For each r age group, the determination of the rim , and
djim , sampling sizes for the NARU municipalities is obtained
through the following iterative procedure:
- Initialization
Define ,...2,1,0=τ the general iteration.
At initial iteration, ,0=τ is set:
∅=τrA ,
NARr UB =τ ,
NAR
rr
n
mm =τ .
- Calculation
According to the value of r, at each iteration ,...2,1=τ , the
calculations are made as following:
≤
>=
−−
−
1,1
11
1
1,1
11,1,
se
se
i
iii
Mmm
MmMm
&&&
&&&&&&
ττ
ττ (12)
=≤
>=
−−
−
3,2se
se
,11
,1
,, r
Mmm
MmMm
rirr
rirriri ττ
ττ (12)
The τrA and τ
rB (r=1,2,3) groups are determined in the
following fashion. The τrA group includes all the NARU
for which 1,
−< τrri mM&&& .
66
Proceedings of The 4th International Multi-Conference on Society, Cybernetics and Informatics (IMSCI 2010)

The τrB complementary group is determined as
ττrNARr AUB −= .
It is also calculated
iBiiriAiNARrrr
Mmm ππ τττ &&&&&& ∑∑ ∈∈
−= /)( , .
- Exit
Indicating with ε a quantity small at will, if the following
condition is verified
εττ <−∑ ∈−
NARUi riri mm 1,, , (13)
then, the iterations are stopped and it is set
τriri mm ,, = (r=1,2,3). (14a)
If condition (13) is not verified, the iterations go on.
Once the iterative procedure is over, for each of three age
groups the following quantities are calculated:
3,2,1, iiii mmmm ++= , (14b)
=∈
= 2,1otherwise0
ty municipali theif, d
djimm i
dji
, (15)
3
33,
33,)1(
J
m
M
Mmm i
i
ji
ijiαα −+=
&&&
&&&
(16)
5,4)1(,
1,
1,
,
1,, =−+= dforJ
m
M
Mmm
di
i
d
i
dji
iddji αα&&&
&&& (17)
where diJ , denotes the number of domains that are present
in the i municipality for the typology of the d domain.
6.6. Phase 6
The iπ final inclusion probabilities are determined by solving
the following calibration system
≤<
=
=
∑∑
∈
∈
10
min),(
i
Ui NARii
Ui ii
NAR
NARD
π
π
ππ
zz
&&&
, (18)
through the subsequent iterative steps:
- Initialization
Let ,...2,1,0=τ be the generic iteration.
If, as initial iteration, ,0=τ then:
∅=τA , NARUB =τ , NARzz =τ , ii ππ τ &&&= .
- Calculation
At subsequent iterations, using the Geneeses software (Istat,
2009), the τπ i probabilities are found as the solution to the
following constrained minimisation problem
<
=
=
∑∑
−
−
∈−
∈−
τ
ττ
ττ
π
π
ππ
τ
τ
i
Bi ii
Bi iiD
0
min),(
1
1
1
1
zz , (19)
where the distance ),( 1−ττ ππ iiD is expressed according to
the logarithmic function:
( ) 111 /ln),( −−− +−= τττττττ πππππππ iiiiiiiD that ensures
the respect of the τπ i<0 condition.
The τA and τ
B groups are defined as following: τττ Γ∪= −1
AA and τττABB −= −1 where τΓ is the
group including all the 1−τB municipalities, for which
1>τπ i .
Thus, ∑ ∈−= τ
τAi iNAR zzz is calculated.
- Exit
If the following condition is verified
0=Γτ , (20)
then, the iterations end and the inclusion probabilities are
defined as
∈
∈=
ττ
τ
ππ
Bi
Ai
ii
se
se1. (21)
Otherwise the iteration continues until condition (20) is
satisfied.
6.7. Phase 8
The kπ&& , inclusion probabilities of secondary school, are
determined through the solution of the constrained minimisation
problem (6) adopting the same iterative procedure described in
the previous paragraph.
7. CONCLUSION
The complexity of the phenomena to be estimated through the
TSL Survey required the implementation of an articulated
survey design with several sampling phases and stages.
The strategy described in this paper uses innovative techniques
and will allow the construction of a rigorous sample from where
individuals with different characteristics and from independent
populations can be jointly drawn.
The TSL survey plays a fundamental role for research in Italy,
as it will allow to fill an informative gap and investigate that
part of the population that is particularly interesting for policy
makers.
REFERENCES
Deville J-C. and Tillé Y. (2004), “Efficient balanced sampling :
the cube method”, Biometrika, No. 91, pp. 893-912.
Deville J-C. and Tillé Y. (2005), “Variance approximation
under balanced sampling”, Journal of Statistical Planning and
Inference, No. 128, pp. 569-591.
P.D. Falorsi P. D. and Righi P. (2008), “A Balanced Sampling
Approach for Multi-way Stratification Designs for Small Area
Estimation”, Survey Methodology, Vol. 34, No. 2, pp. 223-
234, Statistics Canada, Catalogue No. 12-001-X
http://www.statcan.gc.ca/pub/12-001-x/2008002/article/10763-
eng.pdf
INSEE (2009),
http://www.insee.fr/fr/methodes/default.asp?page=outils/cube/a
ccueil_cube.htm, For downloading the “Macro– CUBE”.
INVALSI (2009), http://www.pisa.oecd.org,
http://www.invalsi.it/invalsi/ri/pisa2009.php?page=pisa2009_it_
00 , For OECD- PISA survey.
ISTAT (2009),
http://www.istat.it/strumenti/metodi/software/produzione_stime
/genesees/index.html, For downloading the software Genesees.
67
Proceedings of The 4th International Multi-Conference on Society, Cybernetics and Informatics (IMSCI 2010)

ICT-Based Collaborative Action Research in Science Education
Josef Trna
Faculty of Education, Masaryk University
Brno, Czech Republic, EU
and
Eva Trnova
Faculty of Education, Masaryk University
Brno, Czech Republic, EU
ABSTRACT
Action research is an important event-based method for science
modification of action research in a web-environment using ICT and international collaboration between teachers and their
students. This ICT-based collaborative action research in
science education is outlined by the methodology used. Support
for the development of science teacher professional
determined through analysis of outcomes during an application
within the European project EuSTD-web. The research
outcomes indicate the value of ICT-based collaborative action research in science education for upgrading science teaching
and learning.
Keywords: Action Research, Collaboration, ICT, Science Education.
1. INTRODUCTION
Science education today plays an important role in educational systems and in many systems has the goal of enhancing
scientific literacy in students [1]. Scientific literacy is suggested as providing support for citizenship in a democratic society [6]
and has the potential for enabling students to interrelate science
with economical, technological and environmental aspect in
striving towards sustainabilitthrough school science in relation to context, terminology,
subject specific concepts and so on, is expected to be the core
focus in defining and developing teaching strategies in the
context of a constructivist approach to science education. The creation of relevant and suitable curricular materials and the
selection of appropriate teaching and learning strategies are seen
their own views to ones seen as more scientific.
A weakness in science education is perceived to be a lack of a
systematic or high quality in-service science teacher training.
which may last about 40 years, many new science discoveries
appear and innovative educational technologies emerge.
However science teachers tend to create their own individual
PCK (pedagogical content knowledge), little influenced by poor quality in-service provisions and indicate little
acknowledgement of these changes, or evidence of exchanges
with colleagues. Therefore, high quality in-service science
teacher training for practicing science teachers is very important in reducing the gap between scientific and educational research
and the development of curricular materials and evidence-based teaching methods for school practice [3], [5].
2. RATIONALE
It is possible to identify two main barriers in promoting the use of innovative science education technology within school
practice: the efficient dissemination of information to science
teachers and the motivation of science teachers to learn and use innovative science educational technology. This study is a start
towards alleviating these barriers, and also increases the
familiarity of use of ICT for collaborative work with other
teachers and trainers across the world.
Recognising the dimension of science education provides a
good opportunity for the dissemination and upgrading of ideas
and curricular materials amongst teachers through the use of ICT. It is proposed that a web-based environment can provide a
very effective technology for initiating and substantiating
if solely amongst teachers has a risk of lacking expertise and hence it is suggested this collaboration should be based and
supported by expertise from the wider science education
community including teachers skilled in this area.
Disseminated curricular materials and technologies which have
been previously implemented and evaluated within a reflective
framework can play an important role in this regard as they have been validated by collaborative teachers-methodologists
whose design and reflections on the science curricular materials
ensure they are in line with acceptable school practice.
European Teachers Professional Development for Science Teaching in a Web-based
- 129455-CP-1-2006-1-PT).
Project outcomes are a set of curricular materials for science
aimed at science teacher professional development developed in
a web-based environment.
Our new core idea is to use action research in a web-based environment realised through the international collaboration of
science teachers. Expected positive outcomes are targeted in two developmental directions: in-service science teacher
are an indivisible system.
3. RESEARCH QUESTIONS AND METHODOLOGY
ICT based collaborative action research (ICT-BCAR) in
science education as a topic of our research is defined and
68
Proceedings of The 4th International Multi-Conference on Society, Cybernetics and Informatics (IMSCI 2010)

69
Proceedings of The 4th International Multi-Conference on Society, Cybernetics and Informatics (IMSCI 2010)
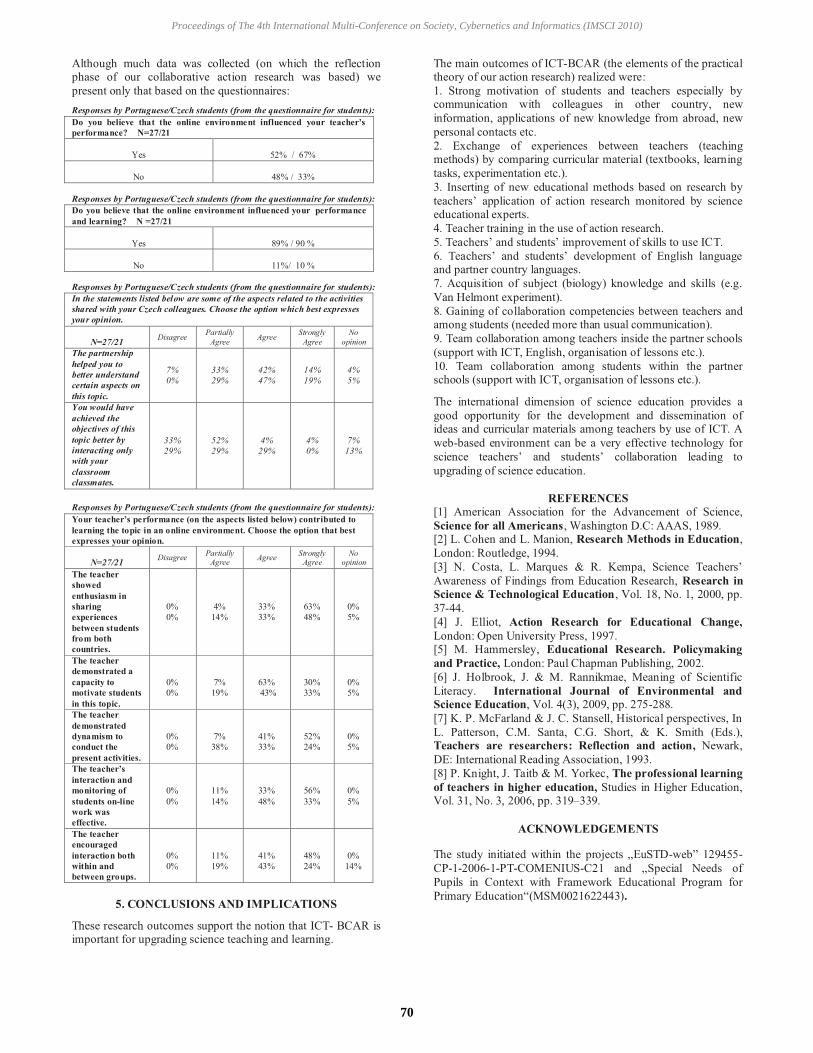
Although much data was collected (on which the reflection phase of our collaborative action research was based) we
present only that based on the questionnaires:
Responses by Portuguese/Czech students (from the questionnaire for students):
performance? N=27/21
Yes
52% / 67%
No
48% / 33%
Responses by Portuguese/Czech students (from the questionnaire for students):
Do you believe that the online environment influenced your performance
and learning? N =27/21
Yes
89% / 90 %
No
11%/ 10 %
Responses by Portuguese/Czech students (from the questionnaire for students):
In the statements listed below are some of the aspects related to the activities
shared with your Czech colleagues. Choose the option which best expresses
your opinion.
N=27/21 Disagree
Partially
Agree Agree
Strongly
Agree
No
opinion
The partnership
helped you to
better understand
certain aspects on
this topic.
7%
0%
33%
29%
42%
47%
14%
19%
4%
5%
You would have
achieved the
objectives of this
topic better by
interacting only
with your
classroom
classmates.
33%
29%
52%
29%
4%
29%
4%
0%
7%
13%
Responses by Portuguese/Czech students (from the questionnaire for students):
learning the topic in an online environment. Choose the option that best
expresses your opinion.
N=27/21 Disagree
Partially Agree
Agree Strongly
Agree No
opinion
The teacher
showed
enthusiasm in
sharing
experiences
between students
from both
countries.
0%
0%
4%
14%
33%
33%
63%
48%
0%
5%
The teacher
demonstrated a
capacity to
motivate students
in this topic.
0%
0%
7%
19%
63%
43%
30%
33%
0%
5%
The teacher
demonstrated
dynamism to
conduct the
present activities.
0%
0%
7%
38%
41%
33%
52%
24%
0%
5%
interaction and
monitoring of
students on-line
work was
effective.
0%
0%
11%
14%
33%
48%
56%
33%
0%
5%
The teacher
encouraged
interaction both
within and
between groups.
0%
0%
11%
19%
41%
43%
48%
24%
0%
14%
5. CONCLUSIONS AND IMPLICATIONS
These research outcomes support the notion that ICT- BCAR is important for upgrading science teaching and learning.
The main outcomes of ICT-BCAR (the elements of the practical theory of our action research) realized were:
1. Strong motivation of students and teachers especially by communication with colleagues in other country, new
information, applications of new knowledge from abroad, new
personal contacts etc.
2. Exchange of experiences between teachers (teaching methods) by comparing curricular material (textbooks, learning
tasks, experimentation etc.).
3. Inserting of new educational methods based on research by
educational experts.
4. Teacher training in the use of action research.
and partner country languages.
7. Acquisition of subject (biology) knowledge and skills (e.g.
Van Helmont experiment).
8. Gaining of collaboration competencies between teachers and among students (needed more than usual communication).
9. Team collaboration among teachers inside the partner schools
(support with ICT, English, organisation of lessons etc.).
10. Team collaboration among students within the partner schools (support with ICT, organisation of lessons etc.).
The international dimension of science education provides a
good opportunity for the development and dissemination of ideas and curricular materials among teachers by use of ICT. A
web-based environment can be a very effective technology for
upgrading of science education.
REFERENCES
[1] American Association for the Advancement of Science,
Science for all Americans, Washington D.C: AAAS, 1989. [2] L. Cohen and L. Manion, Research Methods in Education,
London: Routledge, 1994.
Awareness of Findings from Education Research, Research in
Science & Technological Education, Vol. 18, No. 1, 2000, pp.
37-44.
[4] J. Elliot, Action Research for Educational Change,
London: Open University Press, 1997. [5] M. Hammersley, Educational Research. Policymaking
and Practice, London: Paul Chapman Publishing, 2002.
[6] J. Holbrook, J. & M. Rannikmae, Meaning of Scientific
Literacy. International Journal of Environmental and
Science Education, Vol. 4(3), 2009, pp. 275-288.
[7] K. P. McFarland & J. C. Stansell, Historical perspectives, In
L. Patterson, C.M. Santa, C.G. Short, & K. Smith (Eds.), Teachers are researchers: Reflection and action, Newark,
DE: International Reading Association, 1993.
[8] P. Knight, J. Taitb & M. Yorkec, The professional learning
of teachers in higher education, Studies in Higher Education, Vol. 31, No. 3, 2006, pp. 319 339.
ACKNOWLEDGEMENTS
- 129455-
CP-1-2006-1-PT-COMENIUS-
Pupils in Context with Framework Educational Program for
.
70
Proceedings of The 4th International Multi-Conference on Society, Cybernetics and Informatics (IMSCI 2010)

“Using Free Web 2.0 Media Tools to Promote Student Engagement
and Instructor Presence in Online Classes.”
Risa Blair and Sheryl Hartman
Miami Dade College
Instructor presence in the online classroom is a vital to promote student engagement in the online
classroom, including both instructor to student interaction and student to student interaction (Picciano,
2002). To that end, Jin et al (1998) provided a model to simulate the professor to student relationship in
the distance-learning environment. This model shows the professor on one side in his or her own world,
and the students on the other side in their own world. Although this model is old by bleeding edge
technology standards, it still holds true in the online environment. There is a clear gap, especially in
terms of communication, providing an opportunity for creating a bridge between the professor and the
students through the use of free Web 2.0 media tools.
Figure 1: Distance Learning Model with Socially Constructed Knowledge (Jin et al, 1998)
Free Web 2.0 tools used in the online classroom to promote student engagement include Animoto,
Xtranormal, Eyejot, Fix8, and Twitter. Animoto is a very easy-to-use tool to optimize student engagement
in the first “Meet & Greet” discussion. Students are generally able to upload picture, so the learning curve
is very short with Animoto. Essentially, students upload pictures, choose music, and are create a video
snapshot introduction to post on their first discussion board.
Xtranormal may be used by students, but can serve a variety of very useful purposes in the online
classroom. The free software download provides a variety of characters for use in scripted dialogue
animations with music and sets. The quality of the characters and the voices is fair, but the overriding
meaning possible is exceptional. Xtranormal can certainly be used for course announcements or
reminders, but the really interesting use is to create characters that conduct conversations about the
course. For instance, early in the semester, the two characters may discuss expectations in the course
and whether they think it will be easy or difficult, as well as strategies for success. The students really
don’t have in depth at the point of this dialogue, so there is some guessing. As the instructor, one can
front-end load the dialogue with Shakespearean foreshadowing. At instructor designated hot spots in the
course, these same two (or maybe different) characters may appear and take their conversation to the
71
Proceedings of The 4th International Multi-Conference on Society, Cybernetics and Informatics (IMSCI 2010)

next level. These two characters may discuss any specific assignments or notable aspects of the course.
This is a useful edutainment tool to bridge the gap between the instructor and the students, as music,
dancing, or other software enabled features may be integrated into the animated video.
Eyejot is a simple video email tool. It may be used directly to speak to someone and provide a video.
However, a more interesting use of the tool is for course announcements. An instructor may send a video
and then cut and paste the embed code into any HTML document, or course announcement. Obviously,
since students will see the instructor, he or she would want to present well in the video. For those early
mornings that instructors spend grading online, prior to meeting and greeting the public, there is Fix8.
The free version of this tool provides a lesser quality video; however, the video is enabled with hats,
glasses, beards, or other embellishments. Additionally, in lieu of a video of the instructor, Fix8 allows the
instructor to speak through an avatar that follows (albeit somewhat crudely) the instructor’s facial
movement. Overall, using Eyejot or Fix8 add interest and engagement to the course, as well as provide
an instructor presence, whether using the instructor’s voice alone with an animated character (Fix8) or the
instructor’s voice and video (Eyejot).
Twitter can be a very powerful tool to broadcast messages around the world in a flash. Twitter can also
be used to broadcast drivel. With guidelines in place, Twitter can be a very useful tool to stay connected
to students in an online class.
In summary, the literature supports providing a strong instructor presence in the online class to promote
student engagement. Free Web 2.0 tools, such as Animoto, Xtranormal, Eyejot, Fix8, and Twitter, when
used with intent, can be extremely helpful in bridging the instructor to student gap, as well as for
promoting student engagement in online courses.
72
Proceedings of The 4th International Multi-Conference on Society, Cybernetics and Informatics (IMSCI 2010)

References
Jin, Z., Mason, R. M., & Yim, P. P. (1998). Bridging Us-China Cross-Cultural Differences Using Internet and
Groupware Technologies. The 7th
International Association for Management of Technology
Annual Conference, http://www.cim-oem.com/bridge_8c18c.html.
Picciano, A. (2002). Beyond student perceptionsL issues of interaction, presence, and performance in an
online course. Journal of Asynchronous Learning Networks, 6, 21-40.
73
Proceedings of The 4th International Multi-Conference on Society, Cybernetics and Informatics (IMSCI 2010)

eGrader, a software application
that automatically scores student
essays: with a postscript on
ethical complexities
Authors
Roxanne Byrne. Ph.D., Department
of Mathematical and Statistical
Sciences, University of Colorado
Denver
Michael Tang, Ph.D., Science,
Technology Studies, University of
Colorado Denver
John Tranduc, (M.S. –pending),
G.I.S. Program, University of
Colorado Denver
Matthew Tang (M.S.—pending),
G.I.S. Program, University of
Colorado Denver
Abstract
Online and traditional teachers face several
instructional challenges with regard to
assessing student learning. This paper
focuses on a software application that
automatically scores student essay. The first
part gives a brief overview of three
commercial automated essay scoring
systems. Then it describes the technical
aspects of the machine grader developed by
the authors, including an assessment of its
performance. Although the statistical results
were significant in finding a strong
correlation between human and machine
scorers and the other measures, follow-up
non-quantitative evaluations led the
researchers to discontinue using the eGrader.
They concluded that while the eGrader’s
ability to measure objective evaluation
criteria was successful, measuring subjective
ideas proved to more complex and
problematic.
Introduction
A survey conducted by authors of this paper
found that essay assignments were perceived
as among the more effective learning
devices in higher education (Byrne and
Tang, 2008). At the same time, the
question arises as to how a human grader
can score essays adequately when the
number of essays to be graded is large and
the time to evaluate them short (Hartley, et.
al. 2006; Weseley and Addyson, 2007;
Walvoord, et. al., 2008). One possible
solution to the problem may be the adoption
of an automated assessment tool for essays.
Such a system, so it has been argued, could
bring more consistency to the scoring of
essays and at the same time promises cost
and time savings.
The major impulse for the development,
testing and use of automated scoring
machines comes not from the groves of
academe but from corporate testing
enterprises such as the Education Testing
Service (ETS). It is therefore of no
surprise, that the one area in traditional
academia where automated essay scoring
services is making great in-roads is in the
scoring of student essays by university
admissions. In the placement area over 900
universities use machines to score written
exams of over 5,000,000 students. In
addition commercial test makers have
entered actual classrooms by providing
teachers with their software through
foundation funding (Ericson, 2006, 3-4).
Commercial Services
What follows is a brief overview of three
commercial automated essay scoring
systems available today. For other
summaries of these and other systems such
as C-Rater, BETSY, Intelligent Essay
Marking System, SEAR, Paperless School
free text Marking Engine and Automark,
see: Velanti (2003) and Shermis and
Burnstein (2003).
1) Project Essay Grade
(http://www.measinc.com/Default.aspx?Pag
e= ETS.AutomatedEssayScoring)
74
Proceedings of The 4th International Multi-Conference on Society, Cybernetics and Informatics (IMSCI 2010)

Project Essay Grade, or PEG, is one of the
earliest implementations of automated essay
grading. It was developed by Page and
others (Hearst, 2000; Page, 1996).
According to the commercial website that
sells the system, it is based on more than 40
years of research in computational
linguistics, and its authors claim that PEG’s
scoring results have been validated in more
independent studies than all other essay
scoring solutions combined. For analysis of
functions and design, see: (Valenti, Neri &
Cucchiarelli, 2003;Shermis, 2003).
2) IntelliMetric®
(http://www.vantagelearning.com/school/pro
ducts/intellimetric/)
IntelliMetric is the result of Lawrence M.
Rudner’s (Rudner and Liang, 2002) early
research on an automated essay grading
system called the Bayesian Essay Scoring
sYstem (BETSY). IntelligMetric uses
Bayesian computer adaptive testing [Frick
(1992), Madigan, Hunt, Levidow, and
Donnell (1995), and Rudner (2001)] to
classify select ―items‖ or essay features into
a three or four point categorical scale. Its
most profitable product is MyAccess, an
automated writing tool to improve student
writing and prepare them for the essay
portions of exams, such as the Graduate
Management Admission Test (GMAT®) for
entrance into business schools with MBA
programs.
3) Criterion’s e-Rater® (http://www.ets.org,
then Products)
E-Rater is a software engine, develop in the
mid-90’s is perhaps the most successful of
the commercial automated writing
evaluators and has been used since 1999 to
score the essay portion of the GMAT
(Burstein, 2003; Kukich,2000). E-Rater uses
Microsoft’s natural language parser and a
companion software application called
Critique to rate essays according to rates of
errors as flagged by Microsoft’s style and
grammar checker. Critique takes into
account statistics based on redundancy,
length of essay, vocabulary and the number
of required discourse elements such as thesis
statement, main idea, or supporting idea.
Evaluation of commercial services
Most of the systems developed are aimed to
grade essays both for style and for content.
Recent research, however, indicates that
using content as a criterion for scoring may
not be as essential as one would think as
documented by the success of PEG, which
takes content as a minimal criterion.
(Shermis, M.D., Shneyderman, A. and
Attali, Y., 2005). We can also found that for
content analysis, Bayesian analysis, NLP,
and LSA appear to be the most successful
techniques used in automated essay grading.
Thirdly, the main methods to measure a
system’s performance are experiments
designed to find a correlation between the
scores of human readers versus machine
readers.
The eGrader
This machine essay scorer in contrast to the
commercial services we surveyed: 1)
operates on a client PC; 2) is cost effective;
3) is extremely fast and robust; 3) requires
little human training; and 4) does not require
a huge data base and large computing
power. The design approach used is a-
theoretical, empirical, and statistical
(Anderson, 2008). Its development is
influenced by three relatively unknown
applications developed by S. R. Hawkins
(1993) for natural language processing, by
Alan Mole (1994) for machine translation
and, by Barbara S. Glatt (1984) for
plagiarism detection. Hawkins showed that
a machine can be built that appears to
understand textual meaning and do well on a
Turing Test using Ogden and I.A. Richard’s
semantic theory. Mole built a successful
translating machine for 33 foreign languages
in the 1990’s and discovered that that
grammar, word order and other niceties of
language such as prepositions are
unnecessary in understanding textual
75
Proceedings of The 4th International Multi-Conference on Society, Cybernetics and Informatics (IMSCI 2010)

meaning. Glatt developed a plagiarism
detection program based on the Cloze
procedure that is used in foreign language
and English as a second language teaching
to test for reading comprehension. See:
http://www.plagiarism.com/screening.htm
The eGrader (eG) uses a key word search
function to download web pages that are
then stored in a client computer directory to
use as benchmark data to score student
essays and other forms of writing. The Web
documents in turn are analyzed by a
semantic technique to provide a content
analysis of the targeted writing. A second
directory can be used to store specific
content data such as relevant readings and
sample student essays for similar analysis.
It’s core algorithm to analyze content may
have similarities to Intellimetric’s where:
meaning of word1 + meaning of word2 +
meaning of word3 = meaning of passage
(Ericsson, 2006, 29). The algorithm is based
on a key word and concordance analyzer to
measure similar concepts and usage between
benchmark writing samples stored in the two
directories.
For writing structure, like PEG, eGrader
uses readability statistics based on Flesch
Kincaid equations. These readability
statistics include essay length, grade levels,
and a proprietary algorithm that measures
complexity of sentence structure based on a
connective word counting device. The
eGrader does not analyze grammar or
mechanics and does not rely on traditional
NPL or LSA theory or techniques to make
its calculations. In addition, unlike other
systems, it does not use vectors to associate
words, concepts and documents to build a
relational database. The eG is implemented
on Netbeans IDE 6.1. It exploits Java
Desktop Application template and Java
Swing components for designing the user
interface
In summary, the program uses the following
rubrics to calculate its essay score:
1) key word and important concept
comparison
2) concordance and similar usage
comparison;
3) writing style and complexity
measures; and
4) grade level, length and reading ease
of writing.
The program’s output then gives results in
columns that can be sorted from highest to
lowest so the user can assign grades scores
according to an absolute or relative curve.
This relative method of reporting simplifies
the problem of weighting scores according
to some pre-determined standard or writing
level of students. A final column gives a
composite score of the average of all the
rubrics.
Fig 2: flow chart and structure of eG’s input and
output.
Benchmark Documents
1. Reading material to be tested on
2. WWW documents 3. Exemplary student essays
Student
essays
Outcomes (Report)
1) key word/important concept score
2) concordance/ similar usage score
3) style and complexity score
4) grade level score
5) length score
6) reading ease score
7) total composite score.
76
Proceedings of The 4th International Multi-Conference on Society, Cybernetics and Informatics (IMSCI 2010)

Performance
The eGrader’s scores for 33 student essays
were compared with the scores of the same
papers given by 3 different human readers.
The scores were then compared to determine
their degree of correlation.
1. Human Reader 1 scores versus
machine scores: r = 85%
2. Human Reader 2 scores versus
machine scores: r = 75%
3. Human Reader 3 scores versus
machine scores: r = 74%
These results are comparable to other
commercial systems. For example, in a
similar experiment, researchers evaluated
the IntelliMetric™ automated essay scoring
system’s performance by comparing human
scorers versus machine scorers of essays
from the Analytic Writing Assessment of
GMAT. In two experiments, they found that
Pearson r correlations of agreement between
human raters and the IntelliMetric system
averaged 83%. (My Access, 2008).
According to ETS and Velanti et. al. (2003),
over 750,000 GMAT essays have been
scored with Criterion’s eRater. By
comparing human and e-Rater grades across
15 test questions, the empirical results range
from 87% to 94%.
Conclusion with an ethical postscript
Even though the testing results were
comparable to those claimed by the
commercial testing services its developers
decided not to continue eGrader’s use in the
classroom. While developing and testing
the software several issues led to conclude
that the LSA technique we used for eGrader
could not detect meaning as per its classical
definition of the word (Ericsson 2006).
Moreover, while commercial firms claim
that their algorithms ―simulate human
judgments and behavior . . . quite well,‖ it is
our judgment that this simulation
undervalued the human effort of students.
It is probably for this reason that several
students expressed their concern of having a
machine read their papers.
When using eGrader in a class (not part of
the original experiments), an instructor
informed students that their essays would be
graded by machine but students could ask
for a second, human reading if they felt the
grade was not representative of their work.
More qualms about the use of automated
essay scoring machines emerged after 10
students asked for a rereading of their work.
After doing so, the instructor changed three
of the grades to A’s by increasing their
scores an average of 24%. During the
grading of the papers, the instructor found a
disturbing pattern. The machine algorithm
could not detect ideas that were not
contained in the readings or Web benchmark
documents although the ideas were germane
to the essay question. For example, one
student who received an average machine
score wrote an essay that compared the
required readings with ideas from another
course she was taking. The machine content
analyzer of course did not recognize the
ideas that the student used from another
class. Consequently, eGrader scored her
essay low in the content rubric. Further
discrepancies between the human reader and
the machine reader suggest that machine
readers probably could not detect other
subtleties of writing such as irony,
metaphor, puns, connotation and other
rhetorical devices. For this and other
reasons, the instructor decided not to use
eGrader in further scoring of student essays.
The machine reader appears to penalize
those students we want to nurture, those who
think and write in original or different ways.
For us the subjective element, which was as
important as the objective aspects of the
essays, proved too complex to measure.
Works Cited
Anderson, Chris (June 23, 2008). The end
of theory: the data deluge makes the
77
Proceedings of The 4th International Multi-Conference on Society, Cybernetics and Informatics (IMSCI 2010)

scientific method obsolete Wired Magazine.
16.07
Attali, Yigal and Powers, Don (April, 2008)
A Developmental Writing Scale, ETS
Research Report. Princeton, NJ: ETS. 4, 1-
59.
Bonwell, Charles C. (Fall 1996). Enhancing
the lecture: revitalizing the traditional
format. New Directions for Teaching and
Learning, n67 p31-44
Christie, J. R. (1999). Automated essay
marking-for both style and content. In M.
Danson (Ed.), Proceedings of the Third
Annual Computer Assisted Assessment
Conference. Loughborough University,
Loughborough, UK.
Deerwester, S. C., Dumais, S. T., Landauer,
T. K., Furnas, G. W., & Harshman R. A.
(1990). Indexing by latent semantic analysis.
Journal of the American Society for
Information Science. 41(6), 391-407.
Ericsson, Patricia Freitag and Haswell,
Richard (2006), eds. Machine Scoring of
Student Essays: Truth and Consequences,
Utah State UP, 2006
Glatt, Barbara S.; Haertel, Edward H. (Spr
1982) The use of the Cloze Testing
Procedure for detecting plagiarism. Journal
of Experimental Education, v50 n3 p127-36
Hartley, James; Trueman, Mark; Betts,
Lucy; Brodie, Lauren (Oct 2006) What price
presentation? The effects of typographic
variables on essay grades. Assessment &
Evaluation in Higher Education, v31 n5
p523-534
Hawkins, S. R. (1993). Ogden’s Basic
English as a lexical database for natural
language processing. Submitted in partial
fulfillment of the requirements for a degree
of Master of Science in the Department of
Computer Science, University of South
Carolina.
Hearst, M. (2000). The debate on automated
essay grading. IEEE Intelligent Systems,
IEEE CS Press. 15(5), 22-37.
Kakkonen, Tuomo; Myller, Niko; Sutinen,
Erkki; Timonen, Jari (2008). Comparison of
dimension reduction methods for automated
essay grading. Educational Technology &
Society, v11 n3 p275-288 2008
Kincaid, J. P.; Fishburne, R. P., Jr.; Rogers,
R. L.; and Chissom, B. S. (March, 1975);
Derivation of new readability formulas
(Automated Readability Index, Fog Count
and Flesch Reading Ease Formula) for Navy
enlisted personnel, Research Branch Report
8-75, Millington, TN: Naval Technical
Training, U. S. Naval Air Station, Memphis,
TN
Landauer, T.K., Laham, D., & Derr, M.
(2004). From paragraph to graph: Latent
semantic analysis for information
visualization. Proceedings of the National
Academy of Science, 101, 5214-5219.
Mole, R.A. (1994). English to any language:
conversational translator program.
EntenteTM.
Boulder, CO.
MY Access!® Efficacy Report September
2007, Vantage Learning. 1-12.
Page, E.B. (1994). New computer grading of
student prose, using modern concepts and
software. Journal of Experimental
Education, 62(2), 127-142
Rudner, L.M. & Liang, T. (2002).
Automated essay scoring using Bayes’
Theorem. The Journal of Technology,
Learning and Assessment, 1(2), 3-21
Shermis, M. D. & Burstein, J. (2003).
Automated Essay Scoring: A Cross
Disciplinary Perspective. Mahwah, NJ:
Lawrence Erlbaum Associates.
Shermis, M.D., Shneyderman, A. and Attali,
Y. (March, 2005). How important is content
in the ratings of essay assessments? Paper
78
Proceedings of The 4th International Multi-Conference on Society, Cybernetics and Informatics (IMSCI 2010)

presented at the annual meeting of the
National Council of Measurement in
Education. Montreal.
Shores, Michael and Weseley, Allyson J
(2007). When the A is for agreement:
factors that affect educators' evaluations of
student essays. Action in Teacher
Education, 29(3), 4-11.
Valenti, Salvatore, Neri, Burstein, J.,
Leacock, C., & Swartz, R. (2001).
Automated evaluation of essay and short
answers. In M. Danson (Ed.). Proceedings of
the Sixth International Computer Assisted
Assessment Conference. Loughborough
University, Loughborough, UK.
Valenti, Landauer, T.K., Laham, D., &
Foltz, P.W. (2003). Automatic essay
assessment. Assessment in Education:
Principles, Policy & Practice, 10(3), 295-
308.
Walvoord, Mark E.; Hoefnagels, Marielle
H.; Gaffin, Douglas D.; Chumchal, Matthew
M.; Long, David A. (Mar-Apr 2008). An
analysis of calibrated peer review (CPR) in a
science lecture classroom. Journal of
College Science Teaching, 37(4), 66-73
Warschauer, Mark & Paige Ware, Page
(2006) Automated writing evaluation:
defining the classroom research agenda
Language Learning Research, 10 (2), 1-24
79
Proceedings of The 4th International Multi-Conference on Society, Cybernetics and Informatics (IMSCI 2010)
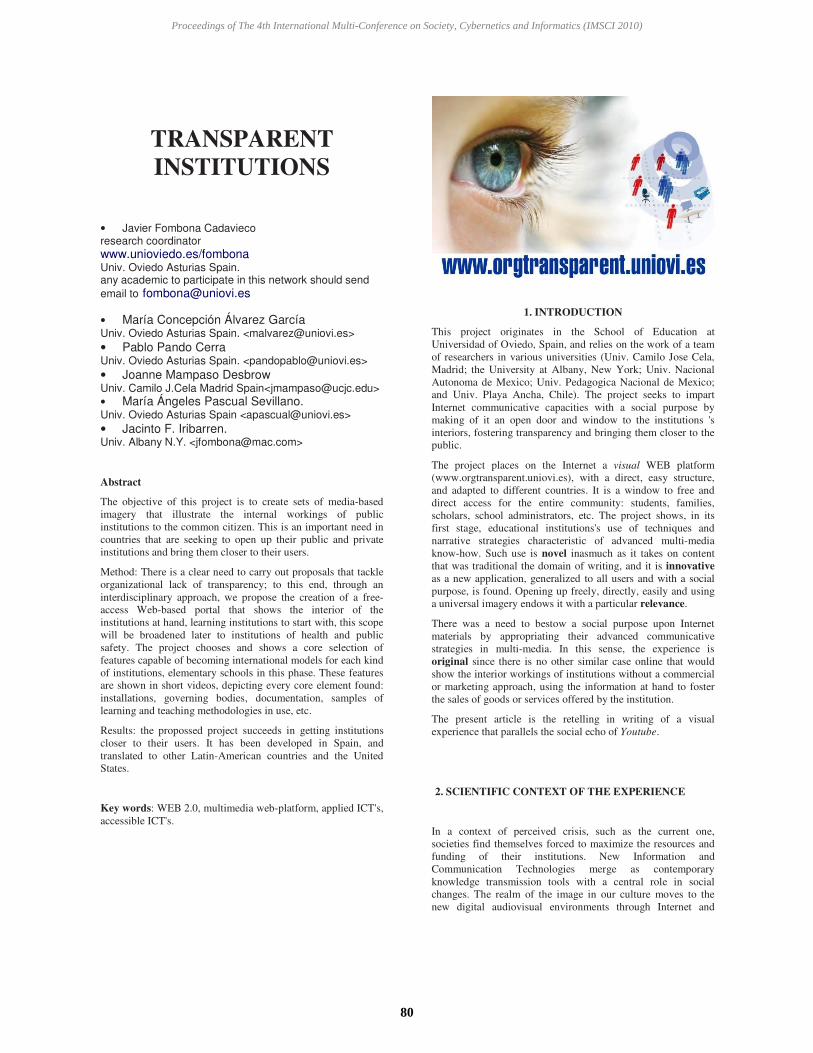
TRANSPARENT
INSTITUTIONS
• Javier Fombona Cadavieco research coordinator www.unioviedo.es/fombona Univ. Oviedo Asturias Spain. any academic to participate in this network should send email to [email protected]
• María Concepción Álvarez GarcíaUniv. Oviedo Asturias Spain. <[email protected]> • Pablo Pando Cerra Univ. Oviedo Asturias Spain. <[email protected]> • Joanne Mampaso Desbrow Univ. Camilo J.Cela Madrid Spain<[email protected]> • María Ángeles Pascual Sevillano.Univ. Oviedo Asturias Spain <[email protected]> • Jacinto F. Iribarren. Univ. Albany N.Y. <[email protected]>
Abstract
The objective of this project is to create sets of media-based
imagery that illustrate the internal workings of public
institutions to the common citizen. This is an important need in
countries that are seeking to open up their public and private
institutions and bring them closer to their users.
Method: There is a clear need to carry out proposals that tackle
organizational lack of transparency; to this end, through an
interdisciplinary approach, we propose the creation of a free-
access Web-based portal that shows the interior of the
institutions at hand, learning institutions to start with, this scope
will be broadened later to institutions of health and public
safety. The project chooses and shows a core selection of
features capable of becoming international models for each kind
of institutions, elementary schools in this phase. These features
are shown in short videos, depicting every core element found:
installations, governing bodies, documentation, samples of
learning and teaching methodologies in use, etc.
Results: the propossed project succeeds in getting institutions
closer to their users. It has been developed in Spain, and
translated to other Latin-American countries and the United
States.
Key words: WEB 2.0, multimedia web-platform, applied ICT's,
accessible ICT's.
1. INTRODUCTION
This project originates in the School of Education at
Universidad of Oviedo, Spain, and relies on the work of a team
of researchers in various universities (Univ. Camilo Jose Cela,
Madrid; the University at Albany, New York; Univ. Nacional
Autonoma de Mexico; Univ. Pedagogica Nacional de Mexico;
and Univ. Playa Ancha, Chile). The project seeks to impart
Internet communicative capacities with a social purpose by
making of it an open door and window to the institutions 's
interiors, fostering transparency and bringing them closer to the
public.
The project places on the Internet a visual WEB platform
(www.orgtransparent.uniovi.es), with a direct, easy structure,
and adapted to different countries. It is a window to free and
direct access for the entire community: students, families,
scholars, school administrators, etc. The project shows, in its
first stage, educational institutions's use of techniques and
narrative strategies characteristic of advanced multi-media
know-how. Such use is novel inasmuch as it takes on content
that was traditional the domain of writing, and it is innovative
as a new application, generalized to all users and with a social
purpose, is found. Opening up freely, directly, easily and using
a universal imagery endows it with a particular relevance.
There was a need to bestow a social purpose upon Internet
materials by appropriating their advanced communicative
strategies in multi-media. In this sense, the experience is
original since there is no other similar case online that would
show the interior workings of institutions without a commercial
or marketing approach, using the information at hand to foster
the sales of goods or services offered by the institution.
The present article is the retelling in writing of a visual
experience that parallels the social echo of Youtube.
2. SCIENTIFIC CONTEXT OF THE EXPERIENCE
In a context of perceived crisis, such as the current one,
societies find themselves forced to maximize the resources and
funding of their institutions. New Information and
Communication Technologies merge as contemporary
knowledge transmission tools with a central role in social
changes. The realm of the image in our culture moves to the
new digital audiovisual environments through Internet and
80
Proceedings of The 4th International Multi-Conference on Society, Cybernetics and Informatics (IMSCI 2010)

portable digital devices (mp3, iPhone, PDA's, etc.). We are
living in a society with a novel framework of knowledge
management, a society in the midst of a dynamic that redresses
educative and formative activity by redirecting both its
methodology and its contents (European Counsel, 2000).
According to Gernard and Klinger [1] this is a shifting scenario
where individuals interact, relate to each other and to the
environment's elements on a grid whose core material is real-
time data integration with a strong preeminence of iconic
information. We see a steady relinquishing of activities
characteristic of traditional education systems, i.e. reading,
traditional phone conversation, old television models [2]. The
society of knowledge affects teaching methodologies at all
levels, their contents, and even their own goals [3]. Educational
systems, in line with these trends, gather technology ideas and
include them in their methodologies and contents [4], but it is
not rare to reverse the process to the extent that the pedagogical
initiative designs and specifically generates innovative models
in knowledge management.
Cabero [5] differentiates two technological models: American
and European. Both approaches are used as reference in our
research (by implementing a Spanish platform and a second
version in English with evaluators in the United States).
Particularly in Europe, there is a new framework of mobility for
the individual, who faces changes in the social boundaries and
points of reference that were formerly physically set in
recognizable places. An ongoing international exchange of
people, workers and students, such as this, implies for the
institutions approved designs, and transparency in their facilities
with an attractive offer for a community that requires exact
knowledge of every organization's workings. University
systems must provide an answer to these new social demands,
and their centers, following organizational reference
approaches, must be able to ofer sharp cultural models in line
with such an environment and dynamic society [6]. This is
particularly the case when the education systems are required to
compete and adopt models of "quality" management [7],
mastery of the markets and attraction of a limited clientele, the
search for students to whom to offer new products and new
learning strategies. It becomes necessary to create a forum that
serves as reference to management models, and thus show
university environments capable of offering technology-based
helping tools that draw near learning institutions and the
citizenry.
The guidelines set up to make systems converge in the
European Higher Education Area indicate that we need to renew
the methodological tenets of education, directing its activities
towards the education of a student body able to interact
independently in the knowledge society we live in. In this
manner education practices reshape their priorities to stress the
value of non presencials activities. A society based on
knowledge, and with a high component of ICT's in its workings,
will encompass virtual communities and networks that allow for
the exchange of information and knowledge, will follow
audiovisual narrative techniques [8], and will make it possible
the active participation and cooperation by its citizenry in all
issues that impact them.
The research background for this project follows the guidelines
proposed in works by Rodriguez [9], Blasco and Perez [10],
Corominas [11], Echeverria [12] and Romero [13], on a Spanish
context; and, more centred on the definition and development of
strategies in new technologies, and the core of our specific
interest in this analysis, Anthony [14], Bloom and Walz [15]
and Caleb [16], among others at an international level. In the
field of web-design, for Web usability the project relies on
works by Nielsen [17], Rosenfeld and Morville [18], and
Norman [19]; and for the design of more functional generic
applets Burdman [20], Niederst [21], Dinucci [22], and Druin
[23], are established world-wide references.
On the field of audiovisual technology, the work of J. Cabero,
M. Gisbert, and Mª. C. Llorente (2007) are a reference for new
education technologies in technological environments and
teacher-training; P. Marques's work on technological activities
in Internet. Also a reference is the research published by
Sevillano M. L. [24]. within their work on I+D (2009).
3. FIRST APPROACH AND PROJECT GOALS
At the School of Education of the University of Oviedo, Spain
we found the need to satisfy the demand for training students
doing their annual internships in elementary schools. This
project was intended as a free- and open-access Internet-based
education support platform for learning the Spanish educational
system; but this idea turned out to be of interest for families, for
other institutions and other countries.
Through the project we found that the institutions and their
workings could be shown using WEB 2.0 audiovisual
techniques and strategies: namely through the showing of
narrative-effective short videos. Also, the project draws on
participants’ experiences and their daily use of computer and
information technologies, as well as access to successful social
networks like Facebook and Flickr. Thus the project benefits
from the citizenry's familiarity with new effective technologies,
as well as from the practical abilities and specific background of
participants in the use of graphic WEB sites.
For these reasons, the project's proposed goals are the design,
setup and assessment of an open WEB platform, with
organization, technique and strategies akin to that of the
audiovisual narrative of social communication media that will
work as a helping tool for showcasing the distinct elements that
make up an institution (educational in this first stage), and that
would work simultaneously as an international window and
frame of reference for the interior of such organizations.
The proposed goals are:
1. To select the main contrasting and meaningful features, keys
for the organization and development of a reference educative
institution at the Spanish Elementary Education level.
2. To carry out video tapings of the selected features’ visual
aspects. Posting those clips using effective narrative techniques
in audiovisual communication media.
3. To design, assess and publish a WEB-based platform in
which to post the pilot institution's video clips of its features, in
English and Spanish.
4. Using techniques and strategies of audiovisual knowledge
society extend the initiative towards the broadcasting of
organizational features of other institutions, to draw closer to
the citizenry, the educational institutions, their physical aspects,
their practices.
5. To publish the research results at national and international
academic, professional and technological publications.
81
Proceedings of The 4th International Multi-Conference on Society, Cybernetics and Informatics (IMSCI 2010)

This is an original project in the sense that currently there are
no multimedia websites in Internet that showcase educational
institutions. Also, by showing a model for implementing
multimedia ICT effectively, as do communication media and
users of virtual knowledge foray, it seeks to be relevant to the
research community. To this end, we research the tenets, the
techniques and strategies of ICT's, documenting distinctive
elements of an educational center (for Elementary Education in
Spain's pilot center) on short videos, edited with graphic inserts:
Installations, governance bodies, charter documentation, etc.
We find this project's publication to be relevant because it
addresses:
• The interest to promote a technological culture based on
techniques and strategies of social communication media and
virtual knowledge forums geared towards improving
educational tools and applications.
• The citizenry's need to know the potential of virtual
communication tools and their best applications in a
knowledge society.
• The opportunity to showcase institutions and transparent
models to a common and converging European Education
Area. Since it is a research on tangible features (capable of
being on video), we opt towards assessing the practice and
exercise of non-tangible features: reflection, conceptualization
and cognitive exercise characteristic of educational
environments.
It benefits to society since:
• The usefulness of the forecast results will be tangible in the
societal impact of the Web-platform, its level of content
enhancement, and the degree of user interaction.
• Its approach to free- and open-access audiovisual content will
foster the overcoming of barriers that, because of age,
background, geography or social status, various social groups
face, thus avoiding the appearance of marginal pockets --
digital gaps-- in the information society.
• The project seeks to offer solutions to concerns and
problems, and will benefit society through broadcasting and
knowledge of the real management and educational
methodology of transparent institutions. All aspects of the
Web platform design, application and assessment aims at it to
be useful and guiding for other activities supported by similar
virtual tools.
4. METHODOLOGY AND WORKPLAN
External assessment of the project: The project starts with the
research and selection of meaningful features that make up an
educational institution, in the pilot case an elementary School in
Asturias, Spain. The selected features for this case and for each
institution will be evaluated by researchers in different countries
to check for their applicability in their areas. The project seeks
to be a contrasting experience for different viewpoints, in
several universities, and an open and communicative experience
of the understandings and educational models of reference for
other academic fields, administrative bodies, and society itself.
Phases:
1st Design: Sampling selection, review and contrasting analysis
of typology, significant characteristics and tangible iconic
features of Elementary Educational institutions.
On the initial research population: Sample and institutions
chosen to select the features to showcase are representative of
the whole population. These contents describe a generic
institution and must be a representative sample of a set of
educational centers. To this end, the project relies on
researchers from diverse regions and countries: Asturias,
Catalonia, Andalucia, Aragon, Murcia, Madrid and Galicia, in
Spain, Mexico, Chile, Venezuela and the United States in the
Americas.
We use several data gathering and analysis techniques
according to the stated goals, from quantitative and qualitative
approaches: questionnaires, semi-structured interviews, focus
groups and fieldwork notes.
Finally, following the Delphi method for treatment and analysis
of the features, we perform a qualitative treatment through
successive analyses of content in the workplan index.
2nd Phase: production of video recordings. The selected
features will be taped in video clips and edited, these will gather
all important elements found in educational centers:
Installations, organizational bodies, documents, methodologies,
etc.
3rd Phase: Web-platform programming suitable for the
project requirements that will host the streaming video
documents. Web-based content will have the same formal and
narrative characteristics of other successful social networking
media: the videos will be of easy and convenient access, direct,
short and rich in graphical information. This phase includes the
try-outs, assessments and improvements of the Web-platform
that will be open to Internet users, and geared in particular to
the educational community itself, to researchers in different
disciplines, and to any individual interested in the main features
of a given educational institution.
The Web platform poses itself to be extensible to other
educational levels, and other institutions. Always under the
framework of a theme-based network, informative for society,
and innovative and rigorous for the international scientific
community.
5. CONCLUSIONS
The setup of this platform support non-presential and
autonomous educational processes. This implies an intervening
approach to offer the agents in charge of designing and
implementing such educational processes --schools,
administrative bodies, educational centers, etc.-- a window into
the events occurring in educational institutions, thus showcasing
a model, contributing to knowledge of reality, consensus
building, and to the standardizing of pedagogical practices.
On the other hand, the project is particularly relevant in
satisfying the universal need to bring closer institutions and
their users, under a framework of international collaboration
through diverse universities. This approach of assessment and
adaptation to distinct social realities affords the project with
external validity, scientific weight, and exactness in its results.
82
Proceedings of The 4th International Multi-Conference on Society, Cybernetics and Informatics (IMSCI 2010)

The impact the project currently has relies on the simplicity and
universality of its strategies: the use of audiovisual
communication to show the internal workings of institutions to
the citizen.
6. REFERENCES
[1] M. Gernard and W. Klinger. “Medienerzierhung in der
zukunft / Educacion en medios en el futuro”. Frankfut.
Media Perspectiven. 2007. 307
[2] OPA Europe. Tareas desatendidas consecuencia del uso de
Internet. Europe Data. 2007.
[3] J. Cabezas. “Modificaciones curriculares en matematicas
producidas introduccion de las nuevas tecnologías”. ICE.
Universidad de Extremadura. Badajoz. 2002.
[4] M. Pascual. Las tecnologias de la informacion y la
comunicacion en la intervencion socioeducativa. En
Sevillano Garcia, M. L.: Nuevas tecnologias aplicadas a la
educacion. Madrid: UNED. 2003. pp. 308-309.
[5] J. Cabero. (Coord.). “Tecnologia educativa” Madrid:
MacGraw-Hill. 2007.
[6] Q. Martin-Moreno Cerrillo. Organizacion y direccion de
centros educativos innovadores: el centro educativo versatil. Madrid: McGraw-Hill. 2006.
[7] S. Murgatroyd and M. Colin La gestion de la calidad total
en el centro docente. Madrid: Ramon Areces. 2002.
[8] J. Fombona. Lectura de imagenes y contenidos. Madrid. Ed.
CEP. 2008.
[9] Mª. L. Rodriguez. El valor economico de la orientacion
profesional. Galiemprego. Santiago de Compostela. 1999.
[10] P. Blasco and A. Perez, Orientacion e insercion
profesional. Competencias y entrenamiento para su
practica. Valencia: Nau Llibres. 2001.
[11] E. Corominas. “Competencias genericas en la formacion
universitaria”. Revista de Educacion, 325, 2001. pp. 299-
321.
[12] F. Etxeberria, Politicas educativas en la Union Europea.
Barcelona: Ariel. 2000.
[13] S. Romero. Orientacion para la transicion. De la escuela
a la vida activa. Barcelona: Laertes. 1999.
[14] K. Anthony. “Counselling in cyberspace”. Counselling, 11
(10), 2000. pp. 625-627.
[15] J. W. Bloom and G. R. Walz. (Eds.). Cybercounselling
and cyberlearning: strategies and resources for the millennium. Alexandria, VA: American Counselling
Association. 2000.
[16] R. Caleb, “Counselling by e-mail – making the link”.
Counselling, 11 (4), 2000. pp. 213-215.
[17] Nielsen. Web Design. Madrid: Prentice, 2000.
[18] Rosenfeld and Morville. Information Architecture for the
World Wide Web: Designing Large-scale Web Sites. U.K.,
O'Reilly, 1997.
[19] Norman. Psicologia de los objetos cotidianos. Madrid,
Nerea, 2001.
[20] Burdman. Collaborative Web Development: Strategies
and Best Practices for Web Teams. N.Y., Addison-Wesley
Pub Co, 1999.
[21] Niederst. Web Design in a Nutshell. N.Y., O'Reilly &
Associates, 2001.
[22] Dinucci. Adobe Master Class: Web Site Redesigns. San
Diego, Adobe Press, 2001.
[23] Druin. The Design of Children’s Technology. San
Francisco, Morgan Kaufmann, 1998.
[24] Sevillano, M, Ortega, J., Ballesta, F. Medina, A. Ricoy, M.
Diagnostico y desarrollo de competencias en el uso de
herramientas de comunicacion virtual para la sociedad del conocimiento a lo largo de la vida. Madrid: UNED.2009.
83
Proceedings of The 4th International Multi-Conference on Society, Cybernetics and Informatics (IMSCI 2010)
Variable Data Printing (VDP): New Applications of IT & Communications Technology
David GORE
School of Technology Studies, Eastern Michigan University Ypsilanti, Michigan 48197, USA
and
Marie LEE
School of Technology Studies, Eastern Michigan University Ypsilanti, Michigan 48197, USA
and
Kenny WASSUS
School of Technology Studies, Eastern Michigan University Ypsilanti, Michigan 48197, USA
ABSTRACT Information Technology, printing, and fulfillment industries are converging to create a new paradigm, variable data printing. The merging of databases and design allow for individualized output, complete with mail fulfillment, creating new roles for printers, and new collaborations in education. New technologies allow all parts of the printing process to be digital. This new format must be incorporated in the education of current and future students in this field. Information Technology, design, print and fulfillment will merge to lead us into a new age of image creation and delivery. Keywords: Variable Data Printing, Databases, Telecommunications, Digital Presses, Communication, Pedagogy, Fulfillment.
Introduction
Today, we are surrounded by a multi-level convergent media world where all modes of communication and information are continually reforming to adapt to the enduring demands of technologies, “changing the way we create, consume, learn and interact with each other (Jenkins).
Less than a decade ago the discussion of information technology, printing, and fulfillment industries would hardly have been in the same sentence, much less taught by the same person. However, technology has changed the world. Information technology databases, laser (digital) printing technology, and advertising/marketing/public relations mail services are becoming a part of the same technology classes. This convergence of technologies is known as variable data printing.
Convergence in this instance is defined as the interlinking of computing and other information technologies, media content and communication networks that have arisen as the result of the evolution and popularisation of the Internet as well as the activities, products and services that have emerged in the digital media space (Wikipedia).
Documents designed to be populated with data, and images from a database that also includes mail fulfillment, are rapidly becoming subject matter for the curriculum in many classrooms. The intent here is to show the interdisciplinary link between these different areas of education and how they fit together for the purpose of teaching variable data printing. Hewlett Packard has long been a leader in the production of copiers, scanners, printers and various other devices utilized in the reproduction of printed documents. In October of 2007, Hewlett Packard helped to usher in a new revolution in the printing industry. When they filed application number 11/932,659 for a patent for variable data printing (USPTO). According to Cope and Kalantzis,
The key difference between this technology and all preceding printing technologies is variability. Rapidly printed consecutive pages can be different from each other just as easily as they can be the same, and with no fluctuation in speed and printing functionality. The implications of this technology are revolutionary… In the case of fully variable, digital print:
84
Proceedings of The 4th International Multi-Conference on Society, Cybernetics and Informatics (IMSCI 2010)

• Every print is an original; • Economics of scale are flat • Niche markets can be viable as mass markets
and small cultures can thrive alongside large. In 1962, Thomas Kuhn wrote The Structure of Scientific Revolution, and fathered, defined, and popularized the concept of "paradigm shift" (p.10). Kuhn argues that scientific advancement is not evolutionary, but rather is a "series of peaceful interludes punctuated by intellectually violent revolutions," and in those revolutions "one conceptual world view is replaced by another."
This VDP Paradigm Shift is a change from one way of thinking to another; a revolution, a transformation, a sort of metamorphosis. This shift just does not happen, but rather is driven by agents of change. In this instance, the change agent is the teacher, not just of print media, but along with those teaching information technology, design, as well as other aspects associated with the complete process. Each area must embrace the knowledge base of the other, whether or not they are active participants in the delivery of that information. In other words, teachers must understand the broad ranging implications of technology in order to be optimally effective within their own domain, and to deliver their piece of instruction that makes up the whole. In order to move to a variable data platform, there are four key criteria that need to be taught. Unlike the traditional print program that focused solely on the mechanics of layout, design, and ink on paper, the new era of print requires an understanding of the interrelated areas of: • Information Technology (IT) • Document Design and Layout • Digital Production Printing • Fulfillment Information Technology
Use of XML requires only a basic understanding of the technology. This involves the ability to recognize a document or data file structure, express the structure as a simple DTD (document type definition), and then properly tag the document or data file (Barzelay, 2009,
September 2).
At the root of variable data printing lies a simple yet exceedingly scalable file format known as .XML. To the untrained eye, .XML is yet another markup language pertinent to web development in some way shape or form. However, in addition to being germane to web formatting, .XML has become a de facto standard in word processing and office productivity encoding. Albeit .XML isn’t as rich as Perl or Ruby in terms of functionality, it still provides a hierarchal and structured way of formulating a simple flat database into design applications to create personalized content. So now the question is, how exactly does such a scalable, flexible platform like .XML impact variable data printing? .XML is incorporated into applications such as InDesign which are built around open standards. Open standards empower third-party software developers to create applications that get rid of the flat, rudimentary print processes of yesteryear and replace them with multi-leveled personalized directly printed content. For example, in June of 2004 Reasons magazine published an issue that was a brilliant epitomization of variable data printing. Of the 40,000 June issues of Reasons sent out, each one was personalized per subscriber and had a satellite photo of each readers’ house on the cover. A feat like this doesn’t come easy and requires a degree of flexibility on the designer’s part and a savvy IT team formulating the .XML precisely. For example:
Data elements in XML are identified by start and end tags,which reflect the content of the element, for instance “<last_name>Smithers</last_name>”. An XML file of repeating data isessentially a set of records where the tagged elements occur in a set sequence (Barzelay, 2009, July 28).
85
Proceedings of The 4th International Multi-Conference on Society, Cybernetics and Informatics (IMSCI 2010)

<XML Document> <Page id=covermag> <mark id=”1”, x=”a”, y=”b”, w=”c”, h=”d”> <external-data=”http://magazine.com/house1.jpg”> </external-data> <mark id=”2”, x=”e”, y=”f”, w=”g”, h=”I”> <external-data=”http://magazine.com/customeraddress”> </external-data> <mark id=”3”, x=”j”, y=”k”, w=”l”, h=”m”> <external-data=”http://magazine.com/descriptioncustomer”> </external data> </mark> </Page id=”covermag>
Although this is an extremely elementary depiction of the work involved, it is a prime example of the flexibility and personalization provided by variable data printing and streaming content into design and directly into print. Document Design and Layout The design of documents today must have a degree of flexibility. This flexibility is quite easily obtained using a powerful page layout software program such as InDesign by Adobe. Through the use of styles in the style palette, the formatting of various elements of a page can be tailored to suit the mood of the document. The advantage to variable data printing is that multiple styles can be created for the same text placeholder. For example, the word ‘headline’ can be used to identify the location for the document headline. Styles can then be created that will establish as many different treatments to the text as needed. The example below shows a very casual style, a bold style, and a fancy style. The style is applied to each individual document by establishing a link, through the XML code, back to the database. This may be completed by the programmer or through a software link that makes the coding transparent to the user with a product like DesignMerge by Meadows Publishing Solutions. Figures 1 and 2 demonstrate the placeholder text and the resultant text in the linked documents.
Figure 1. The InDesign Style Palette showing the three separate headline styles: Casual, Bold and Fancy and the placeholder for the headline that has been tagged to work with the information in the database..
Figure 2. The result from applying the style to the placeholder for the tagged headline. Mail merge capabilities are not new. Word processing programs have incorporated this type of operation for many years. However, this has been limited in its scope to text only. The power behind variable data printing operations is that it extends to graphics as well. In the document, just as the text frame is identified, so is the graphics frame. Once identified, the specific graphic that populates the space at the time of imaging is determined by the link back to the database. This allows a specific picture or graphic to be associated with a particular individual or group, and then printed only onto the page, or pages, that are linked to that individual, or group, in the database. Figures 3 and 4 below illustrate the process.
86
Proceedings of The 4th International Multi-Conference on Society, Cybernetics and Informatics (IMSCI 2010)

Figure 3. The InDesign graphic frame is tagged by the software and identified as the location to place the .jpg image identified in the database.
Figure 4. The InDesign images of Washington DC (2590.jpg), Vancouver (2844.jpg), and Chicago
(2704.jpg) will appear in the graphic frame corresponding to person they are associated with. Digital Production Printing The digital print production process has undergone a drastic transformation over the past several years due to the advances in technology. In the simplest terms, digital printing is laser printing. However, it is accomplished with high quality, color, fast delivery and duplex output. In fact, the digital ‘presses’ of today rival offset printing presses in both volume and quality. In addition to speed and quality, many of the digital presses today include finishing and binding as part of the process. When these features are incorporated into a press, a finished document emerges. At this point, with the entire process being digital, it is conceivable to produce a one-of-a-kind document without incurring the traditional costs of production. In the same sense, variable content documents can be produced in way not feasible by any other traditional print process. A variable data press looks very similar to a traditional copy machine as seen below.
Figure 3. The Canon ImagePRESS (L) and the H P Indigo 7000 series (R) digital presses While the equipment may resemble a copy machine and it does, in fact, use toner as opposed to printing ink, that is where the similarity ends. The digital press contains a great deal of sophistication. The press has the ability to process the variable data that is streaming into it and, depending on the processor, can deliver finished pages at speeds of several thousand per hour. Finishing operations such as applying covers, binding, and trimming, may also be available depending on the size, quality, and options available for the particular press model. Fulfillment
87
Proceedings of The 4th International Multi-Conference on Society, Cybernetics and Informatics (IMSCI 2010)

Fulfillment has not traditionally been a concern of the printing company. Once a job was complete, it was merely boxed and delivered to the client or to a mail services provider. The printing company is now capable, thanks to variable data, to organize the database according to state, postal code, region, or whatever sorting is necessary for the post office to process the mailing of the documents most efficiently. Similarly, if the documents are not to be mailed individually, the database may be tailored to a distribution by company, divisions, or some other unit. The database can be made more sophisticated by the addition of supplemental units to add other variable data such as PostNet, United States Postal Service zip codes, Codebar, ISBN, Code-39, EAN-13, etc. This not only streamlines the printing process, but adds data that would ordinarily require time after the completion of the print step. While this creates a new function for the print shop, namely that of storage and delivery by sorted groups, this process is definitely offset by the increased volume of printed material that the print shop will be requested to provide based on the diversity of services. Conclusion The influence of IT on the print industry, and the ability of many people to recreate documents and images in their own home using a ‘printer’ (Cope and Kalantzis), has pushed the entire publishing process to be digital in format. Merging databases, using new design programs with the ability to format variable data, has created the ability to ‘publish’ where it was previously very cost prohibitive. As stated by Romano, The rise of digital-only print services by a generation of entrepreneurs is a phenomenon. Some are new services and some are spin-offs from existing businesses…There will be a growth in small digital printing businesses on a worldwide basis as copy shops upgrade, photo shops expand, and sign shops extend their offerings.
As the traditional, ink-based printing declines, digital printing will begin to dominate the industry (Romano), creating a host of new applications for published materials. These trends will also present opportunities for those who are able to harness the power of IT applications and pair it with creative design.
As print providers change their approach to the evolving business they must take into consideration that past processes must change. This evolution requires that they re-assess their infrastructure and add services such as document management, web access to document repositories, electronic document distribution, data mining, variable data printing, distributed printing, fulfillment, and kitting services. This
provides "one-stop shopping" for printing and related services. Print service providers must make these changes to assure their future success (Gilboa).
This new era of converged technologies is both exciting and uneasy. There are few who understand all of the pieces and, therefore, very few schools who are teaching students how to become a part of this emerging industry. It is clear that IT, design, print, and fulfillment have a new relationship that will lead us into the next age of image creation and delivery. As industry is changing and adapting to new technologies and new demands in the marketplace, so must education reach across disciplines to best prepare students for these new realities in the workplace. References
Barzelay, N. (2009, September 2). Data Processing Skills for VDP. The Digital Nirvana. [On-line] Available, http://thedigitalnirvana.com/category/variable-data-printing
Barzelay, N. (2009, July 28). XML Processing for
VDP. The Digital Nirvana. [On-line] Available,
http://thedigitalnirvana.com/category/variable-data-printing
Cope, B. and Kalantzis, D. (2001). New Ways With
Words: Print and eText Convergence. Print and Electronic Text Convergence. Common Ground Publishing.
Gilboa, R. (2002). The Production Digital Printing
Market: Opportunities and Trends. IS&T’s NIP 18: 2002 International Conference on Digital Printing Technologies.
Jenkins, H. (2006). Convergence Culture. New York
University Press, New York. Kuhn, T. S., (1962). The Structure of Scientific
Revolutions, Second Edition, Enlarged. The University of Chicago Press, Chicago, 1970.
Romano, F. (2009). Digital Printing 2020. Digital
Printing Report, Vol. 15, No. 6. United States Patent and Trademark Office. (2008).
United States Patent Application Publication (USPTO Publication No. US 2008/0155394 A1). Washington, DC; U.S. Government Printing Office.
Wikipedia. (n.d.) Retrieved October, 16, 2009, from
http://en.wikipedia.org/wiki/Technological_convergence.
88
Proceedings of The 4th International Multi-Conference on Society, Cybernetics and Informatics (IMSCI 2010)

“Moodle and Collaborative Learning in the ESL Classroom”
Cecilia Ikeguchi, Ph.D.
Tsukuba Gakuin University
ABSTRACT:
As computers have become
increasingly common in language
education, progressive teachers of ESL
have taken advantage of available
technology to promote student autonomy,
to promote culture and language and an
anytime-anywhere learning. (Mougalian
& Salazar, 2005). The Moodle,
considered one type of Course
Management System (Al-Jarf, 2005),
allows teachers to put their courses
online easily. Because of its ease in
usage, downloading, modifying and
distribution, the Moodle has also been
known to be teacher and student friendly.
This research aims to find answers to the
following questions. (1) What is the
pedagogical theory behind Moodle? (2)
What is the rationale behind this
electronic syllabus? (3) How does
Moodle promote collaborative work in
the classroom?
Moodle and ESL instruction
Computer assisted instruction
has been one of the most explosive areas
in applied linguistics especially in the last
two decades. Tremendous amount of
research on the application of technology
on language teaching and learning has
kept up with the rapid development in
computer hardware and software. Many
results were enthusiastic; but others were
skeptic.
In the ESL classroom on the
other hand, as computers have become
widely available to language teachers
since the 1980's (Chapelle, 2001),
progressive teachers of ESL have taken
advantage of available software
technology to promote student autonomy,
to promote culture and language and an
anytime-anywhere learning. (Mougalian
& Salazar, 2005).
Among the most recent
application of technology in language
instruction are the Course Management
Systems, also called CMS, and the
Virtual Learning Environments (VLE).
These allow teachers to transfer
documents and messages, and put their
course online.
What is the role of Moodle in
second language learning as well as in
the advancement of technology in
the classroom? This paper explores
moodle applications and implications.
This research aims to find answers to the
following questions. (1) What is moodle?
What are the pedagogical assumptions
89
Proceedings of The 4th International Multi-Conference on Society, Cybernetics and Informatics (IMSCI 2010)

behind the use of this electronic syllabus?
(2) What are the features and strengths of
moodle and its application? (3) How does
moodle promote collaborative work and
language learning in the classroom?
Moodle & its pedagogical
assumptions
Moodle, originally an acronym
for Object-oriented Dynamic Learning
Environment, has been considered as one
of the newest types of Course
Management Systems (Al-Jarf, 2005) that
allows teachers to put their courses online
easily. Because of its ease in usage,
downloading, modifying and distribution,
the Moodle has been known to be teacher
and student friendly. As an open source
software Moodle offers the following
advantages: it is efficient; it is low cost; it
is highly reliable, and it can be
customized. For details, refer to Joe Row,
2005.
Dougiamas, the original maker
of moodle, relates the concept of this
software to the principles of
constructivism. The notion of
constructivism asserts that people
actively construct new knowledge as they
interact with their environment.
Furthermore, he describes six concepts
or “faces of constructivism” that help
people understand the uses of this system,
two of which are relevant and will be
mentioned here: constructionism and
social constructivism. The principle of
constructionism maintains that learning is
effectively when the student creates or
constructs something for others.
Meanwhile, social constructivism refers
to the social world that surround a learner.
This includes people that directly affect
him: teachers, friends, students, as well
the larger community. It also asserts that
when students create something for
others, they are involved in a
collaborative endeavor.
Features and strengths of moodle
and its application?
This section explains the
features of Moodle environment that
support the conditions of L2 learning as
described below. Over the years, moodle
has evolved in a number of ways that
makes it more powerful for the teacher's
record-keeping, as well as its power to
engage the students for more interactive
exercises.
In the classroom, it is used to
give quizzes, check student
understanding of content or supply
information to other useful links and
resources. It includes several features
such as class schedule, class assignment,
participant profiles, chats, email lessons,
and even workshops (Mougalian &
Salazar, 2001).
In his article “Moodle Online
Classroom”, Weiskopf describes details
of moodle applications as a way of
90
Proceedings of The 4th International Multi-Conference on Society, Cybernetics and Informatics (IMSCI 2010)

creating online learning communities
and for supporting face-to-face learning.
Among the “powerful tools” described
in the essay are online exercises, digital
assignments, electronic journals and
online discussion through forums
module. Dialogues and chat rooms have
also been described as effective
learning tools that support in-class
instruction.
In a similar vein, Mougalian and
Salazar demonstrate actual moodle
classroom applications as follows.
Focusing on Moodle environment called
chats, forums, wikis, and workshops
Mougalian and Salazar assert that
workshops enable students to work
collaboratively.
“The workshops, which include
an adaptable rubric, allow students
to engage in peer feedback as
well as self-assessment”
M. & S. discuss how wikis,
forums, and chats serve as useful
platforms for brainstorming, discussions,
and debates. Chats in particular, seem to
be the favorite of students. Testimonies of
teachers using moodle indicate that the
chat module gives opportunities for shy
students to express themselves. Students
who find it hard to speak in front of the
class, post several quality articles on the
chat. Furthermore, on the teacher’s side,
there is a platform for creating and
delivering lessons, which the students can
access independently, or in groups. As a
result the platform encourages ways by
which students can connect with other
people and other useful information even
outside of the classroom.
In the following section, this
paper will describe the extent to which
Moodle encourages collaborative effort
between teacher and students, and among
students themselves through hands-on
online interaction.
In an online collaborative setting,
as the moddle, students are able to
explore and engage in hands-on activities,
and strengthen their understanding of
concepts and processes (Chapelle, 1998).
Moodle and cooperative work
in language learning
According to the constructivist
philosophy, “learning occurs as a
reflection of the experiences we construct
about the world around us.” An analysis
of the social constructivist philosophy
shows that while moodle in the classroom
allows for a student-centered
environment where learners are able to
work independently. It also allows
students to reflect on their own work and
on the work of other students by staying
connected to a group of learners who can
share ideas and reflect on each other’s
work (Dougiamas, 1998).
In a collaborative learning
91
Proceedings of The 4th International Multi-Conference on Society, Cybernetics and Informatics (IMSCI 2010)

situation, the students strengthen
understanding of the concepts learned in
class by engaging in several hands-on
activities and by and exploring through
online activities. Normandie (2001 ) calls
this a process of connecting students to
other peers, to the teacher, to a bigger
community of learners.
The following section of this
paper will demonstrate how moodle
principle relates to CALL learning and
communication. According to Chappelle
(1997), the primary goal of implementing
CALL into a language classroom is to
provide a communicative context and to
encourage social interaction among the
students. Multimedia CALL materials
can be constructed to support the
linguistic conditions Chapelle describes
below:
1. The linguistic
characteristics of target
language input need to be
made salient.
2. Learners should receive
help in comprehending
semantic and syntactic
aspects of linguistic input.
3. Learners need to have
opportunities to produce
target language output.
4. Learners need to notice
errors in their own output.
5. Learners need to correct their
linguistic output.
6. Learners need to engage in
target language interaction
whose structure can be
modified for negotiation of
meaning.
7. Learners should engage in
L2 tasks designed to
maximize opportunities
CONCLUSION:
This paper has described how the
theoretical assumptions behind the use
of moodle and how they relate to the
principles of language learning at a
distance. Furthermore, by analyzing
previous research on Moodle use in the
classroom, this paper supports the view
that this new type of course
management system opens vast
opportunities for the development of the
four language skills. Lastly and most
importantly this paper has
demonstrated how Moodle provides a
communicative context and how it
encourages social interaction in and
outside of the classroom .
REFERENCES:
C. Chapelle. Language Learning and
Technology. Vol. 2, No. 1, July 1998, pp.
22-34
C. Chapelle. Computer Applications in
Second Language Acquisition.
Cambridge University Press, 2001.
C. Mougalian, & Salazar, A. Moodle, the
92
Proceedings of The 4th International Multi-Conference on Society, Cybernetics and Informatics (IMSCI 2010)

electronic syllabus, lends itself to Pro Call.
CALLme. Retrieved, February, 2010.
M. Dougiamas, M. (1998). A Journey
into Constructivism. Retrieved January,
2010.
J. Rowe, 2005. Building Educational
websites with Moodle, CompuMentor.
Retrieved March, 2010.
S. Normandie. Global School: Online
Collaborations in the ECE Classroom.
Retrieved February 6, 2010.
93
Proceedings of The 4th International Multi-Conference on Society, Cybernetics and Informatics (IMSCI 2010)

foreign language learning process using wikis
Mr. Diego MIDEROS
Department of Liberal Arts
The University of The West Indies
St. Augustine, Trinidad
and
Dr. Nicole ROBERTS
Department of Liberal Arts,
The University of the West Indies
St. Augustine, Trinidad
ABSTRACT
This paper describes the experience of a qualitative case study in
which a WIKI was implemented as a strategy for independent and
interactive learning/practice of the receptive foreign language
skills of reading and listening. The main objective was to make an
in-depth exploration of students perceptions and responses to the
implementation paying particular attention to the influence that a
small percentage of the overall grade of the course could have had
in the students active, passive, or disengaged response to the
exercise. The study observed and analyzed the voices of a group
of Level II Spanish students of the Spanish Degree Program at the
University of the West Indies, St. Augustine Campus during the
first semester of the academic year 2009-2010. This paper serves
as a mode of reflection of the benefits and challenges that
technology in the form of WEB 2.0 carries in the learning process
of a foreign language, in this case Spanish, analyzing motivation
and students dis/engagement with their own learning process at
higher education.
Key words: wikis, perceptions of assessment, motivation,
autonomy, social learning.
1. INTRODUCTION
As Foreign Language (FL) teachers and avid users of technology,
we were already very aware of our use of technologies in the
classroom. However, we wanted to investigate the use of learning
networks in FL teaching and learning as well as to make better
use of learning networks in our classroom engagement. There can
be no doubt as to the high level of flexibility of time and place
which technology provides today and another great advantage in
the FL classroom was that students could work at developing
many and varied skills. Admittedly we were also interested in
addressing the rising interest and permanent contact that students
have with technology and making our Spanish course SPAN
2001/2 more interactive and creative.
As such we created a WIKI as a strategy for independent and
interactive learning/practice of the two receptive FL skills of
reading and listening. The wiki was created at wikispaces.com
using the code for the course SPAN 2001/2. We felt that the wiki
would possibly provide a space with which most students would be
familiar but in any case, it is a very simple online interface and as
such, a perfect tool for both collaboration and for the sharing of
ideas. Moreover we were certain that it would facilitate students
interaction with each other in an academic environment perceived
to be less rigid than the classroom; effectively to make students
collaborate and not perceive it as work. Students were invited to
join the wiki together with the other instructors of the course.
The study qualitatively observed and analyzed the voices of Level
II students of the Spanish Degree Program at the University of the
West Indies, St. Augustine Campus during the first semester of the
academic year 2009-2010 through reflection on their individual
postings. Of central importance to the analysis were the factors that
motivated students posting in a wiki designed to engage active,
independent learning/practice in a FL. The paper analyses the level
of success as perceived by students and moreover their use of the
wiki to enhance critical thinking rather than simply as an
information-processing space. The paper also reflects on the
benefits and challenges that technology in the form of WEB 2.0
carries in the learning process of a foreign language, in this case
Spanish, Finally, special attention is given to motivation and
students dis/engagement with their own learning process at higher
education.
2. REVIEW OF RELATED LITERATURE
Approaches to Foreign Language (FL) teaching and learning
Approaches and principles to FL teaching and learning are subject
to permanent reflection and study from scholars in the field of
Applied Linguistics and practitioners in FL education. They are
often revisited in the quest for best practices and a broader
understanding of the processes involved in teaching and learning a
foreign language. Historically both theories of language and
language learning have evolved resulting in different ways to
approach FL teaching and learning.
94
Proceedings of The 4th International Multi-Conference on Society, Cybernetics and Informatics (IMSCI 2010)

In their review of the major trends in language teaching Richards
and Rodgers (2001) [15
of them is the structural view in which language is conceived as
(20). The second is the functional view where language is
language as a vehicle for the realization of interpersonal relations
and for the performance of social transactions between
used most extensively is that presented by different
interpretations of the communicative approach. These
interpretations tend to incorporate a more interactive view to
language. Examples of this are cooperative language learning and
task-based language teaching. In both approaches the student s
primary role is that of being a member of a group who
collaborates with other group members.
Brown (2007) [3] explains the latest school of thought of
language teaching and learning in light of the multidisciplinary
approach of constructivism that integrates linguistic,
psychological and sociological paradigms. He highlights the
importance that the insight of Bakhtin has played in this view of
language as interaction. Hall (2006) [12] elaborates on Bakhtin s
guiding pedagogical strategies stating that i) language is a living
learning in social interaction rather than in the head of the
ideas of Vygotsky (1962) [19] who stresses the central role of
social interaction in learning.
WEB 2.0 Technologies
The notion of social interaction is not exclusive to the field of FL
teaching and learning. Vygotsky s [19] ideas have had a great
impact on the whole education system and other spheres where
interaction has become a key to bring people together and closer.
That is the case of technology and how it has evolved to develop
the complex social networks that we know today.
first phase, WEB 1.0, focused on presenting information. The
next phase, WEB 2.0 enables both presentati
(Rosen & Nelson, 2008) [16]. WEB 1.0 was more of a Read Web
in which users had access to large amounts of information; yet
they were unable to broadcast anything. While with WEB 2.0, a
Read-Write Web, users are given the opportunity to present
information and participate in its creation. Downes (2005) [7]
advocates that WEB 2.0, more than being a technological
revolution, is a social one. This new phase of internet is
considered by some a more democratic web (Williams, 2009)
[22]. WEB 2.0 has now given a voice to those who were obliged
to be passive recipients of the information that some few decided
to make public. This presents great advantages to the FL learner
as s/he can now access tons of information in the target language,
contact speakers and learners of the target language, and practice
not only receptive but also productive skills.
The interest in the role of technology in the FL learning process
has grown tremendously as a result of recent research on Second
Language Acquisition (SLA). Research on the latter has given
crucial importance to input and the exposure that learners need to
gain proficiency in the target language. As such, an increase in
contact with the target language has been suggested as a solution,
this could take the form of full immersion in the language through
study abroad (Blake, 12) [2]. This could serve to explain why some
SLA theorists argue that in many cases unsuccessful L2 instruction
is due to poor input in the foreign language (Cummings, 19) [5].
Technology has emerged as a way to solve the issue of insufficient
input as it facilitates student contact and interaction with the target
language.
SLA research on computer-Mediated Communication (CMC) has
learning
experience (Blake, 114) [2]. Adair-Hauck, Willingham-McLain
and Earnest-Youngs (1999) [1] reported that some students found
that technology-enhanced environments were positive and
beneficial as they allowed flexibility of the multimedia material
which contributed to their progress in the class, they also noted the
advantage of being able to spend more time on the activities they
found difficult. Green and Earnest-Youngs (2001) [11] found a less
positive response as students argued that some web pages were too
difficult and some of the activities were not sufficiently well-
experiences seem to be mostly positive as they appreciate the
flexibility of the materials, other students also think that it makes
learning less stressful as it reduces the anxiety of the face-to-face
experience.
A new type of learner
The current generation of learners now lives and has grown under
the influence of technology which obviously makes a difference if
compared with previous generations. This affects teaching
practices as a whole, as this new generation brings different
intellectual interests, skills and demands to the classroom setting.
Godwin-Jones reports that:
Language instructors in higher education are finding that the
current generation of students is coming to campus with quite
sophisticated technology skills and habits. Many are fully
conversant with and committed to communication through
social networking sites. They use on a regular basis a variety of
Internet-based services to manage much of their lives: to locate
and obtain resources, plan free time, maintain contact with
peers, access media, stay informed, and maybe even learn a
language. (2009, 3) [10]
Prensky (2001) [14] argues that this generation of students in the
United States has changed dramatically and as a result they are no
longer the students that the educational system was designed to
teach. He introduces the term Digital Natives as he sa
students today are all native speakers of the digital language of
Prensky makes reference to the American context, the term digital
native can also be extended to other contexts around the world
where youths have found in technology a good source of
networking, entertainment and information.
According to Entwistle and Entwistle (1991) [8], more than the
educational context where they are immersed, the way in which
students perceive the learning environment and assessment
influence how they learn. As a result of this finding, several studies
have been conducted seeking to identify students perception of
assessment and how their perceptions affect their learning
outcomes.
Empirical studies have been conducted to identify the relationship
between students perception of assessment, learning strategies and
achievement. Waterin, Gijbels, Dochy and Rijt (2008) [20]
indicate that students prefer traditional written assessment as well
as alternative assessment such as papers or projects, the reason for
95
Proceedings of The 4th International Multi-Conference on Society, Cybernetics and Informatics (IMSCI 2010)

this is that they are used to being traditionally assessed as
opposed to other kinds of assessment such as group discussions,
peer evaluations or oral presentations (655). In their attempt to
implement a constructivist learning environment in order to
change students perceptions of assessment demands and
approaches to learning and also foster critical thinking and
analysis instead of rote learning and the reproduction of factual
content, Gijbels, Segers, and Struyf (2008) [9] found that even
though students changed their perception on assessment demands,
they did not change their approach to learning, but they seemed to
have developed even more surface approaches to learning during
the course.
In their extended review of students perceptions about
assessment Struyven, Duchy and Janssens (2005) [18] found
three categories that explain how students approach learning and
assessment. Surface approaches to learning is the first category,
students view learning work as an external imposition and they
complete the learning task with a high level of disengagement
resulting in poor conceptualization. The opposite is the second
category, deep approaches to learning; the student seeks active
conceptual analysis rather than mere understanding. The last
category results from the social value given to assessment; some
students approach learning strategically in order to achieve the
highest possible grades by using well-organized study methods
and effective time-management, this category is known as
strategic or achieving approach to learning.
Motivation and assessment
The last approaches to learning presented by Struyven, Duchy
and Janssens (2005) [18], deep and strategic or achieving, lead to
the widely discussed topic in FL learning of motivation. Brown
(2007) [3] describes two types of motivation: intrinsic and
extrinsic motivation. The former refers to the learner who does
not require any kind of external stimuli to engage in the learning
process; intrinsic motivation could be related to the deep
approach to learning. The latter refers to the learner who is
constantly seeking external stimuli to engage in the learning
process, achieving high marks in an exam is a good example of
that kind of external stimuli; external motivation could be related
to strategic-achieving approach to learning as the student is
driven by the mark more than developing a deeper understanding
of a concept. Brown asserts that intrinsically motivated students
are, to a great extent, better language learners than extrinsically
motivated students. The literature that we have reviewed sought
to explain and support our study and its research design. In the
following section a broader picture of the methodology will be
presented.
3. RESEARCH DESIGN AND METHODOLOGY
Data Collection strategies
The present is a qualitative case study. As stated by Creswell
investigator explores a bounded system (a case
through detail, in-depth data collection involving multiple
sources of information 4]. As such we used
different sources of information to draw from seeking to explore,
understand, and interpret students reactions, responses and
feelings.
Throughout one academic semester of thirteen weeks data were
collected from different sources. What follows is a brief
description of those sources and the data retrieved:
Wiki: Accessing the free option of www.wikispaces.com (2009),
we created a wiki with the name of the course SPAN2001/2:
http://span2001-2.wikispaces.com/ [21]. We observed and
analyzed the students activity within the WIKI.
Survey 1: Conducted at the beginning of the semester this survey
contained eight open-ended items that explored students beliefs
and approaches of technology.
Survey 2: Conducted at the end of the semester, this survey
contained four open-ended items that interrogated students
perceptions and responses to the implementation of a WIKI as an
independent learning strategy.
Participants
A total of (N=59) students were registered for the course SPAN
2001, (N=56) completed it. (N=51) students took part in the wiki
exercise and completed the surveys. This was a diverse group
integrated by majors and minors as well as students who are
pursuing Spanish as an elective. The vast majority were females
(N=41). The ages of the participants ranged between 19 and 35.
Methodology
At the beginning of the academic semester, participants were
presented with the wiki that was created for the purposes of the
study. Students were given clear instructions as to how to register
for the wiki and how and where to make their postings. They also
received a timetable with the weekly material that they were
expected to post in the wiki. That is, one week they had to post one
video clip retrieved from www.youtube.com or any other website
from which video could be streamed, the following week
participants were expected to post a reading retrieved from any
site. Participants were given freedom of choice, the only
restrictions were music video clips or material with sensitive
content that could offend any of the other participants, and the
reading material had the only restriction of not being less than one
paragraph in length. All material had to be in Spanish.
Students were told that this exercise accounted for 10% of their
mark in the Reading and Listening components of course. Note
that the Spanish language course follows a skill-oriented approach
to teaching and every skill is assessed independently. In our
specific case each component of the course (reading, writing,
speaking, listening, and grammar) accounts for 20% of the overall
grade of the 100% continuous assessment process which is the sum
of each component. The wiki exercise accounted for 4% of the
overall grade of the course.
The triangulation process of the different data resources resulted in
the emerging themes that we will now present in the next section.
4. DATA ANALYSIS and DISCUSSION
From the different data sources we gathered that students displayed
very positive responses to the inclusion of technology in the form
of a Wiki as part of the Spanish course. In the first survey
conducted on September 12th students were asked the following
questions all related to the role of different media forms in their
lives and their preferences: (Note that the first survey did not
require students to write their names)
-What is the role that mass media plays in your life as a young
adult?
-What is/are your favorite(s) medium?
-Approximately how much time do you spend on a daily basis
using different media?
96
Proceedings of The 4th International Multi-Conference on Society, Cybernetics and Informatics (IMSCI 2010)

This first table shows clearly that this generation of learners we
have in our Spanish classroom find in mass media an important
source of information and entertainment that impacts
considerably their construction of reality. They also admit that
different media forms help them on a daily basis in their
academic lives as the following quotation illustrates:
Student 1
I like to
stay connected, I like to know what s happening in [the]
world and it helps me. It helps with my homework and
The second item of the survey explored students preferences in
terms of media. They have the option to choose more than one
medium. This item confirms the fact that we are dealing with
mostly digital natives (Prensky, 2001) [14] as the majority of
them N=48 chose internet as their favorite medium followed by
television N=39. These preferences could be understood in light
of Prensky s explanation of the kind of behaviors displayed by
before their text rather
than the opposite. They prefer random access (like hypertext).
They function best when networked. They thrive on instant
gratification and frequent rewards. They prefer games to
(2) Obviously our learners are more attracted by
images that demand less cognitive work than reading the press or
listening to the radio as these tasks force them to create mental
images that internet and television offer at faster speed rates. Like
student 2 (below), many felt:
very attractive and play a major role in my entertainment. TV
and internet are the most accessible so I use them more often
and the cinema also is my main means of recreation as it is
outdoors movie watching with other close friends with whom
This response describes the kind of interests that this generation
of learners seeks: attractiveness, entertainment, easy access and
socialization. These interests reinforce Prensky s [14] idea that
digital natives prefer less serious work as they have been
surrounded by several sources of entertainment and by the same
token they constantly surround themselves with those sources.
The positive attitudes that students display toward technology
were also evidenced in the reflective survey conducted at the end
of the semester on November 28th. Students were asked to reflect
on the process and to express how they perceived the
implementation and their contributions to the wiki. Generally
students commended the implementation of the wiki as part of the
language program. Some exceptions did occur. Prensky (2001)
[14] calls them digital immigrants as the following example
illustrates:
Ria, 28
and to find sites in Spanish that dealt with the issues I wanted
my classmates to think about, hence me sending an email for
two articles and then posting them as videos instead of lecturas
[readings]. However once I overcame these hurdles, got
assistance from my classmates, the task was more enjoyable. I
Students such as Ria sought and got technological help from their
classmates and were then able to navigate the wiki quite
successfully. Overall, by the end of the course, students expressed
a general sense of satisfaction with the use of the wiki and with
their own performance.
Allison, 20
students with another outlet to share their ideas and opinions
on a wide range of topics. In addition the fact that we had the
choice of choosing whatever topic we pleased was great as
everyone had their own interests which they wanted to share
with others. I think that the inclusion of activities like this
really does enhance the language degree programme because
students are not only learning in the class but also additionally
learning by participating in this forum. It enhances your
listening skills through recomm ending videos and moreover
your reading skills, grammar and vocabulary through the
reading. It [has] really opens[ed] up your mind to think and
reflect
This kind of response reinforces the ideas of social constructivism
and the interactional view of language as it demonstrates that
students enjoy the idea of interacting and exchanging their ideas
and opinions with others. Allison s voice also brought up a
perception shared by other students in terms of the benefits that
activities like this bring to their language learning process and the
development of different competencies that are of great importance
in this process such as acquiring more vocabulary, revising
different grammar structures in scenarios different from the
classroom and without the instruction of a teacher.
Despite the fact that the general perception of the implementation
was positive, some participants expressed their dissatisfaction with
the level of participation and interaction of other students and users
of the forum:
Carolina, 30
interaction among all participants of the forum. Therefore it
would tr
This opinion was also expressed by one of the course
representatives in the Student-Staff Liaison Committee meeting
held on October 29th. He stated that students should post more
comments on what their peers originally posted in the wiki as
that was the aim of the activity.
97
Proceedings of The 4th International Multi-Conference on Society, Cybernetics and Informatics (IMSCI 2010)

In the second survey conducted, we interrogated students on the
specific factors that motivated them to participate in the wiki.
Using a semi-directed item students had to respond to the
Which of the following factors would you say
influenced your choices of material
options given: a) my personal interests, b) the main topics of the
course: education and culture, c) I wanted to impress my
lecturers, d) I wanted to make my audience reflect, e) I did it just
because it accounts for 10% of the grade in reading and listening,
f) by chance, g) a combination of some/all the above, h) other/s
(See results in graph 3.0). From these options students could
choose more than one and subsequently elaborate in a short
paragraph that they could write either in Spanish or English.
In this survey completed by N=51 the main characteristic of
students responses was their rhetoric language and a deep sense
of fulfillment with the completion of the task. The majority of the
group expressed that they had made their recommendations as a
result of their personal interests N=45 and also because they
wanted to make their audience reflect on various issues that affect
the global community N=38. N=23 stated that the main topics of
the course, education and culture, influenced their choices as in
many instances they were uncertain of what to post. Only N=21
expressed openly that they completed the task just because it
accounted for 10% of the grade in the reading and listening
components.
To a great extent we believe that the kind of responses received
were influenced by the fact that students felt assessed by the
survey and they wanted to make a good impression on the
lecturers. However, the reality of what students thoughtfully
responded in a very rhetoric language contrasts with what we
found in the next theme.
While cramming is never a good idea, especially at the university
level, the data in this study clearly reveal a seemingly
contradictory positioning among students. Students weekly
postings in weeks eleven and twelve rose considerably (from a
weekly average of thirty postings in weeks one through ten to
almost one hundred postings in week eleven and some three
hundred and thirty seven postings in week twelve, the final week
of semester). This demonstrates a reliance on cramming resulting
in very limited participation (views as well as commentary by
other students) and moreover in poor long-term retention of the
topics and the language used. As such, the students initial
suggestion that they had an interest in raising awareness and
consciousness among other student colleagues seems belied by
the evidence of the crammed postings simply to meet the course
deadline.
Sommer [17] argues that some students organize themselves
efficiently into a system based on limited time (at the UWI, a
twelve-week semester system) and the need to excel (if not simply
-of-
among a host of other aspects, so as to ensure their academic
survival (5-10).
For some students it was clear from the start that they were
participating in the wiki simply for the perceived grade it would
afford them:
Dex, 20
such, the fact that the wiki posts contribute to 10% of our
Reading and Listening grades motivated me to upload as many
videos and lecturas [readings] as I possibly could. At the end
of the day, knowing that you are getting marked for doing
This is a clear sign of what Struyven, Duchy and Janssens (2005)
[18] noted as a surface approach to learning that seems to be a
trend among the participants of our study. It is evident that they
approached the task as an imposition that they had to complete
with the levels of disengagement that their behavior throughout the
semester showed in Graph 4.0. In terms of motivation this group of
students displayed a high level of extrinsic motivation (Brown,
2007) [3
Unfortunately, the removal of extrinsic factors in a formal
education setting makes it difficult to encourage students to take
more deep approaches to learning (Struyven, Duchy & Janssens,
2005) [18] that will result in intrinsically motivated behaviors and
self-determination (Deci, 1975) [6]. Among other students there
was evidence of lesser habits in cramming as the following
quotation shows:
Maria, 27
other interests in music and art but it was difficult to locate
educational or sensible material, perhaps because I
procrastinated in doing the assignment and tried to do it too
The contradiction between the students perception on their
participation on the wiki and their actual participation recorded in
the wiki suggest that the students approach to using the wiki SPAN
2001/2 did not encourage active critical thinking because although
there was some observation and reading of the various postings,
there was limited evaluation and interpretation of the material/s
posted by others. In terms of the self-posted material, because so
98
Proceedings of The 4th International Multi-Conference on Society, Cybernetics and Informatics (IMSCI 2010)

much was crammed into the final two week period of the course,
this aptly demonstrates a lack of reflective practices because
although students may have read their articles or viewed the
videos, they had no turn-around time in which to make active
evaluations of the material/s posted. However, it is clear from
overwhelming student comments that many of them felt that they
had made an overall improvement in Spanish. Their use of
cramming as a study technique/habit is now so fossilized that
many seem convinced of their improvement despite their
cramming:
Samantha, 19
Yo recomiendo undoubtedly
strengthened my competence of the Spanish language while
enabling me to become aware of prominent issues of the
5. CLOSING REMARKS
In this paper we have described the experience of implementing a
wiki as a strategy in the quest for more independent and
autonomous approaches to the learning/practice of a FL in higher
education. Three main themes emerged from our data. The first
confirms what other studies have indicated, that is, that this
generation of learners, the so-called digital natives, are very
conversant with technology as a result of the exposure they have
had throughout their lives with different manifestations of
technology (Godwin-Jones, 2009) [10]. In our study this
translated into a positive response to the inclusion of technology
as part of our language program this also confirms Adair-Hauck,
Willingham-McLain and Earnest-Youngs (1999) [1] finding that
Such inclusion allows great levels of autonomous exposure and
input as suggested by SLA research by means of CMC. Students
perceived that the wiki promoted a sense of satisfaction because
their reading increased, they were listening to more Spanish
outside of the classroom and that they were exploring new ideas
and topics as well as sharing their thoughts and concerns with
each other, thus increasing their academic and personal
development.
The second theme showed that students perceived their own
participation as satisfactory and argued very interesting reasons to
support the choice of material they posted on the wiki. The third
theme presented a contradiction between the students perception
of their own participation and contributions to the wiki, and the
records of actual participation. This contradiction shows that this
group of students is mainly driven by external motivations that
guide their actions leaving very little room for reflective practice
and reflective learning (Struyven, Duchy and Janssens, 2005)
[18]. Factors such as time management, learning strategies, and
beliefs about language learning and education can be questioned
in this case as students approach to a very simple task that sought
freedom of choice and independent practice, was simply
cramming. It is ironic that students comprehensively embrace the
new approaches to learning but they compromise themselves by
holding on to the old study habit of cramming so as to achieve a
good grade (Gijbels, Segers and Struyf, 2008) [9]. As FL
educators we are left to wonder if this is the approach that they
assume for every learning task and if that is the case, then why.
6. REFERENCES
[1] B. Adair-Hauck, L. Willingham-McLain and B Earnest-
Evaluating the integration of technology and second
language learning. CALICO Journal 17, no. 2 (1999): 269-306.
[2] J. Robert Blake, Brave New Digital Classroom: Technology
and Foreign Language Learning. Washington D.C.: Georgetown
University Press, 2008.
[3] H. D. Brown, Principles of Language Learning and
Teaching, New York: Longman Inc., 2007.
[4] J. C. Creswell, Qualitative Inquiry and Research Design.
Choosing Among five Approaches (2nd Ed.) California: SAGE
Publications INC., 2007.
[5] J. Cummins, E-Lective language learning: Design of a
computer-assisted text-based ESL/EFL learning system. TESOL
Journal 7, no. 3 (1998): 18-21.
[6] E. Deci, Intrinsic motivation, New York: Plenum Press, 1975.
[7] S. Downes, (17 de October de 2005). -
Retrieved on December 29, 2009, from www.elearnmag.org:
http://www.elearnmag.org/subpage.cfm?article=29-
1§ion=articles
[8] N.J.
understanding for degree examinations: the student experience and
Higher Education, 22, 1991, pp. 205-227.
[9] D. Gijbels, M. Segers, & E. Struyf, Constructivist learning
environments and the (im)possibility to change students'
perceptions of assessment demands and approaches to learning.
Instructional science , 36(5-6), 2008, pp. 431-443.
[10] R. Godwin-
Language Learning and Technology, 13(2)
2009, pp 3-9.
[11] A. Green, and B. Earnest-Youngs. Using the web in
elementary French and German courses: Quantitative and
qualitative study results. CALICO Journal 19, no. 1 (2001): 89-
123.
[12] G.V. Joan Kelly Hall, Dialogue with Bakhtin on Second and
Foreign Language Learning: New Perspectives . New Jersey:
Lawrence Erlbaum Associates, 2005.
[13] B. H. Kniveton, Student perceptions of assessment methods.
Assessment and Evaluation in Higher Education , 21(3), 1996,
pp. 229-237.
[14 On the
horizon, 9(5), 2001, pp 1-6.
[15] J.C. Richards & T.S. Rodgers, Approaches and Methods in
Language Teaching. New York: Cambridge University Press,
2001.
[1 Web 2.0: A New Generation of
Learners and Education. Computers in the Schools , 25 (3 & 4),
2008, pp. 211-225.
[17
Journal of American College Health
39(1), 1990, pp. 5-10.
[18] K. St perception
Assessment & Evaluation in Higher Education, 30(4) 2005, pp.
325-341.
[19] L. Vygotsky, Thought and Language . Cambridge : MIT
Press, 1962.
[20
assessment preferences, perceptions of assessment and their
The International Journal of
Higher Education and Educational Planning , 56 (6), 2008, pp.
645-658.
[21] wikispaces.com. Obtained from www.wikispaces.com, 2009.
[22
International Journal of Technology
& Design Education, 19 (3), 2009, pp. 237-254.
99
Proceedings of The 4th International Multi-Conference on Society, Cybernetics and Informatics (IMSCI 2010)

Developing Intercultural Competence and
Foreign Language Skills with Web-based Tools
Elena SELEZNEVA
Padnos International Center, Grand Valley State University
Allendale, Michigan 49401, USA
and
Alberto VEIGA
Modern Languages and Literatures Department
Grand Valley State University
Allendale, Michigan 49401, USA
ABSTRACT
Contemporary societies, increasingly complex
and diverse, are demanding citizens and
workers able to successfully integrate and
operate with and within other cultures. This is
particularly important in the field of health care.
To address this need, college instructors may
present assignments/tasks that help develop
students´ intercultural competence (IC) by
enhancing their knowledge, skills and attitudes.
Preliminary results show that in addition to
providing authentic language and cultural
content, the use of web-based tools in a Spanish
for Health Care course helps develop IC by
promoting understanding of original documents
of a foreign culture (savoir-comprendre) and
sensitivity towards others and own´s culture
(savoir-être).Keywords: Intercultural competence, CMC
tools, Spanish for Health care, Hispanics and
health care, foreign language skills,
instructional technology
INTRODUCTION
Internet and Computer Mediated
Communication tools have emerged as a
versatile platform for language and culture
learning instruction. This trend is the reflection
of a shift in the pedagogical focus from
language proficiency to a broader notion of
communicative competence that has taken place
since the early 1990s. The change “expands the
focus beyond language learning to an emphasis
on culture (i.e. intercultural competence, culture
learning, cultural literacy) […] it expands the
notion of context beyond the social to include
broad social discourses. Third, it problematizes
the notions of its own inquiry, namely,
communication and intercultural competence”
[8].
O´Dowd has noted an increasing demand for
“intercultural approaches […] which attempt to
fully exploit the interactive features of
information and communication technologies in
order to provide rich opportunities […] for
intercultural acquisition and development” [11].
Both comments indicate that this cultural
change that has taken place in the field with the
help of web-based learning tools is suited for
the delivery and development of cultural and
cross-cultural content. This is one of the
consequences of the emerging need of qualified
workers in areas such as health care, business,
criminal justice and education. As a result,
colleges and universities are expanding their
course offerings or complementing the existing
ones with instructional practices that address
this demand from society.
Defining and assessing IC is a difficult task
considering of all the aspects that have been
identified around this concept. In American
academia and for a general audience, IC refers
to the individual knowledge, skills, attitudes,
attributes and behaviors needed to interact
successfully with people from different cultures
[6], or following Janet Bennett, IC constitutes
100
Proceedings of The 4th International Multi-Conference on Society, Cybernetics and Informatics (IMSCI 2010)

“a set of cognitive, affective, and behavioral
skills and characteristics that support effective
and appropriate interaction in a variety of
cultural context” [2]. For our research in health
care, we understand IC as the ability to deliver
“effective, understandable, and respectful care
that is provided in a manner compatible with
[patient’s] cultural beliefs and practices and
preferred language” [5]. This means that one of
the keys to providing quality care to patients
and family members of a Hispanic cultural
background depends on the providers´
acquisition and development of the elements
identified above from the core of Hispanic
cultures.
This cultural awareness demands, among other
features, an understanding of the patient’s
perspectives and sensitivity in issues related to
health care. A note of caution against
generalizations is that not all subjects from the
same cultural background hold similar belief
and values systems [4]. Therefore, intercultural
competence, though consisting of several
critical elements, constitutes a process “in
which the healthcare provider continuously
strives to achieve the ability to effectively work
within the cultural context of an individual or
community from a diverse cultural/ethnic
background” [4].
In practical terms, the absence of this set of
features in health care providers, may translate
in the presence of prejudice in this professional
field. The American Institutes for Research
have already stated: “social issues such as
stereotyping, institutionalized racism, and
dominant group privilege are as real in the
examining room as they are in society at large.
Therefore, the goal of cultural competence
training in health care should be to guide
physicians in bringing these power imbalances
into check” [1]. Then, in order to guide health
care workers efficiently in their encounters with
patients of Hispanic background and to improve
the quality of communication and the
relationship between patient and provider, it is
necessary that health care workers develop and
enhance their IC. Considering this idea, we
emphasize to our students that cultural
knowledge and IC need to be used as a starting
point in their relationship with individuals from
specific cultural groups, and that the connection
derived from their interactions will complement
and help establish the frame for their individual
care needs.
From the different elements of IC proposed by
Byram [3], adapted by Sercu [13] for an
educational framework, and that Deardorff [6]
recently compiled, we focused our research in
the assessment of skills and attitudes, in
particular the categories that fall under the
domains of savoir-comprendre and savoir-être
[3]. The former is defined as “the ability to
interpret a document or event from another
culture, to explain it and relate it to documents
or events from one’s own [3]. The second is
defined as “curiosity and openness, readiness to
suspend disbelief about other cultures and belief
about one’s own” [3].
DESCRIPTION
Our investigation was conducted in a Spanish
for the Health Profession undergraduate college
course. We implemented the use of Computer
Mediated Communication (CMC) tools such a
discussion board, and a blog to perform web-
based tasks. In particular, students were asked
to read on-line newspaper articles in Spanish,
and write and read blog postings related to
health care topics in Spanish that tailored the
course content with IC goals in mind. These
web-based tools were selected as valuable and
accessible sources of information for students
since they provide authentic language practice
and offer a platform for intercultural exchange
and learning. In addition, blogs are engaging
and interactive by nature, and they also offer
the possibility of negotiating intercultural
communication in an on-line environment. This
may make the experience more efficient for
teaching practices compared to traditional
classroom means [7]. Another positive aspect of
on-line controlled, mediated tools is that they
are not divorced from the rest of the culture
since participants apply conventions derived
from other forms of cultural interactions [7]. In
101
Proceedings of The 4th International Multi-Conference on Society, Cybernetics and Informatics (IMSCI 2010)

this way, with on-line communication in
educational contexts, students model their
participation in similar ways to forums open to
the general public and shown by Kramsch and
Thorne [10]. In this sense: “successful
intercultural internet discussion depends not on
participants progressing towards a common
goal but rather on their capacity to shift among
a variety of positions, even contradictory ones”
[7]. This emphasizes the fact IC acquisition is a
process where subjects exposed to specific
instruction and learning (such as Spanish for
health care) are susceptible of alternating
positions in regards to the situations and events
presented to them and the tools available may
help this process. We also pose that blogs help
to accomplish the established goals based on
our previous research [12]. For all of these
reasons, we decided to assess the efficiency for
helping acquire and develop IC of the proposed
web-based activities.
RESEARCH QUESTIONS
1. Can we help develop students´ ability to
interpret a document or event from another
culture, explain it and relate it to documents or
events from their own culture?
2. Can we enhance students´ curiosity, openness
and respect for other cultures, while changing
their perceptions (whenever appropriate)
without impacting negatively on the legitimacy
of their own cultures?
3. What is the role that technology, such as
web-based tools, can have in the development
of students´ IC in the field of health care?
METHODS AND PROCEDURE
Participants
This is a third year, undergraduate level,
university course: Spanish for the Health
Professions that aims to equip students with
enhanced foreign language skills (verbal and
non verbal communication), and help them
develop their intercultural competence
appropriate for this level of language and
content instruction. More specifically, students
are required, among other aspects, to: learn
vocabulary related to the health field; learn,
understand and identify differences among the
Hispanic cultures in issues related to health
care; be able to contrast and compare topics
with their own culture and familiarize
themselves with on-line sources of information
(newspapers in Spanish) that produce content to
a mainstream audience.
There were a total of 20 students in this course,
native speakers of English: 18 females and 2
males, ranging from 18-46 years old (mean
22.35). A significant number of students (12)
had visited or stayed in a Hispanic country for
lengths of one week to four months.
Materials
Information was gathered through the review of
two sources: on-line newspaper articles
presented through a discussion board and blog
postings, and a questionnaire. The articles were
selected from the health sections of online
newspapers “El País” and “El Mundo”
(www.elpais.es and www.elmundo.com), and
were part of students´ coursework. The
instructor made them available to the class
through the discussion board of a Learning
Management System (Blackboard). For each
article students had to read and understand the
content, produce a list of new words, a
summary with the main ideas and a personal
reaction/opinion using a worksheet (between
16-20 lines in Spanish). The topics were
diverse: changes in Spain´s laws related to
smoking in public places, a comparison
between approaches to the interruption of
pregnancy laws and its results in various
European countries, the potential use of
genetically altered newborns to save family
members from genetic diseases, new research
on the remains of emperor Tutankhamun that
point to research of genetic conditions. Topics
were discussed in class so that students could
share their views orally and take notes from
peers. The instructor offered feedback in
written format to individual learners as they
progressed with their work. This task intended
to prepare students for the next set of activities.
Around midterm, students were asked to
perform the same task in groups of two and
instructed to select an on-line article in Spanish
102
Proceedings of The 4th International Multi-Conference on Society, Cybernetics and Informatics (IMSCI 2010)

and make it available to the rest of the class
through the Blog tool in Blackboard. They were
asked to post a summary and personal/reaction
opinion on the selected topic (16-20 lines in
Spanish). All students had access to peers´
group postings with summaries and reactions.
Then, each student was required to write in the
blog two personal reactions/opinions based on
their peers´ postings (6-8 lines each in Spanish).
Some of the topics that students selected were:
the relation between obesity and depression, the
interaction between cannabis and alcohol,
obesity and malnutrition, cancer and pregnancy,
attempts to reducing the rate of infant mortality,
or the use of thalidomide (a sedative) in Spain
during Franco´s dictatorship. Finally, at the end
of the semester, students were offered a
questionnaire to collect information with
multiple choice questions and open-ended
questions. As the results from the questionnaire
of a 46 years old participant did not deviate
significantly from the results of others, we
made the decision to keep these in the research.
RESULTS
Our first research question is based on one of
the elements that integrate the savoir-comprendre domain: the students´ ability to
work (read, understand, summarize, and react to
topics) with on-line newspaper articles in
Spanish. Although 65% of students stated that
they could read and understand texts in Spanish
from the course textbook better than from the
on-line sources, 95% of them said that they also
were able to read and understand on-line
newspaper articles. One of the reasons that may
explain this apparent contradiction has to do
with the type of discourse students were
exposed from these two sources. Texts from the
health care textbook used were simple
brochures were the narrative was dominated by
bullet points and simple sentence structure,
whereas newspaper articles tend to be more
literary and follow an information
presentational mode. In addition, almost all of
the students said that they were able to
understand peers´ blog postings (95%), they felt
they could write a summary of a newspaper
article in Spanish (100%), and they are able to
comment in writing on peers´ postings (100%).
Finally, 90% of students stated they had read
their peers´ postings and that they have learned
through them about the Hispanic cultures. In
their quotes from the questionnaires and the
blog reactions, they referred to this as well: “I
was able to follow up on general topics
discussed in class”, “I learned more information
about current events”, “I learned about cultural
differences in family involvement”, “I learned
about cultural topics that were not brought up in
class”, “I learned about the interaction between
culture and people”. Some quotes from blog
reactions illustrate this aspect (translations have
been prepared by researchers): “In this article,
the scientist is from Spain and it is very
interesting because the problem with AIDS
exists everywhere, not only in the USA”;
“Before reading this newspaper article, I did not
think about the relation between depression and
obesity”.
Our second research question belongs to the
realm of subjectivity since we rely on students´
perceptions about their own attitudes toward
other cultures and their own culture. First we
tried to establish their departing point when
addressing this element of IC. Students were
asked about their curiosity, openness about
other cultures (90% of strong positive answers).
However, only 60% of them want to read more
about the health topics selected. They were
asked as well whether they felt closer to people
from their own culture (40% agree, 30%
disagree): “I think it is natural to feel
comfortable around like-minded people, I think
it is just an unconscious reaction”. We asked if
they looked for opportunities to interact with
people from other cultures (65% of positive
answers). Finally, they stated that they felt
comfortable establishing relations with people
from other cultures (85% positive answers):
“Yes, if they have interest in English”. We also
asked students if they felt people from other
cultures could teach them something of value
(100% of positive answers): “It is important to
have a multicultural point of view”. It seems
that students have a high regard and respect for
other cultures, and that they value and
103
Proceedings of The 4th International Multi-Conference on Society, Cybernetics and Informatics (IMSCI 2010)
recognize their legitimacy. However, several
factors influence these responses, from
individual (social shyness), to group/societal
(not having the opportunity to interact with
people from other cultures since communities
may be very homogeneous).
In relation to this aspect, we also wanted to
assess the impact of the on-line articles and
blog postings that they read as part of the
course assignments on their perception of other
cultures. Students indicated in the questionnaire
that after completing these tasks they had
changed their perceptions about Hispanic
cultures (80%). Some quotes from students are:
“I understand better how Hispanics relate to
health care”, “I am less judgmental”, “We have
learned a lot of cultural qualities and they
proved to be true when reflected on the
professor”, “No, I have always seen it as a
fascinating culture”. These comments show that
as a whole, students strengthened their
impressions in a positive way. They also stated
that they have changed their perception about
their own culture (90%): “It allowed me to see
similarities and differences”, “Understood that
we expect and take many things for granted”,
“Yes, it shown me that we tend to be
disrespectful and impatient”, “I feel that I
recognize things that I never realized I was
doing”. Since they felt they had been exposed
to a different point of view (90%): “I learned
how certain medical conditions affect them
(Hispanics) and how they feel these conditions
should be treated, “They (articles) gave me
different points which made me think
differently”, “I learned that there are more
issues involved: poverty and poor eating” that
affect health. Some of the blog quotes refer to
this process (translation prepared by
researchers): “I learned that behind 90% of
those who died [committed suicide] there was a
mental problem [psychological issue]. That is
why I like that this article allowed us to know
more about a topic that is a little taboo in many
societies”; “I cannot believe that suicide has
become a more common cause of death than
traffic accidents in Spain […] I´d rather be a
little uncomfortable talking about suicide that
having to lose another friend so unnecessarily”.
As part of our commitment to implement better
practices that allows us to be more efficient in
content delivery, we surveyed our students
about the role of the technology used in the
course assignments, specifically, the impact of
the selected web-based activities. Students´
responses, 90%, are positive about their
learning of their culture and other cultures, and
as a result 90% of them stated that technology
helped them gain cultural competence in the
health care field. Some quotes are: “I feel that
my vocabulary has improved”, “Technology
allows to explore and make new connections”, “
On-line articles made the topic more relevant”,
“Now I am confident I can understand authentic
material”.
CONCLUSIONS
Regular exposure to documents originating
from a foreign culture and presented in guided
tasks such as the web-based activities proposed
are a valid tool that helps students develop their
ability to interpret authentic materials. In
addition, the on-line newspaper articles in
Spanish related to health care seem to have
enhanced students ability to relate documents
and events to their own culture by contrasting,
comparing and reflecting on selected topics.
This addresses the acquisition of the savoir-
comprendre domain from Byram´s model [3].
Participants are curious about other cultures,
some materials they read on line and the topics
they discussed in the blogs helped to change
their perception or strengthen their positive
impression of the Hispanic cultures, and
understand better the views of this group related
to health care. Some students have changed
their understanding of their own culture and
were able to embrace opinions other than their
own. Regular guided instruction of the
proposed web-based activities and students´
work seem to help them reflect critically about
other cultures, their own culture, and about
themselves. This helps students develop
Byram´s savoir-être domain [3].
104
Proceedings of The 4th International Multi-Conference on Society, Cybernetics and Informatics (IMSCI 2010)

The majority of participants feel positive about
the use of technology (on-line newspaper
articles via a discussion board and a blog) to
learn about their own culture and others. The
implementation of these web-based activities to
present specific content related to health issues
to students seem to affect positively their
interest in the course and their learning.
Further examination of these results interpreting
the level of intercultural competence that
subjects have achieved in contrast with their
departing level may produce significant
findings. If, as we said before, IC development
is a process, then individuals are expected to
advance towards a more complete level of
competency through ongoing study, observation
and interaction with people from other culture/s
[9]. In the group that we examined, one of the
subjects showed traits of a more advanced state
of IC through the examination of the blog
postings and the questionnaire. The departing
point for this subject was: “I have considerable
experience in meeting and conversing with
people from all over the world”, which
influenced the following comment about peers´
reactions in the blog: “[I did not learn very
much] as the reactions and reviews tended to be
rather simplistic”. However, despite this
background experience, the same subject
reacted positively when assessing the change of
perceptions about Hispanic cultures after taking
the course: “Yes, particularly in regard to
Hispanics and Health care”. This shows how
difficult is to meet students´ individual needs
when working towards a stage of IC that is
proportional in its progress to the stage they had
before being exposed to the Spanish for Health
Care class.
REFERENCES
[1] American Institutes for Research. (2002).
Teaching cultural competence in health
care: A review of current concepts,
policies and practices. Washington DC:
Author.
[2] Bennet, J. (2008). “On Becoming a Global
Soul. A Path to Engagement During Study
Abroad”. In Victor Savicki (ed). Developing
intercultural competence and
transformation: Theory, research and
application in international education.
Sterling, VA: Stylus.
[3] Byram, M. (1997). Teaching and assessing
intercultural communication competence.
New York, Clevendon: Multilingual
Matters.
[4] Campinha-Bacote, J. (2002). “The process
of cultural competence in the delivery of
healthcare services: A model of care”.
Journal of Transcultural Nursing, 13: 181-184.
[5] Deardoff, D.K. (2009). The Sage
Handbook of Intercultural Competence.
Duke University, Sage Publications.
[6]-----. (2006) “Identification and assessment
of intercultural competence as a student
outcome of internationalization”. Journal of
Studies in International Education, 10:
241-267.
[7] Hanna, B.E. and De Nooy, J. (2009).
Learning Language and Culture via
Public Internet Discussion Forums. New
York: Palgrave MacMillan.
[8] Kern, R., Ware, P. and Warschauer, P.
(2004). “Crossing frontiers: New directions
in online pedagogy and research”. Annual
Review of Applied Linguistics, 24: 243-260.
[9] King, P.M. and Baxter Magolda, M.B.
(2005). “A developmental model of
intercultural maturity”. Journal of College
Student Development, 46: 571-592.
[10] Kramsch, C. and Thorne, S. (2002).
“Foreign language learning as global
communication practice”. In D.B.Lock and
D.Cameron (eds). Globalization and
language teaching. London: Routledge,
83-100.
[11] O´Dowd, R. (2006). Telecollaboration
and the development of intercultural
communicative competence. Munich:
Langenscheidt.
[12] Selezneva, E. and Veiga, A. (2007) “Weblogs
for Intermediate level Spanish”: SOCALLT 07
Annual Conference, Cy-Fair College,
Houston. (Conference Presentation)
[13] Sercu, L. (2004). “Assessing intercultural
competence: a framework for systematic
test development in foreign language
education and beyond”. Intercultural
Education, 15 (1): 73
105
Proceedings of The 4th International Multi-Conference on Society, Cybernetics and Informatics (IMSCI 2010)

Connecting Technology with Student Achievement: The Use of Technology by Blue
Ribbon School Principals
Ronald A. Styron, Jr. Ed.D., Associate Professor
Department of Educational Leadership and School Counseling
College of Education and Psychology
The University of Southern Mississippi
118 College Drive #5027
Hattiesburg, MS 39406-0001
and
Jennifer Styron, M.Ed., Research Specialist
Center for Research, Evaluation, Assessment and Training Services
The University of Southern Mississippi
118 College Drive #5214
Hattiesburg, MS 39406-0001
ABSTRACT
The purpose of this study was to investigate
perceptions and technology usage of K-12 school principals of
Blue Ribbon Schools to identify technological characteristics of
successful school leaders. Items on the questionnaire were
aligned with the International Society of Technology Education
National Educational Technology Standards and Performance
Indicators for School Administrators. The researchers sent
questionnaires to 500 principals throughout the United States
with a return rate of nearly 37%.
Pearson and Spearman correlations were conducted to
determine the level of agreement with NETS-A Standards of
Blue Ribbon School Principals and if there was a relationship
between use of technology and NETS-A Standards. An
independent-sample t-test was also conducted to determine if the
levels of agreement with NETS-A Standards differed by gender.
Results of this study indicated that there is evidence
to support high levels of agreement of Blue Ribbon School
Principals with the NETS-A Standards with females reporting
higher levels of agreement then males, and the need for
professional development to support technology integration.
Keywords: Principals, Technology Integration, Student
Achievement, Leadership
INTRODUCTION
The United States Department of Education Blue
Ribbon School Program was created in 1982 by then Secretary
of Education, Terrel H. Bell. It was created to honor America’s
most successful schools. Since then awards have been given to
elementary, middle, and high schools that are either
academically superior or have demonstrated dramatic academic
student achievement gains for disadvantaged students. Since it’s
inception, 5,150 different schools have been recognized. This
represents approximately 4.3% of the nation’s 133,000 public,
private, charter and parochial schools [1].
Principals of Blue Ribbon Schools were selected for
this study because of their extra-ordinary leadership skills as
evidenced by the recognition of their schools by the United
States Department of Education. Results from this study are
intended to provide school leaders with a better understanding of
the role of technology within their school settings and how to
effectively integrate technology standards across their school
curriculum. Results will also be used to help inform curricular
decisions related to principal preparation programs to better
prepare future administrators. Furthermore, it is the intention of
the researchers to determine if Blue Ribbon School principals
agree with current technology standards to inform best practices
related to improved student achievement.
THEORETICAL FRAMEWORK AND PERTINENT
LITERATURE
Data gathered for this study have been sorted by
standards identified by the International Society of Technology
Education (ISTE). These standards are widely recognized by
school leaders as an effective road map concerning the
integration of technology in such a way as to maximize student
achievement. They represent the theoretical framework for this
study.
National Educational Technology Standards
The National Educational Technology Standards and
Performance Indicators for School Administrators (NETS-A)
were originally developed in 2002 by ISTE and subsequently
updated in 2009. In addition to administrator standards, ISTE
developed teacher and student standards with corresponding
rubrics to facilitate the acquisition of technological
competencies.
NETS-A Standards include [2]: Visionary
Leadership—Educational Administrators inspire and lead
development and implementation of a shared vision for
comprehensive integration of technology to promote excellence
and support transformation throughout the organization; Digital-
Age Learning Culture—Educational Administrators create,
promote, and sustain a dynamic, digital-age learning culture that
provides a rigorous, relevant, and engaging education for all
students; Excellence in Professional Practice—Educational
Administrators promote an environment of professional learning
106
Proceedings of The 4th International Multi-Conference on Society, Cybernetics and Informatics (IMSCI 2010)

and innovation that empowers educators to enhance student
learning through the infusion of contemporary technologies and
digital resources; Systemic Improvement—Educational
Administrators provide digital-age leadership and management
to continuously improve the organization through the effective
use of information and technological resources; and Digital
Citizenship—Educational Administrators model and facilitate
understanding of social, ethical, and legal issues and
responsibilities related to an evolving digital culture.
Technology and Student Achievement
Refereed articles cited in this literature review
substantiate the connection between proper usage of technology
and improved student achievement [3]. When utilized properly,
quality integration of technology in daily instruction has been
documented to have a positive effect on student achievement.
Research suggests that the quantity of technology alone is not
critical to student learning [4].
Upon implementation of a computer-assisted learning
program, Banerjee, Cole, Duflo, and Linden [5] found an
increase in mathematic test scores by 0.47 standard deviation.
Penuel et. al. [6] conducted a meta-analysis of 19 studies and
found increased student achievement in mathematics, reading
and writing when utilizing laptop, home desktop, discrete
educational software and voicemail programs into instruction.
The United States Department of Education Institute
of Education Sciences (IES) has published several studies
through their What Works Clearinghouse (WWC) pertaining to
the use of technology and improved student achievement in
mathematics. In 2006, IES found that Everyday Mathematics,
published by Wright Group/McGraw-Hill, had positive effects
on students’ mathematics achievement. This program addressed
real-life problem solving, student communication of
mathematics thinking, and appropriate use of technology [7]. In
2009 IES published The Cognitive Tutor® Algebra I curriculum
study. This curriculum represented an approach combining
algebra textbooks with interactive software. The software was
developed around an artificial intelligence model that identified
student strengths and weaknesses relative to mastery of
mathematical concepts. The study included 255 9th
grade
students and was found to have positive effects on student
achievement [8]. What's more in 2009, IES published a meta-
analysis report called the I CAN Learn® Pre-Algebra and
Algebra program. This program was an interactive self-paced,
mastery-based software system. Contained within the meta-
analysis were 5 different studies including 16, 519 8th
grade
students. Based on data from these studies it was concluded that
the software system had a positive effect on mathematics
achievement [9].
There have been several published studies pertaining to
the use of technology and improved student achievement in
reading. In 2007 Knezek and Christensen gathered data from
schools in Texas to determine the effect of technology-intensive
classroom learning activities. Results of their study indicated
technology helped to foster improved reading accuracy in 1st and
2nd
graders [10]. Tracy and Young [11] evaluated the
effectiveness of the Waterford Early Reading Program software
on early literacy development and found that students who
utilized this software performed significantly better. In a study
by Yip and Kwan [12], undergraduate students increased their
vocabulary skills after utilizing online vocabulary games from
selected websites. Fasting and Lyster [13] investigated the effect
of a computer-based intervention on the enhancement of skills in
below average readers and spellers. They found that student
improvement in word reading, reading comprehension and
spelling occurred.
Studies also indicate positive gains in science
achievement when using technology-based instructional
strategies properly. Working with middle school students,
Dunleavy and Heinecke [14] found that those with one-to-one
laptop use with 24-hour access, had improved student
achievement in science as measured by standardized tests.
Loaded on the laptops was Microsoft Office software, Internet
Explorer, and Glencoe/McGraw-Hill textbook resources.
Schroeder et al. [15] conducted a meta-analysis of research
found in 61 studies from 1980-2004 on science pedagogical
strategies. The data in these studies indicated that the
instructional use of technology has a significant impact on
student achievement. In 7 experiments conducted by Van Lehn
et al. [16], it was determined that computer-mediated tutorials
could be more beneficial than traditional one-on-one tutorials
when the preparation matched content.
Research also indicated that effective computer
technology usage can help improve student collaboration and
develop learning communities by facilitating the planning,
monitoring and evaluating of learning. Computer technology
may as well help students understand remember, and learn
complex concepts [17]. In addition, web-based virtual
environments allow teachers to better address varied student
learning styles through the integration of information and
communication technology into instruction. Results of a study
by Sun, Lin and Yu also indicated technology integration lead to
improved academic achievement [18].
Technology and The Role of Administrators
Schools are changing at a speed never witnessed
before and technology is at the very center of these changes.
School administrators, as technology leaders, must not be
consumed with the management of technology at the expense of
working through teachers’ fears and emotions. Since school
leaders play a significant role in the successful implementation
and integration of technology, they must play a more proactive
role in implementing technology, connecting technology with
the improvement of student achievement [19].
As evidenced by the work of Roschelle et al. [20], the
commonality to successfully linking technology to improving
student achievement is the effective integration of technology
into real-life daily instructional practices. All too often
administrators provide technological resources to teachers, such
as hardware and software, but stop short of attaining the other
conditions necessary for connecting technology with improved
student achievement.
To serve as an administrative guide, ISTE [2] has
identified 7 factors for successful implementation of technology
for learning. They include: 1) Providing effective professional
development for teachers in the integration of technology into
instruction, 2) Aligning local and/or state curriculum standards
with appropriate use of technology, 3) Incorporating technology
into the daily learning schedule, 4) Providing individualized
feedback to students and teachers regarding programs and
applications and having the ability for teachers to tailor lessons
to individual student needs, 5) Incorporating technology usage
into a collaborative teaching environment, 6) Focusing
instructional technology utilization into project-based learning
and real-world simulations, and 7) Providing leadership,
modeling, and support [2].
107
Proceedings of The 4th International Multi-Conference on Society, Cybernetics and Informatics (IMSCI 2010)

In a report by NCREL & Metiri Group [21], several
reasons were identified for administrators to know and utilize
instructional technology. They include the need to prepare
students to function in an information-based, Internet-using
society, the need to make students competent in using tools
found in almost all work areas, and the need to make education
more effective and efficient.
METHODOLOGY
Description of Procedures
This purpose of the study was to explore the
perceptions and use of technology by principals at Blue Ribbon
Schools throughout the United States. A pilot study was
conducted prior to the study to determine the reliability and
validity of the survey instrument. After making appropriate
revisions as identified by pilot study respondents, the
researchers deployed a questionnaire based on the 2009 NETS-
A Standards and Performance Indicators. These questionnaires
were delivered by postal mail.
Participants
Researchers used a criterion-based sample to select
principals of nationally recognized Blue Ribbon Schools from
2007 - 2008. Behaviors of Blue Ribbon School principals are
important because of the status afforded to them by this
recognition. The application process and corresponding
requirements and award represent the apex of curricular rigor
and academic achievement. Blue Ribbon Schools, together with
their teachers and administrators, are seen as models for all
members of K-12 educational communities to emulate. Five
hundred questionnaires were mailed with 183 returned for a rate
of 37%. Participants’ age fell within the range of 27 to 60. A list
of all Blue Ribbon Principals may be found at
http://www2.ed.gov/programs/nclbbrs/.
Research Questions
There were three research questions guiding this
study. They were: 1) What was the level of agreement with
NETS-A Standards of Blue Ribbon School Principals? 2) Was
there a relationship between use of technology and NETS-A
Standards? 3) Did the levels of agreement with NETS-A
Standards differ by gender?
Instrument
The demographic section of the questionnaire included
questions regarding to participant’s age, education level, school
region, use of mobile devices, email, Internet, and web 2.0 tools,
whether or not the participant had received technology training
and if so, where the training was received. In addition, 22 closed
form questions were included on the instrument. These
questions were based on the 2009 ISTE NETS-A Standards and
Performance Indicators for Administrators. Items on the
questionnaire were related to one of the five emphasis areas.
Questions were on a six point Likert Scale and ranged from
strongly disagree (1) to strongly agree (6).
The researchers utilized items from the questionnaire
to create five variables, one to represent each Standard including
Visionary Leadership; Digital-Age Learning Culture; Excellence
in Professional Practice; and Systemic Improvement; and Digital
Citizenship.
Evidence of Reliability: Cronbach’s alpha was
computed and reported for the instrument at an alpha level of
.936 showing strong consistency and stability in the scores of
the questionnaire, as such, the reliability of the instrument is
high. Table 1 shows the variable alpha level for each of the five
Standards. Alpha levels ranged from .792-.881, showing
adequate to good reliability for each measure.
Table 1. Alpha levels of NETS-A Standards
Standard Alpha Coefficient
Visionary Leadership .792
Digital-Age Learning Culture .874
Excellence in Professional Practice .856
Systemic Improvement .881
Digital Citizenship .829
Evidence of Validity: The instrument was designed
and developed by researchers who possessed content expertise
in the field of K-12 educational leadership. The five main
components of the instrument were selected because of their link
with NETS-A Standards and Performance Indicators. The
components were reviewed to ensure comprehensiveness.
Revisions recommended by the focus group, consisting of K-12
administrators, were completed prior to the administration of the
questionnaire. Moreover, a Blue Ribbon School principal, who
was not selected as part of the sample group, was asked to
conduct a final evaluation of the instrument to determine level of
difficulty, applicability and practicality of questions, and
provide feedback on the wording of questions before mailing.
Analysis Procedures
Data was entered into the statistical analysis program
called SPSS. Pearson and Spearman correlations were conducted
to determine 1) if a relationship existed between the five
Standards; 2) if a relationship existed between the level of
agreement of the five Standards and the use of mobile devices,
email, Internet, and web 2.0 tools; and 3) if a relationship
existed between the level of agreement with the five Standards
and technology use in general. An independent-sample t-test
was also conducted to determine if there were significant
differences between the levels of agreement with the five NETS-
A components and gender.
Findings
Descriptive Statistics: Of the 183 participants, over
half were female (60.2%) with 39.8% male participants. A
large majority of participants held a Master’s degree (79.7%)
with 13.7% reporting a doctoral degree, 4.9% reporting a
Specialist, and 1.6% reporting a Bachelor degree. The study also
had a diverse geographic representation with 20.7% of
participants reporting from the North, 39.6% reporting from the
South, 16.6% reporting from the East, and 23.1% reporting from
the West. Sixty-one percent of participants were over the age of
50 with 28.6% reporting in the age of 40-49, 9.9% reporting in
the age of 30-39, and less than one percent (.5) reporting in the
age of 20-29. Participants were also asked to report his/her level
108
Proceedings of The 4th International Multi-Conference on Society, Cybernetics and Informatics (IMSCI 2010)

of use of mobile devices, email, Internet, and web 2.0 tools.
Participants reported using email the most frequently with 100%
using it on a daily basis, followed by 96.7% of participants using
Internet on a daily basis. Mobile device use was split into two
main categories with 74% using mobile devices daily and 22.1%
never using mobile devices. Most participants rarely used web
2.0 tools such as Wikis, Podcasts, and Online Video
Presentations with 20.8% reporting no use and 43.8% reporting
once a month use.
Table 2 provides descriptive information on each
NETS-A Standard. Each of the five Standards was connected to
3-6 questions from the 22 on the questionnaire. The Likert Scale
ranged from 1 being “strongly disagree” to 6 being “strongly
agree,” however, the minimum and maximums calculated were
based on the means of the questions that comprised the
respective variable. Visionary leadership reported the highest
mean (M = 5.22, SD = .83) and digital citizenship reported the
lowest mean (M = 4.19, SD = 1.01).
Table 2. Descriptive Statistics for NETS-A Standards (N=183)
Standard Min Max Mean Std. Deviation
Visionary (Vis.) 1.00 6.00 5.22 .83
Digital (Dig.) 1.40 6.00 5.02 .79
Excellence (Exc.) 1.67 6.00 5.07 .73
Systemic (Sys.) 1.17 6.00 5.01 .79
Citizenship (Cit.) 1.33 6.00 4.19 1.01
Correlational Analysis: A Pearson product-moment
correlation coefficient was computed in response to the first
research question to determine if relationships existed between
the five Standards. As seen in Table 3, positive relationships
were found statistically significant between the five Standards
with the highest correlation between Digital-Age Learning
Culture (Dig.) and Excellence in Professional Practice (Exc.) [ r
(183) = .865, p< 0.01]. The lowest correlations for each variable
were reported with digital citizenship (Cit.).
Table 3. Pearson Correlation Output for NETS-A Standards
(N=183)
Standard Vis. Dig. Exc. Sys. Cit.
Vis. 1.000 .842** .853** .780** .618**
Dig. .842** 1.000 .865** .824** .751**
Exc. .853** .865** 1.000 .814** .709**
Sys. .780** .824** .814** 1.000 .625**
Cit. .618** .751** .709** .625** 1.000
The second correlation test was conducted to
determine if a relationship existed between the level of
agreement of the five Standards with the use of mobile devices,
email, Internet, and web 2.0 tools. For Visionary Leadership, the
Spearman rank correlation coefficients indicated significant
positive relationships between mobile devices (r (183) = .233,
p< 0.01), Internet (r (183) = .163, p< 0.05), and web 2.0 tools (r
(183) = .247, p< 0.01); for Digital-Age Learning Culture, the
Spearman rank correlation coefficients indicated significant
relationships between mobile devices (r (183) = .183, p< 0.05),
Internet (r (183) = .181, p< 0.05), and web 2.0 tools (r (183) =
.226, p< 0.01); for Excellence in Professional Practice, the
Spearman rank correlation coefficients indicated significant
relationships between mobile devices (r (183) = .215, p< 0.01),
Internet (r (183) = .205, p< 0.05), and web 2.0 tools (r (183) =
.298, p< 0.01); for Systemic Improvement, the Spearman rank
correlation coefficients indicated significant relationships
between mobile devices (r (183) = .160 p< 0.05), Internet (r
(183) = .170, p< 0.05), and web 2.0 tools (r (183) = .194, p<
0.01); and for Digital Citizenship, the Spearman rank correlation
coefficients indicated significant relationships between mobile
device (r (183) = .200, p< 0.05), and web 2.0 tools (r (183) =
.275, p< 0.01). Email was not correlated because all participants
reported daily use of email. Additionally, the only correlation
not found was between Digital Citizenship and use of the
Internet.
The final correlation test was conducted to determine
if a relationship existed between the level of agreement with the
Standards and technology use in general. For this correlation the
variable named TechUse was created to sum use of all four
technologies, mobile devices, email, Internet and web 2.0 tools
into one variable. A Pearson product-moment correlation
coefficient found a positive significant relationship between
technology use and Visionary Leadership [r (183) = .270 p<
0.01], Digital-Age Learning Culture [r (183) = .234 p< 0.01],
Excellence in Professional Practice [r (183) = .278 p< 0.01],
Systemic Improvement [r (183) = .190 p< 0.01], and Digital
Citizenship [r (183) = .264 p< 0.01].
Independent Samples T-Test: The final statistical
test, an independent samples t-test, was conducted to determine
whether or not differences existed in the level of agreement of
the NETS-A Standards by gender. Females reported level of
agreement was significantly different from males level of
agreement in visionary leadership, t (179)=-1.99, p = .048;
digital-age learning culture, t (179)=-2.72, p = .007; Excellence
in Professional Practice, t (179)=-2.26, p = .025; Systemic
Improvement, t (179)=-2.93, p = .004; and in Digital
Citizenship, t (179)=-1.77, p = .079. Table 4 provides means and
standard deviations by gender for each Standard. Females
reported higher levels of agreement than males for all five
Standards.
DISCUSSION
Data and analysis resulting from this study have
provided useful insights to help answer the research questions
posed by the authors of this work. The answer to the first
question, what was the level of agreement with NETS-A
Standards of Blue Ribbon School Principals, has been
ascertained within the descriptive statistics generated by the
study. This data set indicated that there was a high level of
agreement with the Standards as mean scores were between 4.1
and 5.2. The answer to the second question, was there a
Table 4. Means and Standard Deviations for NETS-A
Standards by Gender
Standard Gender N Mean Std. Deviation
Vis. Male 72 5.06 .84
Female 109 5.31 .81
Dig. Male 72 4.82 .85
Female 109 5.14 .72
Exc. Male 72 4.92 .76
Female 109 5.16 .69
Sys. Male 72 4.79 .81
Female 109 5.14 .75
Cit. Male 72 4.01 .96
Female 109 4.28 1.02
109
Proceedings of The 4th International Multi-Conference on Society, Cybernetics and Informatics (IMSCI 2010)

relationship between use of technology and NETS-A Standards,
has been also been ascertained within the correlational statistics.
This data set indicated that all NETS-A Standards’ relationships
were significant and correlated with each other. Finally, the
answer to the third question, did the levels of agreement with
NETS-A Standards differ by gender, has been ascertained with
T-test data. This data set indicated that females reported higher
levels of agreement than males for all five Standards.
Recommendations for Policy and Practice
Two of the performance indicators not included in the
correlational analysis had the lowest mean scores. They were,
adequate funding to support technology integration in their
schools (M = 3.81, SD = 1.43), and technology promoting
responsible social interactions (M = 3.67, SD = 1.24).
Accordingly, it is recommended by the authors of this work that
school leaders seek ways to establish sufficient, permanent
funding for technology initiatives, as long as these initiatives are
connected to real-world applications and are planned in concert
with faculty. Also, it is recommended by the authors of this
work that school leaders seek ways to promote meaningful
social interaction via web 2.0 through active involvement.
Sixty-four percent of participants did not belong to a social
network. Since web 2.0 is the medium of choice by the digital
generation [22], leaders must figure out ways to become
compassionate and collaborative partners with students to be
able to model appropriate interactions and practices between
peers.
College administrators may consider the results of this
study to help inform policy decisions regarding administrator
preparation programs. Information found in this work can be
used to help determine course content pertaining to technology
preparation and may also be used to help structure degree
programs with technology integrated throughout. Topics such
as funding for technology initiatives, knowledge/involvement
with social networks, technology equity along with legal and
ethical issues may receive additional emphasis since evidence
cited in this study suggest deficit areas in need of improvement.
Recommendations for Future Research
As found in data generated by a multi-variate analysis,
the southern region of the United States reported higher levels of
agreement with the Standards than the north and west sections of
the United States. Future research is suggested to help determine
if regional differences exist among levels of agreement with
NETS-A standards. Future research is also recommended to
help devise professional development pertaining to technology.
Data found in the descriptive statistics indicated a need for
professional development as 72% of participants indicated they
were self-taught. Added research may be conducted regarding
gender differences and differing levels of NETS-A Standards’
agreement found at non-Blue Ribbon Schools.
REFERENCES
[1] The Unites States Department of Education (2010). The
Blue Ribbon School Program Recognizing Excellent
American Schools. Retrieved on May 20, 2010 from
www.ed.gov.
[2] The International Society of Technology Education (2010).
National Educational Technology Standards and
Performance Indicators for School Administrators.
Retrieved May 20, 2010 from http://www.iste.org.
[3] The International Society of Technology Education (2008).
Technology and Student Achievement—The indelible Link.
Retrieved May 22, 2010 from www.iste.org.
[4] Lei, J., & Zhao, Y. (2005). Technology uses and student
achievement: A longitudinal study. Computers &
Education, 49(4), 284-296.
[5] Banerjee, A., Cole, S., Duflo, E., & Linden, L. (2007).
Remedying education: Evidence from two randomized
experiments in India. Quarterly Journal of Economics
122(3), 1235-1264.
[6] Penuel, W.R., Kim, D.Y., Michalchik, V., Lewis, S.,
Means, B., Murphy, R., Korbak, C., Whaley, A., & Allen,
J.E. (2002). Using technology to enhance connections
between home and school: A research synthesis.
Washington, DC: Planning and Evaluation Service, U.S.
Department of Education. Retrieved May 15, 2010 from
ctl.sri.com/publications/downloads/Task1_FinalReport3.pd
f.
[7] What Works Clearinghouse (September, 2006). Everyday
mathematics. Washington, DC: Institute of Education
Sciences. Retrieved May1, 2010 from
http.//ies.ed.gov/nces/wwe/reports.
[8] What Works Clearinghouse. (July, 2009). Cognitive Tutor®
Algebra 1. Washington, DC: Institute of Education
Sciences. Retrieved May1, 2010 from
http.//ies.ed.gov/nces/wwe/reports.
[9] What Works Clearinghouse (March, 2009). Intervention: I
CAN Learn® Pre-Algebra and Algebra. Washington, DC:
Institute of Education Sciences. Retrieved May 22, 2010
from http://ies.ed.gov/nces/wwe/reports.
[10] Knezek, G. & Christensen R. (2007). Effect of technology-
based programs on first- and second-grade reading
achievement. Computers in the Schools, 24(3 ), 23-41.
[11] Tracy, D. & Young, J. (2007). Technology and early
literacy: The impact of an integrated learning system on
high-risk kindergartners' achievement. Reading
Psychology, 28(5) 443-467.
[12] Yip, F. & Kwan, A.(2006). Online vocabulary games as a
tool for teaching and learning English vocabulary.
Educational Media International, 43(3), 233-49.
[13] Fasting, R. & Lyster, S. (2005). The effects of computer
technology in assisting the development of literacy in
young struggling readers and spellers. European Journal of
Special Needs Education, 20(1), 21-40.
[14] Dunleavy, M. & Heinecke, W. (2007). The impact of 1:1
laptop use on middle school math and science standardized
test scores. Computers in the Schools, 24,(3/4) 7-22.
[15] Schroeder, C., Scott, T., Homer, T., Tse-Yang, H., & Yi-
Hsuan, L. (2007). A meta-analysis of national research:
Effects of teaching strategies on student achievement in
science in the United States. Journal of Research in
Science Teaching, 44(10), 1436-1460.
[16] Van Lehn, K., Graesser, A., Jackson, G., Jordan, P., Olney,
A., & Rosé, C. (2006). When are tutorial dialogues more
effective than reading? Cognitive Science, 31(1), 3-62.
[17] Shell, D., Husman, J., Turner, J., Cliffel, D., Nath, I., &
Sweany, N. (2005). The impact of computer supported
collaborative learning communities on high school
students’ knowledge building, strategic learning, and
perceptions of the classroom. Journal of Computing
Research, 3I(3), 327-349.
[18] Sun, K., Lin, Y., & Yu, C. (2007). A study of learning
110
Proceedings of The 4th International Multi-Conference on Society, Cybernetics and Informatics (IMSCI 2010)

effect among different learning styles in a web-based lab of
science of elementary school students. Computers &
Education, 50(4),1411-1422.
[19] Creighton, Theodore (2003). The Principal as Technology
Leader, Corwin Press, Inc., Thousand Oaks, CA.
[20] Roschelle, J. M., Pea, R. D., Hoadley, C. M., Gordin, D. N.,
& Means, B. M. (2000). Changing how and what children
learn in school with computer-based technology. Children
and Computer Technology, 10(2), 76–101.
[21] North Central Regional Educational Laboratory & Metiri
Group. (2003). enGauge 21st century skills: Literacy in the
digital age. Naperville, IL: North Central Regional
Educational Laboratory. Retrieved May 22, 2010 from
www.asbindia.info/asb21/engauge21st.pdf.
[22] Prensky, M. (2001). Digital natives, digital immigrants:
Part I. On the Horizon, 9(5), 1-6.
111
Proceedings of The 4th International Multi-Conference on Society, Cybernetics and Informatics (IMSCI 2010)

The potential of e-learning platforms to communicate mathematics
Cristina Bardellei, Pier Luigi Ferrariii Department of Science and Advanced Technology
University of Eastern Piedmont “Amedeo Avogadro”, Italy
ABSTRACT
This paper presents some ideas for the design of online activities for mathematics blended courses. The focus is on the integration of technology and research in the field of mathematics education, with special concern for language and semiotics. In the section ‘Background’ we give:
• an overview of the outcomes of research that underline the complexity of educational processes, and in particular the need for taking into account not just cognitive, but also meta-cognitive and non-cognitive aspects;
• a framework for dealing with language and representations in order to effectively interpret students’ behaviors.
In the section ‘The potential of e-learning’ we show how some of the activities provided by a standard e-learning platform can help to implement some of the ideas presented in the ‘Background’ section. In the section ‘Teaching and learning opportunities’ we show examples of teaching activities which fulfil some of the requirements sketched in the previous sections and apply some of the ideas and methods discussed there. The section “Future trends and conclusions” includes some discussion of the opportunities for future research. In all the examples described in this paper we mainly refer to Moodle (see Moodle documentation). Keywords: e-learning, blended course, mathematics education, constructivism, semiotics, linguistics, pragmatics, register.
BACKGROUND
Mathematics Education, Technology and Research Nowadays information and communication technology (ICT) is not closely related to any theoretical framework in mathematics education. In the past, on the contrary, sometimes it was naively associated to some cognitive framework or even to some way of interpreting mathematics. This might explain the relatively poor role played by ICT in most studies in the psychology of mathematics education. Needless to say, the use of ICT is far from being a simple matter but wants the development of comprehensive teaching units and plenty of research to make the most of the opportunities provided and to avoid any possible shortcoming. A range of studies on mathematics education, on the other hand, has highlighted the complexity of teaching and learning processes. This means that oversimplified frameworks, including the belief that just the addition of technology to standard practices could provide considerable improvements of the outcomes are utterly inadequate. Above all, mathematics education has to take into account that learning outcomes are influenced by factors belonging to at least three separate levels:
• the non-cognitive level, which refers to beliefs, emotions and attitudes, and all affective aspects, which are most often critical in shaping learners’ decisions and performances;
• the meta-cognitive level, which refers to learners’ management of their own processes;
• the cognitive level, which refers to the acquisition of the characteristic ideas and methods of the discipline, with special care for to the obstacles recognized by research and practice.
As we will see below, ICT (and thus e-learning platforms) can be relevant at each level, including the non-cognitive one. As a matter of fact, it can deeply affect learners’ beliefs, emotions and attitudes towards mathematics, and moreover it is itself the object of deep-rooted beliefs and can influence the non-cognitive aspects. So any investigation combining ICT and mathematics education needs to consider non-cognitive factors concerning both technology and mathematics.
Constructive Methods In mathematics education the constructivist perspective plays a major role. In the past ICT has been regarded as conflicting with such methods by a good share of researchers in mathematics education. More recently technology has proved able to support a wide range of teaching methods, although this has not still been acknowledged by all researchers. Most likely some scholars would adopt a more restricted view of constructivism and would regard some computer environments and, more generally, some ways of using ICT as inconsistent with the constructivist perspective. For example, graphing a function, (defined by a symbolic expression) by means of the facilities of some Computer Algebra System might be regarded as non-constructive as some steps of the process are fully concealed to the learner, whereas programs explicitly computing the coordinates of a finite set of points of the graph of the function might be regarded as more suitable for a truly constructive approach. Although we understand some of the concerns of the supporters of the restricted view, in this section we are adopting an inclusive definition of constructivism. An e-learning platform allows the learners to develop new knowledge as they interact with the environment. Within an e-learning platform the learner can freely use a range of modules to construct his or her knowledge. Modules allowing some feedback, such as Moodle’s ‘lesson’ or ‘quiz’ are specially relevant from this perspective.
Cooperative Learning E-learning platforms generally provide a number of activities involving peer interactions or interactions between learners and tutors. Modules such as Moodle’s ‘workshop’, ‘wiki’ or ‘task’ are generally suitable for designing activities of this kind. In the paper we describe some experiences with a ‘workshop’ module at undergraduate level. From the viewpoint of the theory of
112
Proceedings of The 4th International Multi-Conference on Society, Cybernetics and Informatics (IMSCI 2010)

mathematics education, all of these activities can be framed within the so-called socio-cultural (or ‘discursive’) approach. For more information see Kieran et al. (2001). It is widely acknowledged that the cognitive processes induced by talking, discussing and explaining to others the concepts to be learnt promote deeper level and higher-order thinking (Johnson & Johnson, 1987). In this framework we want to underline peer learning (Boud et al., 1999), which is meant as the use of teaching and learning strategies inducing students to learn with and from each other without the close intervention of a teacher. It includes peer tutoring and peer mentoring. When the students in a group act as both teachers and learners we talk about reciprocal peer learning. This may incorporate self and peer assessment whereby students actively develop criteria for assessment. Falchikov (2001) analysed the various peer tutoring techniques and the benefits linked to each of them. She found evidence of some improvement in comprehension, memory for lecture content, performance and facilitation in encoding and retrieval of material given by Guided Reciprocal Peer Questioning.
Language And Representations The potential of information and communication technology as regards semiotic or linguistic issues is largely underestimated. Language is growing one of the most relevant issues for research on mathematics education. From the one hand, classes including students from different linguistic groups pose new teaching problems. On the other hand, at any level, including undergraduate, a large share of students’ failures can be ascribed to linguistic issues. An increasing number of students, for example, seemingly cannot properly understand a written verbal text even if it is short and simple. A detailed investigation of language-related troubles is beyond the scope of this chapter. More details on this topic have been provided by Ferrari (2002, 2004). In this section we are going to focus on two aspects: R. Duval’s (2005) investigation of semiotic representation systems and the pragmatic interpretation of mathematical language.
Coordination of Semiotic Systems: Duval’s Theory of Semiotic Representation Systems provides a new insight on the role of semiosis in learning. Algebraic symbol notation, verbal language, Cartesian graphs and geometrical figures are examples of semiotic representation systems. The main activities described by Duval are:
• The construction of a representation within a semiotic system, such as writing a text or a formula or drawing a figure.
• The treatment of representations within a semiotic system, such as summarizing a verbal text, computing the derivative of a function given as a symbolic expression or transforming a geometrical figure.
• The conversion of representations from a semiotic system to another, such as verbally describing a figure, or writing a formula to represent the data of a word problem, or drawing a figure satisfying some condition verbally expressed, or building a table of numerical values extracted by some formula, or verbally describing the solving strategy of a problem.
Duval often refers to semiotic representation systems as ‘registers’. We prefer to employ ‘register’ to denote a use-oriented linguistic variety, according to the definition widely accepted in the field of linguistics. According to Duval, the main goal of education as far as semiotics is concerned is what he names ‘coordination of semiotic systems’, which is the ability at
using multiple representations of the same ‘object’ and moving quickly from one to another. A problem involving real functions, for example, can be appropriately dealt with by the coordination of the verbal description of the function, its symbolic representation as an equation, its Cartesian graph and a table of values it assumes. The coordination of semiotic systems might improve both understanding and problem solving skills. From the one hand students who can coordinate semiotic systems are allowed to distinguish a concept from its representation (which usually proves much harder, if one can deal with one representation only), from the other hand, they can adopt the best strategies provided by each representation (for example, symbolic computation of the derivative of a function or visual search for a tangent on the graph). The same remarks hold for other subjects like rational numbers, which can be represented as fractions or as decimals. Decimal representations are more suitable in order to calculate sums and to compare number size, fractional representations are more suitable in order to calculate products and in general to carry out exact calculations.
ICT provides plenty of opportunities to use multiple representation. An e-learning platform can suggest a number of activities appropriate to the goal of achieving the coordination of semiotic systems. A quiz item, for example, might involve verbal texts, formulas and graphs. Let’s see a sample of typical items that can be inserted in a quiz, numerical answer question and multiple choice question.
Consider the function f defined on reals by the equation
f(x) =2cosx−sinx
a) Compute f’(x). b) Compute f’(0) c) Mark at least three of the following graphs that do not correspond to f.
A)
−2π −π π 2π
−2
2
4
x
y
B)
−2π −π π 2π
−2
2
4
x
y
113
Proceedings of The 4th International Multi-Conference on Society, Cybernetics and Informatics (IMSCI 2010)

C)
−2π −π π 2π
−2
2
4
x
y
D)
−2π −π π 2π
−2
2
4
x
y
Question a) can be implemented as a short answer question, question b) as a numerical answer question, question c) as a multiple choice question. Problems of this time require students to read all the kinds of representations (verbal text, graph, formula), to recognize properties of each of them and to combine the informations they can extract from each of them (e.g., from the symbolic expression of the derivative and the shape of the graph).
Pragmatics and Mathematical Language: Recently various frameworks have been proposed that underline the role of languages in the learning of mathematics. For example, Sfard (2000) interprets thinking as communication and regards languages not just as carriers of pre-existing meanings, but as builders of the meanings themselves. So, under this perspective, language heavily influences thinking. On the other hand, there is evidence that a good share of students' troubles in mathematics, at any school level, including undergraduates, can be ascribed to the improper use of verbal language. More precisely, as shown by Ferrari (2004), students often produce or interpret mathematical texts according to linguistic patterns appropriate to everyday-life contexts rather than to mathematical ones. The difference is not just a matter of vocabulary, grammar or symbols, but it heavily involves the organization of verbal texts, their functions and relationships with the context they are produced within. Under these assumptions, a pragmatic perspective has proven suitable to provide tools to interpret students’ behaviors and to design appropriate teaching units. A fine survey of the field of pragmatics has been provided by Leech (1983). In particular the functional linguistics approach, developed mainly by Halliday (1985), has provided a framework appropriate even from the epistemological perspective. Adopting these approaches means focusing on language use rather than on grammar, and regarding the interpretation of a text as a cooperative enterprise which involves not only vocabulary and grammar, but also the so called encyclopedia, i.e. the knowledge of the learner on the subject matter as well as on the world.. An e-learning platform provides plenty of opportunities for planning activities compatible with a pragmatic perspective. It is specially suitable
for planning activities aimed at improving linguistic competence, including competence in verbal language, as it allows the authors to design a wide range of communication situations and to devise tasks forcing students to use more refined linguistic resources. An application of these ideas to advanced mathematics has been presented by Ferrari (2004). All of the activities described in the above paragraph on cooperative learning involve plenty of exchanges relevant from this perspective.
TEACHING AND LEARNING OPPORTUNITIES
Self-evaluation Most of e-learning platforms provide the opportunity of designing sets of questions with automatic evaluation of the answers. The admissible formats for the items include multiple choice, true/false, matching, fill-in, cloze-procedure, short answer, numerical answer. Apart from short answer and numerical answer items, the other formats only require the learners to select their answer out of a prearranged set, and not to construct the answer themselves. This might be a critical issue. Items can be designed according to different criteria: they could be focused on one subject only, or on a whole course. In general, correct answers equipped with some comment are made available to students as soon as they have submitted their ones. Resources of this kind provide plenty of teaching opportunities, and some risk too. The item developers have to make the most of the benefits, exploiting the opportunities as much as possible, and to reduce the risks. This might make the development of the items a very troublesome business. Students might use the sets of questions individually or in groups, to get immediate feedback about some aspects of their learning. This may greatly affect not just their knowledge, but their confidence too (the so called sense of autoefficacy). The opportunity of trying and making mistakes without the judgment of another human being may help some students to grow more confident and to develop a more positive attitude towards their products. Students could even use sets of questions as a means to learn: the interaction with the resource could be used to add some piece of knowledge. Using resources of this kind might prove somewhat risky, as some kinds of items might prove harder to develop and implement than others, which might imply that they are chosen less frequently, notwithstanding their effectiveness. For example, currently in most platforms is much easier and faster to insert word questions with little symbolic expressions and no images. In spite of that, questions including images and complex symbolic expressions are crucial in order to attain the coordination of semiotic systems. Moreover, items like multiple-choice or true-false ones cannot provide a complete information about students achievements. For example, devising a solution procedure for a problem, representing and describing it with words involve fundamental skills that should not be overlooked. Uncritical use of test items might also induce some high school teachers or students to neglect the skills related to mathematical proof. Thus users should be warned that prearranged-answer items cannot provide a complete evaluation of their achievements, and opportunities to deal with open-answer items should be provided anyway. This could be achieved by means of resources allowing people to post files like Moodle’s task or ‘workshop’. Of course items of this sort cannot be evaluated automatically, but require more sophisticated patterns of evaluation or self-evaluation. On the fall of 2006 at the University of Piemonte Orientale some 150 Biology, Chemistry and Environmental Sciences students have been offered more than three hundred quiz items covering
114
Proceedings of The 4th International Multi-Conference on Society, Cybernetics and Informatics (IMSCI 2010)

all the topics of the ‘Introductory Mathematics’ course, from linear algebra to differential and integral calculus. On average each item has been dealt with by 34 individuals. More precisely, students split into two groups. About half of them visited the platform on a regular basis and tried to answer to a fair amount of items. The other half visited the platform occasionally and made just few attempts to answer to some item, and completed at most one set of them. The number of students regularly visiting the platform and attempting to answer to a reasonable amount of items has been far beyond our expectations. Their outcomes, although not significant from a statistical viewpoint, encourage us to go on with the experience and to expand and improve the offer for activities on the platform.
Interactions And Role-Play The experience we are going to describe may be inserted in the framework of cooperative learning previously described. The experiment has been carried out in 2005-06 in the university of Eastern Piedmont in Italy. It has been organised by selecting two groups: an experimental group and a control one. In our setting, the subject matter has been split into various sections. For each section rounds of different activities have been planned for the two selected groups. The activities of the experimental group have been based on role-play. In each round each student has dealt with 3 topics:
• 1st: the student acts as a teacher, so he or she devises some questions as if he or she were to evaluate someone other’s learning outcomes;
• 2nd: the student answers to the questions proposed by a peer;
• 3rd: the student again acts as a teacher and checks the output (both questions and answers) of two peers.
At the end of each round, the tutors revise all the files produced and made them available to all the students. The activities of the control group have been based on standard problem solving. Each member of the group was asked to autonomously solve problems provided by the staff (teacher+tutors) in a given time. Then the staff makes available solution patterns for self-evaluation. An implicit selection of a third group has arisen: the passive users of the platform, who have at their disposal lecture notes, self-evaluation tests, other materials (worked-out problems, problems with hints for solution, FAQ), opportunity to contact the teacher, the tutors and other students. The outcomes of the experiment have been collected at the end of the course by means of interviews, aimed at understanding how the activities carried out have affected the way of studying, which progress have been noticed by the students themselves, which role (among those played) has been considered particularly useful and why. The interviews have given evidence of many benefits due to peer-to-peer activities (see for example Albano, 2006, or Albano et al., 2007): strengthening communication skills, critical enquiry and reflection; clarifying subject content through discussion; viewing situations from different perspectives; learning how to work as a team member; becoming actively involved in the learning process, learning to learn. In particular, looking at the benefits identified by the students for each role, we can summarize as follows. The most appreciated role has been the first one, because it has allowed them to be in the teacher’s perspective, so getting able to understand the educational goals. Moreover, to ask questions have helped to study in a more critical and deeper way, with greater care, because it is not simple to pose a question due to the fact that there is no method to do that. At the same time, the request of a certain number of questions on a topic requires to
range over all the programme, not only concentrating on the specific and restricted topic but also paying attention to all the other linked topics. It is also interesting to note that some students has used this role to make critical points clear (posing as questions exactly their own doubts). Finally we noticed some non-cognitive aspects such as the trend to pose non trivial questions, also for pride reasons, and this has required the mastery of the topics. The second role, answering questions, has been considered useful because it has allowed students to appreciate topics usually neglected. It is commonly experienced by teachers the students’ quite general assumption about questions they consider tricky when posed at the exams. Some students have appreciated to receive from their colleagues some questions considered “tortuous” so that they have been forced to think about. Actually, if we see the papers produced by the students, there are no really tortuous questions, as well as there are not at the exams. Anyway the feeling of the students simply shows their familiarity with a flat and rote-learning style that is related to the lack of self-posed questions. In the same direction, we note that most of them have found questions that they did not think of before. The role of the teacher who checks the correctness is not really much appreciated, essentially for two reasons: students do not feel themselves to be equal to this task or consider the task not useful because they think they surely will do well. The role-play activities also affected students’ working methods. The students have acquired the habit of going into depth as a standard practice, and the habit of looking at something from more viewpoints (also through the comparison with other colleagues). This has changed attitudes toward studying, fostering the practice of reasoning rather than of learning by heart. The involvement in the activities proposed has given the students a sort of guidance for the organization of their study, providing time constrictions, topics to revise, indications of the relevant activities. Finally we want to note that some students have appreciated such kind of group activity also as training for their future work. From a practical viewpoint, some management difficulties are to be mentioned. The experimental activities described require some work for revising students’ products and this has to be done in itinere as much as possible, in order to influence their further elaborations. So, on the basis of our experience, the availability of a staff, composed by a suitable number of tutors, is essential: maybe one tutor per 10-20 users could be appropriate. Of course the coordination among the teacher and the tutors has to be taken into account.
Communication And Semiosis The activities described in the previous section are a good example of communication that involves the adoption of different registers (i.e. use-related linguistic varieties). The students have to understand each other, but also to convey some mathematical ideas. These two tasks may require different linguistic resources, and students have to switch between informal registers, in order to communicate each other as persons, and more formal ones, in order to describe mathematical ideas. Looking at the files produced by the students through the activities, we can find a range of examples of conversion between different registers and semiotic systems. If we try to trace the evolution of the use of language by the students through the activities, we can say that at beginning the use of language is seemingly more formal, and in some sense more precise from the mathematical viewpoint. Actually, it is only a
115
Proceedings of The 4th International Multi-Conference on Society, Cybernetics and Informatics (IMSCI 2010)

more rigid usage, due to the fact that students are not used to “talk of mathematics” and then their questions are standard (e.g. “What’s the definition of a group?”) so that the answers exactly conform to some piece of a book or lecture. Going on, students try to pose questions requiring some consideration for different topics or registers or semiotic systems, with the obvious consequence that answers cannot exactly conform to the style of a textbook. The presence of non standard questions has been increasing as much as the activities have gone on, with an average of 45% on the total amount of the questions. So for one thing, this is a good advance in mathematical thinking, for another thing , although they use a number of informal or even inaccurate expressions, students gradually improve their understanding of the meanings involved in mathematical expressions. A platform, anyway, provides plenty of opportunities for designing communication situations involving the use of a wide range of linguistic resources. More generally, ICT provides matchless opportunities for designing tasks involving conversion of semiotic systems, as defined in section 2.5. The following problem can be quite easily inserted as an item in different e-learning modules. A problem like this (administered to Science freshman students) involves conversions between formulas, graphs and tables of values. It involves neither any advanced mathematical content nor any sophisticated use of semiotic systems, but it requires to coordinate some piece of mathematical knowledge and three different semiotic systems. Problems like this are hardly proposed in standard teaching activities, if they are based on paper-and-pencil or blackboard work only. Nevertheless, they provide unique learning opportunities from almost all the perspectives discussed in this chapter.
Affective Aspects: Students, Teachers And Mathematics The use of an e-learning platform as a support to a standard lecture-based course also affects emotional aspects. Some investigations (Albano, 2005) have strongly pointed out students’ expectations and beliefs on their relationship with mathematics and the teacher. The interviews have highlighted the importance of the role of the teacher as a tutor and as a guide for a proper use of technology. Otherwise, the computer may prove an obstacle if the work is not properly supported by the teacher, because of the risk of getting lost due to the “dispersiveness” proper of the technological tools. We underline that even from the first question the expectation of a wider contact with the teacher has been made explicit, and it remains unwavering through all the questionnaire. A considerable share of students actually expects an improvement in the relationship with the teacher, due to the increased opportunity to communicate provided by the technological tools. We suppose that this feeling of approaching (even if not physical) should be read as “it is beautiful to know that there is someone”. In other words they greatly appreciate that the teacher is always at hand (by email for instance) if they wish or need. Through the platform the teacher is perceived closer, helpful, etc, and these factors have positive influence on the motivation to study, on the involvement in the course and on understanding. In almost 50% of the questionnaires the students refer to their expectation for wider, more frequent and easier opportunities to interact with the teacher. Such expectation is as strong as to be expressed anyway, independently from the question posed: we might be talking of either the course or their learning outcomes, or their relationship with mathematics, but in any case their expectation emerged in an almost “intrusive” way! At undergraduate level maybe this issue is felt as an important one because of the larger
number of students per class compared to high school, which might weaken the relationship between teacher and student. So we can read their answers as a request for some contact with the teacher, who is felt remote and missing. Tools as those offered by the ICT not only make the students nearer to the teacher, but induce them to communicate in a less formal, less rigid, “warmer” way. In other words, the relationship between teacher and students becomes less asymmetrical. Note that the improvement of the quality of the relationship between teacher and students greatly influence also the relationship between students and mathematics. Actually, the 44% of the students claim that the ICT-support, by itself, cannot change their feeling about mathematics, but most of them think that the teacher can strongly influence their relationship with mathematics anyway. This is true of the quality of the course too: a teacher who doesn’t love what he/she is teaching and who doesn’t transmit passion to his/her students is the main, or maybe the only, factor that can “un-qualify” a course. On the other hand almost 20% of the learners states that a platform can improve the quality of a course since it allows to improve the relationship teacher-student because of a “direct contact” created (18,8%). Anyway most of the learners (70%) expect to progress in mathematics learning and performance, thanks to the e-learning platform, because of the following main reasons:
• greater availability of contents/investigations/doubts/tests (37,2%);
• to be always in contact with the teacher (9,3%); • course more interesting/practical/stimulant/new/involving
(39,5%); • easy, fast, deepen learning (23,3%).
Further investigations on such expectations have been carried out after attendance to the blended course in order to compare students’ expectations and the actual outcomes (Albano, 2006, or Albano et al., 2007). It has been found that the students’ expectations have been met quite satisfactorily. The use of an e-learning platform really helps to create a relation with the teacher, that is quite lacking otherwise. We would like to underline that a teacher who uses a blended course has been considered as a teacher who takes care of the learning of his/her students, who wants them to be successful in their learning outcomes, who wants to communicate with them. Thus it positively affects students’ motivation and then their outcomes: seeing the background activity of the teacher on the platform (such as materials updating, asynchronous interactions by emails and forum, etc) let students to feel encouraged and eager to learn. Moreover, being acquainted to communicate with the teacher can help to reduce the exam-related anxiety, which often cannot be overcome by the mastery of the subject only. Finally, the support offered by a blended course has proved an optimal help for students who failed previous exams. The benefits they got not only affected their cognitive and meta-cognitive state, but also improved their relation with mathematics.
FUTURE RESEARCH DIRECTIONS We plan to go on with research on communication in an e-learning setting. of teaching for students with learning difficulties. This should take into account both the aspects more closely related to interpersonal communication and the specific features of the semiotic systems adopted in doing mathematics. This should involve the issues related to linguistic competence. Linguistic competence is most often than not ignored in research on mathematics learning at high school or undergraduate level. We need a careful investigation of opportunities and limits provided by the use of multiple representation systems and by
116
Proceedings of The 4th International Multi-Conference on Society, Cybernetics and Informatics (IMSCI 2010)

interpersonal communication. We also need to design activities supporting the acquisition of well-defined, advanced linguistic skills. We want also to investigate how to create interactive, open-ended tasks engaging students in creative activities of construction, conversion and treatment of semiotic representations within different semiotic systems, in the setting of multiple-representation systems such as Computer Algebra Systems or Dynamical Geometry Systems. Actually, we already use multiple representations, but they are almost always pre-arranged by the teacher (e.g., test items involving graphs) and do not fully exploit the opportunity of asking the student to build the representations him/herself.
REFERENCES
[1] Albano, G. (2006). A case study about mathematics and e-learning: First investigations. In: International Commission for the Study and Improvement of Mathematics Education 58 Congress, Changes in Society: A Challenge for Mathematics Education (pp. 146-151). Plezeň: University of West Bohemia Press.
[2] Albano, G., Bardelle, C., & Ferrari, P. L. (2007). The impact of e-learning on mathematics education: Some experiences at university level. La matematica e la sua didattica, 21(1), 61-66.
[3] Albano, G &.Ferrari, P.L (2008), ‘Integrating technology and research in mathematics education: the case of e-learning’, in García Peñalvo F.J. (Ed.), Advances in E-Learning: Experiences and Methodologies, Hershey (PA-USA): Information Science Reference (IGI Global), 132-148.
[4] Ayersman, D.J. (1996). Reviewing the research on hypermedia-based learning. Journal of Research on Computing in Education, 28(4), 500–525.
[5] Boud, D., Cohen, R., & Sampson, J. (1999). Peer learning and assessment. Assessment and Evaluation in Higher Education, 24 (4), 413-426.
[6] Calvani, A. (2005). E-learning at University. Which direction?. Journal of e-Learning and Knowledge Society. Issue 3 – No. 3, November 2005.
[7] Conole, G., Dyke, M., Oliver, M. Seale, J. (2004). Mapping pedagogy and tools for effective learning design. Computers & Education 43(2004) 17-33
[8] Di Martino, P., & Zan, R. (2002). An attempt to describe a negative attitude toward mathematics. In P. Di Martino (Ed.), Proceedings of the Mathematics Views—XI European Workshop: Research on Mathematical Beliefs (pp. 22-29). Pisa: Università di Pisa Press.
[9] Duval, R. (1995). Sémiosis et pensée humaine. Peter Lang.
[10] Falchikov N. (2001). Learning Together: Peer Tutoring in Higher Education. Falmer Press.
[11] Ferrari P.L. (2002). Developing language through communication and conversion of semiotic systems. Proc. of the 26th Conference of the Int. Group for the Psychology of Mathematics Education. (vol. 2, pp. 353-360). Norwich (UK).
[12] Ferrari, P.L. (2004). Mathematical Language and Advanced Mathematics Learning. In Johnsen Høines, M. & Berit Fuglestad, A. (Eds.), Proceedings of the 28th Conference of the International Group for the Psychology of Mathematics
Education, Vol. 2 (pp.383-390), Bergen (Norway), Bergen University College.Press.,
[13] Ginns, P., & Ellis, R. (2007). Quality in blended learning: Exploring the relations between on-line and face-to-face teaching and learning. Internet and Higher Education, 10, 53-64.
[14] Halliday, M.A.K.: 1985, An introduction to functional grammar, London: Arnold
[15] Johnson, D.W., & Johnson, R.T. (1987). Learning together and alone: Cooperative, competitive, and individualistic. Englewood Cliffs, NJ: Prentice Hall.
[16] Kieran, C., Forman, E., & Sfard, A. (2001). Learning discourse: sociocultural approaches to research in mathematics education. Educational Studies in Mathematics, 46, 1-12.
[17] Leech, G.: 1983, Principles of pragmatics, London: Longman.
[18] Mitra, A., & Steffensmeier, T. (2000).Changes in student attitudes and student computer use in a computer-enriched environment. Journal of Research on Technology in Education, 32 (3), 417-433.
[19] Sfard, A. (2001). There is More to Discourse than Meets the Ears: Learning from mathematical communication things that we have not known before. Educational Studies in Mathematics, 46(1/3), 13-57.
[20] Soulier, J. S. (1988). The design and development of computer-based instruction. Boston: Allyn and Bacon. (ED 301 456)
i [email protected] ii [email protected]
117
Proceedings of The 4th International Multi-Conference on Society, Cybernetics and Informatics (IMSCI 2010)

Effects of Student-Computer Interaction
on Math Educational Outcomes
Cristina Bardelle
Department of Science and Advanced Technology
University of Eastern Piedmont “Amedeo Avogadro”
Alessandria, Italy
ABSTRACT
The paper provides the description of an introductory
mathematics blended course for Italian Science freshman
students. The online environment is designed in order to
integrate the need of coordination of different semiotic
systems such as symbolic expressions, graphs, verbal
texts with suitable technical tools. The outcomes reveal a
preference for student-computer interaction as apposed to
student-instructor one due to affective aspects and a
preference for short online activities.
Keywords: e-learning, blended course, mathematics
education, language, semiotic systems
INTRODUCTION
Currently there have been a large number of online
educational environments developed, but these
developments have not been accompanied by a very wide
range of suitable research on the impact of this kind of
education on learning. On one side, some authors stressed
the importance of mapping learning theories with
technical tools of e-learning; for example in [4] it is
stated that “many designs reflect ‘commonsense’ rather
than theoretically informed design”. On the other side,
exploratory research is necessary to evaluate the extent of
the contribution of online environments to quality
learning with particular regard to blended experiences
(see e.g. [7],[13],[2]). Calvani [3] places the added value
of e-learning in the “substantial rewards it provides as
potential forms of assistance (cognitive, emotional),
mainly through interpersonal dialogue and the
personalized adjustment of contents”. The blended
modality, i.e. the addition of online activities to the face-
to-face ones, seems to bring a substantial contribution.
This study presents an example of using online activities
blended with standard ones for the learning of
mathematics at undergraduate level. In particular the
reported research was focused on the understanding of
how students feel about this kind of learning
environment.
Due to the constraints of the course, as the availability of
two instructors only, the lack of time and the large
number of students, the online activities were designed in
order to promote self learning in the online environment.
Therefore the online activities were conceived in order to
exploit more student-computer interactions rather than
peer-to-peer or student-instructor interactions.
The paper describes briefly the learning theory on which
the entire course was based and the technological tools
used, among those available, in order to apply the
learning theory at best.
Finally the paper reports some data on the participation of
students to the e-learning environment. In particular it is
described the correlation between the use of online
materials and activities and between students’ grades
both in final examination and in online activities. Some
attempts to interpret data are discussed focusing on the
research of patterns useful to improve online learning.
BACKGROUND
The entire course both for what concerned face-to-face
and online activities was prepared following the main
theory that language and communication play a central
role in the learning of mathematics. The terms ‘language’
and ‘communication’ are used here in a very broad sense.
‘Language’ refers, on one side, to all semiotic systems
available in the communication of mathematics such as
verbal language, images, graphs, symbolic expressions,
etc, and, on the other side, to all less explicit aspects such
as functions, relationship with the context, etc.
The word ‘communication’ is not confined to interactions
between individuals only, but it includes also thinking
that is one’s communication with oneself. This is what is
called ‘communicational approach to the study of human
cognition’ presented in [12], that has its roots in
Vygotskian writings.
In this perspective language heavily influences thinking
and moreover here it is adopted the idea (see [6] and
references therein) that the ability in switching from a
representation to another is fundamental for the learning
of mathematics. Following the previous principles several
online activities were designed for the course, taking into
account the opportunities and constraints of the available
free platform. First of all technology platforms give the
opportunity to exploit different semiotic systems, among
which figures and symbolic expression, even if, in my
opinion, additional innovations are needed in order to
allow practitioners an easier access to them. Secondly, a
118
Proceedings of The 4th International Multi-Conference on Society, Cybernetics and Informatics (IMSCI 2010)

detailed analysis of possible kinds of questions with their
pros and cons was conducted in order to realize quizzes
and lessons. About this subject matter, [11], [10], [1] deal
with an interesting taxonomy respectively of item types
useful in computer based assessment and of mathematical
questions.
A BLENDED COURSE
The research concerned an introductory mathematics
course aimed at giving students all mathematical
knowledge and skills they need to face further
mathematics undergraduate courses. This course is held
each year at the Faculty of Science of the University of
Eastern Piedmont “Amedeo Avogadro” in Alessandria in
Italy. This University has provided in the past 7 years the
possibility to use a free e-learning platform (Moodle) in
order to integrate standard activities with online ones.
At the end of the course students had to attend an exam
(written test) to verify their achievements. Both the test
and the course are not compulsory but students are
warmly suggested to attend them in order to become
aware of their flaws in mathematics knowledge and
skills, if any. This need stems from the fact that Italian
students start university with very different mathematical
backgrounds and most of them, more or less, need to fill
some gaps.
The course is a very short intensive course. In particular,
last edition, on which the study is focused on, had nine
face-to-face lessons of three hours each on eight major
mathematics topics. Moreover students have been
provided, for the first time, with several online activities:
1 opening quiz (18 questions) to help students to
identify their major mathematical flaws
8 short quizzes, one per topic (5 questions each)
for practicing math skills
8 long quizzes, one per topic (about 25 questions
each) for practicing math skills
8 lessons, one per topic
8 assignments (tasks), one per topic
1 final quiz (25 questions)
Such activities were placed in a suitable on line course
together with other resources such as notes, explanations
about the course and a glossary.
In the previous editions of the course the platform was
used only for the upload of resources such as notes, to
communicate technical information such as timetables,
evaluations of the exams and for not compulsory
assignments.
All 169 students were enrolled in the online course from
the start and part of the first face-to-face lesson was
dedicated to explain students how to use the platform and
the resources and activities available on it.
The course had only two instructors both for face-to-face
and online activities. The instructors themselves designed
the online course and uploaded all resources and
activities.
The questions used in quizzes and lessons are of three
different kinds: multiple choice - multiple answer,
numerical and matching-categorizing questions. In what
follows an example (in Italian) per type is given.
1. Multiple choice - multiple answer questions
This kind of question is different from the standard
multiple choice questions. In this case more than one
correct answer can occur and students are required to
select all the correct answers from the set available.
The designed questions in particular did not tell the
students how many correct answer there were.
Moreover, among the set of answers it was given the
option that ‘none of the other answers in the list are
correct’, as in figure 1.
With this setting students have to take into
consideration all the given options and not to stop at
the first answer they believe correct.
2. Numerical questions
It consists of a single numerical constructed
question, that requires only one number as the
answer. The limit of this question is that, in the
answer, the number must be given in only one
precise format. For example 1/2 and 0.5 represent the
same number, but just one is the correct answer for
the system. This problem can be overcome requiring
in the text of the question the desired format of the
number. Figure 2 provides an example of this kind of
question.
3. Matching – categorizing question
This item format is quite different from the standard
matching one. In this case the two lists of items that
must be correctly matched can have different length.
Figure 2 provides an example of this kind of
question.
All the questions were designed in order to foster
learning and not to evaluate students. In this perspective
the kinds of question that were used are not analyzed in
order to be exploited in formal testing setting.
For what concerns the construction of the tasks we just
remark that their answers did not require the use of too
complex representation systems such as graphs, particular
mathematical symbols, etc. This was done in order not to
create troubles to students, due to poor technical skills in
typing texts with a computer. Several studies, as [8],
reported that students characteristics for online success
depend on online writing skills and computer literacy.
Finally, online lessons were designed using the previous
question types in order to test students’ comprehension of
the subject matter.
All the activities were implemented trying to connect
different semiotic systems such as graphs and formulae as
in the question of figure 1.
119
Proceedings of The 4th International Multi-Conference on Society, Cybernetics and Informatics (IMSCI 2010)

____________________________________________________________________________________________________
____________________________________________________________________________________________________Figure 1: example of multiple choice – multiple answer question
____________________________________________________________________________________________________
____________________________________________________________________________________________________Figure 2: example of numerical question
____________________________________________________________________________________________________
____________________________________________________________________________________________________Figure 3: example of matching - categorizing question
120
Proceedings of The 4th International Multi-Conference on Society, Cybernetics and Informatics (IMSCI 2010)

FINDINGS
Firstly, the use of the platform by students in the last year
of this course compared to the previous ones is largely
increased. In particular in the past no one submitted the
assignments (the only activities available). We think that
this behavior is due to an increase of computer literacy of
younger generations (see [8] and references therein).
Moreover we think that a wider offer of online activities
influenced the perceived usefulness of the online
platforms. Perceived usefulness and perceived ease of
use are two variables which prove fundamental in the
acceptance of information technology (see [5]).
Detailed results related to some activities, among those
provided in the online course, of the last edition are
concisely reported in the appendix.
The participation to the online activities was always
below 57% and it decreased as time passed. Probably this
behavior is heavily influenced by the overload of the
entire course. Anyway most of the 57% used the
activities several times until they managed to give the
correct answers, indeed they asked for this opportunity
since the activities were initially set to be used just twice.
The students’ behaviors on the online activities are
divided into three categories
- activity not opened
- activity solved and submitted for final
grading (automated grading)
- activity opened but not submitted for final
grading (in this case sometimes the activity
was partially or even totally solved)
The system allows students to perform an activity and
save their responses checking their correctness without
submitting them for final scoring (automatically
generated by the platform). In this context ‘activity not
opened’ by a student means that he or she has never tried
to do the activity. ‘Activity solved and submitted for final
grading (automated grading)’ by a student means that he
or she solved the activity and submitted them to obtain a
grade. Finally ‘activity opened but not submitted for final
grading’ by a student means that he or she performed the
activity, partially or totally, but he or she did not submit
the responses in order to receive a grade.
We think that this behavior could be related to the fact
that students did not want to interact with instructors,
indeed they did not want to receive a judgment. It seems
that, in this case, students’ behavior is influenced by
some affective aspects such as they do not feel under
examination while taking tests on a computer without
submission. The interaction with a computer only can
provide the opportunity to use online activities as a
means to learn.
The previous behavior seems to be confirmed by the
scarce number of students that submitted responses to
tasks, even if this could also stem from the fact that such
kind of assignments requires fully constructed responses
(traditional essay).
Another important outcome is that students preferred to
perform short activities (quizzes with few questions)
instead of long ones such as long quizzes and above all
lessons. Online lessons were the least performed
activities of all. This fact probably is related also to poor
reading abilities in mathematical texts.
Students’ behavior was different concerning the initial
and final quizzes. Probably these activities, even if they
were long, were performed because they were considered
useful. In fact such quizzes dealt with all topics of the
course and they were structured in a similar way to the
final exam.
The outcomes of the experiment suggest improvements to
the implementation of the online environment. All
findings suggest to design many short online activities
instead of few long ones. Moreover the preference for
student-computer interaction can suggest, especially for
numerous courses, the development of personalized path
with the help of a wide use of the system of feedbacks.
Finally there is a relation between the results of the
written exam at the end of the course and the
participation to the online activities: better grading in the
test corresponded to large participation in the online
activities. This fact confirm the result in [8] that students
with high independent learning scores (as in the online
environment of this experiment) had significantly higher
course grades than low independent learner.
We are aware that researches of this kind need more tools
such as those used in [5], [8], [7] but the factors that
emerged from this preliminary research can be taken as a
basis for the development of tools for the measurement of
effective online learning.
121
Proceedings of The 4th International Multi-Conference on Society, Cybernetics and Informatics (IMSCI 2010)

APPENDIX
____________________________________________________________________________________________________
Lesson
on
'Arithmetic'
Lesson
on
'Functions'
Lesson
on
'Equations'
Lesson
on
'Arithmetic'
Lesson
on
'Functions'
Lesson
on
'Equations'
Not opened 123 126 147 73% 75% 87%
Submitted 10 16 0 6% 9% 0%
Not submitted 36 27 22 21% 16% 13%
Total 169 169 169 100% 100% 100%
____________________________________________________________________________________________________
Table 1: online lessons participation
____________________________________________________________________________________________________
_
Short Quiz
on
topic 1
(Arithmetic)
Short Quiz
on
topic 2
(Rational
and real
numbers)
Short Quiz
on
topic 3
(Geometry)
Short Quiz
on
topic 1
(Arithmetic)
Short Quiz
on
topic 2
(Rational
and real
numbers)
Short Quiz
on
topic 3
(Geometry)
Not opened 74 100 105 44% 59% 62%
Submitted 63 53 51 37% 31% 30%
Not submitted 32 16 13 19% 10% 8%
Total 169 169 169 100% 100% 100%
____________________________________________________________________________________________________ Table 2: short quizzes participation
____________________________________________________________________________________________________
Long Quiz
on
topic 1
(Arithmetic)
Long Quiz
on
topic 2
(Rational
and real
numbers)
Long Quiz
on
topic 3
(Geometry)
Long Quiz
on
topic 1
(Arithmetic)
Long Quiz
on
topic 2
(Rational
and real
numbers)
Long Quiz
on
topic 3
(Geometry)
Not opened 101 125 133 60% 74% 79%
Submitted 40 33 26 24% 20% 15%
Not submitted 28 11 10 16% 6% 6%
Total 169 169 169 100% 100% 100%
____________________________________________________________________________________________________ Table 3: long quizzes participation
____________________________________________________________________________________________________
Opening Quiz Final Quiz Opening Quiz Final Quiz
Not opened 73 99 43% 58%
Submitted 63 37 37% 22%
Not submitted 33 33 20% 20%
Total 169 169 100% 100%
____________________________________________________________________________________________________ Table 4: opening and final quiz participation
122
Proceedings of The 4th International Multi-Conference on Society, Cybernetics and Informatics (IMSCI 2010)

____________________________________________________________________________________________________
Task 1 Task 2 Task 3 Task 4 Task 5 Task 6 Task 7 Task 8
Not
opened 139 138 148 131 156 165 161 162
Submitted 31 32 22 39 14 5 9 8
Total 169 169 169 169 169 169 169 169
Task 1 Task 2 Task 3 Task 4 Task 5 Task 6 Task 7 Task 8
Not
opened 82% 82% 88% 78% 92% 98% 95% 96%
Submitted 18% 19% 13% 23% 8% 3% 5% 5%
Total 100% 100% 100% 100% 100% 100% 100% 100%
____________________________________________________________________________________________________ Table 5: assignments participation
REFERENCES
[1] Albano, G &.Ferrari, P.L, “Integrating technology
and research in mathematics education: the case of e-
learning”, in García Peñalvo F.J. (Ed.), Advances in
E-Learning: Experiences and Methodologies,
Hershey (PA-USA): Information Science Reference
(IGI Global), 2008, pp. 132-148.
[2] Ayersman, D.J., “Reviewing the research on
hypermedia-based learning”. Journal of Research
on Computing in Education, 28(4), 1996, pp. 500–
525.
[3] Calvani, A. (2005). “E-learning at University. Which
direction?”, Journal of e-Learning and Knowledge
Society, Issue 3 – No. 3, November 2005.
[4] Conole, G., Dyke, M., Oliver, M. Seale, J.,
“Mapping pedagogy and tools for effective learning
design”. Computers & Education 43, 2004, pp. 17-
33.
[5] Davis, F. D., “Perceived usefulness, perceived ease
of use, and user acceptance of information
technology”, MIS Quarterly, 13(3), 1989, pp. 319-
339.
[6] Ferrari P.L., “Developing language through
communication and conversion of semiotic systems”,
Proc. of the 26th Conference of the Int. Group for
the Psychology of Mathematics Education, Vol. 2,
Norwich (UK) 2002, pp. 353-360.
[7] Ginns, P., & Ellis, R., “Quality in blended learning:
Exploring the relations between on-line and face-to-
face teaching and learning”, Internet and Higher
Education, 10, 2007, pp. 53-64.
[8] Kerr, M. S., Rynearson, K., & Kerr, M. C., Student
characteristics for online learning success. The
Internet and Higher Education, 9, 2006, pp. 91-
105.
[9] Mitra, A., & Steffensmeier, T., “Changes in student
attitudes and student computer use in a computer-
enriched environment”, Journal of Research on
Technology in Education, 32 (3), 2000, pp. 417-
433.
[10] Sangwin Chris J., “New opportunities for
encouraging higher level mathematical learning by
creative use of emerging computer aided
assessment”, International Journal for
Mathematical Education in Science and
Technology, 2003.
[11] Scalise, K. & Gifford, B., “Computer-Based
Assessment in E-Learning: A Framework for
Constructing “Intermediate Constraint”, Questions
and Tasks for Technology Platforms”, Journal of
Technology, Learning, and Assessment, 4(6),
2006. Retrieved Novembre 2009 from
http://www.jtla.org
[12] Sfard, A., “There is More to Discourse than Meets
the Ears: Learning from mathematical
communication things that we have not known
before”, Educational Studies in Mathematics,
46(1/3), 2001, pp. 13-57.
[13] Soulier, J. S.,. The design and development of
computer-based instruction. Boston: Allyn and
Bacon. (ED 301 456), 1988.
123
Proceedings of The 4th International Multi-Conference on Society, Cybernetics and Informatics (IMSCI 2010)

Student perceptions of online discussions:
Is there agreement between students and faculty?
Paula San Millan Maurino, Ph.D
Sheryl Schoenacher, Ph.D.
Farmingdale State College
Farmingdale, NY 11735
Keywords: online discussions, threaded discussions, distance learning, student perceptions, faculty perceptions
ABSTRACT
There has been an abundance of research focusing on
student and faculty perceptions of online threaded
discussions. The purpose of this research study was to
compare the perceptions of the two groups. Are student
perceptions the same as faculty perceptions? During the
spring 2009 semester, students at Farmingdale State College
were asked to complete a structured survey and participate
in a semi-structured interview to ascertain their perceptions
of online discussions. The following research questions
were answered: How do students describe their online
discussion experiences in terms of the successful attainment
of social, cognitive and professional skills? How do
students’ experiences compare with faculty perceptions of
the attainment of social, cognitive and professional skills
developed through online discussions? The results were
then compared to two previous research studies conducted
at Farmingdale, one involving faculty perceptions of online
discussions and the other, an analysis of online discussion
transcripts for social capital.
INTRODUCTION
There has been an abundance of research that has focused
on students and faculty perceptions of online threaded
discussions. The purpose of this research study was to
compare the two with actual discussion threads. Are student
perceptions the same as faculty perceptions?
In 2006-7, Maurino compared 37 current distance education
studies and synthesized their findings on participation
quality, participation quantity, critical thinking skills, deep
learning, and recommendations. The synthesis revealed that
the potential for deep learning and insightful, creative
discussions online was recognized, but not yet happening at
a high level or to any great extent (Maurino, 2006-7). In a
later research study, Maurino, Federman and Greenwald
interviewed 31 online instructors at Farmingdale State
College and basically duplicated the preceding synthesis.
Faculty saw the potential for utilization of online
discussions, but were not fully satisfied with the discussion
results in their own online classes. These findings were also
duplicated by interviews with focus groups of online
instructors from other colleges (Maurino et al., 2007-8).
A common theme presented in recent research in distance
education is that the degree of student satisfaction and
retention is related to the interaction between the teacher
and students (Saba, 2000). Both students and faculty
reported increased satisfaction in online courses with more
interaction (Hartman & Truman-Davis, 2000). Yet, the need
for interaction does not unilaterally equate to active and
enthusiastic participation in online threaded discussions by
students. Literature reports on the quality and quantity of
online threaded discussions vary greatly. In 2002, Kreijns,
Kirschner, and Jochems (2002) stated that there is a
concomitant body of research that reports low participation
rates and varying degrees of disappointing collaboration in
online classes. These findings are supported by many
studies that report low participation rates (Beaudoin, 2002;
Goodell & Yusko, 2005; Guzdial et al., 2002; Kehoe,
Tennent & Becker, 2005; Klemm & Snell, 1996; Li, 2005;
Picciano, 2002) There are some studies that report more
participation in online classes than in-class discussions
(Chen & Zimitat, 2004), but the most common finding
seems to be that there are widely varying degrees of
participation by students in the same class (Ellis et al., 2004;
Picciano, 2002).
Students in some of the studies described online discussions
as less personal (Vonderwell, 2002), perfunctory (Goodell
& Yusko, 2005), less interactive and lacking in speed,
spontaneity and energy (Goodwell & Yusko, 2005; Hawkes
& Romiszowki, 2001; Meyer, 2003). On the other hand,
there are studies that report more honest, reflective
discussion online (Kippen, 2003; Ellis, 2004; Hara, Bonk &
Angeli, 1998; Hawkes & Romiszowki, 2001; Eustace 2003).
Research has found that some online environments
culturally condition students to agree with each other and
challenging each others ideas in discussion is considered a
personal affront. There is little social discord (Rourke et al.,
1999; Bullen, 1998; Kanuka, 2002). In a 2002 study,
Vonderwell found that students claimed to all have similar
ideas so there was nothing to really talk about. Thus, the
type of question asked in a discussion forum is important to
the quality and quantity of the discussion (Arbaugh, 2000;
Harasim, 1990). There are researchers that recommend
faculty relinquish control so that students are encouraged to
participate (Hazari, 2004). This relinquishment of control
can include having students post their own questions to the
discussion forum (Schoenacher, 2008-9).
This research project was a follow up study to two previous
studies completed at Farmingdale State College. The first
study sought to find the purposes, goals, and objectives set
by online instructors in the utilization of online threaded
discussions. Findings revealed that most instructors set
interwoven cognitive and social goals for their classes and
wanted to create a social environment conducive to student
learning from each other, the instructor, and course
124
Proceedings of The 4th International Multi-Conference on Society, Cybernetics and Informatics (IMSCI 2010)

materials. The professors wanted to replicate the classroom
genre of “class participation”. These goals were not always
met and only 47% of the professors considered their
discussions successful (Maurino, 2007-8). Little deep
learning was reported in these discussions and when it
occurred, it was with older, more experienced students.
The second study analyzed online threaded discussion
transcripts for development of social capital and found that
social capital was, in fact, achieved in these discussions.
Schoenacher (2008-9) found that when students are allowed
to post their own discussion questions, students have a more
vested interest in discussions and that this venue provided
an opportunity for students to build social capital, i.e.,
information sharing, trust building, and social cohesion
(Narayan & Cassidy, 2001).
This follow-up study considered the same issues and topics,
but considered them from the standpoint of the student.
The research questions answered in this study were: 1. How
do students describe their online threaded discussion
experiences in terms of the successful attainment of social,
cognitive, and professional skills? 2. How do students’
experiences compare with faculty perceptions of the
attainment of social, cognitive and professional skills?
METHODOLOGY
During the spring 2009 semester, 100 students of varied
programs were asked to complete a structured questionnaire.
The questionnaire utilized a Likert scale of “1” to “5” with
“1” being the lowest rating and “5” the highest rating.
The data collected included demographics and online
experiences of the students. This data was used to answer
the first research question
questionnaire included the following questions to elicit the
following:
Do students feel socially connected to other
students and/or instructor?
Do students feel that they learned from other
students and/or instructor?
Do discussions reinforce subject matter?
Do discussions help with job/career
choices/activities?
Are online discussions important to students?
Were online discussions found to be a good
experience?
What was the level of instructor participation?
The questionnaire data was placed into an Excel
spreadsheet. Each question was analyzed by comparing it by
age, gender, major, years of work experience, and rating of
self participation.
In addition to the survey questionnaires, 22 students at
Farmingdale State College were interviewed. These students
were not in the pool of the 100 students surveyed. The
students selected to participate had experience taking online
classes and were selected from two Senior Project classes.
The students were interviewed by an experienced researcher
and investigator in her office at the college. They were first
told about the purpose of the study and then asked to sign a
consent form. Data collection from the interviews was used
to answer the second research question by providing the
answer to “What were the social, cognitive, and professional
skills attained?”
The interview questions were:
Do you feel online discussions were an important
part of the class?
Describe what you learned from online discussions.
Were the discussions “successful”?
Is it better if the student or instructor posts the
question?
What are the best things to discuss?
The interviews were evaluated using conceptual analysis in
three areas: social, cognitive and professional skills. The
units of analysis were the occurrence of specific words,
concepts, or issues that indicate the existence of one or more
of the general characteristics of social-capital, cognitive, and
professional skills found from student responses to
interview questions.
After the questionnaires and interviews were analyzed, they
were compared to each other and to the previous study at the
college with professors as participants.
RESULTS
One hundred students were surveyed. Twenty percent were
19 or 20 years old, 54% were 21 to 23 years old. The 24 to
29 age group constituted 14%, 30 to 40 years old, 6%, and
6% were over 40. This is reflective of Farmingdale’s student
body. Most students are in their 20’s.
Males constituted 77% of the surveyed students and women
22%. One percent did not state gender. Farmingdale has
more men than women students, but not as disproportionate
as these numbers would suggest. The majority of the
students interviewed were business and computer systems
majors and these are mainly male dominated areas at the
college.
Only 9% of the students had no work experience. Twenty
percent had one to three years of work experience, 38% had
four to six years work experience and 33% had more than
six years experience. Farmingdale is a primarily commuter
college. Almost all of the students work and attend school
simultaneously.
For the most part, students did not feel that the online
threaded discussions provided them with a strong social
connection to either the other students or their instructor.
The most common rating for this connection was a “3”
(27%). Only 26% of the students felt that the online
discussions created a bond or connection to the other
students or instructor. In addition, students ranked the
connection exactly the same for other students and their
instructor. See Figure 1. No significant difference was found
based on the student characteristics of gender, number of
online courses taken, or major. There was a significant
difference based on age if the student was over 40. Students
over 40 were much more positive about all aspects of the
online threaded discussions. Students who claimed to
125
Proceedings of The 4th International Multi-Conference on Society, Cybernetics and Informatics (IMSCI 2010)

participate more often and had more work experience
evaluated the connection to other students and the instructor
slightly higher.
Figure 1: Student ranked feelings of social connections to the
instructor and other students during the online discussions.
Only 28% of the students gave a “4” or “5” rating to “I
learned a lot from other students in the online discussions”.
Fifty percent of the students ranked this statement as a “1”
or “2”. Similar findings were found for the statement “I
learned from the instructor in the online discussions”. No
significant differences were found based on gender, age,
major, number of online courses taken, years of work
experience or self evaluation of student participation. See
Figure 2.
Figure 2: Student perceptions of how much they learned from
other students and the instructor in the online discussions.
Sixty-four percent of the surveyed students gave rankings of
only “1” or “2” to the statement “Online discussions are
important to the course”. Results were slightly better for the
statement, “The online discussions were a positive
experience” with 46% of the students ranking the statement
as a “4” or “5”. Forty percent of the students, however, still
ranked the statement negatively. Again, no significant
differences were found based on gender, age, major, number
of online courses taken, years of work experience or self
evaluation of student participation. See Figure 3.
Figure 3: Evaluation of the discussions as an important component
of the course and a positive experience.
When students were asked if the online discussions
reinforced the material covered in class, 33% responded
positively and 44% negatively. Results for the statement
“The online discussions helped me with job and career
information and activities” were fairly evenly split, with
positive rankings by 43% of the students and negative
rankings 40%. See Figure 4.
Figure 4. Online discussions evaluated as reinforcement of course
material and a source of job and career assistance and activities.
When student responses to interview questions were
analyzed for specific words, concepts or issues for the
existence of social capital, cognitive, and professional skill
attainment, the results were somewhat more positive than
the questionnaires in some categories. Nine out of the 22
students interviewed described the discussions as successful
and 4 out of 22 as unsuccessful. Seven noted that some
discussions were successful and some were not. See Figure
5.
Eleven of the 22 students liked it better when the professor
started the discussion question and 8 thought discussions
were more valuable when the student was able to post the
initial question.
126
Proceedings of The 4th International Multi-Conference on Society, Cybernetics and Informatics (IMSCI 2010)

Figure 5. Interviewed students evaluation of online discussions as
successful or unsuccessful.
There were clues within the interview transcripts that social
capital skills were there. Clues were noted in the categories
of “groups and networks”, information and
communication”, and “empowerment and political action”.
These clues, however, were only noted in 50% of the
student interviews.
Cognitive skill clues were noted in the categories of
“student interaction”, “transmission of information”,
“understanding”, and “real-life experiences”. Understanding
was the most often noted clue and appeared in virtually all
the interview transcripts.
Professional skill clues were not noticed very often, except
in the area of “reinforces diversity”. Students mentioned that
they learned from the differences between rather than the
similarity of other students comments over 50% of the time.
DISCUSSION
In the 2007 survey, only 47% of the professors stated that
their discussions were successful in achieving social and
cognitive goals. This low rate of success was duplicated
with the student surveys. Only 40% of the surveyed students
described the discussions as a positive experience and 64%
felt that the online discussions were not an important part of
the course.
The professors most often commented that discussions were
successful some of the time with some of the students. They
stated that the students who benefited and contributed most
to the discussions were the older, mature students. This was
also consistent with the surveyed students that were over 40
years old. These older students gave very high ratings in all
areas of the online discussions. It also points to a serious
problem. The students in most of the online classes are
younger than 40 years old.
The interviewed students, due to the semi-structured nature
of the questions, were more able to accurately describe the
discussions that were successful and those that were not
successful than those completing a questionnaire. Some of
the students described the discussions as “busy work”, full
of “copied and pasted text”, “plagiarized material”, or
“made-up stuff”. Others stated that after awhile all the
postings were the same – there was nothing left to say about
the topic.
It was mentioned that some students found it easier to
understand the students’ comments than the textbook
readings. But others noted that some students have poor
writing skills and it was almost impossible to understand
what they were talking about. It was also noted that some
classes have more motivated students than others and
motivated students make the discussions interesting and
vital.
Some said students talked about real life experiences and
they enjoyed reading about them. One student stated that the
discussions “opened my eyes to things I had never thought
about before”. A few mentioned that without the
discussions, it would be a “correspondence course” or
“robotic”. Some students shared valuable links online and
helped others with research on the web. Also noted
frequently was the importance of an interesting topic and
question.
The professors noted that discussions take an enormous
amount of time and effort. Students cannot easily participate
in an online discussion without preparation as in a
classroom. This was a consistent theme with both the
surveyed and interviewed students. Some students felt that it
took away time from the “real” work of the class. They
described “going through the motions to get the points”, but
resenting the fact that they had to do so. Some felt that the
percentages allocated to discussions (some as high as 40%)
were unreasonable as well as mandated dates and number of
postings. Some mentioned, however, that they thought the
required number of postings and dates provided structure
that made them more disciplined.
On the other hand, students mentioned that an online class
gives them more time to work and that is a necessity for
them. They can participate late at night or whenever
possible.
The professors noted that some students just did not
participate while others were not disciplined enough to
participate the required number of times and within the
assigned time frame. This was reiterated by the interviewed
students. They mentioned that there were students who
never participated in the discussions and in some classes,
only a handful of students actually participated. This
adversely affected the conversations.
The professors stated that they used the online discussion to
replicate the classroom genre of “class participation”. There
was some agreement and disagreement with this statement
by both groups of students. Some of the interviewed
students stated that an online discussion was not like a real
discussion. They stated that the discussions often got off
track and there was no professor there to reroute the
conversation. Others stated that there was actually more
interactivity online than in a classroom. One student stated,
“In a classroom, only three or four students actually
participate. The other students just sit there and watch”.
Some described learning of different perspectives from
other students and gaining new insights. Others stated that
they don’t like discussions in the class or online.
The professors stated that the school or discipline did not
have a strong effect on the goals set or use of discussions.
The students appeared to agree. No significant differences
were noted in the evaluations of online discussions based on
major. Instructors of “technical” courses did describe their
127
Proceedings of The 4th International Multi-Conference on Society, Cybernetics and Informatics (IMSCI 2010)

classes as distinctive and having unique problems with
online discussions. Technical classes were not specifically
identified or investigated in this study. However, several
interviewed students stated that some courses did not easily
lend themselves to discussions. Some classes are more
“hands-on” and there were few topics to discuss. One
student stated that “Some classes are ‘just facts’ and other
classes like Sports Economics can have great discussions.”
The professors stated that there was little deep learning or
critical thinking in their online discussions. Many
interviewed students concurred, stating that the discussion
threads were collections of duplicative entries by students.
There were a few student statements that the discussion
helped them learn the material better and provided
information about work and careers. This was not deemed to
be within the realm of critical or deep learning.
One difference between the professors and the students was
that the professors wanted to see critical thinking and deep
learning in the online discussions. This was not mentioned
by any of the students. If there was to be a discussion at all,
students wanted to talk about something interesting and
exciting.
Quite a few interviewed students stated that the online
discussions reinforced and helped them learn other course
material. This was also a finding of the professors.
However, this was not found to be the case with the
surveyed students. Only 33% of the surveyed students
ranked reinforcement of course material in the “4” and “5”
ranges. This discrepancy could be attributed to the fact that
the interviewed students were graduating seniors more
likely to have a broader perspective of their educational
experiences.
Almost all of the surveyed students described the need for
discussions with appropriate topics. What were appropriate
topics? Some students wanted topics that were related to
the textbook so that they could better understand the
material. Others wanted topics that were interesting and
exciting to talk about that required students to “take an
opinion and defend it”. One student mentioned “issues
relevant to the textbook chapter, but not actually covered in
the book that are interesting”.
The great majority of the professors posted their own initial
questions and had the students respond to that question. The
surveyed students were not definitive on whether it was best
to have the instructor or the students post the initial
question. Some felt that if the student posted the question, it
would broaden the discussion and make it more interesting.
A common reply when asked what happens if the instructor
posts the initial question was, “You get a lot of the same
answers from students”. One student stated that it was easier
if the instructor posted the question because it “gave us a
good place to start, narrowed down the topic, and gave
students assistance in selecting types of comments”.
Another student stated that, “The most memorable
discussions were those that the students posted themselves.
If you have to post the question yourself, you have to really
think and analyze the topic”. Lastly, some students stated
that they do not like discussions — period. It does not
matter what the topic or question is.
SUMMARY
What does all this tell us? Online faculty see that online
threaded discussions have potential, but are not providing
the results that they want in undergraduate classes. Students
are also not satisfied with the online discussions. They want
interaction and connection in the online classroom, but are
not finding this in their online discussions. Although older,
more mature students enjoy the online discussions, the
majority of our students are young, working and commuting
from home.
Online discussions need to be restructured and moderated in
a different way. One step in the right direction might be for
instructors to share successful topics and questions with
each other. The issue of interesting topics was frequently
mentioned by students. Communication and sharing of
successes and “best practices” is vital to improving
curriculum and pedagogy.
Another step might be for instructors to have students post
their own questions to broaden the topics and potential
responses. Students may feel more vested in the discussion
if the topic is their own and they are responsible for running
the discussion.
Instructors might want to participate more often in the
discussions themselves to connect to and motivate students.
They could answer student questions instead of having
students answer their questions.
Reviewing the time required to complete assignments
outside the discussion area may be necessary. Discussion
weeks could alternate with work weeks so students do not
feel overwhelmed with the volume of work in an online
class and conflicted about whether to complete the
assignment or participate in the discussion. As an
alternative, the assignments could be interwoven with the
discussions. This might cut down on the time consumed for
both separate activities.
Training for faculty should encompass how to create and
monitor questions and responses for these online
discussions.
Finally, more research is needed in this area. Are there tools
better than online discussions to promote interactivity and
connection? Can they be replaced? Should they be
replaced? Or, can they be fixed through training,
restructuring, and revamping?
128
Proceedings of The 4th International Multi-Conference on Society, Cybernetics and Informatics (IMSCI 2010)

REFERENCES
Arbaugh, J. B. (2000). How classroom environment and
student engagement affect learning in Internet-
based MBA classes. Business Communication
Quarterly 63 (4), 9-26.
Beaudoin, M. F. (2002). Learning or lurking? Tracking
the “invisible” online student. Internet and
Higher Education 5, 147-155.
Bullen, M. (1998). Participation and critical thinking in
online university distance education. Journal of
Distance Education 13 (2), 1-32.
Chen, N. & Zimitat, C. (2004). Differences in the quality
of learning outcomes in a F2F blended versus
wholly online course. In Beyond the comfort
zone: Proceedings of the 21st ASCILITEConference, Perth, December 5-8, 175-179.
(accessed on January 25, 2009).
Ellis, R. , Calvo, R., Levy, D., & Tan, K. (2004).
Learning through discussions. Educational
Media International 41 (3), 263-274.
Eustace, K. (2003). Educational value of e-learning in
conventional and complementary computing
education. Proceedings of 16th Annual
Conference of the National Advisory Committee
on Computing Qualifications, Palmerston North,
New Zealand, July 6-9, 2003.
Goodell, J. & Yusko, B. (2005). Overcoming barriers to
student participation in online discussions.
Contemporary Issues in Technology and Teacher
Education. 5 (1), 77-92.
Guzdial, M., Lodovice, P. Realf, M., Morley, T., &
Carroll, K. (2002). When collaboration doesn't
work. Paper presented at the 5th. International
Conference of the Learning Sciences, Seattle.
Hara, N., Bonk, C.J., and Angeli, C. (1998). Content
analysis of online discussion in an applied
educational psychology course. Instructional
Science 28 (2), 115-152.
Harasim, L. (1990). Online education: An environment
for collaboration and intellectual amplification. In
Online education: Perspectives on a new
environment, ed. L. Harasim, 133-169.
Hartman, J.L. & Truman-Davis, B. (2000). Factors related
to the satisfaction of faculty teaching online
courses at the University of Central Florida. In
Online Education: Proceedings of the 2000 Sloan
Summer Workshop on Asynchronous Learning
Networks, edited by J. Bourne and J. Moore.
Needham, MA, Sloan-C Press.
Hawkes, M. & Romiszowski, A. (2001). Examining the
reflective outcomes of asynchronous computer-
mediated communication on in service teacher
development. Journal of Technology and
Teacher Education 9 (2), 285-308.
Hazari, S. (2004). Strategy for assessment of online
course discussions. Journal of Information
Systems Education 15 (4), 349-355.
Kanuka, H. (2002). A principled approach to facilitating
distance education: The Internet, higher
education and higher levels of learning. Journal
of Distance Education. 17 (2), 70-86.
Kehoe, J, Tennent, B., and Becker, K. (2005). Student
perceptions and expectations of flexible learning
and teaching approaches research report.
Queensland University.
http://learning.cqu.edu.au/lt_grants/files/Grantre
portKehoe2004.pdf (accessed on January 25,
2009).
Klemm, W.R., & Snell, J.R. (1996). Enriching computer-
mediated group learning by coupling
constructivism with collaborative learning.
Electronic Journal of Instructional Technology,
1(1), 1996.
Kreijns, K., Kirschner, P.A, and Jochems, W. (2002). The
sociability of computer-supported collaborative
learning environments. Educational Technology
and Society 5 (1), 8-22.
Li, S. (2003). The format-shifting dilemma in distance
education. Quarterly Review of Distance
Education. .
Maurino, P.S.M., Federman, F., & Greenwald, L. (2007-
2008). Online threaded discussions: Purposes,
goals, and objectives. Journal of Educational
Technology Systems, 36 (2), 129-143.
Maurino, P.S.M. (2006-2007). Looking for critical
thinking in online threaded discussions. Journal
of Educational Technology Systems, 35 (3), 241-
260.
Meyer, K. (2003). Face-to-face versus threaded
discussions: The role of time and higher-order
thinking. Journal of Asynchronous Learning
Networks. 7 (3) 55-63.
Narayan, D. and M.F. Cassidy (2001). A dimensional
approach to measuring social capital:
Development and validation of a social capital
inventory. Current Sociology, 49 (2):59-102.
Picciano, A.G. (2002). Beyond student perceptions: Issues
of interaction, presence, and performance in an
online course. Journal of Asynchronous
Learning Networks 6 (1), 20-40.
Rourke, L., Anderson, T., Garrison, R., & Archer, W.
(1999). Assessing social presence in
asynchronous text based computer conferencing.
Journal of Distance Education 14 (3): 51-70.
Saba, F. (2000). Research in distance education.
International Review of Research in Open and
Distance Learning 1 (1).
Schoenacher, S. (2008-2009). Building social capital in
online class discussions: A little freedom goes a
long way. Journal of Educational Technology
Systems 37 (3), 291-304.
Vonderwell, S. (2002). An examination of asynchronous
communication experiences and perspectives of
students in an online course: A case study. The
Internet and Higher Education 6, 77-90.
129
Proceedings of The 4th International Multi-Conference on Society, Cybernetics and Informatics (IMSCI 2010)

DEVELOPING A CAUSAL RELATIONSHIP MODEL
OF THE CHARACTERISTICS OF SCIENTIFICALLY TALENED STUDENTS:
A MIXED RESEARCH METHODOLOGY
Assoc. Prof. Dr. Samran Mejang
Faculty of Education, Naresuan University
Phitsanulok 65000, Thailand
ABSTRACT
The objective of this research is to develop a causal
relationship model of factors affecting the character of
scientifically gifted and talented students. The methodology
is a mixture of quantitative and qualitative research methods.
The research procedure comprises 3 phases : phase 1 – the
formulation of an initial hypothetical model of factors
affecting the character of scientifically gifted and talented
students , based upon related documentary analysis, in-depth
interview of experts in science , and multi-case studies; phase
2 – the verification and modification of the initial
hypothetical model through the connoisseurship seminar ;
phase 3 -- Test the goodness of fit of the modified model into
the empirical data through quantitative research. Data were
collected from 1,000 students on the basis of the variables in
the model These are the research results derived from phase
1 and 2 of research procedure : The character make-up of
scientifically gifted and talented students consists of 7
components , namely, cognitive ability and scientific inquiring
mind, scientific creativity, reasoning and deliberating,
perseverance, self-confidence, responsibility, self-confidence,
scientific problem-solving ability, whereas 5 factors are found
to be affecting the character of scientifically gifted and
talented students : socio-economic status of parent/guardian,
family environment, parent/guardian supports, classroom
social climate, and school environment
Keywords: Scientifically talented students, Characteristics,
Affecting factors
BACKGROUND OF THE RESEARCH
In the development of the nation, the well-being of
the public is the ultimate goal and to achieve the goal of the
development, knowledge and science play a crucial role for
the effective operations. However, in the development of
science in Thailand in the past, it is evident that we still lack
persons with scientific expertise, who will conduct research
and create scientific productivity to bring up natural resources
for optimum use.
Due to the aforementioned state of the problem, the
government has been trying to find out the solution by
developing human resources -- those with scientifically gifted
and talented character to be experts in science. Special
curriculum, scholarships for further studies, research
scholarships have continually and extensively been provided
for the development of persons with scientific potential at all
levels. It is found that science instructions are currently
conducted in three ways: 1. science instruction program
provided for scientifically gifted and talented students in the
schools established for this specific purpose such as
Mahidolnusorn School,and Chulapornrachavitayalai schools
2. Science instruction programs intended for the scientifically
gifted and talented students studying along with the students
in normal classrooms such as the project for development and
promotion of scientifically gifted and talented students. 3
Science instruction, regularly conducted in schools in general.
In the past, the scientifically gifted and talented
students were not the group of special academic focus.
Normally, it was assumed that these students were able and
could pursue their studies on their own to fulfill their
potential. A number of these students probably emerged as
high achievers in life However, it is accepted that this
might be because of an unidentified impetus or their better
opportunities , not because of special favorable programs
purposively extended to them.
In order to develop scientifically gifted and talented
students to achieve their full potential, it is necessary that
those who are concerned possess knowledge and
understanding pertaining to factors affecting the character of
scientifically gifted and talented students in order to promote
them.
For this reason, the researcher is interested in the
development of a causal model of factors affecting the
character of scientifically gifted and talented students. The
focus is placed on the students of the fourth secondary-
education level (10th -12th Grade) , since it is the highest
level before their further studies in higher education.
The results of the research will reveal a causal
relationship model of factors affecting the character of
scientifically gifted and talented students as well as the
information needed for creating scientific innovation to help
them achieve their full potential.
RESEARCH QUESTIONS
1. What is the character make-up of scientifically
gifted and talented students?
2. What are the factors affecting the character of
scientifically gifted and talented students ?
3. What does it look like -- a causal relationship model
of factors affecting the character of scientifically
gifted and talented students?
RESEARCH OBJECTIVES
General Objective
To formulate and develop a causal relationship
model of factors affecting the character of scientifically gifted
and talented students
Specific Objectives
1. To study the character make-up of
scientifically gifted and talented students
2. To study the factors affecting the character of
scientifically gifted and talented students
3. To construct a causal relationship model of
factors affecting the character of scientifically gifted and
talented students
130
Proceedings of The 4th International Multi-Conference on Society, Cybernetics and Informatics (IMSCI 2010)

4. To verify and modify the causal relationship
model of factors affecting the character of scientifically gifted
and talented students
5. To test the goodness of fit of the modified
model into the empirical data and modify the causal
relationship model of factors affecting the character of
scientifically gifted and talented students
SCOPE OF THE RESEARCH
The research procedure uses a methodology mix:
quantitative and qualitative and comprises 3 phases:
Phase 1 – the formulation of an initial hypothetical
causal relationship model of factors affecting the character of
scientifically gifted and talented students, based upon related
documentary analysis, in-depth interview of experts in science
, and multi-case studies.
Source of data
1. The synthesis of theories, concepts,
documents, research related to factors affecting the character
of scientifically gifted and talented students
2. In-depth interview of experts in science
3. Three multi-case studies
Phase 2 – the verification and modification of the
initial hypothetical model through the connoisseurship
seminar.
Source of data
Connoisseurship seminar of three groups of
experts: experts at the policy level, academia level and
operation level
Phase 3 – test the goodness of fit of the modified
model into the empirical data through quantitative research.
Data were collected from 1,000 students on the basis of the
variables in the model
Source of data
One thousand students in the fourth secondary-
education level (10th -12th Grade), obtained through multi-
stage random sampling.
RESEARCH PROCEDURES
The research procedure comprises 3 phases :
Phase 1 – the formulation of an initial hypothetical
model of a causal model of factors affecting the character of
scientifically gifted and talented students ,
1. The synthesis of theories , concepts,
documents, and research related to factors affecting the
character of scientifically gifted and talented students
2. In-depth interview of experts in science
3. Three multi-case studies
3.1 The only one student who
was studying in science program
of the fourth secondary-
education level ( 10th -12th
Grade ) and won the goal
medal in the International
Olympic Science Competition
3.2 The non-science student
studying in the fourth
secondary- education level (10th
-12th Grade ) , analytic induction
method and content analysis
were employed for data
analysis. The results were used
as the basis for the formulation
of an initial hypothetical causal
model of factors affecting the
character of scientifically gifted
and talented students
Phase 2 – Verification and modification of the
initial hypothetical model through the connoisseurship
seminar, consisting of 8 experts in educational provision for
scientifically gifted and talented students from 3 different
levels ; 1. at the policy level 2. in academics , specializing
in educational provision and 3. at the operational level .
Analytic induction method was used for data analysis. The
results were used as the basis for making the model complete.
Phase 3 - Verification of the concurrence of the
modified hypothetical model obtained from phase 1 and 2
with the empirical data ; Statistical Package of LISREL was
employed for the analysis of linear structural relationship of
the model.
The researcher constructed an measuring
inventory on the basis of the factor variables in the
formulated model, and these factor variables were measured
with 1, 000 students of the fourth secondary- education level
( 10th -12th Grade ) , the sample obtained through a multi-
stage sampling from the following schools.
1. The schools established for the purpose of science
instruction.
2.The schools in the project for development and
promotion of the students gifted and talented in science,
mathematics, and technology.
3. Normal schools in Education Inspection Region 3
Then the analysis was made on the linear structural
relationship model of factors affecting the character of
scientifically gifted and talented students with Statistical
Package of LISREL. The model was readjusted for the parts
that did not fit the empirical data.
RESEARCH RESULTS
The research results are derived from phase 1 and 2 of
research procedure and presented in response to 3 research
objectives as follows:
1. The character of scientifically gifted and talented
students consists of 7 prominent components which tend to be
the indicators to scientific achievements:
1.1 cognitive ability and scientific
inquiring mind, characterized by such observable behaviors as
intelligent expressions, high achievement in science learning ,
interest and enthusiasm in knowledge researching from a
variety of learning sources , including observing behavior ,
knowledge sharing habits, and enjoying challenging activities.
1.2 scientific creativity, characterized by
such observable behaviors as imaginations, new challenging
creatives as the alternatives in use in terms of thinking,
inventing, repairing scientific tools and equipment as well as
their applications.
1.3 reasoning and deliberating,
characterized by such observable behaviors as decision-
making based on reasons – taking into account cause-effect
relationship, and adequate supporting information rather than
groundless beliefs, conforming to rules and regulations at
work, systematic work planning , and tolerating criticisms for
the sake of work improvement.
1.4 perseverance , characterized by such
observable behaviors as commitment in carrying on scientific
activities until achieving accurate results, devoting time,
efforts, perseverance despite obstacles, difficulties and time
consuming, working consciously and attentively, and
tolerating criticism for the sake of professional achievement.
1.5 self-confidence, characterized by such
observable behaviors as doing things with confidence,
courage-showing expressions and acts, readiness to do what is
right rather than comply with the just-majority trends,
131
Proceedings of The 4th International Multi-Conference on Society, Cybernetics and Informatics (IMSCI 2010)
preference of competing and disseminating scientific
productivity to public.
1.6 responsibility, characterized by such
observable behaviors as attentiveness in task assignments
without shirking one’s duties, willingness to help out group
activities, punctuality, eagerness to learn in depth scientific
phenomena, accountability for the outcome of his/her own
work with transparency and integrity.
1.7 scientific problem-solving ability ,
characterized by such observable behaviors as using scientific
skills and process for the analysis of scientific complex
problems, envisaging potential the outcomes with accuracy ,
adjusting and applying a problem-solving method ,
appropriate for a situation, and evaluating his /her own
problem-solving outcomes .
2. Found to be affecting the character of scientifically
gifted and talented students are 5 latent variable factors, all of
which consist of 20 observable variable components.
2.1 socio-economic status of parent/guardian,
measured by 3 observable variables : 1. education level of
parent/guardian 2, career of parent/guardian 3. income of
parent/guardian
2.2 family environment , measured by 3
observable variables :1. mode of upbringing 2. relationship in
family 3. role model of parent/guardian
2.3 parent/guardian supports , measured by 3
observable variables :
1. education media supports of parent/guardian 2. loving and
energizing of parent/guardian 3. shared expectation in
learning by student and parent/guardian
2.4 classroom social climate, measured by 5
observable variables : 1. in-class behaviors of student 2.
process of learning management in class 3 competition in
learning in class 4. relationship in class 5. student-teacher
relationship
2.5 school environment , measured by 6
observable variables : 1. sources of science learning 2.
readiness and access to supporting facilities in science
3. extra-activities for science learning 4. Role-model in
science of a teacher
5. Role-model of a high achiever in science in school 6.
School policy on science
3. The causal relationship model of factors affecting
the character of scientifically gifted and talented students is
depicted as the framework by the following diagram:
132
Proceedings of The 4th International Multi-Conference on Society, Cybernetics and Informatics (IMSCI 2010)

X4 X5 X6
REFERENCES
Department of Academics. ( B .E. 2545 ). Learning Standards
: Subject Group Science , Basic Education
Curriculum 2544 (A.D. 2001 ). Bangkok, Ladprao :
Kuruspa Printing House.
Nongluck Virachcahi ( B.E. 2542). LISREL
MODEL : Analytical Statistics for Research ( 3 th.
edition ). Bangkok , Chulalongkorn University
Press.
Wasan Punpol .( B.E. 2551 ) . Developing the Indicators of
Character of Scientifically Gifted and Talented : The
application of research methodology mix. Dissertation
Ph.D. , Naresuan University..
Anderson, O Roger; et al. (1995). The role of ideational
networks in laboratory inquiry learning and knowledge
of evolution among seventh grade
students.(Online).H.W. Wilson.
Bullock.,M.(1994). “Development of Reasoning in
Childhood” The International Encyclopedia of
Education BPC Wheatons LTD : Excter.
Byrne, Barbara M. (1998). Structural Equation Modeling
with LISREL, PRELIS, and SIMPLIS: Basic
Concepts, Applications, and Programming. New
Jersey: Lawrence Erlbaum Associates.
Frances,L.& Louise, Bates Ames.(1995). Child Behavior.
New York : Holt.Rinchart and Winston.
Kelloway, E.K.(1996). Using LISREL for structural equation
modeling : A researcher’s guide. California : Sage
Publications,Inc.
McDermott , Paul A ; Mordell, Melissa ; Stoltzfus, Jill C. (
2001). “The Organization of student performance in
American school : Discipline, motivation, verbal
learning, nonverbal learning.” Journal of Educational
Psychology.93
Moos, Rudoft h. (1987). “Classroom Social Climate and
Student Absences And Grades.” Journal of
Educational Psychology. 70(2).
Robbins, S.P.(1986). Organization Behavior: Concepts.
Controversies and Applications. 3rded. Englewood
Cliff. N.J. Prentice-Hall Privated Limited.
Robert K. Yin. (2003). Case study research : design
and methods. 3rd ed. United State of America
: Sage Publications ,Inc.
Schwartz, David D. and others.(1986). “Influence of Personal
and University on the Subsequent Performance of
Performance of Persons with Type A Type B behavior
Patterns” Journal of Performance of Persons Social
Psychology.51(20)
Weiss, Richard Victor. (1997,September). Cognitive ability,
classroom learning behavior, and Achievement
responsibility as predictor of Concurrent academic
performance. Dissertation Abstracts.
SchEnv
Inclass
SocioEco
FamEnv
Support
Charact
X1
X2
X3
Charact : Character of scientifically gifted and talented Students
Y1 : Cognitive ability and scientific inquiring mind
Y2 : Scientific creativity Y4 : Perseverance
Y5 : self-confidence, Y6 : responsibility
Y7 : scientific problem-solving ability
SocioEco : socio-economic status
Env : family environment
Support : supports by parent/guardian
Inclass: classroom social climate SchEnv : school environment
X1 : ed level of parent/ guardian X2 :career of parent/guardian
X3 : family income X4 : mode of child up-bringing
X5 : in-family relationship X6 : role model of parent/guardian
X7 : education materials supports of parent/guardian
X8 : loving and encouraging of parent/guardian
X9 :shared expectation in learning
X10 : in-class behaviors of student
X11 : process of learning management in class
X12 : competing in class
X13 : in-class relationship
X14 : student-teacher relationship
X15 : sources of science learning
X16 : readiness and access to science learning facilities
X17 : extra activities to promote science learning
X18 Role model of science teacher
X19 : Role-model of a high achiever in science in school
X20 : school policy on science
Figure 1 The causal relationship model of factors affecting the character of scientifically gifted and talented students
Y1
Y2
Y3
Y4
Y5
Y6
Y7
X7
X8
X10
X11
X12
X13
X14
X9
X15 X16 X17 X18 X19 X20
133
Proceedings of The 4th International Multi-Conference on Society, Cybernetics and Informatics (IMSCI 2010)

New Teaching Experiments for New Learning Strategies The Key Role of Beliefs
Markus SANZR&D dept., Swiss Federal Institute for Vocational Education & Training (SFIVET)
1000 Lausanne, Switzerland - http://www.iffp-suisse.ch
ABSTRACT
Teaching and training practices have rapidly evolved in the past decades, making it difficult to produce any evi-dence based on research that would not turn shortly out-dated. At SFIVET, Switzerland, we have opted for an-other approach of the phenomenon and ultimately de-signed training structures characterized by a focus on the trainees' beliefs rather than on the development and im-plementation of supposedly new efficient technologies.
Keywords: e-Learning, Beliefs, Values, Change
______________________________________________
ABOUT THIS PAPER
The Key Role of Beliefs is a paper of a series called New Teaching Experiments for New Learning Strategies dedi-cated to experiments with new teaching methods – essen-tially based on various uses of computer and web tech-nologies – carried out at SFIVET, Switzerland, a federal institute that provides tertiary-level basic and continuing training to VET professionals and conducts research and development in the VET field.
This paper refers to a study labelled F300BLM1-3.3 that looked at the differences in trainees' beliefs by comparing 3 groups of students who followed the same training taught along a blended learning formula.
The beliefs this paper refers to are the beliefs that charac-terize the trainees and not the trainers' beliefs.
The purpose of this paper is to• remind that in spite of the computer revolution,
there are things that have not changed in the learn-ing process;
• show that at the heart of all that has not changed, there are beliefs;
• show that beliefs play a determining role in the success or failure of any form of e-learning;
• roughly explain how beliefs are at work in e-learning;
• give some information on how we addressed this belief issue at SFIVET in order to have students install success-oriented beliefs.
FRAMEWORK
"What are the best teaching practices nowadays?" That's the only question our New Teaching Laboratory had – and still has – to answer. Our mission is to determine what teaching practices are the most efficient. Since 10 years, we do our best to give a convincing answer, like thousands of other teams, schools, institutes and universi-ties in the world.
During these years we saw at least three amazing phe-nomena happen:
1. The computer revolutionThe first thing we observed is, of course, the fabulous development of computer technology. It was so rapid, so universal and so performant that nowadays, there isn't just anymore single human activity without a link, in a way or another, with computing. As a result, computer-based work has modified our way of thinking, by changing our references, by opening new fields for intellectual speculation, by allowing experi-ments in physics that were unthinkable a few years ago, or by creating virtual reality more appealing than real life!
2. The exhausting and costly efforts of schools to cope wit this developmentAs a rule, all schools we observed tried to follow the evo-lution and to integrate technology in their teaching meth-ods (and of course in the curricula), after having imple-mented it first in school administration. However, be-cause of the bureaucratic inertia, most adopted technolo-gies were implemented too late and were therefore not appealing and ultimately not used.If we look back at these 10 years of experimenting with new ways of teaching, we can say that every single aspect of the question has changed over the years. And it has changed so radically that it is difficult to produce even a single comparison that would make sense.
3. New learning strategiesRegarding learning, thousands of new ways of learning have emerged spontaneously, through the generalization of video/computer games and the incredible collaboration allowed by wikis, open source communities or forums. New competences were forged through these practices,
134
Proceedings of The 4th International Multi-Conference on Society, Cybernetics and Informatics (IMSCI 2010)

far away from any curriculum of any school, but de-manded and well payed in the field of employment.
This modification of the learning processes dramatically affected the schools - the traditional places for learning – from kindergarten to university. No more omniscience of the teacher and therefore diminished teacher's authority. No more handwriting or personal expression, but copy and paste compositions, etc. No more "correct" spelling, but spontaneous new ways of typing on keyboards. And any knowledge is now at only a few mouse-clicks away…
Dropping out of the rat-raceSo what? Is our knowledge like sand escaping the hand that wants to retain it? Yes, probably, if we keep jumping from each new tech-nology to the next, trying to find out what we could do better with these new technologies. And can we not do so? But the answer can be different if we adopt another approach of the phenomenon, if besides the frenetic (but necessary) R&D process we pay closer attention to what has NOT changed in the learning process despite the ICT revolution.
RATIONALE
The idea emerged when we realized, one day in 2007, that the most significant factor in the success of a course model was one we did not take into account! We sud-denly understood that we were prisoners of a thinking pattern and used a representation of the field and its char-acteristics that couldn't help us find our way to our goal.
The methodology we had adopted until then consisted in developing a computer-based learning environment and having people learn with it. The course designing process as well as the learning process was systematically docu-mented, along design-based research rules, in order to find out what was OK, where the difficulties were, what the efficacy/investment ratio was, etc. To reach the goals assigned to the R&D team, we varied the technologies and developed an evaluation grid that integrated the various features of distance and "blended learning" courses.
Since the main objective of the research was to determine the best e-learning models, the 2 most important indexes were efficacy (measured by the trainees results) and effi-ciency (the ratio efficacy/investment).The efficiency itself being essentially dependent on costs, we tried to measure various models with regard on the complexity of design (the more complex the design, the more expensive it is) and the amount of distant coach-ing requested (the more coaching time a course needs, the more expensive it is).
We won't go into details here, since it is not the subject of this paper. Suffice to say that we developed five different course models and ameliorated them regularly thanks to new emerging technologies and on the base of the feed-back collected by research.
Roughly, we arrived to the same conclusions as those expressed in the comprehensive Socrates Minerva report of the European Commission [1] or any similar report.
The underestimated variableWe did so until the day we had a significant variation concerning a course, although we hadn't changed any-thing (no change in dependent variables and apparently no variation in the independent variables).Looking closer at the data, we saw that what had varied were the beliefs of the trainees regarding the pertinence of the methodological choices embedded in the distance learning courses. To make it short, it appeared that a be-lief had grown in the class – don't ask why – that the use of a specific computer supported collaborative practice, imposed by us, would make learning more difficult in-stead of facilitating it. As a result, this group got weaker grades and expressed some dissatisfaction regarding the course, whereas other groups performed well and ex-pressed satisfaction.
Of course, this is old music for psychologists. Since Ro-senthal and Jacobson published in 1968 their study on what they called the Pygmalion effect [2], we know the power of self-fulfilling prophecy. Beliefs affect reality perception and can create self-fulfilling prophecies as a result.Feldman & Prohaska [3] went further and studied the effect of student expectations regarding teachers. They showed that, overall, the expectations regarding the teacher affect learning outcomes.
Obviously, the effect occurs similarly with distance learn-ing environments. We had underestimated the importance of this factor because we were too much focused on tech-nology.
Looking closer at beliefsWhat characterizes the belief issue, is firstly that it is a constant in the context of learning and teaching.
After reviewing scientific literature and personal experi-ence to find out what else had not changed despite the computer revolution, we found that the clearest picture was given by Philippe Meirieux [4]. In short, Meirieux proposed a list of four conditions that a learning process must fulfill to be successful. They are summarized in diagram 2 (next page).
Interestingly, all four items of this list are implicitly or explicitly linked to beliefs.
135
Proceedings of The 4th International Multi-Conference on Society, Cybernetics and Informatics (IMSCI 2010)

Diagram 2: Conditions for successful learning (Summary of Ph. Meirieux, 1987)
As we linked these items to the context of e-learning, questions like the following ones arose:
• How do learners find/build sense in the procedures proposed by distance learning programs?
• When confronted to use e-learning assignments, are they convinced that it is going to be the right way to reach the goal?
• What do they do when they disagree with the op-tions?
• How do they react when a course is based on a technology they find outdated?
• How do they manage to stay motivated?• How do they link what they do in front of their
screen with the rest of their knowledge?• What strategy do they develop when they can't
cope with the requirements and assignments ex-pressed by the e-teaching system or tutor?
• How do they treat the loneliness induced by computer-based learning?
• How do they experience computer-based collabo-ration?
• What do they believe about their identity when all relations are mediated by screen and mouse?
• Does their judgement on the technology or meth-odology affect their evaluation of the content?
RESEARCH QUESTIONS
We reduced this bunch of questions to 4:1.Do students' beliefs regarding e-learning affect
their e-learning practice? 2. If yes, a) what are these beliefs? and b) how do
they affect e-learning?3.Can something be done to remove limiting beliefs
and install success-oriented beliefs?4.If yes, what?
MATERIALS AND METHOD
MaterialsWe collected data through questionnaires and interviews. 3 classes of 20-30 learners were interrogated. The classes were constituted by adults professionally active in vari-ous vocational fields and going to be part-time teachers in vocational schools. The training consisted in two mod-ules, both of them proposed in e-learning (although not of the same kind, since we wanted to check various models).
Both modules had a similar Blended Learning structure, with 4 face to face one-day-long meetings: one at the start of the module (launching), one at the end (reframing and synthesis) and two in between (for discussing complex issues, reframing, completing information, micro-teaching, role-playing, etc).They differed in the technology used (Google Groups + Website for module 1 / CD-ROM with set of documents linked by hypertext links for module 2)
The research took place in between September 2007 and December 2009.
MethodologyThe methodology was development-oriented and aimed at getting results usable for course design improvement rather than "sound" scientific knowledge. We therefore often made a mix of quantitative data and qualitative deepening through interviews.
Question 1 was treated by contrasting the grades obtained by the students and their answers concerning e-learning in which they expressed their convictions.Some aspects were cleared afterwards through interviews.Question 2 was also treated first by means of a question-naire. The gathered information was then systematically completed by interviews.Question 3 was treated by reading scientific material about beliefs and belief change.Question 4 was treated by experimenting belief-installation in a real course and analyzing the effects by means of questionnaires and assessment comparison.
RESULTS
1. Do students' beliefs regarding e-learning affect their e-learning practice?The answer is undoubtedly yes.For instance, if the e-learning framework set by the teacher(s) takes into account the participation at forums, someone who does not participate actively, because he/she finds this activity irrelevant or useless, won't get full marks when evaluated on matters treated in forums, etc..Data showed also evidently that those who got the best results had all expressed their conviction that e-learning was going to be the most appropriate method. And among those who badly rated e-learning, many got proportionally weaker results at the assessments.
136
Proceedings of The 4th International Multi-Conference on Society, Cybernetics and Informatics (IMSCI 2010)

2a. If yes, what are these beliefs? The answers collected by means of the questionnaires allowed us, in a first step, to determine rough categories. Expressions of beliefs concerned essentially:
• the principle of learning at distance with a com-puter
• the possibility (or impossibility) to learn this spe-cific matter (pedagogy) this way
• the personal ability to match the requirements im-posed by e-learning
• the efficacy of forums and – more generally – computer-supported collaborative learning.
A distinction should be made here between beliefs ex-pressed before the beginning and beliefs expressed after the completion of the course. We could observe an evi-dent change of beliefs and see what had changed, what was useful for the treatment of question 4. The most significant results of post-course assertions were the following:
• 50% of the students expressed feelings that the success was mainly due to the quality of the train-ers.
• 40% of the students said that although this specific experience with e-learning was a success, they doubted that it could be extended to other do-mains.
We categorized these belief expressions and found an evident correlation to Meirieux's list of conditions for a successful learning.
Diagram 3: Correlation table between Meirieux's list of conditions for successful learning and the categories
of limiting believes registered in the study
2b. How do beliefs affect e-learning?Beliefs have effects on every aspect of the e-learning process. Some are important:
• Students who believed that it was not important or not necessary to respect the assignments set for collaborative tasks disturbed considerably the course and had much more effect on fellows than in classical face to face teaching.
• Students who believed that there is no profit in participating in forums and didn't take part the discussions missed many important reframings,
couldn't valuably take part in many further discus-sions and developed a feeling of being excluded.
• Students who believed that they were not smart enough to post in forums and didn't therefore write anything reinforced a feeling of inferiority, what affected in turn their participation in face to face activities as well.
• Students who believed that only the activities pro-posed during the face to face days were useful developed a strategy of investing only in these ways of learning.
We could summarize the way beliefs affected the e-learning process in saying that beliefs are directly linked to personal values and that they determine the behavior as e-learner mainly through a set of beliefs regarding capa-bilities. Beliefs were also directly linked to identity, as it appeared in expressions like "I am not the kind of guy who is go-ing to do that", "I' hate to write in forums because I fear misspelling". Diagram 4 summarizes this process.
Diagram 4: Pathway from beliefs to behavior
Ultimately, the effect of beliefs on behaviors affected the performance at assessments, what in turn had an influ-ence on the set of beliefs students have about themselves.
Remark: we focused here on limiting beliefs, but natu-rally, the same process occurs with positive beliefs, which foster good results and positive image of self, what was the case of the majority of the students who took part in the study.
3. Can something be done to remove limiting beliefs and install success-oriented beliefs?The answer is yes, of course. Many students showed such a change of beliefs during the course, passing from doubt about e-learning to a positive evaluation. Some expressed even surprise concerning this shift in perception. The belief issue is also directly linked to motivation, and every teacher knows that a lot can be done to motivate, thus change representations and beliefs. What we did, instead of waisting time to give proofs of obvious evidence, was to focus on the mechanisms of belief construction and the techniques developed to change limiting belief or foster success-oriented beliefs, independently of the specific context of SFIVET and e-learning.
137
Proceedings of The 4th International Multi-Conference on Society, Cybernetics and Informatics (IMSCI 2010)

To define a way to treat this belief issue, we decided, after having what has been written on the subject, to refer exclusively to NLP for the theoretical framework as well as for the methodology to change limiting beliefs, be-cause NLP is the only system that integrates theory, re-search and practical application in a coherent, logical and elegant way.
We used mainly Bateson's Levels of Learning and Change diagram, as refined and developed by Robert Dilts [5] to understand the effect of beliefs and their in-teraction with behaviors and competence building.
Diagram 5: Bateson's Levels of Learning and Change
This tool allowed easy linking to the Meirieux diagram and proved performant to understand the role and effect of beliefs in the particular context of e-learning, which usually requests changes at all levels identified by Bate-son. Indeed the e-learning student is often discovering a new environment, in which a specific and often new be-havior is requested, what supposes capabilities the stu-dent isn't sure to be able to display. In such a context, beliefs are dramatically challenged and identity often questioned. Beliefs about all that have to be up-dated and "re-aligned" until they generate a global OK-feeling.
NLP offers also specific tools to treat the question of how to address limiting beliefs. We experimented with all of them, in order to better understand the belief construction-and-evolution process. Particularly efficient were the Belief Assessment and the Belief Installation procedures. For a description of these tools, refer to the Encyclopedia of Systemic NLP and NLP New Coding [5] and to Changing Belief Systems with NLP [6].
We experimented with these techniques in interviews with students in order to be able to answer research ques-tion 4.
4. What can be done in the specific context of a train-ing institute to avoid that student start e-learning courses with limiting beliefs an to install success ori-ented beliefs?With the answers to this question we are leaving the strict research logic and methodology and are returning to the field of development.
After having experimented with NLP techniques regard-ing belief change, we decided to
• start our distance learning courses with a face to face session dedicated essentially to the installa-
tion of beliefs enforcing the efficacy of the e-learning environment students were about to dis-cover;
• do that by means of plays, self-esteem reinforcing interactions, role-playing, etc.;
• keep track of that for further analysis.
We did so and could observe that addressing the belief issue makes a significant difference. Diagram 6 below shows the difference in satisfaction between a course given in 2008 without specific preparation and the same course with initial appropriate belief installation in 2009.
Diagram 6: Difference in post-course satisfaction between a course without preparation regarding be-
liefs (left) and one with preparation (right)
To check the efficacy of this kind of "belief treatment", we made a test by installing
• a positive belief concerning CSCL in a group that would work using computer-supported collabora-tion;
• a positive belief concerning work without CSCL in another group of students who would work in-dividually, with no compulsory collaboration via internet.
We checked the satisfaction of the participants at the end of both courses and observed that both groups were satis-fied with the methodology (see diagram 7 below).
Diagram 7: Equal satisfaction with to opposite methodologies
138
Proceedings of The 4th International Multi-Conference on Society, Cybernetics and Informatics (IMSCI 2010)

This demonstrates that it is possible to install the beliefs requested to have successful and joyful learning, what-ever the methodology.
CONCLUSIONS
Among our conclusions after having experienced this approach, the first could be that any technology is effi-cient as soon as people using it are convinced that they will succeed using it. Its corollary is certainly true too: no technology will work efficaciously if the belief question is not properly ad-dressed.
It also appeared clearly that the belief issue is particularly important in distance learning, since there are less – if any – opportunities for reframing, motivating and en-couraging than in traditional classroom-teaching.
A last conclusion, that progressively emerged through the interviews, is that the most important belief that should be present at the beginning of any course is that the course is going to bring pleasure and fun.
SFIVET's New Teaching Laboratory therefore developed its new models by paying more attention to the needs and beliefs of the learners than to technology.As a result, people learn with more pleasure and less fear, get better results at the end and are grateful to the teach-ing team.
REFERENCES
[1] Guidelines for the implementation of effective e-learning courses based on collaboration, published by the European Education and Culture Socrates Minerva Project "Social networks and knowledge construction promotion in e-learning contexts, 2008.
[2] R. Rosenthal and L. Jacobson, Pygmalion in the classroom - Teacher expectation and pupils' Intellec-tual development, Holt Rinehart Winston; First Edition edition January 1, 1968.
[3] R.S. Feldman and T. Prohaska, The student as Pyg-malion: Effect of student expectation on the teacher, Journal of Educational Psychology, 1979.
[4] Ph. Meirieux, Apprendre, oui, mais comment?, ESF éditeur, Paris,1987.
[5] R. Dilts and J. DeLozier, Encyclopedia of Systemic Neuro-Linguistic Programming and NLP New Cod-ing, NLP University Press, Scotts Valley, CA,2000
[6] R. Dilts, Changing Belief Systems with NLP, 1990
m.s. / April 8, 2010
139
Proceedings of The 4th International Multi-Conference on Society, Cybernetics and Informatics (IMSCI 2010)

A Case Study: Student-Centered Course Development for a Sustainable Building/BIM Class
Kevin L. Burr, Ed.DBrigham Young University
Provo, UT
Course development for construction management (CM) programs, and arguably all of higher education, is
difficult to keep up with, let alone to create. This study describes the use of creative strategies for course design
testing the utilization of student involvement as an effective approach in the design process. CM students were
directly involved in the creation and development of a new and potentially required course at Brigham Young
University in Sustainable Building and Building Information Modeling (BIM). This paper discusses how
students involved in the course development effectively worked through the process to develop the new class.
Techniques in qualitative research and course design along with the current and crucial topics of Sustainable
Building and BIM are emphasized.
Key words: Creative Course Design, Building Information Technology (BIM), Sustainable Design
INTRODUCTION
Much of the building industry is redirecting its focus from
traditional production methods to environmentally friendly,
cost-efficient technologies. As Americans become more
concerned about energy conservation and eco-friendly
buildings, companies are taking notice.
Changes in building construction practices have created a need
for new education courses. Recent demand for green or
sustainable construction practices has compelled the building
industry to embrace sustainable design and BIM (Building
Information Modeling), a design and planning process on the
forefront of building technology. BYU’s Construction
Management Department needed to create new coursework to
update the core curriculum or graduate unprepared students.
Curriculum and/or coursework that would assist students in the
undergraduate construction management program at Brigham
Young University to learn about sustainable design and BIM
was limited. In the CM Architectural Drafting course, students
gain limited exposure to BIM. Building upon and enhancing
this basic introduction was identified as a direction for the new
course. Due to the still emerging nature of sustainable design
and BIM technology, BYU’s new course must create a
balance between including instruction of proven methods
while also continuing to address novel changes in industry
trends.
When the need for a new course in green building concepts and
BIM became apparent, the timing was ripe to not only create a
course, but also create a change in the curriculum development
process, thus, adding not only updated courses to the
curriculum, but also updated teaching strategies focused on
giving students increased control over their own learning.
Instead of developing the course solely as faculty, the
responsible professor felt it would add additional value to the
course to include students and industry professionals in the
process. The students are the ones who take the classes; they
are the ones who are going to work in the industry.
Incorporating their input is the best way to assure that the
course they created would be tailored to their interests, needs,
and abilities. Not only would future CM students benefit from
their efforts, but the students participating would perhaps gain
even greater knowledge through the research and development
process.
REVIEW OF LITERATURE
Facilitating increased student learning should be the focus of
any educator. Teachers often seem to get caught up in the
frenzy of a multitude of academia demands, drastically lacking
the time and energy to do much else, and finding themselves
moving along in the education fast lane. Thus,
teaching/learning techniques seldom change, courses are
seldom retrofitted, and, despite rapid adjustments in technology
and social change, new courses and curriculum restructuring
seldom keep pace.
For generations, not only higher education, but most of
education in general, sees students in classrooms where
teachers “teach” and students “get.” As Cohen and Brawer
[1989, p.155] put it, this still has not changed much,
“It is reasonable to assume that in an institution
dedicated since its inception to ‘good teaching,’ new
instructional forms will be tried. However . . .
traditional methods of instruction still flourish.
Visitors to a campus might be shown mathematics
laboratories, the media production facilities, and
computer-assisted instruction programs. But on the
way to those installations, they will pass dozens of
classrooms with instructors lecturing and conducting
discussions just the way they and their predecessors
have been doing for decades.”
Currently, much of the way that college professors approach
education is still based upon the lecture
transfer tradition of stated curriculum objectives and
instructor-centered teaching, even though strict adherence to
such teaching methods is known to limit critical thinking and
student retention. In general, college students retain little of
what they supposedly have learned. “Although a very few
studies report exceptionally high values, such as students
retaining 50% of the course content, studies more commonly
report a retention of 20% or less” [Gardiner 1998].
140
Proceedings of The 4th International Multi-Conference on Society, Cybernetics and Informatics (IMSCI 2010)

Categorization of Creative Processes Based on Case Study
Yohei HARA, Tsutomu OHTA, Toshio SANO, Shuichiro ONO and Hiroyuki ONO
Department of Management Information Science, Chiba Institute of Technology,
2-17-1 Tsudanuma, Narashino, Chiba, 275-0016 Japan
ABSTRACT
Creativity is one of the essential ability in business society.
Therefore we performed a case study of creative processes in
various fields such as business, design, science etc. We had a
hypothetical conclusion that a creation is defined as
production of a new information element and the new
information element is produced by the combination of two
already known information elements. In this study the
equation of creation is given as A*B=N, where A and B are
known elements and N is the new element produced and we
added K which is another element describing the clue of
creative process in the creator’s mind. In our case study we
found that every creative case can be described as a set of 4
elements (K, A, B, N) and then we have examined the
relationship among these 4 elements.
Keywords: Creativity, Creation, Business, Information,
Creative process, Categorization
1. INTRODUCTION
Creativity is one of the most important ability for young
workers to be expected to have. In order to develop a
practical educational program for creativity, we were forced
to face the essential question of what creation is. We have
reviewed previous researches on creativity and it is noted
that many researchers think of a creation as a combination of
known old elements [1]. J.W.Young said in his famous
book [2] that an idea is nothing more nor less than a new
combination of old elements.
2. THE OUTLINE OF OUR STUDY ON CREATIVITY
[3, 4, 5, 6, 7, 8, 9]
We set forth the hypothesis on the creative process in the
creator’s mind that a new information element (N) is
produced by the new combination of two known information
elements (A and B). So the process is described as
A * B = N
We call it ‘the equation of creation’ in this paper [3].
Over 400 creative cases collected in various fields such as
business field, design field, science and technology field
have been analyzed using the equation of creation to K, A, B,
N where K is another element which describes the clue for
the creator to initiate the creative process. So each creative
case has been described as a set of 4 elements (K, A, B, N).
3. THE LEVEL OF CREATION [3]
The equation of creation suggests that creativity is partly
skill and a technical education might be effective. It should
be noted that creative cases collected in the present study are
remarkably different from those of most previous studies.
Their concern is the very high level creative mind such as
Beethoven, Poincare, Darwin, Goethe et al. From the results
of many previous efforts for creativity training, we conclude
that it is hardly possible to teach such a high-level creativity
by simple technical training. In this study, we paid
attention not only to high-level creative cases but also to
rather low-level cases from the reason described in the
following. If we count all creative cases in an organization,
most of the cases are low-level ones and the very limited
number of high level ones are included. We have a
hypothesis that the ratio of the number of high-level cases to
that of low-level cases in a given organization is constant. If
it’s true, some training will be effective to increase the
number of low level cases and eventually to increase high
level ones.
We used the term of ‘level of creation’ without
explanation. Although to define exactly this term is difficult,
the level of creation is defined as the sense of distance
between A and B. If A and B are easy to be connected, the
141
Proceedings of The 4th International Multi-Conference on Society, Cybernetics and Informatics (IMSCI 2010)
sense of distance is close and the level is low. If B is hardly
hit from A, the sense of distance is far and the level is high.
The level of creation is supposed to have a wide continuous
range.
4. METHOD
We collected over 400 cases from various fields such as
business, design, science and technology and advertising.
Cases in the business field were mainly obtained from
hearing of students and graduates of our department, because
we were especially interested in the creativity which young
workers are expected to have in the daily work. The cases
obtained were mostly low-level cases. Most of the high-level
cases were collected from books, magazines, web sites, TV
and newspapers. These data were already published in the
previous paper [4]. A case study were also made on design
field, collecting creative cases from hearing of 2 architects, a
hair designer and a commercial designer and also from
books [5]. A case study in science and technology field
was made using 65 original research papers of S.Ono, one of
the present authors and published [6]. These reports are all
written in Japanese.
All creative cases collected above were analyzed using the
equation of creation. In the process of analysis we found
another element K is important, which describes the clue for
the creator to start the creative process. Trial was made to
clarify the relationship among K, the clue element, A and B,
the already known elements, and N, the new element
produced.
5. THE EQUATION OF CREATION
All creative cases were able to be analyzed into the
elements, A, B, and N easily. Although K, the clue for the
creator to start the creative process, can only be identified by
the creator and sometimes was difficult to be fixed. For most
such cases, however, we tried to estimate K. Through
analysis of over 400 cases, we have obtained one set of 4
information elements, K, A, B and N for each creative case.
From these results the equation of creation was proved to be
generally applicable to all creative cases. Only 8 of them are
selected and listed as typical cases in Table 1.
In this study creative cases of a wide range of level are
included. For example the lowest level is the case of No.1 in
Table 1, where he only input the daily obtained data into a
computer according to the manual. This is sort of routine job,
far from creation. However, according to the equation of
creation, the following equation can be written.
(Daily sales slip data) * (The manual) = (Daily sales data
in Excel database)
This is the lowest level of creation. These routine work is,
however, essential for the company. The value is based on
the new information they produced. The lowest level means
the sense of distance between A (Daily data) and B (The
manual) is nearly zero. The sense of distance corresponds to
the difficulty of finding B from the point of A. In the case of
No.2 ‘Kaiten sushi’, the creator who was looking for a new
model of sushi restaurant happened to get an idea from
conveyor belt in a beer manufacturing company. B
(Conveyor belt) is not easy to reach from A (Sushi
restaurant) and the sense of distance is far and the level is
high. The level does not mean the economical value. A very
easy combination sometimes makes a big business. One of
the good example is No.3 ‘Hamburger’. Although this is a
simple mixing of 2 elements in the same field and the sense
of distance between A and B is close, hamburger has become
a big business in these days. The general way of thinking in
the creator’s mind is described as ‘First K fixes A, then
search B’. This searching is the most difficult process and
greatly depends on one’s ability. Even when the creator
cannot fix A directly from K, the mind will fix A1
temporarily, then search B and if A1 does not work well, the
mind replaces A1 by A2 , then search B again, and so on. If
the creative process is subdivided, the fundamental way of
thinking is as shown above. The present investigation aims
at understanding various combination patterns of A and B
and obtaining important information for developing the
education program.
6. CLASSIFICATION OF CREATION PROCESSES
K is the clue which leads to the creative process and was
found to be the essential element to distinguish creative
processes. For a young worker in the office, a task is usually
given to him by the superior and the task becomes A. Of the
two known information elements the one which is closer to
K is always set as A. So A is fixed and then the creator is
142
Proceedings of The 4th International Multi-Conference on Society, Cybernetics and Informatics (IMSCI 2010)

going to search B in the range of known elements in his
mind. It is the most typical creative process that A is derived
from K and then B is the target of searching. The most
essential process in creation is this searching, because any
combination of known elements does not necessarily yield a
new valuable information element. The probability is very
low. The creator searches B in various fields, sometimes in
very close field around A, or sometimes in a field far from A.
Although the former case might be excluded as a routine
work, there is not any discriminative difference except the
sense of distance between A and B. According to the
relationship between K and the other elements, the cases
were classified into three types, (1) K=A type, (2) K=N type,
and (3) K A, N type. This classification is named K type
classification. Another categorization named combination
type is based on the relation between A and B.
7. K TYPE CLASSIFICATION [3, 9]
K type classification is based on the relationship between K
and the other elements. We analyzed the relationship using
over 400 cases and we found that these cases can be
classified into 3 types.
(1) K=A type
This type describes the creative case where A can be
specified from K. Most of the cases analyzed in this
study are ascribed to this type. Our way of thinking is
usually follows this process, ‘First K fixes A, then
search B’.
(2) K=N type
This type means that the concept of N is deduced from
K.
(3) K A,N type
This type means K is not directly related to A nor N.
8. COMBINATION TYPE CLASSIFICATION
Though K type classification is based on the relationship
between K and the other elements, the combination type
classification which is based on the relationship between A
and B is more important for training how to search B. Most
cases of our study were able to be classified to K=A type.
Usually the creator thinks according to the K=A type process
as already mentioned above. That means the process will be
described as ‘First K fixes A, then search B’. Searching area
for B is all information existing in the creator’s mind. If B
exists near A, B is easily found, but if B is far from A,
searching B is not easy. The further is the sense of distance
between A and B, the more difficult is B to be found.
The classification by combination type is possible only
within the limited range of sense of distance. However it
should be noted that there still exists unlimited information
area beyond this range, where the combination type can only
be ascribed to By-chance type. It means that By-chance
type combination is not exceptional but essential. Table 2
summarizes the result of categorization of over 400 cases,
which were classified into 26 combination types in 10
groups. The meaning of each type is given briefly in the
Table 2. Although the sense of distance is not so quantitative
parameter, combination types in Table 2 are listed in order of
the sense of distance from close to far as much as possible.
‘Kaiten Sushi’ is the case of No.2 in Table 1. We classify
this case into ‘Association type’. In this case Mr. Siraishi,
who was the owner of Tachigui Sushi restaurants, was
looking for a new model of sushi restaurant. One day he had
a chance of visiting a beer manufacturing company and the
moving conveyor belt made him associate with a turning
conveyor sushi table. The word of association means that
the intended purpose has changed from the original conveyor
in the factory to the conveyor sushi table. This change of
purpose makes the association type different from the simple
introduction type.
These combination types have been obtained empirically by
ascribing 400 creative cases to each type. It should be noted
that classifications from different viewpoints are mixed and
some of the types are overlapped in Table 2. These
combination types, however, should be quite helpful for
searching B.
9. CONCLUSION
The following direction will support the effective
educational program to make students understand how to be
creative.
(1) The creative process can be described using 4
information elements K, A, B and N. K is the clue to
initiate the creative process. The equation of creation,
A*B=N, where N, the new information element, is
produced by the combination of A and B which are
143
Proceedings of The 4th International Multi-Conference on Society, Cybernetics and Informatics (IMSCI 2010)

already known information elements. This means that
the creation is a thoughtful imitation. ‘Thoughtful’
means that N imitates both A and B simultaneously.
Imitation is important for creativity. The equation of
creation makes it easier for students to understand the
technical aspect of creativity.
(2) For systematization of creative processes, there are 2
types of classifications, K type and combination-type.
K type is based on the relationship between K and the
other elements. According to K type the cases are
classified into three K types, K=A type, K=N type and
K A,N type. K=A type is the most popular pattern for
the creative process, where the process proceeds like ‘K
specifies A, then B is searched’. The combination type
is based on the relationship between A and B.
According to combination type the cases are classified
into 10 groups, 26 types.
(3) Although the classification by combination type is
possible within the limited range of distance, there still
exists unlimited information area beyond the range,
where the combination type is ascribed to By-chance
type. It means that By-chance type combination is not
exceptional but essential.
(4) Although the creativity required in the daily work is not
so high-level, there exists high-level creativity and
students should recognize what the difference is
between high-level and low-level.
(5) The best way for education is to show as many cases as
possible and make students understand each case.
10. REFERENCES
[1] M.Takahashi(eds): The Bible of Creativity
(Nikkagiren Publishing, 2002).
[2] J.W.Young: A Technique for Producing Ideas
(IBC Publishing, 2005).
[3] S.Ono, T.Ohta, K.Hatta, T.Sano, Y.Hara and
Y.Miyokawa: A Study of Creative Processes Based
on the Relationship between the Clue Element and
the Other Information Elements. International
Journal of Japan Association for Management
Systems, Vol.1, No.1(2009),13-18
[4] T.Ohta, T.Sano and S.Ono: Case Study on Creativity
in Business Field. Journal of Japan Association
for Management Systems, Vol.21, No.2 (2005),
87-98 ( In Japanese)
[5] T.Ohta, T.Sano and S.Ono: Case Study on Creativity
in Design Business Field. Journal of Japan
Association for Management Systems, Vol.24,
No.1(2007),77-82 ( In Japanese)
[6] S.Ono, T.Ohta, K.Hatta, T.Sano, Y.Hara and H.Ono:
Case Study on Creativity in the Field of Science and
Technology. Journal of Japan Association for
Management Systems, Vol.25, No.2(2009),67-74
( In Japanese)
[7] T.Ohta, T.Sano and S.Ono: An Approach to
Enterprise Practice under the Cooperation of
University, Industry and Government. Proc. Int.
Conf. on Education and Training Systems,
Technologies and Applications, Florida, USA, July,
vol.2 (2004),335-338.
[8] T.Ohta, S.Ono and T.Sano: Case Study on Creativity
in Business Field for Internship Educational
Program. Proc. Int. Conf. on Education and
Training Systems, Technologies and Applications,
Florida, USA, July, vol.1 (2005), 290-297.
[9] Development Center of Creativity Education
Program, Chiba Institute of Technology: The
Equation of Creation (Voyager Publishing, 2010)
(In Japanese)
144
Proceedings of The 4th International Multi-Conference on Society, Cybernetics and Informatics (IMSCI 2010)

Ta
ble
1. C
rea
tiv
e ca
ses
form
ula
ted
as
KA
*B
=N
Tit
leD
etail
sK
AB
NK
-ty
pe
Com
bin
ati
on
typ
e
Sen
se o
f
dis
tan
ce
Inp
ut
dai
ly
sale
s sl
ip d
ata
Ret
aile
r. I
np
ut
dai
ly s
ales
sli
p d
ata
into
PC
.D
aily
ro
uti
ne
work
Dai
ly s
ales
sli
p d
ata
The
man
ual
Dai
ly s
ales
dat
a in
Ex
cel
dat
abas
e
K=
AL
ogic
Clo
sest
Kai
ten S
ush
iIn
1958,
Mr.
Sir
aish
i, w
ho w
as t
he
ow
ner
of
Tac
hig
ui
Su
shi
rest
aura
nts
, h
ad
an i
dea
of
Kai
ten
Su
shi,
wh
en h
e lo
ok
ed a
t th
e
con
bey
or
bel
t in
a b
eer
man
ufa
ctu
rin
g
com
pan
y.
He
was
lookin
g f
or
a new
model
of
sush
i re
stau
rant.
Sush
i re
stau
rant
Convey
or
bel
t'C
onvey
or
sush
i ta
ble
'
(Co
nce
pt
of
Kai
ten
Sush
i)
K=
AA
ssoci
atio
nF
ar
Ham
burg
erIn
1904 h
amburg
er w
as f
irst
sold
at
the
Worl
d E
XP
O h
eld
in
Sai
nt
Lo
uis
. S
ince
ham
burg
was
too h
ot
to b
ring b
y h
ands,
they
pu
t it
bet
wee
n r
ou
nd
bre
ads
lik
e
sandw
ich.
Hot
ham
burg
Hot
ham
bu
rgS
and
wic
hH
amb
erg
erK
=A
Imit
atio
nC
lose
Man
agem
ent
of
too
ls
In t
he
fact
ory
, si
nce
all
to
ols
had
bee
n k
ept
in o
ne
bo
x,
it h
ad t
aken
tim
e to
fin
d a
nec
essa
ry t
oo
l.
Sin
ce a
ll t
ools
had
bee
n
kep
t in
one
box,
it h
ad
taken
tim
e to
fin
d a
nec
essa
ry t
ool.
Man
agem
ent
of
too
lsA
rran
gem
ent
Th
e to
ols
wer
e d
ivid
ed
into
sev
eral
spec
ies.
Th
e
sam
e sp
ecie
s w
ere
pu
t in
to
on
e b
ox
on
wh
ich
th
e to
ol
nam
e w
as w
ritt
en b
y
mar
ker
pen
.
K=
NL
ogic
Clo
se
Red
uct
ion
of
sludge
trea
tmen
t
expen
se
His
com
pan
y h
ad b
ought
caust
ic s
oda
for
slu
dg
e tr
eatm
ent.
He
read
by
ch
ance
an
arti
cle
in t
he
mag
azin
e p
ub
lish
ed f
rom
Yo
ko
ham
a ci
ty o
ffic
e t
hat
th
e o
ffic
e o
ffer
s
free
cau
stic
so
da
and
succ
eed
ed t
o c
ost
reduct
ion a
bout
500000 y
en p
er m
onth
.
Rea
d t
he
info
rmat
ion o
f
free
causi
tic
soda
by
chan
ce
Info
rmat
ion
ab
ou
t fr
ee
cau
stic
so
da
fro
m
Yo
ko
ham
a ci
ty
Info
rmat
ion a
bout
expen
sive
caust
ic s
oda
for
sludge
trea
tmen
t
Red
uct
ion
of
slu
dg
e
trea
tmen
t ex
pen
se
KA
,NB
y c
han
ceF
ar
Co
st r
edu
ctio
n
for
the
ou
tsid
e
ord
er o
f
gil
din
g
He
was
in
ch
arg
e o
f th
e o
uts
ide
ord
er o
f
gil
din
g a
nd
fo
rced
to
cu
t re
du
ctio
n t
he
cost
of
ou
tsid
e o
rder
.
Was
forc
ed t
o c
ut
the
cost
of
outs
ide
ord
er o
f gil
din
g.
Ou
tsid
e o
rder
of
gil
din
g t
o
a g
iven
man
ufa
ctu
rer
as
bef
ore
.
Met
ho
d o
f co
mpet
itiv
e b
id.
Intr
od
uce
d t
he
com
pet
itiv
e
bid
met
hod t
o h
is c
om
pan
y.
K=
AIm
itat
ion
Clo
se
Par
t-ti
me
job
at g
as s
tati
on
Par
t-ti
me
job
at
a g
as s
tati
on
. C
ust
om
er's
cars
wo
n't s
top
at
the
exac
t p
osi
ton
fo
r
feed
ing
. T
hen
pro
po
sed
to
dra
w a
wh
ite
sto
p l
ine
on
th
e g
rou
nd
an
d i
t w
as e
ffec
tiv
e.
Wan
ted t
o m
ake
cars
sto
p
at t
he
good p
osi
tion f
or
feed
ing.
The
posi
ton o
f cu
stom
er's
cars
fo
r g
as f
eed
ing
Sto
p l
ine
Car
s st
op
ped
at
the
wh
ite
lin
e
K=
AIn
troduct
ion
Med
ium
Snow
mel
ting
syst
em
Th
e co
mp
any
's m
ain
pro
du
ct i
s th
e fl
oo
r-
hea
tin
g s
yst
em.
He
inte
nd
ed
to e
xte
nd
th
eir
core
tec
hn
olo
gy
to
oth
er a
pp
lica
tio
ns.
Th
en
pro
po
sed
to
ap
ply
it
to a
new
sn
ow
-mel
tin
g
syst
em f
or
road
s.
dev
elopm
ent
of
new
pro
duct
s
Th
e fl
oo
r-h
eati
ng
sy
stem
(Co
re t
ech
no
log
y)
Snow
mel
ting
New
snow
mel
ting s
yst
emK
=A
Exte
nsi
on
Far
145
Proceedings of The 4th International Multi-Conference on Society, Cybernetics and Informatics (IMSCI 2010)

Table 2. Combination type
Combination type Meaning
GP.1 Logic type
1. Logic type If the clue K is recognized, B is logically found easily. That means the sense of distance is
close.
GP.2 Introduction type
2. Introduction type To introduce a thing known in the outside into the inside.
3. Imitation type To imitate something already known
4. Experience type Experience is used as B to solve the problem
5. Knowledge type Knowledge is used as B to solve the problem
6. Custom type To use some social custom in the business
GP.3 Parameter-change type
7. Parameter-change type Originality is aimed by changing one of the parameters in the existing system.
8. Experiment type Experiments are performed in order to search the best condition.
9. Size-change type One of the elements of the system is enlarged or reduced.
10. Concentration type Cases where selection and concentration of the variables in the existing system are tried
for optimization.
GP.4 Extension type
11. Extension type To fix one's original thing as A and search its new application as B.
12. Use-development type To search new uses of remains
13. Exchange type To exchange one part of the system for another.
14. Substitution type To substitute one part of the system.
GP.5 Anti-commonsense type
15. Anti-commonsense type Cases where the commonsense is destroyed.
GP6. Combination-in-different-genres type
16. Combination-in-one-genre
type Combination of two things in the same genre.
17. Combination-in-different-
genres type Combination of the two things from different genres
GP7. Functional-combination type
18. Functional-addition type Addition of a new function to the existing system.
19. Functional-combination
type Combination of two functions into one system.
20. Unification type Cases where disjointed information elements are summarized or unified into a knowledge
GP8. Association type
21. Association type To use a known thing in a different way from its original use.
22. Functional-application
type To use a thing known outside from the functional point of view.
23. Correlation type To apply a thing known outside from the viewpoint of correlation
24. Analogy type To associate different things in analogy
GP9. Sensitivity type
25. Sensitivity type Cases where there exists no single answer and selection is strongly dependent on
personal sensitivity.
GP10. By-chance type
26. By-chance type Combination of A and B happened by chance. No clue K to the creation is existent.
146
Proceedings of The 4th International Multi-Conference on Society, Cybernetics and Informatics (IMSCI 2010)

The use of adaptive individualized e-learning at teaching �
Ing. Kateřina Kostolányová, Ph.D. Department of information and communication technologies, University of Ostrava, Pedagogical faculty
Ostrava, Czech republic
and
Doc., RNDr. Jana Šarmanová, CSc. Department of Infornatics, Technical university of Ostrava, Faculty of Electrical Engineering and Computer Science
Ostrava, Czech republic
and
Ing. Ondřej Takács Department of Infornatics, Technical university of Ostrava, Faculty of Electrical Engineering and Computer Science
Ostrava, Czech republic
ABSTRAKT
The significance of the distant learning is not a
novelty, yet in terms of the study effectiveness the
conventional e-learning is not sufficient. A new
model of learning is based on the new paradigm –
the personalization of teaching environment taking
into consideration the personal parameters of
students, their abilities, learning styles, etc. That
possibility is offered by current systems only in a
very limited scope.
The paper deals with the description of an
individualized e-learning system which
automatically adapts the different characteristics
and learning styles of students. The system consists
of three modules: Within the Student Module, the set
of mutually independent student characteristics
influencing the process of their learning styles has
been designed on the basis of analysis of published
classifications. For the Virtual Teacher Module
variants of teaching procedures wieldy via e-
learning form corresponding with the determined
student characteristics have been designed. And
finally, the Adaptive Module is represented by a set
of adaptive algorithms selecting optimal study
materials for individual types of students. All those
mechanisms will be applied in the new adaptive
LMS. The contribution involves a pilot description
of the proposed structure, including the description
of learning styles analysis and its results, and
finally, next gradual development of the issue being
solved is formulated here.
Keywords: e-Learning, LMS, teaching styles, study materials, multimedia, learning style, teaching strategies
1. INTRODUCTION
We are living in a society in which information and communication technology (ICT), specifically e-learning, are becoming an impetus of its development. Those who are looking for the e-learning word certainly appreciate, that it involves a new form of education recently experiencing its boom. The reason is time, quick changes and the necessity of lifelong education.
E-learning in a broad sense means the process. It describes and solves the development, distribution and management of teaching including feedback on the basis of an e-course. Those applications cover simulations, multimedia lessons (combinations of text interpretation with animation graphics, charts, audio files, video sequences and electronic texts). It is said that each student can select a form of education which suits them best. We will try to raise that idea and aim at the method and form of the subject matter presentation to students. Can today´s courses be tailor-made for various types of students?
We will dive into a routine e-course in detail. Many conferences, seminars and workshops focused on the e-learning area offer a large quantity of courses of various quality. [1] They differ in terms of thelevel of feedback and forms of communication management. They have one common feature – the courses are submitted to students in a single compact form of a precisely planned passage of the course. Frequently conducted evaluations and investigations show that the defined passage through the course as such does not need to be suitable for each individual. It would be easy to object – let the student choose a different form of study. Yes, even that could be a solution, but let us try to look at this issue from a different point of view while considering the student and let us adjust teaching in an e-course according to their needs and abilities.
147
Proceedings of The 4th International Multi-Conference on Society, Cybernetics and Informatics (IMSCI 2010)

The main idea of the outlined issue rests in finding optimum adaptive methods of passing through the e-course on the basis of the determined learning style with regard to the changing knowledge and skills during the course of the whole study in a particular course. There are several motivations and reasons for the implementation of intelligent computerized teaching. The key ones are the following:
• For certain students mass teaching is boring and takes up their time, some believe that it is too quick and they have little time for understanding it all. That is why it is necessary to come up with a tailor-made teaching process for the sake of its optimisation.
• Technology aspect; the computer can present information in many ways, it integrates “computing”, work with text, pictures, sound, video, etc. and can organize it all, including monitoring, keeping statistics, evaluation, etc.
These trends cannot be ignored. Our objective is not to let students study from conventional text-books, which could result in superficial, short-term knowledge without a deeper understanding and use in practice. The aim is to prepare students for thefield, no matter if they want it or not. One of the possibilities on how to handle the situation better is to develop proficient e-learning distant textbooks. Those will be adapted to students as much as possible while informing them on what they must know and to what extend and what mark they will get for their knowledge.
2. THE PRINCIPLE OF THE
ADAPTIVE ENVIRONMENT
DEVELOPMENT
Teaching via computers has already been used for a long time. In general, it means utilisation of the internet environment together with the learning management system (LMS), in which learning supports and functions for learning management, followed by the information system monitoring students and their activities and the saving of results. [2]
If students learn without direct contact with a teacher, they usually use textbooks. A good textbook can be understood as a different form of teacher; the author has contributed their optimum procedure of presentation, their scope and level of detail of submitted information. We know that conventional textbooks complement the direct presentation of a teacher, while textbooks for individual study – self-learning, distant – should substitute both the presentation of a new content of study, and communication with a teacher, followed by practicing the content, etc.
The system proposed by us consists of three parts:
Fig. No. 1 - Adaptive models
3. PERSONALITY OF STUDENT AND
THEIR CHARACTERISTICS
For the teaching program to be able to respond to the various personalities of students we must select, describe and suitably store student characteristics into the system including other attributes, which have an impact on his/her learning process. Regarding their obtaining, those characteristics will be of various types. [3]
One group can be obtained from the student directly via a suitable questionnaire, the second by his/her testing before the initiation of learning and finally the third by a long-term monitoring of his/her study activities. The third group as a method of feedback can be utilised not only during the current learning, but can be also used for modification of the student`s characteristics, or monitoring his/her development, if required. [4]
Learning styles are the key component of statistic characteristics of the student. There is much literature available dealing with learning styles and a series of their classifications. Their authors often define two-value dimensions, and according to those they divide learning styles into four quadrants, corresponding to their four combinations. Typically, for example [5] uses two-value dimensions called:
1. method of obtaining information with poles: preference of a specific experience/abstract concepts,
2. method of processing experiences with poles: active experimenting / cogitative observation
Their combinations result in the established 4 learning styles: divergent (1a + 2b), convergent (1b + 2a), assimilating (1b + 2b) and accommodating (1a + 2a).
Another example of classification using 2-value dimmensions is in [6], later [7]. The author defines dimension 1 as perception, a tool of information assumption with poles of discreteness / concreteness and dimension 2 as a way of information processing with poles of random / sequential. And again, combination of dimensions
148
Proceedings of The 4th International Multi-Conference on Society, Cybernetics and Informatics (IMSCI 2010)

will ensue in 4 types of learning styles called concrete-sequential, concrete-random, discrete-sequential and discrete-random.
The characteristics applicable in e-learning were structured into the following parts: • perception – intuitive perception – logical; • sense perception: visual – auditive – kinesthetic -
verbal; • social aspects: the student likes to work alone –
with teacher – in pair – in a group; • affective aspects: motivation to study – internal,
external; • learning tactics:
• orderliness with poles logical (the student solves problems according to instruction, order) – heuristic (freedom, the student is creative at solving)
• method with poles of theoretical derivation – experimenting
• method with poles detailman, bottom-up – holistic, top-down
• conception with poles of in-depth – strategic - superficial
• self-regulation with poles of directive (dependent, unable to organize the studies, they need instructions) – shared – free (entirely independent).
4. TESTING AND DATA ANALYSIS
OF LEARNING STYLES
It would not be useful to define n-tuple theoretically, if we were not able to determine its value for each student. We can use questionnaires for that, where students directly describe their characteristics, or suitable tests, where students answer a series of questions and the result is determined from combinations of their answers. We combined the following questionnaires: VARK, LSI, ILS, TSI, ASSIST, or their parts, dealing with e-learning education. [8] So far, that pilot group of questionnaires has not been verified or validated. Yet in that group of questionnaires data were analyzed to verify technical possibilities of analyses and types of potential results, which can be useful for future development of questionnaires. Those questionnaires were completed by 350 students, one-third of those of secondary education and the rest involved university students of various disciplines – informatics, economists and pedagogues.
The first objective was to determine potential dependencies among defined characteristics and consequently to reduce the number of characteristics without limitation of the resulting
information scope. To do so, factor analysis was applied. The next objective was to obtain information on the distribution of theoretically possible combinations of characteristics in actual population of students via cluster analysis. Thus it was possible to come up with a lower number of real learning styles. And finally, via construction of decision trees it was investigated, which characteristics we can consider to be predictive, i.e. those from witch, on the basis of their knowledge, we can predict other characteristics of students.
Additionally, we will present results of individual types of analyses of given data. Due to a small scope and low quality of data sources, the stated results should be considered only as illustrative.
Main components
The method of main components involving given data creates its new representation via mutually independent components which cover the given data of various scope.
The expectation on well designed questionnaires has not been confirmed, because the number of main components determined from answers of questionnaires exceeds the number of main components determined from results of questionnaires severalfold. Another possible explanation is, that students completed the questionnaire irresponsibly, or some questions were incorrectly understood, so students answered various questions of the same characteristic differently.
Analysis of the main components of sensual types confirmed, that individual sensual types form jointly the component of multi-modal type.
It has been shown, that the resulting characteristics were mutually dependent. Out of the original 28 characteristics it would have been enough to have only 18 main components to cover variability of the majority of data. The number of characteristics describing a student could be reduced to the main found components, but the interpretation of such new characteristics would not be obvious. Therefore, it is more advantageous to maintain the original characteristics. The reason for these independencies among student characteristics probably stems from the fact, that those characteristics arise from several different questionnaires which aim at various groups of characteristics.
Analysis involving decision trees
The method of decision trees applied in connection with the given data reveals a certain quantity of interesting rules, represented in the form of a tree. This way, it is possible to find predictive
149
Proceedings of The 4th International Multi-Conference on Society, Cybernetics and Informatics (IMSCI 2010)

characteristics, which determine the values of other characteristics.
The most interesting results were found in sensual types. The auditive types of students depend strongly on the fact, whether they are the multimodal types or not. If so, then such students are mostly the auditive types, too. The same result came up even in visual and verbal types of students. That finding confirms one of the results of analysis of main components, where the multimodal type resulted as the main component. Regarding the kinesthetic type, that dependency came up slightly differently. It appears, that for those data the kinesthetic sensual type can be completely left out and substituted with the remaining sensual types, specifically with the multimodal and visual. For it became clear, that overwhelming majority of the multimodal types are at the same time of the kinesthetic type. Additionally, that result is greatly supported, which indicates that the same result could appear even in different data.
Moreover, we were also surprised by another result which indicated that the students who exhibit smaller responsibility to their study prefer to learn with classmates as opposed to those who are more responsible.
Regarding social characteristics, as opposed to literature, the data revealed a connection with responsibility at learning, whereby responsible students prefer to learn on their own, but irresponsible prefer to learn with classmates.
Furthermore, the influence of student characteristics on their self-assessment was investigated and it appeared that the major influence on positive self-assessment comes from good organization of learning, above all.
Cluster analysis
Cluster analysis is a method of discovering, via data, the groups of mutually similar objects, yet different from others.
According to all characteristics no significant clusters came up for clustering, only a certain quantity of isolated points. Fig. No. 1 shows a clustering tree, so-called dendogram, illustrating numbers of clusters for individual levels of similarity. Individual students are illustrated here with individual lines, which are at certain levels of similarity connected with vertical lines to clusters. The most significant level of similarities is indicated as a bold line on the upper axis. At this level, only a single sufficiently large cluster appears, which includes students with a single common characteristic: the auditive type of sensing. That result suggests that there are no groups of students who would be similar in the majority of characteristics. That can indicate the fact that
students are covering the space of all characteristics evenly. But it can also stem from a small quantity of data related to the number of characteristics, and there are also certain parts of questionnaires which are erroneously designed. Another problem can involve poor concentration of students at completing large-scale questionnaires. It will be necessary to develop an easier testing mechanism, thus testing a larger quantity of students. Then, on the basis on a bigger testing sample designed as such, it will be easier to establish groups of similar students – students of the same or similar characteristics. [9]
Fig. No. 2 - the clustering tree, so called dendogram, illustrating numbers of clusters for individual levels of similarity
5. STUDY MATERIALS
Learning certainly requires a source of teaching material. That is on the opposite side of the proposed adaptive management system. Philosophy of study materials development for the adaptive system proposed as such stems from the following idea: Teaching topics (for a particular subject) are described via the so-called terms (topic, chapter). Each term is described via so called metadata involving the name, teaching area to which it belongs, the level of difficulty (according to the level of complexity, detail of explanation) to what multimedia type of processing it belongs, and others. Moreover, the stated facts suggest that each term will occur in the databank of teaching materials in several options (describing the same topic but using different tools). The basic levels of the term include:
150
Proceedings of The 4th International Multi-Conference on Society, Cybernetics and Informatics (IMSCI 2010)

� the level of sensual perception (audio, video, animation, text, …)
� the level of complexity, details in the content of study presentation
� method of presentation (teaching style). Regarding the originator of study materials, their work is quite demanding in terms of time, because the term must be developed in several indicated options, metadata must be described and stored in a database. The database will be developed by particular teaching objects available for the selection of the optimum method of passage through the course. [10] Currently we have been developing teaching materials in options of the mentioned styles, formats and of various level of similarity. We understand how to get sufficient information about a current student and their learning styles, followed by their preliminary knowledge necessary for the study of the current study matter. We are also facing another task – the description of rules, according to which the suitable frameworks will be optimally selected both in terms of the student characteristics, and objectives of teaching (according to the required level of their knowledge – understanding – analysis – synthesis). Then, the stated frameworks will be submitted to the student via continuously asked theoretical questions and tasks to be solved while checking their correct understanding. In case of a positive result it should be continued, but in case of failure the content of study should be explained again, differently, in greater detail, including the presenting of more examples, etc.
6. STUDENT AND AUTHOR MODELS
INTERLINK
Teaching styles will be then adopted to the frequent learning styles. Teaching style is understood as the method of presentation of a teacher, should they teach each student individually. It will be effective to present the content of the study differently to students of abstract thinking and good theoretical background, unlike those students who, for the sake of good understanding, must firstly challenge everything, understand the sense and importance of new information and only then are they able to accept a particular theory. Similarly, it will be suitable to present sections of the content of study to the student preferring a written text unlike the student of acoustic memory, or optical memory, etc. Therefore, each presentation should be processed in a series of methods which differ factually and formally.
The rules will be a logical framework for an adaptive teaching algorithm, for a virtual teacher. They will be formulated by the team of psychologists and pedagogues. The task for the
informatics will be the implementation of those rules. It will involve collaboration of the author database with the expert system which will record characteristics of virtual students, with metadata monitoring the course of student learning and their immediate reactions. All student activities must be continuously recorded: the time spent by particular frameworks, necessity of using other than the selected optimum frameworks, request for further, more detailed presentation or other examples, and of course the correct answers of control questions. The adaptive algorithm should immediately respond to all such information in the course of learning and to a potential change of characteristics following analysis of the whole learning process. It would be ideal to consider each student as an individual characterized by features and learning styles and based on known characteristics to formulate precisely the passage through the course via the most suitable (tailor-made) chapters. That is ideal future. For pilot versions of adaptive algorithms three so-called virtual students were selected. We have described them as such: • „ideal “ students – exemplary, eager to get new
knowledge, showing interest in the subject, capable of independent work, perceiving visually and auditively, looking for details
• „average“ students – visual types, who do not want to “overwork” themselves, yet do not want to fail, they fulfill tasks on time, but at the last moment, they need encouragement at times of failure, otherwise they give up their studies, they can work independently but prefer to be led by the teacher, they favour learning with a friend rather than on their own (they need additional explanation of things, …)
• „underworker“ students – unmotivated, fed up with the fact that they must study, not interested in the subject, unable to learn “without leadership”, without logical thinking, learning “by heart”, a superficial attitude, not looking for contexts.
Those different types of students will be presented the content of the study in different way. The students of abstract thinking and good theoretical background will be presented the content of the study differently to the students who must firstly challenge everything for the sake of good understanding, to understand the sense and importance of new information and only then they will be capable of accepting a particular theory. Similarly, it will be convenient to present differently the content of study to the student preferring a written text than to the student of acoustic or optical memory, etc. For those types of students we have been gradually formulating adaptive rules which will be at the start of the following type:
151
Proceedings of The 4th International Multi-Conference on Society, Cybernetics and Informatics (IMSCI 2010)

• facing a visual type of student, we will choose parts of study materials with an overwhelming share of pictures, diagrams, maps, etc.
• if a student prefers independence, we will not strictly force him/her to the collective task solving (we will offer it, but will not force him/her)
• student is motivated (eager) in a given subject
Those rules are gradually embedded in an educational system under development. The issue of unmotivated students will be analysed on the basis of their personal talent and we will try to adapt to the preferred way while presenting the content of study.
7. CONCLUSION
The aim of the adaptive teaching will not involve only be more adaption of student learning style. Students will also be proposed an optimum way of the passage through the course according to results of testing their characteristics, capabilities and skills. The described ideas of intelligent learning suggest that the project is quite extensive, which requires the collaboration of several types of experts. However, even following implementation of the particular management learning system the task will still not be finished. The author (or better to say a team of authors) should develop teaching supports with various methods for each subject. Their more demanding work will be then rewarded by carefully processed preparations for full time study teaching, supports for distant teaching of very high quality and perhaps mainly by all students whose learning will be of better quality, more speedy and more effective. The resulting high-quality knowledge of students should be the main reward. It is necessary to say, that it is possible to teach individually any number of students while employing a minimum teaching load.
8. REFERENCES
[1] J. MUŽÍK. Rozvoj e-learningu a změny v úloze vysokoškolského pedagoga. Konference E-learning v praxi firemního vzdělávání, Praha : 2002. Perspektivy e-learningu a pedagogická praxe. Dostupné na www.stech.cz
[2] E. MECHLOVÁ, J. ŠARMANOVÁ. Vývoj vzdělávacích multimediálních programů v e-learningovém prostředí. Ostrava: Ostravská univerzita, 2003.
[3] K. KOSTOLÁNYOVÁ, J. ŠARMANOVÁ, Proceedings of the 9th International Conference on Information&Communication Technologies in
Education, University of Ostrava, Czech Republic, 2009, pp. 136-141.
[4] J. MARES, Styly učení žáků a studentů. Praha: Portal (1998).
[5] D. A. KOLB, Experiential learning: Experience as the source of learning and development. (Engelwood Cliffs, NJ, Prentice Hall, 1984)
[6] A. GREGORC, Learning/Teaching Styles: Their Nature and Effects. Reston, Christian Education Journal, 4, 1, 62 (1979).
[7] R. J. RIDING AND I. CHEEMA, Cognitive styles – An overview and integration, Educational Psychology (1991), pp 193-215.
[8] K. DUNN, R. DUNN, G. E. PRICE, Dotaznik stylu uceni. Praha, Institut pedagogicko-psychologickeho poradenstvi, Czech Republic (2004).
[9] K. KOSTOLÁNYOVÁ, J. ŠARMANOVÁ, O. TAKÁCS. Results of analysis of learning styles. Information and Communication Technology in
Education. Ostrava: Ostravská univerzita, 2009. s. 205-210. [2009]. ISBN 978-80-7368-459-4
[10] G. PETTY. Moderní vyučování. Praha. Portál, 1996. s.120-127. ISBN 80-7178-070-7.
�
152
Proceedings of The 4th International Multi-Conference on Society, Cybernetics and Informatics (IMSCI 2010)

������������� ������������������������������������
�������� ��������������������������
����������
��� ����������������� ������ ������� ���� ��� �� ������ ������������
� ������� �� �
��
���� !"
�������������#���� ��$��� ������� ���� ��� �����%�����������������
� ������� �� �
��
& ��
����������'�����������#������������������
#����%� ����(��)*+,��-���� ��
���� �������.�� ������ /�������/�������
���� ������������������ ���������������
���������������� ����������������� 0�����
�����������/����������������������� ���
���������1�"�� ���������� ������.����
�0���������� �������� ���������� �����
������������1��� ������ ������������/��
� �������������������������������������� ���
���������� �������������������� ������
� �����/���������.��1�������������
���� �����0 ��������������������� � ������
�0�������������%�������2 �� ������ ������
�������������� ������������������ ������
� �� �1�& ����������� ���������� ���
����������������������� ���������������
����������� ���� �������� �������� �����
����� ������ ���������������������������
�� ������� ��������������/�� ����������
�������� ����� ������� ��� �� ��������3�/�
������ ������� ������������������0������1�
�� ������ ������� ����'���+,14����
���3�������������� ������������������
5�������� ���������� ����������������������
���� ���1�6*����������5�������� ����������
+*������������������������ ����������������
����������� �����������0 �����1�"�������
�����������������/�������3�/�����������
����������������������������������������
�� ������� ����� ���� ����������� ���� ���
� ���������������������� ������� ��1� �.�
������������� �� �� 3����/�� ���1�$��� �����
������������� ��� ������������������������
� ���������������������� ��������������������
���� ����� ��������� �������������������
�0���������������� �����1�&���������� ����
� ���������������������������������
�������������.����������1
��������������������������������
���������������������������
������������������������� ���
��� !�"#$%�� #!
-����/���������� ������������ ����� ���
� �������� �� �������������� ������ /���������
�� ������������������ ���������������7�����
������������������������������� � ������
�0������������������ �� �1��� ������
�� �� ���������������������� ����� ��� ���
����������������� ������������������ ��
����� ������ �������������������� �����������
����������� � �������0�����������
������ ������������� ���������������� ��8���
��������������� �����9*:1������ ��������� ��
����������� � �������0���������� ���������
����������� ������������ �� /����0 ������
���/�������0�� � ��������� ���������/�����
� �����/������������/����������� �����������
���������������������1
153
Proceedings of The 4th International Multi-Conference on Society, Cybernetics and Informatics (IMSCI 2010)

���������������� �������������������������
� ������������������ ��/������ ����/��
�������������������� �����������������
��/3������ ����� ���������� ��������������1�
������������ �������������������������������
����������������������������%�������
2 �� ������ ���������.���������������
����������������1
���� ������������ ������������������ �������
����������������� ������������� ������
%�������2 �� ������ �������������������
��� ��������������� � �������0����������
��� ������/������������������������� ���
%�������2 �� ������ �����1
&��' ��"��%"��"�( �)
�����.�9;:� �������� �������������
���������� ����������������������� �������
�� �����1������������������� ��������� �����
������� ������������/������ ��� ����� ���
������������������������5���������� �����
��������/����������� ��������� �����1���
������������ ������ ����������� ��� ����<��
�� �������������� ����������� ��� ������
������������ ����������������������
��������1���������������������������
���� �������������� ��������������� �����=�
������������������������� ������������������
�������������� ����������������������� �����
�������������.��������� ���/���������
�� �����1
>��3 �9*:��������������� ���0 ���������
�������������������������������� ����������
��������� ��������� ��#����� �������
&����������������� ������?#&�@��
� ������������ ������������ ������ ���
�����������?&�*@�� �������-A�
%� ����������������������������������
� ��������B��.������' �����������
������������ ������������������ ���2 ���
$��� �����?�2$@�� ��������C �����
�� �����$0���������'���� �1�$����
������ ���������������� ��������������
���� �����9+:1
*� �����������+�������,���
����������������� �������������� ������
��������������������� �����������������������
��������������������������������������������
�� ��������������� ��������3�/�� ����� �����
�����������/�������1�!������������� ����
�������������� ��������������������� ������
������������������������������� � ������
�0���������1
�+������������-����������������
�������������
��������������� ��� ���������������������
���� ������������� ����������������
������/����������� �����������������
� �������� �������� ����������������
������������ �������� ��������������
�� �����1�������0������������������� ��
������� �������������������� ��������������
� �������������� �������������������������
�0�������������������������������.�����
�� ���������� �������������������/3��������
�.������� ���������������������1
"�����.���,���
���������������� �������������� ���� ������
����������������������� ������������� ���
�� �������� ����������������� �����1�����
����������� ������������ �������������/��
���������1��������������� /����������
.��������������5�������� ���� ����
�������� ������������������������ ����������
��� ��������� �����������������1�
����������� �������������� �������� ������
�� ������� ����� �����������������
������������� �����1�������� ������������
� ������������ ����� ������������������
��������������������� � �������0����������
���������� ������� ����������������������
�� �������0��������������������� ���
������������������� ������ /��������
�0��������1
"�����
������������������������������� ��������
� ������ ����������������������������
�� �����1������ ������ ������ ������������
������ ��������� ���� �������������� ��� ������
�������������������������������� ��������
������������� �����1���� ������ ����� �����
�� �� ��������� ��?�1�1���.����� �5�����
����������� ���������� ����@������������ ���
154
Proceedings of The 4th International Multi-Conference on Society, Cybernetics and Informatics (IMSCI 2010)

������������� ���� ������7������ �������
�0���� ���� �����?�1�1� ����5������/������
�����������@������������ ���������������������
���� ���� ������������������������� ������
�0��������1
/����,���� ������
������������D���������E��/�� �����/�� ����
�������������� ���������������������.����
�����0 ����� ��������������������� �������
������ .����������������� �����1�������
����������� ������ ������ ��� ���� ��
��������������/�� ����������� �������������
� ��������� ��������������� ���/�� ���1�
����� ��������� �������������������
�/�� ������������ ���������������������������
��������������������������� � ������
��� �����1�
0�����1#$
2+ 3����
����������������� ��+6�� ���� ���,)�
��� ���%�������2 �� ������ ������
� ������ ����������������������� ����������
++1+F�������������+G1*F� ����� ���
������������+,1HF� ����� �������������� ���
,,1;F����������1�2������ �������/� �����
2 ������ �������������������� �����������
?,G1HF@�����������/��'���?*H1;F@� ���
> ��������?+G1+F@1�!����� ������ ���
� ������ ����?,;1IF@�������� ���� ���� ��
�0�����������������������������1������������
�� ������5� ����� �������6H1;F�� ���������
� .��� ������� �������������� ��������++�
�� ������� ����������� ���� ��������������
����/� ����� ��� �������������1
4+��������
����� ���� � ������������������������ ��
����5�������� ���1���� ������������
�����������������0������ ���1�"��� �������
�����/������������ ���%�������2 �� ����
���������������������.���� 3���� �������� ��
� �������������� ������ /������ ���
�������������������� ����������������������
�5�������� ���1�
������� �����������������������;�� ���1�' ���
�������������������� ����� ����� ������
������ ������������������������������
�/� ������� ����0����������� ��������������
�������������� ������ �����������1�' ���
���� �.�������� ������ �������� ������������
����� ������� �������� ������������������� ��
��/���� ������� ��������� ����������������� ��
�� �������� ��������1�' ��������������������)�
�����=�� ����0��������������������������
�� ������?������������������ �������� �
��������������������������
������������������������������
���������������7��������������H@��
������������� ���?������������������� �
������������������������������
����������������� ������������
����������������������������������
����!���������������������������
������������������������7��������������
H@��/���������� �������� ������������������
�����������?"���������#$����
�����������"���������!����!��������
�����������"�����!��!���������������
�����������7��������������*@�� ���
��� ���������� ������?�������������� �
%�����������������&'������� �
�����������7��������������*@1�' ��������
��5������� ������ ���������������������
������������� ������������������ ���
� ������ ������������ ���H��� ���� ���
���� �����)������=���������
����� ���J�� �������������� .����
������������� ������?(��������)���
������*��������������������
'����+�,��)�����!������������+� ��
��������������������!+� ��������
�����������!+�-�����!���������� �
,��������������!�����������������!� �
����7�� ���������������������������@��
���������� ������������������� ������
?������������������ �������� �
��������������������������
������������������������������
���������������7�� ���������
������������������@����� ������� ������
��������������������� ������?H�5� ��� �����
��/������=�� �������������������������.��
��� ����@�� ���� ���� �������������������
������������� ������?,��������.������ ��@1�
�������� �������������� ��� ����0���������
�������� ���H��� ���������� ���.���' ��������
�������������� ��������' ������������������
155
Proceedings of The 4th International Multi-Conference on Society, Cybernetics and Informatics (IMSCI 2010)

�������������������������G������������
��� �����������������/�� ������� ��� ��
������������ ��������� �������������� .����
������������� �����=�-���������������� �
�������%�������������������������� �
���������������������!�����������(������ �
����������������������������� �
�����������.��!����������(�������
������������������7�� ���������
������������������1�' �����0����������)�
�� �������� ��� �.���� ������ �������� ���
�������������� ���������������� ��������
��� �,��������� ��1������� �������� ���� �
�������������������*���� �
��������������������!���������������*
�������������������������!�������������
���������������������������
������������� �������������������������! �
���������������������������!�������/
5��"�2%'�2��!$�$ 2�%22 #!
!������+**�5�������� �����������/��������+*�
��������� �������������������� �� ���6*�
��������������� ������������� ������ ��
� ����������������� �� ����0�� �����,IF�
������������������� ���1�
$��������
$�������������������� ����� �����������
������������� ��������� ��������������
���������������5�������� ����� ��������
61,F���������.������������������ ������
�������������������?����� ������ ���@1����
'����� ����������������������������������
����� �����������2 ���������������
���.�������������������������� �����1�����
������������� �������������������� ��������
�� ������������������� �����1� �����������
���;*1IF���� ����� �������������������������
��������� ����� �������� ������ ���)*1IF�
�������.�������������������������� �������
/����/������������������������ ���������
�� ��1�2������ ������?I+1,F@�� ���
������������0������������������������������
�������� � ������ �������������������
���.�?6;1+F@1
�+���������/��-���������������-�
����������������
����������������������������������
��������������������� �����������������
�� ������?H,F����� ������ ���@�����������
/�����������?H4F@�������������������� �
�����������������?*4F@�����������
?+4F@� ��� ��������?,F@1���������������
������������������ �����������������
�� ����������������������.� ���������
�� ��������� ���������� ����������
���� �����������1�
� � ������������ /��������������������
���������������������������������*G1;F�
�������������������������� �����������������
�� �����1�-�����������������������������
�����������������������������
���������/
�������� ��������� �����������
��������������������������������������� ������
������ ����������������������� ����1
2���������������?)+1*F@������� .����
��������� ��� ������ �����������������������
�� ������������������������������������ ��
����������������1������?+)1HF@������������
� �������������������� ��� �����������������
�� �����1�-����� ������������������������
��������� ����������������������
���������1�-����� ����������������.��
����������������������������7�
���� ����������5������������ �����������
��� ����������� ���1�����������������
�����������������������������������
�����������0�������������������������
���������?�1�1��������@1
"�����
���������������0�������� ���-���
��������������1�2���������������
� ����������������������������������� �
�������������������������?*I1*F@1�
-����� ����������������������5� ���������
������������������������������������� �
��������������������������������
�����������������������������������
?*+1+F@1� �������������� ��������� ���
���������������� ����������������
������������������!�����������?*1;F@1�
-����� ��������������� ������ �������
����������������������������������
156
Proceedings of The 4th International Multi-Conference on Society, Cybernetics and Informatics (IMSCI 2010)

���� ��������������� ����� ������� ���
���.������������������ ���� ��������������
/ �.������������������������1�!��������
���������������������������� ��������
'����������� �������������������������
?H41IF@��������������������������
��������������������������������� �
������
!��� ����������������������������
����������������������� �����������
����������� ��������������6H1;F���� ���
�� ���������������1���������������
�������������������� �� ������� ���;G1+F�
��������� ��������� ����� ������
����� ����1�!����+H1IF��� ���������������
������������������!������������ ��
� ���������� �������������� ������� ��
�� ������������������������������������ ����
/������� ������ ���1
���������������������� ������������
������������� ������������������ � �� ��
� ������ ����������������$��� �����
�����1� ���������� ���������������
�/� �����> ����������������� ���� �������
������������������������������� ����� ��
������� ������� ��������������������������
�����������������������1
"�����
,�)������������*����������������
?H61GF@� ��������������������������!�
?H*1IF@��������������� 3����� ���������
�� ��������������� .��������������� �����1�
-������������ ������ ����/�� �������
������� ������������������������� ��
��5���������?+1*F@1������������������
������������� ������������ ���� ������
���� ����������� ������� �����������1
2�������� ��������������������
�� ���� ������� ��/�������� ���������������
����������� ��������� ������ ������������
��������������������� ������������� ��
������� �������������� ������������� ��
��5��������1� �������������� ������ �
� 3���������������������������������������
����� ������������������5�������� ����
���������K���� ������ ���<�����������
�����������������������������0������������
������������ ��������1�
/����,���� ������
������������5����������������/�� �������
� �.�������������?*I1;F@�� ������ �������
������0���/�� ������ �.�������� /����� ������
������������������ ������?*)1*F@1������� ���
�����������/�� ���������� ��� ������������
�����*16F�������������������� ������������
����� ��� /��������������� ������������
��� ���������� ��� ���������1� ������������
��/�� ��� �����/�������� ����������������
L� �.������������<� �������������/�� �������
����� ����������� 3����� ������������������
����������� � ������� ������ �����1�-�� ����
�����������?H61GF@������ ������� ������ ���
������������������������������ ������/�� ����
������ ������ �5���������������� ����
������ ����1� ������������������ �� ������
������������������� �������0���������� �.����
��������� ��������/��������/�� ���M���������
/�������/����� �������� ������������������
� ������������������ � �������0���������1�
�����������������������������L��������<����
����������� ��/��� ���1�-�� ����� �����
�0�� � ���������� �� � ������������������
� ������ �5���������������� ����
������ �����?H61GF@� �������������� ���
������������� ������ /������?H*1IF@�
������������������� � �������0�����������
��������������������������������������������
������������� �������������������1��������
�������������������� ������������� ��������
� ������ ����������� ��������������������
/���� ��������41HF��������� ������
���������������� ���������� �������
�����������?*I1H� ���*I1;F�������������@1���
��������������� ������������� �����0������
������������� �� ������� ������������������
����� �������� ����� �����������
� ������ ����� ����� �������������������1
�.�������� /����� ���������������������
����������������� ������� ��������0��� ������
�����������/�� ���1�����������������������
����������������� ����������������������
�����������0�/����� ������������������������
��� ��� ����������������� ������������������
����� ������� ��� ���� ���� ������
�� ������1
157
Proceedings of The 4th International Multi-Conference on Society, Cybernetics and Informatics (IMSCI 2010)

6���#!�'%2 #!2
�������������������� ������ ��� � ���������
������������������������������� ���������
/�������3�/�������� ��������������� ������
�� �����1�$��� ������������������ ��� �������
����������������C�������������������������
'�������������� �������.�����������������
��������� �����������-����� ���'�����������
��������������������������� ��������1�
������������������� ���������������� ������
����� ��������� ���� ���� ��� �� ����
��/���������� �����1���� ��/�����������������
����������������������������������������
�� �����1��
-������� �� ����������������/��� ���
��� ������������������������� ���� ��
� �������� �������������� �����<������������
���� ������ ������������������ �����1���
� ������ ���������������/�����������
������� ������ ������ ��������������������
�����������/��������������������������������
�� �����1
���������� �������� ���������/������� ����
��� ������ ������ ��� ����������������
��� ����.�������������������� �����1�
'����������������������� �������� ��
�������� ���� ���������������������������
� �������.��/���������������� ������ ��� ��
�� ������ ��������������1�$��� �����
������������� ��� ���� ������������������
������ ��������������� ������ ��������
��������������������� � ��������������������
������������ �������� �� /������������� ����
���������1
&���������� ��������������������/����������
���������������������������� ������ ��������
� ��������� ���������� �������.�����������
�� ������������������1����������������������
��������������������� ��� �� �3�������
�������������������������������1
"�7�"�!��2
9+:�>��������������� ������>1�N�&��������
'1��$�������������� ���������� ��������
������ ����������������� ��=�-�������
�� .�����������������������+�����8�
�������C��1�)I����1�)��*4461���1�
*;,�*6;1
9*:�>��3 ��"1�"1��"� ��B�����$0�����������
��+�����)��9��C��1�*,����1�)H��
*44;1���1�H+�HH1
9H:�2 ���� ���-1��"���������
������������������
���1���� ���������1���J4)44�
4I+*1���������������,�� ���*4+41
9):�2����������1�N�>��.����21��:+�����
:������ �������%�,���������
��+����������������/�������
���1���� ���������1���J44)4�
4I+*1���������������+4�� ���*4+41
9,:��������O����������������� �%���������
���$����������$��� ����=������$H�
'��3�����!�����9���'�������*44;1
9;:������.��>1������������'��������� ��
������������-��������������$ ����
%����������� ���������������������
$�,�����������������C��1�++6��
+II;1���1�++H�+*+1
158
Proceedings of The 4th International Multi-Conference on Society, Cybernetics and Informatics (IMSCI 2010)

������������ �������������� ����������������������������
����������������������������
������������������ ��� �������������������� ��������� ����
� ��������������� ������ ��� �������������!���"��������� ����
#���$����%���������� ��� �������������������� ��������� ����
&���"��������������� ������ ��� �������������������� ��������� ����
�����'�������(���� �� �������������������� ��������� ����
����)����(���� ���������������* ���������� ����
�������������! ������ ���� �������������������
������ ���+��� ���,!� ��� �� �� �-������ ���� ���-���������
��� �� ������������.������ ������������+���
+�� �� ������� �!���-���� � ������������� �� ���� ��
�-������
/��������� ��������������� �����,!� ��!������� ��
�+� ��+���012����������.������ ������� �� ��� ���
13� ���������+������ ��������������������������������� ���
����+���� ������+�� �!��������45����+��1����������
�� �����+��������6������+����
�������% ���+������� ��0������70889:������
����������! ��� �����!��+��� ��+��������! ����� ���� ��
�-�������������� ������ ������� � �������+��� ����
��� �����������������;<�;9��������� �����! ��� ���
=<�<9������! ��� ����+�1=9�������� �� � ���>���� ���
�.+� ������������;8�<9����� �� �����������-������+�
��! ����� ���� ���� ������ ������ ������� � �����
��+��� ������� ��������� ����������� ������� ���� ����������
11�19����� �� �������$���� �� �������1��.,�� ���� ������
�� � �������+��� ������� �������������+������� ����
+�� �� �����?.+� ����������@��<��?"�������@�������������
�� ���� � ����������+��� ������� �����7A�<9:�� ��� +�����
��������-� ����� �������� ���A��>������������+��� ����
�,!� ��� ����� �������������+�-�������+��� �+��!! � ��
��+� � �������,� �������!! � ��
���� �������! ��+�+������������������ ��+����!�����
���+��� ������� ����� ���� �� ��������������
.������ �������+��� �������� �� �� �� ��+������ �� �����
�����+��+� �����������������
&���� +�B����������� ������������� ������������
�� ���������������������������������������������
�����
��� !�"#$%�"&��'��(�#%)
��� �������+� ���� ��� ���������������! �����
-��� ��-����������������� ��� ���+� �����C2D����� �� ������+�
��E�����������!� ������������+�+����� �������� �
! ������������� �����������F��� �� � �� ���� �������
�����������
����!� !�������� ! ����� �+���� !� ��������
�� ��� ������� �+��� ����+������������+��� �� �
����� �� ����������� ����! � �� ����,!� ��� ����+� �+� ��
������!�-���������� ����+��!!�� �������������������E����
�� �������������� ��� ����������������������������+�
� ��� ��,!��+�������� ���� �����+�C1��08D��.��� ! ����
� �+���� !� �����! ����������!! ������� ���� �� ����
������,!� ��� ���������������+��� ����+� ��� ����� ����+�
! � �� ������ � ����! ������� � ���� ���-������
���� � �������+������������������������������ �
!�����,!� ��� ������ �����+����+�� �� �-������ ���� ��
�-����������������.������ ������� �� �������������
��������+�����+�� ����� � ��������� ���������� ������������
�������+� �������E����-+�������+����!��������� ��
!�������+��� � �� �������! ��� ���� ���-������������ �� ��
*�����*�#�����+��,
����! ���������+�������(���������!��>�+��� ��
.,!� ��� ����+�(���� ���-���������� �� �����
���������.������ ������������+���������� ����� ! ����
�,!� ��� ����� �����+��� ���� ���-������������������
.������ ������� �� ������������������+�+ ��������� ��� ��
������������������������!���-���� � ��������� ������
)� ��� � �����+� ����+�������!� ���!������� �����
�,!� ��� ������� ��� ����� �� ����+����� ����! � �� ���
! � ���� ����� ! ������� ��������� �� ��������������
.������ �������+�
����� ����*��������� ����������������������������
����#���������,��������$���
$� �����E�����-���������! ��� ������� ! ������� �����
�,!� ��� ������������������� �� �G��-����������� ���� ���
��� �������+�! ���������E������� ��������� �����+�
���+�����>������-� ��������!� �� ����������� ��� ����
159
Proceedings of The 4th International Multi-Conference on Society, Cybernetics and Informatics (IMSCI 2010)

��+���� �������������������+� ������������ �!����������+�
��������� ��+���������� ��+� �����CAD�
����!� !�������� ! ����� �+���� !� ��������
�� ��� ������� �+��� ����+������������+��� �� �
����� �� ����������� ����! � �� ����,!� ��� ����+� �+� ��
������!�-���������� ����+��!!�� �������������������E����
�� �������������� ��� ����������������������������+�
� ��� ��,!��+�������� ���� �����+�C<D��(���� �� �(����
C00D������� ������������ ���������+� �����������������
��+���+��� ������� E������� ����+������ ������ ��� ���
-�������������������������������� ������+�� ����������
����10��� ���� ��
(����������������+����������� �������-�������
���� ! �����+� ����� ��� ����������� ������������
E����+�����+��E��������� �� ���#����������� �+��� �
���+������ ! ����� �+��� � !� �����! ������� �������
�,!� ��� ����������������+��-�������/�������C1D�
>�� ���-��E���� �������-������� ��� �� ������
������� ������������ ! �����,!� ��� ���F��!����� �� �������
� ���� �E����+�����+��E����� �-���� ���� �������+�
���� ���-������
&�����������������������-����������������
>��0HHH������$����� ���.+� �����! !��+���!�����
?I���� ������ �������� ����@� �����!� !����+����!����
� �� ���� �� ����+������ ��������-� ���������
��!�������+��������������� �������� ��-�������188=�
��+�188;��?>��� ���������!������ ���������+�(���� ��
"��� �������!������ ����@�������!�������+��!��������
���!��+�=�-�������� �=���� ����� ����������+��F��!�
����� ���������+�(���� ��"��� �����-� ������+� �������
� �+�������� �+���������������+� �<���� ������ ��������
1882��>��������+���������� � ��� ����������� �� +�
���� ���
����� ��� ����������� ���������+������������� ��+����
!� �� �!������+� �� ���!������������!� �+��J���������
���� ���� ��������� ��-������ �+�� ��������
���������������� �����������F�������������������-��������+�����
�������������+������ ���+� ��������� ������������������
��� �� ��
I����� ������� ������� �������� ������
� ��������! ������+�-��K������#���(���C=D���� � ��
������� ������ ���� ��-������ ����� �� ��
./0���������(�������1�"�!���+�-��K������
#���(���C=D���+��������L��(���C;D� �������#���� ��
���� �� ���������-������+�������!� �� ���������
! ��������E����+�����+���� ���� ���������� �
�+� ����� ���� ���-��������� ������� �+��� �����
�F�� �������-����!�-������������������!���-��������!� ��
��� �������������� ������������!�!������+���E��!�
!������������������������ �� +���� +� ���� ������
� ����6������� �+��� ������������ � ���+��� ��������� �
��������+���+� �� �-���������� ��������
.20������������������1�>�� ���-�� � ��+�+� ��
K������#���(���C=D��������� ��� ������ ���E������ �+������
���������������� �� ��������� � ���� ���>���� ��+��� ���� ��
��+��7� �+��� ��!� ������+���!�-��������� ������ �:��
��,�-E��7�,�+�!� ������� �� ���F�� E� �� �� ����
���������+� ��� ����������� �:�������� ��� ��
7�+������ �������� ���F��������� �!��� ��� � :���+������
7�� ����� ���� ���!����������� ����� F�� ���� �����
���+�������,�-������ ������� ���� �:�
>���++��������������������+�& �����CHD��
�!���+�-���������L��(���C;D��!����+�����������������
���+��� ��� �������� �� ��� ��������������������
�� ��+����� E����+��������� ���� ����� +�� ������������
�!� ���!�� ���!! ���� �������F�� E� ��� ����� ���������
��E���� ���������-������������������������!��������� �
���� ���-��������������������� ���������� � ����������������
��� ����+���� � �����-��������! +� ��F����������+����
������! ��� ��� ���� �� ��� ���� �� �����������-�����
��!������+�� �+��+�M���������������!� ������� ���-��
��� �+�
.30����������4�������1�������)��������CAD�
-�������������� ����+���������� ����������! �����
�������������! ������������������!��������� ����
���� ���� �����������!� �������������� ������%� ����
� �� ����
$��������� ������������������ ��� ������ ��� ���
�����+��������!! ���� ���� �� � �������� ��� �� E��������
��������� �������������-�� ���+� �+���������+���+��������
���! ���+�������������� G�������������������+������
! ������-���� ��������! ��+�����, �!�������� ��������
���� �� ���� ���� ������ ����+������-� E�������
��������������� �-����� ��C;D�
�����-������+������������� �������
�� � ����������+����� ���� ���-������� ����������
��������� �������� ���� �� ���� �+� �� ���� ��
.50���� ����������1����!����+����-���������
L��(��;������ ����+��� ���� ��-� ����� ����! �����
�������� ������ ��� � ����� ��� �������G����!!������
��������� ���� �+��� �������������-� ��������� ���������!�
-��������������-� ��� ��� ���!�������#�����������������
�!� ������������ ���� ������ �� ���������� ��������� ��� ��
������� ����� �� �����+����� �����+������������- ��E��!��
��� � ����������! �����������-����� ���� ��-� ������
�� ������ ��� ��
(������1�$����� � ���� ����� �� �G� ���� ��
�-�������>�� ���� ���������������� �+�������,� ���� � ��� +��
��+���� �������!!���+���+� �������������� �+��� �
���� ��������+��� �������! � ���� ���-����� ������� �
�����G��������� �� ���������������� ��������� �+��� �
����+� +��
4��'"%"*"!)��$%��46*�$�����"$
����! ���������+���������������� � �����������
! ��������+��� �����,!� ��� ��������������� �� �G� ���� ��
�-���������������� ���������������,������������!� ���
+�� ������!� �������������������������� ���,���
���������.������ �����������"���������+�>����������
�� ��������
���������(��7����
160
Proceedings of The 4th International Multi-Conference on Society, Cybernetics and Informatics (IMSCI 2010)

/��������� ����� ����������00H���� �� ��� ���1A�
����-���� �����+��+� ���������������� � ����+��� ����
������������������������ �� ����+����E������ ��� �� �����
21�<39������� �!��������!������ �� ����+����������
H3��� ��������!��������� ��A3���� �� ����+����� ! ����
�,!� ��� ���������!����<���� �����E�����!�A;�H9������
�� �����+����
)��� ��0��(���� ���� � �� �
���������%����
>�������+���-��������� ������ ���+��� ��������������
���� ��� �� �������-� ��������� ����-�����+�������,!� ��
�� �� �� �+�� ��������+��!! ������)��� ��0����������
! �������������� �����
��� ��� ��=���% �� ���� �� �+�-������-���! ����
�� ��+��B�-��� �!� ������� �������������� ��������+�
������������ �����+����� ���� �+������� ! ������� �����
! %� ��7� �������������� �����!� �+����� �����
���� �����:�� � �������� ! ������� ������� ���� ���
+�� ���������+�����������
�������������������
/��������� ����� �� ������+���� ������,!� ��G���������
��������E���� ���������+���� � �!��������������+�
+�� �!������ ��+�����������E��?�������+� ����������
�����+����� ! ������� ����@� ������+�H�������� ���+�����=�
!������E� ��� ���������0�-������������������+���+�=�-�����
���������?.��� ! ������� ����� �����-������� �� �@����
��+���!��A�� �!����� �������A�2����������+���������1A�
�������
(� �������� ! ������� ������ ��������@����������+��
�!��A�� �!����� �������<�;���������+���������03��������
)����!������E� ��� ����������������+� ������� ���� ��������
�����0�-������� �����������+���+�=�-������� ���������+�
.����������� ��?����-���! -������� ���� �+�+� ����
���� ! ������� ����@���+�A� �?�� ���-����������� �
���� ! ������� ����@������=�!������E� ��� ����������-����+�
���0�-����� �!�������+���� �����+�=�-����� �!�������
�� ����������� ����������+������ ������� ��!���� �����
������!��� �� ������������������� ����������� �����
�� �����������������-�������� ���>��� ���� ������� ���
����F��������� ������+������� ! ������� ������
��� �� ��-�����+�" �-� �G��N���283����� ��������� �
����F��������� �����+�� ���� �� ������������� ! ����
�,!� ��� ������212�
%�����$�*)(�(��$%�&�$%�$!(
����! ���������+���������� ��+������!� ��
���� ! ����� �+��� ��,!� ��� ���4�����H3��� �����
F��������� ����A3���+����� ! �����,!� ��� �������������!����
<���� �����E����!�A;�H9�������� �����F��������� ����
�����A3�������+������ ������ �+����������������� ���
���� ��������� ����0=�8����+��������+�������!! ! �����
�������� ������������
4���4���������������������#����������� ����
*������
I����+� ����+������������������� ���������� �� �����
��+����� ! �����,!� ��� ���������!����<���� ���������!���-���
���+��������� ��� � ��� ����! ���������� �� ��7��-���
0:�
) �������������� �����!�����������+������!�<�
������ �� ���� �� ����+� ��E�������� ! ������� ������ ��
?��E����� F�� �����������E��������+��,!� ��� �@��
?����! ������ ������-�����@���+�?����! ��� ���� ��
�-�����@��>�� ���-����������������������� �� �������+�
���� ! �����,!� ��� ���� ��+������! ���������� ! ����
�,!� ��� ���������! ��+�����������������E����+�����+�
�,!� ��� ���-������� �� �-�������������� ���� �������+�
���� ���-������
"����F�� �����������������!���+�������������� �
�� ����+�!��+������ ��-���� ��� ���������+�!��+������� ��
��� ������ �������� �������-���1�7�����!!��+�,:�
70:�(�����������?&��+���� ��@���+�?��
��! ������ ������-�����@�� �������� ������ �����+�OP��
A0H�1
χ P2�83=����80��.������!����������!� �����
��� �� �����! ������� ���������+�! ���������� ! ����
�,!� ��� ������ ��+������������ � ����� ! ������� �����
�������! ������ ������-���������� ��������A89������ �
���� !� ������������� �������+����������!�����
71:�>���������! ������+�������� ������������?��� �����
��� �@���+�?�� ��-�� ��������@�� �������+�!��+����
75 P�A3=�1
χ PH�H<1����8=:�������������!� �����
��� �� �������+�����������=���� ������ ������,!� ��� ��
-���������������� ������ ����� ���+� ��������� ! ����
��� ��������+����������� ������� � ��������������� �� ��
�����=���� ����+��-������ ������,!� ��� ���� ��+����
����� ���������-� ����� �� ��������� ��+�?�� ��-��
��������@����� �!����A�<9��������� �� �������+�
5� ��-���B
�� ��� ������ �����
���� �������� �
�����
��-�������
�.+� ����
�.��� ! �����,!� ��� �
�.+� ����� �+������E��
.��� ! ������� �����
� !����� ����� ���
������� ������� �� �B
�* �����! !���
�>� �������! !���
���� ������� ��! !���
���� �����!�� ��! !���
>�������������
�����+�����������+����
���� ! ������� ����
.��� ! �����,!� ��� ��
������������B
���� �������������
���� �������!��
���� ����� ������
���� ����������� ����
)� � ���� �������� �� ��
�������+�������� ! ����
��� �����! !���
��� ��������+���������
�����+����� ���� �+��
161
Proceedings of The 4th International Multi-Conference on Society, Cybernetics and Informatics (IMSCI 2010)

! ���������� ! �����,!� ��� �����E����������������E������-��
���� ����� ���+� ��������� ! ������� ���������� ���������
�+� ������ ��-�� �������� ���-�� ���+� �+��� !� ����
����.��� ! ����� �+��� ��� �������� ������������ ���
7<:������������������ ��� ��+����� �����������?%-�
�����@���+�?��! ��� ���� ���-�����@�� ��!���������
�����+��5 P�A<0�1
χ P2�=38����8=����������������
! ��� ���������+�! ���������� ! �����,!� ��� ��-�������
�������! ����� ���� ���-������������������������ � �
��+���+������#�� ���������;<�;9����� �����! ��� ���
=<�<9��! ��� ����+�1=9���� �� � �����+����������
-������)� ��� ��������������� �����! ��� �� ������+������
�!���;=9���������+��� �=���� �������-���� �����+�
�,!� ��� ��
7A:�(����������������?��������+�� ���-�����+@����
������ ������ �����+������?��! ��� ���� ���-������
7OP��<H0�1
χ P;�80;����80:����� �� �������+�! ������
���� ! �����,!� ��� �� �!���;8�<9����������� �����
� ���� ����������11�19��$���� ������� ���������!�
-������������-�������������� �� ������������� �����
! ��� ����+��-������� �� �����-�����+�������+�� ���
������ �� �������-�����%�����+�!��� �� +���+�� ���������
��������� ��� ��"�� ������������ �!��+��!���
=1�<<9��������� �7��������� ��� ��"�� ����188H:�
7=:�>�+�!��+�� ��������������� ���+�-�������
?��������+�� ���-�����+@���+�?� �!����+��� ����� @��
" ������� �� �����OP��<A1�1
χ P=�<20����8=� �� ��+�
������ �� ����������� �������������+��� ����� �������
��� �� �������! ���������� ! �����,!� ��� �� �� ��+��������
=A�09��� �� ���� ��������� �� ���������-�����+�$���� ��
+�� ���
73:�>�+�!��+�� �����������-�����-�������
?��+��� �����,!� ��� �@���+��?��%��� F�� ��������-����
�����+�E����+�����+��,!� ��� �@�75 P�A<;�1
χ P2�;2<��
��8=:������������,�!� �������� �� �������!�����,!� ��� ��
� �����%������ F�� ��������-���� �����+�E����+���
��+��,!� ��� �������������������� � ���+� �����
���� ! ������� ��������� ������ ���� ����������3A�;9�������
��������,!� ��� �����+������� ������������������ �����+�
� E��,!� ��� ���������������� ��������������
������������������4���4����������� ����*������
"� ������������������! ������+�����������+����
���� ! ������� �������+� ��E���-����� �� ������������-����
.������ �������+�7��-���1:����� ���� ��+���� E���������
��+��� �� �! ������������73;�A9:�����!� ����7=2�;9:��
������� ��� �������������+��� �� �! �����������7<;9:���+�
�����>����� ��� ������� E�����������+��� �� �! ������������
����������� �����+������� ! ������� �����
���� � ������+�+��� �+��+�����+� ��E����
���� ! ������� ����������������+������"����F�� ��
��+�!��+�� ����������� �� ��� ��+������� ���� �������7��-���
<:��)� ��� �����������������+� �� ��� ��-�����������
���� ���������������������� ����+�� ��������� E���������
��+��� �� �! �����������������������+��� �+��+���
���� ! ������� �����
�"$�*#(�"$(
�� ������������ ����������������� � �������+��-�����+�
����������� � ������B
70:�����-����.������ ������� �� �����"��������
����� ���������+�>�������������� ��������� �������
���������������!��� ������������� ����� ! ����
��� ����B���%��� F�� ��������-���� �����+�E����+���
��+��,!� ��� �������! ������ ������-��������+���
��! ��� ���� ���-������
71:�����-����.������ ������� �� �����"��������
����� ���������+�>�������������� ��������� �������
�����������+����� ! �����,!� ��� ���������!����<�
��� ���������-�����+� ��� E�����������+��� ��
�! ����������������!� ������+�������� ��� ������
�������+��� �� �! ������������
7<:���� �������+�� �� ��-�����������+�� ����?%-�������@�
��+�?�+� �����������@�������� �����?����! ��� ���� ��
�-�����@��������������� � ���+� ��E�������� ! ����
��� ������4������+ �+�!� ���������������! ��� ���
;<�;9����� �����! ��� ���=<�<9��! ��� ����+�
1=9���� �� � ����+���������� ����������������;8�<9��
��� �� �����-�����+��������� ������ ���� ����������
11�19����� �� ��������-�����+�$���� ��������
7A:���������������! ��� ����+�! ����������-���� �����+�
�,!� ��� �����+��� �;=9���+�=���� �� �� ��
7=:�>������ �����?� �!����+��� ����� @��������� ������
��+� ��E�������� ! ������� ������+�� �� ��������+�
-��������������?�+� �����������@��������� �� ��� ��
� ����E������-��� �+�-����+��� ����
73:�"�� ��� ��������+�-�����������+��� �+��+���
��+� ��E�������� ! ������� ������?� E���������
��+��� ���@������������! �� �+��+���� ����
7;:�(��� +������?��� ������ ����@����� �� �����
��+� ��E������ ! ������� �����+�����?�� ��-��
��������@� �����������A�<9��>����� � ��+�+������
�������������+� ��E������� ! ������� �������+� �����
������ ��� ���������
��&���$��(
C0D�"���������������8���������'�������
4���������������9������������� ������
$��������9���#�������������� ��
#���������������������0��0HH2�
C1D������/������������ �� � �� ���� ���.��� ! ����� �+����
"!� ������:�����������������������
�����������������5���1<��0HHA��!!��<1�<=�
C<D������L���+�����������+������� ��������.��� ! ����
� ����� ����������� ������������������������
���������������������$��������9���$�����
#���������0HH;�
CAD�$����� ���.+� ������������������������������
����������������������������������������
F�����B����!BQQ���� ������+����Q�� Q���R���Q=Q=�
A<������188H�82�<8
C=D�K������#��� ��������$� ����������+���>� �������
������� �� �G�(���� �����"������S�� �������+��
162
Proceedings of The 4th International Multi-Conference on Society, Cybernetics and Informatics (IMSCI 2010)

���!����� ������ ���� ��!��������������
� ��� ��"�� �������������������������������
����4�������������(��'����#���������188=�
C3D���������� ��� ��"�� ��������(���������������������
(�������%����������������������������9����
2;;5�����2;;<��F�����B�
���!BQQ��-0��� ������Q�!���!,�188H�82�<0
C;D��������L�� ��������� �+� ���� ������
� ��� �G�(���� ���� ��� ���������� ��������
����:������������������6�����5���0=�����A��
1880��!!��;0�2A�
C2D������)��������������������������������������
��������=����!��B�"���� ��"������1880�
CHD���������������������������T���&�& ��6���"����������
�+����������+�>��F����������� ��� �����������
(�����������9��5���A;��0H21��!!��30=�31=�
C08D�I��+����(�5�����T���E������(���$�E��������� �����
>�+��� ��"���- ������(���� ���� ��+�����������
���������4�����������5���<;�����1��0HHA��
!!��AA�AH�
C00D�(�������&����� ������I�������������� �B�"���� ��
�� �������������4������������������
���������0HH3��!!��08�<A�
��-���0��$�������������� ���� �� �������+� ��E�������� ! ������� ����
$�������� ) �F��� � �� ������79: (��E���
��E��� � � �� F�� �� ��� � E��������+��,!� ��� ��������� ��
<8 3=�1 0
>�! �������� ������-����� 1H 3< 1>�! �����(���� ���-����� 12 38�2 <� �!������������� ! ������!! � 10 A=�3 A(�F�� �+�-�� ������ ���� 1 A�< =�� ��+�-��� ��� ������� 1 A�< =
��-���1����������������$����$+����.��� ! ������� ����
$����$+����.��� ! ������� ���� ) �F��� � �� ������79: (��E����
"!� ��������������� �! �������������
���� ! ���<0 3;�A 0
., � ����������� ! ��� 1; =2�; 1
$���������������� �! ������������
���� ! ���0; <; <
� � �� �������������� ! ��� H 18 A
>��� ��������������� ! ���� 2 0;�A =
��-���<��"����F�� ������������"� ������+����� �+�$+����.��� ! ������� ����
���� �+��������
.��� ! ������� ����
"� �����������
.��� ! ������� ����O
1χ �
., � ��� ., � ��� �A31 H�202 �881
� � �� � � � �� � �<22 3�H<2 �882
>��� � >��� � �1H< <�H<; �8A;
$����������������
�! ������������
���� ! ���
$����������������
�! ������������
���� ! ���
�A<H 2�23; �88<
"!� ���������������
�! ������������
���� ! ���
"!� ���������������
�! ������������
���� ! ���
�<28 3�3<< �808
163
Proceedings of The 4th International Multi-Conference on Society, Cybernetics and Informatics (IMSCI 2010)

Learning and Human Computer Interactions: Does Wii Bowling Transfer To Real Bowling?
Ronald Mellado Miller Brigham Young University - Hawaii
55-220 Kulanui St. Laie, HI 96762
1 (801) 675-3831
Yoko H.W. Tsui Brigham Young University - Hawaii
55-220 Kulanui St. Laie, HI 96762
1 (801) 675-3831
Thomas Dearden Brigham Young University - Hawaii
55-220 Kulanui St. Laie, HI 96762
1 (801) 675-3831
Stuart Lincoln Wolthuis Brigham Young University - Hawaii
55-220 Kulanui St. Laie, HI 96762
1 (801) 675-3473
Timothy Stanley Brigham Young University - Hawaii
55-220 Kulanui St. Laie, HI 96762
1 (801) 675-3388
ABSTRACT The Wii video game console has many games that include physical movements related to the actual activity being simulated. What this paper proposes to do is measure in controlled experiments the transfer of experience from simulated bowling to actual bowling on a real lane. Certainly simulation has been used by many organizations, for example flight simulators in the military, to lower total training costs. And clearly some experience is transferable, but how much? This is an experiment to quantify experience gain in a simulation environment as applied later to an actual task. Analysis will include a characterization of the simulation tool from the perspective of the Information Technology discipline of Human Computer Interaction.
Categories and Subject Descriptors H.5 [Information Interfaces and Presentation]; H.5.1 [Multimedia Information Systems]; artificial, augmented, and virtual realities; H5.2 [User Interfaces].
General Terms Measurement, Performance, Human Factors
Keywords Presence, Bowling, Wii, Gaming Console
1. INTRODUCTION Video game studies have found a general link between several skills, such as multitasking performance [8] and hand eye coordination [6]. These studies have been described as providing evidence that video games help solve laparoscopic tasks. Laparoscopic tasks can be translated as hand eye coordination. One highly regarded study indicates that surgeons who spend a great deal of time playing video games will make about one third fewer mistakes [7].
The Wii1 console is one of the current generations of computer gaming consoles that seek to give a more immersive user experience than is possible with a typical push button controller. This console has a special controller, called the Wii remote that reacts to player’s motions. The Wii can translate velocity and motion in three dimensions. Nintendo bundles the Wii console with Wii sports, a game consisting of multiple real life sports. These sports are tennis, bowling, baseball, golf, and boxing. The player is able to simulate the motions of each sport and those motions are translated into the game and are then visible on the playing screen. By doing so they are given feedback in which they can improve their abilities. The feedback is through scoring and practice rather than training [2].
Since the release of the Wii gaming console there have been numerous studies on its effects [1, 5, 10]. One of the Wii sports games that has been evaluated is Wii bowling. Doorfus [1] found that Wii bowling was positively associated with real bowling performance. They used two groups, a Wii bowling group and a real bowling group. Although they found that the Wii bowling group scored higher than a group which received no training in a real bowling test, the Wii group was given 2 games, with coaching, in order to practice while the bowling group was not given any additional practices. This study seeks to expand on this
1 Wii is a registered trademark of the Nintendo and SONY
Corporations.
Permission to make digital or hard copies of all or part of this work for personal or classroom use is granted without fee provided that copies are not made or distributed for profit or commercial advantage and that copies bear this notice and the full citation on the first page. To copy otherwise, or republish, to post on servers or to redistribute to lists, requires prior specific permission and/or a fee.
164
Proceedings of The 4th International Multi-Conference on Society, Cybernetics and Informatics (IMSCI 2010)

idea by having bowling novices practice both Wii and regular bowling over four days and compare their results in a real bowling game to a control group which had no practice to help determine if practicing the physical task with a Wii teaches skills transferable to regular bowling.
2. RELATED WORK Many aspects of human computer interface could be involved in this exploration of the Wii gaming system. Immersing a user into a virtual world is obviously not the goal of Nintendo or other virtual entertainment systems, but does beg the question, how much simulated reality is required to effectually benefit the user?
A brief look at haptic feedback, visual and presence factors are given here. Flight simulators vary in complexity from a PC based system using only simple graphics to full 6 DOF systems with G seats using air pressure to mimic motion [4]. The realism of a Virtual Reality (VR) system or virtual environment, noted as presence [11] may determine how effectively a simulation trains a user to use an actual system. The data in this experiment clearly shows that Wii does not accomplish this for bowling.
For Wii bowling, there is no haptic feedback, the controller does sense the user’s arm swing and wrist spin resulting in a virtual ball that may hit the pocket resulting in a strike, spin the ball in to the gutter or anything in between. But the mass of a bowling ball and the resulting inertia felt in swinging this mass is not realized with the Wii controller.
Figure 1. Wii Controller
The size and weight of the Wii handheld console in relation to an actual bowling ball is of interest; in our scenario. The Wii hand grip controller measures 6.25 x 2.1 x 1.5 inches (16 x 5.5 x 4cm) and weighs 6.56 oz (186 gms). Our test subjects used 8, 9 or 10 lbs bowling balls; the largest bowling ball therefore, is 24.39 times heavier than the controller. When swinging the ball to bowl, this factor increases as a quadratic since the moment of inertia I = mr2, where m is the mass and r equals the radius of rotation, in our experiment this is roughly the length of a test subject’s arm.
Regarding the visual experience, the field of view (FOV) perceived by a user can be enhanced by motion based interaction. A larger viewing area however does not enhance the “learning, naturalness or intuitiveness” [3] of the experience. In our case, a 70” (178 cm) diagonal television was used with a Wii controller that senses a user’s motion translating direction and spin to a graphical image of a bowling ball rolling down the lane. Our users mastered the game interface quickly as shown in their significantly higher scores on day 2 through 4, see figure 3.
Presence is a concatenation of many HCI factors, we’ve briefly examined haptic feedback and the visual interface in this case, The physical characteristics of the Wii controller don’t match the expected proprioception (a sense that the body is moving with the effort required) of a bowling ball. Neither does the visual display, although large, provide a complete immersion into an actual bowling alley, which is also a function of the Wii graphics.
3. EXPERIMENTS 3.1 Participants Twenty-five undergraduate students from a western university were utilized in this study. Participation was voluntary. Participants were enlisted from a variety of psychology and information technology classes, with the researchers specifically asking for participants with little or no bowling experience. Volunteers who had completed a bowling class or who had competed in a bowling league were not allowed to participate. Demographically, the subjects ranged in age from 18 to 27 with an even distribution of males and females.
3.2 Apparatus The bowling was performed at the Brigham Young University – Hawaii campus game center bowling alley with automatic scoring. The Nintendo Wii console used was also part of the same game center. As with all bowling centers, participants are required to wear socks with game center provided bowling shoes. Although all participants were clearly instructed both verbally and by email to bring socks, many did not resulting in subjects with no socks being assigned as Wii bowlers. This event was used to randomly assign subjects to either the real bowling or Wii bowling group and explains why the two groups were not evenly divided.
3.3 Procedure The study was designed to test regular bowling against Wii bowling as well as against a control group that did not participate in the daily practices. On the first day of the experiment, 16 students were divided into 2 groups, with 9 students randomly assigned to regular bowling training and 7 randomly assigned to Wii bowling training. Training consisted of a single full game of bowling per day for 4 days, with an additional day of testing wherein all participants played a regular bowling game. On that day, 9 control participants who had not been part of the experiment up to that time also played.
The selection of training for 4 days was a function of game center and subject availability and matched previous motor skill research conducted by our psychology department.
For each student, their relative experience with bowling was recorded as “Never”, “5 or fewer bowling games per year”, and
165
Proceedings of The 4th International Multi-Conference on Society, Cybernetics and Informatics (IMSCI 2010)

“More than 5 games per year”, on average, to ensure that the groups used were, indeed, novices.
4. RESULTS One subject’s data was removed from the study because he consistently scored strikes and spares in almost every frame he played, although he said he had virtually no experience in the game, the success of which he rested on his years as a cricket player. Other subjects did not skew the data and were included.
Wii Regular Control
Group
70
72
74
76
78
80
82
84
86
88
90
92
94
Tes
t bo
wlin
g sc
ore
Figure 2. Comparison between regular bowling, Wii bowling and the control groups on their test bowling score.
An analysis of covariance was run between the three bowling groups (Regular, Wii, and Control) with Experience (never, 5 or fewer bowling games per year, and more than 5 games per year, on average) as the covariate to determine the effect of any experience in the participants’ past. As Experience was non-significant as a covariate (p>.90), a regular one way analysis of variance (ANOVA) was run between the 3 groups. The results were F(2, 20)=2.50, p<.05, partial η2=0.20. As can be seen in Figure 3, on the test day when all subjects played a regular bowling game, those who had practiced daily with regular bowling scored significantly higher than either Wii or the no practice Control Group. Least Squared Difference (LSD) post hoc tests substantiated this interpretation as the Regular Bowling Group differed significantly from the Wii Group (p<.05) and the Control Group (p<.05, one-tailed).
In addition, a mixed model repeated measures ANOVA was run on the five daily scores of the Regular and Wii Groups, (Figure 3) with the groups serving as the between subjects variable and the daily scores as the dependent. The results were F(4,52)=8.23, p<.001, partial η2=0.39. As can be seen in Figure 3, the Wii Group outperformed the Regular Group in terms of their bowling scores within their own medium, but when tested in regular bowling the Wii Group underperformed the group trained in regular bowling. As expected the Wii bowling scores were significantly (p<.05) higher than the Regular bowling on days 2-4, but not on the test day where the cross-over occurred.
1 2 3 4 Test
Day
60
70
80
90
100
110
120
130
140
150
160
Bow
ling
Sco
re
Wii Regular
Figure 3. Repeated measure of regular bowling and Wii bowling groups on their bowling scores across the study.
5. DISCUSSION Our results showed that the regular bowling group scored higher than the Wii bowling group and the control group scored higher than the Wii bowling group (Figure 2). However, we found that the regular bowling group scores were stable across the study. In contrast, the Wii bowling group scored higher after the first game and remained stabilized through game 2 to game 4. We interpreted this to show that the Wii Group adapted to the game, thus raising their scores. However, that the Wii Group scored significantly lower than the Regular Bowling Group on the test day seems to indicate that the skills that make one successful at Wii bowling may not transfer well to regular bowling. For our study, that the Wii Group did not differ from a group that had no practices was particularly troublesome to the hypothesis that the Wii simulation was teaching any transferable skills. As a final point, these statistically significant results and large effect sizes were achieved with a very small n, with the maximum group size of nine. Further studies with more participants are recommended so that the results may become clearer. It would also be interesting to examine the transferability of bowling and other physical skills from tasks performed with Microsoft’s new Xbox 360 Natal interface, where posture and hand motions can be tracked in real time and which may lend towards more skill transferability as a result.
This experiment scratches the surface on determining how much reality is required to translate a user’s VR experience to an actual task by creating a baseline. Future research should include an isolation of HCI functions to determine the threshold at which a VR experience actually translates to the real world. One example is to increase the weight of the Wii controller up to the weight of an actual bowling ball to determine if and when the tipping point between VR and reality occurs. This might translate to a formula or guide [9] on how “real” VR must be to provide an effective ROI for training systems.
6. ACKNOWLEDGMENTS Our thanks to David Lucero and Eric Nielsen for allowing us to conduct our experiments at the University’s Game Center.
7. REFERENCES [1] Dorrfuss, K., Bader, F., Wegener, R., Siemon, A., Schwake,
J.U., Hieber T., et al. (2008) Video games can improve
166
Proceedings of The 4th International Multi-Conference on Society, Cybernetics and Informatics (IMSCI 2010)

performance in sports: An empirical study with Wii sports bowling.
[2] Retrieved June 1 2009. http://www.cogsys.wiai.uni-bamberg.de/teaching/ws0708/hci/practice/bowlingwii08.pdf
[3] Hwang, J., Jung, J., and Kim, G. J. 2006. Hand-held virtual reality: a feasibility study. In Proceedings of the ACM Symposium on Virtual Reality Software and Technology (Limassol, Cyprus, November 01 - 03, 2006). VRST '06. ACM, New York, NY, 356-363. DOI= http://doi.acm.org/10.1145/1180495.1180568
[4] McKissick, B. T., Ashworth, B. R., Parrish, R. V., and Martin, D. J. 1980. A study of the comparative effects of various means of motion cueing during a simulated compensatory tracking task. In Proceedings of the 13th Annual Symposium on Simulation V. P. Boyd, R. G. Cumings, C. Hammer, and W. Malamphy, Eds. Annual Simulation Symposium. IEEE Press, Piscataway, NJ, 227-246.
[5] Pasch, M., Berthouze, N., Van Dijk, B, Nijholt, A. (2008). Motivations, strategies, and movement patterns of video gamers playing Nintendo Wii boxing. Human Media Interaction, 8(3), 27-33.
[6] Rosenberg, B.H., Landsittel, D., & Averch, T.D. (2005). Can video games be used to predict or improve laparoscopic skills? Journal of Endourology, 19, 372-376.
[7] Rosser, J.C., Lynch, P.J., Cuddihy, L., Gentile, D.A., Klonsky, J., & Merrell, R.M. (2007). The impact of video games on training surgeons in the 21st century. Archives of Surgery, 142(2), 181-186.
[8] Satyen, L., & Ohtsuka, K. (2002). Strategies to develop dual attention skills through video game training. International Journal for Numerical Methods in Engineering, 42, 561-578.
[9] Sprague, D. W., Po, B. A., and Booth, K. S. 2006. The importance of accurate VR head registration on skilled motor performance. In Proceedings of Graphics interface 2006 (Quebec, Canada, June 07 - 09, 2006). ACM International Conference Proceeding Series, vol. 137. Canadian Information Processing Society, Toronto, Ont., Canada, 131-137.
[10] Voida, A. & Greenberg, S. (2009). Wii all play: The console game as a computational meeting place. Poster session presented at the annual Conference on Human Factors in Computing Systems, Boston, MA.
[11] Witmer, B. G. and Singer, M. J. Measuring Presence in Virtual Environments: A Presence Questionnaire. Presence: Teleoperators and Virtual Environments, 7, 3, pp. 225--240, 1998.
167
Proceedings of The 4th International Multi-Conference on Society, Cybernetics and Informatics (IMSCI 2010)

“Overcoming the digital gap between students and teachers: teacher training in
Media Education in Portugal”
Maria Helena Menezes 1Escola Superior de Educação do Instituto Politécnico de Castelo Branco
Rua Professor Dr. Faria de Vasconcelos, 6000-080 Castelo Branco, PORTUGAL 2Centro de Investigação em Educação da Universidade de Lisboa
Campo Grande, Edifício C1, Piso 3, 1749-016, Lisboa, PORTUGAL
Vitor Tomé1Escola Superior de Educação do Instituto Politécnico de Castelo Branco
Rua Professor Dr. Faria de Vasconcelos, 6000-080 Castelo Branco, PORTUGAL 2Centro de Investigação em Educação da Universidade de Lisboa
Campo Grande, Edifício C1, Piso 3, 1749-016, Lisboa, PORTUGAL
ABSTRACT
Outcomes from research show that the
digital divide between students and
teachers is nowadays a reality in many
schools of several countries. Many
times it is identified as a generational
gap, being the students digital natives
and the teachers digital immigrants.
One fundamental aspect for learning is
concerned to the active analyses and
creative production of media messages
as well as their broadcasting through
several platforms. These messages must
be interesting to be consumed by young
people. Young people must raise their
media literacy level in order to develop
those skills.
The European Union and many other
countries all over the World are taking
measures in order to develop the field
but many are struggling with some
problems, being the most important the
lack on initial and in service teacher
training. To solve these problems within
the Project Media Education in Castelo
Branco region we are developing a
course for teachers. This is a blended
course as the literature advises. At the
moment we are working with 150
teachers and about 650 students (aged
from 11 to 18) in 24 schools. This paper
presents the first results of the project.
Keywords: Media Education, teacher
training, school newspapers,
pedagogical resources, ICT
1. INTRODUCTION
The international scientific community is
paying attention to Media Education
issues nowadays. The United Nations
created the Alliance of Civilizations and
through Unesco defended the importance
of integrating Media Education in all the
curricula in schools and also in the
curricula of initial and in service teacher
training.
The National Association for Media
Literacy Education was created in 2009
in the United States of America for the
same purpose.
In Europe, and also in 2009 the
EuroMedia Literacy network held the
Second European Congress on Media
Education in Italy. Before this Congress
the European Commission published a
recommendation where all Member
States were asked to implement Media
Education in schools [1] in order to
define assessment criteria to assess the
level of media literacy citizens may have
until 2011 [2] so that they can take
168
Proceedings of The 4th International Multi-Conference on Society, Cybernetics and Informatics (IMSCI 2010)
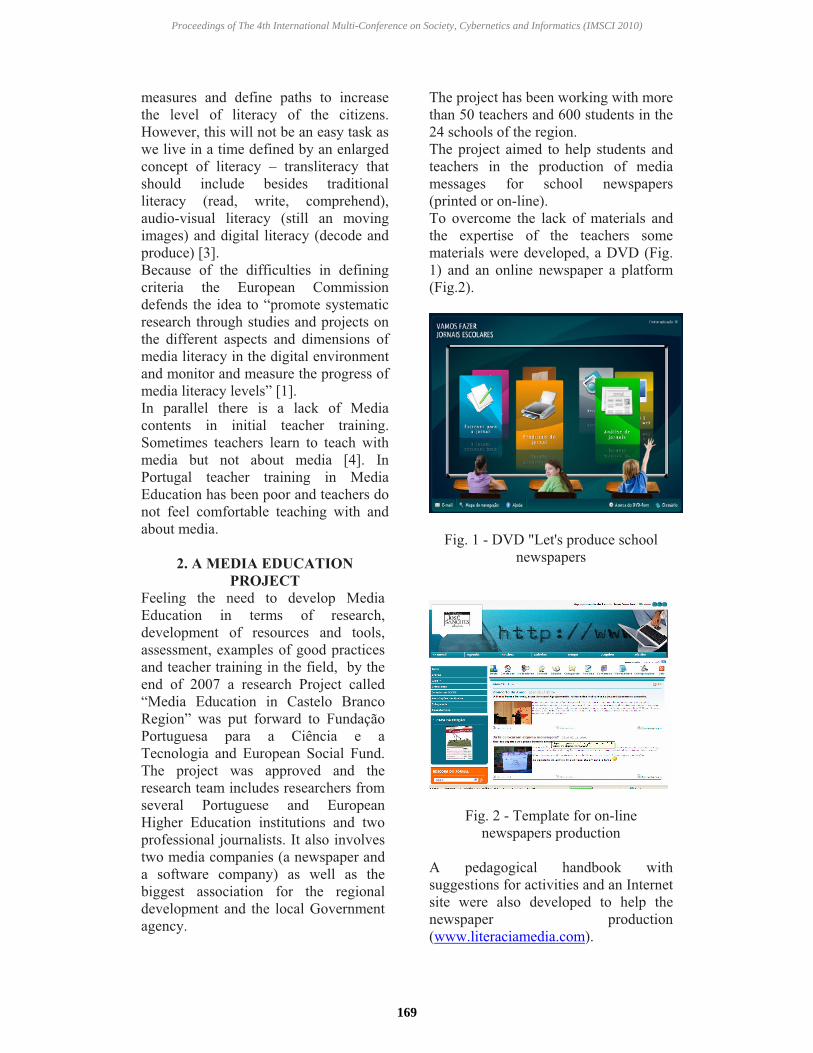
measures and define paths to increase
the level of literacy of the citizens.
However, this will not be an easy task as
we live in a time defined by an enlarged
concept of literacy – transliteracy that
should include besides traditional
literacy (read, write, comprehend),
audio-visual literacy (still an moving
images) and digital literacy (decode and
produce) [3].
Because of the difficulties in defining
criteria the European Commission
defends the idea to “promote systematic
research through studies and projects on
the different aspects and dimensions of
media literacy in the digital environment
and monitor and measure the progress of
media literacy levels” [1].
In parallel there is a lack of Media
contents in initial teacher training.
Sometimes teachers learn to teach with
media but not about media [4]. In
Portugal teacher training in Media
Education has been poor and teachers do
not feel comfortable teaching with and
about media.
2. A MEDIA EDUCATION
PROJECT
Feeling the need to develop Media
Education in terms of research,
development of resources and tools,
assessment, examples of good practices
and teacher training in the field, by the
end of 2007 a research Project called
“Media Education in Castelo Branco
Region” was put forward to Fundação
Portuguesa para a Ciência e a
Tecnologia and European Social Fund.
The project was approved and the
research team includes researchers from
several Portuguese and European
Higher Education institutions and two
professional journalists. It also involves
two media companies (a newspaper and
a software company) as well as the
biggest association for the regional
development and the local Government
agency.
The project has been working with more
than 50 teachers and 600 students in the
24 schools of the region.
The project aimed to help students and
teachers in the production of media
messages for school newspapers
(printed or on-line).
To overcome the lack of materials and
the expertise of the teachers some
materials were developed, a DVD (Fig.
1) and an online newspaper a platform
(Fig.2).
Fig. 1 - DVD "Let's produce school
newspapers
Fig. 2 - Template for on-line
newspapers production
A pedagogical handbook with
suggestions for activities and an Internet
site were also developed to help the
newspaper production
(www.literaciamedia.com).
169
Proceedings of The 4th International Multi-Conference on Society, Cybernetics and Informatics (IMSCI 2010)

These tools were presented and offered
to schools that started using them in the
production of the school newspaper. By
the end of 2009 an assessment seminar
was held, with the international
evaluators in order to evaluate the
activities of the project done so far.
Almost every school published a printed
newspaper with 3 editions a year, with
one thousand copies per edition. The
online platform was not used by every
school because teachers did not feel at
easy. Teachers considered the tools
very helpful however they complained
about lack of training and lack of
communication among them. To solve
the problem teacher training was offered
to those who wanted to improve their
skills and a Google group (Fig. 3) was
created to increase communication and
to help exchanging experiences and
practices among the teachers.
Fig. 3 – Google group
Teachers also complained about lack of
time to perform the activities as the
school does not reduce them teaching
hours.
3. TEACHER TRAINING IN
CASTELO BRANCO (PORTUGAL)
Having in mind the recommendations of
the Second European Congress on
Media Education i.e encourage aesthetic
and creative dimensions; support
teachers with blended learning
solutions; encourage models (at local
level) sharing responsibilities; develop
activities in formal and informal
contexts the research team decided to
start with in-service teacher training.
130 teachers (from several teaching
levels and subject areas) are
participating in the course entitled
‘Media education and the school
newspaper – promoting reading and
writing’ that started on January the 16th
and finishes by the end of July. Each
class has 25 training hours. The content
of the blended course spreads from an
historical perspective of Media
education, the advantages and obstacles
of its integration in the curricula to a
practical project with students in
schools. The resources developed by the
project are also explored (DVD,
handbook, websites, tutorials that
support critical analyses and reflexive
production of media messages). The
course will finish with the presentation
of all the projects and activities
developed in schools and their
assessment.
The final goal of the training is to
produce a handbook with good practices
on Media Education to be made
available to all teachers. Many
interesting interdisciplinary projects are
going on, for instance in the field of
advertising and environment, analyses
and production of labels and
intercultural issues.
4. CONCLUSION
Outcomes from research show that the
digital divide between students and
teachers is nowadays a reality in many
schools of several countries. Many
times it is identified as a generational
gap, being the students digital natives
and the teachers digital immigrants.
It is very important to develop Media
Education activities within the
classroom with students in several
170
Proceedings of The 4th International Multi-Conference on Society, Cybernetics and Informatics (IMSCI 2010)

subject areas. Many of these activities
can be reported in the school
newspaper. For that it is important to
develop pedagogical and technological
resources and to train teachers to feel
comfortable using those resources.
Although Media Education can be
approached by using paper, pencil and
photocopies [6] it is important that
teachers feel comfortable using
technology used to produce and
disseminate media messages.
The development of research projects in
the field of Media Education in schools
is also very important so that teachers
can produce media messages. However
it is fundamental to pay special attention
to processes rather than products,
because it is when analyzing processes
that students may develop critical skills
in the analyses and production of media
messages. Evaluating teacher practices
is, to us, fundamental to improve those
practices and to empower students in
the inter-relation with media.
In the world we live in, surrounded by
media, the development of these skills
is necessary so that individuals may be
fully and integrated citizens in society.
REFERENCES
[1] Commission of the European
Communities. Commission
Recommendation on media literacy
in the digital environment for a more
competitive audiovisual and content
industry and an inclusive knowledge
society (20 August 2009). Accessed
on 20 August 2009 from
http://ec.europa.eu/avpolicy/media_li
teracy/docs/recom/c_2009_6464_en.
[2] Universitat Autònoma de Barcelona
[UAB]. Final report. In UAB.
Current trends and approaches to media literacy in Europe. Barcelona:
Universitat Autònoma de Barcelona,
2007.
http://ec.europa.eu/avpolicy/media_li
teracy/docs/studies/study.pdf
(Accessed on 17 December 2007).
[4] Tyner, K. New Agendas for Media
Literacy. In Kathleen Tyner (Ed.),
Media Literacy: New Agendas in
Communication. New York: College
of Communication of the University
of Texas in Austin and Routledge
2010, pp. 1-7.
[5] Geeroms, C. Final recommendations
of the EuroMeduc Congress of
Bellaria. In Patrick Verniers (Org.)
EuroMeduc: Media Literacy in
Europe: Controversies, Challenges
and Perspectives. Brussels:
EuroMeduc, 2009, pp. 167-171.
[6] Kellner, D. e Share, J. Critical Media
Literacy, democracy and the
reconstruction of Education. In
Donaldo Macedo e Shirley R.
Steinberg (Eds.), Media Literacy: a
reader. New York: Peter Lang
Publishing, 2007, pp. 3-23.
171
Proceedings of The 4th International Multi-Conference on Society, Cybernetics and Informatics (IMSCI 2010)

CancerSPACE: An Interactive E-learning Tool for Healthcare Professionals
Jeffrey SWARZ, Anita OUSLEY, Lenora JOHNSON, Harry KWON, Adriane MAGRO, Office of Communications
and Education, National Cancer Institute, 6116 Executive Blvd., Rockville, MD 20852, USA
ABSTRACT
This paper describes the development of
CancerSPACE (Simulating Practice And
Collaborative Education), a simulation-based, online
e-learning tool for healthcare providers that aims to
increase cancer screening rates for underserved and
minority populations that bear a disproportional
share of the cancer burden. It presents insight into
the purpose of developing this type of educational
tool as well as the reasoning and theories behind
development. This paper also discusses different
obstacles that were faced throughout development
and how they were subsequently approached. The
goal is to guide others in development of simulated
e-learning tools which are focused on improving
chronic and preventive care. Once the final version
is completed, CancerSPACE will be evaluated to
help expand the evidence-base available for guiding
future efforts.
Keywords: Cancer, Screening Rates, Disparities,
Community Health Center, Provider Education,
Games, National Cancer Institute.
INTRODUCTION
The burden of cancer on patients, families,
businesses, and the nation is punishing. Cancer
affects one in two men and one in three women
during their lifetimes. Cancer is th
second leading cause of death among all races and
genders year after year, closely following cardiac
disease. The physical, emotional, and financial toll
of cancer on patients and families is an all too
common story. The financial toll of cancer is
leading to medical bankruptcy increasingly often,
requiring society at large to underwrite the
additional costs of treatment which can last years.
Even setting aside moral, ethical, and humane
motivations for pursuing aggressive cancer
screening interventions in order to reduce the
incidence and mortality of this disease, the bottom
line for business and industry creates further
motivation.
Millions of working hours are lost as employees
battle the disease or care for others during their
fight. This translates into years of productivity lost
annually, and the portion of the cost of healthcare
borne by employers compounds the effect.
Screening for some types of cancer before there is
evidence of the disease can significantly reduce
incidence and mortality from cancer, however,
significant numbers of patients in the healthcare
system are ing
tests that they should be. Can an interactive,
educational tool that simulates barriers to cancer
screening in the clinical environment help?
Simulations have been used for decades to achieve
various performance objectives across various
industries and academic fields. Simulations mimic
actual behaviors and situations allowing a user to
gain practical experience without the associated
harms and risks, as well as gain practice with
uncommon situations. They have been used as part
of common practice and have been proven effective
at training people in various fields including
aviation, military, business, nuclear, and medical [1]
[2]; the archetype being flight simulators, wherein
pilots can rehearse emergency procedures that are
not possible to model without endangering lives and
aircraft. Flight simulators have proven exceedingly
effective at achieving the outcome of fewer
preventable plane crashes.
Simulations are popular among students, and are a
good way to supplement traditional learning
methods. While it is important to have high learner
172
Proceedings of The 4th International Multi-Conference on Society, Cybernetics and Informatics (IMSCI 2010)

satisfaction, it is also important to balance that
information with the other factors. Looking at
knowledge attainment by creating an environment in
which the user can repetitively practice a scenario
until they have thoroughly learned the information
and can be used at a pace which is comfortable for
the user and conducive to their learning. From an
organizational standpoint, simulations have the
ability to reduce financial costs and save staff
resources [3]. They do not require direct supervision
or instructors to present information during the
learning sessions. Finally, they do not require
multiple staff members to be absent from work at
the same time since, unlike a seminar, they can be
completed anywhere at any time. In clinical care,
this can provide benefits to the user, the health
center, and even the patients because of less
disruption during normal office hours.
Advances in digital communications technologies
are increasing the capabilities and reach of
simulation based e-learning tools and they are now
being used in more diverse ways, including more
frequently in the education and training of
healthcare professionals. In the medical field,
simulations allow the user to gain useful experience
without the potential of causing harm to a patient
and practice procedures which they are rarely likely
to encounter in a clinical situation. Some
simulations are strictly computer based, others use
mannequins, and some integrate both to form a
more comprehensive program. Most medical
simulations have historically focused on acute care
and improving medical procedure skills, examples
While health care simulations have been used in the
education and training of health professionals in
acute care settings such as emergency departments
and surgical wards, only recently have medical
simulations begun to be used to improve chronic
and preventive care. One example includes the
This
allows users to see how foods they eat, including
fast food, impact their health [4]. However,
examples of simulation use in chronic and
preventive care are few and even fewer incorporate
educational methodologies that have been shown to
have the greatest level of effectiveness. Moreover,
research to date has not revealed any simulation
based e-learning tools aimed at screening rates in
populations bearing the disparate proportions of the
cancer burden.
CancerSPACE (Simulating Practice And
Collaborative Education) is a simulation-based e-
learning tool designed and developed, at the
National Cancer Institute, for the context of chronic
and preventive care, as opposed to traditional
healthcare related simulations which focus primarily
on improving acute care and procedural expertise.
an interactive, e-learning application represents an
organizational leap in cancer communications and
education methodologies and delivery systems. It
represents the first effort within the Institute to
education portfolio. An E-learning tool was
selected as the appropriate method to promote
cancer screening, in this case, because it overcomes
some of the barriers of previous educational
initiatives. Traditional educational programs such as
train the trainer and educational seminars reach a
limited audience and force workers to take time off
to receive training. A simulation format was chosen
because of the reasons detailed elsewhere in this
paper.
CancerSPACE primarily aims to support increasing
cancer screening rates in Federally Qualified
Community Health Centers ) by advancing
patient/provider communications skills, addressing
screening barriers and interventions, as well as
improving clinical processes.
The mission of FQHCs is to provide free or low cost
health care services, including cancer screening and
other preventive services, to medically underserved
areas and populations. In addition, the
CancerSPACE tool contains features allowing
health educators, professionals, and medical faculty
to create custom simulations, thereby easily
adapting it to educational content about HIV
prevention, diabetes, asthma, obesity, or practically
any other chronic condition.
173
Proceedings of The 4th International Multi-Conference on Society, Cybernetics and Informatics (IMSCI 2010)
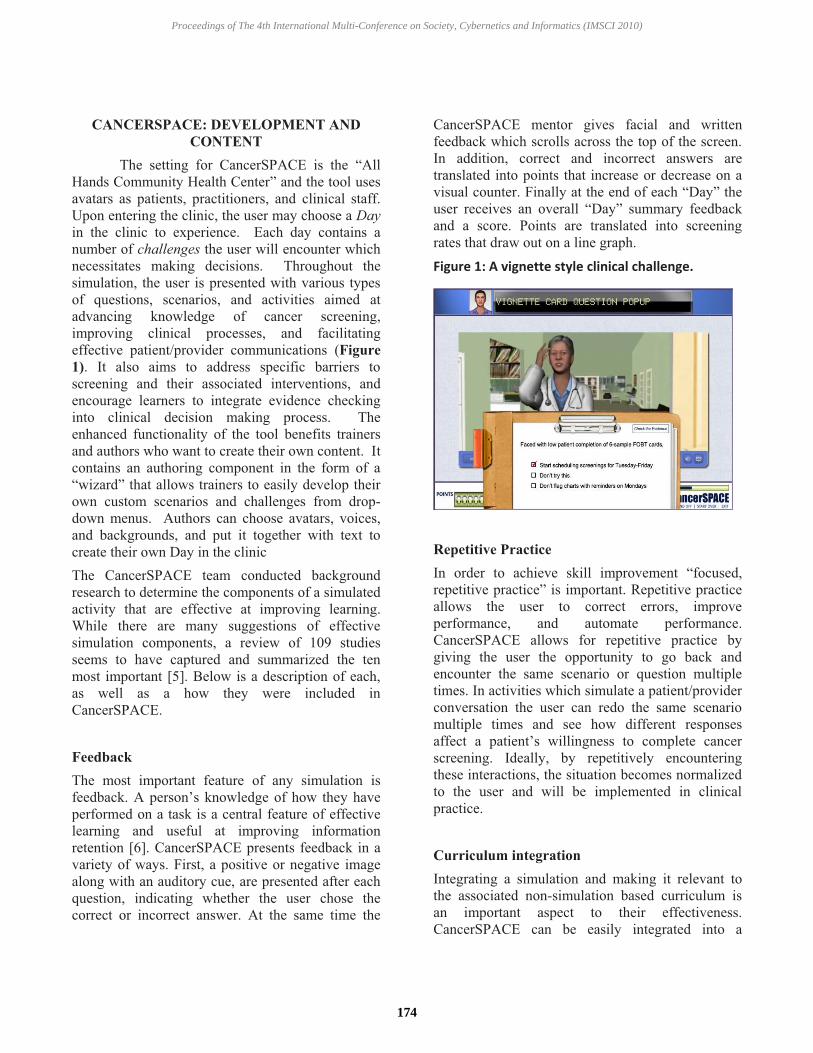
CANCERSPACE: DEVELOPMENT AND
CONTENT
The setting for CancerSPACE is the All
Hands Community Health Center and the tool uses
avatars as patients, practitioners, and clinical staff.
Upon entering the clinic, the user may choose a Day
in the clinic to experience. Each day contains a
number of challenges the user will encounter which
necessitates making decisions. Throughout the
simulation, the user is presented with various types
of questions, scenarios, and activities aimed at
advancing knowledge of cancer screening,
improving clinical processes, and facilitating
effective patient/provider communications (Figure
1). It also aims to address specific barriers to
screening and their associated interventions, and
encourage learners to integrate evidence checking
into clinical decision making process. The
enhanced functionality of the tool benefits trainers
and authors who want to create their own content. It
contains an authoring component in the form of a
own custom scenarios and challenges from drop-
down menus. Authors can choose avatars, voices,
and backgrounds, and put it together with text to
create their own Day in the clinic
The CancerSPACE team conducted background
research to determine the components of a simulated
activity that are effective at improving learning.
While there are many suggestions of effective
simulation components, a review of 109 studies
seems to have captured and summarized the ten
most important [5]. Below is a description of each,
as well as a how they were included in
CancerSPACE.
Feedback
The most important feature of any simulation is
y have
performed on a task is a central feature of effective
learning and useful at improving information
retention [6]. CancerSPACE presents feedback in a
variety of ways. First, a positive or negative image
along with an auditory cue, are presented after each
question, indicating whether the user chose the
correct or incorrect answer. At the same time the
CancerSPACE mentor gives facial and written
feedback which scrolls across the top of the screen.
In addition, correct and incorrect answers are
translated into points that increase or decrease on a
visual counter. Finally at the end of Day
user receives an Day summary feedback
and a score. Points are translated into screening
rates that draw out on a line graph.
Figure 1: A vignette style clinical challenge.
Repetitive Practice
In order to achieve skill improvement ,
important. Repetitive practice
allows the user to correct errors, improve
performance, and automate performance.
CancerSPACE allows for repetitive practice by
giving the user the opportunity to go back and
encounter the same scenario or question multiple
times. In activities which simulate a patient/provider
conversation the user can redo the same scenario
multiple times and see how different responses
screening. Ideally, by repetitively encountering
these interactions, the situation becomes normalized
to the user and will be implemented in clinical
practice.
Curriculum integration
Integrating a simulation and making it relevant to
the associated non-simulation based curriculum is
an important aspect to their effectiveness.
CancerSPACE can be easily integrated into a
174
Proceedings of The 4th International Multi-Conference on Society, Cybernetics and Informatics (IMSCI 2010)
general cancer screening curriculum, or be a part of
mandatory educational sessions. Its intended use is
by trainers as a supplement to a larger curriculum.
Nevertheless, some users may find it useful as a
stand-alone tool, as well.
Multiple learning strategies
Incorporating various learning strategies into a
simulation is desirable. It allows for a higher chance
of fulfilling the intended goal of the simulation, as
well as making it adaptable to the learning styles of
multiples users. Information in CancerSPACE is
presented in a variety of formats ranging from basic
multiple choice questions to activities and
interactive scenarios where the user is able to have a
mock conversation with a patient. CancerSPACE
presents information from basic screening
guidelines to more challenging concepts on
overcoming patient barriers. It is designed to
challenge different types of users and present skills
and information with varying degrees of
complexity.
Capture clinical variation
Simulations are most useful when they include
variation. Variation can portray itself in terms of
patient conditions, illnesses, ethnicities, age,
demographics, and so on. While CancerSPACE was
developed with FQHCs in mind as the target
audience, there is still a great deal of clinical
variation present. The patients, as well as the
clinical staff are ethnically diverse with diverse
dialects and accents. The tool also addresses cancer
screening issues across a range of different ages and
cultural backgrounds, as reported in the scientific
literature. CancerSPACE allows users to interact
rent interventions to
solve a problem, without having to face the real
world consequences of saying the wrong thing or
choosing the wrong intervention. This environment
also allows the user to reflect on a plan of action and
think about how it could be improved in order to
better address a specific situation.
Individualized learning
It is important for a simulation to be adaptable to the
learner. In CancerSPACE, learning becomes
individualized by allowing users to self-pace their
learning and encounter one problem multiple times
if they choose. It was also developed in accordance
with self directed learning approaches and adult
learning theory.
Defined outcomes and objectives
Creating defined outcomes and objectives help the
user to target their learning. Clearly defined goals
encourage the user to create meaningful associations
with the content and a focus on an end result.
CancerSPACE has defined objectives and
summarizes concepts learned for the user at the end
of each Day in the clinic on a summary screen.
Simulator validity
It is important for a simulation to replicate the
experience it is trying to mimic as closely as
possible and for the information presented to the
user to be reputable and valid. The CancerSPACE
team has worked to make the virtual clinic
environment and the characters presented in it as
similar to those which the users experience in the
real-world clinical environment.
While the components presented by Issenberg et al.
are of obvious importance and are fundamental
features incorporated into the development of
CancerSPACE, the development team felt it was
also important to include theoretical components
from behaviorism and adult learning theory in order
to best fit the most effective learning methodologies.
Behaviorism is the idea that positive and negative
reinforcements can help guide learning [7]. The
n example
of how behaviorism is portrayed in CancerSPACE,
with reinforcements presented in image, written, and
numerical form. Additionally, the opportunities to
practice and apply learning are factors that affect
long-term retention and behavior change. Adult
learning theory, otherwise known as andragogy,
suggests that adults learn best when learning is self-
175
Proceedings of The 4th International Multi-Conference on Society, Cybernetics and Informatics (IMSCI 2010)

directed. Taking this into account, programs and
learning tools which allow users to be in control of
their learning, or encourage learners to be active
participants in their learning, are the best way to
teach adults [8].
The material and core knowledge components
presented in CancerSPACE are a combination of
current evidence based recommendations, best
practices, and research tested interventions.
Evidence based recommendations were derived
from studies put forth by the U.S. Preventative
Services Task Force (USPSTF) and supplemented
using information from other studies and
organizations. Best practices and interventions were
obtained through an extensive literature review as
well as through the Research Tested Intervention
Programs (RTIPS) which were developed by
organizations within Health and Human Services.
Since CancerSPACE was developed toward meeting
educational needs of the
in
and consulted throughout the development process.
Clinical staff input was essential at making
CancerSPACE as realistic and applicable as possible
scenarios which are important and useful for the
populations they serve.
FUTURE DEVELOPMENT:
DISSEMINATION AND EVALUATION
Two types of evaluation are currently being planned
for CancerSPACE, a preliminary comparative study
involving six community clinics, and a larger
evaluation of the use of the tool for medical
students. The preliminary study will be conducted
with community health centers located in the Mid-
Atlantic and Northeast regions of the United States.
The purpose of this study is to determine whether
CancerSPACE meets its primary educational
objectives. In addition, this study will assess if these
learners using the tool gain knowledge about cancer
screening and to what degree the learners are
satisfied with this method of learning. Findings from
this study are expected in early summer, 2010.
A second and larger scale evaluation will be
conducted to assess the function and utility of
CancerSPACE as an e-learning tool for medical
students. As discussed earlier, the simulations
presented in CancerSPACE mimic actual behaviors
and situations and allow a user to gain practical
experience. This tool can supplement traditional
medical learning by providing simulations that will
likely be encountered in a clinical setting. This
evaluation will be conducted in collaboration with
school of public health and school of medicine
researchers at a major university. Findings from this
study may have implications on medical education
with regards to preparing future providers on how to
overcome barriers and increase cancer screening
outcomes.
In conjunction with evaluation results, the
CancerSPACE team is exploring possible
enhancements to the tool. While the target audience
that it could be adapted into a cancer prevention or
treatment decision aid tool for patients. Such a tool
could help patients learn about cancer screening,
different options available to them, and potential
risk factors for the disease. In the future it is
anticipated that CancerSPACE will be made more
comprehensive so that clinics can tailor the
information specifically to their needs, and share
created content with other authors. A component
currently in development to facilitate this is a
database that will allow users to create and store
their own Days and Challenges for insertion into the
tool, and make it available for others to download if
they choose. . Moreover, it could also be used as a
foundation for creating similar e-learning tools for
other chronic diseases.
The development of CancerSPACE has given the
development staff a better understanding of new
technologies and how they may be applied to help
further cancer communications. The avatars which
were used in the development of CancerSPACE are
now being employed to help both staff and the
public gain a better understanding of cancer
communications and cancer research at NCI.
176
Proceedings of The 4th International Multi-Conference on Society, Cybernetics and Informatics (IMSCI 2010)

CONCLUSION
Overall, the evidence indicates that simulations are
effective at improving learning; however they
should be used in conjunction with traditional
learning methods and curriculums rather than as a
substitute [9]. They are useful at teaching
uncommon situations, and raise student satisfaction,
potentially resulting in easier and more effective
learning. There is an obvious need for more research
and evaluation in the area of medical simulations
that deal with patient/provider interaction. It is
anticipated that future endeavors with
CancerSPACE will include completing a controlled
effectiveness of this type of simulation, in terms of
immediate information gained, long term
information retention, and overall improvements in
clinical cancer screening rates.
[1]
Issenberg, S.B., McGaghie, W.C., Hart, I.R.,
Mayer, J.W., Felner, J.M. Petrusa, E.R., et al.
(1999). Simulation Technology for Health Care
Professional Skills Training and Assessment.
Journal of the American Medical Association,
282 (9), 861-866.
[2] Bradley, P. (2006). The history of simulation in
medical education and possible future
directions. Medical Education, 40, 254-262. [3] Nelson, E.A. (2003). E-learning A Practical
Solution for Training and Tracking in patient-
care Settings. Nursing Administration
Quarterly, (27), 1, 29-32. [4] Boulos, M.N.K., Hetherington, L., & Sheeler, S.
(2007). Second Life: An Overview of the
potential of 3-D virtual worlds in medical and
health education. Health Information and
Libraries Journal, 24, 233-245.
[5] Issenberg, S.B., McGaghei, W.C., Petrusa, E.R.,
Gordon, D.L., & Scalese, R.J. (2005). Features
and uses of high-fidelity medical simulations
that lead to effective learning: a BEME
systematic review. Medical Teacher, 27, 1, 10-
28.
[6]Quinn, C.N. (2005). Engaging Learning:
Designing e-Learning Simulation Games. San
Francisco, CA: Pfieffer.
[7] Parkay, F.W. & Hass, G. (2000). Curriculum
Planning (7th Ed.). Needham Heights, MA:
Allyn & Bacon
[8] Merriam, S.B. (2001). Andragogy and Self-
Directed Learning: Pillars of Adult learning
Theory. New Directions for Adult and
Continuing Education, 89, 3-13. [9] Laschinger, S., Medves, J., Pulling, C., McGraw,
R., Waytuck, B., Harrison, M.V., & Gambeta, K.
(2008). Effectiveness of simulation on health
confidence, and satisfaction. International
Journal of Evidence Based Healthcare, 6, 278-
302.
177
Proceedings of The 4th International Multi-Conference on Society, Cybernetics and Informatics (IMSCI 2010)

THE TEACHERS AND THE STUDENTS RELATED TO GRAPHIC DESIGN LESSON
AT FINE ARTS SCHOOLS
Assoc.Prof.Dr.H.Turgay Unalan
Anadolu University
Education Faculty, Fine Arts Department
Eskisehir, Turkey
1.ABSTRACT
Art education takes its places with different approach and
stages in all period of civillisation history. In Turkey
Painting Departments of Fine Arts and Physical
Education High School have an important role to
educate students. After some examinations the graduated
students have a chance to attend painting department of
educational faculty or art education of Fine Art Faculty
(Artut,2002,s.62). High Schools are not only the placesthat are preparing the students to university but they are
also forming the human for the future life. Furthermore if
we think that these students will become Fine Arts
teacher or producer the importance of the lecture increase
once again. It should be understood that Graphical
Design Lecture has an importance and effect on students
to be ready and interfere to social transformations.
The aim of this research is to make contribution to ideasrelated to importance and development of GraphicalDesign Lecture.Key Words: art Education, Graphic lesson, Fine ArtSchools.2.INTRODUCTION
The scope of this research is to investigate teacher andstudent ideas of Fine Arts and Physical EducationHighschool and to make contribution to development ofGraphical Design Lecture.3.PURPOSE
These are the questions that are tried to answer with thisresearch:
• What are the theacher’s ideas related to thelecture given at Fine Arts and PhysicalEducation Highschools.
• The student ideas related to Graphical DesignLecture periods with the educational approachapplied by physical situations like activity,workshop and technical materials.
• What are the student ideas about the GraphicalDesign Lecture teacher’s experience, approach,expectations and lecture periods.
• The teacher and student ideas related todiffuculties exposed in Graphical DesignLecture.
The aim of Graphical Design Lecture given as mainlecture at Painting Department is to bring out student ‘screative power and to express their observations, feelingsand designs with the art education. The creative periods
like observation, research, identification and evaluationare built up the background of Graphical Design. But theGraphical Desing Lecture given in 11 th year hasimportant problems to perform these aims.4.LIMITATIONS
Especially the students have troubles with the basicinformation and design periods. The students have to befamiliar with the Graphical Design Lecture before the 11th year and have the basic design education period. It isnecessary to define the teacher and student diffucultiesand their needs in Graphical Design Lecture at Fine Artsand Physical Education Highschool to solve theseproblems.5.UNIVERSE AND SAMPLE
The samples of the reserch are obtained from 5 differentFine Art and Physical Education High School in Turkey.These are Çorum Fine Arts and Physical Education HighSchool, Samsun !lk Adım Fine Arts and PhysicalEducation High School, Trabzon Akçaabat Fine Arts andPhysical Education High School, Giresun Hur"it Bozba#Fine Arts and Physical Education High School, TokatFine Arts and Physical Education High School.6.COLLECTING DATA
Survey data collection tool has been used among thequantitative analysis methods. A questionnaire has beenconducted to 10 teachers composed of 3 section, 20question and to 98 students composed of 2 section, 13question.7.FINDING AND EXPLICATON
By this reserch it is desired to detected the problems thatGraphical Design Lecture students have, teacher andstudent ideas related to the lecture and how does it effectthe efficiency. With the help of the Graphical DesignLecture annual plan the effects determined by the studentideas has been described depending on the survey data.The students problems in the Graphical Design Lecturehas been detected and the advices for the solution hasgiven. If the problems of Graphical Design Lecture canbe defined it is possible to understand better by the helpof the survey.
• The following results have been obtained by thesurvey:
• If we analyze the teacher ideas related to thelecture the lecture hours are not suffcient toreach the targets.As a result of
• If analyze the students approach to the GraphicalDesign lecture it is seen that most of the studentlike the lecture.
178
Proceedings of The 4th International Multi-Conference on Society, Cybernetics and Informatics (IMSCI 2010)

• If we analyze the answers to the question “do yohave enough tools for the lecture in yourschool”it is seen that some schools don’t havecomputer and printing machines and thenecessary physical conditions and technicalbackgrounds are insufficient.
• Another problem with the Graphical DesignLecture is that the preparation level of thestudents are not sufficient as the lecture requires.As a result of this the student interest to thelecture is decreasing.
The teacher and student problems in Graphical Designlecture are too much and also very important8.CONCLUSION AND SUGGESTIONS
The following advices are obtained by examining theresearch data:• To be more effective the physical conditions,technical material and equipments should be enoughforthe teacher who are giving the Graphical Design Lecture.• It is necessary to think about the teacher’s advicerelated to annual program content and its sequence to beable to make improvement.• It is necessary to supply computer programcourses about Graphical Design Lecture and make themmore useful.• The workshop conditions should be improved inGraphical Design Lecture, supply the equipment needsand the documents. Graphical design special workshopsshall be more effective.• To increase student motivation and interest it isnecessary to arrange some presentations with the relatedfaculty. Some educational visits can be performed to theuniversity, advertorial agents and printing offices.• It is necessary to have basic design lecture at 9thclass to give computer program technical knowledge anddiscipline. In addition with some activities except theschool hours the students can improve themselves.With this research, the necessity to give much moreimportance to the Graphical Design Lecture and thenecessity to make more effective course program hasbeen proved.REFERENCES
[1]Artut, K. Sanat E!itimi: Kuramları ve
Yöntemleri. !kinci Basım. Ankara:Anı. (2002).
[2]Karasar, N.(2000). Ara"tırmada Rapor
Hazırlama.Ankara:NobelYayınları.Yayıncılık.Ank
ara:Hacettepe Üniversitesi yayınları.
179
Proceedings of The 4th International Multi-Conference on Society, Cybernetics and Informatics (IMSCI 2010)

Assessing Learning Processes with a Gain-Loss Model
Pasquale ANSELMI
Department of Applied Psychology, University of Padua
Padua, 35131, Italy
Egidio ROBUSTO
Department of Applied Psychology, University of Padua
Padua, 35131, Italy
and
Luca STEFANUTTI
Department of Applied Psychology, University of Padua
Padua, 35131, Italy
ABSTRACT
Within the context of formative assessment, a probabilistic skill
multimap model for assessing learning processes is proposed.
The learning process of a student is modelled as a function of
the interaction between the knowledge of the student and the
effect of a learning object on specific skills. Model parameters
are initial probabilities of the skills, effects of learning objects
on gaining and losing the skills, careless error and lucky guess
probabilities of the problems. An empirical application shows
that the model is effective in detecting students’ knowledge and
the effectiveness of learning objects on attaining specific skills.
Practical implications for formative assessment are discussed.
Keywords: Formative Assessment, Learning Process, Learning
Object, Knowledge Structure, Skill Map.
1. INTRODUCTION
Summative assessment points to grade the knowledge of
students after the teaching is over through a score that
summarizes their learning outcomes. Differently, formative
assessment is ongoing throughout the teaching and aims to
improve knowledge, skills and abilities of students by guiding
teaching and learning at the individual level [1]. In addition, it
helps the teacher to ascertain whether an educational
intervention has been effective in promoting specific learning or
not. Students’ specific strengths and weaknesses are pinpointed
by assigning multidimensional skill profiles to them.
Within the context of formative assessment, we propose a
probabilistic model for assessing the knowledge of students in
the different steps of the learning process, and the effectiveness
of the educational intervention in promoting specific learning.
The theoretical framework is knowledge space theory [2,3] that,
consistently with the aims of formative assessment, provides a
non numerical, multidimensional representation of the
characteristics of students.
In the following section, the theoretical model and its
mathematical specification are presented. Then, an application
on empirical data is provided. Finally, some practical
implications for formative assessment of knowledge are
discussed.
2. THE MODEL
In knowledge space theory, the knowledge state of a student is
represented by the set of problems in a specific knowledge
domain that this student is capable of solving [2,4,5,6].
Differently, we refer to the knowledge state of a student as the
set of non directly observable skills possessed by the student
and which underlie his/her observable responses (with the term
“skills” we refer to a broad class of pieces of knowledge at both
declarative and procedural knowledge, including notions,
abilities, solution procedures, and so on).
In our work, the learning process of a student is modelled as a
function of the interaction between the knowledge state of the
student and the effect of an educational intervention, called
learning object (with the term “learning object” we refer to a
broad class of didactic tools at different levels of granularity). A
probabilistic model is developed to assess the effect of learning
objects on the attainment of skills required to solve problems in
a given field of knowledge. Via the competency model, a skill
multimap [4,5] is used to associate each problem with a
collection of subsets of skills that are necessary and sufficient to
solve it.
The model is characterized by five types of parameters. The
parameter concerning the initial probability of the skills
specifies what skills the students possess before the teaching
begins. The gain and loss parameters respectively specify the
effects of the learning object on gaining and losing specific
skills. The careless error and lucky guess parameters
respectively specify if a problem is failed by inattention or it is
solved by guessing.
Model Specification Let S be a finite and non empty set of discrete skills, and K be
any subset of S. K represents the unknown knowledge state of a
student. Let K1 and K2 be two discrete random variables whose
realizations are the knowledge states of a student at the pre-test
and post-test, respectively. Let Q be a finite and non empty set
containing n dichotomous problems, and R1 and R2 be two
180
Proceedings of The 4th International Multi-Conference on Society, Cybernetics and Informatics (IMSCI 2010)

discrete random variables whose realizations are the response
patterns r ∈ {0, 1}n of a student at the pre-test and post-test,
respectively. Let m be the number of learning objects, and o ∈{1, 2, … , m} be the learning object the student is presented
with.
The conditional probability that r1 and r2 are the response
patterns of a randomly sampled student at the pre-test and post-
test, given the learning object o, is:
( ) ( )
( ) ( ) ( ),,
,
112222
1112211
KPoKLPLP
KPoPSK SL
=====
===== ∑∑⊆ ⊆
KKKKrR
KrRrRrR
)1(
where ( )KP =1K is the initial probability of the state K at the
pre-test, ( )oKLP ,12 == KK is the transition probability from
state K at the pre-test to state L at the post-test,
( )KP == 111 KrR and ( )LP == 222 KrR are the emission
probabilities of response patterns r1 and r2 at the pre-test and
post-test, respectively. Eq. (1) is the basic equation of the
model. Model assumptions are that: a) the response patterns R1
and R2 are locally independent, given the states K1 and K2; b)
the initial state K1 does not depend on the learning object o; and
c) state K2 depends on previous state K1 and on the learning
object o.
Let πs be the probability that skill s belongs to the initial
knowledge state. Assuming total independence among the
skills, the probability ( )KP =1K is resolved according to Eq.
(2):
( ) ( ) ,11
1 ∏∈
−−==
Ss
sKw
ssKw
sKP ππK )2(
where wsK ∈ {0, 1} is equal to 1 if skill s belongs to state K.
Let gain γos be the probability that students presented with
learning object o gain the skill s going from the pre-test to the
post-test, and loss λos be the probability that the same students
lose it. The conditional probability of state L at the post-test,
given state K at the pre-test and learning object o, is:
( ) ( )[ ]
( )[ ] ,1
1,
11
1
12
sKwsLw
ossLw
os
Ss
sKwsLw
ossLw
osoKLP
−−
∈
−
−
−=== ∏
γγ
λλKK
)3(
where wsK ∈ {0, 1} (resp. wsL) is equal to 1 if skill s belongs to
state K (resp. L).
Let careless error αq be the probability that students fail problem
q given that it is solvable by their knowledge state, and lucky
guess βq be the probability that the same students solve problem
q given that it is not solvable by their knowledge state.
Assuming responses to the problems are locally independent,
given students’ knowledge state, the conditional probability of
response pattern r, given the state K, is:
( ) ( )[ ]
( )[ ] ,1
1
11
1
1
qKvqr
qqr
q
n
q
qKvqr
qqr
qtt KP
−−
=
−
−
−=== ∏
ββ
ααKrR
)4(
where t ∈ {1, 2}, vqK ∈ {0, 1} is equal to 1 if problem q is
solvable by state K, and rq ∈ {0, 1} is equal to 1 if problem q is
solved. Eq. (4) is the BLIM [5,7] and the DINA Model [8,9].
Initial probabilities are estimated for each skill, gain and loss for
each learning object and each skill, careless error and lucky
guess for each problem. Maximum likelihood estimates of the
parameters can be computed by an application of the
Expectation-Maximization algorithm [10].
3. EMPIRICAL APPLICATION
Sixty-seven university students were presented with a collection
of 13 open response problems in elementary probability theory
through a computer-based testing procedure. Table 1 represents
the problems in a concise format. Four skills (stochastic
independence, law of total probability, conditional probability,
probability of the complement of an event), and their
combinations, were required to solve all the problems.
Table 1. Problems and conjunctive skill map
Problem Content Skill
1 ( ) ( ) ?;28. == APAP {cp}
2 ( ) ( )( ) ?
34.;13.
=
=∩=∩
AP
BAPBAP{tt}
3 ( ) ( ) ( ) ?;5.;26. ===∩ BAPBPBAP {cd}
4 A and B are independent
( ) ( ) ( ) ?;78.;10. =∩== BAPBPAP{id}
5 ( ) ( )( ) ?
02.;86.
=
=∩=∩
AP
BAPBAP{cp, tt}
6 ( ) ( ) ( ) ?;2.;08. ===∩ BAPBPBAP {cp, cd}
7 A and B are independent
( ) ( ) ( ) ?;84.;95. =∩== BAPBPAP{cp, id}
8 ( ) ( )( ) ?
12.;24.
=
=∩=∩
ABP
BAPBAP{tt, cd}
9
A and B are independent
( ) ( )( ) ?
18.;15.
=
=∩=∩
BP
BAPBAP {tt, id}
10 A and B are independent
( ) ( ) ( ) ?;78.;56. === BAPBPAP{cd, id}
11 ( ) ( ) ( ) ?;67.;04. =∩== BAPABPAP {cp, tt, cd}
12
A are B are independent
( ) ( )( ) ?
18.;34.
=∩
=∩=∩
BAP
BAPBAP {cp, tt, id}
13 A and B are independent
( ) ( ) ?;02. == APBAP{cp, cd, id}
Note. cd = conditional probability; cp = complement of an
event; id = stochastic independence; tt = total probability.
181
Proceedings of The 4th International Multi-Conference on Society, Cybernetics and Informatics (IMSCI 2010)

To test the model, a 2 × 2 experimental design with two
learning objects (effective vs. ineffective) and two assessment
steps (pre-test and post-test) was planned. The effective learning
object (i.e., instructions and information concerning the four
skills) was supposed to be useful to learn the skills required to
solve the problems, whereas the ineffective learning object (i.e.,
concepts of elementary probability theory that were not relevant
for solving the problems) was not supposed to be useful. After
responding to the problems the first time (pre-test), students
belonging to a first group (Group E, N = 36) were presented
with the effective learning object, and those belonging to a
second one (Group I, N = 31) with the ineffective learning
object. Then, a post-test with the same problems took place.
In the present application, each problem was associated with the
skills that are necessary and sufficient for its mastery according
to the conjunctive skill map represented in Table 1. The
knowledge structure K on the collection of problems delineated
by the given skill map is:
K = {∅, {1}, {2}, {3}, {4}, {1, 2, 5}, {1, 3, 6}, {1, 4, 7}, {2, 3, 8},
{2, 4, 9}, {3, 4, 10}, {1, 2, 3, 5, 6, 8, 11}, {1, 2, 4, 5, 7, 9, 12},
{1, 3, 4, 6, 7, 10, 13}, {2, 3, 4, 8, 9, 10}, Q}.
Goodness-of-fit (i.e., how well the model fits the data) and
goodness-of-recovery (i.e., how well model parameters are
recovered by the estimation algorithm) of the model based on
the knowledge structure K were tested using a parametric
bootstrap [11]. Pearson’s Chi-square statistic was used as
goodness-of-fit index. Model identifiability was tested by
estimating the parameters 100 times from different initial points
of the parametric space.
4. RESULTS
Goodness-of-fit of the estimated model (p = .12), as well as
goodness-of-recovery (.01 ≤ SE ≤ .19) were good. Parameter
estimates did not change by varying their initial values.
Table 2 contains the estimates of the parameters π, γ and λ.
“Complement of an event” is the skill having the highest initial
probability (πcp = .79), followed by “total probability” (πtt =
.49), “conditional probability” (πcd = .36), and “stochastic
independence” (πid = .35).
Table 2. Maximum likelihood estimates of the parameters ππππ,
γγγγ and λλλλ Group E (N = 36) Group I (N = 31)
Skill
Initial
prob. πGain
γLoss
λGain
γLoss
λCompl. of event
Total probability
Cond. probability
Stochastic ind.
.79
.49
.36
.35
< .01
.80
.23
.48
< .01
.09
.02
.10
< .01
< .01
< .01
< .01
< .01
< .01
< .01
< .01
The learning object presented to Group E has been effective in
promoting the attainment of the skills. “Total probability” is the
skill attained with highest probability (γtt = .80), followed by
“stochastic independence” (γid = .48), and “conditional
probability” (γcd = .23). The skill concerning the complement of
an event is not further acquired (γcp < .01). Since it is the skill
having the highest initial probability, it is difficult to assess the
effectiveness of the learning object in the few students who did
not possess it in the pre-test. Unlike the learning object
presented to Group E, the one presented to Group I has not been
effective in promoting the attainment of the skills (γ < .01 for
all). All differences between parameters across the two groups
were significant at a level p < .001. Unexpectedly, in Group E
the probability of losing three of the four skills is greater than in
Group I, even if these probabilities are quite small (see Table 2).
Table 3 contains the estimates of the parameters α and β.
Problems 5, 6 and 4 have the smallest overall values of careless
error and lucky guess (α5 + β5 = .09; α6 + β6 = .17; α4 + β4 =
.20). It means that, almost certainly, they are solved only by
students who possess the underlying skills. In contrast,
problems 13, 12, 11 and 9 have the greatest overall values of
careless error and lucky guess (α13 + β13 = .74; α12 + β12 = .69;
α11 + β11 = .65; α9 + β9 = .54). It means that they do not provide
reliable information on the presence of the underlying skills.
Table 3. Maximum likelihood estimates of the parameters ααααand ββββ
Problem
Careless
error αLucky
guessβ
Problem
Careless
error αLucky
guess β1
2
3
4
5
6
7
.02
.22
.02
< .01
.09
.04
.25
.31
.04
.35
.20
< .01
.13
.02
8
9
10
11
12
13
.29
.51
.07
.63
.69
.49
.06
.03
.17
.02
< .01
.25
5. CONCLUSIONS
The model assessed the initial knowledge state of the students
and the change in this state due to the learning process. In
particular, it has permitted to observe the effect of the learning
objects on gaining and losing specific skills. Estimated
probabilities of acquiring the skills were greater in the group
presented with the effective learning object than in the other
one.
Model parameters provide the teacher with information for
organizing and evaluating learning programs. Initial
probabilities of the skills help the teacher to assess what the
students already know and what they are ready to learn. Gain
and loss parameters enable the teacher to select the best learning
object for the specific weaknesses of the students, given their
knowledge state. Careless error and lucky guess parameters
inform the teacher about the effectiveness of each problem in
detecting the underlying skills. The problems with the smallest
careless error and lucky guess probabilities are with confidence
solved only by students who possess the underlying skills. On
the contrary, the problems with the highest careless error and
lucky guess probabilities do not reliably inform on the presence
of the underlying skills. The latter could suggest failings in the
specification of the skill multimap or in the wording of the
problems.
Once the model has been estimated and validated on the group
of students, posterior Bayesian estimates of the parameters, as
well as those of the knowledge states, can be computed for each
student.
By focusing on the skills which underlie the problems, the
model can suggest to the teacher which skills should be taught
so that a previously unsolvable problem becomes solvable. In
this respect the model is not dissimilar to other ones [8,9,12,13].
However, unlike existing models, our model allows to compare
182
Proceedings of The 4th International Multi-Conference on Society, Cybernetics and Informatics (IMSCI 2010)

different learning objects by directly measuring their effect on
the acquisition of specific skills. In this way, it helps the teacher
to select the best material and instructions for the specific
weaknesses of the students.
Assessing the knowledge of the students and the effectiveness
of the educational interventions in promoting specific learning
can directly guide teaching and learning. This is consistent with
the aims of formative assessment.
6. REFERENCES
[1] L.V. DiBello & W. Stout, “Guest editors’ introduction
and overview: IRT-based cognitive diagnostic models
and related methods”, Journal of Educational
Measurement, Vol. 44, No. 4, 2007, pp. 285-291.
[2] J.P Doignon & J.C. Falmagne, “Spaces for the
Assessment of Knowledge”, International Journal of
Man-Machine Studies, Vol. 23, No. 2, 1985, pp. 175-
196.
[3] J.C. Falmagne, M. Koppen, M. Villano, J.P. Doignon &
L. Johanessen, “Introduction to knowledge spaces: how to
build, test and search them”, Psychological Review, Vol.
97, No. 2, 1990, pp. 201-224.
[4] J.P. Doignon, “Knowledge spaces and skill assignments”.
In G. H. Fischer & D. Laming (Eds.), Contributions to
Mathematical Psychology, Psychometrics, and Methodology (pp. 111-121), New York: Springer-
Verlag, 1994.
[5] J.P. Doignon & J.C. Falmagne, Knowledge Spaces,
Berlin: Springer-Verlag, 1999.
[6] J. Lukas & D. Albert, “Knowledge Structures: What they
are and how they can be used in cognitive psychology,
test theory, and the design of learning environments”. In
D. Albert & J. Lukas (Eds.), Knowledge Spaces:
Theories, Empirical Research, and Applications (pp.
3-12), Mahwah: Lawrence Erlbaum Associates, 1999.
[7] J.C. Falmagne & J.P. Doignon, “A Class of Stochastic
Procedures for the Assessment of Knowledge”, British
Journal of Mathematical and Statistical Psychology,
Vol. 41, 1988, pp. 1-23.
[8] J. de la Torre & J. Douglas, “Higher-order latent trait
models for cognitive diagnosis”, Psychometrika, Vol.
69, No. 3, 2004, pp. 333-353.
[9] B.W. Junker & K. Sijtsma, “Cognitive assessment models
with few assumptions, and connections with
nonparametric item response theory”, Applied
Psychological Measurement, Vol. 25, No. 3, 2001, pp.
258-272.
[10] A.P. Dempster, N.M. Laird & D.B. Rubin, “Maximum
Likelihood from Incomplete Data via the EM Algorithm”,
Journal of the Royal Statistical Society. Series B (Methodological), Vol. 39, No. 1, 1977, pp. 1-38.
[11] R. Langeheine, J. Pannekoek & F. van de Pol,
“Bootstrapping Goodness-of-fit Measures in Categorical
Data Analysis”, Sociological Methods and Research,
Vol. 24, No. 4, 1996, pp. 492-516.
[12] D. Albert & T. Held, “Component-based Knowledge
Spaces in Problem Solving and Inductive Reasoning”. In
D. Albert & J. Lukas (Eds.), Knowledge Spaces:
Theories, Empirical Research, and Applications (pp.
15-40), Mahwah: Lawrence Erlbaum Associates, 1999.
[13] K. Korossy, “Modeling Knowledge as Competence and
Performance”. In D. Albert & J. Lukas (Eds.),
Knowledge Spaces: Theories, Empirical Research, and
Applications (pp. 103-132), Mahwah: Lawrence Erlbaum
Associates, 1999.
183
Proceedings of The 4th International Multi-Conference on Society, Cybernetics and Informatics (IMSCI 2010)

Attitudes Towards Patients by Undergraduate Health Students
Malcolm Boyle
Department of Community Emergency Health and Paramedic Practice, Monash University
Frankston, Victoria 3199, Australia
Brett Williams
Department of Community Emergency Health and Paramedic Practice, Monash University
Frankston, Victoria 3199, Australia
Ted Brown
Department of Occupational Therapy, Monash University
Frankston, Victoria 3199, Australia
Lisa McKenna
School of Nursing & Midwifery ,Monash University
Frankston, Victoria 3199, Australia
Liz Molloy
Centre for Medical Health Science Education, Monash University
Notting Hill, Victoria 3168, Australia
Belinda Lewis
Department of Health Social Science, Monash University
Frankston, Victoria 3199, Australia
184
Proceedings of The 4th International Multi-Conference on Society, Cybernetics and Informatics (IMSCI 2010)

ABSTRACT
Introduction
Empathy is often considered an important trait for professionals
in the health field along with positive attitudes toward all
medical conditions. The objective of this study was to
determine the extent of empathy and attitudes towards specific
medical conditions amongst undergraduate students in six
health-related courses at one Australian university.
Methods
A convenience sample of undergraduate students enrolled in six
health-related courses in first, second and third years at Monash
University were surveyed. The Jefferson Scale of Physician
Empathy (Health Professional version) and the Medical
Condition Regard Scale were completed by students along with
a brief demographic questionnaire. Mean scores, t-tests, and
ANOVA were used to analyse student attitudes. Ethics approval
was granted.
Results
The study involved 549 students. Female students were
significantly more empathic than male students (p=0.002).
Older students were more empathic than younger students
(p=0.039). No significant differences between year level of
study, and professional course of study were found. Statistically
significant differences were found between the health
professional courses for each of the three medical conditions
focused on in the study intellectual disability (p<0.002),
substance abuse (p<0.033),) and acute mental illness (p<0.023).
Conclusion
This study suggests a strong presence of empathy amongst
undergraduate allied health students who also have a strong
regard for some medical conditions.
Keywords
allied health, education, empathy, Jefferson Scale of Physician
Empathy - Health Professional version, Medical Condition
Regard Scale, undergraduate students.
INTRODUCTION
Empathy is considered to be an important trait for professionals
in the health field to possess. Several previous studies have
assessed empathy in medical students and medical interns.[1-8]
No previous studies were located that investigated empathy in
the allied health professions nor specifically undergraduate
allied health science students.
There is a long history of certain medical conditions being
associated with stigma, stereotypes, and negative attitudes.
Research has shown that such attitudes can have a detrimental
effect on the patients suffering a stigmatised medical condition
and can even flow on to negatively impact their family.[9]
There have been three previous studies that have use the
Medical Condition Regard Scale (MCRS) to determine attitudes
of healthcare professionals towards patients with specific
medical conditions.[10-12]
There have been no previous published studies into
conditions for midwifery, health science, occupational therapy,
physiotherapy, and emergency health (paramedics).
The objective of this study was to determine the extent of
empathy and attitudes towards specific medical conditions
amongst undergraduate students in six health-related courses at
Monash University - Peninsula Campus.
METHODS
Design
A cross-sectional study using a paper-based Jefferson Scale of
Physician Empathy - Health Professional (JSPE-HP) version
and Medical Condition Regard Scale (MCRS) were completed
by students.
Participants
All students enrolled as an undergraduate student in one of the
health-related courses at Monash University - Peninsula
Campus were eligible to participate in the study. This included
students from any year of their course (see Table 1).
Course Year 1 Year 2 Year 3 Total
Emergency Health
(Paramedic)
12 77 160 249
Nursing 35 153 270 458
Midwifery 4 31 51 86
Occupational
Therapy
18 33 118 169
Physiotherapy 13 42 181 236
Health Science 24 29 45 98
Table 1: Number of student enrolled by course by year
Instrumentation
We utilised the Jefferson Scale of Physician Empathy Health
Professional (JSPE-HP) version, a psychometrically validated
measurement of empathy.[2] The JSPE-HP required students to
answer 20 questions using a 7-point Likert scale (Strongly
disagree=1 to Strongly agree=7). Ten of the 20 questions were
negatively worded in order to decrease the confounding effect
of acquiescence responding, which were afterwards reversed-
scored for analysis.[13] The scale can be completed in
approximately five minutes and produces scores ranging from a
minimum of 20 through to a maximum of 140. The higher the
-
HP has proven reliability and validity.[4, 5, 13-15]
The Medical Condition Regard Scale (MCRS) was developed
to provide a measure of attitudes that could be applied to any
medical condition and allow for comparison between them.[10]
This study utilised the MCRS since it measures attitudes toward
medical conditions and in particular the extent to which students
find such medical conditions to be ,treatable and worthy of
medical resources. The MCRS is designed such that it can be
used with any medical condition. This provides a useful degree
of flexibility allowing the health-related courses involved in this
study to apply five medical conditions most relevant to their
professional field, giving a total of thirteen different medical
conditions in the final results. The MCRS is considered valid
and reliable and its authors found the scale to have a Cronbach
coefficient alpha of 0.87 and a test re-test reliability of 0.84.[10]
The eleven items on the MCRS were rated on a 6-point Likert
scale (1=strongly disagree, 6=strongly agree). To reduce the
confounding effect of acquiescence responding, five of the
eleven items are worded negatively, which were later reversed
for analysis.
185
Proceedings of The 4th International Multi-Conference on Society, Cybernetics and Informatics (IMSCI 2010)

Procedures
All students participating in the study received an explanatory
statement about the study and were informed that participation
was voluntary and anonymous prior to commencing the survey.
Each participant was required to complete a self-reporting
questionnaire which included demographic questions the JSPE-
HP and MCRS. The survey was completed at the end of a
lecture for each respective group of health students. A non-
teaching member of staff facilitated the process and collected
the questionnaires and consent was implied by completion of
the survey. It took participants on average 20 minutes to
complete the questionnaires.
Ethics
Ethics approval for the study was obtained from the Monash
University Standing Committee on Ethics in Research Involving
Humans (SCERH).
Data analysis
Descriptive and inferential data analysis was undertaken using
SPSS (Statistical Package for the Social Sciences Version 17.0,
SPSS Inc., Chicago, Illinois, USA). Descriptive statistics,
means, and standard deviations, were used to summarise the
demographic and some JPSE-HP and MCRS data. Inferential
statistics, t-test, and ANOVA, including post hoc tests, were
used to compare the difference between courses, age groups,
gender, and year of the course. All tests were two tailed unless
otherwise stated with the results considered statistically
significance if the p value is < 0.05.
RESULTS
Student Demographics
A total of 459 students participated in the study with all six
health-related courses having an adequate representation of
participants for statistical analysis. The number of students from
each course who participated in the study is presented in Table
2. Because convenience sampling was used we cannot be sure
of the number of students who declined to participate, therefore,
no response rate can be provided.
Course n
Emergency Health (Paramedic) 120
Nursing 107
Midwifery 52
Occupational Therapy 92
Physiotherapy 109
Health Science 69
Table 2: Total number of student respondents by health-related
course enrolled in
Of the student participants overall, the majority were female
(81.3%) and were under the age of 21 (55.2%) or between 21
and 25 years of age (24.7%). There was a good representation
of students from each of the three years of study; 24.6% from
first year, 42.7% from second year, and 32.7% from third year.
An important phenomenon encountered in the results was the
uneven distribution of males across the six health-related
courses. Most of the male students were studying physiotherapy
(38.6%) or emergency health (paramedic) (35.6%) with no
males studying midwifery.
Jefferson Scale of Physician Empathy- Health Professional version
Comparison of Mean Empathy
The mean empathy score for female students (mean=109.78,
SD=14.73) was significantly higher than the mean empathy
score for males (mean=104.76, SD=12.21), p=0.002. There was
a significant difference in empathy scores between younger
students (< 26 years), p=0.039, however post hoc testing did not
demonstrate any statistically significant difference between the
age groups. Students enrolled in Occupational Therapy reported
the highest levels of empathy (mean=111.55, SD=17.12) while
nursing students reported the lowest levels of empathy
(mean=107.34, SD=13.74). However, there was no statistically
significant variation between the students enrolled in the six
allied health courses (p=0.164). There were no statistically
significant difference recorded for year level of the course
(p=0.862).
The Cronbach alpha coefficient was 0.85 for this study which
demonstrates a good level of internal consistency. An analysis
of the individual JSPE-HP items showed that respondents
tended to answer all, but one item in a way that was indicative
touched by intense emotional relationships among my patients
-point Likert Scale (mean=4.03).
Medical Condition Regard Scale
Students from six health-related courses were administered
different sets of medical conditions. Consequently there were a
total of thirteen different medical conditions. The focus is on an
overview of student attitudes and how they differ between the
health-related courses. Therefore the analysis focussed on the
three most commonly encountered medical conditions:
intellectual disability, substance abuse, and acute mental illness.
There was also a strong internal consistency for the MCRS as
Intellectual Disability Medical Condition Group
Overall intellectual disability as a medical condition was held in
high regard by the students (mean=51.98, SD=7.97). There was
a statistically significant difference in the attitude reported
towards intellectual disability as a medical condition between
the six courses (p=0.02), with students studying physiotherapy
having reported the lowest mean regard (mean=49.83,
SD=7.90). Statistically significant differences were also
reported between year level (p<0.013) and gender (p<0.017).
The notable differences within these two variables were that
third year students reported the lowest regard (mean=50.50,
SD=8.30) and females reported the highest regard (mean=52.56,
SD=7.82) compared to male students.
On the MCRS, students rated their level of agreement on a 6-
point scale for each item and mean item scores below 3.5 are
therefore indicative of negative regard or attitude. For
intellectual disability, there were no negative means for each
course on any individual scale item. There were, however, three
items which received notably high means overall. From highest
186
Proceedings of The 4th International Multi-Conference on Society, Cybernetics and Informatics (IMSCI 2010)

Substance Abuse Medical Condition Group
Substance abuse as a medical condition was held in the lowest
regard by health science students overall (mean=46.37,
SD=8.80), with midwifery students holding substance abuse in
the lowest regard by a statistically significant margin (p=0.033).
A statistically significant difference was also reported between
the two genders with respect to substance abuse (p=0.028), with
females (mean=46.82, SD=8.81) reporting more positive
attitudes to clients with substance abuse problems than males
(mean=44.19, SD=8.72).
as to how students reported their regard for patients with
substance abuse problems. Slightly negative mean scores were
ients like
Despite some negative regard, three items received means
indicative of a positive regard towards substance abusing
do to help patients like
(mean=5.45).
Acute Mental Illness Medical Condition Group
Acute mental illness as a medical condition was also held in
high regard by students overall. The only demographic variable
to have a statistically significant difference with respect to mean
regard for acute mental illness was by course (p<0.023) and
students enrolled in emergency health (paramedics) reported the
highest mean regard for acute mental illness (mean=53.3,
SD=7.48).
The MCRS item that received the highest mean with regard to
s that received
received a mean score indicative of high regard if students
science reported an extremely low regard for this item
(mean=2.36).
DISCUSSION
Like other studies of students studying in the health-related
disciplines, females in this study reported being more empathic
than their male counterparts. [2, 4, 15] Studies using versions
of the JSPE-HP typically found females to have significantly
higher mean empathy scores than males.[4, 5, 13-15] While this
gender difference is commonly reproduced in studies, there are
still some studies that do not find a significant difference.[2, 16,
17]
This study demonstrated no statistically significant decline in
empathy across the year levels of study for students. On the
surface this result is contrary to the findings obtained in other
studies which typically report
progress through their professional education.[2, 18] Likewise,
there was no significant difference between students from the
six health-related courses in this study.
One course did demonstrate an increase in empathy from year
one to year three, that being midwifery. The participants
enrolled in midwifery reported a statistically significant rise in
mean empathy levels (p=0.025), a rise from first year
(mean=101.00) through to third year (mean=119.88). This may
be explained by midwives working in more intimate, one-to-one
relationships with childbearing women over extended periods of
throughout pregnancy, labour and birth. It should also be noted
that there were no male students enrolled in the midwifery
course.
One JSPE-HP item
allow myself to be touched by intense emotional relationships
across all disciplines evidently had some difficulty with this
item. The other 19 items were answered consistently, showing a
strong presence of empathy.
The findings also indicated that students have a high regard for
both acute mental illness and intellectual disability conditions.
Substance abuse, however, received a comparatively low
regard. Across all the medical conditions, students answered in
such a way indicative of a desire to act professionally with
answered favourably across all the medical conditions, showing
an intention to be fair and responsible in their conduct and
interactions with patients.
eel especially compassionate toward patients like
particularly low for substance abuse (mean=3.36) than it was
for either intellectual disability (mean=4.25) or acute mental
illness (mean=4.29). Because items were rated on a 6-point
Likert scale scores below 3.5 is indicative of negative attitudes.
These differences found between the six health-related courses
may be the result of how students from each of the disciplines
view their role in healthcare, their level of exposure during
clinical placements, and the vantage point their profession
provides from which to view patients. The data provides
sufficient evidence to show that there is a significant difference
in views between the disciplines and, more importantly, that the
views these students have impact on their attitudes and
perceptions towards patients presenting with different medical
conditions.
The findings from this study highlight a need to better educate
undergraduate health students towards some medical conditions,
e.g. substance abuse, as this may be an endpoint to an
underlying medical condition like depression. The generally
high reports of empathy in the data set lead to questions about
how university-based curricula can best develop empathy in
undergraduate students and how it should be used in their
professional careers. Is a didactic session the best way to
would a variety of blended teaching
and learning methods better meet the students different
learning styles and skill needs? Further study is also needed to
explore the extent to which clinical role models influence the
development of attitudes and behaviours related to empathy in
the clinical setting
CONCLUSION
This study suggests a strong presence of empathy amongst
students enrolled in undergraduate health-related courses.
Female students were found to be more empathic than their
187
Proceedings of The 4th International Multi-Conference on Society, Cybernetics and Informatics (IMSCI 2010)

male peers whilst older students were more empathetic than
younger students. There was little difference in reported
empathy levels between the specific health-related courses that
students were enrolled in or the year level of study.
The undergraduate health-related students as a group have a
strong regard and positive attitude towards patients presenting
with intellectual disability and acute mental illness conditions,
but not for patients that fall into the substance abuse condition
category. The results suggest that health professional students
distinguish between patients with medical conditions perceived
to be self-inflicted or a result of personal choices and that such
patients are not as worthy of compassion and effort beyond
standard professional expectations.
REFERENCES
1 Bailey B. Empathy in medical students: Assessment
and relationship to specialty choice [PhD].
Charlottesville VA: University of Virginia; 2001.
2 Chen D, Lew R, Hershman W, Orlander J. A cross-
sectional measurement of medical student empathy. J
Gen Intern Med. 2007;22(10):1434-8.
3 Harsch H. The role of empathy in medical students'
choice of specialty. Academic Psychiatry.
1989;13(2):96-8.
4 Hojat M, Gonnella J, Mangione S, Nasca T, Veloski
J, Erdmann J, et al. Empathy in medical students as
related to academic performance, clinical competence
and gender. Med Educ. 2002;36(6):522-7.
5 Hojat M, Zuckerman M, Magee M, Mangione S,
Nasca T, Vergare M, et al. Empathy in medical
students as related to specialty interest, personality,
and perceptions of mother and father. Personality and
Individual Differences. 2005;39(7):1205-15.
6 Kupfer D, Drew F, Curtis E, Rubinstein D.
Personality style and empathy in medical students. J
Med Educ. 1978;53(6):507-9.
7 Newton B, Savidge M, Barber L, Cleveland E, Clardy
J, Beeman G, et al. Differences in medical students'
empathy. Acad Med. 2000;75(12):1215.
8 Winefield H, Chur-Hansen A. Evaluating the outcome
of communication skill teaching for entry-level
medical students: Does knowledge of empathy
increase? Med Educ. 2000;34(2):90-4.
9 Link BG, Struening EL, Rahav M, Phelan JC,
Nuttbrock L. On Stigma and its Consequences:
Evidence from a Longitudinal Study of Men with Dial
Diagnoses of Mental Illness and Substance Abuse. J
Health Soc Behav. 1997;38(2):177-90.
10 Christison G, Haviland M, Riggs M. The Medical
Condition Regard Scale: Measuring reactions to
diagnoses. Acad Med. 2002;77(3):257-62.
11 Christison G, Haviland M. Requiring a One-Week
Addiction Treatment Experience in a Six-Week
Psychiatry Clerkship: Effects on Attitudes Toward
Substance-Abusing Patients. Teaching and Learning
in Medicine. 2003;15(2):93-7.
12 Dearing KS, Steadman S. Challenging Stereotyping
and Bias: A Voice Simulation Study. J Nurs Educ.
2008;47(2):59-65.
13 Hojat M, Gonnella J, Nasca T, Mangione S, Vergare
M, Magee M. Physician empathy: Definition,
components, measurement, and relationship to gender
and specialty. Am J Psychiatry. 2002;159(9):1563-9.
14 Hojat M, Gonnella J, Mangione S, Nasca T, Magee
M. Physician empathy in medical education and
practice: Experience with the Jefferson scale of
physician empathy. Seminars in Integrative Medicine.
2003;1(1):25-41.
15 Sherman J, Cramer A. Measurement of Changes in
Empathy During Dental School. J Dent Educ.
2005;69(3):338-45.
16 Hojat M, Mangione S, Nasca T, Rattner S, Erdmann
J, Gonnella J, et al. An empirical study of decline in
empathy in medical school. Med Educ.
2004;38(9):934-41.
17 Kliszcz J, Nowicka-Sauer K, Trzeciak B, Nowak P,
Sadowska A. Empathy in health care providers -
validation study of the Polish version of the Jefferson
Scale of Empathy. Advances in Medical Sciences.
2006;51:219-25.
18 Newton B, Barber L, Clardy J, Cleveland E,
O'Sullivan P. Is there hardening of the heart during
medical school? Acad Med. 2008;83(3):244-9.
188
Proceedings of The 4th International Multi-Conference on Society, Cybernetics and Informatics (IMSCI 2010)

Inside the Black Box:
Exploring Mental Models in the Learning Environment
Linda J. Smith
Florida State University, Tallahassee, Florida
ABSTRACT
en
the student exhibits an observable representation of his or her conceptions. Instructors and researchers are
mind. A new methodology has been
developed to provide a more holistic view of learner conceptions. The methodology includes a means of
comparing mental models (e.g., novice vs. expert) and determining similarity in content and structure. The
methodology seeks to reduce to represent
his or her own model. In a formative evaluation, the methodology provided important information about
differences between the mental models of new instructional design students and the mental models of
experienced practitioners. The methodology identified learner needs and possible misconceptions that could
affect the design and delivery of their instruction. Recommendations for future research are presented.
Key words: mental models, instructional design, entry level knowledge, assessment, GAPS
INTRODUCTION
In the context of an education system, students and
instructors function both as education system elements
and as individual systems. Viewing a student as a
learning system suggests that instructional designers
and instructors would benefit from new ways to gain
Similarly, it can be helpful for researchers and
instructional designers to gain better understanding of
what an instructor brings to the learning environment.
A holistic expression
internal views can reveal that perso
a subject. A mental model is defined here as an internal
cognitive structure created by an individual to explain
external phenomena, to solve problems, and/or to
predict outcomes of actions and decisions. These
structures are created in response to the demands of a
situation and rely on accumulated
experiences, observations, instructional histories, and
reflections. Internal structures cannot be observed
d
mental model vary according to the extent of freedom
of expression s/he is given and assumptions that must
be made about the similarity between the internal
model and its external representation. This paper
reports highlights of research regarding a new
methodology (Smith, 2005) for representing and
assessing mental models of students and instructors.
THE NEED FOR A NEW METHODOLOGY
The new methodology is Graph and Property Sets
(GAPS) analysis (Smith, 2005). Mental models are
represented by graphs consisting of concept nodes
(vertices) and the linkages (edges) among them.
Property sets are used to describe each graph element
(vertices and edges). The methodology includes
instructions and formulas for determining the degree of
similarity in structure and content of mental model
representations. Such comparisons can be used for a
variety of purposes, including: (a) assessing entry level
knowledge; (b) tracking learning progress; (c)
determining if and to what extent instructional
interventions help learners deal with complex
phenomena and problem solving situations; (d)
examining similarities and differences among experts;
and (e) improving our understanding of learning and
the design principles that influence it.
Most discussions of mental model assessment focus on
the learner
Teacher conceptions could be at variance with those of
recognized experts (e.g., scientists) and might
compound problems in learners onceptions
(Ogan-Bekiroglu, 2007). More information is needed
about the cognitive processes of teacher and students
working together in building mental models (Clement
& Oviedo, 2003) and about
conceptions on conceptual change in learners (Reinders
and Treagust, 2003). Mental models in instruction can
be viewed as a triad consisting of:
target mental model (the instructional goal); the learner
mental model (the learning achievement); and the
instructor mental model (t
response to the learning needs of the student).
GAPS seeks to provide additional insight to the mental
models of both students and teachers by offering
189
Proceedings of The 4th International Multi-Conference on Society, Cybernetics and Informatics (IMSCI 2010)

detailed information concerning cognitive structures as
required by research agendas like those suggested by
Mayer (1989), Snow (1990), and Clement (2000). The
methodology builds on the work of other researchers
(e.g., Spector & Koszalka, 2004). The methodology
was tested in a prototype study (Smith, 2006) and then
was the subject of a dissertation study (Smith, 2009)
consisting of a formative evaluation to determine its
usefulness in assessing entry level conceptions and
misconceptions of new instructional design students.
Theoretical Foundations
The historical context of mental model theory
development includes decades of research in
psychology, artificial intelligence (computer science),
cognitive neuroscience, and educational technology
(Winn, 1996). Johnson-Laird (1983) was the first to
publish a book offering a theory to explain mental
models and their use in reasoning. He described
knowledge and understanding as a process of
translating external information into words, numbers,
or other symbols that can be used in "thinking" about
the subject and then "retranslating" the representational
system into some application of its principles. More
recently, Johnson-Laird (1994) described mental
constructs reality, conceives alternatives to it, and
999). A key point in his theory is that models consist
not only of entities and the relations between them but
also of their properties. This assumption implies that
attempts to investigate a mental model without regard
to both relationships and properties may miss
significant aspects of the model.
Winn (1996) aligns the work of Johnson-Laird with
traditional views of cognitive theory which assume that
the brain functions like a computer, by representing
information as symbols and then operating on them
through learned procedures. Seel (who published a
theory of mental models in Germany in 1991) and
others theorists emphasize an alternative conceptual
framework for cognition: ade
that mental models are constructed from the significant
properties of external situations, such as learning
with these well- -Diban,
& Blumschein, 2000, p. 131).
The impetus for mental model theory can be traced to
the emergence of cognitive psychology in a field that
had been strongly behaviorist in nature (Seel, 2003).
Objective measurements have dominated the field of
instructional design; however, cognitive psychologists
have begun to explore the relationship between what is
observed. In order to improve the design of learning
environments, materials, and activities, educational
technologists need to know more than the fact that
behaviors occur in an instructional setting. They need
to understand how learners think and what can be done
to influence thought that leads to performance. There is
a need to complement objective measurement with
reliable methods of gaining access to the inner
Koszalka, 2005).
Challenges in Mental Model Assessments
Various techniques have been used for eliciting mental
model data, including essay questions, multiple choice
test items, think-aloud protocols, and concept maps.
expression, labor-intensive analysis, and difficulties of
interpretation. State-of-the-art work is reflected in a
new computer-based toolset known as the Highly
Integrated Model Assessment Technology and Tools
(HIMATT) (Pirnay-Dummer, Ifenthaler, & Spector,
2008). There remains a need for a methodology that
can capture more details along with a holistic
expression, provide finer levels of model comparisons,
and reduce the number of inferences and assumptions
concerning what an individual intends in expressing his
or her mental model. Specifically, there is a need for a
better understanding of what subjects mean by concept
labels and how they believe concepts are related.
Figure 1 illustrates the relationships of
mental model(s), the data elicitation techniques that act
as a filter in external representations, and the degree of
similarity between
an observer on. On the left side of the
figure, the internal mindset of a person contains his or
her world view and one or more mental models relating
to a subject. In the center, model data elicitation
techniques range from whole model expression in some
form to increasingly piecemeal collections of model
elements. Techniques asking for a direct representation
of entire model require relatively few
inferences and assumptions by the observer; therefore,
these direct expressions are likely to be more similar to
techniques that consist of fragmented expression (e.g.,
test question answers, linked word pairs, or narratives).
However, it has been a challenge to assess and evaluate
holistic mental model representations elicited using
open-ended techniques. Fragmented elicitations are
often easier to assess and evaluate, but results may not
adequately represent
observers must construct their own version of the
internal model. The limitations of both approaches are
exacerbated in situations where models refer to
complex domains.
190
Proceedings of The 4th International Multi-Conference on Society, Cybernetics and Informatics (IMSCI 2010)

Elicitation Techniques
Individual s
World View
Mental Model(s)
Direct expression:
limited inferences
and assumptions
Indirect
expression:
many inferences
and assumptions
Elicitation Techniques Affect How Similar the
External Model Is to the Internal Mental Model
Figure 1. The effect of elicitation techniques on the level of similarity between internal and external models.
GAPS Methodology Summary
GAPS represents a systematic attempt to combine
freedom of expression with structured detail elicitation.
The intention is to reduce the number of inferences and
assumptions required to interpret mental model
representations and address finer levels of comparisons
between models. GAPS can be distinguished from
other graph-based methodologies by one or more of the
following characteristics. Subjects create their own
graphs to represent their mental models. Subjects
provide detailed property sets for each graphic element.
concepts are related. Finally, comparisons between
models are based on analyses of properties of graphic
elements rather than linked pairs of concept labels.
Property set analysis may determine whether or not
similar labels in different mental model representations
refer to the same concepts. It also may determine
whether or not similar concepts are identified with
different labels. Assumptions that subjects understand
and use concept labels the same way can lead to
inaccurate conclusions about model similarities.
STUDY OVERVIEW
The study was a formative evaluation of the GAPS
methodology conducted at a large, Southern university
using a convenience sample. Participants were 19
graduate students in an introductory instructional
design course and three professors who are experienced
instructional designers: 1) the professor teaching the
introductory course; 2) another instructor for beginning
instructional design students; and 3) an experienced
designer not teaching in the instructional design
program. Nine students were from the U.S., and 10
were international students, primarily Asians.
Although GAPS is not limited to instructional design,
the study was limited to identify improvements needed
before expanding developmental research to broader
subject areas and applications and to larger samples
needed for statistical analyses. The focus of the study
was to examine gaps between the knowledge and
conceptions of beginning students and the knowledge
and conceptions of the professor teaching the course.
For this study, the methodology is considered useful if
it reveals misconceptions or gaps in knowledge that, if
present, will affect the design and/or delivery of
instruction for the purpose of improving the potential
for learners to achieve the targeted learning goals. At
this early stage of methodology development, the
decision of usefulness rests with the professors who
were recipients of the data produced by the
methodology. In other words, did the methodology
yield information that the professors believed would
affect how they approached meeting learner needs?
The initial state of student knowledge and conceptions
can have significant implications for the design and
delivery of instruction. U
knowledge provides a starting point in bridging the gap
between this initial state and instructional objectives.
Learning new material takes place with regard to a
larger world view. Integration of new knowledge
within this context requires some awareness its relevant
attributes; therefore, e
conceptions and mental models may reveal
misconceptions that must be overcome in order for
learning objectives to be achieved. Misconceptions can
191
Proceedings of The 4th International Multi-Conference on Society, Cybernetics and Informatics (IMSCI 2010)

be firmly entrenched and may require design and/or
delivery approaches beyond those sufficient to instruct
students without such handicaps. It is assumed that a
comparison of mental model representations of
beginning students with the model representation of an
experienced practitioner will reveal both the initial
states of learners and misconceptions they may have.
Procedures
Data collection included mental model representations,
questionnaires, and interviews. Participants received 20
minutes of training which included instruction, guided
practice, and independent practice. Students had
approximately one hour to represent their models. All
participants responded to the same instructional design
problem. Training and data collection for students
occurred on the first day of their instructional design
program. Professors had additional time to represent
their models as would occur in normal practice.
Mental model representations of students were
compared with that of the professor teaching the
course. The comparison among the three professors
models examined also to
distinguish differences and similarities among persons
of similar expertise (experienced designers). All
participants completed questionnaires before and after
the training. After data analysis, a report was prepared
for the professor teaching the course and was shared
with all three professors to obtain their feedback on its
usefulness. Professors were interviewed to obtain their
reactions to the model analysis results.
RESULTS
The study revealed areas in which the methodology
could be improved; however, even in its current state,
the methodology was successful in providing data that
instructional design professors believed would aid
conceptions and instructional needs. The following
results represent highlights of the analyses.
Understanding of the Task
Eighty-four percent (84%) of students and all
professors reported that the training helped them to
understand how to represent a mental model. Ninety
percent (90%) of students and all professors said they
understood what they were to do in the exercise.
Seventy-four percent (74%) of students also reported
that the mental model representation exercise helped to
clarify their thinking about instructional design.
Qualitative Differences in Models
Table 1 presents a summary of the qualitative
differences between student models and the model of
their professor. The qualitative differences between the
determined by comparing the elements that were
included, how those elements were linked, and the
descriptive properties of the elements and linkages.
Table 1
Summary of Differences between Professor and Student Models
Professor Model Student ModelsIs presented from a holistic, systems view of the problem and an approach to a solution.
Contain compilations of elements whose relationships are not defined in terms of an approach to a problem solution.
Identifies project goals, plans, activities, information sources, and functions in relation to an instructional design process.
Tend to show groups of elements with little, if any, expression of how those elements are related to the problem solution.
Is both comprehensive and concise. No model presents a comprehensive picture, and many modelscontain extraneous elements and details.
Presents a high level view of an entire design process. Models that include elements of the design process are incomplete. Some are inaccurate.
Is expressed in general terms and could apply to other settings with similar characteristics.
Many models appear to focus on physical characteristics of a target setting and specific persons.
Does not repeat the elements contained in the problem statement; the model responds to the problem statement.
Many models repeat the elements contained in the problem statement without responding to the problem.
Reflects the perspective of an experienced instructional designer.
Some appear to reflect backgrounds as instructors.Approximately one-third of the models include the delivery of instruction.
Reflects a team approach, including client personnel and subject matter experts.
Do not reflect a team approach to instructional design. Itappears students assume the designer role is to become a source of knowledge in the subject matter and instructional delivery requirements.
Identifies a number of sources for information, content knowledge, and specialized expertise.
Some attempt to show details of the problem area rather than identifying where to locate knowledge sources in the problem context.
May be characterized as conceptual and abstract. Tend to be related in more concrete terms.
a holistic, systems view
of the problem and an approach to a solution. His
model included the aspects of an instructional
192
Proceedings of The 4th International Multi-Conference on Society, Cybernetics and Informatics (IMSCI 2010)

needed, persons involved, project management, and
other pertinent elements all related to the context
model may be described generally as conceptual and
abstract; the model he presents may be applicable in
other problem settings that have similar characteristics.
In contrast, the student models may be described
generally as much more specific and concrete. Many
student models consisted largely of lists of physical
aspects of a classroom setting.
The students had a variety of educational backgrounds.
None reported formal training in instructional design.
The focus on classroom elements and teaching
suggested that the 12 students with teaching or training
backgrounds would emphasize these features in their
models more than students who did not have this
experience, but this was not observed. The common
background characteristic that appeared to be related to
graph focus and perspectives was whether or not
students were from the U.S. or another country.
Only one U.S. student included the instructional design
process in his model, but seven of the ten international
students referred to it. Nearly half of the U.S. students
(four of nine) indicated an expectation that the
instructional designer required personal knowledge of
the subject matter to be taught. No international student
included this requirement. More than half of the U.S.
students (five of nine) included the delivery of
instruction in their models not with regard to
formative or summative evaluation but as a part of their
view of instructional design. Only one international
student included this area in his model.
The following elements and concepts were included in
student models, indicating knowledge gaps in spite of
their backgrounds in education: (a) the instructional
designer role; (b) project planning and execution; (c) a
systems view of the context for an instructional design
project; (d) the roles of other persons in a project; (e)
sources of information and their relationship to the
design process; (f) constraints and limitations, and (g)
the instructional design process. Some students
included graph elements referring to an ADDIE-type
design process (Analysis, Design, Development,
Implementation, Evaluation); however, these were
usually presented at a high level and lacked
appropriate, if any, detail. Some student graphs suggest
that there may be misconceptions about: (a) the role of
the instructional designer; (b) a focus on individual
details rather than general characteristics; (c)
limitations imposed on the designer; and (d) the
product of instructional design. Although individual
circumstances may affect the role, activities, and
limitations in a particular design task, no such
limitations were implied in the problem statement.
Quantitative Model Comparisons
The quantitative analysis showed little similarity
between any of the student models and the model of
their professor (professor 1). Comparing the models of
the two instructional design professors offers a better
illustration of the quantitative data the methodology
can provide, although more data would be needed for a
thorough statistical analysis. Perfectly matched models
would have a similarity value of 1. In a full model
comparison with the model of professor 1, the highest
similarity value on vertex properties for any student
model was 0.02. In contrast, the full model comparison
of the models for professor 1 and professor 2 had a
vertex similarity of 0.08. Figure 2 illustrates the
the left side represents the vertices that appeared only
in the model of professor 1. The area on the right side
represents the vertices that appeared only in the model
of professor 2. In the middle area, the bars that are all
black and all white indicate the overlap for the two
models (i.e., the 14 vertices that were common to both
models). However, the descriptions for the common
vertices were not identical. The portion of the bar that
is all black (8%) represents the portion of unique
vertices that was described similarly in both models.
Comparison of Vertex Set for the Models of Two Experienced Designers
0% 10% 20% 30% 40% 50% 60% 70% 80% 90% 100%
1
Vertices only in Model 2 49%
Common vertices/different properties 10%
Common Vertices/Common Properties 8%
Vertices only in Model 1 33%
1
Figure 2. Basis for a quantitative comparison of models for professor 1 and professor 2
193
Proceedings of The 4th International Multi-Conference on Society, Cybernetics and Informatics (IMSCI 2010)

The quantitative analysis alone does not reveal why the
models appear to have differences. The
differences relate to: (a) the perspective from which the
problem statement was viewed (holistic context vs.
linear process); (b) the way related elements were
presented (clustering vs. linear linkages); and (c) type
of detail included (detail in description vs. detail in
concepts included). Observations in the preceding
prototype study and the current study reflected the
experience of Spector and Koszalka (2004), who
reported finding some deep differences among experts.
The observation that comparable expertise may be
represented quite differently leads to several questions.
First, should the comparison model used to assess
be designed to accommodate more than one style of
conceptualization? It may be better to create a model
that represents a composite of several expert models so
that differences in style do not suggest differences in
understanding. On the other hand, could differences in
the style of a mental model representation suggest
important differences in conceptualization?
CONCLUSION
The formative evaluation revealed that the GAPS
methodology can provide information professors
consider useful in determining their approaches to
responding to of
instructional design as communicated in their mental
model representations. This result sets the stage for the
next phase of GAPS methodology development.
Because this study was limited to a single application
and participant group, results cannot be generalized.
Additional limitations pertain to the time available for
training and model representations. Although this study
was limited, the GAPS methodology design is not
limited to one application. Future research with more
robust samples can address other subject areas,
different educational levels, and additional populations.
Some additional research questions were suggested
during data analysis. Can mental model representations
and feedback contribute to the development of systems
thinking? What are the impacts of different instructor
perspectives (e.g., linear vs. centered) on models
developed by students? How might different model
styles be related to perception, comprehension, and
performance? These questions and others could be
explored using the methodology investigated in this
study. In contrast to other methodologies reviewed, the
GAPS methodology seemed to provide greater insight
regarding the internal models of subjects. Whether
used alone or in conjunction with other tools, the
GAPS methodology has potential for making a
contribution to mental model assessment in the field of
instructional design and other applications in
education.
REFERENCES
Clement, J. (2000). Model based learning as a key research area for
science education. International Journal of Science Education, 22(9),
1041-1053.
Clement, J., & Oviedo, M. C. N. (2003). Abduction and analogy in
scientific model construction. Proceedings of NARST, Philadelphia,
PA.
Johnson-Laird, P. N. (1983). Mental models: Towards a cognitive
science of language, inference, and consciousness. Cambridge, MA:
Harvard University Press.
Johnson-Laird, P. N. (1994). Mental models, deductive reasoning,
and the brain. In M. S. Gazzaniga (Ed.), The cognitive neurosciences
(pp. 999-1008). Cambridge, MA: MIT Press.
Mayer, R. E. (1989). Models for understanding. Review of
Educational Research, 59(1), 43-64.
Ogan-Bekiroglu, F. (2007). Effects of model-based teaching on pre-
other lunar phenomena. International Journal of Science Education,
29(5), 565-593.
Pirnay-Dummer, P., Ifenthaler, D., & Spector, J. M. (2008). Highly
integrated model assessment technology and tools.
Reinders, D., & Treagust, D. F. (2003). Conceptual change: A
powerful framework for improving science teaching and learning.
International Journal of Science Education, 25(6), 671-688.
Seel, N. M. (2003). Model-centered learning and instruction.
Technology, Instruction, Cognition and Learning, 1(1), 59-85.
Seel, N. M., Al-diban, S., Blumschein, P. (2000). Mental models &
instructional planning. In J. M. Spector & T. M. Anderson (eds.),
Integrated and holistic perspectives on learning, instruction and
technology, 129-158. The Netherlands: Kluwer Academic Publishers.
Smith, L. J. (2005). The application of graph theory for the
comparison of mental models. Unpublished manuscript.
Smith, L. J. (2006) Application of graph theory for the comparison of
model representations: A prototype study using descriptions of
instructional design. Unpublished manuscript.
Smith, L. J. (2009). Graph and Property Set Analysis: A
Methodology for Comparing Mental Model Representations.
Unpublished dissertation.
Snow, R. E. (1990). New approaches to cognitive and conative
assessment in education. International Journal of Educational
Research, 14(5), 455-473.
Spector, J. M., Dennen, V. P., & Koszalka, T. A. (2005). Causal
maps, mental models and assessing acquisition of expertise. Paper
presented at AERA 2005, Montreal, Quebec, Canada.
Spector, J. M., & Koszalka, T. A. (2004). The DEEP methodology
for assessing learning in complex domains (Final report to the
National Science Foundation Evaluative Research and Evaluation
Capacity Building). Syracuse, NY: Syracuse University.
Winn, W. (1996). Cogntive perspectives in psychology. In D. H.
Jonassen (Ed.), Handbook of Research for Educational
Communications and Technology (2nd ed.), pp. 79-112. Mawah, NJ:
Erlbaum.
194
Proceedings of The 4th International Multi-Conference on Society, Cybernetics and Informatics (IMSCI 2010)

TRAINING WAYS OF ARABIC IN AMERICAN UNIVERSITIES
Prof. Dr. Luisa María ARVIDE CAMBRA
Departamento de Filología, University of Almería
04120- Almería. Spain
ABSTRACT
This paper explains teaching and learning system of
Arabic in five noted American Universities, according to
the academic visits made by Professor Arvide. And it has
also reference to the connection of these ways to the
Higher Education in U.S.A. Thirteen conclusions are
included.
Keyword: American Higher Education System.
This paper analyzes the Higher Education System in
some American Universities into the Arabic field
according my own experience as a Visiting Professor in
order to make a study on the training ways of Arabic in
some Arabic Language and Literature Departments.
I have the honour of having been a beneficiary of four
scientific research grants from the Andalusian
Government Program in order to do study on the training
ways of Arabic into several prestigious American
Universities [1].
The most important objectives of these academic stays
were:
1) To know the performance of American
prestigious Universities.
2) To compare their training ways with the
Spanish Universities.
3) To contact with colleagues from abroad.
The visited Institutions were five:
1) UNIVERSITY OF BERKELEY: Department of Near
Eastern Studies. California.
Professor of contact: Prof. Dr. James T. Monroe.
The American Higher Education system favours the free
selection of matters thanks to a wide scale of optional
subjects, and Berkeley University is an example of that.
Arabic studied is Modern Standard Arabic. Redaction and
translation from English into Arabic are methods very
important in the training.
2) UNIVERSITY OF YALE: Department of Near
Eastern Languages and Civilizations. New Haven.
Connecticut.
Professor of contact: Prof. Dr. Dimitri Gutas.
Arabic language studied is Modern Standard Arabic.
Teaching and learning methods of Arabic are: knowledge
of grammar, training of the spoken language –and, for
that this Institution includes Arab teachers among its
educational staff-, and the translation.
3) GEORGETOWN UNIVERSITY: Department of
Arabic Language, Literature, and Linguistics. Faculty of
Languages and Linguistics. Washington. Washington
D.C.
Professor of contact: Prof. Dr. Karin C. Ryding.
Arabic language studied here is the Classical and the
dialects are treated into some optional subjects.
The obligatory subjects are referred to three main
contents: linguistics, language and literature, and the
optional ones are referred to complementary contents,
like Arabic and Islamic history, culture and civilization.
The knowledge of Arabic is improved with the
translation, the grammatical analysis of texts and
audiovisual methods.
4) HARVARD UNIVERSITY: Center of Middle Eastern
Languages and Civilizations. Cambridge. Massachusetts.
Professor of contact: Prof. Dr. William Granara.
Arabic language studied is Modern Standard Arabic. The
obligatory subjects are language, literature and history.
They used several methods of training, according to the
different levels, and basically are: conversation, study of
grammar and translation.
5) UNIVERSITY OF PENNSYLVANIA: Department of
Asian and Middle Eastern Studies. Philadelphia.
Pennsylvania.
Professor of contact: Prof. Dr. Roger Allen.
195
Proceedings of The 4th International Multi-Conference on Society, Cybernetics and Informatics (IMSCI 2010)

Arabic language taught is Modern Standard Arabic. The
dialects, like for example Syrian and Egyptian, are treated
only in some optional subjects.
The study of the grammar is fundamental and the training
ways take good care of phonetics and getting a competent
vocabulary by means of the reading of texts and the talk
in the lecture room using Arabic.
The most Anglo-Saxon Universities use the same basic
textbooks and grammar methods, and among the
grammars, manuals and textbooks used by these five
American Universities for teaching the basic and the
intermediate levels of Arabic are, for example: Peter F.
Abboud & Ernest N. McCarus, Elementary Modern
Standard Arabic; Kristen Brustad & Mahmoud Al-Batal
& Abbas Al-Tonsi, Alif Baa. Introduction to Arabic
Letters and Sounds; Kristen Brustad & Mahmoud Al-
Batal & Abbas Al-Tonsi, Al-Kitaab fii Ta‘allum al-
‘Arabiyya: A Textbook for Beginning Arabic, Part One;
Kristen Brustad & Mahmoud Al-Batal & Abbas Al-
Tonsi, Al-Kitaab fii Ta‘allum al-‘Arabiyya: A Textbook
for Arabic, Part Two.
The experience obtained through these academic visits
was remarkable and helped me in some respects to
improve my own training ways.
Nevertheless, I could note that, with regard to Arabic
studies, the differences between the methods used by the
cited American Universities and the Spanish ones were
small and they mainly referred more to academic system
rules than to the aims of the subjects. I could verify, too,
that the scientific care about Arabic is the same at all the
Universities, in Spain as well as abroad.
CONCLUSIONS
The most important results got in this research were the
next ones:
1) Arabic studies are minority.
2) The length of the studies is four years and they
are divided into two cycles, except Yale.
3) The academic year is divided into two
semesters.
4) The speciality starts in the first year.
5) Arabic studies are enclosed into Departments of
Oriental, Semitic or Islamic Languages, Cultures and
Civilizations.
6) The openings of the graduates are: Universities,
Council for Scientific Research, Embassies, International
Agencies and Institutions, and National and International
Companies, et cetera.
7) Teaching programmes encloses obligatory and
optional subjects.
8) The obligatory subjects referred mainly to
language, literature and history. The optional ones
referred to diverse aspects in relation to philosophy, law,
Islamic thought, et cetera, as well as other more specific
and concrete sights of the obligatory subjects.
9) Arabic language studied was the classical
Arabic, named also Modern Arabic Standard. The
dialects were treated by chance in some courses.
10) The main goals pursued were:
10.1) An excellent knowledge and mastery of the
written Arabic language.
10.2) A good training of the spoken Arabic language.
11) The stay of the students in Arabic countries is
too advised.
12) The translation of classic and modern texts was
a technique very used and quite habitual.
And it proves that:
12.1) Translation science was in expansion and today
it is yet in progress.
12.2) Translation technique is very important in the
training ways of any language.
13) All Universities shared the same view: the
importance which has the grammar in the study of any
language.
REFERENCES
[1] L. Arvide, “Apuntes sobre métodos de enseñanza y
técnicas de aprendizaje de la lengua árabe (I)”, Anaquel de Estudios Árabes, Vol. VIII, 1997, pp.41-56. L. Arvide, “Apuntes sobre métodos de enseñanza y
técnicas de aprendizaje de la lengua árabe (II)”, Anaquel de Estudios Árabes, Vol. IX, 1998, pp.9-17. L. Arvide, “Apuntes sobre métodos de enseñanza y
técnicas de aprendizaje de la lengua árabe (III)”,
Anaquel de Estudios Árabes, Vol. XI, 2000, pp.109-122.
196
Proceedings of The 4th International Multi-Conference on Society, Cybernetics and Informatics (IMSCI 2010)

Technology and Teacher Education: Integration in Context
Michael J. Borka
St. Joseph, MN, USA
ABSTRACT
This position paper reading
of literature on the presence of technology in
the lives of adolescents and young adults and
his own experiences with introducing new
media to preservice teachers. The author
examines four issues affecting his on-going
attempts to integrate technology in his
education courses. These issues are likely to
impact other teacher preparation program
integration processes as well:
1. Mind the Gap. People use and respond to
technology in unique ways. These disparate
responses suggest that individuals
idiosyncratically maintain memberships within
digital cultures.
2. One by One.
actions further reveal their knowledge of and
associations with the culture of new media
practices.
3. Because i here. Teacher educators can
increase the effectiveness with which they
model technology uses by determining how
specific applications meet their
learning needs.
4. Let it Be. Well-explained and well-organized
new media assignments can stand on their own
as replacements for some traditional projects.
An education program that accounts for
idiosyncratic technology usage and critically
considers access and application issues will
assist preservice teachers in using technology to
address their current learning needs and the
needs of their future students.
Keywords: technology; new media;
teacher education; preservice teachers;
integration.
1. Mind the Gaps
Over the last decade, the Pew Research Center
has documented how Americans access and use
digital technology and new media. Not
surprisingly, teens and young adults are the
biggest users of the Internet and maintain an
online presence at higher levels than do adults
[1]. These findings have fostered popular
descriptions of anyone 30 years of age and
younger as a continuously plugged in and tech
savvy digital native [2]. Reports like these
create the impression of generational users
always connected to their phones, the Internet,
and each other. While researchers explore the
effects of how screen time influences thinking
and learning, education faculty and preservice
teachers must develop an awareness of the
order to effectively integrate technology into
their courses and classrooms.
While young adults and teens are prolific users
of mobile devices and the Internet, marketing
professionals [3], bloggers [4], and researchers
[5] are beginning to challenge the notion that
everyone born after 1980 is an adept user.
how and how well they use the Internet [6].
Gaps exist between and among adults and
adolescents, teachers and students concerning
the frequency and ease with which they access
new media. Given these differences, it is
beneficial for teachers, whether young or old, to
set aside thinking about their students as a
digitally, mono-cultural group, i.e. Gen X, Y, Z,
197
Proceedings of The 4th International Multi-Conference on Society, Cybernetics and Informatics (IMSCI 2010)

and Millennials. While each of these groups can
be characterized by their general tendencies, the
labels do not explain the totality of
technological thoughts, behaviors, or
perceptions of group members any more than
the terms African-American, Asian, White, etc.
capture the diverse experiences of persons
within these groups. Over-generalizations in
socio-culture and technological groupings too
easily lead to biases and stereotypes.
Individuals interact with technology in
particular ways, uniquely affecting their
position within a digital culture. People exhibit
permutations of general characteristics making
their associations with a digital culture
idiosyncratic as much as collective. I can draw
from my own technology experiences as an
example. I am a tail-end baby boomer. In
college, my correcting, IBM Selectric
typewriter represented .
By all standards, then, I am a digital immigrant.
However, I have sent and deleted countless
emails, started and abandoned several blogs,
created wikis for personal, class, and collegial
use, and made digital movies on Movie Maker
and iMovie. I, similar to many digital natives,
do not know what I would do without the
Internet. Despite these practices, I sent my first
text message this past winter. Simple
descriptions
technology may be quite elusive. Teachers who
develop an awareness of their own and their
unique digital culture are better
positioned to integrate technology into their
classrooms as a multi-dimensional learning
experience.
If access to information technologies is the
traditional, digital divide, then understanding
individual patterns of technology use
creates new cognitive and instructional gaps to
consider. Much like teachers develop cultural
competence to better understand the unique
ways that people from diverse backgrounds
think about and view the world, education
faculty and preservice teachers can frame the
distinctive digital cultures that will be present in
their classrooms and provide instruction to meet
the range of technology learning needs of their
students. xperiences with technology,
like other interactions with the environment,
affect thinking, perception, and attention in
personal ways. This view presses teachers to
move beyond addressing usage and proficiency
as merely generational issues. Practices are
much more distinctive. In a classroom, teacher
educators and preservice teachers who note
these distinctions can begin to integrate a wider
and more effective approach to technology use
and instruction.
2. One by One
Jenkins [7] helps to identify some of these
distinctions when he defines
association with various online activities as
participatory culture. He goes on to list several
categories that encompass common,
participatory activities: affiliations, expressions,
collaborative problem-solving, and circulations.
Buildi [8] ideas of participation
and interaction, I suggest teacher educators can
also benefit from describing
participation active role to
differentiate their online and digital abilities:
Researcher accessing any type of text
for varied personal, consumer, and
informational purposes.
Communicator establishing and
maintaining interpersonal relationships
in any number of digital forms.
Creator producing and providing
print, aural, and/or
visual media.
Invader accessing sites and
information in a nonproprietary manner
with the purpose of corrupting or
stealing the contents.
Distributor marketing and offering for
sale commercial products or intellectual
properties.
Organizer communicating a political,
religious, artistic, economic, or
environmental ideology and establishing
198
Proceedings of The 4th International Multi-Conference on Society, Cybernetics and Informatics (IMSCI 2010)

communities whose members actively
work to disseminate a similar ideology.
Since this taxonomy suggests a range of
necessary skills and abilities connected to new
media activities and processes, it can provide a
distinctive picture of
specific, digital culture. For example, as part of
I ask the
students, largely college-aged sophomores, to
create a digital movie as a way of expressing
their reactions and interpretations to a book we
read. Students are free to incorporate words,
still images, and video into their movies. After
explaining the project I allow several days for
the students to work in class. On the first day, I
noticed one student staring at her laptop and
having difficulties beginning. I asked her if she
had any questions. She said she was
overwhelmed because she had never been asked
to work so freely with ideas and technology in
an assignment before. After the students
completed and screened their movies, a
different
iPod or iTunes. I listen to the radio so working
While these scenarios are anecdotal, I believe
they highlight important lessons for teacher
educators and preservice teachers. According to
their ages, both of these students are digital
natives, but each displayed unique participatory
or interactive gaps. One student struggled with
her first-time role as creator while the other
student was working through new avenues as a
researcher. As I continue to integrate
technology use in my classrooms, I consider
active role variations as factors that influence
and attempt to design experiences that support
and extend student
3.
Teachers striving to integrate technology into
their virtual and traditional classrooms, face a
two-pronged challenge. First, they must be
adept users of the technology and secondly,
they need to use technology to help their
preservice teachers achieve course outcomes.
When education faculties successfully integrate
technology into their courses, they inherently
model and demonstrate how preservice teachers
might include new media and technology in
their future classrooms to the benefit of their
students. Integration of technology is not a
haphazard process. The array of information
and communication technologies (ICTs)
available to teachers is vast, and the temptation
to sample them is strong. The best applications
of ICTs, however, reflect the learning goals, the
learning environment, and the digital culture of
the students.
In exemplary, teacher education programs,
faculty members do not use technology because
it is available. Rather they use it to augment
their pedagogical practices [9]. While this
finding suggests that exemplary education
faculties think about technology use, it also
seems to suggest that instructors may be
including ICT applications that match their
preferred approaches to teaching rather than
first considering the students
and prior experiences with technology. Here,
the focus can shift from the teacher to the
students. In education courses, the goal would
be for faculty to integrate, model and
demonstrate transformative uses of technology
[10], transformative in that they have the
potential to extend
solving, and learning. The shift to
transformative applications is not a simple one
technology backgrounds, dissimilar technology
cultures. What is transformative for one student
may not be so for another. The growing use of
interactive whiteboards (IWBs) provides a
relevant example of this dichotomy.
Approximately 70 percent of classrooms in the
U.K and 20 percent of U.S. classrooms contain
IWBs [11]. Within my own department,
preservice teachers and education faculty are
motivated to understand and use IWBs as an
instructional technology due in part to their
popular presence in local schools. While IWBs
are universally interactive, the level of
199
Proceedings of The 4th International Multi-Conference on Society, Cybernetics and Informatics (IMSCI 2010)

interactivity, however, is user specific. In my
courses I notice for students with developing
world and technological experiences the IWB
can be highly engaging and transformative.
These users can view and manipulate images
and information in startling new ways. On the
other hand, students who maintain an extensive
online presence, who have produced user
created content, and who own and regularly use
multiple wireless devices seem to have different
cognitive and affective responses. For them, the
IWB is simply another or the next tool for
accessing information.
I do not believe students learn from a book
because it is open, from a movie because it is
shown, or from a lecture because it is delivered.
Similarly, I think it is unlikely that students will
learn content and processes in deep and
meaningful ways from a technology simply
because it is there. Instead, I believe an
effective
motivation, prior knowledge, abilities, language
and culture and selects the materials and
instructional approaches that increase the
opportunities for learning.
Education faculty best model the uses of
technology when its application extends
reflect on mastering content and instructional
practices. From these demonstrations,
preservice teachers should gain insight into how
they might integrate technology as part of their
pedagogical approaches. In both instances the
goals of instruction and the students
experiences with technology should be
considered. Equipped with this information, I
endeavor to establish a learning environment
that allows students flexible access to
technology for meaningful and authentic
purposes. People working in science, industry,
and the arts use ICT to find, create, and
manipulate information and images. They do so
based on the overall demands of their jobs but
also because of their own needs and interests. If
I can successfully connect these characteristics
to ICT learning, I better position my preservice
teachers to explore and apply technology as
transformative, instructional tools.
4. Let it Be
One way for education faculty to model
authentic uses of technology is to include new
media and digital-based assignments in their
courses. These assignments can be developed
and structured to address course outcomes,
demonstrate effective and engaging teaching
practices, and support the individual content
and technology learning needs of their
preservice teachers. If these new media
assignments are well designed and well
explained, they can replace and exist outside of
similar, traditional paper-and-pencil tasks.
New media interactive and flexible character
offers teacher educators an expressive space in
which their preservice teachers can explore
teaching, learning, and educational issues.
Novices and experts can access and create
content in a variety of formats, enhancing their
abilities to critically reflect and comment on
their development. Blogs, wikis, and web pages
provide forums for individual or collective
journal responses about classroom and field-
based experiences. Digital movies can be used
-going
pedagogical growth or serve as a vehicle for
preservice teachers to interpret and make
personal connections to ideas, themes, and
information. Social networks can keep student
teachers and first-year teachers in contact with
each other and with their mentors for important,
early-career support. For those interested in
incorporating information from multiple, media
sources, opportunities for mashups seem
endless.
Assignments help teachers and students to
synthesize, extend, or evaluate ideas. Whether
traditional or digital, the format of the
assignment is directly connected to its purpose.
Teacher educators provide a valuable lesson
when they model and explain how and why
they develop particular, assignment guidelines
and encourage the preservice teachers with
200
Proceedings of The 4th International Multi-Conference on Society, Cybernetics and Informatics (IMSCI 2010)

whom they work to be intentional about the
assignments they will create. A key issue here
is for teachers at all levels to purposefully
examine the goals of the assignment and the
role that technology will play in that work.
My students are often surprised when they
discover that I do not require them to write a
formal paper or make a formal presentation to
explain the processes undertaken, the problems
encountered, and the insights unearthed after
completing a new media assignments. If the
interaction with technology and how it may
have shaped learning and perceptions, then a
paper-pencil component seems warranted (For
consideration, there seems to be little difference
between a required paper and an assigned
number of blog entries, wiki pages, or tweets
read primarily by the instructor). On the other
hand, if the goal of the assignment is for
students to use new media to interpret, analyze,
or synthesize information, or to express an
opinion, I simply let it be. Digital pictures,
sounds, images, and mashups can more than
stand on their own. I add public display and
response as appropriate.
5. Click to Exit
The potentiality of technology and new media
as teaching tools are immense. I effectively
weave each into a teacher education program by
developing an awareness of my preservice
the active
roles they engage in connected to their online
use. This information informs my curriculum
and teaching as I work to integrate technology
into courses for communicative, informative,
and expressive purposes. My goal is that
preservice teachers who experience this type of
modeling will be better equipped to support
thinking and learning through
new and authentic applications of technology.
References
[1] A. Lenhart, M. Madden, P. Hitlin, Teens
and Technology: Youth are Leading the
Transition to a Fully Wired and Mobile
Nation, Washington D.C.: Pew Internet &
American Life Project, 2005. Retrieved from
http://www.pewinternet.org/pdfs/
PIP_Teens_Tech_July2005web.pdf.
[2] Off
USA Today, pp.
D1-2.
[3] C. Phillips, Millennials Tech-dependent,
but not Necessarily Tech-savvy, 2010.
Retrieved from http://millennialmarketing.com/
2010/04/millennials-tech-dependent-but-not-
necessarily-tech-savvy/
[4] D. Stanford,
Savvy, 2009.
Retrieved from http://www.iddblog.org/?p=143
[5] E. Hargittai,
Internet Skills and Uses among Members of the
Sociological Inquiry, Vol.
80, No. 1, 2010, pp. 92-113.
[6] Ibid.
[7] H. Jenkins, Confronting the Challenges of
Participatory Culture: Media Education for
the 21st Century, Chicago, IL: MacAurthur
Foundation, 2006. Retrieved from
http://www.macfound.org/site/c.lkLXJ8MQKr
H/ b.4462309/apps/s/content.asp?ct=2946895
[8] Ibid.
[9] N. Strudler, & K. Wetzel,
Exemplary Colleges of Education: Factors
Affecting Technology Integration in Preservice
Educational Technology Research
and Development, Vol. 47, No. 4, 1999, p. 74
of pp. 63-81.
[10] J. Hughes,
Knowledge and Learning Experiences in
Forming Technology-integrated Pedagogy,
Journal of Technology and Teacher
Education, Vol. 13, No. 2, 2005, pp. 277-302.
[11] M. Phillips,
2008, September 13, Newsweek. Retrieved
from http://www.newsweek. com/id/158740
201
Proceedings of The 4th International Multi-Conference on Society, Cybernetics and Informatics (IMSCI 2010)
Online Access Patterns and
Students’ Performance
A/P Dr Nasir Butrous
School of Business, Australian Catholic
University
1100 Nudgee Road, Brisbane, Qld, 4014,
Australia
ABSTRACT
The paper follows accessing patterns of five cohorts of
postgraduate students enrolled in a core unit within a
master of business administration (MBA) program. The
unit is designed to provide numerous opportunities for
student participation in Discussion Boards using
Blackboard technologies. Discussion Boards create
numerous opportunities for interaction amongst online
learners to share and exchange their experiences, creating
a sense of a virtual community. Relationships between
accessing patterns for each week of the semester for each
student are explored in relation to their performance
using course statistics generated by the Blackboard
technology. Close examination of the significant
differences in access patterns to the course window and
its components of communication, content, and student
areas reveal middle of the semester (week 7) as the
common critical point that differentiates high achieving
students from low achieving students. Identifying critical
points provides the faculty staff member an opportunity
to introduce intervention strategies in order to improve
the learning experience of all the students.
Keywords:
Studying patterns, Student Performance, Student
learning, Discussion Boards, Online Access
INTRODUCTION
The relationship between online access patterns and
student performance is a subject that captures the interest
of many researchers. However, most of the focus to date
has been on investigating the above relationship at the
end of semester. This study follows access patterns of
five cohorts of postgraduate students enrolled in a core
unit within a master of business administration. It
examines students’ access to “Course Window” for each
week of the semester and for each student to identify
accessing patterns that differentiate high achieving
students from low achieving students. Course statistics
generated by Blackboard Technology over a five-year
period are used to explore the above argument.
VIRTUAL LEARNING COMMUNITY
Creating an online learning community is the result of
collaboration between faculty members, students, and the
learning institution. The Organisational Behaviour unit
was designed to create a class room environment for
online learners that combined Chickering and Gamson’s
seven principles of good educational practice [1 & 2]
combined with Astin’s “student involvement” [3] and
Rowh’s “flexible approach” [4]. This resulted in
enormous opportunities, throughout the semester, for
interaction between participants with emphasise on what
later described Dahl [5] and Shen and Eder [6] as
“collaborative learning”. The unit design enabled
students to share and exchange their experiences in
creating a tremendous virtual “community of practice”
[7] with purpose using Black Board technology as
perceived by Bata-Jones and Avery [8].
Unit Design
In order to achieve the unit aims and taking into
consideration the online mode, ranges of teaching
methodologies have been used. For each topic there were
topic objectives, reading material, lecture notes, and
group discussions. Announcements were used, during the
running of the unit, to further facilitate communication
between the instructor and students together with
individual and group emails [9]. To encourage more
participation among students enrolled in the unit, the
discussion board number one task was to ask all students
to introduce themselves to their fellow students. This was
in addition to the development of the individual student
and group homepages.
Participants were required to present one seminar
(assessment task one) as part of the group discussion
during the course. Seminar topics were allocated by the
instructor in consultation with all students no later than
the end of the first week of the semester and were spread
throughout the semester. Other students were invited to
engage in discussions and share their experiences,
readings, and comment on the presented material.
Students’ participation in at least eight out of twelve
topics via “discussion boards” was the second assessment
task in this unit.
To enrich the student learning experience, active learning
[10] through problem solving was used. Students were
asked, in the final assessment task, to examine and
critically analyse an organisation of which they had
knowledge or with which they have been closely
involved. Using this scrutiny, students were asked to
critically analyse and make suggestions for improvement
on the major issues identified. This learning task was
submitted electronically using the "Student Drop Box".
The first two assessment tasks, as part of the unit design,
promotes extensive dialogue and collaborative learning
that is equally effective to traditional modes of delivery
as argued by Horton [11]. This interaction amongst the
students and with the faculty member is an essential and
critical component of the “constructivism learning
philosophy” as described by Hover [12] and Boudourides
[13] to which the author subscribes.
202
Proceedings of The 4th International Multi-Conference on Society, Cybernetics and Informatics (IMSCI 2010)
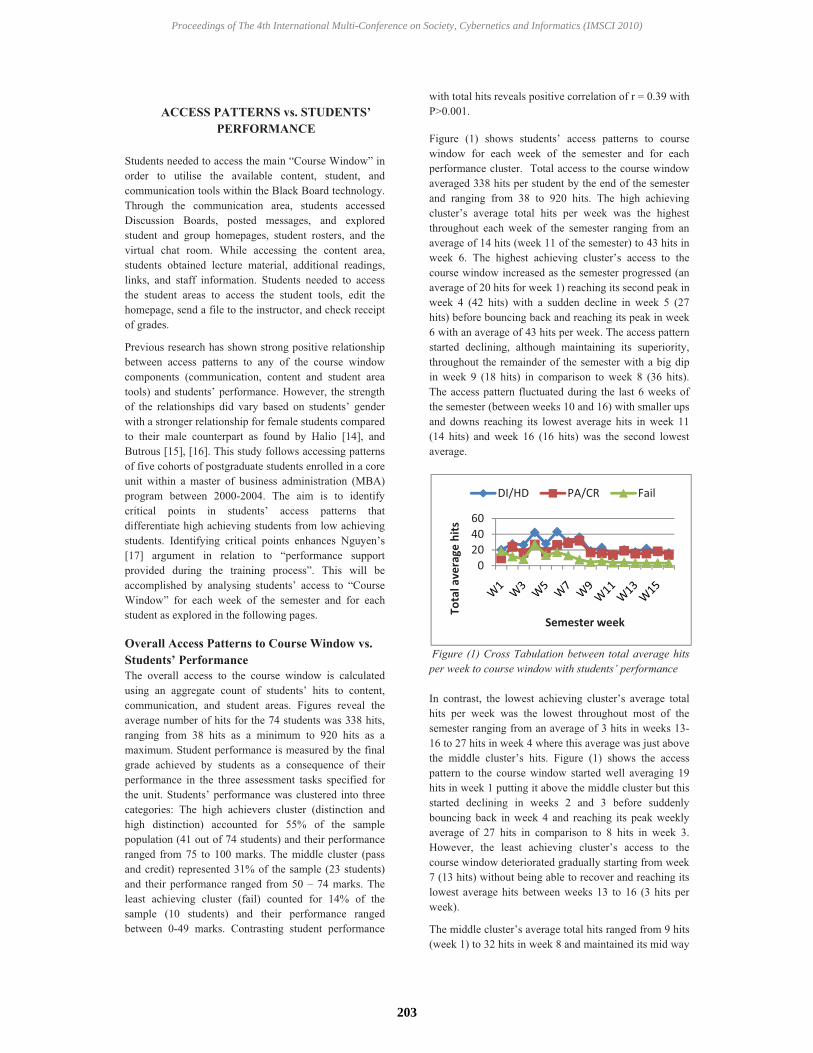
ACCESS PATTERNS vs. STUDENTS’
PERFORMANCE
Students needed to access the main “Course Window” in
order to utilise the available content, student, and
communication tools within the Black Board technology.
Through the communication area, students accessed
Discussion Boards, posted messages, and explored
student and group homepages, student rosters, and the
virtual chat room. While accessing the content area,
students obtained lecture material, additional readings,
links, and staff information. Students needed to access
the student areas to access the student tools, edit the
homepage, send a file to the instructor, and check receipt
of grades.
Previous research has shown strong positive relationship
between access patterns to any of the course window
components (communication, content and student area
tools) and students’ performance. However, the strength
of the relationships did vary based on students’ gender
with a stronger relationship for female students compared
to their male counterpart as found by Halio [14], and
Butrous [15], [16]. This study follows accessing patterns
of five cohorts of postgraduate students enrolled in a core
unit within a master of business administration (MBA)
program between 2000-2004. The aim is to identify
critical points in students’ access patterns that
differentiate high achieving students from low achieving
students. Identifying critical points enhances Nguyen’s
[17] argument in relation to “performance support
provided during the training process”. This will be
accomplished by analysing students’ access to “Course
Window” for each week of the semester and for each
student as explored in the following pages.
Overall Access Patterns to Course Window vs.
Students’ Performance
The overall access to the course window is calculated
using an aggregate count of students’ hits to content,
communication, and student areas. Figures reveal the
average number of hits for the 74 students was 338 hits,
ranging from 38 hits as a minimum to 920 hits as a
maximum. Student performance is measured by the final
grade achieved by students as a consequence of their
performance in the three assessment tasks specified for
the unit. Students’ performance was clustered into three
categories: The high achievers cluster (distinction and
high distinction) accounted for 55% of the sample
population (41 out of 74 students) and their performance
ranged from 75 to 100 marks. The middle cluster (pass
and credit) represented 31% of the sample (23 students)
and their performance ranged from 50 – 74 marks. The
least achieving cluster (fail) counted for 14% of the
sample (10 students) and their performance ranged
between 0-49 marks. Contrasting student performance
with total hits reveals positive correlation of r = 0.39 with
P>0.001.
Figure (1) shows students’ access patterns to course
window for each week of the semester and for each
performance cluster. Total access to the course window
averaged 338 hits per student by the end of the semester
and ranging from 38 to 920 hits. The high achieving
cluster’s average total hits per week was the highest
throughout each week of the semester ranging from an
average of 14 hits (week 11 of the semester) to 43 hits in
week 6. The highest achieving cluster’s access to the
course window increased as the semester progressed (an
average of 20 hits for week 1) reaching its second peak in
week 4 (42 hits) with a sudden decline in week 5 (27
hits) before bouncing back and reaching its peak in week
6 with an average of 43 hits per week. The access pattern
started declining, although maintaining its superiority,
throughout the remainder of the semester with a big dip
in week 9 (18 hits) in comparison to week 8 (36 hits).
The access pattern fluctuated during the last 6 weeks of
the semester (between weeks 10 and 16) with smaller ups
and downs reaching its lowest average hits in week 11
(14 hits) and week 16 (16 hits) was the second lowest
average.
Figure (1) Cross Tabulation between total average hits
per week to course window with students’ performance
In contrast, the lowest achieving cluster’s average total
hits per week was the lowest throughout most of the
semester ranging from an average of 3 hits in weeks 13-
16 to 27 hits in week 4 where this average was just above
the middle cluster’s hits. Figure (1) shows the access
pattern to the course window started well averaging 19
hits in week 1 putting it above the middle cluster but this
started declining in weeks 2 and 3 before suddenly
bouncing back in week 4 and reaching its peak weekly
average of 27 hits in comparison to 8 hits in week 3.
However, the least achieving cluster’s access to the
course window deteriorated gradually starting from week
7 (13 hits) without being able to recover and reaching its
lowest average hits between weeks 13 to 16 (3 hits per
week).
The middle cluster’s average total hits ranged from 9 hits
(week 1) to 32 hits in week 8 and maintained its mid way
0
20
40
60
Totalaveragehits
Semester week
DI/HD PA/CR Fail
203
Proceedings of The 4th International Multi-Conference on Society, Cybernetics and Informatics (IMSCI 2010)

between the other two clusters throughout most weeks of
the semester. In spite of its slow start behind the least
achievers cluster in week 1, the middle cluster gradually
increased its access in week 2 with frequent fluctuations
of ups and downs until week 6 when it started climbing
reaching its peak average weekly of 32 hits in week 8.
The access pattern of the middle cluster experienced its
biggest decline in week 9 reaching almost half of the hits
in the previous week (17 hits) and then gradually
declined in weeks 10 and 11 before a slight improvement
in week 12 (19 hits) with continuous fluctuations during
the last four weeks of the semester and concluding with
an average of 13 hits in week 16.
Close examination of Figure (1) shows access patterns of
the three clusters to the course window is significantly
different at many weeks (points) of the semester.
Analysis of variance shows statistically significant
differences in the average student access to course
window in weeks 3, and between weeks 5 to week 11,
and again between weeks 13 and 16 at the significant
level of P>.05 and P>.001. Figure (1) also shows an
overall trend of decline in the access pattern starting from
week 9 (middle of the semester) regardless of the
students’ performance. However, the level of decline for
the least achievers cluster is the highest with very limited
to no improvement or recovery in the second half of the
semester in comparison to the highest achievers cluster
and the middle cluster. The second half of the semester
shows some bounce back, with smaller fluctuations, ups
and downs, for both high and middle achiever clusters.
Thus, making week 9 the critical point in the semester
that differentiates the highest achieving students from the
lowest achieving students, where each faculty staff
member should consider introducing intervention
strategies to turn around the access pattern of the least
achieving students.
Access to Communication Area vs. Student’s
Performance
Through the communication area, students accessed
Discussion Boards, posted messages, and explored
student and group homepages, student rosters, and the
virtual chat room. Figure (2) shows that the high
achievers cluster’s average access to communication area
per week was superior to other clusters throughout most
weeks of the semester ranging from an average of 6 hits
(week 16 of the semester) to 32 hits in week 6. The
highest achievers cluster’s access to the communication
area started with an average of 10.5 hits in week 1 and
increased gradually as the semester progressed, reaching
its peak in week 6 (32 hits) with a sudden increase from
week 5 (21 hits). The access pattern started declining,
although maintaining its superiority, throughout the
remainder of the semester with a big dip in week 6 (21
hits) followed by a gradual decline, without any
recovery, and reaching its least average of 6.2 hits in
week 16.
The least achievers cluster’s average hits per week to the
communication area continuously fluctuated throughout
the semester, and exceeded the middle cluster in a few
weeks, ranging from an average of 1.5 hits in week 15 to
18.3 hits in week 4. Figure (2) indicates the access
pattern to the communication area for the least achievers
cluster started very well and just exceeded the highest
achievers cluster averaging 10.9 hits in week 1 but
started declining in weeks 2 and 3 (5.3 and 4.6 hits
respectively) before suddenly bouncing back in week 4
and reaching its peak weekly average of 18 hits.
However, the least achievers cluster’s access to the
communication area weakened gradually starting from
week 5 (an average of 9 hits) with some recovery in
week 6 (12 hits). The least achievers cluster’s average
hits to the communication area continued to fluctuate
with small ups and downs, with a stronger improvement
in week 13 reaching an average of 7 hits before gradual
decline throughout the remainder of the semester
reaching its lowest average hits in weeks 15 and 16 (2.1
and 1.5 hits respectively).
Figure (2) Cross Tabulation between average hits per
week to communication area with students’ performance
The middle cluster’s average hits to the communication
area ranged from an average of 4.3 hits (week 1) to 17.9
hits in week 6 and maintained its mid way throughout
most weeks of the semester. In spite of its slowest start,
compared to other clusters, the middle cluster suddenly
increased its access in week 2 reaching its second peak
average off 14.2 hits. The access pattern of the middle
cluster declined in week 3 (9.7 hits) before gradually
increasing to its peak average hits in the communication
area in week 6 (18 hits). In spite this, the access pattern
for the middle cluster experienced its biggest drop in
week 7 (10.4 hits) followed by steady hits in weeks 8-9
before another sudden dip in week 10 averaging 7.2 hits.
Access pattern of the middle cluster experienced gradual
recovery reaching 11 hits in week 12 before deteriorating
throughout the remainder of the semester reaching its
lowest average weekly hits in weeks 15 and 16 (5.3 and
4.6 hits respectively).
Analysing Figure (2) shows access patterns of the three
clusters to the communication area is significantly
different at many weeks (points) of the semester.
0
20
40
Communicationhits
Semester week
DI/HD PA/CR Fail
204
Proceedings of The 4th International Multi-Conference on Society, Cybernetics and Informatics (IMSCI 2010)

Analysis of variance shows statistical significant
differences in the average student access to the
communication area in weeks 2 and 3, and between week
5 to week 11, and again in week 14 at the significant
level of P>.05 and P>.001. Figure (2) also reveals an
overall trend of decline in the access pattern starting from
week 6 (just before the middle of the semester)
regardless of the students’ performance. Although, the
level of decline for the least achievers cluster is the
highest, the extent of recovery in the second half of the
semester is higher in comparison to the highest achievers
cluster and the middle cluster. The second half of the
semester shows a surge for the least achievers cluster,
with smaller fluctuations, ups and downs. Thus, making
week 7 as the critical point in the semester that
differentiates the access to the communication area, by
the highest achievers students from the least achievers,
that the faculty staff member should consider introducing
intervention strategies in order to improve the learning
experience of the students.
Access to Content Area vs. Student’s
Performance
Students need to access the content area to obtain lecture
material, additional readings, links, and the staff
information. Figure (3) demonstrates the high achievers
cluster average access per week to the content area was
superior to other clusters throughout most weeks of the
semester, except for week 4, ranging from an average of
4.6 hits (week 13) to 10 hits in week 6. The highest
achievers’ cluster access to content area started with an
average of 11 hits in week 1 and increased suddenly to its
second peak in week 2 averaging 9.9 hits before another
unexpected dip to an average of 7.1 hits in weeks 3 and
4. The high achievers cluster’s average hits gained its
momentum in week 5 and reaching its peak average of 10
hits in week 6. The access pattern started declining,
although maintained its superiority, throughout the
remainder of the semester with another big dip in week 7
(averaging 7.5 hits). The access pattern experienced a
gradual decline, with a small bounce in weeks 10 and 12
(6.6 and 5.5 hits respectively) and reached its least
average hits of 4.6 in week 13 with a gradual increase
during the last three weeks of the semester reaching an
average of 5.4 hits in week 16.
The least achievers cluster’s average hits per week to the
content area was unexpectedly higher than the mid
cluster’s average throughout the semester indicating that
obtaining lecture material, additional readings, links, and
the staff information was not an issue. The least
achievers cluster started reasonably well with an average
of 5.8 hits in week 1 but declined in weeks 3 and 4 (an
average of 5.1 and 4.4 respectively) before an increase
reaching its peak weekly average of 7.2 hits in week 4.
The least achievers cluster’s average hits to the content
area fluctuated in weeks 5 to 7 reaching its highest dip
of an average 3.3 hits in week 7. Figure (3) highlights the
access pattern to the content area for the least achievers
cluster which continued its steady decline throughout the
remainder of the semester but still maintained its
superiority to the middle cluster reaching its lowest
weekly average of 2.6 and 2.5 hits in weeks 15 and 16
respectively.
Figure (3) Cross Tabulation between average hits per
week to content area with students’ performance
The middle cluster’s average hits to the content area
ranged from an average of 1.3 hits (week 16) to 7.3 hits
in week 4 and unexpectedly was behind the least
achievers cluster’s average hits throughout the semester.
Although it did start close to other clusters in week 1
with an average of 5.4 hits, it did decline to just an
average of 3.0 hits in week 2 before having its highest
increase in week 4 with an average of 7.3 hits,. In spite of
this, the middle cluster’s average access to the content
area declined in week 5 (4.2 hits) and continued its
decline in week 7 reaching its second lowest average of
1.5 weekly hits. The access pattern of the middle cluster
fluctuated during the second half of the semester, with
small ups and downs reaching its highest in the second
half with an average of 2.7 hits in week 11 before
declining to its least average hits of 1.4 and 1.3 in weeks
15 and 16 respectively.
Figure (3) exposes an overall trend of decline in the
access pattern to the content area starting from week 6
(just before the middle of the semester) regardless of the
students’ performance. However, the level of decline
varies amongst the students based on their performance
with the least achievers cluster maintaining its middle
way through the highest and the middle achievers’
cluster. None of the clusters managed to really recover in
the second half of the semester although the highest
achievers’ cluster managed to recover better than other
clusters. Analysis of variance shows statistically
significant differences in the average student access to
the content area in weeks 1, 6, 10 15, and 16 at the
significant level of P>.05 and P>.001. Thus, making
week 6 the critical point in the semester that
differentiates the access to the content area, by the
highest achieving students from the least achieving
students, providing the faculty staff member with an
0
5
10
15
W1 W3 W5 W7 W9 W11W13W15
Contentaveragehits
Semester week
DI/HD PA/CR Fail
205
Proceedings of The 4th International Multi-Conference on Society, Cybernetics and Informatics (IMSCI 2010)

opportunity to introduce intervention strategies in order
to improve the learning experience of all the students.
Access to Student Area vs. Student’s
Performance
Students needed to access the student area to acquire the
student tools, edit the homepage, send a file to the
instructor, and check receipt of grades. Figure (4)
exhibits similar access patterns per week by all the
clusters to the student area with continuous fluctuations
during the first half of the semester where the high and
middle achievers’ cluster shared the highest average hits
in different weeks. The high achievers cluster’s access to
the student area ranged from an average of 1.1 hits in
week 11 to 7.2 hits in week 14. The highest achievers’
cluster access to the student area started with an average
of 3 hits in week 1 and declined gradually to reach its
second lowest average of 1.5 hits in week 4 before
climbing up to an average of 2.6 hits in week 6. The
access pattern continued its fluctuations reaching its
lowest average of 1.1 hits in week 11 before bouncing
back reaching its highest average of 7.2 hits in week 14.
This could be related to the third assessment task due
date. The pattern then declined slightly and finished the
semester with an average of 5.8 hits in week 16.
Figure (4) Cross Tabulation between average hits per
week to student area with students’ performance
In contrast, the least achievers cluster’s average access
hits to the student area per week was the lowest
throughout most of the semester ranging from an average
of 0 hit in week 7 to 2.5 hits in week 1 where this
average was above the middle cluster’s hits. Figure (4)
confirms the access pattern to the student area started
well averaging 2.5 hits in week 1 putting it above the
middle cluster but then started declining in week 2,
increasing slightly in week 3 and 4 reaching an average
of 1.3 hits in week 4 before a gradual decline to no
access in week 7. The least achievers cluster’s average
access to the student area bounced back slightly with
small ups and downs until week 13 experiencing a big
increase to an average of 1.2 hits and 1.3 hits in week 15,
before declining to an average of 0.7 hits in week 16.
The middle cluster’s average total hits ranged from 0.8
hits (week 3) to 7.1 hits in week 15 and exceeded the
high achievers cluster hits in half of the semester weeks
(weeks 2, 4, 7, 8, 9, 11, 12, and 15) as Figure (4)
indicates. As with the other clusters, the middle cluster’s
access to the student area remained low in the first half of
the semester until week 11when it started climbing
reaching its peak weekly average of 7.1 hits in week 15
before ending the semester with an average of 4.7 hits in
week 16.
Close examination of Figure (4) reveals access patterns
of the three clusters to the student area are similar during
the first 6 weeks with all clusters fluctuating. Although
the overall trend of access to the student area has
increased in the second half of the semester regardless of
the student performance, the increase access of the high
and middle achievers cluster’s average was higher.
Analysis of variance shows statistically significant
differences in the average access to the student area in
weeks 7, 14 and 16 at the significant level of P>.05 and
P>.001. Thus, making week 7 the most critical point in
the semester that differentiates the highest achieving
students from the lowest achieving students which the
faculty staff member could utilise to introduce
intervention strategies to improve the access patterns of
the least achieving students.
DISCUSSIONS
Previous research has shown strong positive relationships
between access patterns to any of the course window
components (communication, content and student area
tools) and students’ performance. This study follows
accessing patterns of five cohorts of postgraduate
students enrolled in a core unit within a master of
business administration (MBA) program between 2000-
2004. The unit is designed to provide numerous
opportunities for student participation in Discussion
Boards using Blackboard technologies. Discussion
Boards create numerous opportunities for interaction
amongst online learners to share and exchange their
experiences, creating a sense of a virtual community that
is equally effective to traditional modes of delivery.
The analysis shows an overall trend of decline in the
access pattern to the course window starting from week 9
and to the communication and content areas starting from
week 6 regardless of the students’ performance.
However, the level of decline to the total course window
and to the communication area for the least achievers
cluster is the highest with very limited to no
improvement at the second half of the semester in
comparison to the highest achievers cluster and the
middle cluster. This could be partially explained by the
fact that students were required to participate in only 8
out of 12 discussion boards. As to the access patterns to
the content area, the level of decline varies amongst the
0
2
4
6
8
W1 W3 W5 W7 W9W11W13W15
StudentAreaaveragehits
Semester week
DI/HD PA/CR Fail
206
Proceedings of The 4th International Multi-Conference on Society, Cybernetics and Informatics (IMSCI 2010)

students based on their performance with the least
achievers cluster maintaining its middle way through the
highest and the middle achievers’ cluster that is
unexpected. In relation to access patterns to the student
area, figures demonstrate an overall increased trend in
the second half of the semester regardless of the student
performance where the increase access of the high and
middle achievers cluster’s average was higher. Analysis
of variance shows statistically significant differences in
the average student access to the course window in week
3, and between weeks 5 and 11, and again between
weeks 13 and 16. Significant differences were also found
in the average student access to the communication area
in weeks 2 and 3, and between weeks 5 and 11, and again
in week 14. In addition, significant differences were also
found in the average student access to the content area in
weeks 1, 6, 10 15, and 16. Differences were also revealed
in the access to the student area in weeks 7, 14 and 16.
Close examination of the significant differences in access
patterns to the course window and its components of
communication, content, and student areas reveals week
7 as the common critical point that differentiates high
achieving students from low achieving students. This is
similar to the face-to-face disengaged point adding to
Horton’s [18] list of similarities between the two modes
of delivery. Identifying critical points provides the
faculty staff member an opportunity to introduce
intervention strategies in order to improve the learning
experience of all the students.
There are some limitations of this research related to the
sample size. Having a very small sample meant that
limited analysis could be performed and results could not
be generalised. Another limitation is related to the fact
that teacher’s quality and its impact on students’
performance being not investigated in this study [19].
Further research with a larger sample incorporating
business programs in Australian universities is needed.
This research would enable drawing conclusions and
generalising results regarding the relationships between
access patterns and student’s performance. Linking
access patterns of high and low achieving students with
their learning style would facilitates personalized online
learning argued by Zajac [20] and Johnson [21]. Further
research is also needed to investigate gender differences
related to the access patterns of males and females and
relate this to their performance.
REFERENCES
[1] A.W. Chickering and Z.F. Gamson, Seven
principles for good practice in undergraduate
education. AAHE Bulletin, Vol. 39, No. 7, 1987,
pp. 3-7.
[2] A.W. Chickering and Z.F. Gamson, Applying seven
principles for good practice in undergraduate
education. San Francisco: Jossey-Bass, 1991.
[3] A.W. Astin, Student involvement: A developmental
theory for higher education. Journal of College
Student Personnel, Vol. 25, 1984, pp.297-308.
[4] M. Rowh, Is On-Line Learning Right for You?
Carer World, Vol. 32, No. 6, 2004, pp. 18-21.
[5] J. Dahl, Focus on Collaboration, and the
Technology will flow, Distance Education Report,
August, pp. 5-6, 2004.
[6] J. Shen, and L.B. Eder, Intentions to Use Virtual
Worlds for Education. Journal of Information
Systems Education, Vol. 20, No. 2, 2009, pp. 225-
233.
[7] R. Ribeiro, C. Kimble, and P. Carins, Quantum
phenomena in Communities of Practice.
International Journal of Information
Management, 30, 2010, pp. 21-27.
[8] B. Bata-Jones and M.D. Avery, Teaching
Pharmacology to Graduate Nursing Students:
Evaluation and Comparison of Web-Based and
Face-to-Face Methods, Journal of Nursing
Education, Vol. 43, No. 4, 2004, pp.185-190.
[9] A.W. Chickering and Z.F. Gamson (1991).
[10] A.W. Chickering and C. Ehrmann, Implementing
the Seven Principles: Technology as Lever, AAHE
Bulletin, Vol. 25, No. 10, 1996, pp. 3-6.
[11] W. Horton, Designing Web-Based Training, New
York, Wiley, 2000.
[12] W. Hover, The Practice Implications of
Constructivism. SEDLetter Vol IX, No 3, August
1996. Retrieved 14th December 2009, from:
http://www.sedl.org/pubs/sedl-letter/welcome.html.
[13] M. Boudourides, Constructivism, Education,
Science, and Technology, Canadian Journal of
Learning and Technology, Volume 29 (3) fall/
autumn. Retrieved 22nd December 2009, from:
http://www.cjlt.ca/content/vol29.3/cjlt29-
3_art1.html
[14] M.P. Halio, Teaching In Our Pajamas: Negotiating
With Adult Learners in Online Distance Writing
Courses, College Teaching, Vol. 52, No. 2, 2004,
pp. 58-63.
[15] N. Butrous, Online Unit Design and Student
Learning, Paper presented at the 3rd International
Conference on Education and Information Systems,
Technologies and Applications (EISTA 2005)
refereed proceedings, 14-17 July 2005, Orlando,
Florida, USA. Vol. 2, pp 28-33.
[16] N. Butrous, Enhancing E-Learning Communities,
Paper presented at the Annual Online Learning and
Teaching Conference (OLT 2005) refereed
proceedings, QUT, Brisbane, 27th September 2005.
[17] F. Nguyen, The Effect of Performance Support and
Training on Performance Attitudes, Performance
Improvements Quarterly, 2009; 22, 1; pp. 95-113.
[18] W. Horton, 2000.
[19] L. Tin-Chin, Teacher quality and student
performance: the case of Pennsylvania. Applied
Economics Letters, Vol. 17, 2010, pp. 191-195.
[20] M. Zajac, Using learning styles to personalize
online learning. Campus-Wide Information
Systems, Vol. 26, No. 3, 2009, pp. 256-265.
[21] R.D. Johnson, H. Guetal, and C.M. Falbe,
Technology, trainees, metacognitive activity and e-
learning effectiveness. Journal of Managerial
Psychology, Vol. 24, No. 6, 2009, pp. 545-566.
207
Proceedings of The 4th International Multi-Conference on Society, Cybernetics and Informatics (IMSCI 2010)

Classroom Technology, Interior
Infrastructure and the Perception of
Learning Effectiveness at the University
Level
Anita Chadha
Department of Social Sciences
University of Houston-Downtown
1 Main St.
Houston, Texas 77002
David Branham, Sr.
Department of Social Sciences
University of Houston-Downtown
1 Main St.
Houston, Texas 77002
ABSTRACT
Understanding learning environments is essential
to the educational process. Our study focuses on access to
technology, specifically video equipment and computer
equipment, and its impact on students’ perception of
learning effectiveness. We also examine the impact that
classroom infrastructure such as desk configuration, the
presence of windows, square footage, classroom shape and
other factors have on learning ability. Data for the project
were drawn from student surveys of in classes of various
disciplines in a diverse university setting. The results of
the analysis indicate that the addition of technology to the
classroom by itself does not increase the perception of
classroom learning proficiency; however, classroom
infrastructure, specifically desk configuration, the way the
classroom faces and the presence of windows do have a
significant impact on classroom evaluations. Further
analysis also indicates that while windows add to the
classroom experience, windows in noisy areas are less
effective than windows which are not subject to noise.
This indicates that classroom construction and
arrangements must be done with great care to maximize the
learning environment.
Keywords: Interior Infrastructure, Learning Environment,
Technology
INTRODUCTION AND LITERATURE REVIEW
Understanding learning environments is receiving
renewed attention as universities are seeking to improve the
quality of their teaching as well as develop the learning
skills of students. With increased demands for teaching
effectiveness in the classroom, instructors are searching for
answers on how to better convey knowledge to students.
Often, the impact of the classroom setting is ignored as an
element of teaching effectiveness. However we contend
that infrastructure is a very important determinant of
classroom success. Does the size or shape of the room
matter? Or how the desks are configured? Do the
presence of windows lend to the learning environment?
Does technology matter in the classroom? Understanding
classrooms as social organizations are a very important
means towards measuring effectiveness in the educational
process.
Undeniably, there has been substantial research
on several aspects of technology as an aid in the classroom.
There is research concerning the use of technology in a
variety of ways including real time video conferencing,
internet access to worldwide information resources, long
distance collaboration with students and scientists,
simulations of problem solving experiences, and
technology aiding school/parent/community
communication (Alavi, 1994; Bielaczyc, 2006; Brill et.al,
2007; Laurillard, 1993; Mergendoller, 1996; Windschitl,
2002). Technology has been touted as a way to encourage
student-centered learning especially positively influencing
teaching success with at risk students. There is increased
attendance in classes of at risk students if technology is
used in the classroom. Moreover, with at risk students,
achievement scores in classes and positive interactions
increase in classes that use technology (Braun, 1990; Olsen,
1990; Chavez, 1990; Walker de Felix et al, 1990; Waxman,
1992). On the other side of the debate are studies that have
also noted the lack of training for teachers in the use of
these technologies (Weldon et. al, 1981; Windschitl, 2002),
noting that instructors that do not task themselves with
understanding new technology as a form of pedagogy can
hurt rather than help themselves with its presence in the
classroom. And of course implementing newer forms of
technology, whether it is physical technology or learning
how to use that technology in the classroom, is also
important in increasing teaching effectiveness
(Mergendoller, 1996).
There has also been little to no research towards
understanding the influence that classroom infrastructure
has on teacher effectiveness. While some researchers have
suggested that schools fail because of organizational and
structural features of the school and the school environment
(Branham, 2004; Erickson, 1987; Waxman, 1992) little
empirical analysis has been conducted to understand the
effect of infrastructure on learning effectiveness in a
university setting. A group of researchers, Weldon, Loewy,
Winer, and Elkin (1981) have argued that the perception of
spaciousness in a classroom is very important; however it
has been very hard to measure that spaciousness and
therefore its effects on class effectiveness. The same group
of authors also note that research on noise levels whether
within or outside of a classroom need to be examined in
order to relate to the quality of learning that occurs in a
classroom.
The placement of desks and chairs in a classroom
has given rise to some substantial research. For instance the
sense of feeling crowded in a room because of the room
design, i.e, noise level in the room, ceiling height, seating
plans, and windows in the room are all factors in
determining effectiveness (Boocock, 1978; Leone &
O’Hare, 1998; Sommer, 1977; Weldon et. al, 1981). The
arrangement of tables and chairs and/or desks can also have
a strong influence on learning (Leone & O’Hare, 1998).
This article will add to this research by being the first study
of its kind to examine the a) contending nature of
technology affecting learning; b) how varied forms of
infrastructure in the classroom affect learning; and c)
setting about this learning in a diverse university setting
208
Proceedings of The 4th International Multi-Conference on Society, Cybernetics and Informatics (IMSCI 2010)

that incorporates six traditional social science disciplines:
Anthropology, Geography, History, Political Science,
Sociology and Psychology.
METHODOLOGY
It is important to go into great detail when
studying classroom environments. Classrooms on college
campuses are used over and over again and if they provide
an inferior atmosphere the negative impact can be
exponential. Therefore we hypothesize that the interior
infrastructure of the classroom, how the classroom is
configured and the classroom’s access to technology, will
affect a student’s perception of the learning experience.
The University of Houston-Downtown is an ideal
setting for this study because of the wide variety of
classroom environments on campus. Classes at the 12,000
student campus were held in three separate buildings from
2002-06, the time period of this study. The 600,000 square
foot One Main building, which was the original home of
UHD when it opened in 1974, is now 77 years old.
Originally built as an office building and factory in the
north end of downtown Houston, the building was
converted into a college facility and housed South Texas
Junior College before UHD was established. The building,
one of the oldest in Houston, has undergone several
renovations. The last of these took place in the late 1980s.
Despite the renovations which modernized the facility, the
classrooms within are a hodgepodge of misshaped spaces
often lined with round supporting beams two feet in
diameter.
In the mid 1990s UHD opened its second
classroom building known as the Academic Building.
While connected to the One Main building, the classroom
facilities in the Academic Building are incomparable to its
neighboring predecessor. Most of the rooms in the
Academic Building are rectangular. Many of the rooms
have state of the art equipment and several have windows
with a spectacular view of downtown Houston. The third
facility, the Commerce Street Building which opened in
2005, is also a superior facility offering many state of the
art classrooms. Figure 1 displays a map of the three
buildings. Together the buildings surround Allen’s
Landing, the scenic bayou conjunction where the Allen
brothers founded the city of Houston, Texas in 1836.
The social science department conducted classes
in all three buildings from the Spring semester of 2002 to
the Spring semester of 2006. During that time some 33,202
students completed evaluations of their classes. The
evaluations ask a series of questions with students being
given Likert scale options of strongly agree (5), agree (4),
neutral (3), disagree (2) and strongly disagree (1) for their
answers. The question that will be used as the dependent
variable for this analysis is, “I have become more
competent in this area because of this course.” This
question, although an indirect measure of gained
competency, should give a reasonably accurate assessment
of the success of the class.
The students consistently gave high evaluations
to their various instructors over the time period. Over 50%
of the students (16,903) answered that they strongly agreed
that their class made them more competent in the subject
area and another 34% (11,134) agreed that the class did so.
Only 592 students answered “strongly disagree” and 1,125
students answered “disagree” to the question.
Figure 1. Map of University of Houston-Downtown
campus. Classrooms for the study were located in the
Academic Building, the One Main Building and the
Commerce Street Building.
In all 179 different instructors taught 127
different classes and 1,781 different face to face sections in
the department during the time period. Summer classes and
on-line classes were not included in the analysis. With
33,202 students being surveyed controlling for each class
and each instructor individually with nominal variables is
easily done in each model without much worry about
degrees of freedom. Such variables must be a part of the
analysis to control for instructor ability, and the ease and
likability of classes (Sex Education) in comparison to
others (Intro to Government). Coefficients for these
instructors and classes will not be reported to save space.
Unreported nominal independent variables will also be
added to each model to control for the time that each class
took place, the days the class took place and the semester in
which the class was taught.
This paper will look at two aspects of the
classroom learning environment. The first hypothesis will
focus on how the presence of technology in the classroom
effects the students’ perception of the learning
environment. Before and during the time period of the
analysis video equipment and computers were installed in
various classrooms. Most classrooms did not have both
and there were some classrooms that did not have either. A
student breakdown of the presence of classroom technology
is revealed in Table 1. The variance in equipment from
classroom to classroom for thousands of students provides
209
Proceedings of The 4th International Multi-Conference on Society, Cybernetics and Informatics (IMSCI 2010)

the ability to compare learning environments. The first
hypothesis for this paper is that the presence of technology
will enhance the learning environment of the classroom,
making students more competent in the subject area.
Table 1. Breakdown of presence of technology in the
classroom by student, 2002-06.
No Technology 3,509
Only Computer Equipment 14,854
Only Video Equipment 13,098
Both Computer and Video Equipment 1,741
The second hypothesis is that the interior
infrastructure of the classroom will have an impact on the
learning environment. First, the buildings will be looked at
individually to see their effects on learning. Then new
models are developed to add variables illustrating
classroom infrastructure. These variables include the space
available in the classroom for each student, class
enrollment, the direction the class faces (does the class face
lengthwise where some students are far from the
instructor?), the table and or desk arrangement, whether or
not the class has a stage for the instructor, and whether or
not the class has windows. These hypotheses will be tested
using ordinary least squares regression.
RESULTS
The results of the hypotheses tests are displayed
in Table 2. The absence of a variable for the One Main
Building in each model is to prevent perfect
multicollinearity, and it should be assumed that the
building has a coefficient of zero. The first model
incorporates the hypothesized variables for classroom
infrastructure and technology. The second model is a
simplified model that eliminates insignificant hypothesized
variables. The hypothesis that the addition of technology in
the classroom would enhance the learning environment is
not supported by the data presented here. In fact the
coefficient for computer equipment is negative (but
insignificant). Apparently, simply adding technology to the
classroom by itself is not enough to enhance the learning
environment, at least from the students perception.
Several of the hypothesized variables for
classroom infrastructure also failed to reach significance.
Apparently the amount of space a student has in the
classroom or the number of students in the classroom has
little impact on the students’ perception of the value of the
class has on learning1. Having a stage presentation area
also does not seem to have a significant impact.
1 The results of the analysis brought to light the possibility
that time may be a factor in the effectiveness of the
technology. Perhaps as instructors got more familiar with
the equipment it would become an asset. Therefore we
looked at each semester separately to see if the coefficients
for the computer systems and the video equipment would
increase over time. The analysis did not confirm our
suspicion. Technology coefficients in this analysis did not
increase as time went by.
However three infrastructure variables did show
significant effects on perceived learning outcomes. The
model indicates that classes that face lengthwise have a
significant negative impact on learning. When a class faces
lengthwise students in the back of the class are farther away
from the instructor than they would be if the classroom was
arranged in the opposite manner. Such an arrangement
appears to have a negative impact on learning perceptions
of students. Table and desk arrangement also has a
significant coefficient indicating that shared tables and
chairs are superior to desks for learning, regardless of
whether the desks can be moved or are permanently
attached. Lastly, students in classrooms with windows are
more likely to say that they learned the class’s subject
matter than students in classes without windows.
Apparently, the addition of windows in the classroom is a
good investment.
Table 2. Classroom environmental factors in students’
evaluation of learning.
Model 1 2
Coef. (Std Err.) Coef. (Std Err.)
________________________________________________
Academic Building .055 (.028) .019 (.014)
Commerce Building .034 (.060) -.009 (.049)
Sq. Ft. per Student .001 (.001) ----------
Enrollment .001 (.001) ----------
Class Faces Lengthwise -.036 (.017)* -.032 (.014)*
Class Has Window .067 (.019)* .062 (.015)*
Single Detached Desks -.018 (.023) ----------
Class has Shared Tables .106 (.041)* .115 (.032)*
Stage Presentation -.045 (.045) ----------
Computer Equipment -.044 (.032) ----------
VCR/DVD Equipment .007 (.017) ----------
Constant 4.32 (.083)* 4.35 (.044)*
________________________________________________
Adj. R Square .130 .130
Std Error of Estimate .849 .849
N 33,202 33,202
Note: Dependent Variable is student response to the
question “I have become more competent in this area
because of this course.” Answers are on Likert scale
responses with 5 being “Strongly Agree” and 1 being
“Strongly Disagree”. Standard errors in parentheses. * p
<.05 for a one tailed test. Categorical variables for each
instructor, each semester, each class (discipline and class
number), time of class and day or days of class are not
reported.
A CLOSER LOOK AT WINDOWS
The initial analysis shows that having windows in
the classroom adds to the students’ perception of learning.
However, all windows are not the same. For the most part
the classroom windows vary in two ways. The first is the
view they provide. A limited or ugly view may reduce the
positive impact that windows can provide. The second
210
Proceedings of The 4th International Multi-Conference on Society, Cybernetics and Informatics (IMSCI 2010)

variable is the noise that windows allow. Windows can be
a conduit for noise and noise certainly can inhibit the
learning process. This true we look closer at the windows
on campus by coding each classroom with windows for the
additional noise that the windows let in and for the view
they provide.
For the most part the views that the windows in
the three buildings provide are limited and/or
unpicturesque. Many of the windows look out into a
courtyard and provide only a view of another wall 20 feet
away. Many of the other windows provide the same type
of view, looking into an unattractive wall of a building only
a few feet away. Other windows provide views of railroad
yards, a parking garage or empty weed filled fields. The
one view that does stand out on campus is the view from
the classrooms on the south side of the Academic Building.
These particular classroom windows provide a spectacular
and breathtaking view of the city of Houston skyline. With
these windows providing a view that far exceeds any other
on campus we will look directly at their impact on student
learning.
There is also wide variation between the window
classrooms in the noise level they have. Some classrooms,
mainly those with windows to an empty courtyard or those
on the south side of the academic building that are high
above ground level and a long way from streets, have very
low noise levels. Others do have noise, but the noise is
fairly consistent and quite low in volume. Among these
classrooms are those in the One Main Building parallel to
I10 and those on the east side of the Commerce Street
Building that overlook a parking lot (see Figure 1).
Students sitting in these classrooms can hear noise if they
listen for it, but it is rare for them to be disturbed by outside
activity. There are also some very high noise window
classrooms. These are mainly the classrooms that border
Main St. like those on the east side of the One Main
Building and the west side of the Commerce Street
Building. The Main Street Rail provides constant noise
going by every two to three minutes, ringing bells and
sounding horns to warn pedestrians. Sirens are also a
constant with police and ambulance continuously using the
street. The pedestrians are also quite audible. One
instructor in the One Main Building would often take a
collection from the class and go down to the street and send
a homeless man to lunch so he would not disturb the class
with his constant guitar playing.
To analyze the impact of these window features
we continue the analysis. To do this a categorical variable
is placed in our original model defining each classroom
with windows for noise level. A nominal variable is also
placed in the model to see the impact of the spectacular city
view. The results are displayed in Table 3. The first model
shows that the view appears to have little or no impact on
the value of windows in a classroom, at least when it comes
to students’ perception of learning. Apparently it does not
matter what view a window provides. Instead, its ability to
enhance the learning process is elsewhere. Both models
also show that noise levels have a large impact on learning.
Windows that produce loud noise lose their value on the
learning process, and windows that produce moderate noise
show significant but diluted value. The windows that truly
enhance the learning process are the windows that have
little or no noise. Classrooms that provide windows with
very low noise levels get very high ratings from students.
Table 2. Classroom environmental factors in students’
evaluation of learning.
Model 1 2
Coef. (Std Err.) Coef. (Std Err.)
________________________________________________
Academic Building .003 (.023) .055 (.028)
Commerce Building .013 (.054) .034 (.060)
Class Faces Lengthwise -.039 (.016)* -.036 (.017)*
Class has Shared Tables .120 (.033)* .106 (.041)*
Window with City View -.002 (.029) ----------
Window with Low Noise .067 (.024)* .066 (.016)*
Window with Moderate Noise .040 (.025) .039 (.022)*
Window with High Noise .012 (.033) .012 (.032)
Constant 4.45 (.038)* 4.37 (.045)*
________________________________________________
Adj. R Square .130 .130
Std Error of Estimate .849 .849
N 33,202 33,202
________________________________________________
Note: Dependent Variable is student response to the
question “I have become more competent in this area
because of this course.” Answers are Likert scale
responses with 5 being “Strongly Agree” and 1 being
“Strongly Disagree”. Standard errors in parentheses. * p
<.05 for a one tailed test. Categorical variables for each
instructor, each semester, each class (discipline and class
number), time of class and day or days of class are not
reported.
CONCLUSIONS
In conclusion, our analysis clearly indicates that
university classrooms with shared tables and chairs provide
a superior learning environment in comparison to
classrooms with individual desks. The conclusions
regarding the effectiveness of windows in the learning
environment are also very interesting. It appears that the
addition of windows to the university classroom is almost
always a good idea. This appears to be true regardless of
the view they provide. But the data also indicate that
classroom windows that provide limited or no noise are far
superior in effectiveness to those that do not. The analysis
also confirms that classrooms that face lengthwise also
provide inferior learning environments. Apparently the
view of “50 haircuts and one face” originally slighted for
its unconstructive nature by Leone and O’Hare (1998) is
not effective for students learning at the university level.
Instructors and students appear to need close proximity in
order to have a superior learning environment.
This analysis did not confirm our hypotheses concerning
the addition of technology to the learning environment.
The insignificant coefficient for the classroom computer
system is especially discouraging, especially when the
investment is considered. This research certainly does not
bring the conclusion that technology in the classroom is
without use. But it does appear that simply placing the
technology in the classroom and expecting it to pay off in
an enhanced teaching environment is shortsighted. It is
211
Proceedings of The 4th International Multi-Conference on Society, Cybernetics and Informatics (IMSCI 2010)

probably the case that many instructors use the systems to
enhance their classes. However, in line with the findings of
Weldon et. al (1981) and Windschitl and Sahl ( 2002), it is
also probable that the presence of the system may be
detrimental to instructors who do not use it or do not use it
well. Perhaps the immense sizes of the systems are large
enough to detract from the classroom environment.2 The
standard classroom computer system at the university
stands 48.5 inches high, has a width of 42 inches, and is
31.2 inches deep. The depth and the height of the
instrument, along with its positioning at the front of the
classroom, make it very difficult for many students to see
the instructor, especially if the instructor is of below
average height. And because the system takes up about 36
square feet of class space the instrument is too bulky for
students to sit strategically so that they can get the best
possible view, especially with instructors that tend to roam
back and forth in front of the class.
There is no doubt that classroom infrastructure can have
an immense amount of impact on learning in the classroom.
We recognize the fact that classrooms are complex
structures that deem further insight. We recommend further
discussions and research on this topic of classroom
infrastructure as it affects learning at the university level.
REFERENCES
[1] Alavi, Maryam. (1994). Computer-Mediated
Collaborative Learning: An Empirical Evaluation. MIS
Quarterly. Vol. 18, #2, pp 159-174.
[2] Bielaczyc, Katerine. (2006). Designing Social
Infrastructure: Critical Issues in Creating Learning
Environments with Technology. Journal of the Learning
Sciences. Vol. 15, No. 3, pp301-329.
[3] Boocook, Sarane Spence. (1978). The Social
Organization of the Classroom. Annual Review of
Sociology. Vol. 4, pp. 1-28.
[4] Branham, David. (2004). The Wise Man Builds His
House Upon the Rock: The Effects of Inadequate School
Building Infrastructure on Student Attendance. Social
Science Quarterly. 85(5): 1112-28.
[5] Braun, L. (1990). Vision: TEST final report:
Recommendations for American Educational Decision
Makers. Eugene, OR: Internal Society of Technology in
Education.
[6] Brill, Jennifer M. and Chad Galloway. (2007). Perils
and Promises: University Instructors’ Integration of
Technology in Classroom-Based Practices. British Journal
of Educational Technology. Vol. 38 No. 1, pp95-105.
[7] Chavez, R.C. (1990). The Development of Story
Writing Within an IBM Writing to Read Program Lab
Among Language Minority Students: Preliminary Findings
2 The results of the analysis brought to light the possibility
that time may be a factor in the effectiveness of the
technology. Perhaps as instructors got more familiar with
the equipment it would become an asset. Therefore we
looked at each semester separately to see if the coefficients
for the computer systems and the video equipment would
increase over time. The analysis did not confirm our
suspicion. Technology coefficients in this analysis did not
increase as time went by.
of a Naturalistic Study. Computers in the Schools, 7.
pp121-144.
[8] Erickson, F. (1987). The Transformation and School
Success: The Politics and Culture of Educational
Achievement. Anthropology and Education Quarterly. Vol.
18, pp 335-356.
[9] Laurillard, Diana. (1993). Rethinking University
Teaching: a Framework for the Effective use of
Educational Technology. London and New York:
Routledge.
[10] Leone, Robert A. and Michael O’Hare (1998).
Curriculum and Case Notes. Journal of Policy Analysis and
Management. Vol. 17. No. 4, pps 706-720.
[11] Mergendoller, John. (1996). Moving From
Technological Possibility to Richer Student Learning:
Revitalized Infrastructure and Reconstructed Pedagogy.
Educational Researcher, Vol 25, No. 8, pp. 43-46
[12] Olsen, J.B. (1990). Learning Improvement Results
From Integrated Learning Systems for Underachieving
Minority Students in J.G. Bain and J.L. Herman (Eds.).
Making Schools Work for Under-Achieving Minority
Students: Next Steps for Research Policy, and Practice.
Westport, CN: Greenwood Press, pp 241-255.
[13] Sommer, Robert (1977). Classroom Layout. Theory
into Practice. Vol. 16, No. 3, pp. 174-175.
[14] Walker de Felix, J., Johnson R.T. and Shick J.E.
(1990). Socio-and Psycholinguistic Considerations in
Interactive Video Instruction for Limited English Proficient
Students. Computers in the schools. 7, pp173-190.
[15] Waxman, H.C. (1992). Reversing the Cycle of
Educational Failure for Students in At-Risk School
Environments. In H.C. Waxman, J. Walker de Felix, J.
Anderson, and H.P. Baptiste (eds). Students At Risk in At-
Risk Schools: Improving Environments for Learning.
Newbury Park, CA: Corwin.
212
Proceedings of The 4th International Multi-Conference on Society, Cybernetics and Informatics (IMSCI 2010)
Deconstructing new media: From computer literacy to new media literacy
Der-Thanq CHENLearning Sciences Laboratory, National Institute of Education, Nanyang Technological University,
Singapore
and
Jing WU
Center for Research in Pedagogy and Practice, National Institute of Education,
Nanyang Technological University, Singapore
ABASTRACT
As we enter the 21st
century, new media has become an
integral part of our daily life. In order to participate
responsibly in the 21st
century society, it is imperative
that a person becomes
have argued that literacy has evolved historically from
classic literacy (reading-writing-understanding) to
audiovisual literacy to digital literacy or information
literacy and recently to new media literacy. The purpose
of the study is to unpack and deconstruct new media
literacy by analyzing its different dimensions. By so
doing, we hope to inform future studies. This paper first
introduces the idea of medium being the message and
then moves on to unpack new media along its technical
and socio-cultural dimensions. We propose a framework
for new media literacy which is consisted of functional
and critical literacies, and consuming and prosuming
literacies.
Keywords: new media, computer literacy and new media
literacy.
1. INTRODUCTION
As we enter the 21st
century, new media has become an
integral part of our daily life. In order to participate
responsibly in the 21st
century society, it is imperative
that a person becomes new med Researchers
have argued that literacy has evolved historically from
classic literacy (reading-writing-understanding) to
audiovisual literacy (mostly related to electronic media)
to digital literacy or information literacy (mostly related
to computer and digital media) and recently to new media
literacy (mostly related to internet and the phenomenon
of media convergence) [34].
However, a quick review of the literature on new media
literacy shows that many researchers did not discuss
issues related to new media in such a way that is practical
for understanding daily life in the 21st
century. New
media literacy is mainly conceived as a combination of
information skills, conventional literacy skills, and social
skills (or multiple literacies). Insufficient attention is
given to the characteristics of new media and how it
impacts on the notion of literacy in the new media era.
The purpose of the study is to unpack and deconstruct
new media literacy by analyzing its technical and socio-
cultural dimensions. By so doing, we hope to inform
future study.
2. CHARACTERISTICS OF NEW MEDIA
is the
]. According to McLuhan, medium is an
extension of ourselves. The choice of medium by the
creator amplifies or accelerates certain social processes
over others. Medium is the message is more prominent in
the new media age as the new media technology has
unprecedented affordance for human communication and
it impacts more significantly on the content and modes of
communication. Based on the literature, we propose that
new media can be broadly understood by their technical
and socio-cultural characteristics.
Technical characteristics
Earlier attempts to characterize new media seemed to
stress on their technical affordances. For example, Rice
[29] defined new media as computer and communication
technologies, which allows interactivity between users
and information and among users. Similarly, Pratt [26]
compared new media with conventional broadcasting and
recording technologies and emphasized the multimedia
affordance as characterizing new media. Manovich [19]
identified two basic principles of new media numerical
representation and modularity. New media are, first of all,
in the form of digital codes. This feature of numerical
representation makes it programmable and computable.
Media elements are also stand-alone modules that can be
assembled into larger-scale objects, for example, the
background sound and picture images in a video clip in
Windows Movie Maker. The characteristic of modularity
enables the elements to keep their own identity while at
the same time the modules can be modified for different
213
Proceedings of The 4th International Multi-Conference on Society, Cybernetics and Informatics (IMSCI 2010)

effects. The two basic principles bring around another
two deeper principles of new media. It allows automation
of operation and variability in media creation and
manipulation at different levels. Tagging functions in
Web 2.0 is such an example. Users may use the
recommended tags or create their own tag for their video
clips in YouTube, or URLs in Delicious bookmark
organizer. The automation function of tagging enables
them to search for related web-pages while the
variability function enable them to easily edit and sort the
tagging of their files.
The technical features afford the development of new
media languages. For example, Twitter enables the users
to spontaneously update their status even from their
mobile devices. It provides a context for a new type of
language to emerge. This new language can be short,
informal, inviting, and intriguing. Each medium typify
various forms, genres, rules [27], codes and conventions
[2], and symbol systems of communication [2]. In
addition, new media is characterized by modularity [19],
multimodality [1], hybridity [22] and interactivity [1] of
different media and platforms. For example, the BBC
website http://www.bbc.co.uk/ is a platform featuring co-
existence of videos, audio clips/podcasts, texts, graph
(hybridity). A piece of news is now presented as a short
written report accompanied with an interview video clip
(multimodality). Users can access the news report on
their mobile devices (interactivity of platforms).
Literature has suggested that the flexibility and fluency
across platforms is highly increased [24].
Socio-cultural characteristics
Recent literature on new media has also emphasized the
socio-cultural aspects of new media. Lievrouw &
Livingstone [16], for example, suggested the definition of
new media should go beyond the systems and features of
information and communication technology and examine
its social contexts. Similarly, Jenkins [11] examined the
impact of new media on consumers. He suggested that
new media is no longer a technical tool that influences
our culture, but an integral part of an emerging culture
which he called convergence culture or participatory
culture. The socio-cultural aspect of new media can be
characterized in three aspects the construction of media,
the ideology and social values embedded, and their
purposes. Firstly, media are constructed. Media
messages do not convey the reality . Instead, they are
representation of interpretation by the author of the
message [2], [27]. A significant characteristic of new
media lies in that it has enabled the ordinary online users
to construct and co-construct media content almost
effortlessly. The media consumers, as Jenkins [11]
suggested, are no longer at the end of information flow.
Instead they are actively changing the information flow
and participate and collaborate in online groups.
Consequently, they promote the quick development of
grassroots energy [4], [25], as opposed
to taxonomy by experts. This bottom-up energy has
generated enormous creativity [4], and harnessed
collective intelligence of the general public [8], [23].
Secondly, media have embedded values and ideological
implications. Media messages are neither facts nor truths,
as what the media business often claims to be. Neither are
media neutral. They are constructed with embedded
values and ideological implications [6], [27]. New media
empower the once end-users of media, providing a
platform for their voice and amplifying
their values and ideology, which is often impossible in
real life. Thirdly, media serves varying purposes. Media
messages serve such purposes as social, political,
commercial [2], [27] and educational [21]. Social
networking has emerged as a major purpose of new
media particularly for youth. In an ethnographical study
[10], it was
found that majority of the youth are using online media to
extend friendship.
their existing or new friends through private or public
new media spaces.
With the new development of the technical (particularly
new media language) and socio-cultural characteristics of
new media, there is a need to re-examine literacy in the
context of 21st
century new media era. We contend that it
is no longer sufficient for a student to participate
responsively in society with just classic literacy and
computer literacy. We propose that an expanded notion
of new media literacy is inevitable. In the following
session, we will propose a framework to deliberate this
notion.
3. A FRAMEWORK FOR NEW MEDIA LITERACY
As Universitat Autònoma de Barcelona [34] has
suggested, new media literacy is a convergence of all
literacies developed over the past centuries (classic
literacy, audiovisual literacy and digital literacy or
information literacy). Taking this view as a point of
departure, we propose a framework that unpacks new
media literacy as two continuums from consuming to
prosuming literacy and from functional to critical literacy.
Figure 1. Framework for new media literacy
214
Proceedings of The 4th International Multi-Conference on Society, Cybernetics and Informatics (IMSCI 2010)

From consuming to prosuming media literacy
Interaction with media content can be depicted as media
[33].
Toffler [33: 288]
production for exchange, half and
brought about by technology, can produce customized
products by themselves.
In this vein, we suggest that
may refer to the ability to access media message and use
it at different levels. Process s
message have been emphasized in earlier literature. For
example, media literacy was viewed
access, analyze, evaluate, and communicate message in a
variety of forms [2: 7]. With the recent development of
information and communication technologies, the issue
of access is become less prominent, and the skill set in
has been expanding to accommodate
more critical skills required in the information age, such
as [7] and [7], [14], [17].
content. There are two aspects of media prosumption:
creating/producing media content and participating in
online communities. For example, students may use
media tools to create a video clip and upload it to
YouTube. It also involves the design of media content
based on individual ideology with his/her unique cultural
background and purpose at hand. The skill to create is
emphasized in many media literacy studies [9], [17], [31],
[32]. Note that even though these researchers use the term
create, the consuming aspect is integrated and implied.
For example, when other users comment on a particular
clip, the originator may have to read and interpret the
comments carefully before he/she responds. This process
is similar to what Jolls [12] called participation.
From functional to critical media literacy
While the above discussion emphasizes on the
new
media, many researchers have also highlighted the
criticality in these activities. They argued that media
literacy is not neutral technical skill in an individual.
Instead it is a social and cultural practice situated in a
specific context [17], [30].
To also further expand Buckin notion of
functional and critical literacy [5], we view functional
media literacy textual meaning making
and use of media content. This would involve accessing
and literally (textual) understanding of the media
message in consuming media, and operating media tools
in prosuming media. Functional media literacy is
essential because users need to be familiar with the
technical characteristics of new media tools and the new
media language to actively utilize the new media
technologies as he wishes. However, it is not sufficient.
Researcher have argued that criticality should also be
considered and therefore the use of the term critical
literacy. Critical literacy refers to analyzing, evaluating,
and critiquing media [14], [18]. It involves a study of
both the textual and social meanings of the media content,
the social values, purpose of the media producers as well
as the power position of the media producers and
audience.
Based on the two dimensions four types of new media
users can be identified. A functional new media
consumer is one who can gain access to created media
and understand what is being conveyed. A critical media
consumer, in comparison, would study the social,
economic, political and cultural contexts of the media
content. He/she has a good understanding of construction
of media message, its embedded social values and
ideologies, and the purpose it aims to serve the socio-
cultural characteristics of media. This person develops a
critical understanding of media message, and more
importantly, a good sense of judgment in consuming
media. A functional prosumer is one who knows how to
create new media (e.g., writing a blog entry) and
participate in various new media spaces. A critical
prosumer, on top of that, understands his/her position and
identity in media construction, media publication and
media participation. He is able to intricately embed his
social values in his media construction and utilize the
media message in a way that he wishes.
From computer literacy to new media literacy
In the above discussion, it is obvious and most desirable
that users to become critical media prosumers. In addition,
based on the analysis, the notion of computer literacy is
likened to functional consuming and at most functional
prosuming. We argue that it should be further expanded
to new media literacy and shift its focus to criticality and
prosumption in media.
Conventionally, computer literacy focuses largely on the
skills and comfort level in the use of computer hardware
and software, i.e. the technical characteristics of media.
Kay [13] reviewed the evolution of computer medium
from the 1970s and its direct influence in the meaning of
computer literacy. He argued that computer literacy has
developed from computer awareness in the 1970s to the
writing of computer programs in the 1980s. With the
rapid technological development, particularly the
abundance of user-friendly software, the notion of
computer literacy gradually evolved and referred to the
use of computer comprising a set of skills from
keyboarding, word processing, data management to
programming. There was also an emerging focus on
personal needs with regards to computer literacy, i.e. how
computers can help to achieve a specific goal.
Simple possession of computer literacy and computer
skills, however, is far from sufficient for participation in
life in the 21st
century. As some researchers e.g. Jenkins
[11] and Lankshear & Knobel [15] suggested, the new
215
Proceedings of The 4th International Multi-Conference on Society, Cybernetics and Informatics (IMSCI 2010)
media technologies is bringing about a convergence
culture featured by the active participation and arising
influence of online media users. The notion of computer
literacy, thus, should evolve to accommodate the new
requirements and incorporate the two important elements
of criticality and prosumption. New media has provided a
platform for various voice, values, ideologies to co-exist.
Therefore, criticality develops the media users into a
person who is capable of forming his/her ideas and
opinion based on the various source of media messages.
It also makes him/her a refined and open-minded media
prosumer, who understands that he/she is constructing
and publicizing an interpretation and there is an ample
space for further refinement through co-construction of
understanding in a community.
4. SUMMARY
In this paper, we first revisit the notion of medium being
the message and unpack the technical and socio-cultural
characteristics of new media. We argue that the new
media technologies have required the media users to
become a critical media prosumer. We propose a
framework to further explain the development of media
literacy in the two continuums from functionality to
criticality and from consumption to prosumption.
Lankshear and Knobel [15] suggested that the new
technology is turning the consumption of popular culture
into active production. User agency in media production
and circulation of the media production in the online
space are emerging as new dimensions of literacy studies.
Online participation and online civic engagement [28] is
also encouraging the emergence of self-actualizing
citizenship [3] [35]. It,
thus, becomes imperative to develop the necessary
production and participation. Critical prosuming media
literacy is a key element in the life of 21st
century.
Through this review, we wish to inform and encourage
more studies in areas such as online social-networking
sites, collective intelligence in online communities and
civic engagement.
5. REFERENCES
[1] S. Anderson, and A. Balsamo, "A Pedagogy for
Original Synners", in Digital Youth,
Innovation, and the Unexpected, T.
McPherson, Ed., Massachusetts: The MIT Press,
2008, pp. 241-259.
[2] P. Aufderheide, and C. Firestone, Media
Literacy: A Report of the National
Leadership Conference on Media Literacy.
Queenstow, MD: Aspen Institute, 1993.
[3] W. L. Bennett, "Changing Citizenship in the
Digital Age", in Civil Life Online, W. L.
Bennett, Ed., Cambridge, MA: MIT Press, 2008,
pp. 1-24.
[4] A. Blau, "The Future of Independent Media",
Deeper News, Vol. 10, 2004.
[5] D. Buckingham, Media Education: Literacy,
Learning and Contemporary Culture.
Cambridge: Polity Press, 2003.
[6] C. E. Cortés, "How the Media Teach", in Media
Literacy: Transforming Curriculum and
Teaching, G. Schwarz, and P. U. Brown, Eds.,
Massachusetts: Blackwell Publishing Malden,
2005, pp. 55-73.
[7] J. D. Frechette, "Critical Thinking for the
Cyberage ", in Media Literacy: Transforming
Curriculum and Teaching, G. Schwarz, and P.
U. Brown, Eds., Massachusetts: Blackwell
Publishing Malden, 2005, pp. 100-118.
[8] J. P. Gee, "New Times and New Literacies:
Themes for a Changing World", in Learning
for the Future: Proceedings of the Learning
Conference 2001, B. Cope, and M. Kalantzis,
Eds., Melbourne, Australia: Common Ground,
July, 2001, pp. 3-36.
[9] S. Goodman, "The Practice and Principles of
Teaching Critical Literacy at the Educational
Video Center", in Media Literacy:
Transforming Curriculum and Teaching, G.
Schwarz, and P. U. Brown, Eds., Massachusetts:
Blackwell Publishing Malden, 2005, pp. 206-
228.
[10] M. Ito, et al. Living and Learning with New
Media: Summary of Findings from the
Digital Youth Project, Nov, 2008, Available:
http://www.macfound.org/atf/cf/%7BB0386CE3
-8B29-4162-8098-
E466FB856794%7D/DML_ETHNOG_WHITE
PAPER.PDF, [Accessed: Dec. 1, 2008].
[11] H. Jenkins, Convergence Culture: Where Old
and New Media Collide. NY: New York
University Press, 2006.
[12] T. Jolls, Literacy for the 21st Century: An
Overview & Orientation Guide to Media
Literacy Education (2nd Ed), 2008, Available:
http://www.medialit.org/pdf/mlk/01a_mlkorient
ation_rev2.pdf, [ Accessed Dec. 1, 2008].
[13] R. Kay, "The Computer Literacy Potpourri: A
Review of Literature, or Mcluhan Revisited",
Journal of Research on Computing in
Education, Vol. 24, No. 4, 1992, pp. 446-456.
[14] D. Kellner, "New Technologies/New Literacies:
Reconstructing Education for the New
Millennium", Teaching Education, Vol. 11, No.
3, 2000, pp. 245-265.
[15] C. Lankshear,
In New Literacies ", in A New Literacies
Sampler, M. Knobel, and C. Lankshear, Eds.,
NY: Peter Lang Publishing, 2007, pp. 1-24.
[16] L. A. Lievrouw, and S. Livingstone,
"Introduction to the First Edition (2002): The
Social Shaping and Consequences of ICTs.", in
Handbook of New Media: Social Shaping and
216
Proceedings of The 4th International Multi-Conference on Society, Cybernetics and Informatics (IMSCI 2010)

Social Consequences of ICTs, L. A. Lievrouw,
and S. Livingstone, Eds., 2nd
ed, London: Sage,
2006, pp. 15-32.
[17] S. Livingstone, "Internet Literacy: Young
People's Negotiation of New Online
Opportunities ", in Digital Youth, Innovation,
and the Unexpected, T. McPherson, Ed.,
Massachusetts: The MIT Press, 2008, pp. 101-
122.
[18] A. Luke, "Critical Literacy in Australia",
Journal of Adolescent and Adult Literacy,
Vol. 43, No. 5, 2000, pp. 448-461.
[19] L. Manovich, The Language of New Media,
Massachusetts: The MIT press, 2001.
[20] M. McLuhan, Understanding Media: The
Extensions of Man. London: Routledge, 2001.
[21] T. Newby, D. Stepich, J. Lehman, and J. Russell,
Instructional Technology for Teaching and
Learning: Designing Instruction, Integrating
Computers, and Using Media, Upper Saddle
River, NJ: Merrill, 2000.
[22] R. E. Nichols, "Kind of Like Emerging from the
Shadows: Adolescent Girls as Multiliteracy
Pedagogues ", in Media, Learning, and Sites of
Possibility, M. L. Hill, and L. Vasudevan, Eds.,
New York: Peter Lang Publishing, 2008, pp.
119-156.
[23] T. O'Reilly. What Is Web 2.0: Design Patterns
and Business Models for the Next Generation
of Software, 2005, Available:
http://www.oreillynet.com/lpt/a/6228, [Accessed:
June. 1, 2008].
[24] K. A. Peppler and Y. B. Kafai, "From Supergoo
to Scratch: Exploring Creative Digital Media
Production in Informal Learning", Learning,
Media, & Technology, Vol. 32, No. 2, 2007, pp.
149-166.
[25] D. H. Pink, Folksonomy, Dec, 2005, Available:
http://www.nytimes.com/2005/12/11/magazine/
11ideas1-21.html, [Accessed: Dec. 1, 2008].
[26] A. Pratt, "New Media, the New Economy and
New Spaces", Geoforum, Vol. 31, No. 4, pp.
425-436, 2000.
[27] J. J. Pungente, B. Duncan, & N. Andersen, "The
Canadian Experience: Leading the Way", in
Media Literacy: Transforming Curriculum
and Teaching, G. Schwarz and P. U. Brown,
Eds., Massachusetts: Blackwell Publishing
Malden, 2005, pp. 140-160.
[28] H. Rheingold, "Using Participatory Media and
Public Voice to Encourage Civic Engagement",
in Civic Life Online, W. L. Bennett, Ed.,
Massachusetts: The MIT Press, 2008, pp. 97-
118.
[29] R. Rice, The New Media: Communication,
Research and Technology. Beverly Hills, CA:
Sage, 1984.
[30]
Studies: Critical Approaches to Literacy in
Theory and Practice", Current Issues in
Comparative Education, Vol. 5, No.2, 2003,
pp. 77-91.
[31] E. Thoman and T. Jolls, "Media Literacy
Education: Lessons from the Center for Media
Literacy", in Media Literacy: Transforming
Curriculum and Teaching, G. Schwarz and P.
U. Brown, Eds., Massachusetts: Blackwell
Publishing Malden, 2005, pp. 180-205.
[32] E. Thoman, and T. Jolls, Literacy for the 21st
Century: An Overview & Orientation Guide
to Media Literacy Education, 2005, Available:
http://www.medialit.org/pdf/mlk/01_MLKorient
ation.pdf, [ Accessed Dec. 1, 2008].
[33] A. Toffler, The Third Wave. New York:
Morrow, 1980.
[34] Universitat Autònoma de Barcelona. Studies on
the Current Trends and Approaches to
Media Literacy in Europe, 2007, Available:
http://ec.europa.eu/avpolicy/media_literacy/docs
/studies/study.pdf, [ Accessed Dec. 1, 2008].
[35] R. Van Bavel, Punie, Y., Burgelman, J. C.,
Tuomi, I., & Clements, B., "ICTs and Social
Capital in the Knowledge Society Technical
Report Series, Eur 21064, Seville: IPTS, 2004.
217
Proceedings of The 4th International Multi-Conference on Society, Cybernetics and Informatics (IMSCI 2010)

Supporting an Innovative Curriculum in a Traditional HE Environment
Developing a winning strategy to support change at Staffordshire University
Author: Fleur Corfield
Abstract Universities have a recognised need to react to a changing environment, from changes in the economy to government initiatives with a focus on widening participation. There is acknowledged need for them to adapt to changing environment by taking a new approach to course/ product development. Staffordshire University has embraced this changing environment, developing a strategy to support the changing nature of Curriculum Design, by using a project called Enable (JISC Funded 2008 - 2012). The University is focused on how it can manage this change, including using a holistic Enterprise Architecture approach to model Curriculum Design as it is now, and how it wishes it to be. The models will act as a strategic roadmap for the transformation of the University’s approach to Curriculum Design encompassing business processes but also the information and IT that supports them. This paper focuses on how Staffordshire University has investigated private sector strategies and applied them to HE, it mentions the challenges that have been considered and the opportunities HE has to move to more agile management. The paper ends by discussing the pilot of an executive programme office for the University and its perceived benefits.
Introduction The challenges presented by an uncertain global economic climate, coupled with a
need recognised by government to widen participation in HE requires universities to take a new approach to course/ product development. This is acknowledged at Staffordshire University as part of the University Plan [1].
There has been, up to this point, limited supporting literature of strategies to support managing change within HE institutions, and as such, much of this paper focuses on strategies from the private sector and how they can be applied to HE institutions. Fortunately the private sector has been working on supporting agility in business practice and HE can capitalise on the lessons learnt and use identified good practice to review its own business position.
Although neither Enterprise Architecture nor programme management are original it is considered that their combined implementation in HE does constitute an innovative development, and indeed, the combination of the two has not been an obvious choice for the HE sector. This paper is designed to support institutions facing similar problems with managing their curriculum within a changing environment.
Challenges to HE Feedback from work done by JISC [2] around strategic issues has highlighted that time is often wasted in organisations due to lack of standardised processes, external legislation and poor internal communication. The survey in question showed that where respondents recognised the above issues, they felt them to be outside of their control, under- estimated, or that the right staff were excluded from the strategic planning stage. Other challenges around communication are in part due to the decentralisation and heterogeneity of different departments and their funding.
One method of change is Business Process Re-engineering (BPR) which links to managerial, group and individual continuous improvement (Child et al [3]). Hammer [4] states that improvements can only occur using BPR methods that strive to move away from the old business rules. Child places Business Re-engineering at
218
Proceedings of The 4th International Multi-Conference on Society, Cybernetics and Informatics (IMSCI 2010)

strategic level, as radical change with high end risks. Allen and Fifield [5] discuss Re-engineering in HE, and conclude that staff engagement is an important factor in supporting change, although this also depends on alignment with existing culture.
Gioia and Thomas [6] recognised in 1996 that one of the biggest challenges that universities have to face is that their traditionally slow approach to change is no longer viable. Universities can also face the challenge of dealing with long service employees, who can have deeply entrenched behavioural and professional culture, which can impede the needed change for the organisation (Cunningham and Kempling [7], Allen and Fifield [5]).
A main issue for Higher Education Institutions (HEIs) looking at supporting change and innovation is the fact that they are traditionally used to a slow, incremental, change environment. Incremental change can cause adaptation, rather than transformation of systems, and often result in stopping an institution being able to handle discontinuous change with cultural inertia (Tushman and O’Reilly [8]).
Whilst incremental change can be useful it should be used in conjunction with revolutionary change to enable the institution to be able to both increase the alignment “among strategy, structure, culture, and processes” and at the same time prepare for “revolutions required from discontinuous environmental change” (Tushman and O’Reilly). The Enterprise Architecture approach encourages planning incremental changes that will result in transformational change across the organisation (Ross & Robertson [9]).
Opportunities for HE In today’s environment HEIs have had to become more agile in their approach to business, due to the changing nature of the learner, the changing economic drivers and the added ability for Further Education institutions to deliver HE awards. As such it needs flexible and responsive management, rather than continuing to use older, more traditional, management approaches (Allen and Fifield). This change also needs to encompass the need to
support flexible access to information and to adapt to the emergence of new technologies.
Staffordshire University’s Strategic Plan includes a clear focus on developing its work with partnerships and networks, along with the development of a University Quarter in the city where its main campus resides. This change to looking at external relationships, and non traditional learners, means that it presents an opportunity to take advantage of implementing a new strategy for managing this change.
Strategic Management, Change and Communication Quinn [10] mentions that when managing Strategic Change in large organisations it is not advisable to pick one particular approach, rather a blended approach should be taken. For the purpose of this paper a few of these approaches will be reviewed, along with the model chosen for Staffordshire University, and the Enable project [11]. The University has embraced this unrivalled opportunity to change how it operates to include the work of Enable, and EA modelling.
The use of 9 principles for change in organisations with strong cultural norms, is raised by Cunningham and Kempling. They highlight employee engagement as important for successful change. The first of these principles is around setting up a guiding coalition, consisting of a committed leadership team, working groups and committees. The questions around this principle and others in their paper map closely to the idea of setting up of a P3M3 [12] approach, including identifying the right people, the communication methods (setting up groups and how often they should meet), articulating outcomes, and a process for implementing planning.
The view of “strong cultural norms” is clear within Staffordshire University where interviews have shown deeply embedded behaviour that has been difficult to change in the past. Staffordshire University has a track record of innovation, however it is also recognised that they are less good at sustaining that innovation beyond small pockets of staff. Cunningham and Kempling go on to talk about the
219
Proceedings of The 4th International Multi-Conference on Society, Cybernetics and Informatics (IMSCI 2010)

experience of the municipality of Saanich, where “Theme Teams” were created to manage inter-department silos. These “Theme Teams” can easily be matched to a “programme” within P3M3.
Kachaner and Deimler look at three reinforcing dimensions: time horizon, thinking, and engagement. These dimensions should reinforce each other and fit with some of the practice already taking place in the university, in particular time horizon, (mainly at strategic level), and thinking (mainly at project level). In the third dimension, engagement, there is a clear cross over of levels. However, it is important to think about applying all dimensions across the levels, for example scenarios (thinking) can work at all levels of an organisation. Engagement has the clearest link with the P3M3 approach with the creation of a strategy panel, however although Kachaner and Deimler talk about rolling out themes, and passing information to the relevant teams they are unclear on how the management of work is sustained once the topics have been raised. This is where the P3M3 approach could be used, along with alignment to their forums.
Staffordshire University Approach As part of this changing environment it is clear that there is a requirement to develop a strategy to support the changing nature of Curriculum Design. There is a project aimed at addressing this at Staffordshire University called Enable. This project is a university initiative but has been funded through the JISC e-Learning Programme [14]. The project is focused on how the university can manage this change and is using a holistic Enterprise Architecture [15] approach to model Curriculum Design as it is now, and how the University would wish it to be. The models will act as a strategic roadmap for the transformation of the University’s approach to Curriculum Design encompassing not only the relevant business processes but also the information and IT that supports them.
The Enable project team has interviewed numerous staff and this has resulted in clear evidence that although some aspects of Strategic Management, including
considering external influences to the University, are handled well in the University (Rollason [16]) it appears that other aspects are less successful, especially when looking at fostering co-ordination and awareness of internal factors. This understanding of university resources, and whether they can be exploited in an advantageous way, is the Resource Based View (RBV). It is important to understand that the RBV should be embedded into the existing approach, rather than as a substitution. This integration of RBV and the existing strategy methods, has not been easy, and has resulted in a change in management of projects within the university, but this has been seen as essential (De Toni and Tonchia [17]). As part of this the project has been using Enterprise Architecture (EA) to model different aspects of Curriculum Design and Development, due to the scope of EA there has been a focus on course information.
Interviews with members of staff in the university revealed a lack of awareness of the strategic management of Curriculum Design and Development, and of understanding how their own work links to the University Plan. Staff were also unclear as to the impact their work would have within the university as a whole and where stakeholders should be involved. In some cases, where projects are in place to improve processes, those involved have little understanding of where they fit from a strategic perspective.
The Enable project team needed to find a workable solution to the issues, and reviewed the models mentioned. The P3M3 model was chosen as the focus point, using the idea of Portfolios and Programmes to support the Strategic Planning within the university. This included the need for an Enterprise Programme Office, and the engagement not only of the executive staff and senior management but also project managers. This enables them to view the strategy behind the work they are doing. This solution embeds existing practice in the university and has real world parallels, including the NASA Education Strategic Coordination Framework [18].
220
Proceedings of The 4th International Multi-Conference on Society, Cybernetics and Informatics (IMSCI 2010)

Figure 1 The P3M3 Model to support change
In figure 1 it can be seen that communication comes down from the strategy and goes up from the work done at project level. These managed communication channels will enable internal work to become equal influencers of strategy along with external influencers. As part of these communication channels, staff at all levels will become more familiar with the university plan and their impact on it. As other authors have stated, including Luss and Nyce [19] in the Watson Wyatt Study, communication is the key to employee engagement.
Employee engagement is important to ensure that employees are not alienated by change, which can lead to slow adoption and even sabotage (Roos and Bruss [20]). Engagement is a powerful tool, it can make staff feel empowered, and ensure enterprise level changes can be implemented successfully as employees will feel they have ownership of the change (Dean [21]). Due to Enable this engagement has been managed at project level with higher engagement with stakeholders than in previous project work. This engagement has been encouraged by the Enterprise Programme Office approach by helping project managers identify staff who will be affected impacted by the work they are undertaking, for some this is a huge cultural change in behaviour where project work would be done in isolation to other services or faculties.
Methods for developing communication channels have been included in the setting up of the Enterprise Programme Office (EPO). The EPO is being created to not only support communication but to bridge the gap between strategy and on the ground projects. The Enable modelling work is designed, by digging deeper, to
identify the core problems and produce a more fundamental transformation in curriculum design. With the EPO approach projects are being developed that are around supporting systems that facilitate flexible curriculum development and assist staff through the process of CDD. With feedback built in to the EPO it is possible to manage strategic refinements, allowing them to take place and insuring managers know whether the strategy is working or not, and why (Kaplan and Norton [22]).
Conclusion As part of the EPO approach, adopted for CDD, the models created by Enable will continue to be developed and used to understand the impact of any new project on existing initiatives, and the actual benefit of the changes to the university. Enable envisions the EPO as a way to align initiatives towards a common goal and vision for the institution. It will be able to look at quick wins and longer term action plans and inform Executive of changes required to achieve them. As a part to this work Enable have created a project register, which sits beyond those projects raised by the executive but impact on the work in the University and is involved with the coordination of initiatives at a programme level.
Achievements from the Enable project, and the EPO approach include:
• Informing the Distance Learning Review about Academic Planning Review to ensure no overlap (saving time and effort)
• Ensuring CRM considered interoperability in its services, allowing for information to be used outside of the CRM system which gives greater flexibility for the future.
• Engaged with the Quality Review, including implementation of solutions.
• Enabled project managers to recognise lack of engagement with stakeholders to ensure systems were not embedded without understanding user requirements,
221
Proceedings of The 4th International Multi-Conference on Society, Cybernetics and Informatics (IMSCI 2010)

therefore stopping work from having to be done twice.
• Raised important issues impacting on project outputs with senior management – including pushing an IDM review.
The author would like to thank Professor Mark Stiles for his help on this paper.
References [1] Staffordshire University Plan,
(2007), 2007 – 2012 http://www.staffs.ac.uk/assets/university_plan_2007_2012_tcm44-4257.pdf
[2] JISC, (2008), Strategic Issues, http://www.jiscinfonet.ac.uk/strategy-planning/survey-results
[3] Child, S.J., Maull, R.S., Bennet, J., (1994), Frameworks for Understanding Business Process Re-engineering, International Journal of Operations & Production Management, 14, 12, p22-34
[4] Hammer, M., (1990),Reeingeering Work: Don’t Automat, Obliterate, Harvard Business Review, July – August, p104 - 112
[5] Allen, D.K. & Fifield, N., (1999), Re-engineering change in higher education, Information Research, 4(3) Available at: http://informationr.net/ir/4-3/paper56.html
[6] Gioia D. and Thomas, J., (1996), Identity, Image, and Issue Interpretation: Sense Making During Strategic Change in Academia, Administrative Science Quarterly, 41, 3, p370 - 403
[7] Cunningham, J. and Kempling, J., (2009), Implementing Change in Public Sector Organisations, Management Decision, 47, 2, p330 – 44
[8] Tushman and O’Reilly, (2006), Ambidextrous Organisations: Managing Evolutionary and Revolutionary Change In Mayle, D., Managing Innovation and Change, p170-84, SAGE
[9] Ross, J. W. Weill, P. Robertson, D. C., (2006), Enterprise Architecture as Strategy: Creating a Foundation for Business Execution. Harvard Business School Press, Boston
[10] Quinn, B. J., (1993), Managing Strategic Change, In Mabey, C., Mayon-White, B., Mayon-White, W. M., Managing Change, p65-84, SAGE
[11] http://projects.staffs.ac.uk/enable and http://jiscenable.blogspot.com
[12] http://www.p3m3-officialsite.com/home/home.asp
[13] Kachaner, N. and Deimler, M., (2008), How leading companies are stretching their strategy, Strategy and Leadership, 36, 4, p40-43
[14] http://www.jisc.ac.uk/whatwedo/programmes/elearning/curriculumdesign.aspx
[15] http://eacoe.org/index2.shtml
[16] Rollason L., (2009), Strategic Leadership and Planning.
[17] De Toni, A. and Tonchia, S., (2003), Strategic planning and firms’ competencies: Traditional Approaches and new perspectives, International Journal of Operations and Production Management, 23, 9, p947 - 76
[18] NASA, (2006), Education Strategic Coordination Framework: A portfolio approach, www.nasa.gov
[19] Luss, R., and Nyce, S., (2004), Connecting Organizational Communication to Financial Performance, Waston and Wyatt, http://www.watsonwyatt.com/
[20] Roos, H. and Bruss, L., (1994), Human and organizational issues, In White, T. E., Fischer, L. (eds) New Tools for New Times: The Workflow Paradigm, p85-99, Future Strategies
[21] Dean, A. M., (2000),Managing Change Initiatives: JIT Delivers but BPR Fails, Knowledge and Process Management, 7, 1, p11-19
[22] Kaplan, S. R. and Norton, P. N., (2006), Using the Balanced
222
Proceedings of The 4th International Multi-Conference on Society, Cybernetics and Informatics (IMSCI 2010)

Scorecard as a Strategic Management System, Harvard Business Review, January, http://portal.sfusd.edu/data/strategicplan/Harvard%20Business%20Review%0article%20BSC.pdf
223
Proceedings of The 4th International Multi-Conference on Society, Cybernetics and Informatics (IMSCI 2010)

Example Of A Lifelong Learning Programme: The Summer School In The Bologna
Apennine
Massimo Gherardi, Gilmo Vianello, Livia Vittori Antisari, Nicoletta Zamboni
CSSAS, DISTA, Facoltà di Agraria, Università di Bologna, Via Fanin 409 – 40127 Bologna
Tel: +39 051.2096232 Fax: +39 051.2096203 E-mail: [email protected], [email protected], [email protected], [email protected]
ABSTRACT
The Summer schools are international graduated courses organized by the University of Bologna, that may last from one to four weeks and they normally take place in summer, mostly outside of traditional academic structures. The CSSAS (Soil Study Center) in 2007 has organized the 1st Summer school edition entitled “Recreational and touristic itinerary planning in a mountain agro ecosystem of particular historical, archaeological and environmental interest”, in English and Italian language, that awards a certificate of attendance equivalent to 3 ECTS credits recognised by the University of Bologna. The school aims to provide new tools to understand and interpret in a recreational and touristic way the environmental, historical and cultural amenities of the agro-forest landscape of the Savena, Idice and Sillaro valleys, in the central-east Italian Apennine in Bologna province. This specific area, that was described for its beauty by J.W. Goethe in 1876 and by M. de Montaignein 1580-1581, is extended trough Loiano, Monghidoro, Monterenzio and Monzuno communes. The area is characterized by one of the most complex geology of the north Italian Apennine and its multiplicity of agricultural and ecological peculiarity; it is rich in history, culture, archaeological sites and museums. Modern cartography, aerolphotogrammetry, remote sensing, Geographic Information System (GIS) and Global Positioning System (GPS) are some of the instruments and technologies used to construct itinerary with a multidisciplinary approach that involved academic and professional teachers of many subjects. The school was supported by Austrian and Hungherian international partners (Insitut für Bodenforschung UNIVERSITATE FUER BODENKULTUR WIEN and EÖTVÖS-LORÁND-UNIVERSITÄT – BUDAPEST) as well as Italian (Bologna Observatory – Telescope of Loiano, Soil Science Italian Society (SISS), Council for the Research in Agriculture (CRA)). The didactic programme developed for 80 hours, divided in 32 classroom lessons, 36 practical classes and 12 workshops.
Keywords: Geographical Information System (GIS), student’s programme exchange, environmental study, touristic itinerary, multidisciplinary approach
1. THE AIMS
1.1 Aims and objectives
The project aims to provide participants with the cognitive tools for constructing agritourist itineraries serving to promote interest in the territories characterizing the upper Savena, Idice and Sillaro river valleys. The principal aim is to design a basic product characterized by cartographic and remote sensing image based representations on three-dimensional digital media, linked to hypertexts referring to georeferenced locations and manmade landmarks. At the same time it should be a flexible tool permitting users to plan out dedicated itineraries on different occasions and to personalize and enrich the existing database with pictures, drawings and notes. The planning of itineraries is dedicated to the mountain communities of the Bologna province, with a particular focus on routes linking places between Emilia and Tuscany (for example, trails along the ridges of the Santerno, Idice, Sillaro and Savena river valleys and along the historical Futa highway), so as to highlight the environmental characteristics, landscape aspects, historical and cultural landmarks, the quality of typical and organic food products, the level of hospitality and the type of services offered.
1.2 Contribution to Erasmus policy
The initiative to involve public and private organizations in a new approach to tourism - one that not only focuses on and advertises the quality of hospitality, but also provides cultural offerings
224
Proceedings of The 4th International Multi-Conference on Society, Cybernetics and Informatics (IMSCI 2010)

that can make a stay in mountain and hillside locations more appealing - is aimed at promoting the locations proposed for the project taking into account similar experiences in other European Community countries. It applies Geographic information systems (GIS) to develop a successful integration of different elements: physical representation of the territory, landscape aspects, environmental and historical-archaeological features, types of land use and town development, different degrees of accessibility and available hospitality facilities. The final hypertextual and interactive product is obtained by combining modern aerial photography and satellite representation techniques with different thematic surveys using dedicated software. This course is open to any international Graduate students, preferably with a background in Agricultural, Development Studies, Environmental or Geological Sciences. The participants will be aiming at careers requiring competence in managing and planning agricultural, environmental and rural systems at various levels in local and national governmental, as well as non-governmental organizations. Using the information acquired, each participant is invited to prepare a paper proposing an itinerary that takes account of the peculiarities of the territories crossed and includes a specific evaluation of hospitality locations, with reference in particular to agritourism, recreational and food service and restaurant facilities. The paper is spread by Bologna university website, Cd or DVD creation and brochure.
2. ENVISAGED OUTPUTS
The investigated area also displays a wealth of historical and cultural land marks such as the archaeological sites of former Etruscan and Celtic settlements. A significant portion of time has to be dedicated to the study of "geopedological and naturalistic-cultural itineraries" with the aid of cartographic, photogrammetric and remote sensing documentation, as well as ad hoc thematic maps representing areas of the valleys concerned. Against a geolithological and environmental thematic backdrop, this will serve to convey the extreme complexity and variability of the environments involved to those attending the
course. A diversity that will be further explored through "windows" dedicated to soils, which, in relation to the different action of pedogenetic factors (climate, vegetation, lithology, morphology, antrophic action), have formed and evolved there over time. The aspect of human settlement and land use will also be considered, starting from the observation of how they fit into the environmental context; particular attention will be focused on the important archaeological sites of Monte Bibele and Monterenzio, a source of important findings providing a considerable amount of information about the period between the first half of the 4th century and the late 3rd - early 2nd century B.C., an epoch falling between the height of Etruscan civilization and the Roman occupation of the Po Valley region.
3. PLANNING OF ACTIVITIES
The interdisciplinary structure of the project is developed over a number of stages, so as to arrive at the definition of new itineraries embracing environmental traits and historical signs of the human presence and providing insight into the systems of land use and town development, production activities and cultural heritage of local communities. Specifically this is entail: - reconstruction of the morphological structure and
network of watercourses and structures connected to them Graphic - cartographic representation of the morphological structure of the territory in a three-dimensional model and analysis of the network of surface watercourses, possibly with a hierarchization into rivers, streams and canals. Location of waterworks and constructions (bridges, dykes, sewers, mills connected to surface watercourses and a comparison between the present-day situation and any available documentation of the past). Evaluation of the chemical and biochemical quality of surface water.
- optimisation and protection of mineraI and thermal water
Location of springs and sources and evaluation of the chemical and biochemical quality of the water originating from them. Local thermalism and its implications for human physical and mental well-being: evaluation of medium-term development trends.
- drawing up of street directories based on semi-detailed maps
225
Proceedings of The 4th International Multi-Conference on Society, Cybernetics and Informatics (IMSCI 2010)

1:25000 scale maps is used to derive the street toponymy of the principal towns and representations of recently developed urban areas will be updated as necessary using photogrammetric tools; in the latter case, this will involve delineating new roads and the residential buildings or production facilities connected to them.
- identification and study of the pIace namesPreparation of a small toponymic glossary which must include the names of places and streets in urban centres and a brief description of their origin and meaning.
- surveying, georeferencing and description of cultural property
Location of the cultural property present across the territory and in urban centres, particularly in the historical centres of the principal towns
- surveying of natural land marks and planning of tourist-cultural itineraries Planning of itineraries with different cultural themes either in town centres and built-up areas or outside them, significant for their cultural and environmental features. This simultaneously involves designing tourist brochures that take into account different modes of access (e.g.: by car, by mountain bike, on horseback, on foot).
- mapping of places characterized by the presence of artisan workshops and handicraft centres (e.g.: stonework, woodwork, ironwork, earthenware and terracotta, textiles) or activities tied to preparation of typical food products (e.g.: bread, chestnuts, truffles, mushrooms, wild berries, wine), as well as an indication of tourism accomodation.
4. THE PARTNERS AND THE TEACHERS
The different stage of the project is managed in accordance with the partners and each phases is discussed and evaluated continuously in order to improve, and modify if necessary, the program. For the project fulfillment it is also necessary the support of local institution (Loiano, Monghidoro, Monzuno and Monterenzio Communes involved in the study area), that consider this initiative a powerful tool to reinforce the development of touristic and recreational amenities of their territory, nowadays poorly considered and not so valorized. They contribute to the project budget providing facilities for students, classrooms and gets them to the local festival and didactical activity. Due to the interdisciplinary approach the project involved a team of expert in different sector:
- environment and soil science (CSSAS and BOKU partner);
- archaeology (HUN partner and Prof. Vitali, expert of this particular rich of history environment);
- an expert of local geology and of morphological structure and network of watercourses (Dott.S.Cremonini);
- an expert in the description and evaluation of historical and modern systems of land use and urban development (Arch. V.Degli Esposti).
5. THE ITINERARIES DEVELOPED DURING THE SUMMER SCHOOL
5.1 The morphologic itinerary
The morphological characterization is based on a Digital Elevation Model (DEM), that also shows the investigated Communes (Figure 1).
Fig. 1. The morphology of the study area
The analysis of the environmental characteristics represents the preliminary stage preceding the recreational and touristic itinerary planning. As seen in the figure 1, the study area is characterized by significant geomorphological variability, so that flora, fauna and forest components manifest a high degree of biodiversity trough the altimetrical zones. The students have seen vegetal specimens like beeches, oak-trees and cork-oaks. The students has come to know the mathildic chestnuts (figure 2), a typical local growing.
226
Proceedings of The 4th International Multi-Conference on Society, Cybernetics and Informatics (IMSCI 2010)

Fig. 2: An outdoor lesson among the mathildic chestnuts
5.2 The hydrological itinerary . The students, using GIS to know the hydrographic system, have also learned how to define water quality by law using the Extended Biotic Index (EBI) for the rivers (Idice, Sillaro, Santerno) flowing towards the valleys. By monitoring activities, they understand the water samples collection, the analytical and the quick methods and the main chemical, physical and microbiological water parameters. Then they applied the improving study analyzing the water themselves, using colorimetrical test (Figure 3).
Fig. 3. Quickly nitrate water testing
5.3 The energetic itinerary
The water availability and the river’s degree of the study area showed the students the watermill existence. They visited them, learning the hydraulic engine of the mill and the millstone power. From the water energy the students have seen the wind energy that is exploited by wind towers in an aeolic plant on top of the mountain.
The discovery of the energetic aspects have to be considered by students while they will plan recreational or touristic in the future in other areas because it has environmental implication that are more and more emphasized by the European Community.
5.4 The geolithological itinerary
The study area is very complex by a geolithologicalpoint of view, crashing the Emilia-Romagna Apennine against the Tuscany one. For this reason this kind of itinerary could be interesting for both researches and touristic people. The students were taken trough the territory to see and know the ophiolitic formation in claystone bed, the ophiolite of San Zenobi and the gabbri and serpentine presence. During this outdoor lessons the students applying the soil science opening and reading soil profiles by the teacher attending.
5.5 The archaeological itinerary
The study area, historical crossroad of different populations from the north (the ancient Bononia) to the south (Florentia and then Rome), presents many traces which are not so famous to the touristic journeys or not emphasized. Certainly they could represent a wealth for the communes involved, planning recreational and touristic itinerary for the socio-economical local development. Trough the Communes the students saw the historical and cultural land marks such as the archaeological sites of former Etruscan and Celtic settlements. They visited the Monte Bibele archaeological site, one of the most important in Europe for Celtic culture, discovered during ’60 by some hunters. They participated in the archaeological excavation of the ancient Monterenzio, where they also saw a warrior grave (Figure 4). The student group then attended the Fantini museum, which showed the Monte Bibele founds, learning more of the Celtic culture and tradition. Then the teachers showed the students the ancient streets, made of local rocks: the one from the romance Claterna to the Raticosa pass and the second one from Bononia to Fiesole towards Florentia. The students applied the cartography and the GIS geographical instruments drawing up of street directories based on semi-detailed maps.
227
Proceedings of The 4th International Multi-Conference on Society, Cybernetics and Informatics (IMSCI 2010)

Fig. 4. Partecipating in the archaeological excavation
5.6 The urban and folkloristic itinerary
The teachers explain to them the techniques of construction, the materials linked to the territorial traditions, the historical and cultural importance. Then the students learned the toponimy importance for a place name and Prepared a small toponymic glossary; for the main centres they compiled a brief description of their origin and meaning. Using aerial imagines and cartography, as tools and instruments for territorial analyses, the students learned to “read” the urban dynamics. The students improved the folklore and local culture living in contact with the citizens, tasting the typical dishes and participating in the local festivals, knowing the artisan workshops and handicraft centres and the preparation of typical food products.
6. CONCLUSIVE CONSIDERATIONS
The flexibility of the system proposed a tool, which enables thematic itineraries to be planned according to different needs and customizable criteria, places at the disposal of public and private organizations and which is capable of satisfying students, researchers and tourists in both a national and European context. The interdisciplinary structure of the project constitutes an effective educational and pedagogic tool, since it induces young people to seek cultural exchanges in order not only to compare different local realities in the broad and diversified geographic, political and ethnic context of the European Community, but also to identify shared historical and linguistic roots and common values in terms of socialization and the exchange of ideas.
Besides the many itineraries explained below, that are important to know the study area, the school aimed to provide new tools to understand and interpret the environmental, historical and cultural amenities an the agro-forest landscape. It have must been considered as a study methodology based on a multidisciplinary approach to promote a territory, underlying its wealth, as the vegetation, the archaeological settlement, the geolithological formation or anything else interesting. Attending the course the students learned how use the technological instruments for environmental and territorial analysis (GIS, cartography, GPS, remote sensing) and how put out the main aspects of an area. The student, at the end of the intensive school, applied the new knowledge to plan an own itinerary emphasizing a specific aspect of the study area. These result products (DVD creation, touristic maps, PowerPoint presentations..) have also economic opportunity and could be useful for local Communes, not really known as famous cities, to promote their territorial peculiarities and to attract people to visit them (for example to publish a map o to charge the DVD on the website). At last, the summer school also answer to the cultural exchange between teachers, students and citizen involved in the project. Summer school is an important lifelong learning programme, useful for foreign students but also for the teachers, meeting different culture and traditions. In particular this summer school met a great success and during the summer 2008 there has been the second edition.
7. REFERENCES
AA.VV., Basic cartography for students and
tecnhnicians, Vol. I-II, ICA, Ed. R.W. Anson, Elsevier Applied Science Publishers, London, 1984. AMATUCCI M., et AL., Territorio senza confini nel Sistema informativo scolastico, Franco Angeli Editore, Milano, 1999. AMADESI E., Atlante aerofotografico con esempi di
fotointepretazione, Pitagora Ed, Bologna, 1982. BALLESTRA G., BERTOZZI R., BUSCAROLI A., GHERARDI M., VIANELLO G., Applicazione dei
sistemi informativi geografici nella valutazione delle modificazioni ambientali e territoriali, Franco Angeli Editore, Milano, 1996. DEGLI ESPOSTI V., La lettura dei caratteri del
paesaggio attraverso la toponomastica, in “Scorci di paesaggio”, Bromurodargento, Bologna, 1993.
228
Proceedings of The 4th International Multi-Conference on Society, Cybernetics and Informatics (IMSCI 2010)

FRABBONI F., GAVIOLI G., VIANELLO G., Ambiente s’impara, Franco Angeli Editore, Milano, 1998. MASSA BONAFE’ P., Strumenti di lettura del
territorio a supporto della attività didattica: la cartografia e la foto aerea, La Didattica, Anno III, Giuseppe Laterza Editore, Bari, 1997. IGM, Segni convenzionali e norme sul loro
uso:cartografia alla scala 1:25.000 in nero e a colori, Firenze, 1963.
PELLEGRINI G.B., Toponomastica italiana, HOEPLI, 1994. ROY A. WEILCH, Il GPS costrusce la mappa, Sistema Terra, n. 2, 1995. VIANELLO G., MALAGOLI P., Cartografia e
fotointepretazione, CLUEB Edizioni, Bologna, 1981. VIANELLO G. Cartografia e telerilevamento: strumenti per la didattica e la ricerca, La Didattica, Anno II, Giuseppe Laterza Editore, Bari, 1996. VIANELLO G., Territorio senza confini, Notiziario CIDIEP, Anno I – n. 1, 1997.
229
Proceedings of The 4th International Multi-Conference on Society, Cybernetics and Informatics (IMSCI 2010)

University teachers’ conceptions and competencies about educational supports in an online
learning environment
Teresa GUASCH & Anna ESPASA
Department of Psychology and Education
eLearn Center
Open University of Catalonia
Rambla del Poblenou, 156, 08018 Barcelona
E-mail: [email protected]
ABSTRACT
It is widely shared that educational supports are indispensable in order to promote knowledge construction in the educational process. However, based on previous research, our hypothesis lies on the idea that teachers in an online environment understand the process of teaching and learning as an autonomous process in which the student -an adult - is able to learn without teacher or peer support. Within this framework the objectives of this research were: a) to identify teachers' conceptions about educational supports in a virtual environment (what teachers say they do to facilitate the learning process), b) to identify teachers' competencies in teaching and learning in a virtual environment and, c) to explore the relationship between teacher’s conceptions and competencies and their teaching discipline. The study was carried out in the Open University of Catalonia, a fully virtual university. An online questionnaire was administered to lecturers distributed in six different disciplines (N=696). Preliminary results show that teachers’ conceptions about educational supports are close to a transmission of knowledge. However they reported to be competent on planning and carrying out the online course. Finally, our research shows that the teaching discipline influences on both conceptions and competencies teachers have about teaching in an online environment.
Keywords: Conceptions, competencies, educational supports, online learning environments, Higher Education.
1. INTRODUCTION
Teaching is associated to a group of competencies in terms of giving support to the students, using communication and methodologies to promote learning, having expertise in a specific subject matter, but also displaying social competencies to build a community of practice, to promote interactions with students and between peers. There are many in-depth investigations that have defined teachers’ competencies in Higher Education. The same idea can be transferred when we focus on research about teachers’ perceptions about educational supports and their relation in the practice.
There is also a very long tradition of studies that explain their implication in the practice.
However, we identify that teaching in an online environment needs the study of specific tools. This statement does not mean that teaching in a face-to-face setting or in an online environment demands different competencies, but specific ones, because there are specific problems to cope with. As Garrison and Anderson [1] point, we intend to understand technology from an educational perspective, but not how technology mediates the teaching and learning process.
This study is based on a competency framework designed in previous studies [2] [3], which identify three roles to be played by an online teacher: first, the planning role, second, the pedagogical or instructional role, and third, the social role linked to the motivational aspects. Transversely to these roles, teachers in a virtual environment should have technological competencies, i.e. they must have competency in using technology for educational purposes and mastery of Management, i.e., they must have management skills applied to the learning process (e.g. information management, management of educational activity).
The present study focuses primarily on the planning and pedagogical functions, as we pay attention to the analysis of educational supports that the teacher provides to students with the aim of promoting the construction of knowledge and guiding the attainment of learning objectives. Within this function, teachers facilitate the planning, monitoring and organisation of the learning process. They provide supporting tools to enable interaction among students and with students concerning learning goals and assignments. Teachers plan the activities/supports that assist students in the acquisition of self-organisation and self-regulation skills. The activities and supports must explicitly scaffold the acquisition of these skills in specific contexts related to specific domains.
Some authors [4], [5], [6], [7] have studied the educational supports in an environment based on written and asynchronous communication. Specifically, McLoughlin notes that educational supports in online environments should promote reflective thought and provide opportunities for interaction between teachers
230
Proceedings of The 4th International Multi-Conference on Society, Cybernetics and Informatics (IMSCI 2010)

and students. McLoughlin and colleagues also understand that supports must be oriented to facilitate self-learning, self-evaluation by the student, flexibility to identify the learning strategy more appropriate to resolve each situation and should enable students to become aware of their own learning process.
Despite the expressed need found in the literature, teachers’ educational support is not very present in an online environment [8]. It is in this context that this study becomes more meaningful. Our hypothesis lies on the idea that teachers in an online environment understand the teaching and learning process as an autonomous process in which the student - an adult - is able to learn without the teacher’s support. We aim to identify the level of teacher competency to test whether the problem could be related to the lack of teacher’s competencies as an online educational professional (the teacher is often an expert in a field of knowledge, but not in didactic-pedagogic skills that allow him/her to know how to teach). From these hypotheses, the following are the three objectives of this research: - To identify teachers' conceptions about educational supports in a virtual environment (what teachers say they do to facilitate the learning process). - To identify teachers' competencies in teaching and learning in a virtual environment. - To explore the relationship between teacher’s conceptions and competencies and their teaching discipline.
2. CONTEXT
The study was carried out in the Open University of Catalonia. The communication is based on a virtual campus (written and asynchronous). This university is a fully virtual university since its foundation. Teaching and learning processes take place within virtual courses. In these courses there are three main communication spaces where the educational activity is carried out. Interaction between teacher and students (and among students themselves) is needed in order to construct knowledge and to progressively assimilate the learning objectives.
3. PARTICIPANTS
The participants were 696 university teachers from different disciplines (Economy, Law, Psychology, Computer Science, Education, and Politics). The distribution of the sample is presented in table I.
Table I Distribution of the participants Disciplines Frequencies %
Economy 313 45,0Law 139 20,0Psychology 99 14,2Computer Science 61 8,8Education 52 7,5Politics 15 2,2Others 17 2,4Total 696 100,0
There were 303 females (43.53%) and 393 males (56.46%). Their age ranged as follows: 19,5% were less than 35 years old. 76.3% were between 35 and 55 years old and 4.2% were more than 55 years old.
4. INSTRUMENTS
A questionnaire was designed to measure university teachers’ conceptions and competencies about educational supports in a specific setting such as an online environment, based on written and asynchronous communication.
The questionnaire was structured in three scales. The first one contained specific questions and different situations based on experiential learning theory [9]. According to this theory, the representation that the subject activates in a particular situation is determined by the experiential memory of this in situations with similar characteristics to those reflected in the cases. Different situations were designed to show the participants alternative models of knowledge. Through these situations the researchers were able to collect teachers’ thoughts and beliefs about educational supports.
This scale measured teachers’ conceptions. There were 14 items (e.g. “Virtual learning is mainly based on the students’ independent work”, “Students in a virtual environment are sufficiently self-organized”) (Cronbach’s = .67). These items were measured using a 5 point Likert scales (totally agree- totally disagree).
In the second part of the questionnaire we examined teachers’ competencies in teaching and learning in virtual environments. For this purpose, the competency framework defined in the European project Elene-TLC http://www.tlcentre.net/competencyFramework.cgi was adapted. This competency framework is based on a review of several studies on the development of competencies in online learning environments [10] [11] and through a study based on Focus Group techniques and expert-validated using the Delphi method.
To assess the competencies two scales were adopted: a scale that measures planning with items like “To design guidelines to learn” (Cronbach’s = .740) and a scale that measures development with items like “To promote collaboration among students” (Cronbach’s = .791). There were 6 items per scale.
A specific measurement was created based on both the conceptual and procedural knowledge teachers display when teaching in an online environment. The scale had five grades: a) I’m not familiar with…; b) I’m familiar with… but I didn’t know how to do it; c) I could do it but I need help; d) I could do it but I don’t do it and e) I can do it.
231
Proceedings of The 4th International Multi-Conference on Society, Cybernetics and Informatics (IMSCI 2010)

6. DATA ANALYSIS
In this exercise several kinds of measures had been calculated. First of all, we used the alpha Cronbach’s analysis [12] to consider the internal consistency of the components in the measurement of the scales. Secondly, the analysis of variance (ANOVA) had shown if the differences between the scores of the analyzed populations were significant, and finally the Pearson correlation was utilized to quantify the relationships between the conceptions and the competencies analyzed.
7. RESULTS
The objectives of this research will serve us to structure and present the results obtained.
University teachers’ conceptions about teaching and
learning in an online environment
Regarding teachers’ beliefs and perceptions about teaching and learning in an online environment, a profile of the teacher as a transmitter of knowledge was defined.
This profile (14 items) includes items like: “Marks are the most reliable mechanism of controlling learning” (43% agree and totally agree); “Virtual learning is mainly based on the students’ independent work” (57% agree and totally agree); “The student in a virtual environment is sufficiently self-organizing his/her own learning” (41% agree and totally agree); “a situation that shows how the teacher gives the correct solution to an activity and the students have to interpret how to improve it, without any other support from the teacher” (69% agree and totally agree). Frequencies and percentages are summarised in the table II.
Next, we analyzed this profile with other variables like: teaching disciplines (6 areas), teaching experience in a face-to-face environment, teaching experience in a virtual environment, ICT knowledge and number of students. The analysis of variance (ANOVA) had shown a significant relation with teaching disciplines and with ICT knowledge.
Concerning teaching disciplines, the results show differences in teachers’ conceptions about educational supports.
Specifically, the mean of teachers from Economics and Law is higher than the others (see table III). Therefore we could infer that teachers from Economics and Law disciplines are more akin to the idea that the teacher is an expert in content and responsible for transmitting knowledge.
Table III. Teachers’ conceptions in relation to their discipline
Disciplines Mean Freq. Standard
Deviation
Economics 2,82 313 0,379Psychology 2,60 99 0,40Education 2,56 52 0,34Law 2,80 139 0,44Politics 2,69 15 0,42ComputerScience
2,70 61 0,43
Others 2,62 17 0,40Total 2,75 696 0,41F(6,689)= 6,756 (p<0,001)
There are also significant differences between teachers’ conceptions about educational supports and their perceptions of their level of knowledge about ICT available in the virtual campus. University teachers that consider themselves as having very high knowledge of ICT are less identified with the concept of teacher as a transmitter of knowledge.
University teachers’ competencies in teaching and
learning in virtual environments
Below we present the results concerning the competencies university teachers need to have to teach in online learning environments. The results are structured in two dimensions: planning, which refers to the tasks lecturers do before starting the course and development, which refers to the tasks lecturers do when the course is in progress.
Table II. Summary of descriptive results about the scale of teachers’ conceptions (N=696) Totally disagree Disagree Not agree and not
disagreeAgree Totally agree
Items * Freq % Freq % Freq % Freq % Freq %
a) 12 1.72 208 29.88 178 25.57 270 38.79 28 4.09b) 22 3.16 186 26.72 97 13.93 320 45.97 71 10.2c) 10 1.43 228 32.75 174 25 252 36.2 32 4.59d) 12 1.72 97 13.93 112 16.09 333 47.84 142 20.4
*Items: a) Marks are the most reliable mechanism of controlling learning; b) Virtual learning is mainly based on the students’ independent work; c) The student in a virtual environment is sufficiently self-organizing his/her own learning; d) Summary of asituation: Teacher gives the correct solution to an activity and the students have to interpret how to improve it, without any other support from the teacher.
232
Proceedings of The 4th International Multi-Conference on Society, Cybernetics and Informatics (IMSCI 2010)

Table IV. Summary of descriptive results about the scale of the planning dimension (N=696) I’m not familiar
with…I’m familiar with… but I don’t know how to do it
I could do it but I need help
I could do it but I don’t do it
I do it
Items* Freq. % Freq. % Freq. % Freq. % Freq. %a) 8 1,14 14 2,01 106 15,22 64 9,19 504 72,41b) 19 2,72 17 3,87 134 19,25 60 8,62 456 65,51c) 13 1,86 24 3,44 155 22,27 62 8,9 442 63,5d) 6 0,86 9 1,29 132 18,96 73 10,48 476 68,39e) 9 1,29 9 1,29 144 20,68 89 12,78 445 63,93
*Items: a) To specify in the syllabus the feedback teacher’s going to give during the course; b) To organize virtual communication spaces to enhance the interaction among students; c) To design guidelines to learn; d) To consider the competencies students shoulddevelop, when planning the assignments; e) To select the most adequate methodology taking into account the learning objectives.
In terms of the planning dimension, the results show (see table IV) that most of the university teachers were able to do the actions we asked them. It is worth highlighting that nearly three quarters of the participants (72,41%) told us that in the syllabus they plan the feedback they are going to give in the course. Looking at other items in table IV, the results show around 60% of the participants reported planning the tasks we asked them. The results show that there are statistical differences between the planning dimension and the discipline (education, psychology, law, politics, computer science, economy). This means that the disciplines bear an influence on when lecturers develop planning competencies. Looking at table V, the mean in the Education discipline is the highest whilst Law and Economics have the lowest. The difference is not substantial but could be explained by the fact that professionals working in a field closer to education often have a natural sensitivity towards teaching methods.
Summing up the results obtained concerning the design dimension, we could claim that in general lecturers plan the supports they are going to give to the students during the course. These supports include feedback, guidelines, orientations about communication and methodologies. However, within the planning dimension there are differences between lecturers of different disciplines.
Table V. Competencies related to the planning dimension in relation to discipline
Disciplines Mean Freq. StandardDeviation
Economy 4,28 313 0,71Psychology 4,62 99 0,49Education 4,61 52 0,46Law 4,26 139 0,72Politics 4,50 15 0,43ComputerScience
4,51 61 0,69
Others 4,44 17 0,77Total 4,38 696 0,68F(6,689)= 5,695 (p<0,001)
Regarding the development dimension (table VI), the results show a high percentage of university teachers who carried out the tasks we asked them. Almost all the lecturers informed their students of the results they obtained (90,8%). This is not a very surprising result in the sense that lecturers must assess the assignments students do during the course. On the other hand, the lowest percentages referred to the extent to which lecturers use the tools offered both by a virtual environment and the internet itself (only 39,65% reported they integrated internet resources within the teaching and learning process and 38,64% use virtual campus tools for teaching).
Taking these results into account, we could claim that the implementation of educational resources into the teaching and learning process is a critical issue in online environments. This would imply that lecturers focus their teaching on traditional methodologies without implementing new resources like blogs, wikis, youtube… However we highlight the percentage (around 30%) of lecturers who reported they would use these resources and tools if they had support.
Going through the relationship between the development dimension and the discipline, the results obtained allow us to identify significant differences as well. From the results presented in table VII, we can observe that the mean of Education lecturers are the highest and the mean of Law and Economy lecturers is the lowest
Although there are no big differences between groups, as previously mentioned, the sensitivity that educators have when teaching seems evident, while other professionals are more focused on the discipline itself.
These results show that teachers’ conceptions about educational supports are close to a transmission of knowledge. However they reported to be competent on planning and carrying out the online course. Finally, our research shows that the teaching discipline influences on both conceptions and competencies teachers have about teaching in an online environment.
233
Proceedings of The 4th International Multi-Conference on Society, Cybernetics and Informatics (IMSCI 2010)

Table VI. Summary of descriptive results about the scale of development dimension (N=696) I’m not familiar
with…I’m familiar with… but I don’t know how to do it
I could do it but I need help
I could do it but I don’t do it
I do it
Items Freq. % Freq. % Freq. % Freq. % Freq. %a) 41 5,89 39 5,6 206 29,59 134 19,25 276 39,65b) 7 1 9 1,29 73 10,48 90 12,93 517 74,28c) 9 1,29 6 0,86 115 16,52 116 16,66 450 64,65d) 6 0,86 12 1,72 69 9,91 77 11,06 532 76,43e) 2 0,28 0 0 24 3,44 38 5,45 632 90,8f) 2 0,28 2 0,28 62 8,9 86 12,35 544 78,16g) 45 6,46 44 6,32 188 27,01 150 21,55 269 38,64
Items: a) To integrate internet resources (i.e. youtube, skype) within teaching and learning process; b) To promote collaboration among students (in the forum, or in teams); c) To promote student competencies about searching, organizing and analyzing information; d) To enhance communication between students and to encourage their participation in the course: e) To communicate to students the result of their assignments; f) To suggest complementary material in order to achieve the learning objectives; g) To use virtual campus tools for teaching (blogs, wikis…).
Table VII Competencies related with the development dimension in relation to discipline
Disciplines Mean Freq. Standard Deviation
Economy 4,30 313 0,57Psychology 4,60 99 0,48Education 4,57 52 0,39Law 4,33 132 0,53Politics 4,51 15 0,44ComputerScience
4,51 61 0,61
Others 4,50 17 0,47Total 4,38 696 0,54F(6,689)= 5,692 (p<0,001)
At the conference, we will present the results concerning the relations found between teachers’ perceptions about educational supports, and the level of competencies on how to teach in an online environment
To conclude, these results will not only be useful for the design of training proposals that seek to develop competencies in teaching and learning in this context, but also to help understand the mechanisms involved in the construction of a learning concept and its relation to the type of practice that is being encouraged.
5. REFERENCES
[1] Garrison & Anderson (2003). E-learning in the 21st
century: a framework for research and practice.London: Routledge Falmer.
[2] Álvarez, I.; Guasch, T. & Espasa, A. (2009). University teacher roles and competencies in online learning environments: a theoretical analysis of
teaching and learning practices. European Journal
of Teacher Education, 32-3, 321-336. [3] Guasch, T.; Álvarez, I. & Espasa, A. (2010).
University teacher competences in a virtual teaching/learning environment: Analysis of a teacher training experience. Teaching and Teacher Education, 26, 199-206.
[4] Thorpe, M. (2002). Rethinking learner support: The challenge of collaborative online learning. Open Learning, 17(2), 105-119.
[5] McLoughlin, C. (2002). Learner support in distance and networked learning environments: Ten dimensions for successful design. Distance
Education, 23(3), 149-162. [6] McLoughlin, C. & Marshall, L. (2000). Scaffolding:
A model for learner support in an online teaching environment. In A. Herrmann & M.M. Kulski (Eds.), Flexible Futures in Tertiary Teaching.
Proceedings of the 9th Annual Teaching Learning
Forum. Retrieved 09/09/2008 from Curtin University of Technology: http://lsn.curtin.edu.au/tlf/tlf2000/mcloughlin2.html
[7] Coll, C., Engel, A. & Bustos, A. (2009). Distributed Teaching Presence and Participants’ Activity Profiles: a theoretical approach to the structural analysis of Asynchronous Learning Networks. European Journal of Education, 44(4), 521-538.
[8] Espasa, A. & Meneses, J. (2010). Analysing feedback processes in an online teaching and learning environment: an exploratory study. Higher
Education. 59-3, 277-292. [9] Máiquez, M.L; Rodrigo, M.J.; Capote, C. &
Vermaes,I. (2000). Aprender en la vida cotidiana.
Barcelona: Visor. [10] Goodyear, P., G. Salmon, M. Spector, C. Steeples
& S. Tickner. (2001). Competence for online teaching: A special report. Educational Technological, Research and Development 49 (1), 65–72.
234
Proceedings of The 4th International Multi-Conference on Society, Cybernetics and Informatics (IMSCI 2010)

[11] Williams, P.E. (2003). Roles and competences for distance education programs in higher institutions. The American Journal of Distance Education 17(1), 45–57.
[12] Cronbach, L. (1951). Coefficient alpha and the internal structure of tests. Pshychometrika, 16, 297-334.
235
Proceedings of The 4th International Multi-Conference on Society, Cybernetics and Informatics (IMSCI 2010)

CONSTRUCTIVISM AND TEXTBOOK SETS AT ENVIRONMENTAL STUDIES
SUBJECT
Vlasta HUS
Faculty of Education, University of Maribor
Maribor, 2000, Slovenia
ABSTRACT
With the curricular modernization of the elementary
school in the Republic of Slovenia at the end of the
last century, the constructivist theory of learning
and teaching has become the main theory also at the
environmental studies subject. It is reflected in the
curriculum plan and consequently it should be also
recognized by the textbook writers. For the subject
of environmental studies there are several different
textbooks from different publishers. With the
empirical research we tried to establish how
teachers of third grades of elementary school
evaluate textbooks sets regarding the consideration
of the selected constructivist elements. With our
research we established that in teachers' opinion
there are differences among the textbook sets
regarding the consideration of the selected
constructivist elements: the stimulation of pupils'
independence, guidance into more active learning
forms and methods of work, and mainly the
representation of the activity of pupils, that should
develop their skills and abilities.
Keywords: environmental studies, teachers,
constructivism, textbooks sets, publishers
1. INTRODUCTION
In Republic of Slovenia, the shift towards the
constructivistic design of learning and teaching in
the early school period, in the primary natural
science, was m
beginning of the nineties in the past century [13].
The curriculum for the subject Environmental
studies (that is the name for the school subject
which covers early natural and social science
teaching in Slovene curriculum in the first
triennium of primary school) is namely based on
the constructivist and humanist theories of learning
and teaching which both place the pupils and their
development in the centre of attention. Its goals
and didactic recommendations direct in the
anticipation that the result of the natural science and
humanistic lessons in the Slovene school should be
not only the reproductive knowledge but also the
developed ability of thinking on the higher
cognitive levels.
Goals in the curriculum for the subject
Environmental studies (ES) are primarily defined
with expressions relating to processes, such as:
pupils familiarize with, pupils recognize, pupils
develop, pupils experience, pupils distinguish.
Goals defined in terms of processes point to the fact
that the authors of the curriculum mainly took
learning processes as the starting point. They were
abilities and skills rather than towards so called
is (defined) to be the development and mastering of
methods such as observation, comparison,
classification, organizing, measuring, research,
application, creative use of evaluation, the effects of
applying these methods should be the development
Didactic recommendations in the curriculum guide
teachers in (to) organizing the lessons by
suggesting the methods, procedures and teaching
instruments. The curriculum for Environmental
studies places greater emphasis on the experiences
and ideas of the pupils in planning the lessons.
within the teaching process, where they can develop
their ideas and make new discoveries in the course
of concrete activities. The role of the teacher: he
leads the pupils and guides them towards various
program to the students. Teachers should monitor
the development and progress of their students.
The curriculum merely presents the means to
achieve t [1].
2. THE CONSTRUCTIVIST CONCEPTS
The Constructivist theory is based on J. Piaget [10],
[11] and [12] research of universal mechanisms of
child's development. He assumed that the human
child has a genetically transmitted readiness to
236
Proceedings of The 4th International Multi-Conference on Society, Cybernetics and Informatics (IMSCI 2010)

construct knowledge from every encounter with the
physical world. In Constructivism, universal
developmental changes are believed to come about
through a general cognitive mechanism for
processing information. To be brief, the course of
development is understood as a sequence of stage-
like changes into higher cognitive structures.
has
had on developmental research it gradually became
evident that the predominant constructivist
approach could not be upheld without revisions. An
abundance of research findings in 1960s and 1970s
different cognitive domains [3].
The debate in Europe focused on the role of the
social environment in human development [8], [14].
To what extent would a child construct knowledge
independently? Could the construction process
originate to any extent from other
the society? The Russian psychologist, Lev
Vygotskij [19] assumed, however, that education
constitutes cognitive growth, meaning that the child
would get support at sensitive stages; a so called
zone of proximal development, from engagements
with more experienced others. In social situations,
parents and siblings, and later peers and other
developing mind. Vygotskij put forth his influential
conclusion that cognitive growth is socially
structured.
The debate about the importance or unimportance
for cognition development has continued until the
1990s. The focus of most research, as Miller [9],
has pointed out, was still on the mind of a solitary,
contextualized child. On the other hand, the
proponents of Social Constructivism have not been
specific about the processes that, within the child,
lead to internalization of knowledge first existing in
social events[16].
The socio-cultural framework for the study of
cognition has gained increasing acceptance in
recent years with the work of B. Rogoff. She points
out the social context in which cognition occurs. In
her research she observes the generic individual as
the basic unit of analysis and adds social factors as
e [15]. Most specifically, the
documentation of what teachers do, say and think
determining how participation changes over time.
development needs also to include detailed
observations of teacher interaction. The research
focus may be on how pupils influence each other,
and equally important on how what the teacher says
and does influences thinking.
3. DEFINITION OF THE RESEARCH
PROBLEM
With the empirical research we wanted to establish
how teachers evaluate the representation of
individual constructivistic elements in the selected
textbook set for the environmental studies subject.
We were interested in:
- Which textbook set do teachers use at the
environmental studies project?
- How do the teachers assess the possibility
of the pupils for an independent learning
with the use of the selected textbook set?
- How do particular textbook sets offer
possibilities for the use of more active
learning methods?
- What do teachers think of the
representation of selected pupils' activities
in the textbook set?
4. METHODOLOGY OF RESEARCH
With the use of causal non-experimental method of
empiric research we collected the data on a non-
accidental pattern of teachers (n=63), that were
teaching the third grade are the primary school in
the school year 2007/2008. Of all (9) units of the
NEI (National Education Institute) of Slovenia we
selected an equal share of teachers (11.1%). A
pattern selected in this way therefore represents a
population of Slovene teachers that teach the
environmental studies subject in the third grade. For
collecting of data we used a questionnaire with
verified dimensional characteristics (validity,
reliability, objectivity). Answers to closed type
questions are presented in tabular form (f, f%), and
the existence of differences according to the
publishing house has been statistically verified with 2-test. When the conditions for the use of
2-test
were not justifiable, then we eliminated the
categories with low frequency or we declined the
test.
5. RESULTS OF RESEARCH
The analysis of the representation of the
publishers textbooks sets
For the environmental studies the teachers can
choose from different textbooks sets from different
publishers. There are many factors that influence
the decision which set to choose or whether to
choose one at all, e.g. the presentation of a textbook
set by the individual publishing houses, the opinion
of other teachers, the textbook fund, the influence
of the principal, etc.
237
Proceedings of The 4th International Multi-Conference on Society, Cybernetics and Informatics (IMSCI 2010)

Our research shows that teachers use for the
environmental studies textbooks sets from three
different publishers. We named them (for the
anonymity purposes) Z1 (49,2%), Z2 (33,3%), Z3
(17,5%). In Slovenia they belong to the more
successful publishers.
The evaluation of the textbooks sets from the
viewpoint of the encouragement of independent
learning
Encouragement of independent learning is one of
the basics of constructivist teaching. It is more
effective and qualitative learning that activates
student mentally and emotionally. This is an active
learning that runs with independent searching and
thinking, with logical dialogue in a group, with
asking and testing hypothesis, basically it is
learning that is involved in a real life environment
[7].
The teachers who participated in the evaluation
believe mostly that the chosen textbook set
encourages students to their independence (Z1-
63%, Z2-76%, Z3-90%). They reason this with the
opportunities that the textbook set offers for
research and experimental work as well as verbal
and imaginary encouragement of students.
Regarding the publisher we did not find any
statistically significant differences. However the
tendency shows (2 = 4.213 <
2
2) = 5.991), that the third publisher has some
advantages in comparison to the second and
especially the first from the viewpoint of
encouraging students to the individual learning.
Evaluation of the representation of teaching
methods in the textbooks sets of individual
publishers
The constructivists defend all methods that
encourage thinking, enable new, surprising
cognitions and unusual way of observation and
open new views, broaden interests and new
horizons. The adequacy of a certain method
depends on the goal and the content, on a student
and teacher and on the cause and the content [17].
The teachers that were surveyed have evaluated the
representation of each method in the selected
textbook sets. For the explanation method all
teachers believe that it is well represented in all
textbook sets (Z1-90,5%, Z2-90,9%, Z3-93,5%).
The same results are for the methods of discussion
(Z1-100%, Z2-100%, Z3-96,8%), experimental and
laboratory work (Z1-54,4%, Z2-23,8%, Z3-87,1%).
The method of demonstration, the teachers believe
that it is too much represented (Z1-72,7%, Z2-
76,2%, Z3-91,3%). For the method of work with
the text the opinions are divided (Z1-54,5%
believes that it is not enough represented , the other
two believe that it is enough represented: Z2-
66,7%, Z3-80,7% ). Also the opinion about the
method of the field work are divided (Z1-72,7%-too
little, Z2-57,1%-enough, Z3-54,8%-enough), and
project work (Z1-54,5%-too little, Z2-52,4%- too
little, Z3-58,1%- enough).
The statistically significant differences regarding
the publishers are evident only in the case of the
experimental and laboratory work method. This
method is the most represented and this estimates
the most teachers who use the textbooks set of the
third publisher (87,1) and at least teachers of the
first publisher (54,5%).
Evaluation of the representation of individual
activities that develop certain skills and
competences of the students
The activities of students for the environmental
studies are written in the teaching plan as a
suggestion. Different activities for students are
foreseen. With this analysis [4] we found out that
the practical activities prevail, but there are fewer
expressive and even less sensory and mental
activities. Through activities students should
develop skills and competences: first observation,
determining properties with experiments, sorting,
organizing and reporting. Later comes
announcement and measuring. This steps enable a
jump from the hands action into the head
thinking [5] and [6].
The textbook sets should encourage to different
activities of students where the students develop
certain skills and competences.
238
Proceedings of The 4th International Multi-Conference on Society, Cybernetics and Informatics (IMSCI 2010)

Table 1: Numbers (f) and structural percentages (f %)of teachers per their evaluation of representation of activities that
develop certain skills and competences in the selected textbook set according to the publisher
Skills
answer
Z1
f f %
Z2
f f %
Z3
f f %
result 2 - test
Too much 0 0,0 1 4,8 0 0,0 2 2( = P = 0,05,
PERCEPTION Enough 9 81,8 17 80,9 30 96,8 g = 2) = 5,991
Too little 2 18,2 3 14,3 1 3,2
RAGING Too much 0 0,0 0 0,0 0 0,0 2 2( = P = 0,05,
CATEGORISING Enough 8 72,7 18 85,7 29 93,6 g = 2) = 5,991
Too little 3 27,3 3 14,3 2 6,4
COUNTING Too much 0 0,0 0 0,0 2 6,5 2 2( = P = 0,05,
MEASURING Enough 8 72,7 20 95,2 24 77,4 g = 2) = 5,991
WEIGHING Too little 3 27,3 1 4,8 5 16,1
Too much 0 0,0 0 0,0 0 0,0 2 2( = P = 0,05,
COMPARATION Enough 9 81,8 17 80,9 28 90,3 g = 2) = 5,991
Too little 2 18,2 4 19,1 3 9,7
Too much 0 0,0 0 0,0 2 6,5 2 2( = P = 0,05,
TO WRITE DOWN Enough 9 81,8 16 76,2 24 77,4 g = 2) = 5,991
Too little 2 18,2 5 23,8 5 16,1
DATA Too much 0 0,0 0 0,0 2 6,5 2 2( = P = 0,05,
COLLECTION Enough 9 81,8 16 76,2 26 83,9 g = 2) = 5,991
Too little 2 18,2 5 23,8 3 9,7
Too much 0 0,0 0 0,0 0 0,0 2 2( = P = 0,05,
CONCLUDING Enough 6 54,5 14 66,7 22 71,0 g = 2) = 5,991
Too little 5 45,5 7 33,3 9 29,0
PERFORMING Too much 0 0,0 0 0,0 0 0,0 2 2( = P = 0,05,
EXPERIMENTS Enough 8 72,7 16 76,2 24 77,4 g = 2) = 5,991
TESTS Too little 3 27,3 5 23,8 7 22,6
FORMING Too much 0 0,0 0 0,0 0 0,0 2 2( = P = 0,05,
HYPOTHESIS Enough 5 45,5 11 52,4 20 64,5 g = 2) = 5,991
Too little 6 54,5 10 47,6 11 35,5
Too much 0 0,0 0 0,0 0 0,0 2 2( = P = 0,05,
RESEARCH Enough 5 45,5 15 71,4 26 83,9 g = 2) = 5,991
Too little 6 54,5 6 28,6 5 16,1
fewer activities in the textbook sets that require
thorough understanding, deeper thinking, but
thinking processes.
Regarding the publisher there is a statistically
important difference only by the research. The
percentage of teachers that use the textbooks set Z3
and estimate that this activity is present enough is
higher (83,9%) from the percentage of the teachers
that think alike but use the textbook sets Z2 and Z1.
6. CONCLUSION
The teachers for the environmental studies subject
have several textbook sets of various publishing
houses at their disposal. It is a fact that sets are
frequently used for this subject [18]. There are
many factors that influence the decision which set
to choose or whether to choose one at all, e.g. the
presentation of a textbook set by the individual
publishing houses, the opinion of other teachers, the
textbook fund, the influence of the principal, etc.
With our research we established that in teachers'
opinion there are differences among the textbook
sets regarding the consideration of the selected
construcitivistic elements: the stimulation of pupils'
independence, guidance into more active learning
forms and methods of work, and mainly the
representation of the activity of pupils, that should
develop their skills and abilities.
Therefore one textbook set helps the teachers more
than others at the constructivistic lesson of the
environmental studies subject. Although, they
believe that they are not enough qualified for this
way of work and that they wish for a supplementary
training in the form of workshops and with the help
of good practice.
239
Proceedings of The 4th International Multi-Conference on Society, Cybernetics and Informatics (IMSCI 2010)

In any case, it would make sense to use this
willingness of the teachers and continue with
similar education that already took place in
Slovenia within the Tempus project. Just the project
the Natural sciences competences that is presently
running in Slovenia and is coordinated by the
Faculty for Natural sciences and mathematics in
Maribor has one of the goals also to help teachers
(with didactical models) implementing the
constructivist lessons into praxis. Examples of good
practice are also present [2].
7. REFERENCES
[1] Bezjak, Z. (1996).
ocenjevanje.
Ljubljana: Zavod
[2] Konstruktivizem v praksi.
-370). Ljubljana:
[3] Flavell J. H., Miller P. H., Miller S. A. (1993).
Cognitive development. Englewood Cliffs. New
York: Prentice Hall.
[4] Hus, V. (2004).
spoznavanja okolja in spoznavanje narave in
obzorja, 19 (1), 17 27.
[5] Krnel,D. (1996). Nastajanje nove podobe
predmeta Spoznavanje okolja v prvem triletju
Ljubljana: PRKK za Spoznavanje
okolja.
[6]
Spoznavanje okolja. Ljubljana: Ministrstvo za
[7]
pouka. Ljubljana: DZS.
[8] Meadows, S. (1996). Parenting behaviour and
Hove, East
Sussex: Psychology Press.
[9]
are the state lines? Cognitive Development, Nr.1
(11), p. 141 155.
[10] Piaget, J. (1951). Play, dreams and imitation in
childhood. London: Routledge.
[11] Piaget, J. (1952). The origins of intelligence in
children. New York: International Universities Press.
[12] Piaget, J. (1954). The construction of reality in the
child. New York: Basic Books.
[13] Piciga, D. in Japelj, B.(1993). Rezultati
med
Educa, str. 136-174.
[14] Richardson, K. (1998). Models of cognitive
development. Howe, East Sussex: Psychology Press.
[15] Rogoff, B. (1998). Cognition as collaborative
process. In.: (Eds.) W. Damon, D. Kuhn, R. S.
Siegler. Handbook of Child Psychology: Cognition,
perception, and language Cambridge, UK: Cambridge
University Press., p. 679-744.
[16] Origins of knowledge: learning
and communication in infancy. Learning and
Instruction Nr. 3 (12), p. 345 374.
[17]
teoriji in vzgojno
67). Ljubljana: Center
za
[18] Vrbek, A. (2008). Konstr
kompletih za predmet spoznavanje okolja v
[19] Vygotski, L. S. (1987). The collected works of L. S.
Vygotskij, Volume 1: Problems of general
psychology. New York: Plenum.
ACKNOWLEDGEMENTS
We greatly acknowledge the support of the Ministry of Education and Sport of Republic of Slovenia and European Social
of Maribor.
240
Proceedings of The 4th International Multi-Conference on Society, Cybernetics and Informatics (IMSCI 2010)

Peer tutoring: The effect of being a tutor for learning Cardiopulmonary
Resuscitation (CPR) with task cards
Peter Iserbyt, PhD, Katholieke Universiteit Leuven (Belgium)
Introduction. Peer tutoring, also known as
peer teaching, is the system of instruction
in which students work in pairs to support
each other’s learning. In this format,
learners are paired and exchange roles of
tutor and tutee. While one learner (tutee)
performs the task, the other learner (tutor)
observes and gives feedback based on
information provided by the teacher orally
or in the form of task cards. The academic
gains following this cooperation are
believed to occur for both tutors and
tutees. While the tutee is learning by
doing, the tutor is intended to be learning
by observing, analyzing performance and
giving performance-related feedback.
However, research directly addressing the
effect of being a tutor for learning a
psychomotor skill is lacking.
Methods. Ninety students in Kinesiology
were paired and randomized over two
groups to learn cardiopulmonary
resuscitation (CPR). They learned CPR in
a 10 min peer tutoring setting with task
cards without instructor involvement. Task
cards combine a picture of the skill with
written instruction about how to perform
the skill. CPR was performed on a
resuscitation manikin, recording all CPR-
related data. Students were assessed
before (baseline), immediately after the 10
min learning phase (intervention), and two
weeks later (retention). In the reciprocal
group, students were allowed to switch
roles of tutor and tutee after 5 minutes. In
the non-reciprocal group, students were
not allowed to switch and remained in their
role of tutor or tutee for the entire 10
minutes. In total, the sample consisted of
32 students who performed both roles of
tutor and tutee, 28 tutors, and 32 tutees.
Results. Repeated measures ANOVA
found no significant differences between
tutors, tutees and students who performed
both roles. A significant gender effect was
found, revealing higher learning gains in
boys compared to girls. Furthermore, a
significant time by gender interaction effect
demonstrated a significant loss of learning
from intervention to retention for boys,
which was not the case for girls. At
intervention, students achieved or
approached closely the 2005 European
Resuscitation Council (ERC) Guidelines
for CPR. This indicates that students were
able to perform a qualitatively high level of
performance in a short amount of time.
Discussion. Results in this study indicate
that role switching in peer tutoring did not
enhance learning. This finding suggests
that tutors, tutees, and students
performing both roles learn CPR equally
241
Proceedings of The 4th International Multi-Conference on Society, Cybernetics and Informatics (IMSCI 2010)

well in 10 minutes with task cards. This
finding is relevant as it demonstrates the
‘learning by instructing and giving
feedback’ from the tutor. Furthermore,
results in this study are in line with
previous research demonstrating higher
learning gains for boys compared to girls
in peer tutoring settings.
Conclusion. This study demonstrated that
immediately after training, tutors without
motor practice are able to achieve an
equal CPR performance level as tutees
and students who performed both roles.
Although further research is recommended
in this matter, it is argued that tutors learn
by instructing, analyzing the tutee’s
performance and comparing this
performance to the information on the task
cards, and giving feedback.
242
Proceedings of The 4th International Multi-Conference on Society, Cybernetics and Informatics (IMSCI 2010)

Is Gender, Age or Experience a Problem? Issues for Primary Teachers with ICT
Dr Graham Morley
School of Education and Professional Development
University of Huddersfield
HD1 3DH
UK
ABSTRACT
The research uses both qualitative and quantitative
methodologies employing multiple sources of data collection.
Quantitative data collection used a questionnaire of primary
schools in two English Local Authorities. The qualitative
evidence of the teacher sample was through individual semi-
structured interviews and a focus group interview of Local
Authorities officers. There is an evidence trail which examines
academic papers, HMI, QCA, Ofsted and DfES reports. The
main findings indicate that gender and age are not an issue,
although the findings were not as expected. The main issue was
that of subject knowledge combined with teaching experience
which allowed teachers to decide when use ICT to its best effect
to aid teaching and learning.
Keywords: primary education, pedagogy, learning
opportunities, time, teacher confidence, subject knowledge and
teaching experience.
1. INTRODUCTION
ICT and in particular computers have become big spending
items with governments around the world. ICT has been seen as
the way to move teaching and learning forward which can lead
to a whole new way of engaging pupils. Our world is now
subjected to new technologies. Our daily lives are constantly
criss-crossed and interwoven with ICT and computers. But what
changes has ICT made to teaching and learning? Are teachers
using ICT in their classrooms? The literature surrounding the
use of ICT in classrooms always speaks of ‘teachers’ but never
breaks the data into any other categories such as age, gender and
teaching experience. This small scale research looks at these
three variables to investigate if they have an influence upon
teachers’ use of ICT.
2. LITERATURE REVIEW
In England the DfES (2005) suggested that with the introduction
of ICT there should also be a new innovative pedagogy, as the
current one has failed many pupils. It has also been recognised
by Becta (2004; 2007), Scrimshaw (2004) and Holmes and
Gardener (2006) that this new pedagogy needs to be ‘pupil
centred’ rather than ‘teacher centred’ and that educational
changes also takes time for the teachers to adjust to.
To successfully implement this new style of pedagogy there also
needs to be appropriate resources. The Stevenson Report (1997)
highlighted the inadequacy and inappropriateness of the hard
and soft-ware available to schools and teachers. The report also
indicated the variability of teachers’ skills and usage of ICT in
the classroom. It was further suggested by HMI (Ofsted, 2005)
that these three factors were key to raising the quality of
teaching when using ICT.
Headteachers and senior managers need to place new
technologies at the centre of teaching and learning if this
integrated pedagogy is going to succeed. In 1997 Becta and The
National College for Leadership introduced a strategic
leadership course to give school leaders the tools to place
technology at the centre of teaching and learning.
The literature reviewed, only refers to the term ‘teachers’ to
describe all of the teaching force. Indeed Becta (2004) go further
and suggest that there is a barrier to new technologies by
teachers but they also admit that educational change is a slow
process and it takes time to become confident with these new
technologies in the classroom.
These sweeping bold statements do not take into account
anything to do with gender, age or teaching experience. Could
these three factors an influence on teachers’ use of ICT in the
primary classroom?
3. METHODOLOGY
The research data is partly based upon qualitative and
quantitative answers from a questionnaire. The questionnaire
was initially piloted with non-participants and as a result
adjusted from participant feedback. The amended questionnaire
was then circulated to the ICT co-ordinator in primary schools
from two English local authorities. Further deeper qualitative
data was gained through semi-structured interviews with a cross-
section of teachers, who matched the national and local profile
for teachers in gender, age and teaching experience; followed by
a focus interview with local authority officers with responsibility
for primary education.
4. ANALYSIS OF DATA
The questionnaire respondents were approximately 1/3 male and
2/3 female (Table 1).
Table 1 - Questionnaire Respondents by Gender
Gender Count %
Male 25 37.3
Female 42 62.7
Total 67 100
243
Proceedings of The 4th International Multi-Conference on Society, Cybernetics and Informatics (IMSCI 2010)

There was inconsistency when comparing the respondents ages
to their gender (Table 2). There were four times more females in
the 20 – 30 year olds, in the 31 – 40 and 41 – 50 year olds had a
ratio of one to two of males to females while the 51 – 60 year
olds were equal between both males and females. These figures
matched both local and national ratios for primary teachers.
Table 2 – Ages – Gender Cross Tabulation of Questionnaire
Respondents
With the teaching experience cross tabulated with gender (Table
3) there was inconsistency for the ratio up to 21+ years of
experience where it then became 50:50.
Table 3 – Teaching experience – Gender Cross tabulation
of Questionnaire Respondents
Table 4 would suggest that teachers feel that computers are
being used frequently and occasionally, with only 2.94% saying
that they never use computers.
Which teachers are not using computers?
Table 4 – Questionnaired Teachers use of
computers in the classroom
Table 5 – Gender – Frequency of use of computers
Cross tabulation of Questionnaire Respondents
Table 5 suggests that females use computers proportionally
more than males. The data shows that 33.91% of females use
computers frequently or occasionally in class while male usage
is only 17.88%.The data implies that there might be a gender
issue, but not in the form expected.
Younger teachers were educated in an educational system where
computers were the norm. It would not, therefore, be surprising
for them to be including computers during their teaching. Are
younger teachers using ICT in the classroom more than older
teachers?
Table 6 – Age – Frequency of use of
Computers Cross tabulation with Questionnaire
Respondents by age
Table 6 surprisingly indicates that younger teachers are not
using ICT other than ‘occasionally’ and ‘infrequently’. It has
been suggested by Becta (2004; 2007) and Scrimshaw (2004)
that this could be due to their lack of confidence regarding their
subject knowledge and pedagogy per se. They have good ICT
knowledge and skills but they are not using them in the
classroom. This, they suggest, is because the more experienced
teachers are able to identify areas where computers can support
and extend teaching and learning.
The under usage of computers cannot be attributed to just the
lack of experience with pedagogical understanding of where
computers assist with teaching and learning within the subject
area.
20– 30 Yrs old 31 – 40 Yrs old
Male Female Male Female
2 8 7 13
2.98% 11.92% 10.43% 19.37%
41 – 50 Yrs old 51 – 60 Yrs old
Male Female Male Female
8 13 8 8
11.92% 19.37% 11.92% 11.92%
Sub-total Total
Male Female
25 42 67
37.25 62.58 99.83%
Gender Teaching
experience
in years Male Female Total
%
Male
%
Female
%
Total
0-10 7 12 19 10.44 17.88 28.32
11-20 5 17 22 7.45 25.33 32.78
21-30 11 11 22 16.39 16.39 32.78
31- 40+ 2 2 4 2.98 2.98 5.96
Total 25 42 67 37.26 62.58 99.84
Frequency %
Valid Every lesson 1 1.47
Frequently 7 10.29
Occasionally 28 41.16
Infrequently 27 39.69
Never 2 2.94
Total 65 95.55
Missing 2 2.94
Total 67 98.49
Gender
Frequency
computers used Male % male Female % Female % Total
Every lesson 0 0 1 1.49 1.49
Frequently 3 4.47 4 5.6 10.07
Occasionally 9 13.41 19 28.31 41.72
Infrequently 10 14.9 16 23.84 38.74
Never 1 1.49 1 1.49 2.98
No answer 2 2.98 1 1.49 4.47
Total 25 37.25 42 62.22 99.47
Frequency
computers
used Age
20 -
30 %
31-
40 %
41-
50 %
51-
60 %
Every lesson - - - - 1 1.49 - -
Frequently - - 2 2.98 4 5.96 1 1.49
Occasionally 5 7.45 8 11.92 7 10.43 8 11.92
Infrequently 5 7.45 8 11.92 7 10.43 6 8.94
Never - - - - 1 1.49 1 1.49
No reply - - 2 2.98 1 1.49 - -
Total 10 14.9 20 29.8 21 31.29 16 23.84
244
Proceedings of The 4th International Multi-Conference on Society, Cybernetics and Informatics (IMSCI 2010)

Table 7 – How many Questionnaire Respondents feel they
need more time to understand programs
When gender is taken as the variable as in Table 7, there is 1 to
2 male to female split with teachers wanting more time to
understand programs.
The age band has a wave effect but the numbers involved
compared with the total are small at only 4.02% requiring more
time.
Teaching experience is also is consistent in both its number of
teachers and percentages. Again the total percentage of the
whole cohort was 4.02%.
Table 8 - How many teachers felt they needed more support
in the use of pedagogy
The research found (Table 8) that 58.2% of teachers
questionnaired are asking for clarification and some direction
regarding their pedagogy with ICT. There were significantly
more male teachers (72%) asking for this than female (50%).
5. CONCLUSION
The lack of confidence in using ICT in the classroom appears to
cross all boundaries. It would appear that there is more
uncertainty with males regarding their use of pedagogy when
using ICT in the classroom.
Males appear to use computers less in class than females. There
is no clear reason for this other than female teachers appear to be
more confident with their pedagogy per se.
Age does not seem to be major factor in the use of computers in
the classroom, indeed less experienced teachers were the least
users of computers in the classroom. This is not because they
lack computing knowledge or skills but rather their teaching
experience. This could be due to the difference between subject
knowledge per se and their pedagogical subject knowledge.
They have subject knowledge but are not fully aware of how
they can best put this across to the pupils.
The most influential factor seems to be teaching experience
which allows the teacher to determine when computers can be
best used for teaching and learning. The experienced teachers
are more concerned with how they teach and make interaction
with the pupils and not the content knowledge per se. It is the
subject matter knowledge for teaching and how best to engage
pupils in that subject matter knowledge that concerns
experienced teachers. Only through delivering the subject matter
knowledge and combining it with their pedagogical knowledge
will they begin to be aware of when computers can aid teaching
and learning.
It would appear that less experienced teachers require time to be
able to assimilate their computer knowledge and skills with the
subject matter knowledge. To encourage this integration then
ICT training should include some pedagogical content that will
give them examples and thus building their confidence to try.
6. GLOSSARY
Becta British Educational Communications
and Technology Agency
DfES Department for Education and Skills
HMI Her Majesty’s Inspectorate
ICT Information and Communication
Technology
Ofsted Office for Standards in Education
QCA Qualifications and Curriculum
Authority
7. REFERENCES
[1] British Educational Communications and Technology
Agency (2004) A Review of the Research Literature on
Barriers to the Uptake of ICT by Teachers Coventry: Becta
[2] British Educational Communications and Technology
Agency (2007) The Impact of ICT in schools – a landscape
review
http://publications.becta.org.uk/display.cfm?resID=28221&page=1835 Accessed 22/1/07
[3] Charalambous, K. and Karagiorgi, Y. (2002) Information
and Communications Technology In-service Training for
Teachers: Cyprus in perspective In: Journal of Information
Technology for Teacher Education, Vol. 11, No. 2, 2002
Netherlands: Kluwer Academic Publishers
[4] Cornu, B. (1995) New Technologies: integration into
education In: Watson, D. and Tinsley, D. (Eds) Integrating
Information Technology into Education London: Chapman and
Hall
[5] Cummings, C.A. (1998) Teacher Attitudes and Effective
Computer Integration Master’s Research Paper: University of
Virginia
Time to
understand
programs Gender
Male
Of Total
% Female
Of Total
% Total %
Yes 2 1.34 4 2.68 4.02
Age
20 -
30 %
31 -
40 %
41-
50 %
51 –
60 %
Total
%
Yes 2
1.3
4 1
0.6
7 2
1.
34 1
0.6
7 4.02
Teaching experience
0-10 % 11-20 % 21-30 % Total %
Yes 2 1.34 2 1.34 2 1.34 4.02
Support
with
Pedagogy
Male
%
Male Female
%
Female Total
%
Total
Yes 18 72 21 50 39 58.2
No 7 28 21 50 28 41.79
245
Proceedings of The 4th International Multi-Conference on Society, Cybernetics and Informatics (IMSCI 2010)

[6] Department for Education and Skills (2005) Harnessing
Technology: Transforming Learning and Children’s Services
Nottingham: DfES Publications Accessed 4/05/2005
[7] Fletcher, D. (2006) Technology Integration: Do They or
Don’t They? A Self-Report Survey from PreK Through 5th.
Grade Professional Educators Association for the Advancement
of Computing In Education Journal, 14(3), 207 - 219
[8] Franklin, T. (2000) Predictions of Ohio K-4 student
competencies on the national educational technology standards
Paper presented at the Annual Meeting of the American
Educational Research Association, New Orleans, LA.
[9] Holmes, B. and Gardner, J. (2006) E-Leaning Concepts and
Practice London: Sage Publications
[10] Kennewell, S. and Beauchamp, G. (2003) The Influence of
a Technology-rich Classroom Environment on Elementary
Teachers’ Pedagogy and Children’s Learning Paper presented
at the IFIP Working Groups 3.5 Conference: Young Children
and Learning Technologies, at UWS Parramatta July 2003
[11] Loveless, A.M. (2003) The Role of ICT
London:Continuum
[12] Office for Standards in Education (2004) ICT in Schools:
The impact of government initiatives five years on London:
Ofsted
[13]Office for Standards in Education (2005) The Annual report
of Her Majesty’s Chief Inspector of Schools Reports 2004/5
Information and communication technology in primary schools
http://live.Ofsted.gov.uk/publications/annualreport0405/4.1.6.html Accessed 19/04/2007
[14] Open University (2008) E-Learning Staff Development Day
Leeds: Conference
[15] Scrimshaw, P. (2004) Enabling Teachers to Make
Successful Use of ICT Coventry: Becta
[16] Stevenson, D. (1997) Information and Communications
Technology in UK schools: An Independent Inquiry London:
SRU
[17] Zhang, J. (2004) Using ICT to Prepare Learners for the
21st. Century: The Perspectives of the Eastern APEC
Economies Presentation for APEC Summit on Educational
Innovation: “Striking Balance: Sharing Practice from East and
West”, Beijing, 2004
246
Proceedings of The 4th International Multi-Conference on Society, Cybernetics and Informatics (IMSCI 2010)

ABSTRACT
This session will present an innovative model
and discuss the efficacy of online peer
discussion as a means of support and reflection
among pre-service teachers.
Keywords: teacher educat ion, course
management systems, knowledge transfer.
Reflection is recognized as an important facet
of effective teaching, a facet closely tied to the
act of teaching and one that is critical when the
time comes for self-assessing and adjusting
lessons. However, the nature of teacher
reflection is such that teacher educators struggle
to assess it directly. It is difficult to see what
student teachers are thinking about with respect
to the teaching they are doing, often outside of
the presence of teacher educators. Providing
online forums for discussion and interaction
among peers joined by experiences in various
practicum experiences during a teacher
preparation program, teacher educators create
an opening not only to extend the boundaries of
the physical university classroom, but to
witness (and at times participate in) the thought
processes of students as they engage in
reflection on their initial, and subsequent,
classroom experiences. This session will show
a model of how this online support is provided
for and managed in field practicum and student
teaching experiences within two secondary
education programs at one undergraduate
university. Additionally, it will demonstrate a
model of scaffolding that facilitates the transfer
of pedagogical theory to practice through this
support. Examples of pre-service teachers’
reflective discussions and an examination of
evidence of growth in their practice will also be
provided.
The technological era has provided new
challenges, but also new opportunities, in
mentoring beginning teachers. There is research
to suggest that this type of online support can
facilitate efficient transfer of theory to practice
in pre-service teachers. This presentation
reflects findings in an ongoing project with
undergraduate students during field practica and
student teaching, and details plans for follow-up
research during the first few years of full-time
teaching. This project’s innovative on-line
approach of support and scaffolding learning is
relatively easy to establish and inexpensive to
maintain, and provides the researcher to:
! examine, outside of the university classroom,
the dialogic relationships between future
teachers, discuss ways that can best provide
support to, and better communication methods
between, these beginning teachers;
! share how pre-service teachers have begun to
develop an epistemological and practical
understanding of pedagogy through online
discussion centered around various teaching
practica and case study scenarios;
! explore how beginning teachers can be
encouraged to reflect upon and incorporate
research-supported pedagogical theory in their
teaching through the use of online course
management systems and discussion boards.
Providing Online Support for Beginning Teachers
to Facilitate Transfer of Pedagogical Theory to Practice
Dr. Allan Nail, Assistant Professor of English Education
Education Division, University of Pittsburgh at Johnstown
Johnstown, PA 15904, USA
247
Proceedings of The 4th International Multi-Conference on Society, Cybernetics and Informatics (IMSCI 2010)
QUALITY ORIENTED OR SLOW RESEARCH
Conversations about assessment in schools or building dynamics into both design and results
Anne REINERTSEN Department of Education, Nord-Trøndelag University College
7700 Levanger, Norway
ABSTRACT
This paper is both part and product of an ongoing
research project designed for and directed towards
developing Sustainable Assessment Cultures in
Norwegian Schools. Student assessment, adapted
teaching and school as a learning organization constitute
the basic theoretical framework. Poststructuralist and
critical feminist research traditions stance of language
however, the background for how these theories is
understood and applied . These are traditions linking
language, subjectivity, social organization and
empowerment together. Language not understood or
used as a tool to discover and interpret- but to introduce
and create meaning: Language as action or action
inscribed in language. In The Eighth and Ninth
Moments of Qualitative Research in/and the Fractured
Future this is a suggestion to how one might perhaps
continue doing research in/and schools; after truth, after
method after(/)all.
Keywords: Associate professor holding a Ph.d. from the
University of Trondheim, NTNU, Norway. Main interest
is Philosophy of Education, School Reform, Quality- and
Assessment issues.
INTRODUCTION
following functions: it
induces diversity in writings, ideas, beliefs that are not
meant as systems or synthesis. It models a multiplicity of
extended intellectual roots and traditions beyond those
conventional in teacher education and philosophy of
education. It asks various kinds of questions about
human social life, ones that are always contextualized
and contingent. It probes
important queries, yet never settles for reductive and
simplistic replies. It recognizes openness to inquiry, not
only in being receptive to new ideas, but also in being
aware that the unknown and unknowable always
knowledge about an object/subject/ issue/theme/question
or problem and simultaneously assessing its value.
Knowledge production and judgment therefore or,
viewing some observed reality against an ideal but not
once and for all but again and again and again. Decision
making in other words, knowledge perceived as
preliminary and a view of reality therefore remaining as
complex after as it was before judgment. It is a move
from knowledge to wisdom perhaps and perfectibility or
that of simultaneously being preoccupied with what is
perfect and what is not.
This can be linked to so called aporetic
thinking or a formal negativity; negative capital or
(Adorno 1952, Bataille1988, Lather 2007, Virno, 2008),
and a process of creating quality between innovation and
negation through engendering aporias (Derrida, 1993)
always. Ideals against reality therefore but through the
negative terrain, or putting the negative picture in
connection with the positive original ideal, however
simultaneously selecting or singling out pictures as
negative in the sense of bad; with broken connections to
the positive: negative to the negative. Drawing on critical
feminist research and poststructuralist philosophy, I have
the art of being
negative ers in
a way of making authority
catching
DEVELOPING SUSTAINABLE ASSESSMENT
CULTURES IN NORWEGIAN SCHOOLS; ME
AND
Judgments are subjective and agency a constitutive effect.
The real issue in our research project in Norway, is
therefore not whether judgments are subjective or not, but
how credible and how consistent those judgments are,
how meaningfully they can be interpreted, and whether
good consequences follow. No pressure therefore to be
No isolated focus on what assessment
means. Full focus however on what it does. The goal on
the one hand is therefore together with students and
teachers to try to create and provide systematic and well
grounded support for teachers in making their judgments
and to recognize the different ways students learn, and
the different ways in which their learning is expressed
and can be forwarded. On the other hand and as far as
the students are concerned the goal is to create
environments in which the critical discernment of quality
becomes the key aspect of learning. The research project
248
Proceedings of The 4th International Multi-Conference on Society, Cybernetics and Informatics (IMSCI 2010)

is of cause about dialogue and inclusion, but in an
indirect way.
The project is therefore focused on opening up
to judgement and developing a language for assessment
focused on learning turning pedagogy into a discursive
field and ultimately school into a discursive institution;
schooling thus here seen quintessentially as practices
producing subjects. Language might
that we recognize that it is constantly changing and in
motion and that we are - all and always - learning in and
through it. Ultimately this might be conceived of as a
way of building (professional) autonomy through
subjectivity and experiential learning, a way of writing
competence forward and preparing perhaps also for the
incalculable. It is an attempt to avoid instrumentalism
and escape reductionism. Quality must be discussed
again and again because that is also quality.
I will continue with discussing the word slow
and the process of catching authority . Theory, research
and method are all mixed together and/or intertwined.
The concept of writing , Derrida,
1967/76) and writing as a research method
(Richardson and StPierre, 2005 ) are both vital in/as both
the building process and the building product affecting
the validity, reliability and credibility of the research
conducted and the research reported. Second, I will tell
you four stories h High School in Norway
which is the place I write through. I have collaborated
with four teachers in their reform efforts resulting in four
conversations about assessment. Thematically the
conversations are about: A).Education as experience and
taking risks. B).Conceptual certainty and how it can be
assessed. C).Written formative assessment on an
electronic platform. D). Assessing practical exams with a
focus on the oral aspect. The fact that all teachers are
working with assessment and the use of assessment tools
in their classrooms makes this into a multileveled and
integrated study of assessment and quality. The common
goal is the development of a more nuanced education
language for use in assessment. And as far as research is
concerned, the development of a more nuanced language
for use in research. Becoming language workers all
eventually or developing language together.
BUILDING DYNAMICS AND CATCHING
AUTHORITY
I link the concept of
and practically to trilogy about the
intervening subject primarily the first The
Stop (1995), referring to being forced to a halt or a
slowing down because of lack of understanding and not
knowing what to do. Being forced to look twice, or
being forced into a state of
or solution cannot easily be found, or turning into a blind
person with a white stick groping along trying to find a
way. Twisting, turning thinking other and more.
Appelbaum however, argues that this groping, this
halting, stumbling, careful, slow progress with a stick,
also has its privileges. Through tentative movements the
blind person might see what the person with vision might
not; because instead of making use of direct lines of
vision to distant objects, she gropes her way across the
poised perception
a gathering unto a moment of novelty. It is
perception of traces of hidden meaning. It is the
perception that belongs to the stop 64). The stop
slowing us up, it takes longer to do things, it takes longer
to make sense. It takes longer to write. The stop, a
version of deconstruction ultimately; a state of
b(l)indness in the double(d) b(l)ind and a writing under
erasure .
Building on Derrida, and thus through an onto-
ontological process, or a double(d) deconstructive logic
of mourning and haunting, such writing is conceived of
as a rigour or practices engaged in processes of lowering
the ontological weight
concept of assessment or any concept as such to keep it
visible but crossed out in order to avoid universalizing or
monumentalizing it. Rather keeping it unprotected by
any authoritative knowledge or subjective certainty or
both limit and resource, opening it
up to margins
strengthening of the concept, not lowering its value, but
increasing its force.
Why however negation (aporia) groping in a
negative terrain or this formal negativity? It is to remind
us that any affirmation (read concept, assessment,
method, system, structure , pedagogy or politics, research
and/or knowledge) must announce itself through a
the necessity of
experience itself and the risk that every promise, every
engagement, and every responsible decision- if there are
such (Derrida, 1993: 19): The necessity and
the risk therefore of going through the trials of the aporias
and
certain experience and
experiment of the possibility of the impossible; the testing
of the aporia from which one may invent the only
possible invention, the impossible invention
(Derrida,1992.a: 41, original emphasis): Judgment or
assessment but not, or assessment through what we do
not want it to be and therefore what we must do:
Exclusion (not) and inclusion (yes) or as I think I prefer
and must; compensation. A best case scenario in both
school reform, processes of change and research is thus
knowing that we cannot know the conditions of our
knowledge, but only its aporetic form
280). A pedagogy of compensation perhaps.
This is a double(d) practice or writing in
awareness therefore arche
writing Derrida, 1967/76:140); the violent instituting
249
Proceedings of The 4th International Multi-Conference on Society, Cybernetics and Informatics (IMSCI 2010)

moment of any institution (read concept); in awareness
thus also of the nonethical opening of the ethics and
arche writing as the origin of
morality as of immorality
law and its force "force de loi" (Derrida, 1994.a/2002)
and the mysterious but engendering and enabling aporetic
(non)foundation of authority: Thus neither taking away
speech from school, teachers and students nor from me as
researcher. Rather mobilizing speech, setting us free and
giving us strength or force to say and do more and other;
thus both allowing and empowering us all to keep going
and ask more. De-authorized knowledge production
processes thus, or authority growing from practices
consisting of a non authoritarian authority. A double(d)
rigour or practice therefore ultimately as the relentless but
fragile pursuit or haunting of the impossible, for the
something more and other to come - as the residue of
dissent that exceeds our search for cohesive unity. This
is building dynamics into both design and results and
sharing and/or catching authority ultimately making it
less dangerous to learn something new, making it less
dangerous both to assess and being assessed, oneself and
others. Expanding the genres of what counts as
knowledge, both in terms of how it is acquired and how it
is to be judged as valid and reliable that is what we do.
And then we are back to where we started or
rather stopped. Slowing down, becoming more humble
perhaps, groping or opening up always, no one
being/having expertise as such and therefore having
developed this writerly reticence
Pierre, 2005: 971) as practitioners in general and
researchers in particular and an awareness of how this
might affect the atmosphere of the place for learning.
Slow research is intra/inter/active, contextualized and
builds on local strengths, needs and wishes: Teachers
using and developing their repertoires as teachers. It is
thus directed towards remaking but with a deep respect
for tradition. It includes self-evaluation and exploration
of processes.
Slow research has a strong focus on both
substance and methods and is (co)constructed
(re)constructed through communication or one might
even say through eating and drinking together; the food
being homemade and with good raw materials. Working,
asking questions and long term perspectives perhaps
. Slow research therefore as that of
working from within the institutional constraints of a
tradition (Read school/research and/or knowledge) while
ignored
or forgotten Lather, 2004.a; Weber,
2001) but not as a tracing or exposure of errors, but as a
process of mobilizing and giving force to what is there.
This might be called a ethics
of discussion
verbal relations and a hermeneutics of refusal (Caputo,
2003). Also it might be called, as already suggested, a
getting lost 2004, 2007) where
fertile space and an ethical practice
in asking how research based knowledge remains
possible after so much questioning of the very ground of
science it might be called a post-
methodology :70): researchers doing things
radically differently wherever we are in our projects. And
as far as assessment is concerned, Sadler (1989) puts it
wonderfully:
extended period of time tends to reduce high levels of
anxiety experienced by some students at the end of the
wider and more varied sampling of
provides frequent
(:141). Creating sustainable
assessment cultures as continuous assessment practices
through creating a questioning knowing in school.
Finding new and other ways for researchers and teachers
to work together always, not looking for slick answers,
but interrogating again and again the ways in which
assessment (read teaching ) is done and what values
inform desirable assessment/teaching.
MASHING UP; CONVERSATIONS ABOUT
ASSESSMENT IN SCHOOL
Cross curricular or multi theoretical and interdisciplinary
approaches are important and both means and goals. This
project is an attempt therefore to combine or think
simultaneously both on empirical oriented social studies
and on humanistic interpretative studies and play. It is an
attempt to expand modernist pragmatic approaches where
learning outcomes dominate and ultimately create more:
The speaking/thinking becomes yours and mine together
or mashing up together; creating a
DDD+ assemblage (Reinertsen, 2010), CAP
ethnography here writing stories
(Richardson &StPierre, 2005).
The methodology (not)
adopted in my research involves open observation in
classrooms, regular semi-structured interviews with
teachers, students and leaders, group interviews,
document studies and filming of activities of particular
interest. Notes are taken. Interviews are recorded,
transcribed and subject of further group discussions.
Films are studied and also subject of further discussions
and ultimately more research. Four sub projects have so
far been developed at in collaboration with
teachers and their students and me. These are four
conversations about assessment.
A). Education as experience and taking risks. This is a
conversation with a teacher who is
to speak. Eg: When a written assignment is completed,
the teacher asks students to choose two sentences that
they think are important and therefore want to discuss
with others. This triggers wide and profound subject
matter discussions in class. Further: This teacher wants
students to ask to be assessed when they are ready for it:
250
Proceedings of The 4th International Multi-Conference on Society, Cybernetics and Informatics (IMSCI 2010)

We want students to come to us and ask to be assessed
when they think they have the competence and skills
required. They can try again if they fail. (Fieldnotes.
Aug.2009). In this classroom being assessed and
assessing others has become such an everyday activity
that students by now (January) are filming themselves.
s one of the students told
me. A camera is at hand any time. Students and teachers
are filming themselves and each other whenever they
think it has a purpose as far as assessment is concerned.
As such this could be turned into a research story titled
ecause that would tell us
much about assessment and quality.
B).Conceptual certainty and how it can be assessed? This
writing story is based on a teacher who is arranging
dialogues between students and teachers in her classroom
discussing proficiency and what quality might be in the
meeting between caretaker/nurse and patient. One of the
interesting questions that have turned up so far is how to
tter competences as part of proficiency
without turning it into something to do with personal
traits?
C).Written formative assessment on an electronic
platform: A writing story about focussing simultaneously
both on local and global text genres when assessing
The goal is creating perspectives,
depth and new ways of looking or perceiving things,
other ways of looking: Seeing simultaneously part and
the whole, the short and the long term. A move from
motivation to inspiration this might be called.
D). Assessing practical exams with a focus on the oral
aspect. This is about discussing communication and how
to show to others your competence so that it can be
assessed. Se A) above.
FURTHER RESEARCH REMARKS
Does it really work? I asked the head of the department
at the school if she had observed any differences after the
teachers had joined the project. She answered:
teachers who are involved in the project speak more
nuanced about school, reform, students and assessment
now. They also act, in my view, more professionally.
They express an understanding of complexity that I have
(Field
notes Feb.3.2010). When I asked one of the teachers to
describe the assessment culture at the school after having
participated in the project for six months? She said:
will describe it as flowering! I have so many ideas, and
you know, I now see that I can always do something else
. The same teacher spent five
hours discussing films from her classroom with me. We
both forgot lunch. This is in my view however, not an
is an expression only of a teacher not having given up or
rejected being part of a research project even after much
work, hard work, difficult work, endless discussions and
no clear answers, - still enthusiastic! I ask; can we expect
more?
research partnerships only through what
this is not and therefore what it must be: Ultimately - and
concerning us all, this is about the development of critical
thinking, avoiding manipulation or being manipulated
and multiculturalism. Through lifting the subject position
and thus breathing life into organisational studies, this
might be seen as an attempt to discuss individual
assessment as system assessment; learning organisations
too.
REFERENCES
Adorno, Theodor W. Minima Moralia: Reflections from
the harmed life.Frankfurt am Main. Suhrkamp Verlag
1951.
Bataille, Georges. Inner Experience. State University of
New York. Albany. 1954/1988.
Caputo,J.D. Hounding hermeneutics:A response to Flynn. In M.Dooley (Ed.), A passion for the impossible: John D. Caputo in focus. New York: Sunny Press. 2003.
Derrida, J. Of Grammatology. The John Hopkins University Press.Baltimore and London. 1967/1976.
Derrida, Jacques. Afterword: Toward an Ethics of Discussion. In Limited Inc. Northwestern University Press. Evanston. pp. 111-160. 1988.
Derrida, Jacques. Aporias. Stanford University Press. 1993
Derrida, Jacques. Force of law/Force de loi; Fondement
mystique de l`autoritè.Editions Galilèe. 1994.a. Lovens
Makt; Autoritetens mystiske grunnlag. Spartakus
Forlag.Valdres. 2002.
Derrida, Jacques. On the Name. In Dutoit, Thomas
(Ed.). Stanford University Press. Stanford, California.
1995. a.
Lather, Patti. Getting Lost: Feminist Efforts Toward a Double(d) Science. Paper presented at the Feminist
Scholar Series. Pennsylvania State University. March 31. 2004. a.
Lather, Patti. Getting lost. Suny Press. 2007.
Reinertsen, Anne B. My Norwegian Lusekofte.
International Review of Qualitative Research. Vol.1.
No.2. Pp: 283-298. August 2008.
Reinertsen, Anne B. DDD + assemblage: community not
and youto(o)biography? International Review of
Qualitative Research. February 2010.
Richardson, Laurel and St.Pierre, Elizabeth A. Writing: A Method of Inquiry. In Denzin, N. K. and Lincoln, Y.S.
251
Proceedings of The 4th International Multi-Conference on Society, Cybernetics and Informatics (IMSCI 2010)

Handbook of Qualitative Research. Third Edition. pp. 959-978. Thousand Oaks. Sage. California. 2005.
Stone L. Teacher isms Today. From certain Systems to Open Inspiration. In Pheland, A. & Sumsion, J. Critical Readings in Teacher Education. Sence Publishers. Rotterdam/Taipei 2008.
Virno, Paolo, Multitude between innovation and negation. Semiotext(e). 2007 Wilshire Blvd.,Suite 427,
Los Angeles, CA 90057. MIT Press, Cambridge, Mass.and London, England.
Field notes Cityhill 2009-2010
252
Proceedings of The 4th International Multi-Conference on Society, Cybernetics and Informatics (IMSCI 2010)

Self and peer assessment in an undergraduate communication research class using mixed methods
Godfrey A. STEELE Department of Liberal Arts, University of the West Indies, St. Augustine
Trinidad and Tobago
ABSTRACT
Self and peer assessments complement tutor and
lecturer assessments and provide a richer range of
perspectives than that obtained from a singular
reliance on one tutor’s or lecturer’s assessment.
Interest in self and peer assessments (SPA) is based on
assumptions about the nature of learning as an active,
engaged and lifelong pursuit which fosters
independent and critical thinking, personal
responsibility for learning, and disciplinary and
professional skills in the academy and in industry
[1][2]. SPA is beneficial [3-6]), but is often
undermined [7]. Nonetheless, supporting arguments
claim SPA ties learning to assessment [8], defines the
actual curriculum [4], and helps students to value their
work and gain insights [9].
In a year-long course in a language and
communication class, students are encouraged to
assess themselves and each other on an ongoing basis.
In this context, formative assessment is designed to
provide feedback on learning. Self and peer
assessments are combined with tutor and lecturer’s
assessments in an effort to develop and improve
students’ written research reports. Using the
underlying philosophy of the collaborative nature of
the group research projects, the combination of self,
peer and lecturer assessments represents a
collaborative approach to assessment. It is not clear,
however, whether this combination of assessments
improves group research writing. It is also not clear
which patterns of combined assessment are most
effective in improving students’ research writing. This
study addresses these questions using data from 16
groups of self, peer, tutor, and lecturer assessments.
The findings are discussed and recommendations are
made regarding the effect of this combination of
assessments as well as the impact of different
combination patterns on undergraduate research
writing.
Keywords: Undergraduate education,
Communication, Assessment, Instructional
Development
1. INTRODUCTION
Interest in self and peer assessments (SPA) has
spanned the last forty years of formal academic
discourse and research. The impulse to study and
employ self and peer assessments is based on
philosophical assumptions about the nature of learning
as an active, engaged and lifelong pursuit which
fosters independent and critical thinking, encourages
personal responsibility for learning, and develops and
hones disciplinary and professional skills for self-
monitoring and assessing the work of others in the
academy and in industry [1] [2].
SPA encourages the development of higher order
thinking and authentic assessment by focusing on
assessing and evaluating [3], and higher education
aims of independent judgment and critical self
awareness [4], but this is often undermined by a
contradictory method of assessment, known as
assessment backwash [7]. In reviewing the promise
and perils of SPA, [1] noted that self and peer
assessments had been found to have helpful benefits in
improving the quality of work and student
performance [5-6] Others have supported this view by
adding that it ties learning to assessment [8], and
positing that from the student perspective, assessment
defines the actual curriculum [4], and helps students to
value their work and gain insights [9].
Some drawbacks of SPA include mistrust in the
qualifications, competence and use of the review
process and product by students, concerns over the
psychological and sociological factors that negatively
influence this activity, and resistance by students
towards doing what is perceived as the teacher’s job.
The promise of self and peer assessment is often
counterbalanced by the challenges associated with its
implementation, but one view is that students tend to
dislike it more than they do [1, 10]. Another view is
that peer review is worth the effort since “its
weaknesses can be avoided with anonymity, multiple
assessors, and tutor moderation. With large numbers
of students the management of peer assessment can be
assisted by Internet technology” [8].
253
Proceedings of The 4th International Multi-Conference on Society, Cybernetics and Informatics (IMSCI 2010)

2. LITERATURE REVIEW
Self- and Peer Assessments as an Alternative
Framework
Traditional assessments use pencil and paper tests to
measure student performance, but an alternative
assessment framework recognizes that performance
skills cannot be assessed adequately with traditional
assessments and that authentic means are needed to
assess performance [11-13]. Self- and peer-
assessments are examples of alternative assessments in
addition to other types such as performance
assessments, portfolio assessment, project work,
presentation, lab work, learning journal, oral report,
documentary report, exhibitions or displays, research,
case, study, concept maps, interviews and so on [14].
Self-assessments have been found to be useful in
helping students to identify their strengths and
limitations [3] and engaging them by learning how to
make judgments about their achievements and
learning outcomes [15] as active participants [16-17].
The challenge of objectivity in self-assessments has
been seen as problematic but has often been addressed
by measuring the extent of agreement between self-
assessments and instructor assessments [18]. It fosters
self-reflection but requires more time and focus on
learning, and needs guidance and teacher support, and
is helpful in formative developmental contexts [15].
Peer assessments require feedback and encourage
responsibility for learning [3]. The challenge of
leniency in marking can be counterbalanced by the
instructor’s marking [18], and there is evidence that
acceptable agreement can be found between peer
assessment and instructor marking [19-20]. Friendship
marking poses another challenge, but the benefits
associated with peer assessment such as the
development of problem-solving skills seems worth it
[16]. Peer assessment has been found to be more
reliable than self-assessment [21-22]. It should be used
in with assessment criteria determined and discussed
in advance with students and in formative learning
[15] and should incorporate students’ views on
assessment and provide feedback on peer assessment
and the overall pattern of scores [23].
Problem
Self and peer assessment in higher education
When students write research reports, they tend to
respond positively to peer reviews in an online
environment. Two studies were conducted to analyze
the impact of writing and receiving peer-mediated
reviews on the revision of undergraduate research
reports [9]. In the first study, students who received
full or partial peer review made more revisions than
students who were limited to reviewing their own
reports. In the second study, all students received peer
reviews. Both studies showed that the receipt of
reviews had a more significant impact than writing
reviews on triggering report revisions. These findings
suggest that peer reviews are beneficial in encouraging
revision of drafts. While peer review seems more
effective than self-review in encouraging more
revisions, it is not clear, however, whether peer review
is as effective as self-review or should be combined
with self and tutor review to improve the quality of
written drafts. The present study explores and
compares the impact of self, peer and tutor feedback
on the revisions to undergraduate communication
research report drafts.
Peer assessment poses challenges. When peer
assessment is not managed well, it can be unpleasant
and counterproductive. In a qualitative study of 12
graduate students in a humanities programme
investigators studied the role of peer critiques in
generating critical discourse (28Rourke & Kanuka,
2007). They found three main barriers such as
different orientations to criticism, a perception of
criticism as a personal attack, and the feeling that it
was not worth effort because it was time consuming
and bothersome, which questioned the approach taken.
It was recommended that “certain practices may ease
some of these difficulties, including (1) well-
structured learning activities with clearly defined roles
for teachers and students, and (2) a method of
assessing students’ participation that reflects the time
and effort required to engage in critical discourse.”
Thus, if peer assessment is to be useful to students,
barriers should be considered and adequate
pedagogical preparation and clarity of teacher and
student roles should be in place. This study addresses
this issue by asking: 1. Do self-, peer, and instructor
classroom assessments improve research writing
performance? 2. Which combinations of self, peer
and instructor feedback improve research writing
performance?
3. METHOD
Design
The semi-structured design sought to capture a range
of assessment scenarios across 16 groups. Table 1
shows the range of feedback scenarios. Ideal
categorizations of groups as shown in Tables 1 and 2
often gave way to the realities of classroom research
and the evolution of student responses and choices of
type of feedback and patterns of feedback.
Table 1: Types of Feedback Assessm
ent Type
Submit
ted
draft
Num
ber of
Grou
ps
Se
lf
Pe
er
Tut
or
Course
leader
(Instruct
or)
Self 8 10 - 7 8 16
Peer 8 8 - 5 16
Tutor 8 16 - 16
Course
leader
8 16 16
254
Proceedings of The 4th International Multi-Conference on Society, Cybernetics and Informatics (IMSCI 2010)

Table 2: Patterns of Feedback
Assess
ment
Type
Submit
ted
draft
Num
ber of
Grou
ps
Sel
f
an
d
Pe
er
onl
y
Self
,
Pee
r
and
Tut
or
onl
y
Self
and
Tut
or
onl
y
Course
leader
(Instruc
tor)
Self 8 10 7 6 8 16
Peer 8 8 - 5 16
Tutor 8 16 - 16
Course
leader
8 16 16
Participants
Sixteen groups of students comprising 3-5 members
(semester 1 n=68; semester 2 n =67) undertook
research projects in a language and communication
course in their final year of study in a B.A. in
Communication Studies on one campus at a regional
university. All students were majors completing this
required research course over two semesters from
September 2008 to April 2009. Students received
credit for participating in peer reviews in semester 1
(20% of Assignment 2 and 20% of Assignment 3) and
semester 2 (20% of Assignment 4 and 5). Assignment
2 was an oral presentation of a research proposal.
Assignment 3 was a written presentation of the same
research proposal. Assignment 4 was the oral
presentation based on the thesis draft and Assignment
5 was the written version of the thesis draft.
Instruments
Quantitative self and peer ratings
Each student completed a self-assessment and a peer-
assessment in the same group in Weeks 11-12 of the
course in November 2008 and in Weeks 10-11 in
March-April 2009. During each semester, each student
rated him/herself and his/her peers in the same group
using a five-point scale in response to four questions.
The ratings were an assessment of the students’
collaborative writing of a draft of the group’s research
project. The four questions asked (1) the extent to
which group members attended meetings, and rated
(2) the quality of work, (3) the degree of dependability
and (4) the extent of contribution of self and peers.
Tutor and instructor feedback. All groups received
feedback from their tutors and instructor based on the
self and peer ratings. For example, a student whose
self-assessment differed significantly (i.e. the
student’s self-assessment score was more than 1 SD
from the group mean) was interviewed by the tutor
and instructor to explore the reasons for this
difference. Often students would explain that a
significantly lower self-assessment was because of
personal problems affecting the student’s performance
in the group. Sometimes the reasons had to do with
interpersonal or relational problems in the group.
These situations were explored and discussed with a
view to resolving the issues and improving the group
dynamics. These discussions were handled
confidentially without revealing the names of group
members or comments made by them on their peers.
4. RESULTS
RQ1. Do self-, peer, and instructor classroom
assessments improve research writing performance?
Data for quantitative self and peer assessments
Semester 1
The self-assessment-only mean score out of 20 was
18.74 (SD 2.79). The peer-assessment-only mean
score out of 20 was 18.41 (SD 2.91). The combined
self- and peer-assessment mean score out of 20 was
18.51 (SD 2.79).
Semester 2
Self-assessment-only mean score out of 20 was 19.09,
SD 1.75. The peer-assessment-only mean score out of
20 was 18.01, SD 3.36. The combined self- and peer-
assessment mean score out of 20 was 18.29, SD 2.85.
Table 3: A comparison of self-only, peer-only and
combined assessment mean scores
Semester Self-
assessment
only mean
score
Peer-
assessment
only mean
score
Combined
self- and
peer-
assessment
mean score
1 18.74
(SD 2.79)
18.41
(SD 2.91)
18.51
(SD 2.79)
2 19.09
(SD 1.75)
18.01
(SD 3.36)
18.29
(SD 2.85)
Peer assessment-only scores yield the lowest mean
scores, while self-assessment-only scores yield the
highest mean scores. The standard deviation statistic is
more dispersed for peer-assessment-only mean scores
than for the self-assessment- only and the combined
and self- and peer-assessment mean scores. This
suggests that the more stable scores exist for self-
assessment and combined self- and peer- assessments.
From a self-assessment perspective the mean scores
improved across the two semesters, but declined for
peer-assessment-only and combined self- and peer-
assessment scores. The combined scores were
consistently ranked midway between the self-
assessment and the peer-assessment-only mean scores.
Using a traditional rubric that excluded the self- and
peer-assessment scores, the mean assessment of the
group research writing of the draft proposal at the end
of the first semester was 52.76%, SD 5.57. When the
self- and peer-assessment scores were added the mean
score was 71.28%, SD 6.28. In the second semester,
the traditional assessment yielded a mean score of
69.41%, 12.25 SD. The addition of the self- and peer-
assessment scores produced a mean score of 71.62%,
SD 11.73.
255
Proceedings of The 4th International Multi-Conference on Society, Cybernetics and Informatics (IMSCI 2010)

In summary, the self-assessment and combined self-
and peer-assessment scores appear to be more stable
than the peer-assessment only scores, with the
combined scores providing a median score between
self-only and peer-only assessments and a broader
range of assessments than that derived from reliance
on only the instructor’s grade.
Qualitative peer assessments: Checklist,
Completeness, Consistency, Evidence, Overall Quality
Using a feedback system developed in consultation
among the course tutors, students and the course
lecturer, five questions were asked. The first question,
coded CHECKLIST, asked whether the draft included
a sequenced list of required preliminary elements such
as a cover page, an abstract, a table of contents, a list
of tables (if any), a list of figures (if any), a list of
appendices (if any), a main report including chapters
1-6, and a supplementary section including a list of
references or bibliography and appendices (if any).
The second question, coded COMPLETENESS, asked
whether the draft was complete and included all of the
expected sections, headings and sub-headings in each
chapter. The third question, coded CONSISTENCY,
asked whether there was consistency in the content of
all the elements outlined in the first question coded
CHECKLIST. The fourth question, coded
EVIDENCE, asked whether there was evidence to
support the statements made regarding the required
elements in the draft. The fifth question, coded
OVERALL QUALITY, assessed the overall quality of
the draft focusing on the language, formatting,
pagination, layout, headings and subheadings, and
general presentation of the draft. All groups received
tutor and instructor feedback but differed in terms of
whether they received additional self-assessment only
or self- and peer-assessment feedback.
The self-assessment, tutor and instructor feedback to
students provided guidelines for revising the drafts of
the groups’ collaborative research reports. The self-
assessments and tutor assessments identified common
areas and provided feedback on items that might have
been overlooked.
RQ2. Which combinations of self, peer and
instructor feedback improve research writing
performance?
Data for quantitative self- and peer assessments
All groups had feedback from their tutors and
instructor. Each group presented its work at the
annual undergraduate communication research day
and received feedback which could be incorporated
into the final draft submitted for grading 40% of the
course. In addition, the groups had different
combinations of self-assessment and peer-assessment
feedback. The members of the 16 groups were
randomly interviewed. Thirty-seven students in a class
of 67 responded to six interview questions.
Table 4: Interviews on Types of Feedback (n=37)
Qualitative Data on Self-, Peer- and Tutor-
Assessments: Interview Responses
Self-, Peer, Tutor Assessment (5 groups)
No group member who received peer assessment
reported any improvement but members in six groups
who did not receive any peer-assessment valued it as
profitable, helpful, and a good guide. They noted,
however, that more student awareness, time for the
process and details of the process were needed. No
member of a group which experienced the three types
of assessment referred to self-assessment or tutor
assessment as a factor that helped with the writing
process, but one group indicated that improvement in
research writing was linked to peer- assessment which
helped the group to assess its work and guided the
group’s consultation with its tutor.
Self and Tutor Assessment (3 groups)
None of the members of these groups referred to any
improvement, but a response from one group valued
peer assessment as partially helpful. No group with
self- and tutor-assessment combinations referred to
self-assessment or tutor-assessment as factor that
helped the writing process.
No Self- and Tutor-assessment (3 groups)
No members of these groups referred to any
improvement, but one response from a group valued
peer assessment as helpful but needed more tie for the
process. No member of these groups referred to self-
assessment or tutor assessment as helping the writing
process.
Peer- and Self-Assessment (2 groups)
The members from two groups which had peer-
assessment and self-assessment valued peer
assessment as helpful but other groups without this
combination also valued peer assessment.
Question Did your group Yes % No %
1 Get Peer-
Assessment?
28 78 9 22
2 Submit a Self-
Assessment?
33 89 4 11
3 Get Tutor
Feedback?
32 84 5 14
4 Use Thesis first
draft feedback to
improve final
draft?
31 84 6 16
5 Find Thesis first
draft feedback
helpful?
35 95 2 5
6 Find Research
Day feedback
helpful?
25 68 12 32
256
Proceedings of The 4th International Multi-Conference on Society, Cybernetics and Informatics (IMSCI 2010)

No Self- and Peer-Assessment (2 groups)
Members from two of the three groups with no peer-
assessment and self-assessment found peer-assessment
helpful.
Tutor-Assessment only (1 group)
No member of the one group with tutor-assessment
only (i.e. without self- or peer-assessment) referred to
self-assessment or tutor assessment as helpful to the
research writing process.
In summary the focus on valuing peer -assessment in
the responses of all groups suggests it is the most
influential factor on its own or, in combination with
other factors, which can improve research writing. It
may be considered a core type of assessment. The
students’ tendency to focus less on self- and tutor-
assessments suggests that each may be combined with
peer-assessment to explore the relative and differential
impact of each type.
5. DISCUSSION AND
CONCLUSION
Based on the findings, the quantitative data suggest
that the self-assessment and combined self- and peer-
assessment scores appear to be more stable than the
peer-assessment-only scores. This contradicts the
previous research which has found peer assessments to
be more reliable when compared to instructor scores.
It is possible that reliability alone is not enough of a
strong argument especially when those peer-instructor
correlations are found to be modest as compared with
low self-instructor correlations. It may well be that the
emphasis on reliability is based on the best available
evidence but is not forceful enough an argument as
one which advocates a broader spectrum within an
alternative framework rather than reliance on a
narrower spectrum of assessment practices based on
traditional assessment.
The value of using a mixed methods approach is that
the assertion of quantitative data can be placed next to
the complementary or counter-assertive evidence from
qualitative data findings. In this study the qualitative
finding that self- and tutor assessments supplemented
each other at times and drew attention to elements that
might have been overlooked from either assessment
perspective.
The second main finding (RQ2) that students valuing
of peer-assessment seems to contradict the suggestion
in the first main finding (RQ1) that self-assessment
and combined self- and peer-assessment scores are
more stable than peer-assessment-only scores. This
lower valuing of peer-assessment is not consistent
with previous research (Furnham & Stringfield, 1994;
Lennon, 1994), but the apparent contradiction is not so
at all. Indeed, if anything, this finding makes the point
that the student valuing of peer-assessment is as
important as the statistical test of reliability.
In conclusion, the sets of data adduced and reviewed
here emphasize that a variety of assessment practices
can contribute to improvement of collaborative
research writing among undergraduate research
students. The role of self-, peer-assessment used
together with traditional instructor assessments as part
of a repertoire of alternative reviews is important in
preparing young researchers for the development of
collaborative, reflective and critical sensibilities in a
research culture that relies on peer review and
informed criticism in the academy.
REFERENCES
[1] Zariski, A. (1996). Student peer assessment in
tertiary education: Promise, perils and practice. In
Abbott, J. and Willcoxson, L. (Eds), Teaching and
Learning Within and Across Disciplines, p189-200.
Proceedings of the 5th Annual Teaching Learning
Forum, Murdoch University, February 1996. Perth:
Murdoch University.
http://cleo.murdoch.edu.au/asu/pubs/tlf/tlf96/zaris189.
html
[2] Brown, S., Rust, C., & Gibbs, G. (1994). Involving
students in the assessment process. In Strategies for
Diversifying Assessments in Higher Education,
Oxford: Oxford Centre for Staff Development, and at
DeLiberations
http://www.lgu.ac.uk/deliberations/ocsd-pubs/div-
ass5.html
[3] Heywood, J. (2000). Assessment in higher
education. London: Jessica Kingsley Publishers Ltd.
[4] Ramsden, P. 1992 Learning to teach in Higher
Education, London: Routledge
[5] Rawson, S., & Tyree, A. L. (1989). Self and peer
assessment in legal education. Legal Education
Review, 1, 135, 137
[6] Boud, D., & Lublin, J. (1983). Self Assessment in
Professional Education: A Report to the
Commonwealth Education Research and Development
Committee, Kensington: University of New South
Wales Tertiary Education Research Centre.
[7] Biggs, J. 1999 Teaching for Quality Learning at
University, Buckingham: SRHE and Open University
Press.
[8] Bostock, S. J. (2000). Computer Assisted
Assessment - experiments in three courses. A
workshop at Keele University, May.
http://www.keele.ac.uk/depts/cs/Stephen_Bostock/doc
s/caa-ktn.htm
257
Proceedings of The 4th International Multi-Conference on Society, Cybernetics and Informatics (IMSCI 2010)

[9] Trautmann, Nancy M. (2007) Interactive learning
through web-mediated peer review of student science
reports. Educational Technology Research and
Development
[10] Rourke, L., & Kanuka, H. (2007) Barriers to
online critical discourse. International Journal of
Computer-Supported Collaborative Learning 2, 1,
105-126.
[11] Gronlund, N. E. (2006). Assessment of student
achievement (8th ed.). Boston: Pearson Publishers.
[12] McMillian, J. H. (2001). Classroom assessment:
Principles and practice for effective instruction.
Needham Heights, Ma: Allyn & Bacon.
[13] Nitko, A. J. (2004). Educational assessment of
students (4th ed.). New Jersey: Pearson/Merrill
Prentice Hall.
[14] Dobson-Lewis, M.A.C. (2008). Alternative
Assessment: An Action Research Study on the use of
Peer Assessment as a Learning Tool for Education
Students in a University in Jamaica. EABR & TLC
Conferences Proceedings Rothenburg, Germany.
[15] Dochy, F.& Segers, M. (1999). The use of Self,
peer and co-assessment in higher education: A review,
Studies in higher Education, Vol.23,3, pp331-350.
[16] Sluijsmans, D., Dochy, F. & Morekerhe, G.
(1999) Creating a Learning Environment by using
self, peer and co-assessment, Learning Environments
Research, Vol. 1, 3, pp.293-319.
[17] Bond, D.(1995). Enhancing Learning through
self-assessment. London Kogan Page
[18] Jacobs, L. C. and Chase, C. L. (1992).
Developing and using tests effectively: A guide for
faculty. San Francisco: Jossey-Bass Publishers.
[19] Falchikov, N. (1993) Group processes analysis:
self and peer assessment of working together in
groups, Educational and training technology,
International, Vol. 30, pp.275-284.
[20] Freman, M. (1995) Peer assessment by groups of
group work, Assessment and evaluation in higher
education Vol. 20,3, pp. 289-300
[21] Furnham, A. & Stringfield, P. (1994) Confidence
of self and subordinate ratings of managerial
practices as a correlative supervisor evaluation,
Journal of Occupational and Organisational
Psychology, Vol. 67, pp.57-67
[22] Lennon, S. (1995) Correlation between tutor,
peer and self assessments of second year
physiotherapy students in movement studies. In S.
Griffiths, K. Houston, & A. Lazenblatt (Eds), enhance
student learning through peer tutoring in higher
education. Section 3 – Implementing (Vol.1, pp. 66-
71) Colereaine, Nothern Ireland: University of Ulster.
[23] Falchikov, N.& Mafin, D. (1997) Detecting
gender bias in peer marking of students’ group
processes work, Assessment and Evaluation in Higher
Education, Vol. 22, 4, pp.385-396.
258
Proceedings of The 4th International Multi-Conference on Society, Cybernetics and Informatics (IMSCI 2010)
“The Fact Speaks for Itself”:
Humanistic English Education with “E-job 100” Internet Project
Akiyoshi Suzuki*
*Department of English Language and Literature,
Faculty of Letters, Konan Women’s University,
6-2-23 Morikita-cho,Higashi Nada-ku, Kobe-shi, Hyogo, 658-0001, Japan
ABSTRACT
The goal of the “E-Job 100” Internet project (http://e-job-100.sakura.ne.jp/) is to motivate students to learn English as a
foreign language and to facilitate their English ability and development of personality. This project has been supported
by Teresa Kuwamura, lecturer at Osaka Sangyo University, Japan. The website contains video recordings of scenes in
which English is used in various work places in Japan. It also contains English documents used in real work
environments. The classroom is regarded as a microcosm of society where people of various occupations are, and
students learn English and develop their personality through communication in English.
Keywords: Career Education, CLT, English Education, EFL, Humanism, the Internet, Motivation, Video
Educational Material
1. INTRODUCTION
The website of “E-job 100” contains videos that
show how people of various occupations read, write,
listen to, and speak English in their workplaces. In
addition, students can access English documents that
are used in real work environments. Students are able
to practice their English in different situations by
playing different roles after choosing their favorite
occupations. In this way, through understanding why
they need to study English, students enhance their
motivation and are driven to improve their English
ability. As society consists of people of various
occupations, in this classroom, students learn English
by practicing communication skills, such as
negotiation and cooperation, with each other in
English. What students improve are not only English
skills but also consideration and understanding of
others and suitable expressions for different situations.
English is a communication tool. Communication is to
share information with others by speaking, writing,
moving your body, and using other signals in order to
help other people understand your thoughts and
feelings. Therefore, English as a communication tool
can be used in relation to others. If a person is selfish
and does not take others into consideration and as a
result he or she is alone, do they need English skills?
In English education, development of personality as
well as English skills should be considered.
2. HOW “E-JOB 100” HAS EVOLVED
2-1. Problems of English Education in Japan
“E-job 100”, at first, started as a solution to a
specific, major problem which Japan faces in English
education for college students. The problem is a
combination of low motivation for learning English
and low academic ability. The survey of the Japan
Association of College English Teachers (JACET)
reports that almost 65% of Japanese college teachers
regarded low motivation and academic ability of
students as the biggest problem of English education
in colleges in Japan.(1) Truly, some Japanese college
students even misuse “be” and other common verbs.
This is not only due to methodology but to motivation.
Motivation for learning English in Japan has
traditionally been enhanced mainly by entrance
examinations for college. This does not work well
now. Japan faces the problem of low birthrate. For
their survival, many colleges in Japan cannot but
allow high-school students of low academic ability to
pass the examination. In addition, many colleges in
Japan admit these students without an achievement
test, requiring only a short essay in Japanese. Hence,
high-school students who are not good at English do
not learn English, and even those who are good at
English tend to avoid learning English well.(2) Many
Japanese college students get into college with low
motivation for learning English and low academic
ability.
Conversely, they recognize the importance of
English. For example, the Curriculum Research Center
in Japan reports that over 80% of pre-college students
think learning English is important.(3) This is highly
influenced by the mass media. TV, magazines, and the
Internet often say English is required of Japanese
people because of globalization. Nonetheless, the
combination of low motivation for learning English
and low academic ability has been problematic. In
short, many Japanese students recognize the
importance of English in a general way but do not see
the importance to themselves personally.
This situation derives from the Japanese social
condition. Most Japanese do not need English in their
daily lives. However, the Japanese media reports that
(1) Report of JACET, 2003.(2) Suzuki (2010), pp. 30-33.(3) http://www.nier.go.jp/kaihatsu/jissihoukoku/Taro12
-9chuei.pdf. .http://www.nier.go.jp/kaihatsu/katei_h15
/H15/03001051030007004.pdf.
259
Proceedings of The 4th International Multi-Conference on Society, Cybernetics and Informatics (IMSCI 2010)

employees in many large Japanese companies need
English language skills. As is demonstrated by their
career goals, attitudes toward learning English among
college students in Japan are diversified. Not all
Japanese college students target jobs at large
companies where English is required according to
reports in the mass media. As an example from the
school where I was teaching, there were some students
in the department of civil engineering who wanted to
run a beauty salon and a few other students wanted to
develop video games.(4) In addition, college students
in Japan cannot accurately comprehend the real work
environment due to a lack of information. Moreover,
no research has been done currently in Japan to study
a various range of occupations to determine whether
English is needed. Therefore, even when teachers tell
their students that they need English after entering the
job market, many of the students tend to take it very
lightly. (5)
2-2. “E-job 100” for Problem Solving
The first goal of the “E-job 100” project is to
answer the students’ question, “Do Japanese people
who live in Japan really need English?” Although
many Japanese do not need English in their everyday
lives, those working in some fields, such as flight
attendants or business employees in international
companies, do need it. While these examples are well
known, there are many professionals whose need for
English is less well known, such as beauty salon staff,
pharmacists, musicians, medical processors, sports
store staff, and so on.
What is the true degree of English knowledge
required by Japanese employees? To answer this
question, first I researched approximately 180 kinds of
jobs to find out whether they require English or not. I
asked people in different occupations if they need
English, when, how, at what level, how often, and for
what purpose. All the occupations except tax
accountant now require the use of English. In fact,
most Japanese now need to use some English in their
work.
At first, in order to increase students’ motivation, I
informed them of this fact which was made clear by
the questionnaire to Japanese companies, and I
showed them various documents used in real work
environments which the companies gave me. This did
not have the expected impact on students. To put
simply the reason for failure, students did not
understand how realistic the situation was. Students
regarded the documents as if a part of English
textbook. As mentioned earlier, students could not
imagine a whole picture of each job, so they could not
feel how important the English documents were for
each job and thus for their future lives: in other words,
how important English is in work places in Japan. As
a result, the failure was ascribed to the inability of the
students to comprehend the importance.
Therefore, due to the answers of the survey I sent
(4) Suzuki (2007), pp.110-113.(5) Suzuki & Kuwamura, p.156.
to the companies, I started going to each job site and
recording video of scenes in which English is used and
then recording an interview with the staff. I have
edited the video to approximately two minutes’
duration. My creed is “The fact speaks for itself”.
Since I started using the video in my English
classes, the attitudes and motivation of Japanese
college students toward learning English have
dramatically changed. Every year I conduct a
questionnaire for students in free format. Typical
answers to the questionnaire before students watch the
videos are “I hope I can get the credits very easily”, “I
don’t expect anything”, “Be enjoyable”, “Be easy”,
and “I don’t like English”. However, common answers
to the questionnaire after they watched the videos are
“I realized we need English”, “I realized the fact”, “I
need English for my future”, and “I want to learn
English spontaneously”. In the questionnaire survey in
the last class in 2007, 97.2% (74 respondents)
answered “easily comprehensible”, 90.4%
“Predigested”, and 90.2% “Interested in this class”, as
I reported in another paper.(6) The students deeply
understand the significance of English skills and start
seriously learning English.
In the questionnaire, all the students wanted to
watch the videos outside of the classroom, too, so I
started making a website which allows students to
freely watch the videos of their favorite jobs. The
concept of the website is that Japanese college
students can deeply understand the significance of
learning English with their career plan. I named the
homepage “E-job 100”. The “E” in the name of “E-
job” comes from the initials of three key words in its
concept: English, electronic, “e” [i:] (“good” in
Japanese).
2-3. Contents of “E-job 100”
Figure 1 is the top page of the website. Figure 2 is a
part of one of the top pages of each occupation. The
top page has four items: 1. “Why do they need
English?”, 2. “Required Skills”, 3. “Educational
Materials”, 4. “Job Information”. In the first item
students can watch the video records of the scenes
where Japanese people use English in their work
places in Japan.
…………
watch
the video
1.Why do
they need
English?
2. Required
Skills
3. Materials
4.Info.
Why
English
For
…….
Figure 1. Top page Figure 2. Top page of each
job (Japanese drug store)
(6) Suzuki & Kuwamura, p.158.
260
Proceedings of The 4th International Multi-Conference on Society, Cybernetics and Informatics (IMSCI 2010)

Figures 3-1 to 3-8 are the scenes of the videos. One
of the characteristics of the videos in “E-job 100” is
the range of employment sectors. Many occupations in
the range are familiar to the students and are popular
but have not been regarded as jobs where English is
needed. Another characteristic is a recording of a
scene of an English conversation with persons of
various races and nationalities. When Japanese hear
that they need English, they tend to think of
conversations with just native English speakers, such
as Americans and the British. Considered in the light
of actuality, such a slanted view should be dispelled.
Dismissing this view would make Japanese students
realize more clearly the necessity of English in Japan.
Figure 3-1. Nurse with a Chinese person
Figure 3-2. Musician
Figure 3-3. Printing CO staff with a Finnish person
Figure 3-4. Doctor with a Chinese person
Figure 3-5. Pharmacist
Figure 3-6. Waiter with a Nepalese person
Figure 3-7. Beautician with a Chinese person
Figure 3-8. Medical processor with a Saudi Arabian
person
The second item on the top page of each occupation
has the video focusing on the English skills which are
required in the workplace (Figure 4).
Figure 4. Videos by Skills
261
Proceedings of The 4th International Multi-Conference on Society, Cybernetics and Informatics (IMSCI 2010)

Figure 5 is a picture of English documents which
companies actually use in their everyday work, such
as material for meetings, invoices, e-mails, and so on.
They are in the third item of the top page of each
occupation. There, students can read the documents
and use them as a guide for writing invoices and e-
mails.
Figure 5. Materials for meeting
The fourth item of the top page of each occupation
is job information. Students can get information on
things such as job interviews, CVs, cover letters,
requirements, average salaries, and average ages of
their intended jobs.
There are not enough videos on the website now, so
I am increasing the number of videos with help of
Grants-in-Aid for Scientific Research from the
Japanese government. The current goal is 100 kinds of
occupations, as the title “E-job 100” suggests.
3. “E-JOB 100” CLASS AS HUMANISTIC
COMMUNICATIVE LANGUAGE TEACHING
FOR JAPANESE LEARNERS (HCLTJL)
As mentioned earlier, I started making the
homepage of “E-job 100” for the purpose of
increasing the motivation of Japanese college students
for learning English by making them deeply
understand the significance of learning English in
Japan by themselves. However, as the next step, when
I started making the homepage, I began thinking about
how “E-job 100” could be put into English classes
where students cannot speak or hear English. The
educational method can be introduced as Humanistic
Communicative Language Teaching for Japanese
Learners (HCLTJL).
3-1. Why Humanistic CLT?
3-1-1. Solution of the Problem of CLT in Japan
Presently, Communicative Language Teaching
(CLT) is popular in English education of Japan. This
is a counterblast against a traditional English teaching
method in Japan. English teaching in Japan was
teacher-centered and translation-centered education
for a long time. The method was criticized because
Japanese people cannot communicate in English no
matter how long they study English. With this
criticism and globalization, the current slogan of
English education in Japan is “practical English”.
From the viewpoint of motivation, however, the use
of CLT in Japan has a problem. It is a contradiction
between the principle of CLT and the facts of Japan.
Summing up David Nunan’s study, CLT has the
following five features:
1. An emphasis on learning to communicate
through interaction in the target language.
2. The introduction of authentic texts into the
learning situation.
3. The provision of opportunities for learners
to focus not only on language but also on the
learning management process.
4. An enhancement of the learner’s own
personal experiences as important
contributing elements to classroom learning.
5. An attempt to link classroom language
learning with language activities outside the
classroom.
Reality is essential for CLT. Is the use of English in
Japan realistic? Are there “language activities outside
the classroom” in Japan? CLT in Japan, first of all,
must answer this question.
To the question, I can answer “Yes” because I have
been researching. However, I started the research
because it had not been previously done and because
nobody had known the necessity of English for many
Japanese people. In other words, English was not
thought to be “outside the classroom”.
The more important point in CLT is that the
students can realize learning English in the classroom
links with activities outside the classroom. Otherwise,
they cannot think of English learning as significant
learning. It would have a bad effect on their
motivation for learning English, as Zoltan Dörnyei,
Teresa Kuwamura, and an authority on their
motiva
students cannot regard their own study as significant
learning, the best the teacher can do is that they “can
lead a horse to the water but cannot make him drink”.
“E-job 100” was created based on reality in Japan.
“E-job 100” can be effective for solving the problem
of CLT for Japanese learners.
3-1-2. Humanism
English is a communication tool. That is why CLT
emphasizes learning to communicate through
interaction in English. Communication is to share
information with others and help other people to
understand; however, without consideration of others,
it is not communication but mere monologue.
Therefore, teaching English as a communication tool
should not be just focused on improving competence
of language. It also should seriously think of the
development of the students’ personality. English
education should be education of a whole person.
This view comes not only from academic logic but
also from my experience of shooting video in work
places. I often shoot video of an interview, too (which
262
Proceedings of The 4th International Multi-Conference on Society, Cybernetics and Informatics (IMSCI 2010)

is in Japanese and students can watch on the website
“E-job 100”). The interviews made me vividly aware
of this view.
For instance, the nurse in the video says, “English is
important in our job. Of course, we must read
technical books in English to learn more and always
update knowledge, but it is not enough. Another
important job of nurse is to let a patient feel secure.
Whoever comes down with an illness feels anxious.
Now in Japan, many foreigners come to hospital or
clinic. In order to release them, a nurse should let them
speak out anything in their own words, listen to them,
and empathize and understand them. In the sense,
English is very important for us because foreigners in
Japan usually speak out anxiety in English”. The
doctor in the video also makes a similar speech. He
says, “For a doctor, the ability of English is very
important. Many foreigners in Japan desperately look
for a doctor who can speak English. When they can
meet the doctor, they really feel secure”.
Consideration, empathy, and understanding of
others are important not only in workplaces but also in
the world. We can consider, empathize, and
understand others with the use of language. Hence, the
important role of language teaching is to educate
students to consider, empathize, and understand
others. Therefore, English teachers should facilitate
the development of students’ personalities through the
practice of communication in English.
In this point, Li Xiaoju’s educational theory is
suggestive. She created Communicative English for
Chinese Learners (CECL). Its educational principle
consists of three dimensions: the ability of language,
the ability of thinking, and the ability of feeling.
Students take the central role in teaching and learning,
and they learn English by doing things with the
language on their own. Keeping these three
dimensions in mind, teachers facilitate students’ study
and development of personality.(7)
I observed English classes of Deng Xiaotao, who is
one of Li’s pupils and an English teacher at
Guangdong University of Foreign Studies. She
effectively practiced CECL. Whenever she introduced
and explained something new to students, such as
English expressions, grammar, and words, she let
them think of others’ feelings and try to empathize and
understand them. In other words, she always makes
students understand the meaning of expressions,
grammar, and words from the viewpoint of
consideration of others in the real, human world. In
this way, she practices Li’s three-dimensional English
education and successfully facilitates students’
English ability and the development of their
personality. It is a whole person education.
Though a teaching model of HCLTJL with “E-job
100” is introduced in the next section, the
methodology has a great influence from Li’s CECL
and Deng’s practice in her English classes.
(7) Li, pp.3-116.
3-2. Teaching the Model of HCLTJL with “E-job
100”
Students are required to play roles by mainly
speaking and hearing English needed for their
intended future job. The classroom which is used is
usually a CALL (Computer Assisted Language
Learning) classroom. Students access the website “E-
job 100” and research both their favorite job and the
use of English in workplaces in order to deeply
understand the significance of learning English by
themselves.
Based on their motivation for learning English,
first, students build the basis for communication in
English. For this purpose, they make a presentation
about goods or services to introduce them to selling.
They write sentences for the introduction, following
some patterns of paragraph writing from English for
Academic Purposes (EAP) which their teacher gives
them. After their teacher reviews what they wrote,
they memorize it. Then they each make a presentation.
Following this, the teacher gives each speaker
feedback and asks several questions. The questions
include ones about goods or services about which they
did not remark. This is done so students can practice
speaking English with a wide application of the
English sentences which they memorized. According
to the teacher’s feedback and questions, the students
will need to conduct more research on the Internet,
rewrite and memorize their presentations, and then
present again.
During the second presentation, the rest of the
students pretend to be the clients and the customers.
The listeners ask a couple of questions of the speaker
after their presentation as the teacher did. This enables
students to become accustomed to communicating in
English and to practice it amongst other students.
The second step is that each of the students
memorizes the conversations which are short and
simple but essential for his or her intended future job.
Students learn them in the second and the third items
on the top page of each occupation on the “E-job 100”
website. For example, a student who chose postal
worker memorizes the following conversation.
C: This is a notice of delivery. Do you have a
package for me?
P: Yes. Do you have an ID?
C: Why do you need to see my ID?
P: For security reasons.
C: I have it. This is my ID.
P: Thank you. Do you have a stamp?
C: Oh, I’m sorry, I don’t have it.
P: Then, could you sign here please?
C: Yes.
P: Thank you. Here you are. Here is your package.
C: Thank you. Have a nice day.
P: You too.
After this, students pair up, and both memorize
conversations with each other. Students start
practicing the conversations. In the practice, they are
required to introduce goods or services for selling and
263
Proceedings of The 4th International Multi-Conference on Society, Cybernetics and Informatics (IMSCI 2010)

to create some questions. Changing pairs, students
repeat this practice, so they can get more used to
English conversation and express more of what they
want to say and ask.
The third step is task-based learning. The teacher
gives each student a set of directions: for instance,
“First, go to the post office to pick up your package.
Second, talk about at least five kinds of medicine with
a visitor in the post office. Finally go to a computer
shop, ask about some computers and get an invoice
from the clerk”.
The teacher gives each student a different direction
every week. Of course, the teacher must create the
directions based on the range of occupations which
students chose, of what they learned, and of what they
can learn by themselves on the “E-job 100” website
and the Internet.
The teacher walks around in the classroom. He or
she supports the students’ communication in English,
corrects errors, and sometimes joins students’
conversations. In addition, the teacher reminds
students of consideration, empathy, and understanding
of others and teaches them English expressions
suitable for them.
4. EFFECT
I practiced the teaching model in one of my English
classes in 2009. I conducted a questionnaire for
students in free format in the first class and the last
class (31 respondents).
To the questionnaire in the first class, 97% of the
students answered “Japanese do not need English as
long as they live in Japan”. On the other hand, in the
questionnaire survey in the last class, 100% answered
“I need English”.
Regarding their communication ability, nobody
could communicate with people in English in the first
class. However, as time went by, they began to
spontaneously communicate with each other in
English. In the last class, their communication in
English still sometimes needed support from the
teacher, but they could manage to communicate with
me solely in English. In addition, they could express
thoughtful words.
In the process of class, students grew in the
competence of language and in personality as well.
5. CONCLUSION
“E-job 100” has been created to increase the
motivation of Japanese college students for learning
English by showing them the reality that English is
used in many various occupations in Japan. The
classroom is regarded as a microcosm of society
where people of various occupations are, and students
learn English and develop their personalities through
communication in English. Students realize the reality
and develop their English ability and personality in
real situations.
“E-job 100” can bring Japanese college students
and English closer together. Japanese college students
learn English as a foreign language (EFL). A method
like “E-job 100” might be effective for learners of
EFL in other countries, too.
REFERENCES
[1] Committee of the Survey in Japan Association of
College English Teachers (JACET), “A
Multidisciplinary Research on the Reality of the
Situation about Education of Foreign Languages
and English in Japan Individual’s Edition of
College Teacher of Foreign Languages and
English”, Tokyo: Japan Association of College
English Teachers, 2003.
[2] A. Suzuki, “On Solution of Deficiencies of CALL
Educational Theory Educational Potential of “e-
job 100” , On Effective Utilization of CALL in
Education of Foreign Languages, Osaka: The
Institute for Industrial Research of Osaka Sangyo
University, 2010, pp. 11-59.
[3] Curriculum Research Center at National Institute
for Educational Policy Research, “Report of the
Situation of the Implementation of the Curriculum
in Elementary and Junior High Schools in 2001:
English in Junior High School”, available at
http://www.nier.go.jp/kaihatsu/jissihoukoku/Taro1
2-9chuei.pdf. (In Japanese), 2003.
, “Report of the Situation of the
Implementation of the Curriculum in Elementary
and Junior High Schools in 2003: English in Junior
High School”, available at
http://www.nier.go.jp/kaihatsu/katei_h15/H15/030
01051030007004.pdf. (In Japanese), 2005.
[4] A. Suzuki, “For a New Student-Centered English
Education with a High Regard for Their
Motivation “Moving Video Picture Database:
English in Diverse Job Sites in Japan ”, A Study
of University Foreign Language Teaching in the
New Era, Osaka: The Institute for Industrial
Research of Osaka Sangyo University, 2007, pp.
83-150.
[5] & [6] A. Suzuki & T. Kuwamura, “E-job 100
Project: CALL for Increasing Motivation for
English Learning in Japan,” The proceeding of
World CALL 2008: Using Technologies for
Language Learning 3rd International
Conference, 2008, pp.155-158.
[7] X. Li, English Education and Testing,
Guangdong: World Publishing Co., 2000.
D. Nunan, Language Teaching
Methodology, London: Prentice Hall, 1991
C.R. Rogers, Freedom to Learn: A View of What
Education Might Become. Columbus: Charles E.
Merrill, 1969.
T. Kuwamura, On Theoretical Application and its
Practice of Carl Rogers’s “Student-Centered
Education” in Foreign Language Education, Nara:
Nara Women’s University, Forthcoming.
Z. Dörnyei, Motivational Strategies in the Language
Classroom. Cambridge: Cambridge University Press,
2001.
264
Proceedings of The 4th International Multi-Conference on Society, Cybernetics and Informatics (IMSCI 2010)

Significant Factors in Students’ Motivation to learn English –
A Case Study at One Private University in Southern Taiwan
Jui-Han Wu
Department of Foreign Languages, Kao Yuan University
Lujhu Township, Kaohsiung County, 821 Taiwan
and
Chih-Che Liu
Department of Foreign Languages, Kao Yuan University
Lujhu Township, Kaohsiung County, 821 Taiwan
ABSTRACT
A quantitative research methodology was used to
investigate what factors were significant in students’
motivation when they participated in English courses at
one private technology university in southern Taiwan.
This study utilized a Chinese translation of the
Motivated Strategies for Learning Questionnaire (MSLQ)
to survey 1,300 students who participated in English
courses. 1,280 surveys were returned (98.46%), of
which 1,254 were valid (96.46%). The statistical
analysis included frequencies, percentages, mean scores,
independent-samples t-tests, and one-way ANOVAs
with post hoc tests by using SPSS 13.0 for Windows
with a confidence level of 95%.
The Motivation Scales includes six dimensions –
intrinsic goal orientation, extrinsic goal orientation, task
value, control of learning beliefs, self-efficacy for
learning and performance, and test anxiety. The results
showed that students rated themselves from 3.72 to 4.92
within the dimensions. Students were most in agreement
with statements about control of learning beliefs. They
reported less agreement with statements that showed
self-efficacy for learning and performance. Students
believed that they were able to control their learning if
they wanted to; however, they didn’t perceive enough
self-efficacy regarding their English learning and
performance.
Keywords: Motivation, Control of Learning Beliefs,
Self-efficacy, English learning.
INTRODUCTION
As Taiwan has moved toward globalization, students
need competence in English in order to communicate in
the world market. The Taiwanese government has been
engaged in educational reforms and promoted the
importance of English. However, tests, such as the
General English Proficiency Test (GEPT) and the Test of
English as a Foreign Language (TOEFL), show poor
English proficiency in Taiwan. This study aimed to
investigate college students’ motivation to learn English.
It will be a benefit if college English teachers adjust
their teaching methods based on the students’
motivational factors in English courses. Teachers will be
able to teach their students more effectively; on the other
hand, students will be able to help themselves be
motivated to learn English and have better performance.
Traditional Chinese parents have high expectations for
265
Proceedings of The 4th International Multi-Conference on Society, Cybernetics and Informatics (IMSCI 2010)

their children. Taiwan’s cultural strengths include an
intense commitment to children and their education
(Lunetta & Lederman, 1998). Education is influenced
deeply by the Confucian value system; therefore,
nobility is found in learning. It not only encourages
parents to pay more attention to their children’s
education, but also to motivate students to learn so they
might have a brighter future. This has resulted in
excessive competition and pressure to pursue higher
education.
The following reasons may explain why Taiwan’s
college students lack English proficiency. College
students are often only required to take two to four
English courses within four years depending on their
entrance English level, except for the students who
major in English. Also, most college and university
instructors give lectures using the Chinese version of the
textbooks which does not promote English learning.
Another reason is that many private schools were
established after the educational reform. Many colleges
and universities are available for students to select to
attend, and the requirements for students’ admission are
lower. Therefore, even students with poor English
proficiency can study in colleges and universities.
The traditional education in Taiwan is an educational
banking system, which focuses on filling students’ heads
with course content. According to Paulo Freire (2003),
education thus becomes an act of depositing. Teachers
make deposits of information, and students receive,
memorize, and repeat. The students may become passive.
Motivation emphasizes the importance of reinforcing the
belief that students have some self-control over what is
occurring in their lives. Therefore, teachers should
provide directions to successful instruction. Students are
more likely to thrive in environments in which they feel
comfortable, accepted, and valued (Strahan, 1989). In
order to improve college students’ English proficiency, it
is very important to know the motivational orientations
students perceived in English courses.
PURPOSE OF THE STUDY
The purpose of this study was to investigate what factors
were significant in students’ motivation when students
participated in English courses at one private technology
university in southern Taiwan. This research utilized a
Chinese translation of the Motivated Strategies for
Learning Questionnaire (MSLQ) to survey students to
gather quantitative data. The research question was to
investigate if there is a significant difference in
motivational orientations among demographic groups.
LITERATURE REVIEW
Expectancy theory has been recognized as one of the
most promising conceptualizations of individual
motivation (Ferris, 1977). It was originally developed by
Vroom in 1964. According to Robbins (2003), the theory
focuses on three relationships:
1. Effort-performance relationship, the
probability perceived by the individual that
exerting a given amount of effort will lead to
performance.
2. Performance-reward relationship, the degree
to which the individual believes that
performing at a particular level will lead to
the attainment of a desired outcome.
3. Rewards-personal goals relationship, the
degree to which organizational rewards
satisfy an individual’s personal goals or needs
and the attractiveness of those potential
rewards for the individual. (p. 173)
Expectancy theory has a long history in the
psychology of learning (Tolman, 1932). Chen and Lou
(2004) believe that expectancy models are cognitive
explanations of human behavior that cast a person as an
266
Proceedings of The 4th International Multi-Conference on Society, Cybernetics and Informatics (IMSCI 2010)

active, thinking, predicting creature in his or her
environment. He or she continuously evaluates the
outcomes of his or her behavior and subjectively
assesses the likelihood that each of his or her possible
actions will lead to various outcomes. If a particular
approach has been successful in a wide range of
situations, a person will develop a strong generalized
expectancy for success when using that approach,
regardless of situation (Rotter, 1975). Therefore, the
view of learning as a process of acquiring information
about relationships between events introduces
expectancies as intervening cognitive variables that
represent this information (Bolles, 1972, 1979; Rescorla,
1987, 1990).
Pintrich and Schunk (2002) identify three recent
advances in expectancy research of value to teachers.
First, the expectancy-value model, led by Eccles (1983)
and Wigfield (Wigfield & Eccles, 1992), looks at
students’ expectancy of success and how they perceive
their ability to cope with academic tasks. They also
found that both expectancy and perceived ability are
highly related to classroom achievement and
performance on standardized test scores. The second is
children’s perceptions of their own competence
(self-perception of ability). Harter (1982) concludes that
the majority of pupils are fairly accurate in their
self-estimates of ability in conventional school subjects,
such as math, English, history, and chemistry. Third,
self-efficacy (Bandura, 1986) has been alluded to above
in the section on goal-orientation. According to Bandura
(1995), self-efficacy theory addresses the origins of
beliefs of personal efficacy, their structure and function,
the processes through which they operate, and their
diverse effects. Self-efficacy is how strong people rate
their competence in doing a task in order to achieve a
desired goal. It also correlates well with school
achievement and standardized tests.
Bandura (1977) made a distinction between efficacy
expectations and response outcome expectancies.
“Outcome expectancy” is defined as the individual’s
estimate that a given behavior will lead to specific
outcomes. An efficacy expectation is the conviction that
one can successfully execute the behavior that is
necessary to produce the outcomes. Expectancy beliefs
are judgments of capability to attain designated types of
performances. Those beliefs that have received the bulk
of attention in academic motivation studies have been
self-concept (Marsh, 1990; Skaalvik, 1997),
self-efficacy (Pajares, 1996; Schunk, 1991), and
confidence to use self-regulatory practices (Zimmerman,
1989; Zimmerman & Schunk, 1989). In addition, the
most extensively researched problem-solving
generalized expectancy is locus of control of
reinforcement (Phares, 1976; Rotter, 1966). Based on
these theories, one should expect to succeed to the
extent that one can control his or her successes and
failures. Rewards have been a way to manipulate
student’s motivation and learning. According to Schultz
(2006), “rewards elicit two forms of behavioral reactions,
approach and consumption” (p. 94). Reward expectancy
is proposed to be a major component of the central
motivational state underlying approach behavior
(Schultz, 2000).
METHODOLOGY
The quantitative research method was used for a
large sample of college students from a stratified cluster
sampling of their English class level (I, II, III, and IV),
and randomly chosen by class to answer the
questionnaire (MSLQ). This questionnaire assessed
students’ motivational orientations when they
participated in English courses at one private university
in southern Taiwan.
The Motivated Strategies for Learning Questionnaire
267
Proceedings of The 4th International Multi-Conference on Society, Cybernetics and Informatics (IMSCI 2010)

(MSLQ) was designed and developed by a team of
researchers from the National Center for Research to
Improve Postsecondary Teaching and Learning
(NCRIPTAL) and the School of Education at the
University of Michigan in 1991. The motivation section
contains six dimensions: Intrinsic Goal Orientation,
Extrinsic Goal Orientation, Task Value, Control of
Learning Beliefs, Self-Efficacy for Learning and
Performance, and Test Anxiety. There are 31 items.
The demographic data included students’ age, gender,
high school completion (senior high school, vocational
high school, or 5-year junior college), class level
(freshman, sophomore, junior, or senior), whether they
study in day school or in night school, college division
(College of Design, College of Applied Social Sciences,
College of Informatics, or College of Management),
English course level (English Level I, English Level II,
English Level III, or English Level IV), how many hours
per week they work for pay, how many hours a week
they study English excluding English classes, and
whether they have taken any English proficiency
examinations (GEPT, TOEFL, IELTS, ILTEA, CSEPT,
TOEIC, or others), whether they passed the school’s
English graduation requirement. The researcher
investigated differences in motivation between gender,
high school completion (senior high school and
others–vocational system), day or night school, whether
they have taken any English proficiency exam and
among different groups of age, class level, college
division, English course level, working hours, and
studying hours.
The researcher reported the reliability and validity
of the survey instrument. After deleting one statement
and rearranging one statement, the revised Cronbach
alpha coefficients of each dimension and the overall
instrument were from .66 to .90. Factor analysis was
used to access the validity of the survey instrument.
Descriptive analysis presented students’ demographic
information, including age, gender, high school
completion, class level, day school or night school,
college division, English course level, working hours,
studying hours, and whether they have taken any
English proficiency examination for the school’s English
graduation requirement.
The research hypotheses used either an
independent-samples t-test or one-way ANOVA to test
the differences in every dimension of motivation
orientations based on demographic variables: age,
gender, high school completion, class level, day school
or night school, college division, English course level,
working hours, studying hours, and whether they have
taken any English proficiency examination for the
school’s English graduation requirement.
RESULTS
The results showed that students rated themselves from
3.72 to 4.92 within the dimensions. Students were most
in agreement with statements about control of learning
beliefs. They reported less agreement with statements
that showed self-efficacy for learning and performance.
Students believed that they were able to control their
learning if they wanted to; however, they didn’t perceive
enough self-efficacy regarding their English learning
and performance.
The statistical results showed that significant factors
were found in students’ motivational orientations in
relation to the demographic variables: age, gender, high
school completion, class level, day school or night
school, college division, English course level, working
hours, studying hours, and whether they have taken any
English proficiency examination for the school’s English
graduation requirement. Notably, studying time was the
most determinant demographic variable to affect
students’ motivation in learning English. The more time
268
Proceedings of The 4th International Multi-Conference on Society, Cybernetics and Informatics (IMSCI 2010)

students spent studying English, the more motivation
they had in learning English. Table 1 summarized the
results of significant differences in the six dimensions of
the Motivation Scales in relation to demographic groups.
Table 1
Significant Differences in the Six Dimensions of the
Motivation Scales
Demographics Significant Differences in the
Motivation Scales
Age Test anxiety
Gender No significant differences
High School
Completion
Self-efficacy for learning and
performance
Class Level Self-efficacy for learning and
performance, test anxiety
Day or Night
School
Task value
College
Division
Self-efficacy for learning and
performance
English Course
Level
Intrinsic goal orientation
Working Hours Task value
Studying Hours Intrinsic goal orientation, extrinsic goal
orientation, task value, control of
learning beliefs, self-efficacy for
learning and performance
Took an Exam
or not
Self-efficacy for learning and
performance
Note. N=1,254.
RECOMMENDATIONS
Several recommendations were presented in this study.
First, English is a tool to communicate with people from
other countries in this global village and information age.
The value of English should be addressed in order for
students to sharpen their English skills. Second, real-life
English should be taught in the classroom because
English is a language which can be used in daily life. It
can also fill students’ learning needs. Third, interactive
teaching should be employed when teaching students
English. Building an interactive learning environment
can benefit all students. Through the class activities,
students are involved in their own learning. Finally,
teachers should increase students’ self-efficacy for
learning and performance with care and praise instead of
punishment in order to encourage and motivate them to
learn English. Students with higher motivation were
willing to better their English proficiency.
REFERENCES
Bandura, A. (1977). Self-efficacy toward a unifying
theory of behavior change. Psychological Review,
84, 191-215.
Bandura, A. (1986). Social foundations of thought and
action: A social cognitive theory. Englewood
Cliffs, NJ: Prentice Hall.
Bandura, A. (1995). Self-efficacy in changing societies.
Cambridge, MA: Harvard University Press.
Bolles, R. C. (1972). Reinforcement, expectancy and
learning. Psychological Review, 79, 394-409.
Bolles, R. C. (1979). Learning theory (2nd Ed.). New
York: Holt, Rinehart and Winston.
Chen, Y., & Lou, H. (2004). Students’ perceptions of
peer evaluation: an expectancy perspective.
Journal of Education for Business, 79(5), 275-282.
Eccles, J. S., Adler, T. F., Futterman, R., Goff, S. B.,
Kaczala, C. M., Meece, J., & Midgley, C. (1983).
Expectancies, values and academic behaviors. In J.
T. Spence (Eds.), Achievement and achievement
motives (pp. 75-146). San Francisco: Freeman.
Eccles, J. S., & Wigfield, A. (2002). Motivational beliefs,
values, and goals. Annual Reviews Psychology, 53,
109-132.
269
Proceedings of The 4th International Multi-Conference on Society, Cybernetics and Informatics (IMSCI 2010)
Ferris, K. R. (1977). A test of the expectancy theory as
motivation in an accounting environment.
Accounting Review, 52(3), 605-614.
Freire, P. (2003). Pedagogy of the oppressed (30th ed.).
New York: Continuum International Publishing
Group.
Harter, S. (1982). The perceived competence scale for
children. Child Development, 53, 87-97.
Lunetta, V. N., & Lederman, N. G. (1998). Reform of
science education in Taiwan: contexts,
opportunities, and concerns. Proc. Natl. Sci. Counc.
ROC(D), 8(3), 121-131. Retrieved Nov. 1st, 2005,
from
http://nr.stic.gov.tw/ejournal/ProceedingD/v8n3/12
1-131.pdf
Marsh, H. W. (1990). The structure of academic
self-concept: The Marsh-Shavelson Model.
Journal of Educational Psychology, 82, 623-636.
Pajares, F. (1996). Self-efficacy beliefs in academic
settings. Review of Educational Research, 66,
543-578.
Phares, E. J. (1976). Locus of Control in Personality.
Morristown, NJ: General Learning Press.
Pintrich, P. R., & Schunk, D. H. (2002). Motivation in
education: Theory, research, and applications (2nd
ed.). Englewood Cliffs, NJ: Prentice Hall.
Rescorla, R. A. (1987). A Pavlovian analysis of
goal-directed behavior. American Psychologist, 42,
119-129.
Rescorla, R. A. (1990). The role of information about
the response-outcome relation in instrumental
discrimination learning. Journal of Experimental
Psychology: Animal Behavior Processes, 16,
262-270.
Robbins, S. P. (2003). Organizational behavior (10th ed.).
Upper Saddle River, NJ: Prentice Hall.
Rotter, J. B. (1966). Generalized expectancies for
internal versus external control of reinforcement.
Psychological Monographs, 80 (1), 609.
Rotter, J. B. (1975). Some problems and misconceptions
related to the construct of internal vs. external
control of reinforcement. Journal of Consulting
and Clinical Psychology, 43, 56-67.
Schultz, W. (2000). Multiple reward signals in the brain.
Nature Review Neuroscience, 1, 199-207.
Schultz, W. (2006). Behavioral theories and the
neurophysiology of reward. Annual Reviews
Psychology, 57, 87-115.Schunk, D. H. (1989).
Social cognitive theory and self-regulated learning.
In B. J. Zimmerman & D. H. Schunk (Eds.),
Self-regulated learning and academic achievement:
Theory, research, and practice (pp. 83-110). New
York: Springer-Verlag.
Skaalvik, E. (1997). Issues in research on self-concept.
In M. Maehr & P. R. Pintrich (Eds.), Advances in
motivation and achievement (Vol. 10, pp. 51-97).
Greenwich, CT: JAI Press.
Strahan, D. (1989). Disconnected and disruptive
students. Middle School Journal, 21(3),
1-5.Tolman, E. C. (1932). Purposive behavior in
animals and men. New York: Century.
Vroom, V. C. (1964). Work and motivation. New York:
Wiley.
Zimmerman, B. J. (1989). A social cognitive view of
self-regulated academic learning. Journal of
Educational Psychology, 81, 329-339.
Zimmerman, B. J., & Schunk, D. H. (1989).
Self-regulated learning and academic achievement:
theory, research, and practice. New York:
Springer-Verlag.
270
Proceedings of The 4th International Multi-Conference on Society, Cybernetics and Informatics (IMSCI 2010)

Poetiks: A JISC-funded Project to Enhance the Learning and Teaching of Poetic Technique
Dr Greg Garrard, Department of English and Cultural Studies,Bath Spa University, Bath, UK
Anthony Head and Andy Bevan, Department of Graphic Communication Design, Bath SpaUniversity, Bath, UK
AbstractThe Poetiks Project (www.poetiks.net) will produce aweb-based application to support the learning,teaching and assessment of poetry, with a specificemphasis on poetic technique. Using a combinationof annotation, mark-up and semi-automatedfunctions, it will help students to avoid commonerrors, and guide them towards deeper responses topoetry.
Key words: poetic technique, elearning, eassessment,humanities computing
The ProblemPoetry is a core element of English Literature in theUK from primary school to degree level. The centraldifficulty in teaching it is to communicate thecharacter and significance of its difference as a genrefrom fictional prose (most students’ favourite),without ‘technique’ becoming a repetitive androutine basis for analysis. Although a few EnglishLiterature students are passionate andknowledgeable about poetry, the majority of thosestraw-polled by the lead investigator over ten yearsevinced fear of poetry, seeing it as a fiendish codedevised by the author to disguise the real meaning ofthe poem. The lecturer is a proxy for the author,cruelly withholding the truth from students.Alternatively, poetic meaning is seen – equallywrongly – as wholly subjective.
Those who go on to become teachers may then teachpoetry reluctantly and, in some cases, poorly,creating a cycle of anxiety, demotivation and lowachievement. Poetic technique comes to be seen notas an application of experience, intelligence, a senseof tradition (accepted or rejected, but known) andtalent, like other sorts of artistry, but as a checklist ofarbitrary features. One student said he’d been taughtto read a poem as a combine harvests a field ofwheat, processing it for its crop of alliteration,imagery and so on. A key indication is that fewEnglish graduates understand rhythm and meter,which are absolutely intrinsic to poetry but notamenable to ‘technique spotting’. KS4 [Key Stage 4]learning materials seldom if ever attempt to teachmetrical analysis.
A recent OFSTED [UK schools inspectorate] report,‘Poetry in Schools’, assessed poetry teaching as‘satisfactory’ across all schools surveyed, but pointedout that it tended to be worse than other areas of
English provision, and said that ‘many teachers,especially in the primary schools, did not knowenough about poetry’. Only eight out of eighty-sixhad ‘outstanding’ poetry programmes. The worstteachers used ‘didactic’ approaches orientatedtowards tests and exams, while the best introduceda wide range of poems and adopted ‘active’ teachingapproaches. A blend of creative writing and analysiswas recommended for maximum benefit.
The situation in HEIs is also troubling:
! Professor Overton (Loughborough)published the results of a survey of theteaching of versification in ‘English’ vol.57,no.2019 (2008), pp.266-82. He found therewas 'a widely shared belief among highereducation teachers that knowledge ofprosody is important, and an equally widelyshared perception that most studentsentrée higher education without it', andconcluded that ‘many remain functionallyilliterate as readers of verse’ at graduation.It is crucial both to teach the technicalterminology of versification in anunintimidating fashion, and to enablestudents to connect the details of poetictechnique with questions of meaning.
! Professor Regan (Head of English,Durham) observed the disparity betweenthe increasing public profile of poetry andits attenuation within a literary education,concluding that ‘we have to rethink the waythat poetry is currently being taught’. (ESCNewsletter 2, August 2001)
! Dr D’Agostino (Head of English, QueenMary’s UC) argued that a poem should be‘listened to and appreciated for what it is inits own linguistic terms’ rather thanimmediately being referred to a largerhistorical or theoretical issue. (ESCNewsletter 5, April 2003)
! The English Benchmark says that studentsshould have ‘knowledge and understandingof the distinctive character of … poetry’, butas Dr Nicole King (Academic Coordinator,ESC) has pointed out on the ESC website,students are often hostile to poetry, seeingit as ‘“difficult” or alien, and thereforeuninteresting’.
271
Proceedings of The 4th International Multi-Conference on Society, Cybernetics and Informatics (IMSCI 2010)

The challenge is therefore to develop an exciting andsophisticated application for secondary and tertiarylevel, using active learning principles to teach poeticform and technique, and to enrich creative writing.
The pedagogical approach adopted for ‘Poetiks’ isbased on the Dr Garrard’s ten years of experienceteaching a level five (mid-degree) poetry course.Paper or Overhead Projector (OHP) slides areinadequate to represent the complexity and densityof techniques and features found in a quality poem,and of course are incapable of generating automaticfeedback. Test functions built in to Virtual LearningEnvironments (VLEs) can provide crude feedback,but cannot be customised by learners, and provideno annotation tools. Interactive whiteboards allowfor a degree of annotation, but are not accessible tolearners outside the teaching room. While adownloadable application was the original plan, aweb-based application would be more easilyaccessible in schools, where tight control is exercisedover downloads.
ResponseUsing pedagogical research funding, Poetiks hasbeen developed at Bath Spa University, in acollaboration of English and GraphicCommunication, to proof of concept stage. Theapplication is now under development with fundingfrom a Learning and Teaching Innovation Grantfrom the Joint Information Services Committee(JISC). It is an ambitious, scaleable web applicationthat promises to transform teaching, learning andassessment of poetry at secondary and tertiary level.
Users will copy and paste any poem into theapplication, then analyse and annotate it through aseries of translucent, functionally-independent‘layers’. While only one layer will be prominent atany one time, all the layers will be visible as a three-dimensional constellation of highlights and notes atall times, so that – in addition to the insightsgenerated within each layer – the user will be able tosee the poem as ‘system of systems’, in the words ofpoetic theorist Yuri Tynyanov: semantic, rhythmic,phonemic and other patterns in the poem will bevisibly juxtaposed. At the same time, each layer willcontribute its own element of functionality andpedagogical feedback: some will carry out complexoperations on the poem, while others will act mainlyas annotation sites. Users will be able to customisePoetiks by adding and removing layers. Theinstructor or learner(s) will work up the poem into aunique, richly-annotated palimpsest of readings andresponses that can be presented in a lecture,discussed in a seminar, or saved for assessment.Poetiks will also be invaluable for facilitating creativewriting workshops, enabling detailed feedback to beefficiently compiled and communicated to the writer.
Ultimately, the layers will be organised under fiveheadings: Sounds, Words, Structures, Contexts,Responses. The final list of layers will bedetermined by the enthusiastic group of British andNorth American subject and IT specialists who haveagreed to be consulted in the process of Poetiks’sdevelopment, but the core layers are:Sounds
! Rhythm. Since there are broadly twoaccepted methods of ‘scanning’ poetry –Greco-Roman and Modern English –Poetiks provides a functional layer for each.It identifies syllables and fixed stresses,thereby eliminating a common source oferrors, and provide feedback on the user’schoice of stress pattern. A ‘read-back’function allows users to record and reviewtheir own performance of the poem,because the first reading of a poem is oftencorrect.
! Phonemes. This layer facilitatesidentification of patterns such as rhyme,alliteration and assonance, and guides theuser in the more difficult task of ascribingsignificance to those they find. Wordsidentified by the user are extracted from thepoem for consideration, and a hierarchicallist of options for the meaning of thepattern is provided.
Words! Lexis. Oxford University Press hasexpressed an interest in developing aninterface that would allow Poetiks to ‘fetch’definitions and etymologies from the OEDdatabase.
! Clozing. This layer would facilitate theengagement of learners in activeconsideration of diction.
! Semantic cloud. Poetiks might incorporateexisting applications that provideconcordance analysis of poetic language.
Rhythm and phonemes are conceptualised as thecentre of the functionality of Poetiks. Other layerscould include imagery, syntax, phonolexis, voice,lineation, sequencing, stanzaic form, rhetoric,emoticons, performance, history, ekphrasis andstructures. Poetiks is envisaged as a webapplication, but would work well on interactivewhiteboards.
InnovationIt is quite surprising that nothing like Poetiks existsas yet. Online resources relating to poetry come infive types:
1. Archives of spoken, scanned or plain /hypertext poems, often with substantialhistorical and contextual material (e.g.World War I Poetry Archive).
272
Proceedings of The 4th International Multi-Conference on Society, Cybernetics and Informatics (IMSCI 2010)

2. Workshops on creative writing practices,mainly secondary level (e.g. BECTA studieson podcasts and use of MovieMaker toenhance poetry teaching).
3. ‘Electronic poetry’ and online magazines.4. Worksheets on scansion and othertechniques posted on university sites.
5. Corpus analysis (e.g. WMatrix, WordSmith)and idea-mapping tools (e.g. Compendium).
Clearly, 1-3 are largely irrelevant to the projectproposed. The worksheets cover some of the samematerial as Poetiks, but are either wholly static oroccasionally minimally interactive, e.g. BOLSTER atthe University of Virginia, that models and testsscansion with pre-selected poems. The annotationfunctions proposed for Poetiks are similar tomapping tools; like them, it will appeal to studentswith a range of learning styles, and will highlightintermediate thinking processes. Corpus analysis,moreover, is a function that should be incorporatedwithin Poetiks: students could then more easily seethe patterns of semantic prevalence and relationshipin a poem. However, existing tools are quitespecialised, requiring pre-marked texts (sometimesin phonetic script), while the mapping tools aremerely annotative. None addresses more than asingle aspect of textual meaning at once.
The only genuinely functional application related topoetic technique I have discovered online is CharlesHartman’s ‘Scandroid’, which algorithmicallydetermines the rhythmic pattern of any poem pastedin. Professor Hartman has agreed to act in aconsultative capacity in the development of Poetiks,although the latter will work quite differently insolving only the problem of word stress in scansion;the learner will have to identify all other stresses.Rather than modelling or completing scansionexercises, Poetiks will eliminate common sources oferror, provide advice and support a process ofproductive iteration. The phonemic pattern, lexicalretrieval and automated pedagogical tool functionsare all wholly original, although teachers can doclozing and sequencing exercises efficiently usingelectronic whiteboards.
Besides its distinctive functions, Poetiks isinnovative in its use of a sophisticated, multi-dimensional interface that is designed actively topromote a complex, layered sense of poetic meaning.Furthermore, its layering system allows for amultiplicity of approaches, from identification ofimagery (enhanced by tags relating to specific sensesso learners can distinguish visual, olfactory andother types) to emoticon tagging that wouldencourage learners to record and reflect upon theiremotional reactions to poems – a rare pleasure insome poetry courses. Finally, the flexibility ofPoetiks – built around several core functions relating
to poetic technique but capable of being scaled upor down, or having user-defined layers added – willencourage uptake at all levels of education, andthereby ensure sustainability.
ChallengesThe central challenge is to design a Graphical UserInterface that is appealing to digital native students,but which remains capable of communicatingclearly the complex information accumulated by theapplication. The ‘layers’ approach is a proven designconcept that, combined with tagging, achieves thisobjective.
The key challenge in terms of functionality is toensure accurate division of polysyllabic words intheir component syllables, and the correctallocation of fixed stresses. Having syllabised thewords in the poem, Poetiks tags them as parts ofspeech (because in some cases homolexemes havedifferent stresses according to whether they arenouns or verbs), and then adds fixed stressesalgorithmically. Nevertheless, the programmerequires an extensive exceptions list to handle therange of spoken and historical English. Finally, theinterface allows the student to modify fixed stress incases where Poetiks makes a mistake, or else themetrical or semantic demands of the poem requiredeparture from the usual stress pattern.Syllabification is also essential for accurateidentification of phonemes.
Since the application will be web-based, it will needto be able to save poems that are being worked onby users for later retrieval. It will also need to allowprivileged access to poems so that instructors canmark them. If used for assessment, Poetiks willincorporate both a marked-up rich text of the poem,and a synoptic essay saved along with the poem.The reliability of servers will therefore be a keytechnical requirement.
Finally, Poetiks will invite users to paste in modernpoems to work on, and will then store them online.It will be crucial to protect the copyright of theauthors and publishers of poems by limiting accessto them to the user and instructor alone.
The JISC funded project started in November 2009and the first functioning public release of Poetikswill be October 2010. It will have been tested bystudents and experts, and will contain the mostimportant functions described above. At the time ofwriting (May 2010), most of the core functions havebeen implemented and early testing has begun,which is helping refine the solutions devised by theresearchers.
273
Proceedings of The 4th International Multi-Conference on Society, Cybernetics and Informatics (IMSCI 2010)

eTEVAL Pilot Project: Migrating Teacher Evaluations to the Online Environment Dr Shelley Kinash, Director [email protected]
Lauren Hives, Multimedia Developer Diana Knight, Project Officer
(Post-Graduate Student Representative to the Teaching & Learning Committee)
Office of Quality, Teaching, and Learning, Bond University, Australia
Abstract: Since 1989 Bond University, Gold Coast, Queensland, Australia has conducted student evaluations of teaching (TEVAL) using a method of paper-based surveying, manually distributed and collected by TEVAL officers in lectures and tutorials. In the final semester of 2009, research was conducted into the benefits of online TEVALs considering such factors as student response rates, and student and educator feedback submitted through a drop-box forum. A pilot project was administered through the Office of Quality, Teaching, and Learning to assess the efficacy of migrating TEVALs to the online environment. A sub-committee of the Teaching and Learning Committee developed new TEVAL 4-point Likert scale questions evaluating both instructors and course design. Two thousand three hundred forty-seven students (over 50% of Bond’s student population) were asked to participate across three (of four) of Bond’s faculties. The surveys were open for student completion between late November 2009 and early December 2009. This paper documents the process undertaken to market and deliver the electronic TEVALs as well as the initial findings based on response rates and student feedback.
Introduction
The primary means of university teaching and learning evaluation is the student survey (Norris & Conn, 2005; Richardson, 2005). Survey data can be applied to course improvement, curriculum review, and instructor professional development needs. Numerous journal articles critique student evaluation of teaching (TEVAL) and/or the process. Some of the prevalent critiques were that: survey data is an inaccurate record of student perception (Ballantyne, Borthwick, & Packer, 2000; Dommeyer, Baum, and Hanna, 2002; Ravelli, 2000; Robertson, 2004); the sample is biased to only those students attending classes at the end of semester, thus missing important informants, i.e. those students who have stopped attending (Nulty, 2008), and; that the data arrives too late in the teaching/course development cycle to be formative (Anderson, Cain & Bird, 2005; Ravelli).
Literature Review
As more universities transition to web-based systems, thus enabling electronic survey systems, ongoing research continues to observe the effects of the shift to online student evaluation of teaching from the traditional paper-and-pen method. Numerous journal articles address migration from the paper-based to electronic TEVAL, reviewing the advantages and disadvantages of web-based evaluations. Anderson et al. (2005) and Coile (2006) noted such advantages as: convenience, rapid feedback, the requirement of less class time, less vulnerability to any instructor influence, cost-effectiveness, and the general ease of data collection and analysis. Studies also reveal that students were more likely to provide additional comments about the course and/or
instructor on the electronic form, thereby enabling more effective, qualitative and constructive feedback than its paper-based counterpart (Anderson et al.; Layne et al., 1999). Furthermore, Oliver & Sautter (2005) and Avery et al. (2006) identified that anonymity and confidentiality in TEVALs are large issues of concern for students and may adversely affect student participation in evaluations if students are not assured of their anonymity. An online forum assures student anonymity by eliminating the chances of handwriting recognition and thus enhances the potential value of quality feedback (Dommeyer, Baum, Hanna & Chapman, 2004). For these reasons, the literature indicates that a majority of students and faculty preferr online course evaluations (Dommeyer et al.; Norris & Conn, 2005; Ravelli, 2000).
Despite these advantages, studies have reported low response rates from students when given the option to complete the evaluations online (Avery et al., 2006; Dommeyer et al., 2002; Layne et al., 1999; Nulty, 2008). However, studies also reported that low response rates to online evaluations do not appear to affect the mean evaluation scores (Avery et al.; Coile, 2006; Dommeyer et al.; Dommeyer et al., 2004; Layne et al.; Leung & Kember, 2005). Moreover, Gamliel & Davidovitz’s (2005) study indicated that even the mode of administering course evaluations may affect the accuracy of the responses, namely, that the format of paper-based evaluations may inhibit a student from giving varied answers. Therefore, there is evidence that transitioning from paper-based evaluations to online TEVALs can help improve the effectiveness and quality of teaching evaluations.
Notwithstanding the growing body of research aimed at the effects of the global transition across universities to web-
274
Proceedings of The 4th International Multi-Conference on Society, Cybernetics and Informatics (IMSCI 2010)
based systems, there are remaining considerations and perceptions that require further investigation. The literature documenting the migration from paper-based to electronic TEVALS is written almost exclusively from the administrator and instructor point of view. The gap in the literature, addressed by this study, is how students perceive the move to electronic TEVALs, or in other words, how do university students evaluate the evaluation? This paper documents a pilot migration from paper-based to electronic TEVALs, analyzing the project on a number of domains, and emphasizing the student experience.
Process Overview A Sub-committee of the Teaching and Learning Committee comprised of academics from all faculties and a student representative drafted 24 new TEVAL questions and a 4-point Likert scale with an additional Don’t Know/Not Applicable response option. The sub-committee adapted the questions recommended by Barnes et al. (2008) and Marsh & Roche (1997). They ensured that the questions addressed the dimensions of “teaching readiness” and “teaching excellence” (Barnes et al., p.199). Each question was comprised of a statement, an agreement scale, and a long answer response option for comments. This approach reflected Robertson’s (2004) suggestion that asking students to provide explanations, thereby prompting more careful thought to the agreement scale, may result in increased accuracy on survey questions. Three faculties chose to participate in the pilot, which was run in the third and final semester of 2009. All courses in Health Sciences and Medicine and all courses in Humanities and Social Sciences, and 11 subjects in Business, Technology and Sustainable Development were included. The students gained access to their online surveys through their Blackboard learning moderation system and through clicking on hyperlinks sent to their email inboxes. The surveys were open for student completion between late November 2009 and early December 2009.
The Software: EvaluationKIT EvaluationKIT is a vendor with its head office in Denver, Colorado, USA. The staff has provided an exceptional level of service and support and is commendably responsive in communications. EvaluationKIT was chosen from among multiple vendors because the interface works well with iLearn@Bond as a Blackboard Building Block (Oliver & Sautter, 2005). The system allows multiple routes of access to surveys. The student surveys are completely confidential and anonymous.
Statistics There were 2,487 students (over 50% of Bond University students) enrolled in courses that were part of the electronic TEVAL pilot. Eleven Business, Technology and Sustainable
Development courses were included in the pilot. One hundred seventy-eight Humanities and Social Sciences courses were included. Fifty-seven Health Sciences and Medicine courses were included. Five CORE courses were included. CORE courses are required enrolments within all degrees. An example is Communication Studies.
Marketing and Communication Strategy The Office of Quality, Teaching, and Learning (O-QTL) partnered with the Bond University Student Association (BUSA) to communicate the change from paper-based to online student evaluation of teaching and market electronic TEVALs to students. BUSA designed posters and distributed them in multiple formats. The designers intentionally used formats that resemble those used to market social events such as pub crawls to increase the chances that students would read the advertising. They displayed the posters on digital signage across the campus. They attached large posters to bulletin boards. They pasted small posters on the back of toilet-stall doors across the campus. They slipped fliers under the doors of all of the residence rooms.
The O-QTL designed email communications to administrators, instructors, and students. These messages were designed and the distribution was timed to advertise the upcoming project, and ask instructors to read announcements to students. Three reminders were sent (approximately weekly) to students who had not yet completed evaluations. The EvaluationKIT system is designed to allow distribution to non-participating students without interfering with the integrity of anonymity of student responses. In addition, the O-QTL designed postcards and inserted them into the university mailboxes of all participating instructors. The postcards shared the project details and an announcement for instructors to read to their students. The message emphasized the importance of student feedback and the instructors’ commitment to applying this feedback.
The O-QTL purchased student draw prizes to a value of $2000 and the Bond University Development Office donated additional prizes. For every survey a student completed and submitted, they were entered into the draw once. The random draw was administered through the EvaluationKIT system and orchestrated by Bond University Information Services so as not to interfere with the integrity of anonymous student evaluation.
Response Rates In the Bond University TEVAL pilot, student participation was not compulsory. Response rates were consistent with those reported in the literature. Oliver & Sautter (2005), for example, reported studies with electronic TEVAL response rates of 32.8% and 47.8%. Calculating response rate by dividing the number of students who completed one or more
275
Proceedings of The 4th International Multi-Conference on Society, Cybernetics and Informatics (IMSCI 2010)

TEVAL survey by the number of students enrolled in courses included in the pilot, the response rate was 42%. Calculating the response rate by central tendencies of each course, the overall mean was 28%, median 34% and mode 34%. Dropping the two outliers, the mean was 37%, median 35% and mode 34%. The mean, dropping the high and low outliers, was 36%. The Faculty of Business, Technology, and Sustainable Development mean was 44%. The Humanities and Social Sciences mean was 39%. The Health Sciences and Medicine mean was 25%. The CORE course mean was 31%. As stated above, CORE courses are fundamental courses taken by all students in the faculties. While response rates for the electronic TEVAL pilot was significantly lower than that of paper-based surveys at Bond University, O-QTL was satisfied with the results for two reasons. First, research indicates that response rates to electronic TEVALs increase incrementally over time and in subsequent semesters of electronic administration, as student completion becomes the norm (Avery et al. 2006). Second, Gamliel & Davidovitz’s (2005) research indicated that the range and quality of response advantages of electronic TEVALs outweighs the response rate advantages of paper-based TEVALs. The two significant low outliers were Doctor of Physiotherapy and Medicine Subjects. There are five hypotheses for this low participation, and stakeholders indicated their perception that these combined factors explained the low student response rate. Students may be over-surveyed. Because the students have multiple educators, they are invited to complete numerous surveys. There is a delay between instructors and TEVALs e.g. an instructor may have taught the student at the beginning of the semester, and then the TEVALs were released near the end. Student access is limited by not being on iLearn (Bond University’s interface to the Blackboard Learning Moderation System). There is a higher workload of students in these programs. There seems to be a historic low response rate in these programs – possibly due to student workload. There was insufficient information for students. There is lack of evidence for students that their feedback is applied to teaching and learning improvement. These factors determined the prioritization of actions to follow-up from the pilot. The completed and in-progress actions are addressed in the Beyond the pilot section below.
Feedback
Preamble
All stakeholders were invited to submit feedback to a dedicated email inbox. A submission form was available from the iLearn@Bond (Blackboard) dashboard and delivered to the dedicated email address. Moore & Kuol (2005) suggested that analyzing the faculty thoughts and reactions to the feedback is as important as analyzing the feedback itself.
However, in this study, we apply the same focus to the student experience. We received sixty valid feedback submissions. Invalid submissions included several blank submission forms with no comments entered, administrative responses from EvaluationKIT, Out of Office automatic responses, and a few comments on educators (replies were sent directing students to survey access).
Students – General Positive Feedback Thirteen of the submissions were from students conveying positive perceptions and support of online TEVALs. Five students indicated that they believed online TEVALs allowed more “honest” and “greater” feedback. Four students liked the capability of completing the evaluations at their own pace and in their own personal time. Four commented on the ease and convenience of the system, as well as the lack of pressure from having the instructor and/or peers nearby when completing the evaluations. Also, two students felt assured of anonymity and confidentiality, as the risk of handwriting recognition was eliminated. Lastly, students supported the online TEVALs because completion did not interfere with class time and included students who were not in attendance on one given day. These positive comments largely support findings of other studies in which students similarly praised the efficiency, convenience, and anonymity of online evaluations (Anderson, 2005; Ravelli, 2006).
Students – Querying Limited Availability of eTEVALs Three of the submissions were from students who queried why all lectures and tutorials were not included in the pilot. One submission was from a Humanities and Social Sciences student who expressed support of online TEVALs and said that not all of her tutorials were included. Another student did not specify a faculty, but stated confusion that some TEVALs were run as paper-and-pencil while others were run digitally. A third student was from Law and asked whether eTEVAL would be available for Law students.
Students – Specific Constructive Feedback
Nine students expressed specific concerns and/or criticisms of the specificities of the electronic TEVAL format and/or process. Many of these submissions expressed support of online TEVALs but commented on the specifics. For example, one student wrote, “Much better than the paper form because opportunities to comment on each question provided. However I would have liked a ‘save and return to it later’ option prior to submit.”
Four students commented that they did not like the moving text-box that had the course and educator name. We queried this concern with the vendor and they replied that they added this feature intentionally and since they had, it significantly reduced the number of instances in which students reported that they completed the TEVAL survey with the wrong educator and/or course in mind. (We had only three
276
Proceedings of The 4th International Multi-Conference on Society, Cybernetics and Informatics (IMSCI 2010)

occurrences of this, and were able to erase each and send instructions for the respective student to complete again).
One student wrote that there should be a midpoint between Agree and Disagree. i.e. Neither Agree nor Disagree. In other words, this student is advocating a 5-point rather than 4-point Likert scale. A graduate student expressed that he would not be completing a TEVAL for a small subject because he believed his teacher would be able to identify him through a “process of elimination.” Another student queried how we could ensure anonymity whilst running a prize draw. We explained the process through a reply email and she replied that in that case she was very satisfied with the eTEVAL process. A student wrote, “I am not sure what is meant by the question that asks about resources being effective to help me learn. What resources? I do like that you are now able to comment on each question – it allows me to give more thorough feedback. I like that. My only question is why can’t we comment on our tutors? In some classes, we have a different lecturer and tutor. I would like to give feedback on my tutors as well.”
Academics General Positive Feedback
Three academics submitted feedback in support of online TEVALs and the pilot process. One submission followed the release of an email announcement to educators. It read, “good timing.” The other two extended submissions echoed the positive perceptions of electronic TEVALs from students and the reviewed literature.
Trouble-Shooting
The majority of messages received by the feedback email address (32) were not about appraisal of the electronic TEVAL pilot format and process, but about the resolution of specific problems. In all instances in which the team was notified of a problem, a solution was determined and implemented to the satisfaction of all parties. For example, two students expressed access difficulty. They were re-sent access instructions and indicated that they were subsequently successful. Seven submissions concerned three students who completed surveys with the wrong educator and/or course in mind. In all three instances, the vendor was contacted. The development team deleted the erroneous entries and the students were directed to re-submit. Three submissions concerned courses that were not received on the to-be-surveyed lists from the faculties. As a result of these and subsequent queries (outside the electronic feedback forum) five subjects with 223 students were added to the TEVAL project part-way along. Eight students (from Law and BTSD) stated that they were having trouble accessing their electronic TEVALs. We queried and determined that they were not enrolled in subjects that were participating in the online pilot. These students were notified accordingly.
Summary of Findings
The submitted feedback indicates that the online TEVAL pilot was positively received overall by those who chose to express perceptions. Just under half of the submissions were of an evaluative nature, primarily entered by students who expressed their support of the move from paper-and-pencil to online TEVALs at Bond University.
Beyond the Pilot The Office of Quality, Teaching, and Learning conducted a rigorous analysis and it was decided to initiate a number of actions prior to moving from the pilot to a full roll-out of online TEVALs. Four month post-pilot a number of action items have been accomplished and others are in-progress. The most significant action that has been accomplished is a further modification to the questions and the Likert scale. Analysis of the TEVAL results initiated a reduction in the number of questions and an increase in the Likert scale. The process of reviewing and redrafting the questions and scale was undertaken first by the TEVAL Sub-committee of the Teaching & Learning Committee (TLC) and then by the TLC general members. The outcome was two surveys. The intention is to reduce the over-surveying of students and nonsensical surveying. i.e. Asking students to evaluate tutors on questions of course design is inappropriate and misleading in that tutors at Bond University do not have curricular control. Two distinct surveys means that Educators can be evaluated on an ongoing basis, and Courses evaluated on a cycle consistent with Curriculum Review processes. The Educator Survey is comprised of ten questions and will be administered every semester for every Instructor and Tutor. The modified questions were reconciled with Barnes et al. (2008) and Marsh and Roche’s (1997) teaching dimensions and all dimensions confirmed as addressed. The tenth and final question is a general question asking for overall perception of the educator’s teaching. This question was positioned at the end of the survey rather than the beginning so that the students were guided through nine teaching themes (e.g. assessment, feedback, enthusiasm) prior to completing the overall evaluation. The scale was increased from a four to six-point scale, as analysis indicated that further discrimination was required. Two features of the response scale that were not changed from the pilot are: 1) even scale so that there is no on-the-fence midpoint, and 2) a response option, Don’t Know/Not Applicable, located to the side of the scaled items and not included in the calculations of central tendency and range. This response option was not overused on the completed pilot surveys, but was necessary in some instances. In addition to the quantitative items, two comment boxes will be provided to students – one located after question five and one after question ten. The pilot electronic TEVAL included a comment box after each question and analysis
277
Proceedings of The 4th International Multi-Conference on Society, Cybernetics and Informatics (IMSCI 2010)

indicated that the resultant quantity and quality of responses did not outweigh the imposing length of the survey. The Subject Survey is comprised of five questions and addresses teaching and learning as embedded components of the educational experience. One of the questions asks students to indicate whether learning outcomes are clearly identified even though learning outcomes are verified through rigorous curriculum review processes. Analysis of the pilot results indicated some differences between what was confirmed in curriculum review and what was perceived by students. The fifth and final question asks the students to evaluate the subject overall. This question was positioned at the end of the survey for the same reasons as Question Ten on the Educator survey, as described above. The Likert scale is consistent with the Educator survey for the reasons described above. There will be one comment box after the final quantitative question. Another action that has been undertaken is a streamlining of the information procurement regarding educators, lectures, tutorials, and labs to be included in future TEVAL administrations. The trouble-shooting instances described above indicated that there were instances of garbage in, garbage out. There were instances in which Faculty administrators provided inaccurate lists of who was teaching what courses. The Office of Quality, Teaching, and Learning (O-QTL) is therefore accepting responsibility for future data procurement and manually taking completed spreadsheets to Heads of Programs, Schools and Faculties to physically sign-off on accuracy of information. The final action that has been completed by O-QTL is adding TEVAL feedback and resultant action to the curriculum review process. There is a portion of the mandatory form requiring course conveners to indicate one or more student comments that they have accepted and applied follow-up action to address. For example, one course convener addressed student requests for additional assessment information by describing posting exemplar submissions and a marking rubric on the course iLearn site. The priority of future TEVAL initiatives will be to further close-the-loop on student feedback (Ballantyne, Borthwick, & Packer, 2000; Harris, & Bretag, 2003). The President of the Bond University Student Association (BUSA) organized post TEVAL pilot student focus groups. The attending students were unanimous about the importance of TEVALs (and of electronic administration). The majority expressed doubt as to whether the feedback they were providing course-after-course, semester-after-semester was being read, taken seriously, and acted upon. Numerous students asserted that the key means of increasing response rates is acting upon the TEVAL feedback and clearly communicating these actions.
An action priority is to move the TEVAL action initiatives beyond the curriculum review process where it is not transparent to students. O-QTL will lead an initiative to place a Subject Evolution Report (SER) on a consistent visible location on the online course outlines. The SER will clearly indicate modifications to course design and teaching in response to student TEVAL feedback. Whereas the students participating in the focus groups believe that making feedback application transparent will increase response rates, the majority indicated that TEVAL completion is so important to their student experience that it warrants mandating. The participating students indicated nearly unanimous agreement that TEVAL completion should be made compulsory based on sanctions. Two ideas of sanctions are delayed release of final grades and no access to the iLearn course sites during final exam week, lifted upon completion of TEVAL surveys. While BUSA representatives perceive sufficient student consultation to advocate compulsory TEVAL completion, the Teaching and Learning Committee has not yet reached consensus on this issue. The other in-progress initiative is continued development of TEVAL alternatives. Currently, within the Foundations of University Learning and Teaching induction training, new academics are matched with established teaching academics across faculties. The two academics observe one another’s teaching and in the role of Support Colleague (SC), the senior academic provides constructive feedback to the new academic. An interesting outcome reported by the SCs is that they perceive greater benefit to themselves than to the inducted academics.
Conclusion
There were limitations to our research design inherent to TEVAL investigation. Whereas as our pilot revealed and enabled amelioration of both broad and deep issues in student evaluation of teaching, the research design means that we are unable to unequivocally report that the outcomes are results of the intervention. We were unable to isolate independent and dependent variables and it is impossible to compare pre- and post-intervention data. There were multiple changes brought in through the pilot initiative. In addition to the change from paper-and-pencil to electronic administration, there were new questions and a new Likert scale. There were also changes to the way in which TEVALs were promoted to academics and students. We believe that the contribution of our research to the extensive body of literature about student evaluation of teaching is the consistent emphasis on students. Throughout the design, organization, data collection, analysis, and action initiatives resulting from TEVALs, the emphasis was consistently on the students and enhancement of their
278
Proceedings of The 4th International Multi-Conference on Society, Cybernetics and Informatics (IMSCI 2010)

learning. Students are the key to student evaluation of teaching. A number of other research questions emerged through our investigation which would enable further exploration of this important terrain. We were unable to find literature specifically addressing compulsory surveys as well as the impact and student perceptions of associated sanctions. There is a paucity of literature describing empirical research about feedback application. Finally, there is a need for further study into alternatives to TEVALs such as peer-review of teaching.
References Anderson, H.M., Cain, J., Bird, E. (2005). Online student course evaluations:
review of literature and a pilot study. American Journal of Pharmaceutical Education, 69(1), 34-43.
Avery, R.J., Bryant, W.K., Mathios, A., Kang, H., & Bell, D. (2006). Electronic course evaluations: does an online delivery system influence student evaluations? Journal of Economic Education, Winter 2006, 21 - 37.
Ballantyne, R., Borthwick, J., & Packer, J. (2000). Beyond student evaluation of teaching: identifying and addressing academic staff development needs. Assessment & Evaluation in Higher Education, 25(3), 221-236.
Barnes, D., Engelland, B., Matherne, C., Martin, W., Orgeron, C., Ring, J., et al. (2008). Developing a psychometrically sound measure of collegiate teaching proficiency. College Student Journal, 42(1), 199-213.
Chen, Y. & Hoshower, L. (1998). Assessing student motivation to participate
in teaching evaluations: An application of expectancy theory. Issues in Accounting Education, 13(3), 531-549.
Chen, Y., & Hoshower, L. (2003). Student evaluation of teaching
effectiveness: an assessment of student perception and motivation. Assessment & Evaluation in Higher Education, 28(1), 71-88.
Coile, A.C.M., (2006). Effectiveness of online evaluations. California State
University Monterey Bay, California, USA. Retrieved April 30, 2010, from http://grants.csumb.edu/site/Documents/grants/Student%20Research%20Competition/Coile_Student_Research_2006.pdf.
Dommeyer, C.J., Baum, P., Chapman, K.S., Hanna, R.W. (2002). Attitudes
of business faculty towards two methods of collecting teaching evaluations: paper vs. online. Assessment & Evaluation in Higher Education, 27(5), 455-462.
Dommeyer, C.J., Baum, P. & Hanna, R.W. (2002). College students’
attitudes toward methods of collecting teaching evaluations: in-class versus on-line. Journal of Education for Business, September/October, 11-15.
Dommeyer, C.J., Baum, P., Hanna, R.W., & Chapman, K.S. (2004).
Gathering faculty teaching evaluations by in-class and online surveys: their effects on response rates and evaluations. Assessment & Evaluation in Higher Education. 28(5), 611-623.
Gamliel, E. & Davidovitz, L. (2005). Online versus traditional teaching evaluation: mode can matter. Assessment & Evaluation in Higher Education, 30(6), 581-592.
Giles, O.W. (2009). Modifying student evaluations of teaching to improve
practice: a report on a project carried out in a Regional Institute of Technology. International Journal of Learning, 16(4), 521-527.
Harris, H., & Bretag, T. (2003). Reflective and collaborative teaching
practice: working towards quality student learning outcomes. Quality in Higher Education, 9(2), 179-185.
Hoffman, K.M. (2003). Online course evaluation and reporting in higher
education. New Directions for Teaching and Learning, 96, 25-29. Layne, B.H., DeCristoforo, J.R., & McGinty, D. (1999). Electronic versus
traditional student ratings of instruction. Research in Higher Education, 40(2), 221-232.
Leung, D.Y.P., Kember, D. (2005). Comparability of data gathered from
evaluation questionnaires on paper and through the internet. Research in Higher Education, 46(5), 571-591.
McPherson, M.A. (2006). Determinants of how students evaluate teachers.
Journal of Economic Education, 37(1), 3-20. Marsh, H.W. & Lawrence A.R. (1997), Making Students' Evaluations of
Teaching Effectiveness Effective. American Psychologist, 52, 1187-1197.
Moore, S., & Kuol, N. (2005). Students evaluating teachers: exploring the
importance of faculty reaction to feedback on teaching. Teaching in Higher Education, 10(1), 57-73.
Moss, J. & Hendry, G. (2002). Use of electronic surveys in course evaluation.
British Journal of Educational Technology, 33(5), 583-592. Norris, J., & Conn, C. (2005). Investigating strategies for increasing student
response rates to online-delivered course evaluations. The Quarterly Review of Distance Education, 6(1), 13-29.
Nulty, D.D. (2008). The adequacy of response rates to online and paper
surveys: what can be done? Assessment & Evaluation in Higher Education, 33(3), 301-314.
Oliver, R.L., & Sautter, E.P. (2005). Using course management systems to
enhance the value of student evaluations of teaching. Journal of Education for Business, 80(4), 231-234.
Paolo, A.M., Bonaminio, G.A., Gibson, C., Partridge, T., Kallall, K. (2000).
Response rate comparisons of e-mail- and mail-distributed student evaluations. Teaching and Learning in Medicine, 12(2), 81-84.
Ravelli, B. (2000, June). Anonymous Online Teaching Assessments:
Preliminary Findings. Paper presented at Conference of the American Association for Higher Education, Charlotte, NC, USA.
Richardson, J.T.E. (2005). Instruments for obtaining student feedback: a
review of the literature. Assessment & Evaluation in Higher Education, 30(4), 387-415.
Robertson, S.I. (2004). Student perceptions of student perception of module
questionnaires: questionnaire completion as problem solving. Assessment & Evaluation in Higher Education, 29(6), 663-679.
Watt, S., Simpson, C., McKillops, C., & Nunn, V. (2002). Electronic Course
Surveys: does automating feedback and reporting give better results? Assessment & Evaluation in Higher Education, 27(4), 325-337.
279
Proceedings of The 4th International Multi-Conference on Society, Cybernetics and Informatics (IMSCI 2010)

as a Positive Influence on Technology Use
Antonette Mendoza1, Linda Stern
1, Jennie Carroll
2
1Department of Computer Science and Software Engineering, The University of Melbourne, Melbourne, Victoria,
Australia
2Department of Property, Construction and Project Management, RMIT University, Melbourne, Victoria Australia
ABSTRACT
A number of different factors influence
adopt and continue using a technology. These include perceived
ease of use (usability) and perceived usefulness (usefulness),
among others. In this paper we examine another factor, ease of
learning to use a technology . We discuss
software design and social influences that can contribute to ease
of learning, and discuss the importance of
technology adoption and continued use.
Keywords: Adoption, technology use, learnability, ease of use,
ease of learning to use
INTRODUCTION
Technologies are introduced into organizations in order to
enable individuals and the organization as a whole to achieve
productive outcomes. Of course, users must adopt the
technology and continue using it if the desired outcomes are to
be achieved. Adoption and acceptance of a technology has long
been an important topic for information systems researchers
[3,9,12,13].
In the Technology Acceptance Model (TAM), perceived
usefulness and perceived ease of use have been identified as
important determinants of intent to use a system, one of the first
steps in technology adoption [3]. Perceived usefulness is defined
as the degree to which a person believes that using a particular
system would enhance his or her job performance [3]. Perceived
ease of use is defined as the degree to which a person believes
that using a particular system would be relatively free of effort
[3]. In addition, TAM suggests that perceived ease of use may
be a causal antecedent to perceived usefulness, another
important factor in technology adoption. Recent revision of the
TAM [13] includes some social influences and key moderators.
It has also been suggested that an additional influence on
technology adoption is the ease of learning to use a technology
[1]. However, little is understood about the dynamic nature of
perceptions of the ease of use and the ease of learning to use a
technology during adoption and actual use.
We have conducted case studies on adoption and appropriation
of software technology in the higher education context, with an
emphasis on the influences that are important for adoption and
continued use [6,8]. In these studies, we have confirmed the
importance of the ease of learning to use a technology, in
addition to the importance of perceived ease of use of the
technology. We define ease of learning to use as the degree to
which a person learns to use a particular technology and its
features without undue difficulty. We identify from these case
studies and report here on factors that contribute to ease of
learning to use a technology or lack thereof.
METHODOLOGY
Case study 1: Algorithms in Action (AIA)
Algorithms in Action (AIA) is designed to support
undergraduate students who are learning algorithms and data
structure. The software provides a high level pseudocode
description of an algorithm, which can be elaborated through a
process of user-driven, step-wise refinement [11. The pseudo-
code is accompanied by animation and textual explanation of
various algorithms, at a level of detail consistent with the
pseudocode. Multiple views of the algorithm are visible
simultaneously. The software has many advanced features to
support independent student learning, including speed control,
backup to the first step in the session, step-wise refinement,
breakpoints, and input of user-defined data. AIA was
specifically designed to accommodate multiple modes of
learning, and studies have shown that students use AIA
according to their own learning style preferences and according
to their needs at any given time, e.g. new learning vs. review for
examinations [4,10].
In our case study of AIA adoption and use, 25 participants were
recruited from a second-year level subject on algorithms and
data structures. Data were collected soon after the initial
encounter with the technology, at 1-2 weeks, and again later at
6-7 weeks of actual use, using interviews, focus groups, and
direct observations of students using the software in the
computer laboratory. prior
knowledge and prior experiences with other software were
collected, and their attitudes and expectations during their initial
encounter with AIA were explored. Specific comments on using
AIA were also recorded.
Case study 2: EndNote
EndNote is a bibliographic software package. It is an all-in-one
tool that integrates tasks such as searching bibliographic
databases on the internet, organizing references in a database
and creating bibliographies automatically in word processors.
While it has many features, use must follow a strict protocol and
there is usually only one way to accomplish a given task.
In our case study of EndNote adoption and use, 14 postgraduate,
participants were recruited from EndNote training courses
conducted by the School of Graduate Studies at the University of
280
Proceedings of The 4th International Multi-Conference on Society, Cybernetics and Informatics (IMSCI 2010)

Melbourne. Twelve out of the 14 participants had no prior
knowledge of the EndNote software. Participants were studied
from the initial training course until 16 to 20 weeks of EndNote
usage.
The research design used interviews, focus groups, scrap books
and participant observations [6]. Data were collected at the initial
encounter with the technology and 3 subsequent times over the
following 20 weeks, using audio tapes and field notes.
Descriptive codes were used to identify general and specific
themes in the data. A time ordered matrix [5] was used to display
and analyse the themes from the data collected at different times.
In both the AIA and the EndNote case study, several different
influences on adoption were studied [6]. In this paper we report
only on perceived ease of use and ease of learning to use.
RESULTS
User Background
The backgrounds of the students in the two studies were quite
different. Participants in the AIA case study were second year
computer science students and had prior experiences with other
learning tools in their tertiary education. Their familiarity in using
a technology in their education appeared to influence their
decision to adopt AIA. For example, one of the participants
I have used MATLAB for another subject and I like
. In addition, students were already positively
disposed towards computers and learning tools, as expressed by
such comments as For computer science, we have to use the
. They perceived that the
information provided by the software would be complete and
accurat If a human being is teaching something, they could
miss- . Several students also expressed a liking
for interactive tools in general and appreciated the pictorial
In contrast, users in the EndNote study were postgraduate
students and researchers from non-technical disciplines, not
necessarily experienced with software or positively predisposed
to it. Participants uniformly replied in the negative in response to
the questions
and
Technology use ease of use and learning to use
Based on the data collected in the AIA case study, it was noted
that in weeks 1-2 and 7-8, aspects of ease of using AIA were
noted as influences that encouraged use, while at the same time
aspects of lack of ease of use were noted as influences that
discouraged use.
Most participants commented that the technology was easy to
It is very easy to use, the options and buttons are self-
In weeks 1-2 and 7-8, lack of ease of use for AIA
was expressed in terms of usability issues. One participant said,
then going back and forth, they tend to disappear, the multiple
me a little
and a few others expressed similar
usability concerns.
Participants in the EndNote case study, in contrast, did not
comment on ease of use and the lack of it, but did comment
extensively on lack of ease of learning to use. As early as 1-2
weeks after training, EndNote users commented negatively on
the lack of ease of learning to use the software, and continued
expressing frustrations through 20 weeks each time they needed
to learn to use a new feature. For example in weeks 1-2 they
found EndNote to be unintuitive and not easy to learn to use: "At
the moment you feel like you have to look up and follow it step
by step because it does not speak to you from the screen, it does
not suggest where to go next". The help feature on the software
did not help them because they were not familiar with the
terminology used: nd a field,
difficult". If a technology is not easy to learn then it can
stimulate users to start comparing it negatively with other
technologies
that I have ever pressed HELP as many times as this one and
noted in weeks 3-4). Lack of
ease of learning continued to negatively influence further
exploring and adapting the technology even in weeks 7-8. For
example one of the participants said, "The references were in
in lower case. It was really annoying me".
The influences observed are summarized in Table 1. As shown
in the table, students using AIA commented solely on ease of
use of the software, with both positive and negative perceptions,
and did not comment on ease of learning to use the software, or
lack thereof, while users of EndNote commented on the lack of
ease of learning to use the software and did not mention ease of
use or the lack of it.
In both case studies, support was available to participants and
offset some of their frustrations with the negative influences. For
example, one of the participants in AIA case study commented,
and contacted the lab demonstrator for help. In the
EndNote case study, the availability of trainers and other on-line
tutorials was noted as a positive influence expressed by
participants. It helped them resolve issues and fix some of their
problems. For example one participant had problems
downloading information using EndNote, "I got only the first
and
The [trainer] said 'down load the
additional filter from the university web site". Another participant
used on-line tutorial to learn to use features, "I found myself
running back again to those on-line tutorials".
Lack of rejection of the technology during adoption and
continued use
It was observed that in neither the AIA case study nor in the
EndNote case study was the technology rejected. In spite of
expressing frustration with the lack of ease of learning to use
EndNote, it was interesting to observe that at the same time
participants were motivated to learn new features because they
281
Proceedings of The 4th International Multi-Conference on Society, Cybernetics and Informatics (IMSCI 2010)

Table 1: Influences noted during adoption and use in AIA and EndNote case studies
found the software increasingly useful. They expressed
usefulness in terms of the features provided by it. For example
participants suggested that the ability to search references
Being able to search
and find through keywords, that's very useful for me I think" and
the ability to cite references as the write documents using
Microsoft Word was useful, "the Cite While You Write feature
which I found very useful" [6]. In addition, subjective norm was
another positive influence that encouraged participants to adopt
AIA and EndNote. For example, participants decided to adopt
I would
not like anything to learn from the tool, I prefer to read the
book, it is not a tool that will automatically be suggested to me,
In EndNote, they decided to
adopt it because their supervisors and peers suggested they use
it, . Further more
my colleagues found it useful and advised me to learn more
[6].
It was also observed that easy access to ongoing training
continued to encourage use of the technology over time. For
example in the EndNote case study, easy access to ongoing
training helped some participants resolve existing problems that
arose while adapting the technology to suit their new needs,
"Things like these-
training it made it easy. This filter thing is not something that I
A few
participants even attended additional on-going training sessions to
help them further explore and use EndNote,
course and asked her [trainer] a few things and then I clicked
this one thing and it changed from lower case to upper case" .
So, the negative influences of lack of ease of learning to use
EndNote and the negative issues around lack of ease of use of
AIA were offset by positive factors, such as perceived
usefulness, subjective norm [3,13] and support.
DISCUSSION AND CONCLUSIONS
In these studies, we have noted that perceived ease of use of a
software application does not always translate into ease of
learning to use that application. Nor does perceived ease of use
always translate into actual ease of use in the medium to long
term. In fact learning to use is the step between perceived ease
of use and actual use. If that learning is difficult, it can be a
negative factor, as we have observed in our study of the
bibliographic software. In the AIA case study, the lack of ease of
learning to use did not appear to present a problem, leading to a
seamless progression through perceived to actual use. In
EndNote, however, lack of ease of learning to use presented a
significant hurdle.
The data from these two case studies suggests that there are
three basic categories of factors that contribute to ease of
learning to use a piece of software (Figure 1). The first of these
categories relates to the technological interests and previous
technological experience of the user. In this category are factors
such as previous experience with similar technologies and a
predisposition to like using information technology, as noted in
AIA case study. EndNote users came from non-technical
backgrounds and did not have an experience with EndNote and
background, and are not influenced by the software design.
Because we did not compare these two different cohorts using
the same software application, we cannot show a definite causal
effect, but our data suggest that may
influence their perceptions of ease of learning to use a
technology. Similar findings have been reported by others [2].
The second category of factors that contribute to ease of learning
to use a piece of software relates to properties of the software
itself. Within this category, we include the ability to use the
software in different ways. For example, EndNote requires that
the user follow a fairly rigid protocol. For example there are
standard columns such as keywords, notes and title that hold
information. The layout suggests that information may be
Weeks 1-2
Weeks 6-8
Weeks 16-20
Lack of ease of learning to use
AIA - - Study ended
EndNote
Ease of use and lack of ease of use
AIA Study ended
EndNote - - -
282
Proceedings of The 4th International Multi-Conference on Society, Cybernetics and Informatics (IMSCI 2010)

filtered based on a specific column for example. The filtered list
is displayed on one page sequentially. A bibliographic tool
could, however, show multiple views and allow multiple modes
mapped visually. The fact that currently available bibliographic
tools do not do visual mapping do
and the extra view might very well improve ease of learning to
use, thus enhancing adoption and continued use.
In contrast, AIA was deliberately designed to be useful to
students with a variety of learning styles; students can use the
software in a primarily visual mode, or they can use the software
in a primarily textual mode [4]. This design framework probably
means that students with a wide variety of different learning
styles can find it easy to learn to use AIA.The presence of
multiple simultaneous views and control of the speed of
animation further enhances the ability of users to use AIA in the
way that suits them best, and probably also enhances the ease
with which they can learn to use the software.
The progression from perceived ease of use to actual use,
through ease of learning to use, and the potential influences of
user background, software design, and the availability of support
are summarized in Figure 1.
The third category of factors that contribute to ease of learning
to use a piece of software relates to the level of support
available, which was seen in both case studies.
Negative influences may not stop users from using a technology,
and rejection was not noted in this study. In the EndNote case
study, there were a number of other positive influences,
encouraging postgraduate students to continue using the
technology, and this lack of ease of learning the system did not
directly result in users rejecting the technology. Our previous
work has shown that perceived usefulness, strong subjective
norm, and appropriate support can be strong enough positive
influences to overcome negative influences [6,7]. For example in
the EndNote case study, all three of these positive influences
were strong.
Figure 1: Progression of influences over time and potential influences.
But negative influences introduce additional hurdles to adoption
and continued use. While rejection of technology was not noted
in our case studies, in other cases, particularly where there are
fewer positive influences, lack of ease of learning to use might
tip the balance into rejecting the system in question. Therefore it
is important to address this issue. Especially in the medium to
long term, negative influences can lead a user to reject a
technology as a whole or to rejecting some of its features, and it
is desirable to minimize them where possible [8]. Bibliographic
software is not usually designed to appeal to the visual part of a
ata, but it could be, and some people
might find this improves ease of learning to use. We speculate
that designing software with learnability, as well as usability, in
mind may improve ease of learning to use, thereby eliminating
an important negative influence on adoption and continued use
of a new technology.
Another strategy might be to provide additional support where
lack of ease of learning to use and the lack of ease of use of the
technology are potential problems. Findings from our study
suggest that quick access to trainers and peers help users to
resolve existing problems while using a technology. A strong
supportive mechanism could play a role in encouraging users to
persist using and exploring new dimensions of a technology,
helping in solving specific technology related obstacles and
problems and finally help users perceive long-term benefits of
using a specific technology. Designers, trainers and managers
need to be aware that lack of ease of use and the lack of ease of
learning to use may disrupt productive outcomes from
technology use and sometimes may lead to rejection of a
technology in the long-term. Therefore, we suggest that
managers and team leaders provide a support mechanism to
users at critical time periods to support and improve persistent
and long-term use of the technology.
REFERENCES
[1] Carroll, J., Howard, S., Peck, J. and Murphy, J. From
adoption to use: The process of appropriating a mobile
phone Australian Journal of Information Systems, Vol.
10, No. 2, 2003, pp. 38-48.
[2] Compeau, D.R.., Meister, D.B. and Higgins, C.A., From
prediction to explanation: Re-conceptualizing and extending
the perceived characteristics of innovating Journal of the
Association for Information Systems, Vol. 8, No. 8, 2007,
pp. 409 - 39.
[3] Davis, F.D. Perceived usefulness, perceived ease of use and
user acceptance of information technology MIS Quarterly,
Vol. 13, No. 3, 1989, pp. 319-339.
[4] Hussein, Z. and Stern, L.
Proceedings of the 20th World
Conference on Educational Multimedia, Hypermedia &
Telecommunications (ED-MEDIA 2008), 2008, pp. 5640-
5645.
Perceived ease of
use
Ease of learning to
use
Actual use
User background Software design
Support
283
Proceedings of The 4th International Multi-Conference on Society, Cybernetics and Informatics (IMSCI 2010)

[5] Miles, B.M. and Hubermann, A.M, Qualitative Data
Analysis, 2nd ed. Singapore, SAGE Publications, 1994.
[6] Mendoza, A., Carroll, J. and Stern, L. Adoption,
adaptation, stabilization and stagnation: software
appropriation over time Proceedings of the 16th
Australasian Conference on Information Systems
(ACIS2005), Sydney, Australia, 2005.
[7] Mendoza, A., Carroll, J. and Stern, L. Plateaus in long-term
appropr Proceedings of
the 18th Australasian Conference on Information
Systems (ACIS2007), Toowoomba, Australia, 2007.
[8] Mendoza, A., Carroll, J. and Stern, L. Influences on
continued use of an information system: a longitudinal
study Proceedings of the 16th European Conference on
Information Systems (ECIS2008), Galway, Ireland, 2008.
[9] Moore, C.G. and Benbasat,I., Development of an instrument
to measure the perception of adopting an information
technology innovation Information Systems Research,
Vol. 2, No. 3, 1991, pp. 192-222.
[10] Stern,L., Markham, S., and Hanewald, R.
horse to water: how students really use pedagogical
Proceedings of the Tenth Annual SIGCSE
Conference on Innovation and Technology in Computer
Science Education (ITiCSE2005), 2005, pp. 246-250.
[11]
Proceedings of the Fourth Annual SIGCSE Conference
on Innovation and Technology in Computer Science
Education, ITiCSE99, ACM Press, 1999, pp. 127-130.
[12] Thompson, R.L.,Higgins, C.A. and Howell, J.M. Personal
computing: Towards a conceptual model ,
MIS Quarterly, Vol 15 No 1, 1991, pp 124-143.
[13] Venkatesh, V., Morris, G., Davis,G.B. and Davis,F.D.,
User acceptance of information technology: Towards a
unified view MIS Quarterly, Vol. 27, No. 3, 2003, pp.
425-454.
284
Proceedings of The 4th International Multi-Conference on Society, Cybernetics and Informatics (IMSCI 2010)

DELIVERING USER-CENTRIC ESYSTEMS
David P SOWDEN
Department of Engineering, University of Hull
Hull, Humberside, HU6 7RX, United Kingdom.
ABSTRACT
This paper’s mission is to highlight the importance for
e-infrastuctures and technologies (referred to in this document
as eSystems) to create value for the lifelong learner. From
perspective, which is fundamentally the wrong way around when
the goal of an eSystem is to create value for the user.
The paper is therefore driven from the user perspective covering:
the User Value, User Experience and the importance of
accessibility and the associated delivery methods.
Keywords: Educational Technology, User/computer interaction,
Information System and User-Centered Design.
BACKGROUNDThe world we live in is constantly changing. The main changes
in the last decades have been: computers gaining omnipresence;
a society diverse in culture, education, and socio-economic
levels; a high skilled workforce needed in the majority of work
places; a highly competitive business market; the appearance of
new educational technologies; and decreasing students’ interest
to such traditionally prestigious subjects as physics, math, and
engineering.
Learning is changing as well, especially the technologies of
learning. e-Learning means that students and lecturers do not
have to sit in the classroom but instead they learn from anywhere
in the world and at anytime.
e-Learning is becoming very popular with Lifelong Learners
universities and colleges have online courses. It helps them
distribute knowledge among learners in a broad and rapid way.
There has been also growth in what is commonly known as Web2
technologies especially in the area of social networking sites.
Adoption curves vary dramatically by region, but it is expected
membership growth in all regions to peak by the end of 2009 and
level out by 2012.
During 2008/09 there have been two extensive reports
investigating the development of eSystems [5,6] within the LLNs
in England, these have shown that there have been numerous
duplication of systems, products and scope creep.
ISSUES, CONTROVERSIES
AND PROBLEMS
This is the value that an eSystem creates for the lifelong learner
and how this relates to their needs. The needs of the lifelong
learner are both those that are directly related to their learning
journey and also their requirement for an environment that
on their own personal development goals.
To achieve this, it is important that the eSystem design process is
deliver true user value.
Therefore, fundamental knowledge of the user is important, along
with possible learning styles. Those involved in the development
of eSystems need to ask the question, who are the Learners and
Users?
Through research within many of the established Lifelong
Learning Networks within England, a user who sees learning as
a lifelong journey will have some of these traits;
Have positive self esteem
Be accepting of others
Perceptive and understanding
Capable of interacting effectively
Discovers and develops personal passions
Wants to impact the world in a positive way
Good communication skills
Types of learning: There is more than one type of learning
that our lifelong learners will use. A committee of colleges,
educational activities: Cognitive: mental skills (Knowledge),
Affective: growth in feelings or emotional areas (Attitude), and
Psychomotor: manual or physical skills (Skills).
Trainers often refer to these three domains as KSA (Knowledge,
Skills, and Attitude). This taxonomy of learning behaviors can
be thought of as “the goals of the training process.” That is, after
the training session, the learner should have acquired new skills,
knowledge, and/or attitudes.
Asynchronous learning resources
(ALRs) developed as interactive courseware for the World Wide
Web are receiving increasing attention because of the ease with
which they can be accessed by Lifelong Learners at the time,
place and pace of their choosing. Knowledge-based ALRs are
critical for developing the knowledge base essential for problem
solving. Problem-based ALRs are especially attractive because
of their emphasis on the higher-order cognitive skills of analysis,
synthesis and evaluation.
Computer-based interactive courseware can be developed to
enable lifelong learners to acquire the entire range of cognitive
skills contained in Bloom’s taxonomy.
Graphic-intensive instructional modules sandwiched between an
introductory statement and a formative quiz are used to constitute
lessons designed to develop knowledge and comprehension.
Practicums composed of problem statements and a series of
questions for leading learners through a disciplined process of
inquiry are designed to enable learners to acquire higher-order
cognitive skills, including: application, analysis, synthesis and
evaluation.
285
Proceedings of The 4th International Multi-Conference on Society, Cybernetics and Informatics (IMSCI 2010)

Stability (Is it stable and reliable, does the user feel
this?).
In addition to the general position of any system there are
Supporting their individual learning (content through to
during their life. Ironically, the third aspect is the one that often
spawns the development of systems as they are nearly always
developed by academic institutions. In reality, accreditation and
them.
This is about the user interface: accessibility, ergonomics, and
clarity (visual, oral, written communication).
Accessibility is massively important, as it is the only aspect of
user experience that involves legal compliance. In addition to
compliance there are extensive guidelines that suggest ways to
support user’s needs. There is a balance that needs to be considered
in implementing an eSystem that it serves the needs of the whole
user community and this involves making a compromise between
different stakeholder requirements.
For a successful user experience it is vital that when designing a
and clarity required by the user. Information architecture
addresses questions such as:
What are users’ primary goals, and how can they achieve
them using the application?
How do users get from place to place?
What rules exist that users have to work around?
What is the optimal scope of the application’s feature set?
What is the application’s search mechanism?
Since September 2002 in the UK the ‘The Special Educational
Needs and Disability Act’ (SENDA) has extended the Disability
and Discrimination Act’ (DDA) to include the education sector.
As far as web based applications are concerned, you should not
disadvantage any disabled visitor to your application by offering
information or services that they cannot access. There is nothing
in the SENDA or DDA legislation to say exactly what makes an
accessible website, but the general consensus is that the (World
Wide Web Consortium) ‘W3C Guidelines’ will be used as an
industry standard.
because they “follow standards” contains a serious fallacy.
Using the recognised the current HTML or XHTML standards
maintained. Using correct syntax and following a standardised
method of communicating information is always a solid best
practice. However, this should absolutely not be taken to mean
that following these standards is the same as applying the
principles of web accessibility.
Web standards only provide accessibility to the degree that
they have been designed to do so and the guiding principle
The way a lifelong learner represents
their identity changes according to circumstances. Different
contexts require a different identity, each of which are expressed
in a different way and provide different information. All of these
contexts have ways for an individual to establish their identity
and just like the physical world, they will have a variety of digital
identities, expressed in different ways.
Today, however, there’s no consistent way to ‘model’ the physical
Different kinds of digital identities will always be necessary—no
provider. The solution is not to mandate a single system for digital
systems. Using these Web services technologies, it’s possible to
by any source, using any identity technology.
user then a system will not be well adopted no matter how good
the communication strategy is. Before developing a system there
needs to be a real clarity of purpose for the development and the
development needs to be tested against this as it progresses.
key to developing a successful software solution for the lifelong
learner.
through functions the software provides that enable the user to
as either a Decision Support System (providing information to
support a decision) or an Online Transaction Processing System
(A way of performing a basic transaction using a software system).
The individual functions
The combination of functions available via this one tool
(integrated functionality)
The fact that so many functions are available in one place
The stakeholders connected to the functionality
Peers
Customers (in the broadest sense)
Suppliers (in the broadest sense)
Security, Speed and Stability compared to alternative
solutions.
The costs of a system, in addition to
more often fail as a result of not considering the Total Cost of
Ownership (TCO) of the system. The costs are generated from:
Financial cost to the user (The Internet is now full of free
software)
User Experience
Ease of use (based on their prior learning and
experience, how much can a user just work out for
their selves)
The “look and feel” of the system (does it have an appropriate
aesthetic to it?)
Security (Is it secure, does it communicate security
to the user)
286
Proceedings of The 4th International Multi-Conference on Society, Cybernetics and Informatics (IMSCI 2010)

behind standards development has not generally been to
support accessibility. Web standards have been designed purely
to establish a set, correct method of using the underlying
code whether presentational (CSS), structural (XHTML) or
behavioural (ECMAscript.)
In many (most) cases, web standards do not in any way require
best practices they merely require conformance.
Does this necessarily mean that the standard is wrong or right?
No, not as such. Different standards support different needs: it is
important to keep distinct the purpose of the standard.
In the UK, the JISC TechDis Service aims to be the leading
inclusion. Their mission is to support the education sector in
achieving greater accessibility and inclusion by stimulating
innovation and providing expert advice and guidance on disability
and technology.
SOLUTIONS AND RECOMMENDATIONS
Around 1910, the German architecture and design school
“Bauhaus” employed this simple creed: “Form follows function,
ornament is a crime”. Bauhaus didn’t exactly teach web design,
based interfaces, but the basic principal will work for any area
of design. Simple and functional design will essentially make
things easier for the individuals who use, or are subjected to the
design. When design is based on the required function, form
comes along naturally.
For example, have you ever used or visited a website where there
is so much art and motion that you can’t tell what is going on,
or what you should even be clicking or navigating on? One can
encounter sites like this quite frequently. Sometimes the sites are
actually quite aesthetically pleasing, but they’ve missed the point
following the rule “Form follows function, ornament is a crime”,
we can start to break down what is necessary, and what is not.
Establish the “function”: First off, one has to determine
what the function is. If one does not know what the function is
impossible to make it easier and simply to use.
It is vital to analyse the functions required by our lifelong learner,
produce the case, prioritise, then focus on making those functions
easily usable and accessible.
to your design is simpler than you think. Ask yourself this question
about every element of your design. “Does this compliment, or
complicate my function”.
in your user interface. This does not mean you can’t use all the
space you’re provided with, but give it some breathing room.
Areas where the eye can rest and linger. By allowing your layout
to be evenly and moderately spread out, content and navigation
will be much easier to view and use for your users.
Examine all your content and ask the question is it really needed?
Where should it be placed that would make the most sense? Is it
helping you or hurting you? Too much verbiage or call to action
can clutter and confuse users. Make your content and actions
clear and concise.
Is the design layout logical? Really think about how a user is
going to navigate through the user interface. Even though you
may think what you’re doing is logical, YOU aren’t your users.
Test, test, test.
Quality is achieved by evaluating the whole e-system against
all of the areas and requirements to be considered as part of
evaluation and continuous improvement in delivery.
Quality doesn’t cost money. It’s poor-quality products and
services that pile up extra costs for a provider.
The “cost of quality” isn’t the price of creating a quality product
or service. It is the cost of NOT creating a quality eSystem.
developed, losing adoption and integration and would lead to
In short, any cost that would not have been expended if quality
were perfect contributes to the cost of quality.
Don’t assume you know what the learner wants. There are many
examples of errors in this area, such as “new Coke” and car
models that didn’t sell. Many organisations expend considerable
time, money and effort determining the “voice” of the customer,
using tools such as customer surveys, focus groups and polling.
Satisfying the learner includes providing what is needed when
it’s needed. In many situations, it’s up to the learner to provide
the provider with some of the requirements.
A solution will be aimed at a particular market. It is important
to consider an approach that will be well suited to the target
demographic and possibly utilise the ability to provide different
approaches, devices and interfaces to meet the different
demographics. There needs to be some consideration of those who
have access to technology and those who don’t. In addition the
skill levels, geographic locations and generational perspectives
need to be considered.
Economic growth is increasingly driven by the skill of the local
using digital technologies.
As the middle class and articulate are relative early adopters of
new services and emerging knowledge, they tend to make full
use early of web-based systems.
Likewise, if we do not begin to develop applications of digital
technology designed to address inequality we shall reinforce the
digital divide by default.
A key challenge is that access to technology will become
necessary within Maslow’s hierarchy of needs as individuals
progress. Increasingly, digital technology will become key to
them, starting with wealth, or at least work.
But there is still a considerable overlap between social exclusion
and digital exclusion. So we need to be creative in developing
targeted digital applications in health if they are to help bring
people into the digital age rather than act as a further barrier to
use.
Our providers need to commit investment in the use of digital
technologies to tackle inequality, including partnerships with
those more skilled in adapting digital to new markets than we
are.
The new barrier is basic ICT skills, now being addressed through
voice technology, increasingly intuitive technology and assertive
investment in schools, with 90 per cent of 16 to 24-year-olds now
ICT familiar if not fully literate.
The key barrier now is attitude and interest. Our most
disadvantaged communities are often our most disappointed,
287
Proceedings of The 4th International Multi-Conference on Society, Cybernetics and Informatics (IMSCI 2010)

with learned low expectations and limited appetite for new
experiences. We really need to understand what the added value
of new technology might need to be, for people to wish to use it.
While digital technology has a huge amount to offer everyone,
currently disadvantaged.
Ownership
In addition to the individual lifelong learner adopting the
e-System it is essential for sustainability that someone takes
ownership of the delivery (It could even be owned by lifelong
learners in a wiki environment). Intellectual Property might be
considered also.
Recently there have been debates concerning the capacity of a
lifelong learner to source learning from a range of providers,
allowing the learner to be in control of their own learning
accessing possibly the best resources and content from around
the world.
Social networking sites could, in their next generation,
facilitate this allows inividuals to create a personalised learning
environment accessing learning from numerous locations.
Technology needs to be subservient to
the needs of the lifelong learners and appropriate to a number of
different factors. There is not one way of providing a solution
that is perfect and the “best” solution is not just about the
selection process but about responding and developing once the
solution is deployed. The solution selected needs to consider the
technologies, people and other resources available to meet the
user’s requirements.
Many researchers have documented the increases in potential
learners worldwide drawing attention to the social imbalance in
access to higher levels of education. There was/is a perceived need
and radical solutions and strategies to engage with these new
learners. These strategies will/have needed a ‘radical change’
in conventional educational thinking, methods, organisations,
structures and practices. In other words, a new approach has been
needed touching on all aspects of the educational process.
Changes in learning needs (more people wanting to learn
different things)
effective use of resources (staff etc.,))
Increased concern about democratisation and fairness
(social equality, elimination of socioeconomic; gender and
geographic inequities)
A perceived need for closer ties to day to day life
(lifestyles) harmony between education and culture,
relating education to work, lifestyle, ecosystem, common
values
A need to change teaching and learning stragies..
There has been a realisation that educational
providers need to review their teaching and learning
the lifelong learner. Providers are encouraged
to allow individual customisation of learning,
allowing reactive solutions to training and personal
development needs. At present funding and reporting
requirements often contrive to discourage and hinder
utilised.
New emerging forms of communication (other that the
written printed word)
New methods of educational delivery
Changing demands of work - retraining
New career patterns
Home-based work
Changing clientele for education - increasing numbers
especially in mature-age students resulting in both work and
career changes.
By starting with User Value then we have a good
basis for the future adoption of the solution. It is really important
to make sure that the value hypothesis originally generated
has been tested out on lifelong learners at the beginning and is
reviewed as the solution develops. If the solution provides value
existence to potential new users. Adoption is often the result of:
The user seeing the potential of something ‘new’
Popularity with peers
Additional functionality
A portal to other places allowing a seamless experience to
the user
Personal skills and requirements
CONCLUSIONS
1.
Develop an understanding
of the user
What are the problems/needs of the Lifelong Learner
(User)?
What is the current provision of services (electronic and
other) to the user?
Lifelong Learner (User)
Personal development
Finding learning
Engaging with:
learning support
peers
professional bodies
Accessing multiple sources of information
Personal presentation
2.
Clarify the purpose reducing cost)
What gaps exist in provision of services? (less likely)
What problem does the application solve?
Current eSystems
Current manual systems
288
Proceedings of The 4th International Multi-Conference on Society, Cybernetics and Informatics (IMSCI 2010)

CONCLUSIONS
3. Individual functions
New integrated functionality
Speed of transaction or reporting
Interaction with peers
Interaction with customers
Interaction with suppliers
4.
Identify functionality from
existing provision that can
be incorporated into the
e-system
What is already in existence that provides the required Access to external related functionality
Portability of data
5.
Identify security require-
ment
What are the legal requirements?
What are the personal requirements?
6.
Design Stability
Where will the eSystem be hosted, is it stable enough
and supported for the required life of the solution?
7.
Evaluate Affordability
How does the price of the solution compare to current
provision?
8.
Design Logical Function
What are the logical steps involved in performing the
function(s)?
What alternative logical path(s) could be provided
9.
Design Intuitivenes
What interfaces will the user be familiar with?
How can the application be designed to make the user
feel at home?
User’s prior experience with software (e.g.
MS Word, Google, Amazon)
User’s experience with non-IT interfaces
10.
Design Clarity of
Communication
How clear is it where “clickable items are”?
How clear is it what the impact of using a certain part of
the interface is?
How cluttered is the interface with different
messages?
Use of language
Tool tips appearing on hover
Simplicity
11.
Design Navigation
How easy is it to move from one part of the system to
another?
How easy is it to retrace steps?
How is data maintained between screen changes?
Multiple Intelligences
12.
Design Visual Appearance
How does it look?
What feelings will the look of the system generate for
the user?
Colours
Font size
Graphic design
Simplicity
“Form follows function”
13.
Create Accessibility
What provision is there for disabled users with
accessibility needs?
What are the legal requirements for accessibility?
289
Proceedings of The 4th International Multi-Conference on Society, Cybernetics and Informatics (IMSCI 2010)

REFERENCES
N. Branden, 1. The psychology of self-esteem: a revolution-
ary approach to self-understanding that launched a new era
in modern psychology. San Francisco: Jossey-Bass, 2001.
ISBN10: 0787945269
P.T. Ewell, 2. Organizing for learning: A point of entry.
Draft prepared for discussion at the 1997 AAHE Summer
Academy at Snowbird. National Center for Higher Educa-
tion Management Systems (NCHEMS). Available: http://
www.intime.uni.edu/model/learning/learn_summary.html
C.K.Knapper and A. J. Cropley. 3. Lifelong Learning
in Higher Education - Routledge; 1 edition ISBN13:
9780749402976 ISBN10: 0749402970 (1991)
B. S. Bloom (Ed.) 4. Taxonomy of Educational Objectives:
pp. 201–207;
Longman Group UK (Jun 1969) ISBN-10: 0679302115
ISBN-13: 978-0679302117
M. Haywood, I. Nixon, R. Bell and J. Burke. 5. Evaluation
and Review of Technical Developments to Support Life-
http://www.jisc.ac.uk/media/documents/
programmes/elearningcapital/evaluationtechlifelongreport.
pdf (2009)
J. Reed and D. Sowden, 6. E-systems development within
Lifelong Learning Networks (LLNs); http://www.
lifelonglearningnetworks.org.uk/documents/document378.
pdf (2008)
CONCLUSIONS
14.
Provide Training
What training will the user require?
How will training be provided for the user?
Help
eLearning
Trainers
15.
Provide Support
What will happen if an error occurs on the system?
Who is responsible for maintaining the application?
Error handling
Clear error messages
16.
Provide Feedback
Opportunity
How can a user feedback problems?
290
Proceedings of The 4th International Multi-Conference on Society, Cybernetics and Informatics (IMSCI 2010)

Academic Integrity and Instructional Design - What Can They Possibly Have in Common?
Dr. Greg Williams
Instructional Systems Development Graduate Program
University of Maryland, Baltimore County
Baltimore, Maryland 21250, USA
Abstract
200 words max
Academic integrity is a core value of the culture of
higher education. eLearning has been a lightning rod
for academic integrity with many academic being very
skeptical about the quality and integrity of elearning.
At the same time the growth of eLearning has created a
demand for instructional designers. Instructional
design is an applied discipline that many college and
university faculty do not know much about. Some of
the benefits of instructional design include using a
variety of instructional strategies, applying a diversity
of assessment techniques, higher level learning.
Ironically, some of these same things may also make it
more difficult for students to cheat, but may also lead
to higher levels of learning as measured by Bloom’s
Taxonomy. By applying some simple instructional
design strategies, faculty can not only improve the
academic integrity of the their course, but also the
learning outcomes
Keywords: Academic Integrity, Blooms’s Taxonomy,
Cheating, elearning, Instructional Design, Online Learning,
Plagiarism, Learning Outcomes, Learning Objectives
Introduction
Academic integrity has always been a big issue in
higher education. With the growth of eLearning, the
spotlight has been focused on this issue even more.
The growth of eLearning makes some members of the
higher education community think that this form of
instructional delivery makes cheating even easier.
Additionally, many traditional faculty even question
the quality of courses delivered via eLearning.
Academic integrity is one of the core values of higher
education. Earning a college degree is an individual
achievement; the academic community put s a high
price on this prized individual credential.
Additionally, many academicians also are very
skeptical of instructional design. Many faculty find it
hard to believe that someone without a degree in their
discipline can help them design an effective course.
Ironically, the growth of eLearning has spurred the
need for professional degreed instructional designers.
So what do academic integrity and instructional design
have in common? They probably have a great deal
more in common than most people think.
Improving Academic Integrity
There are a number of strategies and simple techniques
that can be applied to reduce cheating and improve
academic integrity. The primary goal should be to
design courses that improve instruction and learning
outcomes. It is possible to accomplish that AND
address academic integrity issues.
Unfortunately, a number of courses in higher education
focus on only the first two levels of Bloom’s
taxonomy, knowledge and comprehension. Ironically,
these are some of the easiest learning outcomes for
students to cheat on, since they are often assessed by
objectives test (e.g. multiple choice, true and false).
Here are some simple strategies ways improve
academic integrity almost immediately:
1. Educate the students on academic integrity
and have a written policy
2. Assess students more than two to three times
(e.g. mid-term final and paper)
3. Provide frequent opportunities for students to
receive feedback
4. Limit the use of objective tests.
5. If you must use objective tests, have different
versions of them.
6. Use timed tests
7. Do not use “generic” research papers.
8. Use academic integrity software tools such as
“Turn it In”
There are many more was to reduce cheating than
listed here. For example, if written assignments are
required, there are a number of things that faculty can
do. Do not allow students to write about generic
topics. Give them a list of choices for research papers
that are off the beaten path. Require students to turn in
rough draft at periodic points. Require student to use a
variety of reference and also place limits on them such
no more than two printed book, three electronic article,
two Internet site, etc. Additionally, you can say that all
reference must be no more than five years old and
require and annotated bibliography. You can require
that students include certain section such as an analysis
of the literature, etc.
291
Proceedings of The 4th International Multi-Conference on Society, Cybernetics and Informatics (IMSCI 2010)
Improving Learning Outcomes
Using some of strategies noted above will indeed
reduce cheating, but will they improve learning
outcomes and quality of the course? Probably not.
While it may be relatively easy for a faculty member to
safeguard their courses against cheating, it more
important to make the course a better learning
experience for the student. Can both be accomplished?
Taken at face value, the topics of academic integrity
and instructional design probably have little in
common. But if one takes a closer look, they can see
that there is a significant relationship between these
two topics. A well designed course can serve both
purposes.
Courses that aim for low levels of learning on Bloom’s
taxonomy (knowledge and comprehension) usually are
the easiest course in which to cheat. Why? They
normally have only objective tests and generic research
paper as the only type of student assessments. A well
designed course can not only assist the instructor in
achieving higher level of learning, but address
academic integrity as a secondary benefit. For example
it much more difficult to cheat on an assignment that
requires the application of knowledge, or to perform an
evaluation, than to simply take a multiple choice tests.
Principles of Instructional Design
One of the major goals of instructional design is to
improve learning outcomes. Some of the foundations
of effective instructional design include:
Creating clear and measurable learning
objectives
Using a variety of instructional strategies
Providing ongoing feedback
Assessing learning frequently using a variety
of assessment tools
Engaging learners
Providing learners opportunities to apply what
they have learned
Providing opportunities for learners to use
previous knowledge and experience
Making learning meaningful
Improving Academic Integrity AND Course Design
Let’s examine some of the principles of instructional
design in a new context. Here are some ways that
sound instructional design can not only improve
learning outcomes, but address academic integrity as
well. They include:
1. Require a variety of assignments, not just tests
and papers. Have a variety of student
assessments that are more frequent and
smaller than major traditional assessments,
such as a mid-term and final exams along with
research paper
2. Use objective tests sparingly (e.g. multiple
choice, true/false). If you must use them,
have some short answers questions. If you are
aiming at higher levels of learning, objectives
test won’t work very well.
3. Use measurable learning objectives that link
to higher levels of learning in Bloom’s
Taxonomy (application, synthesis,
evaluation). The old saying that “you can’t
learn to ride a bike in a seminar” is very true.
4. Try not to require “generic” written
assignments. Give them a list of topics that
you approve that have a different slant on the
topic. For example, you can post some
“critical thinking skills” questions in the
assignment. It is less likely that there will be
existing papers “for sale” on more unique
topics. Also, require rough drafts that give
you the opportunity to provide feedback long
before the final written assignment is due.
5. Make students do presentations on their
written assignments, projects, portfolios, etc.
They can be live or recorded. This can be
easily done with just a webcam or a consumer
camcorder, or other forms of multi-media.
6. Incorporate individual project assignments
(not tests), where students can actually apply
what they learned.
7. Use a portfolio approach that requires students
to reflect (using a written journal) on their
learning. For example, you can provide
opportunities for students to incorporate their
prior learning or experience in an assignment.
Since this will be unique by definition, every
student will have something different
8. Use “open book” approach to assignments that
requires students to use higher level learning
(e.g. application, analysis, synthesis,
evaluation). This will force students to come
up with a variety of different ideas and
approaches, compared to choosing one correct
answer on a multiple choice test.
Conclusion
The issue of academic integrity will never go away
completely. Academic integrity and instructional
design are not often mentioned in the same sentence.
However there is a relationship that may help faculty in
both areas. By incorporating some of the instructional
design principles, faculty will improve academic
integrity as, well as improve the design of the course.
This will require the faculty member to do more work,
but in the end, it will improve learning outcomes for
the students
292
Proceedings of The 4th International Multi-Conference on Society, Cybernetics and Informatics (IMSCI 2010)

The issue of academic integrity will never go away
completely. Academic integrity and instructional
design are not often mentioned in the same sentence.
However there is a relationship that may help faculty in
both areas. By incorporating some of the instructional
design principles, faculty will improve academic
integrity as, well as improve the design of the course.
This will require the faculty member to do more work,
but in the end, it will improve learning outcomes for
the students.
References
[1] J.C. Adkins, C. Kenkel, Lo Lim. Deterrents to
online academic dishonesty. The Journal of Learning in
Higher Education 1(1): 17-22. Accessed September 7,
2007, from
http://jwpress.com/JLHE/Issues/v1i1/Deterrents%20to
%20Online%20Academic%20Dishonesty.pdf
[2] B. Christe, Designing online courses to discourage
dishonesty, 2003
Educause Quarterly November 4: 54-58.
[3] G. J. Cizek, Cheating on tests: How to do it, detect
it, and prevent it. Lawrence Erlbaum Associates: New
Jersey, 1999
[4] R.A. Dewey, Writing multiple choice items which
require comprehension. Retrieved September 6, 2007,
from http://www.psywww.com/selfquiz/aboutq.htm
[5] V. Harsh, V. (2004). Assessing well: Using
publisher test banks as a component of an assessment
portfolio. Educator’s Voice 5(7). Retrieved September
24, 2007, from
http://www.ecollege.com/Newsletter/EducatorsVoice/E
ducatorsVoice-Vol5Iss7.learn
[6] C. Kleiner, and M. Lord. (1999). The cheating
game. U.S. News and World Report November 22.
Retrieved September 24, 2007, retrieved from
http://www.usnews.com/usnews/culture/articles/99112
2/archive_002427.htm
[7] Olt, M.R. Ethics and distance education: strategies
for minimizing academic dishonesty in online
assessment. Online Journal of Distance Learning
Administration, 5(3). 2002, Retrieved September 6,
2007, from
http://www.westga.edu/%7Edistance/ojdla/fall53/olt53.
html
[8] G.C. Rakes, (n.d.). The effects of open book testing
on student performance in online learning
environments. Retrieved September 6, 2007, from
http://edtech.tennessee.edu/rite/rite2006/rakes_rite_06.
[9] E. Rohrer, Creating quality multiple choice
questions. Educator’s Voice 7(5). 2006, Retrieved
September 24, 2007, from
http://www.ecollege.com/Newsletter/EducatorsVoice/
EducatorsVoice-Vol7Iss5.learn
[10] N. C. Rowe, Cheating in online student
assessment: beyond plagiarism.
Online Journal of Distance Learning Administration
VII (II), Summer. 2004, Retrieved September 6, 2007,
retrieved from
http://www.cs.nps.navy.mil/people/faculty/rowe/dlchea
t.htm
[11] S. Trenholm, S. A review of cheating in fully
asynchronous online courses: a math or fact-based
course perspective. Journal of Educational Technology
Systems 35: 281-300, 2006-2007.
293
Proceedings of The 4th International Multi-Conference on Society, Cybernetics and Informatics (IMSCI 2010)

294
Proceedings of The 4th International Multi-Conference on Society, Cybernetics and Informatics (IMSCI 2010)

AUTHORS INDEX Volume I
Allen, Fred 51 Alsorook, Metta 30 Álvarez García, María Concepción 80 Anselmi, Pasquale 180 Arvide Cambra, Luisa María 195 Bach, Craig 35; 40 Bardelle, Cristina 112; 118 Bevan, Andy 271 Blair, Risa 71 Bollaert, Hiram 57 Borka, Michael J. 197 Boyle, Malcolm 184 Branham, David 208 Brante, Göran 2; 8 Brown, Ted 184 Burr, Kevin L. 140 Butrous, Nasir 202 Byrne, Roxanne 74 Carroll, Jennie 280 Centra, M. 62 Chadha, Anita 208 Chen, Der-Thanq "Victor" 213 Cheung, Wai-Ming 1 Corfield, Fleur 218 Dearden, Thomas 164 Espasa, Anna 230 Falorsi, P. D. 62 Ferrari, Pier Luigi 112 Fombona Cadavieco, Javier 80 Garrard, Greg 271 Gherardi, Massimo 224 Gore, David 84 Gualtieri, V. 62 Guasch, Teresa 230 Hara, Yohei 141 Hartman, Sheryl 71 Head, Anthony 271 Hives, Lauren 274 Holmqvist, Mona 2; 8; 12 Hor, Shu 153; 159
Hus, Vlasta 236 Ikeguchi, Cecilia 89 Iribarren, Jacinto F. 80 Iserbyt, Peter 241 Johnson, Lenora 172 Kinash, Shelley 274 Knight, Diana 274 Kostolányová, Katerina 147 Kuo, Chin-Guo 159 Kwon, Harry 172 Lai, Xi-Nan 159 Lee, Marie 84 Lewis, Belinda 184 Li, Fan 153; 159 Li, Jeen-Fong 153; 159 Lincoln Wolthuis, Stuart 164 Linfante, G. 62 Liu, Chih-Che 265 Magnusson, Andreas 12 Magro, Adriane 172 Mampaso Desbrow, Joanne 80 Maurino, Paula San Millan 124 Mceachron, Donald 35; 45 McKenna, Lisa 184 Mejang, Samran 130 Mellado Miller, Ronald 164 Mendoza, Antonette 280 Menezes, Maria Helena 168 Mideros, Diego 94 Molloy, Liz 184 Morley, Graham 243 Nail, Allan 247 Ohta, Tsutomu 141 Olteanu, Constanta 18 Ono, Hiroyuki 141 Ono, Shuichiro 141 Ousley, Anita 172 Pando Cerra, Pablo 80 Papazoglou, Elisabeth 51 Pascual Sevillano, María Ángeles 80
295
Proceedings of The 4th International Multi-Conference on Society, Cybernetics and Informatics (IMSCI 2010)

Reinertsen, Anne 248 Roberts, Nicole 94 Robusto, Egidio 180 Sano, Toshio 141 Sanz, Markus 134 Šarmanová, Jana 147 Selezneva, Elena 100 Smith, Linda J. 189 Sowden, David P. 285 Stanley, Timothy 164 Steele, Godfrey A. 253 Stefanutti, Luca 180 Stern, Linda 280 Styron, Jennifer 106 Styron, Jr., Ronald A. 106 Suzuki, Akiyoshi 259 Swarz, Jeffrey 172 Takács, Ondrej 147 Tang, Matthew 74 Tang, Michael 74 Tomé, Vitor 168 Torres, Antoinette 45 Tranduc, John 74 Trna, Josef 68 Trnova, Eva 68 Tsui, Yoko H. W. 164 Tullgren, Charlotte 2; 8 Unalan, H. Turgay 178 Veiga, Alberto 100 Vianello, Gilmo 224 Vittori Antisari, Livia 224 Wassus, Kenny 84 Wennås Brante, Eva 24 Williams, Brett 184 Williams, Greg 291 Wu, Jing 213 Wu, Jui-Han 265 Wu, Ming-Jenn 159 Zamboni, Nicoletta 224
296
Proceedings of The 4th International Multi-Conference on Society, Cybernetics and Informatics (IMSCI 2010)