Interdependence and dynamic linkages between stock markets of Sri Lanka and its trading partners
13
ELSEVIER Journal of MULTINATIONAL FINANCIAL Journalof Multinational Financial Management MANAGEMENT 8(1998)89-101 Interdependenceand dynamic linkages between stock markets of Sri Lanka and its trading partners Elyas Elyasiani a, Priyal Perera b,Tribhuvan N. Puri a-* ’ Depurtmeni qf Finance, Temple University, Pkiludelpltia, PA 19122. USA b Unit Trust Manugrment Co. (Pvt) Ltd., 3rd Floor. West Wing, Bank qf‘Ce,vlon, York Street, Colomho 1. Sri Lanka Received 30 December 1996; received in revised form 30 December 1997; accepted 30January 1998 Abstract This paper investigates the interdependence and dynamic linkages between the emerging capital market of Sri Lanka and the markets of its major trading partners (Taiwan, Singapore, Japan, South Korea, Hong Kong, India, and the US) using the vector autoregression (VAR) technique. No significant interdependence is discovered between the Sri Lankan market and the equity markets of the US and the Asian markets considered. Small capitalization, lack of liquidity, high concentration in blue chips, and unilateral investment barriers on Sri Lankan investors are possible reasons for lack of interdependence. 0 1998 Elsevier ScienceB.V. All rights reserved. JEL classtj?cation: G15; 053 Keywords: VAR; Sri Lanka; Emerging country 1. Introduction In recent years, the emerging capital market of Sri Lanka has generated consider- able interest among regional as well as global investors largely because of a rapid increase in its level of economic activity and the 1989 legislation liberalizing foreign investment in this country. Tables 1 and 2 document the trend in the GDP, imports, exports, foreign investment, and stock market performance in Sri Lanka in the aftermath of the civil unrest of the 1980s particularly in the 1989-1994 period. According to the figures in these tables, Sri Lanka witnessed an extraordinary spurt of economic growth and foreign trade during this period, with the real GDP growth averaging an annual rate of about 5%, and exports and imports growing at impressive * Corresponding author. Fax: + I 215 204 1697; e-mail: [email protected] 1042-444X/98/$19.00 0 1998 Elsevier Science B.V. All rights reserved PII S1042-444X(98)00020-6
Transcript of Interdependence and dynamic linkages between stock markets of Sri Lanka and its trading partners
ELSEVIER
Journal of MULTINATIONAL FINANCIAL
Journal of Multinational Financial Management MANAGEMENT 8(1998)89-101
Interdependence and dynamic linkages between stock markets of Sri Lanka and its trading partners
Elyas Elyasiani a, Priyal Perera b, Tribhuvan N. Puri a-* ’ Depurtmeni qf Finance, Temple University, Pkiludelpltia, PA 19122. USA
b Unit Trust Manugrment Co. (Pvt) Ltd., 3rd Floor. West Wing, Bank qf‘Ce,vlon, York Street, Colomho 1. Sri Lanka
Received 30 December 1996; received in revised form 30 December 1997; accepted 30 January 1998
Abstract
This paper investigates the interdependence and dynamic linkages between the emerging capital market of Sri Lanka and the markets of its major trading partners (Taiwan, Singapore, Japan, South Korea, Hong Kong, India, and the US) using the vector autoregression (VAR) technique. No significant interdependence is discovered between the Sri Lankan market and the equity markets of the US and the Asian markets considered. Small capitalization, lack of liquidity, high concentration in blue chips, and unilateral investment barriers on Sri Lankan investors are possible reasons for lack of interdependence. 0 1998 Elsevier Science B.V. All rights reserved.
JEL classtj?cation: G15; 053
Keywords: VAR; Sri Lanka; Emerging country
1. Introduction
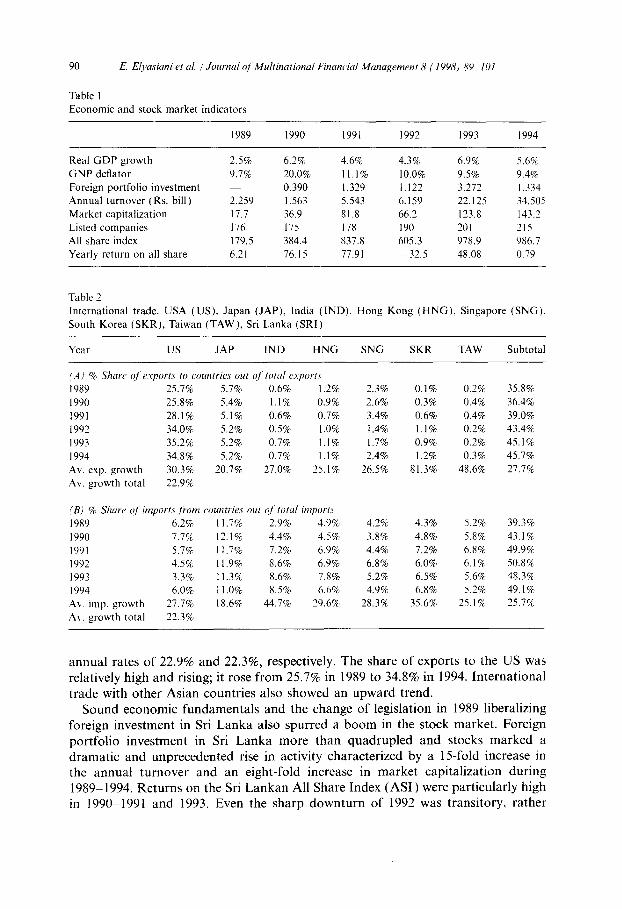
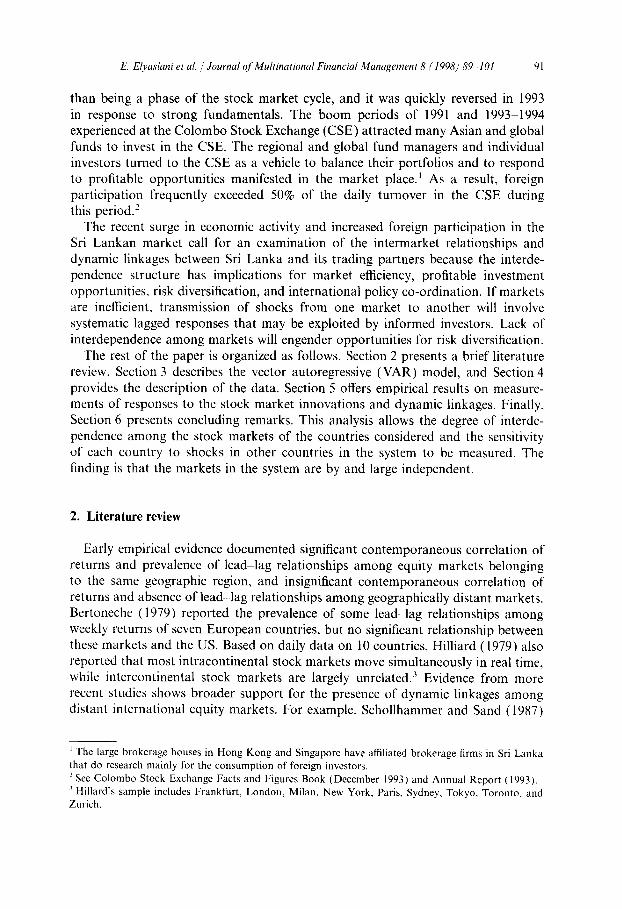
In recent years, the emerging capital market of Sri Lanka has generated consider- able interest among regional as well as global investors largely because of a rapid increase in its level of economic activity and the 1989 legislation liberalizing foreign investment in this country. Tables 1 and 2 document the trend in the GDP, imports, exports, foreign investment, and stock market performance in Sri Lanka in the aftermath of the civil unrest of the 1980s particularly in the 1989-1994 period. According to the figures in these tables, Sri Lanka witnessed an extraordinary spurt of economic growth and foreign trade during this period, with the real GDP growth averaging an annual rate of about 5%, and exports and imports growing at impressive
* Corresponding author. Fax: + I 215 204 1697; e-mail: [email protected]
1042-444X/98/$19.00 0 1998 Elsevier Science B.V. All rights reserved PII S1042-444X(98)00020-6
90 E. Elyusiani et al. ; Journul of’ Multinutional Financiul Management 8 (I 998) @-~I01
Table 1 Economic and stock market indicators
1989 1990 1991 1992 1993 1994
Real GDP growth 2.5% 6.2% 4.6% 4.3% 6.9% 5.6% GNP deflator 9.7% 20.0% 11.1% 10.0% 9.5% 9.4% Foreign portfolio investment 0.390 1.329 1.122 3.272 1.334 Annual turnover (Rs. bill ) 2.259 1.563 5.543 6.159 22.125 34.505 Market capitalization 17.7 36.9 81.8 66.2 123.8 143.2 Listed companies 176 175 178 190 201 215 All share index 179.5 384.4 837.8 605.3 978.9 986.7 Yearly return on all share 6.21 76.15 77.91 -32.5 48.08 0.79
Table 2 International trade. USA (US), Japan (JAP), India (IND). Hong Kong (HNG), Singapore (SNG). South Korea (SKR), Taiwan (TAW), Sri Lanka (SRI)
Year us JAP IND HNG SNG SKR TAW Subtotal
(A) % Shure of’ rsports to countries out of’ totul esports
1989 25.7% 5.7% 0.6% 1.2%
1990 25.8% 5.4% 1.1% 0.9% 1991 28.1% 5.1% 0.6% 0.7% 1992 34.0% 5.2% 0.5% 1.0% 1993 35.2% 5.2% 0.7% 1.1% 1994 34.8% 5.2% 0.7% 1.1%
Av. exp. growth 30.3% 20.7% 27.0% 25.1% Av. growth total 22.9%
(B) % She of’imports from countries out of’ totd import.\
1989 6.2% 11.7% 2.9% 4.9%
1990 7.7% 12.1% 4.4% 4.5% 1991 5.7% 11.7% 7.2% 6.9%
1992 4.5% 11.9% 8.6% 6.9% 1993 3.3% 11.3% 8.6% 7.8% 1994 6.0% 1 I .O% 8.5% 6.6%
Av. imp. growth 27.7% 18.6% 44.7% 29.6%
Av. growth total 22.3%
2.3% 0.1% 0.2%
2.6% 0.3% 0.4% 3.4% 0.6% 0.4%
1.4% 1.1% 0.2%
1.7% 0.9% 0.2% 2.4% 1.2% 0.3%
26.5% 81.3% 48.6%
4.2% 4.3% 3.8% 4.8% 4.4% 7.2%
6.8% 6.0% 5.2% 6.5% 4.9% 6.8%
28.3% 35.6%
5.2%
5.8% 6.8%
6.1% 5.6% 5.2%
25.1%
35.8%
36.4% 39.0% 43.4%
45.1% 45.7%
27.7%
39.3% 43.1% 49.9%
50.8% 48.3% 49.1%
25.7%
annual rates of 22.9% and 22.3%, respectively. The share of exports to the US was relatively high and rising; it rose from 25.7% in 1989 to 34.8% in 1994. International trade with other Asian countries also showed an upward trend.
Sound economic fundamentals and the change of legislation in 1989 liberalizing foreign investment in Sri Lanka also spurred a boom in the stock market. Foreign portfolio investment in Sri Lanka more than quadrupled and stocks marked a dramatic and unprecedented rise in activity characterized by a 15-fold increase in the annual turnover and an eight-fold increase in market capitalization during 1989- 1994. Returns on the Sri Lankan All Share Index (AS1 ) were particularly high in 1990&1991 and 1993. Even the sharp downturn of 1992 was transitory, rather
E. Elyusiuni et al. /Journal qfMultinationa1 Financial Manqement 8 (1998) 89-101 91
than being a phase of the stock market cycle, and it was quickly reversed in 1993 in response to strong fundamentals. The boom periods of 1991 and 1993-1994 experienced at the Colombo Stock Exchange (CSE) attracted many Asian and global funds to invest in the CSE. The regional and global fund managers and individual investors turned to the CSE as a vehicle to balance their portfolios and to respond to profitable opportunities manifested in the market place.’ As a result, foreign participation frequently exceeded 50% of the daily turnover in the CSE during this period.2
The recent surge in economic activity and increased foreign participation in the Sri Lankan market call for an examination of the intermarket relationships and dynamic linkages between Sri Lanka and its trading partners because the interde- pendence structure has implications for market efficiency, profitable investment opportunities, risk diversification, and international policy co-ordination. If markets are inefficient, transmission of shocks from one market to another will involve systematic lagged responses that may be exploited by informed investors. Lack of interdependence among markets will engender opportunities for risk diversification.
The rest of the paper is organized as follows. Section 2 presents a brief literature review. Section 3 describes the vector autoregressive (VAR) model, and Section 4 provides the description of the data. Section 5 offers empirical results on measure- ments of responses to the stock market innovations and dynamic linkages. Finally, Section 6 presents concluding remarks. This analysis allows the degree of interde- pendence among the stock markets of the countries considered and the sensitivity of each country to shocks in other countries in the system to be measured. The finding is that the markets in the system are by and large independent.
2. Literature review
Early empirical evidence documented significant contemporaneous correlation of returns and prevalence of lead-lag relationships among equity markets belonging to the same geographic region, and insignificant contemporaneous correlation of returns and absence of lead-lag relationships among geographically distant markets. Bertoneche ( 1979) reported the prevalence of some lead-lag relationships among weekly returns of seven European countries, but no significant relationship between these markets and the US. Based on daily data on 10 countries, Hilliard (1979) also reported that most intracontinental stock markets move simultaneously in real time, while intercontinental stock markets are largely unrelated.” Evidence from more recent studies shows broader support for the presence of dynamic linkages among distant international equity markets. For example, Schollhammer and Sand (1987)
I The large brokerage houses in Hong Kong and Singapore have affiliated brokerage firms in Sri Lanka that do research mainly for the consumption of foreign investors. ‘See Colombo Stock Exchange Facts and Figures Book (December 1993) and Annual Report (1993). ’ Hillard’s sample includes Frankfurt, London, Milan, New York. Paris, Sydney, Tokyo, Toronto, and Zurich.
92 E. Elyasiani et al. / Journal of Multinational Financial Management 8 (I 998) 89-101
investigate lead-lag relationships among 13 international indices over the 198 1~ 1983 period and find that the US market generally leads other markets by approximately one trading day. Using daily data across nine major markets, Eun and Shim ( 1989) also report that a substantial degree of interdependence exists among these markets, with the US market leading the other eight4 Koch and Koch (1991) provide further evidence that the US market leads the European and Asian markets by one or two days. Arshanapalli and Doukas (1993) demonstrate that a high degree of interde- pendence did prevail among stock markets of Japan, US, UK, Germany, and France prior to the 1987 market crash and that the link further strengthened after the crash, with the exception of Japan. Friedman and Shachmurove ( 1996) study the transmis- sion of innovations among European stock markets employing the VAR technique and find differential effects for the small and large markets; while the stock markets of Britain, France, Germany and the Netherlands are highly related, the smaller markets of Belgium, Denmark, Italy, and Spain are rather independent.
A natural question is whether small emerging markets of various geographic regions exhibit lagged adjustments to innovations originating from the regional and dominant capital markets. Studies in this area are limited. Shachmurove (1995) uses the VAR technique to estimate dynamic linkages among four Latin American countries and finds that none of the South American markets is completely indepen- dent. Chan et al. (1992) examine relationships among stock markets of South Korea. Singapore, Taiwan, Japan, and the US using cointegration tests and conclude that the Asian stock markets in their sample are independent and weak-form efficient in the long run.’
The purpose of this study is to provide evidence on interdependence between the emerging market of Sri Lanka and the capital markets of its major trading partners, including the US and six Asian countries -- Taiwan, Singapore, Japan, South Korea, Hong Kong, and India. Using a VAR model, a dynamic system of simultaneous equations is estimated for the Sri Lankan stock market and the stock markets of the US and the six aforesaid Asian countries over the 1989-1994 period. A forecast error variance decomposition is used to determine whether linkages exist among these markets and in particular to what extent the Sri Lankan market is influenced by those of its trading partners. Through an impulse response analysis, the paper also investigates the transmission of innovations originating in the US and the six Asian markets to the CSE. Empirical findings suggest that Sri Lanka’s major trading partners have little impact on the CSE and the Sri Lankan market behaves mostly through its own internal dynamics. This is in accord with the extant studies. Small capitalization, lack of liquidity, high concentration in blue chips, and investment
’ Eun and Shim’s sample includes Australia, Japan, Hong Kong. UK, Switzerland, France, Germany, Canada. and US. ’ For studies of stock market interdependence in the industrialized countries based on cointegration analysis, see Dwyer and Hafer ( 1993) and Chan and Lai (1993). Dwyer and Hafer investigate the markets for the US, UK. Japan, and Germany and find that sets of stock price indexes manifest a common factor with a unit root. Chan and Lai consider 14 countries including Brussels, Frankfurt, Hong Kong, Johannesburg, London, Milan, New York, Paris, Singapore, Stockholm, Sydney, Tokyo. Toronto. and Zurich. Most of these countries show some evidence of cointegration with others.
E. ELyusiani et al. i Journal of Multinational Finuncial Managemmf 8 (1998) 89-101 93
barriers on Sri Lankan investors to invest abroad are possible explanations for the lack of interdependence and absence of linkages between Sri Lanka and other markets under consideration. An implication of the Sri Lankan stock market being independent of other equity markets considered is that this emerging market is not yet significantly integrated into the global markets and this lack of integration allows CSE to provide additional profit opportunities and diversification benefits to global portfolios.
3. The econometric model
The VAR model, originally developed by Sims ( 1980), enables one to identify the responses in each country to the innovations originating in various stock markets included in the system.6 The VAR model can be expressed as follows:
R,=a+ i & R,-k+E, k=l
(1)
where R, is an m x 1 column vector of daily returns for the m stock markets in the system, x is an m x 1 vector of constant terms, Pk is an n? x m matrix of coefficients, L is the number of lags, and E, is an m x 1 vector of white noise errors independently and normally distributed with zero mean. The ijth component of the matrix flk measures the direct impact of a change in thejth market on the ith market in period k.’ The response of a given market to shocks emanating in the same or another market within the system can be analyzed through a VAR system of moving averages (MA) described as:
R,= 2 hfk &k k=O
(2)
In this system, R, is a stationary process and it is a linear combination of the current and the past one-step ahead forecast errors. The ijth component of the matrix ~4~ represents the response of the ith market to a shock in thejth market. If the elements of the error vector E, are correlated, the error terms can be transformed by a lower triangular matrix Q to solve the problem. The orthogonalized innovations v can be obtained from E = Qv and can be incorporated in the above MA representation as:
R,= f Pk V,-k k=O
where P, = MkQ (see Eun and Shim, 1989). The ijth component of P, is the impulse
’ See also Vector autoregressions: A user’s guide (Hakkio and Morris, 1984). 7 While the simplicity of the systematic structure of VAR is an advantage, its unrestricted construction poses a drawback for econometric analysis because some important variables may be omitted. Moreover. the presence of only lagged variables as regressors requires that all the contemporaneous shocks feed through the error term. This may be problematical in variance decomposition and impulse responses analysis because when residuals are highly correlated ordering of the variables may vastly atrect the impulse responses.
94 E. Elyasiani et al. /Journal qf’Mulrinational Financial Management 8 (1998) 8V-101
response of the ith market in period k to a shock in the jth market. Usually, this latter shock is given in terms of a standard error. It should be noted that when orthogonalization is performed, the triangular system employed is only one possible transformation among many, depending on the ordering of the variables in the VAR system.
4. Data
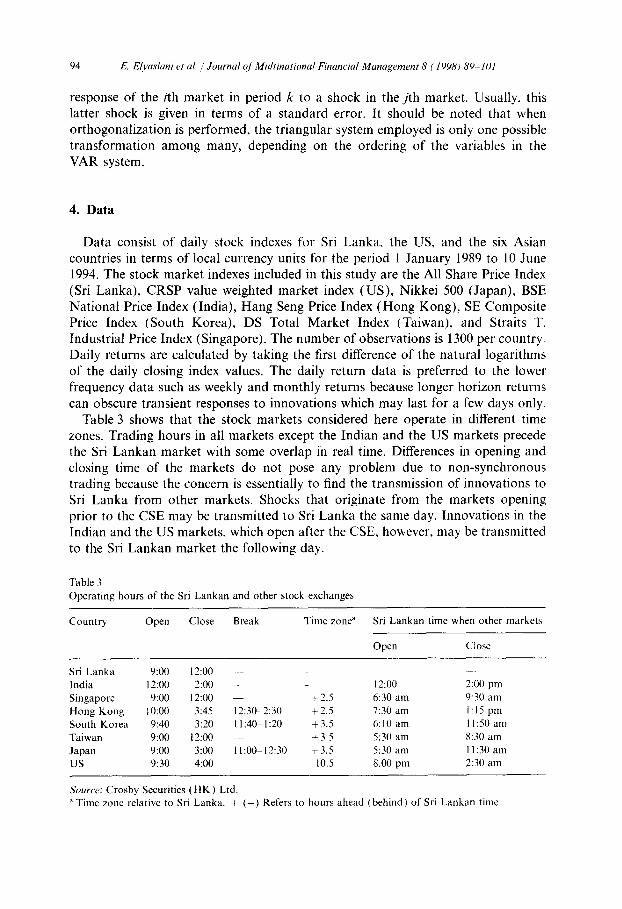
Data consist of daily stock indexes for Sri Lanka, the US, and the six Asian countries in terms of local currency units for the period 1 January 1989 to 10 June 1994. The stock market indexes included in this study are the All Share Price Index (Sri Lanka), CRSP value weighted market index (US), Nikkei 500 (Japan), BSE National Price Index (India), Hang Seng Price Index (Hong Kong), SE Composite Price Index (South Korea), DS Total Market Index (Taiwan), and Straits T. Industrial Price Index (Singapore). The number of observations is 1300 per country. Daily returns are calculated by taking the first difference of the natural logarithms of the daily closing index values. The daily return data is preferred to the lower frequency data such as weekly and monthly returns because longer horizon returns can obscure transient responses to innovations which may last for a few days only.
Table 3 shows that the stock markets considered here operate in different time zones. Trading hours in all markets except the Indian and the US markets precede the Sri Lankan market with some overlap in real time. Differences in opening and closing time of the markets do not pose any problem due to non-synchronous trading because the concern is essentially to find the transmission of innovations to Sri Lanka from other markets. Shocks that originate from the markets opening prior to the CSE may be transmitted to Sri Lanka the same day. Innovations in the Indian and the US markets, which open after the CSE, however, may be transmitted to the Sri Lankan market the following day.
Table 3 Operating hours of the Sri Lankan and other stock exchanges
Country Open Close Break Time zoned Sri Lankan time when other markets
Open Close
Sri Lanka 9:oo 12:oo India I2:OO 2:oo Singapore 9:oo 12:oo Hong Kong IO:00 3:45 South Korea 9:40 3:20 Taiwan 9:oo 12:oo Japan 9:oo 3:oo us 9:30 4:oo
12:oo 2:00 pm f2.5 6:30 am 930 am
12:30-2:30 +2.5 7:30 am I:15 pm 1 I :40-- 1:20 +3.5 6:lO am I 1:50 am
+3.5 5:30 am 8:30 am 1 l:OOGl2:30 +3.5 5:30 am 1 I :30 am
- 10.5 8.00 pm 230 am
Source: Crosby Securities (HK) Ltd. a Time zone relative to Sri Lanka. + (-) Refers to hours ahead (behind) of Sri Lankan time
E. Elyasiuni et ul. /Journal qf’Multinationa1 Financial Management 8 (199X) 89-101 95
5. Empirical results
5.1. Interdependence structure
Data must be tested for stationarity before they are used for model estimating and testing. The returns series on the equity markets under consideration are found to be non-stationary, namely to contain unit roots. However, the augmented Dickey-Fuller (ADF) test results reject the null of unit root at the 5% level for the first-difference series for all eight countries, indicating that these series are stationary.* The first difference series will be used in carrying out lag length selection, causality tests, decomposition of the forecast error variance, and the impulse responses of the Sri Lankan Stock market to shocks in each of the other markets considered. The likelihood ratio test, employed e.g. also by Hamilton (1994), determines the optimal lag length for the VAR system to be 16.”
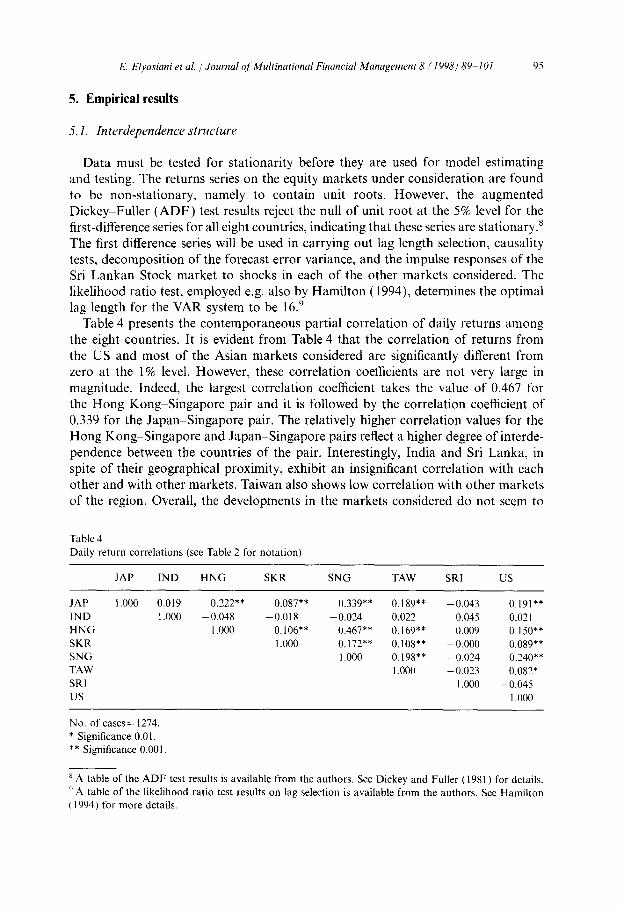
Table 4 presents the contemporaneous partial correlation of daily returns among the eight countries. It is evident from Table 4 that the correlation of returns from the US and most of the Asian markets considered are significantly different from zero at the 1% level. However, these correlation coefficients are not very large in magnitude. Indeed, the largest correlation coefficient takes the value of 0.467 for the Hong Kong-Singapore pair and it is followed by the correlation coefficient of 0.339 for the Japan-Singapore pair. The relatively higher correlation values for the Hong Kong-Singapore and Japan-Singapore pairs reflect a higher degree of interde- pendence between the countries of the pair. Interestingly, India and Sri Lanka, in spite of their geographical proximity, exhibit an insignificant correlation with each other and with other markets. Taiwan also shows low correlation with other markets of the region. Overall, the developments in the markets considered do not seem to
Table 4 Daily return correlations (see Table 2 for notation)
JAP IND HNG SKR SNG TAW SRI us
JAP 1 .ooo 0.019 0.222** 0.087** 0.339** 0.189** -0.043 0.191** IND 1 .ooo -0.048 -0.018 - 0.024 0.022 0.045 -0.021 HNG I.000 0.106** 0.467** 0.169** 0.009 0.150** SKR 1.000 0.172** 0.108** - 0.000 0.089** SNG 1 .ooo 0.198** - 0.024 0.240** TAW I .ooo - 0.023 0.082* SRI 1.000 - 0.045 US I .ooo
No. of cases= 1274. * Significance 0.01. ** Significance 0.001
’ A table of the ADF test results is available from the authors. See Dickey and Fuller ( 1981) for details. ‘) A table of the likelihood ratio test results on lag selection is available from the authors. See Hamilton ( 1994) for more details.
96 E. Elyasiani et cd. I Journal ~f’Multinational Financial Management 8 (1998) X9-101
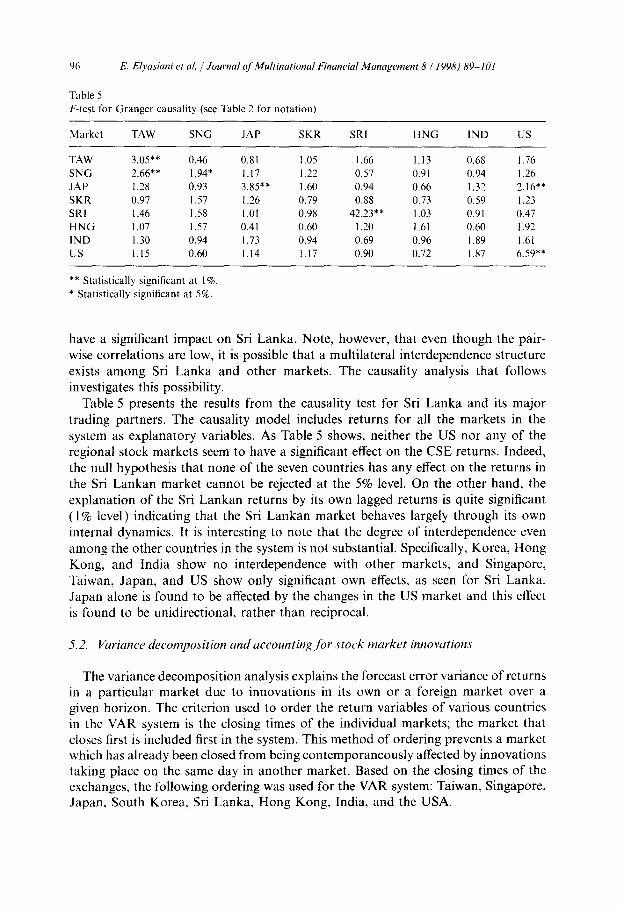
Table 5 F-test for Cranger causality (see Table 2 for notation)
Market TAW SNG JAP SKR SRI HNG IND US
TAW SNG JAP SKR SRI HNG IND us
3.05** 0.46 0.81 1.05 1.66 1.13 0.68 2.66** 1.94* I.17 I .22 0.57 0.91 0.94 I .28 0.93 3.85** I .60 0.94 0.66 1.32 0.97 1.57 I .26 0.79 0.88 0.73 0.59 I .46 1.58 I.01 0.98 42.23** 1.03 0.91 1.07 1.57 0.41 0.60 1.20 1.61 0.60 1.30 0.94 1.73 0.94 0.69 0.96 1.89 I.15 0.60 I.14 I.17 0.90 0.72 I .87
1.76 I .26 2.16** I .23 0.47 I .92 I.61 6.59**
** Statistically significant at I %. * Statistically significant at 5%.
have a significant impact on Sri Lanka. Note, however, that even though the pair- wise correlations are low, it is possible that a multilateral interdependence structure exists among Sri Lanka and other markets. The causality analysis that follows investigates this possibility.
Table 5 presents the results from the causality test for Sri Lanka and its major trading partners. The causality model includes returns for all the markets in the system as explanatory variables. As Table 5 shows, neither the US nor any of the regional stock markets seem to have a significant effect on the CSE returns. Indeed, the null hypothesis that none of the seven countries has any effect on the returns in the Sri Lankan market cannot be rejected at the 5% level. On the other hand, the explanation of the Sri Lankan returns by its own lagged returns is quite significant ( 1% level) indicating that the Sri Lankan market behaves largely through its own internal dynamics. It is interesting to note that the degree of interdependence even among the other countries in the system is not substantial. Specifically, Korea, Hong Kong, and India show no interdependence with other markets, and Singapore, Taiwan, Japan, and US show only significant own effects, as seen for Sri Lanka. Japan alone is found to be affected by the changes in the US market and this effect is found to be unidirectional, rather than reciprocal.
5.2. Variance decomposition und uccounting for stock market innovatioru
The variance decomposition analysis explains the forecast error variance of returns in a particular market due to innovations in its own or a foreign market over a given horizon. The criterion used to order the return variables of various countries in the VAR system is the closing times of the individual markets; the market that closes first is included first in the system. This method of ordering prevents a market which has already been closed from being contemporaneously affected by innovations taking place on the same day in another market. Based on the closing times of the exchanges, the following ordering was used for the VAR system: Taiwan, Singapore, Japan, South Korea, Sri Lanka, Hong Kong, India, and the USA.
E. Elyasiani et al. / Journal of Multinational Financial Management 8 (1998) 89-101 91
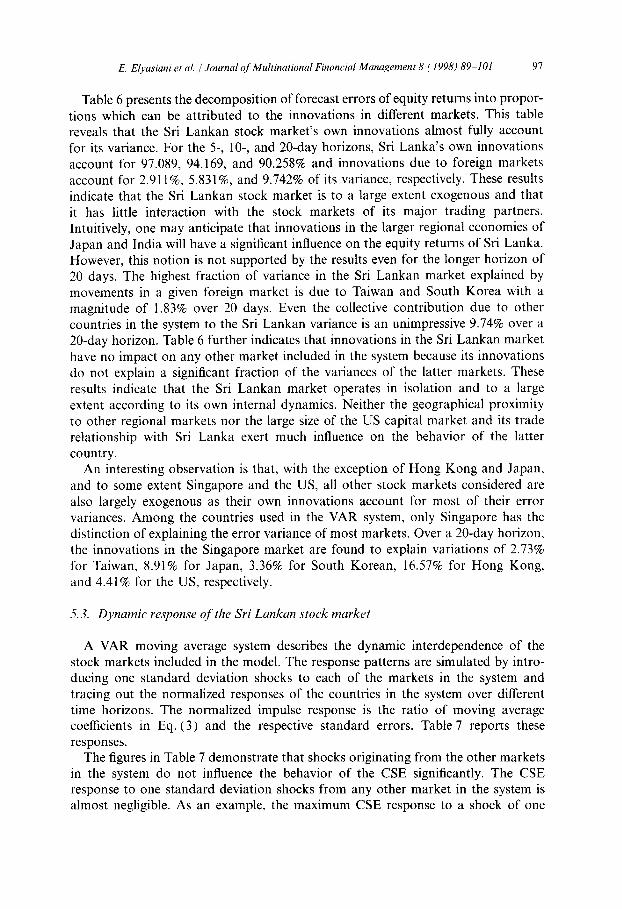
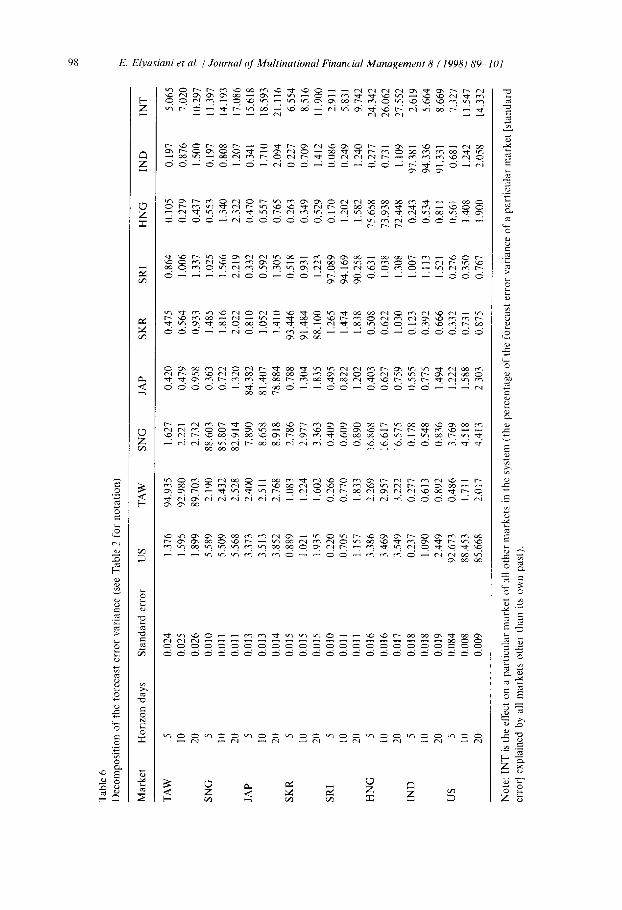
Table 6 presents the decomposition of forecast errors of equity returns into propor- tions which can be attributed to the innovations in different markets. This table reveals that the Sri Lankan stock market’s own innovations almost fully account for its variance. For the 5, lo-, and 20-day horizons, Sri Lanka’s own innovations account for 97.089, 94.169, and 90.258% and innovations due to foreign markets account for 2.91 l%, 5.831%, and 9.742% of its variance, respectively. These results indicate that the Sri Lankan stock market is to a large extent exogenous and that it has little interaction with the stock markets of its major trading partners. Intuitively, one may anticipate that innovations in the larger regional economies of Japan and India will have a significant influence on the equity returns of Sri Lanka. However, this notion is not supported by the results even for the longer horizon of 20 days. The highest fraction of variance in the Sri Lankan market explained by movements in a given foreign market is due to Taiwan and South Korea with a magnitude of 1.83% over 20 days. Even the collective contribution due to other countries in the system to the Sri Lankan variance is an unimpressive 9.74% over a 20-day horizon. Table 6 further indicates that innovations in the Sri Lankan market have no impact on any other market included in the system because its innovations do not explain a significant fraction of the variances of the latter markets. These results indicate that the Sri Lankan market operates in isolation and to a large extent according to its own internal dynamics. Neither the geographical proximity to other regional markets nor the large size of the US capital market and its trade relationship with Sri Lanka exert much influence on the behavior of the latter country.
An interesting observation is that, with the exception of Hong Kong and Japan, and to some extent Singapore and the US, all other stock markets considered are also largely exogenous as their own innovations account for most of their error variances. Among the countries used in the VAR system, only Singapore has the distinction of explaining the error variance of most markets. Over a 20-day horizon, the innovations in the Singapore market are found to explain variations of 2.73% for Taiwan, 8.91% for Japan, 3.36% for South Korean, 16.57% for Hong Kong, and 4.41% for the US, respectively.
5.3. Dynamic response of’ the Sri Lankan stock market
A VAR moving average system describes the dynamic interdependence of the stock markets included in the model. The response patterns are simulated by intro- ducing one standard deviation shocks to each of the markets in the system and tracing out the normalized responses of the countries in the system over different time horizons. The normalized impulse response is the ratio of moving average coefficients in Eq. (3) and the respective standard errors. Table 7 reports these responses.
The figures in Table 7 demonstrate that shocks originating from the other markets in the system do not influence the behavior of the CSE significantly. The CSE response to one standard deviation shocks from any other market in the system is almost negligible. As an example, the maximum CSE response to a shock of one
Marke
t
TAW
SNG
JAP
SKR
SRI
HNG
IND
US
Horiz
on
days
5 10
20 5 10
20 5 10
20 5 10
20 5 10
20 5 IO
20 5 10
20 5 10
20
Stan
dard
err
or US
0.02
4 0.
025
0.02
6 0.
010
0.01
I 0.0
1 I
0.01
3 0.
013
0.01
4 0.
015
0.01
5 0.
015
0.01
0 0.0
1 I
0.01
I 0.
016
0.01
6 0.
017
0.01
8 0.
018
0.01
9 0.
084
0.00
8 0.
009
1.37
6 1.
595
I .89
9 5.
589
5.50
9 5.
568
3.37
3 3.
513
3.85
2 0.
889
1.02
1 1.
935
0.22
0 0.
705
1.15
7 3.
386
3.46
9 3.
549
0.23
7 1.
090
2.44
9 92
.673
88
.453
85
.668
TAW
94.9
35
92.9
80
89.7
03
2.19
0 2.
432
2.52
8 2.
400
2.51
I 2.
768
1.08
3 1.
224
1.60
2 0.
266
0.77
0 1.
833
2.26
9 2.
957
3.22
2 0.
277
0.61
3 0.
892
0.48
6 I.7
11
2.01
7
SNG 1.62
7 2.
221
2.73
2 88
.603
85
.807
82
.914
7.
890
8.65
8 8.
918
2.78
6 2.
977
3.36
3 0.
409
0.60
9 0.
890
16.8
68
16.6
17
16.5
75
0.17
8 0.
548
0.83
6 3.
769
4.51
8 4,
413
JAP 0.42
0 0.
479
0.95
8 0.
363
0.72
2 1.
320
84.3
82
8 1.
407
78.8
84
0.78
8 1.
304
1.83
5 0.
495
0.82
2 1.
202
0.40
3 0.
627
0.75
9 0.
555
0.77
5 1.
494
1.22
2 1.
588
2.30
3
0.47
5 0.
564
0.93
3 1.
485
1.81
6 2.
022
0.81
0 1.
052
1.41
0 93
.446
91
.484
SKR
88.1
00
1.26
5 1.
474
1.83
8 0.
508
0.62
2 1.
030
0.12
3 0.
392
0.66
6 0.
332
0.73
1 0.
875
0.86
4 1.
006
1.33
7 1.
025
1.56
6 2.
219
0.33
2 0.
592
1.30
5 0.
518
0.93
1
SRI I .22
3 97
.089
94
.169
90
.258
0.6
3 1
1.03
8 1.
308
I.007
1.
113
1.52
1 0.
276
0.35
0 0.
767
0.10
5 0.
279
0.43
7 0.
553
1.34
0 2.
322
0.47
0 0.
557
0.76
5 0.
263
0.34
9 0.
529
HNG 0.17
0 1.
202
1.58
2 75
.658
73
.938
72
.448
0.
243
0.53
4 0.
811
0.56
1 1.
408
1.90
0
0.19
7 0.
876
1.50
0 0.
197
0.80
8 1.
207
0.34
1 1.
710
2.09
4 0.
227
0.70
9 1.
412
0.08
6
IND 0.
249
1.24
0 0.
277
0.73
1 1.
109
97.3
81
94.3
36
91.3
31
0.68
I 1.
242
2.05
8
Table
6
Deco
mpos
ition
of the
for
ecas
t err
or va
rianc
e (se
e Ta
ble
2 for
no
tation
) h
INT
$ 2. 5.
065
:. 7.
020
2 10
.297
R
11.3
97
.< 14
.193
3
17.0
86
5 15
.618
e
18.5
93
2 21
.116
2.
6.55
4 :
8.51
6 %
’ 11
.900
;
2.91
1 s
5.83
1 $.
9.74
2 5
24.3
42
$ 26
.062
s
27.5
52
?j 2.
619
3 5.
664
z 8.
669
2 7.
327
2 11
.547
2
14.3
32
p
Note:
IN
T is
the
effec
t on
a
partic
ular
marke
t of
all
other
ma
rkets
in the
sy
stem
(the
perce
ntage
of
the
forec
ast
error
varia
nce
of a
partic
ular
marke
t [st
anda
rd
b err
or]
expla
ined
by
all
marke
ts oth
er
than
its
own
past)
.
E. Elyasiani et al. /Journal of’Multinationa1 Financial Management 8 C 1998) 89-101 99
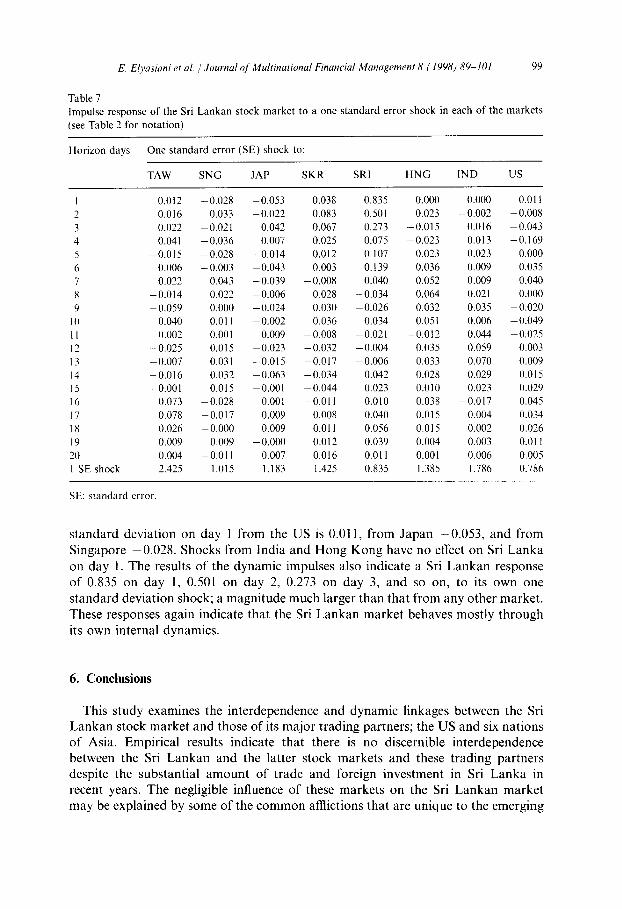
Table I Impulse response of the Sri Lankan stock market to a one standard error shock in each of the markets (see Table 2 for notation)
Horizon days One standard error (SE) shock to:
TAW SNG JAP SKR SRI HNG IND us
1
3 4 5 6 7 8 9
IO II 12 13 14 15 16 17 18 19 20 I SE shock
0.012 -0.028 -0.053 0.038 0.835 0.000 0.000 0.01 I
0.016 -0.033 -0.022 0.083 0.501 0.023 - 0.002 -0.008 0.022 -0.021 0.042 0.067 0.273 -0.015 0.016 -0.043 0.041 - 0.036 0.007 0.025 0.075 - 0.023 0.013 -0.169
-0.015 - 0.028 -0.014 0.012 0.107 0.023 0.023 0.000 0.006 -0.003 -0.043 0.003 0.139 0.036 0.009 0.035 0.022 0.043 -0.039 -0.008 0.040 0.052 0.009 0.040
-0.014 0.022 -0.006 0.028 -0.034 0.064 0.021 0.000 - 0.059 0.000 -0.024 0.030 -0.026 0.032 0.035 -0.020 ~ 0.040 0.01 I -0.002 0.036 0.034 0.051 0.006 - 0.049
0.002 0.001 0.009 -0.008 -0.021 -0.012 0.044 -0.025 - 0.025 0.015 - 0.023 - 0.032 - 0.004 0.035 0.059 0.003 - 0.007 0.031 -0.015 -0.017 - 0.006 0.033 0.070 0.009 -0.016 0.032 ~ 0.063 -0.034 0.042 0.028 0.029 0.015 -0.001 0.015 -0.001 -0.044 0.023 0.010 0.023 0.029
0.073 -0.028 -0.001 -0.011 0.010 0.038 -0.017 0.045 0.078 -0.017 0.009 0.008 0.040 0.015 0.004 0.034 0.026 - 0.000 0.009 0.011 0.056 0.015 0.002 0.026 0.009 0.009 -0.000 0.012 0.039 0.004 0.003 0.01 I 0.004 -0.01 I 0.007 0.016 0.011 -0.001 0.006 0.005 2.425 1.015 1.183 1.425 0.835 1.385 1.786 0.786
SE: standard error.
standard deviation on day 1 from the US is 0.011, from Japan -0.053, and from Singapore -0.028. Shocks from India and Hong Kong have no effect on Sri Lanka on day 1. The results of the dynamic impulses also indicate a Sri Lankan response of 0.835 on day 1, 0.501 on day 2, 0.273 on day 3, and so on, to its own one standard deviation shock; a magnitude much larger than that from any other market. These responses again indicate that the Sri Lankan market behaves mostly through its own internal dynamics.
6. Conclusions
This study examines the interdependence and dynamic linkages between the Sri Lankan stock market and those of its major trading partners; the US and six nations of Asia. Empirical results indicate that there is no discernible interdependence between the Sri Lankan and the latter stock markets and these trading partners despite the substantial amount of trade and foreign investment in Sri Lanka in recent years. The negligible influence of these markets on the Sri Lankan market may be explained by some of the common afflictions that are unique to the emerging
100 E. Elyasiani et al. /Journal of Multinational Financial Management 8 (1998) 89-101
capital markets. Similar to other emerging markets, the CSE is relatively small in size, and hence it offers a modest degree of attraction to major investors outside the country. Although frequently over 50% of daily turnover of the stocks in the CSE is due to foreign investors, the proportion of CSE stocks in a foreign fund manager or foreign individual investors’ portfolio is relatively small. Hence, they may find it costly to allocate significant efforts to watch the Sri Lankan market in order to trade in response to market fluctuations. In addition, the Sri Lankan market suffers from lack of market liquidity and from a high concentration of market capitalization in blue chip stocks. i” Most local investors hold on to their stocks, especially blue chips, for long periods of time without trading because of the perception that they will not be able to buy again later if they so desire. This is a phenomenon typical of the Sri Lankan market leading to lack of liquidity. With these idiosyncrasies present in the market, a foreign fund manager, even if willing, will be unable to quickly move funds into and out of the Sri Lankan market when profitable opportu- nities are observed.
Overall, the results on the dynamic responses to external shocks demonstrate that the Sri Lankan market is very much immune to shocks originating from the US and six Asian countries considered here with whom it has a trading partnership. It appears that the emerging capital market of Sri Lanka is scantly integrated with those of the larger and stronger economies of the region and the US. This is in contrast to the significant interdependence prevailing among the developed markets of the US, Europe, and Asia-Pacific region as reported by Eun and Shim (1989). Being largely independent and having liberalized the controls over its markets, Sri Lanka can, therefore, provide profit opportunities and diversification benefits to the global investors in the countries investigated in this study, especially if the size of the market is allowed to grow and the liquidity problem is eased.
References
Arshanapalli, B., Doukas, J.. 1987. International stock market linkages: Evidence from the pre- and post- October 1987 period. J. Banking and Finance 17, 1933208.
Bertoneche, M.L., 1979. Spectral analysis of stock market prices. J. Banking and Finance 3, 201-208. Chan, K.C., Lai, P., 1993. Unit root and cointegration tests of world stock prices. In: Stansell, S.R. (Ed.).
International Financial Market Integration. Blackwell, MA. pp. 2699287. Chan, K.C., Cup, B.E., Pan, MS., 1992. An empirical analysis of stock price in major Asian markets
and the US. The Financial Review 27, 289-307. Dickey, D.A., Fuller, W.A., 1981. Likelihood ratio statistics for an autoregressive time series with a unit
root. Econometrica 49, 105771072. Dwyer, G.P., Hafer, R.W., 1993. Are national stock markets linked? In: Stansell, S.R. (Ed.), International
Financial Market Integration. Blackwell, MA, pp. 2355258. Eun, C.S., Shim, S., 1989. International transmission of stock market movements. .I. Financial and
Quantitative Analysis 24, 241-256.
“The minimum SEC requirement to go public is for companies to issue 34% of their outstanding stocks. Because of dilution of ownership, most companies refrain from further issuance of stocks.

E. Elyasiani et al. /Journal of Multinational Financial Management 8 (1998) 89-101 101
Friedman, J., Shachmurove, Y., 1996. International transmission of innovations among EC stock markets. Research in International Business and Finance, 35-64.
Hakkio, C.S., Morris, C.S., 1984. Vector autoregressions: A user’s guide. Research Working Paper RWP 84-10, Research Division, Federal Reserve Bank of Kansas City, November 1984.
Hamilton, J.D., 1994. Time Series Analysis. Princeton University Press, Princeton, NJ. Hilliard, J., 1979. The relationship between equity indices on world exchanges. J. Finance 34, 103-l 14. Koch, P.D., Koch, T., 1991. Evolution in dynamic linkages across daily national stock indexes.
J. International Money and Finance 10 (2), 23 l-251. Schollhammer, H., Sand, O.C., 1987. Leaddlag relationships among national equity markets: An empirical
investigation. In: Khowy. S., Ghosh, A. (Eds.), Recent Developments in Banking and Finance, vol. 1. Lexington Books, Lexington, KY
Shachmurove, Y.. 1995. Dynamic linkages among Latin American and other major world stock markets. Presented at North American Economic and Finance Association Annual Meeting, Washington, DC, January.
Sims, C., 1980. Macroeconomics and reality. Econometrica 48, l-48.