ATLAS RESOURCE PARTNERS, L.P.
238
UNITED STATES SECURITIES AND EXCHANGE COMMISSION Washington, D.C. 20549 FORM 10-K (Mark One) ANNUAL REPORT PURSUANT TO SECTION 13 OR 15(d) OF THE SECURITIES EXCHANGE ACT OF 1934 For the fiscal year ended December 31, 2015 OR TRANSITION REPORT PURSUANT TO SECTION 13 OR 15(d) OF THE SECURITIES EXCHANGE ACT OF 1934 For the transition period from to Commission file number: 001-35317 ATLAS RESOURCE PARTNERS, L.P. (Exact name of registrant as specified in its charter) Delaware 45-3591625 (State or other jurisdiction or incorporation or organization) (I.R.S. Employer Identification No.) Park Place Corporate Center One 1000 Commerce Drive, Suite 400 Pittsburgh, PA 15275 (Address of principal executive offices) Zip code Registrant’s telephone number, including area code: 800-251-0171 Securities registered pursuant to Section 12(b) of the Act: Title of each class Name of each exchange on which registered Common Units representing Limited Partnership Interests 8.625% Class D Cumulative Redeemable Perpetual Preferred Units 10.75% Class E Cumulative Redeemable Perpetual Preferred Units New York Stock Exchange New York Stock Exchange New York Stock Exchange Securities registered pursuant to Section 12(g) of the Act: None Indicate by check mark if the registrant is a well-known seasoned issuer, as defined in Rule 405 of the Securities Act. Yes No Indicate by check mark if the registrant is not required to file reports pursuant to Section 13 or Section 15(d) of the Act. Yes No Indicate by check mark whether the registrant (1) has filed all reports required to be filed by Section 13 or 15(d) of the Securities Exchange Act of 1934 during the preceding 12 months (or for such shorter period that the registrant was required to file such reports), and (2) has been subject to such filing requirements for the past 90 days. Yes No Indicate by check mark whether the registrant has submitted electronically and posted on its corporate Web site, if any, every Interactive Data File required to be submitted and posted pursuant to Rule 405 of Regulation S-T during the preceding 12 months (or for such shorter period that the registrant was required to submit and post such files). Yes No Indicate by check mark if disclosure of delinquent filers pursuant to Item 405 of Regulation S-K is not contained herein, and will not be contained, to the best of registrant’s knowledge, in definitive proxy or information statement s incorporated by reference in Part III of this Form 10-K or any amendment to this Form 10-K. Indicate by check mark whether the registrant is a large accelerated filer, an accelerated filer, a non-accelerated filer or a smaller reporting company. See definitions of “large accelerated filer”, “accelerated filer” and “small reporting company” in Rule 12b -2 of the Exchange Act. (Check one): Large accelerated filer Accelerated filer Non-accelerated filer Smaller reporting company Indicate by check mark whether the registrant is a shell company (as defined in Rule 12b-2 of the Exchange Act). Yes No The aggregate market value of the voting and non-voting equity securities held by non-affiliates of the registrant, based on the closing price of the registrant’s common units on the last business day of the registrant’s most recently completed second quarter, June 30, 2015, was approximately $457.9 million. The number of outstanding common limited partner units of the registrant on February 29, 2016 was 102,421,097. DOCUMENTS INCORPORATED BY REFERENCE: None
-
Upload
khangminh22 -
Category
Documents
-
view
0 -
download
0
Transcript of ATLAS RESOURCE PARTNERS, L.P.
UNITED STATES
SECURITIES AND EXCHANGE COMMISSION Washington, D.C. 20549
FORM 10-K
(Mark One)
ANNUAL REPORT PURSUANT TO SECTION 13 OR 15(d) OF THE SECURITIES EXCHANGE ACT OF 1934
For the fiscal year ended December 31, 2015
OR
TRANSITION REPORT PURSUANT TO SECTION 13 OR 15(d) OF THE SECURITIES EXCHANGE ACT OF 1934
For the transition period from to
Commission file number: 001-35317
ATLAS RESOURCE PARTNERS, L.P. (Exact name of registrant as specified in its charter)
Delaware 45-3591625 (State or other jurisdiction or
incorporation or organization)
(I.R.S. Employer
Identification No.)
Park Place Corporate Center One
1000 Commerce Drive, Suite 400
Pittsburgh, PA 15275 (Address of principal executive offices) Zip code
Registrant’s telephone number, including area code: 800-251-0171
Securities registered pursuant to Section 12(b) of the Act:
Title of each class Name of each exchange on which registered
Common Units representing Limited Partnership Interests
8.625% Class D Cumulative Redeemable Perpetual Preferred Units
10.75% Class E Cumulative Redeemable Perpetual Preferred Units
New York Stock Exchange
New York Stock Exchange
New York Stock Exchange
Securities registered pursuant to Section 12(g) of the Act:
None
Indicate by check mark if the registrant is a well-known seasoned issuer, as defined in Rule 405 of the Securities Act. Yes No
Indicate by check mark if the registrant is not required to file reports pursuant to Section 13 or Section 15(d) of the Act. Yes No
Indicate by check mark whether the registrant (1) has filed all reports required to be filed by Section 13 or 15(d) of the Securities Exchange Act
of 1934 during the preceding 12 months (or for such shorter period that the registrant was required to file such reports), and (2) has been subject to
such filing requirements for the past 90 days. Yes No
Indicate by check mark whether the registrant has submitted electronically and posted on its corporate Web site, if any, every Interactive Data File
required to be submitted and posted pursuant to Rule 405 of Regulation S-T during the preceding 12 months (or for such shorter period that the
registrant was required to submit and post such files). Yes No
Indicate by check mark if disclosure of delinquent filers pursuant to Item 405 of Regulation S-K is not contained herein, and will not be contained, to
the best of registrant’s knowledge, in definitive proxy or information statements incorporated by reference in Part III of this Form 10-K or any
amendment to this Form 10-K.
Indicate by check mark whether the registrant is a large accelerated filer, an accelerated filer, a non-accelerated filer or a smaller reporting company.
See definitions of “large accelerated filer”, “accelerated filer” and “small reporting company” in Rule 12b-2 of the Exchange Act. (Check one):
Large accelerated filer Accelerated filer Non-accelerated filer Smaller reporting company
Indicate by check mark whether the registrant is a shell company (as defined in Rule 12b-2 of the Exchange Act). Yes No
The aggregate market value of the voting and non-voting equity securities held by non-affiliates of the registrant, based on the closing price of the
registrant’s common units on the last business day of the registrant’s most recently completed second quarter, June 30, 2015, was approximately
$457.9 million.
The number of outstanding common limited partner units of the registrant on February 29, 2016 was 102,421,097.
DOCUMENTS INCORPORATED BY REFERENCE: None

2
ATLAS RESOURCE PARTNERS, L.P.
INDEX TO ANNUAL REPORT
ON FORM 10-K
TABLE OF CONTENTS
Page
PART I Item 1: Business ............................................................................................................................................................... 8
Item 1A: Risk Factors ......................................................................................................................................................... 28
Item 1B: Unresolved Staff Comments ................................................................................................................................ 59
Item 2: Properties ............................................................................................................................................................. 59
Item 3: Legal Proceedings ................................................................................................................................................ 63
Item 4: Mine Safety Disclosures ...................................................................................................................................... 64
PART II Item 5: Market for Registrant’s Common Equity, Related Unitholder Matters and Issuer Purchases of
Equity Securities .............................................................................................................................................
65
Item 6: Selected Financial Data ........................................................................................................................................ 65
Item 7: Management’s Discussion and Analysis of Financial Condition and Results of Operations ............................... 69
Item 7A: Quantitative and Qualitative Disclosures about Market Risk ............................................................................... 98
Item 8: Financial Statements and Supplementary Data .................................................................................................... 101
Item 9: Changes in and Disagreements with Accountants on Accounting and Financial Disclosure ............................... 149
Item 9A: Controls and Procedures ...................................................................................................................................... 149
Item 9B: Other Information ................................................................................................................................................ 151
PART III Item 10: Directors, Executive Officers and Corporate Governance ................................................................................... 152
Item 11: Executive Compensation ...................................................................................................................................... 160
Item 12: Security Ownership of Certain Beneficial Owners and Management and Related Unitholder Matters ............... 178
Item 13: Certain Relationships and Related Transactions, and Director Independence ................................................... 181
Item 14: Principal Accountant Fees and Services............................................................................................................... 184
PART IV Item 15: Exhibits and Financial Statement Schedules ........................................................................................................ 185
SIGNATURES 191

3
GLOSSARY OF TERMS
Unless the context otherwise requires, references below to “Atlas Resource Partners, L.P.,” “Atlas Resource Partners,”
“the Partnership,” “we,” “us,” “our” and “our company”, when used in a historical context, refer to the subsidiaries and operations
that Atlas Energy, L.P. contributed to Atlas Resource Partners in connection with the separation and distribution completed in March
2012, and, when used in the present tense or prospectively, refer to Atlas Resource Partners, L.P. and its combined subsidiaries.
References below to “Atlas Energy” or “Atlas Energy, L.P.” refers to Atlas Energy, L.P. and its consolidated subsidiaries prior to the
February 2015 merger of Atlas Energy discussed herein, unless the context otherwise requires.
Bbl. One barrel of crude oil, condensate or other liquid hydrocarbons equal to 42 United States gallons.
Bcf. One billion cubic feet of natural gas.
Bcfe. One billion cubic feet equivalent, determined using a ratio of six Mcf of gas to one Bbl oil, condensate or natural gas liquids.
Bpd. Barrels per day.
Btu. One British thermal unit, which is the heat required to raise the temperature of a one-pound mass of water from 58.5 to 59.5
degrees Fahrenheit.
Condensate. Condensate is a mixture of hydrocarbons that exists in the gaseous phase at original reservoir temperature and pressure,
but that, when produced, is in the liquid phase at surface pressure and temperature.
Developed Acreage. The number of acres which are allocated or assignable to producing wells or wells capable of production.
Development Well. A well drilled within the proved area of an oil or gas reservoir to the depth of a stratigraphic horizon known to be
productive.
Dth. One dekatherm, equivalent to one million British thermal units.
Dth/d. Dekatherms per day.
Dry hole or well. A well found to be incapable of producing either oil or gas in sufficient quantities to justify completion as an oil or
gas well.
EBITDA. Net income (loss) before net interest expense, income taxes, and depreciation and amortization. EBITDA is considered to be
a non-GAAP measurement.
Exploratory Well. An exploratory well is a well drilled to find a new field or to find a new reservoir in a field previously found to be
productive of oil or gas in another reservoir. Generally, an exploratory well is any well that is not a development well or a
stratigraphic test well.
FASB. Financial Accounting Standards Board.
Field. An area consisting of a single reservoir or multiple reservoirs all grouped on or related to the same individual geological
structural feature and/or stratigraphic condition. There may be two or more reservoirs in a field that are separated vertically by
intervening impervious, strata, or laterally by local geologic barriers, or by both. Reservoirs that are associated by being in
overlapping or adjacent fields may be treated as a single or common operational field. The geological terms structural feature and
stratigraphic condition are intended to identify localized geological features as opposed to the broader terms of basins, trends,
provinces, plays, areas-of-interest, etc.
Fractionation. The process used to separate a natural gas liquid stream into its individual components.
GAAP. Generally Accepted Accounting Principles in the United States of America.
Gross acres or gross wells. The total acres or wells, as the case may be, in which a working interest is owned.
MBbl. One thousand barrels of crude oil, condensate or other liquid hydrocarbons.

4
Mcf. One thousand cubic feet of natural gas; the standard unit for measuring volumes of natural gas.
Mcfe. Mcf of natural gas equivalent, determined using the ratio of six Mcf of natural gas to one Bbl of crude oil, condensate or natural
gas liquids.
Mcfd. One thousand cubic feet per day.
Mcfed. One Mcfe per day.
MMBbl. One million barrels of crude oil, condensate or other liquid hydrocarbons.
MMBtu. One million British thermal units.
MMcf. One million cubic feet of natural gas.
MMcfe. MMcf of natural gas equivalent, determined using the ratio of six Mcf of natural gas to one Bbl of crude oil, condensate or
natural gas liquids.
MMcfed. One MMcfe per day.
Net acres or net wells. The sum of the fractional working interests owned in gross acres or gross wells, as the case may be.
Natural Gas Liquids or NGLs —A mixture of light hydrocarbons that exist in the gaseous phase at reservoir conditions but are
recovered as liquids in gas processing plants. NGL differs from condensate in two principal respects: (1) NGL is extracted and
recovered in gas plants rather than lease separators or other lease facilities; and (2) NGL includes very light hydrocarbons (ethane,
propane, butanes) as well as the pentanes-plus (the main constituent of condensates).
NYMEX. The New York Mercantile Exchange.
NYSE. The New York Stock Exchange.
Oil. Crude oil and condensate.
Productive well. A producing well or well that is found to be capable of producing either oil or gas in sufficient quantities to justify
completion as an oil and gas well.
Proved developed reserves. Reserves of any category that can be expected to be recovered through existing wells with existing
equipment and operating methods or in which the cost of the required equipment is relatively minor compared to the cost of a new
well; and through installed extraction equipment and infrastructure operational at the time of the reserves estimate if the extraction is
by means not involving a well.
Proved Reserves. Proved oil and gas reserves are those quantities of oil and gas, which, by analysis of geoscience and engineering
data, can be estimated with reasonable certainty to be economically producible—from a given date forward, from known reservoirs,
and under existing economic conditions, operating methods, and government regulations—prior to the time at which contracts
providing the right to operate expire, unless evidence indicates that renewal is reasonably certain, regardless of whether deterministic
or probabilistic methods are used for the estimation. The project to extract the hydrocarbons must have commenced or the operator
must be reasonably certain that it will commence the project within a reasonable time.
(i) The area of the reservoir considered as proved includes:
(a) The area identified by drilling and limited by fluid contacts, if any, and
(b) Adjacent undrilled portions of the reservoir that can, with reasonable certainty, be judged to be continuous with it and to contain
economically producible oil or gas on the basis of available geoscience and engineering data.
(ii) In the absence of data on fluid contacts, proved quantities in a reservoir are limited by the lowest known hydrocarbons (LKH) as
seen in a well penetration unless geoscience, engineering, or performance data and reliable technology establishes a lower
contact with reasonable certainty.
5
(iii) Where direct observation from well penetrations has defined a highest known oil (HKO) elevation and the potential exists for an
associated gas cap, proved oil reserves may be assigned in the structurally higher portions of the reservoir only if geoscience,
engineering, or performance data and reliable technology establish the higher contact with reasonable certainty.
(iv) Reserves which can be produced economically through application of improved recovery techniques (including, but not limited
to, fluid injection) are included in the proved classification when:
(a) Successful testing by a pilot project in an area of the reservoir with properties no more favorable than in the reservoir as a
whole, the operation of an installed program in the reservoir or an analogous reservoir, or other evidence using reliable
technology establishes the reasonable certainty of the engineering analysis on which the project or program was based; and
(b) The project has been approved for development by all necessary parties and entities, including governmental entities.
(v) Existing economic conditions include prices and costs at which economic producibility from a reservoir is to be determined. The
price shall be the average price during the 12-month period prior to the ending date of the period covered by the report,
determined as an unweighted arithmetic average of the first-day-of-the-month price for each month within such period, unless
prices are defined by contractual arrangements, excluding escalations based upon future conditions.
Proved undeveloped drilling location. A site on which a development well can be drilled consistent with spacing rules for purposes of
recovering proved undeveloped reserves.
Proved Undeveloped Reserves or PUDs. Reserves that are expected to be recovered from new wells on undrilled acreage, or from
existing wells where a relatively major expenditure is required for recompletion. Reserves on undrilled acreage shall be limited to
those directly offsetting development spacing areas that are reasonably certain of production when drilled, unless evidence using
reliable technology exists that establishes reasonable certainty of economic producibility at greater distances. Undrilled locations can
be classified as having proved undeveloped reserves only if a development plan has been adopted indicating that they are scheduled to
be drilled within five years, unless the specific circumstances justify a longer time. Under no circumstances should estimates for
proved undeveloped reserves be attributable to any acreage for which an application of fluid injection or other improved recovery
technique is contemplated, unless such techniques have proved effective by actual projects in the same reservoir or an analogous
reservoir, or by other evidence using reliable technology establishing reasonable certainty.
PV-10. Present value of future net revenues. See the definition of “standardized measure.”
Recompletion. The completion for production of an existing well bore in another formation from that in which the well has been
previously completed.
Reserves. Reserves are estimated remaining quantities of oil and natural gas and related substances anticipated to be economically
producible, as of a given date, by application of development projects to known accumulations. In addition, there must exist, or there
must be a reasonable expectation that there will exist, the legal right to produce or a revenue interest in the production, installed means
of delivering oil and natural gas or related substances to the market and all permits and financing required to implement the project.
Reserves should not be assigned to adjacent reservoirs isolated by major, potentially sealing, faults until those reservoirs are
penetrated and evaluated as economically producible. Reserves should not be assigned to areas that are clearly separated from a
known accumulation by a non-productive reservoir (i.e., absence of reservoir, structurally low reservoir or negative test results). Such
areas may contain prospective resources (i.e., potentially recoverable resources from undiscovered accumulations).
Reservoir. A porous and permeable underground formation containing a natural accumulation of producible oil and/or gas that is
confined by impermeable rock or water barriers and is individual and separate from other reservoirs.
SEC. Securities Exchange Commission.
Standardized Measure. Standardized measure, or standardized measure of discounted future net cash flows relating to proved oil and
gas reserve quantities, is the present value of estimated future net revenues to be generated from the production of proved reserves,
determined in accordance with the rules and regulations of the Securities and Exchange Commission (using prices and costs in effect
as of the date of estimation) without giving effect to non-property related expenses such as general and administrative expenses, debt
service or to depreciation, depletion and amortization and discounted using an annual discount rate of 10%. Standardized measure
differs from PV-10 because standardized measure includes the effect of future income taxes.
Successful well. A well capable of producing oil and/or gas in commercial quantities.
Undeveloped acreage. Lease acreage on which wells have not been drilled or completed to a point that would permit the production of
commercial quantities of oil and gas regardless of whether such acreage contains proved reserves.
6
Unproved Reserves. Unproved Reserves are based on geoscience and/or engineering data similar to that used in estimates of Proved
Reserves, but technical or other uncertainties preclude such reserves being classified as Proved. Unproved Reserves may be further
categorized as Probable Reserves and Possible Reserves.
Working Interest. An operating interest in an oil and natural gas lease that gives the owner of the interest the right to drill for and
produce oil and natural gas on the leased acreage and the responsibility to pay royalties and a share of the costs of drilling and
production operations under the applicable fiscal terms. The share of production to which a working interest owner is entitled will
always be smaller than the share of costs that the working interest owner is required to bear, with the balance of the production
accruing to the owners of royalties. For example, the owner of a 100.00% working interest in a lease burdened only by a landowner’s
royalty of 12.50% would be required to pay 100.00% of the costs of a well but would be entitled to retain 87.50% of the production.
FORWARD-LOOKING STATEMENTS
The matters discussed within this report include forward-looking statements. These statements may be identified by the use of
forward-looking terminology such as “anticipate,” “believe,” “continue,” “could,” “estimate,” “expect,” “intend,” “may,”
“might,” “plan,” “potential,” “predict,” “should,” or “will,” or the negative thereof or other variations thereon or comparable
terminology. In particular, statements about our expectations, beliefs, plans, objectives, assumptions or future events or performance
contained in this report are forward-looking statements. We have based these forward-looking statements on our current expectations,
assumptions, estimates and projections. While we believe these expectations, assumptions, estimates and projections are reasonable,
such forward-looking statements are only predictions and involve known and unknown risks and uncertainties, many of which are
beyond our control. These and other important factors may cause our actual results, performance or achievements to differ materially
from any future results, performance or achievements expressed or implied by these forward-looking statements. Some of the key
factors that could cause actual results to differ from our expectations include:
the demand for natural gas, oil, NGLs and condensate;
the price volatility of natural gas, oil, NGLs and condensate;
changes in the differential between benchmark prices for oil and natural gas and wellhead prices that we receive;
changes in the market price of our units;
future financial and operating results;
our ability to meet our liquidity needs, including as a result of borrowing base redeterminations;
restrictive covenants in the debt documents governing our indebtedness that may adversely affect operational flexibility;
actions that we may take in connection with our liquidity needs, including the ability to service our debt, and ability to
satisfy covenants in our debt documents;
economic conditions and instability in the financial markets;
effects of debt payment obligations on our distributable cash;
resource potential;
our ability to meet or exceed the continued listing standards of the New York Stock Exchange;
effects of partial depletion or drainage by earlier offset drilling on our acreage;
success in efficiently developing and exploiting our reserves and economically finding or acquiring additional
recoverable reserves;
the accuracy of estimated natural gas and oil reserves;
the financial and accounting impact of hedging transactions;
the ability to fulfill our substantial capital investment needs;
expectations with regard to acquisition activity, or difficulties encountered in connection with acquisitions, dispositions or
similar transactions;
the limited payment of distributions, or failure to declare a distribution, on outstanding common units or other equity
securities;
7
any issuance of additional common units or other equity securities, and any resulting dilution or decline in the market
price of any such securities;
potential changes in tax laws which may impair the ability to obtain capital funds through investment partnerships;
the ability to obtain adequate water to conduct drilling and production operations, and to dispose of the water used in and
generated by these operations at a reasonable cost and within applicable environmental rules;
the effects of unexpected operational events and drilling conditions, and other risks associated with drilling operations;
impact fees and severance taxes;
changes and potential changes in the regulatory and enforcement environment in the areas in which we conduct business;
the effects of intense competition in the natural gas and oil industry;
general market, labor and economic conditions and uncertainties;
the ability to retain certain key customers;
dependence on the gathering and transportation facilities of third parties;
the availability of drilling rigs, equipment and crews;
potential incurrence of significant costs and liabilities in the future resulting from a failure to comply with new or existing
environmental regulations or an accidental release of hazardous substances into the environment;
access to sufficient amounts of carbon dioxide for tertiary recovery operations;
uncertainties with respect to the success of drilling wells at identified drilling locations;
acquisitions may potentially prove to be worth less than we paid, or provide less than anticipated proved reserves;
ability to identify all risks associated with the acquisition of oil and natural gas properties, or existing wells, and the
sufficiency of indemnifications we receive from sellers to protect us from such risks;
expirations of undeveloped leasehold acreage;
uncertainty regarding leasing operating expenses, general and administrative expenses and funding and development
costs;
exposure to financial and other liabilities of the managing general partners of the investment partnerships;
the ability to comply with, and the potential costs of compliance with, new and existing federal, state, local and other laws
and regulations applicable to our business and operations;
restrictions on hydraulic fracturing;
exposure to new and existing litigation;
development of alternative energy resources; and
the effects of a cyber event or terrorist attack.
Other factors that could cause actual results to differ from those implied by the forward-looking statements in this report are
more fully described under “Item 1A: Risk Factors” in this report. Given these risks and uncertainties, you are cautioned not to place
undue reliance on these forward-looking statements. The forward-looking statements included in this report are made only as of the
date hereof. We do not undertake and specifically decline any obligation to update any such statements or to publicly announce the
results of any revisions to any of these statements to reflect future events or developments.
8
PART I
ITEM 1: BUSINESS
Overview
We are a publicly-traded master-limited partnership (NYSE: ARP) and an independent developer and producer of natural gas,
crude oil and natural gas liquids (“NGL”), with operations in basins across the United States. We are a leading sponsor and manager
of tax-advantaged investment partnerships (“Drilling Partnerships”), in which we co-invest, to finance a portion of our natural gas,
crude oil and natural gas liquids production activities.
We believe we have established a strong track record of growing our reserves, production and cash flows through a balanced
mix of natural gas, oil and natural gas liquids exploitation and development, sponsorship of our Drilling Partnerships, and the
acquisition of oil and gas properties. Our primary business objective is to generate growing yet stable cash flows through the
development and acquisition of mature, long-lived natural gas, oil and natural gas liquids properties. As of December 31, 2015, our
estimated proved reserves were 921 Bcfe, including the reserves net to our equity interest in our Drilling Partnerships. Of our
estimated proved reserves, approximately 82% were proved developed and approximately 66% were natural gas. For the year ended
December 31, 2015, our average daily net production was approximately 266.4 MMcfe. Through December 31, 2015, we own
production positions in the following areas:
the Barnett Shale and Marble Falls play in the Fort Worth Basin in northern Texas where we have ownership interests in
approximately 736 proved developed wells and 10 proved undeveloped locations totaling 139 Bcfe of total proved
reserves with average daily production of 60.6 MMcfe for the year ended December 31, 2015;
the coal-bed methane producing natural gas assets in the Raton Basin in northern New Mexico, the Black Warrior Basin in
central Alabama, the Central Appalachian Basin in southern West Virginia and southwestern Virginia, and Arkoma where
we have ownership interests in approximately 3,646 proved developed wells and 18 proved undeveloped locations totaling
378 Bcfe of total proved reserves with average daily production of 129.5 MMcfe for the year ended December 31, 2015;
the Appalachia Basin, including the Marcellus Shale and the Utica Shale where we have ownership interests in
approximately 8,620 wells, including approximately 271 wells in the Marcellus Shale, and 90 Bcfe of total proved
reserves with average daily production of 34.1 MMcfe for the year ended December 31, 2015;
the Eagle Ford Shale in southern Texas where we have ownership interests in approximately 27 proved developed wells
and 72 proved undeveloped locations in the Eagle Ford Shale totaling 115 Bcfe of total proved reserves with average daily
production of 9.4 MMcfe for the year ended December 31, 2015;
the Rangely field in northwest Colorado where we have non-operated ownership interests in approximately 400 wells in
the Rangely field and 170 Bcfe of total proved reserves with average daily production of 15.8 MMcfe for the year ended
December 31, 2015;
the Mississippi Lime and Hunton plays in northwestern Oklahoma where we have ownership interests in approximately
108 proved developed wells and 18 Bcfe of total proved reserves with average daily production of 12.3 MMcfe for the
year ended December 31, 2015; and
other operating areas, including the Chattanooga Shale in northeastern Tennessee, the New Albany Shale in southwestern
Indiana and the Niobrara Shale in northeastern Colorado in which we have an aggregate 11 Bcfe of total proved reserves
with average daily production of 4.8 MMcfe for the year ended December 31, 2015.
We seek to create substantial value by executing our strategy of acquiring properties with stable, long-life production, relatively
predictable decline curves and lower risk development opportunities. Over the three years ended December 31, 2015, we have
acquired significant net proved reserves and production through the following transactions:
EP Energy Acquisition. On July 31, 2013, we completed the acquisition of certain assets from EP Energy E&P Company,
L.P (“EP Energy”) for approximately $709.6 million in net cash (the “EP Energy Acquisition”). The coal-bed methane
producing natural gas assets included approximately 3,000 producing wells generating net production of approximately
119 MMcfed on the date of acquisition from EP Energy on approximately 700,000 net acres in the Raton Basin in
northern New Mexico, the Black Warrior Basin in central Alabama and the County Line area of Wyoming.
GeoMet Acquisition—On May 12, 2014, we completed the acquisition of certain assets from GeoMet, Inc. for
approximately $97.9 million in cash, net of purchase price adjustments, with an effective date of January 1, 2014 (the
“GeoMet Acquisition”). The coal-bed methane producing natural gas assets include approximately 70 Bcfe of proved
reserves with over 400 active wells generating 22 MMcfed on the date of acquisition in the Central Appalachian Basin in
West Virginia and Virginia.
9
Rangely Acquisition—On June 30, 2014, we completed the acquisition of a 25% non-operated net working interest in oil
and NGL producing assets, representing approximately 47 Mmboe reserves for $408.9 million in cash with an effective
date of April 1, 2014 (the “Rangely Acquisition”). The assets are located in the Rangely field in northwest Colorado. The
acquired assets are expected to provide us with a stable, high margin cash flow stream with a low-decline profile (average
3-4% annual decline rate over the past 15 years). The asset position is a tertiary oil recovery project using CO2 flood
activity, and the production mix is 90% oil, with the remainder coming from NGLs. Chevron Corporation (NYSE: CVX;
“Chevron”) will continue as operator of the assets.
Eagle Ford Acquisition—On November 5, 2014, we and our affiliate, Atlas Growth Partners, L.P. (“AGP”), completed
the acquisition of interests in oil and natural gas assets in the Eagle Ford Shale in South Central Atascosa County, Texas,
including 4,000 operated gross acres and net reserves of 12 Mmboe as of July 1, 2014 (the “Eagle Ford Acquisition”). The
purchase price was $342.0 million, our initial share of the aggregate purchase price was $206.5 million and AGP’s share
was $135.5 million. The Eagle Ford Acquisition had an effective date of July 1, 2014. On July 8, 2015, AGP sold to us,
for a purchase price of $1.4 million, AGP’s interest in a portion of the acreage it acquired in the Eagle Ford Acquisition.
On September 21, 2015, we and AGP, in accordance with the terms of the Eagle Ford shared acquisition and operating
agreement, agreed that we would fund AGP’s remaining two deferred purchase price installments of $16.2 million and
$20.1 million to be paid on September 30, 2015 and December 31, 2015, respectively. In conjunction with this agreement,
AGP assigned us a portion of its non-operating Eagle Ford assets that had an allocated value (as such value was agreed
upon by the sellers and the buyers in connection with the Eagle Ford Acquisition) equal to both installments to be paid by
us. The transaction was approved by our and AGP’s respective conflicts committees. As a result, our final share of the
aggregate purchase price was $242.8 million and AGP’s share was $99.2 million.
Arkoma Acquisition—On June 5, 2015, we completed the acquisition of ATLS’s coal-bed methane producing natural gas
assets in the Arkoma Basin in eastern Oklahoma for approximately $31.5 million, net of purchase price adjustments (the
“Arkoma Acquisition”).
On February 27, 2015, our general partner, Atlas Energy Group, LLC (“Atlas Energy Group”; NYSE: ATLS) distributed 100%
of its common units to existing unitholders of its then parent, Atlas Energy, L.P. (“Atlas Energy”), which was a publicly traded
master-limited partnership (NYSE: ATLS) (Atlas Energy and Atlas Energy Group are collectively referred to as “ATLS”). Atlas
Energy Group manages our operations and activities through its ownership of our general partner interest. Concurrent with Atlas
Energy Group’s unit distribution, Atlas Energy and its midstream ownership interests merged into Targa Resources Corp. (“Targa”;
NYSE: TRGP) (the “Atlas Merger”) and ceased trading. At December 31, 2015, Atlas Energy Group owned 100% of our general
partner Class A units, all of the incentive distribution rights through which it manages and effectively controls us, and an approximate
23.3% limited partner interest (20,962,485 common and 3,749,986 preferred limited partner units) in us.
Our operations include three reportable operating segments: gas and oil production, well construction and completion and other
partnership management (see “Item 8: Financial Statements and Supplementary Data – Note 15”).
Competitive Strengths
We believe we are well-positioned to successfully execute our business strategy because of the following competitive strengths:
We have a high quality, long-lived reserve base. Our natural gas and oil properties are located principally in the Barnett and
Eagle Ford shales, the Marble Falls play, the Mississippi Lime, the Raton, Black Warrior and Appalachian basins and the Rangely
field, and are characterized by long-lived reserves, generally favorable pricing for our production and readily available transportation.
We have significant experience in making accretive acquisitions. Our management team has extensive experience in
consummating accretive acquisitions. We believe we will be able to generate acquisition opportunities of both producing and non-
producing properties through our management’s extensive industry relationships. We intend to use these relationships and experience
to find, evaluate and execute on acquisition opportunities.
We have significant engineering, geologic and management experience. Our technical team of geologists and engineers has
extensive industry experience. We believe that we have been one of the most active drillers in our core operating areas and, as a result,
that we have accumulated extensive geological and geographical knowledge about these areas. We have also added geologists and
engineers to our technical staff who have significant experience in other productive basins within the continental United States, which
enables us to evaluate and expand our core operating areas.

10
We are one of the leading sponsors of tax-advantaged Drilling Partnerships. We and our predecessor have sponsored limited
and general partnerships to raise funds from investors to finance our development drilling activities since 1968, and we believe that we
are one of the leading sponsors of such Drilling Partnerships in the country. We believe that our lengthy association with many of the
broker-dealers that act as placement agents for our Drilling Partnerships provide us with a competitive advantage over entities with
similar operations. We also believe that our sponsorship of Drilling Partnerships has allowed us to generate attractive returns on
drilling, operating and production activities.
Fee-based revenues from our Drilling Partnerships and our substantially hedged production provide protection from
commodity price volatility. Our Drilling Partnerships provide us with stable, fee-based revenues which diminish the influence of
commodity price fluctuations on our cash flows. Because our Drilling Partnerships reimburse us on a cost-plus basis for drilling
capital expenses, we are partially protected against increases in drilling costs. Our fees for managing our Drilling Partnerships
accounted for approximately 15% of our segment margin for the year ended December 31, 2015. Additionally, our natural gas, crude
oil and NGL production was hedged approximately 75% on an equivalent basis for the year ended December 31, 2015. As of
December 31, 2015, we had approximately 160.2 Bcf, 4.3 Mmbbl and 0.1 Mmbbl of hedge positions, respectively, on our natural gas,
crude oil and NGL production for 2016 through 2019.
Our partnership management business can improve the economic rates of return associated with our natural gas and oil
production activities. A well drilled, net to our equity interest, in our partnership management business will provide us with an
enhanced rate of return. For each well drilled in a partnership, we receive an upfront fee on the investors’ well construction and
completion costs and a fixed administration and oversight fee, which enhances our overall rate of return. We also receive monthly per
well fees from the partnership for the life of each individual well, which also increases our rate of return.
Business Strategy
The key elements of our business strategy are:
Continue to manage our capital structure. We continually monitor the capital markets, our capital structure and our leverage
ratios and may make changes to our capital structure from time to time, with the goal of maintaining financial flexibility, preserving or
improving liquidity and/or achieving cost efficiency.
Continue to manage our exposure to commodity price risk. To limit our exposure to changing commodity prices and enhance
and stabilize our cash flow, we use financial hedges for a portion of our natural gas and oil production. We principally use fixed price
swaps and collars as the mechanism for the financial hedging of our commodity prices.
Continue to maintain control of operations and costs. We believe it is important to be the operator of wells in which we or our
Drilling Partnerships have an interest because we believe it will allow us to achieve operating efficiencies and control costs. As
operator, we are better positioned to control the timing and plans for future enhancement and exploitation efforts, costs of enhancing,
drilling, completing and producing the well, and marketing negotiations for our natural gas, oil, and NGL production to maximize
both volumes and wellhead price. We were the operator of the vast majority of the properties in which we or our Drilling Partnerships
had a working interest at December 31, 2015.
Expand our natural gas and oil production. We generate a significant portion of our revenue and net cash flow from natural gas
and oil production. We believe our program of sponsoring Drilling Partnerships to exploit our acreage opportunities provides us with
enhanced economic returns. For the five year period ended December 31, 2015, we raised over $0.6 billion from outside investors
through our Drilling Partnerships. We intend to continue to develop our inventory of proved undeveloped locations through both
sponsorship of Drilling Partnerships and direct well drilling to add value through reserve and production growth.
Expand our fee-based revenue through our sponsorship of Drilling Partnerships. We generate substantial revenue and cash flow
from fees paid by the Drilling Partnerships to us for acting as the managing general partner. As we continue to sponsor Drilling
Partnerships, we expect that our fee revenues from our drilling and operating agreements with our Drilling Partnerships will increase
and will add stability to our revenue and cash flows.
Expand operations through strategic acquisitions. We continually evaluate opportunities to expand our operations through
acquisitions of developed and undeveloped properties or companies that can increase our cash available for distribution. We will
continue to seek strategic opportunities in our current areas of operation, as well as other regions of the United States.

11
Subsequent Events
Senior Note Repurchases. In January and February 2016, we executed transactions to repurchase portions of our senior
unsecured notes. Through the end of February 2016, we have repurchased approximately $20.3 million of our 7.75% Senior Notes
due 2021 and approximately $12.1 million of our 9.25% Senior Notes for approximately $5.5 million. As a result of these
transactions, we will recognize approximately $25.9 million as gain on early extinguishment of debt in the first quarter of 2016.
Cash Distributions. On January 28, 2016, we declared a monthly distribution of $0.0125 per common unit for the month of
December 31, 2015. The $2.0 million distribution, including $39,000 and $0.6 million to the general partner as holder of common
units and Class C preferred limited units, respectively, was paid on February 12, 2016 to unitholders of record at the close of business
on February 8, 2016.
On February 24, 2016, we declared a monthly distribution of $0.0125 per common unit for the month of January 31, 2016. The
$2.0 million distribution, including $39,000 and $0.6 million to the general partner as holder of common units and Class C preferred
limited units, respectively, will be paid on March 16, 2016 to unitholders of record at the close of business on March 9, 2016.
On January 15, 2016, we paid a quarterly distribution of $0.5390625 per Class D Preferred Unit, or $2.2 million, for the period
from October 15, 2015 through January 14, 2016 to Class D Preferred Unitholders of record as of January 4, 2016.
On January 15, 2016, we paid a quarterly distribution of $0.671875 per Class E Preferred Unit, or $0.2 million, for the period
from October 15, 2015 through January 14, 2016 to Class E Preferred Unitholders of record as of January 4, 2016.
NYSE Compliance. On January 12, 2016, we were notified by the NYSE that we were not in compliance with NYSE’s
continued listing criteria under Section 802.01C of the NYSE Listed Company Manual because the average closing price of the
common units had been less than $1.00 for 30 consecutive trading days. We are working to remedy this situation in a timely manner
as set forth in the applicable NYSE rules in order to maintain our listing on the NYSE.
Recent Developments
Credit Facility Amendment. On November 23, 2015, we entered into an Eighth Amendment to the Second Amended and
Restated Credit Agreement (the “Amendment”) with Wells Fargo Bank, National Association, as administrative agent, and the lenders
party thereto, which amendment amends the Second Amended and Restated Credit Agreement dated July 31, 2013 (as amended from
time to time, the “Credit Agreement”). Among other things, the Eighth Amendment:
reduced the borrowing base under the Credit Agreement from $750.0 million to $700.0 million;
increased the applicable margin on Eurodollar loans and ABR loans by 0.25% from previous levels;
permits the incurrence of third lien debt subject to the satisfaction of certain conditions, including pro forma financial
covenant compliance;
upon the issuance of any third lien debt, reduces the borrowing base by 25% of the stated amount of such third lien debt
(other than third lien debt that is used to refinance senior notes, second lien debt and other third lien debt);
suspends compliance with a maximum ratio of Total Funded Debt (as defined in the Credit Agreement) to EBITDA (as
defined in the Credit Agreement) until the four fiscal quarter period ending March 31, 2017 and revised the maximum
ratio of Total Funded Debt to EBITDA to be 5.75 to 1.00 for the four quarter periods ending March 31, 2017 and June 30,
2017, 5.50 to 1.00 for the four quarter periods ending September 30, 2017 and December 31, 2017, 5.25 to 1.00 for the
four quarter period ending March 31, 2018, and 5.00 to 1.00 for each four fiscal quarter period ending thereafter;
replaced the requirement to maintain compliance with a maximum ratio of Senior Secured Total Funded Debt to EBITDA
with a requirement to be in compliance with a maximum ratio of First Lien Debt (as defined in the Credit Agreement) to
EBITDA of 2.75 to1.00; and
reset the distribution to $0.15 per common unit and permits increases to the distribution per common unit if (a) the ratio of
Total Funded Debt (as of such date) to EBITDA for the most recent four fiscal quarters is equal to or less than 5.00 to1.00
and (b) the borrowing base utilization is less than or equal to 85%, on a pro forma basis after giving effect to the
distribution payments.
A Seventh Amendment to the Credit Agreement was entered into on July 24, 2015. Among other things, the Seventh
Amendment redefined EBITDA.

12
A Sixth Amendment to the Credit Agreement was entered into on February 23, 2015. Among other things, the Sixth
Amendment:
reduced the borrowing base under the Credit Agreement from $900.0 million to $750.0 million;
permitted the incurrence of second lien debt in an aggregate principal amount up to $300.0 million;
rescheduled the May 1, 2015 borrowing base redetermination for July 1, 2015;
if the borrowing base utilization (as defined in the Credit Agreement) is less than 90%, increases the applicable margin on
Eurodollar loans and ABR loans by 0.25% from previous levels;
following the next scheduled redetermination of the borrowing base, upon the issuance of senior notes or the incurrence of
second lien debt, reduces the borrowing base by 25% of the stated amount of such senior notes or additional second lien
debt; and
revised the maximum ratio of Total Funded Debt to EBITDA to be (i) 5.25 to 1.0 as of the last day of the quarters ending
on March 31, 2015, June 30, 2015, September 30, 2015, December 31, 2015 and March 31, 2016, (ii) 5.00 to 1.0 as of the
last day of the quarters ending on June 30, 2016, September 30, 2016 and December 31, 2016, (iii) 4.50 to 1.0 as of the
last day of the quarter ending on March 31, 2017 and (iv) 4.00 to 1.0 as of the last day of each quarter thereafter.
Funding of AGP’s Eagle Ford Deferred Purchase Price. In connection with the Eagle Ford Acquisition, we guaranteed the
timely payment of the deferred portion of the purchase price that was to be paid by AGP. Pursuant to the agreement between us and
AGP, we had the right to receive some or all of the assets acquired by AGP in the event of its failure to contribute its portion of any
deferred payments. In connection with the second installment payments, we and AGP amended the purchase and sale agreement to
alter the timing and amount of the quarterly installment payments beginning on March 31, 2015 and ending December 31, 2015 (see
“Overview – Eagle Ford Acquisition”). On September 21, 2015, we and AGP, in accordance with the terms of the Eagle Ford shared
acquisition and operating agreement, agreed that we would fund AGP’s remaining two deferred purchase price installments.
Arkoma Acquisition. On June 5, 2015, we completed the acquisition of ATLS’s coal-bed methane producing natural gas assets
in the Arkoma Basin in eastern Oklahoma for approximately $31.5 million, net of purchase price adjustments (the “Arkoma
Acquisition”). We funded the purchase price through the issuance of 6,500,000 common limited partner units. The Arkoma
Acquisition had an effective date of January 1, 2015, however, as the acquisition constituted a transaction between entities under
common control, we retrospectively adjusted our consolidated financial statements for dates prior to the date of acquisition to reflect
our results on a consolidated basis with the results of the Arkoma assets as of or at the beginning of the respective period.
Issuance of Common Units. In May 2015, in connection with the Arkoma Acquisition, we issued 6,500,000 of our common
limited partner units in a public offering at a price of $7.97 per unit, yielding net proceeds of approximately $49.5 million. We used a
portion of the net proceeds to fund the Arkoma Acquisition and to reduce borrowings outstanding under our revolving credit facility.
Issuance of Preferred Units. In April 2015, we issued 255,000 of our 10.75% Class E Cumulative Redeemable Perpetual
Preferred Units (“Class E Preferred Units”) at a public offering price of $25.00 per unit for net proceeds of approximately $6.0
million. We pay distributions on the Class E Preferred Units at a rate of 10.75% per annum of the stated liquidation preference of
$25.00.
Second Lien Term Loan Facility. On February 23, 2015, we entered into a Second Lien Credit Agreement (the “Second Lien
Credit Agreement”) with certain lenders and Wilmington Trust, National Association, as administrative agent. The Second Lien Credit
Agreement provides for a second lien term loan in an original principal amount of $250.0 million (the “Term Loan Facility”). The
Term Loan Facility matures on February 23, 2020.
Our obligations under the Term Loan Facility are secured on a second priority basis by security interests in all of our assets and
those of our restricted subsidiaries that guarantee our existing first lien revolving credit facility. In addition, the obligations under the
Term Loan Facility are guaranteed by our material restricted subsidiaries. Borrowings under the Term Loan Facility bear interest, at
our option, at either (i) LIBOR plus 9.0% or (ii) the highest of (a) the prime rate, (b) the federal funds rate plus 0.50%, (c) one-month
LIBOR plus 1.0% and (d) 2.0%, each plus 8.0% (an “ABR Loan”). Interest is generally payable at the last day of the applicable
interest period (or, with respect to interest periods of more than three-months’ duration, each day prior to the last day of such interest
period that occurs at intervals of three months’ duration after the first day of such interest period) for Eurodollar loans and quarterly
for ABR loans.
13
Geographic and Geologic Overview
Through December 31, 2015, the majority of our production positions were in the following areas:
Barnett Shale/Marble Falls. The Barnett Shale and Marble Falls play are located east of the Bend Arch and west of the Quachita
Thrust in the Fort Worth Basin of northern Texas. The Barnett Shale is Mississippian-age shale formation located at depths between
5,000 and 8,000 feet and ranges in thickness from 100 and 600 feet. The Marble Falls play is Pennsylvanian-age formation located
above the Barnett Shale and beneath the Atoka at depths of approximately 5,500 feet and ranges in thickness from 50 and 500 feet. As
of December 31, 2015, we had an interest in approximately 746 Barnett Shale and Marble Falls wells. As of December 31, 2015, we
had more than 88,077 net acres prospective for the Barnett Shale/Marble Falls play.
Appalachian Basin. The Appalachian Basin includes all or parts of: Alabama, Georgia, Kentucky, Maryland, New York, Ohio,
Pennsylvania, Tennessee, Virginia and West Virginia. It is the most mature natural gas, crude oil and NGL producing region in the
United States, having established the first oil production in 1860. Our development and production activities in the Appalachia Basin
principally include the Marcellus Shale, Utica-Point Pleasant Shale, Clinton Sand and other conventional formations primarily in
Pennsylvania and Ohio.
The Marcellus Shale is a black, organic rich shale formation located at depths between 4,000 and 8,500 feet and ranges in
thickness from 50 to 250 feet. As of December 31, 2015, we had an interest in approximately 271 Marcellus Shale wells, consisting of
228 vertical wells and 43 horizontal wells. As of December 31, 2015, we had an interest in eight horizontal Marcellus Shale wells in
Northeastern Pennsylvania, all of which were developed through Drilling Partnerships. Also as of December 31, 2015, approximately
1,456 prospective Marcellus Shale acres remained undeveloped in Lycoming County, Pennsylvania. Our drilling activity in certain
portions of the Appalachian Basin located in southwestern Pennsylvania, West Virginia and New York were limited until February 17,
2014 by the terms of the non-competition agreements between certain of ATLS’s officers and directors and Chevron Corporation.
The Utica-Point Pleasant Shale is an Ordovician-age shale which covers a large portion of Ohio, Pennsylvania, New York and
West Virginia and lies several thousand feet below the Devonian-age Marcellus. The Utica-Point Pleasant is an organic rich system
comprised of two related shales. The richest concentration of organic material is present within the Point Pleasant member of the
Lower Utica formation; therefore, the primary objective section of this shale play. From central Ohio, the Utica-Point Pleasant play
has gentle basin center dip towards its deepest point in central Pennsylvania. In general, as the present day depth increases from West
to East, so does the progression of hydrocarbon maturity-along the following, ordered hydrocarbon phase windows: Immature-Oil-
Condensate-Rich Gas-Dry Gas Windows. As of December 31, 2015, we had an interest in approximately 2,373 wells in Ohio
including 12 horizontal Utica-Point Pleasant wells. As of December 31, 2015, we had approximately 1,394 net undeveloped acres
prospective for the Utica Shale in Trumbull and Stark counties in Ohio.
Coal-Bed Methane. Our coal-bed methane developments are diversified across four well-known coal-bed methane producing
areas: the Raton, Black Warrior, Arkoma and Central Appalachian basins. As of December 31, 2015, we had more than 455,630 net
undeveloped acres prospective for coal-bed methane. Also as of December 31, 2015, we operated 2,831 wells and had an interest in
another 833 wells, all of which produce gas generated from coal.
The Raton asset straddles the New Mexico-Colorado border, along the eastern edge of the Sangre de Cristo Mountains. The
production derives from two coal-bearing intervals, the Raton (Tertiary-Upper Cretaceous Age) and Vermajo (Cretaceous Age)
formations. The combined net coal thickness ranges between 18 and 65 feet, with depths between 750 and 2,200 feet. As of December
31, 2015, we operated 973 wells at the Raton asset.
The Black Warrior coal-bed methane asset is located in central Alabama and geologically related with the frontal thrusts
associated with the Appalachian Mountains. The three Pennsylvanian-age coal intervals (Pratt, Mary Lee and Black Creek, listed in
increasing stratigraphic depth and age) possess combined net coal thicknesses ranging from 16 to 24 feet, at depths of 500 to 2,400
feet. As of December 31, 2015, we operated 882 wells and had an interest in an additional 695 wells at the Black Warrior asset.
The Arkoma coal-bed methane asset is located in eastern Oklahoma and the Arkoma basin formed by the Ouachita Mountain
uplift to the southeast. The main producing coal is the Hartshorne Coal seam which is of middle Pennsylvanian Age. The net coal
thickness ranges from 5 to 10 feet, at depths of 14 to 4,900 feet. As of December 31, 2015, we operated 564 wells and had an interest
in an additional 66 wells at the Arkoma asset.
The Central Appalachian coal-bed methane asset is located in Virginia and West Virginia. The Central Appalachian Basin is a
mountainous region where coal mining is prevalent. We operate vertical wells in the Pond Creek and Lasher fields located in southern
West Virginia and southwestern Virginia and pinnate horizontal wells in southern and northern West Virginia. As of December 31,
2015, we operated 412 wells and had an interest in an additional 72 wells in Virginia and West Virginia.
14
Rangely. The Rangely Oil Field, located in northwestern Colorado, is one of the oldest and largest oil fields in the Rocky
Mountain region. We have an approximate 25% non-operating net working interest in the assets and Chevron Corporation is the
current owner/operator of the Rangely Weber Sand Unit. The Weber Formation is Permian to Pennsylvanian in age (245-315 million
years ago), and typically consists of fine-grained, cross-bedded calcareous sandstones. Average thickness of the unit is 1,200 feet,
although the gross reservoir thickness averages 530 feet, and the net production interval within the formation varies from
approximately 150 to 250 feet.
Eagle Ford. The Eagle Ford Shale is an Upper Cretaceous-age formation that is prospective for horizontal drilling in
approximately 26 counties across South Texas. Target vertical depths range from 4,000 to some 11,000+ feet with thickness from 40
to over 400 feet. The Eagle Ford formation is considered to be the primary source rock for many conventional oil and gas fields
including the prolific East Texas Oil Field, one of the largest oil fields in the contiguous United States. As of December 31, 2015, we
had 27 producing wells and 72 undeveloped locations in the Eagle Ford Shale.
Mississippi Lime/Hunton. The Mississippi Lime and Hunton formations are located in the Anadarko Shelf in northern
Oklahoma. The Mississippi Lime formation is an expansive carbonate hydrocarbon system and is located at depths between 4,000 and
7,000 feet between the Pennsylvanian-aged Morrow formation and the Devonian-age world-class source rock Woodford Shale
formation. The Mississippi Lime formation can reach 600 feet in gross thickness, with a targeted porosity zone between 50 and 100
feet thickness. The Hunton formation is a limestone formation located at a depth of approximately 7,500 feet, and ranges in thickness
from 150 and 300 feet. As of December 31, 2015, we had an interest in approximately 78 Mississippi Lime wells and 30 Hunton
wells.
Gas and Oil Production
Production Volumes
Currently, our natural gas, crude oil and NGL production operations are focused in various plays throughout the United States,
and include direct interest wells and ownership interests in wells drilled through our Drilling Partnerships. When we drill new wells
through our partnership management business we receive an interest in each Drilling Partnership proportionate to the value of our co-
investment in it and the value of the acreage we contribute to it, typically 30% of the overall capitalization of a particular partnership.
The following table presents our total net natural gas, oil and natural gas liquids production volumes and production per day for the
three years ended December 31, 2015, 2014, and 2013:
Years Ended December 31,
2015 2014 2013
Production per day:(1)(2)
Natural gas (Mcfd) .................................................... 216,613 238,054 163,971
Oil (Bpd) ................................................................... 5,139 3,436 1,329
Natural gas liquids (Bpd) .......................................... 3,155 3,802 3,473
Total (Mcfed) ....................................................... 266,374 281,486 192,786
(1) “Mcfd” represents thousand cubic feet per day; “Mcfed” represents thousand cubic feet equivalents per day; and “Bpd”
represents barrels per day. Barrels are converted to Mcfe using the ratio of approximately 6 Mcf to one barrel.
(2) Production quantities consist of the sum of (i) our proportionate share of production from wells in which we have a direct
interest, based on our proportionate net revenue interest in such wells, and (ii) our proportionate share of production from wells
owned by the Drilling Partnerships in which we have an interest, based on our equity interest in each such partnership and based
on each partnership’s proportionate net revenue interest in these wells.
15
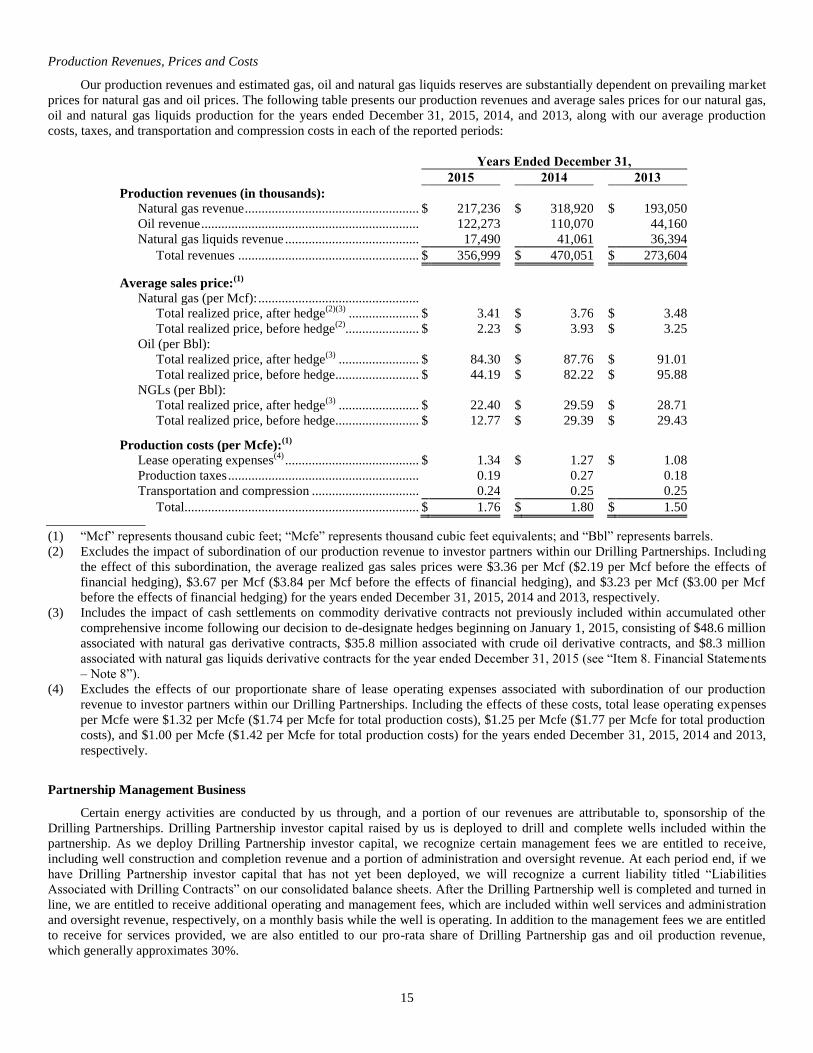
Production Revenues, Prices and Costs
Our production revenues and estimated gas, oil and natural gas liquids reserves are substantially dependent on prevailing market
prices for natural gas and oil prices. The following table presents our production revenues and average sales prices for our natural gas,
oil and natural gas liquids production for the years ended December 31, 2015, 2014, and 2013, along with our average production
costs, taxes, and transportation and compression costs in each of the reported periods:
Years Ended December 31,
2015 2014 2013
Production revenues (in thousands):
Natural gas revenue .................................................... $ 217,236 $ 318,920 $ 193,050
Oil revenue ................................................................. 122,273 110,070 44,160
Natural gas liquids revenue ........................................ 17,490 41,061 36,394
Total revenues ...................................................... $ 356,999 $ 470,051 $ 273,604
Average sales price:(1)
Natural gas (per Mcf): ................................................
Total realized price, after hedge(2)(3)
..................... $ 3.41 $ 3.76 $ 3.48
Total realized price, before hedge(2)
...................... $ 2.23 $ 3.93 $ 3.25
Oil (per Bbl):
Total realized price, after hedge(3)
........................ $ 84.30 $ 87.76 $ 91.01
Total realized price, before hedge......................... $ 44.19 $ 82.22 $ 95.88
NGLs (per Bbl):
Total realized price, after hedge(3)
........................ $ 22.40 $ 29.59 $ 28.71
Total realized price, before hedge......................... $ 12.77 $ 29.39 $ 29.43
Production costs (per Mcfe):(1)
Lease operating expenses(4)
........................................ $ 1.34 $ 1.27 $ 1.08
Production taxes ......................................................... 0.19 0.27 0.18
Transportation and compression ................................ 0.24 0.25 0.25
Total ...................................................................... $ 1.76 $ 1.80 $ 1.50
(1) “Mcf” represents thousand cubic feet; “Mcfe” represents thousand cubic feet equivalents; and “Bbl” represents barrels.
(2) Excludes the impact of subordination of our production revenue to investor partners within our Drilling Partnerships. Including
the effect of this subordination, the average realized gas sales prices were $3.36 per Mcf ($2.19 per Mcf before the effects of
financial hedging), $3.67 per Mcf ($3.84 per Mcf before the effects of financial hedging), and $3.23 per Mcf ($3.00 per Mcf
before the effects of financial hedging) for the years ended December 31, 2015, 2014 and 2013, respectively.
(3) Includes the impact of cash settlements on commodity derivative contracts not previously included within accumulated other
comprehensive income following our decision to de-designate hedges beginning on January 1, 2015, consisting of $48.6 million
associated with natural gas derivative contracts, $35.8 million associated with crude oil derivative contracts, and $8.3 million
associated with natural gas liquids derivative contracts for the year ended December 31, 2015 (see “Item 8. Financial Statements
– Note 8”).
(4) Excludes the effects of our proportionate share of lease operating expenses associated with subordination of our production
revenue to investor partners within our Drilling Partnerships. Including the effects of these costs, total lease operating expenses
per Mcfe were $1.32 per Mcfe ($1.74 per Mcfe for total production costs), $1.25 per Mcfe ($1.77 per Mcfe for total production
costs), and $1.00 per Mcfe ($1.42 per Mcfe for total production costs) for the years ended December 31, 2015, 2014 and 2013,
respectively.
Partnership Management Business
Certain energy activities are conducted by us through, and a portion of our revenues are attributable to, sponsorship of the
Drilling Partnerships. Drilling Partnership investor capital raised by us is deployed to drill and complete wells included within the
partnership. As we deploy Drilling Partnership investor capital, we recognize certain management fees we are entitled to receive,
including well construction and completion revenue and a portion of administration and oversight revenue. At each period end, if we
have Drilling Partnership investor capital that has not yet been deployed, we will recognize a current liability titled “Liabilities
Associated with Drilling Contracts” on our consolidated balance sheets. After the Drilling Partnership well is completed and turned in
line, we are entitled to receive additional operating and management fees, which are included within well services and administration
and oversight revenue, respectively, on a monthly basis while the well is operating. In addition to the management fees we are entitled
to receive for services provided, we are also entitled to our pro-rata share of Drilling Partnership gas and oil production revenue,
which generally approximates 30%.

16
Over the last five years, we raised over $645.1 million from outside investors for participation in our Drilling Partnerships. Net
proceeds from these partnerships are used to fund the investors’ share of drilling and completion costs under our drilling contracts
with the partnerships.
Our fund raising activities for sponsored Drilling Partnerships during the last five years are summarized in the following table
(amounts in millions):
Drilling Program Capital
Investor
contributions
Our
contributions
Total
capital
2015 ................................................................................. $ 59.3 $ 17.6 $ 76.9
2014 ................................................................................. 166.8 71.0 237.8
2013 ................................................................................. 150.0 92.3 242.3
2012 ................................................................................. 127.1 54.4 181.5
2011 ................................................................................. 141.9 28.3 170.2
Total ................................................................................ $ 645.1 $ 263.6 $ 908.7
As managing general partner of our Drilling Partnerships, we recognize our Drilling Partnership management fees in the
following manner:
Well construction and completion. For each well that is drilled by a Drilling Partnership, we receive a 15% mark-up on
those costs incurred to drill and complete the wells included within the partnership. Such fees are earned, in accordance
with the partnership agreement, and recognized as the services are performed, typically between 60 and 270 days, using
the percentage of completion method;
Administration and oversight. For each well drilled by a Drilling Partnership, we receive a fixed fee between $100,000
and $500,000, depending on the type of well drilled, which is earned in accordance with the partnership agreement and
recognized at the initiation of the well. Additionally, the Drilling Partnership pays us a monthly per well administrative
fee of $75 for the life of the well. The well administrative fee is earned on a monthly basis as the services are performed;
and
Well services. Each Drilling Partnership pays us a monthly per well operating fee, currently $1,000 to $2,000, depending
on the type of well, for the life of the well. Such fees are earned on a monthly basis as the services are performed;
Gathering and processing revenue includes gathering fees we charge to the Drilling Partnership wells for our processing plants
in the New Albany and the Chattanooga Shales. Generally, we charge a gathering fee to the Drilling Partnership wells equivalent to
the fees we remit. In Appalachia, a majority of our Drilling Partnership wells are subject to a gathering agreement, whereby we remit a
gathering fee of 16%. However, based on the respective Drilling Partnership agreements, we charge our Drilling Partnership wells a
13% gathering fee. As a result, some of our gathering expenses within our partnership management segment, specifically those in the
Appalachian Basin, will generally exceed the revenues collected from Drilling Partnerships by approximately 3%.
Our Drilling Partnerships provide tax advantages to our investors because an investor’s share of the partnership’s intangible
drilling cost deduction may be used to offset ordinary income. Intangible drilling costs include items that do not have salvage value,
such as labor, fuel, repairs, supplies and hauling. Generally, for our Drilling Partnerships, approximately 80% to 94% of the
subscription proceeds received have been used to pay 100% of the partnership’s intangible drilling costs. For example, an investment
of $10,000 generally permits the investor to deduct from taxable ordinary income approximately $8,000 to $9,400 in the year in which
the investor invests.
17
While our historical structure has varied, we have generally agreed to subordinate a portion of our share of Drilling Partnership
gas and oil production revenue, net of corresponding production costs and up to a maximum of 50% of unhedged revenue, from
certain Drilling Partnerships for the benefit of the limited partner investors until they have received specified returns, typically from
10% to 12% per year determined on a cumulative basis, over a specified period, typically the first five to eight years, in accordance
with the terms of the partnership agreements. We periodically compare the projected return on investment for limited partners in a
Drilling Partnership during the subordination period, based upon historical and projected cumulative gas and oil production revenue
and expenses, with the return on investment subject to subordination agreed upon within the Drilling Partnership agreement. If the
projected return on investment falls below the agreed upon rate, we recognize subordination as an estimated reduction of our pro-rata
share of gas and oil production revenue, net of corresponding production costs, during the current period in an amount that will
achieve the agreed upon investment return, subject to the limitation of 50% of unhedged cumulative net production revenues over the
subordination period. For Drilling Partnerships for which we have recognized subordination in a historical period, if projected
investment returns subsequently reflect that the agreed upon limited partner investment return will be achieved during the
subordination period, we will recognize an estimated increase in our portion of historical cumulative gas and oil net production,
subject to a limitation of the cumulative subordination previously recognized.
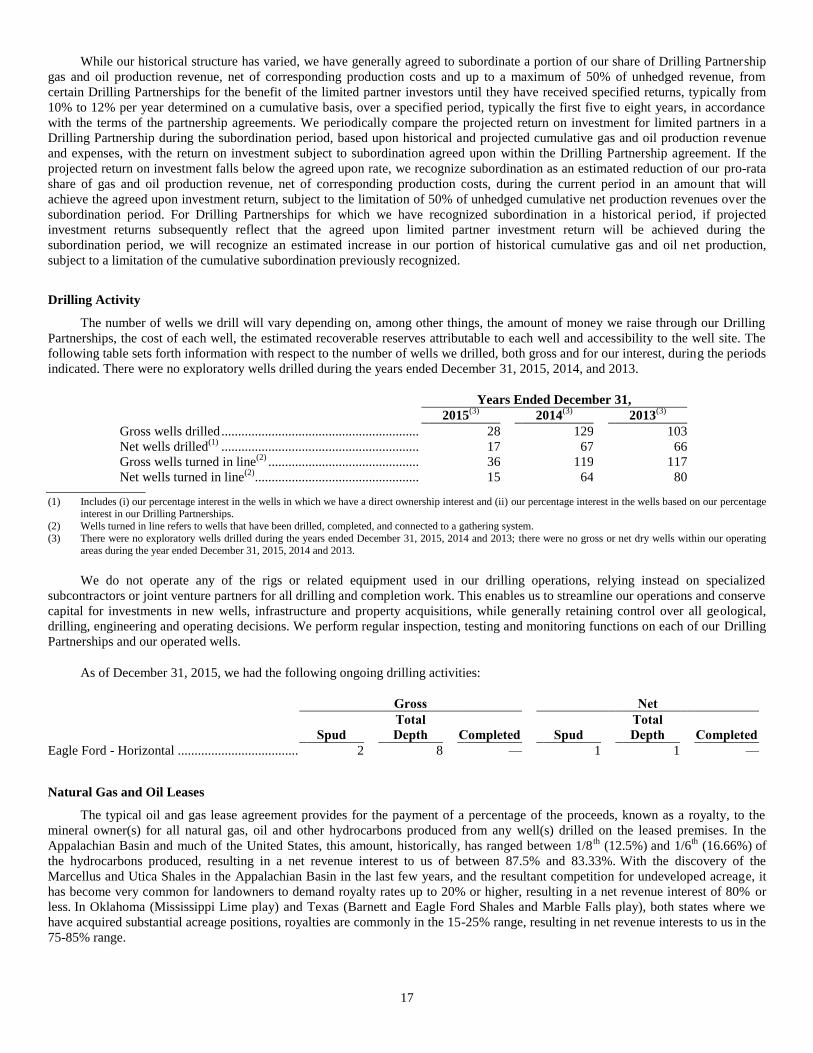
Drilling Activity
The number of wells we drill will vary depending on, among other things, the amount of money we raise through our Drilling
Partnerships, the cost of each well, the estimated recoverable reserves attributable to each well and accessibility to the well site. The
following table sets forth information with respect to the number of wells we drilled, both gross and for our interest, during the periods
indicated. There were no exploratory wells drilled during the years ended December 31, 2015, 2014, and 2013.
Years Ended December 31,
2015(3)
2014(3)
2013(3)
Gross wells drilled ........................................................... 28 129 103
Net wells drilled(1)
........................................................... 17 67 66
Gross wells turned in line(2)
............................................. 36 119 117
Net wells turned in line(2)
................................................. 15 64 80
(1) Includes (i) our percentage interest in the wells in which we have a direct ownership interest and (ii) our percentage interest in the wells based on our percentage interest in our Drilling Partnerships.
(2) Wells turned in line refers to wells that have been drilled, completed, and connected to a gathering system.
(3) There were no exploratory wells drilled during the years ended December 31, 2015, 2014 and 2013; there were no gross or net dry wells within our operating
areas during the year ended December 31, 2015, 2014 and 2013.
We do not operate any of the rigs or related equipment used in our drilling operations, relying instead on specialized
subcontractors or joint venture partners for all drilling and completion work. This enables us to streamline our operations and conserve
capital for investments in new wells, infrastructure and property acquisitions, while generally retaining control over all geological,
drilling, engineering and operating decisions. We perform regular inspection, testing and monitoring functions on each of our Drilling
Partnerships and our operated wells.
As of December 31, 2015, we had the following ongoing drilling activities:
Gross Net
Spud
Total
Depth Completed Spud
Total
Depth Completed
Eagle Ford - Horizontal .................................... 2 8 — 1 1 —
Natural Gas and Oil Leases
The typical oil and gas lease agreement provides for the payment of a percentage of the proceeds, known as a royalty, to the
mineral owner(s) for all natural gas, oil and other hydrocarbons produced from any well(s) drilled on the leased premises. In the
Appalachian Basin and much of the United States, this amount, historically, has ranged between 1/8th
(12.5%) and 1/6th (16.66%) of
the hydrocarbons produced, resulting in a net revenue interest to us of between 87.5% and 83.33%. With the discovery of the
Marcellus and Utica Shales in the Appalachian Basin in the last few years, and the resultant competition for undeveloped acreage, it
has become very common for landowners to demand royalty rates up to 20% or higher, resulting in a net revenue interest of 80% or
less. In Oklahoma (Mississippi Lime play) and Texas (Barnett and Eagle Ford Shales and Marble Falls play), both states where we
have acquired substantial acreage positions, royalties are commonly in the 15-25% range, resulting in net revenue interests to us in the
75-85% range.
18
In the Texas Barnett and Eagle Ford Shales, Oklahoma Mississippi Lime and Appalachian Basin Marcellus and Utica plays,
where horizontal wells are generally drilled on much larger drilling units (sometimes approaching 1,000 acres), the mineral and/or
surface rights are generally acquired from multiple parties. In the case of “urban” drilling areas in the Barnett Shale, there may be as
many as 3,500 royalty owners within a single drilling unit.
Because the acquisition of hydrocarbon leases in highly desirable basins is an extremely competitive process, and involves
certain geological and business risks to identify prospective areas, leases are frequently held by other oil and gas operators. In order to
access the rights to drill on those leases held by others, we may elect to farm-in lease rights and/or purchase assignments of leases
from competitor operators. Typically, the assignor of such leases will reserve an overriding royalty interest (over and above the
existing mineral owner royalty), that can range from 2-3% up to as high as 7 or 8%, and sometimes contain options to convert the
overriding royalty interests to working interests at payout of a well. Areas where farm-ins are utilized can result in additional
reductions in our net revenue interests, depending upon their terms and how much of a particular drilling unit the farm-in acreage
encompasses.
There will be occasions where competitors owning leasehold interests in areas where we want to drill will not farm-out or sell
their leases, but will instead join us as working interest partners, paying their proportionate share of all drilling and operating costs in a
well. However, it is generally our goal to obtain 100% of the working interest in any and all new wells that we operate.
Contractual Revenue Arrangements
Natural Gas. We market the majority of our natural gas production to gas marketers directly or to third party plant operators
who process and market the gas. The sales price of natural gas produced is a function of the market in the area and typically linked to
a regional index. The pricing indices for the majority of our production areas are as follows:
Appalachian Basin - Dominion South Point, Tennessee Gas Pipeline Zone 4 (200 Leg), Transco Leidy Line, Columbia
Appalachia, NYMEX and Transco Zone 5;
Mississippi Lime - Southern Star;
Barnett Shale and Marble Falls- primarily Waha but with smaller amounts sold into a variety of north Texas outlets;
Raton – ANR, Panhandle, and NGPL;
Black Warrior Basin – Southern Natural;
Eagle Ford – Transco Zone 1;
Arkoma – Enable Gas; and
Other regions - primarily the Texas Gas Zone SL spot market (New Albany Shale) and the Cheyenne Hub spot market
(Niobrara).
We attempt to sell the majority of our natural gas at monthly, fixed index prices and a smaller portion at index daily prices.
Crude Oil. Crude oil produced from our wells flows directly into leasehold storage tanks where it is picked up by an oil
company or a common carrier acting for an oil company. The crude oil is typically sold at the prevailing spot market price for each
region, less appropriate trucking/pipeline charges. The oil and natural gas liquids production of our Rangely assets flows into a
common carrier pipeline and is sold at prevailing market prices, less applicable transportation and oil quality differentials. We do not
have delivery commitments for fixed and determinable quantities of crude oil in any future periods under existing contracts or
agreements.
Natural Gas Liquids. NGLs are extracted from the natural gas stream by processing and fractionation plants enabling the
remaining “dry” gas to meet pipeline specifications for transport or sale to end users or marketers operating on the receiving pipeline.
The resulting plant residue natural gas is sold as described above and the NGLs are generally priced and sold using the Mont Belvieu
(TX) or Conway (KS) regional processing indices. The cost to process and fractionate the NGLs from the gas stream is typically either
a volumetric fee for the gas and liquids processed or a percentage retention by the processing and fractionation facility. We do not
have delivery commitments for fixed and determinable quantities of NGLs in any future periods under existing contracts or
agreements.
For the year ended December 31, 2015, Tenaska Marketing Ventures, Chevron, Enterprise and Interconn Resources LLC
accounted for approximately 21%, 15%, 11% and 11% of our total natural gas, oil, and NGL production revenues, respectively, with
no other single customer accounting for more than 10% for this period.
19
Drilling Partnerships. We generally have funded a portion of our drilling activities through sponsorship of tax-advantaged
Drilling Partnerships. In addition to providing capital for our drilling activities, our Drilling Partnerships are a source of fee-based
revenues, which are not directly dependent on commodity prices. See “Partnership Management Business” for further discussion.
Natural Gas and Oil Hedging
We seek to provide greater stability in our cash flows through our use of financial hedges for our natural gas, oil and natural gas
liquids production. The financial hedges may include purchases of regulated NYMEX futures and options contracts and non-regulated
over-the-counter futures and options contracts with qualified counterparties. Financial hedges are contracts between ourselves and
counterparties and do not require physical delivery of hydrocarbons. Financial hedges allow us to mitigate hydrocarbon price risk, and
cash is settled to the extent there is a price difference between the hedge price and the actual NYMEX settlement price. Settlement
typically occurs on a monthly basis, at the time in the future dictated within the hedge contract. Financial hedges executed in
accordance with our secured credit facility do not require cash margin and are secured by our natural gas and oil properties. To assure
that the financial instruments will be used solely for hedging price risks and not for speculative purposes, we have a management
committee to assure that all financial trading is done in compliance with our hedging policies and procedures. We do not intend to
contract for positions that we cannot offset with actual production.
Natural Gas Gathering Agreements
Virtually all natural gas produced is gathered through one or more pipeline systems before sale or delivery to a marketer or an
interstate pipeline. A gathering fee can be charged for each gathering activity that is utilized and by each separate gatherer providing
the service. Fees will vary depending on the distance the gas travels and whether additional services such as compression, blending, or
contaminant removal are provided.
Barnett and Marble Falls production in Texas is gathered/processed by a variety of companies depending on the location of the
production. As in the case of Appalachian and Mississippi Lime production, either a fee is charged for the gathering activity alone, or
a gatherer/processor may provide a combination of services to include processing, fractionation and/or compression. In some
instances, the market to which the gas is sold will deduct the third-party gathering fees from the proceeds payable and pay the third-
party gatherers directly.
In Appalachia, we have gathering agreements with Laurel Mountain Midstream, LLC (“Laurel Mountain”). Under these
agreements, we dedicate our natural gas production in certain areas within southwest Pennsylvania to Laurel Mountain for
transportation to interstate pipeline systems or local distribution companies, subject to certain exceptions. In return, Laurel Mountain
is required to accept and transport our dedicated natural gas subject to certain conditions. The greater of $0.35 per mcf or 16% of the
gross sales price of the natural gas is charged by Laurel Mountain for the majority of the gas. A lesser fee does apply to a small
number of specific wells in the area. We also use Anadarko Marcellus Midstream, L.L.C.’s facilities to gather our Lycoming Co.,
Pennsylvania production for a $0.45 MMBtu fee which delivers our production to Transco Interstate pipeline for purchase by Sequent
Energy Management, L.P. Our Utica production in Ohio is gathered by both Utica East Ohio Midstream, L.L.C. (“UEO”) and Blue
Racer Midstream, L.L.C. for delivery to UEO’s Kensington Processing plant. Residue gas is sold to markets on Dominion East Ohio
or Tennessee pipelines. UEO markets the NGLs and returns proceeds to us.
In the Raton Basin (New Mexico and Colorado), we gather all of our production and deliver it to Colorado Interstate Gas
Pipeline, an interstate pipeline. In the Black Warrior Basin (Alabama), we gather our own production and deliver it to the Southcross
Alabama pipeline who then delivers the gas to our purchaser, Interconn Resources, L.L.C. and BP.
Mississippi Lime production is currently gathered, processed, fractionated, and marketed by one company, SemGas, and they
return a Percent of Proceeds (“POP”) of the revenues it receives. That POP amount is 95%. The remaining 5% and a $0.3276 MMB tu
gathering fee are paid to SemGas for all services provided.
Availability of Energy Field Services
We contract for drilling rigs and purchase goods and services necessary for the drilling and completion of wells from a number
of drillers and suppliers, none of which supplies a significant portion of our annual needs. Over the past year, we and other oil and
natural gas companies have experienced a significant reduction in drilling and operating costs. We cannot predict the duration or
stability of the current level of supply and demand for drilling rigs and other goods and services required for our operations with any
certainty due to numerous factors affecting the energy industry, including the supply and demand for natural gas and oil.
We maintained a Pennsylvania Operating Services Agreement, pursuant to which a subsidiary of Chevron Corporation provided
us (including Drilling Partnerships which we manage) with water disposal services with respect to certain wells in Pennsylvania in
20
exchange for specified fees. We had an obligation to indemnify the provider against all claims and liabilities arising out of its
provision of services under this agreement. On February 12, 2015, we received notice of termination from Chevron Corporation of the
Pennsylvania Operating Services Agreement which terminated on August 12, 2015. Subsequent to the termination of the
Pennsylvania Operating Services Agreement, we have utilized many of the same water hauling companies in the area but have had to
pay higher disposal related fees.
Competition
The energy industry is intensely competitive in all of its aspects. We operate in a highly competitive environment for acquiring
properties and other energy companies, attracting capital for our Drilling Partnerships, contracting for drilling equipment and securing
trained personnel. We also compete with the exploration and production divisions of public utility companies for mineral property
acquisitions. Competition is intense for the acquisition of leases considered favorable for the development of hydrocarbons in
commercial quantities. Our competitors may be able to pay more for hydrocarbon properties and to evaluate, bid for and purchase a
greater number of properties than our financial or personnel resources permit. Furthermore, competition arises not only from
numerous domestic and foreign sources of hydrocarbons but also from other industries that supply alternative sources of energy.
Product availability and price are the principal means of competition in selling natural gas, crude oil, and natural gas liquids.
Many of our competitors possess greater financial and other resources which may enable them to identify and acquire desirable
properties and market their hydrocarbon production more effectively than we do. Moreover, we also compete with a number of other
companies that offer interests in Drilling Partnerships. As a result, competition for investment capital to fund Drilling Partnerships is
intense.
Markets
The availability of a ready market for natural gas, oil and natural gas liquids and the price obtained, depends upon numerous
factors beyond our control, as described in “Item 1A: Risk Factors - Risks Relating to Our Business”. Product availability and price
are the principal means of competition in selling natural gas, oil and NGLs.
Seasonal Nature of Business
Generally, but not always, the demand for natural gas decreases during the summer months and increases during the winter
months. Seasonal anomalies such as mild winters or hot summers sometimes lessen this fluctuation. In addition, certain natural gas
users utilize natural gas storage facilities and purchase some of their anticipated winter requirements during the summer. This can also
lessen seasonal demand fluctuations. In addition, seasonal weather conditions and lease stipulations can limit our drilling and
producing activities and other operations in certain areas. These seasonal anomalies may pose challenges for meeting our well
construction objectives and increase competition for equipment, supplies and personnel, which could lead to shortages and increase
costs or delay our operations. We have in the past drilled a greater number of wells during the winter months, because we typically
received the majority of funds from Drilling Partnerships during the fourth calendar quarter.
Environmental Matters and Regulation
Our operations relating to drilling and waste disposal are subject to stringent and complex laws and regulations pertaining to
health, safety and the environment. As operators within the complex natural gas and oil industry, we must comply with laws and
regulations at the federal, state and local levels. These laws and regulations can restrict or affect our business activities in many ways,
such as by:
restricting the way waste disposal is handled;
limiting or prohibiting drilling, construction and operating activities in sensitive areas such as wetlands, coastal regions,
non-attainment areas, tribal lands or areas inhabited by threatened or endangered species;
requiring the acquisition of various permits before the commencement of drilling;
requiring the installation of expensive pollution control equipment and water treatment facilities;
restricting the types, quantities and concentration of various substances that can be released into the environment in
connection with siting, drilling, completion, production, and plugging activities;
requiring remedial measures to reduce, mitigate and/or respond to releases of pollutants or hazardous substances from
existing and former operations, such as pit closure and plugging of abandoned wells;
21
enjoining some or all of the operations of facilities deemed in non-compliance with permits issued pursuant to such
environmental laws and regulations;
imposing substantial liabilities for pollution resulting from operations; and
requiring preparation of a Resource Management Plan, an Environmental Assessment, and/or an Environmental Impact
Statement with respect to operations affecting federal lands or leases.
Failure to comply with these laws and regulations may result in the assessment of administrative, civil or criminal penalties, the
imposition of remedial requirements, and the issuance of orders enjoining future operations. Certain environmental statutes impose
strict, joint and several liability for costs required to clean up and restore sites where pollutants or wastes have been disposed or
otherwise released. Neighboring landowners and other third parties can file claims for personal injury or property damage allegedly
caused by noise and/or the release of pollutants or wastes into the environment. These laws, rules and regulations may also restrict the
rate of natural gas and oil production below the rate that would otherwise be possible. The regulatory burden on the natural gas and oil
industry increases the cost of doing business in the industry and consequently affects profitability. Additionally, Congress and federal
and state agencies frequently enact new, and revise existing, environmental laws and regulations, and any new laws or changes to
existing laws that result in more stringent and costly waste handling, disposal and clean-up requirements for the natural gas and oil
industry could have a significant impact on our operating costs.
We believe that our operations are in substantial compliance with applicable environmental laws and regulations, and
compliance with existing federal, state and local environmental laws and regulations will not have a material adverse effect on our
business, financial position or results of operations. Nevertheless, the trend in environmental regulation is to place more restrictions
and limitations on activities that may affect the environment. As a result, there can be no assurance as to the amount or timing of
future expenditures for environmental compliance or remediation, and actual future expenditures may be different from the amounts
we currently anticipate. Moreover, we cannot assure future events, such as changes in existing laws, the promulgation of new laws, or
the development or discovery of new facts or conditions will not cause us to incur significant costs.
Environmental laws and regulations that could have a material impact on our operations include the following:
National Environmental Policy Act. Natural gas and oil exploration and production activities on federal lands are subject to the
National Environmental Policy Act, or “NEPA.” NEPA requires federal agencies, including the Department of Interior, to evaluate
major federal agency actions having the potential to significantly affect the environment. In the course of such evaluations, an agency
will typically require an Environmental Assessment to assess the potential direct, indirect and cumulative impacts of a proposed
project and, if necessary, will prepare a more detailed Environmental Impact Statement that will be made available for public review
and comment. All of our proposed exploration and production activities on federal lands, if any, require governmental permits, many
of which are subject to the requirements of NEPA. This process has the potential to delay the development of natural gas and oil
projects.
Waste Handling. The Solid Waste Disposal Act, including RCRA, and comparable state statutes regulate the generation,
transportation, treatment, storage, disposal and cleanup of “hazardous wastes” and the disposal of non-hazardous wastes. Under the
auspices of the United States Environmental Protection Agency (the “EPA”), individual states administer some or all of the provisions
of RCRA, sometimes in conjunction with their own more stringent requirements. Drilling fluids, produced waters, and most of the
other wastes associated with the exploration, development and production of crude oil and natural gas constitute “solid wastes,” which
are regulated under the less stringent non-hazardous waste provisions, but there is no guarantee that the EPA or individual states will
not adopt more stringent requirements for the handling of non-hazardous wastes or categorize some non-hazardous wastes as
hazardous for future regulation. Moreover, ordinary industrial wastes such as paint wastes, waste solvents, laboratory wastes and
waste compressor oils may be regulated as solid waste. The transportation of natural gas in pipelines may also generate some
hazardous wastes that are subject to RCRA or comparable state law requirements.
We believe that our operations are currently in substantial compliance with the requirements of RCRA and related state and
local laws and regulations, and that they hold all necessary and up-to-date permits, registrations and other authorizations to the extent
that they are required under such laws and regulations. Although we and our subsidiaries do not believe the current costs of managing
wastes to be significant, any more stringent regulation of natural gas and oil exploitation and production wastes could increase the
costs to manage and dispose of such wastes.

22
CERCLA. The Comprehensive Environmental Response, Compensation, and Liability Act (“CERCLA”), also known as the
“Superfund” law, imposes joint and several liability, without regard to fault or legality of conduct, on persons who are considered
under the statute to be responsible for the release of a “hazardous substance” into the environment. These persons include the owner or
operator of the site where the release occurred and companies that disposed or arranged for the disposal of the hazardous substance at
the site. Under CERCLA, such persons may be liable for the costs of cleaning up the hazardous substances that have been released
into the environment, for damages to natural resources and for the costs of certain health studies. In addition, it is not uncommon for
neighboring landowners and other third parties to file claims for personal injury and property damage allegedly caused by the
hazardous substances released into the environment.
Our operations are, in many cases, conducted at properties that have been used for natural gas and oil exploitation and
production for many years. Although we believe that we utilized operating and waste disposal practices that were standard in the
industry at the time, hazardous substances, wastes or hydrocarbons may have been released on or under the properties owned or leased
by us or on or under other locations, including off-site locations, where such substances have been taken for disposal. There may be
evidence that petroleum spills or releases have occurred at some of the properties owned or leased by us. However, none of these spills
or releases appears to be material to our financial condition and we believe all of them have been or will be appropriately remediated.
In addition, some of these properties have been operated by third parties or by previous owners or operators whose treatment and
disposal of hazardous substances, wastes or hydrocarbons was not under our control. These properties, and the substances disposed or
released on them, may be subject to CERCLA, RCRA and analogous state laws. Under such laws, we could be required to remove
previously disposed substances and wastes (including waste disposed of by prior owners or operators), remediate contaminated
property (including groundwater contamination, whether from prior owners or operators or other historic activities or spills), or
perform remedial plugging or pit closure operations to prevent future contamination.
Water Discharges. The Federal Water Pollution Control Act, also known as the Clean Water Act, the federal regulations that
implement the Clean Water Act, and analogous state laws and regulations impose restrictions and strict controls on the discharge of
pollutants, including produced waters and other natural gas and oil wastes, into navigable waters of the United States. The discharge
of pollutants into regulated waters is prohibited, except in accordance with the terms of a permit issued by the EPA or the relevant
state. These permits may require pretreatment of produced waters before discharge. Compliance with such permits and requirements
may be costly. Further, much of our natural gas extraction activity utilizes a process called hydraulic fracturing, which results in water
discharges that must be treated and disposed of in accordance with applicable regulatory requirements.
On April 21, 2014, the U.S. Army Corps of Engineers (“USACE”) and the EPA proposed a rule that would define ‘Waters of
the United States’ (“WOTUS”), i.e., the scope of waters protected under the Clean Water Act, in light of several U.S. Supreme Court
opinions (U.S. v. Riverside Bayview, Rapanos v. United States, and Solid Waste Agency of Northern Cook County v. U.S. Army Corps
of Engineers). The public comment period concluded on November 14, 2014 and the EPA received hundreds of thousands of
comments on the proposed rule. On May 27, 2015, the EPA and USACE announced the final rule redefining the extent of the
agencies’ jurisdiction over WOTUS, and the final rule was published in the Federal Register on June 29, 2015 with an effective date
of August 28, 2015. The final rule was immediately challenged by multiple parties, including individual states, in both United States
District Courts and U.S. Circuit Courts of Appeals. On October 9, 2015, the 6th
Circuit Court of Appeals found that the petitioners,
totaling 18 states, demonstrated a “substantial possibility of success on the merits of the claim” and issued a nationwide stay of the
WOTUS final rule. Currently, this nationwide stay is in place and the litigation in both the U.S. District and Circuit Courts is ongoing.
Additionally, there have been legislative efforts by the General Assembly to nullify the rule, specifically a joint resolution of Congress
passed under authority of the Congressional Review Act that was vetoed by President Obama on January 19, 2016. As drafted, the
final rule is broader in scope then the current rule, and will increase the costs of compliance and result in additional permitting
requirements for some of our existing or future facilities.
The Clean Water Act also prohibits the discharge of dredge and fill material in regulated waters, including wetlands, unless
authorized by a permit issued by the U.S. Army Corps of Engineers. The Clean Water Act also requires specified facilities to maintain
and implement spill prevention, control and countermeasure plans and to take measures to minimize the risks of petroleum spills.
Federal and state regulatory agencies can impose administrative, civil and criminal penalties for failure to obtain or non-compliance
with discharge permits or other requirements of the federal Clean Water Act and analogous state laws and regulations. We believe that
our operations are in substantial compliance with the requirements of the Clean Water Act.
Air Emissions. Our operations are subject to the federal Clean Air Act, as amended, the federal regulations that implement the
Clean Air Act, and comparable state laws and regulations. These laws and regulations regulate emissions of air pollutants from
various industrial sources, including drilling sites, processing plants, certain storage vessels and compressor stations, and also impose
various monitoring and reporting requirements. These laws and regulations also apply to entities that use natural gas as fuel, and may
increase the costs of customer compliance to the point where demand for natural gas is affected. Such laws and regulations may
require obtaining pre-approval for the construction or modification of certain projects or facilities expected to produce air emissions or
result in the increase of existing air emissions. Air permits contain various emissions and operational limitations, and may require
23
specific emission control technologies to limit emissions. Various air quality regulations are periodically reviewed by the EPA and are
amended as deemed necessary. The EPA may also issue new regulations based on changing environmental concerns.
Recent revisions to federal Clean Air Act rules impose additional emissions control requirements and practices on our
operations. Some of our new facilities may be required to obtain permits before work can begin, and existing facilities may be
required to incur capital costs in order to comply with new or revised requirements. These regulations may increase the costs of
compliance for some facilities. Our failure to comply with these requirements could subject us to monetary penalties, injunctions,
conditions or restrictions on operations, and potentially criminal enforcement actions. We believe that our operations are in substantial
compliance with the requirements of the Clean Air Act and comparable state laws and regulations.
While we will likely be required to incur certain capital expenditures in the future for air pollution control equipment to comply
with applicable regulations and to obtain and maintain operating permits and approvals for air emissions, we believe that our
operations will not be materially adversely affected by such requirements, and the requirements are not expected to be any more
burdensome to us than other similarly situated companies.
OSHA and Other Regulations. We are subject to the requirements of the federal Occupational Safety and Health Act, or
“OSHA,” and comparable state statutes. The OSHA hazard communication standard, the EPA community right-to-know regulations
under Title III of CERCLA and similar state statutes require that we organize and/or disclose information about hazardous materials
used or produced in our operations. We believe that we are in substantial compliance with these applicable requirements and with
other OSHA and comparable requirements.
On October 22, 2015, the EPA responded to an October 24, 2012 petition to the EPA requesting that the oil and gas extraction
industrial sector be added to the sectors with reporting requirements covered by Section 313 of the Emergency Planning and
Community Right-to-Know Act (the Toxics Release Inventory or “TRI”). In its response, the EPA stated that it intends to propose a
rulemaking that would subject natural gas processing facilities that employ more than 10 people to annual TRI reporting, but that the
EPA will not propose that well sites, compressor stations, pipelines, and other oil and gas extraction industrial sector facilities be
subject to TRI reporting.
Additionally, the White House Office of Management and Budget received OSHA’s final “Occupational Exposure to
Crystalline Silica” rule on December 21, 2015. The final rule has not been published, but is expected to follow OSHA’s proposed rule
from September 12, 2013 that would impose a new exposure limit for silica and with it various new requirements. The federal 2015
Fall Unified Agenda and Regulatory Plan lists February 2016 as the target release date for the final rulemaking. OSHA has previously
addressed respirable silica from the oil and gas industry operations back in December 2014 when it released a “Hydraulic Fracturing
and Flowback Hazards Other than Respirable Silica” safety alert. If finalized, the rule would likely result in significant costs for the
oil and gas industry to comply with the new requirements.
Greenhouse Gas Regulation and Climate Change. To date, legislative and regulatory initiatives relating to greenhouse gas
emissions have not had a material impact on our business. However, Congress has been actively considering climate change
legislation. More directly, the EPA has begun regulating greenhouse gas emissions under the federal Clean Air Act. In response to the
Supreme Court’s decision in Massachusetts v. EPA, 549 U.S. 497 (2007) (holding that greenhouse gases are air pollutants covered by
the Clean Air Act), the EPA made a final determination that greenhouse gases endangered public health and welfare, 74 Fed. Reg.
66,496 (Dec. 15, 2009). This finding led to the regulation of greenhouse gases under the Clean Air Act. Currently, the EPA has
promulgated two final rules relating to greenhouse gases that will affect our businesses.
First, the EPA promulgated the so-called “Tailoring Rule” which established emission thresholds for greenhouse gases under the
Clean Air Act permitting programs, 75 Fed. Reg. 31,514 (June 3, 2010). Both the federal preconstruction review program, known as
“Prevention of Significant Deterioration” (“PSD”), and the operating permit program are now implicated by emissions of greenhouse
gases. These programs, as modified by the Tailoring Rule, could require some new facilities to obtain a PSD permit depending on the
size of the new facilities. In addition, existing facilities as well as new facilities that exceed the emissions thresholds could be required
to obtain the requisite operating permits.
On June 23, 2014, the United States Supreme Court ruled on challenges to the Tailoring Rule in the case of Utility Air
Regulatory Group v. EPA, 134 S. Ct. 2427 (2014). The Court limited the applicability of the PSD program and Tailoring Rule to only
new sources or modifications that would trigger PSD for another criteria pollutant such that projects cannot trigger PSD based solely
on greenhouse gas emissions. However, if PSD is triggered for another pollutant, greenhouse gases could be subject to a control
technology review process. The Court’s decision also means that sources cannot trigger a federal operating permit requirement based
solely on greenhouse gas emissions. Overall, the impact of the Tailoring Rule after the Court’s decision is that it is unlikely to have
much, if any, impact on our operations. However, the EPA is still in the process of responding to the Court’s decision through
rulemakings.

24
Second, the EPA finalized its Mandatory Reporting of Greenhouse Gases rule in 2009, 74 Fed. Reg. 56,260 (Oct. 2009).
Subsequent revisions, additions and clarifications were promulgated, including a rule subpart specifically addressing the natural gas
industry. This particular subpart was most recently revised in October 2015, 80 Fed. Reg. 64262 (Oct. 22, 2015), when the EPA
finalized changes to calculation methods, monitoring and data reporting requirements, and other provisions. Shortly thereafter, in
January 2016, the EPA proposed additional revisions to the broader Greenhouse Gas Reporting for public comment. In general, the
Greenhouse Gas Reporting Rule requires certain industry sectors that emit greenhouse gases above a specified threshold to report
greenhouse gas emissions to the EPA on an annual basis. The natural gas industry is covered by the rule and requires annual
greenhouse gas emissions to be reported by March 31 of each year for the emissions during the preceding calendar year. This rule
imposes additional obligations on us to determine whether the greenhouse gas reporting applies and if so, to calculate and report
greenhouse gas emissions.
In addition to these existing rules, the Obama Administration announced in January 2015 that it was developing additional rules
to curb greenhouse gas emissions from the oil and gas sector, as part of a new national strategy for reducing methane emissions from
the sector by 40 – 45% from 2012 levels by the year 2025. This national methane reduction strategy targeting the oil and gas sector is
related to the Obama Administration’s broader Climate Action Plan of 2013. Multiple federal agencies, including the EPA and the
U.S. Department of the Interior’s Bureau of Land Management, which we refer to as the BLM, are involved in implementing the
national methane reduction strategy.
In August 2015, the EPA proposed a broad suite of regulatory measures to implement the national methane reduction strategy,
as well as to reduce emissions of ozone-forming volatile organic compounds (“VOCs”) and clarify air permitting requirements for the
oil and gas sector. The proposed measures include: (1) a revised New Source Performance Standards (“NSPS”) rule for oil and
natural gas production, transmission, and distribution that would expand existing requirements for sources of VOCs and establish new
requirements for sources of methane; (2) draft Control Techniques Guidelines that direct states to adopt regulations for reducing VOC
emissions from existing oil and gas facilities in certain ozone nonattainment areas and states in the Ozone Transport Region; (3) a
Federal Implementation Plan for certain oil and gas operations located in Indian country; and (4) a rule defining the circumstances in
which oil and gas equipment and activities are to be considered part of a source that is subject to “major source” permitting
requirements under the Clean Air Act. The EPA accepted public comments on these proposals through early December 2015. The
proposals are expected to be finalized in 2016.
Consistent with the Obama Administration’s methane reduction strategy, on January 22, 2016, BLM released a proposed rule to
update standards for venting, flaring, and equipment leaks from oil and gas production activities on onshore Federal and Indian leases.
BLM’s existing requirements are more than three decades old. According to BLM, the proposed rule would ensure that operators use
modern best practices to minimize waste of produced natural gas and reduce emissions of methane and VOCs.
There are also ongoing legislative and regulatory efforts to encourage the use of cleaner energy technologies. While natural gas
is a fossil fuel, it is considered to be more benign, from a greenhouse gas standpoint, than other carbon-based fuels, such as coal or oil.
Thus, future regulatory developments could have a positive impact on our business to the extent that they either decrease the demand
for other carbon-based fuels or position natural gas as a favored fuel.
In addition to domestic regulatory developments, the United States is a participant in multi-national discussions intended to deal
with the greenhouse gas issue on a global basis. To date, those discussions have not resulted in the imposition of any specific
regulatory system, but such talks are continuing and may result in treaties or other multi-national agreements (e.g., the “Paris
Agreement,” reached at the United Nations Conference on Climate Change in December 2015) that could have an impact on our
business.
Finally, the scientific community continues to engage in a healthy debate as to the impact of greenhouse gas emissions on
planetary conditions. For example, such emissions may be responsible for increasing global temperatures, and/or enhancing the
frequency and severity of storms, flooding and other similar adverse weather conditions. We do not believe that these conditions are
having any material current adverse impact on our business, and we are unable to predict at this time, what, if any, long-term impact
such climate effects would have.
Energy Policy Act. Much of our natural gas extraction activity utilizes a process called hydraulic fracturing. The Energy Policy
Act of 2005 amended the definition of “underground injection” in the Federal Safe Drinking Water Act of 1974, or “SDWA.” This
amendment effectively excluded hydraulic fracturing for oil, gas or geothermal activities from the SDWA permitting requirements,
except when “diesel fuels” are used in the hydraulic fracturing operations. Recently, this subject has received much regulatory and
legislative attention at both the federal and state level and we anticipate that the permitting and compliance requirements applicable to
hydraulic fracturing activity are likely to become more stringent and could have a material adverse impact on our business and
operations. For instance, the EPA released its revised final guidance document on SDWA underground injection control permitting for
hydraulic fracturing using diesel fuels in February 2014, along with responses to selected substantive public comments on the EPA’s

25
previous draft guidance, a fact sheet and a memorandum to the EPA’s regional offices regarding implementation of the guidance. The
process for implementing the EPA’s final guidance document may vary across states depending on the regulatory authority
responsible for implementing the SDWA UIC program in each state.
The U.S. Senate and House of Representatives considered legislative bills in the 111th
, 112th
, and 113th
Sessions of Congress
that, if enacted, would have repealed the SDWA permitting exemption for hydraulic fracturing activities. Titled the “Fracturing
Responsibility and Awareness of Chemicals Act,” or “Frac Act,” the legislative bills as proposed could have potentially led to
significant oversight of hydraulic fracturing activities by federal and state agencies. The Frac Act was re-introduced in the current
114th
Session of Congress and referred to the Committee on Environment and Public Works; if enacted into law, the legislation as
proposed could potentially result in significant regulatory oversight, which may include additional permitting, monitoring, recording
and recordkeeping requirements for us.
We believe our operations are in substantial compliance with existing SDWA requirements. However, future compliance with
the SDWA could result in additional requirements and costs due to the possibility that new or amended laws, regulations or policies
could be implemented or enacted in the future.
Hydrogen Sulfide. Exposure to gas containing high levels of hydrogen sulfide, referred to as sour gas, is harmful to humans and
can result in death. We conduct our natural gas extraction activities in certain formations where hydrogen sulfide may be, or is known
to be, present. We employ numerous safety precautions at our operations to ensure the safety of our employees. There are various
federal and state environmental and safety requirements for handling sour gas, and we are in substantial compliance with all such
requirements.
Drilling and Production. State laws regulate the size and shape of drilling and spacing units or proration units governing the
pooling of natural gas and oil properties. Some states allow forced pooling or integration of tracts to facilitate exploitation while other
states rely on voluntary pooling of lands and leases. In some instances, forced pooling or unitization may be implemented by third
parties and may reduce our interest in the unitized properties. In addition, state conservation laws establish maximum rates of
production from natural gas and oil wells, generally prohibit the venting or flaring of natural gas, and impose requirements regarding
the ratability of production. These laws and regulations may limit the amount of natural gas and oil we can produce from our or its
wells or limit the number of wells or the locations at which we can drill. Moreover, each state generally imposes a production or
severance tax or impact fee with respect to the production and sale of oil, natural gas and NGLs within its jurisdiction.
State Regulation and Taxation of Drilling. The various states regulate the drilling for, and the production, gathering and sale of,
natural gas, including imposing severance taxes and requirements for obtaining drilling permits. For example, Pennsylvania has
imposed an impact fee on wells drilled into an unconventional formation, which includes the Marcellus Shale. The impact fee, which
changes from year to year, is based on the average annual price of natural gas as determined by the NYMEX price, as reported by the
Wall Street Journal for the last trading day of each calendar month. For example, based upon natural gas prices for 2015, the impact
fee for qualifying unconventional horizontal wells spudded during 2015 was $45,300 per well, while the impact fee for
unconventional vertical wells was $9,100 per well. The payment structure for the impact fee makes the fee due the year after an
unconventional well is spudded, and the fee will continue for 15 years for an unconventional horizontal well and 10 years for an
unconventional vertical well. States also regulate the method of developing new fields, the spacing and operation of wells and the
prevention of waste of natural gas resources.
States may regulate rates of production and may establish maximum limits on daily production allowable from natural gas wells
based on market demand or resource conservation, or both. States do not regulate wellhead prices or engage in other similar direct
economic regulation, but there can be no assurance that they will not do so in the future. The effect of these regulations may be to
limit the amounts of natural gas that may be produced from our wells, the type of wells that may be drilled in the future in proximity
to existing wells and to limit the number of wells or locations from which we can drill. Texas imposes a 7.5% tax on the market value
of natural gas sold, 4.6% on the market value of condensate and oil produced and an oil field clean up regulatory fee of $0.000667 per
Mcf of gas produced, a regulatory tax of $.001875 and the oil field clean-up fee of $.00625 per barrel of crude. New Mexico imposes,
among other taxes, a severance tax of up to 3.75% of the value of oil and gas produced, a conservation tax of up to 0.24% of the oil
and gas sold, and a school emergency tax of up to 3.15% for oil and 4% for gas. Alabama imposes a production tax of up to 2% on oil
or gas and a privilege tax of up to 8% on oil or gas. Oklahoma imposes a gross production tax of 7% per Bbl of oil, up to 7% per Mcf
of natural gas and a petroleum excise tax of .095% on the gross production of oil and gas.
The petroleum industry is also subject to compliance with various other federal, state and local regulations and laws. Some of
those laws relate to occupational safety, resource conservation and equal employment opportunity. We do not believe that compliance
with these laws will have a material adverse effect upon our unitholders.
26
Oil Spills and Hydraulic Fracturing. The Oil Pollution Act of 1990, as amended (“OPA”), contains numerous requirements
relating to the prevention of and response to oil spills into waters of the United States. The OPA subjects owners of facilities to strict,
joint and several liability for all containment and cleanup costs and certain other damages arising from a spill, including, but not
limited to, the costs of responding to a release of oil to surface waters. While we believe we have been in compliance with OPA,
noncompliance could result in varying civil and criminal penalties and liabilities.
A number of federal agencies, including the EPA and the Department of Interior, are currently evaluating a variety of
environmental issues related to hydraulic fracturing. For example, the EPA is conducting a study that evaluates any potential effects of
hydraulic fracturing on drinking water and ground water. On December 9, 2013, the EPA’s Hydraulic Fracturing Study Technical
Roundtable of subject-matter experts from a variety of stakeholder groups met to discuss the work underway to answer the hydraulic
fracturing study’s key research questions. Individual research projects associated with the EPA’s study were published in July 2014.
On June 4, 2015, the EPA released its draft “Assessment of the Potential Impacts of Hydraulic Fracturing for Oil and Gas on Drinking
Water Resources” (the “Draft Assessment”), in addition to nine new peer-reviewed scientific reports that formed the basis for certain
findings included in the Draft Assessment. The scope of the Draft Assessment focuses on potential impacts to drinking water
resources by hydraulic fracturing, specifically the following water activities that the EPA has identified as the “hydraulic fracturing
water cycle” in the Draft Assessment: water acquisition from ground or surface waters; chemical mixing at the well site; well injection
of hydraulic fracturing fluids; the collection and handling of wastewater from hydraulic fracturing (such as flowback and produced
water); and wastewater treatment and waste disposal. The EPA revealed in its Draft Assessment that it has not found any evidence
that hydraulic fracturing activities are performed in a way that leads to widespread, systemic impacts on drinking water resources.
The EPA did identify specific instances where hydraulic fracturing activities may have led to impacts to drinking water; however, the
EPA noted that those instances are minimal when compared to the number of hydraulically fractured wells in the United States.
Notice of the Draft Assessment was published in the June 5, 2015 Federal Register, and several public teleconference calls and a
public meeting were held by the EPA’s Science Advisory Board (SAB) to discuss the Draft Assessment. On January 7, 2016, the
SAB released a Draft Review of the EPA’s Draft Assessment. The Draft Review includes many recommendations to the EPA that
SAB believes the EPA should consider to improve the Draft Assessment. These recommendations include, but are not limited to:
revising its draft finding that the EPA found no “evidence that hydraulic fracturing mechanisms have led to widespread, systemic
impacts on drinking water resources,” as the SAB found the statement to be ambiguous and therefore require clarification and
additional explanation; adding further discussion on the Pavillion, Wyoming; Parker County, Texas; and Dimock, Pennsylvania
investigations; collecting and add new data regarding the chemicals used during hydraulic fracturing and the content of flowback
water; and adding Best Management Practices and suggested improvements to each stage of the hydraulic fracturing process.
BLM proposed a rule on May 11, 2012 that includes provisions requiring disclosure of chemicals used in hydraulic fracturing
and construction standards for hydraulic fracturing on federal lands. On May 24, 2013, BLM published a revised proposed rule to
regulate hydraulic fracturing on federal and Indian lands. On March 26, 2015, BLM issued a final rule updating the regulations
governing hydraulic fracturing on federal and Indian lands. Among the many new requirements, the final rule requires operators
planning to conduct hydraulic fracturing to design and implement a casing and cementing program that follows best practices and
meets performance standards to protect and isolate usable water, as well as requires operators to monitor cementing operations during
well completion. Additionally, the final rule requires that companies publicly disclose the chemicals used in the hydraulic fracturing
process, subject to limited exceptions for trade secret materials; comply with safety standards for storage of produced water in rigid
enclosed, covered, or netted and screened above-ground tanks, with very limited exceptions allowing use of pits that must be approved
by BLM on a case-by-case basis; and submit detailed information to the BLM on proposed operations, including but not limited to
well geology, location of faults and fractures, estimated volume of fluid to be used, and estimated direction and length of
fractures. The final rule also provides that for certain circumstances in which specific state or tribal regulations are equally or more
protective than the BLM’s new rules, the state or tribe may obtain a variance for that specific regulation. The final rule was set to go
into effect on June 24, 2015. However on June 23, 2015, the U.S. District Court for the District of Wyoming announced a stay on the
effective date of the rule in State of Wyoming v. Dep't of Interior, No. 2:15-cv-00043, a lawsuit that involves several states and
industry associations who requested that the Court grant a preliminary injunction of the final rule. On September 30, 2015, the U.S.
District Court granted the preliminary injunction, thus enjoining the final rule.
In addition, state and local conservancy districts and river basin commissions have all previously exercised their various
regulatory powers to curtail and, in some cases, place moratoriums on hydraulic fracturing. State regulations include express inclusion
of hydraulic fracturing into existing regulations covering other aspects of exploration and production and specifically may include, but
not be limited to, the following:
requirement that logs and pressure test results are included in disclosures to state authorities;
disclosure of hydraulic fracturing fluids and chemicals, potentially subject to trade secret/confidential proprietary
information protections, and the ratios of same used in operations;
specific disposal regimens for hydraulic fracturing fluids;

27
replacement/remediation of contaminated water assets; and
minimum depth of hydraulic fracturing.
Local regulations, which may be preempted by state and federal regulations, have included, but have not been limited to, the
following, which may extend to all operations including those beyond hydraulic fracturing:
noise control ordinances;
traffic control ordinances;
limitations on the hours of operations; and
mandatory reporting of accidents, spills and pressure test failures.
Other Regulation of the Natural Gas and Oil Industry. The natural gas and oil industry is extensively regulated by federal, state
and local authorities. Legislation affecting the natural gas and oil industry is under constant review for amendment or expansion,
frequently increasing the regulatory burden on the industry. Also, numerous departments and agencies, both federal and state, are
authorized by statute to issue rules and regulations binding on the natural gas and oil industry and its individual members, some of
which carry substantial penalties for failure to comply. Although the regulatory burden on the natural gas and oil industry increases
our cost of doing business and, consequently, affects our profitability, these burdens generally do not affect us any differently or to
any greater or lesser extent than they affect other companies in their industries with similar types, quantities and locations of
production.
Legislation continues to be introduced in Congress and development of regulations continues in the Department of Homeland
Security and other agencies concerning the security of industrial facilities, including natural gas and oil facilities. Our operations may
be subject to such laws and regulations. Presently, it is not possible to accurately estimate the potential costs to comply with any such
facility security laws or regulations, but such expenditures could be substantial.
Employees
We do not directly employ any of the persons responsible for our management or operation. In general, personnel employed by
ATLS manage and operate our business. As of December 31, 2015, approximately 619 ATLS employees provided direct support to
our operations. After the closing of the Atlas Energy Merger, all of our personnel were employed by our general partner. Some of the
officers of our general partner may spend a substantial amount of time managing the business and affairs of our general partner and its
affiliates other than us and may face a conflict regarding the allocation of their time between our business and affairs and their other
business interests.
Available Information
We make our periodic reports under the Securities Exchange Act of 1934, including our annual report on Form 10-K, our
quarterly reports on Form 10-Q, our current reports on Form 8-K, and any amendments to those reports, available through our website
at www.atlasresourcepartners.com as soon as reasonably practicable after we electronically file such material with, or furnish it to, the
Securities and Exchange Commission (“SEC”). To view these reports, click on “Investor Relations”, then “SEC Filings”. The other
information contained on or hyperlinked from our website does not constitute part of this report. You may also receive, without
charge, a paper copy of any such filings by request to us at Park Place Corporate Center One, 1000 Commerce Drive, Suite 400,
Pittsburgh, Pennsylvania 15275, telephone number (800) 251-0171. A complete list of our filings is available on the SEC’s website at
www.sec.gov. Any of our filings are also available at the SEC’s Public Reference Room at 100 F Street, N.E., Room 1580,
Washington, D.C. 20549. The Public Reference Room may be contacted at telephone number (800) 732-0330 for further information.

28
ITEM 1A: RISK FACTORS
You should carefully consider each of the following risks, which we believe are the principal risks that we face and of which we
are currently aware, and all of the other information in this report. Some of the risks described below relate to our business, while
others relate principally to the securities markets and ownership of our limited partnership interests. Partnership interests are
inherently different from the capital stock of a corporation, although many of the business risks to which we are subject are similar to
those that would be faced by a corporation engaged in a similar business. The risks and uncertainties our company faces are not
limited to those set forth in the risk factors described below. Additional risks and uncertainties not presently known to us or that we
currently believe to be immaterial may also adversely affect our business. In addition, past financial performance may not be a
reliable indicator of future performance, and historical trends should not be used to anticipate results or trends in future periods. If
any of the following risks were actually to occur, our business, financial condition or results of operations could be materially
adversely affected.
Risks Relating to Our Business
Natural gas and oil prices fluctuate widely, and low prices for an extended period would likely have a material adverse impact on
our business.
Our revenues, operating results, financial condition and ability to borrow funds or obtain additional capital depend substantially
on prevailing prices for natural gas and oil, which have declined substantially. Lower commodity prices may reduce the amount of
natural gas and oil that we can produce economically. Historically, natural gas and oil prices and markets have been volatile, with
prices fluctuating widely, and they are likely to continue to be volatile. Continued depressed prices in the future would have a negative
impact on our future financial results and could result in an impairment charge. Because our reserves are predominantly natural gas,
changes in natural gas prices have a more significant impact on our financial results.
Prices for natural gas and oil are subject to wide fluctuations in response to relatively minor changes in the supply of and
demand for natural gas and oil, market uncertainty and a variety of additional factors that are beyond our control. These factors
include but are not limited to the following:
the levels and location of natural gas and oil supply and demand and expectations regarding supply and demand, including
the potential long-term impact of an abundance of natural gas and oil (such as that produced from our Marcellus Shale
properties) on the domestic and global natural gas and oil supply;
the level of industrial and consumer product demand;
weather conditions;
fluctuating seasonal demand;
political conditions or hostilities in natural gas and oil producing regions, including the Middle East, Africa and South
America;
the ability of the members of the Organization of Petroleum Exporting Countries and other exporting nations to agree to
and maintain oil price and production controls;
the price level of foreign imports;
actions of governmental authorities;
the availability, proximity and capacity of gathering, transportation, processing and/or refining facilities in regional or
localized areas that may affect the realized price for natural gas and oil;
inventory storage levels;
the nature and extent of domestic and foreign governmental regulations and taxation, including environmental and climate
change regulation;
the price, availability and acceptance of alternative fuels;
technological advances affecting energy consumption;
speculation by investors in oil and natural gas;
variations between product prices at sales points and applicable index prices; and
overall economic conditions, including the value of the U.S. dollar relative to other major currencies.
29
These factors and the volatile nature of the energy markets make it impossible to predict with any certainty the future prices of
natural gas and oil. In the past, the prices of natural gas, NGLs and oil have been extremely volatile, and we expect this volatility to
continue. During the year ended December 31, 2015, the NYMEX Henry Hub natural gas index price ranged from a high of $3.23 per
MMBtu to a low of $1.76 per MMBtu, and West Texas Intermediate oil prices ranged from a high of $61.43 per Bbl to a low of
$34.73 per Bbl. Between January 1, 2016 and February 29, 2016, the NYMEX Henry Hub natural gas index price ranged from a high
of $2.47 per MMBtu to a low of $1.71 per MMBtu, and West Texas Intermediate oil prices ranged from a high of $36.76 per Bbl to a
low of $26.21 per Bbl.
A continuation of the prolonged substantial decline in the price of oil and natural gas will likely have a material adverse effect
on our financial condition, results of operations, and ability to continue cash distributions to unitholders. We may use various
derivative instruments in connection with anticipated oil and natural gas sales to reduce the impact of commodity price fluctuations.
However, the entire exposure of our operations from commodity price volatility is not currently hedged, and we may not be able to
hedge such exposure going forward. To the extent we do not hedge against commodity price volatility, or our hedges are not effective,
our results of operations and financial position may be further diminished.
In addition, low oil and natural gas prices have reduced, and may in the future further reduce, the amount of oil and natural gas
that can be produced economically by our operators. This scenario may result in our having to make substantial downward
adjustments to our estimated proved reserves, which could negatively impact our borrowing base and our ability to fund our
operations. If this occurs or if production estimates change or exploration or development results deteriorate, successful efforts method
of accounting principles may require us to write down, as a non-cash charge to earnings, the carrying value of our oil and natural gas
properties. Our operators could also determine during periods of low commodity prices to shut in or curtail production from wells on
our properties. In addition, they could determine during periods of low commodity prices to plug and abandon marginal wells that
otherwise may have been allowed to continue to produce for a longer period under conditions of higher prices.
Oil prices and natural gas prices have declined substantially from historical highs and may remain depressed for the foreseeable
future. Approximately 17% of our 2015 total revenues were derived from oil and condensate sales. Approximately 81% of our 2015
total production was natural gas, on a “Mcf-equivalent” basis. Any additional decreases in prices of oil and natural gas may
adversely affect our cash generated from operations, results of operations, financial position, and our ability to pay distributions,
perhaps materially.
During the year ended December 2015, the spot WTI market price at Cushing, Oklahoma has declined from a high of $61.43 per
Bbl to a low of $34.73 per Bbl. During the nine years prior to December 31, 2015, natural gas prices at Henry Hub have ranged from a
high of $13.31 per MMBtu in 2008 to a low of $1.76 per MMBtu in 2015. Between January 1, 2015 and December 31, 2015, the
Henry Hub spot market price of natural gas ranged from a high of $3.23 per MMBtu to a low of $1.76 per MMBtu. The reduction in
prices has been caused by many factors, including substantial increases in U.S. oil and natural gas production and reserves from
unconventional (shale) reservoirs, without an offsetting increase in demand. The International Energy Agency (“IEA”) forecasts
steady or a slightly declining U.S. production growth and a slowdown in global demand growth in 2016.
This environment could cause the prices for oil and natural gas to remain at current levels or to fall to even lower levels. If
prices for oil and natural gas continue to remain depressed for lengthy periods, we may be required to write down the value of our oil
and natural gas properties, and some of our undeveloped locations may no longer be economically viable. In addition, sustained low
prices for oil and natural gas will negatively impact the value of our estimated proved reserves and the amount that we are allowed to
borrow under our bank credit facility (as a result of borrowing base redeterminations) and reduce the amounts of cash we would
otherwise have available to pay expenses, fund capital expenditures, make distributions to our unitholders, and service our
indebtedness.
Competition in the natural gas and oil industry is intense, which may hinder our ability to acquire natural gas and oil properties
and companies and to obtain capital, contract for drilling equipment and secure trained personnel.
We operate in a highly competitive environment for acquiring properties and other natural gas and oil companies, attracting
capital through our Drilling Partnerships, contracting for drilling equipment and securing trained personnel. Our competitors may be
able to pay more for natural gas, natural gas liquids and oil properties and drilling equipment and to evaluate, bid for and purchase a
greater number of properties than our financial or personnel resources permit. Moreover, our competitors for investment capital may
have better track records in their programs, lower costs or stronger relationships with participants in the oil and gas investment
community than we do. All of these challenges could make it more difficult for us to execute our growth strategy. We may not be able
to compete successfully in the future in acquiring leasehold acreage or prospective reserves or in raising additional capital.
Furthermore, competition arises not only from numerous domestic and foreign sources of natural gas and oil but also from other
industries that supply alternative sources of energy. Competition is intense for the acquisition of leases considered favorable for the
30
development of natural gas and oil in commercial quantities. Product availability and price are the principal means of competition in
selling natural gas and oil. Many of our competitors possess greater financial and other resources than we do, which may enable them
to identify and acquire desirable properties and market their natural gas and oil production more effectively than we can.
Many of our leases are in areas that have been partially depleted or drained by offset wells.
Our key operated project areas are located in active drilling areas in the Mississippi Lime, Marble Falls, Utica Shale and
Marcellus Shale, and many of our leases are in areas that have already been partially depleted or drained by earlier offset drilling. This
may inhibit our ability to find economically recoverable quantities of natural gas and oil in these areas.
Our operations require liquidity for normal operating expenses, servicing our debt, capital expenditures and distributions to our
limited partners and general partners.
Our primary liquidity requirements, in addition to normal operating expenses, are for servicing our debt, capital expenditures
and distributions to our limited partners and general partner. In general, we expect to fund our liquidity needs through cash flow from
operations (including our hedges), bank borrowings, the Drilling Partnerships and equity and debt offerings. Due to the steep decline
in commodity prices, our ability to obtain funding in the equity or capital markets has been, and may continue to be, constrained, and
there can be no assurances that our liquidity requirements will continue to be satisfied given current commodity prices. If our sources
of liquidity are not sufficient to fund our current or future liquidity needs, including as a result of any future borrowing base
redetermination, we may be required to take other actions, such as:
refinancing, restructuring or reorganizing all or a portion of our debt or capital structure;
obtaining alternative financing;
selling assets;
reducing or delaying capital investments;
seeking to raise additional capital;
liquidating all or a portion of our hedge portfolio;
seeking additional partners to develop our assets;
reducing our planned capital program;
continuing to take, and potentially increasing, our cost saving measures to reduce costs, including renegotiation contracts
with contractors, suppliers and service providers, reducing the number of staff and contractors and deferring and
eliminating discretionary costs; or
revising or delaying our other strategic plans.
Our ability to take these actions will depend on, among other things, the conditions of the capital markets and our financial
condition at such time. Due to the steep decline in commodity prices, we may not be able to obtain funding in the equity or capital
markets on terms we find acceptable as the cost of obtaining money from the credit markets generally has increased as many lenders
and institutional investors have increased interest rates, enacted tighter lending standards and reduced and, in some cases, ceased to
provide any new funding. We cannot assure you that we would be able to implement the above actions, if necessary, on commercially
reasonable terms, or at all, in a manner that would be permitted under the terms of our debt instruments or in a manner that does not
negatively impact the price of our securities. Additionally, there can be no assurance that the above actions would allow us to meet
our debt obligations and capital requirements.
We are currently primarily dependent on our credit facilities for liquidity. Any further reduction of the borrowing base under our
revolving credit facility could reduce or eliminate our ability to borrow under the facility and may require us to repay indebtedness
under our credit facilities earlier than anticipated, which would adversely impact our liquidity.
Subject to amounts reserved in the discretion of our Board of Directors to provide for the proper conduct of our business, our
limited partnership agreement provides that we make distributions to our unitholders of available cash. Therefore, we have not
historically accumulated cash to preserve liquidity and have been dependent on the capital markets and our credit facilities for
liquidity. Although our Board of Directors approved a reduction of our common unit distributions, if the constrained capital markets
conditions continue, we will continue to be primarily reliant on our credit facilities, and to the extent available, the excess of net cash
provided by operating activities, for liquidity.

31
At December 31, 2015, there was approximately $103.8 million of available borrowing capacity under our revolving credit
facility. The revolving credit facility is subject to semi-annual redeterminations of its borrowing base, based primarily on reserve
reports, and our next redetermination date is in May 2016. Downward revisions of our oil and natural gas reserves volume and value
due to declines in commodity prices, the impact of lower estimated capital spending in response to lower prices, performance
revisions, sales of assets or the incurrence of certain types of additional debt, among other items, could cause a reduction of our
borrowing base in the future, and these reductions could be significant. For example, as a result of lower commodity prices, in
November 2015, the borrowing base decreased from $750 million to $700 million. Continued low commodity prices and the possible
reserve write-downs that may result, along with the maturity schedule of our hedges, may impact future redeterminations.
There can be no assurance that our lenders will not reduce the borrowing base to an amount below our outstanding borrowings,
which would require us to repay a portion of outstanding borrowings or deposit additional collateral to eliminate such deficiency. In
such event, we may be required to enter into discussions with our lenders or take other actions, including those described in the
preceding risk factor, to satisfy our obligations as a result of such a borrowing base redetermination. If we cannot make the required
payments under our credit facilities, including as a result of a borrowing base redetermination to an amount below our outstanding
borrowings, or the indentures governing our senior notes, an event of default would result thereunder as well as a cross-default under
our other debt agreements. Upon the occurrence of an event of default, the lenders under our credit facilities or holders or our notes, as
applicable, could elect to declare all amounts outstanding immediately due and payable and the lenders could terminate all
commitments to extend further credit. If we were unable to repay those amounts, the lenders could proceed against the collateral
granted to them to secure that indebtedness. We have pledged a significant portion of our assets as collateral under our credit facilities.
If the lenders accelerate the repayment of borrowings, we may not have sufficient assets to repay our credit facilities and our other
liabilities.
Our operations require substantial capital expenditures to increase our asset base. If we are unable to obtain needed capital or
financing on satisfactory terms, our asset base will decline, which could cause our revenues to decline and affect our ability to pay
distributions on our units.
The natural gas and oil industry is capital intensive. If we are unable to obtain sufficient capital funds on satisfactory terms, we
may be unable to increase or maintain our inventory of properties and reserve base, or be forced to curtail drilling or other activities.
This could cause our revenues to decline and diminish our ability to service any debt that we may have at such time. If we do not
make sufficient or effective expansion capital expenditures, including with funds from third-party sources, we will be unable to
expand our business operations, and may not generate sufficient revenue or have sufficient available cash to pay distributions on our
units.
Economic conditions and instability in the financial markets could negatively impact our business which, in turn, could impact the
cash we have to make distributions to our unitholders.
Concerns over global economic conditions, energy costs, geopolitical issues, inflation, the availability and cost of credit, the
European debt crisis, the Chinese economy, and the United States real estate market have contributed to increased economic
uncertainty and diminished expectations for the global economy. These factors, combined with volatile prices of oil, natural gas and
natural gas liquids, declining business and consumer confidence and increased unemployment, have precipitated an economic
slowdown and could lead to a recession. In addition, continued hostilities in the Middle East and the occurrence or threat of terrorist
attacks in the United States or other countries could adversely affect the economies of the United States and other countries. Concerns
about global economic growth have had a significant adverse impact on global financial markets and commodity prices. If the
economic climate in the United States or abroad deteriorates further, worldwide demand for petroleum products could diminish, which
could impact the price at which oil, natural gas and natural gas liquids produced from our properties are sold, affect the ability of
vendors, suppliers and customers associated with our properties to continue operations and ultimately adversely impact our results of
operations, financial condition and potential cash available for distribution.
The above factors can also cause volatility in the markets and affect our ability to raise capital and reduce the amount of cash
available to fund operations. We cannot be certain that additional capital will be available to us to the extent required and on
acceptable terms. Disruptions in the capital and credit markets could negatively impact our access to liquidity needed for our
businesses and impact flexibility to react to changing economic and business conditions. We may be unable to execute our growth
strategies, take advantage of business opportunities, respond to competitive pressures or service our debt, any of which could
negatively impact our business.
A continuing or weakening of the current economic situation could have an adverse impact on producers, key suppliers or other
customers, or on our lenders, causing them to fail to meet their obligations. Market conditions could also impact our derivative
instruments. If a counterparty is unable to perform its obligations and the derivative instrument is terminated, our cash flow and ability
to pay distributions could be impacted which in turn could affect the amount of distributions that we are able to make to our
32
unitholders. The uncertainty and volatility surrounding the global financial system may have further impacts on our business and
financial condition that we currently cannot predict or anticipate.
Our debt obligations could restrict our ability to pay cash distributions and have a negative impact on our financing options and
liquidity position.
Our debt obligations could have important consequences to us and our investors, including:
requiring a substantial portion of our cash flow to make interest payments on this debt;
making it more difficult to satisfy debt service and other obligations;
increasing the risk of a future credit ratings downgrade of our debt, which could increase future debt costs and
limit the future availability of debt financing;
increasing our vulnerability to general adverse economic and industry conditions;
reducing the cash flow available to fund capital expenditures and other corporate purposes and to grow our
business;
limiting our flexibility in planning for, or reacting to, changes in our business and the industry;
placing us at a competitive disadvantage relative to our competitors that may not be as leveraged with debt;
limiting our ability to borrow additional funds as needed or take advantage of business opportunities as they
arise; and
limiting our ability to pay cash distributions.
To the extent that we incur additional indebtedness, the risks described above could increase.
Covenants in our debt documents restrict our business in many ways.
Our credit facilities and the indentures governing our senior notes contain various restrictive covenants that limit our ability to,
among other things:
incur additional debt or liens or provide guarantees in respect of obligations of other persons;
pay distributions or redeem or repurchase our securities;
prepay, redeem or repurchase debt;
make loans, investments and acquisitions;
enter into hedging arrangements;
sell assets;
enter into certain transactions with affiliates; and
consolidate or merge with or into, or sell substantially all of our assets to, another person.
In addition, our debt documents require us to maintain specified financial ratios. Our ability to meet those financial ratios can be
affected by events beyond our control, and we may be unable to meet those tests.
33
If we are unable to meet any of the covenants in our credit facilities or the indentures governing our senior notes, we may be
required to enter into discussions with our lenders or take other actions, such as: refinancing, restructuring or reorganizing all or a
portion of our debt or capital structure; obtaining alternative financing; selling assets; reducing or delaying capital investments;
seeking to raise additional capital; liquidating all or a portion of our hedge portfolio; reducing our planned capital program; continuing
to take, and potentially increasing, our cost saving measures to reduce costs, including renegotiation contracts with contractors,
suppliers and service providers, reducing the number of staff and contractors and deferring and eliminating discretionary costs; or
revising or delaying our other strategic plans, which may negatively impact the price of our securities. A breach of any of the
covenants in our credit facilities or the indentures governing our senior notes, respectively, could result in an event of default
thereunder as well as a cross-default under our other debt agreements. Upon the occurrence of an event of default, the lenders under
our credit facilities or holders or our notes, as applicable, could elect to declare all amounts outstanding immediately due and payable
and the lenders could terminate all commitments to extend further credit. If we were unable to repay those amounts, the lenders could
proceed against the collateral granted to them to secure that indebtedness. We have pledged a significant portion of our assets as
collateral under our credit facilities. If the lenders accelerate the repayment of borrowings, we may not have sufficient assets to repay
our credit facilities and our other liabilities. Our borrowings under our credit facilities are, and are expected to continue to be, at
variable rates of interest and expose us to interest rate risk. If interest rates increase, our debt service obligations on the variable rate
indebtedness would increase even though the amount borrowed remained the same.
Our cash distribution policy limits our ability to grow.
Because we distribute our available cash, if any, rather than reinvesting it in our business, our growth may not be as significant
as businesses that reinvest their available cash to expand ongoing operations, and we may not have enough cash to meet our needs if
any of the following events occur:
an increase in our operating expenses;
an increase in general and administrative expenses;
an increase in principal and interest payments on our outstanding debt;
a reduction in the amount we are allowed to borrow under our bank credit facility (including as a result of borrowing base
redeterminations); or
an increase in working capital requirements.
If we issue additional units or incur debt to fund our operations, acquisitions and expansion or investment capital expenditures,
the payment of distributions on those additional units or interest on that debt could increase the risk that we will be unable to maintain
or continue our per unit distribution level.
Significant physical effects of climate change have the potential to damage our facilities, disrupt our production activities and
cause us to incur significant costs in preparing for or responding to those effects.
Climate change could have an effect on the severity of weather (including hurricanes and floods), sea levels, the arability of
farmland, and water availability and quality. If such effects were to occur, our exploration and production operations have the
potential to be adversely affected. Potential adverse effects could include damages to our facilities from powerful winds or rising
waters in low lying areas, disruption of our production activities either because of climate-related damages to our facilities or our costs
of operation potentially rising from such climatic effects, less efficient or non-routine operating practices necessitated by climate
effects or increased costs for insurance coverage in the aftermath of such effects. Significant physical effects of climate change could
also have an indirect effect on our financing and operations by disrupting the transportation or process-related services provided by
midstream companies, service companies or suppliers with whom we have a business relationship. We may not be able to recover
through insurance some or any of the damages, losses or costs that may result from potential physical effects of climate change.
We depend on certain key customers for sales of our natural gas, crude oil and natural gas liquids. To the extent these customers
reduce the volumes of natural gas, crude oil and natural gas liquids they purchase or process from us, or cease to purchase or
process natural gas, crude oil and natural gas liquids from us, our revenues and cash available for distribution could decline.
We market the majority of our natural gas production to gas utility companies, gas marketers, local distribution companies and
industrial or other end-users. Crude oil produced from our wells flow directly into leasehold storage tanks where it is picked up by an
oil company or a common carrier acting for an oil company. Natural gas liquids are extracted from the natural gas stream by
processing and fractionation plants enabling the remaining “dry” gas (low Btu content) to meet pipeline specifications for transport to
end users or marketers operating on the receiving pipeline. For the year ended December 31, 2015, Tenaska Marketing Ventures,
Chevron, Enterprise and Interconn Resources LLC accounted for approximately 21%, 15%, 11% and 11% of our total natural gas,

34
crude oil and natural gas liquids production revenue, respectively, with no other single customer accounting for more than 10% for
this period. To the extent these and other key customers reduce the amount of natural gas, crude oil and natural gas liquids they
purchase from us, our revenues and cash available for distributions to unitholders could temporarily decline in the event we are unable
to sell to additional purchasers.
An increase in the differential between the NYMEX or other benchmark prices of oil and natural gas and the wellhead price that
we receive for our production could significantly reduce our cash available for distribution and adversely affect our financial
condition.
The prices that we receive for our oil and natural gas production sometimes reflect a discount to the relevant benchmark prices,
such as NYMEX. The difference between the benchmark price and the price that we receive is called a differential. Increases in the
differential between the benchmark prices for oil and natural gas and the wellhead price that we receive could significantly reduce our
cash available for distribution to our unitholders and adversely affect our financial condition. We use the relevant benchmark price to
calculate our hedge positions, and we do not have any commodity derivative contracts covering the amount of the basis differentials
we experience in respect of our production. As such, we will be exposed to any increase in such differentials, which could adversely
affect our results of operations.
Some of our undeveloped leasehold acreage is subject to leases that may expire in the near future.
As of December 31, 2015, leases covering approximately 4,702 of our 742,944 net undeveloped acres, or 0.6%, are scheduled to
expire on or before December 31, 2016. An additional 1.6% of our net undeveloped acres are scheduled to expire in 2017 and 0.2% in 2018.
If we are unable to renew these leases or any leases scheduled for expiration beyond their expiration date, on favorable terms, we will lose the
right to develop the acreage that is covered by an expired lease.
Drilling for and producing natural gas and oil are high-risk activities with many uncertainties.
Our drilling activities are subject to many risks, including the risk that we will not discover commercially productive reservoirs.
Drilling for natural gas and oil can be uneconomic, not only from dry holes, but also from productive wells that do not produce
sufficient revenues to be commercially viable. This risk is exacerbated by the current decline in oil and gas prices. In addition, our
drilling and producing operations may be curtailed, delayed or canceled as a result of other factors, including:
the high cost, shortages or delivery delays of equipment and services;
unexpected operational events and drilling conditions;
adverse weather conditions;
facility or equipment malfunctions;
title problems;
pipeline ruptures or spills;
compliance with environmental and other governmental requirements;
unusual or unexpected geological formations;
formations with abnormal pressures;
injury or loss of life and property damage to a well or third-party property;
leaks or discharges of toxic gases, brine, natural gas, oil, hydraulic fracturing fluid and wastewater from a well;
environmental accidents, including groundwater contamination;
fires, blowouts, craterings and explosions; and
uncontrollable flows of natural gas or well fluids.
Any one or more of the factors discussed above could reduce or delay our receipt of drilling and production revenues, thereby
reducing our earnings, and could reduce revenues in one or more of our Drilling Partnerships, which may make it more difficult to
finance our drilling operations through sponsorship of future partnerships. In addition, any of these events can cause substantial losses,
which may not fully be covered by insurance, including personal injury or loss of life, damage to or destruction of property, natural
resources and equipment, pollution, environmental contamination, loss of wells and regulatory penalties, which could reduce our cash
flow and our ability to pay distributions.
35
Although we maintain insurance against various losses and liabilities arising from our operations, insurance against all
operational risks is not available to us. Additionally, we may elect not to obtain insurance if we believe that the cost of available
insurance is excessive relative to the perceived risks presented. Losses could, therefore, occur for uninsurable or uninsured risks or in
amounts in excess of existing insurance coverage. The occurrence of an event that is not fully covered by insurance could reduce our
results of operations.
Unless we replace our oil and natural gas reserves, our reserves and production will decline, which would reduce our cash flow
from operations and income.
Producing natural gas and oil reservoirs generally are characterized by declining production rates that vary depending upon
reservoir characteristics and other factors. Our natural gas and oil reserves and production and, therefore, our cash flow and income
are highly dependent on our success in efficiently developing and exploiting our reserves and economically finding or acquiring
additional recoverable reserves. Our ability to find and acquire additional recoverable reserves to replace current and future production
at acceptable costs depends on our generating sufficient cash flow from operations and other sources of capital, principally from the
sponsorship of new Drilling Partnerships, all of which are subject to the risks discussed elsewhere in this section.
The recent decrease in natural gas and oil prices, or any further decrease in commodity prices, could subject our oil and gas
properties to a non-cash impairment loss under U.S. generally accepted accounting principles.
U.S. generally accepted accounting principles require oil and gas properties and other long-lived assets to be reviewed for
impairment whenever events or changes in circumstances indicate that their carrying amounts may not be recoverable. Long-lived
assets are reviewed for potential impairments at the lowest levels for which there are identifiable cash flows that are largely
independent of other groups of assets. We test our oil and gas properties on a field-by-field basis, by determining if the historical cost
of proved properties less the applicable depletion, depreciation and amortization and abandonment is less than the estimated expected
undiscounted future cash flows. The expected future cash flows are estimated based on our economic interests and our plans to
continue to produce and develop proved reserves. Expected future cash flow from the sale of production of reserves is calculated
based on estimated future prices. We estimate prices based on current contracts in place at the impairment testing date, adjusted for
basis differentials and market related information, including published future prices. The estimated future level of production is based
on assumptions surrounding future levels of prices and costs, field decline rates, market demand and supply, and the economic and
regulatory climates.
Prolonged depressed prices of natural gas and oil may cause the carrying value of our oil and gas properties to exceed the
expected future cash flows, and a non-cash impairment loss would be required to be recognized in the financial statements for the
difference between the estimated fair market value (as determined by discounted future cash flows) and the carrying value of the
assets. During the year ended December 31, 2015, we recognized $966.6 million of asset impairment primarily related to oil and gas
properties in the Barnett, Coal-bed Methane, Rangely, Southern Appalachia, Marcellus and Mississippi Lime operating areas, and
unproved acreage in the New Albany Shale, which were impaired due to lower forecasted commodity prices, net of $85.8 million of
future hedge gains reclassified from accumulated other comprehensive income.
Estimates of reserves are based on many assumptions that may prove to be inaccurate. Any material inaccuracies in these reserve
estimates or underlying assumptions will materially affect the quantities and present value of our reserves.
Underground accumulations of natural gas and oil cannot be measured in an exact way. Natural gas and oil reserve engineering
requires subjective estimates of underground accumulations of natural gas and oil and assumptions concerning future natural gas
prices, production levels and operating and development costs. As a result, estimated quantities of proved reserves and projections of
future production rates and the timing of development expenditures may prove to be inaccurate. Our current estimates of our proved
reserves are prepared by our internal engineers and our independent petroleum engineers. Over time, our internal engineers may make
material changes to reserve estimates taking into account the results of actual drilling and production. Some of our reserve estimates
were made without the benefit of a lengthy production history, which are less reliable than estimates based on a lengthy production
history. Also, we make certain assumptions regarding future natural gas prices, production levels and operating and development costs
that may prove incorrect. Any significant variance from these assumptions by actual figures could greatly affect our estimates of
reserves, the economically recoverable quantities of natural gas and oil attributable to any particular group of properties, the
classifications of reserves based on risk of recovery and estimates of the future net cash flows. Our standardized measure is calculated
using natural gas prices that do not include financial hedges. Numerous changes over time to the assumptions on which our reserve
estimates are based, as described above, often result in the actual quantities of natural gas and oil we ultimately recover being different
from our reserve estimates.
36
The present value of future net cash flows from our proved reserves is not necessarily the same as the current market value of
our estimated natural gas and oil reserves. We base the estimated discounted future net cash flows from our proved reserves on
historical prices and costs. However, actual future net cash flows from our natural gas and oil properties also will be affected by
factors such as:
actual prices we receive for natural gas and oil;
the amount and timing of actual production;
the amount and timing of our capital expenditures;
the amount and timing of our capital expenditures; and
changes in governmental regulations or taxation.
The timing of both our production and incurrence of expenses in connection with the development and production of natural gas
and oil properties will affect the timing of actual future net cash flows from proved reserves, and thus their actual present value. In
addition, the 10% discount factor we use when calculating discounted future net cash flows may not be the most appropriate discount
factor based on interest rates in effect from time to time and risks associated with us or the natural gas and oil industry in general.
Any significant variance in our assumptions could materially affect the quantity and value of reserves, the amount of
standardized measure, and our financial condition and results of operations. In addition, our reserves or standardized measure may be
revised downward or upward based upon production history, results of future exploitation and development activities, prevailing
natural gas and oil prices and other factors. A material decline in prices paid for our production can reduce the estimated volumes of
our reserves because the economic life of our wells could end sooner. Similarly, a decline in market prices for natural gas or oil may
reduce our standardized measure.
Hedging transactions may limit our potential gains or cause us to lose money.
Pricing for natural gas, NGLs and oil has been volatile and unpredictable for many years. To limit exposure to changing natural
gas and oil prices, we may use financial hedges and physical hedges for our production. Physical hedges are not deemed hedges for
accounting purposes because they require firm delivery of natural gas and oil and are considered normal sales of natural gas and oil.
We general limit these arrangements to smaller quantities than those we project to be available at any delivery point.
In addition, we may enter into financial hedges, which may include purchases of regulated NYMEX futures and options
contracts and non-regulated over-the-counter futures contracts with qualified counterparties in compliance with the Dodd-Frank Wall
Street Reform and Consumer Protection Act. The futures contracts are commitments to purchase or sell natural gas and oil at future
dates and generally cover one-month periods for up to six years in the future. The over-the-counter derivative contracts are typically
cash settled by determining the difference in financial value between the contract price and settlement price and do not require
physical delivery of hydrocarbons.
These hedging arrangements may reduce, but will not eliminate, the potential effects of changing commodity prices on our cash
flow from operations for the periods covered by these arrangements. Furthermore, while intended to help reduce the effects of volatile
commodity prices, such transactions, depending on the hedging instrument used, may limit our potential gains if commodity prices
were to rise substantially over the price established by the hedge. In addition, these arrangements expose us to risks of financial loss in
a variety of circumstances, including when:
a counterparty is unable to satisfy its obligations;
production is less than expected; or
there is an adverse change in the expected differential between the underlying price in the derivative instrument and actual
prices received for our production.
In addition, it is not always possible for us to engage in a derivative transaction that completely mitigates our exposure to
commodity prices and interest rates. Our financial statements may reflect a gain or loss arising from an exposure to commodity prices
and interest rates for which we are unable to enter into a completely effective hedge transaction.
The failure by counterparties to our derivative risk management activities to perform their obligations could have a material
adverse effect on our results of operations.
The use of derivative risk management transactions involves the risk that the counterparties will be unable to meet the financial
terms of such transactions. If any of these counterparties were to default on its obligations under our derivative arrangements, such a

37
default could have a material adverse effect on our results of operations, and could result in a larger percentage of our future
production being subject to commodity price changes.
Due to the accounting treatment of derivative contracts, increases in prices for natural gas, crude oil and NGLs could result in
non-cash balance sheet reductions and non-cash losses in our statement of operations.
We account for our derivative contracts by applying the mark-to-market accounting treatment required for these derivative
contracts. We could recognize incremental derivative liabilities between reporting periods resulting from increases or decreases in
reference prices for natural gas, crude oil and NGLs, which could result in us recognizing a non-cash loss in our combined statements
of operations and a consequent non-cash decrease in our equity between reporting periods. Any such decrease could be substantial. In
addition, we may be required to make cash payments upon the termination of any of these derivative contracts.
Regulations adopted by the Commodities Futures Trading Commission could have an adverse effect on our ability to use derivative
instruments to reduce the effect of commodity price, interest rate and other risks associated with our business.
The ongoing implementation of derivatives legislation adopted by the U.S. Congress could have an adverse effect on our ability
to use derivative instruments to reduce the effect of commodity price, interest rate and other risks associated with our business. The
Dodd-Frank Act, among other provisions, establishes federal oversight and regulation of the over-the-counter derivatives market and
entities that participate in that market. The legislation requires the Commodities Futures Trading Commission, or CFTC, and the SEC
to promulgate rules and regulations implementing the new legislation. The CFTC finalized many of the regulations associated with the
reform legislation, and is in the process of implementing position limits for certain futures and option contracts in the major energy
markets and for swaps that are their economic equivalents. The CFTC recently adopted final rules establishing margin requirements
for uncleared swaps entered by swap dealers, major swap participants and financial end users (though non-financial end users are
excluded from margin requirements). While, as a non-financial end user, we are not subject to margin requirements, application of
these requirements to our counterparties could affect the cost and availability of swaps we use for hedging. The financial reform
legislation may also require the counterparties to our derivative instruments to spin off some of their derivatives activities to separate
entities, which may not be as creditworthy as the current counterparties.
The new legislation and any new regulations could significantly increase the cost of derivative contracts; materially alter the
terms of derivative contracts; reduce the availability of derivatives to protect against risks we encounter; reduce our ability to monetize
or restructure our derivative contracts in existence at that time; and increase our exposure to less creditworthy counterparties. If we
reduce or change the way we use derivative instruments as a result of the legislation or regulations, our results of operations may
become more volatile and cash flows may be less predictable, which could adversely affect our ability to plan for and fund capital
expenditures. Finally, the legislation was also intended, in part, to reduce the volatility of oil and natural gas prices, which some
legislators attributed to speculative trading in derivatives and commodity instruments related to oil and natural gas. Our revenues
could therefore be adversely affected if a consequence of the legislation and regulations is to lower commodity prices. Any of these
consequences could have a material adverse effect on our consolidated financial position, results of operations and/or cash flows.
Any acquisitions we complete are subject to substantial risks that could adversely affect our financial condition and results of
operations and reduce our ability to make distributions to unitholders.
Any acquisition involves potential risks, including, among other things:
the validity of our assumptions about reserves, future production, revenues, capital expenditures and operating costs;
an inability to successfully integrate the businesses we acquire;
a decrease in our liquidity by using a portion of our available cash or borrowing capacity under our revolving credit
facility to finance acquisitions;
a significant increase in our interest expense or financial leverage if we incur additional debt to finance acquisitions;
the assumption of unknown environmental or title and other liabilities, losses or costs for which we are not indemnified or
for which our indemnity is inadequate;
the diversion of management’s attention from other business concerns and increased demand on existing personnel;
the incurrence of other significant charges, such as impairment of oil and natural gas properties, goodwill or other
intangible assets, asset devaluation or restructuring charges;
unforeseen difficulties encountered in operating in new geographic areas; and
38
the loss of key purchasers of our production; and
the failure to realize expected growth or profitability.
Our decision to acquire oil and natural gas properties depends in part on the evaluation of data obtained from production reports
and engineering studies, geophysical and geological analyses, seismic data and other information, the results of which are often
inconclusive and subject to various interpretations. The scope and cost of the above risks may be materially greater than estimated at
the time of the acquisition. Further, our future acquisition costs may be higher than those we have achieved historically. Any of these
factors could adversely affect our future growth and the ability to pay distributions.
We may be unsuccessful in integrating the operations from any future acquisitions with our operations and in realizing all of the
anticipated benefits of these acquisitions.
The integration of previously independent operations can be a complex, costly and time-consuming process. The difficulties of
combining these systems, as well as any operations we may acquire in the future, include, among other things:
operating a significantly larger combined entity;
the necessity of coordinating geographically disparate organizations, systems and facilities;
integrating personnel with diverse business backgrounds and organizational cultures;
consolidating operational and administrative functions;
integrating internal controls, compliance under Sarbanes-Oxley Act of 2002 and other corporate governance matters;
the diversion of management’s attention from other business concerns;
customer or key employee loss from the acquired businesses;
a significant increase in our indebtedness; and
potential environmental or regulatory liabilities and title problems.
Costs incurred and liabilities assumed in connection with an acquisition and increased capital expenditures and overhead costs
incurred to expand our operations could harm our business or future prospects, and result in significant decreases in our gross margin
and cash flows.
Our acquisitions may prove to be worth less than we paid, or provide less than anticipated proved reserves, because of uncertainties
in evaluating recoverable reserves, well performance, and potential liabilities as well as uncertainties in forecasting oil and natural
gas prices and future development, production and marketing costs.
Successful acquisitions require an assessment of a number of factors, including estimates of recoverable reserves, development
potential, well performance, future oil and natural gas prices, operating costs and potential environmental and other liabilities. Our
estimates of future reserves and estimates of future production for our acquisitions are initially based on detailed information furnished
by the sellers and subject to review, analysis and adjustment by our internal staff, typically without consulting independent petroleum
engineers. Such assessments are inexact and their accuracy is inherently uncertain; our proved reserves estimates may thus exceed
actual acquired proved reserves. In connection with our assessments, we perform a review of the acquired properties that we believe is
generally consistent with industry practices. However, such a review will not reveal all existing or potential problems. In addition, our
review may not permit us to become sufficiently familiar with the properties to fully assess their deficiencies and capabilities. We do
not inspect every well. Even when we inspect a well, we do not always discover structural, subsurface and environmental problems
that may exist or arise. As a result of these factors, the purchase price we pay to acquire oil and natural gas properties may exceed the
value we realize.
Also, our reviews of acquired properties are inherently incomplete because it is generally not feasible to perform an in-depth
review of the individual properties involved in each acquisition given the time constraints imposed by the applicable acquisition
agreement. Even a detailed review of records and properties may not necessarily reveal existing or potential problems, nor would it
necessarily permit a buyer to become sufficiently familiar with the properties to fully assess their deficiencies and potential.
39
Acquired properties may not produce as projected and we may be unable to determine reserve potential, identify liabilities
associated with the properties or obtain protection from sellers against such liabilities.
One of our growth strategies is to capitalize on opportunistic acquisitions of natural gas reserves. However, reviews of acquired
properties are often incomplete because it generally is not feasible to review in depth every individual property involved in each
acquisition. A detailed review of records and properties also may not necessarily reveal existing or potential problems, and may not
permit a buyer to become sufficiently familiar with the properties to assess fully their deficiencies and potential. Inspections may not
always be performed on every well that we acquire. Potential problems, such as deficiencies in the mechanical integrity of equipment
or environmental conditions that may require significant remedial expenditures, are not necessarily observable even when we inspect a
well. Any unidentified problems could result in material liabilities and costs that negatively affect our financial condition and results
of operations.
Even if we are able to identify problems with an acquisition, the seller may be unwilling or unable to provide effective
contractual protection or indemnity against all or part of these problems. Even if a seller agrees to provide indemnity, the indemnity
may not be fully enforceable and may be limited by floors and caps on such indemnity.
We may not identify all risks associated with the acquisition of oil and natural gas properties, or existing wells, and any
indemnifications we receive from sellers may be insufficient to protect us from such risks, which may result in unexpected
liabilities and costs to us.
Our business strategy focuses on acquisitions of undeveloped oil and natural gas properties that we believe are capable of
production. We have acquired and may make additional acquisitions of undeveloped oil and gas properties from time to time, subject
to available resources. Any future acquisitions will require an assessment of recoverable reserves, title, future oil and natural gas
prices, operating costs, potential environmental hazards, potential tax and other liabilities and other factors. Generally, it is not feasible
for us to review in detail every individual property involved in a potential acquisition. In making acquisitions, we generally focus most
of our title, environmental and valuation efforts on the properties that we believe to be more significant, or of higher-value. Even a
detailed review of properties and records may not reveal all existing or potential problems, nor would it permit us to become
sufficiently familiar with the properties to assess fully their deficiencies and capabilities. In addition, we do not inspect in detail every
well that we acquire. Potential problems, such as deficiencies in the mechanical integrity of equipment or environmental conditions
that may require significant remedial expenditures, are not necessarily observable even when we perform a detailed inspection. Any
unidentified problems could result in material liabilities and costs that negatively impact our financial condition and results of
operations.
Even if we are able to identify problems with an acquisition, the seller may be unwilling or unable to provide effective
contractual protection or indemnity against all or part of these problems. Even if a seller agrees to provide indemnity, the indemnity
may not be fully enforceable or may be limited by floors and caps, and the financial wherewithal of such seller may significantly limit
our ability to recover our costs and expenses. Any limitation on our ability to recover the costs related any potential problem could
materially impact our financial condition and results of operations.
Any production associated with the assets acquired in the Rangely Acquisition will decline if the operator’s access to sufficient
amounts of carbon dioxide is limited.
Production associated with the assets we acquired in the Rangely Acquisition is dependent on CO2 tertiary recovery operations
in the Rangely Field. The crude oil and NGL production from these tertiary recovery operations depends, in large part, on having
access to sufficient amounts of CO2. The ability to produce oil and NGLs from these assets would be hindered if the supply of CO2 was
limited due to, among other things, problems with the Rangely Field’s current CO2 producing wells and facilities, including
compression equipment, or catastrophic pipeline failure. Any such supply limitation could have a material adverse effect on the results
of operations and cash flows associated with these tertiary recovery operations. Our anticipated future crude oil and NGL production
from tertiary operations is also dependent on the timing, volumes and location of CO2 injections and, in particular, on the operator’s
ability to increase its combined purchased and produced volumes of CO2 and inject adequate amounts of CO2 into the proper formation
and area within the Rangely Field.
Ownership of our oil, gas and natural gas liquids production depends on good title to our property.
Good and clear title to our oil and gas properties is important. Although we will generally conduct title reviews before the
purchase of most oil, gas, natural gas liquids and mineral producing properties or the commencement of drilling wells, such reviews
do not assure that an unforeseen defect in the chain of title will not arise to defeat our claim, which could result in a reduction or
elimination of the revenue received by us from such properties.
40
Conservation measures and technological advances could reduce demand for oil and natural gas.
Fuel conservation measures, alternative fuel requirements, increasing consumer demand for alternatives to oil and natural gas,
technological advances in fuel economy and energy generation devices could reduce demand for oil and natural gas. The impact of the
changing demand for oil and natural gas services and products may have a material adverse effect on our business, financial condition,
results of operations and cash available for distribution.
Federal and state legislative and regulatory initiatives relating to hydraulic fracturing could result in increased costs and
additional operating restrictions or delays.
Hydraulic fracturing is used to stimulate production of hydrocarbons, particularly natural gas, from tight formations. The
process involves the injection of water, sand and chemicals under pressure into formations to fracture the surrounding rock and
stimulate production. The process is typically regulated by state oil and natural gas commissions or by state environmental agencies.
Some states have adopted, and other states are considering adopting, regulations that could restrict hydraulic fracturing in
certain circumstances. For example:
On December 17, 2014, New York Governor Andrew Cuomo’s administration said it would ban hydraulic fracturing for
shale gas development throughout the state. Dr. Howard Zucker, the Acting Commissioner of Health, announced that the
state Department of Health completed its long-awaited public health review report, which recommended prohibiting
hydraulic fracturing in New York. Dr. Zucker cited significant uncertainties regarding risks to public health in concluding
that hydraulic fracturing should not proceed in New York until more research is completed. On June 29, 2015 the New
York State Department of Environmental Conservation officially prohibited hydraulic fracturing in New York State by
issuing its legally-binding Findings Statement. According to the Findings Statement, the Department of Conservation
concluded that “there are no feasible or prudent alternatives that would adequately avoid or minimize adverse
environmental impacts and that address the scientific uncertainties and risks to public health” associated with hydraulic
fracturing.
Pennsylvania has adopted a variety of regulations limiting how and where fracturing can be performed. On February 14,
2012, legislation was passed in Pennsylvania requiring, among other things, disclosure of chemicals used in hydraulic
fracturing. We refer to this legislation as the “2012 Oil and Gas Act.” To implement the new legislative requirements, on
December 14, 2013 the Pennsylvania Department of Environmental Protection, which we refer to as PADEP, proposed
amendments to its environmental regulations at 25 Pa. Code Chapter 78, Subchapter C, pertaining to environmental
protection performance standards for surface activities at oil and gas well sites. Pursuant to a legislative bill that passed in
July 2014 as a companion to Pennsylvania’s budget for 2014 to 2015, PADEP bifurcated its proposed 25 Pa. Code
Chapter 78 regulations into two parts. . As proposed, 25 Pa. Code Chapter 78 will apply to conventional wells and 25 Pa.
Code Chapter 78A will apply to unconventional wells. On January 6, 2016, PADEP released a final-form rulemaking
package of the Chapters 78 and 78a amendments. PADEP identified the key provisions of the final-form rulemaking
package to include, but not be limited to, new requirements for operators to address potential impacts to public resources,
as well as requirements for operators to identify and monitor abandoned, orphaned and inactive wells prior to hydraulic
fracturing. It will also mandate new containment practices and protection water resources, which includes rules for
operator response to spill and remediation, and many other changes that will impact our operations. Pennsylvania’s
Environmental Quality Board is scheduled to meet February 3, 2016 to consider the proposed rulemakings, and PADEP
anticipates that the final form rulemaking will likely be finalized in early summer 2016. Additionally, PADEP announced
in June 2014 that it also intends to propose amendments to its present environmental regulations at 25 Pa. Code Chapter
78, Subchapters D (relating to well drilling, operation and plugging) and H (relating to underground gas storage). It is
anticipated that these proposed amendments will be released in 2016. In January 2015, PADEP issued the results of its
Technologically Enhanced Naturally Occurring Radioactive Materials Study, which analyzed levels of radioactivity
associated with oil and gas development in Pennsylvania. Initiated in January 2013, the study evaluated radioactivity
levels in flowback waters, treatment solids, and drill cuttings, in addition to the transportation, storage and disposal of
these materials. According to the study, PADEP concluded that there is little potential for harm to workers or the public
from radiation exposure due to oil and gas development, as well as provided recommendations for further study to be
conducted.

41
Ohio has in recent years expanded its oil and gas regulatory program. In June 2012, Ohio passed legislation that made
several significant amendments to the state’s oil and gas laws, including additional permitting requirements, chemical
disclosure requirements, and site investigation requirements for horizontal wells. In June 2013, legislation was adopted
imposing sampling requirements and disposal restrictions on certain drilling wastes containing naturally occurring
radioactive material and requiring the state regulatory authority to adopt rules on the design and operation of facilities that
store, recycle, or dispose of brine or other oil and natural gas related waste materials. In July 2015, the regulatory
authority adopted rules imposing detailed construction standards on well pads, and in April 2014, Ohio announced new
standard drilling permit conditions to address concerns regarding seismic activity in certain parts of the state.
For wells spudded January 1, 2014 and after, the Texas Railroad Commission adopted new rules regarding well casing,
cementing, drilling, completion and well control for ensuring hydraulic fracturing operations do not contaminate nearby
water resources. Recent Railroad Commission rules and regulations focus on prevention of waste, as evidenced by
regulations relating to the commercial recycling of produced water and/or hydraulic fracturing flowback fluid approved in
September 2012, and more stringent permitting for venting/flaring of casinghead gas and gas well gas beginning in
January 2014.
A West Virginia rule that became effective July 1, 2013 imposes more stringent regulation of horizontal drilling and was
promulgated to provide further direction in the implementation and administration of the Natural Gas Horizontal Well
Control Act that became effective on December 14, 2011. In 2014, West Virginia revised its solid waste regulations to
allow landfills to increase their tonnage limits specifically for natural gas drilling wastes, along with requiring more
stringent controls and radiation testing of landfills located in the state.
In addition to state law, local land use restrictions, such as municipal ordinances, may restrict or prohibit the performance of
well drilling in general and/or hydraulic fracturing in particular. Recent changes regarding local land use restrictions in Pennsylvania
occurred because of decisions of the Pennsylvania Supreme and Commonwealth Courts. On December 19, 2013, when the
Pennsylvania Supreme Court issued its Robinson Township v. Commonwealth of Pennsylvania ruling, which invalidated key sections
of the 2012 Oil and Gas Act that placed limits on the regulatory authority of local governments. Additionally, the Pennsylvania
Supreme Court remanded a number of issues to the Commonwealth Court for further decision. On July 17, 2014, the Commonwealth
Court ruled on the remanded issues. The cumulative effect of the Supreme and Commonwealth Court rulings is that all of the
challenged provisions relating to local ordinances contained in the 2012 Oil and Gas Act are invalid, except for the definitions section
and most of the updated preemption language in the 2012 Oil and Gas Act that was included from the previous 1984 Oil and Gas Act.
The total impact of these rulings in Robinson Township, which is ongoing before the Supreme Court, are not clear and will occur over
an extended period of time. An immediate impact of the rulings has been increased regulatory impediments and disputes at the local
government level, as well as validity challenges initiated by private landowners alleging that local ordinances do not adequately
protect health, safety, and welfare. Additionally, there is a pending challenge by an industry association regarding the Robinson
Township decision and PADEP’s use of its Public Resources Form and Pennsylvania Natural Diversity Index Policy based on a
provision of the 2012 Oil and Gas Act (58 C.S. § 3215(c)). The petitioner is seeking a declaration from the Supreme Court that
PADEP is enjoined from application and enforcement of that provision pursuant to the Court’s Robinson Township ruling.
On June 30, 2014, the New York Court of Appeals issued its opinion in Wallach v. Town of Dryden affirming local zoning laws
adopted by two upstate municipalities that prohibited oil and gas-related activities within their borders. Specifically, the Court of
Appeals ruled that there was nothing within the plain language, statutory scheme and legislative history of the New York Oil, Gas and
Solution Mining Law that manifested an intent by the legislature to preempt a municipality’s home rule authority to regulate land use.
On October 16, 2014, the New York Court of Appeals denied a request by the petitioner – the bankruptcy trustee for Norse Energy –
to re-hear arguments in the case. If state, local or municipal legal restrictions are adopted in areas where we are currently conducting,
or in the future plan to conduct operations, we may incur additional costs to comply with such requirements that may be significant in
nature, experience delays or curtailment in the pursuit of exploration, development, or production activities, and perhaps even be
precluded from the drilling of wells. Generally, Federal, state and local restrictions and requirements are applied consistently to
similar types of producers (e.g., conventional, unconventional, etc.), regardless of size of the producing company.
Although, to date, the hydraulic fracturing process has not generally been subject to regulation at the federal level, there are
certain governmental reviews either under way or being proposed that focus on environmental aspects of hydraulic fracturing
practices, and some federal regulation has taken place. A few of these initiatives are listed here, although others may exist now or be
implemented in the future. In April 2012, President Obama established an Interagency Working Group to Support Safe and
Responsible Development of Unconventional Domestic Natural Gas Resources with the purpose of coordinating the policies and
activities of agencies regarding unconventional gas development. The United States Environmental Protection Agency (the “EPA”)
has asserted federal regulatory authority over certain hydraulic fracturing activities involving diesel fuel as an additive under the Safe
Drinking Water Act. In May 2012, the EPA issued draft permitting guidance for oil and gas hydraulic fracturing activities using diesel
fuel. In February 2014, the EPA released its revised final guidance document on Safe Drinking Water Act underground injection
control permitting for hydraulic fracturing using diesel fuels, along with responses to selected substantive public comments on the

42
EPA’s previous draft guidance, a fact sheet and a memorandum to the EPA’s regional offices regarding implementation of the
guidance. The process for implementing the EPA’s final guidance document may vary across the states depending on the regulatory
authority responsible for implementing the Safe Drinking Water Act underground injection control program in each state.
Furthermore, a number of federal agencies are analyzing, or have been requested to review, a variety of environmental issues
associated with hydraulic fracturing. For example, the EPA is currently studying the potential impacts of hydraulic fracturing on
drinking water and groundwater, and, in fact, released a Draft Assessment on June 4, 2015.
In 2013, the EPA indicated that it intended to propose a draft water quality criteria document that would update the aquatic life
water quality criteria for chloride by the summer of 2014. However, the EPA has yet to propose the draft water quality criteria
document and it has not provided an updated timeframe for the proposal. On April 7, 2015, the EPA published its “Effluent
Limitations Guidelines and Standards for the Oil and Gas Extraction Point Source Category” in the Federal Register, and accepted
comments through July 17, 2015. As proposed, the regulations would establish pretreatment standards for discharges of wastewater
pollutants from onshore unconventional oil and gas extractive facilities to publicly-owned treatment works. The EPA has proposed
pretreatment standards for existing and new sources that would prohibit the indirect discharge of wastewater pollutants associated with
onshore unconventional gas extraction facilities. Additionally, the EPA published its “Final 2014 Effluent Guidelines Program Plan”
on August 4, 2015 and confirmed its schedule for the aforementioned ongoing unconventional oil and gas extraction effluent guideline
rulemaking, as well as announced a final decision to continue its detailed study to investigate centralized waste treatment facilities that
accept oil and gas extraction wastewaters. On May 11, 2012, the U.S. Department of the Interior, Bureau of Land Management
published a proposed rule that includes provisions requiring disclosure of chemicals used in hydraulic fracturing and construction standards
for hydraulic fracturing on federal and Indian lands. On May 24, 2013, the Bureau of Land Management published a revised proposed rule to
regulate hydraulic fracturing on federal and Indian lands. On March 26, 2015, BLM issued a final rule updating the regulations governing
hydraulic fracturing on federal and Indian lands that was set to go into effect on June 24, 2015. Subsequently on June 23, 2015 in a
lawsuit filed by several states and industry associations before the U.S. District Court for the District of Wyoming (State of Wyoming
v. Dep't of Interior, No. 2:15-cv-00043), a stay of the effective date of the BLM’s pending rule was lodged. The petitioners
specifically requested that Court grant a preliminary injunction of the final rule and, on September 30, 2015, the U.S. District Court
granted the preliminary injunction thereby enjoining the final rule.
Certain members of the U.S. Congress have called upon the U.S. Government Accountability Office to investigate how
hydraulic fracturing might adversely affect water resources, and Congress has asked the SEC to investigate the natural gas industry
and any possible misleading of investors or the public regarding the economic feasibility of pursuing natural gas deposits in shales by
means of hydraulic fracturing. In addition, Congress requested the U.S. Energy Information Administration to provide a better
understanding of that agency’s estimates regarding natural gas reserves, including reserves from shale formations, as well as
uncertainties associated with those estimates. On December 16, 2013, the U.S. Energy Information Administration published an
abridged version of its Annual Energy Outlook 2014 with projections to 2040 report, with the full report released on May 7, 2014. A
subsequent Annual Energy Outlook 2015 was released on April 14, 2015, with the next coming June 2016. These ongoing proposed
studies, depending on their degree of pursuit and any meaningful results obtained, could result in initiatives to further regulate
hydraulic fracturing under the Safe Drinking Water Act or one or more other regulatory mechanisms. If new laws or regulations that
significantly restrict hydraulic fracturing are adopted at the state and local level, such laws could make it more difficult or costly for us
to perform hydraulic fracturing to stimulate production from dense subsurface rock formations and, in the event of local prohibitions
against commercial production of natural gas, may preclude our ability to drill wells. In addition, if hydraulic fracturing becomes
regulated at the federal level as a result of federal legislation or regulatory initiatives by the EPA or other federal agencies, our
fracturing activities could be significantly affected.
Some of the potential effects of changes in Federal, state or local regulation of hydraulic fracturing operations could include the
following:
additional permitting requirements and permitting delays;
increased costs;
changes in the way operations, drilling and/or completion must be conducted;
increased recordkeeping and reporting; and
restrictions on the types of additives that can be used.
Restrictions on hydraulic fracturing could also reduce the amount of oil and natural gas that we are ultimately able to produce
from our reserves.
43
Climate change laws and regulations restricting emissions of “greenhouse gases” could result in increased operating costs and
reduced demand for the natural gas, while potential physical effects of climate change could disrupt our operations and cause us
to incur significant costs in preparing for or responding to those effects.
In response to findings that emissions of carbon dioxide, methane and other greenhouse gases present an endangerment to public
health and the environment, the EPA has adopted regulations under existing provisions of the federal Clean Air Act that, among other
things, establish Prevention of Significant Deterioration construction and Title V operating permit reviews for certain large stationary
sources that are potential major sources of greenhouse gas emissions. Facilities required to obtain Prevention of Significant
Deterioration permits because of their potential criteria pollutant emissions may be required to comply with “best available control
technology” standards for greenhouse gases. These regulations could adversely affect our operations and restrict or delay our ability to
obtain air permits for new or modified sources.
While Congress has from time to time considered legislation to reduce emissions of greenhouse gases, there has not been
significant activity in the form of adopted legislation to reduce greenhouse gas emissions at the federal level in recent years. In the
absence of such federal climate legislation, a number of state and regional efforts have emerged that are aimed at tracking and/or
reducing greenhouse gas emissions by means of cap and trade programs that typically require major sources of greenhouse gas
emissions, such as electric power plants, to acquire and surrender emission allowances in return for emitting those greenhouse gases.
In addition, the Obama Administration announced its Climate Action Plan in 2013, which, among other things, directs federal
agencies to develop a strategy for the reduction of methane emissions, including emissions from the oil and gas industry. The Obama
Administration announced a formal methane reduction strategy in January 2015, and is taking actions to implement the strategy (see
“Item 1. Business- Environmental Matters and Regulation - Greenhouse Gas Regulation and Climate Change”). Although it is not
possible at this time to predict how legislation or new regulations that may be adopted to address greenhouse gas emissions would
impact our business, any such future laws and regulations imposing reporting obligations on, or limiting emissions of greenhouse
gases from, our equipment and operations could require us to incur costs to reduce emissions of greenhouse gases associated with our
operations.
Finally, it should be noted that some scientists have concluded that increasing concentrations of greenhouse gases in the Earth’s
atmosphere may produce climate changes that have significant physical effects, such as increased frequency and severity of storms,
floods and other climatic events; if any such effects were to occur, they could have an adverse effect on our operations.
Rules regulating air emissions from oil and natural gas operations could cause us to incur increased capital expenditures and
operating costs.
In 2012, the EPA established the NSPS rule for oil and natural gas production, transmission, and distribution, and also made
significant revisions to the existing National Emission Standards for Hazardous Air Pollutants (“NESHAP”) rules for oil and natural
gas production, transmission, and storage facilities. These rules require oil and natural gas production facilities to conduct “green
completions” for hydraulic fracturing, which is recovering rather than venting the gas and natural gas liquids that come to the surface
during completion of the fracturing process. The rules also establish specific requirements regarding emissions from compressors,
dehydrators, storage tanks and other production equipment. Both the NSPS and NESHAP rules continue to evolve based on new
information and changing environmental concerns. The NSPS rule was most recently revised in August 2015, 80 Fed. Reg. 48262
(Aug. 12, 2015), and it will be revised again when the EPA finalizes the rulemaking to implement the national methane reduction
strategy (see “Item 1. Business- Environmental Matters and Regulation - Greenhouse Gas Regulation and Climate Change”). In
November 2015, the EPA issued a formal request for data and information which suggests that the agency may revise the NESHAP
rules in the near future. In addition to these EPA rules, BLM released a proposed rule in January 2016 to reduce oil and gas industry
emissions and minimize waste of produced gas from Federal and Indian leases.
States are also proposing increasingly stringent requirements for air pollution control and permitting for well sites and
compressor stations. For example, in January 2016, the Governor of Pennsylvania announced a comprehensive new regulatory
strategy for reducing methane emissions from new and existing oil and natural gas operations, including well sites, compressor
stations, and pipelines. Implementation of this strategy will result in significant changes to the air permitting and pollution control
standards that apply to the oil and gas industry in Pennsylvania. It may also influence air programs in other oil and gas-producing
states. Moreover West Virginia issued General Permit 70-A for natural gas production facilities at the well site in 2013. In response
to industry concerns regarding the restrictiveness of the general permit, in November 2015, West Virginia issued General Permit 70-B
which provides more flexibility for emission sources located at the well site.
Overall, compliance with new rules regulating air emissions from our operations could result in significant costs, including
increased capital expenditures and operating costs, and could affect the results of our business.
44
The third parties on whom we rely for gathering and transportation services are subject to complex federal, state and other laws
that could adversely affect the cost, manner or feasibility of conducting our business.
The operations of the third parties on whom we rely for gathering and transportation services are subject to complex and
stringent laws and regulations that require obtaining and maintaining numerous permits, approvals and certifications from various
federal, state and local government authorities. These third parties may incur substantial costs in order to comply with existing laws
and regulation. If existing laws and regulations governing such third-party services are revised or reinterpreted, or if new laws and
regulations become applicable to their operations, these changes may affect the costs that we pay for such services. Similarly, a failure
to comply with such laws and regulations by the third parties on whom we rely could have a material adverse effect on our business,
financial condition, results of operations and our ability to make distributions to our unitholders.
Our drilling and production operations require adequate sources of water to facilitate the fracturing process and the disposal of
flowback and produced water. If we are unable to dispose of the flowback and produced water from the strata at a reasonable cost
and within applicable environmental rules, our ability to produce gas economically and in commercial quantities could be
impaired.
A significant portion of our natural gas extraction activity utilizes hydraulic fracturing, which results in water that must be treated and
disposed of in accordance with applicable regulatory requirements. Environmental regulations governing the withdrawal, storage and use of
surface water or groundwater necessary for hydraulic fracturing may increase operating costs and cause delays, interruptions or termination
of operations, the extent of which cannot be predicted, all of which could have an adverse effect on our operations and financial performance.
For example, Pennsylvania’s 2012 Oil and Gas Act requires the development, submission and approval of a water management plan before
withdrawing or using water from water sources in Pennsylvania to drill or hydraulically fracture an unconventional well. The requirements of
these plans continue to be modified by proposed amendments to state regulations and agency policies and guidance. For Pennsylvania
operations located in the Susquehanna River Basin, the Susquehanna River Basin Commission regulates consumptive water uses, water
withdrawals, and the diversions of water into and out of the Susquehanna River Basin, and specific approvals are required prior to initiating
drilling activities. In June 2012, Ohio passed legislation that established a water withdrawal and consumptive use permit program in the Lake
Erie watershed. If certain withdrawal thresholds are triggered due to water needs for a particular project, we will be required to develop a
Water Conservation Plan and obtain a withdrawal permit for that project. West Virginia also requires that if a certain amount of water is
withdrawn water management plans are required and/or registration and reporting requirements are triggered.
Our ability to collect and dispose of flowback and produced water will affect our production, and potential increases in the cost
of wastewater treatment and disposal may affect our profitability. The imposition of new environmental initiatives and regulations
could include restrictions on our ability to conduct hydraulic fracturing or disposal of wastewater, drilling fluids and other substances
associated with the exploration, development and production of gas and oil. For example, in July 2012, the Ohio Department of
Natural Resources promulgated amendments to the regulations governing disposal wells in Ohio. The rules provide the Department of
Natural Resources with the authority to require certain testing as part of the process for obtaining a permit for the underground
injection of produced water, and require all new disposal wells to be equipped with continuous pressure monitors and automatic shut
off devices.
Impact fees and severance taxes could materially increase our liabilities.
In an effort to offset budget deficits and fund state programs, many states have imposed impact fees and/or severance taxes on
the natural gas industry. In February 2012, the Commonwealth of Pennsylvania enacted an “impact fee” on unconventional natural gas
and oil production which includes the Marcellus Shale. The impact fee is based upon the year a well is spudded and varies, like most
severance taxes, based upon natural gas prices. For the year ended December 31, 2015, we estimated that the impact fee for our wells,
including the wells in our Drilling Partnerships will approximately $643,000. This is compared to an impact fee of approximately
$1.0 million for the year ended December 31, 2014, an impact fee of approximately $1.7 million for the year ended December 2013
and an impact fee of approximately $2.0 for year ended December 31, 2012.
Because we handle natural gas, natural gas liquids and oil, we may incur significant costs and liabilities in the future resulting
from a failure to comply with new or existing environmental regulations or an accidental release of substances into the
environment.
How we plan, design, drill, install, operate and abandon natural gas wells and associated facilities are matters subject to
stringent and complex federal, state and local environmental laws and regulations. These include, for example:
The federal Clean Air Act and comparable state laws and regulations that impose obligations related to air emissions;
The federal Clean Water Act and comparable state laws and regulations that impose obligations related to spills, releases,
streams, wetlands and discharges of pollutants into regulated bodies of water;

45
The federal Resource Conservation and Recovery Act (“RCRA”) and comparable state laws that impose requirements for
the handling and disposal of waste, including produced waters, from our facilities;
The federal Comprehensive Environmental Response, Compensation, and Liability Act (“CERCLA”) and comparable
state laws that regulate the cleanup of hazardous substances that may have been released at properties currently or
previously owned or operated by us or at locations to which we have sent waste for disposal; and
Wildlife protection laws and regulations such as the Migratory Bird Treaty Act that requires operators to cover reserve
pits during the cleanup phase of the pit, if the pit is open more than 90 days.
Complying with these requirements is expected to increase costs and prompt delays in natural gas production. There can be no
assurance that we will be able to obtain all necessary permits and, if obtained, that the costs associated with obtaining such permits
will not exceed those that previously had been estimated. It is possible that the costs and delays associated with compliance with such
requirements could cause us to delay or abandon the further development of certain properties.
Failure to comply with these laws and regulations may trigger a variety of administrative, civil and criminal enforcement
measures, including the assessment of monetary penalties, the imposition of remedial requirements and the issuance of orders
enjoining future operations. These enforcement actions may be handled by the EPA and/or the appropriate state agency. In some
cases, the EPA has taken a heightened role in enforcement activities targeting the oil and gas extraction sector. For example, in 2011,
the EPA Region III requested the lead on all oil and gas related violations in the United States Army Corps of Engineers’ Pittsburgh
District. The EPA, the United States Army Corps of Engineers’ and the United States Department of Justice have been actively
pursuing instances of unpermitted stream and wetland impacts, particularly for activities occurring in West Virginia. We also
understand that the EPA has taken an increased interest in assessing operator compliance with the Spill Prevention, Control and
Countermeasures regulations, set forth at 40 CFR Part 112.
Certain environmental statutes, including RCRA, CERCLA, the federal Oil Pollution Act and analogous state laws and
regulations, impose strict, joint and several liability for costs required to clean up and restore sites where certain substances have been
disposed of or otherwise released, whether caused by our operations, the past operations of our predecessors or third parties.
Moreover, it is not uncommon for neighboring landowners and other third parties to file claims for personal injury and property
damage allegedly caused by the release of hazardous substances or other waste products into the environment.
There is an inherent risk that we may incur environmental costs and liabilities due to the nature of our business and the
substances we handle. For example, an accidental release from one of our wells could subject us to substantial liabilities arising from
environmental cleanup and restoration costs, claims made by neighboring landowners and other third parties for personal injury and
property damage, and fines or penalties for related violations of environmental laws or regulations. Moreover, the possibility exists
that stricter laws, regulations or enforcement policies may be enacted or adopted and could significantly increase our compliance costs
and the cost of any remediation that may become necessary. We may not be able to recover remediation costs under our respective
insurance policies.
We are subject to comprehensive federal, state, local and other laws and regulations that could increase the cost and alter the
manner or feasibility of us doing business.
Our operations are regulated extensively at the federal, state and local levels. The regulatory environment in which we operate
includes, in some cases, legal requirements for obtaining environmental assessments, environmental impact studies and/or plans of
development before commencing drilling and production activities. In addition, our activities will be subject to the regulations
regarding conservation practices and protection of correlative rights. These regulations affect our operations and limit the quantity of
natural gas and oil we may produce and sell. A major risk inherent in a drilling plan is the need to obtain drilling permits from state
agencies and local authorities. Delays in obtaining regulatory approvals or drilling permits, the failure to obtain a drilling permit for a
well or the receipt of a permit with unreasonable conditions or costs could inhibit our ability to develop our respective properties. The
natural gas and oil regulatory environment could also change in ways that might substantially increase the financial and managerial
costs of compliance with these laws and regulations and, consequently, reduce our profitability. For example, Pennsylvania’s 2012 Oil
and Gas Act imposes significant, costly requirements on the natural gas industry, including the imposition of increased bonding
requirements and impact fees for unconventional gas wells, based on the price of natural gas and the age of the unconventional gas
well. PADEP’s proposed regulatory amendments associated with this legislation, when finalized will affect how natural gas operations
are conducted in Pennsylvania. Moreover, PADEP has indicated that more regulatory amendments are likely to be proposed in 2016. West Virginia has promulgated regulations associated with its existing Horizontal Well Control Act and has developed new
aboveground storage tank laws that are being applied broadly and impose stringent requirements that affect the natural gas industry.
We may be put at a competitive disadvantage to larger companies in the industry that can spread these additional costs over a greater
number of wells and these increased regulatory hurdles over a larger operating staff.
46
We may not be able to continue to raise funds through our Drilling Partnerships at desired levels, which may in turn restrict our
ability to maintain our drilling activity at recent levels.
We sponsor limited and general partnerships to finance certain of our development drilling activities. Accordingly, the amount
of development activities that we will undertake depends in large part upon our ability to obtain investor subscriptions to invest in
these partnerships. We raised $59.3 million, $166.8 million and $150.0 million in 2015, 2014, and 2013, respectively. In the future, we
may not be successful in raising funds through these Drilling Partnerships at the same levels that it experienced, and we also may not
be successful in increasing the amount of funds we raise. Our ability to raise funds through our Drilling Partnerships depends in large
part upon the perception of investors of their potential return on their investment and their tax benefits from investing in them, which
perception is influenced significantly by our historical track record of generating returns and tax benefits to the investors in our
existing partnerships.
In the event that our Drilling Partnerships do not achieve satisfactory returns on investment or the anticipated tax benefits, we
may have difficulty in maintaining or increasing the level of Drilling Partnership fundraising relative to the levels achieved by us. In
this event, we may need to seek financing for our drilling activities through alternative methods, which may not be available, or which
may be available only on a less attractive basis than the financing we realized through these Drilling Partnerships, or we may
determine to reduce drilling activity.
Changes in tax laws may impair our ability to obtain capital funds through Drilling Partnerships.
Under current federal tax laws, there are tax benefits to investing in Drilling Partnerships, including deductions for intangible
drilling costs and depletion deductions. However, both the Obama Administration’s budget proposal for fiscal year 2017 and other
recently introduced legislation include proposals that would, among other things, eliminate or reduce certain key U.S. federal income
tax incentives currently available to oil and natural gas exploration and production companies. These changes include, but are not
limited to, (i) the repeal of the percentage depletion allowance for oil and natural gas properties, (ii) the elimination of current
deductions for intangible drilling and development costs and certain environmental clean-up costs, (iii) the elimination of the
deduction for certain domestic production activities, and (iv) an extension of the amortization period for certain geological and geophysical expenditures. It is unclear whether these or similar changes will be enacted and, if enacted, how soon any such changes
could become effective. The passage of any legislation as a result of these proposals or any other similar changes in U.S. federal
income tax laws could eliminate or postpone certain tax deductions that are currently available with respect to oil and natural gas
exploration and development. The repeal of these oil and gas tax benefits, if it happens, would result in a substantial decrease in tax
benefits associated with an investment in our Drilling Partnerships. These or other changes to federal tax law may make investment in
the Drilling Partnerships less attractive and, thus, reduce our ability to obtain funding from this significant source of capital funds.
Fee-based revenues may decline if we are unsuccessful in sponsoring new Drilling Partnerships.
Our fee-based revenues will be based on the number of Drilling Partnerships we sponsor and the number of partnerships and
wells we manage or operate. If we are unsuccessful in sponsoring future Drilling Partnerships, our fee-based revenues may decline.
Our revenues may decrease if investors in our Drilling Partnerships do not receive a minimum return.
We have agreed to subordinate a portion of our share of production revenues, net of corresponding production costs, to specified
returns to the investor partners in the Drilling Partnerships, typically 10% to 12% per year for the first five to eight years of
distributions. Thus, our revenues from a particular partnership will decrease if we do not achieve the specified minimum return. For
the year ended December 31, 2015, $1.7 million of our revenues, net of corresponding production costs, were subordinated, which
reduced our cash distributions received from the Drilling Partnerships. For the year ended December 31, 2014, the subordinated
amount, net of corresponding production costs, was $5.3 million and for the year ended December 31, 2013, it was $9.6 million.
We or one of our subsidiaries may be exposed to financial and other liabilities as the managing general partner in Drilling
Partnerships.
We or one of our subsidiaries serves as the managing general partner of the Drilling Partnerships and will be the managing
general partner of new Drilling Partnerships that we sponsor. As a general partner, we or one of our subsidiaries will be contingently
liable for the obligations of the partnerships to the extent that partnership assets or insurance proceeds are insufficient. We have agreed
to indemnify each investor partner in the Drilling Partnerships from any liability that exceeds such partner’s share of the Drilling
Partnership’s assets.

47
Our historical financial information may not be representative of the results we would have achieved as a stand-alone public
company and may not be a reliable indicator of our future results.
Some of the historical financial information that we have included in this report may not necessarily reflect what our financial
position, results of operations or cash flows would have been had we been an independent, stand-alone entity during the periods
presented or those that we will achieve in the future. The general and administrative expenses reflected in the financial statements for
Atlas Energy E&P Operations include an allocation for certain corporate functions historically provided by Atlas Energy, Inc. These
allocations were based on what we and Atlas Energy, Inc. considered to be reasonable reflections of the historical utilization levels of
these services required in support of the business. We have not adjusted the historical financial statements for Atlas Energy E&P
Operations to reflect changes that occurred in our cost structure and operations as a result of our transition to becoming a stand-alone
public company. Therefore, the financial statements of Atlas E&P Operations and our historical financial information may not
necessarily be indicative of what our financial position, results of operations or cash flows will be in the future.
A cyber incident or a terrorist attacks could result in information theft, data corruption, operational disruption and/or financial
loss.
We have become increasingly dependent upon digital technologies, including information systems, infrastructure and cloud
applications and services, to operate our businesses, to process and record financial and operating data, communicate with our
employees and business partners, analyze seismic and drilling information, estimate quantities of oil and gas reserves, as well as other
activities related to our businesses. Strategic targets, such as energy-related assets, may be at greater risk of future cyber or terrorist
attacks than other targets in the United States. Deliberate attacks on, or security breaches in our systems or infrastructure, or the
systems or infrastructure of third parties or the cloud, could lead to corruption or loss of our proprietary data and potentially sensitive
data, delays in production or delivery, challenges in maintaining our books and records and other operational disruptions and third
party liability. Our insurance may not protect us against such occurrences. Consequently, it is possible that any of these occurrences,
or a combination of them, could have a material adverse effect on our business, financial condition and results of operations. Further,
as cyber incidents continue to evolve, we may be required to expend additional resources to continue to modify or enhance our
protective measures or to investigate and remediate any vulnerability to cyber incidents.
Risks Relating to the Ownership of Our Units
If prices of our common and/or preferred units decline, our unitholders could lose a significant part of their investment.
The market price of our units could be subject to wide fluctuations in response to a number of factors, most of which we cannot
control, including:
changes in securities analysts’ recommendations and their estimates of our financial performance;
the public’s reaction to our press releases, announcements and our filings with the SEC;
fluctuations in broader securities market prices and volumes, particularly among securities of natural gas and oil
companies and securities of publicly traded limited partnerships and limited liability companies;
fluctuations in natural gas and oil prices;
changes in market valuations of similar companies;
departures of key personnel;
commencement of or involvement in litigation;
variations in our quarterly results of operations or those of other natural gas and oil companies;
variations in the amount of our cash distributions;
future issuances and sales of our units; and
changes in general conditions in the U.S. economy, financial markets or the natural gas and oil industry.
In recent years, the securities market has experienced extreme price and volume fluctuations. This volatility has had a significant
effect on the market price of securities issued by many companies for reasons unrelated to the operating performance of these
companies. Future market fluctuations may result in a lower price of our common and/or preferred units.

48
Sales of our units may cause our unit price to decline.
Sales of substantial amounts of our units in the public market, or the perception that these sales may occur, could cause the
market price of our units to decline. In addition, the sale of these units could impair our ability to raise capital through the sale of
additional units.
At December 31, 2015, Atlas Energy Group, our general partner, owned approximately 20.96 million common and 3.75 million
preferred limited partner units, representing an approximately 23.3% limited partner ownership interest in us. Our general partner is
free to sell some or all of these common units at any time. In addition, we have agreed to register under the U.S. Securities Act of
1933, as amended, which we refer to as the Securities Act, any sale of common units held by our general partner and its affil iates.
These registration rights allow our general partner and its affiliates to request registration of their common units and to include any of
those units in a registration of other securities by us. If our general partner and its affiliates were to sell a substantial portion of their
units, it could reduce the market price of our outstanding common units. Additionally, unless previously converted, all of our Class C
preferred units, including all of our general partner’s preferred units, will convert into common units on a one-for-one basis on July
31, 2016. At December 31, 2015, there were 3,749,986 Class C preferred units outstanding.
An increase in interest rates may cause the market price of our units to decline.
Like all equity investments, an investment in our units is subject to risks. Investors may be willing to accept these risks in
exchange for possibly receiving a higher rate of return than may otherwise be obtainable from lower-risk investments. Accordingly, as
interest rates rise, the ability of investors to obtain higher risk-adjusted rates of return by purchasing government-backed debt
securities may cause a corresponding decline in demand for riskier investments generally, including yield-based equity investments
such as publicly traded limited partner interests. Reduced demand for our units resulting from investors seeking other investment
opportunities may cause the trading price of our units to decline.
We may not have sufficient cash flow from operations to pay the minimum quarterly distribution following the establishment of
cash reserves and payment of fees and expenses, including payments to our general partner.
We may not have sufficient cash flow from operations each quarter to pay the minimum quarterly distribution. Under the terms
of our partnership agreement, the amount of cash otherwise available for distribution will be reduced by our operating expenses and
the amount of any cash reserve amounts that our general partner establishes to provide for the conduct of our business, including
operations, future capital expenditures and our anticipated future credit needs, future debt service requirements and future cash
distributions to our unitholders and the holders of the distribution incentive rights. The amount of cash we can distribute on our
common units principally depends upon the amount of cash we generate from our operations, which will fluctuate from quarter to
quarter based on, among other things:
the amount of natural gas and oil we produce;
the price at which we sell our natural gas and oil;
the level of our operating costs;
our ability to acquire, locate and produce new reserves;
the results of our hedging activities;
the level of our interest expense, which depends on the amount of our indebtedness and the interest payable on it; and
the level of our capital expenditures.
In addition, the actual amount of cash we will have available for distribution will depend on other factors, some of which are
beyond our control, including:
our ability to make working capital borrowings to pay distributions;
the cost of acquisitions, if any;
fluctuations in our working capital needs;
timing and collectability of receivables;
restrictions on distributions imposed by lenders;
payments to our general partner; and
the strength of financial markets and our ability to access capital or borrow funds.
49
The amount of cash we have available for distribution to unitholders, if any, depends primarily on our cash flow and not solely on
profitability.
The amount of cash that we have available for distribution, if any, depends primarily on our cash flow, including cash reserves
and working capital or other borrowings, and not solely on profitability, which will be affected by non-cash items. As a result, we may
make cash distributions during periods when we record losses, and we may not make cash distributions during periods when we
record net income.
We have the right to borrow to make distributions. Repayment of these borrowings will decrease cash available for future
distributions, and covenants in our debt documents have restrictions and financial covenants that may restrict our ability to pay
distributions to our unitholders.
Our partnership agreement allows us to borrow to make distributions. We may make short term borrowings under our credit
facility, which we refer to as working capital borrowings, to make distributions. The primary purpose of these borrowings would be to
mitigate the effects of short term fluctuations in our working capital that would otherwise cause volatility in our quarter to quarter
distributions.
Our credit facilities and the indentures governing our senior notes contain various restrictive covenants that limit our ability to,
among other things, pay distributions or redeem or repurchase our securities. In addition, our debt documents require us to maintain
specified financial ratios. Our ability to meet those financial ratios can be affected by events beyond our control, and we may be
unable to meet those tests. These restrictions and financial covenants may restrict our ability to pay distributions to our unitholders.
Cost reimbursements due to our general partner for services provided may be substantial and will reduce our cash available for
distribution to our unitholders.
Pursuant to our partnership agreement, our general partner receives reimbursement for the provision of various general and
administrative services for our benefit. Payments for these services may be substantial, are not subject to any aggregate limit, and will
reduce the amount of cash available for distribution to unitholders. In addition, under Delaware partnership law, our general partner
has unlimited liability for our obligations, such as our debts and environmental liabilities, except for our contractual obligations that
are expressly made without recourse to our general partner. To the extent our general partner incurs obligations on our behalf, we are
obligated to reimburse or indemnify it. If we are unable or unwilling to reimburse or indemnify our general partner, our general
partner may take actions to cause us to make payments of these obligations and liabilities. Any such payments could reduce the
amount of cash otherwise available for distribution to our unitholders.
If we do not pay distributions on our preferred units in any fiscal quarter, we will be unable to pay distributions on our common
units until all unpaid preferred unit distributions have been paid, and our common unitholders are not entitled to receive
distributions for such prior periods.
If we do not pay the required distributions on our preferred units, we will be unable to pay distributions on our common units.
Additionally, because distributions to our preferred unitholders are cumulative, we will have to pay all unpaid accumulated preferred
distributions before we can pay any distributions to our common unitholders. Also, because distributions to our common unitholders
are not cumulative, if we do not pay distributions on our common units with respect to any quarter, our common unitholders will not
be entitled to receive distributions covering any prior periods.
With limited exceptions, our partnership agreement restricts the voting rights of unitholders that own 20% or more of our common
units.
Our partnership agreement prohibits any person or group that owns 20% or more of our common units then outstanding, other
than our general partner, its affiliates and transferees, from voting on any matter.
50
Our general partner may elect to cause us to issue common units to it in connection with a resetting of the target distribution levels
related to its incentive distribution rights, without the approval of the conflicts committee of its board of directors or the holders of
our common units. This could result in lower distributions to holders of our common units.
Our general partner, as the initial holder of our incentive distribution rights, has the right, at any time when it has received
incentive distributions at the highest level to which it is entitled (50.0%) for each of the prior four consecutive fiscal quarters and the
amount of each such distribution did not exceed adjusted operating surplus for such quarter, to reset the initial target distribution levels
at higher levels based on our cash distributions at the time of the exercise of the reset election. Following any reset election, the
minimum quarterly distribution will be reset to an amount equal to the average cash distribution per common unit for the two fiscal
quarters immediately preceding the reset election (such amount is referred to as the “reset minimum quarterly distribution”), and the
target distribution levels will be reset to correspondingly higher levels based on percentage increases above the reset minimum
quarterly distribution. If our general partner transfers all or a portion of our incentive distribution rights in the future, then the holder
or holders of a majority of our incentive distribution rights will be entitled to exercise this reset right.
If a reset election is made, then the holder of the incentive distribution rights will be entitled to receive additional common units
from the partnership equal to the number of common units that would have entitled the holder of such additional common units to an
average aggregate quarterly cash distribution in the prior two quarters equal to the average of the distributions on the incentive
distribution rights in the prior two quarters. We anticipate that the holder of our incentive distribution rights may exercise this reset
right in order to facilitate acquisitions or internal growth projects that would not be sufficiently accretive to cash distributions per
common unit without such reset. It is possible, however, that the reset right is exercised at a time when the holder is experiencing, or
expects to experience, declines in the cash distributions it receives related to its incentive distribution rights and may, therefore, desire
to be issued common units rather than retain the right to receive incentive distributions based on the initial target distribution levels.
As a result, a reset election may cause our common unitholders to experience a reduction in the amount of cash distributions that our
common unitholders would have otherwise received had we not issued new common units to our general partner in connection with
resetting the target distribution levels.
Our unitholders who fail to furnish certain information requested by our general partner or who our general partner determines
are not eligible citizens may not be entitled to receive distributions in kind upon our liquidation and their units will be subject to
redemption.
We have the right to redeem all of the units of any holder that is not an eligible citizen if we are or become subject to federal,
state, or local laws or regulations that, in the determination of our general partner, create a substantial risk of cancellation or forfeiture
of any property in which we have an interest because of the nationality, citizenship or other related status of any limited partner. Our
general partner may require any limited partner or transferee to furnish information about his nationality, citizenship or related status.
If a limited partner fails to furnish information about his nationality, citizenship or other related status within a reasonable period after
a request for the information or our general partner determines after receipt of the information that the limited partner is not an eligible
citizen, the limited partner may be treated as a non-citizen assignee. A non-citizen assignee does not have the right to direct the voting
of his units and may not receive distributions in kind upon our liquidation. Furthermore, we have the right to redeem all of the units of
any holder that is not an eligible citizen or fails to furnish the requested information.
Units held by persons who are non-taxpaying assignees will be subject to the possibility of redemption.
If our general partner determines that our not being treated as an association taxable as a corporation or otherwise taxable as an
entity for U.S. federal income tax purposes, coupled with the tax status (or lack of proof thereof) of one or more of our limited
partners, has, or is reasonably likely to have, a material adverse effect on our ability to operate our assets or generate revenues from
our assets, then our general partner may adopt such amendments to our partnership agreement as it determines are necessary or
appropriate to obtain proof of the U.S. federal income tax status of our limited partners (and their owners, to the extent relevant) and
permit us to redeem the units held by any person whose tax status has or is reasonably likely to have a material adverse effect on the
maximum applicable rate that can be charged to customers by our subsidiaries or who fails to comply with the procedures instituted by
our general partner to obtain proof of the U.S. federal income tax status.
Holders of our units have limited voting rights and are not entitled to elect our general partner or its board of directors.
Unlike the holders of common stock in a corporation, our common unitholders have only limited voting rights on matters
affecting our business and, therefore, limited ability to influence management’s decisions regarding our business. Common unitholders
do not elect our general partner or the members of its board of directors on an annual or other continuing basis. The board of directors of
our general partner is elected by its unitholders. Furthermore, the vote of the holders of at least two-thirds of all outstanding common
units is required to remove our general partner. As a result of these limitations on the ability of holders of our common units to influence
the management of our company, the price at which the common units trade could be diminished.

51
Additionally, holders of the preferred units have no voting rights with respect to matters that generally require the approval of
voting unitholders. Voting rights for holders of preferred units exist primarily with respect to voting on amendments to our certificate of
formation and partnership agreement that materially and adversely affect the rights of the holders of preferred units or authorizing,
increasing or creating additional classes or series of our units that are senior to the preferred units.
Our general partner’s interest in us and the control of our general partner may be transferred to a third party without unitholder
consent.
Our general partner may transfer its general partner interest to a third party without the consent of our unitholders, either before
March 13, 2022 in a merger or in a sale of all or substantially all of its assets, or after March 13, 2022 under any circumstances if such
transfer is otherwise in compliance with our partnership agreement. In addition, our general partner may transfer all or a portion of its
incentive distribution rights to a third party at any time without the consent of our unitholders. If our general partner transfers its
incentive distribution rights to a third party but retains its general partner interest, our general partner may not have the same incentive
to grow our partnership and increase distributions to unitholders over time as it would if it had retained ownership of the incentive
distribution rights.
We may issue an unlimited number of additional units, including units that are senior to the common units and parri passu with
the preferred units, without unitholder approval, which would dilute unitholders’ ownership interests. Any additional issuance will
not dilute the general partner interest in us.
Our partnership agreement does not limit the number of additional common units that we may issue at any time without the
approval of our unitholders. In addition, we may issue an unlimited number of units that are senior to the common units in right of
distribution, liquidation and voting, including additional preferred units and any securities parity with the preferred units without any
vote of the holders of the preferred units (except where the cumulative distributions on the preferred units or any parity securities are
in arrears) and without the approval of our common unitholders. The issuance by us of additional units or other equity interests of
equal or senior rank will have the following effects:
our unitholders’ proportionate ownership interest in us will decrease;
the amount of cash available for distribution on each unit may decrease;
the ratio of taxable income to distributions may increase;
the relative voting strength of each previously outstanding unit may be diminished; and
the market price of our common units and preferred units may decline.
Moreover, the issuance of additional common units will not dilute the holder of our class A units. The class A units represent a
2% general partner interest in us, and the holder of such class A units will be entitled to 2% of our cash distributions without any
obligation to make future capital contributions to us. The 2% sharing ratio of the class A units will not be reduced if we issue
additional common units in the future. Because the 2% sharing ratio will not be reduced if we issue additional common units, and in
order to ensure that each class A unit represents the same percentage economic interest in us as one common unit, if we issue
additional common units, we will also issue to our general partner, for no additional consideration and without any requirement to
make a capital contribution, an additional number of class A units so that the total number of outstanding class A units after such
issuance equals 2% of the sum of the total number of common units and class A units after such issuance.
In addition, the payment of distributions on any additional units may increase the risk that we will not be able to make
distributions at our prior per unit distribution levels. To the extent new units are senior to our common units, their issuance will
increase the uncertainty of the payment of distributions on our common units.
As a limited partnership, we qualify for, and rely on, exemptions from certain corporate governance requirements of the NYSE
rules.
Under the NYSE listing standards, a limited partnership is exempt from certain NYSE corporate governance requirements,
including:
the requirement that a majority of the board of directors consists of independent directors;
the requirement that we have a nominating/governance committee that is comprised entirely of independent directors with
a written charter addressing the committee’s purpose and responsibilities;
52
the requirement that we have a compensation committee that is composed entirely of independent directors with a written
charter addressing the committee’s purpose and responsibilities; and
the requirement for an annual performance evaluation of the nominating/governance and compensation committees.
We utilize some of the foregoing exemptions from the corporate governance requirements of the NYSE listing standards. As a
result, we do not have a nominating/governance committee or a compensation committee.
In addition, NYSE rules requiring that stockholder approval be obtained prior to certain issuances of equity securities do not
apply to limited partnerships.
Accordingly, you will not have the same protections afforded to stockholders of companies that are subject to all of the NYSE
corporate governance requirements.
Our units may be delisted from the New York Stock Exchange.
On January 12, 2016, we were notified by the NYSE that we are not in compliance with NYSE’s continued listing criteria under
Section 802.01C of the NYSE Listed Company Manual because the average closing price of our common units had been less than
$1.00 for 30 consecutive trading days. We are required to remedy this in a timely manner as set forth in the applicable NYSE rules in
order to maintain our listing on the NYSE, and, if we are unable to do so, our preferred units that are currently listed on the NYSE and
our common units may be delisted by the NYSE. If delisting occurs, it could be more difficult to buy or sell our units and the price of
our units could decline. Delisting could also affect our ability to raise capital. If we were delisted from the NYSE, we could seek to
move trading of the units to the NYSE MKT exchange or OTC. These methods of trading could significantly impair our ability to
raise new capital.
Our general partner has a limited call right that may require you to sell your units at an undesirable time or price.
If at any time our general partner and its affiliates own more than two-thirds of the outstanding class of any limited partner
interests, our general partner will have the right, which it may assign to any of its affiliates or to us, to acquire all, but not less than all,
of such class of limited partner interests held by unaffiliated persons at a price equal to the greater of (1) the highest cash price paid by
our general partner or any of its affiliates for any limited partner interests of the class purchased within the 90 days preceding the date
on which our general partner first mails notice of its election to purchase those limited partner interests; and (2) the average of the
daily closing prices of the limited partner interests of such class over the 20 trading days preceding the date three days before the date
of the mailing of the exercise notice for such call right. You may be required to sell your units at an undesirable time or price. You
may also incur a tax liability upon a sale of your units.
The credit and risk profiles of our general partner could adversely affect our credit ratings and profile.
The credit and risk profiles of our general partner may be factors in credit evaluations of us as a publicly traded limited
partnership due to the significant influence of our general partner over our business activities, including our cash distributions,
acquisition strategy and business risk profile. Another factor that may be considered is the financial condition of our general partner,
including the degree of its financial leverage and its dependence on cash flow from us to service its indebtedness.
Unitholders’ liability may not be limited if a court finds that unitholder action constitutes control of our business.
A general partner of a partnership generally has unlimited liability for the obligations of the partnership, except for those
contractual obligations of the partnership that are expressly made without recourse to the general partner. Our partnership is organized
under Delaware law and we conduct business in a number of other states. The limitations on the liability of holders of limited partner
interests for the obligations of a limited partnership have not been clearly established in some of the other states in which we do
business. Unitholders could be liable for any and all of our obligations as if they were a general partner if, among other potential
reasons:
a court or government agency determined that we were conducting business in a state but had not complied with that
particular state’s partnership statute; or
unitholders’ right to act with other unitholders to remove or replace the general partner, to approve some amendments to
our partnership agreement or to take other actions under our partnership agreement constitutes “control” of our business.
Unitholders may have liability to repay distributions that were wrongfully distributed to them, or other liabilities with respect to
ownership of our units.

53
Under certain circumstances, unitholders may have to repay amounts wrongfully returned or distributed to them. Under
Section 17–607 of the Delaware Revised Uniform Limited Partnership Act (“Delaware Act”), we may not make a distribution to you
if the distribution would cause our liabilities to exceed the fair value of our assets. Liabilities to partners on account of their
partnership interests and liabilities that are non-recourse to us are not counted for purposes of determining whether a distribution is
permitted. Delaware law provides that for a period of three years from the date of the impermissible distribution, limited partners who
received the distribution and who knew at the time of the distribution that it violated Delaware law will be liable to the limited
partnership for the distribution amount. A purchaser of common units who becomes a limited partner is liable for the obligations of the
transferring limited partner to make contributions to the partnership that are known to such purchaser of common units at the time it
became a limited partner and for unknown obligations if the liabilities could be determined from the partnership agreement.
The preferred units represent perpetual equity interests in us.
The preferred units represent perpetual equity interests in us and, unlike our indebtedness, will not give rise to a claim for
payment of a principal amount at a particular date. As a result, holders of the preferred units may be required to bear the financial risks
of an investment in the preferred units for an indefinite period of time. In addition, the preferred units rank junior to all our current and
future indebtedness (including indebtedness outstanding under our revolving credit facility, our second lien term loan facility and our
senior notes), and any other senior securities we may issue in the future with respect to assets available to satisfy claims against us.
Tax Risks to Unitholders
Our tax treatment depends on our status as a partnership for U.S. federal income tax purposes, as well as our not being subject to
a material amount of entity-level taxation by individual states. If the IRS were to treat us as a corporation for U.S. federal income
tax purposes or we were to become subject to a material amount of entity-level taxation for state tax purposes, taxes paid, if any,
would reduce the amount of cash available for distribution.
The anticipated after-tax benefit of an investment in our common units depends largely on our being treated as a partnership for
federal income tax purposes. We have not requested, and do not plan to request, a ruling from the IRS on this or any other tax matter
that affects us.
We are currently treated as a partnership for federal income tax purposes, which requires that 90% or more of our gross income
for every taxable year consist of qualifying income, as defined in Section 7704 of the Internal Revenue Code. Qualifying income is
defined as income and gains derived from the exploration, development, mining or production, processing, refining, transportation
(including pipelines transporting gas, oil, or products thereof), or the marketing of any mineral or natural resource (including fertilizer,
geothermal energy and timber). We may not meet this requirement or current law may change so as to cause, in either event, us to be
treated as a corporation for federal income tax purposes or otherwise be subject to federal income tax. We have not requested, and do
not plan to request, a ruling from the IRS on this or any other matter affecting us.
If we were treated as a corporation for U.S. federal income tax purposes, we would pay U.S. federal income tax on our taxable
income at the corporate tax rates, currently at a maximum rate of 35% and would likely pay state income tax at varying rates.
Distributions to you would generally be taxed as corporate distributions, and no income, gain, loss, deduction or credit would flow
through to you. Because a tax may be imposed on us as a corporation, our cash available for distribution to our unitholders could be
reduced. Therefore, our treatment as a corporation could result in a material reduction in the anticipated cash flow and after-tax return
to our unitholders and therefore result in a substantial reduction in the value of our common units.
54
Current law or our business may change so as to cause us to be treated as a corporation for U.S. federal income tax purposes or
otherwise subject us to entity-level taxation. In addition, because of widespread state budget deficits, several states are evaluating
ways to subject partnerships to entity-level taxation through the imposition of state income, franchise or other forms of taxation. If any
state were to impose a tax upon us as an entity, the cash available for distribution to you would be reduced. Our limited partnership
agreement provides that if a law is enacted or existing law is modified or interpreted in a manner that subjects us to taxation as a
corporation or otherwise subjects us to entity-level taxation for U.S. federal, state or local or foreign income tax purposes, the
minimum quarterly distribution amount and the incentive distribution amounts will be adjusted to reflect the impact of that law on us.
Unitholders are required to pay taxes on their share of our taxable income, including their share of ordinary income and capital
gain upon dispositions of properties by us or cancellation of debt, even if they do not receive any cash distributions from us. A
unitholder’s share of our taxable income, gain, loss and deduction, or specific items thereof, may be substantially different than
the unitholder’s interest in our economic profits.
Our unitholders are required to pay federal income taxes and, in some cases, state and local income taxes on their share of our
taxable income, whether or not they receive any cash distributions from us. Our unitholders may not receive cash distributions from us
equal to their share of our taxable income or even equal to the actual tax liability that results from their share of our taxable income.
For example, we have repurchased approximately $20.3 million of our 7.75% Senior Notes and approximately $12.1 million of
our 9.25% Senior Notes at prices lower than face amount (See “Subsequent Events”). These repurchases will, and other similar
transactions in the future may, result in cancellation of debt income that will be allocated to our unitholders. Some or all of our
unitholders may be allocated substantial amounts of such taxable income, and income tax liabilities arising therefrom may exceed cash
distributions. The ultimate effect to each unitholder would depend on the unitholder's individual tax position with respect to the units;
however, taxable income allocations from us, including cancelation of debt income, increase a unitholder’s tax basis in their units.
In addition, we may sell a portion of our properties and use the proceeds to pay down debt or acquire other properties rather than
distributing the proceeds to our unitholders, and some or all of our unitholders may be allocated substantial taxable income with
respect to that sale. A unitholder’s share of our taxable income upon a disposition of property by us may be ordinary income or capital
gain or some combination thereof. Even where we dispose of properties that are capital assets, what otherwise would be capital gains
may be recharacterized as ordinary income in order to “recapture” ordinary deductions that were previously allocated to that
unitholder related to the same property.
A unitholder’s share of our taxable income and gain (or specific items thereof) may be substantially greater than, or our tax
losses and deductions (or specific items thereof) may be substantially less than, the unitholder’s interest in our economic profits. This
may occur, for example, in the case of a unitholder who purchases units at a time when the value of our units or of one or more of our
properties is relatively low or a unitholder who acquires units directly from us in exchange for property whose fair market value
exceeds its tax basis at the time of the exchange. Cash distributions from us decrease a unitholder’s tax basis in its units, and the
amount, if any, of excess distributions over a unitholder’s tax basis in its units will, in effect, become taxable income to the unitholder,
above and beyond the unitholder’s share of our taxable income and gain (or specific items thereof).
Tax-exempt entities and foreign persons face unique tax issues from owning common units that may result in adverse tax
consequences to them.
Investment in common units by tax-exempt entities, including employee benefit plans and individual retirement accounts
(“IRAs”) and non-U.S. persons raises issues unique to them. For example, virtually all of our income allocated to organizations
exempt from federal income tax, including individual retirement accounts and other retirement plans, will be unrelated business
taxable income and will be taxable to such a unitholder. Distributions to non-U.S. persons will be reduced by withholding taxes
imposed at the highest effective applicable tax rate, and non-U.S. persons will be required to file United States federal income tax
returns and pay tax on their share of our taxable income.
A successful IRS contest of the U.S. federal income tax positions we take may harm the market for our common units, and the
costs of any contest will reduce cash available for distribution.
We have not requested a ruling from the IRS with respect to our treatment as a partnership for U.S. federal income tax purposes
or any other matter that affects us. The IRS may adopt positions that differ from the positions we take. It may be necessary to resort to
administrative or court proceedings to sustain some or all of the positions we take and a court may disagree with some or all of those
positions. Any contest with the IRS may lower the price at which our common units trade. In addition, our costs of any contest with
the IRS will result in a reduction in cash available for distribution to our unitholders and thus will be borne indirectly by our
unitholders.
55
We treat each holder of our common units as having the same tax benefits without regard to the common units held. The IRS may
challenge this treatment, which could reduce the value of the common units.
Because we cannot match transferors and transferees of common units, we adopt depreciation and amortization positions that
may not conform with all aspects of existing U.S. Treasury regulations. A successful IRS challenge to those positions could reduce the
amount of tax benefits available to our unitholders. It also could affect the timing of these tax benefits or the amount of gain on the
sale of common units and could have a negative impact on the value of our common units or result in audits of and adjustments to our
unitholders’ tax returns.
Tax gain or loss on disposition of our common units could be more or less than expected.
If a unitholder sells their common units, they will recognize a gain or loss equal to the difference between the amount realized
and the adjusted tax basis in those common units. Prior distributions and the allocation of losses, including depreciation deductions, to
the unitholder in excess of the total net taxable income allocated to them, which decreased the tax basis in their common units, will, in
effect, become taxable income to them if the common units are sold at a price greater than their tax basis in those common units, even
if the price is less than the original cost. A substantial portion of the amount realized, whether or not representing gain, may be
ordinary income to the unitholder.
We will be considered to have terminated for tax purposes due to a sale or exchange of 50% or more of our interests within a 12-
month period.
We will be considered to have terminated for tax purposes if there is a sale or exchange of 50% or more of the total interests in
our capital and profits within a twelve-month period. A constructive termination results in the closing of our taxable year for all
unitholders and in the case of a unitholder reporting on a taxable year other than a fiscal year ending December 31, may result in more
than 12 months of our taxable income or loss being includable in his taxable income for the year of termination. A constructive
termination occurring on a date other than December 31 will result in us filing two tax returns, and unitholders receiving two Schedule
K-1s, for one fiscal year and the cost of the preparation of these returns will be borne by all unitholders.
Unitholders may be subject to state and local taxes and return filing requirements as a result of investing in our common units.
In addition to U.S. federal income taxes, our unitholders will likely be subject to other taxes, including state and local taxes,
unincorporated business taxes and estate, inheritance or intangible taxes that are imposed by the various jurisdictions in which we do
business or own property now or in the future, even if our unitholders do not reside in any of those jurisdictions. Our unitholders will
likely be required to file foreign, state and local income tax returns and pay state and local income taxes in some or all of these
jurisdictions. Further, our unitholders may be subject to penalties for failure to comply with those requirements. We do business and
own assets in Alabama, Colorado, Indiana, New Mexico, New York, Ohio, Oklahoma, Pennsylvania, Tennessee, Texas, Virginia and
West Virginia. As we make acquisitions or expand our business, we may do business or own assets in other states in the future. It is
the responsibility of each unitholder to file all U.S. federal, foreign, state and local tax returns that may be required of such unitholder.
The IRS may challenge our tax treatment related to transfers of units, which could change the allocation of items of income, gain,
loss and deduction among our unitholders.
We prorate our items of income, gain, loss and deduction between transferors and transferees of our units each month based
upon the ownership of our units on the first day of each month, instead of on the basis of the date a particular unit is transferred. If the
IRS were to challenge this method or new U.S. Treasury regulations were issued, we may be required to change the allocation of items
of income, gain, loss and deduction among our unitholders.

56
We have adopted certain valuation methodologies that may result in a shift of income, gain, loss and deduction between us and our
public unitholders. The IRS may challenge this treatment, which could adversely affect the value of our common units.
When we issue additional units or engage in certain other transactions, we determine the fair market value of our assets and
allocate any unrealized gain or loss attributable to such assets to the capital accounts of our unitholders and our general partner.
Although we may from time to time consult with professional appraisers regarding valuation matters, including the valuation of our
assets, we make many of the fair market value estimates of our assets ourselves using a methodology based on the market value of our
common units as a means to measure the fair market value of our assets. Our methodology may be viewed as understating the value of
our assets. In that case, there may be a shift of income, gain, loss and deduction between certain unitholders and our general partner,
which may be unfavorable to such unitholders. Moreover, under our current valuation methods, subsequent purchasers of our common
units may have a greater portion of their Internal Revenue Code Section 743(b) adjustment allocated to our tangible assets and a lesser
portion allocated to our intangible assets. The IRS may challenge our valuation methods, or our allocation of Section 743(b)
adjustment attributable to our tangible and intangible assets, and allocations of income, gain, loss and deduction between our general
partner and certain of our unitholders.
A successful IRS challenge to these methods or allocations could adversely affect the amount of taxable income or loss being
allocated to our unitholders. It also could affect the amount of gain on the sale of common units by our unitholders and could have a
negative impact on the value of our common units or result in audit adjustments to the tax returns of our unitholders without the
benefit of additional deductions.
A unitholder whose units are loaned to a “short seller” to cover a short sale of units may be considered as having disposed of those
units. If so, the unitholder would no longer be treated for tax purposes as a partner with respect to those units during the period of
the loan and may recognize gain or loss from the disposition.
Because a unitholder whose units are loaned to a “short seller” to cover a short sale of units may be considered as having
disposed of the loaned units, the unitholder may no longer be treated for tax purposes as a partner with respect to those units during
the period of the loan to the short seller and the unitholder may recognize gain or loss from such disposition. Moreover, during the
period of the loan to the short seller, any of our income, gain, loss or deduction with respect to those units may not be reportable by
the unitholder and any cash distributions received by the unitholder as to those units could be fully taxable as ordinary income.
Unitholders desiring to assure their status as partners and avoid the risk of gain recognition from a loan to a short seller are urged to
modify any applicable brokerage account agreements to prohibit their brokers from borrowing their units.
Treatment of distributions on our preferred units as guaranteed payments for the use of capital creates a different tax treatment
for the holders of our preferred units than the holders of our common units.
The tax treatment of distributions on our preferred units is uncertain. We will treat the holders of preferred units as partners for
tax purposes and will treat distributions on the preferred units as guaranteed payments for the use of capital that will generally be
taxable to the holders of preferred units as ordinary income. Although a holder of preferred units could recognize taxable income from
the accrual of such a guaranteed payment even in the absence of a contemporaneous distribution, we anticipate accruing and making
the guaranteed payment distributions quarterly. Otherwise, the holders of Preferred Units are generally not anticipated to share in our
items of income, gain, loss or deduction. Nor will we allocate any share of our nonrecourse liabilities to the holders of preferred units.
If the preferred units were treated as indebtedness for tax purposes, rather than as guaranteed payments for the use of capital,
distributions likely would be treated as payments of interest by us to the holders of preferred units.
A holder of preferred units will be required to recognize gain or loss on a sale of units equal to the difference between the
unitholder’s amount realized and tax basis in the units sold. The amount realized generally will equal the sum of the cash and the fair
market value of other property such holder receives in exchange for such preferred units. Subject to general rules requiring a blended
basis among multiple limited partnership interests, the tax basis of a preferred unit will generally be equal to the sum of the cash and
the fair market value of other property paid by the unitholder to acquire such preferred unit. Gain or loss recognized by a unitholder on
the sale or exchange of a preferred unit held for more than one year generally will be taxable as long-term capital gain or loss. Because
holders of preferred units will not be allocated a share of our items of depreciation, depletion or amortization, it is not anticipated that
such holders would be required to recharacterize any portion of their gain as ordinary income as a result of the recapture rules.
If the IRS makes audit adjustments to our income tax returns for tax years beginning after December 31, 2017, it may assess and
collect any taxes (including any applicable penalties and interest) resulting from such audit adjustment directly from us, in which
case our cash available for distribution to our unitholders might be substantially reduced.
Pursuant to the Bipartisan Budget Act of 2015, for tax years beginning after December 31, 2017, if the IRS makes audit
adjustments to our income tax returns, it may assess and collect any taxes (including any applicable penalties and interest) resulting
57
from such audit adjustment directly from us. Generally, we will have the ability to elect to have our general partner and our
unitholders take such audit adjustment into account in accordance with their interests in us during the tax year under audit, but there
can be no assurance that we will choose to make such election or that such election will be effective in all circumstances. If we are
unable to have our general partner and our unitholders take such audit adjustment into account in accordance with their interests in us
during the tax year under audit, or we choose not to do so, our current unitholders may bear some or all of the tax liability resulting
from such audit adjustment, even if such unitholders did not own units in us during the tax year under audit. If, as a result of any such
audit adjustment, we are required to make payments of taxes, penalties and interest, our cash available for distribution to our
unitholders might be substantially reduced. These rules are not applicable to us for tax years beginning on or prior to December 31,
2017.
Risks Relating to Our Ongoing Relationship with Our General Partner and its Affiliates
Our general partner, through its subsidiary, owns our own common and preferred limited partner units representing an
approximate 23.3% limited partner ownership interest. Therefore, our general partner possesses significant influence on all
matters submitted to a vote of our unitholders.
At December 31, 2015, a wholly-owned subsidiary of Atlas Energy Group owned approximately 20.96 million common and
3.75 million preferred limited partner units, representing an approximate 23.3% limited partner ownership interest in us. Accordingly,
our general partner possesses significant influence over matters submitted to our unitholders for approval, and could exercise such
influence in a manner that is not in the best interests of our other unitholders, including the ability to effectively prevent the approval
of certain matters, such as removal of our general partner and other extraordinary transactions for which super-majority approval is
required under applicable Delaware law. In addition, our general partner is able to control, subject to our partnership agreement and
applicable law, all matters affecting us, including:
any determination with respect to our business direction and policies, including the appointment and removal of officers;
any determinations with respect to mergers, business combinations or disposition of assets;
our financing, including determinations as to the issuance of additional common or preferred units, and the terms thereof;
compensation and benefit programs and other human resources policy decisions;
the payment of distributions on our units; and
determinations with respect to our tax returns.
Our general partner has the authority to conduct our business and manage our operations. Atlas Energy Group may have conflicts
of interest, which may permit it to favor its own interests to our unitholders’ detriment.
Conflicts of interest may arise between our general partner and its affiliates, on the one hand, and us and our unitholders, on the
other hand. In resolving these conflicts of interest, our general partner is permitted to favor its own interests and the interests of its
owners over the interests of our unitholders. These conflicts include, among others, the following situations:
neither our partnership agreement nor any other agreement requires our general partner or any of its affiliates to pursue a
business strategy that favors us or to refer any business opportunity to us;
our general partner is expressly allowed to take into account the interests of parties other than us in resolving conflicts of
interest;
our partnership agreement eliminates any fiduciary duties owed by our general partner to us, and restricts the remedies
available to unitholders for actions that, without the limitations, might constitute breaches of fiduciary duty;
except in limited circumstances, our general partner has the power and authority to conduct our business without
unitholder approval;
our general partner determines the amount and timing of our drilling programs and related capital expenditures, asset
purchases and sales, borrowings, issuance of additional partnership securities and reserves;
our partnership agreement does not restrict our general partner from causing us to pay it or its affiliates for any services
rendered to us or entering into additional contractual arrangements with any of these entities on our behalf;
our general partner determines the amount and timing of any capital expenditure and whether a capital expenditure is
classified as a maintenance capital expenditure, which reduces operating surplus, or an expansion or investment capital
expenditure, which does not reduce operating surplus. Our partnership agreement does not set a limit on the amount of
maintenance capital expenditures that our general partner may estimate;

58
our general partner controls the enforcement of obligations owed to us by our general partner and its affiliates;
our general partner intends to limit its liability regarding our contractual and other obligations;
our general partner decides which costs incurred by it and its affiliates are reimbursable by us; and
our general partner decides whether to retain separate counsel, accountants or others to perform services for us.
Our general partner and affiliates of our general partner may compete with us. This could cause conflicts of interest and limit our
ability to acquire additional assets or businesses, which in turn could adversely affect our ability to replace reserves, results of
operations and cash available for distribution to our unitholders.
Our partnership agreement provides that for so long as it is the general partner of ARP, our general partner’s sole business will
be to act as a general partner of ARP and any other partnership or limited liability company of which ARP is, directly or indirectly, a
partner or member and to undertake activities that are ancillary or related thereto. This restriction does not apply to any person other
than our general partner, and our general partner may hold or dispose any interest that it acquires or obtains from any affiliate or
unrestricted person (as defined in our partnership agreement), and perform activities in connection holding such interest. Affiliates of
our general partner, therefore, are not prohibited from engaging in other businesses or activities, including those that might be in direct
competition with us. Our general partner owns general and limited partner interests in AGP, an exploration and production
development subsidiary, which currently conducts operations in the mid-continent region of the United States as well as interests in
entities which incubate new master limited partnerships and invest in existing ones. Our general partner and its affiliates may make
future investments and acquisitions that may include entities or assets that we would have been interested in acquiring. In addition,
members of management of Atlas Energy Group have substantial experience in the natural gas and oil business.
Therefore, our general partner and its affiliates may compete with us for investment opportunities and our general partner and its
affiliates may own an interest in entities that compete with us.
Our partnership agreement provides that:
affiliates of our general partner have no obligation to refrain from engaging in the same or similar business activities or
lines of business we do, doing business with any of our customers or employing or otherwise engaging any of our officers
or employees;
neither our general partner nor any of its officers or directors will be liable to us or to our unitholders for breach of any
duty, including any fiduciary duty, by reason of any of these activities; and
none of our general partner, its affiliates or any of their respective directors or officers is under any duty to present any
corporate opportunity to us which may be a corporate opportunity for such person and us, and such person will not be
liable to us or our unitholders for breach of any duty, including any fiduciary duty, by reason of the fact that such person
pursues or acquires that corporate opportunity for itself, directs that corporate opportunity to another person or does not
present that corporate opportunity to us.
Accordingly, our general partner and its affiliates may acquire, develop or dispose of additional natural gas or oil properties or
other assets in the future, without any obligation to offer us the opportunity to purchase or develop any of those assets. These factors
may make it difficult for us to compete with our general partner and its affiliates with respect to commercial activities as well as for
acquisition candidates. As a result, competition from these entities could adversely impact our results of operations and accordingly
cash available for distribution. This also may create actual and potential conflicts of interest between us and our general partner, and
its affiliates and result in less than favorable treatment of us.
Certain of our officers and the directors of our general partner may have actual or potential conflicts of interest with us.
Our officers and our general partner’s directors have duties to manage us in a manner beneficial to us, but they also have duties
to manage our general partner’s business in a manner beneficial to it. Certain of our non-independent directors and officers also have
positions with other affiliates of our general partner. Consequently, these directors and officers may encounter situations in which their
obligations to our general partner or one or more of its subsidiaries, on the one hand, and us, on the other hand, are in conflict.
Additionally, such directors and officers may own common units of our general partner, options to purchase common units of our general
partner or other equity awards, as well as equity of our general partner’s affiliates, which may be significant for some of these persons.
Their positions and ownership of such equity and equity awards creates, or may create the appearance of, conflicts of interest when they
are faced with decisions that could have different implications for Atlas Energy Group and/or its affiliates than the decisions have for us.
59
ITEM 1B: UNRESOLVED STAFF COMMENTS
None.
ITEM 2: PROPERTIES
Natural Gas, Oil and NGL Reserves
The following tables summarize information regarding our estimated proved natural gas, oil and NGL reserves as of
December 31, 2015. Proved reserves are the estimated quantities of crude oil, natural gas, and NGLs which geological and
engineering data demonstrate with reasonable certainty to be recoverable in future years from known reservoirs under existing
economic and operating conditions, i.e., prices and costs as of the date the estimate is made. Prices include consideration of changes in
existing prices provided only by contractual arrangements, but not on escalations based upon future conditions. The estimated reserves
include reserves attributable to our direct ownership interests in oil and gas properties as well as the reserves attributable to our
percentage interests in the oil and gas properties owned by Drilling Partnerships in which we own partnership interests. All of the
reserves are located in the United States. We base these estimated proved natural gas, oil and NGL reserves and future net revenues of
natural gas, oil and NGL reserves upon reports prepared by independent third-party reserve engineers. We have adjusted these
estimates to reflect the settlement of asset retirement obligations on gas and oil properties. A summary of the reserves report related to
our estimated proved reserves at December 31, 2015 is included as Exhibits 99.2 and 99.3 to this report. In accordance with SEC
guidelines, we make the standardized measure estimates of future net cash flows from proved reserves using natural gas, oil and NGL
sales prices in effect as of the dates of the estimates which are held constant throughout the life of the properties. Our estimates of
proved reserves are calculated on the basis of the unweighted adjusted average of the first-day-of-the-month prices for each month
during the years ended December 31, 2015 and 2014, and are listed below as of the dates indicated:
December 31,
2015 2014
Unadjusted Prices(1)
Natural gas (per Mcf) .............................................................. $ 2.59 $ 4.35
Oil (per Bbl) ............................................................................ $ 50.28 $ 94.99
Natural gas liquids (per Bbl) ................................................... $ 11.02 $ 30.21
Average Realized Prices, Before Hedge(1) (2)
Natural gas (per Mcf) .............................................................. $ 2.23 $ 3.93
Oil (per Bbl) ............................................................................ $ 44.19 $ 82.22
Natural gas liquids (per Bbl) ................................................... $ 12.77 $ 29.39
(1) “Mcf” represents thousand cubic feet; and “Bbl” represents barrels.
(2) Excludes the impact of subordination of our production revenue to investor partners within our Drilling Partnerships for years
ended December 31, 2015 and 2014. Including the effect of this subordination, the average realized sales price was $2.19 per
Mcf before the effects of financial hedging and $3.84 per Mcf before the effects of financial hedging for years ended December
31, 2015 and 2014, respectively.
Reserve estimates are imprecise and may change as additional information becomes available. Furthermore, estimates of natural
gas, oil and NGL reserves are projections based on engineering data. There are uncertainties inherent in the interpretation of this data
as well as the projection of future rates of production and the timing of development expenditures. Reservoir engineering is a
subjective process of estimating underground accumulations of natural gas, oil and NGLs that cannot be measured in an exact way and
the accuracy of any reserve estimate is a function of the quality of available data and of engineering and geological interpretation and
judgment.
The preparation of our natural gas, oil and NGL reserve estimates was completed in accordance with prescribed internal control
procedures by our reserve engineers. For the periods presented, other than for our Rangely assets, Wright and Company, Inc. was
retained to prepare a report of proved reserves. The reserve information includes natural gas, oil and NGL reserves which are all
located in the United States. The independent reserves engineer’s evaluation was based on more than 39 years of experience in the
estimation of and evaluation of petroleum reserves, specified economic parameters, operating conditions and government regulations.
For our Rangely assets, Cawley, Gillespie, and Associates, Inc. was retained to prepare a report of proved reserves. The independent
reserves engineer’s evaluation was based on more than 33 years of experience in the estimation of and evaluation of petroleum
reserves, specified economic parameters, operating conditions, and government regulations. Our internal control procedures include
verification of input data delivered to our third-party reserve specialist, as well as a multi-functional management review. The
preparation of reserve estimates was overseen by our Senior Reserve Engineer, who is a member of the Society of Petroleum
Engineers and has more than 17 years of natural gas and oil industry experience. The reserve estimates were reviewed and approved
by our senior engineering staff and management, with final approval by our President.

60
Results of drilling, testing and production subsequent to the date of the estimate may justify revision of these estimates. Future
prices received from the sale of natural gas, oil and NGLs may be different from those estimated by our independent third-party
engineers in preparing its reports. The amounts and timing of future operating and development costs may also differ from those used.
Due to these factors, the reserves set forth in the following tables ultimately may not be produced and the proved undeveloped
reserves may not be developed within the periods anticipated. The estimated standardized measure values may not be representative of
the current or future fair market value of our proved natural gas and oil properties. Standardized measure values are based upon
projected cash inflows, which do not provide for changes in natural gas, oil and NGL prices or for the escalation of expenses and
capital costs. The meaningfulness of these estimates depends upon the accuracy of the assumptions upon which they were based (see
“Item 1A: Risk Factors—Risks Relating to Our Business”).
We evaluate natural gas and oil reserves at constant temperature and pressure. A change in either of these factors can affect the
measurement of natural gas and oil reserves. We deduct operating costs, development costs and production-related and ad valorem
taxes in arriving at the estimated future cash flows. We base the estimates on operating methods and conditions prevailing as of the
dates indicated:
Proved Reserves at December 31,
2015 2014
Proved reserves:
Natural gas reserves (MMcf)(1):
Proved developed reserves ................................ 567,992 887,819
Proved undeveloped reserves(2)
......................... 36,586 168,566
Total proved reserves of natural gas ............ 604,578 1,056,385
Oil reserves (MBbl)(1)
:
Proved developed reserves ................................ 25,484 30,538
Proved undeveloped reserves(2)
......................... 19,320 17,480
Total proved reserves of oil ......................... 44,804 48,018
NGL reserves (MBbl):
Proved developed reserves ................................ 6,334 12,005
Proved undeveloped reserves(2)
......................... 1,516 9,752
Total proved reserves of NGL ..................... 7,850 21,757
Total proved reserves (MMcfe)(1)
.......... 920,504 1,475,035
Standardized measure of discounted future cash flows
(in thousands)(3)
....................................................... $ 502,769 $ 1,984,271
(1) “MMcf” represents million cubic feet; “MMcfe” represents million cubic feet equivalents; and “MBbl” represents thousand
barrels. Oil and NGLs are converted to gas equivalent basis (“Mcfe”) at the rate of one barrel to 6 Mcf of natural gas. Mcf is
defined as one thousand cubic feet.
(2) Our ownership in these reserves is subject to reduction as we generally make capital contributions, which includes leasehold
acreage associated with our proved undeveloped reserves, to our Drilling Partnerships in exchange for an equity interest in these
partnerships, which is approximately 30%, which effectively will reduce our ownership interest in these reserves from 100% to
our respective ownership interest as we make these contributions.
(3) Standardized measure is the present value of estimated future net revenues to be generated from the production of proved
reserves, determined in accordance with the rules and regulations of the SEC without giving effect to non-property related
expenses, such as general and administrative expenses, interest and income tax expenses, or to depletion, depreciation and
amortization. The future cash flows are discounted using an annual discount rate of 10%. Standardized measure does not give
effect to commodity derivative contracts. Because we are a limited partnership, no provision for federal or state income taxes
has been included in the December 31, 2015 and 2014 calculations of standardized measure, which is, therefore, the same as the
PV-10 value. Standardized measure for the years ended December 31, 2015 and 2014 includes approximately $(23.5) million
and $(36.7) million related to the present value of future cash flows plugging and abandonment of wells, including the estimated
salvage value. These amounts were not included in the summary reserve report that appear in Exhibits 99.2 and 99.3 in this
report.
Proved developed reserves are those reserves of any category that can be expected to be recovered through existing wells with
existing equipment and operating methods or in which the cost of the required equipment is relatively minor compared to the cost of a
new well; and through installed extraction equipment and infrastructure operational at the time of the reserve estimate if the extraction
is by means not involving a well. Proved undeveloped reserves are reserves of any category that are expected to be recovered from
new wells on undrilled acreage, or from existing wells on which a relatively major expenditure is required for recompletion.
61
Proved Undeveloped Reserves (“PUDS”)
PUD Locations. As of December 31, 2015, we had 102 PUD locations totaling approximately 162 net Bcfe’s of natural gas, oil
and NGLs. These PUDS are based on the definition of PUD’s in accordance with the SEC’s rules allowing the use of techniques that
have been proven effective through documented evidence, such as actual production from projects in the same reservoir or an
analogous reservoir or by other evidence using reliable technology that establishes reasonable certainty.
Changes in PUDs. Changes in PUDS that occurred during the year ended December 31, 2015 were due to the following:
addition of approximately 76 Bcfe due to our drilling and leasing activity as well as locations purchased in the Eagle Ford
Shale offset by
negative revisions of approximately 219 Bcfe in PUDs primarily due to the reduction of our five year drilling plans and
unfavorable pricing environment.
Development Costs. Costs incurred related to the development of PUDs were approximately $28.0 million, $164.9 million and
$103.3 million for the years ended December 31, 2015, 2014 and 2013, respectively. During the years ended December 31, 2015,
2014 and 2013, approximately 21 Bcfe, 41.2 Bcfe and 58.4 Bcfe of our reserves, respectively, were converted from PUDs to proved
developed reserves. See “Item 1: Business - Overview” for further information. As of December 31, 2015, there were no PUDs that
had remained undeveloped for five years or more. The proved undeveloped reserves disclosed as of December 31, 2015 are included
within our five-year development plan and will be developed within five years of the initial disclosure.

62
Productive Wells
The following table sets forth information regarding productive natural gas and oil wells in which we have a working interest as
of December 31, 2015. Productive wells consist of producing wells and wells capable of production, including natural gas wells
awaiting pipeline connections to commence deliveries and oil wells awaiting connection to production facilities. Gross wells are the
total number of productive wells in which we have an interest, directly or through our ownership interests in Drilling Partnerships and
net wells are the sum of our fractional working interests in gross wells, based on the percentage interest we own in the Drilling
Partnership that owns the well:
Number of Productive Wells(1)(2)
Gross Net
Appalachia:
Gas wells ...................................................................... 7,581 3,790
Oil wells ....................................................................... 456 344
Total ....................................................................... 8,037 4,134
Coal-bed Methane(3)
:
Gas wells ...................................................................... 3,646 2,896
Oil wells ....................................................................... — —
Total ............................................................................. 3,646 2,896
Barnett/Marble Falls:
Gas wells ...................................................................... 643 511
Oil wells ....................................................................... 60 38
Total ....................................................................... 703 549
Mississippi Lime/Hunton:
Gas wells ...................................................................... 106 60
Oil wells ....................................................................... — —
Total ....................................................................... 106 60
Rangely/Eagle Ford:
Gas wells ...................................................................... — —
Oil wells ....................................................................... 427 125
Total ....................................................................... 427 125
Other operating areas(4)
:
Gas wells ...................................................................... 759 237
Oil wells ....................................................................... 2 1
Total ....................................................................... 761 238
Total:
Gas wells ...................................................................... 12,735 7,494
Oil wells ....................................................................... 945 508
Total ....................................................................... 13,680 8,002
(1) Includes our proportionate interest in wells owned by 60 Drilling Partnerships for which we serve as managing general partner
and various joint ventures. This does not include royalty or overriding interests in 778 wells.
(2) There were no exploratory wells drilled during the years ended December 31, 2015, 2014 and 2013; there were no gross or net
dry wells within our operating areas during the year ended December 31, 2015, 2014 and 2013.
(3) Coal-bed methane includes our production located in the Raton Basin in northern New Mexico, the Black Warrior Basin in
central Alabama and the Central Appalachian Basin in Virginia and West Virginia.
(4) Other operating areas include our production located in the Chattanooga, New Albany and Niobrara Shales.
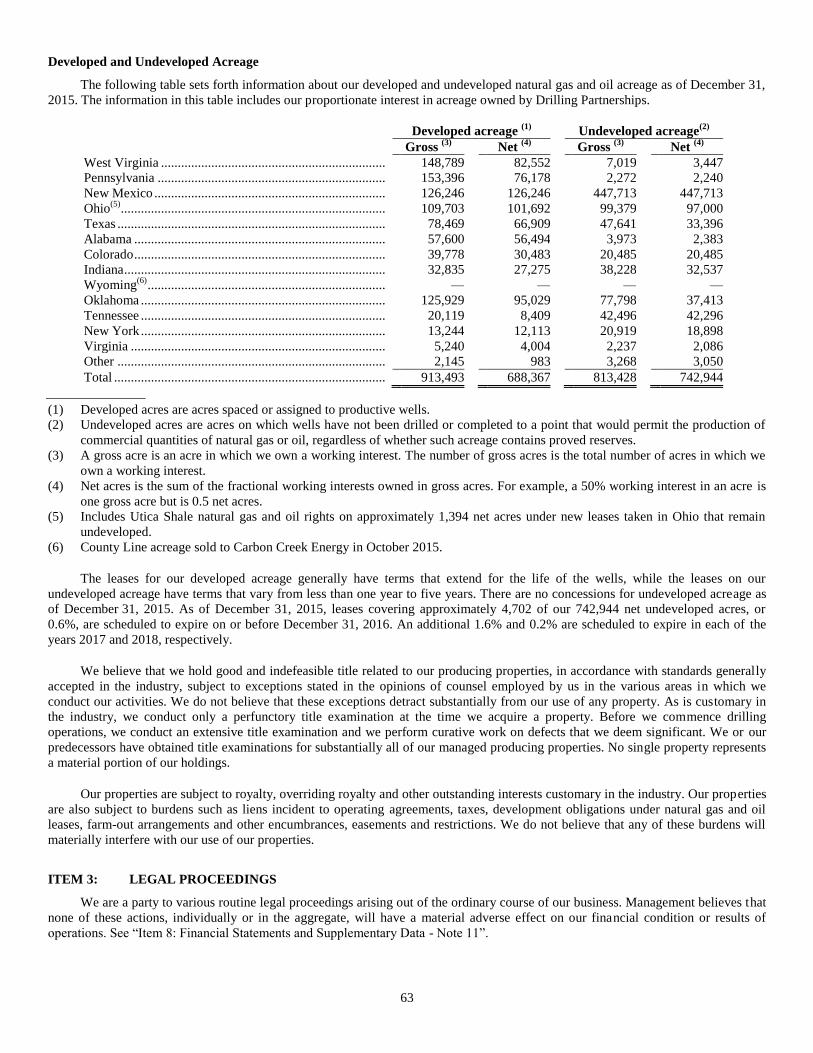
63
Developed and Undeveloped Acreage
The following table sets forth information about our developed and undeveloped natural gas and oil acreage as of December 31,
2015. The information in this table includes our proportionate interest in acreage owned by Drilling Partnerships.
Developed acreage (1)
Undeveloped acreage(2)
Gross (3)
Net (4)
Gross (3)
Net (4)
West Virginia ................................................................... 148,789 82,552 7,019 3,447 Pennsylvania .................................................................... 153,396 76,178 2,272 2,240 New Mexico ..................................................................... 126,246 126,246 447,713 447,713 Ohio
(5) ...............................................................................
109,703 101,692 99,379 97,000
Texas ................................................................................ 78,469 66,909 47,641 33,396 Alabama ........................................................................... 57,600 56,494 3,973 2,383 Colorado ........................................................................... 39,778 30,483 20,485 20,485 Indiana .............................................................................. 32,835 27,275 38,228 32,537 Wyoming
(6) ....................................................................... — — — —
Oklahoma ......................................................................... 125,929 95,029 77,798 37,413 Tennessee ......................................................................... 20,119 8,409 42,496 42,296 New York ......................................................................... 13,244 12,113 20,919 18,898 Virginia ............................................................................ 5,240 4,004 2,237 2,086 Other ................................................................................ 2,145 983 3,268 3,050
Total ................................................................................. 913,493 688,367 813,428 742,944
(1) Developed acres are acres spaced or assigned to productive wells.
(2) Undeveloped acres are acres on which wells have not been drilled or completed to a point that would permit the production of
commercial quantities of natural gas or oil, regardless of whether such acreage contains proved reserves.
(3) A gross acre is an acre in which we own a working interest. The number of gross acres is the total number of acres in which we
own a working interest.
(4) Net acres is the sum of the fractional working interests owned in gross acres. For example, a 50% working interest in an acre is
one gross acre but is 0.5 net acres.
(5) Includes Utica Shale natural gas and oil rights on approximately 1,394 net acres under new leases taken in Ohio that remain
undeveloped.
(6) County Line acreage sold to Carbon Creek Energy in October 2015.
The leases for our developed acreage generally have terms that extend for the life of the wells, while the leases on our
undeveloped acreage have terms that vary from less than one year to five years. There are no concessions for undeveloped acreage as
of December 31, 2015. As of December 31, 2015, leases covering approximately 4,702 of our 742,944 net undeveloped acres, or
0.6%, are scheduled to expire on or before December 31, 2016. An additional 1.6% and 0.2% are scheduled to expire in each of the
years 2017 and 2018, respectively.
We believe that we hold good and indefeasible title related to our producing properties, in accordance with standards generally
accepted in the industry, subject to exceptions stated in the opinions of counsel employed by us in the various areas in which we
conduct our activities. We do not believe that these exceptions detract substantially from our use of any property. As is customary in
the industry, we conduct only a perfunctory title examination at the time we acquire a property. Before we commence drilling
operations, we conduct an extensive title examination and we perform curative work on defects that we deem significant. We or our
predecessors have obtained title examinations for substantially all of our managed producing properties. No single property represents
a material portion of our holdings.
Our properties are subject to royalty, overriding royalty and other outstanding interests customary in the industry. Our properties
are also subject to burdens such as liens incident to operating agreements, taxes, development obligations under natural gas and oil
leases, farm-out arrangements and other encumbrances, easements and restrictions. We do not believe that any of these burdens will
materially interfere with our use of our properties.
ITEM 3: LEGAL PROCEEDINGS
We are a party to various routine legal proceedings arising out of the ordinary course of our business. Management believes that
none of these actions, individually or in the aggregate, will have a material adverse effect on our financial condition or results of
operations. See “Item 8: Financial Statements and Supplementary Data - Note 11”.

64
ITEM 4: MINE SAFETY DISCLOSURES
Not applicable.
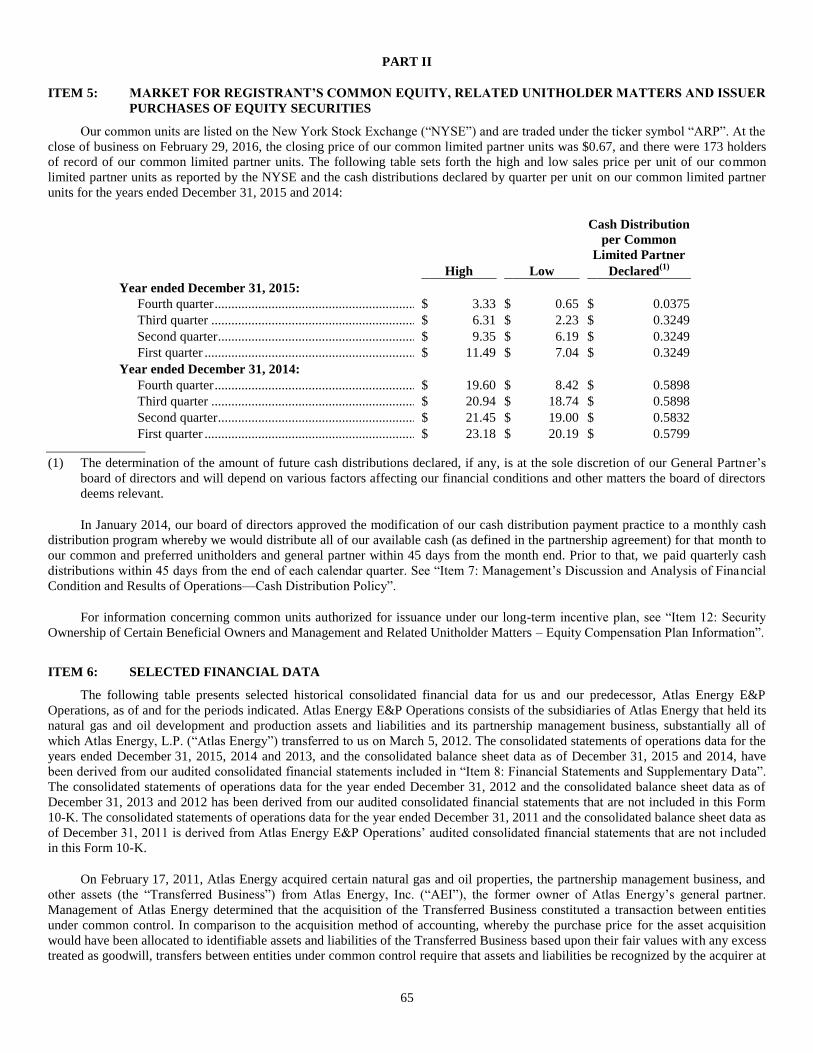
65
PART II
ITEM 5: MARKET FOR REGISTRANT’S COMMON EQUITY, RELATED UNITHOLDER MATTERS AND ISSUER
PURCHASES OF EQUITY SECURITIES
Our common units are listed on the New York Stock Exchange (“NYSE”) and are traded under the ticker symbol “ARP”. At the
close of business on February 29, 2016, the closing price of our common limited partner units was $0.67, and there were 173 holders
of record of our common limited partner units. The following table sets forth the high and low sales price per unit of our common
limited partner units as reported by the NYSE and the cash distributions declared by quarter per unit on our common limited partner
units for the years ended December 31, 2015 and 2014:
Cash Distribution
per Common
Limited Partner
High Low Declared(1)
Year ended December 31, 2015:
Fourth quarter ............................................................ $ 3.33 $ 0.65 $ 0.0375
Third quarter ............................................................. $ 6.31 $ 2.23 $ 0.3249
Second quarter ........................................................... $ 9.35 $ 6.19 $ 0.3249
First quarter ............................................................... $ 11.49 $ 7.04 $ 0.3249
Year ended December 31, 2014:
Fourth quarter ............................................................ $ 19.60 $ 8.42 $ 0.5898
Third quarter ............................................................. $ 20.94 $ 18.74 $ 0.5898
Second quarter ........................................................... $ 21.45 $ 19.00 $ 0.5832
First quarter ............................................................... $ 23.18 $ 20.19 $ 0.5799
(1) The determination of the amount of future cash distributions declared, if any, is at the sole discretion of our General Partner’s
board of directors and will depend on various factors affecting our financial conditions and other matters the board of directors
deems relevant.
In January 2014, our board of directors approved the modification of our cash distribution payment practice to a monthly cash
distribution program whereby we would distribute all of our available cash (as defined in the partnership agreement) for that month to
our common and preferred unitholders and general partner within 45 days from the month end. Prior to that, we paid quarterly cash
distributions within 45 days from the end of each calendar quarter. See “Item 7: Management’s Discussion and Analysis of Financial
Condition and Results of Operations—Cash Distribution Policy”.
For information concerning common units authorized for issuance under our long-term incentive plan, see “Item 12: Security
Ownership of Certain Beneficial Owners and Management and Related Unitholder Matters – Equity Compensation Plan Information”.
ITEM 6: SELECTED FINANCIAL DATA
The following table presents selected historical consolidated financial data for us and our predecessor, Atlas Energy E&P
Operations, as of and for the periods indicated. Atlas Energy E&P Operations consists of the subsidiaries of Atlas Energy that held its
natural gas and oil development and production assets and liabilities and its partnership management business, substantially all of
which Atlas Energy, L.P. (“Atlas Energy”) transferred to us on March 5, 2012. The consolidated statements of operations data for the
years ended December 31, 2015, 2014 and 2013, and the consolidated balance sheet data as of December 31, 2015 and 2014, have
been derived from our audited consolidated financial statements included in “Item 8: Financial Statements and Supplementary Data”.
The consolidated statements of operations data for the year ended December 31, 2012 and the consolidated balance sheet data as of
December 31, 2013 and 2012 has been derived from our audited consolidated financial statements that are not included in this Form
10-K. The consolidated statements of operations data for the year ended December 31, 2011 and the consolidated balance sheet data as
of December 31, 2011 is derived from Atlas Energy E&P Operations’ audited consolidated financial statements that are not included
in this Form 10-K.
On February 17, 2011, Atlas Energy acquired certain natural gas and oil properties, the partnership management business, and
other assets (the “Transferred Business”) from Atlas Energy, Inc. (“AEI”), the former owner of Atlas Energy’s general partner.
Management of Atlas Energy determined that the acquisition of the Transferred Business constituted a transaction between entities
under common control. In comparison to the acquisition method of accounting, whereby the purchase price for the asset acquisition
would have been allocated to identifiable assets and liabilities of the Transferred Business based upon their fair values with any excess
treated as goodwill, transfers between entities under common control require that assets and liabilities be recognized by the acquirer at
66
historical carrying value at the date of transfer, with any difference between the purchase price and the net book value of the assets
recognized as an adjustment to partners’ capital (deficit)/equity on our consolidated balance sheet. Also, in comparison to the
acquisition method of accounting, whereby the results of operations and the financial position of the Transferred Business would have
been included in our consolidated combined financial statements from the date of acquisition, transfers between entities under
common control require the acquirer to reflect the effect to the assets acquired and liabilities assumed and the related results of
operations at the beginning of the period during which it was acquired and retrospectively adjust its prior year financial statements to
furnish comparative information. As such, we reflected the impact of the acquisition of the Transferred Business on our consolidated
financial statements in the following manner:
Recognized the assets acquired and liabilities assumed from the Transferred Business at their historical carrying value at
the date of transfer, with any difference between the purchase price and the net book value of the assets recognized as an
adjustment to partners’ capital (deficit) /equity;
Retrospectively adjusted our consolidated financial statements for any date prior to February 17, 2011, the date of
acquisition, to reflect our results on a consolidated basis with the results of the Transferred Business as of or at the
beginning of the respective period; and
Adjusted the presentation of our consolidated statements of operations for any date prior to February 17, 2011 to reflect
the results of operations attributable to the Transferred Business as a reduction of net income (loss) to determine income
(loss) attributable to common limited partners and the general partner. The Transferred Business’ historical financial
statements prior to the date of acquisition reflect an allocation of general and administrative expenses determined by AEI
to the underlying business segments, including the Transferred Business. We have reviewed AEI’s general and
administrative expense allocation methodology, which is based on the relative total assets of AEI and the Transferred
Business, for the Transferred Business’ historical financial statements prior to the date of acquisition and believe the
methodology is reasonable and reflects the approximate general and administrative costs of our underlying business
segments.
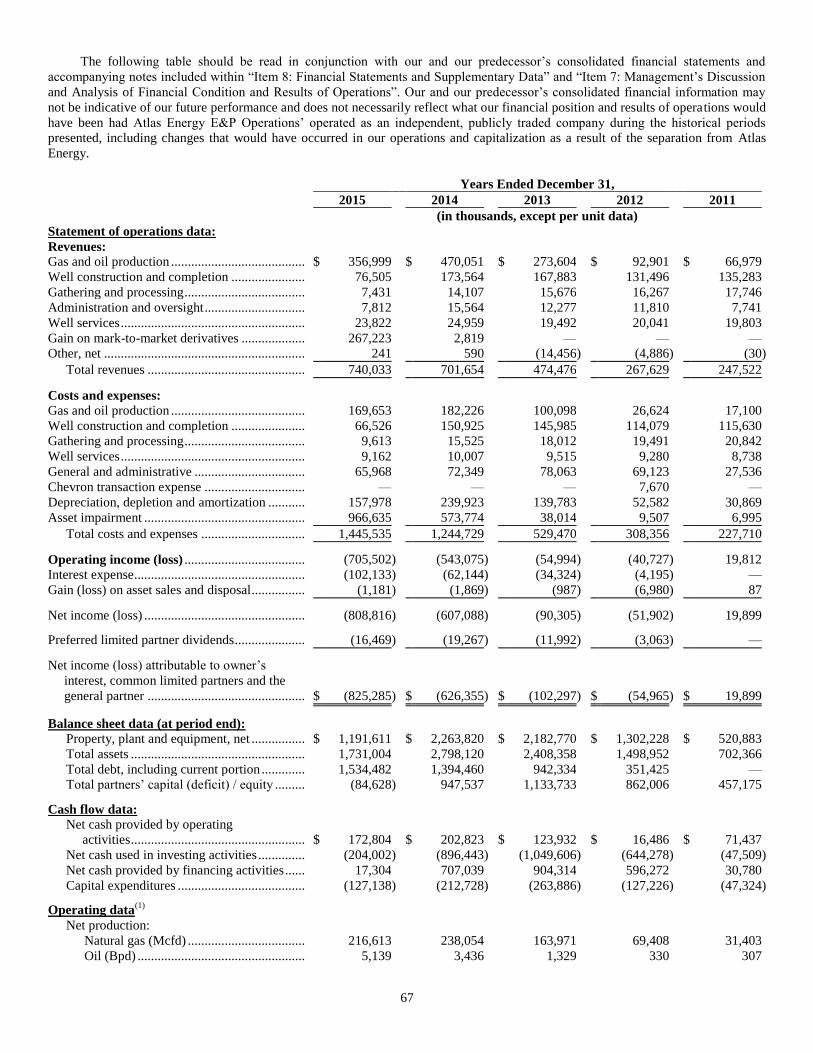
67
The following table should be read in conjunction with our and our predecessor’s consolidated financial statements and
accompanying notes included within “Item 8: Financial Statements and Supplementary Data” and “Item 7: Management’s Discussion
and Analysis of Financial Condition and Results of Operations”. Our and our predecessor’s consolidated financial information may
not be indicative of our future performance and does not necessarily reflect what our financial position and results of operations would
have been had Atlas Energy E&P Operations’ operated as an independent, publicly traded company during the historical periods
presented, including changes that would have occurred in our operations and capitalization as a result of the separation from Atlas
Energy.
Years Ended December 31,
2015 2014 2013 2012 2011
(in thousands, except per unit data)
Statement of operations data:
Revenues:
Gas and oil production ........................................ $ 356,999 $ 470,051 $ 273,604 $ 92,901 $ 66,979
Well construction and completion ...................... 76,505 173,564 167,883 131,496 135,283
Gathering and processing .................................... 7,431 14,107 15,676 16,267 17,746
Administration and oversight .............................. 7,812 15,564 12,277 11,810 7,741
Well services ....................................................... 23,822 24,959 19,492 20,041 19,803
Gain on mark-to-market derivatives ................... 267,223 2,819 — — —
Other, net ............................................................ 241 590 (14,456 ) (4,886 ) (30 )
Total revenues ............................................... 740,033 701,654 474,476 267,629 247,522
Costs and expenses:
Gas and oil production ........................................ 169,653 182,226 100,098 26,624 17,100
Well construction and completion ...................... 66,526 150,925 145,985 114,079 115,630
Gathering and processing .................................... 9,613 15,525 18,012 19,491 20,842
Well services ....................................................... 9,162 10,007 9,515 9,280 8,738
General and administrative ................................. 65,968 72,349 78,063 69,123 27,536
Chevron transaction expense .............................. — — — 7,670 —
Depreciation, depletion and amortization ........... 157,978 239,923 139,783 52,582 30,869
Asset impairment ................................................ 966,635 573,774 38,014 9,507 6,995
Total costs and expenses ............................... 1,445,535 1,244,729 529,470 308,356 227,710
Operating income (loss) ....................................
(705,502 ) (543,075 ) (54,994 ) (40,727 ) 19,812
Interest expense ................................................... (102,133 ) (62,144 ) (34,324 ) (4,195 ) —
Gain (loss) on asset sales and disposal ................ (1,181 ) (1,869 ) (987 ) (6,980 ) 87
Net income (loss) ................................................
(808,816 ) (607,088 ) (90,305 ) (51,902 ) 19,899
Preferred limited partner dividends .....................
(16,469 ) (19,267 ) (11,992 ) (3,063 ) —
Net income (loss) attributable to owner’s
interest, common limited partners and the
general partner ...............................................
$ (825,285 ) $ (626,355 ) $ (102,297 ) $ (54,965 ) $ 19,899
Balance sheet data (at period end):
Property, plant and equipment, net ................ $ 1,191,611 $ 2,263,820 $ 2,182,770 $ 1,302,228 $ 520,883
Total assets .................................................... 1,731,004 2,798,120 2,408,358 1,498,952 702,366
Total debt, including current portion ............. 1,534,482 1,394,460 942,334 351,425 —
Total partners’ capital (deficit) / equity ......... (84,628 ) 947,537 1,133,733 862,006 457,175
Cash flow data:
Net cash provided by operating
activities ....................................................
$ 172,804 $ 202,823 $ 123,932 $ 16,486 $ 71,437
Net cash used in investing activities .............. (204,002 ) (896,443 ) (1,049,606 ) (644,278 ) (47,509 )
Net cash provided by financing activities ...... 17,304 707,039 904,314 596,272 30,780
Capital expenditures ...................................... (127,138 ) (212,728 ) (263,886 ) (127,226 ) (47,324 )
Operating data(1)
Net production:
Natural gas (Mcfd) ................................... 216,613 238,054 163,971 69,408 31,403
Oil (Bpd) .................................................. 5,139 3,436 1,329 330 307

68
Years Ended December 31,
2015 2014 2013 2012 2011
(in thousands, except per unit data)
Natural gas liquids (Bpd) ................................. 3,155 3,802 3,473 974 444
Total (Mcfed) ................................ 266,374 281,486 192,786 77,232 35,912
Average sales price:
Natural gas (per Mcf)(2)
:
Realized price, after hedge(2)(3)
........... $ 3.41 $ 3.76 $ 3.48 $ 3.29 $ 4.98
Realized price, before hedge(2)
............ $ 2.23 $ 3.93 $ 3.25 $ 2.60 $ 4.53
Oil (per Bbl):
Realized price, after hedge(3)
.............. $ 84.30 $ 87.76 $ 91.01 $ 94.02 $ 89.70
Realized price, before hedge ............... $ 44.19 $ 82.22 $ 95.88 $ 91.32 $ 89.07
Natural gas liquids (per Bbl):
Realized price, after hedge(3)
.............. $ 22.40 $ 29.59 $ 28.71 $ 31.97 $ 48.26
Realized price, before hedge ............... $ 12.77 $ 29.39 $ 29.43 $ 31.97 $ 48.26
Production costs (per Mcfe):
Lease operating expenses(4):
$ 1.34 $ 1.27 $ 1.08 $ 0.82 $ 1.09
Production taxes ....................................... 0.19 0.27 0.18 0.12 0.10
Transportation and compression .............. 0.24 0.25 0.25 0.24 0.43
Total .............................................. $ 1.76 $ 1.80 $ 1.50 $ 1.19 $ 1.61
(1) “Mcf” represents thousand cubic feet; “Mcfe” represents thousand cubic feet equivalents; “Mcfd” represents thousand cubic feet
per day; “Mcfed” represents thousand cubic feet equivalents per day; and “Bbls” and “Bpd” represent barrels and barrels per
day.
(2) Excludes the impact of subordination of our production revenue to investor partners within our Drilling Partnerships. Including
the effect of this subordination, the average realized gas sales price $3.36 per Mcf ($2.19 per Mcf before the effects of financial
hedging), $3.67 per Mcf ($3.84 per Mcf before the effects of financial hedging), $3.23 per Mcf ($3.00 per Mcf before the effects
of financial hedging), $2.76 per Mcf ($2.08 per Mcf before the effects of financial hedging) and $4.28 per Mcf ($3.83 per Mcf
before the effects of financial hedging) for the years ended December 31, 2015, 2014, 2013, 2012 and 2011, respectively.
(3) Includes the impact of cash settlements on commodity derivative contracts not previously included within accumulated other
comprehensive income following our decision to de-designate hedges beginning on January 1, 2015, consisting of $48.6 million
associated with natural gas derivative contracts, $35.8 million associated with crude oil derivative contracts, and $8.3 million
associated with natural gas liquids derivative contracts for the year ended December 31, 2015 (see “Item 8. Financial Statements
– Note 8”).
(4) Excludes the effects of our proportionate share of lease operating expenses associated with subordination of our production
revenue to investor partners within our Drilling Partnerships. Including the effects of these costs, total lease operating expenses
per Mcfe were $1.32 per Mcfe ($1.74 per Mcfe for total production costs), $1.25 per Mcfe ($1.77 per Mcfe for total production
costs), $1.00 per Mcfe ($1.42 per Mcfe for total production costs), $0.58 per Mcfe ($0.94 per Mcfe for total production costs)
and $0.77 per Mcfe ($1.33 per Mcfe for total production costs) for the years ended December 31, 2015, 2014, 2013, 2012 and
2011, respectively.

69
ITEM 7: MANAGEMENT’S DISCUSSION AND ANALYSIS OF FINANCIAL CONDITION AND RESULTS OF
OPERATIONS
The discussion and analysis presented below provides information to assist in understanding our financial condition and results
of operations. This discussion should be read in conjunction with “Item 6: Selected Financial Data” and “Item 8: Financial Statements
and Supplemental Data”, which contains our consolidated financial statements.
Unless the context otherwise requires, references below to “Atlas Resource Partners, L.P.,” “Atlas Resource Partners,” “the
Partnership,” “we,” “us,” “our” and “our company”, when used for periods prior to March 5, 2012, refer to the subsidiaries and
operations that Atlas Energy, L.P. contributed to Atlas Resource Partners in connection with the separation and, when used for periods
after that date, refer to Atlas Resource Partners, L.P. and its consolidated subsidiaries. References below to “Atlas Energy” refer to
Atlas Energy, L.P. and its consolidated subsidiaries for all periods through February 27, 2015 and Atlas Energy Group, LLC for all
periods thereafter, unless the context otherwise requires.
The following discussion may contain forward-looking statements that reflect our plans, estimates and beliefs. Forward-looking
statements speak only as of the date the statements were made. The matters discussed in these forward-looking statements are subject
to risks, uncertainties and other factors that could cause actual results to differ materially from those made, projected or implied in the
forward-looking statements. Factors that could cause or contribute to these differences include those discussed below and in “Item 1A:
Risk Factors”. We believe the assumptions underlying the consolidated financial statements are reasonable. However, our
consolidated financial statements included herein may not necessarily reflect our results of operations, financial position and cash
flows in the future or what they would have been had our predecessor been a separate, stand-alone company during the periods
presented.
BUSINESS OVERVIEW
We are a publicly-traded (NYSE: ARP) Delaware master-limited partnership (“MLP”) and an independent developer and
producer of natural gas, crude oil and natural gas liquids (“NGL”), with operations in basins across the United States. We sponsor and
manage tax-advantaged investment partnerships (“Drilling Partnerships”), in which we coinvest, to finance a portion of our natural
gas, crude oil and natural gas liquid production activities.
On February 27, 2015, our general partner, Atlas Energy Group, LLC (“Atlas Energy Group”; NYSE: ATLS) distributed 100%
of its common units to existing unitholders of its then parent, Atlas Energy, L.P. (“Atlas Energy”), which was a publicly traded
master-limited partnership (NYSE: ATLS) (Atlas Energy and Atlas Energy Group are collectively referred to as “ATLS”). Atlas
Energy Group manages our operations and activities through its ownership of our general partner interest. Concurrent with Atlas
Energy Group’s unit distribution, Atlas Energy and its midstream ownership interests merged into Targa Resources Corp. (“Targa”;
NYSE: TRGP) (the “Atlas Merger”) and ceased trading. At December 31, 2015, Atlas Energy Group owned 100% of our general
partner Class A units, all of the incentive distribution rights through which it manages and effectively controls us, and an approximate
23.3% limited partner interest (20,962,485 common and 3,749,986 preferred limited partner units) in us.
In addition to its general and limited partner interest in us, ATLS also holds general and limited partner interests in the
following:
Atlas Growth Partners, L.P. (“AGP”), a Delaware limited partnership and an independent developer and producer of
natural gas, oil and NGLs, with operations primarily focused in the Eagle Ford Shale; and
Lightfoot Capital Partners, L.P. and Lightfoot Capital Partners GP, LLC, which incubate new MLPs and invest in existing
MLPs.
SUBSEQUENT EVENTS
Senior Note Repurchases. In January and February 2016, we executed transactions to repurchase portions of our senior
unsecured notes. Through the end of February 2016, we have repurchased approximately $20.3 million of our 7.75% Senior Notes in
2021 and approximately $12.1 million of our 9.25% Senior Notes for approximately $5.5 million. As a result of these transactions, we
will recognize approximately $25.9 million as gain on early extinguishment of debt in the first quarter of 2016.
Cash Distributions. On January 28, 2016, we declared a monthly distribution of $0.0125 per common unit for the month of
December 31, 2015. The $2.0 million distribution, including $39,000 and $0.6 million to the general partner and preferred limited
partners, respectively, was paid on February 12, 2016 to unitholders of record at the close of business on February 8, 2016.
70
On February 24, 2016, we declared a monthly distribution of $0.0125 per common unit for the month of January 31, 2016. The
$2.0 million distribution, including $39,000 and $0.6 million to the general partner as holder of common units and Class C preferred
limited units, respectively, will be paid on March 16, 2016 to unitholders of record at the close of business on March 9, 2016.
On January 15, 2016, we paid a quarterly distribution of $0.5390625 per Class D Preferred Unit, or $2.2 million, for the period
from October 15, 2015 through January 14, 2016 to Class D Preferred Unitholders of record as of January 4, 2016.
On January 15, 2016, we paid a quarterly distribution of $0.671875 per Class E Preferred Unit, or $0.2 million, for the period
from October 15, 2015 through January 14, 2016 to Class E Preferred Unitholders of record as of January 4, 2016.
NYSE Compliance. On January 12, 2016, we were notified by the NYSE that we were not in compliance with NYSE’s
continued listing criteria under Section 802.01C of the NYSE Listed Company Manual because the average closing price of the
common units had been less than $1.00 for 30 consecutive trading days. We are working to remedy this situation in a timely manner
as set forth in the applicable NYSE rules in order to maintain our listing on the NYSE.
RECENT DEVELOPMENTS
Credit Facility Amendment. On November 23, 2015, we entered into an Eighth Amendment to the Second Amended and
Restated Credit Agreement (the “Amendment”) with Wells Fargo Bank, National Association, as administrative agent, and the lenders
party thereto, which amendment amends the Second Amended and Restated Credit Agreement dated July 31, 2013 (as amended from
time to time, the “Credit Agreement”). Among other things, the Eighth Amendment:
reduced the borrowing base under the Credit Agreement from $750.0 million to $700.0 million;
increased the applicable margin on Eurodollar loans and ABR loans by 0.25% from previous levels;
permits the incurrence of third lien debt subject to the satisfaction of certain conditions, including pro forma financial
covenant compliance;
upon the issuance of any third lien debt, reduces the borrowing base by 25% of the stated amount of such third lien debt
(other than third lien debt that is used to refinance senior notes, second lien debt and other third lien debt);
suspends compliance with a maximum ratio of Total Funded Debt (as defined in the Credit Agreement) to EBITDA (as
defined in the Credit Agreement) until the four fiscal quarter period ending March 31, 2017 and revised the maximum
ratio of Total Funded Debt to EBITDA to be 5.75 to 1.00 for the four quarter periods ending March 31, 2017 and June 30,
2017, 5.50 to 1.00 for the four quarter periods ending September 30, 2017 and December 31, 2017, 5.25 to 1.00 for the
four quarter period ending March 31, 2018, and 5.00 to 1.00 for each four fiscal quarter period ending thereafter;
replaced the requirement to maintain compliance with a maximum ratio of Senior Secured Total Funded Debt to EBITDA
with a requirement to be in compliance with a maximum ratio of First Lien Debt (as defined in the Credit Agreement) to
EBITDA of 2.75 to1.00; and
reset the distribution to $0.15 per common unit and permits increases to the distribution per common unit if (a) the ratio of
Total Funded Debt (as of such date) to EBITDA for the most recent four fiscal quarters is equal to or less than 5.00 to1.00
and (b) the borrowing base utilization is less than or equal to 85%, on a pro forma basis after giving effect to the
distribution payment.
A Seventh Amendment to the Credit Agreement was entered into on July 24, 2015. Among other things, the Seventh
Amendment redefined EBITDA.
A Sixth Amendment to the Credit Agreement was entered into on February 23, 2015. Among other things, the Sixth
Amendment:
reduced the borrowing base under the Credit Agreement from $900.0 million to $750.0 million;
permitted the incurrence of second lien debt in an aggregate principal amount up to $300.0 million;
rescheduled the May 1, 2015 borrowing base redetermination for July 1, 2015;
if the borrowing base utilization (as defined in the Credit Agreement) is less than 90%, increases the applicable margin on
Eurodollar loans and ABR loans by 0.25% from previous levels;
71
following the next scheduled redetermination of the borrowing base, upon the issuance of senior notes or the incurrence of
second lien debt, reduces the borrowing base by 25% of the stated amount of such senior notes or additional second lien
debt; and
revised the maximum ratio of Total Funded Debt to EBITDA to be (i) 5.25 to 1.0 as of the last day of the quarters ending
on March 31, 2015, June 30, 2015, September 30, 2015, December 31, 2015 and March 31, 2016, (ii) 5.00 to 1.0 as of the
last day of the quarters ending on June 30, 2016, September 30, 2016 and December 31, 2016, (iii) 4.50 to 1.0 as of the
last day of the quarter ending on March 31, 2017 and (iv) 4.00 to 1.0 as of the last day of each quarter thereafter.
Funding of AGP’s Eagle Ford Deferred Purchase Price. In connection with the Eagle Ford Acquisition, we guaranteed the
timely payment of the deferred portion of the purchase price that was to be paid by AGP. Pursuant to the agreement between us and
AGP, we had the right to receive some or all of the assets acquired by AGP in the event of its failure to contribute its portion of any
deferred payments. In connection with the second installment payments, we and AGP amended the purchase and sale agreement to
alter the timing and amount of the quarterly installment payments beginning on March 31, 2015 and ending December 31, 2015. On
September 21, 2015, we and AGP, in accordance with the terms of the Eagle Ford shared acquisition and operating agreement, agreed
that we would fund AGP’s remaining two deferred purchase price installments, which were paid on October 1, 2015 and December
31, 2015.
Arkoma Acquisition. On June 5, 2015, we completed the acquisition of ATLS’s coal-bed methane producing natural gas assets
in the Arkoma Basin in eastern Oklahoma for approximately $31.5 million, net of purchase price adjustments (the “Arkoma
Acquisition”). We funded the purchase price through the issuance of 6,500,000 common limited partner units. The Arkoma
Acquisition had an effective date of January 1, 2015, however, as the acquisition constituted a transaction between entities under
common control, we retrospectively adjusted our consolidated financial statements for dates prior to the date of acquisition to reflect
our results on a consolidated basis with the results of the Arkoma assets as of or at the beginning of the respective period.
Issuance of Common Units. In May 2015, in connection with the Arkoma Acquisition, we issued 6,500,000 of our common
limited partner units in a public offering at a price of $7.97 per unit, yielding net proceeds of approximately $49.5 million. We used a
portion of the net proceeds to fund the Arkoma Acquisition and to reduce borrowings outstanding under our revolving credit facility
(see “Issuance of Units”).
Issuance of Preferred Units. In April 2015, we issued 255,000 of our 10.75% Class E Cumulative Redeemable Perpetual
Preferred Units (“Class E Preferred Units”) at a public offering price of $25.00 per unit for net proceeds of approximately $6.0
million. We pay distributions on the Class E Preferred Units at a rate of 10.75% per annum of the stated liquidation preference of
$25.00 (see “Issuance of Units”).
Second Lien Term Loan Facility. On February 23, 2015, we entered into a Second Lien Credit Agreement (the “Second Lien
Credit Agreement”) with certain lenders and Wilmington Trust, National Association, as administrative agent. The Second Lien Credit
Agreement provides for a second lien term loan in an original principal amount of $250.0 million (the “Term Loan Facility”). The
Term Loan Facility matures on February 23, 2020.
Our obligations under the Term Loan Facility are secured on a second priority basis by security interests in all of our assets and
those of our restricted subsidiaries that guarantee our existing first lien revolving credit facility. In addition, the obligations under the
Term Loan Facility are guaranteed by our material restricted subsidiaries. Borrowings under the Term Loan Facility bear interest, at
our option, at either (i) LIBOR plus 9.0% or (ii) the highest of (a) the prime rate, (b) the federal funds rate plus 0.50%, (c) one-month
LIBOR plus 1.0% and (d) 2.0%, each plus 8.0% (an “ABR Loan”). Interest is generally payable at the last day of the applicable
interest period (or, with respect to interest periods of more than three-months’ duration, each day prior to the last day of such interest
period that occurs at intervals of three months’ duration after the first day of such interest period) for Eurodollar loans and quarterly
for ABR loans (see “Credit Facilities”).
CONTRACTUAL REVENUE ARRANGEMENTS
Natural Gas. We market the majority of our natural gas production to gas marketers directly or to third party plant operators
who process and market our gas. The sales price of natural gas produced is a function of the market in the area and typically linked to
a regional index. The pricing indices for the majority of our production areas are as follows:
Appalachian Basin - Dominion South Point, Tennessee Gas Pipeline Zone 4 (200 Leg), Transco Leidy Line, Columbia
Appalachia, NYMEX and Transco Zone 5;
Mississippi Lime - Southern Star;
Barnett Shale and Marble Falls- primarily Waha;
72
Raton - ANR, Panhandle, and NGPL;
Black Warrior Basin - Southern Natural;
Eagle Ford – Transco Zone 1;
Arkoma – Enable Gas; and
Other regions - primarily the Texas Gas Zone SL spot market (New Albany Shale) and the Cheyenne Hub spot market
(Niobrara).
We attempt to sell the majority of our natural gas at monthly, fixed index prices and a smaller portion at index daily prices.
We hold firm transportation obligations on Colorado Interstate Gas for the benefit of production from the Raton Basin in the
New Mexico/Colorado Area. The total of firm transportation obligations held is approximately 82,500 dth/d under contracts expiring
in 2016. We also hold firm transportation obligations on East Tennessee Natural Gas (25,000 dth/d), Columbia Gas Transmission
(14,000 dth/d) and Equitrans (12,300 dth/d) for the benefit of production from the central Appalachian Basin under contracts expiring
between the years 2016 and 2024. We hold gathering obligations on ETC that was inherited from Cinco in the Eagle Ford acquisition.
The total gathering obligations held is 4,750 mcf/d under contracts expiring in 2016.
Crude Oil. Crude oil produced from our wells flows directly into leasehold storage tanks where it is picked up by an oil
company or a common carrier acting for an oil company. The crude oil is typically sold at the prevailing spot market price for each
region, less appropriate trucking/pipeline charges. The oil and natural gas liquids production of our Rangely assets flows into a
common carrier pipeline and is sold at prevailing market prices, less applicable transportation and oil quality differentials. We do not
have delivery commitments for fixed and determinable quantities of crude oil in any future periods under existing contracts or
agreements.
Natural Gas Liquids. NGLs are extracted from the natural gas stream by processing and fractionation plants enabling the
remaining “dry” gas to meet pipeline specifications for transport or sale to end users or marketers operating on the receiving pipeline.
The resulting plant residue natural gas is sold as indicated above and our NGLs are generally priced and sold using the Mont Belvieu
(TX) or Conway (KS) regional processing indices. The cost to process and fractionate the NGLs from the gas stream is typically either
a volumetric fee for the gas and liquids processed or a percentage retention by the processing and fractionation facility. We do not
have delivery commitments for fixed and determinable quantities of NGLs in any future periods under existing contracts or
agreements.
For the year ended December 31, 2015, Tenaska Marketing Ventures, Chevron, Enterprise and Interconn Resources LLC
accounted for approximately 21%, 15%, 11% and 11% of our total natural gas, oil and NGL production revenues, respectively, with
no other single customer accounting for more than 10% for this period.
Drilling Partnerships. Certain energy activities are conducted by us through, and a portion of our revenues are attributable to,
sponsorship of our Drilling Partnerships. Drilling Partnership investor capital raised by us is deployed to drill and complete wells
included within the partnership. As we deploy Drilling Partnership investor capital, we recognize certain management fees we are
entitled to receive, including well construction and completion revenue and a portion of administration and oversight revenue. At each
period end, if we have Drilling Partnership investor capital that has not yet been deployed, we will recognize a current liability titled
“Liabilities Associated with Drilling Contracts” on our consolidated balance sheets. After the Drilling Partnership well is completed
and turned in line (i.e. wells that have been drilled, completed, and connected to a gathering system), we are entitled to receive
additional operating and management fees, which are included within well services and administration and oversight revenue,
respectively, on a monthly basis while the well is operating. In addition to the management fees we are entitled to receive for services
provided, we are also entitled to our pro-rata share of Drilling Partnership gas and oil production revenue, which generally
approximates 30%.
73
As the ultimate managing general partner of our Drilling Partnerships, we receive the following Drilling Partnership
management fees:
Well construction and completion. For each well that is drilled by a Drilling Partnership, we receive a 15% mark-up on
those costs incurred to drill and complete the wells included within the partnership. Such fees are earned, in accordance
with each Drilling Partnership’s partnership agreement, and recognized as the services are performed, typically between
60 and 270 days.
Administration and oversight. For each well drilled by a Drilling Partnership, we receive a fixed fee between $100,000
and $500,000, depending on the type of well drilled, which is earned in accordance with each Drilling Partnership’s
partnership agreement and recognized at the initiation of the well. Additionally, the Drilling Partnership pays us a monthly
per well administrative fee of $75 for the life of the well. The well administrative fee is earned on a monthly basis as the
services are performed; and
Well services. Each Drilling Partnership pays us a monthly per well operating fee, currently $1,000 to $2,000, depending
on the type of well, for the life of the well. Such fees are earned on a monthly basis as the services are performed.
Gathering and processing revenue includes gathering fees we charge to the Drilling Partnership wells for our processing plants
in the New Albany and the Chattanooga Shales. Generally, we charge a gathering fee to the Drilling Partnership wells equivalent to
the fees we remit. In Appalachia, a majority of our Drilling Partnership wells are subject to a gathering agreement, whereby we remit a
gathering fee of 16%. However, based on the respective Drilling Partnership agreements, we charge our Drilling Partnership wells a
13% gathering fee. As a result, some of our gathering expenses within our partnership management segment, specifically those in the
Appalachian Basin, will generally exceed the revenues collected from Drilling Partnerships by approximately 3%.
While the historical structure has varied, we have generally agreed to subordinate a portion of our share of Drilling Partnership
gas and oil production revenue, net of corresponding production costs and up to a maximum of 50% of unhedged revenue, from
certain Drilling Partnerships for the benefit of the limited partner investors until they have received specified returns, typically from
10% to 12% per year determined on a cumulative basis, over a specified period, typically the first five to eight years, in accordance
with the terms of the partnership agreements. We periodically compare the projected return on investment for limited partners in a
Drilling Partnership during the subordination period, based upon historical and projected cumulative gas and oil production revenue
and expenses, with the return on investment subject to subordination agreed upon within the Drilling Partnership agreement. If the
projected return on investment falls below the agreed upon rate, we recognize subordination as an estimated reduction of our pro-rata
share of gas and oil production revenue, net of corresponding production costs, during the current period in an amount that will
achieve the agreed upon investment return, subject to the limitation of 50% of unhedged cumulative net production revenues over the
subordination period. For Drilling Partnerships for which we have recognized subordination in a historical period, if projected
investment returns subsequently reflect that the agreed upon limited partner investment return will be achieved during the
subordination period, we will recognize an estimated increase in our portion of historical cumulative gas and oil net production,
subject to a limitation of the cumulative subordination previously recognized.
GENERAL TRENDS AND OUTLOOK
We expect our business to be affected by key trends in natural gas and oil production markets. Our expectations are based on
assumptions made by us and information currently available to us. To the extent our underlying assumptions about or interpretations
of available information prove to be incorrect, our actual results may vary materially from our expected results.
The natural gas, oil and natural gas liquids commodity price markets have suffered significant declines during the fourth quarter
of 2014 and throughout 2015. The causes of these declines are based on a number of factors, including, but not limited to, a significant
increase in natural gas, oil and NGL production. While we anticipate continued high levels of exploration and production activities
over the long-term in the areas in which we operate, fluctuations in energy prices can greatly affect production rates and investments
in the development of new natural gas, oil and NGL reserves.
Our future gas and oil reserves, production, cash flow, our ability to make payments on our debt and our ability to make
distributions to our unitholders, including ATLS, depend on our success in producing our current reserves efficiently, developing our
existing acreage and acquiring additional proved reserves economically. We face the challenge of natural production declines and
volatile natural gas, oil and NGL prices. As initial reservoir pressures are depleted, natural gas and oil production from particular wells
decrease. We attempt to overcome this natural decline by drilling to find additional reserves and acquiring more reserves than we
produce.

74
RESULTS OF OPERATIONS
Gas and Oil Production
Production Profile. Currently, we have focused our natural gas, crude oil and NGL production operations in various plays
throughout the United States. Through December 31, 2015, we have established production positions in the following operating areas:
the Appalachia Basin assets, including the Marcellus Shale, a rich, organic shale that generally contains dry, pipeline-
quality natural gas, and the Utica Shale, which lies several thousand feet below the Marcellus Shale, is much thicker than
the Marcellus Shale and trends primarily towards wet natural gas in the central region and dry gas in the eastern region;
coal-bed methane producing natural gas assets in the Raton Basin in northern New Mexico and the Black Warrior Basin in
central Alabama, where we established a position following our acquisition of certain assets from EP Energy during 2013,
as well as the Central Appalachia Basin in West Virginia and Virginia, where we established a position following our
acquisition of assets from GeoMet Inc. in May 2014, and the Arkoma Basin in eastern Oklahoma, where we established a
position following the Arkoma Acquisition (see “Recent Developments”);
the Barnett Shale and Marble Falls play, both in the Fort Worth Basin in northern Texas. The Barnett Shale contains
mostly dry gas and the Marble Falls play contains liquids rich gas and oil.
the Rangely field in northwest Colorado, a mature tertiary CO2 flood with low-decline oil production, where we have a
25% non-operated net working interest position following our acquisition on June 30, 2014 (“Rangely Acquisition”);
the Eagle Ford Shale in south Texas, in which we and AGP acquired acreage and producing wells in November 2014;
the Mississippi Lime and Hunton plays in northwestern Oklahoma, an oil and NGL-rich area; and
our other operating areas, including the Chattanooga Shale in northeastern Tennessee, which enables us to access other
formations in that region such as the Monteagle and Ft. Payne Limestone; the New Albany Shale in southwestern Indiana,
a biogenic shale play with a long-lived and shallow decline profile; and the Niobrara Shale in northeastern Colorado, a
predominantly biogenic shale play that produces dry gas.

75
The following table presents the number of wells we drilled and the number of wells we turned in line, both gross and for our
interest, during the years ended December 31, 2015, 2014 and 2013:
Years Ended December 31,
2015 2014 2013
Gross wells drilled:
Appalachia – Utica .................................................. — 4 3
Barnett/Marble Falls ................................................ 3 97 75
Eagle Ford ............................................................... 21 2 —
Mississippi Lime ..................................................... 4 26 25
Total ............................................................. 28 129 103
Net wells drilled(1)
:
Appalachia – Utica .................................................. — 1 1
Barnett/Marble Falls ................................................ 2 51 55
Eagle Ford ............................................................... 12 1 —
Mississippi Lime ..................................................... 3 14 10
Total ............................................................. 17 67 66
Gross wells turned in line(2)(3)
:
Appalachia ..............................................................
Marcellus Shale ................................................. — — 9
Utica................................................................... 4 3 5
Barnett/Marble Falls ................................................ 14 94 82
Eagle Ford ............................................................... 5 — —
Mississippi Lime ..................................................... 13 22 21
Total ............................................................. 36 119 117
Net wells turned in line(2)(3)
:
Appalachia ..............................................................
Marcellus Shale ................................................. — — 3
Utica................................................................... 1 1 2
Barnett/Marble Falls ................................................ 4 53 65
Eagle Ford ............................................................... 4 — —
Mississippi Lime ..................................................... 6 10 10
Total ............................................................. 15 64 80
(1) Includes (i) our percentage interest in the wells in which we have a direct ownership interest and (ii) our percentage interest in the wells based on our percentage
ownership in our Drilling Partnerships.
(2) Wells turned in line refers to wells that have been drilled, completed, and connected to a gathering system.
(3) There were no exploratory wells drilled during the years ended December 31, 2015, 2014 and 2013; there were no gross or net dry wells within our operating
areas during the year ended December 31, 2015, 2014 and 2013.
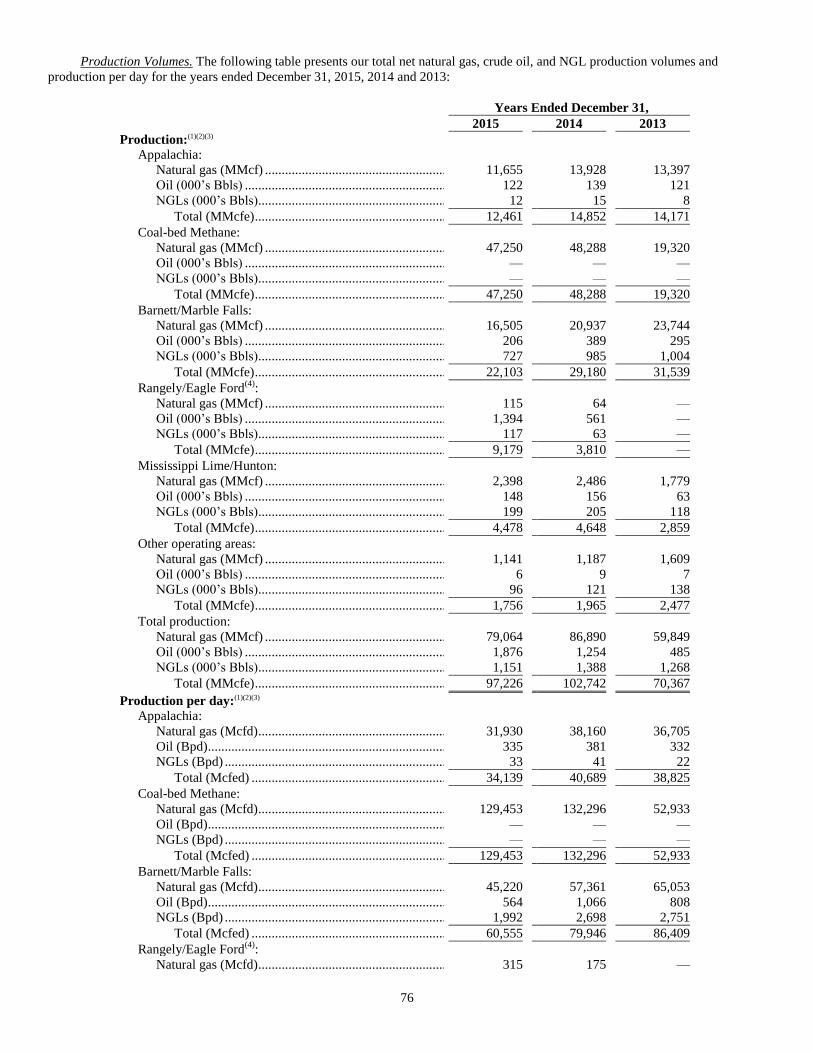
76
Production Volumes. The following table presents our total net natural gas, crude oil, and NGL production volumes and
production per day for the years ended December 31, 2015, 2014 and 2013:
Years Ended December 31,
2015 2014 2013
Production:(1)(2)(3)
Appalachia:
Natural gas (MMcf) .......................................................... 11,655 13,928 13,397
Oil (000’s Bbls) ................................................................ 122 139 121
NGLs (000’s Bbls)............................................................ 12 15 8
Total (MMcfe) ............................................................. 12,461 14,852 14,171
Coal-bed Methane:
Natural gas (MMcf) .......................................................... 47,250 48,288 19,320
Oil (000’s Bbls) ................................................................ — — —
NGLs (000’s Bbls)............................................................ — — —
Total (MMcfe) ............................................................. 47,250 48,288 19,320
Barnett/Marble Falls:
Natural gas (MMcf) .......................................................... 16,505 20,937 23,744
Oil (000’s Bbls) ................................................................ 206 389 295
NGLs (000’s Bbls)............................................................ 727 985 1,004
Total (MMcfe) ............................................................. 22,103 29,180 31,539
Rangely/Eagle Ford(4)
:
Natural gas (MMcf) .......................................................... 115 64 —
Oil (000’s Bbls) ................................................................ 1,394 561 —
NGLs (000’s Bbls)............................................................ 117 63 —
Total (MMcfe) ............................................................. 9,179 3,810 —
Mississippi Lime/Hunton:
Natural gas (MMcf) .......................................................... 2,398 2,486 1,779
Oil (000’s Bbls) ................................................................ 148 156 63
NGLs (000’s Bbls)............................................................ 199 205 118
Total (MMcfe) ............................................................. 4,478 4,648 2,859
Other operating areas:
Natural gas (MMcf) .......................................................... 1,141 1,187 1,609
Oil (000’s Bbls) ................................................................ 6 9 7
NGLs (000’s Bbls)............................................................ 96 121 138
Total (MMcfe) ............................................................. 1,756 1,965 2,477
Total production:
Natural gas (MMcf) .......................................................... 79,064 86,890 59,849
Oil (000’s Bbls) ................................................................ 1,876 1,254 485
NGLs (000’s Bbls)............................................................ 1,151 1,388 1,268
Total (MMcfe) ............................................................. 97,226 102,742 70,367
Production per day:(1)(2)(3)
Appalachia:
Natural gas (Mcfd)............................................................ 31,930 38,160 36,705
Oil (Bpd) ........................................................................... 335 381 332
NGLs (Bpd) ...................................................................... 33 41 22
Total (Mcfed) .............................................................. 34,139 40,689 38,825
Coal-bed Methane:
Natural gas (Mcfd)............................................................ 129,453 132,296 52,933
Oil (Bpd) ........................................................................... — — —
NGLs (Bpd) ...................................................................... — — —
Total (Mcfed) .............................................................. 129,453 132,296 52,933
Barnett/Marble Falls:
Natural gas (Mcfd)............................................................ 45,220 57,361 65,053
Oil (Bpd) ........................................................................... 564 1,066 808
NGLs (Bpd) ...................................................................... 1,992 2,698 2,751
Total (Mcfed) .............................................................. 60,555 79,946 86,409
Rangely/Eagle Ford(4)
:
Natural gas (Mcfd)............................................................ 315 175 —

77
Years Ended December 31,
2015 2014 2013
Oil (Bpd) ........................................................................... 3,818 1,538 —
NGLs (Bpd) ...................................................................... 320 173 —
Total (Mcfed) .............................................................. 25,147 10,438 —
Mississippi Lime/Hunton:
Natural gas (Mcfd)............................................................ 6,570 6,810 4,873
Oil (Bpd) ........................................................................... 404 427 171
NGLs (Bpd) ...................................................................... 546 561 322
Total (Mcfed) .............................................................. 12,269 12,734 7,834
Other operating areas:
Natural gas (Mcfd)............................................................ 3,126 3,253 4,408
Oil (Bpd) ........................................................................... 17 25 18
NGLs (Bpd) ...................................................................... 263 330 378
Total (Mcfed) .............................................................. 4,811 5,384 6,786
Total production per day:
Natural gas (Mcfd)............................................................ 216,613 238,054 163,971
Oil (Bpd) ........................................................................... 5,139 3,436 1,329
NGLs (Bpd) ...................................................................... 3,155 3,802 3,473
Total (Mcfed) .............................................................. 266,374 281,486 192,786
(1) Production quantities consist of the sum of (i) our proportionate share of production from wells in which we have a direct
interest, based on our proportionate net revenue interest in such wells, and (ii) our proportionate share of production from wells
owned by the Drilling Partnerships in which we have an interest, based on our equity interest in each such Drilling Partnership
and based on each Drilling Partnership’s proportionate net revenue interest in these wells.
(2) “MMcf” represents million cubic feet; “MMcfe” represent million cubic feet equivalents; “Mcfd” represents thousand cubic feet
per day; “Mcfed” represents thousand cubic feet equivalents per day; and “Bbls” and “Bpd” represent barrels and barrels per
day. Barrels are converted to Mcfe using the ratio of approximately 6 Mcf to one barrel.
(3) Appalachia includes our production located in Pennsylvania, Ohio, New York and West Virginia (excluding the Cedar Bluff
area); Coal-bed methane includes our production located in the Raton Basin in northern New Mexico, the Black Warrior Basin
in central Alabama, the Cedar Bluff area of West Virginia and Virginia, and the Arkoma Basin in eastern Oklahoma;
Rangely/Eagle Ford includes our 25% non-operated net working interest in oil and natural gas liquids producing assets in the
Rangely field in northwest Colorado and our production located in southern Texas; Other operating areas include our production
located in the Chattanooga, New Albany and Niobrara Shales.
(4) Rangely includes production from July 1, 2014, the date of the acquisition, through December 31, 2014; Eagle Ford includes
production from November 5, 2014, the date of the acquisition, through December 31, 2014. Production per day represents
production based on the full 365-day year ended December 31, 2014.

78
Production Revenues, Prices and Costs. Our production revenues and estimated gas and oil reserves are substantially dependent
on prevailing market prices for natural gas and oil. The following table presents our production revenues and average sales prices for
our natural gas, oil, and natural gas liquids production for the years ended December 31, 2015, 2014 and 2013 along with our average
production costs, which include lease operating expenses, taxes, and transportation and compression costs, in each of the reported
periods:
Years Ended December 31,
2015 2014 2013
Production revenues (in thousands):(1)
Appalachia:
Natural gas revenue ............................................................... $ 13,062 $ 40,030 $ 36,375
Oil revenue ............................................................................ 8,115 11,785 10,564
Natural gas liquids revenue ................................................... 192 599 223
Total revenues .................................................................. $ 21,369 $ 52,414 $ 47,162
Coal-bed Methane:
Natural gas revenue ............................................................... $ 158,162 $ 197,831 $ 72,876
Oil revenue ............................................................................ — — —
Natural gas liquids revenue ................................................... — — —
Total revenues .................................................................. $ 158,162 $ 197,831 $ 72,876
Barnett/Marble Falls:
Natural gas revenue ............................................................... $ 36,682 $ 65,562 $ 70,167
Oil revenue ............................................................................ 4,767 35,772 26,578
Natural gas liquids revenue ................................................... 9,740 26,344 26,929
Total revenues .................................................................. $ 51,189 $ 127,678 $ 123,674
Rangely/Eagle Ford(6)
:
Natural gas revenue ............................................................... $ 456 $ 183 $ —
Oil revenue ............................................................................ 104,010 47,597 —
Natural gas liquids revenue ................................................... 4,283 3,254 —
Total revenues .................................................................. $ 108,749 $ 51,034 $ —
Mississippi Lime/Hunton:
Natural gas revenue ............................................................... $ 4,625 $ 10,134 $ 7,010
Oil revenue ............................................................................ 4,885 14,044 6,452
Natural gas liquids revenue ................................................... 2,909 7,459 5,175
Total revenues .................................................................. $ 12,419 $ 31,637 $ 18,637
Other operating areas:
Natural gas revenue ............................................................... $ 4,249 $ 5,180 $ 6,622
Oil revenue ............................................................................ 496 872 566
Natural gas liquids revenue ................................................... 366 3,405 4,067
Total revenues .................................................................. $ 5,111 $ 9,457 $ 11,255
Total production revenues:
Natural gas revenue ............................................................... $ 217,236 $ 318,920 $ 193,050
Oil revenue ............................................................................ 122,273 110,070 44,160
Natural gas liquids revenue ................................................... 17,490 41,061 36,394
Total revenues .................................................................. $ 356,999 $ 470,051 $ 273,604
Average sales price:
Natural gas (per Mcf):(2)
Total realized price, after hedge(3) (4)
...................................... $ 3.41 $ 3.76 $ 3.48
Total realized price, before hedge(3)
...................................... $ 2.23 $ 3.93 $ 3.25
Oil (per Bbl):(2)
Total realized price, after hedge(4)
......................................... $ 84.30 $ 87.76 $ 91.01
Total realized price, before hedge.......................................... $ 44.19 $ 82.22 $ 95.88
Natural gas liquids (per Bbl):(2)
Total realized price, after hedge(4)
......................................... $ 22.40 $ 29.59 $ 28.71
Total realized price, before hedge.......................................... $ 12.77 $ 29.39 $ 29.43
Production costs (per Mcfe):(1) (2)
Appalachia:
Lease operating expenses(5)
................................................... $ 1.04 $ 1.12 $ 1.08
Production taxes .................................................................... 0.06 0.06 0.07
Transportation and compression ............................................ 0.26 0.45 0.47
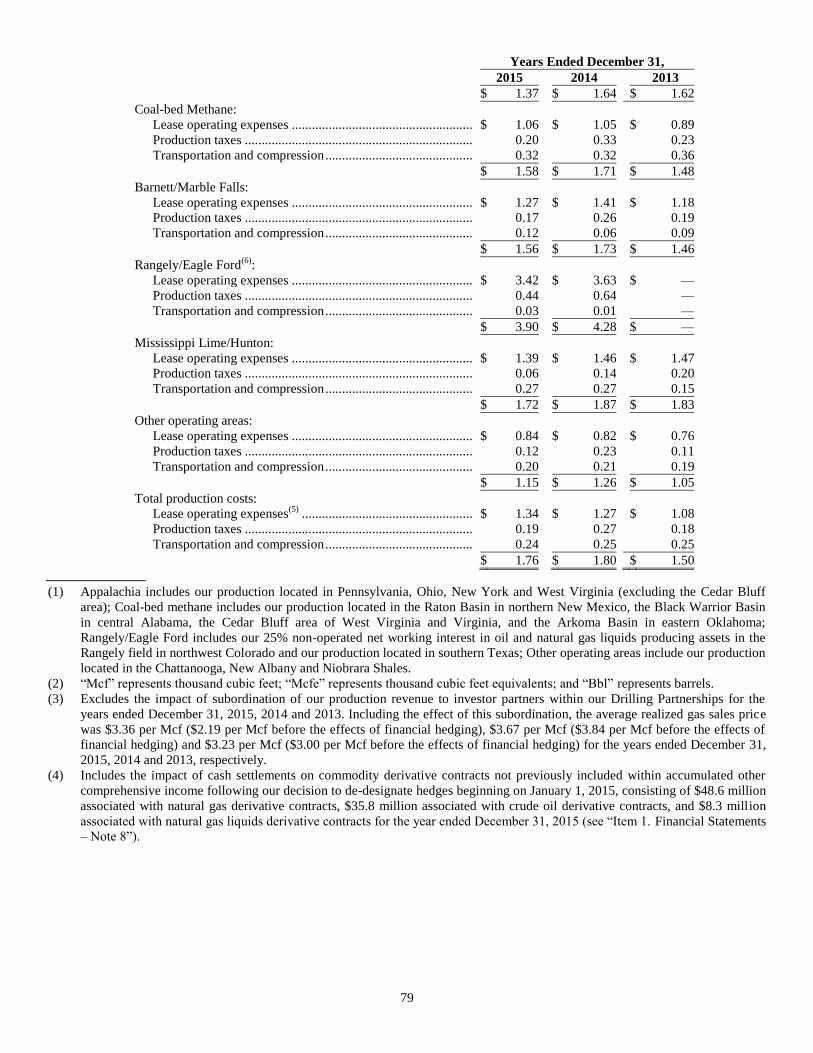
79
Years Ended December 31,
2015 2014 2013
$ 1.37 $ 1.64 $ 1.62
Coal-bed Methane:
Lease operating expenses ...................................................... $ 1.06 $ 1.05 $ 0.89
Production taxes .................................................................... 0.20 0.33 0.23
Transportation and compression ............................................ 0.32 0.32 0.36
$ 1.58 $ 1.71 $ 1.48
Barnett/Marble Falls:
Lease operating expenses ...................................................... $ 1.27 $ 1.41 $ 1.18
Production taxes .................................................................... 0.17 0.26 0.19
Transportation and compression ............................................ 0.12 0.06 0.09
$ 1.56 $ 1.73 $ 1.46
Rangely/Eagle Ford(6)
:
Lease operating expenses ...................................................... $ 3.42 $ 3.63 $ —
Production taxes .................................................................... 0.44 0.64 —
Transportation and compression ............................................ 0.03 0.01 —
$ 3.90 $ 4.28 $ —
Mississippi Lime/Hunton:
Lease operating expenses ...................................................... $ 1.39 $ 1.46 $ 1.47
Production taxes .................................................................... 0.06 0.14 0.20
Transportation and compression ............................................ 0.27 0.27 0.15
$ 1.72 $ 1.87 $ 1.83
Other operating areas:
Lease operating expenses ...................................................... $ 0.84 $ 0.82 $ 0.76
Production taxes .................................................................... 0.12 0.23 0.11
Transportation and compression ............................................ 0.20 0.21 0.19
$ 1.15 $ 1.26 $ 1.05
Total production costs:
Lease operating expenses(5)
................................................... $ 1.34 $ 1.27 $ 1.08
Production taxes .................................................................... 0.19 0.27 0.18
Transportation and compression ............................................ 0.24 0.25 0.25
$ 1.76 $ 1.80 $ 1.50
(1) Appalachia includes our production located in Pennsylvania, Ohio, New York and West Virginia (excluding the Cedar Bluff
area); Coal-bed methane includes our production located in the Raton Basin in northern New Mexico, the Black Warrior Basin
in central Alabama, the Cedar Bluff area of West Virginia and Virginia, and the Arkoma Basin in eastern Oklahoma;
Rangely/Eagle Ford includes our 25% non-operated net working interest in oil and natural gas liquids producing assets in the
Rangely field in northwest Colorado and our production located in southern Texas; Other operating areas include our production
located in the Chattanooga, New Albany and Niobrara Shales.
(2) “Mcf” represents thousand cubic feet; “Mcfe” represents thousand cubic feet equivalents; and “Bbl” represents barrels.
(3) Excludes the impact of subordination of our production revenue to investor partners within our Drilling Partnerships for the
years ended December 31, 2015, 2014 and 2013. Including the effect of this subordination, the average realized gas sales price
was $3.36 per Mcf ($2.19 per Mcf before the effects of financial hedging), $3.67 per Mcf ($3.84 per Mcf before the effects of
financial hedging) and $3.23 per Mcf ($3.00 per Mcf before the effects of financial hedging) for the years ended December 31,
2015, 2014 and 2013, respectively.
(4) Includes the impact of cash settlements on commodity derivative contracts not previously included within accumulated other
comprehensive income following our decision to de-designate hedges beginning on January 1, 2015, consisting of $48.6 million
associated with natural gas derivative contracts, $35.8 million associated with crude oil derivative contracts, and $8.3 million
associated with natural gas liquids derivative contracts for the year ended December 31, 2015 (see “Item 1. Financial Statements
– Note 8”).

80
(5) Excludes the effects of our proportionate share of lease operating expenses associated with subordination of our production
revenue to investor partners within our Drilling Partnerships for the year ended December 31, 2015, 2014 and 2013. Including
the effects of these costs, Appalachia lease operating expenses were $0.88 per Mcfe ($1.21 per Mcfe for total production costs),
$0.96 per Mcfe ($1.47 per Mcfe for total production costs) and $0.69 per Mcfe ($1.23 per Mcfe for total production costs) for
the years ended December 31, 2015, 2014 and 2013, respectively. Including the effects of these costs, total lease operating
expenses per Mcfe were $1.32 per Mcfe ($1.74 per Mcfe for total production costs), $1.25 per Mcfe ($1.77 per Mcfe for total
production costs) and $1.00 per Mcfe ($1.42 per Mcfe for total production costs) for the years ended December 31, 2015, 2014
and 2013, respectively.
(6) Rangely includes production from July 1, 2014, the date of the acquisition, through December 31, 2014; Eagle Ford includes
production from November 5, 2014, the date of the acquisition, through December 31, 2014. Production per day represents
production based on the full 365-day year ended December 31, 2014.
Year Ended December 31, 2015 Compared with the Year Ended December 31, 2014. Total production revenues were $357.0
million for the year ended December 31, 2015, a decrease of $113.1 million from $470.1 million for the year ended December 31,
2014. This decrease principally consisted of a $76.5 million decrease attributable to the Barnett Shale/Marble Falls operations, a $39.6
million decrease attributable to the coal-bed methane assets, a $31.0 million decrease attributable to the Appalachia assets, a $19.2
million decrease attributable to the Mississippi Lime/Hunton assets, and a $4.3 million decrease associated with our other operating
areas, partially offset by a $57.7 million increase attributable to the newly acquired Rangely and Eagle Ford assets.
Total production costs were $169.7 million for the year ended December 31, 2015, a decrease of $12.5 million from $182.2
million for the year ended December 31, 2014. This decrease primarily consisted of a $16.1 million decrease attributable to the
Barnett Shale/Marble Falls assets, a $7.9 million decrease attributable to the coal-bed methane assets, a $7.3 million decrease
attributable to the Appalachia operations, a $0.9 million decrease attributable to the Mississippi Lime/Hunton assets, and a $0.4
million decrease associated with our other operating areas, partially offset by a $19.5 million increase attributable to the newly
acquired Rangely/Eagle Ford assets, and a $0.6 million decrease in the credit received against lease operating expenses pertaining to the
subordination of our revenue within our Drilling Partnerships. Total production costs per Mcfe decreased to $1.76 per Mcfe for the year
ended December 31, 2015 from $1.80 per Mcfe for the comparable prior year period primarily as a result of continued efforts to
reduce operating costs in each of our areas of production.
Year Ended December 31, 2014 Compared with the Year Ended December 31, 2013. Total production revenues were $470.1
million for the year ended December 31, 2014, an increase of $196.5 million from $273.6 million for the year ended December 31,
2013. This increase principally consisted of a $125.0 million increase attributable to the coal-bed methane assets, a $51.0 million
increase attributable to the newly acquired Rangely/Eagle Ford assets, a $13.0 million increase attributable to the Mississippi
Lime/Hunton assets, a $5.3 million increase attributable to the Appalachia assets due primarily to the Marcellus and Utica Shale wells
drilled, and a $4.0 million increase attributable to the Barnett Shale/Marble Falls operations.
Total production costs were $182.2 million for the year ended December 31, 2014, an increase of $82.1 million from $100.1
million for the year ended December 31, 2013. This increase primarily consisted of a $53.7 million increase attributable to production
costs associated with the newly acquired coal-bed methane assets, a $16.3 million increase attributable to the newly acquired
Rangely/Eagle Ford assets, a $4.4 million increase attributable to the Barnett Shale/Marble Falls assets, a $3.4 million increase
attributable to the Mississippi Lime/Hunton assets, a $3.1 million decrease in the credit received against lease operating expenses
pertaining to the subordination of our revenue within our Drilling Partnerships, and a $1.3 million increase attributable to Appalachia
operations. Total production costs per Mcfe increased to $1.80 per Mcfe for the year ended December 31, 2014 from $1.50 per Mcfe
for the comparable prior year period primarily as a result of the increases in our oil and natural gas liquids production.

81
PARTNERSHIP MANAGEMENT
Well Construction and Completion
Drilling Program Results. The number of wells we drill will vary within the partnership management segment depending on the
amount of capital we raise through our Drilling Partnerships, the cost of each well, the depth or type of each well, the estimated
recoverable reserves attributable to each well and accessibility to the well site. Well construction and completion revenues and costs
and expenses incurred represent the billings and costs associated with the completion of wells for Drilling Partnerships we sponsor.
The following table presents the amounts of Drilling Partnership investor capital raised and deployed (in thousands), as well as sets
forth information relating to these revenues and the related costs and number of net wells associated with these revenues during the
periods indicated (dollars in thousands):
Years Ended December 31,
2015 2014 2013
Drilling partnership investor capital:
Raised ............................................................. $ 59,277 $ 166,798 $ 149,967
Deployed ......................................................... $ 76,505 $ 173,564 $ 167,883
Average construction and completion:
Revenue per well ............................................ $ 4,286 $ 2,227 $ 3,276
Cost per well ................................................... 3,727 1,937 2,849
Gross profit per well ....................................... $ 559 $ 290 $ 427
Gross profit margin .................................................... $ 9,979 $ 22,639 $ 21,898
Partnership net wells associated with revenue
recognized(1):
Appalachia
Marcellus Shale ......................................... — — 4
Utica .......................................................... 2 3 5
Barnett/Marble Falls............................................. 5 60 24
Rangely/Eagle Ford .............................................. 6 1 —
Mississippi Lime/Hunton ..................................... 5 14 18
Total ..................................................... 18 78 51
(1) Consists of Drilling Partnership net wells for which well construction and completion revenue was recognized on a percentage
of completion basis.
Year Ended December 31, 2015 Compared with the Year Ended December 31, 2014. Well construction and completion segment
margin was $10.0 million for the year ended December 31, 2015, a decrease of $12.6 million from $22.6 million for the year ended
December 31, 2014. This decrease consisted of a $17.4 million decrease related to fewer wells recognized for revenue within our
Drilling Partnerships, partially offset by a $4.8 million increase associated with our higher gross profit margin per well. Average
revenue and cost per well increased between periods due primarily to higher capital deployed for Eagle Ford Shale wells within our
Drilling Partnerships during the year ended December 31, 2015 compared with the prior year. As our drilling contracts with the
Drilling Partnerships are on a “cost-plus” basis, an increase or decrease in our average cost per well also results in a proportionate
increase or decrease in our average revenue per well, which directly affects the number of wells we drill.
Year Ended December 31, 2014 Compared with the Year Ended December 31, 2013. Well construction and completion segment
margin was $22.6 million for year ended December 31, 2014, an increase of $0.7 million from $21.9 million for the year ended
December 31, 2013. This increase consisted of a $7.7 million increase related to a greater number of wells recognized for revenue
within our Drilling Partnerships, partially offset by a $7.0 million decrease associated with lower gross profit margin per well.
Average revenue and cost per well decreased between periods due primarily to capital deployed for lower cost Marble Falls wells
within the Drilling Partnerships during the year ended December 31, 2014 compared with capital deployed for higher cost Marcellus
and Utica Shale wells during the prior year.
At December 31, 2015, our consolidated balance sheet includes $21.5 million of “liabilities associated with well drilling
contracts” for funds raised by our Drilling Partnerships that have not been applied to the completion of wells due to the timing of
drilling operations, and thus had not been recognized as well construction and completion revenue on our consolidated statement of
operations. We expect to recognize this amount as revenue during 2016.

82
Administration and Oversight
Administration and oversight fee revenues represent supervision and administrative fees earned for the drilling and subsequent
ongoing management of wells for our Drilling Partnerships. Typically, we receive a lower administration and oversight fee related to
shallow, vertical wells we drill within the Drilling Partnerships, such as those in the Marble Falls play, as compared to deep,
horizontal wells, such as those drilled in the Marcellus and Utica Shales. The following table presents the number of gross and net
development wells we drilled for our Drilling Partnerships during years ended December 31, 2015, 2014 and 2013. There were no
exploratory wells drilled during the years ended December 31, 2015, 2014 and 2013:
Years Ended December 31,
2015 2014 2013
Gross partnership wells drilled:
Appalachia - Utica ........................................... — 4 3
Barnett/Marble Falls ........................................ 2 77 51
Eagle Ford ........................................................ 10 2 21
Mississippi Lime/Hunton ................................. 2 17 —
Total ............................................................ 14 100 75
Net partnership wells drilled:
Appalachia - Utica ........................................... — 4 3
Barnett/Marble Falls ........................................ 2 64 25
Eagle Ford ........................................................ 9 1 —
Mississippi Lime/Hunton ................................. 1 16 21
Total ............................................................ 12 85 49
Year Ended December 31, 2015 Compared with the Year Ended December 31, 2014. Administration and oversight fee revenues
were $7.8 million for the year ended December 31, 2015, a decrease of $7.8 million from $15.6 million for the year ended December
31, 2014. This decrease was due to a decrease in the number of wells spud within the current year period compared with the prior year
period, particularly within the Marble Falls and the Mississippi Lime plays.
Year Ended December 31, 2014 Compared with the Year Ended December 31, 2013. Administration and oversight fee revenues
were $15.6 million for the year ended December 31, 2014, an increase of $3.3 million from $12.3 million for the year ended
December 31, 2013. This increase was due to increases in the number of wells spud within the year ended December 31, 2014
compared with the prior year period, particularly within the Marble Falls play.
Well Services
Well service revenue and expenses represent the monthly operating fees we charge and the work our service company performs,
including work performed for our Drilling Partnership wells during the drilling and completing phase as well as ongoing maintenance
of these wells and other wells for which we serve as operator.
Year Ended December 31, 2015 Compared with the Year Ended December 31, 2014. Well services revenues were $23.8 million
for the year ended December 31, 2015, a decrease of $1.2 million from $25.0 million for the year ended December 31, 2014. Well
services expenses were $9.2 million for the year ended December 31, 2015, a decrease of $0.8 million from $10.0 million for the year
ended December 31, 2014. The decrease in well services revenue is primarily related to our continued efforts to increase production
through intermittent operation of certain legacy wells which results in a reduction of the monthly operating fees which we charge,
partially offset by the increased utilization of our salt water gathering and disposal systems within the Mississippi Lime and Marble
Falls plays by our Drilling Partnership wells. The decrease in well services expense is primarily related to lower labor and other
employee costs.
Year Ended December 31, 2014 Compared with the Year Ended December 31, 2013. Well services revenues were $25.0 million
for the year ended December 31, 2014, an increase of $5.5 million from $19.5 million for the year ended December 31, 2013. Well
services expenses were $10.0 million for the year ended December 31, 2014, an increase of $0.5 million from $9.5 million for the year
ended December 31, 2013. The increase in well services revenue is primarily related to the increased utilization of our salt water
gathering and disposal systems within the Mississippi Lime and Marble Falls plays by Drilling Partnership wells. The increase in well
services expense is primarily related to higher labor costs.
83
Gathering and Processing
Gathering and processing margin includes gathering fees we charge to our Drilling Partnership wells and the related expenses
and gross margin for our processing plants in the New Albany Shale and the Chattanooga Shale. Generally, we charge a gathering fee
to our Drilling Partnership wells equivalent to the fees we remit. In Appalachia, a majority of our Drilling Partnership wells are
subject to a gathering agreement, whereby we remit a gathering fee of 16%. However, based on the respective Drilling Partnership
agreements, we charge our Drilling Partnership wells a 13% gathering fee. As a result, some of our gathering expenses within our
partnership management segment, specifically those in the Appalachian Basin, will generally exceed the revenues collected from the
Drilling Partnerships by approximately 3%.
Year Ended December 31, 2015 Compared with the Year Ended December 31, 2014. Our net gathering and processing expense
for the year ended December 31, 2015 was net expense of $2.2 million, an unfavorable movement of $0.8 million compared with net
expense of $1.4 million for the year ended December 31, 2014. This unfavorable movement was principally due to lower gathering
fees from our Marcellus Shale Drilling Partnership wells in Northeastern Pennsylvania, which are utilizing our gathering pipeline, in
comparison with the prior year.
Year Ended December 31, 2014 Compared with the Year Ended December 31, 2013. Our net gathering and processing expense
for the year ended December 31, 2014 was $1.4 million, a decrease of $0.9 million compared with net expense of $2.3 million for the
year ended December 31, 2013. This favorable movement was principally due to a full year of gathering fees from the Marcellus
Shale Drilling Partnership wells in Northeastern Pennsylvania, which are utilizing our gathering pipeline.
Gain on Mark-to-Market Derivatives
On January 1, 2015, we discontinued hedge accounting for our qualified commodity derivatives. As such, subsequent changes
in fair value of these derivatives are recognized immediately within gain (loss) on mark-to-market derivatives on our consolidated
statements of operations. The fair values of these commodity derivative instruments at December 31, 2014, which were recognized in
accumulated other comprehensive income within partners’ capital (deficit) on our balance sheet, will be reclassified to our
consolidated statements of operations in the future at the time the originally hedged physical transactions settle.
Year Ended December 31, 2015 Compared with the Year Ended December 31, 2014. We recognized a gain on mark-to-market
derivatives of $267.2 million for the year ended December 31, 2015 as compared to a gain on mark-to-market derivatives of $2.8
million for the year ended December 31, 2014. This $264.4 million increase was due to mark-to-market gains in the current year
related to the change in natural gas and oil prices during the year.
Year Ended December 31, 2014 Compared with the Year Ended December 31, 2013. We recognized a gain on mark-to-market
derivatives of $2.8 million for the year ended December 31, 2014. This gain was due to mark-to-market gains in the year ended
December 31, 2014 related to the change in natural gas and oil prices during the year. There were no gains or losses on mark-to-
market derivatives during the year ended December 31, 2013.
Other, net
Year Ended December 31, 2015 Compared with the Year Ended December 31, 2014. Other, net for the year ended December
31, 2015 was income of approximately $0.2 million, compared to income of $0.6 million for year ended December 31, 2014.
Year Ended December 31, 2014 Compared with the Year Ended December 31, 2013. Other, net for the year ended
December 31, 2014 was income of $0.6 million, compared with expense of $14.5 million for the year ended December 31, 2013. The
$15.1 million favorable movement compared with the prior year period was primarily related to the $14.5 million of premium
amortization associated with swaption derivative contracts for production volumes related to wells acquired from EP Energy in the
prior year period.
OTHER COSTS AND EXPENSES
General and Administrative Expenses
Year Ended December 31, 2015 Compared with the Year Ended December 31, 2014. Total general and administrative expenses
decreased to $66.0 million for the year ended December 31, 2015 compared with $72.3 million for the year ended December 31, 2014.
This decrease was primarily due to an $8.8 million decrease in the current year period in non-recurring transaction costs related to the
acquisitions of assets and a $3.1 million decrease in non-cash stock compensation, partially offset by a $5.3 million increase in
syndication expenses.
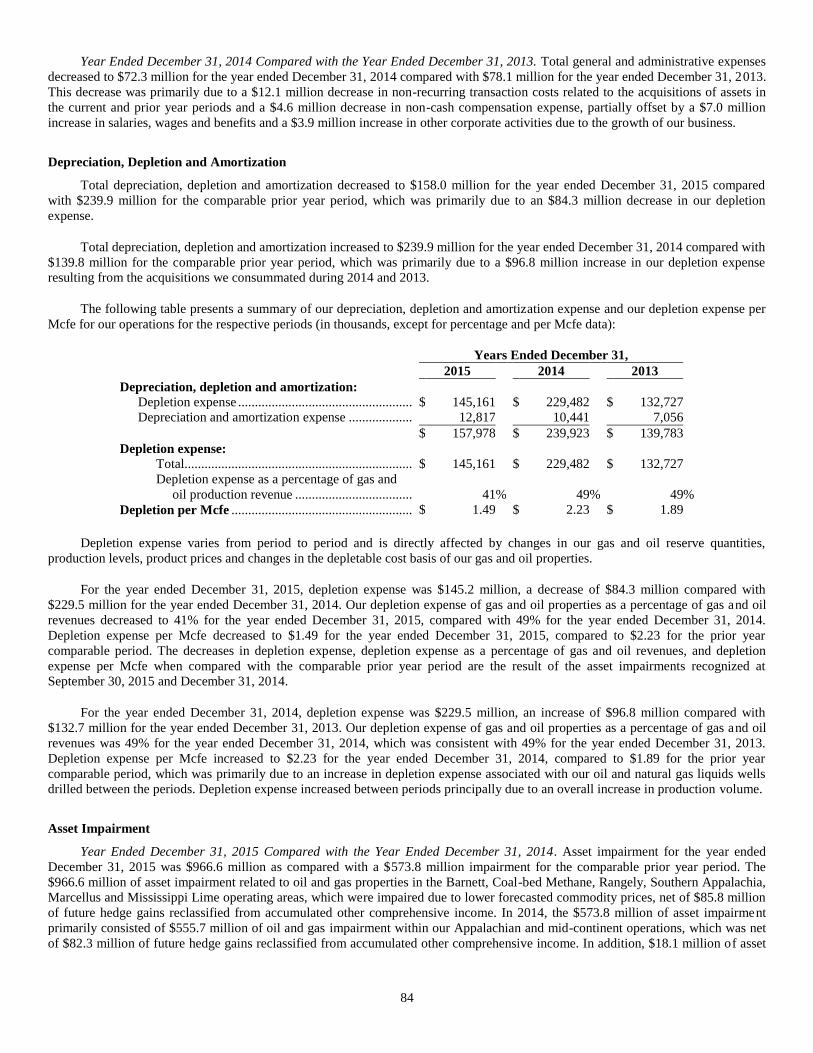
84
Year Ended December 31, 2014 Compared with the Year Ended December 31, 2013. Total general and administrative expenses
decreased to $72.3 million for the year ended December 31, 2014 compared with $78.1 million for the year ended December 31, 2013.
This decrease was primarily due to a $12.1 million decrease in non-recurring transaction costs related to the acquisitions of assets in
the current and prior year periods and a $4.6 million decrease in non-cash compensation expense, partially offset by a $7.0 million
increase in salaries, wages and benefits and a $3.9 million increase in other corporate activities due to the growth of our business.
Depreciation, Depletion and Amortization
Total depreciation, depletion and amortization decreased to $158.0 million for the year ended December 31, 2015 compared
with $239.9 million for the comparable prior year period, which was primarily due to an $84.3 million decrease in our depletion
expense.
Total depreciation, depletion and amortization increased to $239.9 million for the year ended December 31, 2014 compared with
$139.8 million for the comparable prior year period, which was primarily due to a $96.8 million increase in our depletion expense
resulting from the acquisitions we consummated during 2014 and 2013.
The following table presents a summary of our depreciation, depletion and amortization expense and our depletion expense per
Mcfe for our operations for the respective periods (in thousands, except for percentage and per Mcfe data):
Years Ended December 31,
2015 2014 2013
Depreciation, depletion and amortization:
Depletion expense .................................................... $ 145,161 $ 229,482 $ 132,727 Depreciation and amortization expense ................... 12,817 10,441 7,056
$ 157,978 $ 239,923 $ 139,783
Depletion expense:
Total .................................................................... $ 145,161 $ 229,482 $ 132,727 Depletion expense as a percentage of gas and
oil production revenue ...................................
41 % 49 %
49 %
Depletion per Mcfe ...................................................... $ 1.49 $ 2.23 $ 1.89
Depletion expense varies from period to period and is directly affected by changes in our gas and oil reserve quantities,
production levels, product prices and changes in the depletable cost basis of our gas and oil properties.
For the year ended December 31, 2015, depletion expense was $145.2 million, a decrease of $84.3 million compared with
$229.5 million for the year ended December 31, 2014. Our depletion expense of gas and oil properties as a percentage of gas and oil
revenues decreased to 41% for the year ended December 31, 2015, compared with 49% for the year ended December 31, 2014.
Depletion expense per Mcfe decreased to $1.49 for the year ended December 31, 2015, compared to $2.23 for the prior year
comparable period. The decreases in depletion expense, depletion expense as a percentage of gas and oil revenues, and depletion
expense per Mcfe when compared with the comparable prior year period are the result of the asset impairments recognized at
September 30, 2015 and December 31, 2014.
For the year ended December 31, 2014, depletion expense was $229.5 million, an increase of $96.8 million compared with
$132.7 million for the year ended December 31, 2013. Our depletion expense of gas and oil properties as a percentage of gas and oil
revenues was 49% for the year ended December 31, 2014, which was consistent with 49% for the year ended December 31, 2013.
Depletion expense per Mcfe increased to $2.23 for the year ended December 31, 2014, compared to $1.89 for the prior year
comparable period, which was primarily due to an increase in depletion expense associated with our oil and natural gas liquids wells
drilled between the periods. Depletion expense increased between periods principally due to an overall increase in production volume.
Asset Impairment
Year Ended December 31, 2015 Compared with the Year Ended December 31, 2014. Asset impairment for the year ended
December 31, 2015 was $966.6 million as compared with a $573.8 million impairment for the comparable prior year period. The
$966.6 million of asset impairment related to oil and gas properties in the Barnett, Coal-bed Methane, Rangely, Southern Appalachia,
Marcellus and Mississippi Lime operating areas, which were impaired due to lower forecasted commodity prices, net of $85.8 million
of future hedge gains reclassified from accumulated other comprehensive income. In 2014, the $573.8 million of asset impairment
primarily consisted of $555.7 million of oil and gas impairment within our Appalachian and mid-continent operations, which was net
of $82.3 million of future hedge gains reclassified from accumulated other comprehensive income. In addition, $18.1 million of asset
85
impairment in 2014 was due to goodwill impairment. Asset impairments for the year ended December 31, 2014 principally resulted
from the decline in forward commodity prices during the fourth quarter of 2014.
Year Ended December 31, 2014 Compared with the Year Ended December 31, 2013. Asset impairment for the year ended
December 31, 2014 was $573.8 million as compared with $38.0 million for the comparable prior year period. The $573.8 million of
asset impairment primarily consisted of $555.7 million of oil and gas impairment within our Appalachian and mid-continent
operations, which was net of $82.3 million of future hedge gains reclassified from accumulated other comprehensive income. In
addition, $18.1 million of asset impairment is due to goodwill impairment. Asset impairments for the year ended December 31, 2014
principally resulted from the decline in forward commodity prices during the fourth quarter of 2014. During the year ended December
31, 2013, we recognized $38.0 million of asset impairment related to impairments of gas and oil properties within property, plant and
equipment, net on our consolidated balance sheet primarily for our shallow natural gas wells in the New Albany Shale and unproved
acreage in the Chattanooga and New Albany Shales. These impairments related to the carrying amount of these gas and oil properties
being in excess of our estimate of their fair values at December 31, 2014 and 2013 and our intention not to drill on certain expiring
unproved acreage. The estimate of fair values of these gas and oil properties was impacted by, among other factors, the deterioration
of commodity prices in comparison to their carrying values at December 31, 2014 and 2013.
Interest Expense
Year Ended December 31, 2015 Compared with the Year Ended December 31, 2014. Interest expense for the year ended
December 31, 2015 was $102.1 million as compared with $62.1 million for the comparable prior year period. The $40.0 million
increase in our interest expense consisted of a $23.1 million increase associated with our Term Loan Facility, an $8.7 million increase
associated with interest expense on our Senior Notes, $5.6 million in accelerated amortization charges related to our reduced credit
facility borrowing base and a $3.0 million increase associated with amortization of our deferred financing costs, partially offset by a
$0.4 million decrease associated with outstanding borrowings under our revolving credit facility. The increase associated with our
Senior Notes is primarily due to the issuance of an additional $100.0 million of our 7.75% Senior Notes due 2021 in June 2014 and an
additional $75.0 million of our 9.25% Senior Notes due 2021 in October 2014. The increase in interest expense for our Term Loan
Facility related to our entry into the Term Loan Facility in February 2015.
Year Ended December 31, 2014 Compared with the Year Ended December 31, 2013. Interest expense for the year ended
December 31, 2014 was $62.1 million as compared with $34.3 million for the comparable prior year period. The $27.8 million
increase consisted of a $20.7 million increase associated with interest expense on our senior notes, a $6.4 million increase associated
with higher weighted-average outstanding borrowings under our revolving credit facility, a $0.2 million increase in the amortization of
the 7.75% and 9.25% senior notes’ discounts, and interest that was capitalized on our ongoing capital projects, partially offset by a
$0.4 million decrease associated with amortization of deferred financing costs and a $0.3 million decrease in commitment fees. The
increase in interest expense related to our senior notes is primarily due to the issuance of an additional $100.0 million of our 7.75%
Senior Notes in June 2014 and an additional $75.0 million of our 9.25% Senior Notes in October 2014, as well as a full year of interest
expense related to the $275.0 million 7.75% Senior Notes issued in January 2013 and $250.0 million of 9.25% Senior Notes issued in
July 2013.
Loss on Asset Sales and Disposal
Year Ended December 31, 2015 Compared with the Year Ended December 31, 2014. During the year ended December 31, 2015
and 2014, we recognized losses on asset sales and disposal of $1.2 million and $1.9 million, respectively. The $1.2 million loss on
asset sales and disposal for the year ended December 31, 2015 was primarily related to the $0.8 million write-down of pipe, pump
units and other inventory in Indiana at our New Albany Shale and Black Warrior Basin that are no longer usable, $0.4 million of
plugging and abandonment costs for certain wells in the New Albany Shale and a $0.1 million loss on the sale of Indiana at our New
Albany Shale inventory to Rex Energy, partially offset by a $0.1 million insurance reimbursement for the Mossy Oak plant fire in
Indiana at our New Albany Shale in 2014. The $1.9 million loss on asset sales and disposal for the year ended December 31, 2014 was
primarily related to the sale of producing wells in the Niobrara Shale in connection with the settlement of a third party farmout
agreement and a $0.3 million loss on the involuntary conversion of the Mossy Oak compressor station.
Year Ended December 31, 2014 Compared with the Year Ended December 31, 2013. During the years ended December 31,
2014 and 2013, we recognized losses on asset sales and disposal of $1.9 million and $1.0 million, respectively. The $1.9 million loss
on asset sales and disposal for the year ended December 31, 2014 was primarily related to the sale of producing wells in the Niobrara
Shale in connection with the settlement of a third party farmout agreement and a $0.3 million loss on the involuntary conversion of the
Mossy Oak compressor station. The $1.0 million loss on asset sales and disposal for the year ended December 31, 2013 primarily
pertained to a loss on the sale of our Antrim assets in Michigan.

86
LIQUIDITY AND CAPITAL RESOURCES
General
Our primary sources of liquidity are cash generated from operations, capital raised through our Drilling Partnerships, and
borrowings under our revolving credit facility (see “Credit Facilities”). Our primary cash requirements, in addition to normal
operating expenses, are for debt service, capital expenditures and distributions to our limited partners and general partner. In general,
we expect to fund:
cash distributions and maintenance capital expenditures through existing cash and cash flows from operating activities;
expansion capital expenditures and working capital deficits through cash generated from operations, additional
borrowings and capital raised through Drilling Partnerships; and
debt principal payments through additional borrowings as they become due or by the issuance of additional limited partner
units or asset sales.
We rely on cash flow from operations and our credit facilities to execute our growth strategy and to meet our financial
commitments and other short-term liquidity needs.
In November 2015, we completed the semi-annual redetermination of our Credit Facility, reducing the borrowing base from
$750 million to $700 million. Our next redetermination date is in May 2016. Our borrowing base, and thus our borrowing capacity,
under the Credit Facility is impacted by the level of our oil and natural gas reserves. Downward revisions of our oil and natural gas
reserves volume and value due to declines in commodity prices, the impact of lower estimated capital spending in response to lower
prices, performance revisions, sales of assets or the incurrence of certain types of additional debt, among other items, could cause a
reduction of our borrowing base in the future, and these reductions could be significant.
We believe we have sufficient liquidity from (i) our cash flows from operations (including our hedges scheduled to settle in
2016), (ii) availability under the Credit Facility and (iii) available cash, to fund our capital program, current obligations and projected
working capital requirements for 2016. Furthermore, despite the decline in natural gas and oil prices, we believe our derivative
contracts, which are primarily fixed price swaps, provide significant commodity price protection on a significant portion of our
anticipated natural gas and oil production for 2016.
Our ability to (i) generate sufficient cash flows from operations or obtain future borrowings under the Credit Facility, (ii) repay
or refinance any of our indebtedness on commercially reasonable terms or at all, or (iii) obtain additional capital if required on
acceptable terms or at all to fund our capital programs or any potential future acquisitions, joint ventures or other similar transactions,
will depend on prevailing economic conditions many of which are beyond our control. The extreme ongoing volatility in the energy
industry and commodity prices will likely continue to impact our outlook. Our plans are intended to address the impacts of the current
volatility in commodity prices while (i) maintaining sufficient liquidity to fund capital in our core drilling programs, (ii) meeting our
debt maturities, and (iii) managing and working to strengthen our balance sheet. We continue to implement various cost saving
measures to reduce our capital, operating, and general and administrative costs, including renegotiating contracts with contractors,
suppliers and service providers, reducing the number of staff and contractors and deferring and eliminating discretionary costs. We
will continue to be opportunistic and aggressive in managing our cost structure and, in turn, our liquidity to meet our capital and
operating needs.
To the extent commodity prices remain low or decline further, or we experience disruptions in the financial markets impacting
our longer-term access to or cost of capital, our ability to fund future growth projects may be further impacted. We continually
monitor the capital markets and our capital structure and may make changes to our capital structure from time to time, with the goal of
maintaining financial flexibility, preserving or improving liquidity and/or achieving cost efficiency. For example, we could (i) elect to
repurchase a portion of our outstanding debt in the future for cash through open market repurchases or privately negotiated
transactions with certain of our debtholders, or (ii) issue additional secured debt as permitted under our debt agreements, although
there is no assurance we would do so. It is also possible additional adjustments to our plan and outlook may occur based on market
conditions and our needs at that time, which could include selling assets, liquidating all or a portion of our hedge portfolio, seeking
additional partners to develop our assets, reducing or suspending the payments of distributions to unitholders and/or reducing our
planned capital program.
Cash Flows – Year Ended December 31, 2015 Compared with the Year Ended December 31, 2014
Net cash provided by operating activities of $172.8 million for the year ended December 31, 2015 represented an unfavorable
movement of $30.0 million from net cash provided by operating activities of $202.8 million for the comparable prior year period. The
$30.0 million unfavorable movement in net cash provided by operating activities resulted from a $110.9 million unfavorable
movement in net loss, excluding non-cash items, partially offset by an $80.9 million favorable movement in working capital. The
87
$110.9 unfavorable movement in net loss, excluding non-cash items, was principally due to a $201.7 million unfavorable movement in
net loss, a $226.8 million unfavorable movement in mark-to-market gain on derivatives subsequent to our discontinuation of hedge
accounting on January 1, 2015, an $82.0 million unfavorable movement in depreciation, depletion and amortization, a $3.1 million
unfavorable movement in non-cash compensation and a $0.7 million unfavorable movement in loss on asset sales and disposal,
partially offset by a $392.9 million asset impairment charge and a $10.5 million favorable movement in amortization of deferred
financing costs and discount and premium on long-term debt. The $80.9 million favorable movement in working capital was due to a
$210.0 million favorable movement in accounts receivable, prepaid expenses and other, partially offset by a $129.1 million
unfavorable movement in accounts payable and accrued liabilities.
Net cash used in investing activities of $204.0 million for the year ended December 31, 2015 represented a favorable movement
of $692.4 million from net cash used in investing activities of $896.4 million for the comparable prior year period. This favorable
movement was principally due to a $609.0 million decrease in net cash paid for acquisitions and a decrease in capital expenditures of
$85.6 million. See further discussion of capital expenditures under “Capital Requirements.”
Net cash provided by financing activities of $17.3 million for the year ended December 31, 2015 represented an unfavorable
movement of $681.5 million from net cash provided by financing activities of $698.8 million for the comparable prior year period.
This unfavorable movement was principally due to a decrease of $731.7 million for borrowings under our term loans and revolving
credit facility, a $332.7 million decrease in net proceeds from issuance of our common limited partner units, a $170.6 million decrease
in net proceeds from our senior notes, a $70.5 million decrease in net proceeds from the issuance of our preferred limited partner units,
and a $40.2 million unfavorable movement in deferred financing costs, distribution equivalent rights and other, partially offset by a
decrease of $593.0 million in repayments under our revolving credit facility and a $71.2 million decrease in cash distributions paid to
limited partners. The gross amount of borrowings and repayments under the revolving credit facilities included within net cash
provided by financing activities in the consolidated statements of cash flows, which are generally in excess of net borrowings or
repayments during the period or at period end, reflect the timing of cash receipts, which generally occur at specific intervals during the
period and are utilized to reduce borrowings under the revolving credit facilities, and payments, which generally occur throughout the
period and increase borrowings under our revolving credit facilities, which is generally common practice for our business and
industries.
The issuance of $20.0 million in Class D Preferred Units as partial payment for the Eagle Ford Acquisition represented a non-
cash transaction during the year ended December 31, 2015.
Cash Flows – Year Ended December 31, 2014 Compared with the Year Ended December 31, 2013
Net cash provided by operating activities of $202.8 million for the year ended December 31, 2014 represented a favorable
movement of $78.9 million from net cash provided by operating activities of $123.9 million for the prior year. The $78.9 million
favorable movement in net cash provided by operating activities resulted from a $110.3 million favorable movement in net income
excluding non-cash items, partially offset by a $31.4 million unfavorable movement in working capital. The $110.3 million favorable
movement in net income excluding non-cash items consisted principally of a $138.3 million increase in operating cash flow, which
was primarily due to our consummation of the EP Energy, GeoMet, Rangely and Eagle Ford acquisitions, partially offset by a $28.0
million increase in cash interest expense principally due to our Senior Notes offerings in July 2013 and June 2014. The $31.4 million
unfavorable movement in working capital was principally due to a $65.5 million unfavorable movement in accounts receivable,
prepaid expenses and other, partially offset by a $34.1 million favorable movement in accounts payable and accrued liabilities. The
$65.5 million unfavorable movement in accounts receivable, prepaid expenses and other was principally due to an unfavorable
movement in accounts receivable due to the timing of cash receipts during the year ended December 31, 2014 compared with the year
ended December 31, 2013. The $34.1 million favorable movement in accounts payable and accrued liabilities was primarily due to a
favorable movement in accounts payable due to the timing of payments and the growth of our business during the year ended
December 31, 2014 compared with the year ended December 31, 2013.
Net cash used in investing activities of $896.4 million for year ended December 31, 2014 represented a favorable movement of
$153.2 million from net cash used in investing activities of $1,049.6 million for the prior year. This favorable movement was
primarily due to a $51.2 million decrease in capital expenditures, a $94.0 million decrease in net cash paid for acquisitions in 2014 as
compared to the prior year and an $8.0 million favorable movement in other assets. See further discussion of capital expenditures
under “Capital Requirements”.
Net cash provided by financing activities of $707.0 million for the year ended December 31, 2014 represented an unfavorable
movement of $197.3 million from net cash provided by financing activities of $904.3 million for the prior year. This movement was
principally due to a $339.8 million decrease in net proceeds from long-term debt, a $241.6 million increase in repayments under our
revolving credit facility, a $94.1 million increase in cash distributions paid to limited partners, a $69.8 million unfavorable movement
in deferred financing costs, distribution equivalent rights and other, and a $9.3 million decrease in net proceeds from the issuance of

88
our preferred limited partner units and warrants, partially offset by a $451.0 million increase in borrowings under our revolving credit
facility and a $106.3 million increase in net proceeds from the issuance of our common limited partner units. The gross amount of
borrowings and repayments under our revolving credit facility included within net cash provided by financing activities, which are
generally in excess of net borrowings or repayments during the period or at period end, reflect the timing of cash receipts, which
generally occur at specific intervals during the period and are utilized to reduce borrowings under our revolving credit facility, and
payments, which generally occur throughout the period and increase borrowings under our revolving credit facility, which is generally
common practice for our industry.
The deferred portion of the purchase price related to the Eagle Ford Acquisition represented a non-cash transaction during the
year ended December 31, 2014.
Capital Requirements
The capital requirements of our natural gas and oil production consist primarily of:
Maintenance capital expenditures — oil and gas assets naturally decline in future periods and, as such, we recognize the
estimated capitalized cost of stemming such decline in production margin for the purpose of stabilizing our distributable
cash flow and cash distributions, which we refer to as maintenance capital expenditures. We calculate the estimate of
maintenance capital expenditures by first multiplying forecasted future full year production margin by expected aggregate
production decline of proved developed producing wells. Maintenance capital expenditures are then the estimated
capitalized cost of wells that will generate an estimated first year margin equivalent to the production margin decline,
assuming such wells are connected on the first day of the calendar year. We do not incur specific capital expenditures
expressly for the purpose of maintaining or increasing production margin, but such amounts are a subset of hypothetical
wells we expect to drill in future periods, including Marcellus Shale, Utica Shale, Mississippi Lime, Marble Falls and
Eagle Ford Shale wells, on undeveloped acreage already leased. Estimated capitalized cost of wells included within
maintenance capital expenditures are also based upon relevant factors, including historical costs of similar wells and
characteristics of each individual well. First year margin from wells included within maintenance capital are also based
upon relevant factors, including utilization of public forward commodity exchange prices, current estimates for regional
pricing differentials, estimated labor and material rates and other production costs. Estimates for maintenance capital
expenditures in the current year are the sum of the estimate calculated in the prior year plus estimates for the decline in
production margin from wells connected during the current year and production acquired through acquisitions; and
Expansion capital expenditures — we consider expansion capital expenditures to be any capital expenditure costs
expended that are not maintenance capital expenditures – generally, this will include expenditures to increase, rather than
maintain, production margin in future periods, as well as land, gathering and processing, and other non-drilling capital
expenditures.
The following table summarizes our maintenance and expansion capital expenditures, excluding amounts paid for acquisitions,
for the periods presented (in thousands):
Years Ended December 31,
2015 2014 2013
Maintenance capital expenditures ................................ $ 53,788 $ 65,300 $ 31,500
Expansion capital expenditures ................................... 73,350 147,428 232,386
Total ....................................................................... $ 127,138 $ 212,728 $ 263,886
During the year ended December 31, 2015, our $127.1 million of total capital expenditures consisted primarily of $51.2 million
for wells drilled exclusively for our own account compared with $82.2 million for the comparable prior year period, $32.4 mil lion of
investments in our Drilling Partnerships compared with $72.4 million for the prior year comparable period, $11.9 million of leasehold
acquisition costs compared with $25.5 million for the prior year comparable period and $31.6 million of corporate and other costs
compared with $32.6 million for the prior year comparable period.
During the year ended December 31, 2014, our $212.7 million of total capital expenditures consisted primarily of $82.2 million
for wells drilled exclusively for our own account compared with $110.9 million for the prior year, $72.4 million of investments in our
Drilling Partnerships compared with $92.3 million for the prior year, $25.5 million of leasehold acquisition costs compared with $20.9
million for the prior year, and $32.6 million of corporate and other costs compared with $39.8 million for the prior year, which
primarily related to a decrease in gathering and processing costs.
89
We continuously evaluate acquisitions of gas and oil assets. In order to make any acquisitions in the future, we believe we will
be required to access outside capital either through debt or equity placements or through joint venture operations with other energy
companies. There can be no assurance that we will be successful in our efforts to obtain outside capital. As of December 31, 2015, we
are committed to expend approximately $7.1 million on drilling and completion and other capital expenditures, excluding acquisitions.
We expect to fund these capital expenditures primarily with cash flow from operations, capital raised through our Drilling
Partnerships and borrowings under our revolving credit facility.
OFF BALANCE SHEET ARRANGEMENTS
As of December 31, 2015, our off-balance sheet arrangements were limited to our letters of credit outstanding of $4.2 million
and commitments to spend $7.1 million related to our drilling and completion and capital expenditures, excluding acquisitions.
We are the ultimate managing general partner of the Drilling Partnerships and have agreed to indemnify each investor partner
from any liability that exceeds such partner’s share of Drilling Partnership assets. We have structured certain Drilling Partnerships to
allow limited partners to have the right to present their interests for purchase. Generally for Drilling Partnerships with this structure,
we are not obligated to purchase more than 5% to 10% of the units in any calendar year, no units may be purchased during the first
five years after closing for the Drilling Partnership, and we may immediately suspend the presentment structure for a Drilling
Partnership by giving notice to the limited partners that we do not have adequate liquidity for redemptions. In accordance with the
Drilling Partnership agreement, the purchase price for limited partner interests would generally be based upon a percentage of the
present value of future cash flows allocable to the interest, discounted at 10%, as of the date of presentment, subject to estimated
changes by us to reflect current well performance, commodity prices and production costs, among other items. Based on our historical
experience, as of December 31, 2015, we believe that any such estimated liability for redemptions of limited partner interests in
Drilling Partnerships which allow such transactions would not be material.
CASH DISTRIBUTION POLICY
Our partnership agreement requires that we distribute 100% of available cash to our common and preferred unitholders and
general partner within 45 days following the end of each calendar quarter in accordance with their respective percentage interests.
Available cash consists generally of all of our cash receipts, less cash disbursements and net additions to reserves, including any
reserves required under debt instruments for future principal and interest payments. Our general partner is granted discretion under the
partnership agreement to establish, maintain and adjust reserves for future operating expenses, debt service, maintenance capital
expenditures and distributions for the next four quarters. These reserves are not restricted by magnitude, but only by type of future
cash requirements with which they can be associated.
On January 29, 2014, the general partner’s board of directors approved a modification to our cash distribution payment practice
to a monthly cash distribution program. Monthly cash distributions are paid approximately 45 days following the end of each
respective monthly period.
Available cash, as defined in our Partnership Agreement, will generally be distributed as follows:
first, 98% to our Class D and E preferred unitholders and 2% to our general partner until the distribution to each of our
Class D and Class E Preferred Units is an amount equal to its fixed quarterly distribution;
second, 98% to our Class C preferred unitholders and 2% to our general partner until there has been distributed to each
outstanding Class C Preferred Unit the greater of $0.51 per quarter and the distribution payable to common unitholders;
thereafter 98% to our common unitholders and 2% to our general partner.
These distribution percentages are modified to provide for incentive distributions to be paid to our general partner, if quarterly
distributions exceed specified targets. Incentive distributions are generally defined as all cash distributions paid to our general partner
that are in excess of 2% of the aggregate amount of cash being distributed. The incentive distribution rights will entitle our general
partner to receive the following increasing percentage of cash distributed by us as it reaches certain target distribution levels:
13.0% of all cash distributed in any quarter after each common unit has received $0.46 for that quarter;
23.0% of all cash distributed in any quarter after each common unit has received $0.50 for that quarter; and
48.0% of all cash distributed in any quarter after each common unit has received $0.60 for that quarter.
90
CONTRACTUAL OBLIGATIONS AND COMMERCIAL COMMITMENTS
The following table summarizes our contractual obligations at December 31, 2015 (in thousands):
Payments Due By Period
Total Less than
1 Year 1 – 3
Years 4 – 5
Years After 5
Years
Contractual cash obligations:
Total debt ..................................................................... $ 1,542,000 $ — $ 592,000 $ 250,000 $ 700,000
Interest on total debt..................................................... 469,065 103,388 198,746 146,931 20,000
Operating leases ........................................................... 15,874 3,875 6,898 3,252 1,849
Total contractual cash obligations ................................ $ 2,026,939 $ 107,263 $ 797,644 $ 400,183 $ 721,849
Amount of Commitment Expiration Per
Period
Total Less than
1 Year 1 – 3
Years 4 – 5
Years After 5
Years
Other commercial commitments:
Standby letters of credit ............................................... $ 4,191 $ 4,191 $ — $ — $ — Other commercial commitments
(1) ............................... 23,285 9,924 4,827 3,624 4,910
Total commercial commitments................................... $ 27,476 $ 14,115 $ 4,827 $ 3,624 $ 4,910
(1) Our other commercial commitments include our share of drilling and completion commitments and our throughput contracts,
including firm transportation obligations for natural gas and gathering commitments as a result of the EP Energy and GeoMet
acquisitions. See “Contractual Revenue Arrangements” for a description of our firm transportation obligations.
ENVIRONMENTAL REGULATION
Our operations are subject to federal, state and local laws and regulations governing the release of regulated materials into the
environment or otherwise relating to environmental protection or human health or safety (see “Item 1: Business —Environmental
Matters and Regulation”). We believe that our operations and facilities are in substantial compliance with applicable environmental
laws and regulations. Any failure to comply with these laws and regulations may result in the assessment of administrative, civil or
criminal penalties; imposition of remedial requirements; issuance of injunctions affecting our operations; or other measures. We have
maintained and expect to continue to maintain environmental compliance programs. However, risks of accidental leaks or spills are
associated with our operations. There can be no assurance that we will not incur significant costs and liabilities relating to claims for
damages to property, the environment, natural resources, or persons resulting from the operation of our and our subsidiaries’ business.
Moreover, it is possible other developments, such as increasingly strict federal, state and local environmental laws and regulations and
enforcement policies, could result in increased costs and liabilities to us and our subsidiaries.
Environmental laws and regulations have changed substantially and rapidly over the last 25 years, and we anticipate that such
changes will continue. Trends in environmental regulation include increased reporting obligations and placing more restrictions and
limitations on operations, such as emissions of greenhouse gases and other pollutants; generation and disposal of wastes, including
wastes that may have technologically enhanced naturally occurring radioactive materials; and use, storage and handling of chemical
substances that may impact human health, the environment and/or threatened or endangered species. Other increasingly stringent
environmental restrictions and limitations have resulted in increased operating costs for us and other similar businesses throughout the
United States. It is possible that the costs of compliance with environmental laws and regulations may continue to increase. We will
attempt to anticipate future regulatory requirements that might be imposed and to plan accordingly, but there can be no assurance that
we will identify and properly anticipate each such change, or that our efforts will prevent material costs, if any, from rising.
CREDIT FACILITIES
Revolving Credit Facility
Credit Facility Amendment. On November 23, 2015, we entered into an Eighth Amendment to the Second Amended and
Restated Credit Agreement (the “Amendment”) with Wells Fargo Bank, National Association, as administrative agent, and the lenders
party thereto, which amendment amends the Second Amended and Restated Credit Agreement dated July 31, 2013 (as amended from
time to time, the “Credit Agreement”). Among other things, the Eighth Amendment:
reduced the borrowing base under the Credit Agreement from $750.0 million to $700.0 million;
increased the applicable margin on Eurodollar loans and ABR loans by 0.25% from previous levels;
91
permits the incurrence of third lien debt subject to the satisfaction of certain conditions, including pro forma financial
covenant compliance;
upon the issuance of any third lien debt, reduces the borrowing base by 25% of the stated amount of such third lien debt
(other than third lien debt that is used to refinance senior notes, second lien debt and other third lien debt);
suspends compliance with a maximum ratio of Total Funded Debt (as defined in the Credit Agreement) to EBITDA (as
defined in the Credit Agreement) until the four fiscal quarter period ending March 31, 2017 and revises the maximum
ratio of Total Funded Debt to EBITDA to be 5.75 to 1.00 for the four quarter periods ending March 31, 2017 and June 30,
2017, 5.50 to 1.00 for the four quarter periods ending September 30, 2017 and December 31, 2017, 5.25 to 1.00 for the
four quarter period ending March 31, 2018, and 5.00 to 1.00 for each four fiscal quarter period ending thereafter;
replaced the requirement to maintain compliance with a maximum ratio of Senior Secured Total Funded Debt to EBITDA
with a requirement to be in compliance with a maximum ratio of First Lien Debt (as defined in the Credit Agreement) to
EBITDA of 2.75 to1.00; and
reset the distribution to $0.15 per common unit and permits increases to the distribution per common unit if (a) the ratio of
Total Funded Debt (as of such date) to EBITDA for the most recent four fiscal quarters is equal to or less than 5.00 to1.00
and (b) the borrowing base utilization is less than or equal to 85%, on a pro forma basis after giving effect to the
distribution payment.
A Seventh Amendment to the Credit Agreement was entered into on July 24, 2015. Among other things, the Seventh
Amendment redefined EBITDA.
A Sixth Amendment to the Credit Agreement was entered into on February 23, 2015. Among other things, the Sixth
Amendment:
reduced the borrowing base under the Credit Agreement from $900.0 million to $750.0 million;
permitted the incurrence of second lien debt in an aggregate principal amount up to $300.0 million;
rescheduled the May 1, 2015 borrowing base redetermination for July 1, 2015;
if the borrowing base utilization (as defined in the Credit Agreement) is less than 90%, increases the applicable margin on
Eurodollar loans and ABR loans by 0.25% from previous levels;
following the next scheduled redetermination of the borrowing base, upon the issuance of senior notes or the incurrence of
second lien debt, reduces the borrowing base by 25% of the stated amount of such senior notes or additional second lien
debt; and
revised the maximum ratio of Total Funded Debt to EBITDA to be (i) 5.25 to 1.0 as of the last day of the quarters ending
on March 31, 2015, June 30, 2015, September 30, 2015, December 31, 2015 and March 31, 2016, (ii) 5.00 to 1.0 as of the
last day of the quarters ending on June 30, 2016, September 30, 2016 and December 31, 2016, (iii) 4.50 to 1.0 as of the
last day of the quarter ending on March 31, 2017 and (iv) 4.00 to 1.0 as of the last day of each quarter thereafter.
Our borrowing base is scheduled for semi-annual redeterminations in May and November of each year. In February 2015, the
borrowing base was reduced from $900 million to $750 million in connection with the Sixth Amendment to the Credit Agreement; in
July 2015 (the rescheduled redetermination date included in the Sixth Amendment to the Credit Agreement), a determination by the
lenders reaffirmed the $750 million borrowing base in connection with the Seventh Amendment to the Credit Agreement; and in
November 2015, the borrowing base was reduced from $750 million to $700 million in connection with the Eighth Amendment to the
Credit Agreement. The Credit Agreement also provides that our borrowing base will be reduced by 25% of the stated amount of any
senior notes issued, or additional second lien debt incurred, after July 1, 2015. In addition, the Credit Agreement provides that our
borrowing base will be reduced by 25% of the stated amount of any third lien debt issued (other than third lien debt that is used to
refinance senior notes, second lien debt and other third lien debt). At December 31, 2015, $592.0 million was outstanding under the
credit facility. Up to $20.0 million of the revolving credit facility may be in the form of standby letters of credit, of which $4.2 million
was outstanding at December 31, 2015. Our obligations under the facility are secured by mortgages on our oil and gas properties and
first priority security interests in substantially all of our assets. Additionally, obligations under the facility are guaranteed by certain of
our material subsidiaries, and any non-guarantor subsidiaries of ours are minor. Borrowings under the credit facility bear interest, at
our election, at either an adjusted LIBOR rate plus an applicable margin between 2.00% and 3.00% per annum (which shall change
depending on the borrowing base utilization percentage) or the base rate (which is the higher of the bank’s prime rate, the Federal
funds rate plus 0.5% or one-month LIBOR plus 1.00%) plus an applicable margin between 1.00% and 2.00% per annum (which shall
change depending on the borrowing base utilization percentage). We are also required to pay a fee on the unused portion of the
borrowing base at a rate of 0.375% per annum if less than 50% of the borrowing base is utilized and 0.5% if 50% or more of the

92
borrowing base is utilized, which is included within interest expense on our consolidated statements of operations. At December 31,
2015, the weighted average interest rate on outstanding borrowings under the credit facility was 3.25%.
The Credit Agreement contains customary covenants including, without limitation, covenants that limit our ability to incur
additional indebtedness (but which permits second lien debt in an aggregate principal amount of up to $300.0 million and third lien
debt that satisfies certain conditions including pro forma financial covenants), grant liens, make loans or investments, make
distributions if a borrowing base deficiency or default exists or would result from the distribution, merge or consolidate with other
persons, or engage in certain asset dispositions including a sale of all or substantially all of our assets. The Credit Agreement also
requires us to maintain a ratio of First Lien Debt to EBITDA of 2.75 to 1.00 as set forth in the Eighth Amendment described above,
and a ratio of current assets (as defined in the Credit Agreement) to current liabilities (as defined in the Credit Agreement) of not less
than 1.0 to 1.0 as of the last day of any fiscal quarter. We were in compliance with these covenants as of December 31, 2015.
Although we currently expect our sources of capital to be sufficient to meet our near-term liquidity needs, there can be no
assurance that the lenders under our credit facility will not reduce the borrowing base to an amount below our outstanding borrowings
or that our liquidity requirements will continue to be satisfied, given current oil prices and the discretion of its lenders to decrease our
borrowing base. Due to the steep decline in commodity prices, we may not be able to obtain funding in the equity or capital markets
on terms we find acceptable. The cost of obtaining money from the credit markets generally has increased as many lenders and
institutional investors have increased interest rates, enacted tighter lending standards, and reduced and, in some cases, ceased to
provide any new funding. If the borrowing base determination in May 2016 results in a borrowing base deficiency and we cannot
access the capital markets and repay debt under our credit facility, we may be unable to continue to pay distributions to its unitholders
and may take other actions to reduce costs and to raise funds to repay debt, such as selling assets or monetizing derivative contracts
Term Loan Facility
On February 23, 2015, we entered into a Second Lien Credit Agreement with certain lenders and Wilmington Trust, National
Association, as administrative agent. The Second Lien Credit Agreement provides for a second lien term loan in an original principal
amount of $250.0 million (the “Term Loan Facility”). The Term Loan Facility matures on February 23, 2020. The Term Loan
Facility is presented net of unamortized discount of $6.2 million at December 31, 2015.
We have the option to prepay the Term Loan Facility at any time, and is required to offer to prepay the Term Loan Facility with
100% of the net cash proceeds from the issuance or incurrence of any debt and 100% of the excess net cash proceeds from certain
asset sales and condemnation recoveries. We are also required to offer to prepay the Term Loan Facility upon the occurrence of a
change of control. All prepayments are subject to the following premiums, plus accrued and unpaid interest:
the make-whole premium (plus an additional amount if such prepayment is optional and funded with proceeds from the
issuance of equity) for prepayments made during the first 12 months after the closing date;
4.5% of the principal amount prepaid for prepayments made between 12 months and 24 months after the closing date;
2.25% of the principal amount prepaid for prepayments made between 24 months and 36 months after the closing date;
and
no premium for prepayments made following 36 months after the closing date.
Our obligations under the Term Loan Facility are secured on a second priority basis by security interests in all of our assets and
those of our restricted subsidiaries that guarantee our existing first lien revolving credit facility. In addition, the obligations under the
Term Loan Facility are guaranteed by our material restricted subsidiaries. Borrowings under the Term Loan Facility bear interest, at
our option, at either (i) LIBOR plus 9.0% or (ii) the highest of (a) the prime rate, (b) the federal funds rate plus 0.50%, (c) one-month
LIBOR plus 1.0% and (d) 2.0%, each plus 8.0% (an “ABR Loan”). Interest is generally payable at the last day of the applicable
interest period (or, with respect to interest periods of more than three-months’ duration, each day prior to the last day of such interest
period that occurs at intervals of three months’ duration after the first day of such interest period) for Eurodollar loans and quarterly
for ABR loans. At December 31, 2015, the weighted average interest rate on outstanding borrowings under the term loan facility was
10.0%.
The Second Lien Credit Agreement contains customary covenants including, without limitation, covenants that limit our ability
to make restricted payments, take on indebtedness, issue preferred stock, grant liens, conduct sales of assets and subsidiary stock,
make distributions from restricted subsidiaries, conduct affiliate transactions and engage in other business activities. In addition, the
Second Lien Credit Agreement contains covenants substantially similar to those in our existing first lien revolving credit facility,
including, among others, restrictions on swap agreements, debt of unrestricted subsidiaries, drilling and operating agreements and the
sale or discount of receivables. We were in compliance with these covenants as of December 31, 2015.

93
Under the Second Lien Credit Agreement, we may elect to add one or more incremental term loan tranches to the Term Loan
Facility so long as the aggregate outstanding principal amount of the Term Loan Facility plus the principal amount of any incremental
term loan does not exceed $300.0 million and certain other conditions are adhered to. Any such incremental term loans may not
mature on a date earlier than February 23, 2020.
Senior Notes
At December 31, 2015, we had $374.6 million outstanding of our 7.75% senior unsecured notes due 2021 (“7.75% Senior
Notes”). The 7.75% Senior Notes were presented net of a $0.4 million unamortized discount as of December 31, 2015. Interest on the
7.75% Senior Notes is payable semi-annually on January 15 and July 15. At any time prior to January 15, 2016, the 7.75% Senior
Notes are redeemable for up to 35% of the outstanding principal amount with the net cash proceeds of equity offerings at the
redemption price of 107.75%. The 7.75% Senior Notes are also subject to repurchase at a price equal to 101% of the principal amount,
plus accrued and unpaid interest, upon a change of control. At any time prior to January 15, 2017, we may redeem the 7.75% Senior
Notes in whole or in part, at a redemption price equal to 100% of the principal amount of the notes plus the Applicable Premium (as
defined in the indenture governing the 7.75% Senior Notes (the “7.75% Senior Notes Indenture”)), plus accrued and unpaid interest
and additional interest, if any. On and after January 15, 2017, the 7.75% Senior Notes are redeemable, in whole or in part, at a
redemption price of 103.875%, decreasing to 101.938% on January 15, 2018 and 100% on January 15, 2019. Under certain
conditions, including if we sell certain assets and does not reinvest the proceeds or repay senior indebtedness or if it experiences
specific kinds of changes of control, we must offer to repurchase the 7.75% Senior Notes.
On December 29, 2015, we entered into a Third Supplemental Indenture to the 7.75% Senior Notes Indenture following the
receipt of requisite consents of the holders of the 7.75% Senior Notes pursuant to a consent solicitation in respect of the 7.75% Senior
Notes that commenced on December 10, 2015. As a result of the consent solicitation, we paid a consent fee of $10.00 for each $1,000
in principal amount of the 7.75% Senior Notes for a total of approximately $3.8 million that was capitalized as deferred financing
costs.
Consents were received for the purpose of making the following amendments to the 7.75% Senior Notes Indenture:
(1) Increasing the fixed dollar amount in the basket for secured credit facility indebtedness to $1,000.0 million, the approximate
amount of secured credit facility indebtedness currently permitted under our secured credit facilities, from $500.0 million. The use of
secured indebtedness incurred under such basket in exchange for the 7.75% Senior Notes or the 9.25% Senior Notes (as defined
below) will be limited to a maximum amount of $100 million, and the subsidiaries of ours that issued the 7.75% Senior Notes (the
“Issuers”) will be required to make any offer to exchange the 7.75% Senior Notes for secured indebtedness of the Issuers incurred
under such basket to all holders of the 7.75% Senior Notes on a pro rata basis and to make any offer to exchange the 9.25% Senior
Notes for secured indebtedness of the Issuers incurred under such basket to all holders of the 9.25% Senior Notes on a pro rata basis.
(2) Adding an additional covenant providing that we will not permit our consolidated senior secured interest expense to exceed
the greater of $80 million in any fiscal year or 8.0% of the consolidated senior secured debt outstanding as of the last day of any fiscal
year for which audited financial statements have been provided, subject to certain adjustments and cure rights.
(3) Adding a prohibition with respect to certain make-whole, yield maintenance, redemption, repayment or any other payments,
premiums, fees or penalties, providing that such payments or premiums shall not be payable after and during the continuance of an
event of default, upon the automatic or other acceleration of such indebtedness prior to its stated maturity date, or after the
commencement of a case with respect to the Issuers under bankruptcy law.
At December 31, 2015, we had $324.1 million outstanding of our 9.25% senior unsecured notes due 2021 (“9.25% Senior
Notes”). The 9.25% Senior Notes were presented net of a $0.9 million unamortized discount as of December 31, 2015. Interest on the
9.25% Senior Notes is payable semi-annually on February 15 and August 15. At any time prior to August 15, 2017, we may redeem
the 9.25% Senior Notes, in whole or in part, at a redemption price equal to 100% of the principal amount of the notes plus the
Applicable Premium (as defined in the indenture governing the 9.25% Senior Notes (the “9.25% Senior Notes Indenture”)), plus
accrued and unpaid interest, if any. At any time on or after August 15, 2017, we may redeem some or all of the 9.25% Senior Notes at
a redemption price of 104.625%. On or after August 15, 2018, we may redeem some or all of the 9.25% Senior Notes at the
redemption price of 102.313% and on or after August 15, 2019, we may redeem some or all of the 9.25% Senior Notes at the
redemption price of 100.0%. Under certain conditions, including if we sell certain assets and does not reinvest the proceeds or repay
senior indebtedness or if it experiences specific kinds of changes of control, we must offer to repurchase the 9.25% Senior Notes.
In connection with the issuance of the $75.0 million of 9.25% Senior Notes on October 14, 2014, we entered into a registration
rights agreement, whereby we agreed to (a) file an exchange offer registration statement with the SEC to exchange the privately issued
notes for registered notes, and (b) cause the exchange offer to be consummated by July 11, 2015. On April 15, 2015, the registration
94
statement relating to the exchange offer for the 9.25% Senior Notes was declared effective, and the exchange offer was subsequently
launched on April 15, 2014 and expired on May 13, 2015.
On December 17, 2015, we entered into a Fourth Supplemental Indenture to the 9.25% Senior Notes Indenture following the
receipt of requisite consents of the holders of the 9.25% Senior Notes pursuant to a consent solicitation in respect of the 9.25% Senior
Notes that commenced on December 10, 2015. As a result of the consent solicitation, we paid a consent fee of $10.00 for each $1,000
in principal amount of the 9.25% Senior Notes for a total of approximately $3.3 million that was capitalized as deferred financing
costs.
Consents were received for the primary purpose of increasing the fixed dollar amount in the basket for secured credit facility
indebtedness to $1,050.0 million, the approximate amount of secured credit facility indebtedness currently permitted under our
secured credit facilities, from $500.0 million. The use of secured indebtedness incurred under such basket in exchange for the 7.75%
Senior Notes or the 9.25% Senior Notes will be limited to a maximum amount of $100 million.
The 7.75% Senior Notes and 9.25% Senior Notes are guaranteed by certain of our material subsidiaries. The guarantees under
the 7.75% Senior Notes and 9.25% Senior Notes are full and unconditional and joint and several, subject to certain customary
automatic release provisions, including, in certain circumstances, the sale or other disposition of all or substantially all the assets of, or
all of the equity interests in, the subsidiary guarantor, or the subsidiary guarantor is declared “unrestricted” for covenant purposes, and
any subsidiaries of ours, other than the subsidiary guarantors, are minor. There are no restrictions on our ability to obtain cash or any
other distributions of funds from the guarantor subsidiaries.
The indentures governing the 7.75% Senior Notes and 9.25% Senior Notes contain covenants including, without limitation,
covenants that limit our ability to incur certain liens, incur additional indebtedness; declare or pay distributions if an event of default
has occurred; redeem, repurchase, or retire equity interests or subordinated indebtedness; make certain investments; or merge,
consolidate or sell substantially all of our assets. We were in compliance with these covenants as of December 31, 2015.
SECURED HEDGE FACILITY
At December 31, 2015, we had a secured hedge facility agreement with a syndicate of banks under which certain Drilling
Partnerships have the ability to enter into derivative contracts to manage their exposure to commodity price movements. Under our
revolving credit facility, we are required to utilize this secured hedge facility for future commodity risk management activity for our
equity production volumes within the participating Drilling Partnerships. We, as the ultimate general partner of the Drilling
Partnerships, administer the commodity price risk management activity for the Drilling Partnerships under the secured hedge facility
and guarantee their obligations under it. Before executing any hedge transaction, a participating Drilling Partnership is required to,
among other things, provide mortgages on its oil and gas properties and first priority security interests in substantially all of its assets
to the collateral agent for the benefit of the counterparties. The secured hedge facility agreement contains covenants that limit each of
the participating Drilling Partnership’s ability to incur indebtedness, grant liens, make loans or investments, make distributions if a
default under the secured hedge facility agreement exists or would result from the distribution, merge into or consolidate with other
persons, enter into commodity or interest rate swap agreements that do not conform to specified terms or that exceed specified
amounts, or engage in certain asset dispositions including a sale of all or substantially all of its assets.
In addition, it will be an event of default under our revolving credit facility if we, as the ultimate general partner of the Drilling
Partnerships, breach an obligation governed by the secured hedge facility, and the effect of such breach is to cause amounts owing
under swap agreements governed by the secured hedge facility to become immediately due and payable.
ISSUANCE OF UNITS
In August 2015, we entered into a distribution agreement with MLV & Co. LLC (“MLV”) which we terminated and replaced in
November 2015, when we entered into a distribution agreement (the “Distribution Agreement”) with MLV and FBR Capital
Markets & Co. (“FBR” and, together with MLV, the “Agents”). Pursuant to the distribution agreement, we may sell from time to time
to or through the Agents our 8.625% Class D Cumulative Redeemable Perpetual Preferred Units (“Class D Preferred Units”) and our
Class E Cumulative Redeemable Perpetual Preferred Units (“Class E Preferred Units”) and together with the Class D Preferred Units,
the “Preferred Units”) having an aggregate offering price of up to $100 million. Sales of the Preferred Units, if any, may be made in
negotiated transactions or transactions that are deemed to be “at-the-market” offerings as defined in Rule 415 of the Securities Act of
1933, as amended, including sales made to or through a market maker other than on an exchange or through an electronic
communications network and sales made directly on the NYSE, the existing trading market for the Preferred Units. Under the terms of
the distribution agreement, we may sell our Preferred Units from time to time to each Agent as principal for its respective account at a
price equal to 97.0% of the volume weighted average price of the Class D Preferred Units or Class E Preferred Units, as applicable, on
95
the date of sale. Upon the sale of Preferred Units to an Agent as principal, we and such Agent will enter into separate terms agreement
with respect to such sale.
The Preferred Units may also be offered by the Sales Agent as agents for us at negotiated prices or prevailing market prices at
the time of sale. We pay each Agent a commission on Preferred Units sold by it in an agency capacity, which shall not be more than
3.0% of the gross sales price of Preferred Units sold through the Agent as agent for us. Under the August 2015 Distribution
Agreement, we issued 90,328 Class D Preferred Units and 1,083 Class E Preferred Units for net proceeds of $0.9 million, net of $0.3
million in commissions and offering expenses paid. Under the November 2015 Distribution Agreement, we did not issue any Class D
Preferred Units nor Class E Preferred Units under the preferred equity distribution program for $0.1 million of net offering expenses
paid.
In July 2015, the remaining 39,654 Class B Preferred Units were converted into common limited partner units.
In May 2015, in connection with the Arkoma Acquisition (see “Recent Developments”), we issued 6,500,000 of our common
limited partner units in a public offering at a price of $7.97 per unit, yielding net proceeds of approximately $49.7 million. We used a
portion of the net proceeds to fund the Arkoma Acquisition and to reduce borrowings outstanding under our revolving credit facility.
In April 2015, we issued 255,000 of our Class E Preferred Units at a public offering price of $25.00 per unit for net proceeds of
approximately $6.0 million (see “Recent Developments”). We pay cumulative distributions on a quarterly basis at an annual rate of
$2.6875 per unit or at a rate of 10.75% per annum of the stated liquidation preference of $25.00.
In October 2014, in connection with the Eagle Ford Acquisition, we issued 3,200,000 Class D Preferred Units at a public
offering price of $25.00 per unit, yielding net proceeds of approximately $77.3 million from the offering, after deducting underwriting
discounts and estimated offering expenses. We used the net proceeds from the offering to fund a portion of the Eagle Ford
Acquisition. On March 31, 2015, to partially pay our portion of the quarterly installment related to the Eagle Ford Acquisition, we
issued an additional 800,000 Class D Preferred Units directly to the seller at a value of $25.00 per unit. We pay distributions on a
quarterly basis, at an annual rate of $2.15625 per unit, or 8.625% of the $25.00 liquidation preference.
The Class D and Class E Preferred Units rank senior to our common units and Class C Preferred Units with respect to the
payment of distributions and distributions upon a liquidation event. The Class D and Class E Preferred Units have no stated maturity
and are not subject to mandatory redemption or any sinking fund and will remain outstanding indefinitely unless repurchased or
redeemed by us or converted into our common units in connection with a change in control. At any time on or after October 15, 2019
for the Class D Preferred Units and April 15, 2020 for the Class E Preferred Units, we may, at our option, redeem such preferred units
in whole or in part, at a redemption price of $25.00 per unit plus an amount equal to all accumulated and unpaid distributions thereon
to the date of redemption, whether or not declared. In addition, we may redeem such preferred units following certain changes of
control, as described in the respective Certificates of Designation. If we do not exercise this redemption option upon a change of
control, then holders of such preferred units will have the option to convert the preferred units into a number of our common units as
set forth in the respective Certificates of Designation. If we exercise any of our redemption rights relating to such preferred units, the
holders will not have the conversion right described above with respect to the preferred units called for redemption. Additionally, if at
any time our general partner and its affiliates own more than two-thirds of the outstanding class of any limited partner interests, our
general partner will have the right, which it may assign to any of its affiliates or to us, to acquire all, but not less than all, of such class
of limited partner interests held by unaffiliated persons at a price equal to the greater of (1) the highest cash price paid by our general
partner or any of its affiliates for any limited partner interests of the class purchased within the 90 days preceding the date on which
our general partner first mails notice of its election to purchase those limited partner interests; and (2) the average of the daily closing
prices of the limited partner interests of such class over the 20 trading days preceding the date three days before the date of the mailing
of the exercise notice for such call right.
In August 2014, we entered into an equity distribution agreement with Deutsche Bank Securities Inc., as representative of the
Agents. Pursuant to the equity distribution agreement, we may sell from time to time through the Agents common units representing
limited partner interests of us having an aggregate offering price of up to $100.0 million. Sales of common units, if any, may be made
in negotiated transactions or transactions that are deemed to be “at-the-market” offerings as defined in Rule 415 of the Securities Act,
including sales made directly on the New York Stock Exchange, the existing trading market for the common units, or sales made to or
through a market maker other than on an exchange or through an electronic communications network. We will pay each of the Agents
a commission, which in each case shall not be more than 2.0% of the gross sales price of common units sold through such Agent.
Under the terms of the equity distribution agreement, we may also sell common units from time to time to any Agent as principal for
its own account at a price to be agreed upon at the time of sale. Any sale of common units to an Agent as principal would be pursuant
to the terms of a separate terms agreement between us and such Agent. During the year ended December 31, 2015, we issued
9,803,451 common limited partner units under the equity distribution program for net proceeds of $44.2 million, net of $1.1 million in
commissions and offering expenses paid.

96
In May 2014, in connection with the Rangely Acquisition, we issued 15,525,000 of our common limited partner units (including
2,025,000 units pursuant to an over-allotment option) in a public offering at a price of $19.90 per unit, yielding net proceeds of
approximately $297.3 million.
In March 2014, in connection with the GeoMet Acquisition, we issued 6,325,000 of our common limited partner units
(including 825,000 units pursuant to an over-allotment option) in a public offering at a price of $21.18 per unit, yielding net proceeds
of approximately $129.0 million.
CRITICAL ACCOUNTING POLICIES AND ESTIMATES
The preparation of financial statements in conformity with accounting principles generally accepted in the United States requires
making estimates and assumptions that affect the reported amounts of assets and liabilities and disclosure of contingent assets and
liabilities at the date of the financial statements and the reported amounts of actual revenue and expenses during the reporting period.
Although we base our estimates on historical experience and various other assumptions that we believe to be reasonable under the
circumstances, actual results may differ from the estimates on which our financial statements are prepared at any given point of time.
Changes in these estimates could materially affect our financial position, results of operations or cash flows. Significant items that are
subject to such estimates and assumptions include revenue and expense accruals, depletion, depreciation and amortization, asset
impairment, fair value of derivative instruments, the probability of forecasted transactions and the allocation of purchase price to the
fair value of assets acquired. We summarize our significant accounting policies within our consolidated financial statements included
in “Item 8: Financial Statements and Supplementary Data – Note 2” included in this report. The critical accounting policies and
estimates we have identified are discussed below.
Depreciation and Impairment of Long-Lived Assets and Goodwill
Long-Lived Assets. The cost of property, plant and equipment, less estimated salvage value, is generally depreciated on a
straight-line basis over the estimated useful lives of the assets. Useful lives are based on historical experience and are adjusted when
changes in planned use, technological advances or other factors indicate that a different life would be more appropriate. Changes in
useful lives that do not result in the impairment of an asset are recognized prospectively.
Long-lived assets, other than goodwill and intangibles with infinite lives, generally consist of natural gas and oil properties and
pipeline, processing and compression facilities and are reviewed for impairment whenever events or changes in circumstances indicate
that the carrying amount of the assets may not be recoverable. A long-lived asset, other than goodwill and intangibles with infinite
lives, is considered to be impaired when the undiscounted net cash flows expected to be generated by the asset are less than its
carrying amount. The undiscounted net cash flows expected to be generated by the asset are based upon our estimates that rely on
various assumptions, including natural gas and oil prices, production and operating expenses. Any significant variance in these
assumptions could materially affect the estimated net cash flows expected to be generated by the asset. As discussed in “General
Trends and Outlook” within this section, recent increases in natural gas and oil drilling have driven an increase in the supply of natural
gas and oil and put a downward pressure on domestic prices. Further declines in commodity prices may result in additional
impairment charges in future periods.
There were no impairments of unproved gas and oil properties recorded by us for the year ended December 31, 2014. During the
year ended December 31, 2015, we recognized $6.6 million of asset impairments related to our unproved gas and oil properties within
property, plant and equipment, net on our consolidated balance sheet, primarily for our unproved acreage in the New Albany Shale.
During the year ended December 31, 2013, we recognized $13.5 million of asset impairments related to our unproved gas and oil
properties within property, plant and equipment, net on our consolidated balance sheet, primarily for our unproved acreage in the
Chattanooga and New Albany Shales.
For the year ended December 31, 2015, we recognized $960.0 million of asset impairment related to proved oil and gas
properties in the Barnett, Coal-bed Methane, Rangely, Southern Appalachia, Marcellus and Mississippi Lime operating areas, which
were impaired due to lower forecasted commodity prices, net of $85.8 million of future hedge gains reclassified from accumulated
other comprehensive income. During the year ended December 31, 2014, we recognized $555.7 million of asset impairments related
to proved oil and gas properties within our Appalachian and mid-continent operations, which was net of $82.3 million of future hedge
gains reclassified from accumulated other comprehensive income. Asset impairments for the year ended December 31, 2014
principally resulted from the decline in forward commodity prices during the fourth quarter of 2014 through the impairment testing
date in January 2015. During the year ended December 31, 2013, we recognized $24.5 million of asset impairments related to our
proved gas and oil properties within property, plant and equipment, net on our consolidated balance sheet for our shallow natural gas
wells in the New Albany Shale. These impairments related to the carrying amounts of these gas and oil properties being in excess of
our estimate of their fair values at December 31, 2015, 2014 and 2013. The estimate of fair values of these gas and oil properties was
impacted by, among other factors, the deterioration of commodity prices at the date of measurement.

97
Events or changes in circumstances that would indicate the need for impairment testing include, among other factors: operating
losses; unused capacity; market value declines; technological developments resulting in obsolescence; changes in demand for products
manufactured by others utilizing our services or for our products; changes in competition and competitive practices; uncertainties
associated with the United States and world economies; changes in the expected level of environmental capital, operating or
remediation expenditures; and changes in governmental regulations or actions. Additional factors impacting the economic viability of
long-lived assets are discussed under “Item 1A: Risk Factors” in this report.
Goodwill and Intangibles with Infinite Lives. Goodwill and intangibles with infinite lives must be tested for impairment annually
or more frequently if events or changes in circumstances indicate that the related asset might be impaired. An impairment loss should
be recognized if the carrying value of an entity’s reporting units exceeds its estimated fair value.
There were no goodwill impairments recognized by us during the years ended December 31, 2015 and 2013. During the year
ended December 31, 2014, we recorded an $18.1 million goodwill non-cash impairment loss within asset impairment on our
consolidated statement of operations related to an impairment of goodwill in our gas and oil production reporting unit due to a decline
in overall commodity prices. These estimates were subjective and based upon numerous assumptions about future operations and
market conditions, which are subject to change.
Fair Value of Financial Instruments
We have established a hierarchy to measure our financial instruments at fair value, which requires us to maximize the use of
observable inputs and minimize the use of unobservable inputs when measuring fair value. The hierarchy defines three levels of inputs
that may be used to measure fair value:
Level 1 – Unadjusted quoted prices in active markets for identical, unrestricted assets and liabilities that the reporting
entity has the ability to access at the measurement date.
Level 2 – Inputs other than quoted prices included within Level 1 that are observable for the asset and liability or can be
corroborated with observable market data for substantially the entire contractual term of the asset or liability.
Level 3 – Unobservable inputs that reflect the entity’s own assumptions about the assumptions market participants would
use in the pricing of the asset or liability and are consequently not based on market activity but rather through particular
valuation techniques.
We use a fair value methodology to value the assets and liabilities for our outstanding derivative contracts. Our commodity
hedges are calculated based on observable market data related to the change in price of the underlying commodity and are therefore
defined as Level 2 fair value measurements.
Liabilities that are required to be measured at fair value on a nonrecurring basis include our asset retirement obligations that are
defined as Level 3. Estimates of the fair value of asset retirement obligations are based on discounted cash flows using numerous
estimates, assumptions, and judgments regarding the cost, timing of settlement, our credit-adjusted risk-free rate and inflation rates.
During the years ended December 31, 2014 and 2013, we completed several acquisitions of oil and gas properties and related
assets. The fair value measurements of assets acquired and liabilities assumed are based on inputs that are not observable in the market
and therefore represent Level 3 inputs. The fair values of natural gas and oil properties were measured using a discounted cash flow
model, which considered the estimated remaining lives of the wells based on reserve estimates, future operating and development
costs of the assets, as well as the respective natural gas, oil and natural gas liquids forward price curves. The fair values of the asset
retirement obligations were measured under our existing methodology for recognizing an estimated liability for the plugging and
abandonment of our gas and oil wells (see “Item 1: Financial Statements - Note 6). These inputs require significant judgments and
estimates by management at the time of the valuation and are subject to change.
Reserve Estimates
Our estimates of proved natural gas, oil and natural gas liquids reserves and future net revenues from them are based upon
reserve analyses that rely upon various assumptions, including those required by the SEC, as to natural gas, oil and natural gas liquids
prices, drilling and operating expenses, capital expenditures and availability of funds. The accuracy of these reserve estimates is a
function of many factors including the following: the quality and quantity of available data, the interpretation of that data, the accuracy
of various mandated economic assumptions and the judgments of the individuals preparing the estimates. We engaged independent
third-party reserve engineers to prepare reports of our proved reserves (see “Item 2: Properties”).
Any significant variance in the assumptions utilized in the calculation of our reserve estimates could materially affect the
estimated quantity of our reserves. As a result, our estimates of proved natural gas, oil and natural gas liquids reserves are inherently
98
imprecise. Actual future production, natural gas, oil and natural gas liquids prices, revenues, development expenditures, operating
expenses and quantities of recoverable natural gas, oil and natural gas liquids reserves may vary substantially from our estimates or
estimates contained in the reserve reports and may affect our ability to pay amounts due under our credit facility or cause a reduction
in our credit facility. In addition, our proved reserves may be subject to downward or upward revision based upon production history,
results of future exploration and development, prevailing natural gas, oil and natural gas liquids prices, mechanical difficulties,
governmental regulation and other factors, many of which are beyond our control. Our reserves and their relation to estimated future
net cash flows impact the calculation of impairment and depletion of oil and gas properties. Adjustments to quarterly depletion rates,
which are based upon a units of production method, are made concurrently with changes to reserve estimates. Generally, an increase
or decrease in reserves without a corresponding change in capitalized costs will have a corresponding inverse impact to depletion
expense.
Asset Retirement Obligations
We estimate the cost of future dismantlement, restoration, reclamation and abandonment of our operating assets.
We recognize an estimated liability for the plugging and abandonment of our gas and oil wells and related facilities. We also
recognize a liability for our future asset retirement obligations if a reasonable estimate of the fair value of that liability can be made.
The associated asset retirement costs are capitalized as part of the carrying amount of the long-lived asset. We also consider the
estimated salvage value in the calculation of depreciation, depletion and amortization.
The estimated liability is based on our historical experience in plugging and abandoning wells, estimated remaining lives of
those wells based on reserve estimates, external estimates as to the cost to plug and abandon the wells in the future and federal and
state regulatory requirements. The liability is discounted using an assumed credit-adjusted risk-free interest rate. Asset removal
technologies and costs are constantly changing, as are regulatory, political, environmental, safety and public relations considerations.
Since there are many variables in estimating asset retirement obligations, we attempt to limit the impact of management’s judgment on
certain of these variables by developing a standard cost estimate based on historical costs and industry quotes updated annually.
Revisions to the liability could occur due to changes in estimates of plugging and abandonment costs or remaining lives of the wells,
or if federal or state regulators enact new plugging and abandonment requirements. We have no assets legally restricted for purposes
of settling asset retirement obligations. Except for our gas and oil properties, we believe that there are no other material retirement
obligations associated with tangible long lived assets.
ITEM 7A: QUANTITATIVE AND QUALITATIVE DISCLOSURES ABOUT MARKET RISK
The primary objective of the following information is to provide forward-looking quantitative and qualitative information about
our potential exposure to market risks. The term “market risk” refers to the risk of loss arising from adverse changes in interest rates
and commodity prices. The disclosures are not meant to be precise indicators of expected future losses, but rather indicators of
reasonable possible losses. This forward-looking information provides indicators of how we view and manage our ongoing market risk
exposures. All of the market risk-sensitive instruments were entered into for purposes other than trading.
General
All of our assets and liabilities are denominated in U.S. dollars, and as a result, we do not have exposure to currency exchange
risks.
We are exposed to various market risks, principally fluctuating interest rates and changes in commodity prices. These risks can
impact our results of operations, cash flows and financial position. We manage these risks through regular operating and financing
activities and periodic use of derivative financial instruments such as forward contracts and interest rate cap and swap agreements. The
following analysis presents the effect on our results of operations, cash flows and financial position as if the hypothetical changes in
market risk factors occurred on December 31, 2015. Only the potential impact of hypothetical assumptions was analyzed. The analysis
does not consider other possible effects that could impact our business.
We are subject to the risk of loss on our derivative instruments that we would incur as a result of non-performance by
counterparties pursuant to the terms of their contractual obligations. We maintain credit policies with regard to our counterparties to
minimize our overall credit risk. These policies require (i) the evaluation of potential counterparties’ financial condition to determine
their credit worthiness; (ii) the quarterly monitoring of our oil, natural gas and NGLs counterparties’ credit exposures;
(iii) comprehensive credit reviews on significant counterparties from physical and financial transactions on an ongoing basis; (iv) the
utilization of contractual language that affords us netting or set off opportunities to mitigate exposure risk; and (v) when appropriate
requiring counterparties to post cash collateral, parent guarantees or letters of credit to minimize credit risk. ARP’s assets related to
derivatives as of December 31, 2015 represent financial instruments from ten counterparties; all of which are financial institutions that
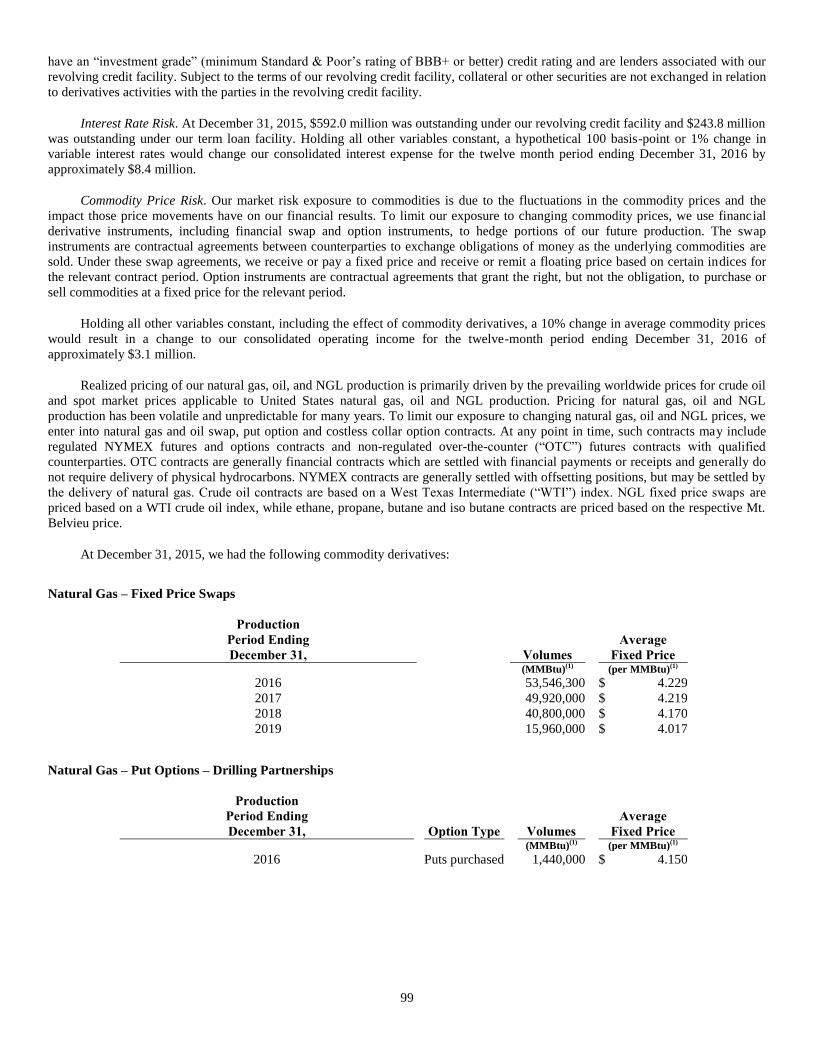
99
have an “investment grade” (minimum Standard & Poor’s rating of BBB+ or better) credit rating and are lenders associated with our
revolving credit facility. Subject to the terms of our revolving credit facility, collateral or other securities are not exchanged in relation
to derivatives activities with the parties in the revolving credit facility.
Interest Rate Risk. At December 31, 2015, $592.0 million was outstanding under our revolving credit facility and $243.8 million
was outstanding under our term loan facility. Holding all other variables constant, a hypothetical 100 basis-point or 1% change in
variable interest rates would change our consolidated interest expense for the twelve month period ending December 31, 2016 by
approximately $8.4 million.
Commodity Price Risk. Our market risk exposure to commodities is due to the fluctuations in the commodity prices and the
impact those price movements have on our financial results. To limit our exposure to changing commodity prices, we use financial
derivative instruments, including financial swap and option instruments, to hedge portions of our future production. The swap
instruments are contractual agreements between counterparties to exchange obligations of money as the underlying commodities are
sold. Under these swap agreements, we receive or pay a fixed price and receive or remit a floating price based on certain indices for
the relevant contract period. Option instruments are contractual agreements that grant the right, but not the obligation, to purchase or
sell commodities at a fixed price for the relevant period.
Holding all other variables constant, including the effect of commodity derivatives, a 10% change in average commodity prices
would result in a change to our consolidated operating income for the twelve-month period ending December 31, 2016 of
approximately $3.1 million.
Realized pricing of our natural gas, oil, and NGL production is primarily driven by the prevailing worldwide prices for crude oil
and spot market prices applicable to United States natural gas, oil and NGL production. Pricing for natural gas, oil and NGL
production has been volatile and unpredictable for many years. To limit our exposure to changing natural gas, oil and NGL prices, we
enter into natural gas and oil swap, put option and costless collar option contracts. At any point in time, such contracts may include
regulated NYMEX futures and options contracts and non-regulated over-the-counter (“OTC”) futures contracts with qualified
counterparties. OTC contracts are generally financial contracts which are settled with financial payments or receipts and generally do
not require delivery of physical hydrocarbons. NYMEX contracts are generally settled with offsetting positions, but may be settled by
the delivery of natural gas. Crude oil contracts are based on a West Texas Intermediate (“WTI”) index. NGL fixed price swaps are
priced based on a WTI crude oil index, while ethane, propane, butane and iso butane contracts are priced based on the respective Mt.
Belvieu price.
At December 31, 2015, we had the following commodity derivatives:
Natural Gas – Fixed Price Swaps
Production
Period Ending
December 31,
Volumes
Average
Fixed Price
(MMBtu)(1) (per MMBtu)(1)
2016 53,546,300 $ 4.229
2017 49,920,000 $ 4.219
2018 40,800,000 $ 4.170
2019 15,960,000 $ 4.017
Natural Gas – Put Options – Drilling Partnerships
Production
Period Ending
December 31,
Option Type Volumes
Average
Fixed Price
(MMBtu)(1) (per MMBtu)(1)
2016 Puts purchased 1,440,000 $ 4.150
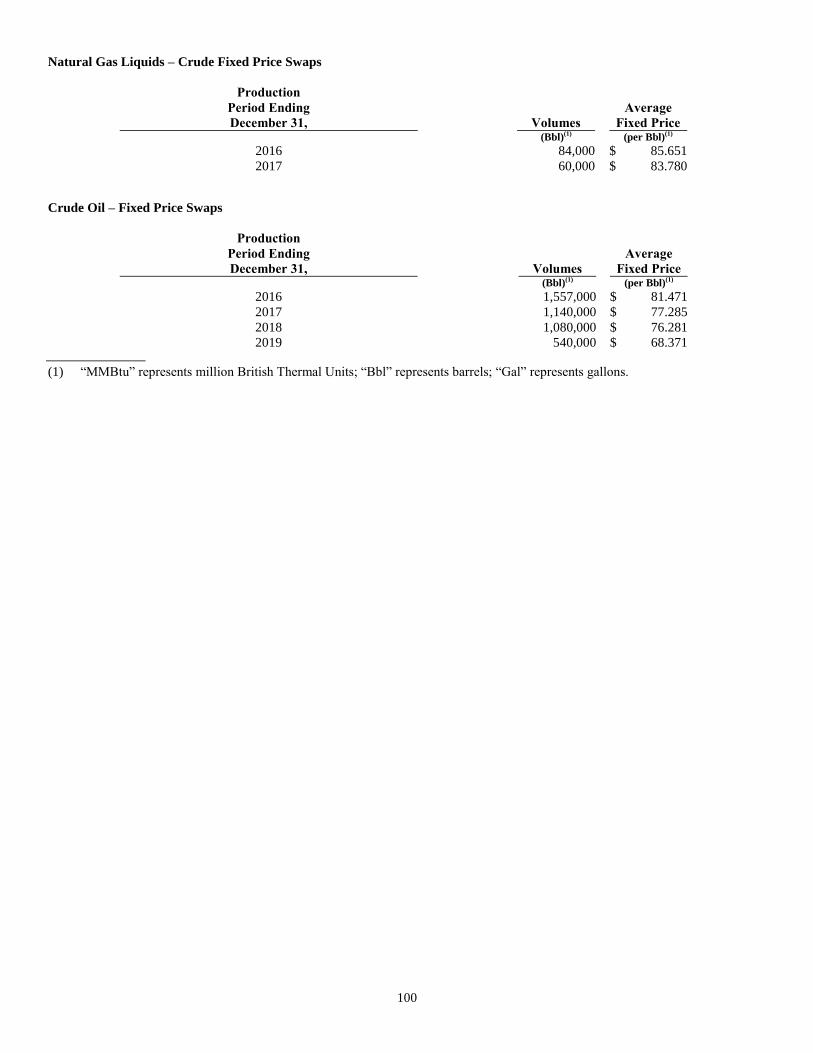
100
Natural Gas Liquids – Crude Fixed Price Swaps
Production
Period Ending
December 31,
Volumes
Average
Fixed Price
(Bbl)(1) (per Bbl)(1)
2016 84,000 $ 85.651
2017 60,000 $ 83.780
Crude Oil – Fixed Price Swaps
Production
Period Ending
December 31,
Volumes
Average
Fixed Price
(Bbl)(1) (per Bbl)(1)
2016 1,557,000 $ 81.471
2017 1,140,000 $ 77.285
2018 1,080,000 $ 76.281
2019 540,000 $ 68.371
(1) “MMBtu” represents million British Thermal Units; “Bbl” represents barrels; “Gal” represents gallons.

101
ITEM 8: FINANCIAL STATEMENTS AND SUPPLEMENTARY DATA
Index
Page
Report of Independent Registered Public Accounting Firm ................................................................................................................... 102
Consolidated Balance Sheets .................................................................................................................................................................. 103
Consolidated Statements of Operations .................................................................................................................................................. 104
Consolidated Statements of Partners’ Capital (Deficit) .......................................................................................................................... 106
Consolidated Statements of Cash Flows ................................................................................................................................................. 107
Notes to Consolidated Financial Statements .......................................................................................................................................... 108
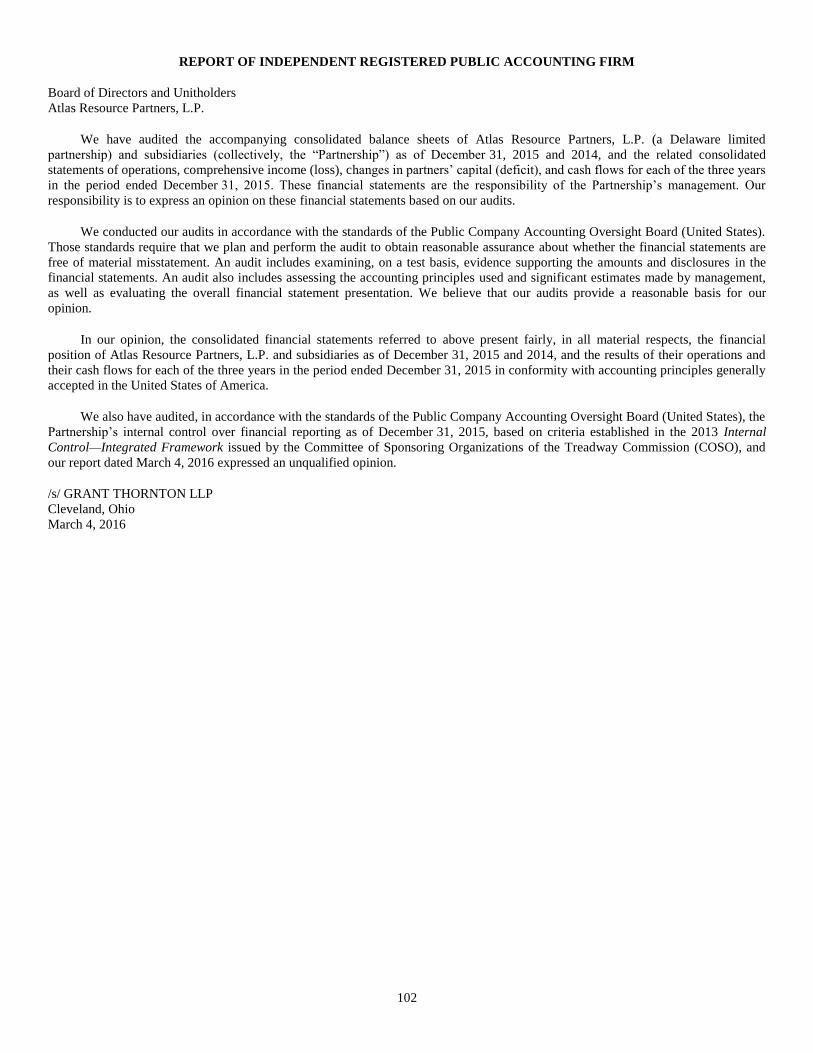
102
REPORT OF INDEPENDENT REGISTERED PUBLIC ACCOUNTING FIRM
Board of Directors and Unitholders
Atlas Resource Partners, L.P.
We have audited the accompanying consolidated balance sheets of Atlas Resource Partners, L.P. (a Delaware limited
partnership) and subsidiaries (collectively, the “Partnership”) as of December 31, 2015 and 2014, and the related consolidated
statements of operations, comprehensive income (loss), changes in partners’ capital (deficit), and cash flows for each of the three years
in the period ended December 31, 2015. These financial statements are the responsibility of the Partnership’s management. Our
responsibility is to express an opinion on these financial statements based on our audits.
We conducted our audits in accordance with the standards of the Public Company Accounting Oversight Board (United States).
Those standards require that we plan and perform the audit to obtain reasonable assurance about whether the financial statements are
free of material misstatement. An audit includes examining, on a test basis, evidence supporting the amounts and disclosures in the
financial statements. An audit also includes assessing the accounting principles used and significant estimates made by management,
as well as evaluating the overall financial statement presentation. We believe that our audits provide a reasonable basis for our
opinion.
In our opinion, the consolidated financial statements referred to above present fairly, in all material respects, the financial
position of Atlas Resource Partners, L.P. and subsidiaries as of December 31, 2015 and 2014, and the results of their operations and
their cash flows for each of the three years in the period ended December 31, 2015 in conformity with accounting principles generally
accepted in the United States of America.
We also have audited, in accordance with the standards of the Public Company Accounting Oversight Board (United States), the
Partnership’s internal control over financial reporting as of December 31, 2015, based on criteria established in the 2013 Internal
Control—Integrated Framework issued by the Committee of Sponsoring Organizations of the Treadway Commission (COSO), and
our report dated March 4, 2016 expressed an unqualified opinion.
/s/ GRANT THORNTON LLP
Cleveland, Ohio
March 4, 2016

103
ATLAS RESOURCE PARTNERS, L.P.
CONSOLIDATED BALANCE SHEETS
(in thousands)
December 31,
2015 2014
ASSETS
Current assets:
Cash and cash equivalents ....................................................................................................... $ 1,353 $ 15,247
Accounts receivable................................................................................................................. 63,367 114,520
Advances to affiliates .............................................................................................................. — 6,567
Current portion of derivative asset .......................................................................................... 159,460 144,259
Subscriptions receivable .......................................................................................................... 19,877 32,398
Prepaid expenses and other...................................................................................................... 22,935 26,296
Total current assets............................................................................................................. 266,992 339,287
Property, plant and equipment, net ............................................................................................... 1,191,611 2,263,820
Goodwill and intangible assets, net ............................................................................................... 14,095 14,330
Long-term derivative asset ............................................................................................................ 198,262 130,602
Other assets, net ............................................................................................................................ 60,044 50,081
Total assets.................................................................................................................................. $ 1,731,004 $ 2,798,120
LIABILITIES AND PARTNERS’ CAPITAL (DEFICIT)
Current liabilities:
Accounts payable .................................................................................................................... $ 49,249 $ 111,198
Advances from affiliates .......................................................................................................... 9,924 8,816
Liabilities associated with drilling contracts ........................................................................... 21,483 40,611
Current portion of derivative payable to Drilling Partnerships ............................................... 2,574 932
Accrued well drilling and completion costs ............................................................................ 26,914 80,404
Accrued interest ....................................................................................................................... 25,436 26,452
Distribution payable ................................................................................................................ 4,334 20,876
Deferred acquisition purchase price ........................................................................................ — 23,445
Accrued liabilities .................................................................................................................... 22,086 33,406
Total current liabilities ....................................................................................................... 162,000 346,140
Long-term debt ............................................................................................................................. 1,534,482 1,394,460
Asset retirement obligations ......................................................................................................... 113,740 107,950
Other long-term liabilities ............................................................................................................. 5,410 2,033
Commitments and contingencies (Note 11)
Partners’ Capital (Deficit):
General partner’s interest ........................................................................................................ (33,642 ) (13,697 )
Preferred limited partners’ interests ........................................................................................ 188,739 163,522
Class C common limited partner warrants............................................................................... 1,176 1,176
Common limited partners’ interests ........................................................................................ (260,276 ) 605,065
Accumulated other comprehensive income ............................................................................. 19,375 191,471
Total partners’ capital (deficit) ........................................................................................... (84,628 ) 947,537
Total liabilities and partners’ capital (deficit) ......................................................................... $ 1,731,004 $ 2,798,120
See accompanying notes to consolidated financial statements.

104
ATLAS RESOURCE PARTNERS, L.P.
CONSOLIDATED STATEMENTS OF OPERATIONS
(in thousands, except per unit data)
Years Ended December 31,
2015 2014 2013
Revenues:
Gas and oil production ........................................................................................ $ 356,999 $ 470,051 $ 273,604
Well construction and completion ...................................................................... 76,505 173,564 167,883
Gathering and processing ................................................................................... 7,431 14,107 15,676
Administration and oversight ............................................................................. 7,812 15,564 12,277
Well services ...................................................................................................... 23,822 24,959 19,492
Gain on mark-to-market derivatives ................................................................... 267,223 2,819 —
Other, net ............................................................................................................ 241 590 (14,456 )
Total revenues ............................................................................................... 740,033 701,654 474,476
Costs and expenses:
Gas and oil production ........................................................................................ 169,653 182,226 100,098
Well construction and completion ...................................................................... 66,526 150,925 145,985
Gathering and processing ................................................................................... 9,613 15,525 18,012
Well services ...................................................................................................... 9,162 10,007 9,515
General and administrative ................................................................................. 65,968 72,349 78,063
Depreciation, depletion and amortization ........................................................... 157,978 239,923 139,783
Asset impairment ................................................................................................ 966,635 573,774 38,014
Total costs and expenses ............................................................................... 1,445,535 1,244,729 529,470
Operating loss ......................................................................................................... (705,502 ) (543,075 ) (54,994 )
Interest expense .................................................................................................. (102,133 ) (62,144 ) (34,324 )
Loss on asset sales and disposal ......................................................................... (1,181 ) (1,869 ) (987 )
Net loss .................................................................................................................... (808,816 ) (607,088 )
(90,305 )
Preferred limited partner dividends .................................................................... (16,469 ) (19,267 ) (11,992 )
Net loss attributable to common limited partners and the general partner ..... $ (825,285 ) $ (626,355 ) $ (102,297 )
Allocation of net loss attributable to common limited partners and the general
partner:
Common limited partners’ interest ..................................................................... $ (808,780 ) $ (625,133 ) $ (105,661 )
General partner’s interest ................................................................................... (16,505 ) (1,222 ) 3,364
Net loss attributable to common limited partners and the general partner ......... $ (825,285 ) $ (626,355 ) $ (102,297 )
Net loss attributable to common limited partners per unit:
Basic ................................................................................................................... $ (8.63 ) $ (8.37 ) $ (2.01 )
Diluted ................................................................................................................ $ (8.63 ) $ (8.37 ) $ (2.01 )
Weighted average common limited partner units outstanding:
Basic ................................................................................................................... 93,745 74,716 52,528
Diluted ................................................................................................................ 93,745 74,716 52,528
See accompanying notes to consolidated financial statements.
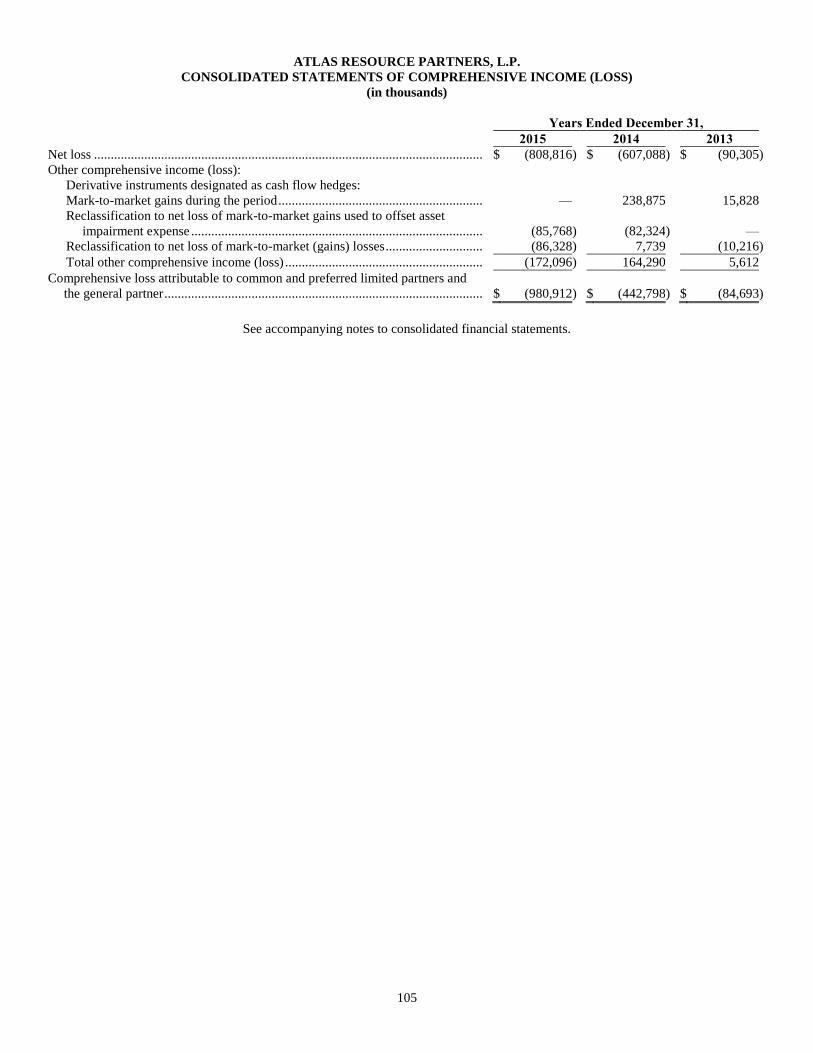
105
ATLAS RESOURCE PARTNERS, L.P.
CONSOLIDATED STATEMENTS OF COMPREHENSIVE INCOME (LOSS)
(in thousands)
Years Ended December 31,
2015 2014 2013
Net loss .................................................................................................................... $ (808,816 ) $ (607,088 ) $ (90,305 )
Other comprehensive income (loss):
Derivative instruments designated as cash flow hedges:
Mark-to-market gains during the period ............................................................. — 238,875 15,828
Reclassification to net loss of mark-to-market gains used to offset asset
impairment expense ....................................................................................... (85,768 ) (82,324 )
—
Reclassification to net loss of mark-to-market (gains) losses ............................. (86,328 ) 7,739 (10,216 )
Total other comprehensive income (loss) ........................................................... (172,096 ) 164,290 5,612
Comprehensive loss attributable to common and preferred limited partners and
the general partner ............................................................................................... $ (980,912 ) $ (442,798 )
$ (84,693 )
See accompanying notes to consolidated financial statements.
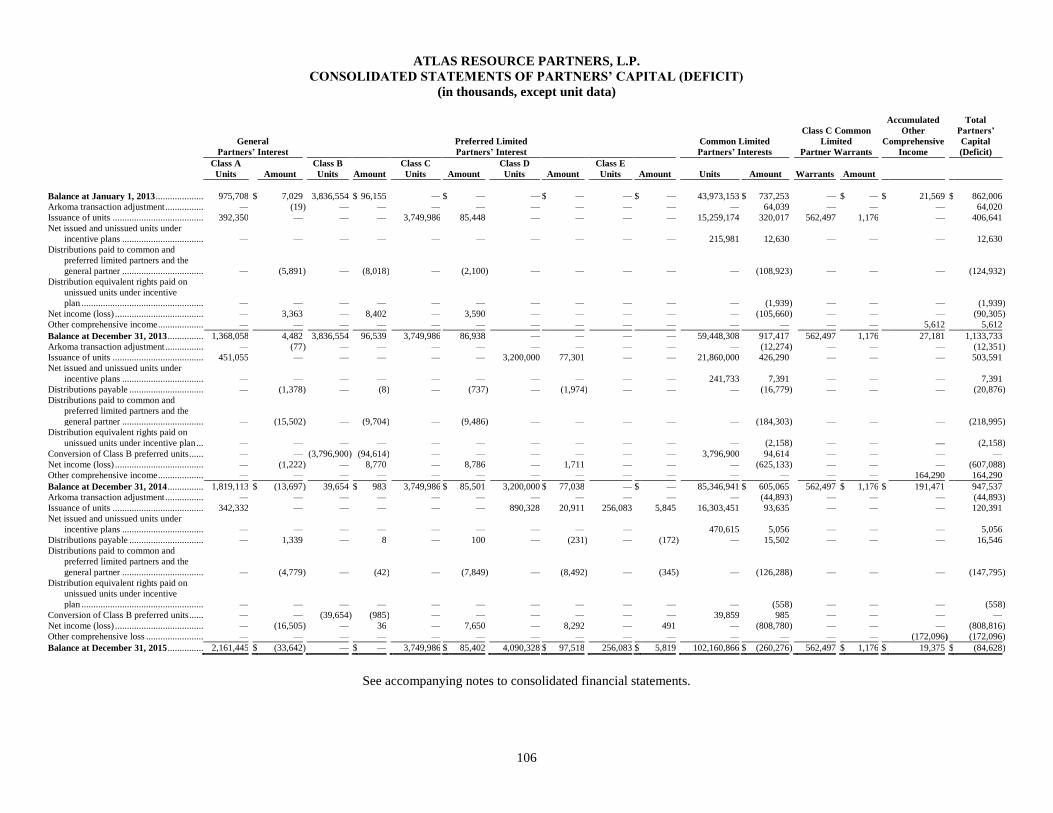
106
ATLAS RESOURCE PARTNERS, L.P.
CONSOLIDATED STATEMENTS OF PARTNERS’ CAPITAL (DEFICIT)
(in thousands, except unit data)
General
Partners’ Interest
Preferred Limited
Partners’ Interest
Common Limited
Partners’ Interests
Class C Common
Limited
Partner Warrants
Accumulated
Other
Comprehensive
Income
Total
Partners’
Capital
(Deficit)
Class A
Units Amount
Class B
Units Amount
Class C
Units Amount
Class D
Units Amount
Class E
Units Amount Units Amount Warrants Amount
Balance at January 1, 2013 ....................
975,708 $ 7,029 3,836,554 $ 96,155 — $ —
— $ —
— $ —
43,973,153 $ 737,253 — $ — $ 21,569 $ 862,006
Arkoma transaction adjustment ................ — (19 ) — — — — — — — — — 64,039 — — — 64,020
Issuance of units ...................................... 392,350 — — — 3,749,986 85,448 — — — — 15,259,174 320,017 562,497 1,176 — 406,641
Net issued and unissued units under
incentive plans .................................. — — — — — —
— —
— —
215,981 12,630 — — — 12,630
Distributions paid to common and
preferred limited partners and the
general partner .................................. — (5,891 ) — (8,018 ) — (2,100 )
— —
— —
— (108,923 ) — — — (124,932 )
Distribution equivalent rights paid on
unissued units under incentive
plan ................................................... — — — — — —
— —
— —
— (1,939 ) — — — (1,939 )
Net income (loss) ..................................... — 3,363 — 8,402 — 3,590 — — — — — (105,660 ) — — — (90,305 )
Other comprehensive income ................... — — — — — — — — — — — — — — 5,612 5,612
Balance at December 31, 2013 ............... 1,368,058 4,482 3,836,554 96,539 3,749,986 86,938 — — — — 59,448,308 917,417 562,497 1,176 27,181 1,133,733
Arkoma transaction adjustment ................ — (77 ) — — — — — — — — — (12,274 ) — — — (12,351 )
Issuance of units ...................................... 451,055 — — — — — 3,200,000 77,301 — — 21,860,000 426,290 — — — 503,591
Net issued and unissued units under
incentive plans .................................. — — — — — —
— —
— —
241,733 7,391 — — — 7,391
Distributions payable ............................... — (1,378 ) — (8 ) — (737 ) — (1,974 ) — — — (16,779 ) — — — (20,876 )
Distributions paid to common and
preferred limited partners and the
general partner .................................. — (15,502 ) — (9,704 ) — (9,486 )
— —
— —
— (184,303 ) — — — (218,995 )
Distribution equivalent rights paid on
unissued units under incentive plan ... — — — — — —
— —
— —
— (2,158 ) — — — (2,158 )
Conversion of Class B preferred units ...... — — (3,796,900 ) (94,614 ) — — — — — — 3,796,900 94,614 — — — —
Net income (loss) ..................................... — (1,222 ) — 8,770 — 8,786 — 1,711 — — — (625,133 ) — — — (607,088 )
Other comprehensive income ................... — — — — — — — — — — — — — — 164,290 164,290
Balance at December 31, 2014 ............... 1,819,113 $ (13,697 ) 39,654 $ 983 3,749,986 $ 85,501 3,200,000 $ 77,038 — $ — 85,346,941 $ 605,065 562,497 $ 1,176 $ 191,471 947,537
Arkoma transaction adjustment ................ — — — — — — — — — — — (44,893 ) — — — (44,893 )
Issuance of units ...................................... 342,332 — — — — — 890,328 20,911 256,083 5,845 16,303,451 93,635 — — — 120,391
Net issued and unissued units under
incentive plans .................................. — — — — — —
—
—
—
470,615 5,056 — — — 5,056
Distributions payable ............................... — 1,339 — 8 — 100 — (231 ) — (172 ) — 15,502 — — — 16,546
Distributions paid to common and
preferred limited partners and the
general partner .................................. — (4,779 ) — (42 ) — (7,849 )
—
(8,492 )
— (345 )
— (126,288 ) — — — (147,795 )
Distribution equivalent rights paid on
unissued units under incentive
plan ................................................... — — — — — —
—
—
— —
— (558 ) — — — (558 )
Conversion of Class B preferred units ...... — — (39,654 ) (985 ) — — — — — — 39,859 985 — — — —
Net income (loss) ..................................... — (16,505 ) — 36 — 7,650 — 8,292 — 491 — (808,780 ) — — — (808,816 )
Other comprehensive loss ........................ — — — — — — — — — — — — — — (172,096 ) (172,096 )
Balance at December 31, 2015 ............... 2,161,445 $ (33,642 ) — $ — 3,749,986 $ 85,402 4,090,328 $ 97,518 256,083 $ 5,819 102,160,866 $ (260,276 ) 562,497 $ 1,176 $ 19,375 $ (84,628 )
See accompanying notes to consolidated financial statements.

107
ATLAS RESOURCE PARTNERS, L.P.
CONSOLIDATED STATEMENTS OF CASH FLOWS
(in thousands)
Years Ended December 31,
2015 2014 2013
CASH FLOWS FROM OPERATING ACTIVITIES:
Net loss ................................................................................................................... $ (808,816 ) $ (607,088 ) $ (90,305 )
Adjustments to reconcile net loss to net cash provided by operating activities:
Depreciation, depletion and amortization .................................................... 157,978 239,923 139,783
Asset impairment ......................................................................................... 966,635 573,774 38,014
Gain on derivatives ...................................................................................... (226,743 ) — 4,749
Loss on asset sales and disposal ................................................................... 1,181 1,869 987
Non-cash compensation expense ................................................................. 4,944 8,067 12,680
Amortization of deferred financing costs and discount and premium on
long-term debt .........................................................................................
19,640 9,191
9,560
Changes in operating assets and liabilities:
Accounts receivable, prepaid expenses and other ........................................ 132,559 (77,476 ) (11,958 )
Accounts payable and accrued liabilities ..................................................... (74,574 ) 54,563 20,422
Net cash provided by operating activities .......................................................... 172,804 202,823 123,932
CASH FLOWS FROM INVESTING ACTIVITIES:
Capital expenditures................................................................................................ (127,138 ) (212,728 ) (263,886 )
Net cash paid for acquisitions ................................................................................. (77,854 ) (686,811 ) (780,857 )
Other ....................................................................................................................... 990 3,096 (4,863 )
Net cash used in investing activities .................................................................. (204,002 ) (896,443 ) (1,049,606 )
CASH FLOWS FROM FINANCING ACTIVITIES:
Borrowings under credit facilities ........................................................................... 661,342 1,393,000 942,000
Repayments under credit facilities .......................................................................... (523,000 ) (1,116,000 ) (874,425 )
Distributions paid to unitholders ............................................................................. (147,795 ) (218,995 ) (124,932 )
Net proceeds from long term debt ........................................................................... — 170,596 510,396
Net proceeds from issuance of common limited partner units ................................ 93,635 426,290 320,017
Net proceeds from issuance of preferred units ........................................................ 6,778 77,301 86,624
Arkoma transaction adjustment .............................................................................. (44,893 ) (12,351 ) 64,020
Deferred financing costs, distribution equivalent rights and other.......................... (28,763 ) (12,802 ) (19,386 )
Net cash provided by financing activities .......................................................... 17,304 707,039 904,314
Net change in cash and cash equivalents ................................................................ (13,894 ) 13,419 (21,360 )
Cash and cash equivalents, beginning of year......................................................... 15,247 1,828 23,188
Cash and cash equivalents, end of year ................................................................... $ 1,353 $ 15,247 $ 1,828
See accompanying notes to consolidated financial statements.
108
ATLAS RESOURCE PARTNERS, L.P.
NOTES TO CONSOLIDATED FINANCIAL STATEMENTS
NOTE 1 – BASIS OF PRESENTATION
Atlas Resource Partners, L.P. (the “Partnership”) is a publicly traded (NYSE: ARP) Delaware master-limited partnership
(“MLP”) and an independent developer and producer of natural gas, crude oil and natural gas liquids (“NGL”) with operations in
basins across the United States. The Partnership sponsors and manages tax-advantaged investment partnerships (the “Drilling
Partnerships”), in which it coinvests, to finance a portion of its natural gas, crude oil and NGL production activities.
On February 27, 2015, the Partnership’s general partner, Atlas Energy Group, LLC (“Atlas Energy Group”; NYSE: ATLS)
distributed 100% of its common units to existing unitholders of its then parent, Atlas Energy, L.P. (“Atlas Energy”), which was a
publicly traded master-limited partnership (NYSE: ATLS) (Atlas Energy and Atlas Energy Group are collectively referred to as
“ATLS”). Atlas Energy Group manages the Partnership’s operations and activities through its ownership of the Partnership’s general
partner interest. Concurrent with Atlas Energy Group’s unit distribution, Atlas Energy and its midstream ownership interests merged
into Targa Resources Corp. (“Targa”; NYSE: TRGP) (the “Atlas Merger”) and ceased trading. At December 31, 2015, Atlas Energy
Group owned 100% of the Partnership’s general partner Class A units, all of the incentive distribution rights through which it manages
and effectively controls the Partnership and an approximate 23.3% limited partner interest (20,962,485 common and 3,749,986
preferred limited partner units) in the Partnership.
In addition to its general and limited partner interest in the Partnership, ATLS also holds general and limited partner interests in
Atlas Growth Partners, L.P. (“AGP”), a Delaware limited partnership and an independent developer and producer of natural gas, oil
and NGLs, with operations primarily focused in the Eagle Ford Shale, and in Lightfoot Capital Partners, L.P. and Lightfoot Capital
Partners GP, LLC, which incubate new MLPs and invest in existing MLPs.
At December 31, 2015, the Partnership had 102,160,866 common limited partner units issued and outstanding. The common
units are a class of limited partner interests in the Partnership. The holders of common units are entitled to participate in partnership
distributions, exercise the rights or privileges available to holders of common units and have limited liability as outlined in the
partnership agreement.
The partnership agreement authorizes the issuance of an unlimited number of additional partnership securities for the
consideration and on the terms and conditions determined by the Partnership’s general partner without the approval of the
Partnership’s unitholders, subject to the rights of holders of the Partnership’s Class B, Class D and Class E Preferred Units to approve
the creation or issuance of any securities senior to such units. The Partnership will continue as a limited partnership until dissolved
under the partnership agreement.
The partnership agreement specifies the manner in which the Partnership will make cash distributions to holders of common
units and other partnership securities as well as to the general partner in respect of incentive distribution rights (see Note 13).
The following is a summary of the unitholder vote required for the matters specified below. Matters requiring the approval of a
“unit majority” require the approval of a majority of the common units. Except as set forth below, the Partnership’s convertible Class
B preferred units, or the Class B Preferred Units, Class C Preferred Units, Class D Preferred Units and Class E Preferred Units have
no voting rights and have limited liability. The holder of the Partnership’s Class A Units has all voting rights applicable to the general
partner and generally has unlimited liability for obligations of the Partnership.
The following is a summary of the vote requirements specified for certain matters under the Partnership’s partnership agreement
(see partnership agreement for full listing of voting requirements):
Issuance of additional partnership securities – common and preferred unitholders have no approval right
Amendment of partnership agreement – certain amendments may be made by the Partnership’s general partner without
approval of common unitholders. Other amendments generally require the approval of a unit majority or, if any
amendment could adversely affect their rights, the approval by a majority of the Class B or Class C Preferred Units or the
approval by two-thirds of the Class D Preferred Units or Class E Preferred Units
Merger or sale of all or substantially all of the Partnership’s assets – unit majority in certain circumstances
Dissolution of the Partnership - unit majority and the approval by a majority of the Class B and Class C Preferred Units
and the approval by two-thirds of the Class D and Class E Preferred Units
Removal of the general partner - not less than two-thirds of the outstanding common units, including common units held
by the Partnership’s general partner and its affiliates
109
NOTE 2 – SUMMARY OF SIGNIFICANT ACCOUNTING POLICIES
Principles of Consolidation
The Partnership’s consolidated financial statements include the accounts of the Partnership and its wholly-owned subsidiaries.
Transactions between the Partnership and other ATLS operations have been identified in the consolidated financial statements as
transactions between affiliates, where applicable. All material intercompany transactions have been eliminated.
On June 5, 2015, the Partnership acquired coal-bed methane producing natural gas assets in the Arkoma Basin in eastern
Oklahoma from ATLS (the “Arkoma Acquisition”). Management of the Partnership determined that the Arkoma Acquisition
constituted a transaction between entities under common control. In comparison to the acquisition method of accounting, whereby the
purchase price for the asset acquisition would have been allocated to identifiable Arkoma assets and liabilities based upon their fair
values with any excess treated as goodwill, transfers between entities under common control require that assets and liabilities be
recognized by the acquirer at historical carrying value at the date of transfer, with any difference between the purchase price and the
net book value of the assets recognized as an adjustment to partners’ capital (deficit) on the Partnership’s consolidated balance sheets.
Also, in comparison to the acquisition method of accounting, whereby the results of operations and the financial position of the
acquisition of Arkoma assets would have been included in the Partnership’s consolidated financial statements from the date of
acquisition, transfers between entities under common control require the acquirer to reflect the effect to the assets acquired and
liabilities assumed and the related results of operations at the beginning of the period during which it was acquired and retrospectively
adjust its prior period consolidated financial statements to furnish comparative information. As such, the Partnership reflected the
impact of the Arkoma Acquisition on its consolidated financial statements in the following manner:
Recognized the assets acquired and liabilities assumed from the Arkoma Acquisition at their historical carrying value at
the date of transfer, with any difference between the purchase price and the net book value of the assets recognized as an
adjustment to partners’ capital (deficit);
Retrospectively adjusted its consolidated financial statements for any date prior to June 5, 2015, the date of acquisition, to
reflect its results on a consolidated basis with the results of the Arkoma assets as of or at the beginning of the respective
period; and
Adjusted the presentation of the Partnership’s consolidated statements of operations for the years ended December 31,
2015, 2014 and 2013 to reflect the results of operations attributable to the Arkoma assets prior to the date of acquisition to
determine income attributable to common limited partners.
Prior to the Arkoma Acquisition, the common limited partners did not participate in the net income (loss) of the Arkoma assets.
Subsequent to the Arkoma Acquisition, the common limited partners participate in the net income (loss) of the Arkoma assets
retrospectively, which was determined after the deduction of the general partner’s and the preferred unitholders’ interests. In
accordance with the accounting guidance for transactions between entities under common control, the retrospective effect of the
restatement of income attributable to common limited partners resulted in a $0.05 and $0.02 decrease in net loss attributable to
common limited partners per unit for the years ended December 31, 2014 and 2013.
In accordance with established practice in the oil and gas industry, the Partnership’s consolidated financial statements include its
pro-rata share of assets, liabilities, income and lease operating and general and administrative costs and expenses of the Drilling
Partnerships in which the Partnership has an interest. Such interests generally approximate 30%. The Partnership’s consolidated
financial statements do not include proportional consolidation of the depletion or impairment expenses of the Drilling Partnerships.
Rather, the Partnership calculates these items specific to its own economics (see “Property, Plant and Equipment”).
Use of Estimates
The preparation of the Partnership’s consolidated financial statements in conformity with U.S. GAAP requires management to
make estimates and assumptions that affect the reported amounts of assets and liabilities and disclosure of contingent assets and
liabilities that exist at the date of the Partnership’s consolidated financial statements, as well as the reported amounts of revenue and
costs and expenses during the reporting periods. The Partnership’s consolidated financial statements are based on a number of
significant estimates, including revenue and expense accruals, depletion, depreciation and amortization, asset impairments, fair value
of derivative instruments, the probability of forecasted transactions and the allocation of purchase price to the fair value of assets
acquired and liabilities assumed. The oil and gas industry principally conducts its business by processing actual transactions as many
as 60 days after the month of delivery. Consequently, the most recent two months’ financial results were recorded using estimated
volumes and contract market prices. Actual results could differ from those estimates.

110
Liquidity and Capital Resources
The Partnership relies on cash flow from operations and its credit facilities to execute its growth strategy and to meet its
financial commitments and other short-term liquidity needs.
In November 2015, the Partnership completed the semi-annual redetermination of its Credit Facility, reducing the borrowing
base from $750 million to $700 million. The Partnership’s next redetermination date is in May 2016. The Partnership’s borrowing
base, and thus its borrowing capacity, under the Credit Facility is impacted by the level of its oil and natural gas reserves. Downward
revisions of its oil and natural gas reserves volume and value due to declines in commodity prices, the impact of lower estimated
capital spending in response to lower prices, performance revisions, sales of assets or the incurrence of certain types of additional
debt, among other items, could cause a reduction of its borrowing base in the future, and these reductions could be significant.
The Partnership believes it has sufficient liquidity from (i) its cash flows from operations (including its hedges scheduled to
settle in 2016), (ii) availability under the Credit Facility and (iii) available cash, to fund its capital program, current obligations and
projected working capital requirements for 2016. Furthermore, despite the decline in natural gas and oil prices, the Partnership
believes its derivative contracts, which are primarily fixed price swaps, provide significant commodity price protection on a
significant portion of its anticipated natural gas and oil production for 2016.
The Partnership’s ability to (i) generate sufficient cash flows from operations or obtain future borrowings under the Credit
Facility, (ii) repay or refinance any of its indebtedness on commercially reasonable terms or at all, or (iii) obtain additional capital if
required on acceptable terms or at all to fund its capital programs or any potential future acquisitions, joint ventures or other similar
transactions, will depend on prevailing economic conditions many of which are beyond our control. The extreme ongoing volatility in
the energy industry and commodity prices will likely continue to impact the Partnership’s outlook. The Partnership’s plans are
intended to address the impacts of the current volatility in commodity prices while (i) maintaining sufficient liquidity to fund capital in
its core drilling programs, (ii) meeting its debt maturities, and (iii) managing and working to strengthen its balance sheet. The
Partnership continues to implement various cost saving measures to reduce our capital, operating, and general and administrative
costs, including renegotiating contracts with contractors, suppliers and service providers, reducing the number of staff and contractors
and deferring and eliminating discretionary costs. The Partnership will continue to be opportunistic and aggressive in managing its
cost structure and, in turn, its liquidity to meet its capital and operating needs.
To the extent commodity prices remain low or decline further, or the Partnership experiences disruptions in the financial
markets impacting its longer-term access to or cost of capital, its ability to fund future growth projects may be further impacted. The
Partnership continually monitors the capital markets and its capital structure and may make changes to its capital structure from time
to time, with the goal of maintaining financial flexibility, preserving or improving liquidity and/or achieving cost efficiency. For
example, the Partnership could (i) elect to repurchase a portion of its outstanding debt in the future for cash through open market
repurchases or privately negotiated transactions with certain of its debtholders, or (ii) issue additional secured debt as permitted under
its debt agreements, although there is no assurance the Partnership would do so. It is also possible additional adjustments to its plan
and outlook may occur based on market conditions and its needs at that time, which could include selling assets, liquidating all or a
portion of its hedge portfolio, seeking additional partners to develop its assets, reducing or suspending the payments of distributions to
unitholders and/or reducing its planned capital program.
Cash Equivalents
The Partnership considers all highly liquid investments with a remaining maturity of three months or less at the time of purchase
to be cash equivalents. These cash equivalents consist principally of temporary investments of cash in short-term money market
instruments.
Receivables
Accounts receivable on the consolidated balance sheets consist solely of the trade accounts receivable associated with the
Partnership’s operations. The Partnership’s management performs ongoing credit evaluations of its customers and adjusts credit limits
based upon payment history and the customers’ current creditworthiness. The Partnership extends credit on sales on an unsecured
basis to many of its customers. At December 31, 2015 and 2014, the Partnership had recorded no allowance for uncollectible accounts
receivable on its consolidated balance sheets.
Inventory
The Partnership had $8.0 million and $8.9 million of inventory at December 31, 2015 and 2014, respectively, which was
included within prepaid expenses and other current assets on the Partnership’s consolidated balance sheets. The Partnership values
111
inventories at the lower of cost or market. The Partnership’s inventories, which consist of materials, pipes, supplies and other
inventories, were principally determined using the average cost method.
Subscriptions Receivable
The Partnership receives contributions from limited partner investors of its Drilling Partnerships, which are used to fund well
drilling activities within the programs. Limited partner investors in the Drilling Partnerships execute an investment agreement with
Anthem Securities, Inc. (“Anthem”), a registered broker-dealer and wholly owned subsidiary of the Partnership, through third-party
broker dealers, which is then delivered to Anthem. The investor contributions are then remitted to Anthem at a later date. Limited
partner investor contributions are non-refundable upon the execution of an investment agreement. The Partnership recognizes the
contributions associated with the executed investment agreements but for which contributions have not yet been received at the
respective balance sheet date as subscriptions receivable.
Property, Plant and Equipment
Property, plant and equipment are stated at cost or, upon acquisition of a business, at the fair value of the assets acquired.
Maintenance and repairs that generally do not extend the useful life of an asset for two years or more through the replacement of
critical components are expensed as incurred. Major renewals and improvements that generally extend the useful life of an asset for
two years or more through the replacement of critical components are capitalized. Depreciation and amortization expense is based on
cost less the estimated salvage value primarily using the straight-line method over the asset’s estimated useful life. When entire
pipeline systems, gas plants or other property and equipment are retired or sold, any gain or loss is included in the Partnership’s results
of operations.
The Partnership follows the successful efforts method of accounting for oil and gas producing activities. Exploratory drilling
costs are capitalized pending determination of whether a well is successful. Exploratory wells subsequently determined to be dry holes
are charged to expense. Costs resulting in exploratory discoveries and all development costs, whether successful or not, are
capitalized. Geological and geophysical costs to enhance or evaluate development of proved fields or areas are capitalized. All other
geological and geophysical costs, delay rentals and unsuccessful exploratory wells are expensed. Oil and NGLs are converted to gas
equivalent basis (“Mcfe”) at the rate of one barrel to 6 Mcf of natural gas. Mcf is defined as one thousand cubic feet.
The Partnership’s depletion expense is determined on a field-by-field basis using the units-of-production method. Depletion
rates for leasehold acquisition costs are based on estimated proved reserves, and depletion rates for well and related equipment costs
are based on proved developed reserves associated with each field. Depletion rates are determined based on reserve quantity estimates
and the capitalized costs of undeveloped and developed producing properties. Capitalized costs of developed producing properties in
each field are aggregated to include the Partnership’s costs of property interests in proportionately consolidated Drilling Partnerships,
joint venture wells, wells drilled solely by the Partnership for its interests, properties purchased and working interests with other
outside operators.
Upon the sale or retirement of a complete field of a proved property, the cost is eliminated from the property accounts, and the
resultant gain or loss is reclassified to the Partnership’s consolidated statements of operations. Upon the sale of an individual well, the
Partnership credits the proceeds to accumulated depreciation and depletion within its consolidated balance sheets. Upon the
Partnership’s sale of an entire interest in an unproved property where the property had been assessed for impairment individually, a
gain or loss is recognized in the Partnership’s consolidated statements of operations. If a partial interest in an unproved property is
sold, any funds received are accounted for as a reduction of the cost in the interest retained.
Impairment of Property, Plant and Equipment
The Partnership reviews its property, plant and equipment for impairment whenever events or changes in circumstances indicate
that the carrying amount of an asset may not be recoverable. If it is determined that an asset’s estimated future cash flows will not be
sufficient to recover its carrying amount, an impairment charge will be recorded to reduce the carrying amount for that asset to its
estimated fair value if such carrying amount exceeds the fair value.
The review of the Partnership’s oil and gas properties is done on a field-by-field basis by determining if the historical cost of
proved properties less the applicable accumulated depletion, depreciation and amortization and abandonment is less than the estimated
expected undiscounted future cash flows. The expected future cash flows are estimated based on the Partnership’s plans to continue to
produce and develop proved reserves. Expected future cash flows from the sale of production of reserves are calculated based on
estimated future prices. The Partnership estimates prices based upon current contracts in place, adjusted for basis differentials and
market related information including published future prices. The estimated future level of production is based on assumptions
surrounding future prices and costs, field decline rates, market demand and supply and the economic and regulatory climates. If the

112
carrying value exceeds the expected undiscounted future cash flows, an impairment loss is recognized for the difference between the
estimated fair market value (as determined by discounted future cash flows) and the carrying value of the assets.
The determination of oil and natural gas reserve estimates is a subjective process, and the accuracy of any reserve estimate
depends on the quality of available data and the application of engineering and geological interpretation and judgment. Estimates of
economically recoverable reserves and future net cash flows depend on a number of variable factors and assumptions that are difficult
to predict and may vary considerably from actual results. In particular, the Partnership’s reserve estimates for its investment in the
Drilling Partnerships are based on its own assumptions rather than its proportionate share of the limited partnerships’ reserves. These
assumptions include the Partnership’s actual capital contributions, a disproportionate share of salvage value upon plugging of the
wells and lower operating and administrative costs.
The Partnership’s lower operating and administrative costs result from recognizing its proportionate share of limited partners’
Drilling Partnership external operating expenses. These assumptions could result in the Partnership’s calculation of depletion and
impairment being different than its proportionate share of the Drilling Partnerships’ calculations for these items. In addition, reserve
estimates for wells with limited or no production history are less reliable than those based on actual production. Estimated reserves are
often subject to future revisions, which could be substantial, based on the availability of additional information which could cause the
assumptions to be modified. The Partnership cannot predict what reserve revisions may be required in future periods.
The Partnership’s method of calculating its reserves may result in reserve quantities and values which are greater than those
which would be calculated by the Drilling Partnerships, which the Partnership sponsors and owns an interest in but does not control.
The Partnership’s reserve quantities include reserves in excess of its proportionate share of reserves in Drilling Partnerships, which the
Partnership may be unable to recover due to the Drilling Partnerships’ legal structure. The Partnership may have to pay additional
consideration in the future as a Drilling Partnership’s wells become uneconomic to the Drilling Partnership under the terms of the
Drilling Partnership’s drilling and operating agreement in order to recover these excess reserves, in addition to the Partnership
becoming responsible for paying associated future operating, development and plugging costs of the well interests acquired, and to
acquire any additional residual interests in the wells held by the Drilling Partnership’s limited partners. The acquisition of any such
uneconomic well interest from the Drilling Partnership by the Partnership is governed under the Drilling Partnership’s limited
partnership agreement. In general, the Partnership will seek consent from the Drilling Partnership’s limited partners to acquire the well
interests from the Drilling Partnership based upon the Partnership’s determination of fair market value.
Capitalized Interest
The Partnership capitalizes interest on borrowed funds related to capital projects only for periods that activities are in progress
to bring these projects to their intended use. The weighted average interest rate used to capitalize interest on borrowed funds by the
Partnership was 6.5%, 5.6% and 6.0% for the years ended December 31, 2015, 2014 and 2013, respectively. The aggregate amount of
interest capitalized by the Partnership was $15.8 million, $13.0 million and $14.2 million for the years ended December 31, 2015,
2014 and 2013, respectively.
Intangible Assets
The Partnership recorded its intangible assets with finite lives in connection with partnership management and operating
contracts acquired through prior consummated acquisitions. The Partnership amortizes contracts acquired on a declining balance
method over their respective estimated useful lives. The Partnership reviews intangible assets for impairment whenever events or
changes in circumstances indicate that the carrying amount of an asset may not be recoverable. If it is determined that an asset’s
estimated future cash flows will not be sufficient to recover its carrying amount, an impairment charge will be recorded to reduce the
carrying amount for that asset to its estimated fair value if such carrying amount exceeds the fair value.
The following table reflects the components of intangible assets being amortized at December 31, 2015 and December 31, 2014
(in thousands):
December 31,
Estimated
Useful Lives
2015 2014 In Years
Gross Carrying Amount ................................................ $ 14,344 $ 14,344 13
Accumulated Amortization............................................ (13,888 ) (13,653 )
Net Carrying Amount ............................................... $ 456 $ 691

113
Amortization expense on intangible assets was $0.2 million, $0.3 million and $0.4 million for the years ended December 31,
2015, 2014 and 2013, respectively. Aggregate estimated annual amortization expense for intangible assets is approximately $0.1
million per year through 2019.
Goodwill
At December 31, 2015 and 2014, the Partnership had $13.6 million of goodwill recorded in connection with its prior
consummated acquisitions.
The Partnership tests goodwill for impairment at each year end by comparing its reporting units’ estimated fair values to
carrying values. Because quoted market prices for the reporting units are not available, the Partnership’s management must apply
judgment in determining the estimated fair value of these reporting units. The Partnership’s management uses all available information
to make these fair value determinations, including the present values of expected future cash flows using discount rates commensurate
with the risks involved in the Partnership’s assets. A key component of these fair value determinations is a reconciliation of the sum of
the fair value calculations to the Partnership’s market capitalization. The observed market prices of individual trades of an entity’s
equity securities (and thus its computed market capitalization) may not be representative of the fair value of the entity as a whole.
Substantial value may arise from the ability to take advantage of synergies and other benefits that flow from control over another
entity. Consequently, measuring the fair value of a collection of assets and liabilities that operate together in a controlled entity is
different from measuring the fair value of that entity on a stand-alone basis. In most industries, including the Partnership’s, an
acquiring entity typically is willing to pay more for equity securities that give it a controlling interest than an investor would pay for a
number of equity securities representing less than a controlling interest. Therefore, once the above fair value calculations have been
determined, the Partnership’s management also considers the inclusion of a control premium within the calculations. This control
premium is judgmental and is based on, among other items, observed acquisitions in the Partnership’s industry. The resultant fair
values calculated for the reporting units are compared to observable metrics on large mergers and acquisitions in the Partnership’s
industry to determine whether those valuations appear reasonable in management’s judgment. Management will continue to evaluate
goodwill at least annually or when impairment indicators arise.
As a result of its goodwill impairment evaluation at December 31, 2014, the Partnership recognized an $18.1 million non-cash
impairment charge within asset impairments on its consolidated statement of operations for the year ended December 31, 2014. The
goodwill impairment resulted from the reduction in the Partnership’s estimated fair value of its gas and oil production reporting unit in
comparison to its carrying amount at December 31, 2014. The Partnership’s estimated fair value of its gas and oil production reporting
unit was impacted by a decline in overall commodity prices during the fourth quarter of 2014. All remaining goodwill at December
31, 2014 and 2015 is attributable to the Partnership’s well construction and completion and other partnership management reporting
units. No changes in the carrying amount of goodwill were recorded for the years ended December 31, 2015 and 2013.
Derivative Instruments
The Partnership enters into certain financial contracts to manage its exposure to movement in commodity prices and interest
rates (see Note 8). The derivative instruments recorded in the consolidated balance sheets were measured as either an asset or liability
at fair value. Changes in a derivative instrument’s fair value are recognized currently in the Partnership’s consolidated statements of
operations unless specific hedge accounting criteria are met. On January 1, 2015, the Partnership discontinued hedge accounting
through de-designation for all of its existing commodity derivatives which were qualified as hedges. As such, subsequent changes in
fair value after December 31, 2014 of these derivatives are recognized immediately within gain (loss) on mark-to-market derivatives
in the Partnership’s consolidated statements of operations, while the fair values of the instruments recorded in accumulated other
comprehensive income as of December 31, 2014 will be reclassified to the consolidated statements of operations in the periods in
which those respective derivative contracts settle. Prior to discontinuance of hedge accounting, the fair value of these commodity
derivative instruments was recognized in accumulated other comprehensive income (loss) within partners’ capital (deficit) on the
Partnership’s consolidated balance sheets and reclassified to the Partnership’s consolidated statements of operations at the time the
originally hedged physical transactions affected earnings.
Asset Retirement Obligations
The Partnership recognizes an estimated liability for the plugging and abandonment of its gas and oil wells and related facilities
(see Note 6). The Partnership recognizes a liability for its future asset retirement obligations in the current period if a reasonable
estimate of the fair value of that liability can be made. The associated asset retirement costs are capitalized as part of the carrying
amount of the long-lived asset. The Partnership also considers the estimated salvage value in the calculation of depreciation, depletion
and amortization.
114
Income Taxes
The Partnership is not subject to U.S. federal and most state income taxes. The partners of the Partnership are liable for income
tax in regard to their distributive share of the Partnership’s taxable income. Such taxable income may vary substantially from net
income reported in the consolidated financial statements. Certain corporate subsidiaries of the Partnership are subject to federal and
state income tax. The federal and state income taxes related to the Partnership and these corporate subsidiaries were immaterial to the
consolidated financial statements and are recorded in pre-tax income on a current basis only. Accordingly, no federal or state deferred
income tax has been provided for in the consolidated financial statements.
The Partnership evaluates tax positions taken or expected to be taken in the course of preparing the Partnership’s tax returns and
disallows the recognition of tax positions not deemed to meet a “more-likely-than-not” threshold of being sustained by the applicable
tax authority. The Partnership’s management does not believe it has any tax positions taken within its consolidated financial
statements that would not meet this threshold. The Partnership’s policy is to reflect interest and penalties related to uncertain tax
positions, when and if they become applicable. The Partnership has not recognized any potential interest or penalties in its
consolidated financial statements for the years ended December 31, 2015, 2014 and 2013.
The Partnership files Partnership Returns of Income in the U.S. and various state jurisdictions. With few exceptions, the
Partnership is no longer subject to income tax examinations by major tax authorities for years prior to 2011. The Partnership is not
currently being examined by any jurisdiction and is not aware of any potential examinations as of December 31, 2015.
Unit-Based Compensation
The Partnership recognizes all unit-based payments to employees, including grants of employee unit options, in the consolidated
financial statements based on their fair values (see Note 14).
Net Income (Loss) Per Common Unit
Basic net income (loss) attributable to common limited partners per unit is computed by dividing net income (loss) attributable
to common limited partners, which is determined after the deduction of the general partner’s and the preferred unitholders’ interests,
by the weighted average number of common limited partner units outstanding during the period. Net income (loss) attributable to
common limited partners is determined by deducting net income attributable to participating securities, if applicable, income (loss)
attributable to preferred limited partners and net income (loss) attributable to the general partner’s Class A units. The general partner’s
interest in net income (loss) is calculated on a quarterly basis based upon its Class A units and incentive distributions to be distributed
for the quarter (see Note 13), with a priority allocation of net income to the general partner’s incentive distributions, if any, in
accordance with the partnership agreement, and the remaining net income (loss) allocated with respect to the general partner’s and
limited partners’ ownership interests.
The Partnership presents net income (loss) per unit under the two-class method for master limited partnerships, which considers
whether the incentive distributions of a master limited partnership represent a participating security. The two-class method considers
whether the partnership agreement contains any contractual limitations concerning distributions to the incentive distribution rights that
would impact the amount of earnings to allocate to the incentive distribution rights for each reporting period. If distributions are
contractually limited to the incentive distribution rights’ share of currently designated available cash for distributions as defined under
the partnership agreement, undistributed earnings in excess of available cash should not be allocated to the incentive distribution
rights. Under the two-class method, management of the Partnership believes the partnership agreement contractually limits cash
distributions to available cash; therefore, undistributed earnings are not allocated to the incentive distribution rights.
Unvested unit-based payment awards that contain non-forfeitable rights to dividends or dividend equivalents (whether paid or
unpaid) are participating securities and are included in the computation of earnings per unit pursuant to the two-class method.
Phantom unit awards, which consist of common units issuable under the terms of its long-term incentive plan (see Note 14), contain
non-forfeitable rights to distribution equivalents of the Partnership. The participation rights would result in a non-contingent transfer
of value each time the Partnership declares a distribution or distribution equivalent right during the award’s vesting period. However,
unless the contractual terms of the participating securities require the holders to share in the losses of the entity, net loss is not
allocated to the participating securities. As such, the net income utilized in the calculation of net income (loss) per unit must be after
the allocation of only net income to the phantom units on a pro-rata basis.
115
The following is a reconciliation of net income (loss) allocated to the common limited partners for purposes of calculating net
income (loss) attributable to common limited partners per unit (in thousands, except unit data):
Years Ended December 31,
2015 2014 2013
Net income (loss) ........................................................... $ (808,816 ) $ (607,088 ) $ (90,305 )
Preferred limited partner dividends ............................... (16,469 ) (19,267 ) (11,992 )
Net loss attributable to common limited partners and
the general partner .................................................... (825,285 ) (626,355 )
(102,297 )
Less: General partner’s interest ..................................... 16,505 1,222 (3,364 )
Net loss attributable to common limited partners .......... (808,780 ) (625,133 ) (105,661 )
Less: Net income attributable to participating securities
– phantom units(1) ...................................................... — —
—
Net loss utilized in the calculation of net loss
attributable to common limited partners per unit -
Basic ......................................................................... (808,780 ) (625,133 )
(105,661 )
Plus: Convertible preferred limited partner dividends(1) .. — — —
Net loss utilized in the calculation of net loss
attributable to common limited partners per unit -
Diluted ...................................................................... $ (808,780 ) $ (625,133 )
$ (105,661 )
(1) Net income (loss) attributable to common limited partners’ ownership interests is allocated to the phantom units on a pro-rata
basis (weighted average phantom units outstanding as a percentage of the sum of the weighted average phantom units and
common limited partner units outstanding). For the years ended December 31, 2015, 2014 and 2013, net loss attributable to
common limited partners’ ownership interest is not allocated to approximately 453,000, 783,000 and 900,000 phantom units,
respectively, because the contractual terms of the phantom units as participating securities do not require the holders to share in
the losses of the entity. For the years ended December 31, 2015, 2014 and 2013, distributions on the Partnership’s Class B and
Class C convertible preferred units were excluded, because the inclusion of such preferred distributions would have been anti-
dilutive.
Diluted net income (loss) attributable to common limited partners per unit is calculated by dividing net income (loss)
attributable to common limited partners, less income allocable to participating securities, by the sum of the weighted average number
of common limited partner units outstanding and the dilutive effect of unit option awards, convertible preferred units and warrants, as
calculated by the treasury stock or if converted methods, as applicable. Unit options consist of common units issuable upon payment
of an exercise price by the participant under the terms of the Partnership’s long-term incentive plan (see Note 14).
116
The following table sets forth the reconciliation of the Partnership’s weighted average number of common limited partner units
used to compute basic net income (loss) attributable to common limited partners per unit with those used to compute diluted net
income (loss) attributable to common limited partners per unit (in thousands):
Years Ended December 31,
2015 2014 2015
Weighted average number of common limited partner
units—basic .............................................................. 93,745 74,716
52,528
Add effect of dilutive incentive awards(1) ...................... — — —
Add effect of dilutive convertible preferred limited
partner units(2) ............................................................ — —
—
Weighted average number of common limited partner
units—diluted ........................................................... 93,745 74,716
52,528
(1) For the years ended December 31, 2015, 2014 and 2013, approximately 453,000 units, 783,000 units and 900,000 units,
respectively, were excluded from the computation of diluted earnings attributable to common limited partners per unit because
the inclusion of such units would have been anti-dilutive.
(2) For the years ended December 31, 2015, 2014 and 2013, potential common limited partner units issuable upon conversion of the
Partnership’s Class B preferred units were excluded from the computation of diluted earnings attributable to common limited
partners per unit, because the inclusion of such units would have been anti-dilutive. For the years ended December 31, 2015,
2014 and 2013, potential common limited partner units issuable upon (a) conversion of the Partnership’s Class C preferred units
and (b) exercise of the common unit warrants issued with the Class C preferred units were excluded from the computation of
diluted earnings attributable to common limited partners per unit, because the inclusion of such units would have been anti-
dilutive. As the Class D and Class E preferred units are convertible only upon a change of control event, they are not considered
dilutive securities for earnings per unit purposes.
Environmental Matters
The Partnership and its subsidiaries are subject to various federal, state and local laws and regulations relating to the protection
of the environment. Management has established procedures for the ongoing evaluation of the Partnership’s and its subsidiaries’
operations, to identify potential environmental exposures and to comply with regulatory policies and procedures. Environmental
expenditures that relate to current operations are expensed or capitalized as appropriate. Expenditures that relate to an existing
condition caused by past operations and do not contribute to current or future revenue generation are expensed. Liabilities are recorded
when environmental assessments and/or clean-ups are probable, and the costs can be reasonably estimated. The Partnership and its
subsidiaries maintain insurance which may cover in whole or in part certain environmental expenditures. The Partnership and its
subsidiaries had no environmental matters requiring specific disclosure or requiring the recognition of a liability for the years ended
December 31, 2015, 2014 and 2013.
Concentration of Credit Risk
Financial instruments, which potentially subject the Partnership to concentrations of credit risk, consist principally of periodic
temporary investments of cash and cash equivalents. The Partnership places its temporary cash investments in high-quality short-term
money market instruments and deposits with high-quality financial institutions and brokerage firms. At December 31, 2015 and 2014,
the Partnership had $10.3 million and $17.2 million, respectively, in deposits at various banks, of which $8.4 million and $14.9
million, respectively, were over the insurance limit of the Federal Deposit Insurance Corporation. No losses have been experienced on
such investments to date.
Cash on deposit at various banks may differ from the balance of cash and cash equivalents at period end due to certain
reconciling items, including any outstanding checks as of period end.
The Partnership sells natural gas, crude oil and NGLs under contracts to various purchasers in the normal course of business.
For the year ended December 31, 2015, the Partnership had four customers within its gas and oil production segment that individually
accounted for approximately 21%, 15%, 11% and 11%, respectively, of the Partnership natural gas, oil and NGL consolidated
revenues, excluding the impact of all financial derivative activity. For the year ended December 31, 2014, the Partnership had four
customers within its gas and oil production segment that individually accounted for approximately 25%, 15%, 14% and 13%,
respectively, of the Partnership natural gas, oil and NGL consolidated revenues, excluding the impact of all financial derivative
activity. For the year ended December 31, 2013, the Partnership had three customers within its gas and oil production segment that
individually accounted for approximately 19%, 11% and 10% of the Partnership’s natural gas, oil and NGL consolidated revenues,
excluding the impact of all financial derivative activity.
117
The Partnership is subject to the risk of loss on its derivative instruments that it would incur as a result of non-performance by
counterparties pursuant to the terms of their contractual obligations. The Partnership maintains credit policies with regard to its
counterparties to minimize its overall credit risk. These policies require (i) the evaluation of potential counterparties’ financial
condition to determine their credit worthiness; (ii) the quarterly monitoring of its oil, natural gas and NGLs counterparties’ credit
exposures; (iii) comprehensive credit reviews on significant counterparties from physical and financial transactions on an ongoing
basis; (iv) the utilization of contractual language that affords it netting or set off opportunities to mitigate exposure risk; and (v) when
appropriate requiring counterparties to post cash collateral, parent guarantees or letters of credit to minimize credit risk. The
Partnership’s assets related to derivatives as of December 31, 2015 represent financial instruments from ten counterparties; all of
which are financial institutions that have an “investment grade” (minimum Standard & Poor’s rating of BBB+ or better) credit rating
and are lenders associated with our revolving credit facility. Subject to the terms of their revolving credit facility, collateral or other
securities are not exchanged in relation to derivatives activities with the parties in the revolving credit facility.
Revenue Recognition
Natural gas and oil production. The Partnership generally sells natural gas, crude oil and NGLs at prevailing market prices.
Typically, the Partnership’s sales contracts are based on pricing provisions that are tied to a market index, with certain fixed
adjustments based on proximity to gathering and transmission lines and the quality of its natural gas. Generally, the market index is
fixed two business days prior to the commencement of the production month. Revenue and the related accounts receivable are
recognized when produced quantities are delivered to a custody transfer point, persuasive evidence of a sales arrangement exists, the
rights and responsibility of ownership pass to the purchaser upon delivery, collection of revenue from the sale is reasonably assured
and the sales price is fixed or determinable. Revenues from the production of natural gas, crude oil and NGLs, in which the
Partnership has an interest with other producers, are recognized on the basis of its percentage ownership of the working interest and/or
overriding royalty.
Drilling Partnerships. Certain energy activities are conducted by the Partnership through, and a portion of its revenues are
attributable to, sponsorship of the Drilling Partnerships. Drilling Partnership investor capital raised by the Partnership is deployed to
drill and complete wells included within the partnership. As the Partnership deploys Drilling Partnership investor capital, it recognizes
certain management fees it is entitled to receive, including well construction and completion revenue and a portion of administration
and oversight revenue. At each period end, if the Partnership has Drilling Partnership investor capital that has not yet been deployed, it
will recognize a current liability titled “Liabilities Associated with Drilling Contracts” on the Partnership’s consolidated balance
sheets. After the Drilling Partnership well is completed and turned in line (i.e. wells that have been drilled, completed, and connected
to a gathering system), the Partnership is entitled to receive additional operating and management fees, which are included within well
services and administration and oversight revenue, respectively, on a monthly basis while the well is operating. In addition to the
management fees it is entitled to receive for services provided, the Partnership is also entitled to its pro-rata share of Drilling
Partnership gas and oil production revenue, which generally approximates 30%. The Partnership recognizes its Drilling Partnership
management fees in the following manner:
Well construction and completion. For each well that is drilled by a Drilling Partnership, the Partnership receives a 15%
mark-up on those costs incurred to drill and complete wells included within the partnership. Such fees are earned, in
accordance with each Drilling Partnership’s partnership agreement, and recognized as the services are performed,
typically between 60 and 270 days.
Administration and oversight. For each well drilled by a Drilling Partnership, the Partnership receives a fixed fee between
$100,000 and $500,000, depending on the type of well drilled, which is earned in accordance with each Drilling
Partnership’s partnership agreement and recognized at the initiation of the well. Additionally, the Drilling Partnership
pays the Partnership a monthly per well administrative fee of $75 for the life of the well. The well administrative fee is
earned on a monthly basis as the services are performed.
Well services. Each Drilling Partnership pays the Partnership a monthly per well operating fee, currently $1,000 to $2,000,
depending on the type of well, for the life of the well. Such fees are earned on a monthly basis as the services are
performed.
While the historical structure has varied, the Partnership has generally agreed to subordinate a portion of its share of Drilling
Partnership gas and oil production revenue, net of corresponding production costs and up to a maximum of 50% of cumulative
unhedged revenue, from certain Drilling Partnerships for the benefit of the limited partner investors until they have received specified
returns, typically from 10% to 12% per year determined on a cumulative basis, over a specified period, typically the first five to eight
years, in accordance with the terms of the partnership agreements. The Partnership periodically compares the projected return on
investment for limited partners in a Drilling Partnership during the subordination period, based upon historical and projected
cumulative gas and oil production revenue and expenses, with the return on investment subject to subordination agreed upon within
the Drilling Partnership agreement. If the projected return on investment falls below the agreed upon rate, the Partnership recognizes
118
subordination as an estimated reduction of its pro-rata share of gas and oil production revenue, net of corresponding production costs,
during the current period in an amount that will achieve the agreed upon investment return, subject to the limitation of 50% of
unhedged cumulative net production revenues over the subordination period. For Drilling Partnerships for which the Partnership has
recognized subordination in a historical period, if projected investment returns subsequently reflect that the agreed upon limited
partner investment return will be achieved during the subordination period, the Partnership will recognize an estimated increase in its
portion of historical cumulative gas and oil net production, subject to a limitation of the cumulative subordination previously
recognized.
Gathering and processing revenue. Gathering and processing revenue includes gathering fees the Partnership charges to the
Drilling Partnership wells for the Partnership’s processing plants in the New Albany and the Chattanooga Shales. Generally, the
Partnership charges a gathering fee to the Drilling Partnership wells equivalent to the fees the Partnership remits. In Appalachia, a
majority of the Drilling Partnership wells are subject to a gathering agreement, whereby the Partnership remits a gathering fee of 16%.
However, based on the respective Drilling Partnership agreements, the Partnership charges the Drilling Partnership wells a 13%
gathering fee. As a result, some of the Partnership’s gathering expenses, specifically those in the Appalachian Basin, will generally
exceed the revenues collected from the Drilling Partnerships by approximately 3%.
The Partnership’s gas and oil production operations accrue unbilled revenue due to timing differences between the delivery of
natural gas, NGLs and crude oil and the receipt of a delivery statement. These revenues are recorded based upon volumetric data and
management estimates of the related commodity sales and transportation and compression fees which are, in turn, based upon
applicable product prices (see “Use of Estimates” for further description). The Partnership had unbilled revenues at December 31,
2015 and 2014 of $37.7 million and $84.7 million, respectively, which were included in accounts receivable within the Partnership’s
consolidated balance sheets.
Comprehensive Income (Loss)
Comprehensive income (loss) includes net income (loss) and all other changes in the equity of a business during a period from
transactions and other events and circumstances from non-owner sources that, under U.S. GAAP, have not been recognized in the
calculation of net income (loss). These changes, other than net income (loss), are referred to as “other comprehensive income (loss)”
on the Partnership’s consolidated financial statements, and for all periods presented, only include changes in the fair value of unsettled
derivative contracts accounted for as cash flow hedges (see Note 8). The Partnership does not have any other type of transaction which
would be included within other comprehensive income (loss).
Recently Issued Accounting Standards
In February 2016, the Financial Accounting Standards Board (“FASB”) updated the accounting guidance related to leases. The
updated accounting guidance requires lessees to recognize a lease asset and liability at the commencement date of all leases (with the
exception of short-term leases), initially measured at the present value of the lease payments. The updated guidance is effective for
the Partnership as of January 1, 2019 and requires a modified retrospective transition approach for leases existing at, or entered into
after, the beginning of the earliest period presented. The Partnership is currently in the process of determining the impact that the
updated accounting guidance will have on its consolidated financial statements.
In August 2015, the FASB updated the accounting guidance related to the balance sheet presentation of debt issuance costs
specific to line of credit arrangements. The updated accounting guidance allows the option of presenting deferred debt issuance costs
related to line-of-credit arrangements as an asset, and subsequently amortizing over the term of the line-of-credit arrangement,
regardless of whether there are any outstanding borrowings. The Partnership adopted the updated accounting guidance effective
January 1, 2016 and does not expect it to have a material impact on its consolidated financial statements.
In April 2015, the FASB updated the accounting guidance related to the balance sheet presentation of debt issuance costs. The
updated accounting guidance requires that debt issuance costs be presented as a direct deduction from the associated debt obligation.
The Partnership adopted this accounting guidance upon its effective date of January 1, 2016, which will result a reclassification of
unamortized deferred financing costs of $31.1 million from other assets to long-term debt on its consolidated balance sheet at
December 31, 2015, when included in future filings.
In April 2015, the FASB updated the accounting guidance for earnings per unit (“EPU”) of master limited partnerships (“MLP”)
applying the two-class method. The updated accounting guidance specifies that for general partner transfers (or “drop downs”) to an
MLP accounted for as a transaction between entities under common control, the earnings (losses) of the transferred business before the
date of the transaction should be allocated entirely to the general partner’s interest, and previously reported EPU of the limited
partners should not change. Qualitative disclosures about how the rights to the earnings (losses) differ before and after the drop down

119
transaction occurs are also required. The Partnership adopted this accounting guidance upon its effective date of January 1, 2016, and
does not expect it to have a material impact on its consolidated financial statements.
In February 2015, the FASB updated the accounting guidance related to consolidation under the variable interest entity and
voting interest entity models. The updated accounting guidance modifies the consolidation guidance for variable interest entities,
limited partnerships and similar legal entities. The Partnership adopted this accounting guidance upon its effective date of January 1,
2016, and does not except it to have a material impact on its consolidated financial statements.
In August 2014, the FASB updated the accounting guidance related to the evaluation of whether there is substantial doubt about
an entity’s ability to continue as a going concern. The updated accounting guidance requires an entity’s management to evaluate
whether there are conditions or events that raise substantial doubt about its ability to continue as a going concern within one year from
the date the financial statements are issued and provide footnote disclosures, if necessary. The Partnership adopted this accounting
guidance upon its effective date of January 1, 2016, and will provide enhanced disclosures, as applicable, within its consolidated
financial statements.
In May 2014, the FASB updated the accounting guidance related to revenue recognition. The updated accounting guidance
provides a single, contract-based revenue recognition model to help improve financial reporting by providing clearer guidance on
when an entity should recognize revenue, and by reducing the number of standards to which an entity has to refer. In July 2015, the
FASB voted to defer the effective date by one year to December 15, 2017 for annual reporting periods beginning after that date. The
updated accounting guidance provides companies with alternative methods of adoption. The Partnership is currently in the process of
determining the impact that the updated accounting guidance will have on its consolidated financial statements and its method of
adoption.
NOTE 3 – ACQUISITIONS
Rangely Acquisition
On June 30, 2014, the Partnership completed an acquisition of a 25% non-operated net working interest in oil and natural gas
liquids producing assets in the Rangely field in northwest Colorado from Merit Management Partners I, L.P., Merit Energy Partners
III, L.P. and Merit Energy Company, LLC (collectively, “Merit Energy”) for approximately $408.9 million in cash, net of purchase
price adjustments (the “Rangely Acquisition”). The purchase price was funded through borrowings under the Partnership’s revolving
credit facility, the issuance of an additional $100.0 million of its 7.75% senior notes due 2021 (“7.75% Senior Notes”) (see Note 7)
and the issuance of 15,525,000 common limited partner units (see Note 12). The Rangely Acquisition had an effective date of April 1,
2014. The Partnership’s consolidated financial statements reflected the operating results of the acquired business commencing June
30, 2014 with the transaction closing.
The Partnership accounted for this transaction under the acquisition method of accounting. Accordingly, the Partnership
evaluated the identifiable assets acquired and liabilities assumed at their respective acquisition date fair values (see Note 9). In
conjunction with the issuance of common limited partner units associated with the acquisition, the Partnership recorded $11.6 million
of transaction fees, which were included with common limited partners’ interests for the year ended December 31, 2014 on the
Partnership’s consolidated balance sheet. All other costs associated with the acquisition of assets were expensed as incurred.
The following table presents the values assigned to the assets acquired and liabilities assumed in the acquisition, based on their
estimated fair values at the date of the acquisition (in thousands):
Assets:
Prepaid expenses and other ....................................... $ 4,041
Property, plant and equipment .................................. 405,416
Other assets, net ........................................................ 2,888
Total assets acquired ........................................... $ 412,345
Liabilities:
Accrued liabilities ..................................................... 2,117
Asset retirement obligation ....................................... 1,305
Total liabilities assumed ...................................... 3,422
Net assets acquired ................................................... $ 408,923

120
EP Energy Acquisition
On July 31, 2013, the Partnership completed an acquisition of assets from EP Energy E&P Company, L.P. (“EP Energy”) for
approximately $709.6 million in cash, net of purchase price adjustments (the “EP Energy Acquisition”). The purchase price was
funded through borrowings under the Partnership’s revolving credit facility, the issuance of the Partnership’s 9.25% senior notes due
August 15, 2021 (“9.25% Senior Notes”) (see Note 7), and the issuance of 14,950,000 common limited partner units and 3,749,986
newly created Class C convertible preferred units (see Note 12). The assets acquired included coal-bed methane producing natural gas
assets in the Raton Basin in northern New Mexico, the Black Warrior Basin in central Alabama and the County Line area of
Wyoming. The EP Energy Acquisition had an effective date of May 1, 2013. The Partnership’s consolidated financial statements
reflected the operating results of the acquired business commencing July 31, 2013 with the transaction closing.
The Partnership accounted for this transaction under the acquisition method of accounting. Accordingly, the Partnership
evaluated the identifiable assets acquired and liabilities assumed at their respective acquisition date fair values (see Note 9). In
conjunction with the issuance of common limited partner units associated with the acquisition, the Partnership recorded $12.1 million
of transaction fees which were included within common limited partners’ interests for the year ended December 31, 2013 on the
Partnership’s consolidated balance sheet. All other costs associated with the acquisition of assets were expensed as incurred.
The following table presents the values assigned to the assets acquired and liabilities assumed in the acquisition, based on their
estimated fair values at the date of the acquisition (in thousands):
Assets:
Prepaid expenses and other ........................................ $ 5,268
Property, plant and equipment ................................... 723,842
Total assets acquired ............................................ $ 729,110
Liabilities:
Accounts payable ....................................................... 2,747
Asset retirement obligation ........................................ 16,728
Total liabilities assumed ....................................... 19,475
Net assets acquired .................................................... $ 709,635
Pro Forma Financial Information
The following data presents pro forma revenues, net income (loss) and basic and diluted net income (loss) per unit for the
Partnership as if the Rangely and EP Energy acquisitions, including the related borrowings, net proceeds from the issuance of debt and
issuances of common and preferred units had occurred on January 1, 2013. The Partnership prepared these pro forma unaudited
financial results for comparative purposes only; they may not be indicative of the results that would have occurred if the Rangely and
EP Energy acquisitions and related offerings had occurred on January 1, 2013 or the results that will be attained in future periods (in
thousands, except per unit data; unaudited):
Years Ended December 31,
2014 2013
Total revenues and other ................................................... $ 747,655 $ 656,677
Net loss ............................................................................. (588,823 ) (21,144 )
Net loss attributable to common limited partners ............. (588,353 ) (26,131 )
Net loss attributable to common limited partners per unit:
Basic and Diluted ........................................................ $ (7.28 ) $ (0.32 )
Other Acquisitions:
Arkoma Acquisition
On June 5, 2015, the Partnership completed the acquisition of ATLS’s coal-bed methane producing natural gas assets in the
Arkoma Basin in eastern Oklahoma for approximately $31.5 million, net of purchase price adjustments (the “Arkoma Acquisition”).
The Partnership funded the purchase price through the issuance of 6,500,000 common limited partner units (see Note 12). The
Arkoma Acquisition had an effective date of January 1, 2015. The Partnership accounted for the Arkoma Acquisition as a transaction
between entities under common control (see Note 2).

121
Eagle Ford Acquisition
On November 5, 2014, the Partnership and AGP completed an acquisition of oil and natural gas liquid interests in the Eagle
Ford Shale in Atascosa County, Texas from Cima Resources, LLC and Cinco Resources, Inc. (together “Cinco”) for $342.0 million ,
net of purchase price adjustments (the “Eagle Ford Acquisition”). Approximately $183.1 million was paid in cash by the Partnership
and $19.9 million was paid by AGP at closing, and approximately $139.0 million was to be paid in four quarterly installments
beginning December 31, 2014. On December 31, 2014, AGP made its first installment payment of $35.0 million related to its Eagle
Ford Acquisition. Prior to the March 31, 2015 installment, the Partnership, AGP, and Cinco amended the purchase and sale agreement
to alter the timing and amount of the quarterly payments beginning with the March 31, 2015 payment and ending December 31, 2015,
with no change to the overall purchase price. On March 31, 2015, AGP paid $28.3 million and the Partnership issued $20.0 million of
its Class D Preferred Units (see Note 12) to satisfy the second installment related to the Eagle Ford Acquisition. On June 30, 2015,
AGP paid $16.0 million and the Partnership paid $0.6 million to satisfy the third installment related to the Eagle Ford Acquisition. On
July 8, 2015, AGP sold to the Partnership, for a purchase price of $1.4 million, AGP’s interest in a portion of the acreage AGP
acquired in the Eagle Ford Acquisition. In September 2015, the Partnership agreed with AGP to have AGP transfer its remaining
$36.3 million of deferred purchase obligation, along with the related undeveloped natural gas and oil properties, to the Partnership.
On October 1, 2015 the Partnership paid $17.5 million to satisfy the fourth installment related to the Eagle Ford Acquisition. On
December 31, 2015 the Partnership paid $21.6 million to satisfy the final installment related to the Eagle Ford Acquisition. The
Partnership’s issuance of Class D Preferred Units in March 2015 represented a non-cash transaction for statement of cash flow
purposes during the year ended December 31, 2015.
GeoMet Acquisition
On May 12, 2014, the Partnership completed the acquisition of certain assets from GeoMet, Inc. (“GeoMet”) (OTCQB: GMET)
for approximately $97.9 million in cash, net of purchase price adjustments, with an effective date of January 1, 2014. The assets
included coal-bed methane producing natural gas assets in West Virginia and Virginia.
Norwood Acquisition
On September 20, 2013, the Partnership completed the acquisition of certain assets from Norwood Natural Resources
(“Norwood”) for $5.4 million (the “Norwood Acquisition”). The assets acquired included Norwood’s non-operating working interest
in certain producing wells in the Barnett Shale. The Norwood Acquisition had an effective date of June 1, 2013.
NOTE 4 – PROPERTY, PLANT AND EQUIPMENT
The following is a summary of property, plant and equipment at the dates indicated (in thousands):
December 31,
Estimated
Useful Lives
2015 2014 in Years
Natural gas and oil properties:
Proved properties:
Leasehold interests .............................................. $ 503,586 $ 441,548
Pre-development costs ......................................... 6,014 7,223
Wells and related equipment ............................... 3,076,239 3,026,416
Total proved properties .................................. 3,585,839 3,475,187
Unproved properties .................................................. 213,047 217,321
Support equipment .................................................... 44,921 37,359
Total natural gas and oil properties ................ 3,843,807 3,729,867
Pipelines, processing and compression facilities ............ 56,738 49,547 15 – 20
Rights of way.................................................................. 829 830 20 – 40
Land, buildings and improvements ................................ 9,798 9,160 3 – 40
Other ............................................................................... 18,405 17,936 3 – 10
3,929,577 3,807,340
Less – accumulated depreciation, depletion and
amortization ............................................................... (2,737,966 ) (1,543,520 )
$ 1,191,611 $ 2,263,820

122
During the year ended December 31, 2015, the Partnership recognized a $1.2 million loss on asset sales and disposals primarily
related to a write-down of pipe, pump units and other inventory in New Albany Shale and Black Warrior that are no longer usable and
plugging and abandonment costs for certain wells in the New Albany Shale. During the year ended December 31, 2014, the
Partnership recognized $1.9 million of loss on asset disposal, primarily related to the sale of producing wells in the Niobrara Shale in
connection with the settlement of a third party farmout agreement. During the year ended December 31, 2013, the Partnership
recognized $1.0 million of loss on asset disposal, primarily pertaining to the loss on the sale of its Antrim assets.
Unproved properties are reviewed annually for impairment or whenever events or circumstances indicate that the carrying
amount of an asset may not be recoverable. Impairment charges are recorded if conditions indicate the Partnership will not explore the
acreage prior to expiration of the applicable leases or if it is determined that the carrying value of the properties is above their fair
value. During the year ended December 31, 2015, the Partnership recognized $6.6 million of asset impairments related to its unproved
gas and oil properties within property, plant and equipment, net on its consolidated balance sheet, primarily for its unproved acreage in
the New Albany Shale. During the year ended December 31, 2013, the Partnership recognized $13.5 million of asset impairments
related to its unproved gas and oil properties within property, plant and equipment, net on its consolidated balance sheet, primarily for
its unproved acreage in the Chattanooga and New Albany Shales. There were no impairments of unproved gas and oil properties
recorded by the Partnership for the year ended December 31, 2014.
Proved properties are reviewed annually for impairment or whenever events or circumstances indicate that the carrying amount
of an asset may not be recoverable. Asset impairments and offsetting hedge gains, if any, are included in Asset impairment expense in
the Partnership’s consolidated statements of operations. For the year ended December 31, 2015, the Partnership recognized $960.0
million of asset impairment related to proved oil and gas properties in the Barnett, Coal-bed Methane, Rangely, Southern Appalachia,
Marcellus and Mississippi Lime operating areas, which were impaired due to lower forecasted commodity prices, net of $85.8 million
of future hedge gains reclassified from accumulated other comprehensive income. During the year ended December 31, 2014, the
Partnership recognized $555.7 million of asset impairment related to proved oil and gas properties within property, plant and
equipment, net on its consolidated balance sheet for its Appalachian and mid-continent operations which were impaired due to lower
forecasted commodity prices, net of $82.3 million of future hedge gains reclassified from accumulated other comprehensive
income. During the year ended December 31, 2013, the Partnership recognized $24.5 million of asset impairments related to its
proved gas and oil properties within property, plant and equipment, net on its consolidated balance sheet for its shallow natural gas
wells in the New Albany Shale.
During the years ended December 31, 2015, 2014 and 2013, the Partnership recognized $22.6 million, $25.0 million and $26.0
million, respectively, of non-cash property, plant and equipment additions, which were included within the changes in accounts
payable and accrued liabilities on the Partnership’s consolidated statements of cash flows.
NOTE 5 – OTHER ASSETS
The following is a summary of other assets at the dates indicated (in thousands):
December 31,
2015 2014
Deferred financing costs, net of accumulated amortization of
$36,582 and $18,622, respectively ....................................
$ 50,884 $ 40,637
Notes receivable..................................................................... 3,708 3,866
Other ...................................................................................... 5,452 5,578
$ 60,044 $ 50,081
Deferred financing costs are recorded at cost and amortized over the term of the respective debt agreements (see Note 7).
Amortization expense of deferred financing costs was $12.4 million, $8.6 million and $6.4 million for the years ended December 31,
2015, 2014 and 2013, respectively, which was recorded within interest expense on the Partnership’s consolidated statements of
operations. During the year ended December 31, 2015, the Partnership recognized $5.6 million for accelerated amortization of
deferred financing costs associated with reductions of the borrowing base under the revolving credit facility. During the year ended
December 31, 2014, the Partnership recognized $0.6 million for accelerated amortization of deferred financing costs associated with a
reduction of the borrowing base under the revolving credit facility. During the year ended December 31, 2013, the Partnership also
recognized $3.2 million for accelerated amortization of deferred financing costs associated with the retirement of its then-existing term
loan facility and a portion of the outstanding indebtedness under its revolving credit facility with a portion of the proceeds from its
issuance of its 7.75% Senior Notes.
At December 31, 2015 and 2014, the Partnership had notes receivable with certain investors of its Drilling Partnerships, which
were included within other assets, net on the Partnership’s consolidated balance sheets. The notes have a maturity date of March 31,
123
2022, and a 2.25% per annum interest rate. The maturity date of the notes can be extended to March 31, 2027, subject to certain
conditions, including an extension fee of 1.0% of the outstanding principal balance. For each of the years ended December 31, 2015,
2014 and 2013, $0.1 million of interest income was recognized within other, net on the Partnership’s consolidated statements of
operations. At December 31, 2015 and 2014, the Partnership recorded no allowance for credit losses within its consolidated balance
sheets based upon payment history and ongoing credit evaluations associated with the notes receivable.
NOTE 6 – ASSET RETIREMENT OBLIGATIONS
The estimated liability for asset retirement obligations was based on the Partnership’s historical experience in plugging and
abandoning wells, the estimated remaining lives of those wells based on reserve estimates, external estimates as to the cost to plug and
abandon the wells in the future, and federal and state regulatory requirements. The liability was discounted using an assumed credit-
adjusted risk-free interest rate. Revisions to the liability could occur due to changes in estimates of plugging and abandonment costs or
remaining lives of the wells, or if federal or state regulators enact new plugging and abandonment requirements. The Partnership has
no assets legally restricted for purposes of settling asset retirement obligations. Except for its gas and oil properties, the Partnership
determined that there were no other material retirement obligations associated with tangible long-lived assets.
The Partnership proportionately consolidates its ownership interest of the asset retirement obligations of its Drilling
Partnerships. At December 31, 2015, the Drilling Partnerships had $44.2 million of aggregate asset retirement obligation liabilities
recognized on their combined balance sheets allocable to the limited partners, exclusive of the Partnership’s proportional interest in
such liabilities. Under the terms of the respective partnership agreements, the Partnership maintains the right to retain a portion or all
of the distributions to the limited partners of its Drilling Partnerships to cover the limited partners’ share of the plugging and
abandonment costs up to a specified amount per month. As of December 31, 2015, the Partnership has withheld $5.2 million of
limited partner distributions related to the asset retirement obligations of certain Drilling Partnerships. The Partnership’s historical
practice and continued intention is to retain distributions from the limited partners as the wells within each Drilling Partnership near
the end of their useful life. On a partnership-by-partnership basis, the Partnership assesses its right to withhold amounts related to
plugging and abandonment costs based on several factors including commodity price trends, the natural decline in the production of
the wells, and current and future costs. Generally, the Partnership’s intention is to retain distributions from the limited partners as the
fair value of the future cash flows of the limited partners’ interest approaches the fair value of the future plugging and abandonment
cost. Upon the Partnership’s decision to retain all future distributions to the limited partners of its Drilling Partnerships, the
Partnership will assume the related asset retirement obligations of the limited partners.
A reconciliation of the Partnership’s liability for well plugging and abandonment costs for the periods indicated is as follows (in
thousands):
December 31,
2015 2014 2013
Asset retirement obligations, beginning of period ......... $ 107,950 $ 91,179 $ 64,794
Liabilities incurred......................................................... 2,070 3,512 6,366
Adjustment to liability due to acquisitions (Note 3) ..... — 6,997 16,728
Liabilities settled ........................................................... (2,591 ) (1,664 ) (1,188 )
Accretion expense ......................................................... 6,311 5,747 4,479
Revisions ....................................................................... — 2,179 —
Asset retirement obligations, end of period ................... $ 113,740 $ 107,950 $ 91,179
The above accretion expense was included in depreciation, depletion and amortization in the Partnership’s consolidated
statements of operations.
124
NOTE 7 - DEBT
Total debt consists of the following at the dates indicated (in thousands):
December 31,
2015 2014
Revolving credit facility ....................................................... $ 592,000 $ 696,000
Term loan facility ................................................................. 243,783 —
7.75 % Senior Notes – due 2021 ........................................... 374,619 374,544
9.25 % Senior Notes – due 2021 ........................................... 324,080 323,916
Total debt ......................................................................... 1,534,482 1,394,460
Less current maturities .......................................................... — —
Total long-term debt ........................................................ $ 1,534,482 $ 1,394,460
Credit Facility
The Partnership is a party to a Second Amended and Restated Credit Agreement, dated July 31, 2013 (as amended from time to
time, (the “Credit Agreement”) with Wells Fargo Bank, National Association, as administrative agent, and the lenders party thereto,
which provides for a senior secured revolving credit facility with a borrowing base of $700.0 million as of December 31, 2015 and a
maximum facility amount of $1.5 billion scheduled to mature in July 2018.
On November 23, 2015, the Partnership entered into an Eighth Amendment. Among other things, the Eighth Amendment:
reduces the borrowing base under the Credit Agreement from $750.0 million to $700.0 million;
increases the applicable margin on Eurodollar loans and ABR loans by 0.25% from previous levels;
permits the incurrence of third lien debt subject to the satisfaction of certain conditions, including pro forma financial
covenant compliance;
upon the issuance of any third lien debt, reduces the borrowing base by 25% of the stated amount of such third lien debt
(other than third lien debt that is used to refinance senior notes, second lien debt and other third lien debt);
suspends compliance with a maximum ratio of Total Funded Debt (as defined in the Credit Agreement) to EBITDA (as
defined in the Credit Agreement) until the four fiscal quarter period ending March 31, 2017 and revises the maximum
ratio of Total Funded Debt to EBITDA to be 5.75 to 1.00 for the four quarter periods ending March 31, 2017 and June 30,
2017, 5.50 to 1.00 for the four quarter periods ending September 30, 2017 and December 31, 2017, 5.25 to1.00 for the
four quarter period ending March 31, 2018, and 5.00 to 1.00 for each four fiscal quarter period ending thereafter;
replaces the requirement to maintain compliance with a maximum ratio of Senior Secured Total Funded Debt to EBITDA
with a requirement to be in compliance with a maximum ratio of First Lien Debt (as defined in the Credit Agreement) to
EBITDA of 2.75 to1.00; and
resets the distribution to $0.15 per common unit and permits increases to the distribution per common unit if (a) the ratio
of Total Funded Debt (as of such date) to EBITDA for the most recent four fiscal quarters is equal to or less than 5.00
to1.00 and (b) the borrowing base utilization is less than or equal to 85%, on a pro forma basis after giving effect to the
distribution payment.
A Seventh Amendment to the Credit Agreement was entered into on July 24, 2015. Among other things, the Seventh
Amendment redefined EBITDA.
A Sixth Amendment to the Credit Agreement was entered into on February 23, 2015. Among other things, the Sixth
Amendment:
reduced the borrowing base under the Credit Agreement from $900.0 million to $750.0 million;
permitted the incurrence of second lien debt in an aggregate principal amount up to $300.0 million;
rescheduled the May 1, 2015 borrowing base redetermination to July 1, 2015;
if the borrowing base utilization (as defined in the Credit Agreement) is less than 90%, increased the applicable margin on
Eurodollar loans and ABR loans by 0.25% from previous levels,
125
following the next scheduled redetermination of the borrowing base, upon the issuance of senior notes or the incurrence of
second lien debt, reduces the borrowing base by 25% of the stated amount of such senior notes or additional second lien
debt; and
revised the maximum ratio of Total Funded Debt to EBITDA to be (i) 5.25 to 1.0 as of the last day of the quarters ending
on March 31, 2015, June 30, 2015, September 30, 2015, December 31, 2015 and March 31, 2016, (ii) 5.00 to 1.0 as of the
last day of the quarters ending on June 30, 2016, September 30, 2016 and December 31, 2016, (iii) 4.50 to 1.0 as of the
last day of the quarter ending on March 31, 2017 and (iv) 4.00 to 1.0 as of the last day of each quarter thereafter
The Partnership’s borrowing base is scheduled for semi-annual redeterminations in May and November of each year. In
February 2015, the borrowing base was reduced from $900 million to $750 million in connection with the Sixth Amendment to the
Credit Agreement; in July 2015 (the rescheduled redetermination date in the Sixth Amendment to the Credit Agreement), a
determination by the lenders reaffirmed the $750.0 million borrowing base in connection with the Seventh Amendment to the Credit
Agreement; and in November 2015, the borrowing base was reduced from $750.0 million to $700.0 million in connection with the
Eighth Amendment to the Credit Agreement. The Credit Agreement also provides that the Partnership’s borrowing base will be
reduced by 25% of the stated amount of any senior notes issued, or additional second lien debt incurred, after July 1, 2015. . In
addition, the Credit Agreement provides that our borrowing base will be reduced by 25% of the stated amount of any third lien debt
issued (other than third lien debt that is used to refinance senior notes, second lien debt and other third lien debt). At December 31,
2015, $592.0 million was outstanding under the credit facility. Up to $20.0 million of the revolving credit facility may be in the form
of standby letters of credit, of which $4.2 million was outstanding at December 31, 2015. The Partnership’s obligations under the
facility are secured by mortgages on its oil and gas properties and first priority security interests in substantially all of its assets.
Additionally, obligations under the facility are guaranteed by certain of the Partnership’s material subsidiaries, and any non-guarantor
subsidiaries of the Partnership are minor. Borrowings under the credit facility bear interest, at the Partnership’s election, at either an
adjusted LIBOR rate plus an applicable margin between 2.00% and 3.00% per annum (which shall change depending on the
borrowing base utilization percentage) or the base rate (which is the higher of the bank’s prime rate, the Federal funds rate plus 0.5%
or one-month LIBOR plus 1.00%) plus an applicable margin between 1.00% and 2.00% per annum (which shall change depending on
the borrowing base utilization percentage). The Partnership is also required to pay a fee on the unused portion of the borrowing base at
a rate of 0.375% per annum if less than 50% of the borrowing base is utilized and 0.5% if 50% or more of the borrowing base is
utilized, which is included within interest expense on the Partnership’s consolidated statements of operations. At December 31, 2015,
the weighted average interest rate on outstanding borrowings under the credit facility was 3.25%.
The Credit Agreement contains customary covenants including, without limitation, covenants that limit the Partnership’s ability
to incur additional indebtedness (but which permits second lien debt in an aggregate principal amount of up to $300.0 million and
third lien debt that satisfies certain conditions including pro forma financial covenants), grant liens, make loans or investments, make
distributions if a borrowing base deficiency or default exists or would result from the distribution, merger or consolidate with other
persons, or engage in certain asset dispositions including a sale of all or substantially all of its assets. The Credit Agreement also
requires the Partnership to maintain a ratio of First Lien Debt to EBITDA of 2.75 to 1.00 as set forth in the Eighth Amendment
described above, and a ratio of current assets (as defined in the Credit Agreement) to current liabilities (as defined in the Credit
Agreement) of not less than 1.0 to 1.0 as of the last day of any fiscal quarter. The Partnership was in compliance with these covenants
as of December 31, 2015. Based on the definitions contained in the Credit Agreement, at December 31, 2015, the Partnership’s ratio
of current assets to current liabilities was 1.3 to 1.0, and its ratio of First Lien Debt to EBITDA was 2.3 to 1.0.
Although the Partnership currently expects its sources of capital to be sufficient to meet its near-term liquidity needs, there can
be no assurance that the lenders under its credit facility will not reduce the borrowing base to an amount below its outstanding
borrowings or that its liquidity requirements will continue to be satisfied, given current oil prices and the discretion of its lenders to
decrease its borrowing base. Due to the steep decline in commodity prices, the Partnership may not be able to obtain funding in the
equity or capital markets on terms it finds acceptable. The cost of obtaining money from the credit markets generally has increased as
many lenders and institutional investors have increased interest rates, enacted tighter lending standards, and reduced and, in some
cases, ceased to provide any new funding. If the borrowing base determination in May 2016 results in a borrowing base deficiency and
the Partnership cannot access the capital markets and repay debt under its credit facility, the Partnership may be unable to continue to
pay distributions to its unitholders and may take other actions to reduce costs and to raise funds to repay debt, such as selling assets or
monetizing derivative contracts.
Term Loan Facility
On February 23, 2015, the Partnership entered into a Second Lien Credit Agreement with certain lenders and Wilmington Trust,
National Association, as administrative agent. The Second Lien Credit Agreement provides for a second lien term loan in an original
principal amount of $250.0 million (the “Term Loan Facility”). The Term Loan Facility matures on February 23, 2020. The Term
Loan Facility is presented net of unamortized discount of $6.2 million at December 31, 2015.

126
The Partnership has the option to prepay the Term Loan Facility at any time, and is required to offer to prepay the Term Loan
Facility with 100% of the net cash proceeds from the issuance or incurrence of any debt and 100% of the excess net cash proceeds
from certain asset sales and condemnation recoveries. The Partnership is also required to offer to prepay the Term Loan Facility upon
the occurrence of a change of control. All prepayments are subject to the following premiums, plus accrued and unpaid interest:
the make-whole premium (plus an additional amount if such prepayment is optional and funded with proceeds from the
issuance of equity) for prepayments made during the first 12 months after the closing date;
4.5% of the principal amount prepaid for prepayments made between 12 months and 24 months after the closing date;
2.25% of the principal amount prepaid for prepayments made between 24 months and 36 months after the closing date;
and
no premium for prepayments made following 36 months after the closing date.
The Partnership’s obligations under the Term Loan Facility are secured on a second priority basis by security interests in all of
its assets and those of its restricted subsidiaries that guarantee the Partnership’s existing first lien revolving credit facility. In addition,
the obligations under the Term Loan Facility are guaranteed by the Partnership’s material restricted subsidiaries. Borrowings under
the Term Loan Facility bear interest, at the Partnership’s option, at either (i) LIBOR plus 9.0% or (ii) the highest of (a) the prime rate,
(b) the federal funds rate plus 0.50%, (c) one-month LIBOR plus 1.0% and (d) 2.0%, each plus 8.0% (an “ABR Loan”). Interest is
generally payable at the last day of the applicable interest period (or, with respect to interest periods of more than three-months’
duration, each day prior to the last day of such interest period that occurs at intervals of three months’ duration after the first day of
such interest period) for Eurodollar loans and quarterly for ABR loans. At December 31, 2015, the weighted average interest rate on
outstanding borrowings under the term loan facility was 10.0%.
The Second Lien Credit Agreement contains customary covenants including, without limitation, covenants that limit the
Partnership’s ability to make restricted payments, take on indebtedness, issue preferred stock, grant liens, conduct sales of assets and
subsidiary stock, make distributions from restricted subsidiaries, conduct affiliate transactions and engage in other business activities.
In addition, the Second Lien Credit Agreement contains covenants substantially similar to those in the Partnership’s existing first lien
revolving credit facility, including, among others, restrictions on swap agreements, debt of unrestricted subsidiaries, drilling and
operating agreements and the sale or discount of receivables. The Partnership was in compliance with these covenants as of December
31, 2015.
Under the Second Lien Credit Agreement, the Partnership may elect to add one or more incremental term loan tranches to the
Term Loan Facility so long as the aggregate outstanding principal amount of the Term Loan Facility plus the principal amount of any
incremental term loan does not exceed $300.0 million and certain other conditions are adhered to. Any such incremental term loans
may not mature on a date earlier than February 23, 2020.
Senior Notes
At December 31, 2015, the Partnership had $374.6 million outstanding of its 7.75% senior unsecured notes due 2021 (“7.75%
Senior Notes”). The 7.75% Senior Notes were presented net of a $0.4 million unamortized discount as of December 31, 2015. Interest
on the 7.75% Senior Notes is payable semi-annually on January 15 and July 15. At any time prior to January 15, 2016, the 7.75%
Senior Notes are redeemable for up to 35% of the outstanding principal amount with the net cash proceeds of equity offerings at the
redemption price of 107.75%. The 7.75% Senior Notes are also subject to repurchase at a price equal to 101% of the principal amount,
plus accrued and unpaid interest, upon a change of control. At any time prior to January 15, 2017, the Partnership may redeem the
7.75% Senior Notes in whole or in part, at a redemption price equal to 100% of the principal amount of the notes plus the Applicable
Premium (as defined in the indenture governing the 7.75% Senior Notes (the “7.75% Senior Notes Indenture”)), plus accrued and
unpaid interest and additional interest, if any. On and after January 15, 2017, the 7.75% Senior Notes are redeemable, in whole or in
part, at a redemption price of 103.875%, decreasing to 101.938% on January 15, 2018 and 100% on January 15, 2019. Under certain
conditions, including if the Partnership sells certain assets and does not reinvest the proceeds or repay senior indebtedness or if it
experiences specific kinds of changes of control, the Partnership must offer to repurchase the 7.75% Senior Notes.
On December 29, 2015, the Partnership entered into a Third Supplemental Indenture to the 7.75% Senior Notes Indenture
following the receipt of requisite consents of the holders of the 7.75% Senior Notes pursuant to a consent solicitation in respect of the
7.75% Senior Notes that commenced on December 10, 2015. As a result of the consent solicitation, the Partnership paid a consent fee
of $10.00 for each $1,000 in principal amount of the 7.75% Senior Notes for a total of approximately $3.8 million that was capitalized
as deferred financing costs.
127
Consents were received for the purpose of making the following amendments to the 7.75% Senior Notes Indenture:
(1) Increasing the fixed dollar amount in the basket for secured credit facility indebtedness to $1,000.0 million, the approximate
amount of secured credit facility indebtedness currently permitted under the Partnership’s secured credit facilities, from $500.0
million. The use of secured indebtedness incurred under such basket in exchange for the 7.75% Senior Notes or the 9.25% Senior
Notes (as defined below) will be limited to a maximum amount of $100 million, and the subsidiaries of the Partnership that issued the
7.75% Senior Notes (the “Issuers”) will be required to make any offer to exchange the 7.75% Senior Notes for secured indebtedness
of the Issuers incurred under such basket to all holders of the 7.75% Senior Notes on a pro rata basis and to make any offer to
exchange the 9.25% Senior Notes for secured indebtedness of the Issuers incurred under such basket to all holders of the 9.25% Senior
Notes on a pro rata basis.
(2) Adding an additional covenant providing that the Partnership will not permit its consolidated senior secured interest expense
to exceed the greater of $80 million in any fiscal year or 8.0% of the consolidated senior secured debt outstanding as of the last day of
any fiscal year for which audited financial statements have been provided, subject to certain adjustments and cure rights.
(3) Adding a prohibition with respect to certain make-whole, yield maintenance, redemption, repayment or any other payments,
premiums, fees or penalties, providing that such payments or premiums shall not be payable after and during the continuance of an
event of default, upon the automatic or other acceleration of such indebtedness prior to its stated maturity date, or after the
commencement of a case with respect to the Issuers under bankruptcy law.
At December 31, 2015, the Partnership had $324.1 million outstanding of its 9.25% senior unsecured notes due 2021 (“9.25%
Senior Notes”). The 9.25% Senior Notes were presented net of a $0.9 million unamortized discount as of December 31, 2015. Interest
on the 9.25% Senior Notes is payable semi-annually on February 15 and August 15. At any time prior to August 15, 2017, the
Partnership may redeem the 9.25% Senior Notes, in whole or in part, at a redemption price equal to 100% of the principal amount of
the notes plus the Applicable Premium (as defined in the indenture governing the 9.25% Senior Notes (the “9.25% Senior Notes
Indenture”)), plus accrued and unpaid interest, if any. At any time on or after August 15, 2017, the Partnership may redeem some or
all of the 9.25% Senior Notes at a redemption price of 104.625%. On or after August 15, 2018, the Partnership may redeem some or
all of the 9.25% Senior Notes at the redemption price of 102.313% and on or after August 15, 2019, the Partnership may redeem some
or all of the 9.25% Senior Notes at the redemption price of 100.0%. Under certain conditions, including if the Partnership sells certain
assets and does not reinvest the proceeds or repay senior indebtedness or if it experiences specific kinds of changes of control, the
Partnership must offer to repurchase the 9.25% Senior Notes.
On December 17, 2015, the Partnership entered into a Fourth Supplemental Indenture to the 9.25% Senior Notes Indenture
following the receipt of requisite consents of the holders of the 9.25% Senior Notes pursuant to a consent solicitation in respect of the
9.25% Senior Notes that commenced on December 10, 2015. As a result of the consent solicitation, the Partnership paid a consent fee
of $10.00 for each $1,000 in principal amount of the 9.25% Senior Notes for a total of approximately $3.3 million that was capitalized
as deferred financing costs.
Consents were received for the primary purpose of increasing the fixed dollar amount in the basket for secured credit facility
indebtedness to $1,050.0 million, the approximate amount of secured credit facility indebtedness currently permitted under the
Partnership’s secured credit facilities, from $500.0 million. The use of secured indebtedness incurred under such basket in exchange
for the 7.75% Senior Notes or the 9.25% Senior Notes will be limited to a maximum amount of $100 million.
The 7.75% Senior Notes and 9.25% Senior Notes are guaranteed by certain of the Partnership’s material subsidiaries. The
guarantees under the 7.75% Senior Notes and 9.25% Senior Notes are full and unconditional and joint and several, subject to certain
customary automatic release provisions, including, in certain circumstances, the sale or other disposition of all or substantially all the
assets of, or all of the equity interests in, the subsidiary guarantor, or the subsidiary guarantor is declared “unrestricted” for covenant
purposes, and any subsidiaries of the Partnership, other than the subsidiary guarantors, are minor. There are no restrictions on the
Partnership’s ability to obtain cash or any other distributions of funds from the guarantor subsidiaries.
The indentures governing the 7.75% Senior Notes and 9.25% Senior Notes contain covenants including, without limitation,
covenants that limit the Partnership’s ability to incur certain liens, incur additional indebtedness; declare or pay distributions if an
event of default has occurred; redeem, repurchase, or retire equity interests or subordinated indebtedness; make certain investments; or
merge, consolidate or sell substantially all of the Partnership’s assets. The Partnership was in compliance with these covenants as of
December 31, 2015.
128
The aggregate amount of the Partnership’s debt maturities is as follows (in thousands):
Years Ended December 31:
2016 ............................................................................................ $ —
2017 ............................................................................................ —
2018 ............................................................................................ 592,000
2019 ............................................................................................ —
2020 ............................................................................................ 250,000
Thereafter .................................................................................... 700,000
Total principle maturities ....................................................... 1,542,000
Unamortized premium ................................................................ 309
Unamortized discounts ................................................................ (7,827 )
Total debt ............................................................................... $ 1,534,482
Total cash payments for interest by the Partnership were $98.5 million $58.7 million and $17.9 million for the years ended
December 31, 2015, 2014 and 2013, respectively.
NOTE 8 – DERIVATIVE INSTRUMENTS
The Partnership uses a number of different derivative instruments, principally swaps, collars and options, in connection with its
commodity and interest rate price risk management activities. Management enters into financial instruments to hedge forecasted
commodity sales against the variability in expected future cash flows attributable to changes in market prices. Swap instruments are
contractual agreements between counterparties to exchange obligations of money as the underlying commodities are sold. Under
commodity-based swap agreements, the Partnership receives or pays a fixed price and receives or remits a floating price based on
certain indices for the relevant contract period. To manage the risk of regional commodity price differences, the Partnership
occasionally enters into basis swaps. Basis swaps are contractual arrangements that guarantee a price differential for a commodity
from a specified delivery point price and the comparable national exchange price. For natural gas basis swaps, which have negative
differentials to the New York Mercantile Stock Exchange (“NYMEX”), the Partnership receives or pays a payment from the
counterparty if the price differential to NYMEX is greater or less than the stated terms of the contract. Commodity-based put option
instruments are contractual agreements that require the payment of a premium and grant the purchaser of the put option the right, but
not the obligation, to receive the difference between a fixed, or strike, price and a floating price based on certain indices for the
relevant contract period, if the floating price is lower than the fixed price. The put option instrument sets a floor price for commodity
sales being hedged. Costless collars are a combination of a purchased put option and a sold call option, in which the premiums net to
zero. The costless collar eliminates the initial cost of the purchased put, but places a ceiling price for commodity sales being hedged.
On January 1, 2015, the Partnership discontinued the use of hedge accounting for its qualified commodity derivatives. As such,
changes in fair value of these derivatives after December 31, 2014 are recognized immediately within gain (loss) on mark-to-market
derivatives in the Partnership’s consolidated statements of operations. The fair values of these commodity derivative instruments at
December 31, 2014, which were recognized in accumulated other comprehensive income within partners’ capital (deficit) on the
Partnership’s consolidated balance sheet, are being reclassified to the Partnership’s consolidated statements of operations at the time
the originally hedged physical transactions settle.
The Partnership enters into derivative contracts with various financial institutions, utilizing master contracts based upon the
standards set by the International Swaps and Derivatives Association, Inc. These contracts allow for rights of offset at the time of
settlement of the derivatives. Due to the right of offset, derivatives are recorded on the Partnership’s consolidated balance sheets as
assets or liabilities at fair value on the basis of the net exposure to each counterparty. Potential credit risk adjustments are also
analyzed based upon the net exposure to each counterparty. Premiums paid for purchased options are recorded on the Partnership’s
consolidated balance sheets as the initial value of the options. The Partnership recorded net derivative assets of $357.7 million and
$274.9 million on its consolidated balance sheets at December 31, 2015 and 2014, respectively. Of the $19.4 million of deferred gains
in accumulated other comprehensive income on the Partnership’s consolidated balance sheet at December 31, 2015, the Partnership
expects to reclassify $16.7 million of gains to its consolidated statement of operations over the next twelve month period as these
contracts expire with the remaining gains of $2.7 million being reclassified to the Partnership’s consolidated statements of operations
in later periods as the remaining contracts expire.
129
The following table summarizes the commodity derivative activity and presentation in the Partnership’s consolidated statement
of operations for the year ended December 31, 2015 (in thousands):
Year Ended
December 31, 2015
Portion of settlements associated with gains previously
recognized within accumulated other comprehensive
income, net of prior year offsets(1) ............................. $ 86,328
Portion of settlements attributable to subsequent mark
to market gains(2) ........................................................ 92,732
Total cash settlements on commodity derivative
contracts .................................................................... $ 179,060
Gains recognized prior to settlement(2) .......................... 40,480
Gains recognized on open derivative contracts, net of
amounts recognized in income in prior year(2) ........... 226,743
Gains on mark-to-market derivatives ............................. $ 267,223
(1) Recognized in gas and oil production revenue.
(2) Recognized in gain on mark-to-market derivatives.
The Partnership reclassified from accumulated other comprehensive income losses of $7.7 million and gains of $10.2 million for
the years ended December 31, 2014 and 2013, respectively, on settled contracts covering commodity production. These gains and loss
were included within gas and oil production revenue in the Partnership’s consolidated statements of operations. As the underlying
prices and terms in the Partnership’s derivative contracts were consistent with the indices used to sell its natural gas and oil, there were
no gains or losses recognized during the years ended December 31, 2014 and 2013 for hedge ineffectiveness.
The following table summarizes the gross fair values of the Partnership’s derivative instruments, presenting the impact of
offsetting the derivative assets and liabilities included on the Partnership’s consolidated balance sheets for the periods indicated (in
thousands):
Offsetting Derivatives as of December 31, 2015
Gross
Amounts
Recognized
Gross
Amounts
Offset Net Amount
Presented
Current portion of derivative assets .................................. $ 159,460 $ — $ 159,460
Long-term portion of derivative assets ............................. 198,262 — 198,262
Total derivative assets ...................................................... $ 357,722 $ — $ 357,722
Current portion of derivative liabilities ........................... $ — $ — $ —
Long-term portion of derivative liabilities ...................... — — —
Total derivative liabilities ................................................ $ — $ — $ —
Offsetting Derivatives as of December 31, 2014
Current portion of derivative assets ................................. $ 144,357 $ (98 ) $ 144,259
Long-term portion of derivative assets ............................ 130,972 (370 ) 130,602
Total derivative assets ..................................................... $ 275,329 $ (468 ) $ 274,861
Current portion of derivative liabilities ........................... $ (98 ) $ 98 $ —
Long-term portion of derivative liabilities ...................... (370 ) 370 —
Total derivative liabilities ................................................ $ (468 ) $ 468 $ —
The Partnership enters into commodity future option and collar contracts to achieve more predictable cash flows by hedging its
exposure to changes in commodity prices. At any point in time, such contracts may include regulated NYMEX futures and options
contracts and non-regulated over-the-counter futures contracts with qualified counterparties. NYMEX contracts are generally settled
with offsetting positions, but may be settled by the physical delivery of the commodity. Crude oil contracts are based on a West Texas
Intermediate (“WTI”) index. NGL fixed price swaps are priced based on a WTI crude oil index, while ethane, propane, butane and iso
butane contracts are priced based on the respective Mt. Belvieu price. These contracts were recorded at their fair values.

130
At December 31, 2014, the Partnership had net cash proceeds of $0.2 million, related to its hedging positions monetized on
behalf of the Drilling Partnerships’ limited partners, which were included within cash and cash equivalents on the Partnership’s
combined consolidated balance sheet. The Partnership allocated the monetization net proceeds to the Drilling Partnerships’ limited
partners based on their natural gas and oil production generated over the period of the original derivative contracts during the year
ended December 31, 2015.
During the year ended December 31, 2013, the Partnership entered into contracts which provided the option to enter into swap
contracts for future production periods (“swaptions”) up through September 30, 2013 for production volumes related to assets
acquired from EP Energy (see Note 3). In connection with the swaption contracts, the Partnership paid premiums of $14.5 million,
which represented their fair value on the date the transactions were initiated and were initially recorded as derivative assets on the
Partnership’s consolidated balance sheet and was fully amortized as of September 30, 2013. Swaption contract premiums paid are
amortized over the period from initiation of the contract through their termination date. For the year ended December 31, 2013, the
Partnership recognized $14.5 million, of amortization expense in other, net on the Partnership’s consolidated statement of operations
related to the swaption contracts.
At December 31, 2015, the Partnership had the following commodity derivatives:
Natural Gas – Fixed Price Swaps
Production
Period Ending
December 31,
Volumes Average
Fixed Price Fair Value
Asset (MMBtu)(1) (per MMBtu)(1) (in thousands)(2)
2016 53,546,300 $ 4.229 $ 92,131
2017 49,920,000 $ 4.219 67,916
2018 40,800,000 $ 4.170 47,153
2019 15,960,000 $ 4.017 13,839
$ 221,039
Natural Gas – Put Options – Drilling Partnerships
Production
Period Ending
December 31, Option
Type Volumes Average
Fixed Price Fair Value
Asset (MMBtu)(1) (per MMBtu)(1) (in thousands)(2)
2016
Puts
purchased 1,440,000 $ 4.150 $ 2,393
$ 2,393
Natural Gas Liquids – Crude Fixed Price Swaps
Production
Period Ending
December 31,
Volumes Average
Fixed Price Fair Value
Asset (Bbl)(1) (per Bbl)(1) (in thousands)(3)
2016 84,000 $ 85.651 $ 3,651
2017 60,000 $ 83.780 2,124
$ 5,775
131
Crude Oil – Fixed Price Swaps
Production
Period Ending
December 31, Volumes Average
Fixed Price Fair Value
Asset (Bbl)(1) (per Bbl)(1) (in thousands)(3)
2016 1,557,000 $ 81.471 $ 61,284
2017 1,140,000 $ 77.285 33,335
2018 1,080,000 $ 76.281 26,248
2019 540,000 $ 68.371 7,648
$ 128,515
Total net assets $ 357,722
(1) “MMBtu” represents million British Thermal Units; “Bbl” represents barrels; “Gal” represents gallons.
(2) Fair value based on forward NYMEX natural gas prices, as applicable.
(3) Fair value based on forward WTI crude oil prices, as applicable.
In June 2012, the Partnership entered into natural gas put option contracts, which related to future natural gas production of the
Drilling Partnerships. Therefore, a portion of any derivative gain or loss is allocable to the limited partners of the Drilling Partnerships
based on their share of estimated gas production related to the derivatives not yet settled. At December 31, 2015, net derivative assets
of $2.4 million were payable to the limited partners in the Drilling Partnerships related to these natural gas put option contracts.
At December 31, 2015, the Partnership had a secured hedge facility agreement with a syndicate of banks under which certain
Drilling Partnerships have the ability to enter into derivative contracts to manage their exposure to commodity price movements.
Under its revolving credit facility (see Note 7), the Partnership is required to utilize this secured hedge facility for future commodity
risk management activity for its equity production volumes within the participating Drilling Partnerships. Each participating Drilling
Partnership’s obligations under the facility are secured by mortgages on its oil and gas properties and first priority security interests in
substantially all of its assets and by a guarantee of the general partner of the Drilling Partnership. The Partnership, as the ultimate
general partner of the Drilling Partnerships, administers the commodity price risk management activity for the Drilling Partnerships
under the secured hedge facility. The secured hedge facility agreement contains covenants that limit each of the participating Drilling
Partnership’s ability to incur indebtedness, grant liens, make loans or investments, make distributions if a default under the secured
hedge facility agreement exists or would result from the distribution, merge into or consolidate with other persons, enter into
commodity or interest rate swap agreements that do not conform to specified terms or that exceed specified amounts, or engage in
certain asset dispositions including a sale of all or substantially all of its assets.
NOTE 9 – FAIR VALUE OF FINANCIAL INSTRUMENTS
Management has established a hierarchy to measure the Partnership’s financial instruments at fair value, which requires it to
maximize the use of observable inputs and minimize the use of unobservable inputs when measuring fair value. Observable inputs
represent market data obtained from independent sources; whereas, unobservable inputs reflect the Partnership’s own market
assumptions, which are used if observable inputs are not reasonably available without undue cost and effort. The hierarchy defines
three levels of inputs that may be used to measure fair value:
Level 1 – Unadjusted quoted prices in active markets for identical, unrestricted assets and liabilities that the reporting entity has
the ability to access at the measurement date.
Level 2 – Inputs other than quoted prices included within Level 1 that are observable for the asset and liability or can be
corroborated with observable market data for substantially the entire contractual term of the asset or liability.
Level 3 – Unobservable inputs that reflect the entity’s own assumptions about the assumptions market participants would use in
the pricing of the asset or liability and are consequently not based on market activity but rather through particular valuation
techniques.
Assets and Liabilities Measured at Fair Value on a Recurring Basis
The Partnership uses a market approach fair value methodology to value the assets and liabilities for its outstanding derivative
contracts (see Note 8). The Partnership manages and reports the derivative assets and liabilities on the basis of its net exposure to
market risks and credit risks by counterparty. The Partnership’s commodity derivative contracts are valued based on observable
market data related to the change in price of the underlying commodity and are therefore defined as Level 2 assets and liabilities
within the same class of nature and risk. These derivative instruments are calculated by utilizing commodity indices’ quoted prices for

132
futures and options contracts traded on open markets that coincide with the underlying commodity, expiration period, strike price (if
applicable) and pricing formula utilized in the derivative instrument.
Information for assets and liabilities measured at fair value at December 31, 2015 and 2014 was as follows (in thousands):
As of December 31, 2015 Level 1 Level 2 Level 3 Total
Derivative assets, gross
Commodity swaps ........................................................... $ — $ 355,329 $ — $ 355,329 Commodity puts .............................................................. — 2,393 — 2,393
Total derivative assets, gross ..................................... — 357,722 — 357,722
Derivative liabilities, gross
Commodity swaps ........................................................... — — — —
Commodity options ......................................................... — — — —
Total derivative liabilities, gross ................................ — — — —
Total derivatives, fair value, net ...................................... $ — $ 357,722 $ — $ 357,722
As of December 31, 2014 Level 1 Level 2 Level 3 Total
Derivative assets, gross
Commodity swaps ........................................................... $ — $ 267,242 $ — $ 267,242 Commodity puts .............................................................. — 2,767 — 2,767 Commodity options ......................................................... — 5,320 — 5,320
Total derivative assets, gross ..................................... — 275,329 — 275,329
Derivative liabilities, gross
Commodity swaps ........................................................... — (401 ) — (401 )
Commodity options ......................................................... — (67 ) — (67 )
Total derivative liabilities, gross ................................ — (468 ) — (468 )
Total derivatives, fair value, net ...................................... $ — $ 274,861 $ — $ 274,861
Other Financial Instruments
The estimated fair value of the Partnership’s other financial instruments has been determined based upon its assessment of
available market information and valuation methodologies. However, these estimates may not necessarily be indicative of the amounts
that the Partnership could realize upon the sale or refinancing of such financial instruments.
The Partnership’s other current assets and liabilities on its consolidated balance sheets are considered to be financial
instruments. The estimated fair values of these instruments approximate their carrying amounts due to their short-term nature and thus
are categorized as Level 1. The estimated fair values of the Partnership’s long-term debt at December 31, 2015 and 2014, which
consist of its Senior Notes and outstanding borrowings under its revolving credit and term loan facilities (see Note 7), were $907.8
million and $1,219.8 million, respectively, compared with the carrying amounts of $1,534.5 million and $1,394.5 million,
respectively. At December 31, 2015 and 2014, the carrying values of outstanding borrowings under the Partnership’s revolving credit
facility (see Note 7), which bears interest at variable interest rates, approximated estimated fair values. The estimated fair values of the
Partnership’s Senior Notes and the term loan credit facility were based upon the market approach and calculated using yields of the
Partnership Senior Notes and the term loan credit facility as provided by financial institutions and thus were categorized as Level 3
values.
Assets and Liabilities Measured at Fair Value on a Non-Recurring Basis
Management estimates the fair value of the Partnership’s asset retirement obligations based on discounted cash flow projections
using numerous estimates, assumptions and judgments regarding such factors at the date of establishment of an asset retirement
obligation such as: amounts and timing of settlements, the credit-adjusted risk-free rate of the Partnership and estimated inflation rates.

133
Information for asset retirement obligations that were measured at fair value on a nonrecurring basis for the years ended
December 31, 2015 and 2014 were as follows (in thousands):
Years Ended December 31,
2015 2014
Level 3 Level 3
Asset retirement obligations ..................................................... $ 2,070 $ 10,509
Total .......................................................................................... $ 2,070 $ 10,509
Management estimates the fair value of the Partnership’s long-lived assets in connection with reviewing these assets for
impairment whenever events or changes in circumstances indicate that the carrying amount of an asset may not be recoverable, using
estimates, assumptions and judgments regarding such events or circumstances. See Note 4 for a discussion of current year
impairments. These estimates of fair value are Level 3 measurements as they are based on unobservable inputs.
During the year ended December 31, 2014, the Partnership completed the Eagle Ford, Rangely and GeoMet acquisitions (see
Note 3). During the year ended December 31, 2013, the Partnership completed the acquisition of certain oil and gas assets from EP
Energy (see Note 3).The fair value measurements of assets acquired and liabilities assumed for these acquisitions are based on inputs
that are not observable in the market and therefore represent Level 3 inputs. The fair values of natural gas and oil properties were
measured using a discounted cash flow model, which considered the estimated remaining lives of the wells based on reserve estimates,
future operating and development costs of the assets, as well as the respective natural gas, oil and natural gas liquids forward price
curves. The fair values of the asset retirement obligations were measured under the Partnership’s existing methodology for
recognizing an estimated liability for the plugging and abandonment of its gas and oil wells (see Note 6). These inputs required
significant judgments and estimates by the Partnership’s management at the time of the valuations, which were finalized in 2015.
NOTE 10 — CERTAIN RELATIONSHIPS AND RELATED PARTY TRANSACTIONS
Relationship with ATLS. The Partnership does not directly employ any persons to manage or operate its business. These
functions are provided by employees of ATLS and/or its affiliates. As of December 31, 2015 and 2014, the Partnership had a $1.3
payable and an $8.8 million payable, respectively, to ATLS related to the timing of funding cash accounts, which is recorded in
advances from affiliates in the consolidated balance sheets.
Relationship with Drilling Partnerships. The Partnership conducts certain activities through, and a portion of its revenues are
attributable to, sponsorship of the Drilling Partnerships. The Partnership serves as general partner and operator of the Drilling
Partnerships and assumes customary rights and obligations for the Drilling Partnerships. As the general partner, the Partnership is
liable for the Drilling Partnerships’ liabilities and can be liable to limited partners of the Drilling Partnerships if it breaches its
responsibilities with respect to the operations of the Drilling Partnerships. The Partnership is entitled to receive management fees,
reimbursement for administrative costs incurred and to share in the Drilling Partnership’s revenue and costs and expenses according to
the respective partnership agreements.
Relationship with AGP. In connection with the Eagle Ford Acquisition (see Note 3), the Partnership guaranteed the timely
payment of the deferred portion of the purchase price that was to be paid by AGP. On September 21, 2015, the Partnership and AGP,
in accordance with the terms of the Eagle Ford shared acquisition and operating agreement, agreed that the Partnership would fund the
remaining two deferred purchase price installments (see Note 3). In conjunction with this agreement, AGP assigned the Partnership a
portion of its non-operating Eagle Ford assets that had a value (as such value was agreed upon by the sellers and the buyers in
connection with the Eagle Ford Acquisition) equal to both installments to be paid by the Partnership. As of December 31, 2015 and
2014, the Partnership had an $8.7 million payable and a $6.6 million receivable, respectively, to/from AGP related to the timing of
funding cash accounts, which is recorded in advances to/from affiliates in the consolidated balance sheets.
NOTE 11 — COMMITMENTS AND CONTINGENCIES
General Commitments
The Partnership leases office space and equipment under leases with varying expiration dates. Rental expense was
$15.7 million, $17.0 million and $13.1 million, for the years ended December 31, 2015, 2014 and 2013, respectively.
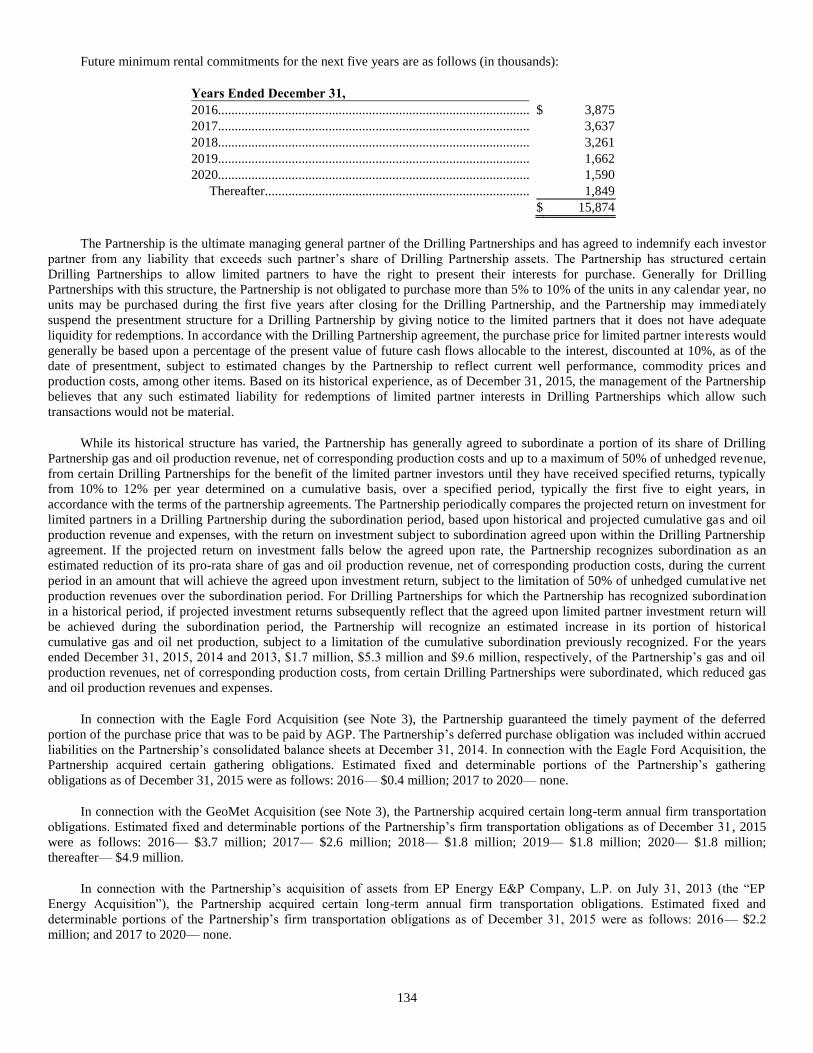
134
Future minimum rental commitments for the next five years are as follows (in thousands):
Years Ended December 31,
2016............................................................................................. $ 3,875
2017............................................................................................. 3,637
2018............................................................................................. 3,261
2019............................................................................................. 1,662
2020............................................................................................. 1,590
Thereafter............................................................................... 1,849
$ 15,874
The Partnership is the ultimate managing general partner of the Drilling Partnerships and has agreed to indemnify each investor
partner from any liability that exceeds such partner’s share of Drilling Partnership assets. The Partnership has structured certain
Drilling Partnerships to allow limited partners to have the right to present their interests for purchase. Generally for Drilling
Partnerships with this structure, the Partnership is not obligated to purchase more than 5% to 10% of the units in any calendar year, no
units may be purchased during the first five years after closing for the Drilling Partnership, and the Partnership may immediately
suspend the presentment structure for a Drilling Partnership by giving notice to the limited partners that it does not have adequate
liquidity for redemptions. In accordance with the Drilling Partnership agreement, the purchase price for limited partner interests would
generally be based upon a percentage of the present value of future cash flows allocable to the interest, discounted at 10%, as of the
date of presentment, subject to estimated changes by the Partnership to reflect current well performance, commodity prices and
production costs, among other items. Based on its historical experience, as of December 31, 2015, the management of the Partnership
believes that any such estimated liability for redemptions of limited partner interests in Drilling Partnerships which allow such
transactions would not be material.
While its historical structure has varied, the Partnership has generally agreed to subordinate a portion of its share of Drilling
Partnership gas and oil production revenue, net of corresponding production costs and up to a maximum of 50% of unhedged revenue,
from certain Drilling Partnerships for the benefit of the limited partner investors until they have received specified returns, typically
from 10% to 12% per year determined on a cumulative basis, over a specified period, typically the first five to eight years, in
accordance with the terms of the partnership agreements. The Partnership periodically compares the projected return on investment for
limited partners in a Drilling Partnership during the subordination period, based upon historical and projected cumulative gas and oil
production revenue and expenses, with the return on investment subject to subordination agreed upon within the Drilling Partnership
agreement. If the projected return on investment falls below the agreed upon rate, the Partnership recognizes subordination as an
estimated reduction of its pro-rata share of gas and oil production revenue, net of corresponding production costs, during the current
period in an amount that will achieve the agreed upon investment return, subject to the limitation of 50% of unhedged cumulative net
production revenues over the subordination period. For Drilling Partnerships for which the Partnership has recognized subordination
in a historical period, if projected investment returns subsequently reflect that the agreed upon limited partner investment return will
be achieved during the subordination period, the Partnership will recognize an estimated increase in its portion of historical
cumulative gas and oil net production, subject to a limitation of the cumulative subordination previously recognized. For the years
ended December 31, 2015, 2014 and 2013, $1.7 million, $5.3 million and $9.6 million, respectively, of the Partnership’s gas and oil
production revenues, net of corresponding production costs, from certain Drilling Partnerships were subordinated, which reduced gas
and oil production revenues and expenses.
In connection with the Eagle Ford Acquisition (see Note 3), the Partnership guaranteed the timely payment of the deferred
portion of the purchase price that was to be paid by AGP. The Partnership’s deferred purchase obligation was included within accrued
liabilities on the Partnership’s consolidated balance sheets at December 31, 2014. In connection with the Eagle Ford Acquisition, the
Partnership acquired certain gathering obligations. Estimated fixed and determinable portions of the Partnership’s gathering
obligations as of December 31, 2015 were as follows: 2016— $0.4 million; 2017 to 2020— none.
In connection with the GeoMet Acquisition (see Note 3), the Partnership acquired certain long-term annual firm transportation
obligations. Estimated fixed and determinable portions of the Partnership’s firm transportation obligations as of December 31 , 2015
were as follows: 2016— $3.7 million; 2017— $2.6 million; 2018— $1.8 million; 2019— $1.8 million; 2020— $1.8 million;
thereafter— $4.9 million.
In connection with the Partnership’s acquisition of assets from EP Energy E&P Company, L.P. on July 31, 2013 (the “EP
Energy Acquisition”), the Partnership acquired certain long-term annual firm transportation obligations. Estimated fixed and
determinable portions of the Partnership’s firm transportation obligations as of December 31, 2015 were as follows: 2016— $2.2
million; and 2017 to 2020— none.

135
As of December 31, 2015, the Partnership is committed to expend approximately $7.1 million, principally on drilling and
completion expenditures.
Legal Proceedings
The Partnership is a party to various routine legal proceedings arising out of the ordinary course of its business. Management
believes that none of these actions, individually or in the aggregate, will have a material adverse effect on the Partnership’s financial
condition or results of operations.
NOTE 12 –ISSUANCES OF UNITS
In August 2015, the Partnership entered into a distribution agreement with MLV & Co. LLC (“MLV”) which the Partnership
terminated and replaced in November 2015, when the Partnership entered into a distribution agreement (the “Distribution
Agreement”) with MLV and FBR Capital Markets & Co. (“FBR” and, together with MLV, the “Agents”). Pursuant to the distribution
agreement, the Partnership may sell from time to time to or through the Agents the Partnership’s 8.625% Class D Cumulative
Redeemable Perpetual Preferred Units (“Class D Preferred Units”) and Class E Cumulative Redeemable Perpetual Preferred Units
(“Class E Preferred Units”) and together with the Class D Preferred Units, the “Preferred Units”) having an aggregate offering price of
up to $100 million. Sales of Preferred Units, if any, may be made in negotiated transactions or transactions that are deemed to be “at-
the-market” offerings as defined in Rule 415 of the Securities Act of 1933, as amended, including sales made to or through a market
maker other than on an exchange or through an electronic communications network and sales made directly on the New York Stock
Exchange, the existing trading market for the Preferred Units. Under the terms of the distribution agreement, the Partnership may sell
Preferred Units from time to time to each Agent as principal for its respective account at a price equal to 97.0% of the volume
weighted average price of the Class D Preferred Units or Class E Preferred Units, as applicable, on the date of sale. Upon the sale of
Preferred Units to an Agent as principal, the Partnership and such Agent will enter into separate terms agreement with respect to such
sale.
The Preferred Units may also be offered by the Sales Agent as agents for the Partnership at negotiated prices or prevailing
market prices at the time of sale. The Partnership will pay each Agent a commission on Units sold by it in an agency capacity, which
shall not be more than 3.0% of the gross sales price of Preferred Units sold through the Agent as agent for the Partnership. Under the
August 2015 ATM Agreement, the Partnership issued 90,328 Class D Preferred Units and 1,083 Class E Preferred Units for net
proceeds of $0.9 million, net of $0.3 million in commissions and offering expenses paid. Under the November 2015 ATM Agreement,
the Partnership did not issue any Class D Preferred Units nor Class E Preferred Units under the preferred equity distribution program,
but incurred $0.1 million of net offering expenses.
In July 2015, the remaining 39,654 Class B Preferred Units were converted into common limited partner units.
In May 2015, in connection with the Arkoma Acquisition (see Note 3), the Partnership issued 6,500,000 of its common limited
partner units in a public offering at a price of $7.97 per unit, yielding net proceeds of approximately $49.7 million. The Partnership
used a portion of the net proceeds to fund the Arkoma Acquisition and to reduce borrowings outstanding under the Partnership’s
revolving credit facility.
In April 2015, the Partnership issued 255,000 of its Class E Preferred Units at a public offering price of $25.00 per unit for net
proceeds of approximately $6.0 million. The Partnership pays cumulative distributions on a quarterly basis at an annual rate of
$2.6875 per unit or at a rate of 10.75% per annum of the stated liquidation preference of $25.00.
In October 2014, the Partnership issued 3,200,000 8.625% Class D Preferred Units at a public offering price of $25.00 per Class
D Preferred Unit, yielding net proceeds of approximately $77.3 million from the offering, after deducting underwriting discounts and
estimated offering expenses. The Partnership used the net proceeds from the offering to fund a portion of the Eagle Ford Acquisition
(see Note 3). On March 31, 2015, to partially pay its portion of the quarterly installment related to the Eagle Ford Acquisit ion, the
Partnership issued an additional 800,000 Class D Preferred Units to the seller at a value of $25.00 per unit. On January 15, 2015, the
Partnership paid an initial quarterly distribution of $0.616927 per unit for the extended period from October 2, 2014 through January
14, 2015 to holders of record as of January 2, 2015 (see Note 13). The Partnership pays distributions on a quarterly basis, at an annual
rate of $2.15625 per unit, or 8.625% of the $25.00 liquidation preference.
The Class D and Class E Preferred Units rank senior to the Partnership’s common units and Class C Preferred Units with respect
to the payment of distributions and distributions upon a liquidation event. The Class D and Class E Preferred Units have no stated
maturity and are not subject to mandatory redemption or any sinking fund and will remain outstanding indefinitely unless repurchased
or redeemed by the Partnership or converted into its common units in connection with a change in control. At any time on or after
October 15, 2019 for the Class D Preferred Units and April 15, 2020 for the Class E Preferred Units, the Partnership may, at its option,

136
redeem such preferred units in whole or in part, at a redemption price of $25.00 per unit plus an amount equal to all accumulated and
unpaid distributions thereon to the date of redemption, whether or not declared. In addition, the Partnership may redeem such
preferred units following certain changes of control, as described in the respective Certificates of Designation. If the Partnership does
not exercise this redemption option upon a change of control, then holders of such preferred units will have the option to convert the
preferred units into a number of Partnership common units as set forth in the respective Certificates of Designation. If the Partnership
exercises any of its redemption rights relating to the preferred units, the holders of such preferred units will not have the conversion
right described above with respect to the preferred units called for redemption. Additionally, if at any time the Partnership’s general
partner and its affiliates own more than two-thirds of the outstanding class of any limited partner interests, the Partnership’s general
partner will have the right, which it may assign to any of its affiliates or to the Partnership, to acquire all, but not less than all, of such
class of limited partner interests held by at a price equal to the greater of (1) the highest cash price paid by the Partnership’s general
partner or any of its affiliates for any limited partner interests of the class purchased within the 90 days preceding the date on which
the Partnership’s general partner first mails notice of its election to purchase those limited partner interests; and (2) the average of the
daily closing prices of the limited partner interests of such class over the 20 trading days preceding the date three days before the date
of the mailing of the exercise notice for such call right.
In August 2014, the Partnership entered into an equity distribution agreement with Deutsche Bank Securities Inc., as
representative of the several banks named therein (the “Agents”). Pursuant to the equity distribution agreement, the Partnership may
sell from time to time through the Agents common units representing limited partner interests of the Partnership having an aggregate
offering price of up to $100.0 million. Sales of common units may be made in negotiated transactions or transactions that are deemed
to be “at-the-market” offerings as defined in Rule 415 of the Securities Act, including sales made directly on the New York Stock
Exchange, the existing trading market for the common units, or sales made to or through a market maker other than on an exchange or
through an electronic communications network. The Partnership will pay each of the Agents a commission, which in each case shall
not be more than 2.0% of the gross sales price of common units sold through such Agent. Under the terms of the equity distribution
agreement, the Partnership may also sell common units from time to time to any Agent as principal for its own account at a price to be
agreed upon at the time of sale. Any sale of common units to an Agent as principal would be pursuant to the terms of a separate terms
agreement between the Partnership and such Agent. During the year ended December 31, 2015, the Partnership issued 9,803,451
common limited partner units under the equity distribution program for net proceeds of $44.2 million, net of $1.1 million in
commissions and offering expenses paid. No units were sold under the equity distribution program during the year ended
December 31, 2014.
In May 2014, in connection with the Rangely Acquisition (see Note 3), the Partnership issued 15,525,000 of its common limited
partner units (including 2,025,000 units pursuant to an over-allotment option) in a public offering at a price of $19.90 per unit,
yielding net proceeds of approximately $297.3 million.
In March 2014, in connection with the GeoMet Acquisition (see Note 3), the Partnership issued 6,325,000 of its common
limited partner units (including 825,000 units pursuant to an over-allotment option) in a public offering at a price of $21.18 per unit,
yielding net proceeds of approximately $129.0 million.
In July 2013, in connection with the closing of the EP Energy Acquisition (see Note 3), the Partnership issued 3,749,986 of its
newly created Class C convertible preferred units to ATLS, at a negotiated price per unit of $23.10, for proceeds of $86.6 million. The
Class C preferred units were offered and sold in a private transaction exempt from registration under Section 4(2) of the Securities
Act. The Class C preferred units pay cash distributions in an amount equal to the greater of (i) $0.51 per unit and (ii) the distributions
payable on each common unit at each declared quarterly distribution date. The Class C preferred units have no voting rights, except as
set forth in the certificate of designation for the Class C preferred units, which provides, among other things, that the affirmative vote
of 75% of the Class C preferred units is required to repeal such certificate of designation. Holders of the Class C preferred units have
the right to convert the Class C preferred units on a one-for-one basis, in whole or in part, into common units at any time before
July 31, 2016. Unless previously converted, all Class C preferred units will convert into common units on July 31, 2016. Upon
issuance of the Class C preferred units, ATLS, as purchaser of the Class C preferred units, received 562,497 warrants to purchase the
Partnership’s common units at an exercise price equal to the face value of the Class C preferred units. The warrants were exercisable
beginning October 29, 2013 into an equal number of common units of the Partnership at an exercise price of $23.10 per unit, subject
to adjustments provided therein. The warrants will expire on July 31, 2016.
Upon issuance of the Class C preferred units and warrants on July 31, 2013, the Partnership entered into a registration rights
agreement pursuant to which it agreed to file a registration statement with the SEC to register the resale of the common units issuable
upon conversion of the Class C preferred units and upon exercise of the warrants. The Partnership agreed to use commercially
reasonable efforts to file such registration statement within 90 days of the conversion of the Class C preferred units into common units
or the exercise of the warrants. The Partnership filed a registration statement with the SEC to register the resale of the common units
issuable upon conversion of the Class C preferred units and the registration statement was declared effective on March 27, 2015.

137
In June 2013, in connection with entering the EP Energy Acquisition (see Note 3), the Partnership sold an aggregate of
14,950,000 of its common limited partner units (including 1,950,000 units pursuant to an over-allotment option) in a public offering at
a price of $21.75 per unit, yielding net proceeds of approximately $313.1 million. The Partnership utilized the net proceeds from the
sale to repay the outstanding balance under its revolving credit facility (see Note 7).
In May 2013, the Partnership entered into an equity distribution agreement with Deutsche Bank Securities Inc., as representative
of several banks. Pursuant to the equity distribution agreement, the Partnership could sell, from time to time through the agents,
common units having an aggregate offering price of up to $25.0 million. During the year ended December 31, 2013, the Partnership
issued 309,174 common limited partner units under the equity distribution program for net proceeds of $6.9 million, net of
$0.4 million in commissions and other offering costs paid. The Partnership utilized the net proceeds from the sale to repay borrowings
outstanding under its revolving credit facility. The Partnership terminated this equity distribution agreement effective
December 27, 2013.
NOTE 13 – CASH DISTRIBUTIONS
In January 2014, the Partnership’s board of directors approved the modification of its cash distribution payment practice to a
monthly cash distribution program whereby it distributes all of its available cash (as defined in the partnership agreement) for that
month to its unitholders within 45 days from the month end. Prior to that, the Partnership paid quarterly cash distributions within 45
days from the end of each calendar quarter. If the Partnership’s common unit distributions in any quarter exceed specified target
levels, ATLS will receive between 13% and 48% of such distributions in excess of the specified target levels. While outstanding, the
Class B Preferred Units received regular quarterly cash distributions equal to the greater of (i) $0.40 (or $0.1333 per unit paid on a
monthly basis) and (ii) the quarterly common unit distribution. While outstanding, the Class C Preferred Units will receive regular
quarterly cash distributions equal to the greater of (i) $0.51 (or $0.17 per unit paid on a monthly basis) and (ii) the quarterly common
unit distribution. The Partnership pays quarterly distributions on the Class D Preferred Units at an annual rate of $2.15625 per unit,
$0.5390625 per unit paid on a quarterly basis, or 8.625% of the $25.00 liquidation preference. The Partnership pays quarterly
distributions on the Class E Preferred Units at an annual rate of $2.6875 per unit, or $0.671875 per unit on a quarterly basis, or
10.75% of the $25.00 liquidation preference.
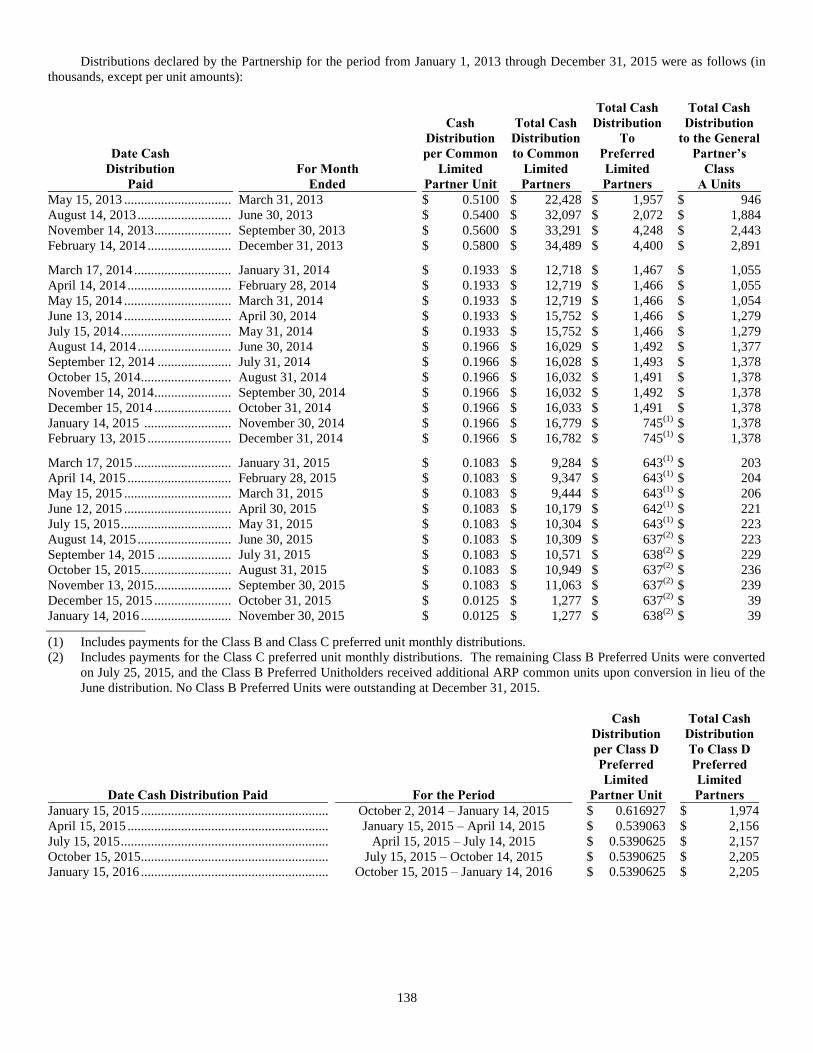
138
Distributions declared by the Partnership for the period from January 1, 2013 through December 31, 2015 were as follows (in
thousands, except per unit amounts):
Date Cash
Distribution
Paid
For Month
Ended
Cash
Distribution
per Common
Limited
Partner Unit
Total Cash
Distribution
to Common
Limited
Partners
Total Cash
Distribution
To
Preferred
Limited
Partners
Total Cash
Distribution
to the General
Partner’s
Class
A Units
May 15, 2013 ................................ March 31, 2013 $ 0.5100 $ 22,428 $ 1,957 $ 946
August 14, 2013 ............................ June 30, 2013 $ 0.5400 $ 32,097 $ 2,072 $ 1,884
November 14, 2013 ....................... September 30, 2013 $ 0.5600 $ 33,291 $ 4,248 $ 2,443
February 14, 2014 ......................... December 31, 2013 $ 0.5800 $ 34,489 $ 4,400 $ 2,891
March 17, 2014 ............................. January 31, 2014 $ 0.1933 $ 12,718 $ 1,467 $ 1,055
April 14, 2014 ............................... February 28, 2014 $ 0.1933 $ 12,719 $ 1,466 $ 1,055
May 15, 2014 ................................ March 31, 2014 $ 0.1933 $ 12,719 $ 1,466 $ 1,054
June 13, 2014 ................................ April 30, 2014 $ 0.1933 $ 15,752 $ 1,466 $ 1,279
July 15, 2014 ................................. May 31, 2014 $ 0.1933 $ 15,752 $ 1,466 $ 1,279
August 14, 2014 ............................ June 30, 2014 $ 0.1966 $ 16,029 $ 1,492 $ 1,377
September 12, 2014 ...................... July 31, 2014 $ 0.1966 $ 16,028 $ 1,493 $ 1,378
October 15, 2014 ........................... August 31, 2014 $ 0.1966 $ 16,032 $ 1,491 $ 1,378
November 14, 2014 ....................... September 30, 2014 $ 0.1966 $ 16,032 $ 1,492 $ 1,378
December 15, 2014 ....................... October 31, 2014 $ 0.1966 $ 16,033 $ 1,491 $ 1,378
January 14, 2015 .......................... November 30, 2014 $ 0.1966 $ 16,779 $ 745 (1)
$ 1,378
February 13, 2015 ......................... December 31, 2014 $ 0.1966 $ 16,782 $ 745 (1)
$ 1,378
March 17, 2015 ............................. January 31, 2015 $ 0.1083 $ 9,284 $ 643 (1)
$ 203
April 14, 2015 ............................... February 28, 2015 $ 0.1083 $ 9,347 $ 643 (1)
$ 204
May 15, 2015 ................................ March 31, 2015 $ 0.1083 $ 9,444 $ 643 (1)
$ 206
June 12, 2015 ................................ April 30, 2015 $ 0.1083 $ 10,179 $ 642 (1)
$ 221
July 15, 2015 ................................. May 31, 2015 $ 0.1083 $ 10,304 $ 643 (1)
$ 223
August 14, 2015 ............................ June 30, 2015 $ 0.1083 $ 10,309 $ 637 (2)
$ 223
September 14, 2015 ...................... July 31, 2015 $ 0.1083 $ 10,571 $ 638 (2)
$ 229
October 15, 2015 ........................... August 31, 2015 $ 0.1083 $ 10,949 $ 637 (2)
$ 236
November 13, 2015 ....................... September 30, 2015 $ 0.1083 $ 11,063 $ 637 (2)
$ 239
December 15, 2015 ....................... October 31, 2015 $ 0.0125 $ 1,277 $ 637 (2)
$ 39
January 14, 2016 ........................... November 30, 2015 $ 0.0125 $ 1,277 $ 638 (2)
$ 39
(1) Includes payments for the Class B and Class C preferred unit monthly distributions.
(2) Includes payments for the Class C preferred unit monthly distributions. The remaining Class B Preferred Units were converted
on July 25, 2015, and the Class B Preferred Unitholders received additional ARP common units upon conversion in lieu of the
June distribution. No Class B Preferred Units were outstanding at December 31, 2015.
Date Cash Distribution Paid For the Period
Cash
Distribution
per Class D
Preferred
Limited
Partner Unit
Total Cash
Distribution
To Class D
Preferred
Limited
Partners
January 15, 2015 ........................................................ October 2, 2014 – January 14, 2015 $ 0.616927 $ 1,974
April 15, 2015 ............................................................ January 15, 2015 – April 14, 2015 $ 0.539063 $ 2,156
July 15, 2015 .............................................................. April 15, 2015 – July 14, 2015 $ 0.5390625 $ 2,157
October 15, 2015 ........................................................ July 15, 2015 – October 14, 2015 $ 0.5390625 $ 2,205
January 15, 2016 ........................................................ October 15, 2015 – January 14, 2016 $ 0.5390625 $ 2,205

139
Date Cash Distribution Paid For the Period
Cash
Distribution
per Class E
Preferred
Limited
Partner Unit
Total Cash
Distribution
To Class E
Preferred
Limited
Partners
July 15, 2015 .............................................................. April 14, 2015 – July 14, 2015 $ 0.6793 $ 173
October 15, 2015 ........................................................ July 15, 2015 – October 14, 2015 $ 0.671875 $ 172
January 15, 2016 ........................................................ October 15, 2015 – January 14, 2016 $ 0.671875 $ 172
NOTE 14 — BENEFIT PLAN
2012 Long-Term Incentive Plan
The Partnership’s 2012 Long-Term Incentive Plan (“2012 LTIP”), effective March 2012, provides incentive awards to officers,
employees and directors and employees of the general partner and its affiliates, consultants and joint venture partners (collectively, the
“Participants”), who perform services for the Partnership. The 2012 LTIP is administered by the board of the general partner, a
committee of the board or the board (or committee of the board) of an affiliate (the “LTIP Committee”). Under the 2012 LTIP, the
LTIP Committee may grant awards of phantom units, restricted units or unit options for an aggregate of 2,900,000 common limited
partner units. At December 31, 2015, the Partnership had 1,656,630 phantom units, restricted units and restricted options outstanding
under the 2012 LTIP with 187,633 phantom units, restricted units and unit options available for grant. Share based payments to non-
employee directors, which have a cash settlement option, are recognized within liabilities in the consolidated financial statements
based upon their current fair market value.
In the case of awards held by eligible employees, following a “change in control”, as defined in the 2012 LTIP, upon the eligible
employee’s termination of employment without “cause”, as defined in the 2012 LTIP, or upon any other type of termination specified
in the eligible employee’s applicable award agreement(s), any unvested award will immediately vest in full and, in the case of options,
become exercisable for the one-year period following the date of termination of employment, but in any case not later than the end of
the original term of the option. Upon a change in control, all unvested awards held by directors will immediately vest in full.
In connection with a change in control, the LTIP Committee, in its sole and absolute discretion and without obtaining the
approval or consent of the unitholders or any Participant, but subject to the terms of any award agreements and employment
agreements to which the general partner (or any affiliate) and any Participant are party, may take one or more of the following actions
(with discretion to differentiate between individual Participants and awards for any reason):
cause awards to be assumed or substituted by the surviving entity (or affiliate of such surviving entity);
accelerate the vesting of awards as of immediately prior to the consummation of the transaction that constitutes the change
in control so that awards will vest (and, with respect to options, become exercisable) as to the common units that
otherwise would have been unvested so that Participants (as holders of awards granted under the new equity plan) may
participate in the transaction;
provide for the payment of cash or other consideration to Participants in exchange for the cancellation of outstanding
awards (in an amount equal to the fair market value of such cancelled awards);
terminate all or some awards upon the consummation of the change-in-control transaction, but only if the LTIP
Committee provides for full vesting of awards immediately prior to the consummation of such transaction; and
make such other modifications, adjustments or amendments to outstanding awards or the new equity plan as the LTIP
Committee deems necessary or appropriate.
Phantom Units
Phantom units represent rights to receive a common unit, an amount of cash or other securities or property based on the value of
a common unit, or a combination of common units and cash or other securities or property upon vesting. Phantom units are subject to
terms and conditions determined by the LTIP Committee, which may include vesting restrictions. In tandem with phantom unit grants,
the LTIP Committee may grant DERs, which are the right to receive an amount in cash, securities, or other property equal to, and at
the same time as, the cash distributions or other distributions of securities or other property made by the Partnership with respect to a
common unit during the period that the underlying phantom unit is outstanding. Phantom units granted under the 2012 LTIP generally
will vest 25% of the original granted amount on each of the four anniversaries of the date of grant. Of the phantom units outstanding
under the 2012 LTIP at December 31, 2015, 159,996 units will vest within the following twelve months. All phantom units
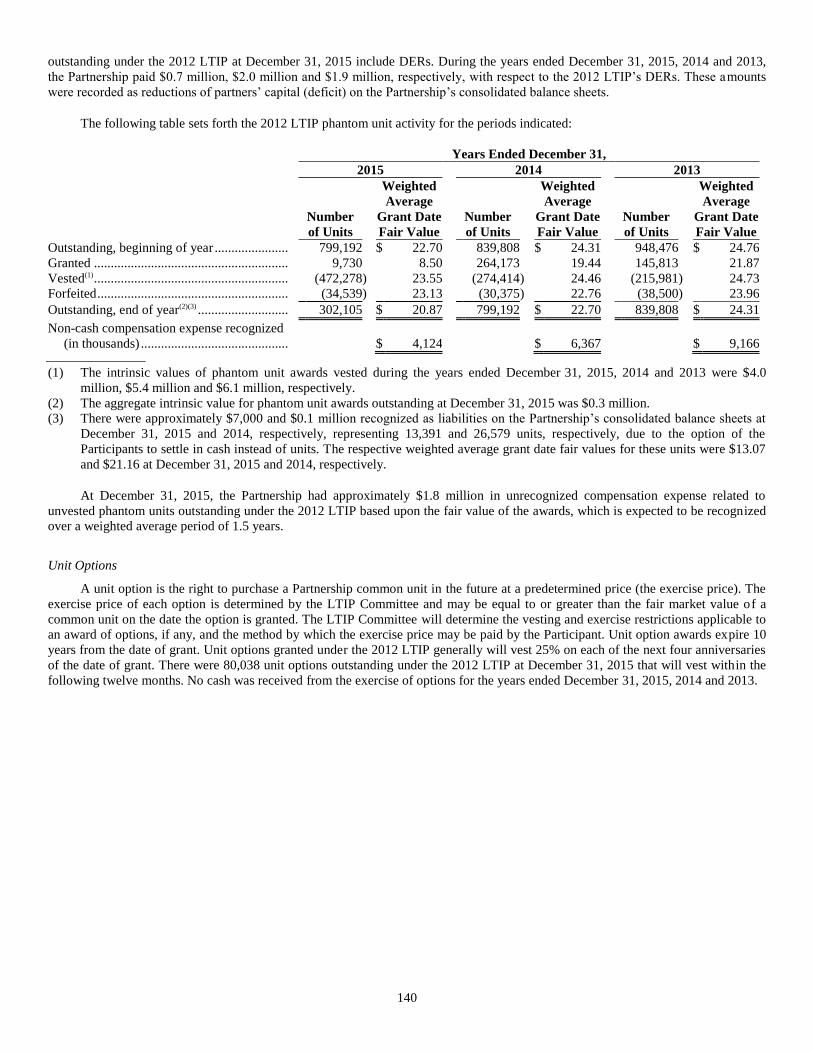
140
outstanding under the 2012 LTIP at December 31, 2015 include DERs. During the years ended December 31, 2015, 2014 and 2013,
the Partnership paid $0.7 million, $2.0 million and $1.9 million, respectively, with respect to the 2012 LTIP’s DERs. These amounts
were recorded as reductions of partners’ capital (deficit) on the Partnership’s consolidated balance sheets.
The following table sets forth the 2012 LTIP phantom unit activity for the periods indicated:
Years Ended December 31,
2015 2014 2013
Number
of Units
Weighted
Average
Grant Date
Fair Value Number
of Units
Weighted
Average
Grant Date
Fair Value Number
of Units
Weighted
Average
Grant Date
Fair Value
Outstanding, beginning of year ...................... 799,192 $ 22.70 839,808 $ 24.31 948,476 $ 24.76
Granted .......................................................... 9,730 8.50 264,173 19.44 145,813 21.87
Vested(1) .......................................................... (472,278 ) 23.55 (274,414 ) 24.46 (215,981 ) 24.73
Forfeited ......................................................... (34,539 ) 23.13 (30,375 ) 22.76 (38,500 ) 23.96
Outstanding, end of year(2)(3) ........................... 302,105 $ 20.87 799,192 $ 22.70 839,808 $ 24.31
Non-cash compensation expense recognized
(in thousands) ............................................
$ 4,124 $ 6,367 $ 9,166
(1) The intrinsic values of phantom unit awards vested during the years ended December 31, 2015, 2014 and 2013 were $4.0
million, $5.4 million and $6.1 million, respectively.
(2) The aggregate intrinsic value for phantom unit awards outstanding at December 31, 2015 was $0.3 million.
(3) There were approximately $7,000 and $0.1 million recognized as liabilities on the Partnership’s consolidated balance sheets at
December 31, 2015 and 2014, respectively, representing 13,391 and 26,579 units, respectively, due to the option of the
Participants to settle in cash instead of units. The respective weighted average grant date fair values for these units were $13.07
and $21.16 at December 31, 2015 and 2014, respectively.
At December 31, 2015, the Partnership had approximately $1.8 million in unrecognized compensation expense related to
unvested phantom units outstanding under the 2012 LTIP based upon the fair value of the awards, which is expected to be recognized
over a weighted average period of 1.5 years.
Unit Options
A unit option is the right to purchase a Partnership common unit in the future at a predetermined price (the exercise price). The
exercise price of each option is determined by the LTIP Committee and may be equal to or greater than the fair market value of a
common unit on the date the option is granted. The LTIP Committee will determine the vesting and exercise restrictions applicable to
an award of options, if any, and the method by which the exercise price may be paid by the Participant. Unit option awards expire 10
years from the date of grant. Unit options granted under the 2012 LTIP generally will vest 25% on each of the next four anniversaries
of the date of grant. There were 80,038 unit options outstanding under the 2012 LTIP at December 31, 2015 that will vest within the
following twelve months. No cash was received from the exercise of options for the years ended December 31, 2015, 2014 and 2013.
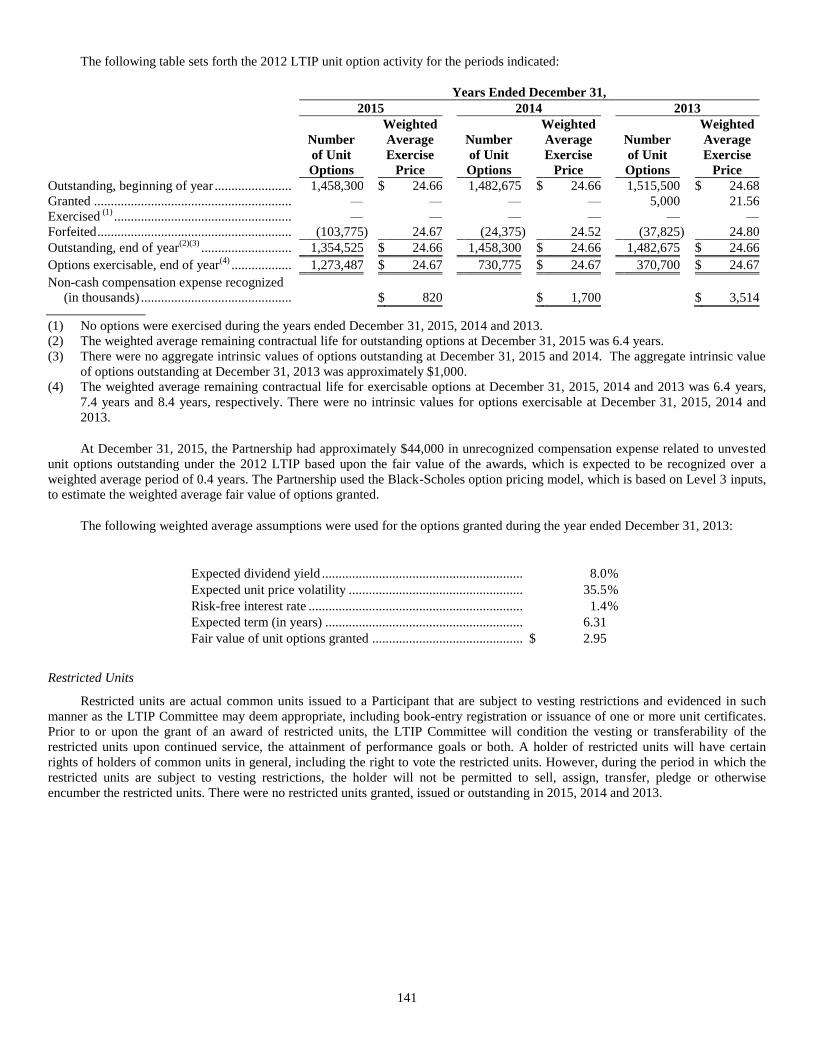
141
The following table sets forth the 2012 LTIP unit option activity for the periods indicated:
Years Ended December 31,
2015 2014 2013
Number
of Unit
Options
Weighted
Average
Exercise
Price
Number
of Unit
Options
Weighted
Average
Exercise
Price
Number
of Unit
Options
Weighted
Average
Exercise
Price
Outstanding, beginning of year ....................... 1,458,300 $ 24.66 1,482,675 $ 24.66 1,515,500 $ 24.68
Granted ........................................................... — — — — 5,000 21.56
Exercised (1)
..................................................... — — — — — —
Forfeited .......................................................... (103,775 ) 24.67 (24,375 ) 24.52 (37,825 ) 24.80
Outstanding, end of year(2)(3)
........................... 1,354,525 $ 24.66 1,458,300 $ 24.66 1,482,675 $ 24.66
Options exercisable, end of year(4)
.................. 1,273,487 $ 24.67 730,775 $ 24.67 370,700 $ 24.67
Non-cash compensation expense recognized
(in thousands) .............................................
$ 820 $ 1,700 $ 3,514
(1) No options were exercised during the years ended December 31, 2015, 2014 and 2013.
(2) The weighted average remaining contractual life for outstanding options at December 31, 2015 was 6.4 years.
(3) There were no aggregate intrinsic values of options outstanding at December 31, 2015 and 2014. The aggregate intrinsic value
of options outstanding at December 31, 2013 was approximately $1,000.
(4) The weighted average remaining contractual life for exercisable options at December 31, 2015, 2014 and 2013 was 6.4 years,
7.4 years and 8.4 years, respectively. There were no intrinsic values for options exercisable at December 31, 2015, 2014 and
2013.
At December 31, 2015, the Partnership had approximately $44,000 in unrecognized compensation expense related to unvested
unit options outstanding under the 2012 LTIP based upon the fair value of the awards, which is expected to be recognized over a
weighted average period of 0.4 years. The Partnership used the Black-Scholes option pricing model, which is based on Level 3 inputs,
to estimate the weighted average fair value of options granted.
The following weighted average assumptions were used for the options granted during the year ended December 31, 2013:
Expected dividend yield ............................................................ 8.0 %
Expected unit price volatility .................................................... 35.5 %
Risk-free interest rate ................................................................ 1.4 %
Expected term (in years) ........................................................... 6.31
Fair value of unit options granted ............................................. $ 2.95
Restricted Units
Restricted units are actual common units issued to a Participant that are subject to vesting restrictions and evidenced in such
manner as the LTIP Committee may deem appropriate, including book-entry registration or issuance of one or more unit certificates.
Prior to or upon the grant of an award of restricted units, the LTIP Committee will condition the vesting or transferability of the
restricted units upon continued service, the attainment of performance goals or both. A holder of restricted units will have certain
rights of holders of common units in general, including the right to vote the restricted units. However, during the period in which the
restricted units are subject to vesting restrictions, the holder will not be permitted to sell, assign, transfer, pledge or otherwise
encumber the restricted units. There were no restricted units granted, issued or outstanding in 2015, 2014 and 2013.
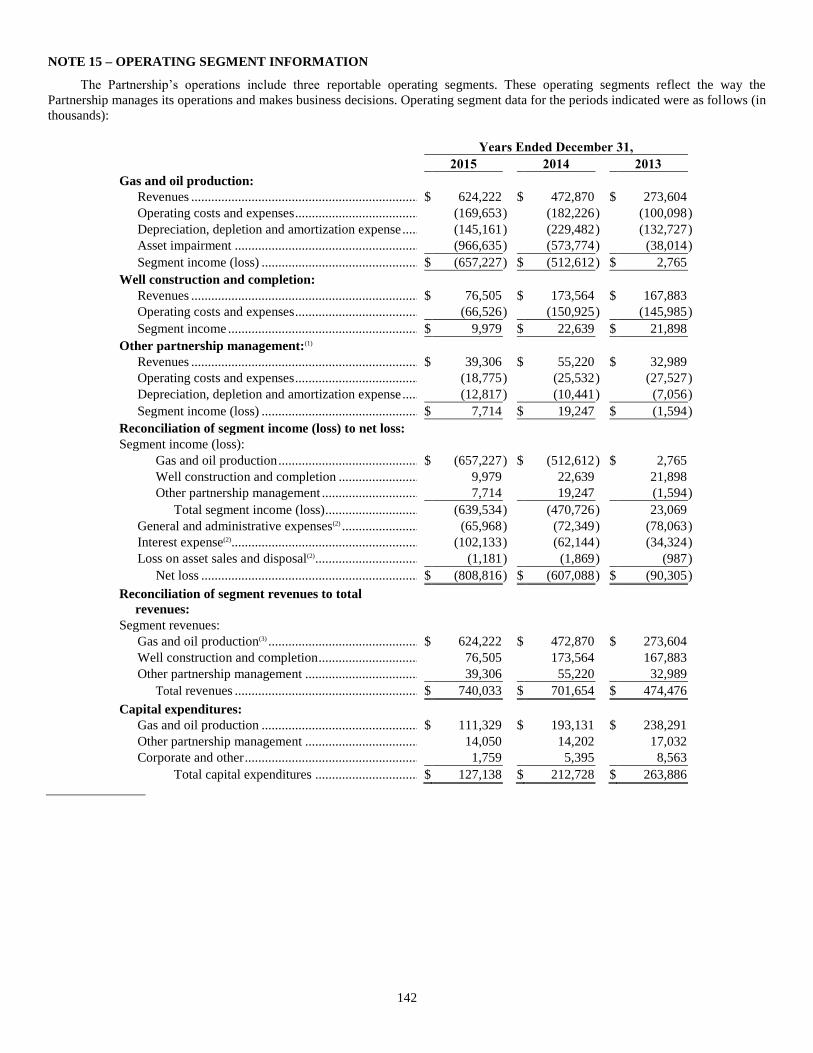
142
NOTE 15 – OPERATING SEGMENT INFORMATION
The Partnership’s operations include three reportable operating segments. These operating segments reflect the way the
Partnership manages its operations and makes business decisions. Operating segment data for the periods indicated were as follows (in
thousands):
Years Ended December 31,
2015 2014 2013
Gas and oil production:
Revenues .................................................................... $ 624,222 $ 472,870 $ 273,604
Operating costs and expenses ..................................... (169,653 ) (182,226 ) (100,098 )
Depreciation, depletion and amortization expense ..... (145,161 ) (229,482 ) (132,727 )
Asset impairment ....................................................... (966,635 ) (573,774 ) (38,014 )
Segment income (loss) ............................................... $ (657,227 ) $ (512,612 ) $ 2,765
Well construction and completion:
Revenues .................................................................... $ 76,505 $ 173,564 $ 167,883
Operating costs and expenses ..................................... (66,526 ) (150,925 ) (145,985 )
Segment income ......................................................... $ 9,979 $ 22,639 $ 21,898
Other partnership management:(1)
Revenues .................................................................... $ 39,306 $ 55,220 $ 32,989
Operating costs and expenses ..................................... (18,775 ) (25,532 ) (27,527 )
Depreciation, depletion and amortization expense ..... (12,817 ) (10,441 ) (7,056 )
Segment income (loss) ............................................... $ 7,714 $ 19,247 $ (1,594 )
Reconciliation of segment income (loss) to net loss:
Segment income (loss):
Gas and oil production .......................................... $ (657,227 ) $ (512,612 ) $ 2,765
Well construction and completion ........................ 9,979 22,639 21,898
Other partnership management ............................. 7,714 19,247 (1,594 )
Total segment income (loss) ............................ (639,534 ) (470,726 ) 23,069
General and administrative expenses(2) ....................... (65,968 ) (72,349 ) (78,063 )
Interest expense(2)........................................................ (102,133 ) (62,144 ) (34,324 )
Loss on asset sales and disposal(2) ............................... (1,181 ) (1,869 ) (987 )
Net loss ................................................................. $ (808,816 ) $ (607,088 ) $ (90,305 )
Reconciliation of segment revenues to total
revenues:
Segment revenues:
Gas and oil production(3) ............................................. $ 624,222 $ 472,870 $ 273,604
Well construction and completion .............................. 76,505 173,564 167,883
Other partnership management .................................. 39,306 55,220 32,989
Total revenues ....................................................... $ 740,033 $ 701,654 $ 474,476
Capital expenditures:
Gas and oil production ............................................... $ 111,329 $ 193,131 $ 238,291
Other partnership management .................................. 14,050 14,202 17,032
Corporate and other .................................................... 1,759 5,395 8,563
Total capital expenditures ............................... $ 127,138 $ 212,728 $ 263,886
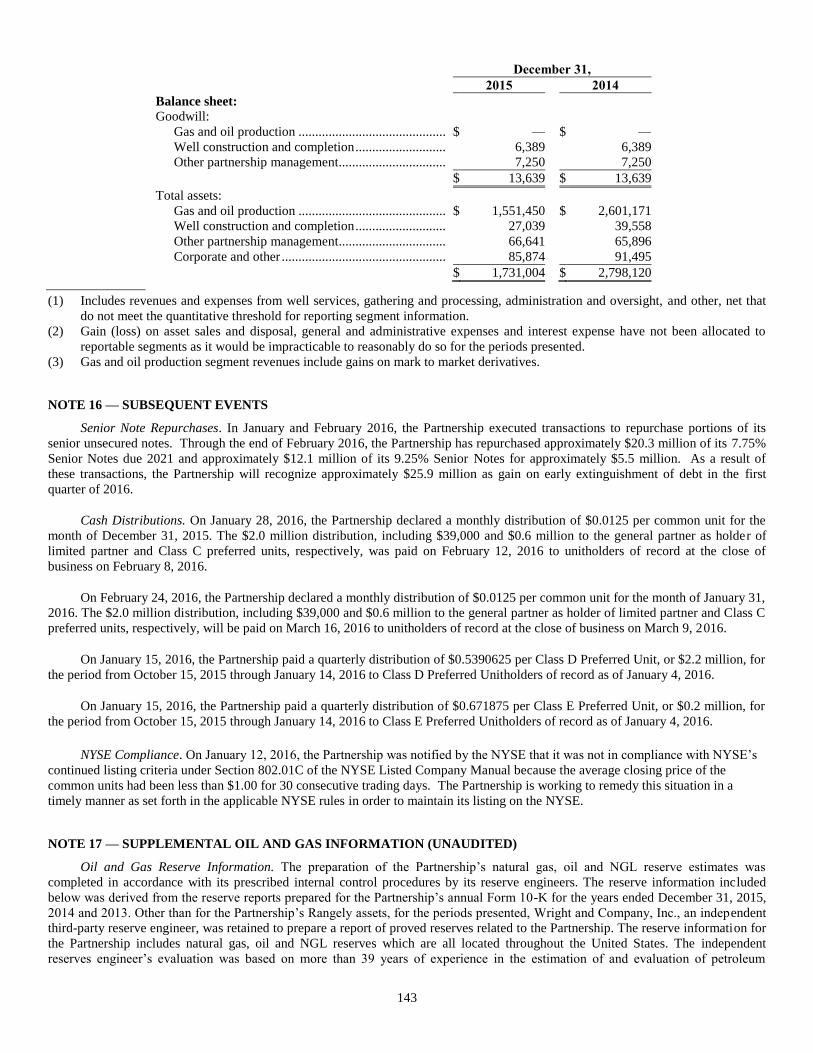
143
December 31,
2015 2014
Balance sheet:
Goodwill:
Gas and oil production ............................................ $ — $ —
Well construction and completion ........................... 6,389 6,389
Other partnership management................................ 7,250 7,250
$ 13,639 $ 13,639
Total assets:
Gas and oil production ............................................ $ 1,551,450 $ 2,601,171
Well construction and completion ........................... 27,039 39,558
Other partnership management................................ 66,641 65,896
Corporate and other ................................................. 85,874 91,495
$ 1,731,004 $ 2,798,120
(1) Includes revenues and expenses from well services, gathering and processing, administration and oversight, and other, net that
do not meet the quantitative threshold for reporting segment information.
(2) Gain (loss) on asset sales and disposal, general and administrative expenses and interest expense have not been allocated to
reportable segments as it would be impracticable to reasonably do so for the periods presented.
(3) Gas and oil production segment revenues include gains on mark to market derivatives.
NOTE 16 — SUBSEQUENT EVENTS
Senior Note Repurchases. In January and February 2016, the Partnership executed transactions to repurchase portions of its
senior unsecured notes. Through the end of February 2016, the Partnership has repurchased approximately $20.3 million of its 7.75%
Senior Notes due 2021 and approximately $12.1 million of its 9.25% Senior Notes for approximately $5.5 million. As a result of
these transactions, the Partnership will recognize approximately $25.9 million as gain on early extinguishment of debt in the first
quarter of 2016.
Cash Distributions. On January 28, 2016, the Partnership declared a monthly distribution of $0.0125 per common unit for the
month of December 31, 2015. The $2.0 million distribution, including $39,000 and $0.6 million to the general partner as holder of
limited partner and Class C preferred units, respectively, was paid on February 12, 2016 to unitholders of record at the close of
business on February 8, 2016.
On February 24, 2016, the Partnership declared a monthly distribution of $0.0125 per common unit for the month of January 31,
2016. The $2.0 million distribution, including $39,000 and $0.6 million to the general partner as holder of limited partner and Class C
preferred units, respectively, will be paid on March 16, 2016 to unitholders of record at the close of business on March 9, 2016.
On January 15, 2016, the Partnership paid a quarterly distribution of $0.5390625 per Class D Preferred Unit, or $2.2 million, for
the period from October 15, 2015 through January 14, 2016 to Class D Preferred Unitholders of record as of January 4, 2016.
On January 15, 2016, the Partnership paid a quarterly distribution of $0.671875 per Class E Preferred Unit, or $0.2 million, for
the period from October 15, 2015 through January 14, 2016 to Class E Preferred Unitholders of record as of January 4, 2016.
NYSE Compliance. On January 12, 2016, the Partnership was notified by the NYSE that it was not in compliance with NYSE’s
continued listing criteria under Section 802.01C of the NYSE Listed Company Manual because the average closing price of the
common units had been less than $1.00 for 30 consecutive trading days. The Partnership is working to remedy this situation in a
timely manner as set forth in the applicable NYSE rules in order to maintain its listing on the NYSE.
NOTE 17 — SUPPLEMENTAL OIL AND GAS INFORMATION (UNAUDITED)
Oil and Gas Reserve Information. The preparation of the Partnership’s natural gas, oil and NGL reserve estimates was
completed in accordance with its prescribed internal control procedures by its reserve engineers. The reserve information included
below was derived from the reserve reports prepared for the Partnership’s annual Form 10-K for the years ended December 31, 2015,
2014 and 2013. Other than for the Partnership’s Rangely assets, for the periods presented, Wright and Company, Inc., an independent
third-party reserve engineer, was retained to prepare a report of proved reserves related to the Partnership. The reserve information for
the Partnership includes natural gas, oil and NGL reserves which are all located throughout the United States. The independent
reserves engineer’s evaluation was based on more than 39 years of experience in the estimation of and evaluation of petroleum
144
reserves, specified economic parameters, operating conditions, and government regulations. For the Partnership’s Rangely assets,
Cawley, Gillespie, and Associates, Inc. was retained to prepare a report of proved reserves. The independent reserves engineer’s
evaluation was based on more than 33 years of experience in the estimation of and evaluation of petroleum reserves, specified
economic parameters, operating conditions, and government regulations. The Partnership’s internal control procedures include
verification of input data delivered to its third-party reserve specialist, as well as a multi-functional management review. The
preparation of reserve estimates was overseen by its Senior Reserve Engineer, who is a member of the Society of Petroleum Engineers
and has more than 17 years of natural gas and oil industry experience. The reserve estimates were reviewed and approved by the
Partnership’s senior engineering staff and management, with final approval by the President.
The reserve disclosures that follow reflect estimates of proved reserves, proved developed reserves and proved undeveloped
reserves, net of royalty interests, of natural gas, crude oil and NGLs owned at year end and changes in proved reserves during the last
three years. Proved oil, gas and NGL reserves are those quantities of oil, gas and NGLs, which, by analysis of geoscience and
engineering data, can be estimated with reasonable certainty to be economically producible—from a given date forward, from known
reservoirs, and under existing economic conditions, operating methods and government regulations—prior to the time at which
contracts providing the right to operate expire, unless evidence indicates that renewal is reasonably certain, regardless of whether
deterministic or probabilistic methods are used for the estimation. The project to extract the hydrocarbons must have commenced or
the operator must be reasonably certain that it will commence the project within a reasonable time. Proved developed reserves are
those reserves of any category that can be expected to be recovered through existing wells with existing equipment and operating
methods or in which the cost of the required equipment is relatively minor compared to the cost of a new well; and through installed
extraction equipment and infrastructure operational at the time of the reserves estimate if the extraction is by means not involving a
well. Proved undeveloped reserves are reserves of any category that are expected to be recovered from new wells on undrilled acreage,
or from existing wells where a relatively major expenditure is required for recompletion. Reserves on undrilled acreage are limited to
those directly offsetting development spacing areas that are reasonably certain of production when drilled, unless evidence using
reliable technology exists that establishes reasonable certainty of economic producibility at greater distances. Undrilled locations can
be classified as having undeveloped reserves only if a development plan has been adopted indicating that they are scheduled to be
drilled within five years, unless the specific circumstances justify a longer time. Estimates for undeveloped reserves cannot be
attributable to any acreage for which an application of fluid injection or other improved recovery technique is contemplated, unless
such techniques have been proved effective by actual projects in the same reservoir or an analogous reservoir, or by other evidence
using reliable technology establishing reasonable certainty. The proved reserves quantities and future net cash flows as of
December 31, 2015, 2014 and 2013 were estimated using an unweighted 12-month average pricing based on the prices on the first day
of each month during the years ended December 31, 2015, 2014 and 2013, including adjustments related to regional price differentials
and energy content.
There are numerous uncertainties inherent in estimating quantities of proven reserves and in projecting future net revenues and
the timing of development expenditures. The reserve data presented represents estimates only and should not be construed as being
exact. In addition, the standardized measures of discounted future net cash flows may not represent the fair market value of oil, gas
and NGL reserves included within the Partnership or the present value of future cash flows of equivalent reserves, due to anticipated
future changes in oil, gas and NGL prices and in production and development costs and other factors, for their effects have not been
proved.
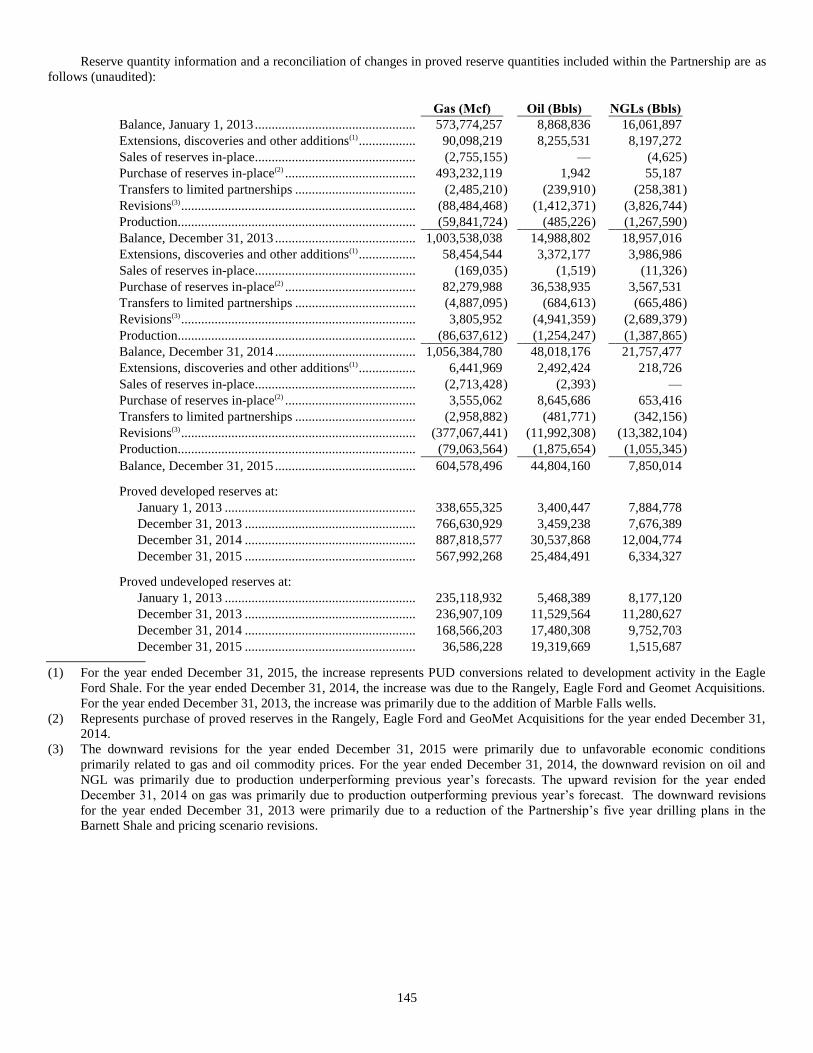
145
Reserve quantity information and a reconciliation of changes in proved reserve quantities included within the Partnership are as
follows (unaudited):
Gas (Mcf) Oil (Bbls) NGLs (Bbls)
Balance, January 1, 2013 .................................................. 573,774,257 8,868,836 16,061,897
Extensions, discoveries and other additions(1) ................... 90,098,219 8,255,531 8,197,272
Sales of reserves in-place.................................................. (2,755,155 ) — (4,625 )
Purchase of reserves in-place(2) ......................................... 493,232,119 1,942 55,187
Transfers to limited partnerships ...................................... (2,485,210 ) (239,910 ) (258,381 )
Revisions(3) ........................................................................ (88,484,468 ) (1,412,371 ) (3,826,744 )
Production......................................................................... (59,841,724 ) (485,226 ) (1,267,590 )
Balance, December 31, 2013 ............................................ 1,003,538,038 14,988,802 18,957,016
Extensions, discoveries and other additions(1) ................... 58,454,544 3,372,177 3,986,986
Sales of reserves in-place.................................................. (169,035 ) (1,519 ) (11,326 )
Purchase of reserves in-place(2) ......................................... 82,279,988 36,538,935 3,567,531
Transfers to limited partnerships ...................................... (4,887,095 ) (684,613 ) (665,486 )
Revisions(3) ........................................................................ 3,805,952 (4,941,359 ) (2,689,379 )
Production......................................................................... (86,637,612 ) (1,254,247 ) (1,387,865 )
Balance, December 31, 2014 ............................................ 1,056,384,780 48,018,176 21,757,477
Extensions, discoveries and other additions(1) ................... 6,441,969 2,492,424 218,726
Sales of reserves in-place.................................................. (2,713,428 ) (2,393 ) —
Purchase of reserves in-place(2) ......................................... 3,555,062 8,645,686 653,416
Transfers to limited partnerships ...................................... (2,958,882 ) (481,771 ) (342,156 )
Revisions(3) ........................................................................ (377,067,441 ) (11,992,308 ) (13,382,104 )
Production......................................................................... (79,063,564 ) (1,875,654 ) (1,055,345 )
Balance, December 31, 2015 ............................................ 604,578,496 44,804,160 7,850,014
Proved developed reserves at:
January 1, 2013 ........................................................... 338,655,325 3,400,447 7,884,778
December 31, 2013 ..................................................... 766,630,929 3,459,238 7,676,389
December 31, 2014 ..................................................... 887,818,577 30,537,868 12,004,774
December 31, 2015 ..................................................... 567,992,268 25,484,491 6,334,327
Proved undeveloped reserves at:
January 1, 2013 ........................................................... 235,118,932 5,468,389 8,177,120
December 31, 2013 ..................................................... 236,907,109 11,529,564 11,280,627
December 31, 2014 ..................................................... 168,566,203 17,480,308 9,752,703
December 31, 2015 ..................................................... 36,586,228 19,319,669 1,515,687
(1) For the year ended December 31, 2015, the increase represents PUD conversions related to development activity in the Eagle
Ford Shale. For the year ended December 31, 2014, the increase was due to the Rangely, Eagle Ford and Geomet Acquisitions.
For the year ended December 31, 2013, the increase was primarily due to the addition of Marble Falls wells.
(2) Represents purchase of proved reserves in the Rangely, Eagle Ford and GeoMet Acquisitions for the year ended December 31,
2014.
(3) The downward revisions for the year ended December 31, 2015 were primarily due to unfavorable economic conditions
primarily related to gas and oil commodity prices. For the year ended December 31, 2014, the downward revision on oil and
NGL was primarily due to production underperforming previous year’s forecasts. The upward revision for the year ended
December 31, 2014 on gas was primarily due to production outperforming previous year’s forecast. The downward revisions
for the year ended December 31, 2013 were primarily due to a reduction of the Partnership’s five year drilling plans in the
Barnett Shale and pricing scenario revisions.
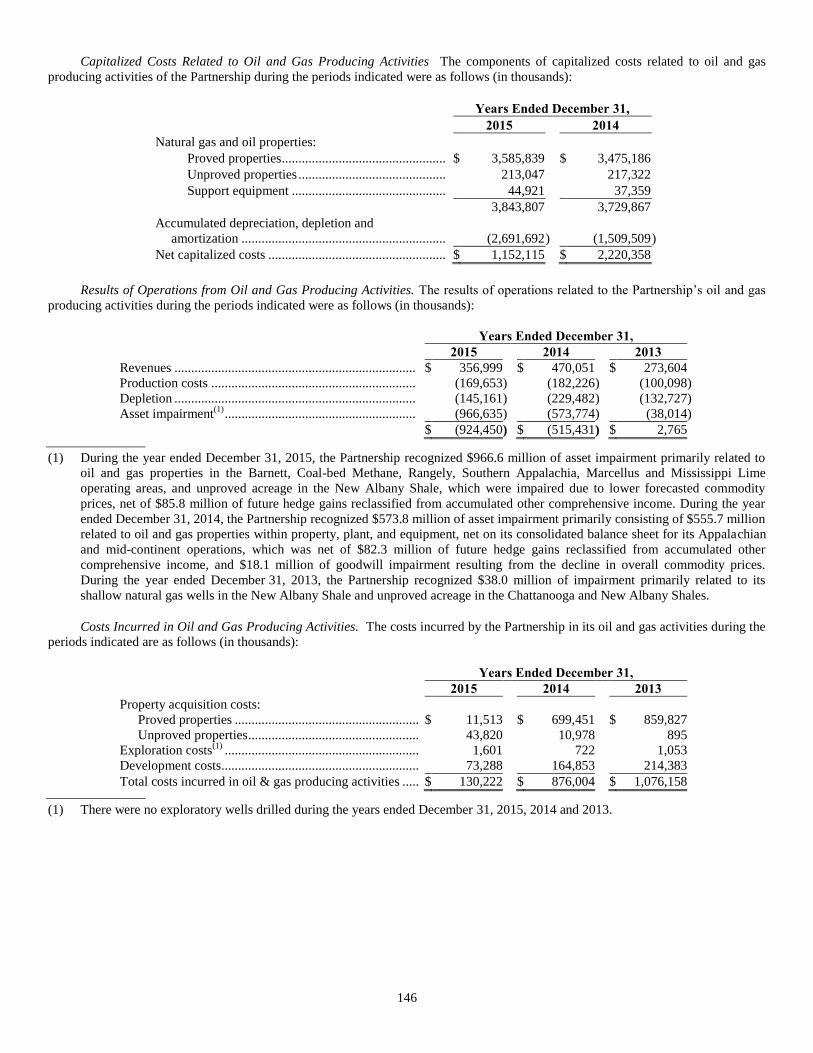
146
Capitalized Costs Related to Oil and Gas Producing Activities The components of capitalized costs related to oil and gas
producing activities of the Partnership during the periods indicated were as follows (in thousands):
Years Ended December 31,
2015 2014
Natural gas and oil properties:
Proved properties ................................................... $ 3,585,839 $ 3,475,186
Unproved properties .............................................. 213,047 217,322
Support equipment ................................................ 44,921 37,359
3,843,807 3,729,867
Accumulated depreciation, depletion and
amortization ...............................................................
(2,691,692 ) (1,509,509 )
Net capitalized costs ....................................................... $ 1,152,115 $ 2,220,358
Results of Operations from Oil and Gas Producing Activities. The results of operations related to the Partnership’s oil and gas
producing activities during the periods indicated were as follows (in thousands):
Years Ended December 31,
2015 2014 2013
Revenues ........................................................................ $ 356,999 $ 470,051 $ 273,604
Production costs ............................................................. (169,653 ) (182,226 ) (100,098 )
Depletion ........................................................................ (145,161 ) (229,482 ) (132,727 )
Asset impairment(1)
......................................................... (966,635 ) (573,774 ) (38,014 )
$ (924,450 ) $ (515,431 ) $ 2,765
(1) During the year ended December 31, 2015, the Partnership recognized $966.6 million of asset impairment primarily related to
oil and gas properties in the Barnett, Coal-bed Methane, Rangely, Southern Appalachia, Marcellus and Mississippi Lime
operating areas, and unproved acreage in the New Albany Shale, which were impaired due to lower forecasted commodity
prices, net of $85.8 million of future hedge gains reclassified from accumulated other comprehensive income. During the year
ended December 31, 2014, the Partnership recognized $573.8 million of asset impairment primarily consisting of $555.7 million
related to oil and gas properties within property, plant, and equipment, net on its consolidated balance sheet for its Appalachian
and mid-continent operations, which was net of $82.3 million of future hedge gains reclassified from accumulated other
comprehensive income, and $18.1 million of goodwill impairment resulting from the decline in overall commodity prices.
During the year ended December 31, 2013, the Partnership recognized $38.0 million of impairment primarily related to its
shallow natural gas wells in the New Albany Shale and unproved acreage in the Chattanooga and New Albany Shales.
Costs Incurred in Oil and Gas Producing Activities. The costs incurred by the Partnership in its oil and gas activities during the
periods indicated are as follows (in thousands):
Years Ended December 31,
2015 2014 2013
Property acquisition costs:
Proved properties ......................................................... $ 11,513 $ 699,451 $ 859,827
Unproved properties ..................................................... 43,820 10,978 895
Exploration costs(1)
............................................................ 1,601 722 1,053
Development costs............................................................. 73,288 164,853 214,383
Total costs incurred in oil & gas producing activities ....... $ 130,222 $ 876,004 $ 1,076,158
(1) There were no exploratory wells drilled during the years ended December 31, 2015, 2014 and 2013.
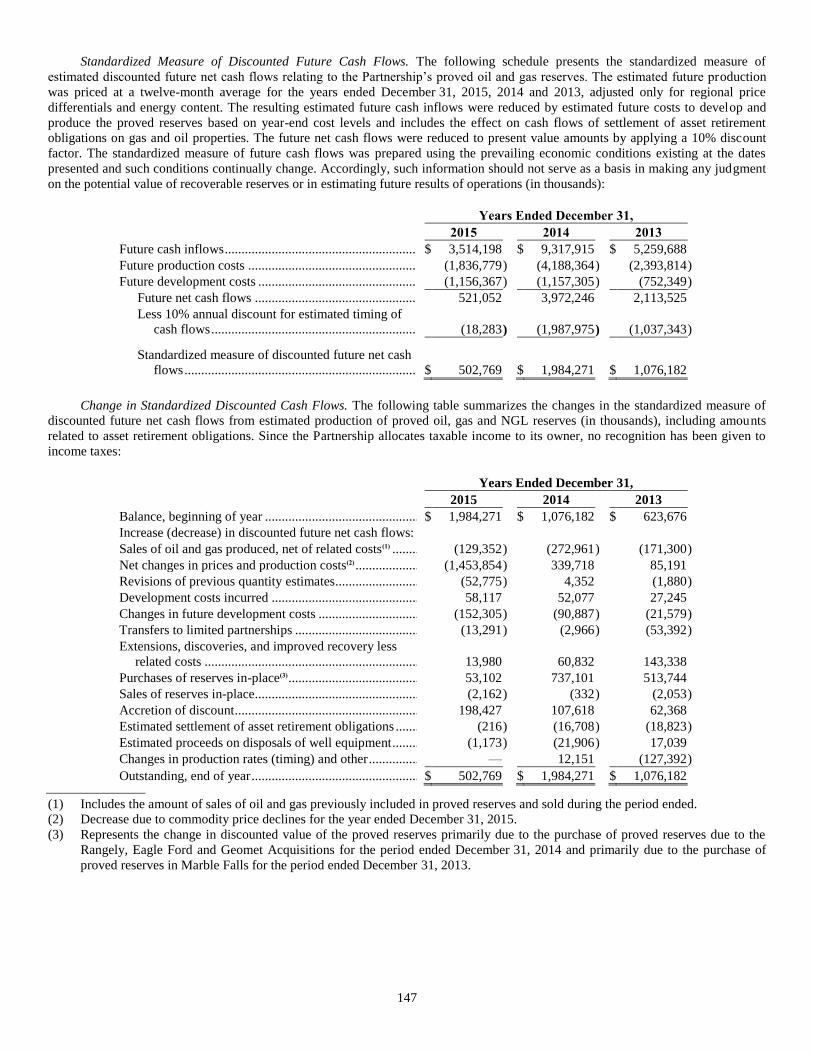
147
Standardized Measure of Discounted Future Cash Flows. The following schedule presents the standardized measure of
estimated discounted future net cash flows relating to the Partnership’s proved oil and gas reserves. The estimated future production
was priced at a twelve-month average for the years ended December 31, 2015, 2014 and 2013, adjusted only for regional price
differentials and energy content. The resulting estimated future cash inflows were reduced by estimated future costs to develop and
produce the proved reserves based on year-end cost levels and includes the effect on cash flows of settlement of asset retirement
obligations on gas and oil properties. The future net cash flows were reduced to present value amounts by applying a 10% discount
factor. The standardized measure of future cash flows was prepared using the prevailing economic conditions existing at the dates
presented and such conditions continually change. Accordingly, such information should not serve as a basis in making any judgment
on the potential value of recoverable reserves or in estimating future results of operations (in thousands):
Years Ended December 31,
2015 2014 2013
Future cash inflows ......................................................... $ 3,514,198 $ 9,317,915 $ 5,259,688
Future production costs .................................................. (1,836,779 ) (4,188,364 ) (2,393,814 )
Future development costs ............................................... (1,156,367 ) (1,157,305 ) (752,349 )
Future net cash flows ................................................ 521,052 3,972,246 2,113,525
Less 10% annual discount for estimated timing of
cash flows .............................................................
(18,283 ) (1,987,975 ) (1,037,343 )
Standardized measure of discounted future net cash
flows .....................................................................
$ 502,769 $ 1,984,271 $ 1,076,182
Change in Standardized Discounted Cash Flows. The following table summarizes the changes in the standardized measure of
discounted future net cash flows from estimated production of proved oil, gas and NGL reserves (in thousands), including amounts
related to asset retirement obligations. Since the Partnership allocates taxable income to its owner, no recognition has been given to
income taxes:
Years Ended December 31,
2015 2014 2013
Balance, beginning of year .............................................. $ 1,984,271 $ 1,076,182 $ 623,676
Increase (decrease) in discounted future net cash flows:
Sales of oil and gas produced, net of related costs(1) ........ (129,352 ) (272,961 ) (171,300 )
Net changes in prices and production costs(2) ................... (1,453,854 ) 339,718 85,191
Revisions of previous quantity estimates ......................... (52,775 ) 4,352 (1,880 )
Development costs incurred ............................................ 58,117 52,077 27,245
Changes in future development costs .............................. (152,305 ) (90,887 ) (21,579 )
Transfers to limited partnerships ..................................... (13,291 ) (2,966 ) (53,392 )
Extensions, discoveries, and improved recovery less
related costs ................................................................
13,980 60,832 143,338
Purchases of reserves in-place(3) ....................................... 53,102 737,101 513,744
Sales of reserves in-place................................................. (2,162 ) (332 ) (2,053 )
Accretion of discount ....................................................... 198,427 107,618 62,368
Estimated settlement of asset retirement obligations ....... (216 ) (16,708 ) (18,823 )
Estimated proceeds on disposals of well equipment ........ (1,173 ) (21,906 ) 17,039
Changes in production rates (timing) and other ............... — 12,151 (127,392 )
Outstanding, end of year .................................................. $ 502,769 $ 1,984,271 $ 1,076,182
(1) Includes the amount of sales of oil and gas previously included in proved reserves and sold during the period ended.
(2) Decrease due to commodity price declines for the year ended December 31, 2015.
(3) Represents the change in discounted value of the proved reserves primarily due to the purchase of proved reserves due to the
Rangely, Eagle Ford and Geomet Acquisitions for the period ended December 31, 2014 and primarily due to the purchase of
proved reserves in Marble Falls for the period ended December 31, 2013.

148
NOTE 18 — QUARTERLY RESULTS (Unaudited)
Fourth
Quarter(1)(2)
Third
Quarter(1)(2)
Second
Quarter(1)
First
Quarter(1)
(in thousands, except unit data)
Year ended December 31, 2015:
Revenues ............................................................................ $ 142,424 $ 257,895 $ 96,125 $ 243,589
Net loss attributable to common limited partners and the
general partner’s interests(2)............................................ $ (293,013 ) $ (565,147 ) $ (51,044 ) $ 83,919
Allocation of net income (loss) attributable to common
limited partners and the general partner:
Common limited partners’ interest ................................ $ (287,153 ) $ (553,844 ) $ (50,023 ) $ 82,240
General partner’s interest ............................................... (5,860 ) (11,303 ) (1,021 ) 1,679
Net loss attributable to common limited partners and the
general partner’s interests .............................................. $ (293,013 ) (565,147 ) $ (51,044 ) $ 83,919
Net loss attributable to common unitholders per unit:
Basic ............................................................................. $ (2.81 ) $ (5.73 ) $ (0.55 ) $ 0.95
Diluted .......................................................................... $ (2.81 ) $ (5.73 ) $ (0.55 ) $ 0.93
(1) For the second, third, and fourth quarters of the year ended December 31, 2015, approximately 469,000, 346,000 and 309,000
units, respectively, were excluded from the computation of diluted net income (loss) per common unit, because the inclusion of
such units would have been anti-dilutive. For the second, third, and fourth quarters of the year ended December 31, 2015,
potential common limited partner units issuable upon conversion of the Partnership’s Class B and Class C preferred units were
excluded from the computation of diluted earnings attributable to common limited partners per unit, because the inclusion of
such units would have been anti-dilutive. For the first, second, third and fourth quarters of the year ended December 31, 2015,
potential common limited partner units issuable upon exercise of the common unit warrants issued with the Class C preferred
units were excluded from the computation of diluted earnings attributable to common limited partners per unit, because the
inclusion of such units would have been anti-dilutive.
(2) Includes asset impairment charges of $672.2 million and $294.4 million in the third and fourth quarters of 2015, respectively.
Fourth
Quarter(1) (2)
Third
Quarter(1)
Second
Quarter(1)
First
Quarter(1)
(in thousands, except unit data)
Year ended December 31, 2014:
Revenues ............................................................................ $ 194,701 $ 206,699 $ 138,897 $ 161,357
Net loss attributable to common limited partners and the
general partner’s interests(2)............................................ $ (585,499 ) $ (2,590 ) $ (23,803 ) $ (14,463 )
Allocation of net income (loss) attributable to common
limited partners and the general partner:
Common limited partners’ interest ................................ $ (576,850 ) $ (5,599 ) $ (26,203 ) $ (16,481 )
General partner’s interest ............................................... (8,649 ) 3,009 2,400 2,018
Net loss attributable to common limited partners and the
general partner’s interests .............................................. $ (585,499 ) (2,590 ) $ (23,803 ) $ (14,463 )
Net loss attributable to common unitholders per unit:
Basic ............................................................................. $ (7.04 ) $ (0.07 ) $ (0.35 ) $ (0.27 )
Diluted .......................................................................... $ (7.04 ) $ (0.07 ) $ (0.35 ) $ (0.27 )
(1) For the first, second, third, and fourth quarters of the year ended December 31, 2014, approximately 820,000, 724,000, 797,000,
and 791,000 units, respectively, were excluded from the computation of diluted net income (loss) per common unit, because the
inclusion of such units would have been anti-dilutive. For the first, second, third, and fourth quarters of the year ended
December 31, 2014, potential common limited partner units issuable upon conversion of the Partnership’s Class B and Class C
preferred units were excluded from the computation of diluted earnings attributable to common limited partners per unit,
because the inclusion of such units would have been anti-dilutive. For the first, second, third and fourth quarters of the year
ended December 31, 2014, potential common limited partner units issuable upon exercise of the common unit warrants issued
with the Class C preferred units were excluded from the computation of diluted earnings attributable to common limited partners
per unit, because the inclusion of such units would have been anti-dilutive.
(2) Includes an asset impairment charge of $573.8 million in the fourth quarter of 2014.
149
ITEM 9: CHANGES IN AND DISAGREEMENTS WITH ACCOUNTANTS ON ACCOUNTING AND FINANCIAL
DISCLOSURE
None.
ITEM 9A: CONTROLS AND PROCEDURES
Conclusion Regarding the Effectiveness of Disclosure Controls and Procedures
We maintain disclosure controls and procedures that are designed to ensure that information required to be disclosed in our
Securities Exchange Act of 1934 reports is recorded, processed, summarized and reported within the time periods specified in the
SEC’s rules and forms, and that such information is accumulated and communicated to our management, including our Chief
Executive Officer and Chief Financial Officer, as appropriate, to allow timely decisions regarding required disclosure. In designing
and evaluating the disclosure controls and procedures, our management recognized that any controls and procedures, no matter how
well designed and operated, can provide only reasonable assurance of achieving the desired control objectives, and our management
necessarily was required to apply its judgment in evaluating the cost-benefit relationship of possible controls and procedures.
Under the supervision of our Chief Executive Officer and Chief Financial Officer and with the participation of our disclosure
committee appointed by such officers, we have carried out an evaluation of the effectiveness of our disclosure controls and procedures
as of the end of the period covered by this report. Based upon that evaluation, our Chief Executive Officer and Chief Financial Officer
concluded that, as of December 31, 2015, our disclosure controls and procedures were effective at the reasonable assurance level.
Management’s Report on Internal Control over Financial Reporting
Our management is responsible for establishing and maintaining adequate internal control over financial reporting, as such term
is defined in Exchange Act Rule 13a-15(f). Under the supervision and with the participation of management, including our Chief
Executive Officer and Chief Financial Officer, we conducted an evaluation of the effectiveness of internal control over financial
reporting based upon criteria set forth by the Committee of Sponsoring Organizations of the Treadway Commission in the 2013
Internal Control – Integrated Framework (COSO framework).
An effective internal control system, no matter how well designed, has inherent limitations, including the possibility of human
error and circumvention or overriding of controls and therefore can provide only reasonable assurance with respect to reliable
financial reporting. Furthermore, effectiveness of an internal control system in future periods cannot be guaranteed because the design
of any system of internal controls is based in part upon assumptions about the likelihood of future events. There can be no assurance
that any control design will succeed in achieving its stated goals under all potential future conditions. Over time certain controls may
become inadequate because of changes in business conditions, or the degree of compliance with policies and procedures may
deteriorate. As such, misstatements due to error or fraud may occur and not be detected.
There have been no changes in our internal control over financial reporting during the fourth quarter of 2015 that have
materially affected, or are reasonably likely to materially affect, our internal control over financial reporting.
Based on our evaluation under the COSO framework, management concluded that our internal control over financial reporting
was effective at the reasonable assurance level as of December 31, 2015. Grant Thornton LLP, an independent registered public
accounting firm, has issued an attestation report on the effectiveness of our internal control over financial reporting as of
December 31, 2015, which is included herein.
150
REPORT OF INDEPENDENT REGISTERED PUBLIC ACCOUNTING FIRM
Board of Directors and Unitholders
Atlas Resource Partners, L.P.
We have audited the internal control over financial reporting of Atlas Resource Partners, L.P. (a Delaware limited partnership)
and subsidiaries (collectively, the “Partnership”) as of December 31, 2015, based on criteria established in the 2013 Internal Control—
Integrated Framework issued by the Committee of Sponsoring Organizations of the Treadway Commission (COSO). The
Partnership’s management is responsible for maintaining effective internal control over financial reporting and for its assessment of
the effectiveness of internal control over financial reporting, included in the accompanying Management’s Report on Internal Control
over Financial Reporting (“Management’s Report”). Our responsibility is to express an opinion on the Partnership’s internal control
over financial reporting based on our audit.
We conducted our audit in accordance with the standards of the Public Company Accounting Oversight Board (United States).
Those standards require that we plan and perform the audit to obtain reasonable assurance about whether effective internal control
over financial reporting was maintained in all material respects. Our audit included obtaining an understanding of internal control over
financial reporting, assessing the risk that a material weakness exists, testing and evaluating the design and operating effectiveness of
internal control based on the assessed risk, and performing such other procedures as we considered necessary in the circumstances.
We believe that our audit provides a reasonable basis for our opinion.
A company’s internal control over financial reporting is a process designed to provide reasonable assurance regarding the
reliability of financial reporting and the preparation of financial statements for external purposes in accordance with generally
accepted accounting principles. A company’s internal control over financial reporting includes those policies and procedures that
(1) pertain to the maintenance of records that, in reasonable detail, accurately and fairly reflect the transactions and dispositions of the
assets of the company; (2) provide reasonable assurance that transactions are recorded as necessary to permit preparation of financial
statements in accordance with generally accepted accounting principles, and that receipts and expenditures of the company are being
made only in accordance with authorizations of management and directors of the company; and (3) provide reasonable assurance
regarding prevention or timely detection of unauthorized acquisition, use, or disposition of the company’s assets that could have a
material effect on the financial statements.
Because of its inherent limitations, internal control over financial reporting may not prevent or detect misstatements. Also,
projections of any evaluation of effectiveness to future periods are subject to the risk that controls may become inadequate because of
changes in conditions, or that the degree of compliance with the policies or procedures may deteriorate.
In our opinion, the Partnership maintained, in all material respects, effective internal control over financial reporting as of
December 31, 2015, based on criteria established in the 2013 Internal Control—Integrated Framework issued by COSO.
We also have audited, in accordance with the standards of the Public Company Accounting Oversight Board (United States), the
consolidated financial statements of the Partnership as of and for the year ended December 31, 2015, and our report dated March 4,
2016 expressed an unqualified opinion on those financial statements.
/s/ GRANT THORNTON LLP
Cleveland, Ohio
March 4, 2016

151
ITEM 9B: OTHER INFORMATION
None.
152
PART III
ITEM 10: DIRECTORS, EXECUTIVE OFFICERS AND CORPORATE GOVERNANCE
Our general partner, Atlas Energy Group, LLC, manages our activities. Unitholders do not directly or indirectly participate in
our management or operations, have actual or apparent authority to enter into contracts on our behalf or to otherwise bind us, or elect
members of our general partner’s board of directors. Our general partner will be liable, as general partner, for all of our debts to the
extent not paid, except to the extent that indebtedness or other obligations incurred by us are specifically with recourse only to our
assets. Whenever possible, our general partner intends to make our indebtedness or other obligations with recourse only to our assets.
As set forth in our partnership governance guidelines and in accordance with NYSE listing standards, the non-management
members of our general partner’s board of directors meet in executive session regularly without management. The board member who
presides at these meetings rotates each meeting. The purpose of these executive sessions is to promote open and candid discussion
among the non-management board members. Interested parties wishing to communicate directly with the non-management members
may contact the lead director of our general partner’s board of directors, Dennis Holtz. Correspondence to Mr. Holtz should be
marked “Confidential” and sent to Mr. Holtz’s attention, c/o Atlas Resource Partners, L.P., 1845 Walnut Street, 10th
Floor,
Philadelphia, Pennsylvania 19103.
The independent board members comprise all of the members of the committees of the board of directors of our general partner:
audit committee, compensation committee, nominating and governance committee, investment committee, and environment, health
and safety committee. Additionally, independent members of the board of managers of Atlas Resource Partners Holdings, LLC, our
wholly-owned subsidiary, comprise all of the members of the conflicts committee.
As is commonly the case with publicly traded limited partnerships, we do not directly employ any of the persons responsible for
our management or operation. Rather, personnel employed by Atlas Energy Group manage and operate our business. Some of our
officers may spend a substantial amount of time managing the business and affairs of Atlas Energy Group and its affiliates other than
us and may face a conflict regarding the allocation of their time between our business and affairs and their other business interests.
Reimbursement of Expenses of Our General Partner and Its Affiliates
Our general partner does not receive any management fee or other compensation for its services to us apart from its general
partner and incentive distributions, when applicable. We reimburse our general partner and its affiliates for all expenses incurred on
our behalf. These expenses include the costs of employee, officer and board member compensation and benefits properly allocable to
us, and all other expenses necessary or appropriate for the conduct of our business. Our limited partnership agreement provides that
our general partner will determine the expenses that are allocable to us in any reasonable manner as determined by our general partner
in its sole discretion, and does not set any aggregate limit on such reimbursements. Our general partner allocates the costs of employee
and officer compensation and benefits based upon the amount of business time spent by those employees and officers on our business.
Board of Directors of Our General Partner and our Officers
The following table sets forth information with respect to those persons who serve on the board of directors of our general
partner (the “Board”) and as our officers:
Name Age Position(s)
Edward E. Cohen ........................................................... 77 Executive Chairman
Jonathan Z. Cohen ......................................................... 45 Executive Vice Chairman
Mark C. Biderman ......................................................... 70 Director
DeAnn Craig .................................................................. 64 Director
Dennis A. Holtz ............................................................. 75 Director
Walter C. Jones .............................................................. 53 Director
Jeffrey F. Kupfer ............................................................ 48 Director
Ellen F. Warren .............................................................. 59 Director
Daniel C. Herz ............................................................... 39 Chief Executive Officer
Mark D. Schumacher ..................................................... 53 President
Jeffrey M. Slotterback .................................................... 33 Chief Financial Officer
Freddie M. Kotek ........................................................... 60 Senior Vice President of Investment Partnership Division
Lisa Washington ............................................................ 48 Vice President, Chief Legal Officer and Secretary
Matthew J. Finkbeiner ................................................... 36 Chief Accounting Officer
Dave Leopold ................................................................. 52 Chief Operating Officer
153
Edward E. Cohen has been our Executive Chairman since August 2015 and the Chief Executive Officer and Executive Vice
Chairman of our general partner since February 2015. Mr. Cohen served as President of our general partner from February 2015 to
April 2015, and before that was Chairman and Chief Executive Officer since February 2012. Mr. Cohen has also served as Chairman
of the Board and Chief Executive Officer of the general partner of Atlas Growth Partners, L.P. since its inception in 2013. Mr. Cohen
was the Chairman of the Board of Atlas Energy’s general partner from its formation in January 2006 until February 2011, when he
became its Chief Executive Officer and President until February 2015. Mr. Cohen served as the Chief Executive Officer of Atlas
Energy’s general partner from its formation in January 2006 until February 2009. Mr. Cohen served on the executive committee of
Atlas Energy’s general partner from 2006 until February 2015. Mr. Cohen also was the Chairman of the Board and Chief Executive
Officer of Atlas Energy, Inc. (formerly known as Atlas America, Inc.) from its organization in 2000 until February 2011and also
served as its President from September 2000 to October 2009. Mr. Cohen was the Executive Chair of the managing board of Atlas
Pipeline Partners GP, LLC (“Atlas Pipeline GP”) from its formation in 1999 until February 2015. Mr. Cohen was the Chief Executive
Officer of Atlas Pipeline GP from 1999 to January 2009. Mr. Cohen was the Chairman of the Board and Chief Executive Officer of
Atlas Energy Resources, LLC and its manager, Atlas Energy Management, Inc. from their formation in June 2006 until February
2011. In addition, Mr. Cohen has been a director of Resource America, Inc. (a publicly-traded specialized asset management
company) since 1988 and its Chairman of its Board of Directors since 1990 and was its Chief Executive Officer from 1988 until 2004,
and President from 2000 until 2003; Chair of the Board of Resource Capital Corp. (a publicly-traded real estate investment trust) since
its formation in 2005 until November 2009 and currently serves on its board; and Chair of the Board of Brandywine Construction &
Management, Inc. (a property management company) since 1994. Mr. Cohen is the father of Jonathan Z. Cohen. Mr. Cohen has been
active in the energy business for over 30 years. Mr. Cohen’s strong financial and energy industry experience, along with his deep
knowledge of the company resulting from his long tenure with the company and its predecessors, enables Mr. Cohen to provide
valuable perspectives on many issues facing the company. Mr. Cohen’s service on the Board of our general partner creates an
important link between management and the Board and provides the company with decisive and effective leadership. Mr. Cohen’s
extensive experience in founding, operating and managing public and private companies of varying size and complexity enables him
to provide valuable expertise to the company. Additionally, among the reasons for his appointment as a director, Mr. Cohen brings to
the Board the vast experience that he has accumulated through his activities as a financier, investor and operator in various parts of the
country. These diverse experiences have enabled Mr. Cohen to bring unique perspectives to the Board, particularly with respect to
business management, financial markets and financing transactions and corporate governance issues.
Jonathan Z. Cohen has served as our Executive Vice Chairman since August 2015 and the Executive Chairman of the Board of
our general partner since February 2015, and before that was Vice Chairman of our general partner since February 2012. Mr. Cohen
has served as the Executive Vice Chairman of the board of the general partner of Atlas Growth Partners, L.P. since its inception in
2013. Mr. Cohen served as Executive Chairman of the Board of Atlas Energy’s general partner from January 2012 until February
2015. Before that, he served as Chairman of the Board of Atlas Energy’s general partner from February 2011 until January 2012 and
as Vice Chairman of the Board of its general partner from its formation in January 2006 until February 2011. Mr. Cohen served as
chairman of the executive committee of Atlas Energy’s general partner from 2006 until February 2015. Mr. Cohen was the Vice
Chairman of the Board of Atlas Energy, Inc. from its incorporation in September 2000 until February 2011. Mr. Cohen was the
Executive Vice Chair of the managing board of Atlas Pipeline GP from its formation in 1999 until February 2015. Mr. Cohen was the
Vice Chairman of the Board of Atlas Energy Resources, LLC and its manager, Atlas Energy Management, Inc. from their formation in
June 2006 until February 2011. Mr. Cohen has been a senior officer of Resource America, Inc. (a publicly-traded specialized asset
management company) since 1998, serving as the Chief Executive Officer since 2004, President since 2003 and a director since 2002.
Mr. Cohen has been Chief Executive Officer, President and a director of Resource Capital Corp. since its formation in 2005.
Mr. Cohen is a son of Edward E. Cohen. Mr. Cohen’s extensive knowledge of the company resulting from his long length of service
with the company and its predecessors, as well as his strong financial and industry experience, allow him to contribute valuable
perspectives on many issues facing the company. Mr. Cohen’s service on the Board of our general partner creates an important link
between management and the Board and provides the company with decisive and effective leadership. Mr. Cohen’s involvement with
public and private entities of varying size, complexity and focus and raising debt and equity for such entities provides him with
extensive experience and contacts that are valuable to the company. Additionally, among the reasons for his appointment as a director,
Mr. Cohen’s financial, business, operational and energy experience as well as the experience that he has accumulated through his
activities as a financier and investor, add strategic vision to our general partner’s Board to assist with our growth, operations and
development. Mr. Cohen is able to draw upon these diverse experiences to provide guidance and leadership with respect to exploration
and production operations, capital markets and corporate finance transactions and corporate governance issues.
Mark C. Biderman has served as a director of our general partner since February 2015. Mr. Biderman served as a director of
Atlas Energy’s general partner from February 2011 to February 2015. Before that, he was a director of Atlas Energy, Inc. from July
2009 until February 2011. Mr. Biderman was Vice Chair of National Financial Partners Corp. (a publicly-traded financial services
company) from September 2008 to December 2008. Before that, from November 1999 to September 2008, he was National
Financial’s Executive Vice President and Chief Financial Officer. From May 1987 to October 1999, he served as Managing Director
and Head of the Financial Institutions Group at CIBC World Markets Group (an investment banking firm) and its predecessor,
Oppenheimer & Co., Inc. Mr. Biderman has served as a director and chair of the audit committee of Full Circle Capital Corporation (a
publicly-traded investment company), as well as a member of its corporate governance and nominating committee, since August 2010.

154
Mr. Biderman has served as a director, and chair of the compensation committee of Apollo Commercial Real Estate Finance, Inc. (a
publicly-traded commercial real estate finance company) as well as a member of its audit committee, since November 2010. He has
also served as a director and chair of the audit committee and as a member of the nominating and corporate governance committee of
Apollo Residential Mortgage, Inc. (a publicly-traded residential real estate finance company) since July 2011. Mr. Biderman is a
Chartered Financial Analyst. Mr. Biderman brings over 40 years’ of business and financial experience to our board of directors,
including his service as a chief financial officer for over eight years. Mr. Biderman also brings more than ten years of collective
service on various boards of directors as well as his service on the audit committees of four other companies, including our general
partner. In addition, our general partner’s board of directors benefits from his business acumen and valuable financial experience.
Dolly Ann (“DeAnn”) Craig has served as a director of our general partner since March 2012. Dr. Craig served as a consultant
to Atlas Energy from April 2011 to January 2012. Dr. Craig has been an Adjunct Professor in the Petroleum Engineering Department
of the Colorado School of Mines since January 2009 and a member of the Colorado Oil and Gas Conservation Commission since
March 2009. Dr. Craig was the Senior Vice President – Asset Assessment with CNX Gas Corporation from September 2007 until
February 2009, and President of Phillips Petroleum Resources (a Canadian subsidiary of Phillips Petroleum) and Manager of
Worldwide Drilling and Production of Phillips Petroleum from July 1992 to October 1996. Dr. Craig was a director for Samson Oil &
Gas Limited from July 2011 through January 2016 and served as the chair of its audit committee as well as a member of its
compensation committee. Dr. Craig is a Past-President of the Society of Petroleum Engineers (“SPE”), Past-President of the Society
of Petroleum Engineers’ Foundation, and a Past-President of the American Institute of Mining, Metallurgical, and Petroleum
Engineers. Dr. Craig was awarded SPE Honorary Membership in 2015, the Society’s highest honor. Dr. Craig serves as chair of our
general partner’s environmental, health and safety committee. Dr. Craig is a member of the National Association of Corporate
Directors and is a Registered Professional Engineer in the State of Colorado. Dr. Craig brings to the board of directors of our general
partner a strong technical and operational background and practical expertise in issues relating to exploration and production activities.
Dr. Craig’s experience, particularly her background in petroleum engineering, and her knowledge of our operations resulting from her
work as a consultant to us, benefits the Board. In addition, Dr. Craig provides leadership to the board of directors of our general
partner with respect to energy policy issues, owing to her experience as a member of the Colorado Oil and Gas Conservation
Commission.
Dennis A Holtz has served as a director of our general partner since February 2015 and has served as lead independent director
since April 2015. Mr. Holtz served as a director of Atlas Energy’s general partner from February 2011 until February 2015. Before
that, he was a director of Atlas Energy, Inc. from February 2004 to February 2011. Mr. Holtz maintained a corporate and real estate
law practice in Philadelphia and New Jersey from 1988 until his retirement in January 2008. During that period, Mr. Holtz was
counsel for or corporate secretary of numerous private and public business entities, and this extensive experience with corporate
governance issues was the reason he was chosen as chair of our general partner’s nominating and governance committee. As a
licensed attorney with over 50 years of business experience, Mr. Holtz offers a unique and invaluable perspective into corporate
governance matters. Additionally, Mr. Holtz has extensive knowledge of the energy industry, having served as a director of former
affiliated companies for nine years.
Walter C. Jones has served as a director of our general partner since February 2015. Mr. Jones served as a director of Atlas
Energy’s general partner from October 2013 until February 2015. Since November 2013, Mr. Jones has been the managing director of
the Jones Pohl Group, an investment firm based in Dubai, UAE, that invests in clean energy projects, primarily based in developing
and developed markets around the globe. JPG is also the majority shareholder of a Dubai-based geothermal energy developer, RG
Safa Energy. From April 2010 to October 2013, Mr. Jones served as the U.S. Executive Director and Chief-of-Mission to the African
Development Bank in Tunis, Tunisia, having been nominated for the position by President Barack Obama in 2009 and confirmed by
the U.S. Senate in 2010. In that position, he represented the United States on the African Development Bank’s Board of Directors, and
served as chair of the bank’s audit committee and vice-chair of both the ethics and development effectiveness committees. From June
2005 until May 2007, Mr. Jones served as the Head of Private Equity and General Counsel at GRAVITAS Capital Advisors, LLC (an
independent advisory firm). From May 1994 to May 2005, and then again from September 2007 until April 2010, Mr. Jones was with
the Overseas Private Investment Corporation, where he served as Manager for Asia, Africa, the Middle East, Latin America and the
Caribbean, as well as a Senior Investment Officer in the Finance Department. Prior to that, Mr. Jones was an International Consultant
at the Washington, D.C. firm of Neill & Co. Mr. Jones began his career at the law firm of Sidley & Austin where he was a transactions
attorney specializing in leveraged buyouts. Mr. Jones is a seasoned energy company director, having previously served as a director
and chair of the audit committee of Atlas Energy Resources, LLC from December 2006 until September 2009 and a director of Atlas
Energy, Inc. from September 2009 until March 2010. Mr. Jones’ combination of private and public sector experience, as well as his
international work, has afforded him a unique combination of management and leadership experience. Our general partner’s board of
directors also benefits from his investment and transaction expertise as well as his valuable financial experience.
Jeffrey F. Kupfer has served as a director of our general partner since February 2015. Mr. Kupfer served as a director of Atlas
Energy’s general partner from March 2014 until February 2015. Since October 2009, he has been an Adjunct Professor of Policy and
Management at Carnegie Mellon University’s H. John Heinz III College. From February 2011 to January 2014, Mr. Kupfer served as
155
a senior advisor for policy and government affairs at Chevron and from September 2009 to February 2011, Mr. Kupfer served as a
Senior Vice President at Atlas Energy, Inc. Before that, Mr. Kupfer held a number of high level positions in the U.S. Department of
Energy. From March 2008 to January 2009, he was the Acting Deputy Secretary and Chief Operating Officer and from October 2006
to March 2008, he was the Chief of Staff. Mr. Kupfer also worked in the White House as a Special Assistant to the President for
Economic Policy in 2006, as the Executive Director of the President’s Panel on Federal Tax Reform in 2005, and as Deputy Chief of
Staff at the U.S. Treasury Department from 2001 to 2005. Mr. Kupfer brings to the board of directors of our general partner extensive
experience in the energy industry, as well his perspective as a former senior official in the U.S. government, which we view as
complementary to the industry perspective of other members of the board of directors.
Ellen F. Warren has served as a director of our general partner since February 2015. Ms. Warren served as a director of Atlas
Energy’s general partner from February 2011 until February 2015. Before that, she was a director of Atlas Energy, Inc. from
September 2009 until February 2011. She is founder and President of OutSource Communications, a marketing communications firm
that services corporate and nonprofit clients. Prior to founding OutSource Communications in August 2005, she was President of Levy
Warren Marketing Media, a public relations and marketing firm she co-founded in March 1998. She was previously Vice President of
Marketing/Communications for Jefferson Bank (a Philadelphia-based financial institution) from September 1992 to February 1998,
and President of Diversified Advertising, Inc. (an advertising and marketing firm) from December 1984 to September 1992, where she
provided marketing services to various industries, including the energy industry. Ms. Warren is a seasoned energy company director
who brings her extensive experience as an independent member of the boards of Atlas Energy, Inc., and Atlas Energy Resources, LLC
where she chaired a special committee, to our general partner’s board of directors. As a member of the National Association of
Corporate Directors, Ms. Warren also offers expertise in corporate governance matters. Ms. Warren has 35 years of experience in
public relations, corporate communications, crisis communications and marketing, and as the founder and president of various
marketing communications firms, she is uniquely positioned to provide leadership to the board of directors in public relations and
communications matters. Ms. Warren also brings valuable management, strategic planning, communication, community involvement
and leadership skills to our general partner’s board of directors.
Daniel C. Herz has served as our Chief Executive Officer since August 2015 and as President of our general partner since April
2015. Mr. Herz has served as President and a director of the general partner of Atlas Growth Partners, L.P. since its inception in 2013.
Mr. Herz served as Senior Vice President of Corporate Development and Strategy of our general partner from March 2012 to April
2015. Mr. Herz served as Senior Vice President of Corporate Development and Strategy of Atlas Energy’s general partner from
February 2011 until February 2015. Mr. Herz was Senior Vice President of Corporate Development of Atlas Pipeline Partners GP,
LLC from August 2007 until February 2015. He also was Senior Vice President of Corporate Development of Atlas Energy, Inc. and
Atlas Energy Resources, LLC from August 2007 until February 2011. Before that, Mr. Herz was Vice President of Corporate
Development of Atlas Energy, Inc. and Atlas Pipeline Partners GP, LLC from December 2004 and of Atlas Energy’s general partner
from January 2006.
Mark D. Schumacher has served as our President since April 2015 and as a Senior Vice President of our general partner since
April 2015. Mr. Schumacher served as Chief Operating Officer of our general partner from October 2013 to April 2015. Mr.
Schumacher has been the Executive Vice President of Operations of the general partner of Atlas Growth Partners, L.P. since its
inception in 2013. He has served as Executive Vice President of Atlas Energy, L.P. from July 2012 to October 2013. From August
2008 to July 2012, Mr. Schumacher served as President of Titan Operating, LLC, which we acquired in July 2012. From November
2006 until August 2008, Mr. Schumacher served as President of Titan Resources, LLC, which built an acreage position in the Barnett
Shale that it sold to XTO Energy in October 2008. From February 2005 to November 2006, Mr. Schumacher served as the Team Lead
of EnCana Oil & Gas (USA) Inc. where he was responsible for Encana’s Barnett Shale development. Mr. Schumacher was an
engineer with Union Pacific Resources from 1984 to 2000. Mr. Schumacher has over 29 years of experience in drilling, production
and reservoir engineering management, operations and business development in East Texas, Austin Chalk, Barnett Shale, Mid-
Continent, the Rockies, the Gulf of Mexico, Latin America and Canada.
Jeffrey M. Slotterback has served as our Chief Financial Officer since September 2015. Mr. Slotterback has served as Chief
Financial Officer of our general partner since September 2015 and served as its Chief Accounting Officer from March 2012 to
October 2015. Mr. Slotterback has also served as the Chief Financial Officer of the general partner of Atlas Growth Partners, L.P.
since September 2015 and served as its Chief Accounting Officer from its inception in 2013 to October 2015. Mr. Slotterback served
as Chief Accounting Officer of Atlas Energy’s general partner from March 2011 until February 2015. Mr. Slotterback was the
Manager of Financial Reporting for Atlas Energy, Inc. from July 2009 until February 2011 and then served as the Manager of
Financial Reporting for Atlas Energy GP, LLC from February 2011 until March 2011. Mr. Slotterback served as Manager of Financial
Reporting for both Atlas Energy GP, LLC and Atlas Pipeline Partners GP, LLC from May 2007 until July 2009. Mr. Slotterback was a
Senior Auditor at Deloitte and Touche, LLP from 2004 until 2007, where he focused on energy and health care clients.
Mr. Slotterback is a Certified Public Accountant.

156
Freddie M. Kotek has served as our Senior Vice President of the Investment Partnership Division since August 2015 and
served as Senior Vice President of Investment Partnership Division of our general partner since March 2012. Mr. Kotek has also
served as Executive Vice President and a director of the board of directors of the general partner of Atlas Growth Partners, L.P. since
its inception in 2013. Mr. Kotek served as Senior Vice President of the Investment Partnership Division of Atlas Energy’s general
partner from February 2011 until February 2015. Mr. Kotek was an Executive Vice President of Atlas Energy, Inc. from February
2004 until February 2011 and served as a director from September 2001 until February 2004. Mr. Kotek also was Chief Financial
Officer of Atlas Energy, Inc. from February 2004 until March 2005. Mr. Kotek has been Chairman of Atlas Resources, LLC since
September 2001 and Chief Executive Officer and President since January 2002. Mr. Kotek was a Senior Vice President of Resource
America, Inc. from 1995 until May 2004 and President of Resource Leasing, Inc. (a wholly owned subsidiary of Resource America,
Inc.) from 1995 until May 2004.
Lisa Washington has been our Vice President, Chief Legal Officer and Secretary since August 2015 and served as Senior Vice
President of our general partner since September 2015, Chief Legal Officer and Secretary of our general partner since February 2012
and served as Vice President of our general partner from February 2015 to September 2015. Ms. Washington has served as Chief
Legal Officer and Secretary of the general partner of Atlas Growth Partners, L.P. since its inception in 2013. Ms. Washington served
as Chief Legal Officer and Secretary of Atlas Energy GP, LLC from January 2006 to October 2009, and as a Senior Vice President
from October 2008 to October 2009, and as Vice President, Chief Legal Officer and Secretary from February 2011 to February 2015.
Ms. Washington served as Chief Legal Officer and Secretary of Atlas Pipeline Partners GP, LLC from November 2005 to October
2009, a Senior Vice President from October 2008 to October 2009 and a Vice President from November 2005 until October 2008.
Ms. Washington served as Chief Legal Officer and Secretary of Atlas Energy, Inc. from November 2005 until February 2011, a Senior
Vice President from October 2008 until February 2011, and a Vice President from November 2005 until October 2008.
Ms. Washington served as Chief Legal Officer and Secretary of Atlas Energy Resources, LLC from 2006 until February 2011, a
Senior President from July 2008 until February 2011 and a Vice President from 2006 until July 2008. From 1999 to 2005,
Ms. Washington was an attorney in the business department of the law firm of Blank Rome LLP.
Matthew Finkbeiner has been our Chief Accounting Officer since October 2015. Mr. Finkbeiner has been the Chief
Accounting Officer of our general partner and the general partner of Atlas Growth Partners, L.P. since October 2015. Mr. Finkbeiner
has held positions with Deloitte & Touche LLP, including Audit Senior Manager from September 2010 until joining us in October
2015, Audit Manager from September 2007 to September 2010, and Audit Senior/Staff from September 2002 until September 2007.
While at Deloitte & Touche LLP, Mr. Finkbeiner managed audits for a diversified base of clients in the oil and gas industry, including
master limited partnerships. Mr. Finkbeiner is a Certified Public Accountant.
Dave Leopold has served as our Chief Operating Officer since April 2015. Mr. Leopold previously served as Senior Vice
President of Operations from December 2013 until April 2015 and served as Regional Vice President of Operations from March 2013
to December 2013. Mr. Leopold has been the Vice President of Operations of the general partner of Atlas Growth Partners, L.P. since
its inception in 2013. From March 2008 to February 2013, Mr. Leopold was the Operations Manager for Chesapeake Energy in Fort
Worth, Texas where he led the Barnett Shale operations team to become the second largest producer in the play. From August 2000 to
September 2006, Mr. Leopold held various management positions at Anadarko Petroleum Corporation, most recently serving as
Production Engineering Manager over the Austin Chalk, Bossier Shale and what is now known as the Eagle Ford Shale. From 1991 to
2000, Mr. Leopold held various engineering and management roles with Union Pacific Resources in Fort Worth, Texas. From 1987 to
1991, he held drilling and reservoir engineering roles with Plains Petroleum Operating Company in Kansas and Colorado.
Our general partner’s board of directors is comprised of individuals who bring diverse but complementary skills and experience
to oversee our business. Our directors collectively have a strong background in energy, finance, law, accounting and management.
Based upon the experience and attributes of the directors discussed herein, our board of our general partner determined that each of the
directors should, as of the date hereof, serve on the board of our general partner.
Section 16(a) Beneficial Ownership Reporting Compliance
Section 16(a) of the Securities Exchange Act of 1934 requires executive officers and board members of our general partner and
persons who beneficially own more than 10% of a registered class of our equity securities to file reports of ownership and changes in
ownership with the Securities and Exchange Commission and to furnish us with copies of all such reports.
Based solely upon our review of reports received by us, or representations from certain reporting persons that no filings were
required for those persons, we believe that during fiscal year 2015 our executive officers and our general partner’s directors and
persons who beneficially owned more than 10% of our common units complied with all applicable filing requirements.

157
Committees of the Board of Directors of our General Partner
The standing committees of the board of directors of our general partner (the “board”) are the Audit Committee, the
Compensation Committee, the Nominating and Governance Committee, the Investment Committee and the Environment, Health and
Safety Committee.
Audit Committee. The Audit Committee’s duties include recommending to the board of directors of our general partner the
independent public accountants to audit our financial statements and establishing the scope of, and overseeing, the annual audit. The
committee also approves any other services provided by public accounting firms. The Audit Committee provides assistance to the
board of directors of our general partner in fulfilling its oversight responsibility to the unitholders, the investment community and
others relating to the integrity of our financial statements, our compliance with legal and regulatory requirements, the independent
auditor’s qualifications and independence and the performance of internal audit function. The Audit Committee oversees our system
of disclosure controls and procedures and system of internal controls regarding financial, accounting, legal compliance and ethics that
our management and the board of directors of our general partner have established. In doing so, it is the responsibility of the Audit
Committee to maintain free and open communication between the committee and the independent auditors, internal accounting
function and our management. In accordance with the Sarbanes-Oxley Act of 2002, the Audit Committee has adopted procedures for
the receipt, retention and treatment of complaints regarding accounting, internal accounting controls, and auditing matters and to allow
for the confidential, anonymous submission by employees and others of concerns regarding questionable accounting or auditing
matters. All of the members of the Audit Committee meet the independence standards established by the NYSE and the board. The
board of directors of our general partner has adopted a written charter for the Audit Committee. The members of the Audit Committee
are Mr. Biderman, Mr. Jones and Mr. Kupfer. Mr. Biderman is the chairman and has been determined by the board of directors of our
general partner to be an “audit committee financial expert,” as defined by SEC rules. Mr. Biderman serves on the audit committee of
more than three public companies. The board of directors of our general partner has determined that Mr. Biderman’s simultaneous
service on the audit committees of more than three public companies will not impair his ability to serve effectively on our general
partner’s audit committee.
Compensation Committee. The principal functions of the Compensation Committee are to assist the board of directors in
carrying out its responsibilities with respect to compensation. The Compensation Committee evaluates the compensation paid or
payable to the chief executive officer and our other named executive officers. The Compensation Committee reviews compensation
paid or payable under employee qualified benefit plans, employee stock option and restricted stock option plans, under individual
employment agreements, and executive compensation and incentive programs. The Compensation Committee has the sole authority
to select, retain and/or terminate independent compensation advisors. Ms. Warren and Messrs. Biderman and Holtz are the members
of the Compensation Committee, with Ms. Warren serving as the chair. The board of directors has determined that each member of the
Compensation Committee is independent, as defined by the rules of the NYSE and in accordance with the independence standards
adopted by the board. In addition, the members of the Compensation Committee qualify as “non-employee directors” for purposes of
Rule 16b-3 under the Exchange Act.
Nominating and Governance Committee. The principal functions of the Nominating and Governance Committee are to recommend to the board the criteria for members of the board and to identify individuals who meet such criteria, and recommend such
individuals to the board for election to fill vacancies on the board of directors of our general partner as well as on the board of
managers of Atlas Resource Partners Holdings (“ARP Holdings”); review all compensation paid to directors, in cash or in equity
grants, and, on a biannual basis, recommend changes to such compensation, if appropriate; establish procedures for the annual self-
assessment by directors set forth by the NYSE, and implement and supervise each self-assessment; and periodically review our
formation documents and suggest revisions to them. Ms. Warren and Messrs. Holtz and Kupfer are the members of the Nominating
and Governance Committee, with Mr. Holtz acting as the chair. The board of directors of our general partner has determined that each
of the members of the Nominating and Governance Committee is independent, as defined by the rules of the NYSE and in accordance
with the independence standards adopted by the board.
Investment Committee. The principal functions of the Investment Committee are to assist the board in reviewing management
investment practices, policies, strategies, transactions and performance, as well as evaluating and monitoring existing and proposed
investments. Messrs. Biderman, W. Jones and Kupfer are the members of the Investment Committee, with Mr. Jones acting as the
chair. The board of directors has determined that each of the members of the Investment Committee is independent, as defined by the
rules of the NYSE and in accordance with any independence standards adopted by the board.
Environment, Health and Safety Committee. The Environment, Health and Safety Committee assists the board of directors of
our general partner in determining whether we have appropriate policies and management systems in place with respect to
environment, health and safety and related matters. The committee monitors the adequacy of our policies and management for
addressing environment, health and safety matters consistent with prudent exploration and production industry practices. The
Environment, Health and Safety Committee monitors and reviews compliance with applicable environment, health and safety laws,
rules and regulations. The committee reviews actions taken by management with respect to deficiencies identified or improvements
158
recommended. The members of the Environment, Health and Safety Committee are Dr. Craig, Ms. Warren and Messrs. Holtz and
Kupfer. Dr. Craig serves as chair of the committee. The board of directors of our general partner has determined that each of the
members of the Environment, Health and Safety Committee is independent, as defined by the rules of the NYSE and in accordance
with the independence standards adopted by the board.
Board of Managers of Atlas Resource Partners Holdings, LLC
Atlas Resource Partners Holdings, LLC (“ARP Holdings”), formerly known as Atlas Energy Holdings Operating Company,
LLC, is a wholly-owned subsidiary of us. In May 2015, we, as sole member of ARP Holdings, adopted the Amended and Restated
Limited Liability Company Agreement of ARP Holdings which provides that ARP Holdings’ managerial power and authority be
delegated to a board of managers.
The following table sets forth information with respect to those persons who serve as the board of managers of ARP Holdings:
NAME AGE POSITION
Edward E. Cohen ............................... 77 Chairman
Jonathan Z. Cohen ............................. 45 Chief Executive Officer and Manager
Mark D. Schumacher ......................... 53 Manager
Daniel C. Herz ................................... 39 President and Manager
Carlton M. Arrendell .......................... 54 Manager
Jeffrey C. Key .................................... 50 Manager
Tony C. Banks ................................... 61 Manager
See “– Board of Directors of Our General Partner and our Officers” for biographical information on Messrs. E. Cohen, J. Cohen, Herz
and Schumacher”.
Carlton M. Arrendell has been a director of ARP Holdings since May 2015. Mr. Arrendell served as a director of Atlas
Energy’s general partner from February 2011 until the Atlas Energy Merger in February 2015. Before that, he served as a director of
Atlas Energy, Inc. from February 2004 until February 2011. Mr. Arrendell has been the Chief Investment Officer and a Vice
President of Full Spectrum of NY LLC since May 2007. Before joining Full Spectrum, Mr. Arrendell was a special consultant to the
AFL-CIO Investment Trust Corporation following six years of service as Investment Trust Corporation’s Chief Investment Officer.
Jeffrey C. Key has been a director of ARP Holdings since May 2015. Mr. Key served as a director of our general partner from
February 2012 until the Atlas Energy Merger in February 2015. Mr. Key has been the Managing Partner of his own consulting firm,
Key Technology Partners, LLC, which provides strategy development and planning services to communications and networking
technology companies since August 2013 and served in the same role from 2002 to 2004. From March 2004 to September 2013,
Mr. Key was Vice President, Corporate Development for Tekelec, a supplier of telecommunications equipment. From 2000 to 2002,
Mr. Key was a Managing Director of Investment Banking at Bear, Stearns & Co. Inc. Mr. Key served as an independent member of
the board of Atlas Energy from 2006 until February 2011.
Tony C. Banks has been a director of ARP Holdings since May 2015. Mr. Banks served on the board of directors of Atlas
Pipeline Partners GP, LLC from November 1999 to February 2015. Mr. Banks has been Managing Director of Banks Advisors since
December 2015, providing business advisory services to energy and energy technology firms. Prior to December 2015, Mr. Banks
was founder, President and Chief Executive Officer from August 2012 to November 2015 of Star Energy Partners, LLC, a retail
provider of electricity, natural gas and energy related products and services to residential and business customers in competitive
markets throughout the U.S. Prior to that, from February 2011 to August 2012, Mr. Banks was Vice President of Competitive Market
Policies of FirstEnergy Solutions Corp., a subsidiary of FirstEnergy Corporation, a public utility, and from October 2009 to February
2011, he served as its Vice President of Product and Market Development. From March 2007 to October 2009, Mr. Banks served as
Vice President of Business Development, Performance & Management for FirstEnergy Corporation and from December 2005 to
February 2007, Mr. Banks was its Vice President of Business Development. Mr. Banks first joined FirstEnergy Solutions, Corp., in
August 2004 as Director of Marketing and in August 2005 became Vice President of Sales & Marketing. Before joining FirstEnergy,
Mr. Banks was a consultant to utilities, energy service companies and energy technology firms. From 2000 through 2002, Mr. Banks
was President of RAI Ventures, Inc. and Chairman of the board of Optiron Corporation, an energy technology subsidiary of AEI. In
addition, Mr. Banks served as President of Atlas Pipeline Partners GP, LLC during 2000 and served as Chief Executive Officer and
President of Atlas Energy, Inc. from 1998 through 2000. He also served on the board of directors of TRM Corporation, a provider of
ATM services, from October 2006 to April 2008.

159
Conflicts Committee of Board of Managers of Atlas Resource Partners Holdings, LLC
Since our general partner’s board of directors also serves as our board of directors, in order to resolve conflicts of interest, the
board amended ARP Holdings’ limited liability company agreement to delegate its managerial power and authority with respect to
conflicts of interest and/or related party transactions, to a committee comprised of disinterested members of the ARP Holdings board
of managers. At such time, the board also amended our related party policy to provide that related party transactions anticipated to
exceed $120,000 must be approved, in advance, by the disinterested members of the board of managers of ARP Holdings. The
disinterested members of the board of managers constitute the conflicts committee of ARP Holdings. ARP Holdings, following the
approval of a related party transaction, is required to notify our general partner’s board of directors of such approval and provide the
board of directors with a summary of each related party transaction at the next meeting of the board of directors. See “Item 13: Certain
Relationships and Related Transactions, and Director Independence.” The disinterested members who comprise the conflicts
committee of the board of managers of ARP Holdings are Messrs. Arrendell, Banks, and Key with Mr. Banks acting as the chair. Our
general partner’s board of directors determined that each of the three disinterested members of the board of managers of ARP
Holdings, is independent with respect us, as defined by the rules of the New York Stock Exchange and the independence standards
adopted by our general partner’s board of directors.
Code of Business Conduct and Ethics, Partnership Governance Guidelines and Committee Charters
We have adopted a code of business conduct and ethics that applies to our principal executive officer, principal financial officer
and principal accounting officer, as well as to persons performing services for us generally. We have also adopted partnership
governance guidelines. Our general partner has adopted charters for the audit committee, compensation committee and environment,
health and safety committee. We will make a printed copy of our code of ethics, our partnership governance guidelines and committee
charters available to any unitholder who so requests. Requests for print copies may be directed to us as follows: Atlas Resource
Partners, L.P., Park Place Corporate Center One, 1000 Commerce Drive, 4th
Floor, Pittsburgh, Pennsylvania 15275-1011, Attention:
Secretary. The code of business conduct and ethics, the partnership governance guidelines and the committee charters are also posted,
and any waivers we grant to our code of business conduct and ethics will be posted, on our website at www.atlasresourcepartners.com.
Role in Risk Oversight
General
The role in risk oversight of the board of directors of our general partner recognizes the multifaceted nature of risk management.
The board has empowered several of its committees with aspects of risk oversight. We administer our risk oversight function through
the Audit Committee, which monitors material enterprise risks, and the Environment, Health and Safety Committee, which assists in
determining whether appropriate policies and management systems are in place with respect to environment, health and safety and
related matters and monitors and reviews compliance with applicable environmental, health and safety laws, rules and regulations. In
order to assist in its oversight function, the Audit Committee oversaw the creation of the enterprise risk management committee
consisting of senior officers from our various divisions that are responsible for day-to-day risk oversight. The Audit Committee meets
with the members of the enterprise risk management committee as needed to discuss our risk management framework and related
areas. It also reviews any major transactions or decisions affecting our risk profile or exposure, and reviews with counsel legal
compliance and legal matters that could have a significant impact on our financial statements. The Audit Committee also oversees our
internal audit function and is responsible for monitoring the integrity and ensuring the transparency of our financial reporting
processes and systems of internal controls regarding finance, accounting and regulatory compliance. The Audit Committee
incorporates its risk oversight function into its regular reports to the board of directors of our general partner. The Environment,
Health and Safety Committee reviews actions taken by management with respect to deficiencies identified or improvements
recommended.
In addition to these committees’ role in overseeing risk management, the full board of directors of our general partner regularly
engages in discussions of the most significant risks that we face and how these risks are being managed. Our senior executives provide
regular updates about our strategies and objectives and the risks inherent within them at board and committee meetings and in regular
reports. Board and committee meetings also provide a venue for directors to discuss issues of concern with management. The board
and committees may call special meetings when necessary to address specific issues or matters that should be addressed before the
next regularly scheduled meeting. In addition, our directors have access to our management at all levels to discuss any matters of
interest, including those related to risk. Those members of management most knowledgeable of the issues will attend board meetings
to provide additional insight into items being discussed, including risk exposures.
Compensation Programs
Our general partner’s compensation policies and programs are intended to encourage those employees who provide services to
us to remain focused on both our short-term and long-term goals. Annual incentives are intended to tie a significant portion of each of
160
the named executive officer’s compensation to our annual performance and/or that of the divisions for which the officer is responsible.
Our Code of Business Conduct and Ethics, which applies to all our officers and our general partner’s directors, seeks to mitigate the
potential for inappropriate risk taking. We also prohibit hedging transactions involving our units so our officers and our general
partner’s directors cannot insulate themselves from the effects of our unit price performance.
Atlas Energy Group’s compensation committee, together with senior management, also reviews compensation programs and
benefits plans affecting employees generally (in addition to those applicable to executive officers who provide services to us), and
Atlas Energy Group has concluded that our compensation policies and practices do not create risks that are reasonably likely to have a
material adverse effect on the company. Atlas Energy Group also believes that its incentive compensation arrangements provide
incentives that do not encourage risk-taking beyond its ability to effectively identify and manage significant risks; are compatible with
effective internal controls and its and our risk management practices; and are supported by the oversight and administration of Atlas
Energy Group’s compensation committee with regard to executive compensation programs.
ITEM 11: EXECUTIVE COMPENSATION
COMPENSATION DISCUSSION AND ANALYSIS
For purposes of the following, the individuals listed below are collectively referred to as our, Atlas Energy Group’s “Named
Executive Officers” or “NEOs.” The amounts of their compensation that are allocated to us are disclosed in the tables following this
discussion and analysis.
• Daniel C. Herz, our Chief Executive Officer; President of Atlas Energy Group
• Jeffrey M. Slotterback, our Chief Financial Officer; Chief Financial Officer of Atlas Energy Group
• Edward E. Cohen, our Executive Chairman of the Board; Chief Executive Officer of Atlas Energy Group
• Jonathan Z. Cohen, our Executive Vice Chairman of the Board; Executive Chairman of the Board of Atlas Energy Group
• Mark D. Schumacher, our President; Senior Vice President of Atlas Energy Group
The following individuals served as NEOs immediately after the Separation but ceased to be employed by us by the end of 2015:
• Sean P. McGrath, Chief Financial Officer
• Matthew A. Jones, President—ARP
We did not, nor will in the future, directly compensate our NEOs. Because Atlas Energy employed our NEOs, decisions
relating to compensation for executive officers in 2014 and prior years were made by the Atlas Energy Compensation Committee.
Atlas Energy allocated the compensation of our executive officers between activities on behalf of us and activities on behalf of itself
and its other affiliates based upon an estimate of the time spent by such persons on activities for us and for Atlas Energy and its other
affiliates.
Following the Separation, in February 2015, Atlas Energy Group formed its Compensation Committee (“Compensation
Committee”), comprised solely of Atlas Energy Group independent directors, and became responsible for determining the
compensation to be paid to our NEOs pursuant to Atlas Energy Group’s compensation objectives and methodology. Atlas Energy
Group employs the same allocation process as Atlas Energy employed vis a vis our general partner and us.
The following sections of this Compensation Discussion and Analysis describe the compensation philosophy, policies and
practices from and after the February 2015 Separation as they apply to the Named Executive Officers identified above.
Compensation Program Objectives
An understanding of our general partner’s executive compensation program begins with the following program objectives:
Aligning the interests of executives and unitholders. The Compensation Committee seeks to align the interests of our
executives with those of our unitholders through equity-based compensation and executive unit ownership
requirements.

161
Linking rewards to performance. The Compensation Committee seeks to implement a pay-for-performance
philosophy by tying a significant portion of executives’ compensation to their achievement of goals that are linked to
our business strategy and each executive’s contributions towards the achievement of those goals.
Offering competitive compensation. The Compensation Committee seeks to offer an executive compensation
program that is competitive and that helps attract, motivate and retain top performing executives.
The Compensation Committee believes that a significant portion of executive compensation should be variable and based on
defined performance goals (i.e., “at risk”). The executive compensation program meets this objective by delivering compensation in
the form of equity and other performance-based awards.
Governance of Executive Compensation
COMPENSATION COMMITTEE
The Compensation Committee was formed at the end of February 2015 following the Separation and is comprised solely of
independent directors of the Atlas Energy Group board.
The Compensation Committee is responsible for designing the compensation objectives and methodology, and evaluating the
compensation to be paid to our NEOs. The Compensation Committee is also responsible for administering Atlas Energy Group’s stock
ownership guidelines and certain employee benefit plans, including incentive plans.
CHIEF EXECUTIVE OFFICER
The Atlas Energy Group Chief Executive Officer makes recommendations to the Compensation Committee regarding the salary,
bonus and incentive compensation component of each of the other NEO’s total compensation. The Atlas Energy Group Chief
Executive Officer provides the Compensation Committee with key elements of Atlas Energy Group’s and our NEOs’ performance
during the year or the applicable performance period to assist the committee in its determinations. The Atlas Energy Group Chief
Executive Officer, at the Compensation Committee’s request, might attend committee meetings to provide insight into our NEOs’
performance, as well as the performance of other comparable companies in the same industry. The Compensation Committee
determines and approves the Atlas Energy Group Chief Executive Officer’s compensation based upon its evaluation of his
performance.
INDEPENDENT COMPENSATION CONSULTANT
For 2015, the Compensation Committee engaged Mercer (US) Inc., a global compensation and benefits consulting firm and
wholly-owned subsidiary of Marsh & McLennan Companies, Inc. (“Marsh”), to provide information and objective advice regarding
executive compensation. Ultimately, all of the decisions with respect to our NEOs’ compensation are made by the Compensation
Committee.
At the request of the Compensation Committee, Mercer worked with Atlas Energy Group’s senior management to develop a
peer group in 2015 that reflected, to the greatest extent possible, Atlas Energy Group’s business mix and structure following the
Separation. The peer group is comprised of 17 energy companies, nine of which are oil and gas partnerships and eight of which are
upstream oil and gas companies. The entire peer group was used to gain broad perspective on compensation for Atlas Energy Group’s
and our industry segment using a fairly large data sample, while the nine partnerships (“partnership peers”) allowed the Committee to
gain a more focused perspective on compensation at publicly traded partnerships as well.
Immediately following the Separation, the Compensation Committee acknowledged the importance of awarding Atlas
Energy Group equity to retain and incentivize the NEOs and other employees. Therefore, it asked Mercer to conduct an analysis with
respect to proposed Atlas Energy Group Long-Term Incentive awards, taking into account the value of our long-term incentive awards
that had been previously granted. In its analysis, Mercer found that the annualized value of our proposed grants fell below the 25th
percentile relative to both peer references. Following receipt of Mercer’s analysis with respect to Atlas Energy Group’s proposed
long-term incentives to the NEOs, in June 2015, the Compensation Committee approved the proposed Atlas Energy Group equity
grants. See “Determination of 2015 Compensation Amounts—Long-Term Incentives.”
A critical criterion in the Compensation Committee’s selection of Mercer to provide executive and director compensation
consulting services was that Mercer does not provide any other executive compensation consulting services to Atlas Energy Group or
its affiliated companies, including us, other than insurance brokerage services provided by its parent company, Marsh. Atlas Energy
Group, its directors and our executive officers are also required to complete questionnaires on an annual basis, which allows Atlas
Energy Group and its subsidiaries, including us, to review whether there are any potential conflicts as a result of personal or business
162
relationships. There were no business or personal relationships between the consultants from Mercer who work with us, Atlas Energy
Group’s directors and our executive officers other than the executive compensation consulting described herein. The Compensation
Committee also determined that the reporting relationship and the compensation of Mercer were separate from, and not determined by
reference to Mercer’s or Marsh’s other lines of business or any other work for Atlas Energy Group and us. Further, the Committee is
aware that in the ordinary course of business we, Atlas Energy Group and its affiliates use Marsh’s insurance broker services, but it
does not monitor or approve those services.
TIMING OF COMPENSATION DECISION PROCESS
Immediately following the Separation, in consultation with the Atlas Energy Group Chief Executive Officer, the
Compensation Committee recommended that the base salaries of the NEOs at that time be reduced to reflect the post-Targa
transaction company. The Compensation Committee then engaged Mercer to develop a peer group and conduct a competitive analysis
with respect to proposed equity grants. See “Governance of Executive Compensation—Independent Compensation Consultant.”
Recognizing the importance of retaining executive talent, in consultation with Mercer, the Compensation Committee
reviewed and approved employment agreements for Messrs. E. Cohen, J. Cohen, Herz and Schumacher. See “Executive
Compensation—Employment Agreements.” The Compensation Committee, with input from management and Mercer, then worked
on developing the 2015 performance measurements under the Annual Incentive Plan for Senior Executives (the “Senior Executive
Plan”).
In January 2016, after the conclusion of the 2015 performance period, the Committee determined the threshold criteria in the
performance metrics had been met and approved variable pay awards under the Senior Executive Plan. At the same time, the
Compensation Committee made recommendations regarding base pay for the NEOs for 2016.
It is anticipated that before the end of the first quarter of 2016, the Compensation Committee will review and approve a
performance formula under the Senior Executive Plan for the 2016 performance period, which is the current year. We anticipate that
the Compensation Committee will evaluate 2016 performance and corresponding compensation following the end of 2016.
Elements of Our Compensation Program
Until the closing of the Targa transaction in February 2015, the Atlas Energy Compensation Committee was responsible for
making the compensation decisions for the NEOs of Atlas Energy. Additionally, as part of the Separation, Atlas Energy Group
assumed the 401(k) Plan, the Excess 401(k) Plan and the J. Cohen consulting agreement related to Lightfoot. See “Additional
Information Concerning Executive Compensation—Consulting Agreement with Mr. J. Cohen.”
BASE SALARY
Base salary is intended to provide fixed compensation to the NEOs for their performance of core duties that contribute to our
success. Base salaries represent one component of our compensation strategy and are not contingent upon the achievement of
performance metrics and/or intended to compensate individuals for performance which exceeds expectations.
ANNUAL INCENTIVES
Annual incentives are intended to tie a significant portion of each of the NEO’s compensation to Atlas Energy Group’s annual
performance and/or that of its subsidiaries or divisions for which the officer is responsible, including us. Generally, the higher the
level of responsibility of the executive within Atlas Energy Group, the greater is the incentive component of that executive’s target
total cash compensation. The Compensation Committee may recommend awards of performance-based variable pay and, on rare
occasions, discretionary bonuses.
PERFORMANCE-BASED VARIABLE PAY
Atlas Energy Group has an Annual Incentive Plan for Senior Executives, which we refer to as the Senior Executive Plan, to
award variable pay for achievement of predetermined performance measurements during a performance period. Going forward, it is
expected that the applicable performance period will be the current fiscal year; however, for 2015, the performance period began at the
end of February following the Separation and concluded at the end of 2015. During the 2015 performance period, each of the NEOs
participated in the Senior Executive Plan. Awards under the Senior Executive Plan may be paid in cash or in a combination of cash
and time-vesting equity.
163
As soon as was practicable after the Separation, the Compensation Committee approved the performance measurements for
the 2015 performance period. The measurements were in the areas of cost control, private channel fund raise, production and
environment, health and safety. The Committee determined that, outside of exceptional circumstances, no performance-based
variable pay would be made to any NEO unless Atlas Energy Group achieved a minimum threshold of at least three of the six
performance measurements during the performance period. Furthermore, since Atlas Energy Group acquired the exploration and
production assets through the Separation, the performance measurements involving a 3-year average were based upon the performance
results of us, Atlas Energy and/or Atlas Growth Partners:
1. Cost control: The average Eagle Ford Shale Well authorization for expenditure for 2015 must be lower than 85% of
the 2014 Average Eagle Ford Shale Well authorization for expenditure;
2. Cost control: Atlas Energy Group’s general and administrative expense for 2015 must be lower than the prior 3-
year average general and administrative expense;
3. Private Channel Fund Raise Performance: For 2015, Atlas Energy Group must achieve 75% of the prior 3-year
average of private channel fund raise;
4. Production Margin Performance: The 2015 value of Atlas Energy Group’s hedge positions realized during the year
must exceed the prior 3-year average value of commodity hedge positions;
5. Production Margin Performance: Atlas Energy Group’s 2015 production gross margin per mcfe must exceed the
prior 3-year average production gross margin per mcfe; and
6. Environmental: Atlas Energy Group shall have fewer reportable spills and fewer violations in 2015 than in 2014.
The Compensation Committee determined that if Atlas Energy Group achieved at least three of the six measurements listed
above, the Atlas Energy Group NEOs, who are also our NEOs, would be eligible to receive an award paid from a variable pay pool.
The maximum amount available to be paid in variable pay is equal to a maximum of 10% of Atlas Energy Group’s adjusted net
distributable cash flow for the 2015 calendar year period, calculated as the total operating subsidiary distributable cash flow less its
general and administrative expense (excluding bonus expense recognized during the period), plus other income, less preferred
payments, less stand-alone interest expense. For the purpose of the performance formulas, the operating subsidiary distributable cash
flow represents Atlas Energy Group’s ownership interest in the distributable cash flow of its operating subsidiaries, regardless of
whether such cash was actually distributed.
Pursuant to the Senior Executive Plan, the Compensation Committee had discretion to recommend reductions, but not
increases, in the maximum awards. The maximum award allocable to us, expressed as a percentage of Atlas Energy Group’s adjusted
distributable cash flow for 2015, for each participant was as follows (the percentage represents the portion of the Atlas Energy Group
maximum potential award, while the dollar value represents the amount allocable to us): Mr. Herz, 1.70% ($1,120,000); Mr.
Slotterback, 0.70% ($490,000); Mr. E. Cohen, 3.20% ($2,170,000); Mr. J. Cohen, 3.20% ($2,170,000); and Mr. Schumacher, 1.20%
($840,000). While the amount of the final maximum variable pay pool allocable to us was $6,790,000, the portion of the actual
awards made to the NEOs allocable to us totaled $1,645,000, or approximately 24% of the maximum variable pay pool.
DISCRETIONARY BONUSES
In exceptional circumstances, discretionary bonuses could be awarded to recognize individual and group performance
without regard to limitations otherwise in effect. The Compensation Committee did not award any discretionary bonuses with respect
to our performance for the applicable performance period.
LONG-TERM INCENTIVES
The Compensation Committee believes that Atlas Energy Group’s and our long-term success depends upon aligning its and
our executives’ and unitholders’ interests. To support this objective, Atlas Energy Group provides our executives with the ability to
become significant equity holders via awards under the Atlas Resource Partners, L.P. 2012 Long-Term Incentive Plan, which we refer
to as our Plan. The Compensation Committee, which administers our Plan, may recommend grants of equity awards in the form of
options and/or phantom units. Generally, the unit options and phantom units vest over a three- or four-year period.
Our NEOs also are eligible to receive awards under the Atlas Energy Group 2015 Long-Term Incentive Plan which we refer
to as the Atlas Energy Group Plan.
164
Additional Information Concerning Executive Compensation
DEFERRED COMPENSATION
All of Atlas Energy Group’s employees may participate in its 401(k) plan, which is a qualified defined contribution plan
designed to help participating employees accumulate funds for retirement. This plan was originally known as the Atlas Energy 401(k)
Plan and was assumed by Atlas Energy Group in connection with the Separation. In February 2015, Atlas Energy Group also
assumed the Atlas Energy Executive Excess 401(k) Plan (now known as the “Deferred Compensation Plan”), a nonqualified deferred
compensation plan that was designed to permit individuals who exceeded certain income thresholds as established by the IRS and who
might be subject to compensation and/or contribution limitations under what was then the Atlas Energy 401(k) plan and is now the
Atlas Energy Group 401(k) Plan to defer an additional portion of their compensation. The purpose of the Deferred Compensation Plan
is to provide participants with an incentive for a long-term career with Atlas Energy Group by providing them with an appropriate
level of replacement income upon retirement. Under the Deferred Compensation Plan, a participant may contribute to an account an
amount up to 10% of annual cash compensation (which means a participant’s salary and non-performance-based bonus) and up to
100% of all performance-based bonuses. Atlas Energy Group is obligated to make matching contributions on a dollar-for-dollar basis
of the amount deferred by the participant subject to a maximum matching contribution equal to 50% of the participant’s base salary
for any calendar year. Atlas Energy Group does not pay above-market or preferential earnings on deferred compensation.
Participation in the Deferred Compensation Plan is available pursuant to the terms of an individual’s employment agreement or at the
designation of the Compensation Committee. During 2015, Messrs. E. Cohen and J. Cohen were the only participants in the Deferred
Compensation Plan. For further details, please see “2015 Nonqualified Deferred Compensation” table. A portion of both the deferred
amounts and the matching contributions are allocated to us.
NO HEDGING OF COMPANY STOCK
All of Atlas Energy Group’s employees are prohibited from hedging their company stock.
NO TAX GROSS-UPS
Atlas Energy Group does not provide tax reimbursements to our NEOs.
PERQUISITES
At the discretion of the Compensation Committee, Atlas Energy Group provided perquisites to our NEOs. In 2015, the benefits
provided to the NEOs were limited to providing automobile allowances or automobile-related expenses to Messrs. E. Cohen, Herz and
Schumacher.
CONSULTING AGREEMENT WITH MR. J. COHEN
We acquired Atlas Energy’s direct and indirect ownership interests in the Lightfoot entities as part of the assets and liabilities it
acquired in connection with the Targa transaction. As part of the transaction, Atlas Energy Group also assumed the obligations under
an agreement pursuant to which Mr. J. Cohen receives compensation in recognition of his role in negotiating and structuring its
investment and his continued service as chair of Lightfoot GP. Pursuant to the agreement, Mr. J. Cohen receives an amount equal to
10% of the distributions that Atlas Energy Group receives from the Lightfoot entities, excluding amounts that constitute a return of
capital.
Determination of 2015 Compensation Amounts
In January 2016, the Compensation Committee consulted with Mercer, with Atlas Energy Group’s Chief Executive Officer
participating, to evaluate Atlas Energy Group’s and our performance and to approve variable pay awards to NEOs as well as to review
base salaries for 2016. At the Committee’s request, Mercer provided the Compensation Committee with an analysis of the proposed
variable pay awards under the Senior Executive Plan and a benchmark of the proposed NEO base salaries for 2016 relative to the peer
group.
BASE SALARY
Immediately following the Targa merger and Separation, upon recommendation from Atlas Energy Group’s Chief Executive
Officer, the Compensation Committee approved the reduction of the 2014 base salaries of Messrs. E. Cohen, J. Cohen, Herz and
McGrath. The Compensation Committee recognized that Atlas Energy Group’s initial size was smaller than its predecessor and
165
approved reductions in the then NEOs base salaries to reflect that fact. During 2015, however, there were management changes that
necessitated further adjustments to base salaries.
In January 2016, the Compensation Committee engaged Mercer to conduct an analysis of historical short-term incentives and
benchmarking of base salaries of all of the NEOs using the market data from the 2015 market competitive assessment. The
Compensation Committee considered the analysis and benchmarking and approved increases to Messrs. E. Cohen and J. Cohen’s base
salaries not to 2014 levels but to bring their base salaries to the median of the peer group. The Compensation Committee recognized
the further increased role that Mr. Herz had undertaken in challenging times and approved an increase in his 2016 base salary to an
amount that is competitive with the peer group. The Compensation Committee maintained the base salaries of Messrs. Slotterback
and Schumacher at 2015 levels. Mr. Slotterback’s base salary was below the median of the peer group and Mr. Schumacher’s base
salary being competitive with the median.
The amounts reflected in the Summary Compensation Table reflect the amount of each NEOs’ base salary that was allocated
to us.
ANNUAL INCENTIVES
VARIABLE PAY AWARDS
After the end of the 2015 fiscal year, the Compensation Committee considered incentive awards pursuant to the Senior
Executive Plan based on performance during the 2015 performance period. In determining the actual amounts to be paid to the NEOs,
the Compensation Committee considered both individual and company performance. The Atlas Energy Group Chief Executive Officer
made recommendations of incentive award amounts based upon Atlas Energy Group’s performance as well as the performance of its
subsidiaries, including our performance; however, the Compensation Committee had the discretion to approve, reject or modify the
recommendations. Further, the Committee had the discretion to reduce, but not increase, the maximum variable pay awards available
under the Senior Executive Plan.
In making its determination with respect to variable pay awards to the NEOs, the Compensation Committee found that Atlas
Energy Group had achieved all six performance measures set forth in the performance formula. The Compensation Committee took
both Atlas Energy Group’s overall performance during the year together with the achievement of the performance measurements and,
while recognizing the strong performance during challenging times, ultimately awarded variable pay awards that were below the
maximum potential awards for each of the NEOs as follows: Mr. E. Cohen, 10% of maximum potential award, Mr. J. Cohen 8% of
maximum potential award, Mr. Herz, 63% of maximum potential award, Mr. Schumacher, 42% of maximum potential award; and Mr.
Slotterback, 43% of maximum potential award. The amount of the variable pay that was allocated to us was as follows: Mr. Herz—
$700,000; Mr. Slotterback—$210,000; Mr. E. Cohen—$210,000; Mr. J. Cohen—$175,000; and Mr. Schumacher—$350,000. The
amounts of the maximum potential awards allocable to us were: Mr. Herz—$1,120,000; Mr. Slotterback—$490,000; Mr. E.
Cohen—$2,170,000; Mr. J. Cohen—$2,170,000; and Mr. Schumacher—$840,000.
LONG-TERM INCENTIVES
In an effort to retain the NEOs and all other employees, in June 2015, the Compensation Committee granted Atlas Energy
Group phantom units to all of its employees and to the NEOs as follows: Mr. Herz—250,000 phantom units; Mr. Slotterback—35,000
phantom units; Mr. E. Cohen—250,000 phantom units; Mr. J. Cohen—250,000 phantom units; Mr. Schumacher—175,000 phantom
units; and Mr. McGrath—175,000. Mr. McGrath forfeited the award upon his departure. These awards are to vest one-third on each
anniversary of the grant. The Compensation Committee recognized that such continuity grants were critical to retention of executive
and other employees even in a “soft” energy market.
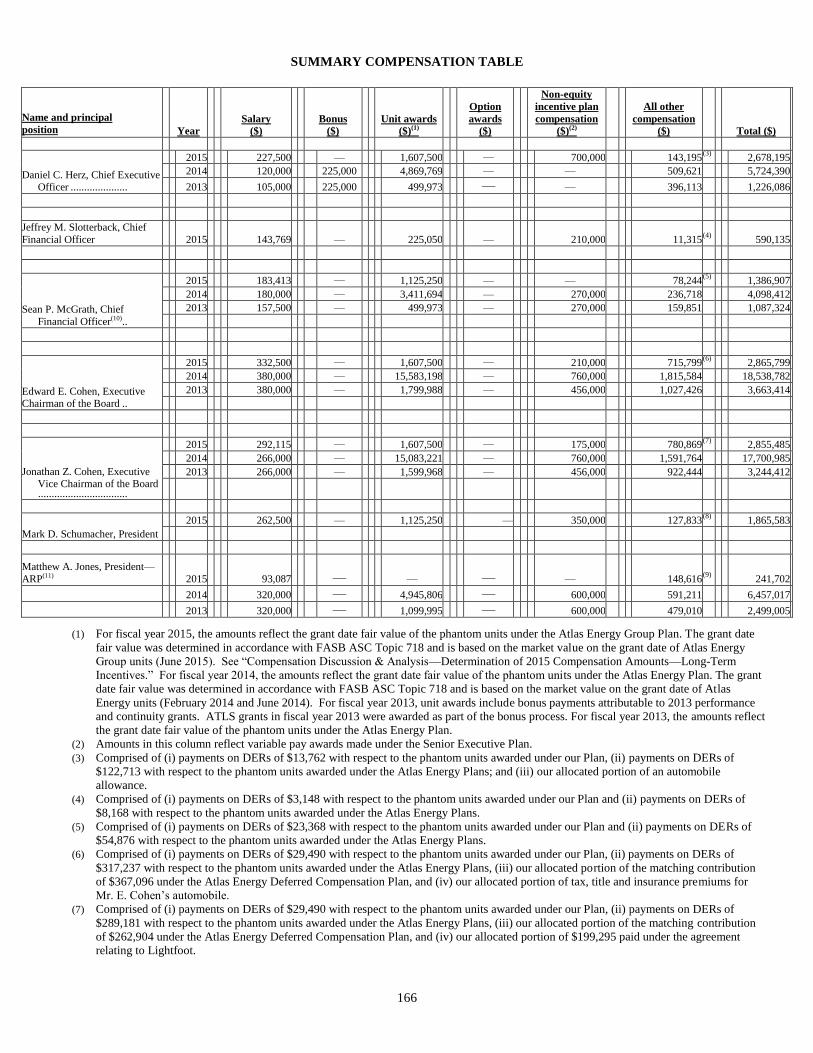
166
SUMMARY COMPENSATION TABLE
Name and principal
position
Year Salary
($) Bonus
($) Unit awards
($)(1)
Option
awards
($)
Non-equity
incentive plan
compensation
($)(2)
All other
compensation
($) Total ($)
Daniel C. Herz, Chief Executive Officer .....................
2015 227,500 — 1,607,500 — 700,000 143,195 (3)
2,678,195
2014 120,000 225,000 4,869,769 — — 509,621
5,724,390
2013 105,000 225,000 499,973 — — 396,113
1,226,086
Jeffrey M. Slotterback, Chief
Financial Officer
2015 143,769 — 225,050 — 210,000 11,315 (4)
590,135
Sean P. McGrath, Chief
Financial Officer(10) ..
2015 183,413 — 1,125,250 — — 78,244 (5)
1,386,907
2014 180,000 — 3,411,694 — 270,000 236,718
4,098,412
2013 157,500 — 499,973 — 270,000 159,851
1,087,324
Edward E. Cohen, Executive Chairman of the Board ..
2015 332,500 — 1,607,500 — 210,000 715,799 (6)
2,865,799
2014 380,000 — 15,583,198 — 760,000 1,815,584
18,538,782
2013 380,000 — 1,799,988 — 456,000 1,027,426
3,663,414
Jonathan Z. Cohen, Executive Vice Chairman of the Board .................................
2015 292,115 — 1,607,500 — 175,000 780,869 (7)
2,855,485
2014 266,000 — 15,083,221 — 760,000 1,591,764
17,700,985
2013 266,000 — 1,599,968 — 456,000 922,444
3,244,412
Mark D. Schumacher, President
2015 262,500 — 1,125,250 — 350,000 127,833 (8)
1,865,583
Matthew A. Jones, President—
ARP(11)
2015 93,087
— —
— — 148,616 (9)
241,702
2014 320,000 — 4,945,806 — 600,000 591,211
6,457,017
2013 320,000 — 1,099,995 — 600,000 479,010
2,499,005
(1) For fiscal year 2015, the amounts reflect the grant date fair value of the phantom units under the Atlas Energy Group Plan. The grant date
fair value was determined in accordance with FASB ASC Topic 718 and is based on the market value on the grant date of Atlas Energy
Group units (June 2015). See “Compensation Discussion & Analysis—Determination of 2015 Compensation Amounts—Long-Term
Incentives.” For fiscal year 2014, the amounts reflect the grant date fair value of the phantom units under the Atlas Energy Plan. The grant
date fair value was determined in accordance with FASB ASC Topic 718 and is based on the market value on the grant date of Atlas
Energy units (February 2014 and June 2014). For fiscal year 2013, unit awards include bonus payments attributable to 2013 performance
and continuity grants. ATLS grants in fiscal year 2013 were awarded as part of the bonus process. For fiscal year 2013, the amounts reflect
the grant date fair value of the phantom units under the Atlas Energy Plan.
(2) Amounts in this column reflect variable pay awards made under the Senior Executive Plan.
(3) Comprised of (i) payments on DERs of $13,762 with respect to the phantom units awarded under our Plan, (ii) payments on DERs of
$122,713 with respect to the phantom units awarded under the Atlas Energy Plans; and (iii) our allocated portion of an automobile
allowance.
(4) Comprised of (i) payments on DERs of $3,148 with respect to the phantom units awarded under our Plan and (ii) payments on DERs of
$8,168 with respect to the phantom units awarded under the Atlas Energy Plans.
(5) Comprised of (i) payments on DERs of $23,368 with respect to the phantom units awarded under our Plan and (ii) payments on DERs of
$54,876 with respect to the phantom units awarded under the Atlas Energy Plans.
(6) Comprised of (i) payments on DERs of $29,490 with respect to the phantom units awarded under our Plan, (ii) payments on DERs of
$317,237 with respect to the phantom units awarded under the Atlas Energy Plans, (iii) our allocated portion of the matching contribution
of $367,096 under the Atlas Energy Deferred Compensation Plan, and (iv) our allocated portion of tax, title and insurance premiums for
Mr. E. Cohen’s automobile.
(7) Comprised of (i) payments on DERs of $29,490 with respect to the phantom units awarded under our Plan, (ii) payments on DERs of
$289,181 with respect to the phantom units awarded under the Atlas Energy Plans, (iii) our allocated portion of the matching contribution
of $262,904 under the Atlas Energy Deferred Compensation Plan, and (iv) our allocated portion of $199,295 paid under the agreement
relating to Lightfoot.

167
(8) Comprised of (i) payments on DERs of $96,255 with respect to the phantom units awarded under our Plan, (ii) payments on DERs of
$24,858 with respect to the phantom units awarded under the Atlas Energy Plans; and (iii) our allocated portion of an automobile
allowance.
(9) Comprised of (i) payments on DERs of $19,660 with respect to the phantom units awarded under our Plan; (ii) payments on DERs of
$126,549 with respect to the phantom units awarded under the Atlas Energy Plans; and (iii) our allocated portion of an automobile
allowance.
(10) We announced in August 2015 that Mr. McGrath resigned from his position as Chief Financial Officer.
(11) We announced in April 2015 that Mr. Jones retired from his position as President—ARP.
2015 GRANTS OF PLAN-BASED AWARDS
Estimated possible payments
under non-equity incentive
plan awards(1)
Grant
date
All
other stock
awards:
Number
of units
All other
option
awards:
Number of
securities
underlying
options
Exercise
or base
price of
option
awards
($/Unit)
Grant date
fair value
of unit and
option
awards
($)(3) Name Threshold
($) Target
($) Maximum
($)
Daniel C. Herz -- -- 1,600,000 6/8/15 250,000 (2) — — 1,607,500 Jeffrey M.
Slotterback -- -- 700,000 6/8/15 35,000 (2) — — 225,050 Sean P. McGrath -- -- -- 6/8/15 175,000 (2) — — 1,125,250 Edward E. Cohen -- -- 3,100,000 6/8/15 250,000 (2) — — 1,607,500 Jonathan Z.
Cohen -- -- 3,100,000 6/8/15 250,000 (2) — — 1,607,500 Mark D. Schumacher -- -- 1,200,000 6/8/15 175,000 (2) — — 1,125,250 Matthew A. Jones -- -- -- -- -- -- -- --
(1)
Represents performance-based variable pay under the Senior Executive Plan that may be paid in cash and/or equity. As
discussed under “Compensation Discussion and Analysis—Elements of our Compensation Program—Annual Incentives” and
“—Performance-Based Bonuses,” the Compensation Committee set performance goals based on the distributable cash flow
and average production volumes, and established maximum awards, but not minimum or target amounts, for each eligible
NEO. (2)
Represents phantom units granted under Atlas Energy Group’s 2015 Long-Term Incentive Plan. (3)
The grant date fair value was calculated in accordance with FASB ASC Topic 718.
EMPLOYMENT AGREEMENTS AND POTENTIAL PAYMENTS UPON TERMINATION
OR CHANGE OF CONTROL
Atlas Energy Group has employment agreements with certain of our NEOs that provide for severance compensation to be paid
if their employment is terminated under certain conditions.
Terms Used
“Good reason” is defined in Mr. E. Cohen’s and Mr. J. Cohen’s employment agreements as:
• a material reduction in base salary;
• a demotion from his position;
• a material reduction in duties, it being deemed such a material reduction if we cease to be a public company unless we
become a subsidiary of a public company and,
• in the case of Mr. E. Cohen, he becomes the chief executive officer of the public parent immediately following the
applicable transaction;
• in the case of Mr. J. Cohen, he becomes the executive chairman of the board of directors of the public parent
immediately following the applicable transaction;
168
• failure to be elected to our board; or
• any material breach of the agreement by us.
“Good reason” is defined in Messrs. Herz’s and Schumacher’s employment agreements as:
• a material reduction in base salary;
• a demotion from his position and,
• in the case of Mr. Herz, it being deemed such a demotion if we or a successor entity ceases to be a public company;
• a material reduction in duties and
• in the case of Mr. Herz, it being deemed such a material reduction if the executive is not an officer of any successor
entity with the same or greater responsibilities as his current position;
• a requirement of the executive to relocate to a location more than 35 miles from the executive’s previous location;
• any material breach of the agreement.
“Cause” is defined in Mr. E. Cohen’s and Mr. J. Cohen’s employment agreements as:
• the executive is convicted of a felony, or any crime involving fraud or embezzlement;
• the executive intentionally and continually fails to perform his reasonably assigned duties (other than as a result of
incapacity due to physical or mental illness), which failure was materially and demonstrably detrimental to us and continues
for 30 days after written notice signed by a majority of our independent directors is delivered to the executive; or
• the executive is determined, through arbitration, to have materially breached the restrictive covenants in the agreement.
“Cause” is defined in Messrs. Herz’s and Schumacher’s employment agreements as:
• the executive commits any demonstrable and material act of fraud;
• illegal or gross misconduct that is willful and resulted in damage to our business or reputation;
• the executive is convicted of a felony or any crime involving fraud or embezzlement;
• failure to substantially perform his duties (other than as a result of physical or mental illness or injury) after written demand
and a reasonable opportunity to cure; or
• failure to follow reasonable written instructions which are consistent with his duties and not in violation of any applicable
law.
Daniel C. Herz
Effective September 4, 2015, we and Atlas Energy Group entered into an employment agreement with Mr. Herz to secure his
service as our Chief Executive Officer and as the President of Atlas Energy Group. The agreement has an initial term of two years,
however, beginning on the first anniversary of the agreement, the term will automatically renew daily so that on any day the
agreement shall have a then-remaining term of not less than one year, provided that such automatic extension shall cease upon our
written notice of our election to terminate the agreement at the end of the one-year period then in effect.
The agreement provides for an annual base salary of $350,000, which can be increased by our board in its discretion, but cannot
be decreased after any such increase. Mr. Herz is entitled to receive a bonus determined in accordance with procedures established by
our board or its compensation committee. Mr. Herz is eligible to receive grants of equity-based compensation as determined by our
board or its compensation committee, and is entitled to participate in all applicable incentive, savings, retirement programs and health
169
and welfare plans to the same extent as our other senior officers, directors or executives, and to receive reimbursement of work-related
administrative and travel expenses.
The agreement provides the following benefits in the event of a termination of employment:
• Upon a termination by us for cause or by Mr. Herz without good reason, he is entitled to receive payment of accrued but
unpaid base salary and (to the extent required to be paid under company policy) amounts of accrued but unpaid vacation, in
each case through the date of termination.
• Upon a termination of employment due to death or disability (defined as Mr. Herz being physically or mentally disabled for
more than 180 days in the aggregate or 90 consecutive days during any 365-day period and the board’s determination, in
good faith based upon medical evidence, that he is unable to perform his duties and services), all equity awards held by
Mr. Herz would accelerate and vest in full upon such termination, and in the case of options to purchase equity, such
options will become immediately exercisable and remain in effect and exercisable through their respective terms
(“Acceleration of Equity Vesting”), and Mr. Herz or his estate is entitled to receive (i) any portion of his base salary that
has been earned but unpaid through the date of termination and (to the extent required to be paid under company policy)
amounts of accrued but unpaid vacation through the date of termination, (ii) any accrued but unpaid cash incentive
compensation earned for any year prior to the year in which the termination occurs, and (iii) an amount representing the
cash incentive compensation opportunity awarded to Mr. Herz for the year in which the termination occurs, equal to the
cash incentive compensation earned by Mr. Herz for the prior fiscal year multiplied by a fraction, the numerator of which
was the number of days in the fiscal year in which the termination occurs through the date of termination, and the
denominator of which was the total number of days in such fiscal year (the “Pro-Rata Bonus”) ((i), (ii) and (iii) are
collectively referred to as the “Accrued Obligations”). In addition, Mr. Herz (in the case of disability) and his dependents
are entitled to company-paid health insurance for the one-year period after termination.
• Upon a termination of employment by us without cause (which includes non-renewal of the agreement) or by the executive
for good reason, Mr. Herz is entitled to either: (i) if Mr. Herz did not timely execute (or revoked) a release of claims against
us, payment of the Accrued Obligations and any other benefits accrued and due under any of our applicable benefit plans
and programs; or (ii) in addition to (i) above, if Mr. Herz timely executes and does not revoke a release of claims against us:
(A) severance compensation in an amount equal to two times his annual compensation (which is defined generally as the
sum of (1) his annualized base salary in effect immediately before the termination of employment plus (2) the average of
the bonuses earned for the three years preceding the year in which the termination occurs); (B) at our request, two years of
COBRA coverage, the premium of which shall be paid by Mr. Herz and reimbursed by us, such reimbursement amount
reduced by the amount that Mr. Herz would be required to contribute for health and dental coverage if he continued as an
active employee (or, where such coverage would have a negative tax effect to our healthcare plan or Mr. Herz, we can elect
to pay Mr. Herz cash in lieu of such coverage at COBRA rates); and Acceleration of Equity Vesting.
In connection with a change of control, any “excess parachute payments” (within the meaning of Section 280G of the Internal
Revenue Code) otherwise payable to Mr. Herz would be reduced if and to the extent he would be in a better after-tax position as a
result of such reduction.
The following table provides an estimate of the value of the benefits to Mr. Herz if a termination event had occurred as of
December 31, 2015.
Reason for termination Lump sum
severance payment Benefits(1)
Accelerated
vesting of unit
awards and
option awards(2)
Death $ 932,918 $ 17,110 $ 237,500
Disability 932,918 17,110 237,500
Termination by us without cause or by Mr. Herz for good
reason 2,355,836 (3)
34,220
237,500
(1)
Dental and medical benefits were calculated using 2015 COBRA rates allocated to us. (2)
Represents the value of unvested unit awards disclosed in the “2015 Outstanding Equity Awards at Fiscal Year-
End” table. Calculated by multiplying the number of accelerated units by the closing price of the applicable unit
on December 31, 2015. (3)
Represents allocation to us of two times (a) Mr. Herz’s base salary plus (b) incentive compensation from Atlas
Energy in respect of fiscal year 2014.
170
Edward E. Cohen
Effective September 4, 2015, we and Atlas Energy Group entered into an employment agreement with Mr. Cohen to secure his
service as Atlas Energy Group’s Chief Executive Officer. The agreement has a term of three years, which automatically renews daily
unless terminated before the expiration of the term pursuant to the termination provisions of the agreement.
The agreement provides for an annual base salary of $350,000, which can be increased at the discretion of our board’s
compensation committee pursuant to its normal performance review policies for senior level executives, but cannot be decreased. Mr.
Cohen is entitled to receive cash and non-cash bonus compensation in such amounts as our board or its compensation committee may
approve or under the terms of any incentive plan that we maintain for our senior level executives. Mr. Cohen is entitled to participate
in any short-term and long-term incentive programs provided by us for our senior level executives generally, at levels commensurate
with the benefits provided to other senior executives and with adjustments appropriate for Mr. Cohen’s position. Mr. Cohen is also
entitled to participate in all employee welfare benefit plans and programs or executive perquisites made available to our senior level
executives as a group or to our employees generally, as well as the reimbursement of reasonable expenses related to Mr. Cohen’s
employment. We are required to maintain a term life insurance policy on Mr. Cohen’s life that provides a death benefit of $3 million
to one or more beneficiaries designated by Mr. Cohen, which such policy, at his request, can be assumed by Mr. Cohen upon a
termination of employment, if and as allowed by the applicable insurance company.
The agreement provides the following benefits in the event of a termination of employment:
• Upon termination of employment due to death, all equity awards held by Mr. Cohen will accelerate and vest in full upon
the later of the termination of employment or six months after the date of grant of the awards (“Acceleration of Equity
Vesting”), and Mr. Cohen’s estate is entitled to receive, in addition to payment of all accrued and unpaid amounts of base
salary, cash incentive compensation earned for any year prior to the year in which the termination occurs, vacation and
business expenses (“Accrued Obligations”), and a prorated annual bonus for the year of termination, which shall be no less
than the amount of the cash incentive compensation awarded in respect of the prior fiscal year, if any, prorated for the
number of days in the current year prior to such termination (the “Pro Rata Bonus”).
• We may terminate Mr. Cohen’s employment if he were unable to perform the material duties of his employment for 180
days in any 12-month period because of physical or mental injury or illness which constitutes a disability for purposes of
Section 409A of the Internal Revenue Code of 1986, as amended, but we are required to pay his base salary until we act to
terminate his employment. Upon termination of employment due to disability, Mr. Cohen would receive the Accrued
Obligations, all amounts payable under our long-term disability plans, if any, three years’ continuation of group term life
and health insurance benefits for himself and, where applicable, his spouse and dependents (or, alternatively, we can elect
to pay Mr. Cohen cash in lieu of such coverage in an amount equal to three years’ healthcare coverage at COBRA rates and
the premiums we would have paid during the three-year period for such life insurance) (such coverage, the “Continued
Benefits”), Acceleration of Equity Vesting and the Pro Rata Bonus.
• Upon termination of employment by us without cause or by Mr. Cohen for good reason, Mr. Cohen is entitled to either (i) if
he does not execute and does not revoke a release of claims against us and related parties, payment of the Accrued
Obligations, or (ii) in addition to payment of the Accrued Obligations, if he executes and does not revoke a release of
claims against us and related parties, (A) a lump sum cash payment in an amount equal to three times his average
compensation (which is defined generally as the sum of (1) his annualized base salary in effect immediately before the
termination of employment plus (2) the average of the bonuses earned for the three years preceding the year in which the
termination occurs), (B) Continued Benefits for three years, (C) the Pro Rata Bonus, and (D) Acceleration of Equity
Vesting.
• Upon a termination of employment by us for cause or by Mr. Cohen without good reason, he is entitled to receive payment
of the Accrued Obligations and any accrued benefits.
In connection with a change of control, any “excess parachute payments” (within the meaning of Section 280G of the Internal
Revenue Code) otherwise payable to Mr. Cohen would, if agreed to by Mr. Cohen, be reduced if and to the extent he would be in a
better after-tax position as a result of such reduction.
The following table provides an estimate of the value of the benefits to Mr. Cohen if a termination event had occurred as of
December 31, 2015.
Reason for termination Lump sum
severance payment Benefits(1) Accelerated
vesting of unit

171
awards and
option awards(2)
Death $ 4,533,698 (3)
$ $ 237,500
Disability 2,433,698 39,749 237,500
Termination by us without cause or by Mr. Cohen for good
reason 11,834,794 (4)
39,749 $ 237,500
(1)
Dental and medical benefits were calculated using 2015 COBRA rates allocated to us. (2)
Represents the value of unvested unit awards disclosed in the “2015 Outstanding Equity Awards at Fiscal Year-
End” table. Calculated by multiplying the number of accelerated units by the closing price of the applicable unit
on December 31, 2015. (3)
Represents pro rata variable incentive pay and life insurance policy proceeds allocated to us. (4)
Represents allocation to us of pro rata incentive compensation from Atlas Energy in respect of fiscal year 2014
plus three times (a) Mr. Cohen’s base salary plus (b) incentive compensation from Atlas Energy in respect of
fiscal year 2014.
Jonathan Z. Cohen
Effective September 4, 2015, we and Atlas Energy Group entered into an employment agreement with Mr. Cohen to secure his
service as Executive Chairman of Atlas Energy Group’s board of directors. The agreement has a term of three years, which
automatically renews daily unless terminated before the expiration of the term pursuant to the termination provisions of the agreement.
The agreement provides for an annual base salary of $350,000, which can be increased at the discretion of our board’s
compensation committee pursuant to its normal performance review policies for senior level executives, but cannot be decreased. Mr.
Cohen is entitled to receive cash and non-cash bonus compensation in such amounts as our board or its compensation committee may
approve or under the terms of any incentive plan that we maintain for our senior level executives. Mr. Cohen is entitled to participate
in any short-term and long-term incentive programs provided by us for our senior level executives generally, at levels commensurate
with the benefits provided to other senior executives and with adjustments appropriate for Mr. Cohen’s position. Mr. Cohen is also
entitled to participate in all employee welfare benefit plans and programs or executive perquisites made available to our senior level
executives as a group or to our employees generally, as well as the reimbursement of reasonable expenses related to Mr. Cohen’s
employment. We are required to maintain a term life insurance policy on Mr. Cohen’s life that provides a death benefit of $3 million
to one or more beneficiaries designated by Mr. Cohen, which such policy, at his request, can be assumed by Mr. Cohen upon a
termination of employment, if and as allowed by the applicable insurance company.
The agreement provides the same benefits in the event of a termination of employment as described above in Mr. E. Cohen’s
employment agreement summary.
In connection with a change of control, any “excess parachute payments” (within the meaning of Section 280G of the Internal
Revenue Code) otherwise payable to Mr. Cohen would, if agreed to by Mr. Cohen, be reduced if and to the extent he would be in a
better after-tax position as a result of such reduction.
The following table provides an estimate of the value of the benefits to Mr. Cohen if a termination event had occurred as of
December 31, 2015.
Reason for termination
Lump sum
severance
payment Benefits(1)
Accelerated
vesting of unit
awards and option awards(2)
Death
$ 4,533,698 (3)
$ $
237,500
Disability 2,433,698 58,296 237,500
Termination by us without cause or by Mr. Cohen for good
reason 11,204,794 (4)
58,296
237,500
(1)
Dental and medical benefits were calculated using 2015 COBRA rates allocated to us. (2)
Represents the value of unvested unit awards disclosed in the “2015 Outstanding Equity Awards at Fiscal Year-
End” table. Calculated by multiplying the number of accelerated units by the closing price of the applicable unit
on December 31, 2015. (3)
Represents pro rata variable incentive pay and life insurance policy proceeds allocated to us.
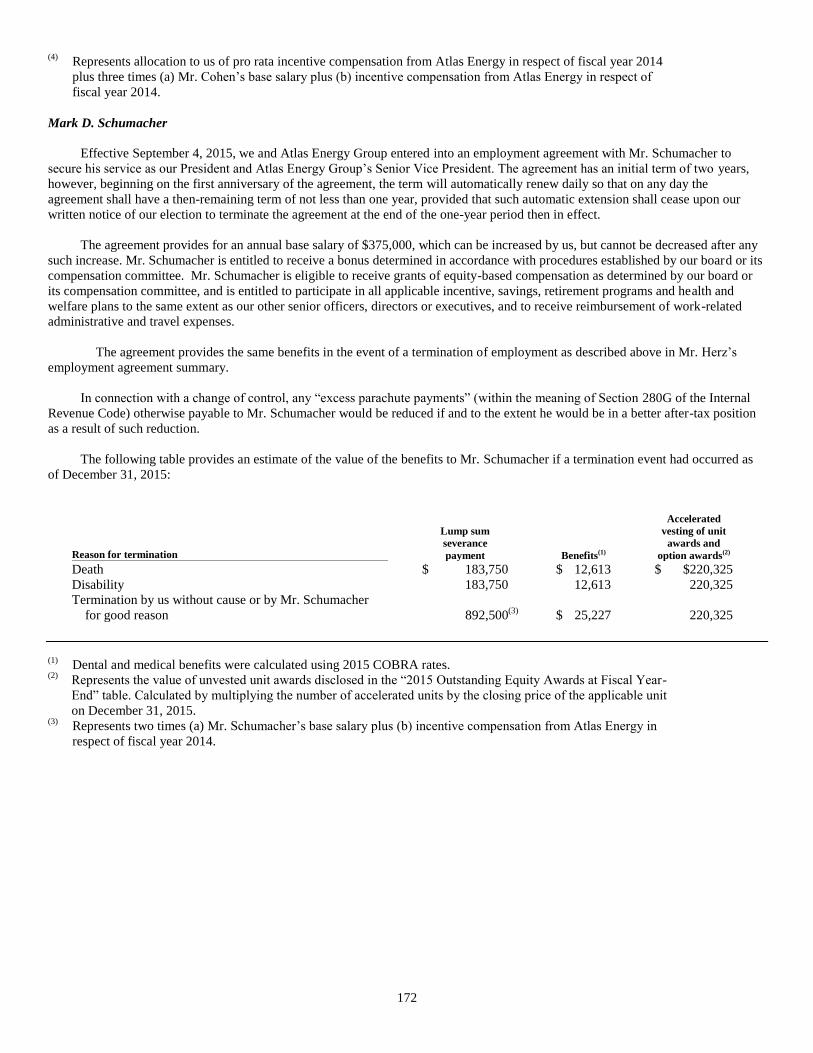
172
(4) Represents allocation to us of pro rata incentive compensation from Atlas Energy in respect of fiscal year 2014
plus three times (a) Mr. Cohen’s base salary plus (b) incentive compensation from Atlas Energy in respect of
fiscal year 2014.
Mark D. Schumacher
Effective September 4, 2015, we and Atlas Energy Group entered into an employment agreement with Mr. Schumacher to
secure his service as our President and Atlas Energy Group’s Senior Vice President. The agreement has an initial term of two years,
however, beginning on the first anniversary of the agreement, the term will automatically renew daily so that on any day the
agreement shall have a then-remaining term of not less than one year, provided that such automatic extension shall cease upon our
written notice of our election to terminate the agreement at the end of the one-year period then in effect.
The agreement provides for an annual base salary of $375,000, which can be increased by us, but cannot be decreased after any
such increase. Mr. Schumacher is entitled to receive a bonus determined in accordance with procedures established by our board or its
compensation committee. Mr. Schumacher is eligible to receive grants of equity-based compensation as determined by our board or
its compensation committee, and is entitled to participate in all applicable incentive, savings, retirement programs and health and
welfare plans to the same extent as our other senior officers, directors or executives, and to receive reimbursement of work-related
administrative and travel expenses.
The agreement provides the same benefits in the event of a termination of employment as described above in Mr. Herz’s
employment agreement summary.
In connection with a change of control, any “excess parachute payments” (within the meaning of Section 280G of the Internal
Revenue Code) otherwise payable to Mr. Schumacher would be reduced if and to the extent he would be in a better after-tax position
as a result of such reduction.
The following table provides an estimate of the value of the benefits to Mr. Schumacher if a termination event had occurred as
of December 31, 2015:
Reason for termination
Lump sum
severance
payment Benefits(1)
Accelerated
vesting of unit
awards and
option awards(2)
Death $ 183,750 $ 12,613 $ $220,325
Disability 183,750 12,613 220,325
Termination by us without cause or by Mr. Schumacher
for good reason 892,500 (3)
$ 25,227
220,325
(1)
Dental and medical benefits were calculated using 2015 COBRA rates. (2)
Represents the value of unvested unit awards disclosed in the “2015 Outstanding Equity Awards at Fiscal Year-
End” table. Calculated by multiplying the number of accelerated units by the closing price of the applicable unit
on December 31, 2015. (3)
Represents two times (a) Mr. Schumacher’s base salary plus (b) incentive compensation from Atlas Energy in
respect of fiscal year 2014.
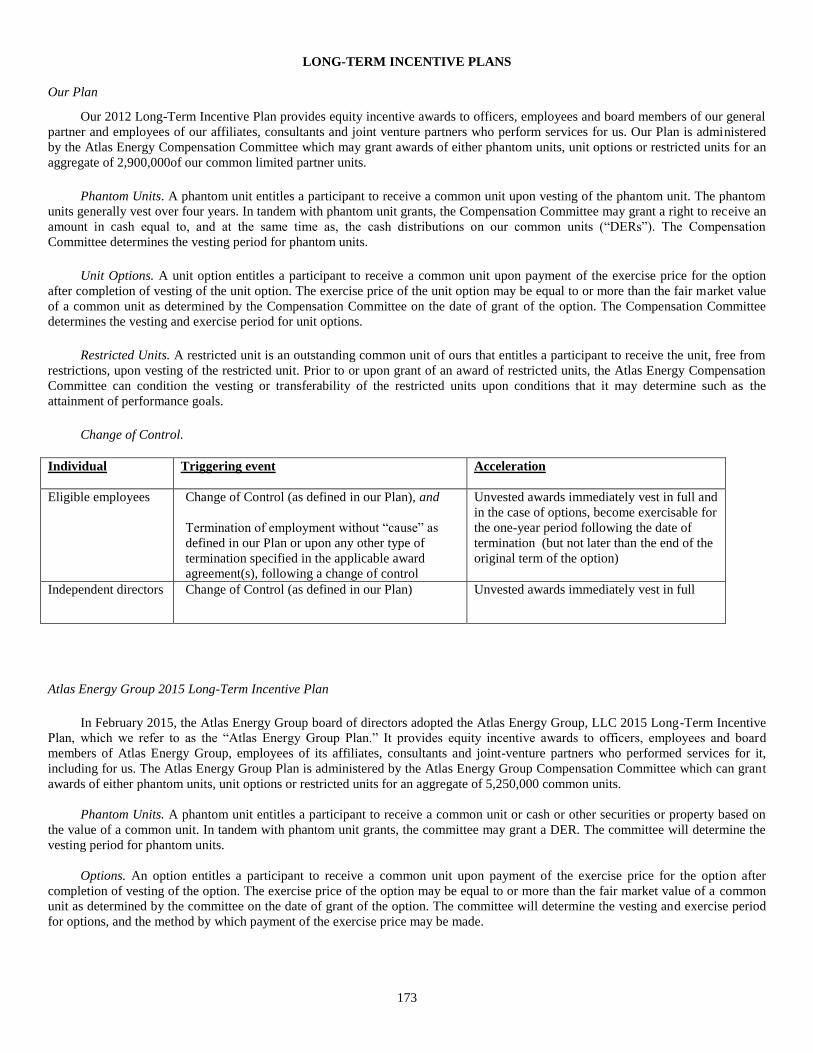
173
LONG-TERM INCENTIVE PLANS
Our Plan
Our 2012 Long-Term Incentive Plan provides equity incentive awards to officers, employees and board members of our general
partner and employees of our affiliates, consultants and joint venture partners who perform services for us. Our Plan is administered
by the Atlas Energy Compensation Committee which may grant awards of either phantom units, unit options or restricted units for an
aggregate of 2,900,000of our common limited partner units. Phantom Units. A phantom unit entitles a participant to receive a common unit upon vesting of the phantom unit. The phantom
units generally vest over four years. In tandem with phantom unit grants, the Compensation Committee may grant a right to receive an
amount in cash equal to, and at the same time as, the cash distributions on our common units (“DERs”). The Compensation
Committee determines the vesting period for phantom units. Unit Options. A unit option entitles a participant to receive a common unit upon payment of the exercise price for the option
after completion of vesting of the unit option. The exercise price of the unit option may be equal to or more than the fair market value
of a common unit as determined by the Compensation Committee on the date of grant of the option. The Compensation Committee
determines the vesting and exercise period for unit options. Restricted Units. A restricted unit is an outstanding common unit of ours that entitles a participant to receive the unit, free from
restrictions, upon vesting of the restricted unit. Prior to or upon grant of an award of restricted units, the Atlas Energy Compensation
Committee can condition the vesting or transferability of the restricted units upon conditions that it may determine such as the
attainment of performance goals. Change of Control.
Individual Triggering event Acceleration
Eligible employees Change of Control (as defined in our Plan), and
Termination of employment without “cause” as
defined in our Plan or upon any other type of
termination specified in the applicable award
agreement(s), following a change of control
Unvested awards immediately vest in full and
in the case of options, become exercisable for
the one-year period following the date of
termination (but not later than the end of the
original term of the option)
Independent directors Change of Control (as defined in our Plan) Unvested awards immediately vest in full
Atlas Energy Group 2015 Long-Term Incentive Plan
In February 2015, the Atlas Energy Group board of directors adopted the Atlas Energy Group, LLC 2015 Long-Term Incentive
Plan, which we refer to as the “Atlas Energy Group Plan.” It provides equity incentive awards to officers, employees and board
members of Atlas Energy Group, employees of its affiliates, consultants and joint-venture partners who performed services for it,
including for us. The Atlas Energy Group Plan is administered by the Atlas Energy Group Compensation Committee which can grant
awards of either phantom units, unit options or restricted units for an aggregate of 5,250,000 common units.
Phantom Units. A phantom unit entitles a participant to receive a common unit or cash or other securities or property based on
the value of a common unit. In tandem with phantom unit grants, the committee may grant a DER. The committee will determine the
vesting period for phantom units.
Options. An option entitles a participant to receive a common unit upon payment of the exercise price for the option after
completion of vesting of the option. The exercise price of the option may be equal to or more than the fair market value of a common
unit as determined by the committee on the date of grant of the option. The committee will determine the vesting and exercise period
for options, and the method by which payment of the exercise price may be made.

174
Restricted Units. A restricted unit is an outstanding common unit issued that entitles a participant to receive the unit, free from
restrictions, upon vesting of the restricted unit. Prior to or upon grant of an award of restricted units, the committee will condition the
vesting or transferability of the restricted units upon continued service, the attainment of performance goals or both.
Change of Control.
Individual Triggering event Acceleration
Eligible employees Change of Control (as defined in the Atlas Energy
Group LTIP), and
Termination of employment without “cause” as
defined in the Atlas Energy Group LTIP or upon
any other type of termination specified in the
applicable award agreement(s), following a change
of control
Unvested awards immediately vest in full and
in the case of options, become exercisable for
the one-year period following the date of
termination (but not later than the end of the
original term of the option)
Independent directors Change of Control (as defined in the Atlas Energy
Group LTIP)
Unvested awards immediately vest in full
2015 OUTSTANDING EQUITY AWARDS AT FISCAL YEAR-END
Option awards Unit awards
Name Exercisable Unexercisable
Option
exercise
price ($)
Option
expiration
date
Number of
units
that have
not
vested(#)
Market value
of
units that have
not
vested($)
Daniel C. Herz 100,000 (1)
-- 20.75 5/15/2022 -- --
-- -- -- -- 250,000 (2)
237,500
Jeffrey M.
Slotterback 7,500 (1)
2,500 (3)
24.67 5/15/2022 1,500 (4)
1,545
-- -- -- -- 35,000 (5)
33,250
Sean P. McGrath --
-- -- -- -- --
Edward E. Cohen 350,000 (1)
-- 24.67 5/15/2022 -- --
-- -- -- -- 250,000 (2)
237,500
Jonathan Z. Cohen 350,000 (1)
-- 24.67 5/15/2022 -- --
-- -- -- -- 250,000 (2)
237,500
Mark D. Schumacher --
-- -- -- 17,500 (6)
18,025
-- -- -- -- 12,500 (7)
12,875
-- -- -- -- 22,500 (8)
23,175
-- -- -- -- 175,000 (9)
166,250
Matthew A. Jones 225,000 (1)
-- 24.67 5/15/2022 -- --
(1)
Represents options to purchase our units. (2)
Represents Atlas Energy Group phantom units, which vest as follows: 6/8/2016—82,500, 6/8/2017—82,500
and 6/8/2018—85,000. (3)
Represents options to purchase our units, which vest as follows: 5/15/2016—2,500. (4)
Represents our phantom units, which vest as follows: 5/15/2016—1,500. (5)
Represents Atlas Energy Group phantom units, which vest as follows: 6/8/2016—11,550, 6/8/2017—11,550
and 6/8/2018—11,900. (6)
Represents our phantom units, which vest as follows: 7/25/2016—17,500. (7)
Represents our phantom units, which vest as follows: 1/24/2016—6,250 and 1/24/2017—6,250. (8)
Represents our phantom units, which vest as follows: 6/26/2016—7,500, 6/26/2017—7,500 and 6/26/2018—
7,500.

175
(9) Represents Atlas Energy Group phantom units, which vest as follows: 6/8/2016—57,750, 6/8/2017—57,750
and 6/8/2018—59,500.
2015 OPTION EXERCISES AND UNITS VESTED TABLE
Option awards Unit awards
Name
Number
of units
acquired
on
exercise
Value
realized
on
exercise
($)
Number of
units
acquired on
vesting
Value realized
on
vesting ($)
Daniel C. Herz — — 35,000 343,000
Jeffrey M. Slotterback — — 1,500 12,885
Sean P. McGrath — — 12,500 107,375
Edward E. Cohen — — 75,000 735,000
Jonathan Z. Cohen — — 75,000 735,000
Mark D. Schumacher — — 31,250 170,475
Matthew A. Jones — — 50,000 490,000
2015 NONQUALIFIED DEFERRED COMPENSATION
Name
Executive
contributions
In the last
FY ($)
Registrant
contributions
in the last
FY ($)
Aggregate
earnings
in the last
FY ($)
Aggregate
Withdrawals/
Distributions
($)
Aggregate
balance
at last
FYE ($)
Edward E. Cohen 166,250 (1)
166,250 (3)
42,139 928,770 (5)
1,303,408
Jonathan Z. Cohen 146,058 (2)
146,058 (4)
29,907 653,725 (5)
975,748
(1)
This amount is included within the Summary Compensation Table for 2015 reflecting $33,251 in the salary
column and $132,999 in the non-equity incentive plan compensation column. (2)
This amount is included within the Summary Compensation Table for 2015 reflecting $33,251 in the salary
column and $112,807 in the non-equity incentive plan compensation column. (3)
This amount is included within the Summary Compensation Table for 2015 reflecting our allocated portion of a
$166,250 matching contribution in the all other compensation column. (4)
This amount is included within the Summary Compensation Table for 2015 reflecting our allocated portion of a
$146,058 matching contribution in the all other compensation column. (5)
Messrs. E. and J. Cohen each elected a deferral period of three years after the amount deferred would otherwise
have been earned. This amount is included within the Summary Compensation Table for 2015 in the all other
compensation column.
176
Effective July 1, 2011, Atlas Energy established the Excess 401(k) Plan, an unfunded nonqualified deferred compensation plan
for certain highly compensated employees. Atlas Energy Group assumed Atlas Energy’s obligations under the plan as part of the
Separation. The Excess 401(k) Plan provides Messrs. E. and J. Cohen, the plan’s current participants, with the opportunity to defer,
annually, the receipt of a portion of their compensation, and to permit them to designate investment indices for the purpose of
crediting earnings and losses on any amounts deferred under the Excess 401(k) Plan. Messrs. E. and J. Cohen may defer up to 10% of
their total annual cash compensation (which means base salary and non-performance-based bonus) and up to 100% of all
performance-based bonuses, and Atlas Energy Group is obligated to match such deferrals on a dollar-for-dollar basis (i.e., 100% of the
deferral) up to a total of 50% of their base salary for any calendar year. The account is invested in a mutual fund and cash balances are
invested daily in a money market account. Atlas Energy established a “rabbi” trust to serve as the funding vehicle for the Excess
401(k) Plan and Atlas Energy Group will, not later than the last day of the first month of each calendar quarter, make contributions to
the trust in the amount of the compensation deferred, along with the corresponding match, during the preceding calendar quarter.
Notwithstanding the establishment of the rabbi trust, Atlas Energy Group’s obligation to pay the amounts due under the Excess 401(k)
Plan constitutes a general, unsecured obligation, payable out of its general assets, and Messrs. E. and J. Cohen do not have any rights
to any specific asset of the company.
The Excess 401(k) Plan has the following additional provisions:
At the time the participant makes his deferral election with respect to any year, he must specify the date or dates (but not
more than two) on which distributions will start, which date may be upon termination of employment or a date that is at
least three years after the year in which the amount deferred would otherwise have been earned. A participant may
subsequently defer a specified payment date for a minimum of an additional five years from the previously elected
payment date. If the participant fails to make an election, all amounts will be distributable upon the termination of
employment.
Distributions will be made earlier in the event of death, disability or a termination of employment due to a change of
control.
If the participant elects to receive all or a portion of his distribution upon the termination of employment, it will be paid in
a lump sum. Otherwise, the participant may elect to receive a lump sum payment or equal installments over not more than
10 years.
A participant may request a distribution of all or part of his account in the event of an unforeseen financial emergency. An
unforeseen financial emergency is a severe financial hardship due to an unforeseeable emergency resulting from a sudden
and unexpected illness or accident of the participant, or, a sudden and unexpected illness or accident of a dependent, or
loss of the participant’s property due to casualty, or other similar and extraordinary unforeseeable circumstances arising as
a result of events beyond the control of the participant. An unforeseen financial emergency is not deemed to exist to the
extent it is or may be relieved through reimbursement or compensation by insurance or otherwise; by borrowing from
commercial sources on reasonable commercial terms to the extent that this borrowing would not itself cause a severe
financial hardship; by cessation of deferrals under the plan; or by liquidation of the participant’s other assets (including
assets of the participant’s spouse and minor children that are reasonably available to the participant) to the extent that this
liquidation would not itself cause severe financial hardship.
The table above reflects salary and matching contribution costs allocated to us.
DIRECTOR COMPENSATION
The following table sets forth compensation for 2015 for the directors of our general partner’s board of directors.
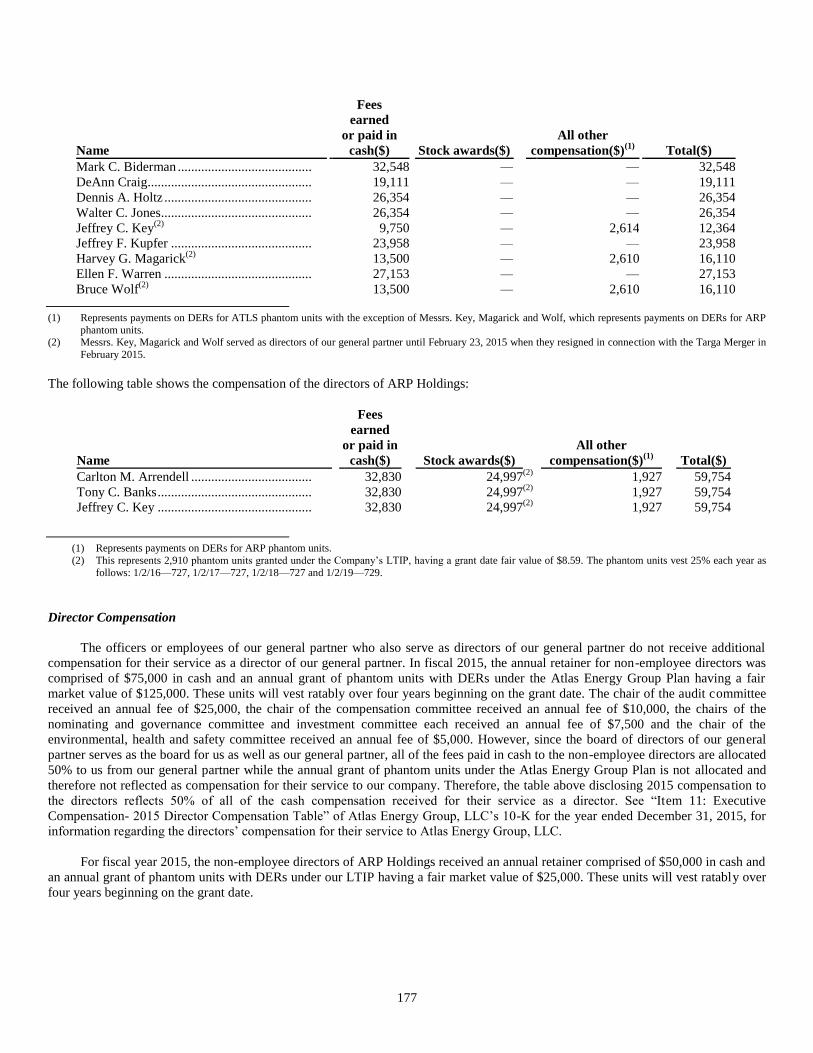
177
Name
Fees
earned
or paid in
cash($) Stock awards($) All other
compensation($)(1)
Total($)
Mark C. Biderman ........................................ 32,548 — — 32,548
DeAnn Craig................................................. 19,111 — — 19,111
Dennis A. Holtz ............................................ 26,354 — — 26,354
Walter C. Jones ............................................. 26,354 — — 26,354
Jeffrey C. Key(2)
9,750 —
2,614 12,364
Jeffrey F. Kupfer .......................................... 23,958 —
— 23,958
Harvey G. Magarick(2)
13,500 —
2,610 16,110
Ellen F. Warren ............................................ 27,153 —
— 27,153
Bruce Wolf(2)
13,500 —
2,610 16,110
(1) Represents payments on DERs for ATLS phantom units with the exception of Messrs. Key, Magarick and Wolf, which represents payments on DERs for ARP
phantom units. (2) Messrs. Key, Magarick and Wolf served as directors of our general partner until February 23, 2015 when they resigned in connection with the Targa Merger in
February 2015.
The following table shows the compensation of the directors of ARP Holdings:
Name
Fees
earned
or paid in
cash($) Stock awards($) All other
compensation($)(1)
Total($)
Carlton M. Arrendell .................................... 32,830 24,997 (2)
1,927 59,754
Tony C. Banks .............................................. 32,830 24,997 (2)
1,927 59,754
Jeffrey C. Key .............................................. 32,830 24,997 (2)
1,927 59,754
(1) Represents payments on DERs for ARP phantom units.
(2) This represents 2,910 phantom units granted under the Company’s LTIP, having a grant date fair value of $8.59. The phantom units vest 25% each year as
follows: 1/2/16—727, 1/2/17—727, 1/2/18—727 and 1/2/19—729.
Director Compensation
The officers or employees of our general partner who also serve as directors of our general partner do not receive additional
compensation for their service as a director of our general partner. In fiscal 2015, the annual retainer for non-employee directors was
comprised of $75,000 in cash and an annual grant of phantom units with DERs under the Atlas Energy Group Plan having a fair
market value of $125,000. These units will vest ratably over four years beginning on the grant date. The chair of the audit committee
received an annual fee of $25,000, the chair of the compensation committee received an annual fee of $10,000, the chairs of the
nominating and governance committee and investment committee each received an annual fee of $7,500 and the chair of the
environmental, health and safety committee received an annual fee of $5,000. However, since the board of directors of our general
partner serves as the board for us as well as our general partner, all of the fees paid in cash to the non-employee directors are allocated
50% to us from our general partner while the annual grant of phantom units under the Atlas Energy Group Plan is not allocated and
therefore not reflected as compensation for their service to our company. Therefore, the table above disclosing 2015 compensation to
the directors reflects 50% of all of the cash compensation received for their service as a director. See “Item 11: Executive
Compensation- 2015 Director Compensation Table” of Atlas Energy Group, LLC’s 10-K for the year ended December 31, 2015, for
information regarding the directors’ compensation for their service to Atlas Energy Group, LLC.
For fiscal year 2015, the non-employee directors of ARP Holdings received an annual retainer comprised of $50,000 in cash and
an annual grant of phantom units with DERs under our LTIP having a fair market value of $25,000. These units will vest ratably over
four years beginning on the grant date.
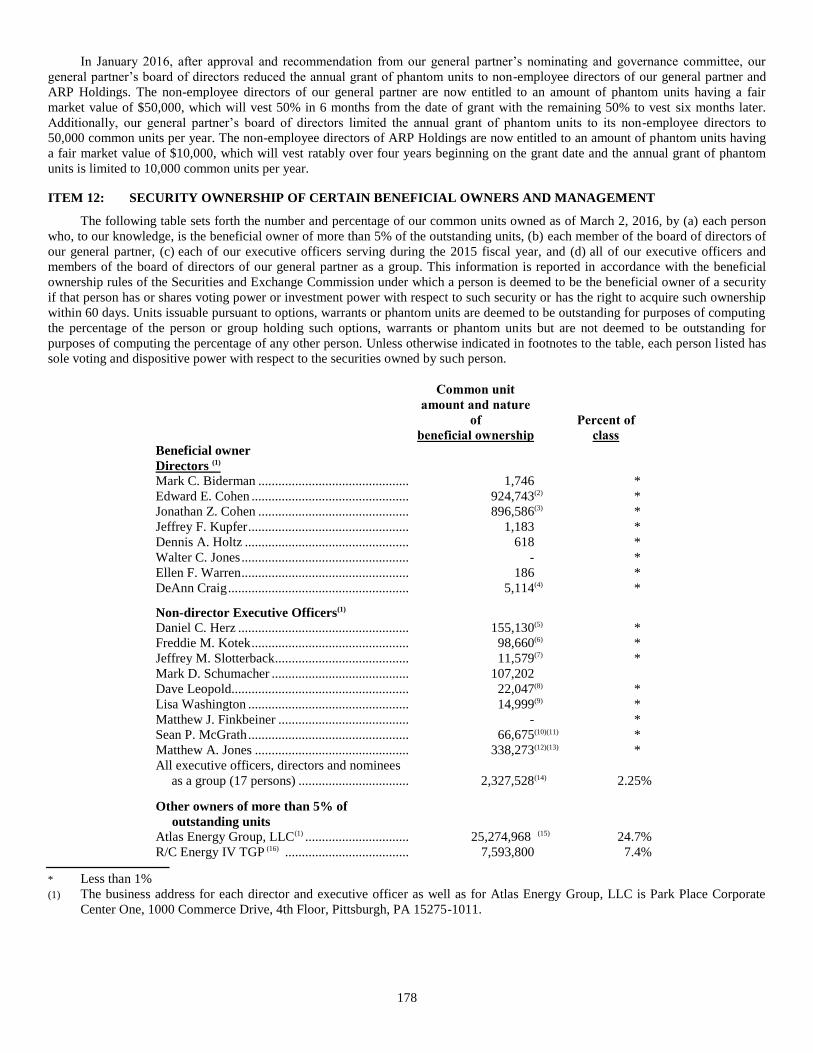
178
In January 2016, after approval and recommendation from our general partner’s nominating and governance committee, our
general partner’s board of directors reduced the annual grant of phantom units to non-employee directors of our general partner and
ARP Holdings. The non-employee directors of our general partner are now entitled to an amount of phantom units having a fair
market value of $50,000, which will vest 50% in 6 months from the date of grant with the remaining 50% to vest six months later.
Additionally, our general partner’s board of directors limited the annual grant of phantom units to its non-employee directors to
50,000 common units per year. The non-employee directors of ARP Holdings are now entitled to an amount of phantom units having
a fair market value of $10,000, which will vest ratably over four years beginning on the grant date and the annual grant of phantom
units is limited to 10,000 common units per year.
ITEM 12: SECURITY OWNERSHIP OF CERTAIN BENEFICIAL OWNERS AND MANAGEMENT
The following table sets forth the number and percentage of our common units owned as of March 2, 2016, by (a) each person
who, to our knowledge, is the beneficial owner of more than 5% of the outstanding units, (b) each member of the board of directors of
our general partner, (c) each of our executive officers serving during the 2015 fiscal year, and (d) all of our executive officers and
members of the board of directors of our general partner as a group. This information is reported in accordance with the beneficial
ownership rules of the Securities and Exchange Commission under which a person is deemed to be the beneficial owner of a security
if that person has or shares voting power or investment power with respect to such security or has the right to acquire such ownership
within 60 days. Units issuable pursuant to options, warrants or phantom units are deemed to be outstanding for purposes of computing
the percentage of the person or group holding such options, warrants or phantom units but are not deemed to be outstanding for
purposes of computing the percentage of any other person. Unless otherwise indicated in footnotes to the table, each person listed has
sole voting and dispositive power with respect to the securities owned by such person.
Common unit
amount and nature
of
beneficial ownership
Percent of
class
Beneficial owner
Directors (1)
Mark C. Biderman ............................................. 1,746 *
Edward E. Cohen ............................................... 924,743 (2) *
Jonathan Z. Cohen ............................................. 896,586 (3) *
Jeffrey F. Kupfer ................................................ 1,183 *
Dennis A. Holtz ................................................. 618 *
Walter C. Jones .................................................. - *
Ellen F. Warren .................................................. 186 *
DeAnn Craig ...................................................... 5,114 (4) *
Non-director Executive Officers(1)
Daniel C. Herz ................................................... 155,130 (5) *
Freddie M. Kotek ............................................... 98,660 (6) *
Jeffrey M. Slotterback........................................ 11,579 (7) *
Mark D. Schumacher ......................................... 107,202
Dave Leopold..................................................... 22,047 (8) *
Lisa Washington ................................................ 14,999 (9) *
Matthew J. Finkbeiner ....................................... - *
Sean P. McGrath ................................................ 66,675 (10)(11) *
Matthew A. Jones .............................................. 338,273 (12)(13) *
All executive officers, directors and nominees
as a group (17 persons) ................................. 2,327,528 (14) 2.25 %
Other owners of more than 5% of
outstanding units
Atlas Energy Group, LLC(1) ............................... 25,274,968 (15) 24.7 %
R/C Energy IV TGP (16) ..................................... 7,593,800 7.4 %
* Less than 1%
(1) The business address for each director and executive officer as well as for Atlas Energy Group, LLC is Park Place Corporate
Center One, 1000 Commerce Drive, 4th Floor, Pittsburgh, PA 15275-1011.

179
(2) Includes (i) 2,680 units held in an individual retirement account of Mr. E. Cohen’s spouse; (ii) 40,896 units held by a
partnership of which Mr. E. Cohen and his spouse are the sole limited partners and sole stockholders, officers and directors of
the general partner; (iii) 310,344 units held by a charitable foundation of which Mr. E. Cohen, his spouse and their children
serve as co-trustees; (iv) 6,869 units held by a trust (of which Mr. E. Cohen is the settlor) for the benefit of his spouse; (v) 7,510
units owned by a trust for the benefit of Mr. E. Cohen’s children; (vi) 766 units owned by a trust (of which Mr. E. Cohen is the
settlor) for the benefit of his spouse and/or children; and (vii) 350,000 common unit purchase options. Mr. E. Cohen disclaims
beneficial ownership of the units described above except for those set forth in (ii) and (vii) above. 317,213 of these units are also
included in the common units referred to in footnote 3 below.
(3) Includes (i) 229,373 units jointly owned by Mr. J. Cohen and his spouse; (ii) 310,344 units held by a charitable foundation of
which Mr. J. Cohen, his parents and his sibling serve as co-trustees; (iii) 6,869 units owned by a trust of which Mr. J. Cohen and
his sibling are each trustees and beneficiaries; and (iv) 350,000 common unit purchase options. Mr. J. Cohen disclaims
beneficial ownership to the units described above in (ii).
(4) Includes 1,373 phantom units that will vest and convert into common units within 60 days.
(5) Includes 100,000 common unit purchase options.
(6) Includes (i) 25,278 units held by spouse; (ii) 5,828 units held by his children’s trust; (iii) 195 units held by his children; (iv) 659
units held by his mother-in-law; and (v) 52,500 common unit purchase options.
(7) Includes 7,500 common unit purchase options.
(8) Includes 6,250 phantom units that will vest and convert into common units within 60 days.
(9) Includes 9,375 common unit purchase options.
(10) Includes 37,500 common unit purchase options.
(11) We announced in August 2015 that Mr. McGrath resigned from his position as Chief Financial Officer; his ownership amount
represents the common units that he held upon his resignation.
(12) Includes 225,000 common unit purchase options.
(13) We announced in April 2015 that Mr. Jones retired from his position as Senior Vice President of Atlas Energy Group and
President, ARP; his ownership amount represents the common units that he held upon his retirement.
(14) This number has been adjusted to exclude 6,869 common units and 310,344 common units which were included in both Mr. E.
Cohen’s beneficial ownership amount and Mr. J. Cohen’s beneficial ownership amount.
(15) Includes 3,749,986 Class C Convertible Preferred Units and 562,497 warrants to purchase common units.
(16) This information is based on a Schedule 13G filed by R/C Energy IV TGP Holdings, L.P., Riverstone/Carlyle Energy Partners
IV, L.P., and R/C Energy GP IV, LLC (collectively, “R/C Energy IV”) with the SEC on August 6, 2012. The address for R/C
Energy is 712 Fifth Avenue, 51st Floor, New York, NY 10019.
Equity Compensation Plan Information
The following table contains information about our Plan as of December 31, 2015:
Plan category
Number of
securities to be
issued upon
exercise of
equity
instruments
Weighted-
average
exercise price
of outstanding
equity
instruments
Number of securities
remaining available for
future issuance under
equity compensation
plans (excluding
securities reflected in
column (a))
(a) (b) (c)
Equity compensation plans approved
by security holders – phantom units ... 302,105 n/a
Equity compensation plans approved
by security holders – unit options ...... 1,352,525 $ 24.66
Equity compensation plans approved
by security holders – Total ................. 1,656,630 187,633

180
The following table contains information about Atlas Energy Group’s Long-Term Incentive Plan as of December 31, 2015:
Plan category
Number of
securities to be
issued upon
exercise of
equity
instruments
Weighted-
average
exercise price
of outstanding
equity
instruments
Number of securities
remaining available for
future issuance under
equity compensation
plans (excluding
securities reflected in
column (a))
(a) (b) (c)
Equity compensation plans approved
by security holders – phantom units ... 2,564,910 N/A
Equity compensation plans approved
by security holders – unit options ...... N/A $ N/A
Equity compensation plans approved
by security holders – Total ................. 2,564,910 2,685,090
181
ITEM 13: CERTAIN RELATIONSHIPS AND RELATED TRANSACTIONS, AND DIRECTOR INDEPENDENCE
The board of directors of our general partner has determined that Dr. Craig, Ms. Warren and Messrs. Biderman, Holtz, Jones
and Kupfer each satisfy the requirement for independence set out in the rules of the New York Stock Exchange and those set forth in
Rule 10A-3(b)(1) of the Securities Exchange Act of 1934, and each of them meet the definition of an independent member set forth in
our Partnership Governance Guidelines. Additionally, the board of directors of our general partner determined that Messrs. Arrendell,
Banks and Key, the three disinterested members of the board of managers of ARP Holdings, are each independent with respect us, as
defined by the rules of the New York Stock Exchange and the independence standards adopted by our general partner’s board of
directors. In making these determinations, the board of directors reviewed information from each of these board members concerning
all their respective relationships with us and analyzed the materiality of those relationships.
We have a written policy governing related party transactions. For purposes of this policy, a related party includes: (i) any
executive officer, director or director nominee; (ii) any person known to be a beneficial owner of 5% or more of our common units;
(iii) an immediate family member of any person included in clauses (i) and (ii) (which, by definition, includes, a person’s spouse,
parents, and parents in law, step parents, children, children in law and step children, siblings and brothers and sisters in law and
anyone residing in that person’s home); and (iv) any firm, corporation or other entity in which any person included in clauses
(i) through (iii) above is employed as an executive officer, is a director, partner, principal or occupies a similar position or in which
that person owns a 5% or more beneficial interest. Any transaction between us and a related party that is anticipated to exceed
$120,000 in any calendar year must be approved, in advance, by the disinterested members of the board of managers (“ARP Holdings
Board”) of Atlas Resource Partners Holdings, LLC (“ARP Holdings”), our wholly-owned subsidiary,. ARP Holdings, following the
approval of a related party transaction, is required to notify our general partner’s board of directors of such approval and provide the
board of directors with a summary of each related party transaction at the next meeting of the board of directors. If consideration by
the disinterested members of the ARP Holdings Board in advance is not feasible, then the related party transaction shall be considered,
and, if the disinterested members determined it to be appropriate, the related party transaction must be ratified at the next meeting of
the ARP Holdings Board. In determining whether to recommend the approval or ratification of a related party transaction, the
disinterested members of the ARP Holdings Board will take into account, among other factors they deem appropriate, whether the
related party transaction is on terms no less favorable than terms generally available to an unaffiliated third party under the same or
similar circumstances, and the extent of the related party’s interest in the transaction. The disinterested members of the ARP Holdings
Board, following the approval of a related party transaction, will notify our general partner’s board of directors of such approval and
provide the board of directors with their recommendation. The general partner’s board of directors then meet to consider the related
party transaction with the non-independent members of the general partner’s board of directors recusing themselves from voting on
the transaction.
Disinterested members of the ARP Holdings Board with respect to a related party transaction means all members of the ARP
Holdings Board who (i) are not officers or employees of Atlas Energy Group, (ii) are not officers, directors or employees of any
affiliate of Atlas Energy Group (other than because any such person serves as a member of the ARP Holdings Board), (iii) are not
holders of any ownership interest in us or Atlas Energy Group, other than a de minimis interest or common units representing limited
partnership interests in us or other awards granted to such persons under our equity compensation plans and (iv) do not have a direct
or indirect interest in such related party transaction.
The following related party transactions are pre-approved under the policy: (i) employment of an executive officer to perform
services on our behalf (or on behalf of one of our subsidiaries) if (a) the compensation is required to be reported in our annual report
on Form 10-K or (b) the executive officer is not an immediate family member and such compensation was approved, or recommended
to our general partner’s board of directors for approval, by its compensation committee; (ii) compensation paid to directors for serving
on the board of directors of our general partner or any committee thereof or reimbursement of expenses in connection with such
services, if the compensation is required to be reported in our annual report on Form 10-K; (iii) transactions where the related party’s
interest arises solely as a holder of our common units and all holders of our common units received the same benefit on a pro rata
basis (e.g., dividends), or transactions available to all employees generally; (iv) a transaction at another company where the related
party is only an employee (and not an executive officer), director or beneficial owner of less than 10% of such company’s shares and
the aggregate amount involved does not exceed the greater of $1,000,000 or 2% of that company’s total annual revenues; and (v) any
charitable contribution, grant or endowment by us or our general partner to a charitable organization, foundation or university at which
the related party’s only relationship is an employee (other than an executive officer) or director or similar capacity, if the aggregate
amount involved does not exceed the lesser of $200,000 or 2% of the charitable organization’s total annual receipts, expenditures or
assets.
Our Relationship with Atlas Energy Group and Atlas Energy
182
Atlas Energy Group owns approximately 20.96 million of our outstanding common units and 3.75 million Class C convertible
preferred units, representing approximately 23.3% limited partner ownership interest in us. In addition, Atlas Energy Group owns
2,161,445 Class A units, representing a 2% general partner interest, and all of our incentive distribution rights. As the owner of our
incentive distribution rights, Atlas Energy Group will be entitled to receive increasing percentages, up to a maximum of 50%, of any
cash distributed by us as we reach certain target distribution levels in excess of $0.46 per common unit in any quarter. Until February
27, 2015, Atlas Energy owned the common and preferred, and our general partner was its wholly owned subsidiary. As part of the
separation from Atlas Energy on February 27, 2015, Atlas Energy contributed the common and preferred interests to Atlas Energy
Group.
We are required by our partnership agreement to distribute all of our “available cash,” as defined in our partnership agreement,
at the end of each quarter. “Available cash” is generally defined to include all our cash on hand at the end of any quarter, less reserves
established by our general partner, in its sole discretion to provide for the proper conduct of our business or to provide for future
distributions. Our general partner will be reimbursed for direct and indirect expenses incurred on our behalf.
We do not currently directly employ any persons to manage or operate our business. These functions are provided by employees
of Atlas Energy Group and/or its affiliates. Our general partner does not receive a management fee in connection with its management
of us apart from its class A units in us and its right to receive incentive distributions. We reimburse our general partner and its
affiliates for expenses they incur in managing our operations, and for an allocation of the compensation paid to our general partner’s
executive officers based upon an estimate of the time spent by such persons on activities for us. Other indirect costs, such as rent for
offices, are allocated to us by our general partner based on the number of its employees who devote substantially all of their time to
activities on our behalf. We reimburse our general partner at cost for direct costs incurred by them on our behalf. Our partnership
agreement provides that our general partner will determine the costs and expenses that are allocable to us at its sole discretion, and
does not set any aggregate limit on the amount of such reimbursements. We reimbursed Atlas Energy Group, our general partner, and
its affiliates $5.2 million for the year ended December 31, 2015 for compensation and benefits related to their employees.
In June 2015, we completed the acquisition of Atlas Energy Group’s coal-bed methane producing natural gas assets in the
Arkoma Basin in eastern Oklahoma for approximately $31.5 million, net of purchase price adjustments. We funded the purchase price
through the issuance of 6,500,000 common limited partner units.
In July 2013, in connection with the EP Energy Acquisition, we issued $86.6 million of our newly created Class C convertible
preferred units to Atlas Energy, at a negotiated price per unit of $23.10, which is the face value of the units. The Class C preferred
units pay cash distributions in an amount equal to the greater of (i) $0.51 per unit and (ii) the distributions payable on each common
unit at each declared quarterly distribution date. The Class C preferred units have no voting rights, except as set forth in the certificate
of designation for the Class C preferred units, which provides, among other things, that the affirmative vote of 75% of the Class C
Preferred Units is required to repeal such certificate of designation. Holders of the Class C preferred units have the right to convert the
Class C preferred units on a one-for-one basis, in whole or in part, into common units at any time before July 31, 2016. Unless
previously converted, all Class C preferred units will convert into common units on July 31, 2016. Upon issuance of the Class C
preferred units, Atlas Energy, as purchaser of the Class C preferred units, received 562,497 warrants to purchase our common units at
an exercise price equal to the face value of the Class C preferred units. The warrants were exercisable beginning October 29, 2013 into
an equal number of our common units at an exercise price of $23.10 per unit, subject to adjustments provided therein. The warrants
will expire on July 31, 2016. Atlas Energy contributed the Class C preferred units and the warrants to Atlas Energy Group in the
separation on February 27, 2015. We paid $7.8 million in distributions on the Class C convertible preferred units to Atlas Energy
Group for the year ended December 31, 2015.
Registration Rights
Under our partnership agreement, we have agreed to register for resale under the Securities Act and applicable state securities
laws any common units or other partnership securities proposed to be sold by our general partner or any of its affiliates if an
exemption from the registration requirements is not otherwise available. There is no limit on the number of times that we may be
required to file registration statements pursuant to this obligation. We have also agreed to include any securities held by our general
partner or any of its affiliates in any registration statement that we file to offer securities for cash, other than an offering relating solely
to an employee benefit plan. These registration rights continue for two years following any withdrawal or removal of our general
partner. We are obligated to pay all expenses incidental to the registration, excluding underwriting discounts and commissions. In
connection with any registration of this kind, we will indemnify the unitholders participating in the registration and their officers,
directors and controlling persons from and against specified liabilities, including under the Securities Act or any applicable state
securities laws.

183
Upon issuance of the Class C preferred units and warrants on July 31, 2013, we entered into a registration rights agreement
pursuant to which we agreed to file a registration statement with the SEC to register the resale of the common units issuable upon
conversion of the Class C preferred units and upon exercise of the warrants. We agreed to use commercially reasonable efforts to file
such registration statement within 90 days of the conversion of the Class C preferred units into common units or the exercise of the
warrants. We filed a registration statement to register for resale the common units underlying the Class C preferred units on March 17,
2015 and the registration statement was declared effective on March 27, 2015.
Relationship with Atlas Growth Partners
Eagle Ford Acquisition
On November 5, 2014, we, together with AGP, completed an acquisition of oil and NGL interests in the Eagle Ford Shale in
Atascosa County, Texas from Cinco Resources, Inc. and Cima Resources, LLC, a wholly owned subsidiary of Cinco (together
“Cinco”), for an aggregate purchase price of $342.0 million, net of purchase price adjustments (the “Eagle Ford Acquisition”). We
paid approximately $183.1 million in cash and AGP paid approximately $19.9 million at closing, and approximately $139.0 million
was to be paid in four quarterly installments beginning December 31, 2014. On December 31, 2014, AGP made its first installment
payment of $35.0 million. Prior to the March 31, 2015 installment, we, AGP, and Cinco amended the purchase and sale agreement to
alter the timing and amount of the quarterly payments beginning with the March 31, 2015 payment and ending December 31, 2015,
with no change to the overall purchase price. On March 31, 2015, AGP paid $28.3 million in cash and we issued $20.0 million of our
Class D Preferred Units to satisfy the second installment related to the Eagle Ford Acquisition. On June 30, 2015, AGP paid $16.0
million and we paid $0.6 million, in cash, to satisfy the third installment related to the Eagle Ford Acquisition.
On September 21, 2015, we and AGP agreed that we would fund AGP’s remaining two deferred purchase price installments of
$16.2 million and $20.1 million to be paid on September 30, 2015 and December 31, 2015, respectively. In conjunction therewith,
AGP assigned to us a portion of its non-operating Eagle Ford assets that had an allocated value (as such value was agreed upon by the
sellers and the buyers in connection with the Eagle Ford Acquisition) equal to both installments to be paid by us. As a result, our share
of the aggregate purchase price was $242.8 million, net of purchase price adjustments. The Eagle Ford Acquisition had an effective
date of July 1, 2014.
Sale of Oil and Natural Gas Properties
On July 8, 2015, AGP sold to us a portion of the wells it acquired in the Eagle Ford acquisition for a purchase price of $1.4
million, which represented its cost for the properties.
All of these transactions were approved by our and AGP’s respective independent conflicts committees.
Relationship with Resource America
Edward E. Cohen, our Chief Executive Officer, serves as Chairman of Resource America, Inc. (“Resource America”) and is a
greater than 10% shareholder, and Jonathan Z. Cohen, our Executive Chairman, serves as Chief Executive Officer and President of
Resource America and is a greater than 10% shareholder. Resource America subleases office space from us and paid us $0.1 million
for the fiscal year ended December 31, 2015. We reimbursed Resource America for other shared services and paid Resource America
$0.2 million for the fiscal year ended December 31, 2015.
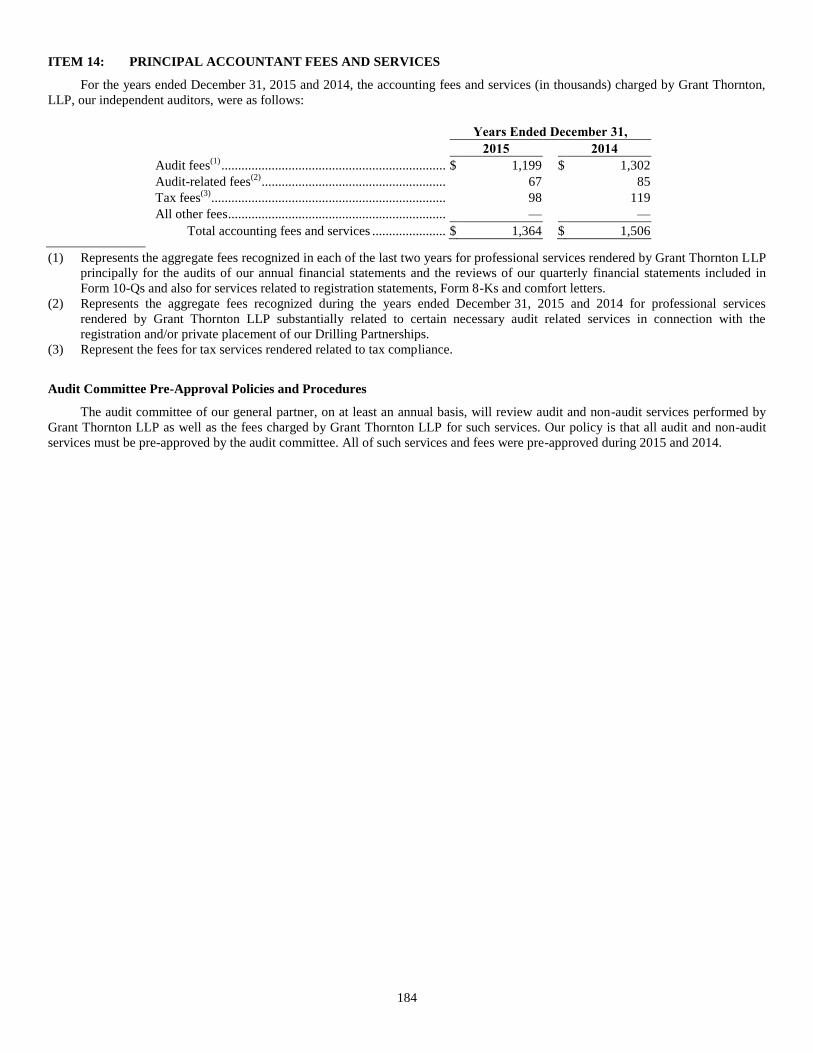
184
ITEM 14: PRINCIPAL ACCOUNTANT FEES AND SERVICES
For the years ended December 31, 2015 and 2014, the accounting fees and services (in thousands) charged by Grant Thornton,
LLP, our independent auditors, were as follows:
Years Ended December 31,
2015 2014
Audit fees(1)
................................................................... $ 1,199 $ 1,302
Audit-related fees(2)
....................................................... 67 85
Tax fees(3)
...................................................................... 98 119
All other fees ................................................................. — —
Total accounting fees and services ...................... $ 1,364 $ 1,506
(1) Represents the aggregate fees recognized in each of the last two years for professional services rendered by Grant Thornton LLP
principally for the audits of our annual financial statements and the reviews of our quarterly financial statements included in
Form 10-Qs and also for services related to registration statements, Form 8-Ks and comfort letters.
(2) Represents the aggregate fees recognized during the years ended December 31, 2015 and 2014 for professional services
rendered by Grant Thornton LLP substantially related to certain necessary audit related services in connection with the
registration and/or private placement of our Drilling Partnerships.
(3) Represent the fees for tax services rendered related to tax compliance.
Audit Committee Pre-Approval Policies and Procedures
The audit committee of our general partner, on at least an annual basis, will review audit and non-audit services performed by
Grant Thornton LLP as well as the fees charged by Grant Thornton LLP for such services. Our policy is that all audit and non-audit
services must be pre-approved by the audit committee. All of such services and fees were pre-approved during 2015 and 2014.

185
PART IV
ITEM 15: EXHIBITS AND FINANCIAL STATEMENT SCHEDULES
(a) The following documents are filed as part of this report:
(1) Financial Statements
The financial statements required by this Item 15(a)(1) are set forth in “Item 8: Financial Statements and Supplementary
Data”.
(2) Financial Statement Schedules
None
(3) Exhibits:
Exhibit No. Description
2.1(a)
Purchase and Sale Agreement, dated September 24, 2014, by and between Cinco Resources, Inc., Cima Resources, LLC,
ARP Eagle Ford, LLC, Atlas Growth Eagle Ford, LLC and Atlas Resource Partners, L.P. The schedules to the Purchase
and Sale Agreement have been omitted pursuant to Item 601(b) of Regulation S-K. A copy of the omitted schedules will
be furnished to the U.S. Securities and Exchange Commission supplementally upon request (30)
2.1(b)
First Amendment to Purchase and Sale Agreement dated October 27, 2014, by and between Cinco Resources, Inc., Cima
Resources, LLC, ARP Eagle Ford, LLC, Atlas Growth Eagle Ford, LLC and Atlas Resource Partners, L.P. (34)
2.1(c)
Second Amendment to Purchase and Sale Agreement dated March 31, 2015, by and between Cinco Resources, Inc.,
Cima Resources, LLC, ARP Eagle Ford, LLC, Atlas Growth Eagle Ford, LLC and Atlas Resource Partners,
L.P. (37)
2.2(a)
Shared Acquisition and Operating Agreement, dated September 24, 2014, by and among ARP Eagle Ford, LLC and
Atlas Growth Eagle Ford, LLC. The schedules to the Shared Acquisition and Operating Agreement have been omitted
pursuant to Item 601(b) of Regulation S-K. A copy of the omitted schedules will be furnished to the U.S. Securities and
Exchange Commission supplementally upon request (30)
2.2(b)
Amended and Restated Shared Acquisition and Operating Agreement, effective as of September 24, 2014, by and among
ARP Eagle Ford, LLC, Atlas Growth Eagle Ford, LLC and Atlas Eagle Ford Operating Company, LLC. The schedules
to the Amended and Restated Shared Acquisition and Operating Agreement have been omitted pursuant to Item 601(b)
of Regulation S-K. A copy of the omitted schedules will be furnished to the U.S. Securities and Exchange Commission
supplementally upon request.(14)
2.2(c)
Addendum #2 to the Amended and Restated Shared Acquisition and Operating Agreement by and among ARP Eagle
Ford, LLC, Atlas Growth Eagle Ford, LLC and Atlas Eagle Ford Operating Company, LLC, effective as of July 1, 2015.
The schedules to Addendum #2 to the Amended and Restated Shared Acquisition and Operating Agreement have been
omitted pursuant to Item 601(b) of Regulation S-K. A copy of the omitted schedules will be furnished to the U.S.
Securities and Exchange Commission supplementally upon request. (14)
2.2(d)
Addendum #3 to the Amended and Restated Shared Acquisition and Operating Agreement by and among ARP Eagle
Ford, LLC, Atlas Growth Eagle Ford, LLC and Atlas Eagle Ford Operating Company, LLC, effective as of September
30, 2015. The schedules to Addendum #3 to the Amended and Restated Shared Acquisition and Operating Agreement
have been omitted pursuant to Item 601(b) of Regulation S-K. A copy of the omitted schedules will be furnished to the
U.S. Securities and Exchange Commission supplementally upon request. (14)
2.3
Purchase and Sale Agreement, dated May 18, 2015, by and between New Atlas Holdings, LLC and ARP Production
Company, LLC. The schedules to the Purchase and Sale Agreement have been omitted pursuant to Item 601(b) of
Regulation S-K. A copy of the omitted schedules will be furnished to the U.S. Securities and Exchange Commission
supplementally upon request (40)
3.1 Certificate of Limited Partnership of Atlas Resource Partners, L.P.(2)
3.2(a) Amended and Restated Limited Partnership Agreement of Atlas Resource Partners, L.P.(4)
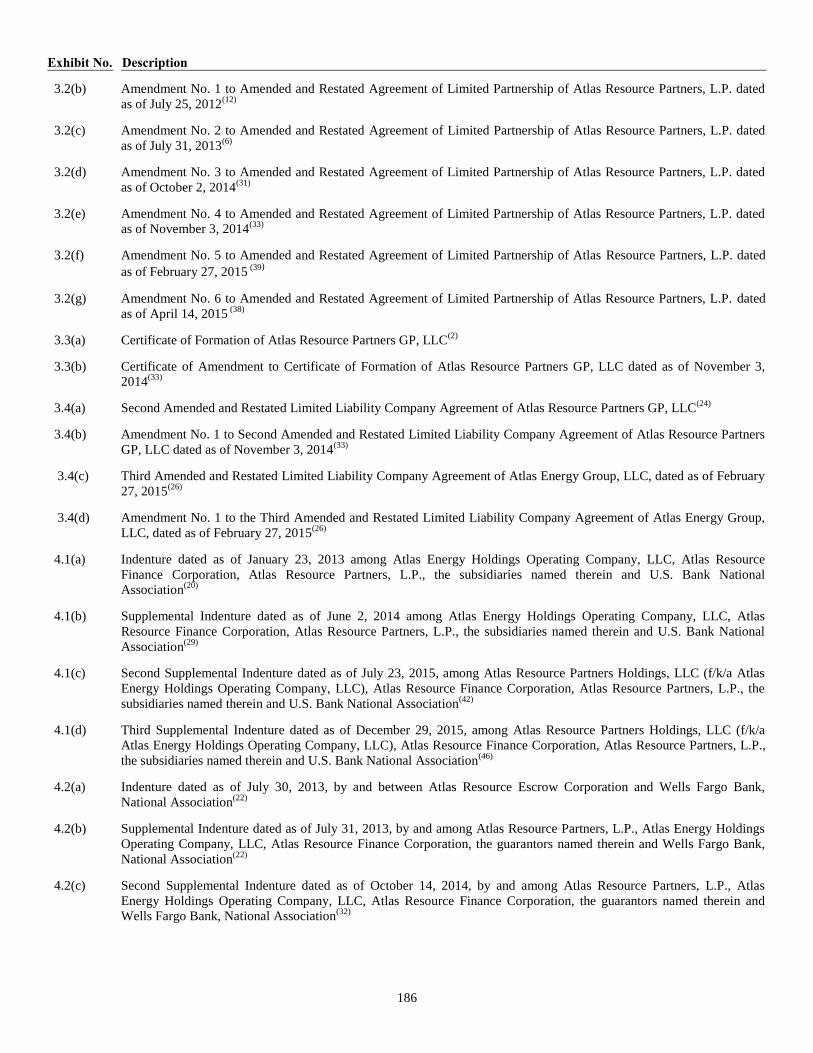
186
Exhibit No. Description
3.2(b)
Amendment No. 1 to Amended and Restated Agreement of Limited Partnership of Atlas Resource Partners, L.P. dated
as of July 25, 2012(12)
3.2(c)
Amendment No. 2 to Amended and Restated Agreement of Limited Partnership of Atlas Resource Partners, L.P. dated
as of July 31, 2013(6)
3.2(d)
Amendment No. 3 to Amended and Restated Agreement of Limited Partnership of Atlas Resource Partners, L.P. dated
as of October 2, 2014(31)
3.2(e)
Amendment No. 4 to Amended and Restated Agreement of Limited Partnership of Atlas Resource Partners, L.P. dated
as of November 3, 2014(33)
3.2(f)
Amendment No. 5 to Amended and Restated Agreement of Limited Partnership of Atlas Resource Partners, L.P. dated
as of February 27, 2015 (39)
3.2(g)
Amendment No. 6 to Amended and Restated Agreement of Limited Partnership of Atlas Resource Partners, L.P. dated
as of April 14, 2015 (38)
3.3(a) Certificate of Formation of Atlas Resource Partners GP, LLC(2)
3.3(b)
Certificate of Amendment to Certificate of Formation of Atlas Resource Partners GP, LLC dated as of November 3,
2014(33)
3.4(a) Second Amended and Restated Limited Liability Company Agreement of Atlas Resource Partners GP, LLC(24)
3.4(b)
Amendment No. 1 to Second Amended and Restated Limited Liability Company Agreement of Atlas Resource Partners
GP, LLC dated as of November 3, 2014(33)
3.4(c)
Third Amended and Restated Limited Liability Company Agreement of Atlas Energy Group, LLC, dated as of February
27, 2015(26)
3.4(d)
Amendment No. 1 to the Third Amended and Restated Limited Liability Company Agreement of Atlas Energy Group,
LLC, dated as of February 27, 2015(26)
4.1(a)
Indenture dated as of January 23, 2013 among Atlas Energy Holdings Operating Company, LLC, Atlas Resource
Finance Corporation, Atlas Resource Partners, L.P., the subsidiaries named therein and U.S. Bank National
Association(20)
4.1(b)
Supplemental Indenture dated as of June 2, 2014 among Atlas Energy Holdings Operating Company, LLC, Atlas
Resource Finance Corporation, Atlas Resource Partners, L.P., the subsidiaries named therein and U.S. Bank National
Association(29)
4.1(c)
Second Supplemental Indenture dated as of July 23, 2015, among Atlas Resource Partners Holdings, LLC (f/k/a Atlas
Energy Holdings Operating Company, LLC), Atlas Resource Finance Corporation, Atlas Resource Partners, L.P., the
subsidiaries named therein and U.S. Bank National Association(42)
4.1(d)
Third Supplemental Indenture dated as of December 29, 2015, among Atlas Resource Partners Holdings, LLC (f/k/a
Atlas Energy Holdings Operating Company, LLC), Atlas Resource Finance Corporation, Atlas Resource Partners, L.P.,
the subsidiaries named therein and U.S. Bank National Association(46)
4.2(a)
Indenture dated as of July 30, 2013, by and between Atlas Resource Escrow Corporation and Wells Fargo Bank,
National Association(22)
4.2(b)
Supplemental Indenture dated as of July 31, 2013, by and among Atlas Resource Partners, L.P., Atlas Energy Holdings
Operating Company, LLC, Atlas Resource Finance Corporation, the guarantors named therein and Wells Fargo Bank,
National Association(22)
4.2(c)
Second Supplemental Indenture dated as of October 14, 2014, by and among Atlas Resource Partners, L.P., Atlas
Energy Holdings Operating Company, LLC, Atlas Resource Finance Corporation, the guarantors named therein and
Wells Fargo Bank, National Association(32)

187
Exhibit No. Description
4.2(d)
Third Supplemental Indenture dated as of July 23, 2015, by and among Atlas Resource Partners, L.P., Atlas Resource
Partners Holdings, LLC (f/k/a Atlas Energy Holdings Operating Company, LLC), Atlas Resource Finance Corporation,
the guarantors named therein and Wells Fargo Bank, National Association(42)
4.2(e)
Fourth Supplemental Indenture dated as of December 17, 2015, by and among Atlas Resource Partners, L.P., Atlas
Resource Partners Holdings, LLC (f/k/a Atlas Energy Holdings Operating Company, LLC), Atlas Resource Finance
Corporation, the guarantors named therein and Wells Fargo Bank, National Association(47)
4.3
Certificate of Designation of the Powers, Preferences and Relative, Participating, Optional and Other Special Rights and
Qualifications, Limitations and Restrictions thereof of Class B Preferred Units, dated as of July 25, 2013(12)
4.4
Certificate of Designation of the Powers, Preferences and Relative, Participating, Optional and Other Special Rights and
Qualifications, Limitations and Restrictions thereof of Class C Convertible Preferred Units, dated as of July 31, 2013(6)
4.5 Warrant to Purchase Common Units(6)
4.6
Certificate of Designation of the Powers, Preferences and Relative, Participating, Optional and Other Special Rights and
Qualifications, Limitations and Restrictions thereof of 8.625% Class D Cumulative Redeemable Perpetual Preferred
Units, dated as of October 2, 2014(31)
4.7
Certificate of Designation of the Powers, Preferences and Relative, Participating, Optional and Other Special Rights and
Qualifications, Limitations and Restrictions thereof of Class E Cumulative Redeemable Perpetual Preferred Units, dated
as of April 14, 2015(38)
10.1
Secured Hedge Facility Agreement, among Atlas Resources, LLC, the participating partnerships from time to time party
thereto, the hedge providers from time to time party thereto and Wells Fargo Bank, N.A., as collateral agent for the
hedge providers(3)
10.2(a)
Second Amended and Restated Credit Agreement dated July 31, 2013 among Atlas Resource Partners, L.P., the lenders
party thereto and Wells Fargo Bank, N.A., as administrative agent for the lenders(6)
10.2(b)
First Amendment to Second Amended and Restated Credit Agreement dated December 6, 2013 among Atlas Resource
Partners, L.P., the lenders party thereto and Wells Fargo Bank, N.A., as administrative agent for the lenders(28)
10.2(c)
Third Amendment to Second Amended and Restated Credit Agreement dated June 30, 2014 among Atlas Resource
Partners, L.P., the lenders party thereto and Wells Fargo Bank, N.A., as administrative agent for the lenders(29)
10.2(d)
Fourth Amendment to Second Amended and Restated Credit Agreement dated September 24, 2014 among Atlas
Resource Partners, L.P., the lenders party thereto and Wells Fargo Bank, N.A., as administrative agent for the lenders(30)
10.2(e)
Fifth Amendment to Second Amended and Restated Credit Agreement dated November 24, 2014 among Atlas Resource
Partners, L.P., the lenders party thereto and Wells Fargo Bank, N.A., as administrative agent for the lenders(10)
10.2(f)
Sixth Amendment to Second Amended and Restated Credit Agreement, dated February 23, 2015, by and among Atlas
Resource Partners, L.P., Wells Fargo Bank, National Association, as administrative agent, and the lenders party
thereto(36)
10.2(g)
Seventh Amendment to Second Amended and Restated Credit Agreement dated as of July 24, 2015 among Atlas
Resource Partners, L.P., the lenders party thereto and Wells Fargo Bank, N.A., as administrative agent for the lenders
10.2(h)
Eighth Amendment to Second Amended and Restated Credit Agreement dated as of November 23, 2015 among Atlas
Resource Partners, L.P., the lenders party thereto and Wells Fargo Bank, N.A., as administrative agent for the lenders(25)
10.3
Second Lien Credit Agreement, dated February 23, 2015, by and among Atlas Resource Partners, L.P., Wilmington
Trust, National Association, as administrative agent, and the lenders party thereto(36)
10.4 2012 Long-Term Incentive Plan of Atlas Resource Partners, L.P. (4)
10.5 Form of Phantom Unit Grant Agreement under 2012 Long-Term Incentive Plan(8)
10.6 Form of Option Grant Agreement under 2012 Long-Term Incentive Plan(8)
10.7 Form of Phantom Unit Grant Agreement for Non-Employee Directors under 2012 Long-Term Incentive Plan(8)

188
Exhibit No. Description
10.8
Registration Rights Agreement, dated March 31, 2015, by and between Cinco Resources, Inc. and Atlas Resource
Partners, L.P.(37)
10.9
Amended and Restated Registration Rights Agreement, dated as of July 31, 2013, between Atlas Resource Partners,
L.P., Wells Fargo Bank, National Association and the lenders named in the Amended and Restated Credit Agreement
dated July 31, 2013 by and among Atlas Energy, L.P. and the lenders named therein(39)
10.10
Registration Rights Agreement dated as of June 2, 2014, by and among Atlas Resource Partners, L.P., Atlas Energy
Holdings Operating Company, LLC, Atlas Resource Finance Corporation, the guarantors named therein Wells Fargo
Securities, LLC and Deutsche Bank Securities, Inc (29)
10.11
Registration Rights Agreement dated as of July 31, 2013, by and among Atlas Energy, L.P. and Atlas Resource Partners,
L.P. (6)
10.12
Registration Rights Agreement dated as of October 14, 2014, by and among Atlas Resource Partners, L.P., Atlas Energy
Holdings Operating Company, LLC, Atlas Resource Finance Corporation, the guarantors named therein and Wells
Fargo Securities, LLC, for itself and on behalf of the Initial Purchasers (32)
10.13
Registration Rights Agreement dated as of February 27, 2015, by and between Atlas Resource Partners, L.P. and
Deutsche Bank AG New York Branch LLC (48)
10.14
Distribution Agreement dated as of August 29, 2014, between Atlas Resource Partners, L.P. and Deutsche Bank
Securities Inc., as representative of the several lenders(35)
10.15
Distribution Agreement dated as of November 13, 2015, between Atlas Resource Partners, L.P., MLV & Co. LLC and
FBR Capital Markets & Co. (43)
10.16
Employment Agreement among Atlas Energy Group, LLC, Atlas Resource Partners, L.P. and Edward E. Cohen, dated
September 4, 2015(44)
10.17
Employment Agreement among Atlas Energy Group, LLC, Atlas Resource Partners, L.P. and Jonathan Z. Cohen, dated
September 4, 2015(44)
10.18
Employment Agreement among Atlas Energy Group, LLC, Atlas Resource Partners, L.P. and Daniel C. Herz, dated
September 4, 2015(44)
10.19
Employment Agreement among Atlas Energy Group, LLC, Atlas Resource Partners, L.P. and Mark Schumacher, dated
September 4, 2015(44)
12.1 Statement of Computation of Ratio of Earnings to Fixed Charges
21.1 Subsidiaries of Atlas Resource Partners, L.P.
23.1 Consent of Grant Thornton LLP
23.2 Consent of Wright and Company, Inc.
23.3 Consent of Cawley, Gillespie, and Associates, Inc.
31.1 Rule 13(a)-14(a)/15(d)-14(a) Certification
31.2 Rule 13(a)-14(a)/15(d)-14(a) Certification
32.1 Section 1350 Certification
32.2 Section 1350 Certification
99.1 Atlas Resource Partners, L.P. - Partnership Agreement and Distribution Policy(45)
99.2 Summary Reserve Report of Wright & Company, Inc.
99.3 Rangely Summary Reserve Report of Cawley, Gillespie, and Associates, Inc.
101.INS XBRL Instance Document(27)

189
Exhibit No. Description
101.SCH XBRL Schema Document(27)
101.CAL XBRL Calculation Linkbase Document(27)
101.LAB XBRL Label Linkbase Document(27)
101.PRE XBRL Presentation Linkbase Document(27)
101.DEF XBRL Definition Linkbase Document(27)
(1) Previously filed as an exhibit to our Current Report on Form 8-K filed on May 31, 2013.
(2) Previously filed as an exhibit to our Registration Statement on Form 10, as amended (File No. 1-35317).
(3) Previously filed as an exhibit to our Current Report on Form 8-K filed on March 7, 2012.
(4) Previously filed as an exhibit to our Current Report on Form 8-K filed on March 14, 2012.
(5) Previously filed as an exhibit to Atlas Energy’s Quarterly Report on Form 10-Q for the quarter ended March 31, 2011.
(6) Previously filed as an exhibit to our Current Report on Form 8-K filed on August 6, 2013
(7) Previously filed as an exhibit to Atlas Energy’s Annual Report on Form 10-K for the year ended December 31, 2011.
(8) Previously filed as an exhibit to our Annual Report on Form 10-K filed for the year ended December 31, 2011.
(9) Previously filed as an exhibit to our Current Report on Form 8-K filed on March 21, 2012.
(10) Previously filed as an exhibit to our Current Report on Form 8-K filed on November 25, 2014.
(11) Previously filed as an exhibit to our Current Report on Form 8-K filed on May 10, 2013.
(12) Previously filed as an exhibit to our Current Report on Form 8-K filed on July 26, 2012.
(13) Previously filed as an exhibit to our Quarterly Report on Form 10-Q for the quarter ended June 30, 2012.
(14) Previously filed as an exhibit to our quarterly report on Form 10-Q for the quarter ended September 30, 2015.
(15) Previously filed as an exhibit to our Current Report on Form 8-K filed on December 26, 2012.
(16) Previously filed as an exhibit to our Current Report on Form 8-K filed on January 11, 2013.
(17) Previously filed as an exhibit to our Current Report on Form 8-K filed on January 17, 2013.
(18) Previously filed as an exhibit to our Quarterly Report on Form 10-Q for the quarter ended March 31, 2012.
(19) Previously filed as an exhibit to our Current Report on Form 8-K filed on November 27, 2012.
(20) Previously filed as an exhibit to our Current Report on Form 8-K filed on January 25, 2013.
(21) Previously filed as an exhibit to our Current Report on Form 8-K filed on June 14, 2013.
(22) Previously filed as an exhibit to our Current Report on Form 8-K filed on August 2, 2013.
(23) Previously filed as an exhibit to Atlas Energy’s Quarterly Report on Form 10-Q for the quarter ended June 30, 2013.
(24) Previously filed as an exhibit to our quarterly report on Form 10-Q for the quarter ended September 30, 2013.
(25) Previously filed as an exhibit to our Current Report on Form 8-K filed on November 25, 2015.
(26) Previously filed as an exhibit to Atlas Energy Group, LLC’s current report on Form 8-K filed on March 2, 2015.
(27) Attached as Exhibit 101 to this report are documents formatted in XBRL (Extensible Business Reporting Language). The
financial information contained in the XBRL-related documents is “unaudited” or “unreviewed”.
(28) Previously filed as an exhibit to our Annual Report on Form 10-K filed for the year ended December 31, 2013.
(29) Previously filed as an exhibit to our current report on Form 8-K filed on June 3, 2014.
(30) Previously filed as an exhibit to our current report on Form 8-K filed on September 30, 2014.
(31) Previously filed as an exhibit to our current report on Form 8-K filed on October 2, 2014.
(32) Previously filed as an exhibit to our current report on Form 8-K filed on October 15, 2014.
(33) Previously filed as an exhibit to our current report on Form 8-K filed on November 5, 2014.
(34) Previously filed as an exhibit to our current report on Form 8-K filed on November 6, 2014.
(35) Previously filed as an exhibit to our current report on Form 8-K filed on August 29, 2014.
(36) Previously filed as an exhibit to our current report on Form 8-K filed on February 23, 2015.
(37) Previously filed as an exhibit to our current report on Form 8-K filed on April 6, 2015.
(38) Previously filed as an exhibit to our registration statement on Form 8-A filed on April 14, 2015.
(39) Previously filed as an exhibit to our Annual Report on Form 10-K for the year ended December 31, 2014.
(40) Previously filed as an exhibit to our Current Report on Form 8-K filed on May 22, 2015.
(41) Previously filed as an exhibit to our Current Report on Form 8-K filed on June 2, 2015.
(42) Previously filed as an exhibit to our Quarterly Report on Form 10-Q for the quarter ended June 30, 2015.
(43) Previously filed as an exhibit to our Current Report on Form 8-K filed on November 13, 2015.
(44) Previously filed as an exhibit to our Current Report on Form 8-K filed on September 4, 2015.
(45) Previously filed as an exhibit to our Quarterly Report on Form 10-Q for the quarter ended March 31, 2015.
(46) Previously filed as an exhibit to our Current Report on Form 8-K filed on January 5, 2016.
(47) Previously filed as an exhibit to our Current Report on Form 8-K filed on December 23, 2015.

190
(48) Previously filed as an exhibit to our Current Report on Form 8-K filed on March 2, 2015.
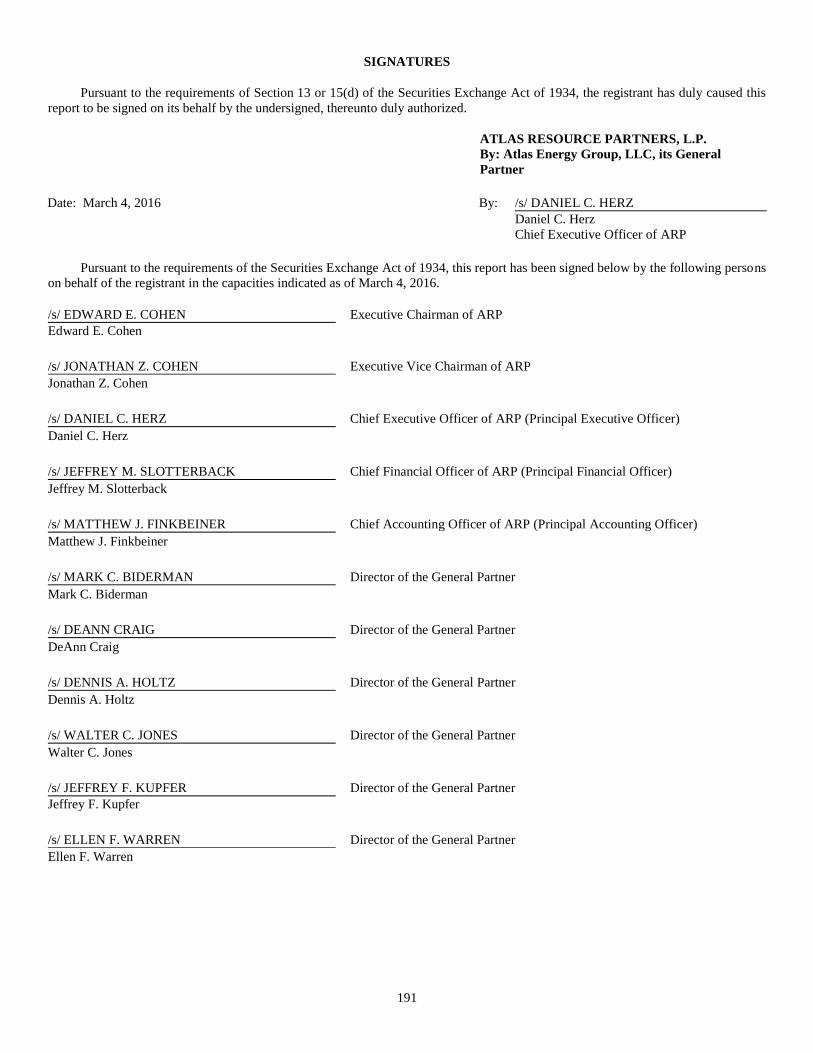
191
SIGNATURES
Pursuant to the requirements of Section 13 or 15(d) of the Securities Exchange Act of 1934, the registrant has duly caused this
report to be signed on its behalf by the undersigned, thereunto duly authorized.
ATLAS RESOURCE PARTNERS, L.P.
By: Atlas Energy Group, LLC, its General
Partner
Date: March 4, 2016 By: /s/ DANIEL C. HERZ
Daniel C. Herz
Chief Executive Officer of ARP
Pursuant to the requirements of the Securities Exchange Act of 1934, this report has been signed below by the following persons
on behalf of the registrant in the capacities indicated as of March 4, 2016.
/s/ EDWARD E. COHEN Executive Chairman of ARP
Edward E. Cohen
/s/ JONATHAN Z. COHEN Executive Vice Chairman of ARP
Jonathan Z. Cohen
/s/ DANIEL C. HERZ Chief Executive Officer of ARP (Principal Executive Officer)
Daniel C. Herz
/s/ JEFFREY M. SLOTTERBACK Chief Financial Officer of ARP (Principal Financial Officer)
Jeffrey M. Slotterback
/s/ MATTHEW J. FINKBEINER Chief Accounting Officer of ARP (Principal Accounting Officer)
Matthew J. Finkbeiner
/s/ MARK C. BIDERMAN Director of the General Partner
Mark C. Biderman
/s/ DEANN CRAIG Director of the General Partner
DeAnn Craig
/s/ DENNIS A. HOLTZ Director of the General Partner
Dennis A. Holtz
/s/ WALTER C. JONES Director of the General Partner
Walter C. Jones
/s/ JEFFREY F. KUPFER Director of the General Partner
Jeffrey F. Kupfer
/s/ ELLEN F. WARREN Director of the General Partner
Ellen F. Warren

Exhibit 10.2(g)
SEVENTH AMENDMENT TO
SECOND AMENDED AND RESTATED CREDIT AGREEMENT
dated as of
July 24, 2015
among
ATLAS RESOURCE PARTNERS, L.P.,
as Borrower,
THE LENDERS PARTY HERETO,
and
WELLS FARGO BANK, NATIONAL ASSOCIATION,
as Administrative Agent
JPMORGAN CHASE BANK, N.A., and
BANK OF AMERICA, N.A.,
as Co-Documentation Agents
WELLS FARGO SECURITIES, LLC,
DEUTSCHE BANK SECURITIES INC., and
CITIBANK GLOBAL MARKETS, INC.,
as Joint Lead Arrangers and Joint Bookrunners
3623924v.3 WEL554/10008
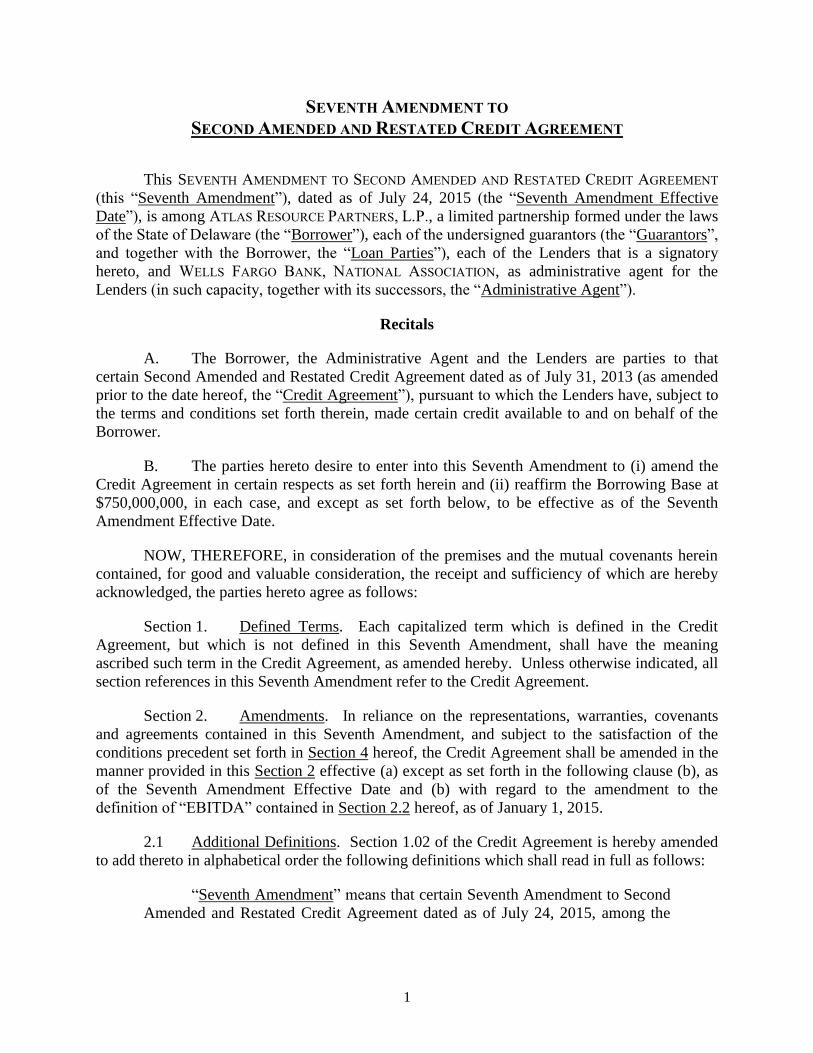
1
SEVENTH AMENDMENT TO
SECOND AMENDED AND RESTATED CREDIT AGREEMENT
This SEVENTH AMENDMENT TO SECOND AMENDED AND RESTATED CREDIT AGREEMENT
(this “Seventh Amendment”), dated as of July 24, 2015 (the “Seventh Amendment Effective
Date”), is among ATLAS RESOURCE PARTNERS, L.P., a limited partnership formed under the laws
of the State of Delaware (the “Borrower”), each of the undersigned guarantors (the “Guarantors”,
and together with the Borrower, the “Loan Parties”), each of the Lenders that is a signatory
hereto, and WELLS FARGO BANK, NATIONAL ASSOCIATION, as administrative agent for the
Lenders (in such capacity, together with its successors, the “Administrative Agent”).
Recitals
A. The Borrower, the Administrative Agent and the Lenders are parties to that
certain Second Amended and Restated Credit Agreement dated as of July 31, 2013 (as amended
prior to the date hereof, the “Credit Agreement”), pursuant to which the Lenders have, subject to
the terms and conditions set forth therein, made certain credit available to and on behalf of the
Borrower.
B. The parties hereto desire to enter into this Seventh Amendment to (i) amend the
Credit Agreement in certain respects as set forth herein and (ii) reaffirm the Borrowing Base at
$750,000,000, in each case, and except as set forth below, to be effective as of the Seventh
Amendment Effective Date.
NOW, THEREFORE, in consideration of the premises and the mutual covenants herein
contained, for good and valuable consideration, the receipt and sufficiency of which are hereby
acknowledged, the parties hereto agree as follows:
Section 1. Defined Terms. Each capitalized term which is defined in the Credit
Agreement, but which is not defined in this Seventh Amendment, shall have the meaning
ascribed such term in the Credit Agreement, as amended hereby. Unless otherwise indicated, all
section references in this Seventh Amendment refer to the Credit Agreement.
Section 2. Amendments. In reliance on the representations, warranties, covenants
and agreements contained in this Seventh Amendment, and subject to the satisfaction of the
conditions precedent set forth in Section 4 hereof, the Credit Agreement shall be amended in the
manner provided in this Section 2 effective (a) except as set forth in the following clause (b), as
of the Seventh Amendment Effective Date and (b) with regard to the amendment to the
definition of “EBITDA” contained in Section 2.2 hereof, as of January 1, 2015.
2.1 Additional Definitions. Section 1.02 of the Credit Agreement is hereby amended
to add thereto in alphabetical order the following definitions which shall read in full as follows:
“Seventh Amendment” means that certain Seventh Amendment to Second
Amended and Restated Credit Agreement dated as of July 24, 2015, among the
2
Borrower, the Guarantors, the Administrative Agent and the Lenders party
thereto.
2.2 Restated Definitions. The definitions of “EBITDA” and “Loan Documents”
contained in Section 1.02 of the Credit Agreement are hereby amended and restated in their
entirety to read in full as follows:
“EBITDA” means, for any period, an amount determined for the Borrower
and the Restricted Subsidiaries determined on a consolidated basis in accordance
with Section 1.05 equal to (a) the sum of (i) Consolidated Net Income for such
period, plus, (ii) without duplication and to the extent deducted from Consolidated
Net Income in such period, (A) interest, income taxes, depreciation, depletion,
amortization, goodwill and other impairment, non-cash compensation on long-
term incentive plans, non-cash losses including non-cash losses resulting from
mark to market accounting of Swap Agreements, (B) reasonable and customary
fees and expenses incurred or paid in connection with the consummation of the
Transactions, the EP Acquisition and other acquisition transactions not prohibited
by the terms of this Agreement or the other Loan Documents, (C) any net loss
from disposed or discontinued operations, and (D) Restricted Payments made in
respect of preferred Equity Interests of the Borrower permitted under Section 9.04
during such period, plus (iii) to the extent not included in Consolidated Net
Income during such period, any settlement payment in connection with Swap
Agreements received in cash by the Borrower or any Restricted Subsidiary during
such period minus (b) the sum of (i) to the extent included in Consolidated Net
Income, non-cash gains including non-cash gains resulting from mark to market
accounting of Swap Agreements, plus (ii) to the extent not deducted in
Consolidated Net Income during such period, any settlement payment in
connection with Swap Agreements paid in cash by the Borrower or any Restricted
Subsidiary during such period; provided that the Partnership Oil and Gas Margin
for any period shall not exceed 15% of the Consolidated Gross Margin for such
period (and, if applicable, EBITDA shall be reduced by deducting any portions of
Consolidated Net Income that are attributable to Partnership Oil and Gas Margin
in excess of such percentage).
“Loan Documents” means this Agreement, the First Amendment, the
Second Amendment, the Third Amendment, the Fourth Amendment, the Fifth
Amendment, the Sixth Amendment, the Seventh Amendment, the Notes, if any,
the Letter of Credit Agreements, the Letters of Credit, the Security Instruments,
the Intercreditor Agreement, the Second Lien Intercreditor Agreement, and any
and all other material agreements or instruments now or hereafter executed and
delivered by any Loan Party or any other Person (other than Swap Agreements or
agreements regarding the provision of Bank Products with the Lenders or any
Affiliate of a Lender or participation or similar agreements between any Lender
and any other lender or creditor with respect to any Indebtedness pursuant to this
Agreement) in connection with the Indebtedness, this Agreement and the
transactions contemplated hereby, as such agreements may be amended, modified,
supplemented or restated from time to time.
3
Section 3. Borrowing Base Reaffirmation. The Borrowing Base is hereby
reaffirmed, effective as of the Seventh Amendment Effective Date, at $750,000,000, and shall
remain at $750,000,000 until the next Scheduled Redetermination, Interim Redetermination or
other redetermination or adjustment of the Borrowing Base thereafter, whichever occurs first
pursuant to the Credit Agreement as amended hereby. The Loan Parties, the Administrative
Agent and the Lenders agree that the redetermination of the Borrowing Base provided for in this
Section 3 shall constitute the Scheduled Redetermination of the Borrowing Base scheduled for
on or about July 1, 2015 and shall not be considered or deemed to be an Interim Redetermination
for purposes of Section 2.07 of the Credit Agreement.
Section 4. Conditions Precedent. The effectiveness of the amendments contained in
Section 2 hereof and the reaffirmation of the Borrowing Base set forth in Section 3 hereof is
subject to the following:
4.1 The Administrative Agent shall have received duly executed counterparts of this
Seventh Amendment from the Loan Parties and the Super Majority Lenders.
4.2 The Administrative Agent shall have received all fees and other amounts due and
payable on or prior to the Seventh Amendment Effective Date.
4.3 The conditions set forth in Section 6.02(a)(i) and (ii) of the Credit Agreement
shall be satisfied.
Section 5. Miscellaneous.
5.1 Confirmation and Effect. The provisions of the Credit Agreement (as amended
by this Seventh Amendment) shall remain in full force and effect in accordance with its terms
following the effectiveness of this Seventh Amendment, and this Seventh Amendment shall not
constitute a waiver of any provision of the Credit Agreement or any other Loan Document,
except as expressly provided for herein. Each reference in the Credit Agreement to “this
Agreement”, “hereunder”, “hereof’, “herein”, or words of like import shall mean and be a
reference to the Credit Agreement as amended hereby, and each reference to the Credit
Agreement in any other document, instrument or agreement executed and/or delivered in
connection with the Credit Agreement shall mean and be a reference to the Credit Agreement as
amended hereby.
5.2 Ratification and Affirmation of Loan Parties. Each of the Loan Parties hereby
expressly (a) acknowledges the terms of this Seventh Amendment, (b) ratifies and affirms its
obligations under the Guaranty Agreement and the other Loan Documents to which it is a party,
(c) acknowledges, renews and extends its continued liability under the Guaranty Agreement and
the other Loan Documents to which it is a party, (d) agrees that its guarantee under the Guaranty
Agreement and the other Loan Documents to which it is a party remains in full force and effect
with respect to the Indebtedness as amended hereby, (e) represents and warrants to the Lenders
and the Administrative Agent that each representation and warranty of such Loan Party
contained in the Credit Agreement and the other Loan Documents to which it is a party is true
and correct in all material respects as of the date hereof and after giving effect to the
amendments set forth in Section 2 hereof (other than representations and warranties that were
4
made as of a specific date, in which case such representations and warranties were true and
correct in all material respects when made), (f) represents and warrants to the Lenders and the
Administrative Agent that the execution, delivery and performance by such Loan Party of this
Seventh Amendment are within such Loan Party’s corporate, limited partnership or limited
liability company powers (as applicable), have been duly authorized by all necessary action and
that this Seventh Amendment constitutes the valid and binding obligation of such Loan Party
enforceable in accordance with its terms, except as the enforceability thereof may be limited by
bankruptcy, insolvency or similar laws affecting creditor’s rights generally, and (g) represents
and warrants to the Lenders and the Administrative Agent that immediately before and after
giving effect to this Seventh Amendment, no Default, Event of Default or Borrowing Base
Deficiency exists.
5.3 Counterparts. This Seventh Amendment may be executed by one or more of the
parties hereto in any number of separate counterparts, and all of such counterparts taken together
shall be deemed to constitute one and the same instrument. Delivery of this Seventh Amendment
by facsimile or electronic (e.g. pdf) transmission shall be effective as delivery of a manually
executed original counterpart hereof.
5.4 No Oral Agreement. THIS WRITTEN SEVENTH AMENDMENT, THE CREDIT
AGREEMENT AND THE OTHER LOAN DOCUMENTS EXECUTED IN CONNECTION HEREWITH AND
THEREWITH REPRESENT THE FINAL AGREEMENT BETWEEN THE PARTIES AND MAY NOT BE
CONTRADICTED BY EVIDENCE OF PRIOR, CONTEMPORANEOUS, OR UNWRITTEN ORAL AGREEMENTS
OF THE PARTIES. THERE ARE NO SUBSEQUENT ORAL AGREEMENTS BETWEEN THE PARTIES.
5.5 Governing Law. THIS SEVENTH AMENDMENT (INCLUDING, BUT NOT LIMITED TO,
THE VALIDITY AND ENFORCEABILITY HEREOF) SHALL BE GOVERNED BY, AND CONSTRUED IN
ACCORDANCE WITH, THE LAWS OF THE STATE OF NEW YORK.
5.6 Payment of Expenses. The Borrower agrees to pay or reimburse the
Administrative Agent for all of its reasonable and documented out-of-pocket costs and expenses
incurred in connection with this Seventh Amendment, any other documents prepared in
connection herewith and the transactions contemplated hereby, including, without limitation, the
reasonable fees and disbursements of counsel to the Administrative Agent.
5.7 Severability. Any provision of this Seventh Amendment which is prohibited or
unenforceable in any jurisdiction shall, as to such jurisdiction, be ineffective to the extent of such
prohibition or unenforceability without invalidating the remaining provisions hereof, and any
such prohibition or unenforceability in any jurisdiction shall not invalidate or render
unenforceable such provision in any other jurisdiction.
5.8 Successors and Assigns. This Seventh Amendment shall be binding upon and
inure to the benefit of the parties hereto and their respective successors and assigns.
5.9 FATCA. For purposes of determining withholding Taxes imposed under
FATCA, from and after the Seventh Amendment Effective Date, the Borrower and the
Administrative Agent shall treat (and the Lenders hereby authorize the Administrative Agent to

5
treat) the Credit Agreement as not qualifying as a “grandfathered obligation” within the meaning
of Treasury Regulation Section 1.1471-2(b)(2)(i).
[Signature pages follow]
SIGNATURE PAGE TO SEVENTH AMENDMENT TO SECOND AMENDED AND RESTATED CREDIT AGREEMENT
ATLAS RESOURCE PARTNERS, L.P.
The parties hereto have caused this Seventh Amendment to be duly executed as of the
day and year first above written.
BORROWER: ATLAS RESOURCE PARTNERS, L.P.
By: Atlas Energy Group, LLC,
its general partner
By:/s/ Sean McGrath
Name: Sean McGrath
Title: Chief Financial Officer
SIGNATURE PAGE TO SEVENTH AMENDMENT TO SECOND AMENDED AND RESTATED CREDIT AGREEMENT
ATLAS RESOURCE PARTNERS, L.P.
ATLAS ENERGY HOLDINGS OPERATING
COMPANY, LLC, a Delaware limited liability
company
ATLAS ENERGY COLORADO, LLC, a Colorado
limited liability company
ATLAS ENERGY INDIANA, LLC, an Indiana limited
liability company
ATLAS ENERGY OHIO, LLC, an Ohio limited
liability company
ATLAS ENERGY TENNESSEE, LLC, a
Pennsylvania limited liability company
ATLAS NOBLE, LLC, a Delaware limited liability company
ATLAS RESOURCES, LLC, a Pennsylvania limited
liability company
REI-NY, LLC, a Delaware limited liability company
RESOURCE ENERGY, LLC, a Delaware limited
liability company
RESOURCE WELL SERVICES, LLC, a Delaware
limited liability company
VIKING RESOURCES, LLC, a Pennsylvania limited
liability company
ARP BARNETT, LLC, a Delaware limited liability
company
ARP OKLAHOMA, LLC, an Oklahoma limited
liability company
ARP BARNETT PIPELINE, LLC, a Delaware limited
liability company
ATLAS BARNETT, LLC, a Texas limited liability
company
ARP PRODUCTION COMPANY, LLC, a Delaware
limited liability company
ARP MOUNTAINEER PRODUCTION, LLC, a
Delaware limited liability company
ARP RANGELY PRODUCTION, LLC, a Delaware
limited liability company
ARP EAGLE FORD, LLC, a Texas limited liability company
ATLS PRODUCTION COMPANY, LLC, a Delaware
limited liability company
By: /s/ Sean McGrath
Sean McGrath
Chief Financial Officer
SIGNATURE PAGE TO SEVENTH AMENDMENT TO SECOND AMENDED AND RESTATED CREDIT AGREEMENT
ATLAS RESOURCE PARTNERS, L.P.
WELLS FARGO BANK, NATIONAL
ASSOCIATION, as a Lender, as Administrative
Agent and an Issuing Bank
By:/s/ Matthew W. Coleman
Matthew W. Coleman
Director

SIGNATURE PAGE TO SEVENTH AMENDMENT TO SECOND AMENDED AND RESTATED CREDIT AGREEMENT
ATLAS RESOURCE PARTNERS, L.P.
CITIBANK, N.A., as a Lender and an
Issuing Bank
By: /s/ Phil Ballard
Name: Phil Ballard
Title: Vice President

SIGNATURE PAGE TO SEVENTH AMENDMENT TO SECOND AMENDED AND RESTATED CREDIT AGREEMENT
ATLAS RESOURCE PARTNERS, L.P.
JPMORGAN CHASE BANK, N.A.,
as a Lender and an Issuing Bank
By: /s/ Linda Papadakis
Name: Linda Papadakis
Title: Authorized Officer

SIGNATURE PAGE TO SEVENTH AMENDMENT TO SECOND AMENDED AND RESTATED CREDIT AGREEMENT
ATLAS RESOURCE PARTNERS, L.P.
BANK OF AMERICA, N.A., as a Lender
By: /s/ Kenneth Phelan
Name: Kenneth Phelan
Title: Vice President
SIGNATURE PAGE TO SEVENTH AMENDMENT TO SECOND AMENDED AND RESTATED CREDIT AGREEMENT
ATLAS RESOURCE PARTNERS, L.P.
NATIXIS, as a Lender
By: /s/ Stuart Murray
Name: Stuart Murray
Title: Managing Director
By: /s/ Andrew Keene
Name: Andrew Keene
Title: Vice President
SIGNATURE PAGE TO SEVENTH AMENDMENT TO SECOND AMENDED AND RESTATED CREDIT AGREEMENT
ATLAS RESOURCE PARTNERS, L.P.
SANTANDER BANK, N.A., formerly
known as Sovereign Bank, N.A., as a
Lender
By: /s/ Aidan Lanigan
Name: Aidan Lanigan
Title: Senior Vice President
By: /s/ Puiki Lok
Name: Puiki Lok
Title: Vice President

SIGNATURE PAGE TO SEVENTH AMENDMENT TO SECOND AMENDED AND RESTATED CREDIT AGREEMENT
ATLAS RESOURCE PARTNERS, L.P.
CAPITAL ONE, NATIONAL
ASSOCIATION, as a Lender
By: /s/ Nancy Mak
Name: Nancy Mak
Title: Senior Vice President

SIGNATURE PAGE TO SEVENTH AMENDMENT TO SECOND AMENDED AND RESTATED CREDIT AGREEMENT
ATLAS RESOURCE PARTNERS, L.P.
DEUTSCHE BANK AG NEW YORK
BRANCH, as a Lender
By: /s/ Benjamin Souh
Name: Benjamin Souh
Title: Vice President
By: /s/ Keith C. Braun
Name: Keith C. Braun
Title: Managing Director
SIGNATURE PAGE TO SEVENTH AMENDMENT TO SECOND AMENDED AND RESTATED CREDIT AGREEMENT
ATLAS RESOURCE PARTNERS, L.P.
COMERICA BANK, as a Lender
By: /s/ John S. Lesikar
Name: John S. Lesikar
Title: Senior Vice President

SIGNATURE PAGE TO SEVENTH AMENDMENT TO SECOND AMENDED AND RESTATED CREDIT AGREEMENT
ATLAS RESOURCE PARTNERS, L.P.
ABN AMRO CAPITAL USA LLC, as a
Lender
By: /s/ Darrell Holley
Name: Darrell Holley
Title: Managing Director
By: /s/Elizabeth Johnson
Name: Elizabeth Johnson
Title: Director

SIGNATURE PAGE TO SEVENTH AMENDMENT TO SECOND AMENDED AND RESTATED CREDIT AGREEMENT
ATLAS RESOURCE PARTNERS, L.P.
SUNTRUST BANK, as a Lender
By: /s/ Shannon Juhan
Name: Shannon Juhan
Title: Director
SIGNATURE PAGE TO SEVENTH AMENDMENT TO SECOND AMENDED AND RESTATED CREDIT AGREEMENT
ATLAS RESOURCE PARTNERS, L.P.
ROYAL BANK OF CANADA, as a
Lender
By: /s/ Evans Swann, Jr.
Name: Evans Swann, Jr.
Title: Authorized Signatory

SIGNATURE PAGE TO SEVENTH AMENDMENT TO SECOND AMENDED AND RESTATED CREDIT AGREEMENT
ATLAS RESOURCE PARTNERS, L.P.
COMPASS BANK, as a Lender
By: /s/ Umar Hassan
Name: Umar Hassan
Title: Senior Vice President
SIGNATURE PAGE TO SEVENTH AMENDMENT TO SECOND AMENDED AND RESTATED CREDIT AGREEMENT
ATLAS RESOURCE PARTNERS, L.P.
CADENCE BANK, N.A., as a Lender
By: /s/ Steven Taylor
Name: Steven Taylor
Title: Vice President
SIGNATURE PAGE TO SEVENTH AMENDMENT TO SECOND AMENDED AND RESTATED CREDIT AGREEMENT
ATLAS RESOURCE PARTNERS, L.P.
CANADIAN IMPERIAL BANK OF
COMMERCE, NEW YORK BRANCH,
as a Lender
By: /s/ Daria Mahoney
Name: Daria Mahoney
Title: Authorized Signatory
By: /s/ William M. Reid
Name: William M. Reid
Title: Authorized Signatory
SIGNATURE PAGE TO SEVENTH AMENDMENT TO SECOND AMENDED AND RESTATED CREDIT AGREEMENT
ATLAS RESOURCE PARTNERS, L.P.
ING CAPITAL LLC, as a Lender
By: /s/ Scott Lamoreaux ___________
Name: Scott Lamoreaux
Title: Director

SIGNATURE PAGE TO SEVENTH AMENDMENT TO SECOND AMENDED AND RESTATED CREDIT AGREEMENT
ATLAS RESOURCE PARTNERS, L.P.
THE HUNTINGTON NATIONAL
BANK, as a Lender
By: /s/ Stephen Hoffman_______
Name: Stephen Hoffman
Title: Managing Director

SIGNATURE PAGE TO SEVENTH AMENDMENT TO SECOND AMENDED AND RESTATED CREDIT AGREEMENT
ATLAS RESOURCE PARTNERS, L.P.
BRANCH BANKING AND TRUST
COMPANY, as a Lender
By: /s/ Ryan K. Michael___________
Name: Ryan K. Michael
Title: Senior Vice President

SIGNATURE PAGE TO SEVENTH AMENDMENT TO SECOND AMENDED AND RESTATED CREDIT AGREEMENT
ATLAS RESOURCE PARTNERS, L.P.
THE BANK OF NOVA SCOTIA, as a
Lender
By: /s/ Alan Dawson___________
Name: Alan Dawson
Title: Director

SIGNATURE PAGE TO SEVENTH AMENDMENT TO SECOND AMENDED AND RESTATED CREDIT AGREEMENT
ATLAS RESOURCE PARTNERS, L.P.
WHITNEY BANK, as a Lender
By: /s/ Liana Tehernysheva
Name: Liana Tehernysheva
Title: Senior Vice President

SIGNATURE PAGE TO SEVENTH AMENDMENT TO SECOND AMENDED AND RESTATED CREDIT AGREEMENT
ATLAS RESOURCE PARTNERS, L.P.
PNC BANK, NATIONAL
ASSOCIATION, as a Lender
By: /s/ Jonathan Luchansky
Name: Jonathan Luchansky
Title: Vice President

SIGNATURE PAGE TO SEVENTH AMENDMENT TO SECOND AMENDED AND RESTATED CREDIT AGREEMENT
ATLAS RESOURCE PARTNERS, L.P.
ONEWEST BANK N.A., as a Lender
By: /s/ Whitney Randolph
Name: Whitney Randolph
Title: Senior Vice President
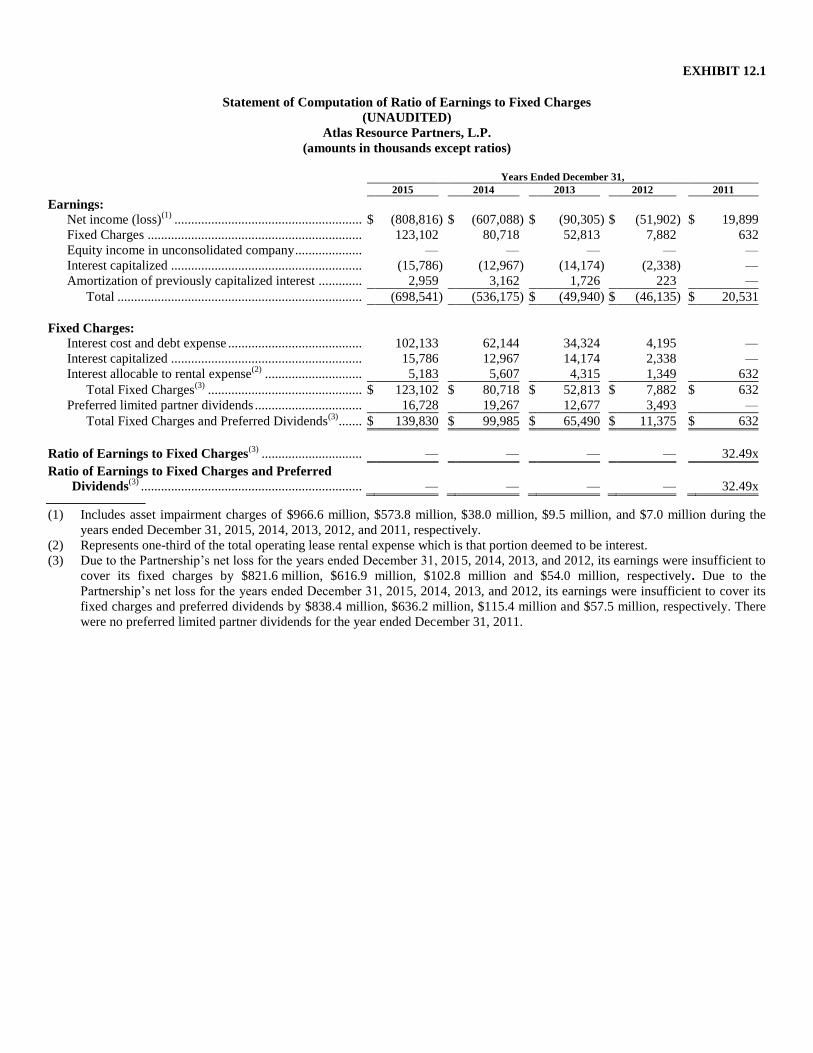
EXHIBIT 12.1
Statement of Computation of Ratio of Earnings to Fixed Charges
(UNAUDITED)
Atlas Resource Partners, L.P.
(amounts in thousands except ratios) Years Ended December 31,
2015 2014 2013 2012 2011
Earnings:
Net income (loss)(1)
........................................................ $ (808,816 ) $ (607,088 ) $ (90,305 ) $ (51,902 ) $ 19,899
Fixed Charges ................................................................ 123,102 80,718 52,813 7,882 632
Equity income in unconsolidated company .................... — — — — —
Interest capitalized ......................................................... (15,786 ) (12,967 ) (14,174 ) (2,338 ) —
Amortization of previously capitalized interest ............. 2,959 3,162 1,726 223 —
Total ......................................................................... (698,541 ) (536,175 ) $ (49,940 ) $ (46,135 ) $ 20,531
Fixed Charges:
Interest cost and debt expense ........................................ 102,133 62,144 34,324 4,195 —
Interest capitalized ......................................................... 15,786 12,967 14,174 2,338 —
Interest allocable to rental expense(2)
............................. 5,183 5,607 4,315 1,349 632
Total Fixed Charges(3)
.............................................. $ 123,102 $ 80,718 $ 52,813 $ 7,882 $ 632
Preferred limited partner dividends ................................ 16,728 19,267 12,677 3,493 —
Total Fixed Charges and Preferred Dividends(3)
....... $ 139,830 $ 99,985 $ 65,490 $ 11,375 $ 632
Ratio of Earnings to Fixed Charges(3)
..............................
—
—
—
—
32.49x
Ratio of Earnings to Fixed Charges and Preferred
Dividends(3)
..................................................................
—
—
—
—
32.49x
(1) Includes asset impairment charges of $966.6 million, $573.8 million, $38.0 million, $9.5 million, and $7.0 million during the
years ended December 31, 2015, 2014, 2013, 2012, and 2011, respectively.
(2) Represents one-third of the total operating lease rental expense which is that portion deemed to be interest.
(3) Due to the Partnership’s net loss for the years ended December 31, 2015, 2014, 2013, and 2012, its earnings were insufficient to
cover its fixed charges by $821.6 million, $616.9 million, $102.8 million and $54.0 million, respectively. Due to the
Partnership’s net loss for the years ended December 31, 2015, 2014, 2013, and 2012, its earnings were insufficient to cover its
fixed charges and preferred dividends by $838.4 million, $636.2 million, $115.4 million and $57.5 million, respectively. There
were no preferred limited partner dividends for the year ended December 31, 2011.
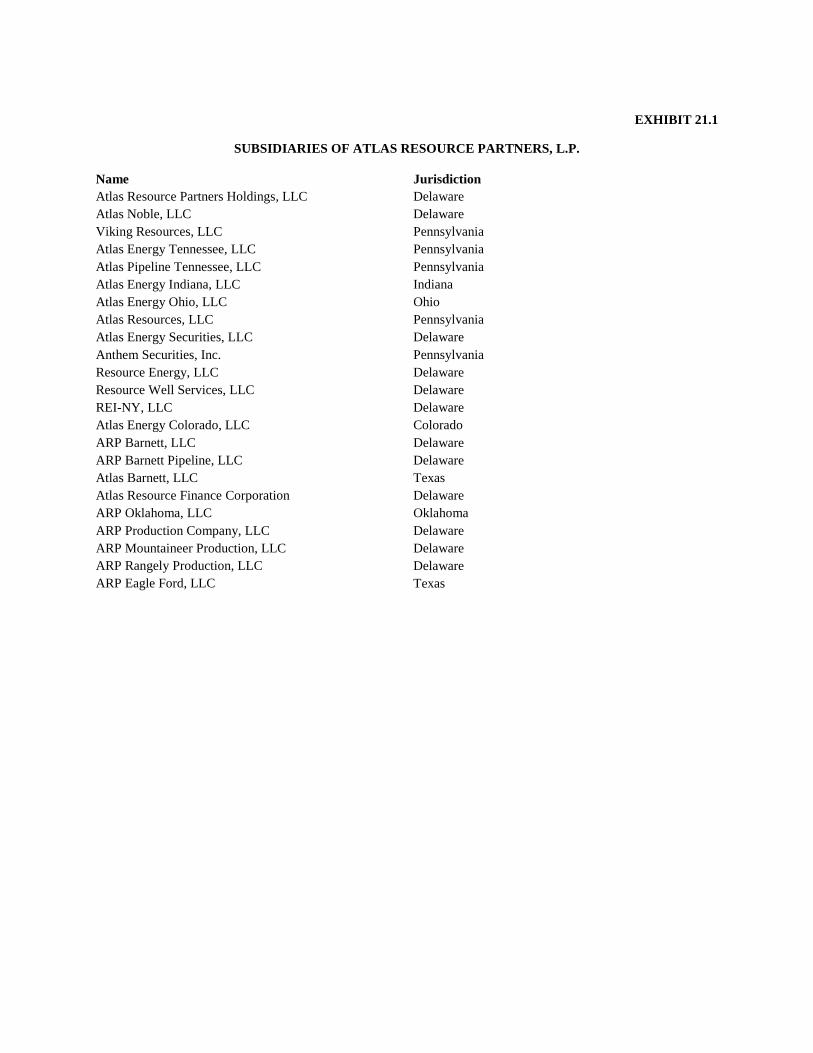
EXHIBIT 21.1
SUBSIDIARIES OF ATLAS RESOURCE PARTNERS, L.P.
Name Jurisdiction
Atlas Resource Partners Holdings, LLC Delaware
Atlas Noble, LLC Delaware
Viking Resources, LLC Pennsylvania
Atlas Energy Tennessee, LLC Pennsylvania
Atlas Pipeline Tennessee, LLC Pennsylvania
Atlas Energy Indiana, LLC Indiana
Atlas Energy Ohio, LLC Ohio
Atlas Resources, LLC Pennsylvania
Atlas Energy Securities, LLC Delaware
Anthem Securities, Inc. Pennsylvania
Resource Energy, LLC Delaware
Resource Well Services, LLC Delaware
REI-NY, LLC Delaware
Atlas Energy Colorado, LLC Colorado
ARP Barnett, LLC Delaware
ARP Barnett Pipeline, LLC Delaware
Atlas Barnett, LLC Texas
Atlas Resource Finance Corporation Delaware
ARP Oklahoma, LLC Oklahoma
ARP Production Company, LLC Delaware
ARP Mountaineer Production, LLC Delaware
ARP Rangely Production, LLC Delaware
ARP Eagle Ford, LLC Texas
EXHIBIT 23.1
CONSENT OF INDEPENDENT REGISTERED PUBLIC ACCOUNTING FIRM
We have issued our reports dated March 4, 2016, with respect to the consolidated financial statements and internal
control over financial reporting included in the Annual Report of Atlas Resource Partners, L.P. on Form 10-K for
the year ended December 31, 2015. We hereby consent to the incorporation by reference of said reports in the
Registration Statements of Atlas Resource Partners, L.P. on Form S-8 (File No. 333-180209, effective March 19,
2012) and Forms S-3 (File No. 333-182616, effective August 28, 2012, File No. 333-183995, effective October 2,
2012, File No. 333-193238, effective January 21, 2014, File No. 333-202827, effective March 27, 2015, File No.
333-203269, effective April 17, 2015 and File No. 333-203800, effective August 5, 2015).
/s/ GRANT THORNTON LLP
Cleveland, Ohio March 4, 2016

EXHIBIT 23.2
CONSENT OF INDEPENDENT PETROLEUM CONSULTANTS
We hereby consent to the incorporation by reference in the registration statement of Atlas Resource Partners, L.P. (the “Partnership”) on Form S-8 (File No. 333-180209, effective March 19, 2012) and Forms S-3 (File No. 333-182616, effective August 28, 2012, File No. 333-183995, effective October 2, 2012, File No. 333-193238, effective January 21, 2014 , File No. 333-202827, effective March 27, 2015, File No. 333-203269, effective April 17, 2015 and File No. 333-203800, effective August 5, 2015) and of the reference to Wright & Company, Inc. and the inclusion of our report dated February 23, 2016 in the Annual Report on Form 10-K for the year ended December 31, 2015, of the Partnership and its subsidiaries, filed with the Securities and Exchange Commission. Wright & Company, Inc. By: /s/ D. Randall Wright
D. Randall Wright, P.E. President March 4, 2016 Brentwood, Tennessee

CAWLEY, GILLESPIE & ASSOCIATES, INC. PETROLEUM CONSULTANTS
13640 BRIARWICK DRIVE, SUITE 100 306 WEST SEVENTH STREET, SUITE 302 1000 LOUISIANA STREET, SUITE 625
AUSTIN, TEXAS 78729-1707 FORT WORTH, TEXAS 76102-4987 HOUSTON, TEXAS 77002-5008
512-249-7000 817- 336-2461 713-651-9944
www.cgaus.com
EXHIBIT 23.3
CONSENT OF INDEPENDENT PETROLEUM CONSULTANTS
We hereby consent to the incorporation by reference in the registration statement of Atlas Resource Partners, L.P.
(the “Partnership”) on Form S-8 (File No. 333-180209, effective March 19, 2012) and Forms S-3 (File No. 333-
182616, effective August 28, 2012, File No. 333-183995, effective October 2, 2012, File No. 333-193238, effective
January 21, 2014 , File No. 333-202827, effective March 27, 2015, File No. 333-203269, effective April 17, 2015
and File No. 333-203800, effective August 5, 2015) and of the reference to Cawley, Gillespie & Associates, Inc. and
the inclusion of our report dated February 19, 2016 in the Annual Report on Form 10-K for the year ended
December 31, 2015, of the Partnership and its subsidiaries, filed with the Securities and Exchange Commission.
CAWLEY, GILLESPIE & ASSOCIATES, INC.
Robert D. Ravnaas, P.E.
President
March 4, 2016
Fort Worth, Texas

EXHIBIT 31.1
CERTIFICATION
I, Daniel C. Herz, certify that:
1. I have reviewed this annual report on Form 10-K for the year ended December 31, 2015 of Atlas Resource Partners, L.P.;
2. Based on my knowledge, this report does not contain any untrue statement of a material fact or omit to state a material fact
necessary to make the statements made, in light of the circumstances under which such statements were made, not misleading
with respect to the period covered by this report;
3. Based on my knowledge, the financial statements, and other financial information included in this report, fairly present in all
material respects the financial condition, results of operations and cash flows of the registrant as of, and for, the periods
presented in this report;
4. The registrant’s other certifying officer(s) and I are responsible for establishing and maintaining disclosure controls and
procedures (as defined in Exchange Act Rules 13a-15(e) and 15d-15(e)) and internal control over financial reporting (as defined
in Exchange Act Rules 13a-15(f) and 15d-15(f)) for the registrant and have:
(a) Designed such disclosure controls and procedures, or caused such disclosure controls and procedures to be designed under
our supervision, to ensure that material information relating to the registrant, including its consolidated subsidiaries, is
made known to us by others within those entities, particularly during the period in which this report is being prepared;
(b) Designed such internal control over financial reporting, or caused such internal control over financial reporting to be
designed under our supervision, to provide reasonable assurance regarding the reliability of financial reporting and the
preparation of financial statements for external purposes in accordance with generally accepted accounting principles;
(c) Evaluated the effectiveness of the registrant’s disclosure controls and procedures and presented in this report our
conclusions about the effectiveness of the disclosure controls and procedures, as of the end of the period covered by this
report based on such evaluation; and
(d) Disclosed in this report any change in the registrant’s internal control over financial reporting that occurred during the
registrant’s most recent fiscal quarter (the registrant’s fourth fiscal quarter in the case of an annual report) that has
materially affected, or is reasonably likely to materially affect, the registrant’s internal control over financial reporting;
and
5. The registrant’s other certifying officer(s) and I have disclosed, based on our most recent evaluation of internal control over
financial reporting, to the registrant’s auditors and the audit committee of the registrant’s board of directors (or persons
performing the equivalent functions):
(a) All significant deficiencies and material weaknesses in the design or operation of internal control over financial reporting
which are reasonably likely to adversely affect the registrant’s ability to record, process, summarize and report financial
information; and
(b) Any fraud, whether or not material, that involves management or other employees who have a significant role in the
registrant’s internal control over financial reporting.
/s/ DANIEL C. HERZ
Daniel C. Herz
Chief Executive Officer of ARP
March 4, 2016

EXHIBIT 31.2
CERTIFICATION
I, Jeffrey M. Slotterback, certify that:
1. I have reviewed this annual report on Form 10-K for the year ended December 31, 2015 of Atlas Resource Partners, L.P.;
2. Based on my knowledge, this report does not contain any untrue statement of a material fact or omit to state a material fact
necessary to make the statements made, in light of the circumstances under which such statements were made, not misleading
with respect to the period covered by this report;
3. Based on my knowledge, the financial statements, and other financial information included in this report, fairly present in all
material respects the financial condition, results of operations and cash flows of the registrant as of, and for, the periods
presented in this report;
4. The registrant’s other certifying officer(s) and I are responsible for establishing and maintaining disclosure controls and
procedures (as defined in Exchange Act Rules 13a-15(e) and 15d-15(e)) and internal control over financial reporting (as defined
in Exchange Act Rules 13a-15(f) and 15d-15(f)) for the registrant and have:
(a) Designed such disclosure controls and procedures, or caused such disclosure controls and procedures to be designed under
our supervision, to ensure that material information relating to the registrant, including its consolidated subsidiaries, is
made known to us by others within those entities, particularly during the period in which this report is being prepared;
(b) Designed such internal control over financial reporting, or caused such internal control over financial reporting to be
designed under our supervision, to provide reasonable assurance regarding the reliability of financial reporting and the
preparation of financial statements for external purposes in accordance with generally accepted accounting principles;
(c) Evaluated the effectiveness of the registrant’s disclosure controls and procedures and presented in this report our
conclusions about the effectiveness of the disclosure controls and procedures, as of the end of the period covered by this
report based on such evaluation; and
(d) Disclosed in this report any change in the registrant’s internal control over financial reporting that occurred during the
registrant’s most recent fiscal quarter (the registrant’s fourth fiscal quarter in the case of an annual report) that has
materially affected, or is reasonably likely to materially affect, the registrant’s internal control over financial reporting;
and
5. The registrant’s other certifying officer(s) and I have disclosed, based on our most recent evaluation of internal control over
financial reporting, to the registrant’s auditors and the audit committee of the registrant’s board of directors (or persons
performing the equivalent functions):
(a) All significant deficiencies and material weaknesses in the design or operation of internal control over financial reporting
which are reasonably likely to adversely affect the registrant’s ability to record, process, summarize and report financial
information; and
(b) Any fraud, whether or not material, that involves management or other employees who have a significant role in the
registrant’s internal control over financial reporting.
/s/ JEFFREY M. SLOTTERBACK
Jeffrey M. Slotterback
Chief Financial Officer of ARP
March 4, 2016

EXHIBIT 32.1
CERTIFICATION PURSUANT TO
18 U.S.C. SECTION 1350,
AS ADOPTED PURSUANT TO
SECTION 906 OF THE SARBANES-OXLEY ACT OF 2002
In connection with the Annual Report of Atlas Resource Partners, L.P. (the “Partnership”) on Form 10-K for the year ended December
31, 2015 as filed with the Securities and Exchange Commission on the date hereof (the “Report”), I, Daniel C. Herz, Chief Executive
Officer of the Partnership, certify, pursuant to 18 U.S.C. Section 1350, as adopted pursuant to Section 906 of the Sarbanes-Oxley Act
of 2002, that:
(1) The Report fully complies with the requirements of section 13(a) or 15(d) of the Securities Exchange Act of 1934, and
(2) The information contained in the Report fairly presents, in all material respects, the financial condition and results of operations
of the Partnership.
/s/ DANIEL C. HERZ
Daniel C. Herz
Chief Executive Officer of ARP
March 4, 2016

EXHIBIT 32.2
CERTIFICATION PURSUANT TO
18 U.S.C. SECTION 1350,
AS ADOPTED PURSUANT TO
SECTION 906 OF THE SARBANES-OXLEY ACT OF 2002
In connection with the Annual Report of Atlas Resource Partners, L.P. (the “Partnership”) on Form 10-K for the year ended December
31, 2015 as filed with the Securities and Exchange Commission on the date hereof (the “Report”), I, Jeffrey M. Slotterback, Chief
Financial Officer of the Partnership, certify, pursuant to 18 U.S.C. Section 1350, as adopted pursuant to Section 906 of the Sarbanes-
Oxley Act of 2002, that:
(1) The Report fully complies with the requirements of section 13(a) or 15(d) of the Securities Exchange Act of 1934; and
(2) The information contained in the Report fairly presents, in all material respects, the financial condition and results of operations
of the Partnership.
/s/ JEFFREY M. SLOTTERBACK
Jeffrey M. Slotterback
Chief Financial Officer of ARP
March 4, 2016
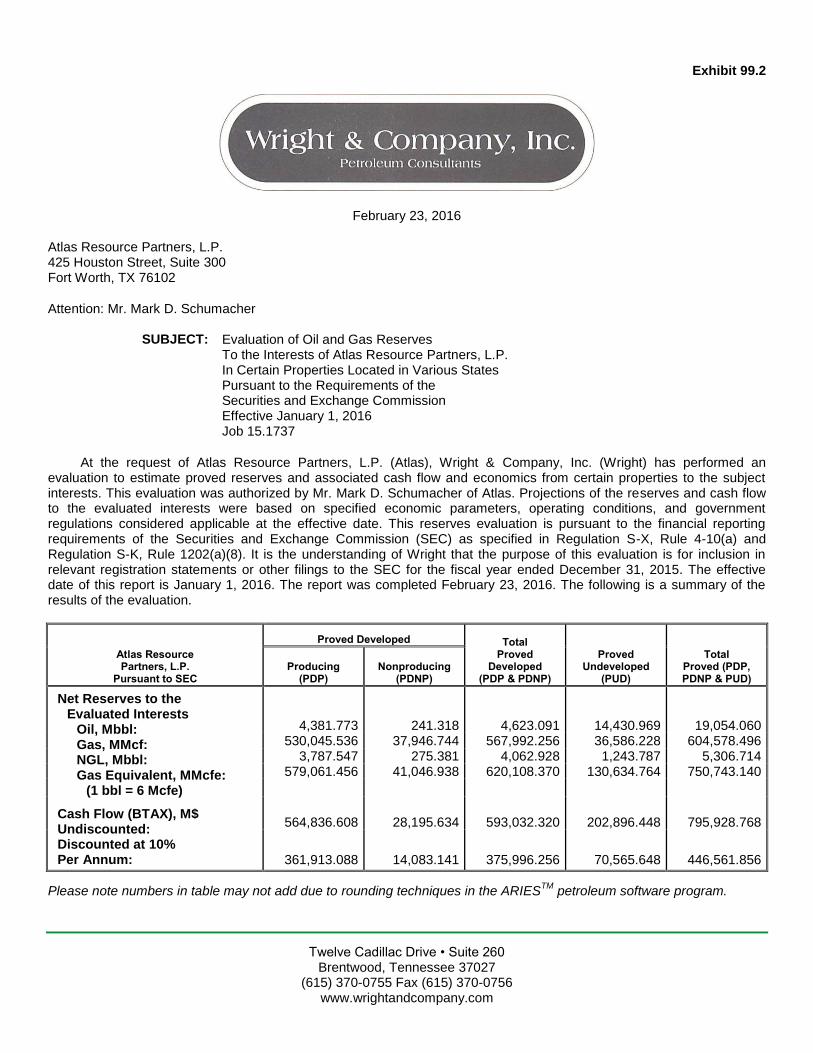
Twelve Cadillac Drive • Suite 260 Brentwood, Tennessee 37027
(615) 370-0755 Fax (615) 370-0756 www.wrightandcompany.com
Exhibit 99.2
February 23, 2016
Atlas Resource Partners, L.P. 425 Houston Street, Suite 300 Fort Worth, TX 76102
Attention: Mr. Mark D. Schumacher
SUBJECT: Evaluation of Oil and Gas Reserves To the Interests of Atlas Resource Partners, L.P. In Certain Properties Located in Various States Pursuant to the Requirements of the Securities and Exchange Commission Effective January 1, 2016 Job 15.1737
At the request of Atlas Resource Partners, L.P. (Atlas), Wright & Company, Inc. (Wright) has performed an evaluation to estimate proved reserves and associated cash flow and economics from certain properties to the subject interests. This evaluation was authorized by Mr. Mark D. Schumacher of Atlas. Projections of the reserves and cash flow to the evaluated interests were based on specified economic parameters, operating conditions, and government regulations considered applicable at the effective date. This reserves evaluation is pursuant to the financial reporting requirements of the Securities and Exchange Commission (SEC) as specified in Regulation S-X, Rule 4-10(a) and Regulation S-K, Rule 1202(a)(8). It is the understanding of Wright that the purpose of this evaluation is for inclusion in relevant registration statements or other filings to the SEC for the fiscal year ended December 31, 2015. The effective date of this report is January 1, 2016. The report was completed February 23, 2016. The following is a summary of the results of the evaluation.
Atlas Resource Partners, L.P.
Pursuant to SEC
Proved Developed Total Proved
Developed (PDP & PDNP)
Proved Undeveloped
(PUD)
Total Proved (PDP, PDNP & PUD)
Producing (PDP)
Nonproducing (PDNP)
Net Reserves to the Evaluated Interests
Oil, Mbbl: Gas, MMcf: NGL, Mbbl: Gas Equivalent, MMcfe:
(1 bbl = 6 Mcfe)
Cash Flow (BTAX), M$ Undiscounted: Discounted at 10% Per Annum:
4,381.773 241.318 4,623.091 14,430.969 19,054.060 530,045.536 37,946.744 567,992.256 36,586.228 604,578.496
3,787.547 275.381 4,062.928 1,243.787 5,306.714 579,061.456 41,046.938 620,108.370 130,634.764 750,743.140
564,836.608 28,195.634 593,032.320 202,896.448 795,928.768
361,913.088 14,083.141 375,996.256 70,565.648 446,561.856
Please note numbers in table may not add due to rounding techniques in the ARIES
TM petroleum software program.
The properties evaluated in this report are located in the states of Alabama, Arkansas, Colorado, Indiana, Kansas, Kentucky, Louisiana, New Mexico, New York, Ohio, Oklahoma, Pennsylvania, Tennessee, Texas, Virginia, West Virginia, and Wyoming. According to Atlas, the total proved reserves included in this evaluation represent 100 percent of the reported total proved reserves of Atlas.
Proved oil and gas reserves are those quantities of oil and gas which can be estimated with reasonable certainty to be economically producible under existing economic conditions, operating methods, and government regulations. As specified by the SEC regulations, when calculating economic producibility, the base product price must be the 12-month average price, calculated as the unweighted arithmetic average of the first-day-of-the-month price for each month within the prior 12-month period. The benchmark base prices used for this evaluation were $50.28 per barrel for West Texas Intermediate oil at Cushing, Oklahoma, and $2.587 per million British thermal units (MMBtu) for natural gas at Henry Hub, Louisiana. These benchmark base prices were adjusted for energy content, quality, and basis differential, as appropriate. The resultant average adjusted product prices are $48.49 per barrel of oil and $2.042 per Mcf of gas. The Natural Gas Liquids (NGL) product price was estimated to be approximately 25 percent of the base oil price, resulting in a weighted average adjusted price of $12.73 per barrel. The base product prices were held constant for the life of the properties.
Oil and other liquid hydrocarbon volumes are expressed in thousands of United States (U.S.) barrels (Mbbl), one barrel equaling 42 U.S. gallons. Gas volumes are expressed in millions of standard cubic feet (MMcf) at 60 degrees Fahrenheit and at the legal pressure base that prevails in the state in which the reserves are located. For purposes of this report, quantities of barrels of oil and NGL are converted into equivalent quantities of natural gas at the ratio of 1 bbl = 6 Mcfe. No adjustment of the individual gas volumes to a common pressure base has been made.
Net income to the evaluated interests is the cash flow after consideration of royalty revenue payable to others, standard state and county taxes, state fees, operating expenses, and investments, as applicable. The cash flow is before federal income tax (BTAX) and excludes consideration of any encumbrances against the properties if such exist. The Cash Flow (BTAX) was discounted monthly at an annual rate of 10.0 percent in accordance with the reporting requirements of the SEC.
The estimates of reserves contained in this report were determined by accepted industry methods, and the procedures used in this evaluation are appropriate for the purpose served by this report. Where sufficient production history and other data were available, reserves for producing properties were determined by extrapolation of historical production or sales trends. Analogy to similar producing properties was used for development projects and for those properties that lacked sufficient production history to yield a definitive estimate of reserves. When appropriate, Wright may have also utilized volumetric calculations and log correlations in the determination of estimated ultimate recovery (EUR). These calculations are often based upon limited log and/or core analysis data and incomplete formation fluid and rock data. Since these limited data must frequently be extrapolated over an assumed drainage area, subsequent production performance trends or material balance calculations may cause the need for significant revisions to the estimates of reserves. Wright has used all methods and procedures as it considered necessary under the circumstances to prepare this report.
Oil and gas reserves were evaluated for the proved developed producing (PDP), proved developed nonproducing (PDNP), and proved undeveloped (PUD) reserves categories. The summary classification of total proved developed reserves combines the PDP and PDNP categories, and the summary classification of total proved reserves combines the total proved developed and PUD categories. In preparing this evaluation, no attempt has been made to quantify the element of uncertainty associated with any category. Reserves were assigned to each category as warranted. Wright is not aware of any local, state, or federal regulations that would preclude Atlas from continuing to produce from currently active wells or to fully develop those properties included in this report.
There are significant uncertainties inherent in estimating reserves, future rates of production, and the timing and amount of future costs. The estimation of oil and gas reserves must be recognized as a subjective process that cannot be measured in an exact way, and estimates of others might differ materially from those of Wright. The accuracy of any reserves estimate is a function of the quantity and quality of available data and of subjective interpretations and judgments. It should be emphasized that production data subsequent to the date of these estimates or changes in the analogous properties may warrant revisions of such estimates. Accordingly, reserves estimates are often different from the quantities of oil and gas that are ultimately recovered.
All data utilized in the preparation of this report were provided by Atlas. No inspection of the properties was made as this was not considered to be within the scope of this evaluation. Wright has not independently verified the accuracy and completeness of information and data furnished by Atlas with respect to ownership interests, oil and gas production or sales, historical costs of operation and development, product prices, or agreements relating to current and future operations and sales of production. Wright requested and received detailed information allowing Wright to check and confirm any calculations provided by Atlas with regard to product pricing, appropriate adjustments, lease operating expenses, and capital investments for drilling the undeveloped locations. Furthermore, if in the course of Wright’s examination something came to our attention that brought into question the validity or sufficiency of any information or data, Wright did not rely on such information or data until we had satisfactorily resolved our questions relating thereto or independently verified such information or data. In accordance with the requirements of the SEC, all operating costs were held constant for the life of the properties.
In accordance with the instructions of Atlas, abandonment costs net of salvage values were included as appropriate. In some areas, Atlas represented that the cost to abandon the property would be directly offset by the salvage value. Wright has not performed a detailed study of the abandonment costs nor the salvage values and offers no opinion as to Atlas’s calculations.
Wright is not aware of any potential environmental liabilities that may exist concerning the properties evaluated. There are no costs included in this evaluation for potential property restoration, liability, or clean up of damages, if any, that may be necessary due to past or future operating practices.
Wright is an independent petroleum consulting firm founded in 1988 and owns no interests in the oil and gas properties covered by this report. No employee, officer, or director of Wright is an employee, officer, or director of Atlas, nor does Wright or any of its employees have direct financial interest in Atlas. Neither the employment of nor the compensation received by Wright is contingent upon the values assigned or the opinions rendered regarding the properties covered by this report.
This report is prepared for the information of Atlas, its shareholders, and for the information and assistance of its independent public accountants in connection with their review of and report upon the financial statements of Atlas, and for reporting disclosures as required by the SEC. This report is also intended for public disclosure as an exhibit in filings made to the SEC by Atlas.
Based on data and information provided by Atlas, and the specified economic parameters, operating conditions, and government regulations considered applicable at the effective date, it is Wright’s conclusion that this report provides a fair and accurate representation of the oil and gas reserves to the interests of Atlas in those certain properties included in this report.
The professional qualifications of the petroleum consultants responsible for the evaluation of the reserves and economics information presented in this report meet the standards of Reserves Estimator as defined in the Standards Pertaining to the Estimating and Auditing of Oil and Gas Reserves Information as promulgated by the Society of Petroleum Engineers.
It has been a pleasure to serve you by preparing this evaluation. All related data will be retained in our files and are available for your review. Very truly yours,
Wright & Company, Inc. TX Reg. No. F-12302
By: /s/ D. Randall Wright
D. Randall Wright President

EXHIBIT 99.3
CAWLEY, GILLESPIE & ASSOCIATES, INC. PETROLEUM CONSULTANTS
13640 BRIARWICK DRIVE, SUITE 100 306 WEST SEVENTH STREET, SUITE 302 1000 LOUISIANA STREET, SUITE 625
AUSTIN, TEXAS 78729-1707 FORT WORTH, TEXAS 76102-4987 HOUSTON, TEXAS 77002-5008
512-249-7000 817- 336-2461 713-651-9944
www.cgaus.com
February 19, 2016
Mr. Trevor Mallernee
Atlas Resource Partners, LP
1026A Cookson Ave. SE
New Philadelphia, OH 44663
Re: Reserve Evaluation
Atlas Resource Partners, LP Interests
Proved Reserves
Certain Properties in Colorado and Wyoming
As of December 31, 2015
Pursuant to the Guidelines of the
Securities and Exchange Commission for
Reporting Corporate Reserves and
Future Net Revenue
Dear Mr. Mallernee:
As requested, this report was prepared on February 19, 2016 for Atlas Resource Partners, LP
(“Atlas”) for the purpose of submitting our estimates of proved reserves and forecasts of economics
attributable to the subject interests. We evaluated 100% of Atlas Rangely Weber Sand Unit Acquisition
reserves, which are made up of oil and gas properties in Colorado and Wyoming. This report utilized an
effective date of December 31, 2015, was prepared using constant prices and costs, and conforms to
Item 1202(a)(8) of Regulation S-K and other rules of the Securities and Exchange Commission (SEC).
The results of this evaluation are presented in the accompanying tabulation, with a composite summary
of the values presented below:
Proved Proved
Developed Developed Proved Total
Producing Non-Producing Undeveloped Proved
Net Reserves
Oil – Mbbl 6,245.6 14,615.8 4,888.7 25,750.1
Gas – MMcf 0.0 0.0 0.0 0.0
NGL – Mbbl 679.5 1,591.9 271.9 2,543.3
Revenue
Oil – M$ 290,733.6 680,364.1 227,568.8 1,198,666.4
Gas – M$ 0.0 0.0 0.0 0.0
NGL – Mbbl 23,915.8 56,028.1 9,570.5 89,514.4
Severance Taxes – M$ 15,732.5 36,819.6 11,857.0 64,409.0
Ad Valorem Taxes – M$ 10,462.3 24,485.0 7,884.9 42,832.2
Operating Expenses – M$ 197,175.8 396,732.5 30,401.4 624,309.8
Other Deductions – M$ 23,368.4 5,839.6 11,559.7 40,767.7
Investments – M$ 0.0 212,164.0 115,202.2 327,366.2
Net Operating
Income (BFIT) – M$ 67,910.4 60,351.4 60,234.1 188,495.9
Discounted at 10% – M$ 51,468.8 -5,678.0 10,416.0 56,206.8
Future revenue is prior to deducting state production taxes and ad valorem taxes. Future net cash
flow is after deducting these taxes, future capital costs and operating expenses, but before consideration of
federal income taxes. In accordance with SEC guidelines, the future net cash flow has been discounted at
an annual rate of ten percent to determine its “present worth”. The present worth is shown to indicate the
effect of time on the value of money and should not be construed as being the fair market value of the
properties.
The oil reserves include oil and condensate. Oil volumes are expressed in barrels (42 U.S. gallons).
Gas volumes are expressed in thousands of standard cubic feet (Mcf) at contract temperature and pressure
base.
0BHydrocarbon Pricing
The base SEC oil and gas prices calculated for December 31, 2015 were $50.28/bbl and
$2.587/MMBTU, respectively. As specified by the SEC, a company must use a 12-month average price,
calculated as the unweighted arithmetic average of the first-day-of-the-month price for each month within
the 12-month period prior to the end of the reporting period. The base oil and gas prices are based upon
WTI-Cushing and Henry Hub spot prices, respectively, as published by the EIA for January 1, 2015
through December 1, 2015.
The base prices shown above were adjusted for differentials on a per-property basis, which may
include local basis differentials, transportation, gas shrinkage, gas heating value (BTU content) and/or crude
quality and gravity corrections. After these adjustments, the net realized prices for the SEC price case over
the life of the proved properties was estimated to be $46.55 per barrel for oil. All economic factors were
held constant in accordance with SEC guidelines.
1BEconomic Parameters
Ownership was accepted as furnished and has not been independently confirmed. Oil and gas price
differentials, gas shrinkage, ad valorem taxes, severance taxes and lease operating expenses were calculated
and prepared by Atlas and were reviewed by us for reasonableness. Capital costs for new development
wells, production equipment and workovers were scheduled as provided by Atlas. Capital costs were
reviewed by us for reasonableness and compared to capital costs provided in previous years.
Adjustments were made as necessary after a review with Atlas. Lease operating expenses were either
determined at the field or individual well level using averages calculated from historical lease operating
statements. All economic parameters, including lease operating expenses and capital costs, were held
constant (not escalated) throughout the life of these properties.
2BSEC Conformance and Regulations
The reserve classifications and the economic considerations used herein conform to the criteria of
the SEC as defined in pages 3 and 4 of the Appendix. The reserves and economics are predicated on
regulatory agency classifications, rules, policies, laws, taxes and royalties currently in effect except as noted
herein. Government policies and market conditions different from those employed in this report may cause
(1) the total quantity of oil or gas to be recovered, (2) actual production rates, (3) prices received, or (4)
operating and capital costs to vary from those presented in this report. However, we do not anticipate nor
are we aware of any legislative changes or restrictive regulatory actions that may impact the recovery of
reserves.
This evaluation includes multiple proved undeveloped locations in the Rangely Weber Sand Unit in
Rio Blanco County, Colorado. As requested, estimates of proved undeveloped reserves have only been
included for properties that are economically producible at existing economic conditions. Each of these

drilling locations proposed as part of Atlas’ development plans conforms to the proved undeveloped
standards as set forth by the SEC. In our opinion, Atlas has indicated they have every intent to complete this
development plan within the next five years. Furthermore, Atlas has demonstrated that they have the proper
company staffing, financial backing and prior development success to ensure this five year development
plan will be fully executed.
3BReserve Estimation Methods
The methods employed in estimating reserves are described in page 2 of the Appendix. Reserves for
proved developed producing wells were estimated using production performance methods for the vast
majority of properties. Certain new producing properties with very little production history were forecast
using a combination of production performance and analogy to similar production, both of which are
considered to provide a relatively high degree of accuracy.
Non-producing reserve estimates, for developed and undeveloped properties, were forecast using
either volumetric or analogy methods, or a combination of both. These methods provide a relatively high
degree of accuracy for predicting proved developed non-producing and proved undeveloped reserves for
Atlas properties, due to the mature nature of their properties targeted for development and an abundance of
subsurface control data. The assumptions, data, methods and procedures used herein are appropriate for the
purpose served by this report.
4BGeneral Discussion
An on-site field inspection of the properties has not been performed. The mechanical operation
or condition of the wells and their related facilities have not been examined nor have the wells been
tested by Cawley, Gillespie & Associates, Inc. (“CG&A”) Possible environmental liability related to the
properties has not been investigated nor considered. The cost of plugging and the salvage value of
equipment at abandonment have not been included.
The estimates and forecasts were based upon interpretations of data furnished by your office and
available from our files. To some extent information from public records has been used to check and/or
supplement these data. The basic engineering and geological data were subject to third party
reservations and qualifications. Nothing has come to our attention, however, that would cause us to
believe that we are not justified in relying on such data. All estimates represent our best judgment based
on the data available at the time of preparation. Due to inherent uncertainties in future production rates,
commodity prices and geologic conditions, it should be realized that the reserve estimates, the reserves
actually recovered, the revenue derived therefrom and the actual cost incurred could be more or less than
the estimated amounts.
Cawley, Gillespie & Associates, Inc. is a Texas Registered Engineering Firm (F-693), made up of
independent registered professional engineers and geologists that have provided petroleum consulting
services to the oil and gas industry for over 50 years. This report has been prepared for BOLP’s use in filing
with the Securities and Exchange Commission. This evaluation was supervised by Robert D. Ravnaas,
President at Cawley, Gillespie & Associates, Inc. and a State of Texas Licensed Professional Engineer
(License #61304). We do not own an interest in the properties, Atlas Resource Partners, LP and are not
employed on a contingent basis. We have used all methods and procedures that we consider necessary
under the circumstances to prepare this report. Our work-papers and related data utilized in the preparation
of these estimates are available in our office.
The professional qualifications of the undersigned, the technical person primarily responsible for
the preparation of this report, are included as an attachment to this letter.
Sincerely,
CAWLEY, GILLESPIE & ASSOCIATES, INC. Texas Registered Engineering Firm F-693
Robert D. Ravnaas, P.E.
President