Market Overview - Paul Comstock Partners
13
Market Overview Third Quarter 2011 The following information is of a proprietary nature. Dissemination to other parties is prohibited without prior t f P l C t k P t consent of Paul Comstock Partners. Copyright © 2011 Paul Comstock Partners. All Rights Reserved.
-
Upload
khangminh22 -
Category
Documents
-
view
2 -
download
0
Transcript of Market Overview - Paul Comstock Partners

Market Overview
Third Quarter 2011
The following information is of a proprietary nature. Dissemination to other parties is prohibited without prior
t f P l C t k P tconsent of Paul Comstock Partners.
Copyright © 2011 Paul Comstock Partners. All Rights Reserved.
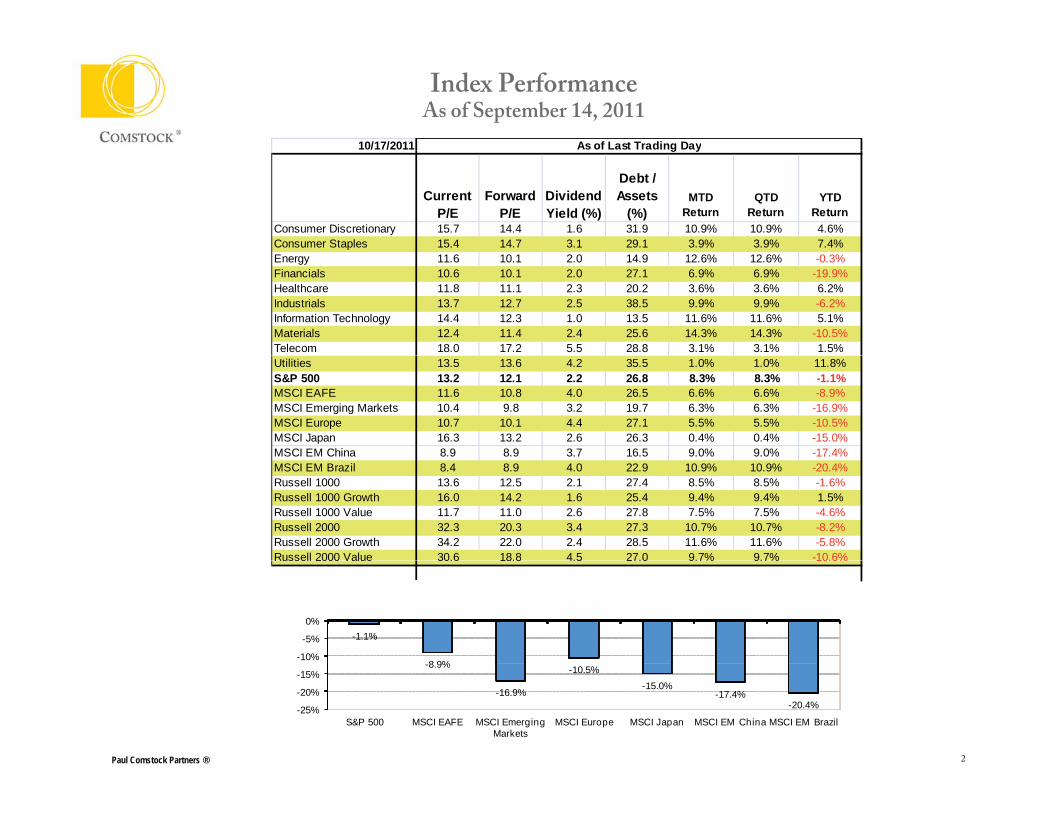
Index PerformanceAs of September 14, 2011
10/17/2011 As of Last Trading Day
Current P/E
Forward P/E
Dividend Yield (%)
Debt / Assets
(%)MTD
ReturnQTD
ReturnYTD
ReturnConsumer Discretionary 15.7 14.4 1.6 31.9 10.9% 10.9% 4.6%Consumer Staples 15.4 14.7 3.1 29.1 3.9% 3.9% 7.4%
g y
Energy 11.6 10.1 2.0 14.9 12.6% 12.6% -0.3%Financials 10.6 10.1 2.0 27.1 6.9% 6.9% -19.9%Healthcare 11.8 11.1 2.3 20.2 3.6% 3.6% 6.2%Industrials 13.7 12.7 2.5 38.5 9.9% 9.9% -6.2%Information Technology 14.4 12.3 1.0 13.5 11.6% 11.6% 5.1%Materials 12.4 11.4 2.4 25.6 14.3% 14.3% -10.5%Telecom 18.0 17.2 5.5 28.8 3.1% 3.1% 1.5%Utilities 13.5 13.6 4.2 35.5 1.0% 1.0% 11.8%S&P 500 13.2 12.1 2.2 26.8 8.3% 8.3% -1.1%MSCI EAFE 11.6 10.8 4.0 26.5 6.6% 6.6% -8.9%MSCI Emerging Markets 10.4 9.8 3.2 19.7 6.3% 6.3% -16.9%MSCI Europe 10.7 10.1 4.4 27.1 5.5% 5.5% -10.5%MSCI Japan 16.3 13.2 2.6 26.3 0.4% 0.4% -15.0%MSCI EM China 8.9 8.9 3.7 16.5 9.0% 9.0% -17.4%MSCI EM Brazil 8.4 8.9 4.0 22.9 10.9% 10.9% -20.4%Russell 1000 13.6 12.5 2.1 27.4 8.5% 8.5% -1.6%Russell 1000 Growth 16.0 14.2 1.6 25.4 9.4% 9.4% 1.5%Russell 1000 Value 11.7 11.0 2.6 27.8 7.5% 7.5% -4.6%Russell 2000 32.3 20.3 3.4 27.3 10.7% 10.7% -8.2%Russell 2000 Growth 34.2 22.0 2.4 28.5 11.6% 11.6% -5.8%Russell 2000 Value 30.6 18.8 4.5 27.0 9.7% 9.7% -10.6%Russell 2000 Value 30.6 18.8 4.5 27.0 9.7% 9.7% 10.6%
-1.1%
8 9%-10%
-5%
0%
Paul Comstock Partners ® 2
-8.9%
-16.9%
-10.5%-15.0%
-17.4%-20.4%-25%
-20%
-15%
S&P 500 MSCI EAFE MSCI Emerging Markets
MSCI Europe MSCI Japan MSCI EM China MSCI EM Brazil

The Third Quarter was Dominated by Fears over Europe
The US economy looks like it will avoid a recession Relatively positive employment and manufacturing data has calmed fears of a US recession
The markets fear that the EU Sovereign Debt Crisis will become a continental banking crisis European authorities are currently discussing a TARP-like program to which the markets have given a
positive initial response The EU remains committed to the Euro and making the necessary financial commitments to keep the
monetary union in place Risk is that events may move too quickly for the political process to cope
Owning productive, quality assets remains the best way to invest long term The stocks of high quality companies are approaching 2009 valuation levelsThe stocks of high quality companies are approaching 2009 valuation levels Dividend yields on the S&P 500 are now above ten year Treasury Bonds
Paul Comstock Partners ® 3
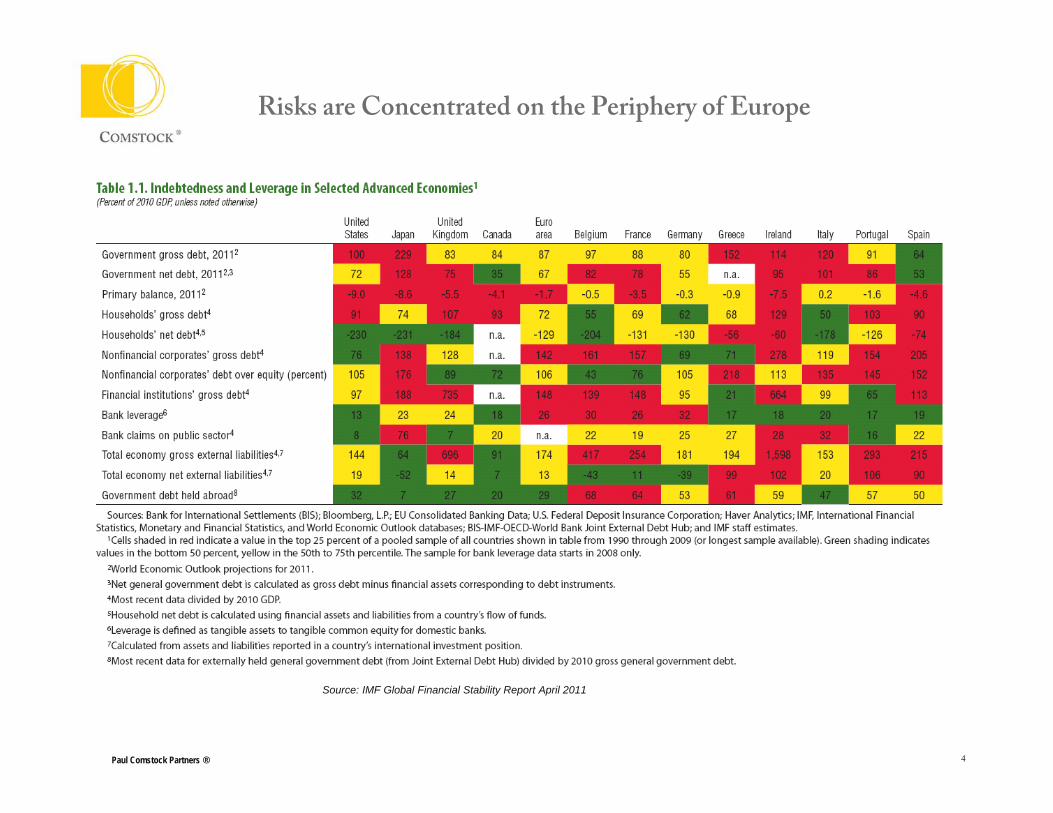
Risks are Concentrated on the Periphery of Europe
Paul Comstock Partners ® 4
Source: IMF Global Financial Stability Report April 2011
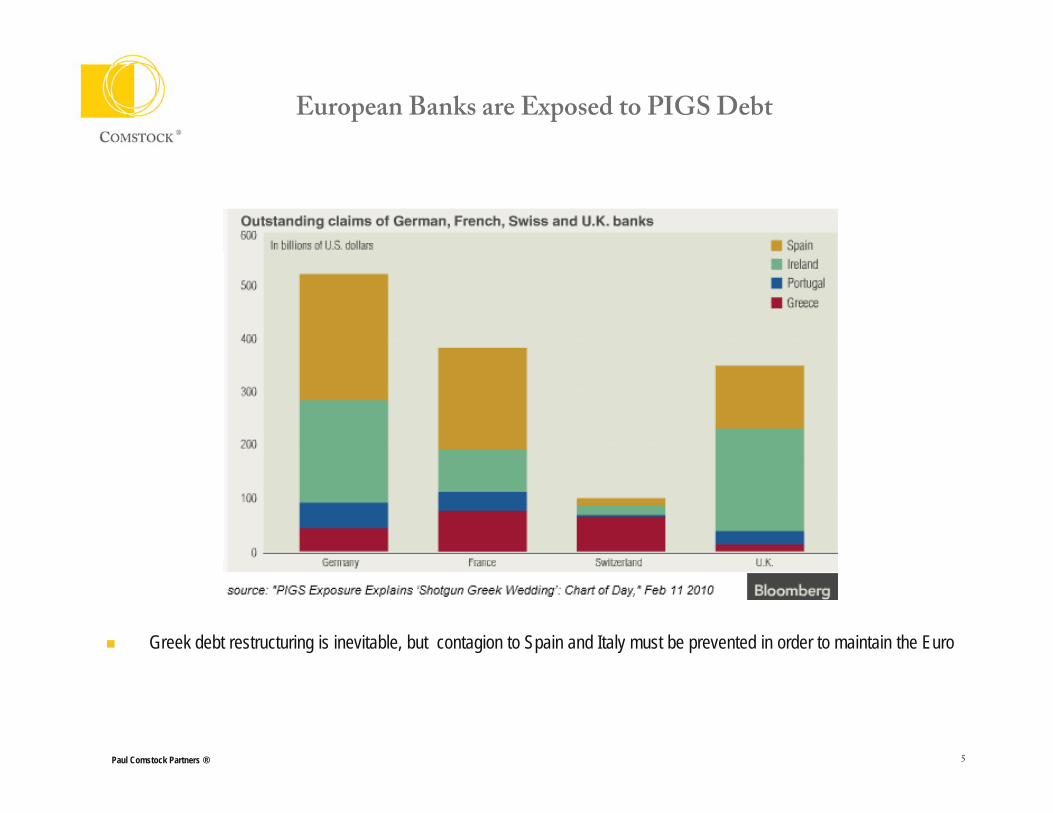
European Banks are Exposed to PIGS Debt
Greek debt restructuring is inevitable, but contagion to Spain and Italy must be prevented in order to maintain the Euro
Paul Comstock Partners ® 5
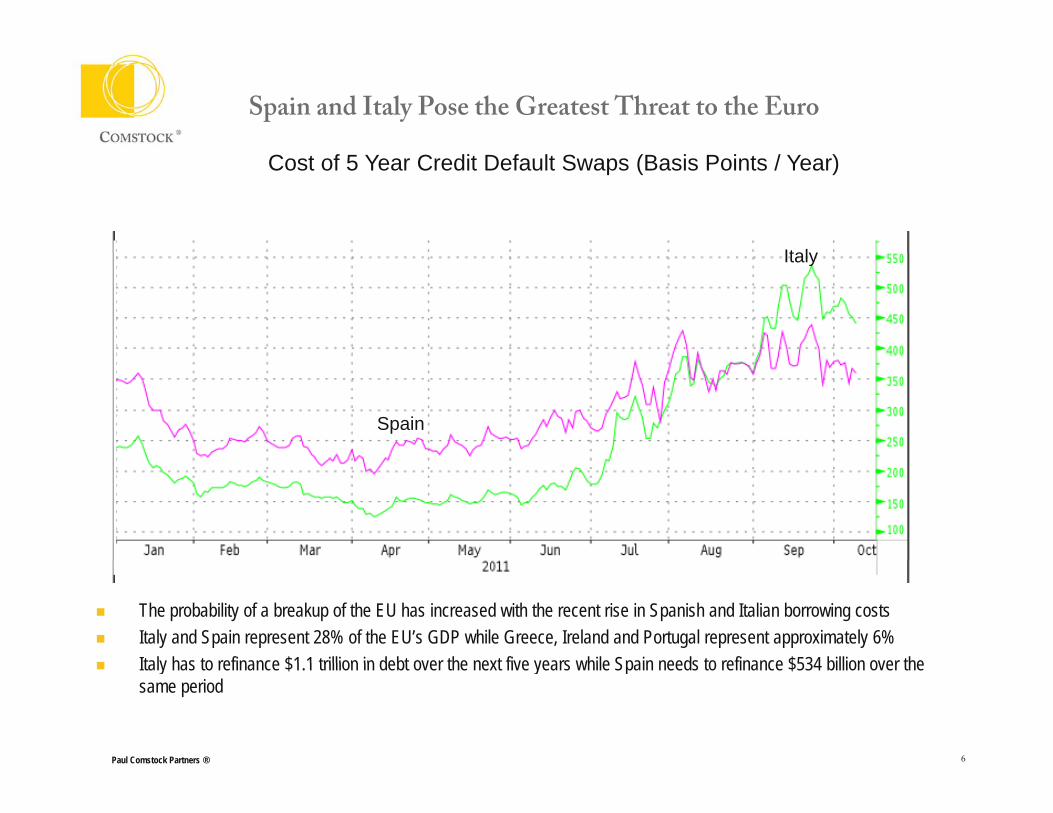
Spain and Italy Pose the Greatest Threat to the Euro
Italy
Cost of 5 Year Credit Default Swaps (Basis Points / Year)
Italy
Spain
The probability of a breakup of the EU has increased with the recent rise in Spanish and Italian borrowing costs Italy and Spain represent 28% of the EU’s GDP while Greece, Ireland and Portugal represent approximately 6% Italy has to refinance $1 1 trillion in debt over the next five years while Spain needs to refinance $534 billion over the
Paul Comstock Partners ® 6
Italy has to refinance $1.1 trillion in debt over the next five years while Spain needs to refinance $534 billion over the same period
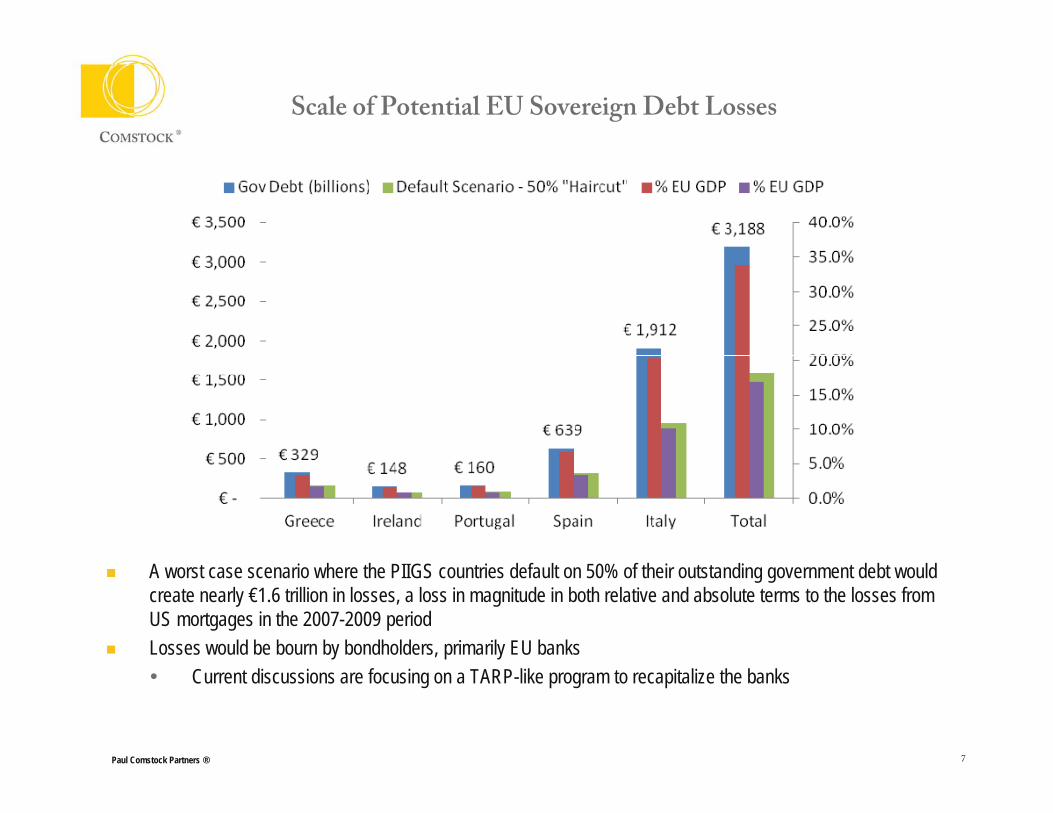
Scale of Potential EU Sovereign Debt Losses
A worst case scenario where the PIIGS countries default on 50% of their outstanding government debt would create nearly €1.6 trillion in losses, a loss in magnitude in both relative and absolute terms to the losses from US mortgages in the 2007-2009 period
Losses would be bourn by bondholders, primarily EU banks
Paul Comstock Partners ® 7
Current discussions are focusing on a TARP-like program to recapitalize the banks
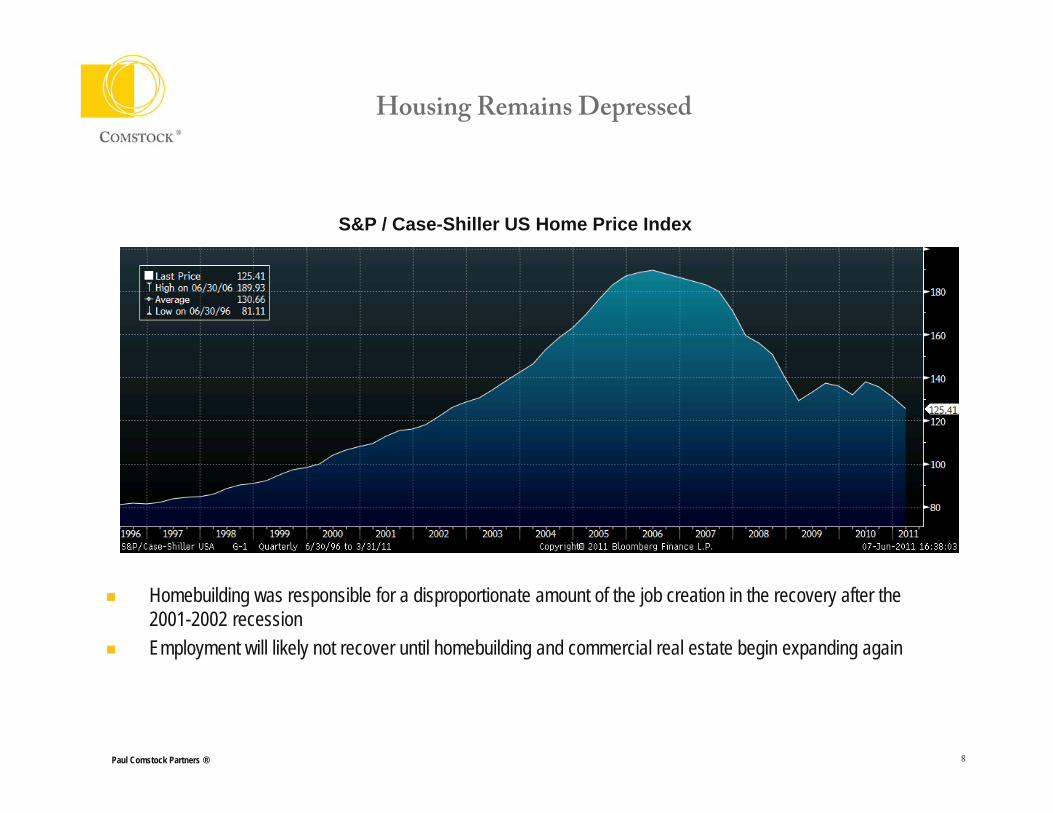
Housing Remains Depressed
S&P / Case-Shiller US Home Price Index
Homebuilding was responsible for a disproportionate amount of the job creation in the recovery after the 2001-2002 recession
Employment will likely not recover until homebuilding and commercial real estate begin expanding again
Paul Comstock Partners ® 8
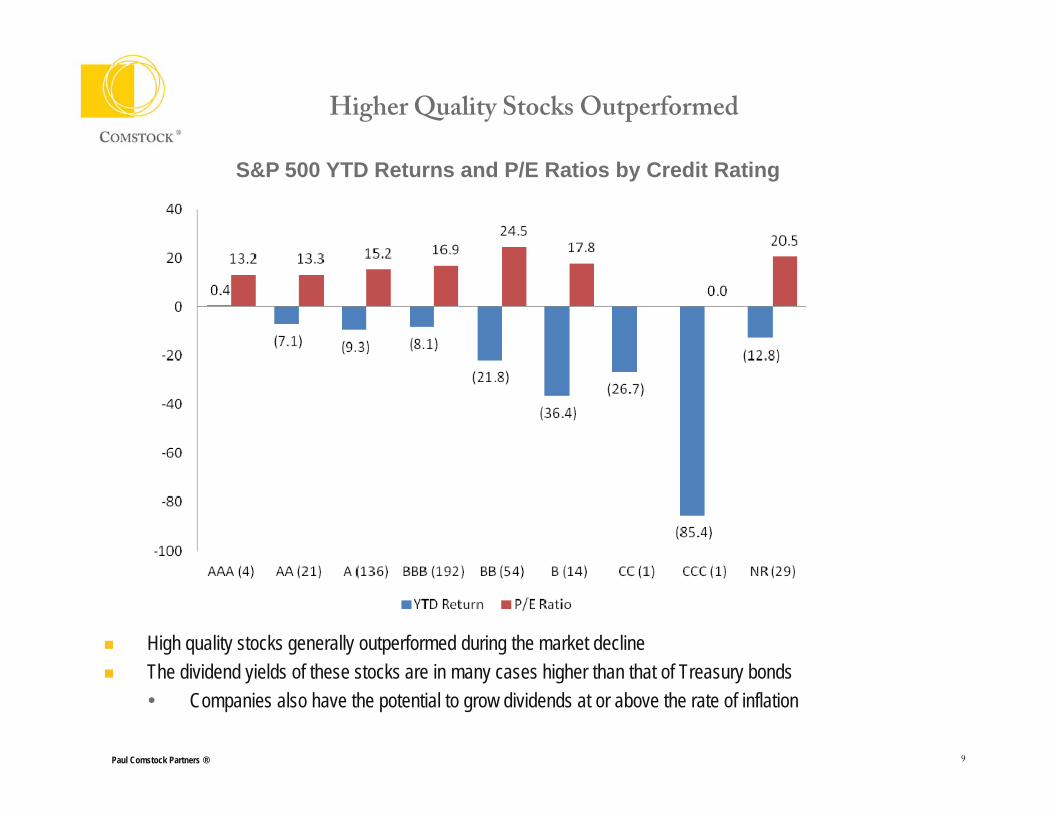
Higher Quality Stocks Outperformed
S&P 500 YTD Returns and P/E Ratios by Credit Rating
High quality stocks generally outperformed during the market decline
Paul Comstock Partners ® 9
The dividend yields of these stocks are in many cases higher than that of Treasury bonds Companies also have the potential to grow dividends at or above the rate of inflation

Valuations Approaching 2009 Levels
CAPE – Cyclically Adjusted PE ratio utilizing average earnings over the past ten years adjusted for inflation
Paul Comstock Partners ® 10
CAPE Cyclically Adjusted PE ratio utilizing average earnings over the past ten years, adjusted for inflation Provides normalized earnings that smooth cyclical peaks and troughs
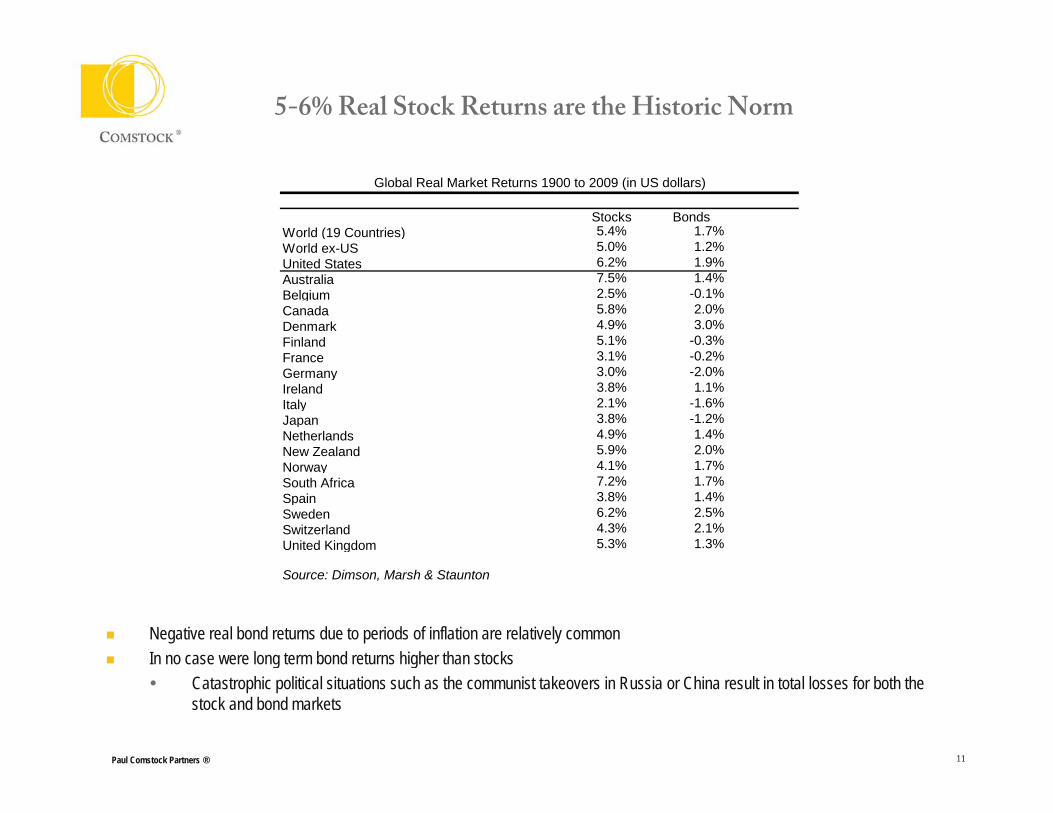
5-6% Real Stock Returns are the Historic Norm
Stocks BondsWorld (19 Countries) 5.4% 1.7%World ex-US 5.0% 1.2%
Global Real Market Returns 1900 to 2009 (in US dollars)
United States 6.2% 1.9%Australia 7.5% 1.4%Belgium 2.5% -0.1%Canada 5.8% 2.0%Denmark 4.9% 3.0%Finland 5.1% -0.3%France 3 1% 0 2%France 3.1% -0.2%Germany 3.0% -2.0%Ireland 3.8% 1.1%Italy 2.1% -1.6%Japan 3.8% -1.2%Netherlands 4.9% 1.4%New Zealand 5.9% 2.0%Norway 4.1% 1.7%South Africa 7.2% 1.7%Spain 3.8% 1.4%Sweden 6.2% 2.5%Switzerland 4.3% 2.1%United Kingdom 5.3% 1.3%
Negative real bond returns due to periods of inflation are relatively common In no case were long term bond returns higher than stocks
Source: Dimson, Marsh & Staunton
Paul Comstock Partners ® 11
In no case were long term bond returns higher than stocks Catastrophic political situations such as the communist takeovers in Russia or China result in total losses for both the
stock and bond markets

Comstock Investment Themes
Focus on quality High quality stocks have delivered excess returns without commiserate risk While quality is a generally recognized concept, it resists simple quantification Relative valuations today are attractivey Financial strength matters in the “New Normal”
Emerging markets have the highest growth potential Already discounted into valuations in many cases Markets are mature enough to warrant multiple investment strategies Avoid closet indexing
“Rifle-shot” approaches to low-grade credit An alternative to stocks, not investment grade bonds Higher default rates and lower recoveries will likely be the new norm
Hedge Fund Beta Research shows most hedge fund returns represent “beta” (fair returns for risk taken) vs. “alpha” (unique skill of money
manager) Does not justify 2% management fees + 20% performance feesL t lt ti t h d f d t t i il bl i t l f d Lower cost alternative to many hedge fund strategies are available in mutual funds Strategies such as convertible and merger arbitrage have attractive risk / return characteristics at the lower fee
levels and without the operational risk of limited partnerships or LLCs Quality Real Assets
A diversified portfolio of MLPs can yield 6%+ with 3-5% dividend growth
Paul Comstock Partners ® 12
A diversified portfolio of MLPs can yield 6%+ with 3 5% dividend growth Core energy infrastructure with limited exposure to commodity prices
Timber & Core Real Estate represent other opportunities
Contact Information
Paul Comstock Partners ®Two Riverway, Suite 1000Houston, TX 77056Main (713) 977 2694Fax (713) 877 1363
New York Satellite Office1120 Avenue of the Americas, 4th FloorNew York, NY 10036
www.paulcomstockpartners.com