It Should Just Be Education: Critical Pedagogy Normalized as Academic Excellence
Upload
independentCategory
view
3download
0
Interannual variations of monthly and seasonal normalized
difference vegetation index (NDVI) in China from 1982 to 1999
Shilong Piao,1 Jingyun Fang,1 Liming Zhou,2 Qinghua Guo,1,3 Mark Henderson,4 Wei Ji,5
Yan Li,1 and Shu Tao1
Received 15 August 2002; revised 22 January 2003; accepted 13 March 2003; published 16 July 2003.
[1] In this paper, we analyzed interannual variations of normalized difference vegetationindex (NDVI) and their relationships with climatic variables (temperature andprecipitation) and human activity in China between 1982 and 1999. Monthly and seasonalNDVI increased significantly at both the country and biome scales over the studyperiod. NDVI shows the largest increase (14.4% during the 18 years and a trend of0.0018 yr�1) over 85.9% of the total study area in spring and the smallest increase(5.2% with a trend of 0.0012 yr�1) over 72.2% of the area in summer. The NDVI trendsshow a marked heterogeneity corresponding to regional and seasonal variations inclimates. There is about a 3-month lag for the period between the maximum trend intemperature (February) and that in NDVI (April or May) at the country and biome scales.Human activity (urbanization and agricultural practices) also played an important role ininfluencing the NDVI trends over some regions. Rapid urbanization resulted in a sharpdecrease in NDVI in the Yangtze River and Pearl River deltas, while irrigation andfertilization may have contributed to the increased NDVI in the North Chinaplain. INDEX TERMS: 0315 Atmospheric Composition and Structure: Biosphere/atmosphere interactions;
1620 Global Change: Climate dynamics (3309); 1640 Global Change: Remote sensing; KEYWORDS: trends in
NDVI, NDVI-climate relationship, human activity, China
Citation: Piao, Shilong, Jingyun Fang, Liming Zhou, Qinghua Guo, M. Henderson, Wei Ji, Yan Li, and Shu Tao, Interannual
variations of monthly and seasonal normalized difference vegetation index (NDVI) in China from 1982 to 1999, J. Geophys. Res.,
108(D14), 4401, doi:10.1029/2002JD002848, 2003.
1. Introduction
[2] Climate-related interannual variations of terrestrialvegetation activity have been investigated by variousapproaches, including studies of plant phenology [Bradleyet al., 1999; Menzel and Fabian, 1999], carbon processmodels [Melillo et al., 1993; Dai and Fung, 1993; Schimelet al., 2000], and analyses of satellite-derived normalizeddifference vegetation index (NDVI) data [Myneni et al.,1997, 1998, 2001; Los et al., 2001; Kawabata et al., 2001;Tucker et al., 2001; Zhou et al., 2001; Hicke et al., 2002a,2002b; Slayback et al., 2003]. These studies have suggestedthat growing season duration has lengthened and photosyn-thetic activity has increased in the northern middle and highlatitudes over the past few decades.
[3] Satellite observations provide a useful and powerfuldatabase for evaluating the dynamics of terrestrial bio-sphere because of its global coverage and short revisitinterval [Cramer et al., 1999]. The availability of thelong-term NDVI data derived from the Advanced VeryHigh Resolution Radiometer (AVHRR) of the NationalOceanic and Atmospheric Administration (NOAA) hasmotivated many scientists to study interannual variationsof vegetation activities. Myneni et al. [1997] found thatthe growing season of terrestrial vegetation in northernhigh latitudes has advanced. This finding is consistentwith observations of atmospheric CO2 concentration[Keeling et al., 1996] and was further confirmed [Loset al., 2001; Tucker et al., 2001; Zhou et al., 2001, 2003;Hicke et al., 2002a, 2002b; Lucht et al., 2002; Slaybacket al., 2003].[4] Variations in vegetation activity have been linked
with changes in climates [Los et al., 2001; Tucker et al.,2001; Zhou et al., 2001, 2003; Lucht et al., 2002]. Inves-tigating interannual variations of NDVI and their relation-ships with climate is critical for understanding themechanisms of climate-derived variations in vegetationactivity, carbon and hydrological cycles, and dynamics ofvegetation structures [Schloss et al., 1999; Los et al., 2001].However, most of these studies were based on coarseresolution climate data, and few detailed studies usingregional ground observations have been done.
JOURNAL OF GEOPHYSICAL RESEARCH, VOL. 108, NO. D14, 4401, doi:10.1029/2002JD002848, 2003
1Department of Ecology and Key Laboratory for Earth SurfaceProcesses of the Ministry of Education, Peking University, Beijing, China.
2School of Earth and Atmospheric Sciences, Georgia Institute ofTechnology, Atlanta, Georgia, USA.
3Now at Department of Environmental Science, Policy and Manage-ment, University of California at Berkeley, Berkeley, Californi, USA.
4Department of Environmental Science, Policy and Management,University of California at Berkeley, Berkeley, California, USA.
5Department of Geosciences, University of Missouri-Kansas City,Kansas City, Missouri, USA.
Copyright 2003 by the American Geophysical Union.0148-0227/03/2002JD002848$09.00
ACL 1 - 1

[5] China, especially the eastern part, is dominated by atypical monsoon climate, with cold and dry winters and hotand humid summers. This, and China’s geographic size,causes the country to have a large climate range, from thetropical to subarctic/alpine and from rain forest to desert,together with diverse and species-rich vegetation types. Inthe present study, we used the NDVI data from 1982 to1999, together with information on climate, vegetation, andhuman activity, to explore interannual variations of monthlyand seasonal NDVI and their relationships with climate andland use change. Climate variables in this paper includemonthly and seasonal precipitation and air temperature.Seasonal NDVI trends were analyzed in three seasons(spring, summer and autumn) to avoid spurious NDVItrends due to winter snow, while monthly NDVI trendswere applied to all 12 months throughout all year.
2. Data and Methods
2.1. NDVI Data
[6] The NDVI data used in this study were from theGlobal Inventory Monitoring and Modeling Studies(GIMMS) group derived from the NOAA/AVHRR Landdata set, at a spatial resolution of 8 � 8 km2 and 15-dayinterval, for the period January 1982 to December 1999[Tucker et al., 2001; Zhou et al., 2001]. This third-generationdata set has been corrected to remove the effects of strat-ospheric aerosol loadings from El Chichon and MountPinatubo eruptions in April 1984 and June 1991 and over-come most problems noted in previous generations of NDVIdata sets [Los, 1998;Myneni et al., 2001; Tucker et al., 2001;Zhou et al., 2001].[7] Interannual signals of plant canopy reflectance are
subtle and therefore subject to nonvegetation effects. Manyfactors, unrelated to ecosystem structure or function such asnavigation uncertainties, calibration uncertainties, atmo-spheric effects, variations in the viewing and illuminationgeometry, and variations in the soil background, introduceextraneous variability in NDVI, both in space and time, andcan be easily misidentified as real NDVI variability [Gut-man, 1999]. In the AVHRR time series, the major problemsare with the continuous changes in sensor sensitivity (cali-bration problem) and with satellite orbital drift and change-over. Properties of both surface and atmosphere are spatiallyand temporally variable and quantitative characteristics ofatmospheric constituents and surface are insufficient [Gut-man, 1999]. Successful removal of nonvegetation effects, atglobal and continental scales, remains a challenge.[8] Some of these nonvegetation effects can be minimized,
to a large extent, by processing and analyzing only themaximum NDVI value within each 15-day period [Holben,1986]. The quality of this data set has been assessed byTucker et al. [2001] and Zhou et al. [2001, 2003]. They foundthat this data set could be used to identify the long-termtrends in vegetation activity. Recent comparisons among fourAVHRR NDVI data sets indicate that variations due tosatellite drifts and changeover in the GIMMS data are smallin latitudes above 40�N. [Slayback et al., 2003].[9] To further reduce residual atmospheric and bidirec-
tional effect, we produced a monthly NDVI data set, usingthe maximum NDVI value in each month [Holben, 1986].However, some variations due to satellite drift/changeover,
incomplete corrections for calibration loss and atmosphericeffects (clouds, aerosols, etc) may still remain in theGIMMS NDVI data. Here we assume that such variationsare smaller than those due to environmental drivers.[10] These monthly NDVIs were then aggregated to grid
cells of 0.1� � 0.1� from the original 8-km resolution data.In this study, the total study area was 803 � 104 km2, 85.5%of China’s land area (940 � 104 km2). Grid cells with <0.1of annual average NDVI during 18 years were excluded toreduce the influence of soil (over deserts and sparselyvegetated grids) and snow on the NDVI trend.
2.2. Climate Data
[11] Monthly mean 2 m air temperature and precipitationdata at 0.1� � 0.1� resolution were compiled from the1949–1999 temperature/precipitation database of China.These data were generated from 680 climatic stations acrossthe country [Fang et al., 2001]. Figure 1 shows thelocations of these stations, together with the geographicaland elevational background of China. Some errors mayresult from the interpolation in the Tibetan Plateau becauseof limited meteorological stations available. The annualmean air temperature varies from ca. �6�C in the northeastregion and the central Tibetan Plateau to ca. 30�C in southChina, Hainan Island, and Taiwan (Figure 2). Precipitationvaries greatly from <50 mm in the Taklimakan Desert (thedriest desert in China) to about 3000 mm in south China. Inthe eastern half of China, temperature decreases from southto north and rainfall is relatively abundant (over 500 mm peryear), while in the western half temperature is generallybelow 10�C and very dry because of the influence of theTibetan Plateau (Figure 2).
2.3. Vegetation Type
[12] Vegetation data were obtained from a digitized actualvegetation map of China derived from ground observations(Figure 3a) [Institute of Geography, Chinese Academy ofSciences, 1986]. China’s vegetation was grouped into thefollowing 10 types: evergreen broadleaf forests, deciduousbroad-leaf forests, broadleaf and needleleaf forests, ever-green needleleaf forests, deciduous needleleaf forests, broad-leaf shrubs, temperate grasslands, alpine meadows andtundra, deserts, and cultivation. The data were aggregatedto grid cells at 0.1� � 0.1� resolution, as done for the NDVIand climate data sets. To compare the vegetation classifica-tion with the distribution of NDVI values, a map of annualmean NDVI for the 18 years was shown in Figure 3b.
3. Results and Discussion
3.1. Trends of Seasonal NDVI and Climate
[13] In this section we discuss the NDVI trends and theirrelationships with climatic variables by three seasons:spring (March to May), summer (June to August), andautumn (September to November). Linear time trends wereestimated by ordinary least squares for NDVI and climatevariables. In this paper, trends in both NDVI and climatevariables were not removed for correlation analysis. Werealize that positive trends in both NDVI and climate mayresult in higher correlations, and the results based ondetrended data may be more reliable. However, detrendingis acceptable only if the time series contains a deterministictrend, otherwise, it may introduce errors if the time series
ACL 1 - 2 PIAO ET AL.: VARIATIONS IN SEASONAL NDVI IN CHINA

contains a stochastic trend [Kaufmann et al., 2000]. Fur-thermore, statistically meaningful relations were found afterdetrending or differencing the NDVI and climate data [Zhouet al., 2001].
3.1.1. Trends at the Country Scale
[14] The NDVI trends for all three seasons increasedsignificantly (Figure 4a). The largest NDVI increase (r2 =0.40, p = 0.005) was in spring, with a magnitude of 14.4%over the 18 years and a trend of 0.0018 yr�1 (the 18-yearaveraged NDVI was 0.231). The increase for summer andautumn was 5.2% and 5.4% with a trend of 0.0012 yr�1 and0.0009 yr�1, respectively.[15] Increased NDVI was parallel with increased tempera-
ture (Figure 4b). There is a significant positive correlationbetween seasonal mean NDVI and temperature for allseasons, with a correlation coefficient of 0.70, 0.59, and0.47 for spring, summer, and autumn, respectively. Tempera-ture exhibits corresponding increases, with trends of 0.062�C yr�1 (r2 = 0.47, p = 0.002), 0.042 �C yr�1 (r2 = 0.37, p =0.007), and 0.047 �C yr�1 (r2 = 0.19, p = 0.07) for these threeseasons. Precipitation has a significant increasing trend insummer (r2 = 0.27, p = 0.03), but a significant decreasingtrend in autumn (r2 = 0.33, p = 0.01) (Figure 4c). Noapparent trend is seen in spring (r2 = 0.00, p = 0.79).
[16] Table 1 summarizes the changes in seasonal NDVIover the 18 years and the correlations between NDVI andclimatic factors for each season. Because the positive trendsin both NDVI and temperature may cause a higher corre-lation between these two variables, we used the methodproposed by Zhou et al. [2001] to calculate the relationship(RT-NDVI
*) between NDVI and the detrended temperature.As expected, the RT-NDVI
* values were smaller than thatbefore detrending; however, they showed a statisticallymeaningful correlation.[17] Consistent with previous studies, the largest increase
in NDVI occurred in the early growing season because of alarge temperature rise and advanced growing season [Myneniet al., 1997, 1998; Los et al., 2001; Zhou et al., 2001; Tuckeret al., 2001; Hicke et al., 2002b; Slayback et al., 2003].Concurrent increases in temperature and precipitation insummer may improve light use efficiency and moistureavailability for plants and thus lead to an increase in plantgrowth. This may be critical or at least partially account forthe large NDVI increase in China’s terrestrial vegetation.Although total annual precipitation has not increased over thepast two decades, significantly increased summer rainfallcould improve moisture availability for vegetation growth(Figure 4c). Autumn precipitation shows a marked decreasebut may not exert a large effect on plant growth in autumn,
Figure 1. Major geographical regions in China, together with location of climatic stations used. A totalof 680 stations are almost uniformly distributed across China. Boundaries of 31 provinces (cities orautonomous regions) are shown. Geographical regions are based on Editorial Committee for PhysicalGeography of China [1985].
PIAO ET AL.: VARIATIONS IN SEASONAL NDVI IN CHINA ACL 1 - 3

because increased summer rainfall could be stored in soilsand remain available in autumn for vegetation.[18] Despite the pronounced NDVI increases in all three
seasons, several large fluctuations appeared in the NDVItrends. For example, seasonal NDVI was large in 1990 butsmall in 1992 for all three seasons (Figure 4a), maybeassociated with seasonal climate patterns and moistureavailability. In 1990, both temperature and precipitationwere high (Figures 4b and 4c), and this may lead to an
increase in NDVI, while in 1992 the worldwide cooling dueto the Pinatubo eruption and low precipitation in summerand autumn may cause a decline of NDVI [Hansen et al.,1996; Zhou et al., 2001] for these two seasons; alternatively,not all of the aerosol effects are removed from the data.[19] A relatively large NDVI trend (Figure 4a) was also
found in the middle of growing season (summer) with a rateof 0.0012 yr�1, following that in spring (0.0018 yr�1). Thissuggests that summer vegetation activity is important to an
Figure 2. Spatial patterns of 18-year averaged (a) annual temperature and (b) precipitation over thestudy period from 1982 to 1999.
ACL 1 - 4 PIAO ET AL.: VARIATIONS IN SEASONAL NDVI IN CHINA

increase in annual plant growth that could be attributed toglobal warming [Melillo et al., 1993], increasing CO2
concentration [Keeling et al., 1996], and nitrogen deposition[McGuire et al., 1995].
3.1.2. Spatial Patterns of Trends
[20] Although the increasing trend of seasonal NDVI isapparent for three seasons at the national scale, we find a
high degree of spatial heterogeneity that varies seasonally(Figures 5a, 6a, and 7a). In spring (Figure 5a), NDVI tendsto increase in most areas, especially in the North ChinaPlain and hilly and plain areas of Central China, butdecreases sharply in the Yangtze River and Pearl Riverdeltas, where a rapid urbanization has taken place over thepast 20 years. Summer NDVI show a fragmented pattern,increasing in most areas of the Northeast China Plain, the
Figure 3. (a) Vegetation map of China derived from ground observations (based on Institute ofGeography, Chinese Academy of Sciences [1986]), and (b) map of annual mean NDVI calculated fromthe 18-year GIMMS NDVI data set from 1982 to 1999. For details, see text.
PIAO ET AL.: VARIATIONS IN SEASONAL NDVI IN CHINA ACL 1 - 5

North China Plain, the Sichuan Basin and the HainanIsland, and decreasing in the Loess Plateau and southernparts of Yangtze River. The area characterized by a declinein NDVI has expanded markedly in the deltas of theYangtze and Pearl Rivers (Figure 6a). The area withincreasing NDVI trends declines considerably in autumnacross the country (Figure 7a). Concomitantly, a decrease inNDVI was observed in a large area of Northeast China, thelower reaches of the Yellow River, the Yunnan-GuizhouPlateau-Sichuan Basin, and the central Tibetan Plateau.[21] To analyze effects of regional climates on seasonal
NDVI trends, correlations between NDVI and climate (tem-perature and precipitation) were showed for these threeseasons (Figures 5, 6, and 7). In spring, NDVI was positivelycorrelated with temperature in most areas (Figure 5b),suggesting that the possible effects of temperature onincreased spring NDVI for most parts of China. A negativecorrelation between NDVI and temperature in the NorthChina Plain could be explained, at least in part, as a resultof agricultural practices, because NDVI increased signifi-cantly even though temperature showed insignificantchange. There was a weak positive correlation betweenNDVI and precipitation over most areas in spring, but anegative correlation appeared in Mt. Xiao-xing-an-ling innortheast China where winter and spring were cold andsnowy, and in southeast China where spring is particularlyrainy (Figure 5c). A negative correlation was also seen inTibet, where increased precipitation might lead to an increasein snow and ice cover. In addition to their direct effects onNDVI, increased snowfall and rainfall could also shorten thegrowing season and reduce incoming solar radiation, thusdecrease NDVI in cold and rainy regions.[22] In summer, a negative correlation between NDVI and
temperature was found in most areas of north Yangtze River(e.g., the Loess Plateau), where significantly increasedtemperature and decreased precipitation could reduce mois-ture availability for plants (Figures 6b and 6c). In southwestareas of China, where summer rainfall was abundant, thecorrelation was also negative probably because of precipi-tation-related temperature reduction. Increased precipitationwas accompanied by an increase in clouds and thus a
reduction in incoming solar radiation. On the other hand,in the Yangtze River Valley, where increased summer rainfallresults in flooding [Xu and Zhao, 1999], NDVI variationswere parallel with changes in temperature (Figure 6b), notthose in precipitation (Figure 6c), probably becauseincreased summer rainfall and flooding resulted in a reduc-tion of plant growth.[23] In autumn, a weak positive correlation between
temperature and NDVI occurred in most areas of China(Figure 7b). In contrast, a negative correlation betweenprecipitation and NDVI was observed in most of thecountry (Figure 7c).[24] Figure 8 summarizes changes of NDVI on the area
base for different seasons. Over the past 18 years, the areawith the largest NDVI increase occurred in spring, whilethe least increase was in autumn (Figure 8a). For example,the area with the NDVI increase of 10–30% and >30% overthe 18 years was 45.6% and 10.2% of the total study area,while in autumn this value was only 27.0% and 2.5%,respectively (Figure 8a). Statistically, 85.9% of the totalstudy area has increased over the 18 years in spring, ofwhich 25.9% had a significant increase at the 5% level,while in summer and autumn 72.2% (16.8% at the 5% level)and 73.0% (12.0% at the 5% level) of the total area hadincreased, respectively (Figure 8b).[25] Evidently, the spatial and seasonal heterogeneity of
NDVI trends may mainly result from differences in regional
Figure 4. Interannual variations in (a) seasonal mean NDVI, (b) seasonal mean temperature, and (c)seasonal precipitation over the period 1982–1999 in China.
Table 1. Mean Value, Trend, and Relative Increase of Seasonal
NDVI, and Correlation Coefficients Between Seasonal Mean
NDVI and Mean Temperature (RT-NDVI) and Seasonal Precipitation
(RP-NDVI), and Between Seasonal NDVI and the Detrended
Temperature (RT-NDVI*)
Season
Seasonal NDVI
RT-NDVI RP-NDVI RT-NDVI*Mean ± SDTrend,per Year
RelativeIncrease,
%
Spring 0.23 ± 0.02 0.0018 14.4 0.70 0.27 0.47Summer 0.40 ± 0.01 0.0012 5.2 0.59 0.32 0.36Autumn 0.29 ± 0.01 0.0009 5.4 0.47 �0.02 0.35
ACL 1 - 6 PIAO ET AL.: VARIATIONS IN SEASONAL NDVI IN CHINA
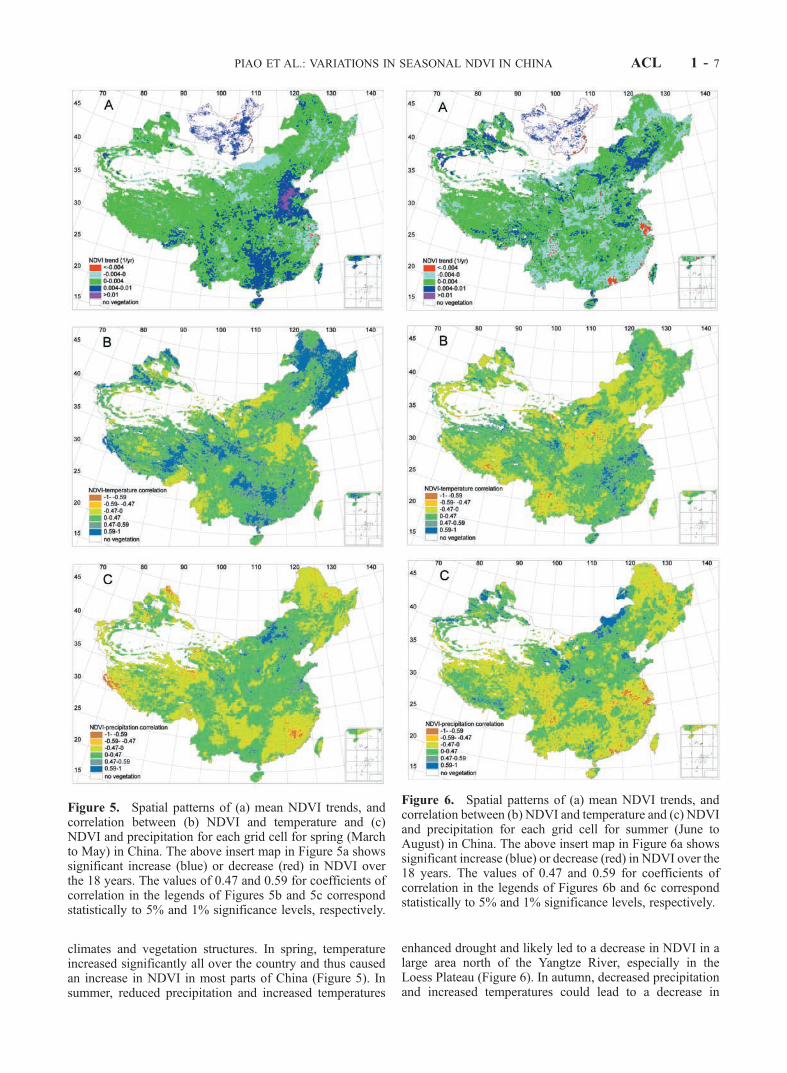
climates and vegetation structures. In spring, temperatureincreased significantly all over the country and thus causedan increase in NDVI in most parts of China (Figure 5). Insummer, reduced precipitation and increased temperatures
enhanced drought and likely led to a decrease in NDVI in alarge area north of the Yangtze River, especially in theLoess Plateau (Figure 6). In autumn, decreased precipitationand increased temperatures could lead to a decrease in
Figure 5. Spatial patterns of (a) mean NDVI trends, andcorrelation between (b) NDVI and temperature and (c)NDVI and precipitation for each grid cell for spring (Marchto May) in China. The above insert map in Figure 5a showssignificant increase (blue) or decrease (red) in NDVI overthe 18 years. The values of 0.47 and 0.59 for coefficients ofcorrelation in the legends of Figures 5b and 5c correspondstatistically to 5% and 1% significance levels, respectively.
Figure 6. Spatial patterns of (a) mean NDVI trends, andcorrelation between (b) NDVI and temperature and (c) NDVIand precipitation for each grid cell for summer (June toAugust) in China. The above insert map in Figure 6a showssignificant increase (blue) or decrease (red) in NDVI over the18 years. The values of 0.47 and 0.59 for coefficients ofcorrelation in the legends of Figures 6b and 6c correspondstatistically to 5% and 1% significance levels, respectively.
PIAO ET AL.: VARIATIONS IN SEASONAL NDVI IN CHINA ACL 1 - 7
NDVI in most of eastern and central China (Figure 7).Accordingly, the spatial pattern and magnitude of seasonalNDVI trends in China appears to be linked with changes intemperature and precipitation. Using the same NDVI data
set, Hicke et al. [2002b] analyzed trends of net primaryproduction (NPP) and their relation with climate in NorthAmerica from 1982 to 1998. They found that changes inclimate influenced NPP in the Central Plains and easternCanada where summer NPP increased, but did not influenceNPP in southeastern US where NPP increased in theabsence of climate variations. This suggests not only inChina, but also in North America, the interannual change invegetation activity varies spatially and seasonally.[26] Land use change, an important determinant for
carbon exchange between air and land [Sampson et al.,1993; Loveland and Belward, 1997; Kicklighter et al., 1999;
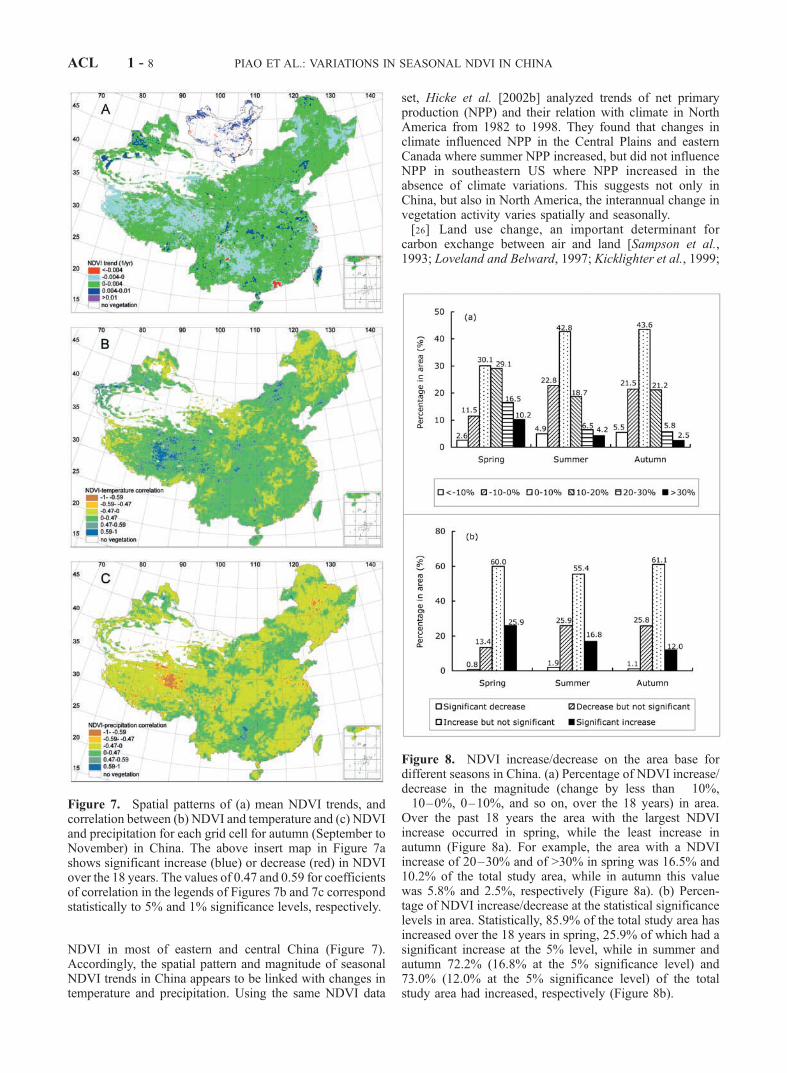
Figure 7. Spatial patterns of (a) mean NDVI trends, andcorrelation between (b) NDVI and temperature and (c) NDVIand precipitation for each grid cell for autumn (September toNovember) in China. The above insert map in Figure 7ashows significant increase (blue) or decrease (red) in NDVIover the 18 years. The values of 0.47 and 0.59 for coefficientsof correlation in the legends of Figures 7b and 7c correspondstatistically to 5% and 1% significance levels, respectively.
Figure 8. NDVI increase/decrease on the area base fordifferent seasons in China. (a) Percentage of NDVI increase/decrease in the magnitude (change by less than �10%,�10–0%, 0–10%, and so on, over the 18 years) in area.Over the past 18 years the area with the largest NDVIincrease occurred in spring, while the least increase inautumn (Figure 8a). For example, the area with a NDVIincrease of 20–30% and of >30% in spring was 16.5% and10.2% of the total study area, while in autumn this valuewas 5.8% and 2.5%, respectively (Figure 8a). (b) Percen-tage of NDVI increase/decrease at the statistical significancelevels in area. Statistically, 85.9% of the total study area hasincreased over the 18 years in spring, 25.9% of which had asignificant increase at the 5% level, while in summer andautumn 72.2% (16.8% at the 5% significance level) and73.0% (12.0% at the 5% significance level) of the totalstudy area had increased, respectively (Figure 8b).
ACL 1 - 8 PIAO ET AL.: VARIATIONS IN SEASONAL NDVI IN CHINA

Schimel et al., 2000], could also play a key role in thespatiotemporal changes in NDVI in the economic corezones of coastal China (Figures 5, 6, and 7). In the YangtzeRiver and Pearl River deltas, NDVI declined sharplythroughout all seasons because of rapid urban expansion.In contrast, in the North China Plain, increased NDVI waspartly a result of improved agricultural practices: irrigationand fertilizer use have increased in the past several decades[Editorial Committee for China’s Agricultural Yearbook,2000]. According to the China’s Agricultural Yearbook2000, food yields of major crops per area in this regionhad increased by 40% from 1982 to 1999, although wecould not identify in this paper how much of such increasewas resulted from the agricultural practices. The largeNDVI trends for the cultivated crops, shown in section3.2.2, also suggest the importance of human activity for theobserved NDVI trend and its spatial patterns.
3.2. Trends of Monthly NDVI and Climate
3.2.1. Monthly Trends at the Country Scale
[27] The magnitude of monthly NDVI and its changeover time are important indicators of the contribution ofvegetation activity in different months to annual plantgrowth total. In China, monthly NDVI reached maximumvalues in August and was rather small from Decemberthrough March (Figure 9a). The monthly NDVI trendsshowed positive values for all months, indicating that NDVIincreased throughout the year over the 18-year study period(Figure 9a). The largest two trends were in May and April,three to four months ahead of the largest monthly NDVI.That is, plant growth peaks in the middle of growing season(summer), while the largest NDVI increase occurred in theearly growing season (spring).
[28] NDVI trends and their patterns were likely coupledwith those of climatic variables (Figures 9b and 9c).Changes in monthly mean temperature and its trend wereconsistent with those of NDVI: high values in summer andlow ones in winter. However, the highest mean temperaturewas in July instead of August, the month with the largestmean NDVI (Figure 9b). Assuming 5�C as the threshold ofthe growing season [Prentice et al., 1992], the duration ofgrowing season would be about seven months long at thenational scale, beginning from about mid-March and endingaround mid-October. The corresponding NDVI value wasabout 0.20 at the beginning of growing season and 0.25 atthe end of the growing season. The different NDVI values atthe beginning and end of the growing season should beimportant for the satellite-based study of plant phenology.[29] The temperature trends were positive for all months,
indicating that mean temperature has increased in everymonth over the study period (Figure 9b). The largesttemperature rise was in February with an annual rate of0.16�C, which means that temperature in this month hasincreased by 3.2�C over the past two decades; the secondlargest were in December and April, both with a annual rateof 0.09�C. Temperature increase was also large in Marchwith a rate of 0.07 �C yr�1. Clearly, the appearance of thelargest NDVI trend lagged behind that of the largesttemperature trend by three months at the national scale.[30] Monthly precipitation showed a similar pattern to
that of temperature and NDVI: large values in summer andsmall in winter (Figure 9c). However, the precipitation trendindicated a large fluctuation: summer saw significantincreases while September suffered a steep decrease. Con-current increased summer rainfall and temperature couldenhance plant growth, as we discussed in section 3.1.1.
Figure 9. Seasonal changes in monthly NDVI and climatic variables over the 18 years from 1982 to1999 in China. (a) 18-year averaged monthly NDVI and its trend. (b) 18-year averaged monthly meantemperature and its trends. (c) 18-year averaged monthly precipitation and its trend. (d) Correlationsbetween monthly NDVI and temperature and between monthly NDVI and precipitation.
PIAO ET AL.: VARIATIONS IN SEASONAL NDVI IN CHINA ACL 1 - 9

[31] Correlations between monthly climatic variables andNDVI are showed in Figure 9d. A positive correlationbetween temperature and NDVI was seen for all months.NDVI significantly correlated with temperature (5% level)in February to July, but not in August and September(Figure 9d). The relationship between precipitation andNDVI was more complicated than that between NDVIand temperature at the national scale: positive correlationsappeared for May, June, July, and October, and othermonths were weak negative or insignificant (Figure 9d).
3.2.2. Monthly Trends by Vegetation Type
[32] Similar tomonthly NDVI and its trend over the past 18years at the country scale (Figure 9a), monthly NDVI and itstrends showed the largest value in summer and spring formost vegetation types (Figure 10). In general, the monthlyNDVI was largest in July or August, and was rather smallvalues in winter and spring for all the vegetation types, exceptevergreen broadleaf forests whose monthly NDVI was rela-tively large from summer through winter, and the lowest inspring (Figure 10a). The monthly NDVI trends showed thatNDVI has increased in the growing season for all vegetationtypes. The largest increase was in the early growing season(April orMay) formost vegetation types except broadleaf andneedleleaf mixed forests (Figure 10c) and temperate grass-lands (Figure 10h), which had similar magnitudes of theNDVI trend throughout the growing season. The largestNDVI trend in the early growing season reflects an effect ofthe advanced growing season. It is noteworthy that the NDVItrend in August was small for most vegetation types exceptdeserts (Figure 10g) and temperate grasslands (Figure 10h),consistent with the trend of the country as awhole (Figure 9a).[33] The seasonal changes in the trends of monthly tem-
perature and precipitation by vegetation type were shown inFigure 10. Among the highlights of the temperature trend:[34] 1. Monthly mean temperatures have increased over
the past 18 years for most vegetation types, except decid-uous needleleaf forest (Figure 10e) in northeast China wherea negative temperature trend was observed in March,November, and December.[35] 2. The temperature rise was not significant during
summer season for all vegetation types, especially for ever-green broadleaf forests, deciduous broad-leaf forests, ever-green needleleaf forests, and deciduous needleleaf forests.[36] 3. In general, the temperature increase was larger in
vegetation types in northern areas than in southern areas.For instance, the largest temperature annual rise (February)was 0.3�C for broadleaf and needleleaf mixed forests(Figure 10c), 0.24–0.26�C for deciduous broad-leaf forests(Figure 10b) and deciduous needleleaf forests (Figure 10e),and 0.08�C (April) for evergreen broadleaf forests in southChina (Figure 10a).[37] 4. Seasonal patterns of precipitation trends by vege-
tation type were almost consistent with those for the wholecountry: increases in summer and decreases in Septemberfor most vegetation types, except broadleaf and needleleafmixed forests (Figure 10c) and deciduous needleleaf forests(Figure 10e) where precipitation decreased in summer.
3.2.3. Lagged Effect of Climate
[38] In China, NDVI showed a consistent seasonal patternwith those of temperature and precipitation: large values in
summer and small in winter (Figure 9a). However, the peakNDVI was seen in August, not in July with the largesttemperature and precipitation (Figures 9b and 9c). This wassomewhat different from results in other northern regionsreported by Schloss et al. [1999] and Kicklighter et al.[1999], who suggested that the highest vegetation activitywas in June or July, the months with the highest temperatureand precipitation in the northern regions. The possiblereasons for such difference is unknown, possibly due todifferent approaches, namely using the carbon processmodels by Kicklighter et al. [1999] and the satellite-derivedanalysis by the present study.[39] A discrepancy between maxima in NDVI and cli-
matic variables may suggest a lagged response of NDVI tochanges in climate. This lagged response was clearly shownin the relationship between trends in monthly NDVI andtemperature at the country scale (Figure 9). The analysis ofcorrelation between NDVI and temperature by vegetationtype also confirmed such a lag: the largest temperatureincrease occurred in February, about 3 months in advance ofthe largest NDVI increase for all vegetation types exceptevergreen broadleaf forests (Figure 10). To illustrate thisfurther, Figure 11 plots the correlations of February meantemperature to monthly NDVI values from March throughJuly at the national scale. A strong correlation was foundbetween the mean temperature and NDVI value for April(r2 = 0.33, p = 0.01) and May (r2 = 0.34, p = 0.01),confirming the time-lag and the importance of Februarymean temperature to the NDVI change. Braswell et al.[1997] found that a lag of about 2 years was between NDVIand temperature at the global scale. Los et al. [2001]explained this by the climatic oscillations, which had asimilar periodicity (ca. 2 years) during the 1980s, andsuggested shorter lags at regional scales. The time lag of 3months between NDVI and temperature identified at nation-al and biome scales in China may suggest that the result fromthe present study has provided regional information on theresponse of vegetation activity to temperature.
4. Concluding Remarks
[40] The multiyear NDVI data set and a correspondingclimate data set from 1982 to 1999 were used to analyzemonthly and seasonal NDVI trends and their relationshipswith climate and human activity. The results indicate thatboth monthly and seasonal NDVI increased at the nationaland biome scales. These trends showed a large spatial andtemporal heterogeneity, corresponding mainly to regionaland seasonal changes in climate, suggesting that climatechange is playing an important role for the patterns of NDVItrends.[41] 1. At the national scale, seasonal mean NDVI and
temperature showed a significant increase for spring, sum-mer and autumn. Several large fluctuations in the NDVItrends were likely due to fluctuations in precipitation. Theseresults suggested that both temperature and precipitation arecritical to interannual variability of NDVI.[42] 2. The NDVI trends showed a large spatial hetero-
geneity, roughly corresponding to regional climate and itsseasonal changes. In general, increased temperature andprecipitation could lead to an increase in NDVI in mostareas, but increased temperatures could also cause seasonal
ACL 1 - 10 PIAO ET AL.: VARIATIONS IN SEASONAL NDVI IN CHINA
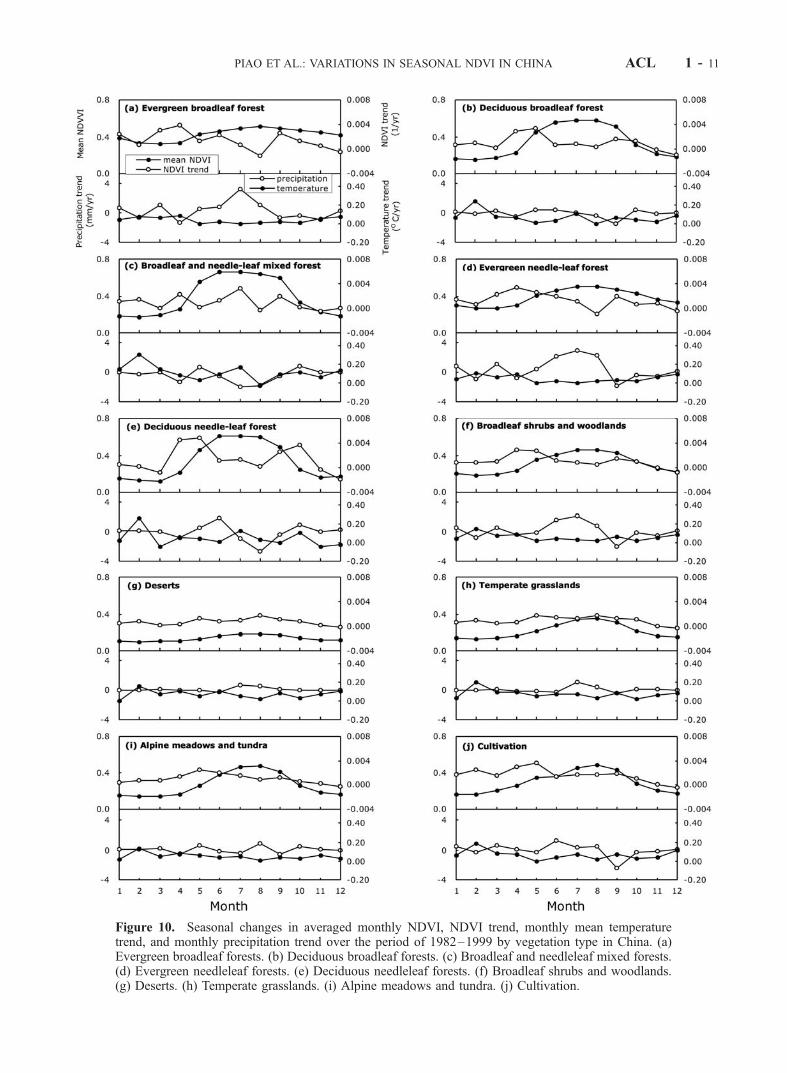
Figure 10. Seasonal changes in averaged monthly NDVI, NDVI trend, monthly mean temperaturetrend, and monthly precipitation trend over the period of 1982–1999 by vegetation type in China. (a)Evergreen broadleaf forests. (b) Deciduous broadleaf forests. (c) Broadleaf and needleleaf mixed forests.(d) Evergreen needleleaf forests. (e) Deciduous needleleaf forests. (f) Broadleaf shrubs and woodlands.(g) Deserts. (h) Temperate grasslands. (i) Alpine meadows and tundra. (j) Cultivation.
PIAO ET AL.: VARIATIONS IN SEASONAL NDVI IN CHINA ACL 1 - 11

drought in arid regions (such as in summer in the LoessPlateau), and increased precipitation could lead to adecrease in plant photosynthesis due to decreased solarradiation in rainy regions (such as in summer in the YangtzeRiver valley and spring in south China) and owing todecreased temperature and solar radiation in cold regions(Tibet and northeast China). The rate and extent of NDVIincrease varied seasonally. The largest increase appeared inspring by 14.4% in magnitude during the 18 years over85.9% of the total study area (with a significant increase of25.9% in area at 5% significance level). The increase insummer and autumn was by 5.2% and 5.4% over 72.2%(with a significant increase of 16.8%) and 73.0% (with asignificant increase of 12.0%) of the study area, respectively(Figure 8).[43] 3. Human activities (urbanization and agricultural
practices) have exerted a large effect on the spatiotemporalpatterns of NDVI trends in some regions. Rapid urbaniza-tion has caused a sharp decrease in NDVI in the YangtzeRiver and Pearl River deltas, while irrigation and fertilizeruse have probably increased plant growth in North ChinaPlain.[44] 4. At the national and biome scales, a time lag of
about three months (February and May) was found betweenvegetation activity and temperature change.
[45] Acknowledgments. The earlier draft of this article was preparedin Department of Geosciences of the University of Missouri at Kansas City(UMKC) where J. Y. Fang took his sabbatical leave from November 2001to January 2002. He thanks R. M. Coveney for administrative support whenhe was at UMKC. The authors also wish to thank F. Wei for her assistancein collecting the climate data and three referees for their helpful sugges-tions. This research was supported by the National Natural ScienceFoundation of China (40024101 and 40152003), State Key Basic Researchand Development Plan (G2000046801), and ‘‘985’’ project of PekingUniversity.
ReferencesBradley, N. L., A. C. Leopold, J. Ross, and W. Huffaker, Phenologicalchanges reflect climate change in Wisconsin, Proc. Natl. Acad. Sci.U.S.A., 96, 9701–9704, 1999.
Braswell, B. H., D. S. Schimel, E. Linder, and Moore III, The response ofglobal terrestrial ecosystems to interannual temperature variability,Science, 278, 868–872, 1997.
Cramer, W., et al., Comparing global models of terrestrial net primaryproductivity (NPP): Overview and key results, Global Change Biol., 5,1–15, 1999.
Dai, A., and I. Y. Fung, Can climate variability contribute to the ‘‘missing’’CO2 sink?, Global Biogeochem. Cycles, 7, 599–609, 1993.
Editorial Committee for China’s Agricultural Yearbook, China’s Agricultur-al Yearbook 1999, Agriculture Press, Beijing, 2000.
Editorial Committee for Physical Geography of China, Physical Geographyof China-A General Note, Science Press, Beijing, 1985.
Fang, J. Y., S. L. Piao, Z. Y. Tang, C. H. Peng, and W. Ji, Interannualvariability in net primary production and precipitation, Science, 293,1723a, 2001.
Gutman, G., On the use of long-term global data of land reflectances andvegetation indices derived from the Advanced Very High ResolutionRadiometer, J. Geophys. Res., 104, 6241–6255, 1999.
Hansen, J., R. Ruedy, M. Sato, and R. Reynolds, Global surface air tem-perature in 1995: Return to pre-Pinatubo level, Geophys. Res. Lett., 23,1665–1668, 1996.
Hicke, J. A., G. P. Asner, J. T. Randerson, C. Tucker, S. Los, R. Birdsey,J. C. Jenkins, C. Field, and E. Holland, Satellite-derived increases in netprimary productivity across North America, 1982–1998, Geophys. Res.Lett., 29(10), 1427, doi:10.1029/2001GL013578, 2002a.
Hicke, J. A., G. P. Asner, J. T. Randerson, C. Tucker, S. Los, R. Birdsey,J. C. Jenkins, and C. Field, Trends in North American net primary pro-ductivity derived from satellite observations, 1982–1998, Global Bio-geochem. Cycles, 16(2), 1018, doi:10.1029/2001GB001550, 2002b.
Holben, B. N., Characteristics of maximum value composite images fromtemporal AVHRR data, Int. J. Remote Sens., 7, 1417–1434, 1986.
Institute of Geography, Chinese Academy of Sciences, Digitized VegetationMap of China, Natl. Lab. for GIS and Remote Sens., Beijing, 1986.
Kaufmann, R. K., L. M. Zhou, Y. Knyazikhin, N. V. Shabanov, R. B.Myneni, and C. J. Tucker, Effect of orbital drift and sensor changes onthe time series of AVHRR vegetation index data, IEEE Trans. Geosci.Remote Sens., 38, 2584–2597, 2000.
Kawabata, A., K. Ichii, and Y. Yamaguchi, Global monitoring of interannualchanges in vegetation activities using NDVI and its relationships to tem-perature and precipitation, Int. J. Remote Sens., 22, 1377–1382, 2001.
Keeling, C. D., J. F. S. Chin, and T. P. Whorf, Increased activity of northernvegetation in inferred from atmospheric CO2 measurements, Nature, 382,146–149, 1996.
Kicklighter, D. W., et al., Comparing global models of terrestrial net pri-mary productivity (NPP): Global pattern and differentiation by majorbiomes, Global Change Biol., 5, 16–24, 1999.
Los, S. O., Estimation of the ratio of sensor degradation between NOAAAVHRR channel 1 and 2 from monthly NDVI composites, IEEE Trans.Geosci. Remote Sens., 36, 202–213, 1998.
Los, S. O., G. J. Collatz, L. Bounoua, P. J. Sellers, and C. J. Tucker, Globalinterannual variations in sea surface temperature and land surface vegeta-tion, air temperature, and precipitation, J. Clim., 14, 1535–1549, 2001.
Loveland, T. R., and A. S. Belward, The IGBP-DIS global 1 km land-coverdataset, DISCOVER-first results, Int. J. Remote Sens., 18, 3291–3295,1997.
Lucht, W., et al., Climatic control of the high-latitude vegetation greeningtrend and Pinatubo effect, Science, 296, 1687–1689, 2002.
McGuire, A. D., J. M. Melillo, and L. A. Joyce, The role of nitrogen in theresponse of forest net primary production to elevated atmospheric carbondioxide, Ann. Rev. Ecol. Syst., 26, 473–503, 1995.
Melillo, J. M., A. D. McGuire, D. W. Kicklighter, B. Moore, C. J. Voros-marty, and A. L. Schloss, Global climate change and terrestrial net pri-mary production, Nature, 363, 234–240, 1993.
Menzel, A., and P. Fabian, Growing season extended in Europe, Nature,397, 659, 1999.
Myneni, R. B., C. D. Keeling, C. J. Tucker, G. Asrar, and R. R. Nemani,Increased plant growth in the northern high latitudes from 1981–1991,Nature, 386, 698–702, 1997.
Myneni, R. B., C. J. Tucker, G. Asrar, and C. D. Keeling, Interannualvariations in satellite-sensed vegetation index data from 1981–1991,J. Geophys. Res., 103, 6145–6160, 1998.
Myneni, R. B., J. Dong, C. J. Tucker, R. K. Kaufmann, P. E. Kauppi,J. Liski, L. M. Zhou, V. Alexeyev, and M. K. Hughes, A large carbonsink in the woody biomass of Northern forests, Proc. Natl. Acad. Sci.U.S.A., 98, 14,784–14,789, 2001.
Prentice, I. C., et al., A global biome model based on plant physiology anddominance, soil properties and climate, J. Biogeogr., 19, 117–134, 1992.
Sampson, R. N., et al., Workshop summary: Terrestrial biospheric carbonfluxes-Quantification of sinks and sources of CO2, Water Air Soil Poll.,70, 3–15, 1993.
Schimel, D., et al., Contribution of increasing CO2 and climate to carbonstorage by ecosystems in the United States, Science, 287, 2004–2006,2000.
Figure 11. Correlations between February mean tempera-ture and monthly NDVI of March to July at the countryscale. A strong correlation showed between the meantemperature and the NDVI value for April (r2 = 0.33, p =0.01) and May (r2 = 0.34, p = 0.01) suggests the importanceof February mean temperature to the NDVI increase forthese 2 months.
ACL 1 - 12 PIAO ET AL.: VARIATIONS IN SEASONAL NDVI IN CHINA

Schloss, A. L., et al., Comparing global models of terrestrial net primaryproductivity (NPP): Comparison of NPP to climate and the normalizeddifference vegetation index (NDVI), Global Change Biol., 5, 25–34,1999.
Slayback, D., J. Pinzon, S. Los, and C. Tucker, Northern Hemispherephotosynthetic trends 1982–1999, Global Change Biol., 9, 1 –15,2003.
Tucker, C. J., D. A. Slayback, J. E. Pinzon, S. O. Los, R. B. Myneni, andM. G. Taylor, Higher northern latitude NDVI and growing season trendsfrom 1982 to 1999, Int. J. Biometeorol., 45, 184–190, 2001.
Xu, H. D., and Q. G. Zhao (Eds.), The Flood Disaster and ScientificStrategies in Yangtze River Basin, Science Press, Beijing, 1999.
Zhou, L. M., C. J. Tucker, R. K. Kaufmann, D. Slayback, N. V. Shabanov,and R. B. Myneni, Variations in northern vegetation activity inferred fromsatellite data of vegetation index during 1981 to 1999, J. Geophys. Res.,106, 20,069–20,083, 2001.
Zhou, L. M., R. K. Kaufmann, Y. Tian, R. B. Myneni, and C. J. Tucker,Relation between interannual variations in satellite measures of vegeta-
tion greenness and climate between 1982 and 1999, J. Geophys. Res.,108, 4004, doi:10.1029/2002JD002510, 2003.
�����������������������Jingyun Fang (corresponding author), Yan Li, Shilong Piao, and Shu Tao,
Department of Ecology and Key Laboratory for Earth Surface Processes ofthe Ministry of Education, Peking University, Beijing 100871, China.( [email protected]; [email protected]; [email protected])Qinghua Guo and M. Henderson, Department of Environmental Science,
Policy, and Management, University of California at Berkeley, 135Giannini Hall, Berkeley, CA 94720-3312, USA. ([email protected])Wei Ji, Department of Geosciences, University of Missouri at Kansas
City, 5100 Rockhill Road, Kansas City, MO 64110-2499, USA.( [email protected])Liming Zhou, School of Earth and Atmospheric Sciences, Georgia
Institute of Technology, Atlanta, GA 30332-0340, USA. ([email protected])
PIAO ET AL.: VARIATIONS IN SEASONAL NDVI IN CHINA ACL 1 - 13
Copyright © 2022 FDOKUMEN