Inter-hemispheric asymmetry in polar mesosphere summer echoes and temperature at 69° latitude
6
Inter-hemispheric asymmetry in polar mesosphere summer echoes and temperature at 691 latitude Ray J. Morris a, , Andrew R. Klekociuk a , Ralph Latteck b , Werner Singer b , David A. Holdsworth c , Damian J. Murphy a a Australian Antarctic Division, 203 Channel Highway, Kingston 7050, Tasmania, Australia b Leibniz-Institute of Atmospheric Physics, Ku ¨hlungsborn, Germany c Atmospheric Radar Systems, Thebarton, South Australia, Australia article info Article history: Accepted 28 September 2008 Available online 25 October 2008 Keywords: MST radar PMSE Mesosphere Temperature Inter-hemispheric abstract An inter-hemispheric asymmetry is found in the characteristics of polar mesosphere summer echoes (PMSE) and upper mesosphere temperatures at conjugate latitudes (691) above Antarctica and the Arctic. The second complete mesosphere–stratosphere–troposphere (MST) radar summer observation season at Davis (68.61S) revealed that PMSE occur less frequently, with lower strength and on average 1 km higher compared with their northern counterparts at Andenes (69.31N). We consider the thermodynamic state of the mesosphere for conjoining hemispheric summers based on satellite and ground-based radar measurements, and show the mesopause region near 80–87 km of the Southern Hemisphere (SH) to be up to 7.5K warmer than its Northern Hemisphere (NH) counterpart. We show that this is consistent with our observation of asymmetries in the characteristics of PMSE and demonstrate how the mesosphere meridional wind field influences the existence and strength of the echoes in both hemispheres. Crown Copyright & 2008 Published by Elsevier Ltd. All rights reserved. 1. Introduction PMSE were first identified almost three decades ago by VHF radars in Germany (521N) (Czechowsky et al., 1979) and Alaska (651N) (Ecklund and Balsley, 1981) as enhanced backscatter in the height range 78–92 km during the boreal summer. Studies followed primarily in the Northern Hemisphere (NH) as far north as 781N(Lu ¨ bken et al., 2004b), although recently more focus has been given to Southern Hemisphere (SH) observations (Woodman et al., 1999; Morris et al., 2004). PMSE layers are believed to comprise charged aerosols that are created near the temperature minimum of the polar summer mesopause. Their theoretical interpretation has evolved (Cho and Ro ¨ttger, 1997) to the current level of understanding whereby most characteristics of PMSE can readily be explained (Rapp and Lu ¨ bken, 2004). Initial limited SH observations of PMSE from Machu Picchu (62.11S) were compared with PMSE observations from Poker Flat (651N) albeit displaced by 10 years (Woodman et al., 1999). This work revealed a significant difference in PMSE strength between the sites in the order of 25 dB, with the echo power observed at the SH site being up to 300 times less. Subsequently, Sarango et al. (2003) reported PMSE some 11dB stronger at Artigas (62.181S) (30 km away) during 2000–2001 on a smaller un-calibrated MST radar, arguing these results support inter-annual variability in PMSE characteristics. Morris et al. (2004, 2006) pointed out that PMSE strengths of 32 dB observed at Davis appeared consistent with published NH PMSE strengths for Andenes (691N), albeit with the caveat that inter-hemispheric comparisons required observations from similar calibrated radars. Hosokawa et al. (2005) extracted PMSE signatures from identical SuperDARN (Super Dual Auroral Radar Network) radars operating at 10 MHz, to reveal 1.5 greater occurrence rate of PMSE at Iceland (63.771N) compared with Syowa (69.011S) for two consecutive NH (1999 and 2000) and SH (1999–2000 and 2000–2001) seasons, concluding that an inter-hemispheric asym- metry in PMSE occurrence exits, albeit much weaker than reported from (un-calibrated) VHF radar observations. However, Jarvis et al. (2005) compared PMSE detected on a Dynasonde (at 28 MHz) at Halley (761S) for the 2005 season with PMSE strengths reported by Woodman et al. (1999, Fig. 4) for Machu Picchu (62.11S) and Poker Flat (651N) a decade earlier on MST radars. These authors estimated PMSE relative SNR (dB) for Halley and Poker Flat (separated by 111 poleward in latitude) to be similar, concluding that no inter-hemispheric difference exists in PMSE strength. Jarvis et al. (2005) and more recently Kirkwood et al. (2007) suggested that their inter-hemispheric results agreed with those reported by Morris et al. (2004), although the Davis radar was not ARTICLE IN PRESS Contents lists available at ScienceDirect journal homepage: www.elsevier.com/locate/jastp Journal of Atmospheric and Solar-Terrestrial Physics 1364-6826/$ - see front matter Crown Copyright & 2008 Published by Elsevier Ltd. All rights reserved. doi:10.1016/j.jastp.2008.09.042 Corresponding author. Tel.: +613 62323315; fax: +613 62323496. E-mail address: [email protected] (R.J. Morris). Journal of Atmospheric and Solar-Terrestrial Physics 71 (2009) 464–469
Transcript of Inter-hemispheric asymmetry in polar mesosphere summer echoes and temperature at 69° latitude

ARTICLE IN PRESS
Journal of Atmospheric and Solar-Terrestrial Physics 71 (2009) 464–469
Contents lists available at ScienceDirect
Journal ofAtmospheric and Solar-Terrestrial Physics
1364-68
doi:10.1
� Corr
E-m
journal homepage: www.elsevier.com/locate/jastp
Inter-hemispheric asymmetry in polar mesosphere summer echoesand temperature at 691 latitude
Ray J. Morris a,�, Andrew R. Klekociuk a, Ralph Latteck b, Werner Singer b,David A. Holdsworth c, Damian J. Murphy a
a Australian Antarctic Division, 203 Channel Highway, Kingston 7050, Tasmania, Australiab Leibniz-Institute of Atmospheric Physics, Kuhlungsborn, Germanyc Atmospheric Radar Systems, Thebarton, South Australia, Australia
a r t i c l e i n f o
Article history:
Accepted 28 September 2008An inter-hemispheric asymmetry is found in the characteristics of polar mesosphere summer echoes
(PMSE) and upper mesosphere temperatures at conjugate latitudes (�691) above Antarctica and the
Available online 25 October 2008Keywords:
MST radar
PMSE
Mesosphere
Temperature
Inter-hemispheric
26/$ - see front matter Crown Copyright & 2
016/j.jastp.2008.09.042
esponding author. Tel.: +613 62323315; fax:
ail address: [email protected] (R.J. Morri
a b s t r a c t
Arctic. The second complete mesosphere–stratosphere–troposphere (MST) radar summer observation
season at Davis (68.61S) revealed that PMSE occur less frequently, with lower strength and on average
1 km higher compared with their northern counterparts at Andenes (69.31N). We consider the
thermodynamic state of the mesosphere for conjoining hemispheric summers based on satellite and
ground-based radar measurements, and show the mesopause region near �80–87 km of the Southern
Hemisphere (SH) to be up to 7.5 K warmer than its Northern Hemisphere (NH) counterpart. We show
that this is consistent with our observation of asymmetries in the characteristics of PMSE and
demonstrate how the mesosphere meridional wind field influences the existence and strength of the
echoes in both hemispheres.
Crown Copyright & 2008 Published by Elsevier Ltd. All rights reserved.
1. Introduction
PMSE were first identified almost three decades ago by VHFradars in Germany (521N) (Czechowsky et al., 1979) and Alaska(651N) (Ecklund and Balsley, 1981) as enhanced backscatter in theheight range 78–92 km during the boreal summer. Studiesfollowed primarily in the Northern Hemisphere (NH) as far northas 781N (Lubken et al., 2004b), although recently more focus hasbeen given to Southern Hemisphere (SH) observations (Woodmanet al., 1999; Morris et al., 2004). PMSE layers are believed tocomprise charged aerosols that are created near the temperatureminimum of the polar summer mesopause. Their theoreticalinterpretation has evolved (Cho and Rottger, 1997) to the currentlevel of understanding whereby most characteristics of PMSE canreadily be explained (Rapp and Lubken, 2004).
Initial limited SH observations of PMSE from Machu Picchu(62.11S) were compared with PMSE observations from Poker Flat(651N) albeit displaced by 10 years (Woodman et al., 1999). Thiswork revealed a significant difference in PMSE strength betweenthe sites in the order of 25 dB, with the echo power observed atthe SH site being up to 300 times less. Subsequently, Sarango et al.(2003) reported PMSE some �11 dB stronger at Artigas (62.181S)
008 Published by Elsevier Ltd. All
+613 62323496.
s).
(�30 km away) during 2000–2001 on a smaller un-calibrated MSTradar, arguing these results support inter-annual variability inPMSE characteristics. Morris et al. (2004, 2006) pointed out thatPMSE strengths of �32 dB observed at Davis appeared consistentwith published NH PMSE strengths for Andenes (691N), albeitwith the caveat that inter-hemispheric comparisons requiredobservations from similar calibrated radars.
Hosokawa et al. (2005) extracted PMSE signatures fromidentical SuperDARN (Super Dual Auroral Radar Network) radarsoperating at 10 MHz, to reveal �1.5 greater occurrence rate ofPMSE at Iceland (63.771N) compared with Syowa (69.011S) for twoconsecutive NH (1999 and 2000) and SH (1999–2000 and2000–2001) seasons, concluding that an inter-hemispheric asym-metry in PMSE occurrence exits, albeit much weaker thanreported from (un-calibrated) VHF radar observations. However,Jarvis et al. (2005) compared PMSE detected on a Dynasonde (at28 MHz) at Halley (761S) for the 2005 season with PMSE strengthsreported by Woodman et al. (1999, Fig. 4) for Machu Picchu(62.11S) and Poker Flat (651N) a decade earlier on MST radars.These authors estimated PMSE relative SNR (dB) for Halley andPoker Flat (separated by 111 poleward in latitude) to be similar,concluding that no inter-hemispheric difference exists in PMSEstrength.
Jarvis et al. (2005) and more recently Kirkwood et al. (2007)suggested that their inter-hemispheric results agreed with thosereported by Morris et al. (2004), although the Davis radar was not
rights reserved.
ARTICLE IN PRESS
R.J. Morris et al. / Journal of Atmospheric and Solar-Terrestrial Physics 71 (2009) 464–469 465
yet calibrated. Also the SH studies of Morris et al. (2004), Jarvis etal. (2005) and Kirkwood et al. (2007) covered only the last 3weeks of the austral summer, when PMSE occurrence rates andstrength decline (from a peak volume reflectivity at Davis ofZ�4�10�11 m�1) (Morris et al., 2007) during the late seasonwarming of the mesopause region (Lubken et al., 2004a). Lattecket al. (2005) stressed the importance of using calibrated radars(i.e. the delay-line methodology) for inter-site comparison ofPMSE strength or more correctly volume reflectivity, Z (a radar-independent parameter) over a complete season.
Subsequently, Latteck et al. (2007) reported the first inter-hemispheric comparison of PMSE recorded on similar calibratedMST radars located near the same latitude (Davis (68.61S) andAndenes (691N)), which revealed a lower peak volume reflectivity atDavis (Z�3.7�10�11 m�1) compared with Andenes (Z�6.8�10�10
m�1). Kirkwood et al. (2007, Fig. 4) using calibrated radars (i.e. skynoise methodology) then reported little difference in volumereflectivity between Wasa (731S) and Kiruna (681N), whereZ�6�10�14 m�1 for 2007, concluding that Arctic PMSE are similarto Antarctic PMSE toward the end of the PMSE season. The Kirkwoodet al. (2007) results show that the 51 poleward location of the SH sitesupports the case for an inter-hemisphere difference in PMSEreflectivity based on a latitude profile of increasing volume reflectivitytoward higher latitude. Indeed, a preliminary comparison of PMSEbetween Davis and Wasa (for 2007) revealed larger reflectivity andoccurrence rates with increasing latitude (S. Kirkwood, personalcommunication, 2007).
A significant knowledge gap relates to whether there is an inter-hemispheric difference in the thermal state of the mesopauseregion. Early satellite temperature measurements suggested the SHpolar mid-summer mesopause region to be warmer than the NH by9 K (Huaman and Balsley, 1999). Bailey et al. (2005) were the first toreport a similar inter-hemispheric difference in polar mesosphericclouds (PMC), and subsequent work by Bailey et al. (2007) revealedthat SH PMC exhibit larger variability, more markedly at latitudesbelow 751. Wrotny and Russell (2006) demonstrated that NH PMCwere more frequent and brighter compared with SH PMC. Similarly,a comprehensive discussion of inter-hemispheric mesospherictemperature and PMC differences determined from HALOE data,together with a comparison with a model was presented by Hervigand Siskind (2006), revealing PMC to be more frequent and 30%brighter, consistent with the observed lower NH mesospherictemperatures. On the other hand, in situ observations from fallingspheres launched from rockets at Rothera (681S) for January showtemperatures to be similar but 2–3 K warmer, compared withearlier Arctic measurements (although warmer again in February)(Lubken et al., 2004a).
In Section 2 we extend and consolidate the inter-hemisphereknowledge base of PMSE morphology and characteristics for Davis(2005–2006) and Andenes (2005) to a second season (usingcalibrated radars), beyond the previous conjoining seasonsreported by Latteck et al. (2007). The first corresponding seasonalspatiotemporal envelopes of mesopause region MLS temperaturemeasurements and MF radar-derived meridional winds arepresented in Section 3. Finally, we discuss the reported inter-hemispheric differences in PMSE (similar to PMC) in relation tovariations in mesopause region temperatures and prevailingmeridional wind flow, concluding that our findings support recentexperimental and model evidence of an inter-hemisphere differ-ences in polar mesopause region temperatures (Section 4).
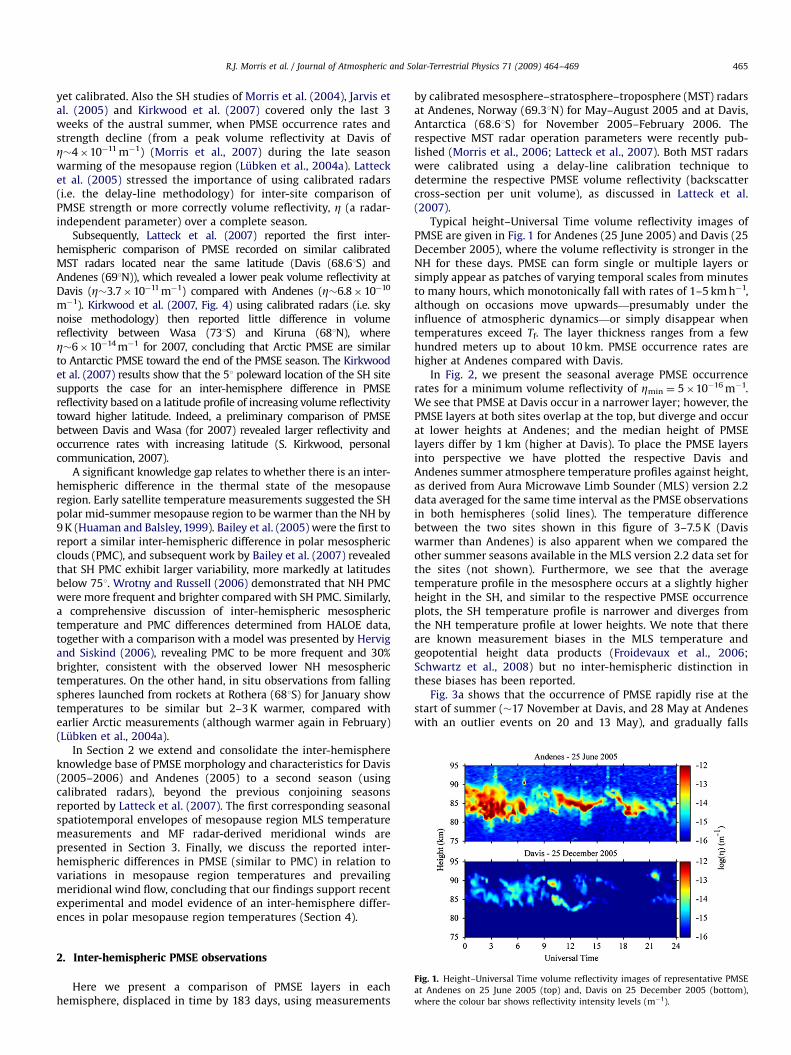
Fig. 1. Height–Universal Time volume reflectivity images of representative PMSE
at Andenes on 25 June 2005 (top) and, Davis on 25 December 2005 (bottom),
where the colour bar shows reflectivity intensity levels (m�1).
2. Inter-hemispheric PMSE observations
Here we present a comparison of PMSE layers in eachhemisphere, displaced in time by 183 days, using measurements
by calibrated mesosphere–stratosphere–troposphere (MST) radarsat Andenes, Norway (69.31N) for May–August 2005 and at Davis,Antarctica (68.61S) for November 2005–February 2006. Therespective MST radar operation parameters were recently pub-lished (Morris et al., 2006; Latteck et al., 2007). Both MST radarswere calibrated using a delay-line calibration technique todetermine the respective PMSE volume reflectivity (backscattercross-section per unit volume), as discussed in Latteck et al.(2007).
Typical height–Universal Time volume reflectivity images ofPMSE are given in Fig. 1 for Andenes (25 June 2005) and Davis (25December 2005), where the volume reflectivity is stronger in theNH for these days. PMSE can form single or multiple layers orsimply appear as patches of varying temporal scales from minutesto many hours, which monotonically fall with rates of 1–5 km h�1,although on occasions move upwards—presumably under theinfluence of atmospheric dynamics—or simply disappear whentemperatures exceed Tf. The layer thickness ranges from a fewhundred meters up to about 10 km. PMSE occurrence rates arehigher at Andenes compared with Davis.
In Fig. 2, we present the seasonal average PMSE occurrencerates for a minimum volume reflectivity of Zmin ¼ 5�10�16 m�1.We see that PMSE at Davis occur in a narrower layer; however, thePMSE layers at both sites overlap at the top, but diverge and occurat lower heights at Andenes; and the median height of PMSElayers differ by 1 km (higher at Davis). To place the PMSE layersinto perspective we have plotted the respective Davis andAndenes summer atmosphere temperature profiles against height,as derived from Aura Microwave Limb Sounder (MLS) version 2.2data averaged for the same time interval as the PMSE observationsin both hemispheres (solid lines). The temperature differencebetween the two sites shown in this figure of 3–7.5 K (Daviswarmer than Andenes) is also apparent when we compared theother summer seasons available in the MLS version 2.2 data set forthe sites (not shown). Furthermore, we see that the averagetemperature profile in the mesosphere occurs at a slightly higherheight in the SH, and similar to the respective PMSE occurrenceplots, the SH temperature profile is narrower and diverges fromthe NH temperature profile at lower heights. We note that thereare known measurement biases in the MLS temperature andgeopotential height data products (Froidevaux et al., 2006;Schwartz et al., 2008) but no inter-hemispheric distinction inthese biases has been reported.
Fig. 3a shows that the occurrence of PMSE rapidly rise at thestart of summer (�17 November at Davis, and 28 May at Andeneswith an outlier events on 20 and 13 May), and gradually falls

ARTICLE IN PRESS
Fig. 2. Aura/MLS temperature profiles (solid lines) within a 500 km radius of each
site with 1 km altitude scaling derived from the standard hypsometric relation and
linear interpolation averaged with equal weighting. The error bars relate to the
measurement uncertainty in the mean obtained using interpolated individual 1-smeasurement uncertainties given in the original data. Season average PMSE
occurrence rates for a volume reflectivity, Z45�10�16 m�1 (dashed lines) plotted
against height. For the intervals 21 November 2005–13 February 2006 Davis (blue)
and 28 May–20 August 2005 Andenes (red).
Fig. 3. (a) Seasonal percentage occurrence rates of PMSE versus month where the
dashed vertical line indicates the respective hemisphere summer solstice. (b) Daily
percentage occurrence rates of PMSE versus local time. (c) Season normalized
height versus percentage occurrence distributions of PMSE, where the dashed
horizontal lines show the respective median occurrence heights of 86.3 km at
Davis (blue) and 85.3 km at Andenes (red). We count an event for PMSE occurrence
in each 300 m�1 h spatiotemporal bin in the height range 78–92 km, i.e. 1128 bins
per day.
R.J. Morris et al. / Journal of Atmospheric and Solar-Terrestrial Physics 71 (2009) 464–469466
toward the end of the season (�13 February at Davis with weakoutlier events on 18 and 19 February, 20 August at Andenes with aweak outlier event on 2 September). The PMSE occurrence rate atAndenes remains at high levels for most of the season, whereas atDavis it declines from mid-January/February, apart from the peakin late January. PMSE peak after the summer solstice (21 June) atAndenes, although they peak each side of the summer solstice(21 December) at Davis. Another striking feature is the similarityof the occurrence rates between the sites before solstices.However, the PMSE season mid-range occurs about 2 weeks afterthe summer solstices in both hemispheres (near 5 January/July).
The diurnal variation of PMSE occurrence at Andenes/Davis for2005/2005–2006 reveals a primary peak at 08/09 h local time (LT)and a secondary peak at 14/16 LT, and distinct minima at 21/23 LT(Fig. 3b). However, at Davis the primary/secondary peaks occurredat 14/06 LT for 2004–2005 (Latteck et al., 2007) and flipped to 06/15 LT for 2006–2007 (not shown). The Andenes diurnal occurrencedistribution is relatively stable, whereas at Davis it is morevariable with a bimodal distribution. The normalized height–-occurrence distributions (Fig. 3c) clearly show that the DavisPMSE peak is 1 km higher than at Andenes (86.3 km at Davis and85.3 km at Andenes). A comprehensive multi-season inter-hemi-spheric comparison of the Davis and Andenes PMSE morphologyand inter-annual variability is presented elsewhere (see Lattecket al., 2008).
3. Inter-hemispheric mesopause region temperature andmeridional wind field
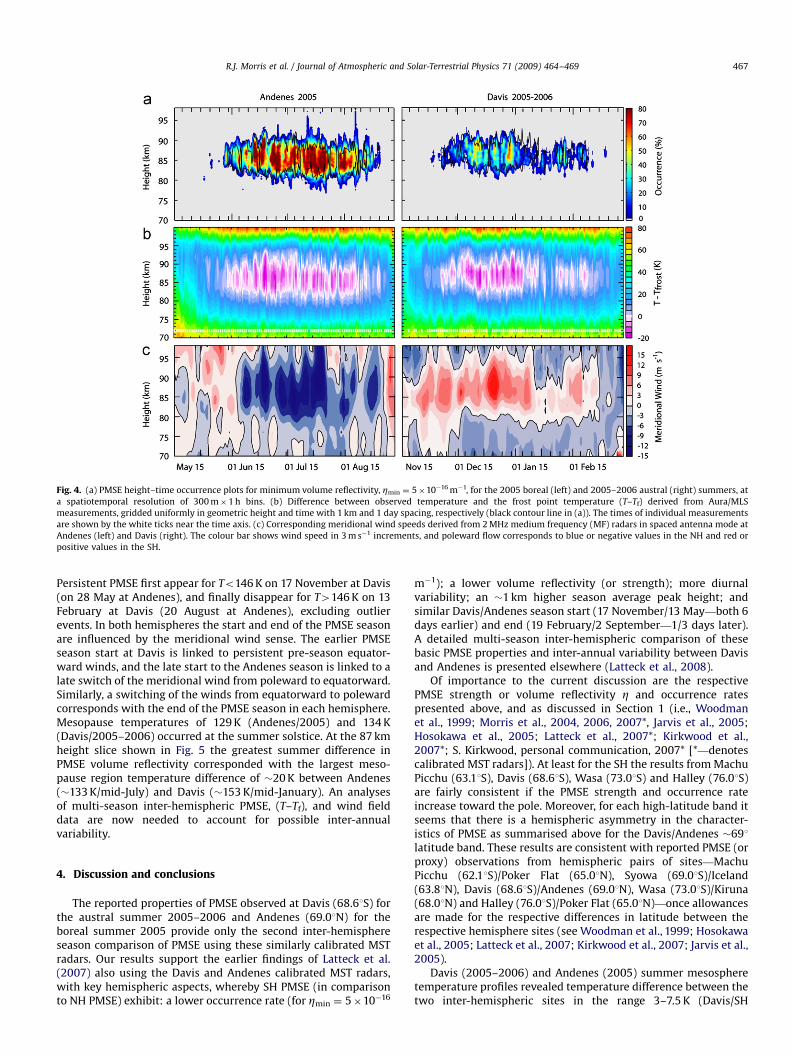
To help understand why we observe an inter-hemisphericdifference in the properties of PMSE we compare their seasonaloccurrence variation (Fig. 4a) for both hemispheres, with similarheight resolution records (70–100 km) of the difference ofmesopause temperature and frost point temperature (T�Tf)(Fig. 4b) and meridional wind flow (Fig. 4c) following themethodology outlined in a recent SH study by Morris et al.(2007). Firstly, we glean that the seasonal envelopes of PMSE(Fig. 4a) reveal a greater and more persistent occurrencethroughout the summer at Andenes, as opposed to the ratherpatchy occurrence evident at Davis with its mid-January/Februarydiminution in occurrence—the latter appears to be a recurringfeature (see Fig. 4a), which reveals an intrinsic property of the SHmesopause region (for all four summer seasons at Davis).Secondly, seasonal envelopes of T–Tf (Fig. 4b) have similarspatiotemporal contours to the respective PMSE envelopes, ashighlighted by the black line in Fig. 4a. The similarity in the broad-scale modulation of PMSE and mesopause region thermalcharacteristics supports current theory (Rapp and Lubken,2004), as summarised earlier that temperatures below thewater–ice frost point are required to create and sustain PMSE.Furthermore, we see a causal linkage between the magnitude anddirection of meridional wind flow (Fig. 4c) on the thermalstructure of the mesopause region (Fig. 4b), which in turn isreflected in the overarching PMSE envelope (Fig. 4a). Clearly, theenvelope bounding the equatorward meridional wind flow or fornear-stagnant wind flow corresponds with colder mesosphereconditions and thus PMSE existence. Moreover, during episodicpoleward turnings of the meridional wind flow (e.g. near 17January 2006) we observe a diminution in PMSE occurrence. Also,the ensuing persistent colder temperatures are associated withintervals of enhanced PMSE intensity similar to earlier reports(Morris et al., 2006). The close correspondence between thedirection and strength of the meridional winds to the mesospherictemperature was pointed out earlier by Espy et al. (2003).
The volume reflectivity variation of PMSE over the respectivesummer hemisphere season (Fig. 5a) clearly shows volumereflectivity at Andenes (Zmax�1�10�12 m�1) to be much greaterthan at Davis (Zmax�8.5�10�15 m�1) (consistent with earlierindirect studies by Woodman et al. (1999), and direct comparisonsby Hosokawa et al. (2005) and Latteck et al. (2007) using a fullseason of PMSE observations). Fig. 5a shows 5-day averagevolume reflectivity values of PMSE to remove the effects of 5-day planetary waves, as discussed by Kirkwood et al. (2002).Considering a height slice near 86–87 km we can see how themesopause temperature profile (Fig. 5b) is influenced by themagnitude and direction of the meridional wind (Fig. 5c).
ARTICLE IN PRESS
Fig. 4. (a) PMSE height–time occurrence plots for minimum volume reflectivity, Zmin ¼ 5�10�16 m�1, for the 2005 boreal (left) and 2005–2006 austral (right) summers, at
a spatiotemporal resolution of 300 m�1 h bins. (b) Difference between observed temperature and the frost point temperature (T–Tf) derived from Aura/MLS
measurements, gridded uniformly in geometric height and time with 1 km and 1 day spacing, respectively (black contour line in (a)). The times of individual measurements
are shown by the white ticks near the time axis. (c) Corresponding meridional wind speeds derived from 2 MHz medium frequency (MF) radars in spaced antenna mode at
Andenes (left) and Davis (right). The colour bar shows wind speed in 3 m s�1 increments, and poleward flow corresponds to blue or negative values in the NH and red or
positive values in the SH.
R.J. Morris et al. / Journal of Atmospheric and Solar-Terrestrial Physics 71 (2009) 464–469 467
Persistent PMSE first appear for To146 K on 17 November at Davis(on 28 May at Andenes), and finally disappear for T4146 K on 13February at Davis (20 August at Andenes), excluding outlierevents. In both hemispheres the start and end of the PMSE seasonare influenced by the meridional wind sense. The earlier PMSEseason start at Davis is linked to persistent pre-season equator-ward winds, and the late start to the Andenes season is linked to alate switch of the meridional wind from poleward to equatorward.Similarly, a switching of the winds from equatorward to polewardcorresponds with the end of the PMSE season in each hemisphere.Mesopause temperatures of 129 K (Andenes/2005) and 134 K(Davis/2005–2006) occurred at the summer solstice. At the 87 kmheight slice shown in Fig. 5 the greatest summer difference inPMSE volume reflectivity corresponded with the largest meso-pause region temperature difference of �20 K between Andenes(�133 K/mid-July) and Davis (�153 K/mid-January). An analysesof multi-season inter-hemispheric PMSE, (T–Tf), and wind fielddata are now needed to account for possible inter-annualvariability.
4. Discussion and conclusions
The reported properties of PMSE observed at Davis (68.61S) forthe austral summer 2005–2006 and Andenes (69.01N) for theboreal summer 2005 provide only the second inter-hemisphereseason comparison of PMSE using these similarly calibrated MSTradars. Our results support the earlier findings of Latteck et al.(2007) also using the Davis and Andenes calibrated MST radars,with key hemispheric aspects, whereby SH PMSE (in comparisonto NH PMSE) exhibit: a lower occurrence rate (for Zmin ¼ 5�10�16
m�1); a lower volume reflectivity (or strength); more diurnalvariability; an �1 km higher season average peak height; andsimilar Davis/Andenes season start (17 November/13 May—both 6days earlier) and end (19 February/2 September—1/3 days later).A detailed multi-season inter-hemispheric comparison of thesebasic PMSE properties and inter-annual variability between Davisand Andenes is presented elsewhere (Latteck et al., 2008).
Of importance to the current discussion are the respectivePMSE strength or volume reflectivity Z and occurrence ratespresented above, and as discussed in Section 1 (i.e., Woodmanet al., 1999; Morris et al., 2004, 2006, 2007*, Jarvis et al., 2005;Hosokawa et al., 2005; Latteck et al., 2007*; Kirkwood et al.,2007*; S. Kirkwood, personal communication, 2007* [*—denotescalibrated MST radars]). At least for the SH the results from MachuPicchu (63.11S), Davis (68.61S), Wasa (73.01S) and Halley (76.01S)are fairly consistent if the PMSE strength and occurrence rateincrease toward the pole. Moreover, for each high-latitude band itseems that there is a hemispheric asymmetry in the character-istics of PMSE as summarised above for the Davis/Andenes �691latitude band. These results are consistent with reported PMSE (orproxy) observations from hemispheric pairs of sites—MachuPicchu (62.11S)/Poker Flat (65.01N), Syowa (69.01S)/Iceland(63.81N), Davis (68.61S)/Andenes (69.01N), Wasa (73.01S)/Kiruna(68.01N) and Halley (76.01S)/Poker Flat (65.01N)—once allowancesare made for the respective differences in latitude between therespective hemisphere sites (see Woodman et al., 1999; Hosokawaet al., 2005; Latteck et al., 2007; Kirkwood et al., 2007; Jarvis et al.,2005).
Davis (2005–2006) and Andenes (2005) summer mesospheretemperature profiles revealed temperature difference between thetwo inter-hemispheric sites in the range 3–7.5 K (Davis/SH

ARTICLE IN PRESS
Fig. 5. The time axes relevant to Davis (blue) and Andenes (red) are shown by the
horizontal scales at the top and bottom of the figure, respectively. The colour-
coded vertical lines show the start and end of the PMSE season, whilst the black
dashed line indicates the summer solstices. (a) Seasonal 5-day running mean of
PMSE maximum volume reflectivity over all heights. (b) Aura/MLS (T–Tf)
temperatures. The measurements within 500 km of each site were interpolated
to a geometric height of 87 km using the standard hypsometric relation. A 4-day
box-car smoothing has been applied. The typical 1-s measurement uncertainty of
mean individual measurements is �2 K at 87 km. (c) Seasonal meridional winds
observed at 86 km height using a 4-day composite day tidal analysis shifted by 1
day.
R.J. Morris et al. / Journal of Atmospheric and Solar-Terrestrial Physics 71 (2009) 464–469468
warmer than Andenes/NH), as derived from Aura Microwave LimbSounder (MLS) version 2.2 data averaged for conjoining seasons ofPMSE observations in both hemispheres. Moreover, seasonalenvelopes of T–Tf have remarkably similar spatiotemporal con-tours to the respective PMSE seasonal envelopes. The similarity inthe broad-scale modulation of PMSE and mesopause regionthermal characteristics supports current theory (Rapp andLubken, 2004) that temperatures below the water–ice frost pointare required to create and sustain PMSE.
These new findings provide further experimental evidence of ahemispheric asymmetry in mesosphere temperature and thelayered ice aerosol phenomena PMSE, which support recentexperimental observations (Bailey et al., 2005, 2007; Wrotnyand Russell, 2006) and model simulation predictions (Siskindet al., 2003; Hervig and Siskind, 2006) that the SH summermesopause region is warmer than at the equivalent northernlatitude. The reason for the hemispheric differences in meso-sphere temperatures as measured from satellites, i.e., Aura(SH warmer by 3–7.5 K) and HALOE (SH warmer by 4–7 K)(Wrotny and Russell, 2006), is the topic of ongoing research.However, two important SH thermal mechanisms are; (i) radia-
tion effects due to the Earth’s orbital eccentricity, i.e., closer to theSun in the austral summer, contributes to an �1–2 K warming(Siskind et al., 2003), and (ii) atmospheric dynamical effects, i.e.,stronger residual zonal wind circulation in the lower stratosphereresults in a reduced gravity wave drag in the lower mesosphereand a weaker cooling in the austral summer by �2–6 K (Siskindet al., 2003). Further quantitative model estimates by Siskind et al.(2003) revealed a larger supersaturation (S ¼ water vapourpressure/saturation vapour pressure) region in the NH (than inthe SH), where contours (S ¼ 1–10; for H2O concentrations of1–6 ppmv) reach lower heights in the NH (higher in the SH), i.e.,similar to the respective PMSE layers.
Furthermore, we have shown a causal linkage between themagnitude and direction of meridional wind flow on the thermalstructure of the mesopause region consistent with the findings ofEspy et al. (2003) and Morris et al. (2007), which in turn isreflected in the modulation of the overarching PMSE seasonaloccurrence volume reflectivity envelope. Additionally we foundthat the meridional wind has an implicit influence on the start,duration, and end of the PMSE season (i.e. inter-annual variabi-lity)—in line with the expectation on the summer pole to winterpole meridional wind flow. Also our reported mid-January/February warming at Davis (consistent with Lubken et al.(2004a)) is associated with a significant episodic reduction inthe average meridional wind. Moreover, periodogram analyses ofDavis PMSE intensity and Aura temperatures by Klekociuk et al.(2008) revealed enhanced wave activity with periods near 2 and 5days suggesting that planetary waves are also associated with awarming of the late summer SH mesopause region. Both themeridional wind and planetary waves appear to contribute to ourreported mid-January/February diminution in PMSE occurrenceat Davis.
Interestingly, our PMSE results are consistent with recentfindings from an inter-hemispheric comparison of PMC, wherebySH PMC were reported to be less frequent, dimmer, and appear�1 km higher in height compared with NH PMC (e.g. Wrotny andRussell, 2006). In essence the inter-hemispheric asymmetry inproperties of both PMSE and PMC can be explained by a similarasymmetry in mesopause temperature (colder in NH). We suggestthat the marginal nature of Davis SH PMSE occurrence andvolume reflectivity, being nearer to the point of existence relativeto their northern counterpart, may provide a more sensitiveindicator of the mesopause region condition; in particular, as aproxy for long-term change in mesosphere temperature and watervapour saturation. We suggest that inter-hemispheric compar-isons of PMSE properties be conducted using calibrated radars forcomplete summer seasons. An important challenge for the radarcommunity is to un-ravel the latitudinal profile of PMSE proper-ties, which requires better volume reflectivity statistics thansummarised in Section 1. Notwithstanding, a long-term record ofPMSE in both hemispheres and the mesosphere condition (i.e.temperature and wind field) is now needed to ascertain theimpact of any inter-annual variability on the findings reported inthis paper.
Acknowledgements
We thank L. Symons, P. Nink and R. Urmonas for technicalsupport of the Davis MST radar, and K. Dahle from the AndøyaRocket Range for the support with the ALWIN MST radar. Supportunder Project no. 2325 (Davis MST radar) is provided by theAustralian Antarctic Science Advisory Committee. Aura/MLS dataused in this study were acquired as part of the NASA’s Earth–SunSystem Division and archived and distributed by the GoddardEarth Sciences (GES) Data and Information Services Center (DISC)
ARTICLE IN PRESS
R.J. Morris et al. / Journal of Atmospheric and Solar-Terrestrial Physics 71 (2009) 464–469 469
Distributed Active Archive Center (DAAC). J. Whelan and D.Ratcliffe provided assistance with the preparation of the figures.
References
Bailey, S.M., Merkel, A.W., Thomas, G.E., Carstens, J.N., 2005. Observations of polarmesospheric clouds by the Student Nitric Oxide Explorer. Journal ofGeophysical Research 110, D13203.
Bailey, S.M., Merkel, A.W., Thomas, G.E., Rusch, D.W., 2007. Hemisphericdifferences in polar mesospheric cloud morphology observed by the StudentNitric Oxide Explorer. Journal of Atmospheric and Solar–Terrestrial Physics 69,1407–1418.
Cho, J.Y.N., Rottger, J., 1997. An updated review of polar mesosphere summerechoes: observation, theory, and their relationship to noctilucent clouds andsubvisible aerosols. Journal of Geophysical Research 102, 2001–2020.
Czechowsky, P., Ruster, R., Schmidt, G., 1979. Variations of mesospheric structuresin different seasons. Geophysical Research Letters 6, 459–462.
Ecklund, W.L., Balsley, B.B., 1981. Long-term observations of the Arctic mesosphere withthe MST radar at Poker Flat, Alaska. Journal of Geophysical Research 86, 7775–7780.
Espy, P.J., Hibbins, R.E., Jones, G.O.L., Riggin, D., Fritts, D., 2003. Rapid, large-scaletemperature changes in the polar mesosphere and their relationship tomeridional flows. Geophysical Research Letters 30, 1240–1244.
Froidevaux, L., et al., 2006. Early validation analyses of atmospheric profiles from EOSMLS on the Aura satellite. IEEE Transactions of Geoscience Remote Sensing 44(5).
Hervig, M., Siskind, D., 2006. Decadal and inter-hemispheric variability in polarmesospheric clouds, water vapour, and temperature. Journal of Atmosphericand Solar–Terrestrial Physics 68, 30–41.
Hosokawa, K., Ogawa, T., Arnold, N.F., Lester, M., Sato, N., Yukimatu, A.S., 2005.Extraction of polar mesosphere summer echoes from SuperDARN data.Geophysical Research Letters 32, L12801.
Huaman, M.M., Balsley, B.B., 1999. Differences in near-mesopause summer winds,temperatures, and water vapour at northern and southern latitudes as possiblecasual factors for inter-hemispheric PMSE differences. Geophysical ResearchLetters 26, 1529–1532.
Jarvis, M.J., Cliverd, M.A., Rose, M.C., Rodwell, S., 2005. Polar mesosphere summerechoes (PMSE) at Halley (761S, 271W), Antarctica. Geophysical Research Letters32, L06816.
Kirkwood, S., Barabash, V., Brandstrom, B.U.E., Mostrom, A., Stebel, K., Mitchell, N.,Hocking, W., 2002. Noctilucent clouds, PMSE and 5-day planetary waves: acase study. Geophysical Research Letters 29 (10).
Kirkwood, S., Wolf, I., Nilsson, H., Dalin, P., Mikhaylova, D., Belova, E., 2007. Polarmesosphere summer echoes at Wasa, Antarctica (731S): first observations andcomparison with 681N. Geophysical Research Letters 34, L15803.
Klekociuk, A.R., Morris, R.J., Innis, J.L., 2008. First Southern Hemisphere common-volume measurements of PMC and PMSE. Geophysical Research Letters, in press.
Latteck, R., Singer, W., Kirkwood, S., Jonsonn, L.-O., Eriksonn, H., 2005. Observationsof mesosphere summer echoes with calibrated VHF radars at latitudesbetween 541N and 691N in summer 2004. In: Warmbein, B. (Ed.), Proceedingson European Rocket and Balloon Programmes and Related Research. EuropeanSpace Agency Special Publication SP-590, pp. 121–126.
Latteck, R., Singer, W., Morris, R.J., Holdsworth, D.A., Murphy, D.J., 2007.Observations of mesosphere summer echoes with calibrated VHF radars at691 on northern and southern latitudes. Geophysical Research Letters 34,L14805.
Latteck, R., Singer, W., Morris, R.J., Hocking, W.K., Murphy, D.J., Holdsworth, D.A.,Swarnalingam, N., 2008. Similarities and differences in polar mesospheresummer echoes observed in the Arctic and Antarctica. Annals Geophysicae 26,2795–2806.
Lubken, F.-J., Mullemann, A., Jarvis, M.J., 2004a. Temperature and horizontal windsin the Antarctic summer mesosphere. Journal of Geophysical Research 109,D24112.
Lubken, F.-J., Zecha, M., Hoffner, J., Rottger, J., 2004b. Temperatures, polarmesosphere summer echoes, and noctilucent clouds over Spitsbergen (781N).Journal of Geophysical Research 109, D1203.
Morris, R.J., Murphy, D.J., Reid, I.M., Holdsworth, D.A., Vincent, R.A., 2004. Firstpolar mesosphere summer echoes observed at Davis, Antarctica (68.61S).Geophysical Research Letters 31, L1111.
Morris, R.J., Murphy, D.J., Vincent, R.A., Holdsworth, D.A., Klekociuk, A.R., Reid, I.M.,2006. Characteristics of the wind, temperature and PMSE field above Davis,Antarctica. Journal of Atmospheric and Solar–Terrestrial Physics 68, 418–435.
Morris, R.J., Murphy, D.J., Klekociuk, A.R., Holdsworth, D.A., 2007. First completeseason of PMSE observations above Davis, Antarctica, and their relation towinds and temperatures. Geophysical Research Letters 34, L05805.
Rapp, M., Lubken, F.-J., 2004. Polar mesosphere summer echoes (PMSE): review ofobservations and current understanding. Atmospheric Chemistry and PhysicsDiscussions 4, 2601–2633.
Sarango, M.F., Woodman, R.F., Flores, L.A., Villegas, S., 2003. Further observations ofPMSE in Antarctica. MST10 Radar Workshop Proceedings, Piura, Peru, 13–20May.
Schwartz, M.J., et al., 2008. Validation of the Aura Microwave Limb Soundertemperature and geopotential height measurements. Journal of GeophysicalResearch 113, D15S11.
Siskind, D.E., Eckermann, S.D., McCormack, J.P., Alexander, M.J., Bacmeister, J.T.,2003. Hemispheric differences in the temperature of the summer-time stratosphere and mesosphere. Journal of Geophysical Research 108(D2), 4051.
Woodman, R.F., Balsley, B.B., Aquino, F., Flores, L., Vazquez, E., Sarango, M., Huaman,M.M., Soldi, H., 1999. First observations of polar mesosphere summer echoes inAntarctica. Journal of Geophysical Research 104, 22,577–22,590.
Wrotny, J.E., Russell III, J.M., 2006. Interhemispheric differences in polar meso-spheric clouds observed by the HALOE instrument. Journal of Atmospheric andSolar–Terrestrial Physics 68, 1352–1369.