brain hemispheric preferences of fourth- and fifth-grade
177
BRAIN HEMISPHERIC PREFERENCES OF FOURTH- AND FIFTH-GRADE SCIENCE TEACHERS AND STUDENTS IN TAIWAN: AN INVESTIGATION OF THE RELATIONSHIPS TO STUDENT SPATIAL AND VERBAL ABILITY, STUDENT ACHIEVEMENT, STUDENT ATTITUDES, AND TEACHING PRACTICE DISSERTATION Presented in Partial Fulfillment of the Requirements for the Degree of Doctor of Philosophy in the Graduate School of The Ohio State University By Tzu-Ling Wang, M.S. ***** The Ohio State University 2008 Dissertation Committee: Professor Donna F. Berlin, Advisor Professor Arthur L. White Professor Garry D. McKenzie Approved by _____________________ Advisor College of Education
-
Upload
khangminh22 -
Category
Documents
-
view
1 -
download
0
Transcript of brain hemispheric preferences of fourth- and fifth-grade

BRAIN HEMISPHERIC PREFERENCES OF FOURTH- AND FIFTH-GRADE SCIENCE TEACHERS AND STUDENTS IN TAIWAN: AN INVESTIGATION OF
THE RELATIONSHIPS TO STUDENT SPATIAL AND VERBAL ABILITY, STUDENT ACHIEVEMENT, STUDENT ATTITUDES, AND TEACHING PRACTICE
DISSERTATION
Presented in Partial Fulfillment of the Requirements for
the Degree of Doctor of Philosophy in the Graduate
School of The Ohio State University
By
Tzu-Ling Wang, M.S.
*****
The Ohio State University 2008
Dissertation Committee:
Professor Donna F. Berlin, Advisor
Professor Arthur L. White
Professor Garry D. McKenzie
Approved by _____________________
Advisor College of Education

Copyright by
Tzu-Ling Wang
© 2008

ii
ABSTRACT
This study is divided into two parts: the construction and validation of teacher and
student instruments translated into Chinese and the main study. After establishing the
validity and reliability of the instruments, the purposes of the main study were to: (a)
investigate the relationships among teacher and student hemispheric preferences, student
spatial and verbal abilities, student science achievement, and student attitudes toward
science class and (b) identify science teaching strategies and match them to teacher and
student hemispheric preferences. Four elementary school science teachers and 133
fourth- and fifth-grade students were selected from a school in Taiwan. Data were
analyzed using quantitative and qualitative procedures.
The major conclusions of the study are: (a) Science teaching strategies seem to be
related to gender differences. Male teachers preferred right-brain teaching strategies,
whereas female teachers preferred left-brain teaching strategies; (b) Verbal ability,
science achievement, and attitudes toward science class seem to be related to student
hemispheric preferences. Students with a stronger whole-brain preference tended to
exhibit better verbal ability, better science achievement, and more positive attitudes
toward science class. Male and fourth-grade students with a stronger whole-brain
preference tended to exhibit better science achievement and more positive attitudes
toward science class, respectively; (c) Student hemispheric preferences seem to be related

iii
to gender and grade level differences. The right hemisphere seems to develop earlier in
male students and the left hemisphere earlier in female students. For female students,
brain lateralization seems to develop earlier and they tended to exhibit a stronger whole-
brain preference. Fifth-grade students tended to exhibit stronger right-brain and left-brain
preferences compared to fourth-grade students suggesting greater brain lateralization in
older students. Fifth-grade males tended to exhibit a stronger right-brain preference
compared to fourth-grade males; fifth-grade females tended to exhibit a stronger left-
brain preference compared to fourth-grade females; (d) Spatial and verbal ability seem to
be related to gender differences. Male students tended to exhibit better spatial ability;
female students tended to exhibit better verbal ability; and (e) Science teaching strategies
were not generally related to student hemispheric preferences. Science teaching strategies
were partially related to student hemispheric preferences for 2 teachers.

iv
Dedicated to the memory of my parents
Sung-Hsin and Wu-Mei
for their endless love and support

v
ACKNOWLEDGMENTS
I would like especially to express my deepest appreciation to my advisor, Dr. Donna
Berlin, for her continuous advice, assistance, patience, and encouragement throughout my
doctoral study. Without her support and assistance, I could not have completed this
doctoral degree.
I would like to express sincere appreciation to Dr. Arthur White for his insightful
suggestions, kind encouragement, and expertise in statistics.
I would like to express grateful appreciation to Dr. Garry McKenzie for his expert
guidance, valuable feedback, and generous support.
I would like to express my thanks to Dr. Ching-Yang Chou for sharing his insightful
thoughts and encouragement throughout my academic career.
I also would like to express my thanks to Dr. Chao-Ti Hsiung for her continuous
support and encouragement.
I extend my sincere thanks to the principals, science teachers, students from the
elementary schools, and undergraduate and graduate students from the university that
participated in this study.
I wish to thank my friends in Taiwan and in the U.S. for their friendship and support
through my study. I am especially grateful to I-Chia who helped me with the translation
of the instruments.

vi
Finally, I would like to express my deep gratitude to my family for their unwavering
love and support. My elder sister, Su-Yu, has given her continuous encouragement and
has taken care of my daughter. My elder brother, Chien-Chia, has given his continuous
support and encouragement. My husband, Yi-Kuan, has given his endless love and
support. My daughter, Wan-Ching, has brought much joy and inspiration into my life.

vii
VITA
September 29, 1966………………… Born-Taipei, Taiwan, R.O.C.
1992……………………………….... B. Ed. Mathematics & Science Education National Taipei Teachers College, Taiwan
1995…………………………………. M. S. Science Education National Kaohsiung Normal University, Taiwan
2004-2007…………………………... Graduate Research Associate The Ohio State University
FIELDS OF STUDY
Major Field: Education
Specialization: Science Education

viii
TABLE OF CONTENTS
Page
Abstract ............................................................................................................................... ii Dedication .......................................................................................................................... iv Acknowledgments................................................................................................................v Vita.................................................................................................................................... vii List of Tables ..................................................................................................................... xi List of Figures .................................................................................................................. xiv Chapters 1. Introduction.................................................................................................................1
Theoretical framework.......................................................................................2 Hemispheric specialization .......................................................................2 Developmental and gender differences in hemispheric specialization.....4 Gender differences in cognitive ability.....................................................4 Left-brain and right-brain teaching strategies...........................................6 Hemisphericity and achievement..............................................................7
Significance of the study....................................................................................8 Statement of the problem and research questions..............................................8 Overview of the study......................................................................................10 Limitations of the study ...................................................................................12
2. Review of the literature.............................................................................................14
Brain structure..................................................................................................14 Brain development ...........................................................................................15 Hemispheric specialization ..............................................................................17 Hemispheric preference ...................................................................................21 Gender differences in brain structure, brain development, and cognitive ability ...............................................................................................................23
Gender differences in brain structure......................................................23 Gender differences in brain development ...............................................27 Gender differences in cognitive ability...................................................30 Spatial ability .................................................................................31 Verbal ability .................................................................................34
Nature and nurture ...........................................................................................35

ix
Left-brain and right-brain teaching strategies..................................................36 Hemisphericity and achievement.....................................................................40 Summary ..........................................................................................................46
3. Methodology............................................................................................................49
Construction and validation of instruments .....................................................49 Subjects ...................................................................................................49 Context....................................................................................................50 Teacher data sources ...............................................................................52 Human Information Processing (HIP) Survey................................52 Student data sources................................................................................55 Style of Learning and Thinking (SOLAT, Elementary Form) .......55 PMA Spatial Relations Test (Grades 4-6) ......................................57 Student Attitudes Toward Science Class Survey............................59
Main study .......................................................................................................64 Participants..............................................................................................64 Research design ......................................................................................65 Data collection procedures......................................................................66 Teacher data collection ...................................................................66 Data collection: Teacher Demographics Questionnaire .........66 Data collection: Human Information Processing Survey .......67 Data collection: Classroom observations................................67 Student data collection....................................................................71 Data collection: Style of Learning and Thinking....................71 Data collection: PMA Spatial Relations Test .........................71 Data collection: Chinese language midterm and final
exams ......................................................................................71 Data collection: Science midterm and final exams.................72 Data collection: Student Attitudes Toward Science Class
Survey .....................................................................................72 Data analysis procedures.........................................................................73 Teacher data analyses .....................................................................73 Data analysis: Teacher Demographics Questionnaire ............73 Data analysis: Human Information Processing Survey ..........73 Data analysis: Classroom observations ..................................74 Student data analyses ......................................................................75 Data analysis: Style of Learning and Thinking.......................75 Data analysis: Student multiple instruments...........................76 Teacher and student data analyses..................................................77 Data analysis: Classroom observations and Style of
Learning and Thinking ...........................................................77 Summary ..........................................................................................................77

x
4. Results of data analyses ............................................................................................79
Results of teacher data analyses.......................................................................79 Data results: Teacher Demographics Questionnaire...............................79 Data results: Human Information Processing Survey.............................81 Data results: Classroom observations .....................................................83
Results of student data analyses.......................................................................90 Data results: Style of Learning and Thinking .........................................90 Data results: Student multiple instruments .............................................96 Descriptive statistics .......................................................................96 Correlation analyses........................................................................99
Two-way Multivariate Analysis of Variance (MANOVA) ..........109 Results of teacher and student data analyses .................................................113
Data results: Classroom observations and Style of Learning and Thinking................................................................................................113
Summary ........................................................................................................118 5. Conclusions and discussion ....................................................................................123
Summary of the main study ...........................................................................123 Discussion of the research questions and the literature .................................126 Research question 1...............................................................................126 Research question 2...............................................................................128 Research question 3...............................................................................129 Research question 4...............................................................................130 Research question 5...............................................................................130 Research question 6...............................................................................131 Research question 7...............................................................................131 Research question 8...............................................................................133 Research question 9...............................................................................134 Research question 10.............................................................................135 Research question 11.............................................................................135 Research question 12.............................................................................136 Major conclusions..........................................................................................142 Implications....................................................................................................143
Teacher education programs .................................................................143 Curriculum developers..........................................................................144
Suggestions for future research......................................................................145 List of references..............................................................................................................147 Appendices
Appendix A: Student Attitudes Toward Science Class ..........................................158 Appendix B: Teacher Demographics Questionnaire ..............................................161
xi
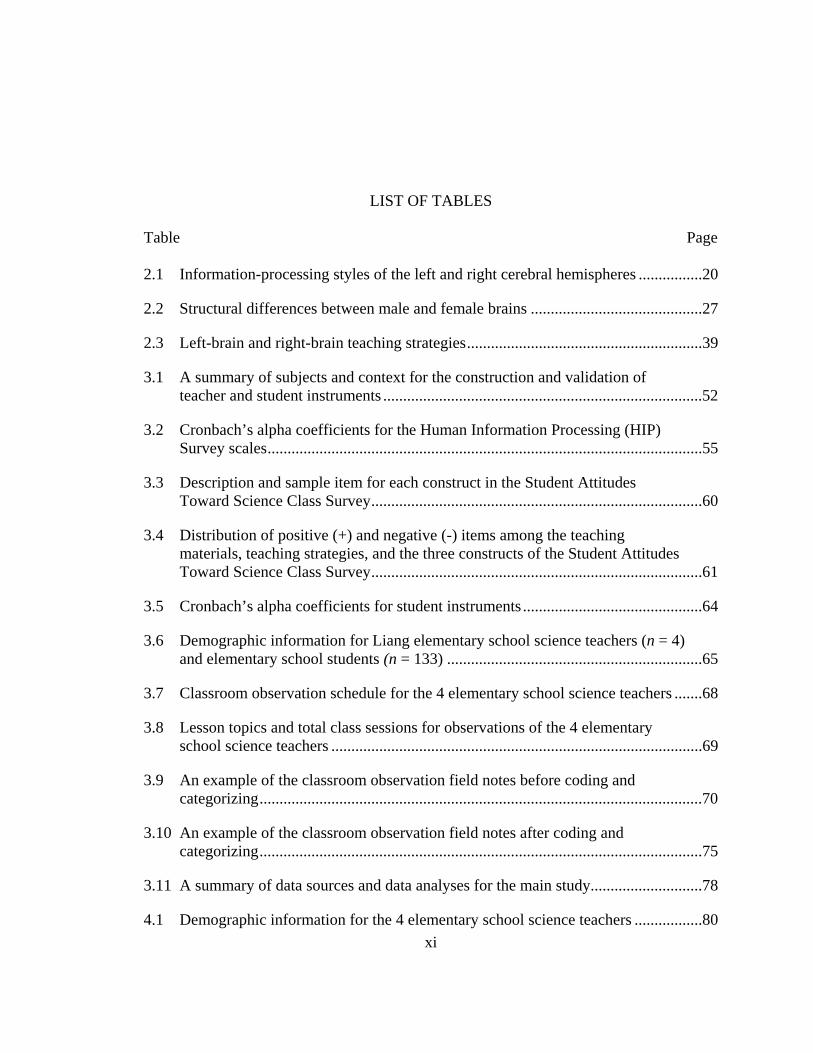
LIST OF TABLES
Table Page 2.1 Information-processing styles of the left and right cerebral hemispheres ................20
2.2 Structural differences between male and female brains ...........................................27
2.3 Left-brain and right-brain teaching strategies...........................................................39
3.1 A summary of subjects and context for the construction and validation of teacher and student instruments ................................................................................52
3.2 Cronbach’s alpha coefficients for the Human Information Processing (HIP) Survey scales.............................................................................................................55
3.3 Description and sample item for each construct in the Student Attitudes Toward Science Class Survey...................................................................................60
3.4 Distribution of positive (+) and negative (-) items among the teaching materials, teaching strategies, and the three constructs of the Student Attitudes Toward Science Class Survey...................................................................................61
3.5 Cronbach’s alpha coefficients for student instruments.............................................64
3.6 Demographic information for Liang elementary school science teachers (n = 4) and elementary school students (n = 133) ................................................................65
3.7 Classroom observation schedule for the 4 elementary school science teachers .......68
3.8 Lesson topics and total class sessions for observations of the 4 elementary school science teachers .............................................................................................69
3.9 An example of the classroom observation field notes before coding and categorizing ...............................................................................................................70
3.10 An example of the classroom observation field notes after coding and categorizing...............................................................................................................75
3.11 A summary of data sources and data analyses for the main study............................78
4.1 Demographic information for the 4 elementary school science teachers .................80

xii
4.2 Standard scores on the HIP Survey left-brain, right-brain, and integrated-brain scales and brain hemispheric preference for the 4 elementary school science teachers .....................................................................................................................82
4.3 Teaching strategy code, teaching strategy category, and category abbreviation......84
4.4 Percentage of instructional time for teaching strategies related to left-brain, right-brain, and whole-brain processing for the 4 elementary school science teachers .....................................................................................................................85
4.5 Total percentage of instructional time for teaching strategies related to left-brain, right-brain, and whole-brain processing for the 4 elementary school science teachers.........................................................................................................88
4.6 Percentage of male and female students for left-brain, right-brain, and whole-brain preferences and no hemispheric preference for the four science classes.........91
4.7 Total percentage for male and female students for left-brain, right-brain, and whole-brain preferences and no hemispheric preference for the two grade levels .........................................................................................................................94
4.8 Means and standard deviations for the dependent variables for the male and female students..........................................................................................................98
4.9 Means and standard deviations for the dependent variables for grade 4 and grade 5 students.........................................................................................................99
4.10 Pearson correlation coefficients (r) for scores on the independent and dependent variables for elementary school students (n = 133)...............................100
4.11 Pearson correlation coefficients (r) for scores on the independent and dependent variables for elementary school male students (n = 68) ........................103
4.12 Pearson correlation coefficients (r) for scores on the independent and dependent variables for elementary school female students (n = 65).....................104
4.13 Pearson correlation coefficients (r) for scores on the independent and dependent variables for elementary school fourth-grade students (n = 65)............106
4.14 Pearson correlation coefficients (r) for scores on the independent and dependent variables for elementary school fifth-grade students (n = 68)...............108
4.15 Results of multivariate analyses of variance for all dependent variables by gender and grade level ............................................................................................110
4.16 Results of univariate analyses of variance for all dependent variables by gender and grade level ............................................................................................112

xiii
4.17 Confidence intervals for proportion tests for teaching strategies and student left-brain, right-brain, and whole-brain preferences in John’s class .............................114
4.18 Confidence intervals for proportion tests for teaching strategies and student left-brain, right-brain, and whole-brain preferences in Betty’s class......................115
4.19 Confidence intervals for proportion tests for teaching strategies and student left-brain, right-brain, and whole-brain preferences in Peter’s class ......................117
4.20 Confidence intervals for proportion tests for teaching strategies and student left-brain, right-brain, and whole-brain preferences in Lucy’s class ......................118
4.21 A summary of data sources, data analyses, and results for the main study ............119
5.1 A summary of the findings for the 12 research questions for the main study ........137

xiv
LIST OF FIGURES Figure Page 4.1 Standard scores on the HIP Survey left-brain, right-brain, and integrated-brain
scales for the 4 elementary school science teachers .................................................83
4.2 Percentage of instructional time for each teaching strategy category abbreviation related to left-brain, right-brain, and whole-brain processing for the 4 elementary school science teachers .................................................................87
4.3 Total percentage of instructional time for teaching strategies related to left-brain, right-brain, and whole-brain processing for the 4 elementary school science teachers.........................................................................................................90
5.1 An overview of the findings for the main study .....................................................141

1
CHAPTER 1
INTRODUCTION
Brain research has increased significantly since the 19th century. In particular,
research during the past 47 years has provided insight into cerebral specialization. Basic
to our understanding of brain functioning is the fact that the largest portion of the human
brain, the cerebrum, consists of two hemispheres. It has been found that each of the two
cerebral hemispheres has specialized functions and different styles for processing
information (Hider & Rice, 1986). The left cerebral hemisphere is commonly engaged in
activities related to written and spoken language, abstract symbolism, number operations,
linear processing, rational decision making, and deductive logic, while the right cerebral
hemisphere is primarily responsible for spatial skills, pattern recognition, creativity,
parallel processing, intuitive decision making, and inductive logic (Miller, 1988).
There is a growing body of research on hemisphericity and such research has
provided insight into possible explanations for the reason why many children are not
succeeding in today’s school (Fountain & Fillmer, 1987; Sonnier & Kemp, 1980). Many
educators believe that most contemporary schools are dominated by a left-brain
curriculum, and generally, teaching strategies and learning activities are based primarily
on a linear, sequential, and analytic way of thinking (Chapman, 1998; Chudzinski, 1988;
Cooke & Haipt, 1986; Grady, 1984; Lewallen, 1985; Marxer, 1988; Rubenzer, 1982;

2
Turner, 1999; Vitale, 1982). Rubenzer pointed out that there is a need to close the gap
between left-brain teaching strategies and right-brain learning styles because the
left-brain educational system handicaps many children who prefer right-brain teaching
strategies. Studies have revealed that a match between instructional practice and student
hemispheric preference appears to have positive effects on student achievement, whereas
a mismatch between instructional practice and student hemispheric preference appears to
have negative effects on student achievement (Douglass, 1979; Dunn, Sklar, Bruno, &
Beaudry, 1990; Jarsonbeck, 1984). These discoveries have shed new light on the way
children learn in school and suggest that teaching strategies and student hemispheric
preferences do affect learning. However, research on hemisphericity and learning is
inconclusive in many cases (Ellis, 2001; Van Giesen, Bell, & Roubinek, 1987) and
requires further investigation and refinement.
Theoretical Framework
Hemispheric Specialization
The earliest evidence of hemispheric asymmetry came from observations of the
disorders produced by unilateral brain damage (Hellige, 1983). During the 1860s, Paul
Broca suggested the localization of speech production in the left hemisphere—Broca’s
area. During the 1870s, Karl Wernicke suggested the localization of speech
comprehension in the left hemisphere—Wernicke’s area (Finger, 1994). These clinical
reports indicated that different areas of the brain control specific functions. The notion of
localization of brain function emerged from early studies of brain-damaged individuals.
The most dramatic evidence for hemispheric asymmetry came from the study of
patients who had the corpus callosum severed in order to control severe epilepsy (Hellige,

3
1983). During the 1960s, Roger Sperry and two neurosurgeons, Philip Vogel and Joseph
Bogen, conducted a series of experiments with split-brain humans (Bogen, 1985). The
results showed that the left and right hemispheres process information differently. The
left hemisphere excels in dealing with verbal and analytic information, whereas the right
hemisphere excels in dealing with visuospatial, synthetic, and holistic information
(Springer & Deutsch, 1998). The initial idea of hemispheric specialization emerged from
studies of split-brain subjects.
More recently, hemispheric asymmetry has been investigated in studies on normal
people in a number of ways (e.g., tachistoscopic presentation, dichotic listening technique,
electroencephalography [EEG], functional magnetic resonance imaging [fMRI], and
positron emission tomography [PET]). The findings from studies on normal subjects
validated some of the insights about brain functioning gleaned from previous studies on
brain-injured individuals. They also offered subtle and new findings about brain
hemispheric differences (Springer & Deutsch, 1998). The notion of complementary
specialization of the cerebral hemispheres or the cooperative engagement of both
hemispheres emerged from the more recent research on normal individuals.
In conclusion, the findings from clinical observations and experimental
examinations support the notion that the left and right cerebral hemispheres in humans
process information differently from each other (Hellige, 1983). It is now widely
accepted that the left hemisphere is specialized for auditory, verbal, analytical, logical,
abstract, convergent, and deductive functions. The right side is specialized for visual,
motoric (tactile/kinesthetic), non-verbal, intuitive, creative, divergent, concrete, musical,
spatial, holistic, and inductive functions (Kane & Kane, 1979). The research data support

4
the notion that each hemisphere has its specialized functions in information processing
and thinking but both hemispheres usually work together when learning (Sousa, 2006).
Developmental and Gender Differences in Hemispheric Specialization
Researchers have suggested that the right hemisphere is superior in infants and
bilateral development gradually occurs until puberty or even later (Gurian, Henley, &
Trueman, 2001; Sonnier, 1982). Overall, female brains develop quicker than male brains
(Berlin, 1978; Gurian et al.; James, 2007). Further, the right hemisphere matures earlier in
males and the left hemisphere matures earlier in females (Berlin; Levy & Heller, 1992).
Epstein’s brain development theory of growth spurts and plateaus indicates that growth
spurts appear to occur between the ages of 3-10 months, 2-4 years, 6-8 years, 10-12+
years, and 14-16+ years. The last two growth spurts show clear differences in boys and
girls. Girls’ brains grew three times as fast as boys’ during the 10-12+ year spurt. During
the 14-16+ year spurt, the boys’ brains grew three times as fast as girls (as cited in
Lindelow, 1983; Rose, 1982). Sax (2005) reviewed a study conducted by researchers in
Virginia Tech who studied the brain activity in 508 normal children, 224 girls and 284
boys, ranging from 2 months to 16-years-old. They found that the various areas of the
brain develop in a different order, time, and rate in girls compared to boys.
Gender Differences in Cognitive Ability
According to Hines (2007), there are no significant sex differences in overall
intelligence tests. However, there are sex differences in some specific cognitive abilities.
In 1974, Maccoby and Jacklin published a systematic review of research which became a
milestone analysis. They concluded that males had an advantage in mathematical and
spatial ability, whereas females had an advantage in verbal ability. In addition, sex

5
differences in verbal ability begin to appear around the age of 11, and that sex differences
in spatial ability do not appear until adolescence (Hyde, 1990). Hyde (1981) published
the first meta-analysis using the studies that had been evaluated by Maccoby and Jacklin.
The results showed that males performed better than females in mathematical ability and
spatial ability, while females performed better than males in verbal ability.
Two major meta-analyses of sex differences related to spatial ability have been
conducted. Linn and Petersen (1985) conducted a meta-analysis of sex differences related
to spatial ability. The results showed that males have a moderate advantage with regard to
spatial perception, a clear advantage for mental rotation, and no difference for spatial
visualization. In addition, the results showed that sex differences in spatial ability seem to
be detected prior to adolescence for spatial perception and mental rotation. Voyer, Voyer,
and Bryden (1995) conducted a meta-analysis of sex differences related to spatial ability.
The results showed that sex differences were largest and most consistent for tests in the
mental rotation category (significant in each test), sex differences were large but
inconsistent for tests in the spatial perception category (significant in four out of seven
tests), and sex differences were highly changeable and frequently not significant for tests
in the spatial visualization category (significant in three out of eleven tests). The results
also showed that the age at which sex differences emerge is related to the test used (e.g.,
10-years-old for the generic mental rotation task and the PMA Spatial Relations subtest).
Based on the meta-analyses reported by Linn and Petersen and Voyer et al., a greater
male advantage appears to be for tasks involving mental rotation.
Hyde and Linn (1988) conducted a meta-analysis of sex differences related to verbal
ability. The results showed that all of the sex differences were small for tests of verbal

6
ability, favoring females with one exception—analogies. The largest sex difference was
for speech production, favoring females. More detailed analysis of various types of verbal
ability indicated that there were no sex differences at all ages from childhood to adult.
Left-Brain and Right-Brain Teaching Strategies
Research has shown that matching teaching strategies to student hemispheric
preference will enhance achievement (Beck, 2001; Saleh, 2001). In addition, research has
shown that educators must incorporate left-brain and right-brain teaching strategies to
stimulate both hemispheres to develop the whole brain, to reach all students, and to
achieve student highest potential (Beck; Lewallen, 1985; Williams, 1983). Researchers
have classified teaching strategies into left-brain and right-brain approaches. The
following left-brain and right-brain teaching strategies were derived from a review of the
literature (Beck; Bishop, 1978; Jackson, 1998; Lewallen; Marxer, 1988; McCarthy, 1987;
Williams). The left-brain teaching strategies include: lecture, recitation, textual readings,
oral reports, written reports, computation, multiple-choice tests, choosing only one
solution, inquiry, systematic experiments with teacher control, problem solving,
independent study, mastery learning, programmed learning, internet search, word
processing, convergent questions, and prompting questions. The right-brain teaching
strategies include: physical relaxation; visual thinking (e.g., pictures, maps, diagrams,
charts, mind maps, illustrations, flow charts, and graphs); brainstorming; fantasy; direct
experiences (e.g., field trips, manipulation of materials, primary sources, and real objects);
random experiments with student control; simulation; multisensory learning
(e.g., requiring visual, auditory, tactile, and/or kinesthetic senses); music and rhythm;
color discrimination; spatial imagery; creativity; art and design; analogy and metaphor;

7
poetry; mediation; open-ended questions; allowing many possible solutions; round table,
magic circle, fish bowl, and cooperative learning groups; dramatic and role play; video
conferencing; creative software; divergent questions; and probing questions.
Hemisphericity and Achievement
Hemispheric specialization has implications for educators. At the elementary school
level, the following studies have related teaching strategies (left-brain, right-brain, and
integrated-brain) and student hemispheric preference to students’ achievement and
attitudes. For example, student left-brain preference has been related to better
achievement and more negative attitudes in science, whereas student integrated-brain
preference has been related to better achievement and more positive attitudes in science
(Hider & Rice, 1986). Student left-brain preference has been related to greater reading
vocabulary achievement (Van Giesen et al., 1987). Student integrated-brain preference
has been related to higher general ability level, whereas student left-brain or right-brain
preference has been related to lower general ability level (Shannon & Rice, 1983).
Specific to fourth-grade students, integrated-brain preference has been related to higher
achievement in reading, mathematics, language, and a basic battery of tests (Fountain &
Fillmer, 1987).
Studies have revealed that a match between teaching strategies and student
hemispheric preference appears to have positive effects on student achievement in (a)
mathematics at the elementary school level (Jarsonbeck, 1984), (b) biology at the high
school level (Douglass, 1979), (c) mathematics at the college level (Dunn et al., 1990),
and (d) on student grades in an undergraduate psychology course (Gadzella, 1995).
However, some studies have revealed inconsistent results. For example, teaching

8
strategies (left-brain, right-brain, and integrated-brain) were not related to students’
achievement in science at the elementary school level (Sonnier & Kemp, 1980). In
addition, a match or mismatch between teaching strategies and student hemispheric
preference did not affect student achievement in mathematics at the senior high school
level (Brennan, 1984). Based upon the literature review, it appears that teaching strategies
and student hemispheric preference may affect learning, but the research results are not
consistent.
Significance of the Study
Children entering today’s schools encounter an unbalanced education. Teaching
materials and teaching strategies are primarily left-hemisphere oriented and almost totally
ignore the right hemisphere. Many learners who prefer right-brain teaching strategies are
particularly handicapped. Discoveries from the field of hemispheric specialization are
helpful in understanding this imbalance. Therefore, educators must incorporate left-brain
and right-brain teaching strategies to reach all students and adjust the curriculum to
involve both hemispheres in the learning process to develop the whole brain. The full
potential of the human brain can be reached only when both hemispheres work together
(Cooke & Haipt, 1986). A balanced curriculum is one that stimulates both hemispheres
(Grady, 1984) and is beneficial to all students and not just left-brain preference students.
Statement of the Problem and Research Questions
The purpose of this mixed methods study was first to investigate the relationships
among teacher hemispheric preference, student hemispheric preference, student spatial
ability, student verbal ability, student science achievement, and student attitudes toward
science class using teacher and student data from multiple instruments. The second

9
purpose was to identify teaching strategies in the science classroom using observation
data and then match these teaching strategies to teacher and student hemispheric
preferences. This study of elementary school science teachers and grade 4 and grade 5
students in Taiwan was designed to investigate the following research questions:
1. What is the relationship between science teacher hemispheric preference and
science teaching strategies? Is there a gender difference in the relationship?
2. What is the relationship between student hemispheric preference and spatial
ability? Is there a gender and/or grade level difference in the relationship?
3. What is the relationship between student hemispheric preference and verbal
ability? Is there a gender difference in the relationship?
4. What is the relationship between student hemispheric preference and science
achievement? Is there a gender difference in the relationship?
5. What is the relationship between student hemispheric preference and attitudes
toward science class? Is there a gender and/or grade level difference in the
relationship?
6. What is the relationship between teacher and student hemispheric preference? Is
there a gender and/or grade level difference in the relationship?
7. Are there any differences in student hemispheric preference by gender and grade
level?
8. Are there any differences in student spatial ability by gender and grade level?
9. Are there any differences in student verbal ability by gender?
10. Are there any differences in student science achievement by gender?

10
11. Are there any differences in student attitudes toward science class by gender and
grade level?
12. What is the relationship between science teaching strategies and student
hemispheric preference?
Overview of the Study
This study, approved by The Ohio State University Behavioral and Social Sciences
Institutional Review Board, is divided into two parts: the construction and validation of
teacher and student instruments translated into Chinese for use in Taiwan and the main
study to explore the relationships among the variables of interest. In the first part, various
instruments were acquired from commercial vendors or developed by the researcher. All
of the instruments were then translated into Chinese, back-translated, and reviewed by a
panel of experts for validity. The Chinese version of the Human Information Processing
(HIP) Survey was administered to 35 undergraduate students, 35 graduate students, and
39 elementary school science teachers in Taiwan. Cronbach’s alpha (n = 109) for the
Chinese version of the HIP Survey was 0.81 for the left-brain scale, 0.78 for the
right-brain scale, and 0.86 for the integrated-brain scale. The Chinese version of the Style
of Learning and Thinking (SOLAT, Elementary Form) was administered to 98
fourth-grade students and 101 fifth-grade students in Taiwan. Cronbach’s alpha (n = 199)
for the Chinese version of the SOLAT inventory was 0.75 for the left-brain scale, 0.74 for
the right-brain scale, and 0.83 for the whole-brain scale. The Chinese version of the
Primary Mental Abilities (PMA) Spatial Relations Test was administered to 98
fourth-grade students and 101 fifth-grade students in Taiwan. Cronbach’s alpha (n = 199)
for the Chinese version of the PMA Spatial Relations Test was 0.64 for fourth-grade

11
students and 0.79 for fifth-grade students. The Chinese version of the
researcher-developed Student Attitudes Toward Science Class Survey was administered
to 98 fourth-grade students and 101 fifth-grade students in Taiwan. Cronbach’s alpha
(n = 199) for the Chinese version of the Student Attitudes Toward Science Class Survey
was 0.90. In conclusion, all four instruments translated into Chinese are valid and reliable
for use in Taiwan.
In the second part, the main study was conducted. Four elementary school science
teachers and 133 fourth- and fifth-grade students participated in the main study during the
2007 fall semester. There were two classes of fourth graders (n = 65) and two classes of
fifth graders (n = 68). The four classes were taught by four science teachers. All the
teachers and students were purposively selected from Liang elementary school located in
northern Taiwan. There were three teacher data sources: (a) Teacher Demographics
Questionnaire to obtain teacher background information, (b) Human Information
Processing Survey to identify teacher hemispheric preference, and (c) classroom
observations to identify science teaching strategies. There were five student data sources:
(a) Style of Learning and Thinking to identify student hemispheric preference, (b) PMA
Spatial Relations Test to measure student spatial ability, (c) Chinese language midterm
and final exams to assess student verbal ability, (d) Science midterm and final exams to
assess student science achievement, and (e) Student Attitudes Toward Science Class
Survey to measure student attitudes toward science class.
Teacher data were analyzed in two ways. The Teacher Demographics Questionnaire
and Human Information Processing Survey were analyzed using descriptive statistics to
describe teacher background information and teacher hemispheric preference. Classroom

12
observations were analyzed by coding and categorizing science teaching strategies related
to hemispheric preference and descriptive statistics. Student data from multiple
instruments—Style of Learning and Thinking, PMA Spatial Relations Test, Chinese
language exams, Science exams, and Student Attitudes Toward Science Class Survey
were analyzed in four ways including descriptive statistics, Pearson Product Moment
Correlations, Multivariate Analysis of Variance (MANOVA), and Analysis of Variance
(ANOVA). Lastly, teacher data related to classroom observations and student data related
to student hemispheric preference were analyzed using Confidence Intervals for
Proportion tests.
Limitations of the Study
The following limitations are associated with the current study. These limitations
may affect the internal reliability and validity of the study as well as the generalizability
of the findings.
1. The participants were delimited to an available sample of elementary school
science teachers and grade 4 and grade 5 students in Taiwan. This sample may
not be representative of the elementary school science teachers and elementary
school students in Taiwan. Thus, generalizability of the results of this study may
be limited to the sample in the study. In addition, the results cannot be
generalized to other countries.
2. Four elementary school science teachers and 133 fourth- and fifth-grade students
were purposively selected for this study. The teachers self-selected and
volunteered to participate in the study. The non-random selection of subjects
from intact classrooms may limit the generalizability of the results of this study.

13
3. The study may be limited by the Chinese translation of the instruments used in
the current study. Instruments were commercial instruments or developed by the
researcher. All of the instruments were translated into Chinese, back-translated,
and reviewed by a panel of experts. However, the translations into Chinese may
not be completely accurate and may be affected by individual language and
cultural misconceptions. Thus, there may be validity issues associated with the
use of these instruments. In addition, the findings associated with teacher and
student responses to these instruments may be problematic.
4. Cronbach’s alphas were used to measure the reliabilities of the instruments in the
current study. Cronbach’s alpha measures internal consistency of the items on an
instrument. Other measures of reliability, such as test-retest analysis, may further
contribute to the reliability of the instruments. However, additional
administrations of the instruments were not feasible in Taiwan.
5. The instrument to measure student spatial ability may be measuring specific
aspects of this construct. For example, spatial ability includes spatial perception,
spatial visualization, or mental rotation. Other instruments may measure
different aspects of spatial ability.
6. Some of the instruments were self-report surveys that rely on the abilities of the
subjects to understand themselves and be aware of their own behavior. Also,
responses to the self-report surveys may be more positive as respondents may
have pre-conceived ideas as to the expectations of the researcher.
7. Classroom observations of the science teachers were dependent upon the ability
and objectiveness of the researcher.

14
CHAPTER 2
REIVEW OF THE LITERATURE
Brain Structure
The human brain weighs only about 3 pounds and represents only 2% of the body
weight; however, it consumes from 20 to 25% of the energy used by the body (Lucas,
2003; Sprenger, 2007). The brain consists of three main structures: the cerebrum, the
cerebellum, and the brainstem. The largest and most complex section of the brain is the
cerebrum which is covered by a thin layer called the cerebral cortex or neocortex (Lucas).
Because the cerebral cortex has a high density of cell bodies, it appears to be a grayish
brown mass called gray matter. Gray matter is formed primarily by neuron cell bodies,
whereas the white matter below the gray matter is formed of myelinated axons
(Gazzaniga, Ivry, & Mangun, 2002). Further, the cerebrum is divided into the right and
left hemispheres. Each consists of four lobes: the frontal, parietal, temporal, and occipital
lobes. Each lobe has distinctive functions. The left and right hemispheres are connected
by a thick bundle of nerve fibers called the corpus callosum, which enables
communication between the two sides of the brain (Hardiman, 2003). The left
hemisphere controls sensory input and motor output on the right side of the body, and the

15
right hemisphere controls sensory input and motor output on the left side of the body
(Halpern, 2000). The two hemispheres are asymmetrical in structure and have different
cognitive functions (Kandel, Schwartz, & Jessell, 1995).
The brain is made up of many cells, including neurons and glial cells. Neurons are
nerve cells that send and receive electrical signals to and from the brain and nerve system.
There are about 100 billion neurons in the brain. Glial cells provide support, protection,
and nutrition to the neurons, and are far more numerous than neurons (Hardiman, 2003;
Sprenger, 2007). Every neuron has a cell body, one axon, and a number of dendrites.
When two neurons communicate, an electrical impulse goes from the axon of the sending
neuron to the dendrite of the receiving neuron. During this process, axons and dendrites
never actually touch. The electrical impulse that flows from the axon travels over a small
gap called a synapse through chemical substances known as neurotransmitters. The action
inside the cell is electrical. The action between the cells is chemical. Learning takes place
when two neurons communicate (Bergen & Coscia, 2001; Estes, 2001; Hardiman;
Sprenger). Sprenger stated that when neurons continually connect to other neurons they
form neural networks.
Brain Development
Blakemore and Frith (2005) stated that an adult brain contains about 100 billion
neurons. At birth, a child’s cerebral cortex has almost all of his/her 100 billion neurons.
Researchers once believed that no new neurons are produced after birth but recent
evidence shows that the cerebellum and hippocampus appear to generate new neurons
after birth.

16
During the first year of life, the brain forms new synapses (connections between
neurons) at a high rate of speed. By age 2, children’s brains contain twice as many
synapses as the brains of normal adults (Halpern, 2000). While these new synapses
between neurons continue to form throughout life, they reach their highest synapses at
around the age of 2 and the number of synapses remains relatively stable until the age of
10 or 11 (Halpern; Nash, 1997). After this age, the number of synapses begins to drop and
continues to decline slowly into adult level. By late adolescence, half of all the synapses
have been pruned which leaves about 500 trillion synapses. This number remains
relatively constant throughout life although new connections continue to be formed.
Brain development is a dynamic process of growth and pruning (Shore, 2003).
The weight of the brain increases from about 1 pound at birth to 2 pounds by age 1
and to its adult weight of 3 pounds at age 16 (Lindelow, 1983). The growth of the brain
involves an increase in size of the neurons and the development of glial cells, myelination
of the axons, and dendrite extensions (Bergen & Coscia, 2001). One type of glial cell
wraps itself around long axons, forming an insulating layer called myelin, and this
insulation helps the rapid conduction of nerve impulses (Martin, 2006; Sylwester, 1995,
2005).
Thatcher, Walker, and Giudice (1987) used EEGs to measure cerebral hemisphere
development in 577 normal subjects, ranging from 2 months to early adult. The results
showed that brain growth spurts were associated with Piaget’s developmental stages. The
results also showed that different regions within the left and right hemispheres developed
at different times and different rates. The results supported that the left frontal-occipital

17
and left frontal-temporal parts developed earlier than the corresponding right
frontal-occipital and right frontal-temporal parts, however, the right frontal pole
developed earlier than the corresponding left frontal pole.
Hemispheric Specialization
The earliest evidence of hemispheric asymmetry came from observations of the
disorders produced by unilateral brain damage (Hellige, 1983). During the 1860s, Paul
Broca observed patients suffering from loss of speech, all with lesions on their left frontal
lobe. He concluded that there is a relationship between the left hemisphere and speech
production. During the 1870s, Karl Wernicke observed patients having difficulties in
understanding speech, all with lesions on their left temporal lobe. He described a
relationship between the left hemisphere and language comprehension (Finger, 1994).
These clinical reports indicated that different areas of the brain control specific functions.
These findings were confirmed and expanded in the 1950s and 1960s (Herrmann, 1990).
In summary, the notion of localization of brain function emerged from early studies of
brain-damaged individuals.
In many ways, the most dramatic evidence for hemispheric asymmetry comes from
the study of patients who have had the corpus callosum severed in order to control severe
epilepsy (Hellige, 1983). During the 1950s, Roger Sperry and his graduate student
Ronald Myers did a series of experiments on split-brain cats. The results showed that
severing the corpus callosum prevented the information received in one hemisphere from
reaching the other hemisphere. In addition, the animals appeared to have two independent
minds. This finding was confirmed with monkeys (Finger, 1994; Springer & Deutsch,
1998). During the 1960s, Sperry and two neurosurgeons, Philip Vogel and Joseph Bogen,

18
conducted a series of experiments with split-brain humans (Bogen, 1985). The results
showed that the left and right hemispheres process information differently. The left
hemisphere excels in dealing with verbal and analytic information, whereas the right
hemisphere excels in dealing with visuospatial, synthetic, and holistic information. These
studies also demonstrated the role of the corpus callosum in integrating the specialized
functions of the left and right hemispheres into unified behavior (Springer & Deutsch). In
summary, the initial idea of hemispheric specialization emerged from studies of
split-brain subjects.
More recently, hemispheric asymmetry has been investigated by studies on normal
people in a number of ways. Some of the techniques on normal people are similar to ones
previously used in clinical populations (i.e., tachistoscopic presentation and dichotic
listening technique), whereas other studies used advanced technologies to measure brain
activity (e.g., EEG, fMRI, and PET).
The tachistoscopic technique assumes that superior performance for a stimulus from
the left visual field indicates that the right hemisphere excels in dealing with the material
presented, and superior performance for a stimulus from the right visual field indicates
that the left hemisphere excels in dealing with the material presented. In dichotic listening
tests, different auditory stimuli are presented simultaneously to each ear, and subjects are
asked to report what they heard. Superior performance for a stimulus presented to the left
ear indicates right hemisphere superiority in processing the stimuli, and vice versa.
Findings related to contralateral hemispheric superiority in normal subjects using both the
tachistoscopic and dichotic listening techniques are highly consistent across numerous
clinical studies (Springer & Deutsch, 1998).
19
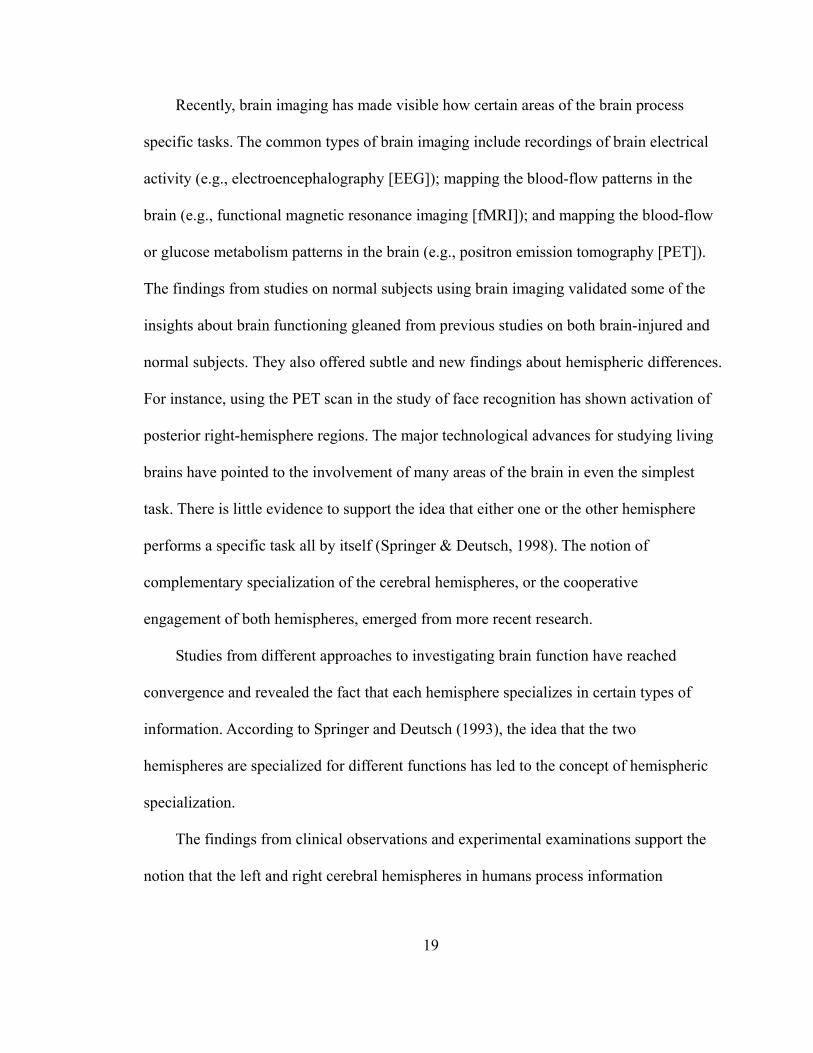
Recently, brain imaging has made visible how certain areas of the brain process
specific tasks. The common types of brain imaging include recordings of brain electrical
activity (e.g., electroencephalography [EEG]); mapping the blood-flow patterns in the
brain (e.g., functional magnetic resonance imaging [fMRI]); and mapping the blood-flow
or glucose metabolism patterns in the brain (e.g., positron emission tomography [PET]).
The findings from studies on normal subjects using brain imaging validated some of the
insights about brain functioning gleaned from previous studies on both brain-injured and
normal subjects. They also offered subtle and new findings about hemispheric differences.
For instance, using the PET scan in the study of face recognition has shown activation of
posterior right-hemisphere regions. The major technological advances for studying living
brains have pointed to the involvement of many areas of the brain in even the simplest
task. There is little evidence to support the idea that either one or the other hemisphere
performs a specific task all by itself (Springer & Deutsch, 1998). The notion of
complementary specialization of the cerebral hemispheres, or the cooperative
engagement of both hemispheres, emerged from more recent research.
Studies from different approaches to investigating brain function have reached
convergence and revealed the fact that each hemisphere specializes in certain types of
information. According to Springer and Deutsch (1993), the idea that the two
hemispheres are specialized for different functions has led to the concept of hemispheric
specialization.
The findings from clinical observations and experimental examinations support the
notion that the left and right cerebral hemispheres in humans process information

differently from each other (Hellige, 1983). The primary differences between the cerebral
hemispheres have been characterized in a number of ways by different researchers.
Left Hemisphere Right Hemisphere Verbal
Using words to name, describe, define. Nonverbal
Awareness of things, but with minimal connections with words. Recognizing music, environmental sounds.
Sequential Dealing with events and actions sequentially.
Parallel Dealing with events and actions simultaneously.
Temporal Keeping track of time.
Non-temporal Without a sense of time.
Analytic Figuring things out step by step and part by part, taking things apart.
Synthetic Putting things together to form wholes.
Linear Thinking part to whole, taking little pieces, lining them up, arranging them in logical order, and leading to a convergent conclusion.
Holistic Thinking whole to part, seeing whole things all at once, perceiving the whole pattern, and leading to a divergent conclusion.
Digital Using numbers as in counting.
Spatial Visualizing where things are in relationship to other things, and how parts go together to form a whole.
Symbolic Using a symbol to stand for something. For example, the drawn form stands for eye, the sign + stands for the process of addition.
Concrete Dealing with real objects. For example, learning by doing, touching, and moving.
Compositional Writing music scientifically.
Responsive Responding to tones and sounds.
Factual Using facts.
Visual Using imagery.
Systematic and formal Dealing with information and objects in a variety of systematic ways.
Casual and informal Dealing with information and objects according to the needs of the moment.
Table 2.1: Information-processing styles of the left and right cerebral hemispheres. 20

21
Table 2.1, derived from a review of the literature, shows that each of the cerebral
hemispheres has a different information-processing style (Botkin, Keen, McClellan, &
Robinette, 1980; Cherry, Godwin, & Staples, 1989; Richards, 1984; Vitale, 1982).
Other researchers have described the cerebral hemispheres in terms of specialized
functions. The right and left hemispheres have distinctly different cognitive functions.
Two separate and unique ways of processing stimuli exist within each person. Both
hemispheres receive and process sensory information from the surrounding environment
and each hemisphere processes the information separately (Sousa, 2006; Vitale, 1982). It
is now widely accepted that the left hemisphere is specialized for auditory, verbal,
analytical, logical, abstract, convergent, and deductive functions. The right side is
specialized for visual, motoric (tactile/kinesthetic), non-verbal, intuitive, creative,
divergent, concrete, musical, spatial, holistic, and inductive functions (Kane & Kane,
1979).
Hemispheric Preference
Reviewing the literature, Torrance (1982) stated that hemisphericity is defined as the
tendency for a person to rely more on one than the other cerebral hemisphere in
processing information. Saleh (2001) reviewed the literature and suggested that
hemisphericity is the tendency for an individual to process information through the left
hemisphere or the right hemisphere or in combination.
Further, research has indicated that the two hemispheres, to some degree, are
lateralized or dominant for different functions (Halpern, 2000). Research also has shown
that most people have a preferred (or dominant) hemisphere, and this hemispheric
preference affects personality, abilities, and learning style. However, some researchers

22
note that people should not overemphasize a rigid specialization. These specializations do
not mean exclusivity; that is, they are relative rather than absolute. One cerebral
hemisphere may be more active in most people, but only in varying degrees (Frank, 1984;
Sousa, 2006; Vitale, 1982). Grady (1984) stated that, in most people, there seems to be a
hemispheric preference for specific functions. At times, a function can be lateralized in
the opposite hemisphere or even show mixed dominance. According to Sousa, these
functions are rarely exclusive to only one hemisphere—it is possible for both
hemispheres to be involved. Many tasks can be performed by either hemisphere, although
one may be better at it than the other. In a typical individual, the results of the separate
processing are exchanged with the opposite hemisphere through the corpus callosum.
According to Cooke and Haipt (1986), the right and left hemispheres of the brain
complement, interact, and collaborate with each other via the corpus callosum or the
commissures or fibers that connect the hemispheres. This interaction contributes to
integrated human thought and behavior. In short, although each hemisphere has
specialized functions, once information enters the brain, both hemispheres can work
cooperatively to process it and they complement one another in almost all activities
(Grady; Sousa). Therefore, neither the right nor the left hemisphere is completely idle
during any task. Most activities involve both hemispheres interacting with each other
(Richards, 1993). In summary, more recent research has continued to move people away
from a theory of cerebral dominance to one of complementary specialization of the
cerebral hemispheres.

23
Gender Differences in Brain Structure, Brain Development, and Cognitive Ability
Gender Differences in Brain Structure
Gur et al. (1999) conducted a study about sex differences in brain structure and
concluded that women have a higher percentage of total gray matter (neuron cell bodies),
whereas men have a higher percentage of total white matter (myelinated axons). Men
have a higher percentage of gray matter in the left hemisphere; however, the percentage
of white matter is the same in both hemispheres. In women, the percentage of gray and
white matter is the same in both hemispheres. According to Sousa (2006), these sex
differences in gray and white matter support the idea that female brains have better
communication between the two hemispheres, whereas male brains have better
communication within each hemisphere.
Powell and Kusuma-Powell (2007) reviewed the research literature and concluded
that a female’s corpus callosum—the connecting bundle of nerve fibers between
hemispheres—is, on average, thicker than a male’s, up to 20% thicker in the female brain
than in the male brain. This structural difference enables more cross talk between
hemispheres in the female’s brain. Halpern (2000) reviewed a large body of research
literature and arrived at a similar conclusion. She concluded that there are sex differences
in the shape and the volume in the corpus callosum. On average, females have a larger
and more bulbous structure. This conclusion supports the idea that females may have
greater information communication between the left and right hemispheres. According to
Gurian and Stevens (2005), more cross talk between hemispheres leads to better
multitasking. Girls tend to be better at multitasking, whereas boys are more single-task
oriented.

24
The hippocampus is another long-term memory area in the brain (Gutman, 2001).
James (2007) stated that girls develop their hippocampus before boys. The hippocampus
is related to mathematical calculations, basic arithmetic, vocabulary, and reading. On
average, girls are cognitively more ready for school tasks than boys. According to Gurian
and Stevens (2004), a girl’s hippocampus is larger than a boy’s. This difference increases
memory storage in girls, leading to greater learning for girls, especially in language arts.
According to Fuster (1997), frontal functions deal with movement, speech,
reasoning, action initiating, decision making, and regulation of emotions. Gurian and
Stevens (2005) stated that a girl’s frontal lobe is generally more active than a boy’s and
develops at an earlier age. Also, girls tend to make less impulsive decisions compared to
boys.
James (2007) reviewed the literature and noted that Broca’s area and Wernicke’s
area are located in the left hemisphere of the brain, in the frontal and temporal lobes,
respectively. Broca’s area is responsible for grammar and the production of words,
whereas Wernicke’s area is responsible for the acquisition and understanding of words.
Gurian and Stevens (2005) stated that a girl’s Broca’s and Wernicke’s areas are more
active than a boy’s and develop at earlier ages. These two areas are the main language
centers of the brain. According to Gurian et al. (2001), in general, these differences
increase girls’ learning advantage for verbal communication skills.
Research on sex differences in brain structure may be said to have begun in 1964,
when psychologist Herbert Lansdell reported the existence of sex differences in brain
anatomy (as cited in Sax, 2005). For example, he conducted research on people who had
epilepsy and had some part of their right hemisphere removed. Men with

25
right-hemisphere damage did badly on spatial IQ tests, whereas women with similar
right-hemisphere damage were hardly affected. These results provided evidence that a
man’s right hemisphere is very important for spatial ability, while a woman’s right
hemisphere is not. Lansdell then studied the left hemisphere, where language skills are
located. Men with left-hemisphere damage did badly on verbal IQ tests, whereas women
with similar left-hemisphere damage were hardly affected. This finding suggests that a
man’s left hemisphere is very important for verbal ability, while a woman’s left
hemisphere is not. Lansdell discovered that men and women who were damaged in the
same area were affected differently. This led Lansdell to the conclusion that in men
verbal skills are much more specifically located in the left hemisphere, spatial skills in
the right hemisphere, whereas in women verbal and spatial skills are located in both
hemispheres. It appears that women use both hemispheres for verbal and spatial skills,
whereas men do not (Moir & Jessel, 1992).
Over the next two decades, a series of studies showed that male brains were more
asymmetrically organized for cognitive functions—a more lateralized organization—and
female brains were more symmetrically organized for these functions—a more bilateral
organization (Halpern, 2000; Powell & Kusuma-Powell, 2007).
Voyer (1996) conducted a meta-analysis of 396 separate comparisons from a variety
of studies on the question of sex differences in lateralization. He concluded that males are
more lateralized for visual and auditory modalities. This extensive review of the literature
confirmed earlier findings.
Boys tend to lateralize brain activity, that is, compartmentalize activity into discrete
areas of the brain (Powell & Kusuma-Powell, 2007). Girls tend to be better at

26
multitasking, whereas boys are more single-task oriented. Girls tend to pay attention to
more information at a given time, with fewer attention span problems, whereas boys tend
to concentrate for long periods on one task. Girls have greater ability to make quick
transition between tasks, whereas boys take more time to transition between tasks
(Gurian & Stevens, 2004, 2005; King & Gurian, 2006; Powell & Kusuma-Powell).
Professor Doreen Kimura, a Canadian psychologist conducted a series of studies
during the 1980s and 1990s that showed a sex difference in the organization of cognitive
functions within the left hemisphere. She examined patients whose damage was restricted
to the anterior (front) region and posterior (back) region of the left hemisphere,
respectively. Kimura concluded that language functions in the female brain are more
focally organized in the front region of the left hemisphere, whereas the language
functions in the male brain are more diffusely organized in the front and back of the left
hemisphere (as cited in Halpern, 2000; Moir & Jessel, 1992).
Research has confirmed that male and female brains differ in the organization of
cognitive functions within a hemisphere (Halpern, 2000; Moir & Jessel, 1992). Table 2.2
was derived from a review of the literature and provides a summary of sex differences in
brain structure.

27
Females Males Gray matter ▪ Higher percentage, with same
percentage in both hemispheres
▪ Lower percentage, with more percentage in left hemisphere
White matter ▪ Lower percentage, with same percentage in both hemispheres
▪ Higher percentage, with same percentage in both hemispheres
Corpus Callosum ▪ Larger (thicker) and more bulbous
▪ Smaller (thinner) and less bulbous
Hippocampus ▪ Quicker development ▪ Larger
▪ Slower development ▪ Smaller
Frontal lobe ▪ More active ▪ Quicker development
▪ Less active ▪ Slower development
Broca’s area ▪ More active ▪ Quicker development
▪ Less active ▪ Slower development
Wernicke’s area ▪ More active ▪ Quicker development
▪ Less active ▪ Slower development
Lateralization (Verbal Ability)
▪ More symmetrical ▪ More bilateral ▪ Left and right hemispheres
▪ More asymmetrical ▪ More lateralized ▪ Left hemisphere
Lateralization (Spatial Ability)
▪ More symmetrical ▪ More bilateral ▪ Left and right hemispheres
▪ More asymmetrical ▪ More lateralized ▪ Right hemisphere
Intrahemispheric (Language)
▪ More focal ▪ Left hemisphere ▪ Front region
▪ More diffuse ▪ Left hemisphere ▪ Front and back regions
Table 2.2: Structural differences between female and male brains.
Gender Differences in Brain Development
Sonnier (1982) stated that evidence has shown that infants depend totally on their
right hemispheres. As infants grow into children, their brain develops more bilaterality
until about puberty. James (2007) suggested that, in general, girls develop earlier than
boys and this developmental difference includes the brain and the body. This
developmental superiority for girls begins soon after birth and continues until late
adolescence or even later. Gurian et al. (2001) suggested that, in general, female brains

28
develop quicker than male brains. The right hemisphere is superior in infants and
development gradually occurs in the left hemisphere. Females’ development of the left
hemisphere occurs earlier compared to males. Levy and Heller (1992) reviewed the
research literature and arrived at an important conclusion in understanding the emergence
of adult gender differences in cognition. The accumulating evidence supports that the
right hemisphere matures faster in males and the left hemisphere matures faster in
females.
Berlin (1978) investigated age and sex differences with regard to brain lateralization.
Male and female subjects volunteered from two kindergarten classrooms (ages 5-to-6)
and two sixth-grade classrooms (ages 11-to-12) in an urban, white, middle class, public
school in the midwestern United States. Brain lateralization of 79 right-handed subjects
was assessed by two left-hemisphere tasks, the WISC Digit Span and PMA Verbal
Meaning Tests, and two right-hemisphere tasks, the WISC Block Design and PMA
Spatial Relations Tests. The statistical analyses employed ANOVA procedures, post hoc
Scheffé tests, and Pearson Correlations.
The statistical results indicated that sixth graders outperformed kindergartners on all
of the tests but the Spatial Relations Test. This unexpected kindergarten superiority on the
spatial test possibility may have reflected a negative context effect for sixth graders who
took the Verbal meaning and Spatial Relations Tests during one testing session and in that
order. The only significant sex effect was for the Block Design Test which revealed a
male advantage at the sixth-grade level. Group differences indicated that kindergarten
females were superior to sixth-grade females on the Spatial Relations Test.

29
Based upon the results of her study, Berlin (1978, p. 104) suggested the following
conclusions.
1. Children improve their performance on left- and right- hemisphere tasks with
increasing age.
2. Kindergarten children do not exhibit sex differences with regard to
left-hemisphere and right-hemisphere tasks thereby indirectly indicating similar
neurological hemisphere organization.
3. Six-grade children do not exhibit sex differences with regard to left-hemisphere
tasks thought there is some support for earlier, greater left-hemisphere
lateralization for females.
4. Sixth-grade children do not exhibit sex differences with regard to
right-hemisphere tasks measured by standardized paper-and-pencil spatial ability
tests.
5. Sixth-grade children do not exhibit sex differences with regard to
right-hemisphere tasks measured by constructive visuo-spatial tests thereby
supporting earlier, greater male right-hemisphere lateralization for specific
aspects of spatial ability.
Dr. Herman T. Epstein’s brain development theory of growth spurts (brain growth
periods) and plateaus (non-brain growth periods) indicates that the brain grows in rapid
spurts rather than in a slow and continuous process. For most normal children, these
growth spurts appear to occur between ages of 3-10 months, 2-4 years, 6-8 years, 10-12+
years, and 14-16+ years. The last two growth spurts show clear differences for boys and
girls. Girls’ brains grew three times as fast as boys’ during the 10-12+ year spurt. During

30
the 14-16+ year spurt, boys’ brains grew three times as fast compared to the growth of
girls’ brains (as cited in Lindelow, 1983; Rose, 1982). Rose also pointed out that
Epstein’s brain development pattern of growth spurts and plateaus corresponded to Jean
Piaget’s stages of cognitive development.
Sax (2005) reviewed a study conducted by researchers at Virginia Tech who studied
the brain activity in 508 normal children, 224 girls and 284 boys, ranging from 2 months
to 16-years-old. They found that different areas of the brain develop in a different
sequence in girls compared to boys. The results showed that the areas of the brain
connected with language and fine motor skills mature about 6 years earlier in girls than in
boys, whereas the areas of the brain connected with throwing an object at a target and
spatial memory mature about four years earlier in boys than in girls. These researchers
concluded that the various areas of the brain develop in a different order, time, and rate in
girls compared to boys.
Gender Differences in Cognitive Ability
According to Hines (2007), there are no significant sex differences in overall
intelligence tests. However, there are sex differences in some specific cognitive abilities.
In 1974, Maccoby and Jacklin published a systematic review of research which
became a milestone analysis. They reviewed more than 1,000 research reports on sex
differences in cognitive abilities, personality, and social behavior that had been conducted
between 1966 and 1973. With regard to the cognitive domain, they concluded that males
had an advantage in mathematical and spatial ability, whereas females had an advantage
in verbal ability. With regard to developmental trends, they concluded that sex differences
in verbal ability begin to appear around the age of 11, and that sex differences in spatial

31
ability do not appear until adolescence. However, this is an oversimplification. In the
1980s, researchers used the meta-analysis technique to combine evidence from a larger
sample of studies. In meta-analysis studies, many researchers use a rubric generated by
Cohen. An effect size of 0.2 is considered small, an effect size of 0.5 is considered
moderate, and an effect of 0.8 is considered large (Hyde & McKinley, 1997). This new
statistical method has radically changed the analysis of sex differences with regard to
cognitive abilities (Hyde, 1990).
Hyde (1981) published the first meta-analysis using the studies that had been
evaluated by Maccoby and Jacklin. Hyde computed effect size for the studies and showed
that the average effect size was -0.24 for verbal ability, 0.43 for mathematical ability, and
0.45 for spatial ability. The positive values indicated higher scores for males and negative
values indicated higher scores for females. The results showed that males performed
better than females for mathematical ability and spatial ability, while females performed
better than males for verbal ability. The results confirmed Maccoby and Jacklin’s
conclusion that males had an advantage for mathematical and spatial abilities, whereas
females had an advantage for verbal ability. According to Cohen’s scheme, the sex
difference in verbal ability was small, while the sex differences in mathematical and
spatial ability were moderate.
Spatial Ability
Two major meta-analyses of sex differences related to spatial ability have been
conducted. Linn and Petersen (1985) conducted a meta-analysis of sex differences related
to spatial ability. They examined 172 studies published between 1974 and 1982 and
classified spatial tests into three distinct categories: spatial perception, mental rotation,

32
and spatial visualization. Spatial perception was defined as the ability to determine spatial
relationships in the presence of distracting information (e.g., Rod-and-Frame Test).
Mental rotation was defined as the ability to imagine what a two- or three-dimensional
figure would look like if rotated in space (e.g., Spatial Relations subtest of the Primary
Mental Abilities Test). According to Crawford and Chaffin (1997), spatial visualization is
defined as the ability to find a simpler figure in a more complex figure (e.g., Embedded
Figures Test). For these tests, the effect size for spatial perception was 0.44; for mental
rotation, it was 0.73; and for spatial visualization, it was 0.13. The results showed that
there was a moderate difference for spatial perception, a rather large difference for mental
rotation, and no difference for spatial visualization. That is, males have a moderate
advantage with regard to spatial perception, a clear advantage for mental rotation, and no
difference for spatial visualization. They also examined the data for developmental trends
in sex differences related to spatial ability. The results showed that a male advantage for
spatial perception was present in childhood and may increase with age, the male
advantage for mental rotation was consistent across ages, and there were no age
differences for spatial visualization. Thus, gender differences in spatial ability seem to be
detected prior to adolescence for spatial perception and mental rotation. The
meta-analysis results did not support Maccoby and Jacklin’s conclusion that sex
differences in spatial ability emerged in adolescence.
Voyer et al. (1995) conducted a meta-analysis of 286 studies published between
1974 and 1993. For these tests, the effect size for spatial perception was 0.44, for mental
rotation was 0.56, and for spatial visualization was 0.19. Because the values of d

( mean differencedSD
= ) were not homogeneous, Voyer et al. partitioned the studies by
type of tests, age of participants, and a number of procedural variables. According to
Crawford and Chaffin (1997), the results of the Voyer et al. meta-analysis showed that
sex differences were largest and most consistent for tests in the mental rotation category
(significant in each of six tests); sex differences were large but inconsistent for tests in the
spatial perception category (significant in four out of seven tests); and sex differences
were highly changeable and frequently not significant for tests in the spatial visualization
category (significant in three out of eleven tests). According to the more detailed analysis,
the results showed that all of the sex differences were in the same direction, favoring
males. The results also showed that the age of emergence of sex differences was related
to the test used such as 7-years-old for the Rod-and-Frame Test, 9-years-old for the Water
Level Test, 10-years-old for the generic mental rotation task and the PMA Spatial
Relations subtest, 13-years-old for the DAT Spatial Relations subtest, and 14-years-old
for the Embedded Figures Test. These results indicated an absence of reliable sex
differences in early childhood.
In conclusion, based upon the meta-analyses reported by Linn and Petersen (1985)
and Voyer et al. (1995), a greater male advantage appears to be for tasks involving mental
rotation. However, there are many different types of spatial ability and different
measurement instruments, and other differences may exist within particular categories
(Berlin, 1978).
33

34
Verbal Ability
Hyde and Linn (1988) conducted a meta-analysis of 165 studies of sex differences
related to verbal ability. Over all studies, the mean effect size was 0.11. In this
meta-analysis, the positive values indicated higher scores for females and negative values
indicated higher scores for males. The results indicated a slight female advantage for
verbal ability. Hyde and Linn argued that the difference was so small that it indicated that
there was no sex difference related to verbal ability. Because the values of d were not
homogeneous, Hyde and Linn partitioned the studies by type of test, age of participants,
cognitive process, and date of study. The results showed that the mean effect size was
0.02 for vocabulary, -0.16 for analogies, 0.03 for reading comprehension, 0.33 for speech
production, 0.09 for essay writing, 0.22 for anagrams, and 0.20 for general verbal ability.
All of these sex differences were small, favoring females with one exception—analogies.
The largest sex difference was for speech production, favoring females.
With regard to developmental trends, all tests showed that the effect size was 0.13
for the 5-year-old and younger group, 0.11 for the 11- to 18-year-old group, and 0.20 for
the 26-year-old and older group. The effect sizes were close to zero for the intervening
two age groups. Vocabulary tests showed that the effect size was -0.26 for the 6- to
10-year-old group and 0.23 for the 19- to 25-year-old group. The effect sizes were close
to zero for the other three age groups. Reading comprehension tests showed that the
effect size was 0.31 for the 5-year-old and younger group but it was not reliable because
this was based on a single study. The effect sizes were close to zero for other age groups.
More detailed analysis of various types of verbal ability indicated that there were no sex

35
differences at all ages from childhood to adult. Thus, the results did not support Maccoby
and Jacklin’s (1974) conclusion that sex differences in verbal ability begin to appear
around the age of 11.
In conclusion, there does not appear to be substantial evidence for sex differences
related to most types of verbal ability. The one possible exception is speech production
which may favor females. In addition, gender differences were consistently small at all
age levels, suggesting that there are no gender differences in verbal ability at all ages
from childhood to adult.
Nature and Nurture
In the 1960s, Marian Diamond and her colleagues at the University of California at
Berkeley conducted experiments with rats on the effects of environmental stimulation and
deprivation on the development of the cerebral cortex. Diamond placed one group of rats
in an enriched environment—cage mates, novel toys; another group was put in an
impoverished environment—no cage mates, no novel toys. The results showed that the
rats living in the enriched environment developed a thicker and heavier cerebral cortex as
the result of an increase in the size of the nerve cells, gaining more dendrite branching,
and an increase in the number of glial cells (Diamond, 1988). Diamond’s study
demonstrated that brain structures in rats were modified by the environment. Her research
led to the concept of brain plasticity, the brain’s amazing ability to change the structure of
the brain through experience (Wolfe & Brandt, 1998).
Some educators and researchers believe that brain development is genetically
programmed (Shore, 2003). Diamond’s (1988) research challenges this assumption. Her
research illustrates that experience appears to be able to change the physical structure of

36
the brain. In recent years, researchers have presented a holistic view, believing that nature
and nurture are inseparable. That is, one cannot separate the environmental effects from
the biological ones related to brain development (Smilkstein, 2003). The nature-nurture
dichotomy has ended and has been replaced with a dynamic model that emphasizes that
brain development is based on a complex interaction between genes and experiences
(Halpern, 2000).
Jensen (1998) stated that Diamond’s discovery of brain plasticity illustrated that the
brain can grow new connections with environmental stimulation. Sprenger (2007)
suggested that learning takes place when connections between neurons form. Experience
can change the physical structure of the brain and influence learning. Plasticity can
explain learning. Kovalik and Olsen (2001) stated that an enriched environment is a
learning environment rich in sensory stimuli. Students have more sensory experiences
which may lead to more brain growth. Erlauer (2003) and Jensen believe that teachers
can create an enriched environment to enhance student learning.
Left-Brain and Right-Brain Teaching Strategies
Many educators believe that most contemporary schools are dominated by a
left-brain curriculum, and generally, teaching strategies and learning activities are based
primarily on a linear, sequential, and analytic way of thinking (Chapman, 1998;
Chudzinski, 1988; Cooke & Haipt, 1986; Grady, 1984; Lewallen, 1985; Marxer, 1988;
Rubenzer, 1982; Turner, 1999; Vitale, 1982). Vitale stated that each child has his own
learning style that is unique. Rubenzer pointed out that there is a need to close the gap
between left-brain teaching strategies and right-brain learning styles because the
left-brain educational system handicaps many children who prefer right-brain processing

37
strategies. Bruggenman and Wehrman (1987) claimed that in order to reach all students,
teachers should expand their teaching strategies to include activities for the left-, right-,
and whole-brained students. Reviewing the literature, Saleh (2001) mentioned that
matching teaching strategies to hemispheric styles will help students gain higher test
scores. Beck (2001) reviewed the literature and stated that students will increase
achievement when teaching strategies are compatible with their hemispheric preferences.
Lewallen reviewed research and stated that the two hemispheres of the brain could
function both simultaneously and independently. When they worked together and
complemented each other, people reached their highest achievement. According to
Williams (1983), in order for all students to have the maximum opportunity to learn,
educators must incorporate left-brain and right-brain teaching strategies. Beck suggested
that teachers should select appropriate strategies to meet diverse students’ hemispheric
preferences as well as stimulate both hemispheres to develop the whole brain.
Jackson (1998) claimed that there are particular teaching strategies for teaching to
the right hemisphere and left hemisphere. Reviewing the literature shows that the
left-brain strategies seem to be writing, reading, computation, and multiple-choice tests or
choosing only one solution (Jackson; Lewallen; 1985). The following right-brain
strategies were derived from a review of the literature: physical relaxation; visual
thinking, for example, ideas expressed via pictures, maps, diagrams, charts, mind maps,
illustrations, flow charts, and graphs; brainstorming; fantasy; direct experiences such as
field trips, manipulation of materials, primary sources, and real objects; simulation; role
playing; multisensory learning requiring visual, auditory, tactile, and kinesthetic senses;
music and rhythm; color discrimination; spatial imagery; creativity; art and design;

38
analogy and metaphor; poetry; meditation; and open-ended questions or allowing many
possible solutions (Bishop, 1978; Jackson; Lewallen; Marxer, 1988; Williams, 1983).
Beck (2001) analyzed three learning styles inventories—the 4MAT System, Dunn’s
Learning Style Inventory, and Renzulli and Smith’s Learning Style Inventory—and
classified approximately 80 teaching strategies into 8 categories which he linked to
learning styles and brain hemispheric preferences. After matching teaching strategies to
brain hemispheric preferences, he identified the following left-brain teaching strategies:
lecture, recitation, textual readings, oral or written reports, inquiry, experimenting,
problem solving, independent study, mastery learning, programmed learning, internet
search, word processing, convergent questions, and prompting questions. Right-brain
teaching strategies included round table, magic circle, fish bowl, brainstorming,
cooperative learning groups, gaming, dramatic and role play, video conferencing, creative
software, divergent questions, and probing questions. Although most of the teaching
strategies appear to be more compatible with either the left or right hemisphere,
technological teaching can be adaptable and bilateral. For example, knowledge-based
computer software would be more suitable for the left hemisphere, whereas creative
computer software would be more appropriate for the right hemisphere.
McCarthy (1987) presented a more refined definition for experimenting. That is,
experimenting is classified into left-brain and right-brain modes. Doing experiments
systematically with teacher control is a left-brain teaching strategy, whereas doing
experiments randomly with student control is a right-brain teaching strategy.

39
Table 2.3 was derived from an extensive review of the literature to provide a
comprehensive list of teaching strategies aligned with either left- or right- hemispheric
processing.
Left-Brain Teaching Strategies Right-Brain Teaching Strategies▪ Lecture ▪ Recitation ▪ Textual readings ▪ Oral reports ▪ Written reports ▪ Computation ▪ Multiple-choice tests ▪ Choosing only one solution ▪ Inquiry ▪ Systematic experiments with teacher control ▪ Problem solving ▪ Independent study ▪ Mastery learning ▪ Programmed learning ▪ Internet search ▪ Word processing ▪ Convergent questions ▪ Prompting questions
▪ Physical relaxation ▪ Visual thinking (e.g., pictures, maps, diagrams, charts, mind maps, illustrations, flow charts, and graphs) ▪ Brainstorming ▪ Fantasy ▪ Direct experiences (e.g., field trips, manipulation of materials, primary sources, and real objects) ▪ Random experiments with student control ▪ Simulation ▪ Multisensory learning requiring visual, auditory, tactile, and/or kinesthetic senses ▪ Music and rhythm ▪ Color discrimination ▪ Spatial imagery ▪ Creativity ▪ Art and design ▪ Analogy and metaphor ▪ Poetry ▪ Meditation ▪ Open-ended questions ▪ Allowing many possible solutions ▪ Round table ▪ Magic circle ▪ Fish bowl ▪ Cooperative learning groups ▪ Dramatic and role play ▪ Video conferencing ▪ Creative software ▪ Divergent questions ▪ Probing questions
Table 2.3: Left-brain and right-brain teaching strategies.

40
Hemisphericity and Achievement
Sonnier and Kemp (1980) conducted a study to investigate the effect of different
teaching strategies—left-brain, right-brain, and integrated-brain—on students’
achievement in science. The study included 130 fifth-grade students enrolled in five
sections of science. The students were randomly assigned to four groups: (a) instruction
emphasizing a textbook oriented, verbal, and a left-brain approach; (b) instruction
emphasizing demonstrations, activities, visual aids, and a right-brain approach; (c)
instruction involving both left-brain and right-brain methods, and an integrated-brain
approach; and (d) the control group that followed the procedures outlined in the textbook.
The results showed that there was no significant difference in science achievement for the
four groups.
Hider and Rice (1986) conducted a study to investigate the effect of varied
instructional strategies—left-brain, right-brain, and integrated-brain—on fifth- and
sixth-grade students’ achievement and attitude in science. The 65 students were randomly
assigned to four groups: (a) science instruction oriented toward a left-brain, textbook
approach; (b) science instruction oriented toward a right-brain, hands-on approach; (c)
science instruction oriented toward an integrated-brain approach, involving both left- and
right-brain methods; and (d) a control group with no instruction related to the science unit.
Pretest and posttest data were collected using the science achievement test and School
Subjects Attitude Scale scores. The results showed that significant gains in science
achievement were greatest for the left-brain, textbook approach group but this group
scored the lowest gains in attitude. In addition, results indicated that the significant gains
in attitude were greatest for the integrated-brain approach and this group also showed

41
significant gains in science achievement. It was concluded that elementary school science
teachers should alter their instruction to combine left-brain and right-brain activities. In
this way, both brain processing modes can be involved in a complementary manner in the
learning process to improve both the achievement and attitude of students in the
elementary school science classroom.
Van Giesen et al. (1987) conducted a study to determine if there was a difference in
the reading achievement scores of remedial reading students who were identified as
having different hemispheric preferences. The study included 64 fourth- and fifth-grade
students in a remedial reading program. The Gates-MacGinitie Reading Test, Level D
was used to measure students’ reading achievement. The Zenhausern Hemispheric
Cognitive Style survey was used to determine students’ hemispheric preferences. The
results showed that there was a significant difference in the scores on the reading
vocabulary achievement test between the left-brain group and the right-brain group and
the left-brain group and the integrated-brain group. That is, left-brain students achieved
greater on the reading vocabulary achievement test than did right-brain students or
integrated-brain students. In addition, the results indicated that there was no significant
difference in the scores on the reading comprehension achievement test scores among the
left-brain students, right-brain students, and the integrated-brain students. Finally, the
results showed that female students achieved significantly greater scores on both the
vocabulary and comprehension tests compared to male students.
Jarsonbeck (1984) conducted a study to examine the effects of right-brain
mathematics instruction on low achieving fourth-grade students. The 147 fourth-grade
students were randomly assigned either to the control group, left-brain instruction, or to

42
the experimental group, right-brain instruction. The results showed that more right-brain
preference students were in the lower achieving group, whereas more left-brain
preference students were in the higher achieving group. In addition, it showed that
students in the control group, left-brain instruction, achieved higher scores if they were
left-brain preference, whereas students in the experimental group, right-brain instruction,
achieved higher scores if they were right-brain preference. The study indicated the
importance of matching teaching strategies to student hemispheric preference.
Shannon and Rice (1983) conducted a study to examine if there was a difference in
hemispheric preference between high ability and low ability elementary school students.
The study included 70 students ranging from first grade to sixth grade. Thirty-seven
students were identified as high ability students and 33 were identified as low ability
students based on their WISC-RIQ scores. The Your Style of Learning and Thinking
(SOLAT), Form C-A was administered to measure students’ hemispheric preferences.
The results showed that there was a significant difference between the two groups for the
integrated-brain responses, with the high ability group having a higher preference for
integrated-brain responses. In addition, it showed that there was a significant difference
between the two groups for both the left- and right-brain responses, with the low ability
group having a higher preference for either left- or right-brain responses. In conclusion,
hemispheric preferences were related to student ability level. Low ability students tended
to have either a left-brain or right-brain preference while high ability students tended to
have an integrated-brain preference.

43
Fountain and Fillmer (1987) conducted a study to investigate the relationship
between hemispheric preference and academic achievement by studying 131 average and
above average fourth- and seventh-grade students. The Metropolitan Achievement Test
was used to measure students’ academic achievement and the Your Style of Learning and
Thinking (SOLAT) was used to assess students’ hemispheric preferences. The results
showed that there were no significant differences between fourth- and seventh-grade
students in hemispheric preferences. The results also indicated that a significantly greater
number of females compared to males had an integrated-brain preference. The
fourth-grade students with an integrated-brain preference scored significantly higher on
all four tests—reading, mathematics, language, and a basic battery of tests—compared to
fourth-grade students with either right-brain or left-brain preference. The seventh-grade
males with an integrated-brain preference scored significantly higher on both
mathematics and the basic battery of tests compared to seventh-grade females with an
integrated-brain preference. It was concluded that hemispheric preferences affect learning
and that some significant differences are related to gender.
Douglass (1979) used three methods to teach biology, and then conducted a study to
examine the effects of these instructional methods on students’ achievement in biology.
The study included 627 high school students, approximately half female and
approximately half male. The students were randomly assigned to three instructional
groups: inductive group, deductive group, and control group. The students in the two
experimental groups studied the same units on genetics and probability but were taught
by different teaching strategies—an inductive sequence or a deductive sequence. The
students in the control group studied units on mitosis, meiosis, and chromosomal

44
abnormalities; however, they were tested on the material on probability and genetics. The
Embedded Figures Test was given to the students to determine their analytical abilities,
the Otis-Lennon Mental Ability Test was given to the students to assess their general
intelligence, and pretest and posttest data were collected from achievement tests in
biology. The results showed that highly analytical students do better with inductive
methods and highly global students do better with deductive methods. It was concluded
that students are more academically successful in learning biology when the instructional
materials they use complement their style of thinking.
Brennan (1984) conducted a study to investigate the effects of hemispheric
preference (left/right), cognitive style (analytic/global), instructional method (congruent
with analytic cognitive style/congruent with global cognitive style), and gender
(female/male) upon mathematics achievement test scores. The study included 56
tenth-grade geometry students. The students were randomly assigned to four groups: two
matched groups (analytic cognitive style/analytic instructional method, global cognitive
style/global instructional method) and two mismatched groups (analytic cognitive
style/global instructional method, global cognitive style/analytic instructional method).
Zenhausern’s Differential Hemispheric Activation Test was administered to determine
students’ hemispheric preferences; Sigel’s Conceptual Styles Test was administered to
measure students’ cognitive style; two sets of instructional materials were developed; and
pretest, posttest, and delayed posttest data were collected using mathematics achievement
tests. The results showed that there were no significant differences between the pretest,
posttest, or delayed posttest mathematics achievement test mean scores for the
hemispheric preference groups (left/right), the cognitive style groups (analytic/global), or

45
female and male groups. The variable of matching and mismatching instructional method
with cognitive style did produce higher mathematics achievement test scores for the
matched groups, although not at a significant level.
Dunn et al. (1990) conducted a study to investigate the (a) effects of hemispheric
preference (successive/simultaneous) and instructional strategies (analytic/global) on
developmental college minority students’ mathematics achievement and attitudes and (b)
the relationships between students’ hemispheric preferences and their learning-style
preferences. Zenhausern’s Differential Hemispheric Activation Test was used to
determine students’ dominant hemispheres, a Semantic Differential Instrument was used
to measure students’ attitudes and perceptions related to instructional strategies, the
Productivity Environmental Preference Survey was used to measure students’
learning-style preferences, and pretest and posttest data were collected using mathematics
achievement tests. The results showed that the simultaneous students achieved
significantly higher with global instructional strategies that were congruent with their
hemispheric preferences than with analytical instructional strategies that were
incongruent with their hemispheric preferences. In addition, results indicated that the
successive students achieved higher with analytical instructional strategies that were
congruent with their hemispheric preferences than with global instructional strategies that
were incongruent with their hemispheric preferences, although not at a significant level.
Furthermore, results indicated that there were no significant attitudinal differences
between successive and simultaneous students when they were taught with instructional
strategies congruent or incongruent with their hemispheric preferences. Finally, the
relationships between hemispheric preferences and learning styles showed that

46
simultaneous students preferred sound, tactile learning, kinesthetic learning, intake, and
frequent mobility while studying, whereas successive students preferred bright light and a
formal design.
Gadzella (1995) conducted a study to assess the effects of hemispheric preferences
upon course grades of undergraduate psychology students. The Human Information
Processing Survey was given to the students to determine their hemispheric preferences:
left-dominant information processor, right-dominant information processor,
integrated-information processor, and mixed-information processor. In this study, there
were 49 subjects identified as having a mixed strategy and they were deleted from the
analysis. The final sample was 55 undergraduates enrolled in the psychology classes. The
class grades were based on five 40-item multiple-choice tests and one written discussion
paper. The results showed that there were significant differences between left-brain
preference and right-brain preference groups with the left-brain preference group
obtaining higher course grades. The course grades did not differ significantly for the
integrated-brain group compared to left-brain and right-brain groups.
Summary
Research has shown that there are sex differences in the brain structure (Gur et al.,
1999; Halpern, 2000; Moir & Jessel, 1992; Sax, 2005); brain development (Berlin, 1978;
Gurian et al., 2001; James, 2007; Levy & Heller, 1992; Lindelow, 1983; Rose, 1982; Sax,
2005; Sonnier, 1982); and brain performance (Hyde, 1981, 1990; Linn & Petersen, 1985;
Voyer et al., 1995). But more research is needed to find more consistent differences in
these aspects of the brain. Research also has provided evidence to demonstrate the age for
the emergence of sex differences in some specific cognitive tasks; however, some of

47
these results related to age and gender differences are inconsistent. Thus, there is the need
for much more research exploring the maturational differences and gender differences for
specific cognitive tasks.
The brain is continually developing from the prenatal period through life. The
process of brain development is not fixed but it is dynamic—exhibiting great plasticity
(Diamond, 1988). Experiences and an enriched environment can change the physical
structure and growth of the brain and influence learning. Teachers can use many
enrichment practices to enhance student learning (Erlauer, 2003; Jensen, 1998).
Studies have revealed the effects of varied instructional practices related to
hemispheric preferences on student achievement and student attitude (Brennan, 1984;
Dunn et al., 1990; Fountain & Fillmer, 1987; Gadzella, 1995; Jarsonbeck, 1984; Van
Giesen et al., 1987); however, some of these results appear to be inconsistent (Brennan;
Sonnier & Kemp, 1980). Thus, more research is needed to explore the effects of
instructional practices related to hemispheric preferences on student achievement and
student attitude.
Most people have a preferred (or dominant) hemisphere, and this hemispheric
preference affects personality, abilities, and learning style (Sousa, 2006). Each child is
unique. However, most contemporary schools are dominated by a left-brain curriculum,
left-brain teaching strategies, and left-brain learning activities (Chapman, 1998;
Chudzinski, 1988; Cooke & Haipt, 1986; Grady, 1984; Lewallen, 1985; Marxer, 1988;
Rubenzer, 1982; Turner, 1999; Vitale, 1982). Teachers can greatly influence the learning

48
environment for students to impact and improve student learning. Thus, exploring the
relationships between hemispheric preferences, teaching practices, and learning may
provide greater insight to improve teaching and learning.
In conclusion, understanding the relationships between teacher variables
(hemispheric preferences and teaching strategies) and student variables (gender, grade
level, hemispheric preferences, spatial ability, verbal ability, science achievement, and
attitudes toward science class) may provide valuable implications for education. The next
chapter will describe the methodology used in this study to explore these relationships.

49
CHAPTER 3
METHODOLOGY
This chapter is divided into two parts: the construction and validation of teacher and
student instruments and the investigation of the variables of interest. Various instruments
were acquired from commercial vendors or developed by the researcher, translated into
Chinese, and analyzed for validity and reliability for use with elementary school science
teachers and students in Taiwan, and then these validated instruments were employed in
the subsequent investigation. The description of the construction and validation of the
teacher and student instruments includes participants, context, teacher data sources, and
student data sources. Only the instruments developed by the researcher are available in
the Appendices. All commercial instruments are copyrighted and permission to use them
was provided by the publishers. The next section, the main study, explores the
relationships among the variables of interest. Participants, research design, data collection
procedures, and data analysis procedures are described. Pseudonyms are used to identify
all teachers and schools.
Construction and Validation of Instruments
Subjects
The participants for the construction and validation of instruments included 35
undergraduate students, 35 graduate students, 39 elementary school science teachers, and

50
199 elementary school students in Taiwan. The 35 undergraduate and 35 graduate
students were from Wen University in Taiwan. The 35 undergraduate students were from
the Department of Life Science and the 35 graduate students were from the Graduate
Institute of Statistics. The 39 elementary school science teachers were from three large
urban elementary schools in Taiwan. Fourteen of the 39 science teachers were from Liang
elementary school, 12 of the 39 science teachers were from Gong elementary school, and
13 of the 39 science teachers were from Jean elementary school. The 199 elementary
school students were from Liang elementary school, 98 fourth-grade students and 101
fifth-grade students. The elementary school students were 9- to 11-years-old.
Context
Wen University was founded in 1915 in China, and then was re-established in
Taiwan in 1962. The school is located in a suburb area in Jhongli city in Taiwan. Wen
University has developed into a comprehensive university and has gained an international
reputation for research and academic excellence. Wen University has now become
Taiwan’s leading school in the fields of geophysics and space science, and was selected
as one of the major research-oriented universities in 2001.
Liang elementary school was founded in 1899, the oldest elementary school in
Taiwan. This school is located in a commercial and cultural city in Taiwan, surrounded by
various kinds of stores and cultural heritage buildings. Currently, there are 98 classes and
3,040 students. Most parents are of a high socioeconomic status. The school is recognized
for the science performance of its students. The school has played a leading role in
sharing good practices and teaching resources in Taiwan.

51
Gong elementary school was founded in 1976. The school set a record for having
224 classes and 12,000 students, the largest elementary school in the world. Although the
school is very large, the school is very well organized. The school is located in a
commercial and residential city in Taiwan. Currently, there are 133 classes and 4,415
students. Most parents are of a high socioeconomic status. The school is noted for
outstanding student achievement in the fields of music education and physical education.
Jean elementary school was founded in 1954. The school is located in a commercial
and residential city in Taiwan. Currently, there are 96 classes and 3,226 students. Most
parents are blue collar workers with a low socioeconomic status. The school is
recognized for outstanding student achievement in the field of physical education.
Table 3.1 provides a summary of participants and context for the construction and
validation of instruments.

52
Subjects Level n Location
Department of Life Science students
Undergraduate 35 Wen University
Graduate Institute of Statistics students
Graduate 35 Wen University
Science teachers Elementary (Grades 1-6)
14 Liang Elementary School
Science teachers Elementary (Grades 1-6)
12 Gong Elementary School
Science teachers Elementary (Grades 1-6)
13 Jean Elementary School
Grade 4 98Elementary school students
Grade 5 101
Liang Elementary School
Table 3.1: A summary of subjects and context for the construction and validation of teacher and student instruments.
Teacher Data Sources
Human Information Processing (HIP) Survey
The Human Information Processing (HIP) Survey was developed by Torrance,
Taggart, and Taggart (1984a) to measure hemispheric preference. The survey was
developed for use with adults. The administration of the survey is not timed. It consists of
40 items with three forced-choice selections for each item. Respondents choose one of
three statements. Each item has a left, right, and integrated alternative response.

53
The following is an example from the HIP Survey:
A solve problems logically, rationally
B solve problems intuitively
C equally skilled in solving problems intuitively and logically
The choice of the first statement is scored on the left-brain scale, the choice of the second
statement is scored on the right-brain scale, and the choice of the third statement is scored
on the integrated-brain scale. According to the manual (Taggart & Torrance, 1984), the
scoring procedure involves counting the number of left-brain, right-brain, and
integrated-brain responses, recording the raw scores on profile sheets, and then
converting them to standard scores and percentiles. According to the strategy and tactics
profiles booklet (Torrance, Taggart & Taggart, 1984b), the standard score shows the
person’s brain processing strategy—left, right, integrated, or mixed. If the standard score
equals or exceeds 120 for left, right, or integrated, then the person is described as having
that processing strategy. The left-dominant information processor prefers to deal with
problems in an active, verbal, and logical manner. The right-dominant information
processor prefers to deal with problems in a receptive, spatial, and intuitive manner. The
integrated-information processor operates simultaneously in the left and right mode of
processing without a clear preference for either. If the standard score is less than 120 for
all three, then the person is described as having a mixed strategy. The mixed-information
processor uses either a left-dominant or a right-dominant strategy depending on the
situation.
Reliability and validity statistics for the HIP Survey have been reported in the
Human Information Processing Survey Administrator’s Manual (Taggart & Torrance,

54
1984). An alternate forms reliability study incorporating a 1-week interval between the
alternate forms, HIP Survey and Form A of SOLAT for adults, resulted in reliability
coefficients of .84 for the right-brain scale, .86 for the left-brain scale, and .82 for the
integrated-brain scale. Based upon a review of a large body of literature related to the
validity of the HIP Survey, Taggart and Torrance concluded that the HIP Survey met the
criteria for construct validity, concurrent validity, and predictive validity.
The HIP Survey used in the current study was translated into Chinese. The
researcher translated the English version of the survey into Chinese and then it was
back-translated by a bilingual professional translator. This translation and
back-translation process was repeated to develop the final form of the instrument. In
addition, content experts evaluated how well each item translated into Chinese
represented what it was intended to measure based upon the original English item. The
bilingual Chinese-English panel was composed of two faculty members and one doctoral
student in science education as well as one fourth-grade teacher and one fifth-grade
teacher. The panel members suggested some specific Chinese words to ensure the
meaning of the original English item. The panel members’ feedback was collected and
then used to revise the Chinese translation of the items.
The Chinese version of the HIP Survey was administered to 35 undergraduate
students and 35 graduate students at Wen University in northern Taiwan and 39 science
teachers from Liang, Gong, and Jean elementary schools in northern Taiwan during late
September to early October 2007. Cronbach’s alpha (n = 109) for the Chinese version of
the Human Information Processing Survey was 0.81 for the left-brain scale, 0.78 for the
right-brain scale, and 0.86 for the integrated-brain scale.

55
Table 3.2 is provided to summarize the Cronbach’s alpha coefficients for the Human
Information Processing (HIP) Survey.
Instrument No. of Items
No. of Subjects
Scales Cronbach’s Alpha
Left-Brain Scale 0.81
Right-Brain Scale 0.78
Human Information Processing (HIP) Survey
40 109
Integrated-Brain Scale 0.86
Table 3.2: Cronbach’s alpha coefficients for the Human Information Processing (HIP) Survey scales.
Student Data Sources
Style of Learning and Thinking (SOLAT, Elementary Form)
The Style of Learning and Thinking (SOLAT, elementary form) developed by
Torrance in 1988 is a self-report inventory consisting of 25 items designed to determine
hemispheric preference. For each item, there are two statements. There are four possible
ways to respond—choose one of two statements, both statements, or neither statement.
The following is an example:
I like to learn from pictures.
I like to learn from words.
The choice of the first statement is scored on the right-brain scale; the choice of the
second statement is scored on the left-brain scale; choosing both statements is scored on
the whole-brain scale. According to the manual (Torrance, 1988), the scoring procedure

56
involves counting the number of left-, right-, and whole-brain responses, recording the
raw scores on profile sheets, and then converting them to standard scores and percentiles.
A standard score of 120 is considered a dominant pattern.
The SOLAT elementary form was developed for use with grades K through 5 and it
is appropriate for group administration in grades 1 through 5. Administration time is
approximately 30-40 minutes. It can be administered to kindergarteners, but this is not
recommended because they have barely begun to lateralize.
Reliability and validity statistics for the SOLAT elementary form have been reported
in the Style of Learning and Thinking Administrator’s Manual (Torrance, 1988).
Cronbach’s alpha was 0.77 for the left-brain scale and 0.73 for the right-brain scale. No
reliability data was reported for the whole-brain scale. Not much has been found in the
literature regarding the validity of the SOLAT elementary form. However, as Torrance
pointed out, its validity primarily rests on the validity evidence accumulated from a few
older versions of the SOLAT.
The SOLAT elementary form used in the current study was translated into Chinese.
The researcher translated the English version of the inventory into the Chinese version
and then it was back-translated by a bilingual professional translator. This translation and
back-translation process was repeated to develop the final form of the instrument. In
addition, content experts evaluated how well each item represented what it was intended
to measure based upon the original English item. The bilingual Chinese-English panel
was composed of two faculty members and one doctoral student in science education as
well as one fourth-grade teacher and one fifth-grade teacher. The panel members

suggested some specific Chinese words to ensure the meaning of the original English
item. The panel members’ feedback was collected and then used to revise the Chinese
translation of the items.
The Chinese version of the SOLAT was administered to 98 fourth-grade students
and 101 fifth-grade students from Liang elementary school in northern Taiwan during late
October to late November in 2007. Cronbach’s alpha (n = 199) for the Chinese version of
the SOLAT was 0.75 for the left-brain scale, 0.74 for the right-brain scale, and 0.83 for
the whole-brain scale.
PMA Spatial Relations Test (Grades 4-6)
The Spatial Relations Test of the Primary Mental Abilities (PMA) tests (Thurstone,
1962) , appropriate for grades 4-6, is designed to determine students’ ability to visualize
how parts of objects or figures fit together, what their relationships are, and what they
look like when rotated in space. The subject is presented with one figure and four choices.
For example, the subject is presented with a triangle and is directed to choose one figure
that would complete a square (see the following example).
( ) ( ) ( ) ( )
57

58
The test consists of 25 items. There is a 6-minute time limit on this test. The choice
of a right answer is scored 1 point for each item. The scores are added to give a total
spatial ability score for each subject. These scores are added together to give an overall
score ranging from 0 to 25. Higher total scores indicate better spatial ability.
Reliability and validity statistics for the PMA Spatial Relations Test have been
reported in the PMA technical report (Thurstone, 1965). The test was standardized on
4,266 subjects ranging in age from 8- to 15-years-old. The test-retest reliability
coefficient for the Spatial Relations Test after a 1-week interval was 0.75 for fourth-grade
students, 0.87 for fifth-grade students, and .68 for sixth-grade students. After a 4-week
interval, the test-retest reliability coefficient was 0.65 for fourth-grade students, 0.72 for
fifth-grade students, and 0.67 for sixth-grade students.
The directions for the PMA Spatial Relations Test used in the current study were
translated into Chinese. The researcher translated the English version of the directions for
the PMA Spatial Relations Test into Chinese and then it was back-translated by a
bilingual professional translator. This translation and back-translation process was
repeated to develop the final form of the instrument. In addition, content experts
evaluated how well the Chinese translation of the directions represented the original
English directions. The bilingual Chinese-English panel was composed of two faculty
members and one doctoral student in science education as well as one fourth-grade
teacher and one fifth-grade teacher. The panel members suggested some specific Chinese
words to ensure the meaning of the original English directions. The panel members’
feedback was collected and then used to revise the Chinese translation of the directions.

59
The Chinese version of the PMA Spatial Relations Test was administered to 98
fourth-grade students and 101 fifth-grade students from Liang elementary school in
northern Taiwan during late October to late November in 2007. Cronbach’s alpha
(n = 199) for the Chinese version of the PMA Spatial Relations Test was 0.64 for
fourth-grade students and 0.79 for fifth-grade students.
Student Attitudes Toward Science Class Survey
The definition of student attitudes toward science class was modified from Dhindsa
and Chung’s (2003) definition of student attitudes toward science. They identified six
attitudinal constructs related to student attitudes toward science: (a) science
enjoyment—the extent to which a student enjoys a science lesson, (b) science
anxiety—the extent to which a student is anxious about a science lesson, (c) science
interest—the extent to which a student develops interest in science and its related
activities, (d) science confidence—the extent to which a student is confident and
successful doing science, (e) science motivation—the extent to which a student is
motivated to learn and pursue science in the future, and (f) importance of science—the
extent to which a student perceives science to be important in everyday life and a
worthwhile activity. The current study defined student attitudes toward science class in
terms of three constructs: (a) science enjoyment—the extent to which a student enjoys a
science class, (b) science confidence—the extent to which a student is confident and feels
successful doing science, and (c) importance of science—the extent to which a student
perceives science to be important in everyday life and a worthwhile activity.
The Student Attitudes Toward Science Class Survey is designed to measure student
attitudes toward science class. The 32 items were derived from other available surveys

60
(Fahey, 1992; Henry, 1996; Lee, 2005; Lewis, 2001; Monhardt, 1998; Moore, 2001;
Sager, 1996; Smith, 1991) and modified to make them suitable for elementary school
students in Taiwan. Table 3.3 provides a description and sample item for each construct in
the Student Attitudes Toward Science Class Survey.
Construct Description Sample Item
Enjoyment Extent to which a student enjoys a science class.
My science class is interesting.
Confidence Extent to which a student is confident and feels successful doing science.
I am afraid to answer questions in science class.
Importance Extent to which a student perceives science to be important in everyday life and a worthwhile activity.
Science class is a waste of time.
Table 3.3: Description and sample item for each construct in the Student Attitudes Toward Science Class Survey.
In addition, some commonly used teaching materials and teaching strategies for
science teaching in Taiwan were embedded in the items for each of the three constructs.
These teaching materials included materials such as the textbook, workbook, DVD film,
and poster. Teaching strategies included the use of experiments, lectures, learning groups,
and informal environments (e.g., field trip, playground). A balance of positive (n = 16)
and negative (n = 16) statements were generated and distributed among the teaching
materials, teaching strategies, and the three constructs: science enjoyment, science

61
confidence, and importance of science. Each item was assigned a unique number through
a random number generator. Table 3.4 provides a distribution of positive (+) and negative
(-) items among the teaching materials, teaching strategies, and the three constructs.
Teaching Materials/ Strategies
Enjoyment
Confidence
Importance
General Item 17+
Item 32+
Item 25-
Item 13-
Item 21+ Item 20- Item 22+
Item 4+
Item 18-
Item 15-
Science textbook Item 9+ Item 26+ Item 12-
Science workbook Item 10- Item 27- Item 7+
DVD film Item 19- Item 28+
Poster Item 16+ Item 23-
Experiment Item 24+ Item 1- Item 5+ Item 2-
Lecture Item 3+ Item 6- Item 31+
Learning groups Item 11- Item 8+
Informal environments
Item 14+ Item 29- Item 30-
Subtotal 7+ 7- 5+ 5- 4+ 4-
Table 3.4: Distribution of positive (+) and negative (-) items among the teaching materials, teaching strategies, and the three constructs of the Student Attitudes Toward Science Class Survey.

62
The following are some examples from the Student Attitudes Toward Science Class
Survey:
During science class, I like to read science posters.
In science class, science posters do not help me to learn science.
In science class, doing experiments is boring.
I like to do experiments in science class.
The Student Attitudes Toward Science Class Survey is a 5-point Likert-type
instrument designed to measure the strength of a student’s attitudes toward science class
(see Appendix A). The instrument contains 16 positive and 16 negative statements, for a
total of 32 items. The values recorded for the positive items are Strongly Disagree = 1,
Disagree = 2, Undecided = 3, Agree = 4, and Strongly Agree = 5. The values recorded for
the negative items are Strongly Agree = 1, Agree = 2, Undecided = 3, Disagree = 4, and
Strongly Disagree = 5. The scores for the recorded positive and negative statements were
added together to give a total attitude score for each participant, ranging from 32 to 160.
The higher the total score, the more positive is the attitude of the respondent toward
science class and the lower the total score, the less positive is the attitude of the
respondent toward science class.
The Student Attitudes Toward Science Class Survey used in the current study was
translated into Chinese. The researcher translated the English version of the survey into
Chinese and then it was back-translated by a bilingual professional translator. This
translation and back-translation process was repeated to develop the final form of the
instrument. In addition, content experts evaluated how well each item represented what it
was intended to measure based upon the definition of the specific constructs of science

63
enjoyment, science confidence, and importance of science. The bilingual Chinese-English
panel was composed of two faculty members and one doctoral student in science
education as well as one fourth-grade teacher and one fifth-grade teacher. The panel
members suggested some specific Chinese words to ensure the meaning of the original
English item. The panel members’ feedback was collected and then used to revise the
Chinese translation of the items.
The Chinese version of the Student Attitudes Toward Science Class Survey was
administered to 98 fourth-grade students and 101 fifth-grade students from Liang
elementary school in northern Taiwan from late October to late November in 2007. In the
principal components analysis of the 32 items, factors generating eigenvalues 1.00 or
higher were rotated by varimax rotation and revealed one major factor—the final version
of the survey consisting of all 32 items in one scale. Cronbach’s alpha (n = 199) for the
Chinese version of the Student Attitudes Toward Science Class Survey was 0.90.

64
Table 3.5 is provided to summarize the Cronbach’s alpha coefficients for the student
instruments.
Instrument No. of Items
No. of Subjects
Scale/Group Cronbach’s Alpha
Left-Brain Scale 0.75
Right-Brain Scale 0.74
Style of Learning and Thinking (SOLAT) Inventory
25 199
Whole-Brain Scale 0.83
98 Grade 4 0.64 PMA Spatial Relations Test 25
101 Grade 5 0.79
Student Attitudes Toward Science Class Survey
32 199 0.90
Table 3.5: Cronbach’s alpha coefficients for student instruments.
Main Study
Participants
The main study included 4 elementary school science teachers and 133 fourth- and
fifth-grade students, 65 fourth graders from two classes and 68 fifth graders from two
classes during the 2007 fall semester. The four classes were taught by the four science
teachers respectively. All the teachers and students were from Liang elementary school
located in northern Taiwan. The elementary school students were 9- to 11-years-old.
Table 3.6 shows the demographic information for the elementary school science
teachers and students for the 4 classes, including teacher name, teacher gender, grade

65
level, number of male and female students for each class, marginal totals, and grand total.
One male teacher and one female teacher taught each grade level. Approximately 50% of
the students were males and approximately 50% of the students were females in each
class.
Students Teacher Name
Teacher Gender
Grade Level
Males n
Females n
Total
John Male 4 17 15 32
Betty Female 4 17 16 33
Subtotal 34 31 65
Peter Male 5 17 18 35
Lucy Female 5 17 16 33
Subtotal 34 34 68
Total 68 65 133
Table 3.6: Demographic information for Liang elementary school science teachers (n = 4) and elementary school students (n = 133).
Research Design
The purpose of this mixed methods study was first to investigate the relationships
among teacher hemispheric preference, student hemispheric preference, student spatial
ability, student verbal ability, student science achievement, and student attitudes toward
science class using student and teacher data from multiple instruments. The second

66
purpose was to identify teaching strategies in the science classroom using observation
data and matching these teaching strategies to teacher and student hemispheric
preferences.
The basic assumption for a mixed methods design is that the combination of
quantitative and qualitative data provides a better understanding of the research questions
than either quantitative or qualitative data by itself (Creswell, 2008). In the current study,
quantitative data, such as scores on surveys, yield specific numbers that can be
statistically analyzed and can produce results to describe the relationships among
variables. In addition, qualitative data, such as classroom observations can explore
teaching strategies in further depth. The rationale for the study is that a mixed methods
study provides a better understanding of the research questions by converging on both
broad numeric trends from quantitative research and the detail of qualitative research.
Data Collection Procedures
In the main study, instruments were used to obtain teacher demographic information
and to develop teacher hemispheric preference profiles. In addition, classroom
observations were used to identify the teaching strategies employed by each teacher.
Furthermore, instruments were used to explore student hemispheric preference, assess
spatial ability, measure verbal ability, measure science achievement, and measure student
attitudes toward science class.
Teacher Data Collection
Data collection: Teacher Demographics Questionnaire. The Teacher Demographics
Questionnaire was developed by the researcher to obtain teacher background information
including name, class, gender, age, type of degree, major, current teaching grade(s),

67
current teaching subject(s), number of years teaching science, and number of years
teaching. See Appendix B for a copy of the Teacher Demographics Questionnaire. During
early October 2007, the Teacher Demographics Questionnaire was administered to 4
elementary school science teachers in Liang elementary school to obtain background
information.
Data collection: Human Information Processing Survey. During early October 2007,
the Human Information Processing (HIP) Survey was administered to 4 elementary
school science teachers in Liang elementary school to determine their hemispheric
preferences. The science teachers were identified as left-brain, right-brain,
integrated-brain, or mixed-brain preference according to the HIP results.
Data collection: Classroom observations. Classroom observations were conducted
for the main study. Classroom observations focused on science teaching strategies.
Before beginning the classroom observations, a list of science teaching strategies was
generated based upon an extensive literature review (see Table 2.3). During classroom
observations, the preliminary list was used as a reference to identify science teaching
strategies. A timer was also used during classroom observations because the current study
focused upon the specific time for each teaching strategy. A classroom observation
schedule for observing the 4 elementary school science teachers was established (see
Table 3.7).

68
Monday Tuesday Wednesday Thursday Friday
8:40- 9:20 John Betty
9:30-10:10 John Betty
10:30-11:10 Lucy Betty John
11:20-12:00 Peter
1:20- 2:00 Peter Lucy
2:10- 2:50 Peter Lucy
3:10- 3:50
Table 3.7: Classroom observation schedule for the 4 elementary school science teachers.
Lesson topics and total number of class sessions for observing the 4 elementary
school science teachers were identified (see Table 3.8). The total number of
observations for each teacher was 8 class sessions from early October to the middle of
November in 2007. Each class session was 40 minutes.
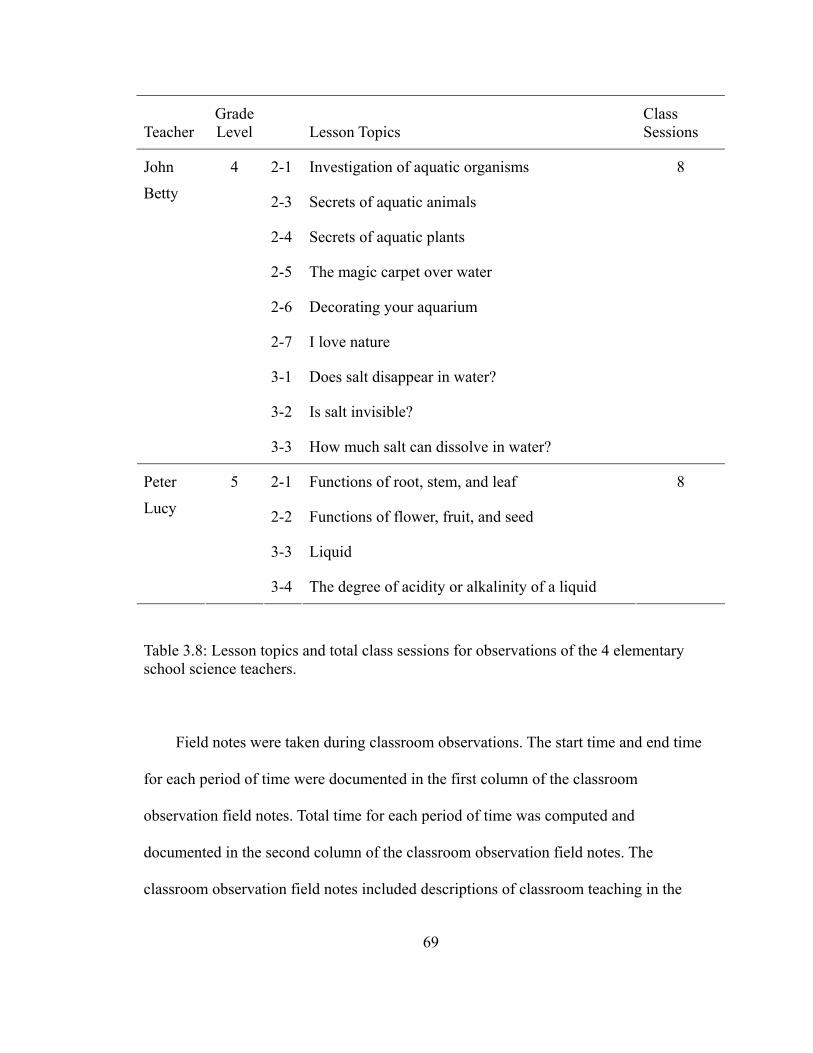
69
Teacher Grade Level
Lesson Topics Class Sessions
2-1 Investigation of aquatic organisms
2-3 Secrets of aquatic animals
2-4 Secrets of aquatic plants
2-5 The magic carpet over water
2-6 Decorating your aquarium
2-7 I love nature
3-1 Does salt disappear in water?
3-2 Is salt invisible?
John
Betty
4
3-3 How much salt can dissolve in water?
8
2-1 Functions of root, stem, and leaf
2-2 Functions of flower, fruit, and seed
3-3 Liquid
Peter
Lucy
5
3-4 The degree of acidity or alkalinity of a liquid
8
Table 3.8: Lesson topics and total class sessions for observations of the 4 elementary school science teachers.
Field notes were taken during classroom observations. The start time and end time
for each period of time were documented in the first column of the classroom
observation field notes. Total time for each period of time was computed and
documented in the second column of the classroom observation field notes. The
classroom observation field notes included descriptions of classroom teaching in the

70
middle column. Teaching Strategy Code, Teaching Strategy Category, and Category
Abbreviation appear in the final columns of the classroom observation field notes and
were completed after all classroom observations were completed and analyzed. Table
3.9 provides an example of the classroom observation field notes.
Session 1: 34 minutes 50 seconds Grade: 4 Teacher: Betty Gender: Female Activity: 2-1 Investigation of aquatic organisms Date: Oct-12-2007 (Friday) Time: 8:40~9:20
Start time End time
Subtotal Time
min sec min sec
Description Teaching Strategy Code
Teaching Strategy Category
Category Abbreviation
0: 1:
00 00
1: 00 Students read textbooks
1: 2:
00 22
1: 22 Lecture
2: 2:
22 58
0: 36 Lecture (explain science posters on the back board)
2: 3:
58 16
0: 18 Lecture (explain science pictures on the back board)
3: 8:
16 46
5: 30 Lecture (explain science posters on the back board)
8: 8:
46 57
0: 11 Teacher demonstration by real objects
8: 27:
57 23
18: 26 Lecture (explain the content of science posters) one by one
27: 27:
23 59
0: 36 Students read textbooks aloud
27: 31:
59 50
3: 51 Lecture
31: 34:
50 50
3: 00 DVD film on TV
Table 3.9: An example of the classroom observation field notes before coding and categorizing.

71
Student Data Collection
Data collection: Style of Learning and Thinking. During late November in 2007,
the Style of Learning and Thinking (SOLAT, Elementary Form) was administered to
133 students in Liang elementary school, 65 in fourth grade and 68 in fifth grade, to
determine student hemispheric preference. The students were identified as left-brain,
right-brain, or whole-brain preference according to their responses to the SOLAT.
Data collection: PMA Spatial Relations Test. During late November in 2007, the
PMA Spatial Relations Test was administered to 133 students in Liang elementary school,
65 in fourth grade and 68 in fifth grade, to measure student spatial ability as an indicator
of right-hemispheric processing. A total spatial score indicated a student’s ability to
visualize how parts of objects or figures fit together, what their relationships are, and
what they look like when rotated in space.
Data collection: Chinese language midterm and final exams. In each semester, a
midterm and a final exam are administered in each public elementary school in Taiwan
to assess student Chinese language ability. All students in a school complete the test on
a specific day and at a specific time; students in each grade take the same test at the
same time. The Chinese language exam in elementary schools in Taiwan usually
includes different types of questions such as identifying words and phrases, making
sentences, applying grammar, and reading comprehension. In the current study, the sum
of the scores on the midterm and final exams were used to determine verbal ability as an
indicator of left-hemispheric processing. With regard to grade 4, a total of 27 questions
on the midterm exam were worth 100 points and a total of 43 questions on the final
exam were worth 100 points. With regard to grade 5, a total of 60 questions on the

72
midterm exam were worth 100 points and a total of 55 questions on the final exam were
worth 100 points. The Chinese language midterm and final exams were administered to
133 elementary school students in Liang elementary school early in November of 2007
and early in January of 2008, respectively.
Data collection: Science midterm and final exams. In each semester, a midterm and
a final exam are administered in each public elementary school in Taiwan to assess
student science achievement. All students in a school complete the test on a specific day
and at a specific time; students in each grade take the same test at the same time. The
sum of the scores on the midterm and final exams measures science achievement. With
regard to grade 4, a total of 77 questions on the midterm exam were worth 100 points
and a total of 61 questions on the final exam were worth 100 points. With regard to
grade 5, a total of 25 questions on the midterm exam were worth 100 points and a total
of 25 questions on the final exam were worth 100 points. The Science midterm and final
exams were administered to 133 elementary school students in Liang elementary school
early in November of 2007 and early in January of 2008, respectively.
Data collection: Student Attitudes Toward Science Class Survey. Late in November
of 2007, the Student Attitudes Toward Science Class Survey was administered to 133
students in Liang elementary school, 65 in fourth grade and 68 in fifth grade, to measure
their attitudes toward science class. A total attitude score reflected the strength of a
student’s attitudes toward science class in terms of three constructs: science enjoyment,
science confidence, and importance of science.

73
Data Analysis Procedures
This section is organized into three parts. Part one describes the data analyses for
teacher data including descriptive statistics related to the Teacher Demographics
Questionnaire and the Human Information Processing Survey. In addition, coding and
categorizing data and descriptive statistics for the classroom observations are described.
Part two describes the data analyses for student data including descriptive statistics for
the Style of Learning and Thinking (SOLAT). Also, Pearson Product Moment
Correlations, Multivariate Analysis of Variance (MANOVA), and Analysis of Variance
(ANOVA) for student data from multiple instruments are described. Part three describes
the data analyses for teacher data and student data including Confidence Intervals for
Proportion tests for teaching strategies from the classroom observations and student
hemispheric preferences from the Style of Learning and Thinking (SOLAT).
Teacher Data Analyses
Data analysis: Teacher Demographics Questionnaire. For the 4 elementary school
science teachers’ responses to the Teacher Demographics Questionnaire, descriptive
statistics were computed. A table was developed to display teacher background
information including teacher pseudonym, gender, current teaching grade, age, major,
number of years teaching science, and total number of years teaching. English names
were chosen as pseudonyms to easily identify a male or female teacher.
Data analysis: Human Information Processing Survey. For the 4 elementary school
science teachers’ responses to the Human Information Processing (HIP) Survey,

74
descriptive statistics were computed. A table was developed to display teachers’ standard
scores on the three scales (left-brain, right-brain, and integrated-brain) and teachers’
hemispheric preferences.
Data analysis: Classroom observations. Observations were conducted in the
classrooms of the 4 elementary school science teachers. The field notes from the
classroom observations were recorded in Chinese and then translated into English. The
preliminary list derived from an extensive literature review included 18 types of left-brain
teaching strategies and 27 types of right-brain teaching strategies (see Table 2.3). The
preliminary teaching strategies were used as guidelines to code and categorize the
classroom observation field notes as a left-brain teaching strategy, a right-brain teaching
strategy, or a whole-brain teaching strategy. If a left-brain teaching strategy and a
right-brain teaching strategy were used simultaneously, this combined teaching strategy
was identified as a whole-brain teaching strategy. All teaching strategies were categorized
and grouped as left-brain, right-brain, or whole-brain teaching strategies. A list of
abbreviations was generated for all teaching strategies. Based on the coding results and
total time, a percent of instructional time for each of the three types of teaching
strategies—left-brain, right-brain, and whole-brain—was calculated for each teacher. The
percentage for each of the three types of teaching strategies for the 4 elementary school
science teachers was presented in tables and bar graphs. Table 3.10 provides an example
of the classroom observation field notes, including Teaching Strategy Code, Teaching
Strategy Category, and Category Abbreviation.

75
Session 1: 34 minutes 50 seconds Grade: 4 Teacher: Betty Gender: Female Activity: 2-1 Investigation of aquatic organisms Date: Oct-12-2007 (Friday) Time: 8:40~9:20
Start time End time
Subtotal Time
min sec min sec
Description Teaching Strategy Code
Teaching Strategy Category
Category Abbreviation
0: 1:
00 00
1: 00 Students read textbooks Textual readings
Left Brain L2
1: 2:
00 22
1: 22 Lecture Lecture Left Brain L1
2: 2:
22 58
0: 36 Lecture (explain science posters on the back board)
Lecture Visual aids
Whole Brain W2
2: 3:
58 16
0: 18 Lecture (explain science pictures on the back board)
Lecture Visual aids
Whole Brain W2
3: 8:
16 46
5: 30 Lecture (explain science posters on the back board)
Lecture Visual aids
Whole Brain W2
8: 8:
46 57
0: 11 Teacher demonstration by real objects
Demonstration
Right Brain R1
8: 27:
57 23
18: 26 Lecture (explain the content of science posters) one by one
Lecture Visual aids
Whole Brain W2
27: 27:
23 59
0: 36 Students read textbooks aloud
Textual readings
Left Brain L2
27: 31:
59 50
3: 51 Lecture Lecture Left Brain L1
31: 34:
50 50
3: 00 DVD film on TV Film projection
Whole Brain W1
Table 3.10: An example of the classroom observation field notes after coding and categorizing. Student Data Analyses
Data analysis: Style of Learning and Thinking. For student responses to the Style
of Learning and Thinking, descriptive statistics (n = 133) were computed. The

percentage for each student hemispheric preference—left-brain preference, right-brain
preference, whole-brain preference, and no hemispheric preference—was presented in
tables according to class, grade level, and gender.
Data analysis: Student multiple instruments. Based upon the scores of 133
elementary school students on the Style of Learning and Thinking, PMA Spatial
Relations Test, Chinese language exams, Science exams, and Student Attitudes Toward
Science Class Survey, descriptive statistics were first computed—means and standard
deviations were presented in tables according to gender and grade level to describe
general tendencies and the spread of scores on the surveys.
Next, Pearson Product Moment Correlations were computed to examine the
relationships among gender (male, female), grade level (fourth grade, fifth grade), student
hemispheric preference, spatial ability, verbal ability, science achievement, and student
attitudes toward science class. The correlation coefficients for the selected variables were
presented in matrices. Pearson product moment correlation coefficients determine the
strength and direction of the linear relationship between two variables. Relationships
between variables were tested at the .05p < level of significance.
Lastly, a two-way MANOVA was computed to determine gender and grade level
differences for left-brain scale scores, right-brain scale scores, whole-brain scale scores,
PMA Spatial Relations Test scores, Chinese language exam scores, Science exam scores,
and Student Attitudes Toward Science Class Survey scores. The follow-up ANOVA was
computed to further understand the main effects.
76

77
Teacher and Student Data Analyses
Data analysis: Classroom observations and Style of Learning and Thinking. To
match teaching strategies to student hemispheric preferences, Confidence Intervals for
Proportion tests were computed based upon teacher data from classroom observations
and student data from the Style of Learning and Thinking (SOLAT). In the main study,
confidence intervals for the proportions of students’ hemispheric preferences—left-brain
preference, right-brain preference, and whole-brain preference—for each class were first
computed, and then the proportions for the three types of teaching strategies for each
teacher were matched to these confidence intervals.
Summary
This chapter consists of two parts: (a) the construction and validation of teacher and
student instruments and (b) the main study to explore the relationships among variables
of interest. In the first part, the Human Information Processing (HIP) Survey was
translated and validated for use with elementary school science teachers in Taiwan. In
addition, the Style of Learning and Thinking (SOLAT) and PMA Spatial Relations Test
were translated and validated for use with elementary school students in Taiwan. In
addition, the Student Attitudes Toward Science Class Survey was developed, translated,
and validated for use with elementary school students in Taiwan. The results showed that
these instruments translated into Chinese are valid and reliable for use in Taiwan. These
validated instruments were used in the main study.
In the second part, the main study was conducted to explore the relationships among
variables of interest. The participants included the 4 elementary school science teachers
and 133 fourth- and fifth-grade elementary school students who were purposively

78
selected from a large urban elementary school, Liang elementary school, in northern
Taiwan. Table 3.11 is provided to summarize the data sources and data analyses for the
main study.
Data Sources Data Analyses
Teacher Demographics Questionnaire ▪ Descriptive Statistics
Human Information Processing Survey ▪ Descriptive Statistics
Teacher
Classroom Observations ▪ Coding and Categorizing Data
▪ Descriptive Statistics
Style of Learning and Thinking
PMA Spatial Relations Test
Chinese language exams
Science exams
Student
Student Attitudes Toward Science Class Survey
▪ Descriptive Statistics
▪ Pearson Product Moment Correlations
▪ MANOVA
▪ ANOVA
Classroom Observations Teacher and
Student Style of Learning and Thinking
▪ Confidence Intervals for Proportion tests
Table 3.11: A summary of data sources and data analyses for the main study.

79
CHAPTER 4
RESULTS OF DATA ANALYSES This chapter reports the results of all data analyses organized into three sections. The
first section presents the results of the analyses of teacher data including descriptive
statistics related to the Teacher Demographics Questionnaire and the Human Information
Processing (HIP) Survey. Results from the teacher classroom observations were
qualitatively coded and categorized according to hemispheric preferences and then
analyzed using descriptive statistics. The second section presents the results of the
analyses of student data including descriptive statistics related to the Style of Learning
and Thinking (SOLAT). Results from Pearson Product Moment Correlations, multivariate
analysis of variance (MANOVA), and analysis of variance (ANOVA) are reported for all
student independent and dependent variables. The third section presents the results of
teacher and student data analyses. Results from Confidence Intervals for Proportion tests
from teacher classroom observations and student responses to the Style of Learning and
Thinking (SOLAT) are reported.
Results of Teacher Data Analyses
Data Results: Teacher Demographics Questionnaire
Based upon the responses of the 4 elementary school science teachers to the Teacher
Demographics Questionnaire, Table 4.1 provides the following demographic information:

80
teacher pseudonym, gender, current teaching grade, age, major, science teaching years,
and total teaching years for each teacher. In the main study, the participants of the
purposeful sample were 4 elementary school science teachers from Liang elementary
school. Two males and two females were from grade 4 and grade 5, one male and one
female for each grade, respectively. The ages of the 4 elementary school science teachers
ranged from 38 to 46 years. The 4 elementary school science teachers had different
majors—ranging from three majors related to education but not specifically to science
education to Network Engineering. The number of science teaching years also varied
among the 4 teachers. The two males served as elementary school science teachers for 10
and 16 years but also taught other subjects for a total of 18 and 17 years, respectively.
The two females served as relatively new elementary school science teachers for 3 years
yet taught other subjects for a total of 26 and 17 years, respectively.
Teacher
Gender
Current Teaching Grade
Age
Major
Science Teaching Years
Total Teaching Years
John Male 4 38 Curriculum and Instruction
10 18
Betty Female 4 46 Special Education 3 26
Peter Male 5 38 Network Engineering 16 17
Lucy Female 5 39 Physical Education 3 17
Table 4.1: Demographic information for the 4 elementary school science teachers.

81
Data Results: Human Information Processing Survey
This section presents the results of the analysis of the responses of the 4 elementary
school science teachers to the Human Information Processing (HIP) Survey. As described
in chapter 3, the standard score on the HIP Survey identifies the person’s processing
strategy—left, right, integrated, or mixed. If the standard score equals or exceeds 120 for
left, right, or integrated, then the person is described as having that processing strategy. If
the standard score is less than 120 for all three, then the person is described as having a
mixed-processing strategy. Table 4.2 is a profile of the HIP Survey results for the 4
elementary school science teachers. With regard to John, his standard score was 109 on
the left-brain scale, 59 on the right-brain scale, and 129 on the integrated-brain scale.
John was identified as exhibiting an integrated-brain preference. With regard to Betty, her
standard score was 97 on the left-brain scale, 88 on the right-brain scale, and 114 on the
integrated-brain scale. Betty was identified as exhibiting a mixed-brain preference. With
regard to Peter, his standard score was 67 on the left-brain scale, 92 on the right-brain
scale, and 136 on the integrated-brain scale. Peter was identified as exhibiting an
integrated-brain preference. With regard to Lucy, her standard score was 80 on the
left-brain scale, 88 on the right-brain scale, and 129 on the integrated-brain scale. Lucy
was identified as exhibiting an integrated-brain preference. In summary, 3 of the
elementary school science teachers were identified as exhibiting an integrated-brain
preference. The remaining elementary school science teacher was identified as exhibiting
a mixed-brain preference.

82
Human Information Processing (HIP) Survey Teacher
Left-Brain Score
Right-Brain Score
Integrated-Brain
Score
Brain Hemispheric Preference
John 109 59 129 Integrated
Betty 97 88 114 Mixed
Peter 67 92 136 Integrated
Lucy 80 88 129 Integrated
Table 4.2: Standard scores on the HIP Survey left-brain, right-brain, and integrated-brain scales and brain hemispheric preference for the 4 elementary school science teachers.
Figure 4.1 provides a distribution of the standard scores on the left-brain, right-brain,
and integrated-brain scales for the 4 elementary school science teachers. The graph
suggests that John scored highest on the left-brain scale but scored lowest on the
right-brain scale compared to the other teachers. Betty scored similarly on each of the
three scales as no score reached 120. The distribution pattern of the scores on the three
scales for John was similar to that of Betty—they both scored highest on the
integrated-brain scale, next on the left-brain scale, and lowest on the right-brain scale.
Peter scored highest on the right-brain and the integrated-brain scales but scored lowest
on the left-brain scale compared to the other teachers, and each of Peter’s scores seemed
considerably different from each other. The distribution pattern of the standard scores on
each of the three scales for Peter and Lucy were similar—they scored highest on the
integrated-brain scale, next on the right-brain scale, and lowest on the left-brain scale.

0
20
40
60
80
100
120
140
160
John Betty Peter Lucy
Left-brain
Right-brain
Integrated-brain
Figure 4.1: Standard scores on the HIP Survey left-brain, right-brain, and integrated-brain scales for the 4 elementary school science teachers.
Data Results: Classroom Observations
This section provides the results of the classroom observations for the 4 elementary
school science teachers. The teaching strategies in all classroom observation field notes
were identified according to Table 2.3. Eventually, 11 teaching strategies emerged via an
analytic constant comparative process. Five of the teaching strategies were categorized as
left-brain processing or preference, four of the teaching strategies were categorized as
right-brain processing or preference, and two of the teaching strategies were categorized
as integrated-brain or whole-brain processing or preference. Table 4.3 lists the teaching
strategies for the left-brain, right-brain, and whole-brain processing or preference along
with the abbreviations recorded in the classroom observation field notes.
83

84
Teaching Strategy Code Teaching Strategy Category
Category Abbreviation
Lecture L1
Textual readings L2
Experiments with teacher control L3
Independent work L4
Oral report
Left Brain
L5
Demonstration R1
Small group discussion R2
Experiments with student control R3
Visual aids
Right Brain
R4
Film projection W1
Lecture with visual aids
Whole Brain
W2
Table 4.3: Teaching strategy code, teaching strategy category, and category abbreviation.
Based upon coding and categorizing the teaching strategies in the field notes for the
classroom observations of the 4 elementary school science teachers, the percentage of
instructional time for each teaching strategy related to each of the three hemispheric
preferences (left-brain, right-brain, and whole-brain) was computed. Table 4.4 profiles
the findings related to the teaching strategies employed by each teacher.

85
Grade 4 Grade 5
Teaching Strategy Code
Category Abbreviation John Betty Peter Lucy
Lecture L1 39.46% 35.17% 13.81% 38.74%
Textual readings L2 6.42% 0.54%
Experiments with teacher control
L3 7.79% 21.59%
Independent work L4 6.73% 2.69% 19.67% 12.57%
Oral report L5 2.04% 6.64% 1.24%
Demonstration R1 11.54% 7.70% 9.44% 4.90%
Small group discussion R2 4.38% 5.95% 2.18% 0.58%
Experiments with student control
R3 12.36% 50.78%
Visual aids R4
Film projection W1 14.50% 5.51% 5.86%
Lecture with visual aids W2 9.00% 22.12% 4.12% 13.98%
Table 4.4: Percentage of instructional time for teaching strategies related to left-brain, right-brain, and whole-brain processing for the 4 elementary school science teachers.
John employed eight teaching strategies: three left-brain teaching strategies, three
right-brain teaching strategies, and two whole-brain teaching strategies. Among the
teaching strategies, the highest percentage was for lecture (39.46%), followed by film
projection (14.50%), experiments with student control (12.36%), and demonstration
(11.54%). The lowest percentages (< 10%) were for lecture with visual aids (9.00%),
independent work (6.73%), small group discussion (4.38%), and oral report (2.04%).
Betty employed nine teaching strategies: five left-brain teaching strategies, two
right-brain teaching strategies, and two whole-brain teaching strategies. Among the

86
teaching strategies, the highest percentage was for lecture (35.17%), followed by lecture
with visual aids (22.12%). The lowest percentages (< 10%) were for experiments with
teacher control (7.79%), demonstration (7.70%), oral report (6.64%), textual readings
(6.42%), small group discussion (5.95%), film projection (5.51%), and independent work
(2.69%).
Peter employed six teaching strategies: two left-brain teaching strategies, three
right-brain teaching strategies, and one whole-brain teaching strategy. Among the
teaching strategies, the highest percentage was for experiments with student control
(50.78%), followed by independent work (19.67%), and lecture (13.81%). The lowest
percentages (< 10%) were for demonstration (9.44%), lecture with visual aids (4.12%),
and small group discussion (2.18%).
Lucy employed nine teaching strategies: five left-brain teaching strategies, two
right-brain teaching strategies, and two whole-brain teaching strategies. Among the
teaching strategies, the highest percentage was for lecture (38.74%); followed by
experiments with teacher control (21.59%), lecture with visual aids (13.98%), and
independent work (12.57%). The lowest percentages (< 10%) were for film projection
(5.86%), demonstration (4.90%), oral report (1.24%), small group discussion (0.58%),
and textual readings (0.54%).
Based upon the descriptive results, it appears that the two female teachers, Betty and
Lucy, employed more types of left-brain teaching strategies (n = 5) and more often
(> 50% of the time) compared to the two male teachers. The two male teachers, John and
Peter, seemed to employ more types of right-brain teaching strategies (n = 3) and Peter

employed these right-brain teaching strategies 62.40% of the instructional time. In
addition, John, Betty, and Lucy seemed to prefer lecture, whereas Peter seemed to prefer
experiments with student control.
Figure 4.2 provides a distribution of the percentage of instructional time for each
teaching strategy category abbreviation related to left-brain, right-brain, and whole-brain
processing for the 4 elementary school science teachers. The graph suggests that lecture
(L1) was employed for a similar percentage of time by John, Betty, and Lucy, whereas
experiments with student control (R3) was clearly used by Peter. It also suggests that the
two female teachers preferred experiments with teacher control (L3), whereas the two
male teachers preferred experiments with student control (R3).
0.00%
10.00%
20.00%
30.00%
40.00%
50.00%
60.00%
L1 L2 L3 L4 L5 R1 R2 R3 R4 W1 W2
John
Betty
Peter
Lucy
Note. L1 = Lecture; L2 = Textual Readings; L3 = Experiments With Teacher Control; L4 = Independent Work; L5 = Oral Report; R1 = Demonstration; R2 = Small Group Discussion; R3 = Experiments With Student Control; R4 = Visual Aids; W1 = Film Projection; W2 = Lecture With Visual Aids. Figure 4.2: Percentage of instructional time for each teaching strategy category abbreviation related to left-brain, right-brain, and whole-brain processing for the 4 elementary school science teachers.
87

88
Table 4.5 displays the total percentage of instructional time for teaching strategies
related to left-brain, right-brain, and whole-brain processing for the 4 elementary school
science teachers. With regard to John, the highest percentage was for left-brain teaching
strategies (48.23%), followed by right-brain teaching strategies (28.28%) and
whole-brain teaching strategies (23.49%). With regard to Betty, the highest percentage
was for left-brain teaching strategies (58.71%), followed by whole-brain teaching
strategies (27.64%) and right-brain teaching strategies (13.65%). With regard to Peter, the
highest percentage was for right-brain teaching strategies (62.40%), followed by
left-brain teaching strategies (33.48%) and whole-brain teaching strategies (4.12%). With
regard to Lucy, the highest percentage was for left-brain teaching strategies (74.68%),
followed by whole-brain teaching strategies (19.84%) and right-brain teaching strategies
(5.48%). Based upon these results, it appears that John, Betty, and Lucy preferred
left-brain teaching strategies, whereas Peter preferred right-brain teaching strategies.
Grade 4 Grade 5
Processing John Betty Peter Lucy
Left Brain 48.23% 58.71% 33.48% 74.68%
Right Brain 28.28% 13.65% 62.40% 5.48%
Whole Brain 23.49% 27.64% 4.12% 19.84%
Table 4.5: Total percentage of instructional time for teaching strategies related to left-brain, right-brain, and whole-brain processing for the 4 elementary school science teachers.

89
Figure 4.3 illustrates the total percentage of instructional time for teaching strategies
related to left-brain, right-brain, and whole-brain preference for the 4 elementary school
science teachers. Comparing the fourth-grade teachers, it appears that both John and
Betty most often used left-brain teaching strategies (nearly 50% and nearly 60% of the
time, respectively). Also, the percentage of instructional time devoted to whole-brain
teaching strategies was similar for John and Betty (approximately 25%). However, the
distribution pattern of teaching strategies for right-brain teaching strategies for John was
different from that for Betty. John seemed to employ right-brain and whole-brain teaching
strategies for nearly the same percentage of time (approximately 25%). In contrast, Betty
seemed to employ whole-brain teaching strategies (approximately 25%) two times more
compared to right-brain teaching strategies. Comparing the fifth-grade teachers, it
appears that Peter clearly used right-brain teaching strategies (> 60%), whereas Lucy
clearly used left-brain teaching strategies (nearly 75%). Peter employed right-brain
teaching strategies most often and whole-brain teaching strategies least often, whereas
Lucy employed left-brain teaching strategies most often and right-brain teaching
strategies least often. The distribution pattern of left-, right-, and whole-brain teaching
strategies for Peter appears to be considerably different from that for Lucy.
Comparing the two male teachers, the distribution pattern of left-brain, right-brain,
and whole-brain teaching strategies for John was considerably different from that for
Peter. Peter clearly used right-brain teaching strategies most often (> 60%) followed by
left-brain teaching strategies (> 30%). Peter rarely used whole-brain teaching strategies
(< 5%). In contrast, John used left-brain teaching strategies most often (nearly 50%) and
right- and whole-brain teaching strategies for nearly the same percentage of time

(approximately 25%). Comparing the two female teachers, the distribution pattern of
left-brain, right-brain, and whole-brain teaching strategies for Betty was similar to that
for Lucy, the highest percentage was for left-brain teaching strategies (> 50%), followed
by whole-brain teaching strategies (< 30%), and right-brain teaching strategies (< 20%).
0.00%
10.00%20.00%30.00%40.00%50.00%60.00%70.00%80.00%
John Betty Pe te r Lucy
Left-bra in s tra tegies
Right-bra in s tra tegies
Whole -bra in s tra tegies
Figure 4.3: Total percentage of instructional time for teaching strategies related to left-brain, right-brain, and whole-brain processing for the 4 elementary school science teachers.
Results of Student Data Analyses
Data Results: Style of Learning and Thinking
This section provides the results of student (n = 133) responses to the Style of
Learning and Thinking (SOLAT). According to the manual (Torrance, 1988), scoring
procedures involve counting the number of left-brain, right-brain, and whole-brain
90

91
responses, recording the raw scores on profile sheets, and then converting them to
standard scores and percentiles. A standard score of 120 is considered a hemispheric
preference. Some children may not exhibit a hemispheric preference.
Class
Grade Level
No. of Subjects
Gender
Left-Brain Preference
Right-Brain Preference
Whole-Brain Preference
No Hemispheric Preference
17 Male 5.88% 41.18% 5.88% 47.06% John
4
15 Female 0.00% 60.00% 13.33% 26.67%
17 Male 0.00% 29.41% 11.76% 58.82% Betty
4
16 Female 6.25% 18.75% 31.25% 43.75%
17 Male 13.33% 73.33% 13.33% 0.00% Peter
5
18 Female 18.75% 18.75% 12.50% 50.00%
17 Male 5.88% 47.06% 5.88% 41.18% Lucy
5
16 Female 18.75% 56.25% 0.00% 25.00%
Table 4.6: Percentage of male and female students for left-brain, right-brain, and whole-brain preferences and no hemispheric preference for the four science classes.
Table 4.6 presents the percentage of male and female students for left-brain,
right-brain, and whole-brain preferences and no hemispheric preference for the four
science classes. Inspection of the table reveals some extreme values, for example, 0.00%
of the female students in John’s class exhibited a left-brain preference, 0.00% of the male
students in Betty’s class exhibited a left-brain preference, 0.00% of the female students in
Lucy’s class exhibited a whole-brain preference, and 0.00% of the male students in
Peter’s class did not exhibit a hemispheric preference. In contrast, it showed that a
relatively high percentage (73.33%) of the male students in Peter’s class exhibited a

92
right-brain preference. A relatively high percentage (60.00%) of the female students in
John’s class exhibited a right-brain preference. A relatively high percentage (58.82%) of
the male students in Betty’s class did not exhibit a hemispheric preference. A relatively
high percentage (56.25%) of the female students in Lucy’s class exhibited a right-brain
preference. A relatively high percentage (50.00%) of the female students in Peter’s class
did not exhibit a hemispheric preference.
With regard to John’s class, a higher percentage (although small) of the male
students (5.88%) compared to the female students (0.00%) exhibited a left-brain
preference and a higher percentage of the male students (47.06%) compared to the female
students (26.67%) did not exhibit a hemispheric preference. In contrast, a higher
percentage of the female students (60.00%) compared to the male students (41.18%)
exhibited a right-brain preference and a higher percentage of the female students (13.33%)
compared to the male students (5.88%) exhibited a whole-brain preference. Based upon
the results for John’s class, it appears that a relatively high percentage (> 40%) of the
male and female students exhibited a right-brain preference, whereas a relatively low
percentage (< 10%) of the male and female students exhibited a left-brain preference. Of
note, there were no female students who exhibited a left-brain preference but a large
percentage of the female students (60.00%) exhibited a right-brain preference. In addition,
it appears that a relatively high percentage (> 40%) of the male students did not exhibit a
hemispheric preference.
With regard to Betty’s class, a higher percentage of the male students (29.41%)
compared to the female students (18.75%) exhibited a right-brain preference and a higher
percentage of the male students (58.82%) compared to the female students (43.75%) did

93
not exhibit a hemispheric preference. In contrast, a higher percentage of the female
students (6.25%) compared to the male students (0.00%) exhibited a left-brain preference
and a higher percentage of the female students (31.25%) compared to the male students
(11.76%) exhibited a whole-brain preference. Based upon the results for Betty’s class, it
appears that a relatively high percentage (> 40%) of the male and female students did not
exhibit a hemispheric preference, whereas a relatively low percentage (< 10%) of the
male and female students exhibited a left-brain preference. Of note, there were no male
students who exhibited a left-brain preference. In addition, it appears that the highest
percentage for the male students (58.82%) and for the female students (43.75%) was for
no hemispheric preference.
With regard to Peter’s class, a higher percentage of the male students (73.33%)
compared to the female students (18.75%) exhibited a right-brain preference and a
slightly higher percentage of the male students (13.33%) compared to the female students
(12.50%) exhibited a whole-brain preference. In contrast, a higher percentage of the
female students (18.75%) compared to the male students (13.33%) exhibited a left-brain
preference and a higher percentage of the female students (50.00%) compared to the male
students (0.00%) did not exhibit a hemispheric preference. Based upon the results for
Peter’s class, it appears that half of the female students (50.00%) did not exhibit a
hemispheric preference, whereas every male student exhibited a hemispheric preference.
Of note, the highest percentage (73.33%) for the male students in Peter’s class was for a
right-brain preference.
With regard to Lucy’s class, a higher percentage of the male students (5.88%)
compared to the female students (0.00%) exhibited a whole-brain preference and a higher

94
percentage of the male students (41.18%) compared to the female students (25.00%) did
not exhibit a hemispheric preference. In contrast, a higher percentage of the female
students (18.75%) compared to the male students (5.88%) exhibited a left-brain
preference and a higher percentage of the female students (56.25%) compared to the male
students (47.06%) exhibited a right-brain preference. Based upon the results for Lucy’s
class, it appears that a relatively high percentage (> 40%) of the male and female students
exhibited a right-brain preference, whereas a relatively low percentage (< 10%) of the
male and female students exhibited a whole-brain preference. Of note, there were no
female students who exhibited a whole-brain preference but a high percentage of the
female students (> 50%) exhibited a right-brain preference. In addition, it appears that a
relatively high percentage (> 40%) of the male students did not exhibit a hemispheric
preference.
Grade Level
No. of Subjects
Gender
Left-Brain Preference
Right-Brain Preference
Whole-Brain Preference
No Hemispheric Preference
34 Male 2.94% 35.29% 8.82% 52.94% 4
31 Female 3.23% 38.71% 22.58% 35.48%
35 Male 9.38% 59.38% 9.38% 21.88% 5
33 Female 18.75% 37.50% 6.25% 37.50%
Table 4.7: Total percentage for male and female students for left-brain, right-brain, and whole-brain preferences and no hemispheric preference for the two grade levels.

95
Table 4.7 presents the total percentage for male and female students for left-brain,
right-brain, and whole-brain preferences and no hemispheric preference for the fourth and
fifth grades. Comparing the fourth-grade and the fifth-grade male students, it appears that
although the percentage is small, approximately three times more fifth-grade male
students (9.38%) compared to the fourth-grade male students (2.94%) exhibited a
left-brain preference and a considerably higher percentage of the fifth-grade male
students (59.38%) compared to the fourth-grade male students (35.29%) exhibited a
right-brain preference. Nearly the same percentage of the fifth-grade male students
(9.38%) compared to the fourth-grade male students (8.82%) exhibited a whole-brain
preference. In contrast, a considerably higher percentage of the fourth-grade male
students (52.94%) compared to the fifth-grade male students (21.88%) did not exhibit a
hemispheric preference. Based upon the results, it appears that a higher percentage of the
fifth-grade male students exhibited a left-brain preference or a right-brain preference
compared to the fourth-grade male students. Both the fourth-grade and fifth-grade male
students exhibited a relatively high percentage of right-brain preference. In addition, it
appears that a similar percentage of the fifth-grade and fourth-grade male students
exhibited a similar, relatively small whole-brain preference.
Comparing the fourth-grade female and the fifth-grade female students, it appears
that a considerably higher percentage of the fifth-grade female students (18.75%)
compared to the fourth-grade female students (3.23%) exhibited a left-brain preference.
Nearly the same percentage of the fourth-grade female students (38.71%) compared to
the fifth-grade female students (37.50%) exhibited a right-brain preference. A
considerably higher percentage of the fourth-grade female students (22.58%) compared

96
to the fifth-grade female students (6.25%) exhibited a whole-brain preference. Nearly the
same percentage of the fifth-grade female students (37.50%) compared to the
fourth-grade female students (35.48%) did not exhibit a hemispheric preference. Based
upon the results, it appears that a higher percentage of the fifth-grade female students
exhibited a left-brain preference compared to the fourth-grade female students. In
addition, it appears that a similar, relatively high percentage of the fifth-grade female and
the fourth-grade female students exhibited a right-brain preference. Furthermore, it
appears that a higher percentage of the fourth-grade female students exhibited a
whole-brain preference compared to the fifth-grade female students.
Data Results: Student Multiple Instruments
This section provides descriptive statistics and correlation analyses for the scores of
133 elementary school students on the Style of Learning and Thinking, PMA Spatial
Relations Test, Chinese language exams, Science exams, and Student Attitudes Toward
Science Class Survey. The results from the administration of these instruments to
measure students’ hemispheric preference, spatial ability, verbal ability, science
achievement, and attitudes toward science class are presented according to gender and
according to grade level. The correlation analyses included all independent variables
(gender and grade level) and all dependent variables (left-brain preference, right-brain
preference, whole-brain preference, spatial ability, verbal ability, science achievement,
and attitudes toward science class).
Descriptive Statistics
Table 4.8 presents means and standard deviations for the dependent variables for
male and female students. The mean for the left-brain scale on the SOLAT for the male

97
students was 93.47 (SD = 18.86) and for the female students was 92.50 (SD = 21.24). The
mean for the right-brain scale on the SOLAT for the male students was 120.43
(SD = 20.39) and for the female students was 113.41 (SD = 23.03). The mean for the
whole-brain scale on the SOLAT for the male students was 92.40 (SD = 16.84) and for
the female students was 99.67 (SD = 19.85). The mean on the PMA Spatial Relations Test
for the male students was 131.96 (SD = 14.94) and for the female students was 125.03
(SD = 15.68). The mean on the Chinese language exams for the male students was 186.66
(SD = 12.37) and for the female students was 191.12 (SD = 11.22). The mean on the
Science exams for the male students was 184.59 (SD = 16.23) and for the female students
was 187.03 (SD = 15.32). Lastly, the mean on the Student Attitudes Toward Science Class
Survey for the male students was 131.19 (SD = 15.81) and for the female students was
129.63 (SD = 16.89). Based upon the results, it appears that the male students achieved a
higher mean score compared to the female students for right-brain preference and spatial
ability. In contrast, the female students achieved a higher mean score compared to the
male students for whole-brain preference and verbal ability.

98
Males (n = 68) Females (n = 65)
Variables M SD M SD
Left-Brain Preference 93.47 18.86 92.50 21.24
Right-Brain Preference 120.43 20.39 113.41 23.03
Whole-Brain Preference 92.40 16.84 99.67 19.85
Spatial Ability 131.96 14.94 125.03 15.68
Verbal Ability 186.66 12.37 191.12 11.22
Science Achievement 184.59 16.23 187.03 15.32
Attitudes Toward Science Class 131.19 15.81 129.63 16.89
Table 4.8: Means and standard deviations for the dependent variables for the male and female students.
Table 4.9 presents means and standard deviations for the dependent variables for the
fourth-grade and fifth-grade students. The mean for the left-brain scale on the SOLAT for
the fourth-grade students was 88.46 (SD = 17.15) and for the fifth-grade students was
97.40 (SD = 21.61). The mean for the right-brain scale on the SOLAT for the
fourth-grade students was 112.55 (SD = 21.08) and for the fifth-grade students was
121.36 (SD = 21.99). The mean for the whole-brain scale on the SOLAT for the
fourth-grade students was 96.29 (SD = 19.30) and for the fifth-grade students was 95.57
(SD = 18.14). The mean on the PMA Spatial Relations Test for the fourth-grade students
was 127.69 (SD = 13.50) and for the fifth-grade students was 129.42 (SD = 17.50). The
mean on the Chinese exams for the fourth-grade students was 188.20 (SD = 11.46) and
for the fifth-grade students was 189.46 (SD = 12.53). The mean on the Science exams for
the fourth-grade students was 192.94 (SD = 7.02) and for the fifth-grade students was

99
178.94 (SD = 18.60). Lastly, the mean on the Student Attitudes Toward Science Class
Survey for the fourth-grade students was 128.54 (SD = 19.28) and for the fifth-grade
students was 132.32 (SD = 12.56). Based upon the results, it appears that the fourth-grade
students achieved a higher mean score compared to the fifth-grade students for science
achievement, whereas the fifth-grade students achieved a higher mean score compared to
the fourth-grade students for left-brain preference and right-brain preference.
Grade 4 (n = 65) Grade 5 (n = 68) Variables M SD M SD
Left-Brain Preference 88.46 17.15 97.40 21.61
Right-Brain Preference 112.55 21.08 121.36 21.99
Whole-Brain Preference 96.29 19.30 95.57 18.14
Spatial Ability 127.69 13.50 129.42 17.50
Verbal Ability 188.20 11.46 189.46 12.53
Science Achievement 192.94 7.02 178.94 18.60
Attitudes Toward Science Class 128.54 19.28 132.32 12.56
Table 4.9: Means and standard deviations for the dependent variables for grade 4 and grade 5 students. Correlation Analyses
Five correlation analyses were computed. The first correlation analysis was used to
explore the relationships among variables of interest for all students. The second and
third correlation analyses were used to explore the relationships among variables of
interest for the students grouped by gender (i.e., male students and female students). The

fourth and fifth correlation analyses were used to explore the relationships among
variables of interest for the students grouped by grade level (i.e., fourth-grade students
and fifth-grade students).
Specifically, the first correlation analysis involved 133 elementary school students to
exam the relationships among gender, grade level, left-brain preference, right-brain
preference, and whole-brain preference, spatial ability, verbal ability, science
achievement, and attitudes toward science class. Table 4.10 presents the correlation
matrix generated from the results of the correlation analysis for all students.
Variables 1 2 3 4 5 6 7 8 9
1. Gender --
2. Grade .02 --
3. Left -.02 .23∗∗ --
4. Right -.16 .20∗ - .22∗ --
5. Whole .20∗ -.02 - .41∗∗ - .49∗∗ --
6. Spatial - .22 ∗ .06 -.12 .07 .05 --
7. Verbal .19∗ .00 .08 .02 .22∗ .20∗ --
8. Science .08 .00 .10 .04 .21∗ .24∗∗ .63∗∗ --
9. Attitudes -.05 .12 -.00 .11 .21∗ .10 .25∗∗ .34∗∗ --
Note. Grade = Grade Level; Left = Left-Brain Preference; Right = Right-Brain Preference; Whole = Whole-Brain Preference; Spatial = Spatial Ability; Verbal = Verbal Ability; Science = Science Achievement; Attitudes = Attitudes Toward Science Class.
.05p∗ < . . .01p∗∗ < Table 4.10: Pearson correlation coefficients (r) for scores on the independent and dependent variables for elementary school students (n = 133).
100

According to Table 4.10, there was a significant weak relationship between gender
and whole-brain preference ( .20r = , .05p < ). That is, female students tended to exhibit a
stronger whole-brain preference. There was a significant weak negative relationship
between gender and spatial ability ( .22r = − , .05p < ). That is, male students tended to
exhibit better spatial ability. There was a significant weak relationship between gender
and verbal ability ( ,.19r = .05p < ). That is, female students tended to exhibit better
verbal ability.
There was a significant weak relationship between grade level and left-brain
preference ( , ). That is, fifth-grade students tended to exhibit a stronger
left-brain preference. There was a significant weak relationship between grade level and
right-brain preference ( ,
.23r = .01p <
.20r = .05p < ). That is, fifth-grade students tended to exhibit
stronger a right-brain preference.
There was a significant weak relationship between whole-brain preference and
verbal ability ( , ). That is, students who exhibited a stronger whole-brain
preference tended to exhibit better verbal ability. There was a significant weak
relationship between whole-brain preference and science achievement ( ,
.22r = .05p <
.21r = .05p < ).
That is, students who exhibited a stronger whole-brain preference tended to exhibit better
science achievement. There was a significant weak relationship between whole-brain
preference and student attitudes toward science class ( .21r = , .05p < ). That is, students
who exhibited a stronger whole-brain preference tended to exhibit more positive attitudes
toward science class.
101

There was a significant weak relationship between spatial ability and verbal ability
( , ). That is, students who exhibited better spatial ability tended to exhibit
better verbal ability. There was a significant weak relationship between spatial ability and
science achievement ( ,
.20r = .05p <
.24r = .01p < ). That is, students who exhibited better spatial
ability tended to exhibit better science achievement.
There was a significant strong relationship between verbal ability and science
achievement ( , ). That is, students who exhibited better verbal ability
tended to exhibit better science achievement. There was a significant weak relationship
between verbal ability and student attitudes toward science class ( , ). That
is, students who exhibited better verbal ability tended to exhibit more positive attitudes
toward science class.
.63r = .01p <
.25r = .01p <
There was a significant moderate relationship between science achievement and
student attitudes toward science class ( .34r = , .01p < ). That is, students who exhibited
better science achievement tended to exhibit more positive attitudes toward science class.
Further, to investigate gender differences in the above relationships, the second and
third correlation analyses were computed on the 133 elementary school students by
gender. Table 4.11 presents the correlation matrix generated from the results of the
correlation analyses for 68 male students.
102

Variables 1 2 3 4 5 6 7 8
1. Grade --
2. Left .13 --
3. Right .33∗ -.18 --
4. Whole -.06 - .44∗∗ - .47∗∗ --
5. Spatial .23 -.23 .03 .18 --
6. Verbal -.03 .10 -.02 .22 .18 --
7. Science -.08 -.03 -.10 .28∗ .19 .53∗∗ --
8. Attitudes -.04 -.07 .09 .24 .23 .30∗ .28∗ --
Note. Grade = Grade Level; Left = Left-Brain Preference; Right = Right-Brain Preference; Whole = Whole-Brain Preference; Spatial = Spatial Ability; Verbal = Verbal Ability; Science = Science Achievement; Attitudes = Attitudes Toward Science Class.
.05p∗ < . . .01p∗∗ < Table 4.11: Pearson correlation coefficients (r) for scores on the independent and dependent variables for elementary school male students (n = 68).
According to Table 4.11, there was a significant moderate relationship between
grade level and right-brain preference ( .33r = , .05p < ) for male students. That is,
fifth-grade male students tended to exhibit a stronger right-brain preference.
There was a significant weak relationship between whole-brain preference and
science achievement ( ,.28r = .05p < ) for male students. That is, male students who
exhibited a stronger whole-brain preference tended to exhibit better science achievement.
For male students, there was a significant strong relationship between verbal ability
and science achievement ( ,.53r = .01p < ).That is, male students who exhibited better
verbal ability tended to exhibit better science achievement. For male students, there was a
103

significant moderate relationship between verbal ability and attitudes toward science
class ( , ).That is, male students who exhibited better verbal ability tended
to exhibit more positive attitudes toward science class.
.30r = .05p <
For male students, there was a significant weak relationship between science
achievement and attitudes toward science class ( .28r = , .05p < ).That is, male students
who exhibited better science achievement tended to exhibit more positive attitudes
toward science class.
Table 4.12 presents the correlation matrix generated from the results of the
correlation analyses for 65 female students.
Variables 1 2 3 4 5 6 7 8
1. Grade --
2. Left .31∗ --
3. Right .09 -.27 --
4. Whole .01 - .39∗∗ - .48∗∗ --
5. Spatial -.10 -.04 .04 .02 --
6. Verbal .03 .08 .13 .16 .38∗∗ --
7. Science .07 .21 .17 .13 .37∗∗ .74∗∗ --
8. Attitudes .27 .06 .11 .22 -.06 .22 .41∗∗ --
Note. Grade = Grade Level; Left = Left-Brain Preference; Right = Right-Brain Preference; Whole = Whole-Brain Preference; Spatial = Spatial Ability; Verbal = Verbal Ability; Science = Science Achievement; Attitudes = Attitudes Toward Science Class.
.05p∗ < . . .01p∗∗ < Table 4.12: Pearson correlation coefficients (r) for scores on the independent and dependent variables for elementary school female students (n = 65). 104

According to Table 4.12, there was a significant moderate relationship between
grade level and left-brain preference ( .31r = , .05p < ) for female students. That is,
fifth-grade female students tended to exhibit a stronger left-brain preference.
For female students, there was a significant moderate relationship between spatial
ability and verbal ability ( ,.38r = .01p < ). That is, female students who exhibited better
spatial ability tended to exhibit better verbal ability. For female students, there was a
significant moderate relationship between spatial ability and science achievement
( , ).That is, female students who exhibited better spatial ability tended to
exhibit better science achievement.
.37r = .01p <
For female students, there was a significant strong relationship between verbal
ability and science achievement ( .74r = , .01p < ).That is, female students who exhibited
better verbal ability tended to exhibit better science achievement. For female students,
there was a significant moderate relationship between science achievement and attitudes
toward science class ( ,.41r = .01p < ). That is, female students who exhibited better
science achievement tended to exhibit more positive attitudes toward science class.
Lastly, to investigate grade level differences in the above relationships, the fourth
and fifth correlation analyses were computed on the 133 elementary school students by
grade level. Table 4.13 presents the correlation matrix generated from the results of the
correlation analyses for 65 fourth-grade students.
105

Variables 1 2 3 4 5 6 7 8
1. Gender --
2. Left -.15 --
3. Right -.06 -.09 --
4. Whole .16 - .41∗∗ - .41∗∗ --
5. Spatial -.07 -.06 .02 -.01 --
6. Verbal .16 .11 .24 .18 .29∗ --
7. Science .00 .19 .28∗ .20 .14 .54∗∗ --
8. Attitudes -.18 -.04 .17 .29∗ .23 .30∗ .37∗∗ --
Note. Left = Left-Brain Preference; Right = Right-Brain Preference; Whole = Whole-Brain Preference; Spatial = Spatial Ability; Verbal = Verbal Ability; Science = Science Achievement; Attitudes = Attitudes Toward Science Class.
.05p∗ < . . .01p∗∗ < Table 4.13: Pearson correlation coefficients (r) for scores on the independent and dependent variables for elementary school fourth-grade students (n = 65). According to Table 4.13, there was a significant weak relationship between
right-brain preference and science achievement ( .28r = , .05p < ) for fourth-grade
students. That is, fourth-grade students who exhibited a stronger right-brain preference
tended to exhibit better science achievement.
There was a significant weak relationship between whole-brain preference and
attitudes toward science class ( .29r = , .05p < ) for fourth-grade students. That is,
fourth-grade students who exhibited a stronger whole-brain preference tended to exhibit
more positive attitudes toward science class. There was a significant weak relationship
106

between spatial ability and verbal ability ( .29r = , .05p < ) for fourth-grade students. That
is, fourth-grade students who exhibited better spatial ability tended to exhibit better
verbal ability.
For fourth-grade students, there was a significant strong relationship between verbal
ability and science achievement ( .54r = , .01p < ), and significant moderate relationship
between verbal ability and attitudes toward science class ( .30r = , ). That is,
fourth-grade students who exhibited better verbal ability tended to exhibit better science
achievement and more positive attitudes toward science class.
.05p <
There was a significant moderate relationship between science achievement and
attitudes toward science class for fourth-grade students ( .37r = , ). That is, for
fourth-grade students who exhibit better science achievement tend to exhibit more
positive attitudes toward science class.
.01p <
Table 4.14 presents the correlation matrix generated from the results of the
correlation analyses for 68 fifth-grade students.
107

Variables 1 2 3 4 5 6 7 8
1. Gender --
2. Left .07 --
3. Right -.27 - .43∗∗ --
4. Whole .23 - .42∗∗ - .58∗∗ --
5. Spatial - .34 ∗∗ -.19 .08 .10 --
6. Verbal .21 .07 -.18 .26 .15 --
7. Science .15 .04 -.17 .21 .31∗ .72∗∗ --
8. Attitudes .14 -.02 -.04 .11 -.07 .19 .33∗ --
Note. Left = Left-Brain Preference; Right = Right-Brain Preference; Whole = Whole-Brain Preference; Spatial = Spatial Ability; Verbal = Verbal Ability; Science = Science Achievement; Attitudes = Attitudes Toward Science Class.
.05p∗ < . . .01p∗∗ < Table 4.14: Pearson correlation coefficients (r) for scores on the independent and dependent variables for elementary school fifth-grade students (n = 68).
According to Table 4.14, for fifth-grade students, there was a significant moderate
negative relationship between gender and spatial ability ( .34r = − , ). That is,
fifth-grade male students tended to exhibit a stronger right-brain preference and better
spatial ability.
.01p <
There was a significant moderate relationship between spatial ability and science
achievement ( , ) for fifth-grade students. That is, fifth-grade students who
exhibited better spatial ability tended to exhibit better science achievement. There was a
.31r = .05p <
108

significant strong relationship between verbal ability and science achievement
( , ) for fifth-grade students. That is, fifth-grade students who exhibited
better verbal ability tended to exhibit better science achievement.
.72r = .01p <
There was a significant moderate relationship between science achievement and
attitudes toward science class for fifth-grade students ( .33r = , .05p < ). That is, for
fifth-grade students who exhibited better science achievement, they tended to exhibit
more positive attitudes toward science class.
Two-Way Multivariate Analysis of Variance (MANOVA)
To determine gender and grade level differences for left-brain scale scores,
right-brain scale scores, whole-brain scale scores, PMA Spatial Relations Test scores,
Chinese language exam scores, Science exam scores, and Student Attitudes Toward
Science Class Survey scores, a two-way MANOVA was computed involving 133
elementary school students. The dependent variables included left-brain preference,
right-brain preference, whole-brain preference, spatial ability, verbal ability, science
achievement, and attitudes toward science class. The independent variables included
gender and grade level. The .05 level of significance was used for all analyses.
Table 4.15 contains a summary of the multivariate analysis for all dependent
variables by gender and grade level. As can be seen from Table 4.15, there were no
significant interaction effects between gender and grade level for the combination of
dependent variables. With regard to gender, there was a significant difference between the
109

male and female students for the combination of dependent variables, Wilk’s Lambda
= .85, F (7,119) = 3.12, p < .01. With regard to grade level, there was a significant
difference between the fourth-grade and fifth-grade students for the combination of
dependent variables, Wilk’s Lambda = .70, F (7,119) = 7.35, p < .001.
Variable Wilk’s Lambda
F
df
p
Gender .85 3.12∗∗ 7, 119 .005
Grade Level .70 7.35∗∗∗ 7, 119 .000
Gender × Grade Level .93 1.33 7, 119 .242
.05p∗ < . . . .01p∗∗ < .001p∗∗∗ < Table 4.15: Results of multivariate analyses of variance for all dependent variables by gender and grade level.
To further understand the main effects, follow-up analyses of variance (ANOVA)
were computed. Table 4.16 presents the results of the follow-up univariate analyses.
Results of follow-up univariate analyses for the gender main effect indicated that three
dependent variables, whole-brain preference, spatial ability, and verbal ability, were
found to be significant (p < .05). That is, there was a significant difference between the
male students and the female students with regard to whole-brain preference,
F (1,125) = 5.77, p = .018; spatial ability, F (1,125) = 5.94, p = .016; and verbal ability,
F (1,125) = 5.63, p = .019. Inspection of the mean scores indicated that female students
110

111
exhibited a stronger whole-brain preference (M = 99.67, SD = 19.85) compared to male
students (M = 92.40, SD = 16.84). In addition, female students exhibited better verbal
ability (M = 191.12, SD = 11.22) compared to male students (M = 186.66, SD = 12.37). In
contrast, male students exhibited better spatial ability (M = 131.96, SD = 14.94)
compared to female students (M = 125.03, SD = 15.68).
For the grade level main effect (see Table 4.16), results of univariate analyses
indicated that two dependent variables, left-brain preference and right-brain preference,
were found to be significant (p < .05). That is, there was a significant difference between
the fourth-grade students and the fifth-grade students with regard to left-brain preference,
F (1,125) = 5.23, p = .024 and right-brain preference, F (1,125) = 5.70, p = .018. Inspection of
the mean scores indicated that the fifth-grade students (M = 97.40, SD = 21.61) exhibited
a stronger left-brain preference compared to fourth-grade students (M = 88.46, SD =
17.15). In addition, the fifth-grade students exhibited a stronger right-brain preference (M
= 121.36, SD = 21.99) compared to fourth-grade students (M = 112.55, SD = 21.08).

Source Dependent Variable F df p
Left-Brain Preference .16 1, 125 .694 Gender
Right-Brain Preference 2.38 1, 125 .125
Whole-Brain Preference 1, 125 .018 5.77∗
Spatial Ability 1, 125 .016 5.94∗
Verbal Ability 1, 125 .019 5.63∗
Science Achievement 1.64 1, 125 .203
Attitudes Toward Science Class .19 1, 125 .668
Grade Level Left-Brain Preference 1, 125 .024 5.23∗
Right-Brain Preference 1, 125 .018 5.70∗
Whole-Brain Preference .10 1, 125 .756
Spatial Ability .70 1, 125 .405
Verbal Ability .11 1, 125 .738
Science Achievement .30 1, 125 .588
Attitudes Toward Science Class 1.59 1, 125 .209
Gender × Grade Level Left-Brain Preference .80 1, 125 .374
Right-Brain Preference 1.75 1, 125 .188
Whole-Brain Preference .09 1, 125 .767
Spatial Ability 3.12 1, 125 .080
Verbal Ability .06 1, 125 .802
Science Achievement .04 1, 125 .834
Attitudes Toward Science Class 2.72 1, 125 .102
.05p∗ < . . .01p∗∗ < Table 4.16: Results of univariate analyses of variance for all dependent variables by gender and grade level.
112

113
Results of Teacher and Student Data Analyses
Data Results: Classroom Observations and Style of Learning and Thinking
In this section, teacher and student data were used to investigate the relationship
between the percentage of instructional time for left-brain, right-brain, and whole-brain
science teaching strategies and the percentage of student left-, right-, and whole-brain
preferences in each of the 4 classes. Confidence Intervals for Proportion tests were used
to determine the alignment between the percentage of instructional time for teaching
strategies and the percentage of student hemispheric preferences related to left-brain,
right-brain, and whole-brain preferences.
A confidence interval (CI) is an interval estimate of a population parameter. The
95% confidence interval for a proportion is calculated from the sample and contains the
population proportion with the probability of 95%. The lower and upper limits of the 95%
confidence interval for a proportion were calculated for the percentage of instructional
time for teacher left-brain, right-brain, and whole-brain teaching strategies in relationship
to the percentage of student left-brain, right-brain, and whole-brain preferences. The
corresponding confidence limits define the boundaries of the interval.
Table 4.17 presents the results of the Confidence Intervals for Proportion tests for
John’s teaching strategies and student left-brain, right-brain, and whole-brain preferences.
According to Table 4.17, John employed left-brain teaching strategies 48.23% of the
instructional time, right-brain teaching strategies 28.28% of the instructional time, and
whole-brain teaching strategies 23.49% of the instructional time. According to Table 4.17,
the 95% confidence interval for the proportion for student left-brain preference was
0.00% to 9.15%. Since the proportion of John’s left-brain teaching strategies was 48.23%,

114
the confidence interval did not contain the population proportion of 48.23%. The 95%
confidence interval for the proportion for student right-brain preference was 32.65% to
67.32%. Since the proportion of John’s right-brain teaching strategies was 28.28%, the
confidence interval did not contain the population proportion of 28.28%. Lastly, the 95%
confidence interval for the proportion for student whole-brain preference was 0.00% to
19.47%. Since the proportion of John’s whole-brain teaching strategies was 23.49%, the
confidence interval did not contain the population proportion of 23.49%. In conclusion,
there were no alignments between John’s teaching strategies and student hemispheric
preferences.
95% Confidence Interval Processing
Student Hemispheric Preference
Teaching Strategy
Lower
Upper
Left Brain 3.13% 48.23% 0.00% 9.15%
Right Brain 50.00% 28.28% 32.65% 67.32%
Whole Brain 9.38% 23.49% 0.00% 19.47%
Table 4.17: Confidence intervals for proportion tests for teaching strategies and student left-brain, right-brain, and whole-brain preferences in John’s class.
Table 4.18 presents the results of the Confidence Intervals for Proportion tests for
Betty’s teaching strategies and student left-brain, right-brain, and whole-brain preferences.
According to Table 4.18, Betty employed left-brain teaching strategies 58.71% of the
instructional time, right-brain teaching strategies 13.65% of the instructional time, and

115
whole-brain teaching strategies 27.64% of the instructional time. According to Table 4.18,
the 95% confidence interval for the proportion for student left-brain preference was
0.00% to 8.88%. Since the proportion of Betty’s left-brain teaching strategies was
58.71%, the confidence interval did not contain the population proportion of 58.71%. The
95% confidence interval for the proportion for student right-brain preference was 9.62%
to 38.86%. Since the proportion of Betty’s right-brain teaching strategies was 13.65%, the
confidence interval contained the population proportion of 13.65%. Lastly, the 95%
confidence interval for the proportion for student whole-brain preference was 7.26% to
35.16%. Since the proportion of Betty’s whole-brain teaching strategies was 27.64%, the
confidence interval contained the population proportion of 27.64%. In conclusion, there
was an alignment between Betty’s right-brain teaching strategies and student right-brain
preference. In addition, there was an alignment between Betty’s whole-brain teaching
strategies and student whole-brain preference.
95% Confidence Interval Processing
Student Hemispheric Preference
Teaching Strategy
Lower
Upper
Left Brain 3.03% 58.71% 0.00% 8.88%
Right Brain 24.24% 13.65% 9.62% 38.86%
Whole Brain 21.21% 27.64% 7.26% 35.16%
Table 4.18: Confidence intervals for proportion tests for teaching strategies and student left-brain, right-brain, and whole-brain preferences in Betty’s class.

116
Table 4.19 presents the results of the Confidence Intervals for Proportion tests for
Peter’s teaching strategies and student left-brain, right-brain, and whole-brain preferences.
According to Table 4.19, Peter employed left-brain teaching strategies 33.48% of the
instructional time, right-brain teaching strategies 62.40% of the instructional time, and
whole-brain teaching strategies 4.12% of the instructional time. According to Table 4.19,
the 95% confidence interval for the proportion for student left-brain preference was
3.10% to 29.08%. Since the proportion of Peter’s left-brain teaching strategies was
33.48%, the confidence interval did not contain the population proportion of 33.48%. The
95% confidence interval for the proportion for student right-brain preference was 27.64%
to 62.68%. Since the proportion of Peter’s right-brain teaching strategies was 62.40%, the
confidence interval contained the population proportion of 62.40%. Lastly, the 95%
confidence interval for the proportion for student whole-brain preference was 11.00% to
24.70%. Since the proportion of Peter’s whole-brain teaching strategies was 4.12%, the
confidence interval did not contain the population proportion of 4.12%. In conclusion,
there was an alignment between Peter’s right-brain teaching strategies and student right
hemispheric preference.

117
95% Confidence Interval Processing
Student Hemispheric Preference
Teaching Strategy
Lower
Upper
Left Brain 16.13% 33.48% 3.10% 29.08%
Right Brain 45.16% 62.40% 27.64% 62.68%
Whole Brain 12.90% 4.12% 11.00% 24.70%
Table 4.19: Confidence intervals for proportion tests for teaching strategies and student left-brain, right-brain, and whole-brain preferences in Peter's class.
Table 4.20 presents the results of the Confidence Intervals for Proportion tests for
Lucy’s teaching strategies and student left-brain, right-brain, and whole-brain preferences.
According to Table 4.20, Lucy employed left-brain teaching strategies 74.68% of the
instructional time, right-brain teaching strategies 5.48% of the instructional time, and
whole-brain teaching strategies 19.84% of the instructional time. According to Table 4.20,
the 95% confidence interval for the proportion for student left-brain preference was
0.99% to 23.26%. Since the proportion of Lucy’s left-brain teaching strategies was
74.68%, the confidence interval did not contain the population proportion of 74.68%. The
95% confidence interval for the proportion for student right-brain preference was 34.48%
to 68.57%. Since the proportion of Lucy’s right-brain teaching strategies was 5.48%, the
confidence interval did not contain the population proportion of 5.48%. Lastly, the 95%
confidence interval for the proportion for student whole-brain preference was 0.00% to
8.88%. Since the proportion of Lucy’s whole-brain teaching strategies was 19.84%, the

118
confidence interval did not contain the population proportion of 19.84%. In conclusion,
there were no alignments between Lucy’s teaching strategies and student hemispheric
preferences.
95% Confidence Interval Processing
Student Hemispheric Preference
Teaching Strategy
Lower
Upper
Left Brain 12.12% 74.68% 0.99% 23.26%
Right Brain 51.52% 5.48% 34.48% 68.57%
Whole Brain 3.03% 19.84% 0.00% 8.88%
Table 4.20: Confidence intervals for proportion tests for teaching strategies and student left-brain, right-brain, and whole-brain preferences in Lucy’s class.
Summary
In this chapter, results of data analyses using coding and categorizing data,
descriptive statistics, Pearson Product Moment Correlations, MANOVA, ANOVA, and
Confidence Intervals for Proportion tests were presented. Table 4.21 provides a summary
of data sources, data analysis techniques, and results of data analyses for the main study.

119
Part 1: Teacher Data Analyses
Sources: Human Information Processing Survey, Teacher Classroom Observations
Analyses: Coding and Categorizing Data, Descriptive Statistics
Variables Results
Teacher Hemispheric Preference & Teaching Strategies —
Teacher Hemispheric Preference & Teacher Gender —
Teaching Strategies & Teacher Gender Males > Right-Brain Teaching Strategies
Females > Left-Brain Teaching Strategies
Part 2.1 : Student Data Analyses
Sources: Style of Learning and Thinking, PMA Spatial Relations Test, Chinese Language Exams, Science Exams, Student Attitudes Toward Science Class Survey
Analyses: Pearson Product Moment Correlations
Variables Results
Hemispheric Preference & Spatial Ability —
Hemispheric Preference & Spatial Ability (by gender) —
Hemispheric Preference & Spatial Ability (by grade level) —
Whole-Brain Preference & Verbal Ability Weak, Positive r
Whole-Brain Preference & Verbal Ability (by gender) —
Whole-Brain Preference & Science Achievement Weak, Positive r
Whole-Brain Preference & Science Achievement (by gender)
Weak, Positive r
Males
Continued Table 4.21: A summary of data sources, data analyses, and results for the main study.

120
Table 4.21 continued
Whole-Brain Preference & Attitudes Toward Science Class
Weak, Positive r
Whole-Brain Preference & Attitudes Toward Science Class (by gender)
—
Whole-Brain Preference & Attitudes Toward Science Class (by grade level)
Weak, Positive r Grade 4
Part 2.2: Student Data Analyses
Sources: Style of Learning and Thinking, PMA Spatial Relations Test, Chinese Language Exams, Science Exams, Student Attitudes Toward Science Class Survey
Analyses: MANOVA and ANOVA
Variables Results
Left-Brain Preference & Gender —
Right-Brain Preference & Gender —
Whole-Brain Preference & Gender Females > Males
Left-Brain Preference & Grade Level Grade 5 > Grade 4
Right-Brain Preference & Grade Level Grade 5 > Grade 4
Whole-Brain Preference & Grade Level —
Spatial Ability & Gender Males > Females
Spatial Ability & Grade Level —
Verbal Ability & Gender Females > Males
Science Achievement & Gender —
Attitudes Toward Science Class & Gender —
Attitudes Toward Science Class & Grade Level —
Continued

121
Table 4.21 continued Part 2.3 : Student Data Analyses
Sources: Style of Learning and Thinking
Analyses: Descriptive Statistics
Student Hemispheric Preference & Gender ▪ No Hemispheric Preference
Males > Females
▪ Left Hemisphere
Females > Males
▪ Right Hemisphere
Males > Females
Student Hemispheric Preference & Gender & Grade Level ▪ Left Hemisphere: Females
Grade 5 > Grade 4
▪ Right Hemisphere: Males
Grade 5 > Grade 4
Part 3.1: Teacher and Student Data Analyses
Sources: Human Information Processing Survey, Style of Learning and Thinking
Analyses: Descriptive Statistics
Variables Results
Teacher Hemispheric Preference & Student Hemispheric Preference
—
Teacher Hemispheric Preference & Student Hemispheric Preference (by gender)
—
Teacher Hemispheric Preference & Student Hemispheric Preference (by grade level)
—
Continued

122
Table 4.21 continued
Part 3.2: Teacher and Student Data Analyses
Sources: Teacher Classroom Observations, Style of Learning and Thinking
Analyses: Confidence Intervals for Proportion Tests
Variables Results
Teaching Strategies & Student Hemispheric Preference Partially Related for 2 Teachers

123
CHAPTER 5
CONCLUSIONS AND DISCUSSION
This chapter consists of five sections. The first section of the chapter presents a
summary of the main study. The second section of this chapter discusses the overall
findings of the main study in terms of the research questions and comparisons with other
research studies in the literature as described in chapter 2. A list of the major conclusions
is found in the third section of this chapter. The fourth section of this chapter provides the
implications for teacher education programs and curriculum developers. The last section
of this chapter provides suggestions for future research in science education.
Summary of the Main Study
Many educators believe that most contemporary schools are dominated by a
left-brain curriculum, and generally, instructional strategies and teaching materials stress
a linear, sequential mode of reasoning (Chapman, 1998; Chudzinski, 1988; Cooke &
Haipt, 1986; Grady, 1984; Lewallen, 1985; Marxer, 1988; Rubenzer, 1982; Turner, 1999;
Vitale, 1982). Rubenzer pointed out that there is a need to close the gap between
left-brain teaching strategies and right-brain learning styles because the left-brain
educational system has handicapped many children who prefer right-brain teaching
strategies. Research has shown that teaching strategies and student hemispheric
preferences do affect learning (Brennan, 1984; Dunn et al., 1990; Fountain & Fillmer,

124
1987; Gadzella, 1995; Jarsonbeck, 1984; Van Giesen et al., 1987). Ellis (2001) and Van
Giesen et al. claimed that research on hemisphericity and learning is inconclusive. Thus,
exploring the relationships among teacher variables (hemispheric preference and science
teaching strategies) and student variables (gender, grade level, hemispheric preference,
spatial ability, verbal ability, science achievement, and attitudes toward science class)
may offer new insight into ways to help children learn science.
The purpose of this mixed methods study was first to investigate the relationships
among teacher hemispheric preference, student hemispheric preference, student spatial
ability, student verbal ability, student science achievement, and student attitudes toward
science class using teacher and student data from multiple instruments. The second
purpose was to identify teaching strategies in the science classroom using observation
data and match these teaching strategies to teacher and student hemispheric preferences.
In order to answer the following research questions, quantitative and qualitative analyses
involving 4 elementary school science teachers and 133 elementary school students were
conducted.
1. What is the relationship between science teacher hemispheric preference and
science teaching strategies? Is there a gender difference in the relationship?
2. What is the relationship between student hemispheric preference and spatial
ability? Is there a gender and/or grade level difference in the relationship?
3. What is the relationship between student hemispheric preference and verbal
ability? Is there a gender difference in the relationship?
4. What is the relationship between student hemispheric preference and science
achievement? Is there a gender difference in the relationship?

125
5. What is the relationship between student hemispheric preference and attitudes
toward science class? Is there a gender and/or grade level difference in the
relationship?
6. What is the relationship between teacher and student hemispheric preference? Is
there a gender and/or grade level difference in the relationship?
7. Are there any differences in student hemispheric preference by gender and grade
level?
8. Are there any differences in student spatial ability by gender and grade level?
9. Are there any differences in student verbal ability by gender?
10. Are there any differences in student science achievement by gender?
11. Are there any differences in student attitudes toward science class by gender and
grade level?
12. What is the relationship between science teaching strategies and student
hemispheric preference?
Four elementary school science teachers and 133 fourth- and fifth-grade students, 65
fourth graders from two classes and 68 fifth graders from two classes, were purposively
selected for the main study. The four classes were taught by four science teachers. All the
teachers and students were from Liang elementary school located in northern Taiwan.
The data collection process took approximately 2 months. Teacher data sources included
the Teacher Demographics Questionnaire, Human Information Processing Survey, and
classroom observations, whereas student data sources included the Style of Learning and
Thinking, PMA Spatial Relations Test, Chinese language midterm and final exams,
Science midterm and final exams, and Student Attitudes Toward Science Class Survey.

126
Teacher data were collected, organized, and analyzed using descriptive statistics. Teacher
classroom observations were coded and categorized to identify left-, right-, and
whole-brain science teaching strategies. For each teacher, the percentage of instructional
time devoted to each hemispheric category was computed. Student data were collected,
organized, and analyzed using four procedures: descriptive statistics, Pearson Product
Moment Correlations, MANOVA, and ANOVA. In addition, teacher and student data
were collected, organized, and analyzed using confidence intervals for proportion tests. In
the next section, the findings of the study will be discussed in relationship to the research
questions and previous literature.
Discussion of the Research Questions and the Literature
Research Question 1
Research Question 1 is “What is the relationship between science teacher
hemispheric preference and science teaching strategies? Is there a gender difference in
the relationship? ” According to the analysis of teacher responses to the Human
Information Processing Survey and classroom observations, science teacher hemispheric
preference was not related to science teaching strategies. John, Peter, and Lucy
demonstrated an integrated-brain preference—meaning they were using both the left and
right hemispheres simultaneously—but they seemed to prefer left-brain, right-brain, and
left-brain teaching strategies, respectively. No clear relationships between John’s, Peter’s,
and Lucy’s hemispheric preferences and teaching strategies were found. In contrast, Betty
demonstrated a mixed-brain preference—meaning she was using either the left or right
hemisphere depending upon the situation. However, Betty seemed to prefer left-brain

127
teaching strategies. Thus, there did not appear to be any relationship between Betty’s
hemispheric preference and her teaching strategies. Based upon the results, it appears that
science teacher hemispheric preference was not related to science teaching strategies.
In addition, teacher hemispheric preference did not appear to be related to gender.
The two male teachers, John and Peter, exhibited an integrated-brain preference, whereas
the two female teachers, Betty and Lucy, exhibited a mixed-brain and an integrated-brain
preference, respectively. There did not appear to be any relationship between teacher
hemispheric preference and gender.
However, gender seemed to be related to overall left-brain teaching strategies and
overall right-brain teaching strategies. In particular, the two male teachers employed
more types of right-brain teaching strategies for a greater percentage of instructional time
compared to the two female teachers. In contrast, the two female teachers employed more
types of left-brain teaching strategies for a greater percentage of instructional time
compared to the two male teachers. Lastly, the findings suggest that gender seemed to be
related to the specific teaching strategy of using experiments. In particular, the two male
teachers preferred to use experiments with student control—a right-brain teaching
strategy—whereas the two female teachers preferred to use experiments with teacher
control—a left-brain teaching strategy. Based upon the results, the male teachers seemed
to prefer right-brain teaching strategies and the female teachers seemed to prefer
left-brain teaching strategies and this gender difference was particularly evident with
regard to student or teacher control of experiments. Thus, gender was related to science
teaching strategies.

128
Another factor that may contribute to teaching strategy preference is teaching
experience. For example, the females who tended to use the left-brain teaching strategies
had extensive teaching experience but only 3 years were spent teaching science. Perhaps,
they were less confident in their science teaching ability and therefore tended to use more
left-brain teaching strategies (e.g., lecture, teacher control of experiments, etc.). In
contrast, Peter preferred right-brain teaching strategies. Perhaps, the fact that Peter had 17
years of teaching experience and 16 of these years were teaching science may have
contributed to his confidence in teaching science and his extensive use of right-brain
teaching strategies such as experiments with student control. Although John preferred
left-brain teaching strategies, he employed more types of right-brain teaching strategies
for a greater percentage of instructional time compared to the two female teachers.
Perhaps, the fact that John had 18 years of teaching experience and 10 of these years
were teaching science also may have contributed to his confidence in teaching science
and the use of right-brain teaching strategies such as experiments with student control.
Research Question 2
Research Question 2 is “What is the relationship between student hemispheric
preference and spatial ability? Is there a gender and/or grade level difference in the
relationship?” According to the analysis of student responses to the Style of Learning and
Thinking and the PMA Spatial Relations Test, student right-brain preference was slightly
positively related to spatial ability but did not reach the significance level. According to a
number of researchers (Botkin et al., 1980; Cherry et al., 1989; Richards, 1984; Vitale,
1982), the right hemisphere is specialized for spatial, concrete, and visual processing.
Spatial ability is generally attributed to the right hemisphere but the relationship between

129
student right-brain preference and spatial ability was not found in the current study. A
possible explanation that may account for the lack of a relationship between student
right-brain preference and spatial ability is that a right-brain preference may not have
developed in many of the fourth-grade and fifth-grade students in the current study. The
results of the current study indicate that a high percentage of the students in grades 4 and
5 exhibited no hemispheric preference. There was no significant relationship between
student hemispheric preference and spatial ability by gender or grade level.
Research Question 3
Research Question 3 is “What is the relationship between student hemispheric
preference and verbal ability? Is there a gender difference in the relationship?” According
to the analysis of student responses to the Style of Learning and Thinking and the
Chinese language exams, student hemispheric preference was significantly and positively
related to verbal ability. In particular, students with a stronger whole-brain preference
tended to exhibit better verbal ability, whereas the left-brain and right-brain preferences
showed little relationship with verbal ability. This finding appears to be consistent with
Fountain and Fillmer’s (1987) research. They found that fourth-grade students with an
integrated-brain preference achieved significantly higher on reading, mathematics,
language, and a basic battery of tests compared to fourth-grade students with either
left-brain or right-brain preference. However, this finding is not consistent with the
research of Van Giesen et al. (1987). They found that students with a left-brain preference
achieved better on a reading vocabulary achievement test compared to students with a
right-brain preference or an integrated-brain preference. In addition, they found no
significant difference in the scores on a reading comprehension achievement test for

130
students with a left-brain preference, right-brain preference, or an integrated-brain
preference. Moreover, when male students were considered separately from female
students in the current study, there were no significant relationships between left-brain,
right-brain, or whole-brain preference and verbal ability.
Research Question 4
Research Question 4 is “What is the relationship between student hemispheric
preference and science achievement?” Is there a gender difference in the relationship?
According to the analysis of student responses to the Style of Learning and Thinking and
the Science exams, student hemispheric preference was significantly and positively
related to science achievement. Students with a stronger whole-brain preference tended to
exhibit better science achievement. However, there was little relationship between
left-brain or right-brain preference and science achievement. Moreover, there was a
gender difference in this relationship. Male students exhibited a positive relationship
between whole-brain preference and science achievement. However, there was no
significant relationship between hemispheric preference and science achievement for
female students.
Research Question 5
Research Question 5 is “What is the relationship between student hemispheric
preference and attitudes toward science class? Is there a gender and/or grade level
difference in the relationship? According to the analysis of student responses to the Style
of Learning and Thinking and Student Attitudes Toward Science Class Survey, student
hemispheric preference was significantly and positively related to student attitudes
toward science class. Students with a stronger whole-brain preference tended to exhibit

131
more positive attitudes toward science class. Moreover, there was no gender difference
with regard to this relationship. However, there was a grade level difference with regard
to this relationship. Only the fourth-grade students exhibited a positive relationship
between whole-brain preference and attitudes toward science class.
Research Question 6
Research Question 6 is “What is the relationship between teacher and student
hemispheric preference? Is there a gender and/or grade level difference in the
relationship?” According to the analysis of teacher responses to the Human Information
Processing Survey and student responses to the Style of Learning and Thinking, teacher
hemispheric preferences were not related to student hemispheric preferences. In addition,
the findings indicate that there were no relationships between teacher and student
hemispheric preference for male students or female students. Furthermore, the findings
indicate that there were no relationships between teacher and student hemispheric
preference for fourth graders or fifth graders.
Research Question 7
Research Question 7 is “Are there any differences in student hemispheric preference
by gender and grade level?” According to the analysis of student responses to the Style of
Learning and Thinking, there were significant gender and grade level differences for
student hemispheric preference. Based upon the results, female students tended to exhibit
a stronger whole-brain preference compared to male students. This finding confirms the
research of Fountain and Fillmer (1987) who found that a significantly greater number of
female students compared to male students had an integrated-brain preference. In
addition, the findings of the current study indicate that fifth-grade students tended to

132
exhibit a stronger right-brain preference compared to fourth-grade students, and
fifth-grade students tended to exhibit a stronger left-brain preference compared to
fourth-grade students. These findings are not consistent with the research of Fountain and
Fillmer who found no significant difference between fourth- and seventh-grade students
with regard to hemispheric preference.
Evidence indicates that student hemispheric preference was related to gender and
grade level. Overall, a higher percentage of the fourth-grade and fifth-grade students
exhibited a right-brain preference. This may suggest that the right hemisphere develops
earlier in both male and female students. Also, the percentage of fourth-grade male
students with a left-brain preference was similar to that of fourth-grade female students
with a left-brain preference and the percentage of fourth-grade male students with a
right-brain preference was similar to that of fourth-grade female students with a
right-brain preference. However, the percentage of fifth-grade female students with a
left-brain preference was much higher compared to fifth-grade male students with a
left-brain preference. Similarly, the percentage of fifth-grade male students with a
right-brain preference was much higher compared to fifth-grade female students with a
right-brain preference. This may suggest that the left hemisphere develops earlier in
female students and the right hemisphere develops earlier in male students. These
findings appear to be consistent with the conclusions of Levy and Heller (1992) who
suggested that the right hemisphere matures earlier in males and the left hemisphere
matures earlier in females. Moreover, the percentage of fifth-grade male students with a
right-brain preference was much higher compared to fourth-grade male students with a
right-brain preference. Similarly, the percentage of fifth-grade female students with a

133
left-brain preference was much higher compared to fourth-grade female students with a
left-brain preference. This may suggest that fifth-grade male students exhibited a stronger
right-brain preference compared to fourth-grade male students, and fifth-grade female
students exhibited a stronger left-brain preference compared to fourth-grade female
students.
Other evidence related to the lack of hemispheric preference provides insight into
the development of brain lateralization in males and females. For fourth-grade students,
the percentage of female students with no hemispheric preference was much lower
compared to male students with no hemispheric preference. This may suggest that brain
lateralization in female students occurs earlier compared to male students. This finding is
consistent with the suggestion made by Berlin (1978) and James (2007) that female
brains lateralize earlier compared to male brains. However, for the fifth-grade, the
percentage of male students with no hemispheric preference was considerably less
compared to fourth-grade male students with no hemispheric preference and much lower
compared to fifth-grade female students with no hemispheric preference. Consequently, a
reasonable conjecture may be that fifth-grade is a sensitive time for brain lateralization
for male students. This conjecture warrants further investigation with a larger sample of
fourth- and fifth-grade students.
Research Question 8
Research Question 8 is “Are there any differences in student spatial ability by
gender and grade level?” According to the analysis of student responses to the PMA
Spatial Relations Test, there were significant gender differences related to student spatial
ability; however, there were no grade level differences related to spatial ability. In

134
particular, male students tended to perform better related to spatial ability compared to
female students. This finding confirms the conclusions of Maccoby and Jacklin (1974)
and Hyde (1981) who suggested that males had an advantage related to mathematical and
spatial ability.
Moreover, the male advantage related to spatial ability found in the current study is
consistent with the work of Linn and Petersen (1985) who suggested that sex differences
in spatial ability may be detected prior to adolescence for spatial perception and mental
rotation. In contrast, Maccoby and Jacklin (1974) suggested that sex differences in spatial
ability emerge during adolescence. According to Berlin (1978) and Voyer et al. (1995),
the age of emergence of sex differences is related to the test and the aspects of the
construct embedded in the test. For example, a greater male advantage related to the
generic mental rotation task and the PMA Spatial Relations Test appears around
10-years-old. The age of the fourth- to fifth-grade elementary school students in the
current study were 9- to 11-years-old. Thus, the findings in the current study seem be to
consistent with the conclusions of Berlin and Voyer et al. that the emergence of sex
differences in spatial ability depend upon the instruments used to measure spatial ability.
There were no differences between fourth-grade students and fifth-grade students related
to spatial ability in the current study.
Research Question 9
Research Question 9 is “Are there any differences in student verbal ability by
gender?” According to the analysis of student responses to the Chinese language exams,
there were significant gender differences related to student verbal ability. Female students
tended to perform better related to verbal ability.
135
The gender differences in the current study are consistent with the conclusions of
Maccoby and Jacklin (1974) and Hyde (1981) who suggested that females had an
advantage for verbal ability. Similarly, Van Giesen et al. (1987) found that female
students achieved significantly greater scores on both vocabulary and comprehension
tests compared to male students. Moreover, Maccoby and Jacklin suggested that females
had an advantage for verbal ability and that this advantage begins to appear around the
age of 11-years-old. However, in contrast, Hyde and Linn (1988) concluded that there
were no sex differences related to verbal ability at all ages from childhood to adulthood.
Research Question 10
Research Question 10 is “Are there any differences in student science achievement
by gender?” According to the analysis of student responses to the Science exams, there
were no gender differences in student science achievement. This finding is consistent
with the research of Hyde and McKinley (1997) who suggested that any gender
differences in science achievement are small.
Research Question 11
Research Question 11 is “Are there any differences in student attitudes toward
science class by gender and grade level?” According to the analysis of student responses
to the Student Attitudes Toward Science Class Survey, there were no gender differences
nor grade level differences for student attitudes toward science class. That is, there were
no differences between male students and female students related to attitudes toward
science class. In addition, there were no differences between fourth-grade students and
fifth-grade students related to attitudes toward science class.

136
Research Question 12
Research Question 12 is “What is the relationship between teacher science teaching
strategies and student hemispheric preference?” According to the analysis of classroom
observations and student responses to the Style of Learning and Thinking, Generally,
science teaching strategies were not related to student hemispheric preferences. However,
there was an alignment between Betty’s right-brain teaching strategies and student
right-brain preference as well as Betty’s whole-brain teaching strategies and student
whole-brain preference. In addition, there was an alignment between Peter’s right-brain
teaching strategies and student right-brain preference. Thus, some teachers’ science
teaching strategies were partially related to student hemispheric preferences.
Table 5.1 is provided to summarize the findings for the main study for each of the 12
research questions.

137
Question Relationships Results
▪ Science teacher hemispheric preference was not related to science teaching strategies.
▪ Gender was not related to science teacher hemispheric preference.
1
▪ Gender was related to science teaching strategies.
▪ Male teachers employed more types of right-brain teaching strategies for a greater percentage of instructional time.
▪ Female teachers employed more types of left-brain teaching strategies for a greater percentage of instructional time.
▪ Student hemispheric preference was not related to spatial ability.
2
▪ There was no significant relationship between student hemispheric preference and spatial ability by gender or grade level.
▪ Student hemispheric preference was significantly and positively related to verbal ability.
▪ Students with a stronger whole-brain preference tended to exhibit better verbal ability.
3
▪ When male students were considered separately from female students, there were no significant relationships between hemispheric preferences and verbal ability.
Continued
Table 5.1: A summary of the findings for the 12 research questions for the main study.

138
Table 5.1 continued
▪ Student hemispheric preference was significantly and positively related to science achievement.
▪ Students with a stronger whole-brain preference tended to exhibit better science achievement.
4
▪ There was a gender difference in the relationship between student hemispheric preference and science achievement.
▪ Male students exhibited a positive relationship between whole-brain preference and science achievement.
▪ Student hemispheric preference was significantly and positively related to student attitudes toward science class.
▪ Students with a stronger whole-brain preference tended to exhibit more positive attitudes toward science class.
▪ There were no gender differences in the relationships between student hemispheric preferences and attitudes toward science class.
5
▪ There was a grade level difference in the relationship between student hemispheric preference and attitudes toward science class.
▪ Fourth-grade students exhibited a positive relationship between whole-brain preference and attitudes toward science class.
▪ Teacher hemispheric preferences were not related to student hemispheric preferences.
▪ There were no relationships between teacher and student hemispheric preferences for male students or female students.
6
▪ There were no relationships between teacher and student hemispheric preferences for fourth graders or fifth graders.
Continued

139
Table 5.1 continued
▪ There was a gender difference for student hemispheric preference.
▪ Female students tended to exhibit a stronger whole-brain preference compared to male students.
▪ There were grade level differences for student hemispheric preferences.
▪ Fifth-grade students tended to exhibit a stronger right-brain preference compared to fourth-grade students.
▪ Fifth-grade students tended to exhibit a stronger left-brain preference compared to fourth-grade students.
▪ Student hemispheric preferences were related to gender.
▪ Right hemisphere develops earlier in male students.
▪ Left hemisphere develops earlier in female students.
▪ Brain lateralization in female students occurs earlier compared to male students.
7
▪ Student hemispheric preferences were related to gender and grade level
▪ Fifth-grade male students exhibited a stronger right-brain preference compared to fourth-grade male students.
▪ Fifth-grade female students exhibited a stronger left-brain preference compared to fourth-grade female students.
▪ There was a gender difference related to student spatial ability.
▪ Male students tended to perform better related to spatial ability compared to female students.
8
▪ There were no grade level differences related to student spatial ability.
Continued

140
Table 5.1 continued
9 ▪ There were gender differences related to student verbal ability.
▪ Female students tended to perform better related to verbal ability compared to male students.
10 ▪ There were no gender differences in student science achievement.
▪ There were no gender differences for student attitudes toward science class.
11
▪ There were no grade level differences for student attitudes toward science class.
12 ▪ Generally, science teaching strategies were not related to student hemispheric preferences.
▪ Science teaching strategies for some teachers were partially related to student hemispheric preferences.
▪ There was alignment between science teaching strategies and student hemispheric preference for Betty and Peter.
Figure 5.1 provides an overview of the findings for the main study. Dashed lines
present partially significant results, whereas solid lines present significant results in the
current study.

141
Mixed-brain preference
Spatial ability
Science achievement
Right-brain preference
Attitudes toward science class Verbal
ability
Whole-brain teaching strategies
Right-brain teaching strategies
Male
Hemispheric preference
Left-brain preference
Female
Female
Hemispheric
Right-brain preference
Left-brain preference
Whole-brain preference
Fifth grade
Integrated-brain preference
Teaching strategies
Left-brain teaching strategies
Fourth grade
Male
preference
Student
Teacher
Figure 5.1: An overview of the findings for the main study.

142
Major Conclusions
The major conclusions from the current study are as follows:
1. Science teaching strategies seem to be related to gender differences. The results
suggest that male teachers preferred right-brain teaching strategies, whereas
female teachers preferred left-brain teaching strategies.
2. Verbal ability, science achievement, and attitudes toward science class seem to
be related to student hemispheric preferences. The results suggest that students
with a stronger whole-brain preference tended to exhibit better verbal ability,
better science achievement, and more positive attitudes toward science class.
Specifically, male students with a stronger whole-brain preference tended to
exhibit better science achievement. In addition, fourth-grade students with a
stronger whole-brain preference tended to exhibit more positive attitudes toward
science class.
3. Student hemispheric preferences seem to be related to gender and grade level
differences. The results suggest that the right hemisphere may develop earlier in
male students and the left hemisphere may develop earlier in female students.
For female students, brain lateralization seems to develop earlier and they tended
to exhibit a stronger whole-brain preference compared to male students.
Fifth-grade students tended to exhibit stronger right-brain and left-brain
preferences compared to fourth-grade students, which may suggest greater brain
lateralization in older students. Fifth-grade male students tended to exhibit a

143
stronger right-brain preference compared to fourth-grade male students;
fifth-grade female students tended to exhibit a stronger left-brain preference
compared to fourth-grade female students.
4. Spatial and verbal ability seem to be related to gender differences. The results
suggest that male students tended to perform better related to spatial ability
compared to female students, whereas female students tended to perform better
related to verbal ability compared to male students.
5. Generally, science teaching strategies were not related to student hemispheric
preference. However, science teaching strategies for 2 teachers were partially
related to student hemispheric preference.
Implications
Teacher Education Programs
The results of this study suggest that male brains and female brains do not mature at
the same time in terms of the development of brain lateralization and brain hemispheric
preference. Also, male students tended to perform better in spatial ability, whereas female
students tended to perform better in verbal ability. Programs should be developed to help
current and future science teachers to understand student differences in brain maturation,
brain lateralization, hemispheric preference, gender differences in cognitive ability, and
hemispheric processing differences related to science teaching strategies. Teachers should
be prepared and encouraged to plan and implement differentiating instruction to
accommodate these differences, providing effective instructional opportunities for all. In
particular, science teachers should be encouraged to use experiments with student control
rather than step-by-step experiments with teacher control.

144
The results of this study suggest that students with a stronger whole-brain preference
tended to exhibit better verbal ability, better science achievement, and more positive
attitudes toward science class. Programs should be developed to help current and future
science teachers understand the importance of incorporating left-brain and right-brain
teaching strategies to stimulate both hemispheres and develop the whole brain. Teacher
preparation and enhancement should help teachers to expand their instructional repertoire
and encourage teachers to design and implement complementary science instruction to
activate both hemispheres.
Curriculum Developers
The results of this study suggest that male teachers preferred right-brain teaching
strategies, whereas female teachers preferred left-brain teaching strategies. Many
educators believe that most contemporary schools are dominated by a left-brain
curriculum, and generally, instructional strategies and teaching materials are based on the
linear, sequential, and analytic functions of the left hemisphere of the brain. The left-brain
educational system may handicap many children who prefer right-brain teaching
strategies. Unfortunately, an unbalanced curriculum often mismatches teaching materials
and teaching strategies with the thinking and learning processes of students. Curriculum
designers should combine left-hemisphere and right-hemisphere teaching materials and
teaching strategies and adapt the curriculum to actively employ both hemispheres. A
balanced curriculum is one that stimulates both hemispheres and is beneficial to all
students, not just the left-brain preference students.

145
Suggestions for Future Research
Based upon the results of the current study, some suggestions for future research
have emerged. Future research could include varied samples and different methodologies.
The results suggest that teacher hemispheric preference was not related to science
teaching strategies. In addition, the results suggest that there were gender differences
related to science teaching strategies. An intensive review of literature has pointed out
that most contemporary schools are dominated by a left-brain curriculum, and generally,
instructional strategies and teaching materials stress a linear, sequential mode of
processing. Possible factors affecting the choice of teaching strategies may be a
biological force (e.g., gender), an educational force (e.g., curriculum), or a social force
(e.g., parental expectation). However, this study did not provide insight into the specific
factors that guided teachers in their choice of science teaching strategies. Therefore, an
exploratory case study could be conducted to explore in detail how and why teaching
strategies are employed by male and female teachers in science classrooms. Further
research may use more qualitative research methods to gather data through multiple ways:
surveys, interviews, classroom observations, and classroom documents.
It would be beneficial to include a larger sample of elementary school science
teachers and students and expand the research to include science teachers and students at
the middle and high school levels. Similar instruments and quantitative research method
could be employed to confirm results and expand the results to other populations.
The current study did not examine the effects of a match between teaching strategies
and student hemispheric preference and a mismatch between teaching strategies and
student hemispheric preference on student science achievement and attitudes toward

146
science class. Therefore, an experimental study could be conducted using several sets of
both matched and mismatched instructional strategies to teach science. Each student may
receive teaching strategies both matched and mismatched to his/her hemispheric
preference, permitting the researcher to determine the effects of matching and
mismatching on each student.
The results of the current study suggest that males tended to perform better in spatial
ability compared to females, whereas females tended to perform better in verbal ability
compared to males. Since the results of the current study did not show the age of
emergence of sex differences in spatial ability and verbal ability, a longitudinal study
could be conducted to determine the age of emergence of sex differences related to spatial
ability and verbal ability. The current research was conducted with fourth-grade and
fifth-grade students; future research could be conducted with first-grade students to
sixth-grade students.
The development of brain lateralization and hemispheric preference may be an
interesting topic for future work. The results from the current study suggest that from
fourth grade to fifth grade, the percentage of left-brain preference and right-brain
preference increases regardless of gender. A longitudinal study could be conducted to
provide insight into how brain lateralization and left-brain, right-brain, and whole-brain
preferences develop for male students and female students from first grade to sixth grade.
Future research could include surveys, interviews, classroom observations, and classroom
documents related to teachers and students. In addition, some technological imaging tools,
such as fMRI or PET, could be used to identify teacher and student hemispheric
preferences.

147
LIST OF REFERENCES Beck, C. R. (2001). Matching teaching strategies to learning style preferences. Teacher Educator, 37(1), 1-15. Bergen, D., & Coscia, J. (2001). Brain research and childhood education: Implications for educators. Olney, MD: Association for Childhood Education International. Berlin, D. F. (1978). The relationship between a developmental theory of brain hemisphere lateralization and age and sex differences in field dependence-independence and visuo-spatial measures (Doctoral dissertation, The Ohio State University, 1978). Dissertation Abstracts International, 39, 6642. Bishop, J. E. (1978). Metric measurement activities to stimulate right-brain learning.
Science and Children, 15(4), 18-20. Blakemore, S.-L., & Frith, U. (2005). The learning brain: Lessons for education. Malden, MA: Blackwell. Bogen, J. E. (1985). The dual brain: Some historical and methodological aspects. In D. F. Benson, & E. Zaidel (Eds.), The dual brain: Hemispheric specialization in humans (pp. 27-43). New York: Guilford Press. Botkin, J. W., Keen, J. P., McClellan, J., & Robinette, H. (1980). Towards more effective
teaching and learning: What can research in the brain sciences contribute? A survey of some recent research efforts and their implications for education. (ERIC Document Reproduction Service No. ED200402)
Brennan, P. K. (1984). An analysis of the relationships among hemispheric preference
and analytic/global cognitive style, two elements of learning style, method of

148
instruction, gender, and mathematics achievement of tenth grade geometry students. Dissertation Abstracts International, 45(11), 3271A. (UMI No. 8500175)
Bruggenman, K. M., & Wehrman, M. M. (1987). A handbook of strategies to aid the elementary teacher when working with right-brained learners. Unpublished master’s thesis, University of Dayton, OH. Chapman, R. (1998). The arts improve student performance. The Education Digest, 57(3), 58-60. Chapman, R. (1998). The arts improve student performance. The Educational Digest,
57(3), 58-60. Cherry, C., Godwin, D., & Staples, J. (1989). Is the left brain always right? A guide to whole child development. Belmont, CA: David S. Lake. Chudzinski, P. M. (1988). A correlation study between hemisphericity tests: Style of
learning and thinking and brain preference indicator. Unpublished master’s thesis, State University of New York, Oswego.
Cooke, J. K., & Haipt, M. (1986). Thinking with the whole brain: An integrative teaching/learning model (K-8). Washington, DC: National Education Association. Crawford, M., & Chaffin, R. (1997). The meanings of difference: Cognition in social and cultural context. In P. J. Caplan, M. Crawford, J. S. Hyde, & J. T. E. Richardson (Eds.), Gender differences in human cognition (pp. 81-130). New York: Oxford University Press. Creswell, J. W. (2008). Educational research: Planning, conducting, and evaluating quantitative and qualitative research (3 ed.). rd Upper Saddle River, NJ: Pearson/Merrill Prentice Hall. Dhindsa, H. S., & Chung, G. (2003). Attitudes and achievement of Bruneian science students. International Journal of Science Education, 25(8), 907-922. Diamond, M. C. (1988). Enriching heredity: The impact of the environment on the anatomy of the brain. New York: Free Press.

149
Douglass, C. B. (1979). Making biology easier to understand. American Biology Teacher, 41(5), 277-299.
Dunn, R., Sklar, R., I., Bruno, J., & Beaudry, J. S. (1990). Effects of matching and
mismatching minority developmental college students’ hemispheric preferences on mathematics scores. Journal of Educational Research, 83(5), 283-288.
Ellis, A. K. (2001). Research on educational innovations. Larchmont, NY: Eye on Education. Erlauer, L. (2003). The brain-compatible classroom: Using what we know about learning
to improve teaching. Alexandria, VA: Association for Supervision and Curriculum Development.
Estes, D. G. (2001). Strengthen your students’ learning by using the latest brain research
(Grades K-8): Resource handbook. Bellevue, WA: Bureau of Education & Research. Fahey, J. A. (1992). Effects of lunchtime instruction on student attitude toward science
(Doctoral dissertation, University of Virginia, 1992). Dissertation Abstracts International, 54, 1652.
Finger, S. (1994). Origins of neuroscience: A history of explorations into brain function.
New York: Oxford University Press. Fountain, J., C., & Fillmer, H. T. (1987). Hemispheric brain preference: What are the
educational implications? Reading Improvement, 24(4), 252-255. Frank, M. (1984). A child’s brain: The impact of advanced research on cognitive and
social behaviors. New York: Haworth Press. Fuster, J. M. (1997). The prefrontal cortex: Anatomy, physiology, and neuropsychology of
the frontal lobe (3rd ed.). Philadelphia: Lippincott-Raven. Gadzella, B. M. (1995). Differences in academic achievement as a function of scores on
hemisphericity. Perceptual & Motor Skills, 81(1), 153-154.

150
Gazzaniga, M. S., Ivry, R. B., & Mangun, G. R. (2002). Cognitive neuroscience: The biology of the mind (2nd ed.). New York: Norton.
Grady, M. P. (1984). Teaching and brain research: Guidelines for the classroom. New
York: Longman. Gur, R., Turetsky, B., Matsui, M., Yan, M., Bilker, W., Hughett, P., & Gur, R. E. (1999).
Sex differences in brain gray and white matter in healthy young adults: Correlations with cognitive performance. The Journal of Neuroscience, 19(10), 4065-4072.
Gurian, M., Henley, P., & Trueman, T. (2001). Boys and girls learn differently: A guide
for teachers and parents. San Francisco: Jossey-Bass. Gurian, M., & Stevens, K. (2004). With boys and girls in mind. Educational Leadership,
62(3), 21-26. Gurian, M., & Stevens, K. (2005). The minds of boys: Saving our sons from falling
behind in school and life. San Francisco, CA: Jossey-Bass. Gutman, S. A. (2001). Quick reference neuroscience for rehabilitation professionals: The
essential neurologic principles underlying rehabilitation practice. Thorofare, NJ: Slack.
Halpern, D. F. (2000). Sex differences in cognitive abilities (3rd ed.). Mahwah, NJ:
Erlbaum. Hardiman, M. M. (2003). Connecting brain research with effective teaching: The
Brain-Targeted Teaching Model. Lanham, MD: Scarecrow Press. Hellige, J. B. (1983). The study of cerebral hemisphere differences: Introduction and
overview. In J. B. Hellige (Ed.), Cerebral hemisphere asymmetry: Method, theory, and application (pp. 1-17). New York: Praeger.

151
Henry, G. E. (1996). A study investigating student and teacher attitudes toward science and science education. Dissertation Abstracts International, 57(10), 4313A. (UMI No. 9709901)
Herrmann, N. (1990). The creative brain (2nd ed.). Lake Lure, NC: Brain Books. Hider, R. A., & Rice, D. R. (1986). A comparison of instructional mode on the attitude
and achievement of fifth and sixth grade students in science. (ERIC Document Reproduction Service No. ED265078)
Hines, M. (2007). Do sex differences in cognition cause the shortage of women in science?
In S. J. Ceci & W. M. Williams (Eds.), Why aren’t more women in science? Top researchers debate the evidence (pp. 101-112). Washington, DC: American Psychological Association.
Hyde, J. S. (1981). How large are cognitive gender differences? American Psychologist,
36(8), 892-901. Hyde, J. S. (1990). Meta-analysis and the psychology of gender differences. Signs:
Journal of Women in Culture & Society, 16(1), 55-73. Hyde, J. S., & Linn, M. C. (1988). Gender differences in verbal ability: A meta-analysis.
Psychological Bulletin, 104(1), 53-69. Hyde, J. S., & McKinley, N. M. (1997). Gender differences in human cognition: Results
from meta-analyses. In P. J. Caplan, M. Crawford, J. S. Hyde, & J. T. E. Richardson (Eds.), Gender differences in human cognition (pp. 30-51). New York: Oxford University Press.
Jackson, I. (1998). A comparison of whole brain teaching and right brain teaching in
eighth grade science. Unpublished master’s thesis, Mercer University, Atlanta, GA. James, A. N. (2007). Teaching the male brain: How boys think, feel, and learn in school.
Thousand Oaks, CA: Corwin Press.

152
Jarsonbeck, S. (1984). The effects of a right-brain mathematics curriculum on low-achieving fourth-grade students. Dissertation Abstracts International, 45(9), 2791A. (UMI No. 8427965)
Jensen, E. (1998). Teaching with the brain in mind. Alexandria, VA: Association for
Supervision and Curriculum Development. Kandel, E. R., Schwartz, J. H., & Jessell, T. M. (1995). Essentials of neural science and
behavior. Norwalk, CT: Appleton & Lange. Kane, N., & Kane, M. (1979). Comparison of right & left hemisphere functions. Gifted
Child Quarterly, 23(1), 157-167. King, K., & Gurian, M. (2006). The brain--His and hers. Educational Leadership, 64(1),
59-59. Kovalik, S. J., & Olsen, K. D. (2001). Exceeding expectations: A user’s guide to
implementing brain research in the classroom. Covington, WA: Susan Kovalik & Associates.
Lee, S. K. (2005). The effects of a kit-based science curriculum and teacher
characteristics on students’ attitude toward science. Dissertation Abstracts International, 66(08), 2880A. (UMI No. 3186909)
Levy, J., & Heller, W. (1992). Gender differences in human neuropsychological function.
In A. A. Gerall, H. Moltz, & I. L. Ward (Eds.), Sexual differentiation (pp. 245-274). New York: Plenum Press.
Lewallen, M. (1985). An annotated bibliography of the literature dealing with the
incorporation of right brain learning into left brain oriented schools. (ERIC Document Reproduction Service No. ED258722)
Lewis, L. S. (2001). The effects of a cross-age peer teaching model on high school
students’ attitudes toward science: An experimental investigation in a K-12 school. Dissertation Abstracts International, 62(09), 2940A. (UMI No. 3027360)

153
Lindelow, J. (1983). The emerging science of individualized instruction. A survey of findings on learning styles, brain research, and learning time with implications for administrative action. (ERIC Document Reproduction Service No. ED229827)
Linn, M. C., & Petersen, A. C. (1985). Emergence and characterization of sex differences
in spatial ability: A meta-analysis. Child Development, 56(6), 1479-1498. Lucas, R. W. (2003). The creative training idea book: Inspired tips and techniques for
engaging and effective learning. New York: American Management Association. Maccoby, E. E., & Jacklin, C. N. (1974). The psychology of sex differences. Stanford, CA:
Stanford University Press. Martin, G. N. (2006). Human neuropsychology (2nd ed.). New York: Pearson/Prentice
Hall. Marxer, J. M. (1988). Teaching strategies designed to integrate the right brain and left
brain thinking processes. Unpublished master’s thesis, The College of Saint Thomas, Fort Worth, TX.
McCarthy, B. (1987). The 4MAT system: Teaching to learning styles with right/left mode
techniques. Oak Brook, IL: EXCEL. Miller, C. A. (1988). Do left or right brain training exercises have the greater effect upon
college calculus achievement? (ERIC Document Reproduction Service No. ED312122)
Moir, A., & Jessel, D. (1992). Brain sex: The real difference between men and women.
New York: Dell. Monhardt, L. C. (1998). The effect of teaching strategies focusing on student ideas,
parent partnerships, and children’s literature on elementary students’ perceptions about and attitudes toward science. Dissertation Abstracts International, 59(09), 3395A. (UMI No. 9904326)

154
Moore, J. M. (2001). The effects of inquiry-based summer enrichment activities on rising eighth graders’ knowledge of science processes, attitude toward science, and perceptions of scientists. Dissertation Abstracts International, 62(04), 1330A. (UMI No. 3011938)
Nash, J. (1997). Fertile minds. Time, 149(5), 48-56. Powell, W., & Kusuma-Powell, O. (2007). Differentiating instruction for girls and boys.
International Schools Journal, 26(2), 7-21. Richards, R. G. (1984, April). Innovative right brain teaching techniques. Paper presented
at the annual meeting of the Council for Exceptional Children, Washington, DC. (ERIC Document Reproduction Service No. ED246632)
Richards, R. G. (1993). Visual activities: A manual to enhance the development of visual
skills. Novato, CA: Academic Therapy. Rose, B. (1982). Learning spurts and plateaus. In T. J. Reifschneider, R. S. Ristow, & G.
Steinley (Eds.), The human brain: Cognition in education (pp.45-49). (ERIC Document Reproduction Service No. ED234035)
Rubenzer, R. L. (1982). Educating the other half: Implications of left/right brain research.
(ERIC Document Reproduction Service No. ED224268) Sager, M. A. (1996). The effects of gender affirmative supplemental science material on
sixth-grade students’ attitudes toward science and science careers. Dissertation Abstracts International, 57(04), 1548A. (UMI No. 9627522)
Saleh, M. (2001). Brain hemisphericity and academic majors: A correlation study.
College Student Journal, 35(2), 193-200. Sax, L. (2005). Why gender matters: What parents and teachers need to know about the
emerging science of sex differences. New York: Doubleday.

155
Shannon, M., & Rice, D. R. (1983). A comparison of hemispheric preference between high ability and low ability elementary children. Educational Research Quarterly, 7(3), 7-15.
Shore, R. (2003). Rethinking the brain: New insights into early development. New York:
Families and Work Institute. Smilkstein, R. (2003). We’re born to learn: Using the brain’s natural learning process to
create today’s curriculum. Thousand Oaks, CA: Corwin Press. Smith, G. E. M. (1991). A comparative study of elementary students’ achievement,
process skills, and attitude toward science when receiving hands-on vs. traditional science instruction (Doctoral dissertation, South Carolina State University, 1991). Dissertation Abstracts International, 53, 1759.
Sonnier, I. L. (1982). Holistic education: How I do it. College Student Journal, 16(1),
64-69. Sonnier, I. L., & Kemp, J. B. (1980). Teach the left brain and only the left brain
learns--Teach the right brain and both brains learn. Southern Journal of Educational Research, 14(1), 63-70.
Sousa, D. A. (2006). How the brain learns: A classroom teacher’s guide (3rd ed.).
Thousand Oaks, CA: Corwin Press. Sprenger, M. (2007). Becoming a “wiz” at brain-based teaching: How to make every
year your best year (2nd ed.). Thousand Oaks, CA: Corwin Press. Springer, S. P., & Deutsch, G. (1993). Left brain, right brain (4th ed.). New York: W.H.
Freeman. Springer, S. P., & Deutsch, G. (1998). Left brain, right brain: Perspectives from cognitive
neuroscience. New York: Freeman.

156
Sylwester, R. (1995). A celebration of neurons: An educator’s guide to the human brain. Alexandria, VA: Association for Supervision and Curriculum Development.
Sylwester, R. (2005). How to explain a brain: An educator’s handbook of brain terms and
cognitive processes. Thousand Oaks, CA: Corwin Press. Taggart, W., & Torrance, E. P. (1984). Human Information Processing Survey:
Administrator’s manual. Bensenville, IL: Scholastic Testing Service. Thatcher, R. W., Walker, R. A., & Giudice, S. (1987). Human cerebral hemispheres
develop at different rates and ages. Science, 236(4805), 1110-1113. Thurstone, T. G. (1962). PMA (Primary Mental Abilities) Grade 4-6 (rev. ed.). Chicago:
Science Research Associates. Thurstone, T. G. (1965). PMA (Primary Mental Abilities): Technical report. Chicago:
Science Research Associates. Torrance, E. P. (1982). Hemisphericity and creative functioning. Journal of Research and
Development in Education, 15(3), 29-37. Torrance, E. P. (1988). Style of Learning and Thinking: Administrator’s manual.
Bensenville, IL: Scholastic Testing Service. Torrance, E. P., Taggart, B., & Taggart, W. (1984a). Human Information Processing
Survey [kit]. Bensenville, IL: Scholastic Testing Service. Torrance, E. P., Taggart, B., & Taggart, W. (1984b). Human Information Processing
Survey: Strategy and tactics profiles booklet. Bensenville, IL: Scholastic Testing Service.
Turner, D. L. (1999). The effects of whole class right and left brain hemisphere teaching
styles on social studies achievement in fourth grade. Unpublished master’s thesis, Mercer University, Atlanta, GA.

157
Van Giesen, A. M., Bell, M. L., & Roubinek, D. L. (1987). Comparing right and left brain dominant students on reading achievement scores. Reading Improvement, 24(4), 267-272.
Vitale, B. M. (1982). Unicorns are real: A right-brained approach to learning. Rolling
Hills Estates, CA: Jalmar Press. Voyer, D. (1996). On the magnitude of laterality effects and sex differences in functional
lateralities. Laterality, 1(1), 51-84. Voyer, D., Voyer, S., & Bryden (1995). Magnitude of sex differences in spatial abilities: A
meta-analysis and consideration of critical variables. Psychological Bulletin, 117(2), 250-270.
Williams, L. V. (1983). Teaching for the two-sided mind: A guide to right brain/left brain
education. New York: Simon & Schuster. Wolfe, P., & Brandt, R. (1998). What do we know from brain research? Educational
Leadership, 56(3), 8-13.

158
APPENDIX A
STUDENT ATTITUDES TOWARD SCIENCE CLASS

Student Name: Date:
School: Grade Level: Class:
ATTITUDES TOWARD SCIENCE CLASS
Directions: Each of the statements expresses a feeling that a person has about science class.
Please indicate whether you disagree or agree with the statement by circling one of the
following for each statement:
SD Strongly Disagree U Undecided S Strongly Agree
D Disagree A Agree
1 In science class, doing experiments is boring. SD D U A SA
2 In science class, experiments are difficult. SD D U A SA
3 In science class, listening to lectures from the teacher is interesting. SD D U A SA
4 I usually understand what is taught in my science class. SD D U A SA
5 The experiments I do in science class are useful. SD D U A SA
6 In science class, the teacher’s lectures do not help me to learn science. SD D U A SA
7 The questions in the science workbook are easy for me. SD D U A SA
8 In science class, I learn more science when I work in a group. SD D U A SA
9 I enjoy reading the science textbook. SD D U A SA
10 I do not like answering the questions in my science workbook. SD D U A SA
11 I do not like group work in science class. SD D U A SA
12 The material in the science textbook is hard for me. SD D U A SA
13 I would enjoy school more if there were no science class. SD D U A SA
159

160
14 I like when the teacher teaches our science class outside. SD D U A SA
15 I am afraid to answer questions in science class. SD D U A SA
16 During science class, I like to read science posters. SD D U A SA
17 My science class is interesting. SD D U A SA
18 Science class is hard for me. SD D U A SA
19 In science class, watching a science film on TV is boring. SD D U A SA
20 Science class is a waste of time. SD D U A SA
21 Science class provides me with knowledge to use in my daily life. SD D U A SA
22 I usually get good scores in science class. SD D U A SA
23 In science class, science posters do not help me to learn science. SD D U A SA
24 I like to do experiments in science class. SD D U A SA
25 I don’t like science class. SD D U A SA
26 The material in the science textbook helps me to learn science. SD D U A SA
27 The questions in the science workbook do not help me to learn science. SD D U A SA
28 In science class, watching a science film on TV helps me to learn science. SD D U A SA
29 I do not like field trips in my science class. SD D U A SA
30 In my science class, field trips do not help me to learn science. SD D U A SA
31 It is easy for me to understand the teacher’s lectures in science class. SD D U A SA
32 I look forward to science class. SD D U A SA

161
APPENDIX B
TEACHER DEMOGRAPHICS QUESTIONNAIRE

162
TEACHER DEMOGRAPHICS QUESTIONNAIRE
Name:
Class:
Gender: □ Male □ Female
Age:
Type of Degree: □ Bachelor’s degree □ Master’s degree □ Ph.D.
Major:
Current teaching:
Grade(s):
Subject(s):
Number of years science teaching:
Number of years teaching: