
Right-hemispheric brain activation correlates to language performance

A Lagrangian Climatology of Tropical Moisture Exports to the Northern HemisphericExtratropics
PETER KNIPPERTZ* AND HEINI WERNLI1
Institute for Atmospheric Physics, Johannes Gutenberg University Mainz, Mainz, Germany
(Manuscript received 6 July 2009, in final form 17 September 2009)
ABSTRACT
Case studies have shown that heavy precipitation events and rapid cyclogenesis in the extratropics can be
fueled by moist and warm tropical air masses. Often the tropical moisture export (TME) occurs through
a longitudinally confined region in the subtropics. Here a comprehensive climatological analysis of TME is
constructed on the basis of seven-day forward trajectories started daily from the tropical lower troposphere
using 6-hourly 40-yr ECMWF Re-Analysis (ERA-40) data from the 23-year period 1979–2001. The objective
TME identification procedure retains only those trajectories that reach a water vapor flux of at least 100
g kg21 m s21 somewhere north of 358N. The results show four distinct activity maxima with different sea-
sonal behavior: (i) The ‘‘pineapple express,’’ which connects tropical moisture sources near Hawaii with
precipitation near the North American west coast, has a marked activity maximum in boreal winter. (ii) TME
over the west Pacific is largest in summer, partly related to the East Asian monsoon and the mei-yu–baiu front.
This region alone is responsible for a large portion of TME across 358N. (iii) The narrow activity maximum
over the Great Plains of North America is rooted over the Gulf of Mexico and the Caribbean Sea and has
a clear maximum in summer and spring. (iv) TME over the western North Atlantic shows the smallest annual
cycle with a maximum in winter and autumn. The interannual variability of (i) and (iv) is significantly
modulated by El Nino. Over the African–European–Asian region, high orographic barriers impede TME. A
typical TME trajectory evolution is poleward and quasi-horizontal in the subtropics and then more eastward
and upward in the southern midlatitudes, where TME contributes up to 60% to climatological precipitation.
The TME dataset presented here can serve as a basis for future studies on extreme events.
1. Introduction
Horizontal and vertical transports of water vapor in
the atmosphere are an important part of the general
circulation and crucial for the earth’s water and energy
budgets (Peixoto and Oort 1992). In a zonally averaged
sense, the main source for atmospheric moisture is ocean
evaporation in the region of the subsiding branches of
the Hadley circulation around 258N/S. The equator-
ward parts of the large subtropical maritime highs are
located in this region, where evaporation exceeds pre-
cipitation by as much as 5 mm day21 (Kallberg et al.
2005). The main transport pathways away from these
source regions are into the midlatitude storm tracks
(mainly poleward of 308N/S) and with the trade winds
into the intertropical convergence zone (ITCZ; mainly
equatorward of 208N/S). Interestingly, if the zonal cir-
culation is averaged in a quasi-Lagrangian sense on dry
or moist isentropes instead of pressure surfaces, the re-
sulting meridional mass streamfunction indicates a di-
rect circulation from the tropics into high latitudes aloft
(Walker and Schneider 2006; Pauluis et al. 2008).
Zonal cross sections of the climatological meridional
water vapor transport along 358N illustrate distinct lon-
gitudinal and seasonal variations of this general pat-
tern (Fig. 1). The Azores high dominates the subtropical
North Atlantic sector during all seasons, resulting in pole-
ward moisture transports between the Rocky Mountains
and about 308W and equatorward transports over the
eastern North Atlantic, the Mediterranean region, and
parts of Asia, where meridional circulations are hin-
dered by significant orographic barriers. There are
* School of Earth and Environment, University of Leeds, Leeds,
United Kingdom.1 Institute for Atmospheric and Climate Science, ETH Zurich,
Zurich, Switzerland.
Corresponding author address: Peter Knippertz, Institute for
Climate and Atmospheric Science, School of Earth and Environ-
ment, University of Leeds, Leeds LS2 9JT, United Kingdom.
E-mail: [email protected]
15 FEBRUARY 2010 K N I P P E R T Z A N D W E R N L I 987
DOI: 10.1175/2009JCLI3333.1
� 2010 American Meteorological Society
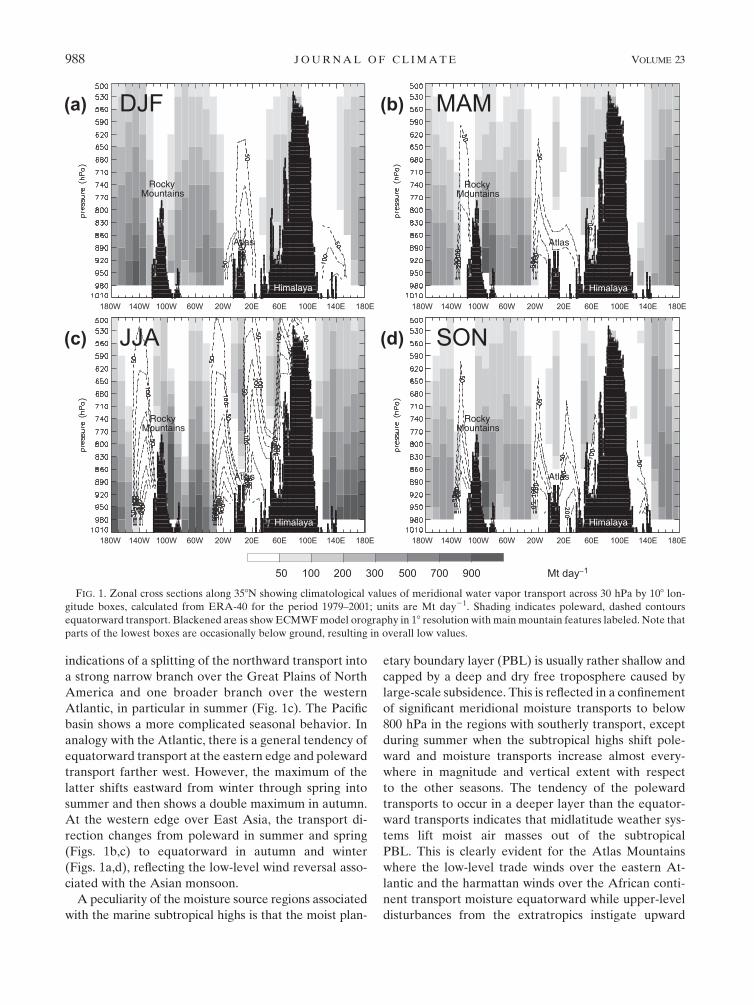
indications of a splitting of the northward transport into
a strong narrow branch over the Great Plains of North
America and one broader branch over the western
Atlantic, in particular in summer (Fig. 1c). The Pacific
basin shows a more complicated seasonal behavior. In
analogy with the Atlantic, there is a general tendency of
equatorward transport at the eastern edge and poleward
transport farther west. However, the maximum of the
latter shifts eastward from winter through spring into
summer and then shows a double maximum in autumn.
At the western edge over East Asia, the transport di-
rection changes from poleward in summer and spring
(Figs. 1b,c) to equatorward in autumn and winter
(Figs. 1a,d), reflecting the low-level wind reversal asso-
ciated with the Asian monsoon.
A peculiarity of the moisture source regions associated
with the marine subtropical highs is that the moist plan-
etary boundary layer (PBL) is usually rather shallow and
capped by a deep and dry free troposphere caused by
large-scale subsidence. This is reflected in a confinement
of significant meridional moisture transports to below
800 hPa in the regions with southerly transport, except
during summer when the subtropical highs shift pole-
ward and moisture transports increase almost every-
where in magnitude and vertical extent with respect
to the other seasons. The tendency of the poleward
transports to occur in a deeper layer than the equator-
ward transports indicates that midlatitude weather sys-
tems lift moist air masses out of the subtropical
PBL. This is clearly evident for the Atlas Mountains
where the low-level trade winds over the eastern At-
lantic and the harmattan winds over the African conti-
nent transport moisture equatorward while upper-level
disturbances from the extratropics instigate upward
FIG. 1. Zonal cross sections along 358N showing climatological values of meridional water vapor transport across 30 hPa by 108 lon-
gitude boxes, calculated from ERA-40 for the period 1979–2001; units are Mt day21. Shading indicates poleward, dashed contours
equatorward transport. Blackened areas show ECMWF model orography in 18 resolution with main mountain features labeled. Note that
parts of the lowest boxes are occasionally below ground, resulting in overall low values.
988 J O U R N A L O F C L I M A T E VOLUME 23

and poleward transports aloft (Figs. 1b–d; Knippertz
et al. 2003; Knippertz 2003).
On synoptic time scales, transient circulation features
can regionally instigate a direct transport of moist
tropical air masses into midlatitudes. In such cases, the
moist layers are often deeper than in purely subtropical
air masses and can lead to heavy precipitation (e.g.,
Higgins et al. 2000; Cavazos and Rivas 2004; Bao et al.
2006; Stohl et al. 2008) and strong latent heat release in
the extratropics, which in turn can contribute to explo-
sive cyclogenesis (e.g., Reed et al. 1988; Zhu and Newell
1994). The regions of intense poleward moisture fluxes
are often longitudinally quite narrow and have therefore
been named atmospheric or tropospheric rivers (Newell
et al. 1992; Newell and Zhu 1994; Zhu and Newell 1994,
1998; Ralph et al. 2004), a term later criticized by Wernli
(1997) and Bao et al. (2006). Instead, Bao et al. (2006),
and Knippertz and Martin (2007, KM07 hereafter)
suggested the term ‘‘moisture conveyor belt’’ to stress
the analogy with the well-established conveyor belt
model of extratropical cyclones (Carlson 1980; Browning
1990). In contrast to the classical ‘‘warm conveyor belt’’
(WCB) concept, which includes a slow rise of PBL air
from within the warm sector over the surface cold or
warm front (e.g., Eckhardt et al. 2004), KM07 noticed
in their case study that most moist trajectories with
tropical origins followed a quasi-horizontal poleward
track above the PBL and then rose abruptly in the pre-
cipitation zone.
A fairly frequent example of a link between tropical
humidity and extratropical precipitation is colloquially
known as the ‘‘pineapple express,’’ which is character-
ized by a strong and persistent flow of atmospheric
moisture and associated heavy rainfall from the waters
adjacent to the Hawaiian Islands and extending to
any location along the Pacific coast of North America
(Higgins et al. 2000; Cavazos and Rivas 2004). Pineapple
express (PE) situations usually occur during the win-
ter half year (see maximum around 1508W in Fig. 1a)
and can be associated with substantial flooding (Mass
2008). Other examples of tropical moisture feeding un-
usual extratropical rain events have been discussed for
the easternmost North Pacific (Bao et al. 2006; KM07),
for northwestern Africa (Fink and Knippertz 2003;
Knippertz and Martin 2005), and even for northern
Europe (Stohl et al. 2008). A more persistent and rather
stationary feature of a tropical moisture–precipitation
link develops over East Asia in summer and has been
referred to as the mei-yu–baiu front that brings heavy
rainfalls to parts of China, South Korea, and Japan (e.g.,
chapters 3 and 4 in Chang and Krishnamurti 1987;
Ninomiya and Shibagaki 2007). It is clearly reflected in
Fig. 1c in large transports between 1108 and 1308E.
In this paper, the authors will refer to the whole
class of such phenomena as ‘‘tropical moisture export’’
(TME) events. For the first time, an objective clima-
tology of TME will be presented based on more than
1.25 billion trajectories calculated from 40-yr European
Centre for Medium-Range Weather Forecasts (ECMWF)
Re-Analysis (ERA-40) data. The study provides a com-
prehensive account of TME frequency, geographical,
seasonal, and interannual variations as well as contri-
butions to climatological moisture transports and pre-
cipitation. After describing the data and trajectory
method used to identify TME events in section 2, some
exemplary case studies are presented in section 3 to
illustrate the influence of TME on both precipitation
and cyclone intensification in the extratropics. Sections 4
and 5 contain detailed statistical analyses of spatial and
temporal variations of TME trajectories and associated
moisture transports, respectively, while section 6 focuses
on the climatological contribution of TME to pre-
cipitation in the extratropics. Finally, main conclusions
and ideas for future research on this topic are given in
section 7.
2. Data and method
The results of this study are mainly based upon
6-hourly ERA-40 data (Uppala et al. 2005) for the 23-
year period 1979–2001, which are available on 60 model
levels and have been interpolated from the native TL159
to a regular grid with 18 3 18 horizontal resolution. For
studying cases after the ERA-40 period, ECMWF op-
erational analyses interpolated to the same horizontal
resolution have been used (native resolutions are
T511L60/T799L91 before/after February 2006). To iden-
tify TMEs, trajectories are calculated with the software
package Lagrangian Analysis Tool (LAGRANTO;
Wernli 1997; Wernli and Davies 1997), which allows
tracing different meteorological parameters along the
trajectories by interpolating the respective fields to the
position of the trajectory at a given time. The identifi-
cation procedure of TMEs consists of three steps that
account for their most important characteristics (see
schematic depiction in Fig. 2:
d Step 1: Moisture source in the tropics—For every
0000 UTC analysis time, one-day forward trajectories
are calculated from every 100 km 3 100 km 3 30 hPa
box between 08 and 208N, and between 1000 and
490 hPa. As every trajectory represents the same at-
mospheric mass of ;3 3 1012 kg, specific humidity can
be readily converted into water mass. The upper
boundary of the starting region for the trajectories was
set to 490 hPa, as about 90% of all water vapor is
15 FEBRUARY 2010 K N I P P E R T Z A N D W E R N L I 989

concentrated below this level. These trajectories can
be expected to represent the synoptic-scale atmo-
spheric flow well, but might be less reliable in regions
of active tropical convection.d Step 2: Poleward circulation—Out of the ;150 000
one-day trajectories started daily (more than 1.25
billion for the whole period) only those that cross 208N
are continued for another six days. If they reach 358N
within this period, they are retained. This relatively
short time span was chosen to ensure that the con-
sidered air parcels are likely to maintain characteris-
tics of tropical air on their way across the subtropics,
although we cannot exclude that some parcels will
undergo modifications due to fluxes of heat and mois-
ture from the underlying surface or through mixing
with ambient air. The minimum average meridional
wind speed consistent with this criterion is 2.85 m s21.d Step 3: Significant moisture transport into the
extratropics—Finally, only those trajectories are re-
tained that reach a water vapor flux of at least
100 g kg21 m s21 somewhere north of 358N. Such a
flux criterion selects for ‘‘fast’’ events, but tests with a
mixing ratio criterion instead showed rather similar
results. While the geographical distribution is generally
quite robust, the number of trajectories varies non-
linearly with the chosen threshold (e.g., reduction by
almost 80% for a doubling of the threshold). The value
of 100 g kg21 m s21 was set in order to get robust, yet
meaningful statistics.
In addition to ECMWF products, global monthly
Climate Prediction Center (CPC) Merged Analysis of
Precipitation (CMAP) data in 18 3 18 horizontal reso-
lution for the 24-year period 1979–2002 (Xie and Arkin
1996, 1997) have been used to estimate the contribution
of TME-related precipitation to climatological values
(see section 6). For the example cases discussed in sec-
tion 3, the Tropical Rainfall Measuring Mission (TRMM)
and other data precipitation (3B42 V6; Huffman et al.
2007) in a spatial resolution of 0.258 has been con-
sidered on a daily basis. These combined microwave–
infrared estimates (with gauge adjustment) were
downloaded from http://disc2.nascom.nasa.gov/Giovanni/
tovas/ operated by the National Aeronautics and Space
Administration.
3. Exemplary case studies
To illustrate some typical characteristics of TME
events, Fig. 3 shows all identified trajectories for 22, 24,
26, and 28 November 2001, when both the Pacific and
Atlantic storm tracks were very active. To facilitate
reference in the text, the four coherent TME regions are
numbered as TME1–4. TME1 over the western North
Pacific consists of a fairly small number of 24 (293)
trajectories on 22 (24) November 2001 (Figs. 3a,b). They
show the typical anticyclonic curvature when circu-
lating from the tropical low-level easterlies into the
midlatitude westerlies (KM07). The pertinent box-and-
whisker plot in Fig. 3b demonstrates that the trajectories
originate from a shallow layer of the tropical tropo-
sphere (median is ;940 hPa). The tracks are initially
quasi-horizontal and then rise abruptly near 358N, 1658E
to about 500 hPa, where they remain until 28 Novem-
ber. According to the TRMM daily rainfall product (not
shown), precipitation associated with this feature was
widespread but of moderate intensity, consistent with
the small number of TME trajectories.
TME2 is rooted over the eastern half of the North
Pacific and persists throughout all four analysis times
shown in Fig. 3. The number of trajectories forming
TME2 increases from 790 (752) on 22 (24) November
to an unusually high value of 1971 on 26 November
and then decreases to 715 on 28 November. Trajectory
origins are from a deep layer of the tropical troposphere
(median ;790 hPa); tracks are initially quasi-horizontal
or even subsiding (insets in Figs. 3a–c). The trajectories
subsequently pass a region of strong ascent, mainly on
FIG. 2. Schematic illustration of the TME trajectory identifica-
tion algorithm. Trajectories are started from each box at 0000 UTC
every day. To avoid a double counting of air parcels on similar
trajectories, only those that cross 208N during the first 24 h are run
forward in time for another 6 days. The seven examples starting
from the gray boxes illustrate typical types of trajectory behavior.
The only trajectory that is identified as a TME trajectory is the one
that reaches a water vapor flux of at least 100 g kg21 m s21 to the
north of 358N. For more details, see section 2.
990 J O U R N A L O F C L I M A T E VOLUME 23

26 November in Fig. 3b and on 27–28 November in
Fig. 3c. Associated with this ascent is a precipitation
band reaching from the ITCZ near 1608W across the
Hawaiian Islands all the way to the Pacific Northwest,
typical of a pineapple express situation. According to
TRMM data, 48-h sums on 27–28 November 2001 ex-
ceeded 200 mm and locally even 300 mm in the area of
Hawaii (not shown). This is consistent with observations
FIG. 3. TME trajectories started at 0000 UTC (a) 22, (b) 24, (c) 26, and (d) 28 Nov 2001. Gray shading indicates the height of the
trajectories in hPa. For each coherent feature with more than 80 trajectories (numbered TME1–4), the insets show a box-and-whisker
depiction (thick line median, box interquartile range, crosses outliers) of the trajectory heights (from 1000 to 300 hPa) as a function of
trajectory calculation time every 6 h. The whiskers extend to the most extreme data point, which is no more than 1.5 times the interquartile
range from the box. The number of identified TME trajectories is also given for each coherent feature. For the sake of clarity, only the first
five days of the trajectories are plotted.
15 FEBRUARY 2010 K N I P P E R T Z A N D W E R N L I 991
of 231 mm at Hilo airport and flash flooding on the
big island of Hawaii. Flash flooding also occurred in
northern California, and several rivers and streams in
Oregon showed rapid rises in response to widespread
precipitation of more than 70 mm [National Weather
Service (NWS) flood summary is available online at
http://www.weather.gov/oh/hic/archive/2001/011129.htm].
As for TME1 there is a bifurcation into a westerly
branch and one returning to low latitudes at later stages
(Figs. 3b,c). Other examples of particularly hazardous
pineapple expresses (see Mass 2008) also show TME
contributions. The period of 4–8 February 1996 with
a rather high number of 1249 TME trajectories was as-
sociated with more than twice the monthly precipitation,
some rainfall records, and substantial flooding in some
regions along the west coast of North America (not
shown). The record flood peak event of 5–7 November
2006 in the Pacific Northwest had contributions from
1196 TME trajectories.
TME3 is already fully developed on 22 November
2001 and indicates substantial moisture transports from
the Caribbean into the eastern United States with 455
TME trajectories, which sharply rise on 25 November
(Fig. 3a). On 24 November, TME3 comprises 551 trajec-
tories that ascend less (Fig. 3b). TME3 weakens to 156
trajectories on 26 November and then reintensifies on
28 November to 391 trajectories, which mainly rise on
29–30 November (Figs. 3c,d). This episode was associated
with record rainfall in the midsouth with storm totals for
26–29 November of 200–300 mm common throughout
the area, according to the U.S. National Weather Ser-
vice. This resulted in extensive flash flooding, inundation
of homes and buildings, washed-out roads, and one fa-
tality. The amount of 174 mm that fell in Memphis,
Tennessee, between 0600 UTC 28 November and 0600
UTC 29 November was the highest 24-h total recorded
since October 1935. The 180 mm in Jackson, Mississippi,
on 28–29 November 2001 is the second wettest 48-h pe-
riod on record. Interestingly, the 48-h record of 198 mm
on 24–25 December 1987 was also related to considerable
TME (not shown). TME4 over the central North Atlantic
is also present through the entire period with 123, 353,
677, and 83 identified trajectories, respectively (Fig. 3).
Compared to TMEs1–3, the ascent within TME4 is fairly
moderate and the median stays below 600 hPa. Consis-
tently, only light precipitation is associated with this fea-
ture. In addition to TMEs1–4, the algorithm also identifies
several TME trajectories that originate near China and
one unusual trajectory over the Sahara in Fig. 3a. The
foregoing discussion demonstrates that TMEs are usually
both spatially and temporally coherent airstreams that
can (but do not necessarily) contribute to heavy pre-
cipitation events in the extratropics.
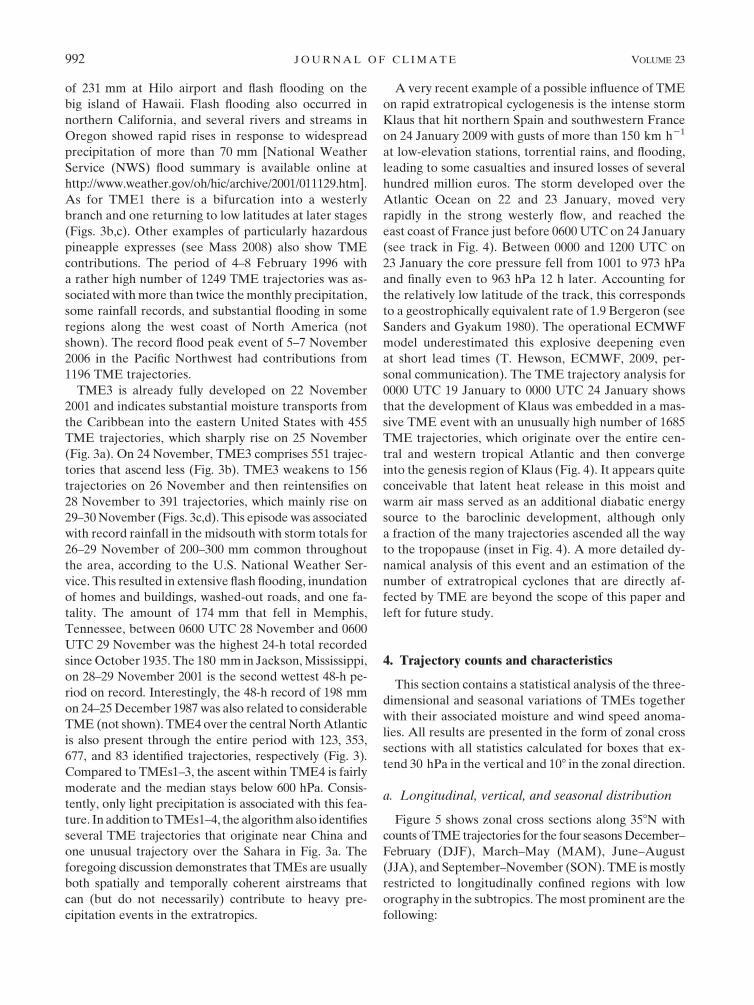
A very recent example of a possible influence of TME
on rapid extratropical cyclogenesis is the intense storm
Klaus that hit northern Spain and southwestern France
on 24 January 2009 with gusts of more than 150 km h21
at low-elevation stations, torrential rains, and flooding,
leading to some casualties and insured losses of several
hundred million euros. The storm developed over the
Atlantic Ocean on 22 and 23 January, moved very
rapidly in the strong westerly flow, and reached the
east coast of France just before 0600 UTC on 24 January
(see track in Fig. 4). Between 0000 and 1200 UTC on
23 January the core pressure fell from 1001 to 973 hPa
and finally even to 963 hPa 12 h later. Accounting for
the relatively low latitude of the track, this corresponds
to a geostrophically equivalent rate of 1.9 Bergeron (see
Sanders and Gyakum 1980). The operational ECMWF
model underestimated this explosive deepening even
at short lead times (T. Hewson, ECMWF, 2009, per-
sonal communication). The TME trajectory analysis for
0000 UTC 19 January to 0000 UTC 24 January shows
that the development of Klaus was embedded in a mas-
sive TME event with an unusually high number of 1685
TME trajectories, which originate over the entire cen-
tral and western tropical Atlantic and then converge
into the genesis region of Klaus (Fig. 4). It appears quite
conceivable that latent heat release in this moist and
warm air mass served as an additional diabatic energy
source to the baroclinic development, although only
a fraction of the many trajectories ascended all the way
to the tropopause (inset in Fig. 4). A more detailed dy-
namical analysis of this event and an estimation of the
number of extratropical cyclones that are directly af-
fected by TME are beyond the scope of this paper and
left for future study.
4. Trajectory counts and characteristics
This section contains a statistical analysis of the three-
dimensional and seasonal variations of TMEs together
with their associated moisture and wind speed anoma-
lies. All results are presented in the form of zonal cross
sections with all statistics calculated for boxes that ex-
tend 30 hPa in the vertical and 108 in the zonal direction.
a. Longitudinal, vertical, and seasonal distribution
Figure 5 shows zonal cross sections along 358N with
counts of TME trajectories for the four seasons December–
February (DJF), March–May (MAM), June–August
(JJA), and September–November (SON). TME is mostly
restricted to longitudinally confined regions with low
orography in the subtropics. The most prominent are the
following:
992 J O U R N A L O F C L I M A T E VOLUME 23

(i) The previously discussed pineapple express (marked
‘‘PE’’ in Figs. 5a,d), which connects the tropics near
Hawaii with the North American west coast (see
TME2 in Fig. 3 for an example). It has a clear ac-
tivity maximum in DJF and is practically absent in
JJA. The PE is ill defined in MAM and appears as
a weak local maximum of more than 250 trajectory
counts at 1608–1508W, 800–680 hPa in SON. The
low activity in summer is consistent with the then
strong and persistent subtropical anticyclone over
the eastern North Pacific that effectively impedes
poleward moisture transports.
(ii) A second prominent hotspot is the west Pacific
(WP in Fig. 5), which is active from MAM to SON
with a clear maximum in JJA when the main
activity shifts westward from ;1508E to ;1308E. In
all three seasons there are considerable trajectory
counts throughout the lowest 500 hPa of the atmo-
sphere with maxima around 700 hPa in SON and
DJF, and below 800 hPa in JJA. The summer
maximum is presumably closely related to the mei-
yu–baiu front over East Asia (see section 1). An ex-
ample is TME1 in Fig. 3.
(iii) A locally very confined maximum occurs between
the Rocky and the Appalachian Mountains and is
therefore termed ‘‘Great Plains’’ (GP in Figs. 5b–d).
It is the sole continental TME activity maximum
and is mainly restricted to the 1008–908W strip. Its
seasonality resembles the one of WP with a maxi-
mum of more than 1500 trajectories in summer
and rather weak activity in winter. The inflow of
moist air masses from the Gulf of Mexico into the
central parts of the United States is related to the
North American monsoon system (e.g., Adams and
FIG. 4. As in Fig. 3, but for TME trajectories started at 0000 UTC 19 Jan 2009. The
6-hourly position of the intense cyclone Klaus with the associated core pressure (hPa) between
1800 UTC 22 Jan and 1200 UTC 24 Jan are given as filled circles and numbers, respectively.
Note that operational ECMWF analyses were used for this figure since the date of the event is
after the end of the ERA-40 period.
15 FEBRUARY 2010 K N I P P E R T Z A N D W E R N L I 993

Comrie 1997) and is intimately linked to convective
activity in this region as shown by the example
TME3 in Fig. 3.
(iv) The fourth prominent TME activity maximum is
located over the western inflow region of the North
Atlantic storm track along the east coast of North
America and is therefore termed ‘‘Gulf Stream’’
(GS in Fig. 5). It is active year-round and has a
much smaller annual cycle than regions i–iii, which
is mainly reflected in a weakened activity in sum-
mer and a higher elevation in DJF.
b. Mean characteristics of TME trajectories
To test whether TMEs constitute predominantly a
moisture or a circulation anomaly, Fig. 6 shows mean
specific humidity and meridional wind averaged over
all identified trajectories in a given longitude–pressure
box (shading) together with the climatological averages
calculated for the entire ERA-40 period 1957–2002
(lines). For DJF, TMEs in both the PE and GS regions
show values of more than 6 g kg21 throughout the bot-
tom 150 hPa of the atmosphere (Fig. 6a). Maximum
values around 9 g kg21 are found over the Atlantic. The
climatological moisture field has an overall similar
structure, but with smaller absolute values by about
1–3 g kg21. The most striking difference is the extension
of the moist layer to well above ;800 hPa during TME.
The corresponding meridional TME wind fields reach
values up to 5.5 m s21, significantly more than the cli-
matological values that hardly exceed 2 m s21 (Fig. 6b).
There is a general decrease of the meridional wind
FIG. 5. Zonal cross sections along 358N showing counts of TME trajectories in 30 hPa by 108 longitude boxes over the period 1979–2001
for (a) DJF, (b) MAM, (c) JJA, and (d) SON. Blackened areas show ECMWF model orography in 18 resolution with main mountain
features labeled. The most significant TME regions are labeled PE, GP, GS, and WP. Note that parts of the lowest boxes are occasionally
below ground, resulting in overall low counts.
994 J O U R N A L O F C L I M A T E VOLUME 23

component with height within the TMEs. TMEs are
more frequently, but not exclusively, found in regions
with climatological southerlies.
During summer a slightly different picture emerges.
The absolute values of both climatological and TME
specific humidity are much higher and reach 14 g kg21,
but the differences between the two become very small
below 800 hPa (Fig. 6c). This is a reflection of the overall
weaker air mass contrasts during this season that make it
more difficult to create a substantial anomaly in an al-
ready warm and moist environment. At higher levels
TME anomalies locally exceed 3 g kg21. The meridio-
nal wind plot shows deep layers of southerlies around
4 m s21 associated with TMEs in both the GP–GS and
WP regions (Fig. 6d) and a smaller decrease with height
than in winter. Compared to the climatological values
around 2 m s21, TME winds are on the order of 2–3
times faster. An interesting exception is the low-level
jet along the eastern side of the Rocky Mountains,
where mean winds reach more than 4 m s21. In conclu-
sion, Fig. 6 demonstrates that during all seasons TMEs
are a combination of anomalous southerlies with anom-
alously high moisture contents with the importance of the
latter decreasing in summer.
c. Latitudinal variations
Finally, latitudinal variations, and thereby in some
sense also the time evolution, of TMEs are addressed by
examining trajectory counts as in Fig. 3 in different zonal
cross sections between 258 and 508N (Fig. 7). Only re-
sults for the DJF season are shown, as they sufficiently
illustrate the most important aspects. In a statistical
sense, both PE and GS trajectories track almost straight
northward between 258 and 308N and are mostly confined
FIG. 6. (a) Mean specific humidity (g kg21) and (b) meridional wind (m s21) for TME trajectories crossing 358N for DJF 1979–2001
(shading). Values are plotted for 30 hPa by 108 longitude boxes if they contain at least 30 trajectories. Lines indicate the respective
climatological means calculated for the entire ERA-40 period 1957–2002. (c),(d) Same as (a) and (b), but for JJA.
15 FEBRUARY 2010 K N I P P E R T Z A N D W E R N L I 995

FIG. 7. Counts of TME trajectories crossing (a) 258N, (b) 308N, (c) 358N, (d) 408N, (e) 458N, and (f) 508N in 30-hPa by 108 longitude boxes
for DJF 1979–2001. Labels are as in Fig. 5. Note the different vertical axis compared to Fig. 5.
996 J O U R N A L O F C L I M A T E VOLUME 23

to the layers below 500 hPa (Figs. 7a,b). Around 358N
trajectories begin to rise while still on an almost me-
ridional track (Fig. 7c, note the different contour in-
terval with respect to Fig. 5a). Between 358 and 458N the
PE trajectories rise over the western slopes of the U.S.
Rocky Mountains, while GS trajectories show even
stronger ascents into the midtroposphere, most likely
related to WCBs of midlatitude baroclinic waves over
the central North Atlantic (Figs. 7c–e). In both TME
regions the tracks shift eastward by about 108–208 lon-
gitude in this latitude band. At 508N the overall numbers
are largely reduced as many trajectories have recircu-
lated toward low latitudes (as, e.g., TME1 in Fig. 3).
Nevertheless, both ascent and eastward shift continue
in this area. Trajectories in other seasons and regions
also tend to slowly rise anticyclonically, although the
ascending regions are shifted northward by about 58 in
summer. In addition, Fig. 7 illustrates why the large area
from 108W to 1208E (i.e., more than a third of the earth’s
circumference) is practically void of TMEs: Poleward
moisture transports in this region are hindered by oro-
graphic features in Africa, Asia, and Europe as indi-
cated by the black ECMWF model orography.
5. Total moisture exports
While the foregoing discussion revealed the temporal
and spatial characteristics of TMEs including the asso-
ciated moisture and wind anomalies, it is not straight-
forward to translate this information into transported
total water mass. To achieve this, the trajectory counts
for each 30-hPa by 108 longitude box were combined
with their respective specific humidity and meridional
wind velocity to quantify total moisture export across
a given latitude circle for a given time. The obtained
values were vertically integrated from 1010 to 80 hPa by
summing up the data from the respective thirty-one
30-hPa boxes and then converted to Mt day21. It should
be noted that this analysis does not include transports of
water in liquid or solid form but concentrates on the
dominating horizontal transport of water vapor. In the
following three subsections this parameter will be dis-
cussed with respect to seasonal, interannual, and lati-
tudinal variations.
a. Seasonal variations
Figure 8 shows vertically integrated, TME-related
water vapor transports across 358N for the four seasons
DJF, MAM, JJA, and SON. Table 1 gives the respective
values longitudinally integrated over each of the four
TME regions discussed in section 4a and marked with
gray shading in Fig. 8. In addition, percentages of the
climatological water vapor transports shown in Fig. 1 are
given in Table 1. These data accentuate some of the
aspects already discussed in section 4a. The activity
maximum of the PE in winter (solid line), for example,
becomes much clearer in this integral depiction than in
Fig. 5. The maximum value for a single 108 longitude
strip within the PE region is almost 1350 Mt day21 in
DJF, while in the other seasons values stay well below
1000 Mt day21. The total transports are about 2 times
larger in DJF than in SON and MAM, and almost
4 times larger than in JJA (second line of Table 1). This
picture changes completely, when relative contributions
of TMEs to the total water vapor transported poleward
across 358N are considered. These values increase from
winter (15.6%) over the transition seasons (22%–23%)
to summer with 56.1%, when cancellation of transports
in opposite directions causes a small climatological value
(Fig. 1c).
GP water vapor exports are spatially confined to the
immediate vicinity of the Rocky Mountains, that is, to
the 1008–908W longitudinal strip (Fig. 8). Maximum values
of 2946 Mt day21 occur during JJA, almost 2 times the
MAM and 3 times the SON exports (Table 1). During
DJF, transports are small, and the GP region appears
more like a western extension of the GS region that is
very active during this time of year (Fig. 8). Contribu-
tions to the climatological transports across 358N range
from 46.2% in summer over 27.1% in spring to 18.9% in
autumn and 17% in winter (Table 1). This demonstrates
the substantial importance of TME for the summer
climate in the GP area. As pointed out in section 4,
the GS region has by far the flattest annual cycle as re-
vealed by total water vapor transports of between
3098 Mt day21 in winter and 2713 Mt day21 in spring
FIG. 8. Mean TME across 358N in Mt day21 per 108 longitude
strip. Shown are the four seasons DJF (solid), MAM (dotted), JJA
(dash–dotted), and SON (dashed) according to the legend. The
water vapor exports are integrated between 1010 and 80 hPa. The
four regions as defined in Table 1 are marked with gray shading.
15 FEBRUARY 2010 K N I P P E R T Z A N D W E R N L I 997

(Table 1) with maximum 108 longitude values hardly
exceeding 1200 Mt day21 (Fig. 8). Because of the ten-
dency of moister trajectories in summer (cf. Figs. 6a,c),
the annual cycle is even flatter than in the TME trajec-
tory counts (cf. Figs. 5a,c). Relative contributions are on
the order of 16%–25% year-round (Table 1). It could be
speculated that the comparably high values in autumn
are related to the frequent recurvature of tropical cy-
clones into midlatitudes (Jones et al. 2003).
The WP is the region that dominates TME into the
Northern Hemispheric extratropics during all seasons
but DJF (Fig. 8). In JJA, transport in the entire region
reaches 20 236 Mt day21 with a 108 longitude maximum
of 4835 Mt day21 over the East China Sea (1208–1308E).
This is 3–4 times the transition season values and more
than 20 times the DJF transport (Table 1). The summer
TME in the WP alone, which constitutes only 14% of the
earth’s circumference, is responsible for 61% (33%) of
the global TME across 358N in summer (over the entire
year). The average daily TME of 20 236 Mt corresponds
to ;1.4% of all water vapor contained between 108 and
208N. Thus it would take only 10 weeks to empty the
entire reservoir through the 508-longitude-wide WP
channel into the extratropics. With respect to the cli-
matology, the WP contributions range from 54.1% in
summer and over 23%–29% in the transition seasons to
only 12.2% in winter. The WP and GP regions both
show distinct TME maxima during Northern Hemi-
spheric summer, when the sea surface temperatures
(SSTs) are high and monsoon circulations are well es-
tablished. In contrast, TME transports in the PE region
are largest during a time of relatively low SSTs but when
the active extratropical storm track frequently generates
the circulation anomalies necessary for TME.
b. Interannual variations
Time series of the vertically and longitudinally in-
tegrated annual TME across 358N show substantial year-
to-year variations throughout the period 1979–2001
(Fig. 9). Note that for the regions with winter maxima
(PE and GS) years run from July to June of the following
year, while for the other two regions calendar years were
used. Largest variability is found in the PE region, where
the most active year (1983/84) has an almost 3 times
larger TME than the least active (1987/88), pointing to
marked differences in the large-scale circulation over
the eastern and central North Pacific (see discussion at
the end of this subsection). Despite the smaller longi-
tudinal range, the GP time series shows somewhat less
fluctuation than PE with most years varying between
1000 and 1600 Mt day21. In the GS region the year-to-
year range is 2150–4200 Mt day21. The WP region has,
of course, the largest absolute values ranging from
6100–10 400 Mt day21, indicating moderate relative
interannual fluctuations.
The calculation of simple linear correlation coeffi-
cients between the time series shown in Fig. 9 reveals
limited coherence between the regions. This does not
change markedly, if July–June, calendar years, or sea-
sonal values are used for all time series. Only for the two
regions over the eastern and western North Pacific (i.e.,
WP and PE), a significant correlation of 20.54 was
found. There is also a weak negative correlation be-
tween GP and GS from MAM to SON. Annual and
seasonal correlations with large-scale climate indices
TABLE 1. TME across 358N in Mt day21 in the four main TME regions during the four seasons and in parentheses, percentage of the
respective ERA-40 climatological values for the period 1979–2001 (see Fig. 1). Region abbreviations are as in Fig. 5 and spatial definitions
are given in parentheses in the first column.
Region DJF MAM JJA SON
PE (1808–1308W) 4815 (15.6) 2791 (23.4) 1337 (56.1) 2316 (22.1)
GP (1008–908W) 539 (17.0) 1667 (27.1) 2946 (46.2) 1064 (18.9)
GS (408–708W) 3098 (20.0) 2713 (19.4) 3019 (16.2) 2880 (24.9)
WP (1208–1708E) 924 (12.2) 6502 (28.9) 20 236 (54.1) 5269 (23.3)
FIG. 9. Time series of 1010–80-hPa vertically integrated TME
across 358N in Mt day21 for the four TME regions PE, GP, GS, and
WP. Definitions of the regions are as given in Table 1 and gray
shaded in Fig. 8 (note the different longitudinal width). Because of
the different seasonality in the four TME regions, years for PE and
GS stand for July to June of the following year, while years for GP
and WP stand for calendar years.
998 J O U R N A L O F C L I M A T E VOLUME 23
like the North Atlantic Oscillation index (normalized
surface pressure difference between the Azores/Gibraltar
and Iceland; see Jones et al. 1997) and the Nino-3.4 in-
dex (SST anomaly in the region 58N–58S, 1708–1208W)
give also rather low values. The exceptions worth men-
tioning are significant correlations between Nino-3.4
and TMEs in the GS (10.47 on a July–June and 10.45
on a winter basis) and PE regions (20.50 July–June
and 20.35 winter).
It is remarkable to note that the TME anomalies over
the PE are in opposite phase with the SST anomalies
associated with the Nino-3.4 variations, that is, more
(less) TME occurs when tropical SSTs are colder
(warmer). This indicates that SST-induced circulation
anomalies essentially modify the intensity of TME,
while increases in column water vapor over the warmer
ocean surface play a minor role. The negative correla-
tion in the PE region is therefore most likely related to
the well-known eastward extension of the North Pacific
waveguide that inhibits the penetration of Rossby wave
energy into low latitudes (Matthews and Kiladis 1999)
and is associated with reduced anticyclonic wave break-
ing [or life cycle (of a baroclinic wave; LC1) events;
Shapiro et al. 2001] and fewer tropical plumes (McGuirk
et al. 1987; Iskenderian 1995). The positive correlation
in the GS region is consistent with the ‘‘Mexican con-
nection’’ proposed by Rasmusson and Mo (1993) that
links Pacific SST anomalies with circulation anomalies
over the western subtropical Atlantic and the Caribbean,
where the number of tropical plumes is increased in
El Nino years (Iskenderian 1995). In conclusion, these
results suggest that TME is to some degree constrained by
El Nino–induced circulation anomalies, while linkages
between the individual TME regions are rather weak.
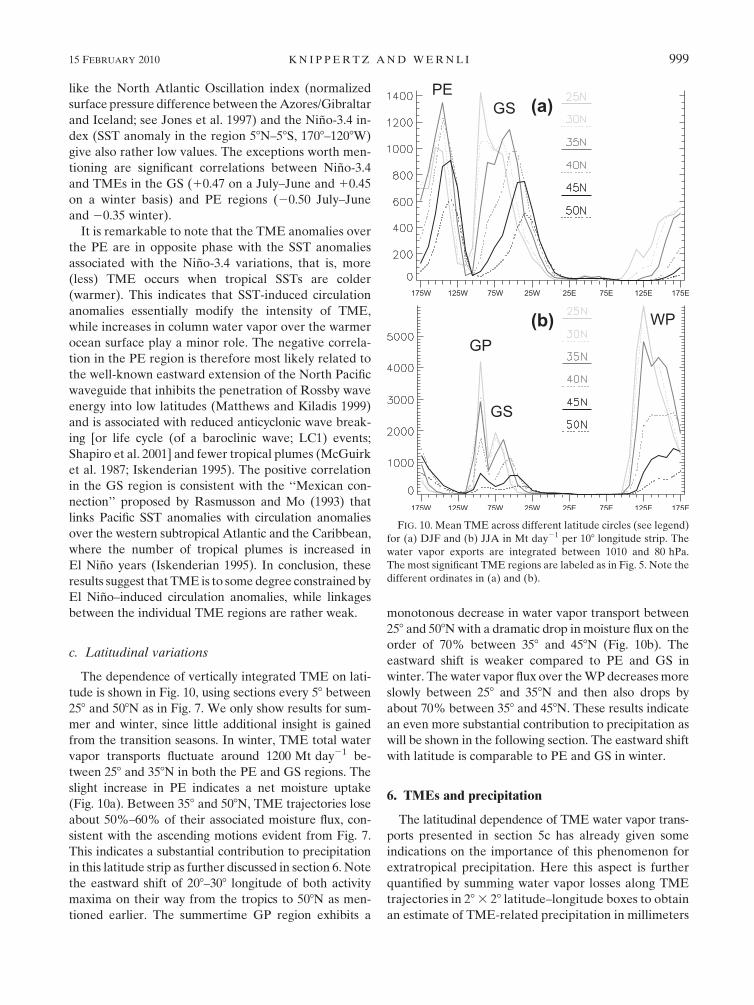
c. Latitudinal variations
The dependence of vertically integrated TME on lati-
tude is shown in Fig. 10, using sections every 58 between
258 and 508N as in Fig. 7. We only show results for sum-
mer and winter, since little additional insight is gained
from the transition seasons. In winter, TME total water
vapor transports fluctuate around 1200 Mt day21 be-
tween 258 and 358N in both the PE and GS regions. The
slight increase in PE indicates a net moisture uptake
(Fig. 10a). Between 358 and 508N, TME trajectories lose
about 50%–60% of their associated moisture flux, con-
sistent with the ascending motions evident from Fig. 7.
This indicates a substantial contribution to precipitation
in this latitude strip as further discussed in section 6. Note
the eastward shift of 208–308 longitude of both activity
maxima on their way from the tropics to 508N as men-
tioned earlier. The summertime GP region exhibits a
monotonous decrease in water vapor transport between
258 and 508N with a dramatic drop in moisture flux on the
order of 70% between 358 and 458N (Fig. 10b). The
eastward shift is weaker compared to PE and GS in
winter. The water vapor flux over the WP decreases more
slowly between 258 and 358N and then also drops by
about 70% between 358 and 458N. These results indicate
an even more substantial contribution to precipitation as
will be shown in the following section. The eastward shift
with latitude is comparable to PE and GS in winter.
6. TMEs and precipitation
The latitudinal dependence of TME water vapor trans-
ports presented in section 5c has already given some
indications on the importance of this phenomenon for
extratropical precipitation. Here this aspect is further
quantified by summing water vapor losses along TME
trajectories in 28 3 28 latitude–longitude boxes to obtain
an estimate of TME-related precipitation in millimeters
FIG. 10. Mean TME across different latitude circles (see legend)
for (a) DJF and (b) JJA in Mt day21 per 108 longitude strip. The
water vapor exports are integrated between 1010 and 80 hPa.
The most significant TME regions are labeled as in Fig. 5. Note the
different ordinates in (a) and (b).
15 FEBRUARY 2010 K N I P P E R T Z A N D W E R N L I 999

per month. Technically, 6-hourly changes of specific
humidity along individual trajectories are evaluated and
decreasing values are associated with immediate pre-
cipitation at the central point of this 6-hourly trajectory
segment (cf. Wernli 1997; Eckhardt et al. 2004). The
obtained estimates should be regarded as upper bounds
for precipitation, since mixing with drier air and evap-
oration on the way to the ground are not taken into
account in this analysis. Results for the four seasons
are given in Fig. 11, including the corresponding per-
centages with respect to the long-term precipitation
climatology for the years 1979–2002 of Xie and Arkin
(1996, 1997). All four seasons show two activity maxima
related to the Atlantic and Pacific storm tracks, while
values over most parts of Europe, Africa, and Asia are
small (Fig. 11). There is a general tendency for a weak
FIG. 11. TME-related precipitation calculated from moisture losses along TME trajectories in millimeters per month (shading) for (a)
DJF, (b) MAM, (c) JJA, and (d) SON. The black lines gives percentages of the corresponding precipitation climatology by Xie and Arkin
(1996, 1997) with contours of 10%, 20%, 40%, and 60%.
1000 J O U R N A L O F C L I M A T E VOLUME 23

subtropical maximum around 208N and a larger and
more intense maximum at southern midlatitudes (408–
508N). The former is most likely a reflection of the fact
that the extratropical disturbances that instigate TME
also trigger precipitation in the subtropical source regions
(Kiladis and Weickmann 1992; Kiladis 1998; Funatsu
and Waugh 2008). Together with the relatively small
variations in total water vapor transport in the latitude
band 258–358N (Fig. 10), this result implies an uptake of
water by evaporation in this region to compensate for
the losses through precipitation. The fixation of this
maximum to 208N is presumably to some degree caused
by the design of the TME identification algorithm (see
section 2). The precipitation signal to the north of 358N
is the actual aim of this work and shall now be discussed
in more detail.
The winter season shows a clear signal related to PE
transports with a local maximum right over Hawaii and
an extended region with more than 20 millimeters per
month reaching from the United States and Canadian
Pacific coast to beyond 1708W (Fig. 11a). Contributions
to climatology exceed 20% in large parts of this region
and near Hawaii. This indicates a considerable
contribution to precipitation totals, while many case
studies have suggested an even more significant contri-
bution to extreme events (see sections 1 and 3). A de-
tailed investigation of this linkage is beyond the scope of
this paper and is left for future studies. The Atlantic
sector shows a maximum of more than 30 millimeters
per month around 408N, 608W associated with GS
transports and a weaker maximum over the eastern
United States (Fig. 11a). Relative contributions are
below 20% over the extratropical Atlantic, while values
of more than 40% occur in the subtropics. It is in-
teresting to note that the arid belt spanning the Sahara
and Arabian Peninsula receives relative contributions of
more than 10% associated with both the far end of the
Atlantic storm track and occasional local TME trajec-
tories (see, e.g., Fig. 3a). Another unexpected result is
the relative contribution of 40% at the very beginning of
the Pacific storm track over Southeast Asia.
Spring shows a pronounced eastward shift of activ-
ity over the Pacific with a maximum of more than
50 millimeters per month to the west of Japan (Fig. 11b),
corresponding to relative contributions of well beyond
20%. In the Atlantic sector the activity maximum shifts to
the central United States, reflecting the increase in GP
with respect to GS transports discussed earlier. Relative
contributions of at least 20% are found along the entire
GP track from the Yucatan Peninsula (60%) across the
Gulf of Mexico into the midwestern United States (40%).
Absolute and relative contributions to European/North
African precipitation are largest with maxima over the
Sahara beyond 40%. In JJA the zonal extension of
the TME-related precipitation is much smaller than in
the other three seasons, reflecting the weaker westerly
flow at midlatitudes during this time of year (Fig. 11c).
Total values are the highest of all seasons, with TME
contributions of more than 70 millimeters per month
over Japan and Korea and of more than 50 millimeters
per month over the central United States. Relative con-
tributions reach over 60% to the west of Japan and over
Texas. The TME-related precipitation during autumn
shows an overall similar pattern to spring but with
generally weaker absolute and relative contributions
(Fig. 11d). Again, there are fairly large relative values
over the Sahara in this season.
This analysis shows that TME contributes significantly
to climatological precipitation in the subtropics and
southern midlatitudes, regionally with more than 60%.
Generally speaking, the relative contributions of TME
to the extratropical rainfall (Fig. 11) and to the mois-
ture exports across 358N (Table 1) are of the same
order except for regions/seasons with small absolute
climatological values such as PE outside of winter. From
various case studies (see section 1) and model experi-
ments using water vapor tagging methods (H. Sodemann,
Norwegian Institute for Air Research, 2009, personal
communication), it seems justified to hypothesize that
TME events tend to be involved in heavy rather than
low-intensity events, but this is to be verified elsewhere.
7. Summary and conclusions
Tropical moisture exports (TMEs) to the Northern
Hemispheric extratropics are an important feature of
the general circulation of the atmosphere and link trop-
ical moisture sources with extratropical precipitation
and occasionally with explosive cyclogenesis. Based on
extensive trajectory computations, an objective 23-year
TME climatology has been constructed and analyzed
with respect to spatial and temporal variations of TME
and their contributions to total moisture transports and
precipitation. The employed TME identification routine
requires a trajectory origin to the south of 208N, a cir-
culation to 358N within seven days or less, and a water
vapor flux of at least 100 g kg21 m s21 somewhere to
the north of this latitude. In its present form, this method
does not quantify the uptake of water vapor along the
track. The large number of trajectories above the PBL to
the north of 358N, however, suggests that the impact of
ocean evaporation on TME trajectories is most likely
relevant in the subtropics only.
Four discrete Northern Hemispheric TME regions
with different seasonal behaviors are identified: The
‘‘pineapple express’’ region connects the tropical central
15 FEBRUARY 2010 K N I P P E R T Z A N D W E R N L I 1001

Pacific near the Hawaiian Islands with precipitation near
the west coast of North America and is most active in
winter. The west Pacific region, in contrast, is most ac-
tive in summer and to some degree related to the East
Asian monsoon and the activity of the mei-yu–baiu
front. Because of the large longitudinal and vertical
extent of TME in this region, in combination with high
water vapor loadings related to the very warm SSTs of
the west Pacific and surrounding waters, the total TME
during this time of year accounts for a third of the
hemispheric TME for the entire year. The narrow Great
Plains region connects moisture sources over the Ca-
ribbean Sea and the Gulf of Mexico with precipitation in
the central United States and also has an activity maxi-
mum in the warm season. The Gulf Stream activity
maximum reflects water vapor transports from low lat-
itudes into the entrance region of the North Atlantic
storm track and has the smallest annual cycle. Precip-
itation related to this TME mainly affects the open
ocean, while Europe and northern Africa are also oc-
casionally reached. All four regions show substantial
interannual variability in total TME. El Nino events
significantly reduce TME in the pineapple express region
and enhance it over the western Atlantic. The North
Atlantic Oscillation does not appear to have a significant
influence on TME.
On average, TME events are the result of both circu-
lation (i.e., anomalously southerly winds) and moisture
anomalies and are characterized by coherent trajectory
ensembles over a longitudinally relatively narrow span
in the subtropics. Typical lifetimes of such ensembles
are several days. On average TME trajectories follow
a quasi-horizontal northward track in the subtropics,
mostly below 550 hPa, and then ascend northeastward
into the midlatitudes. This suggests that many of them
could be considered as the far tropical/subtropical inflow
into WCBs (Wernli 1997; Eckhardt et al. 2004). It is also
noteworthy that in a first one-month statistical study of
the frequency of coherent moist ascending airstreams,
some of these features originated to the south of 208N
(Wernli and Davies 1997, their Fig. 14). In the extra-
tropics TME trajectories are involved in orographic and
storm-track precipitation in both major ocean basins
and over East Asia and North America. Relative con-
tributions reach more than 60% to the east of Japan
during summer. In addition, there is a smaller contri-
bution of TME situations to precipitation generation in
the subtropics, most likely related to the far southward
penetration of extratropical upper-level disturbances
that instigate poleward moisture transport and at the
same time trigger rainfall at low latitudes. As total mois-
ture transports do not decrease strongly up to 358N, these
losses are most likely compensated by water vapor uptake
along the track. Contributions of TME to climatological
moisture transports across 358N reach 54% over the west
Pacific in summer.
This analysis shows that the bulk of TME is related to
the western part of the two big ocean basins, where
warm SSTs and southerly flow associated with the west-
ern flank of the marine subtropical highs and monsoon
circulations favor poleward transports. The associated
precipitation falls mainly over the downstream ocean
surfaces but also affects surrounding continents, most
strongly North America and East Asia. Cases of TME
over West Africa like the ones described by Fink and
Knippertz (2003) and Knippertz and Martin (2005) are
more unusual in a climatological sense but are also re-
flected in our analysis. The TME climatology presented
here, to the best of our knowledge the first of its kind,
will serve as a basis for further studies of this important
component of the general circulation. The presumably
most important aspect is to establish a closer link with
high-impact weather events such as heavy precipitation
and explosive cyclogenesis. Such an analysis should also
include a careful evaluation of null cases, that is, situa-
tions with substantial TME but without considerable
impacts in the extratropics. Another interesting research
path is an investigation of the evolution of vorticity and
potential vorticity along TME trajectories (see, e.g., the
work of Rodwell and Hoskins 1995). More specifically
such a study would address the dynamical question to
what degree diabatic processes such as latent heating
and friction along the TME trajectories support the
northward protrusion of moisture.
Acknowledgments. The first author acknowledges fund-
ing under the Emmy Noether program of the German
Science Foundation (DFG; Grant KN 581/2–3). The
authors like to thank the German Weather Service for
providing access to ECMWF data, Gregor Glaser for
data processing and visualization, and Andreas Stohl and
two anonymous reviewers for their constructive criticism
that helped to improve an earlier version of this paper.
REFERENCES
Adams, D. K., and A. C. Comrie, 1997: The North American
monsoon. Bull. Amer. Meteor. Soc., 78, 2197–2213.
Bao, J.-W., S. A. Michelson, P. J. Nieman, F. M. Ralph, and
J. M. Wilczak, 2006: Interpretation of enhanced integrated
water vapor bands associated with extratropical cyclones:
Their formation and connection to tropical moisture. Mon.
Wea. Rev., 134, 1063–1080.
Browning, K. A., 1990: Organization of clouds and precipitation
in extratropical cyclones. Extratropical Cyclones: The Erik
H. Palmen Memorial Volume, C. Newton and E. Holopainen,
Eds., Amer. Meteor. Soc., 129–153.
1002 J O U R N A L O F C L I M A T E VOLUME 23

Carlson, T. N., 1980: Airflow through midlatitude cyclones and the
comma cloud pattern. Mon. Wea. Rev., 108, 1498–1509.
Cavazos, T., and D. Rivas, 2004: Variability of extreme precipitation
events in Tijuana, Mexico. Climate Res., 25, 229–243.
Chang, C.-P., and T. N. Krishnamurti, 1987: Monsoon Meteorol-
ogy. Oxford University Press, 560 pp.
Eckhardt, S., A. Stohl, H. Wernli, P. James, C. Forster, and
N. Spichtinger, 2004: A 15-year climatology of warm conveyor
belts. J. Climate, 17, 218–237.
Fink, A. H., and P. Knippertz, 2003: An extreme precipitation
event in southern Morocco in spring 2002 and some hydro-
logical implications. Weather, 58, 377–387.
Funatsu, B. M., and D. W. Waugh, 2008: Connections between
potential vorticity intrusions and convection in the eastern
tropical Pacific. J. Atmos. Sci., 65, 987–1002.
Higgins, R. W., J.-K. E. Schemm, W. Shi, and A. Leetma, 2000:
Extreme precipitation events in the western United States
related to tropical forcing. J. Climate, 13, 793–820.
Huffman, G. J., R. F. Adler, S. Curtis, D. T. Bolvin, and E. J. Nelkin,
2007: Global rainfall analyses at monthly and 3-hr time scales.
Measuring Precipitation from Space: EURAINSAT and the
Future, V. Levizzani, P. Bauer, and F. J. Turk, Eds., Springer
Verlag, 291–306.
Iskenderian, H., 1995: A 10-year climatology of Northern Hemi-
sphere tropical cloud plumes and their composite flow pat-
terns. J. Climate, 8, 1630–1637.
Jones, P. D., T. Jonsson, and D. Wheeler, 1997: Extension to the
North Atlantic oscillation using early instrumental pressure
observations from Gibraltar and south-west Iceland. Int.
J. Climatol., 17, 1433–1450.
Jones, S. C., and Coauthors, 2003: The extratropical transition of
tropical cyclones: Forecast challenges, current understanding,
and future directions. Wea. Forecasting, 18, 1052–1092.
Kallberg, P., P. Berrisford, B. Hoskins, A. Simmons, S. Uppala,
S. Lamy-Thepaut, and R. Hine, 2005: ERA-40 Atlas. ERA-40
Project Report Series 19, ECMWF, 191 pp.
Kiladis, G. N., 1998: Observations of Rossby waves linked to
convection over the eastern tropical Pacific. J. Atmos. Sci., 55,
321–339.
——, and K. M. Weickmann, 1992: Extratropical forcing of tropical
Pacific convection during northern winter. Mon. Wea. Rev.,
120, 1924–1938.
Knippertz, P., 2003: Tropical–extratropical interactions causing
precipitation in northwest Africa: Statistical analysis and
seasonal variations. Mon. Wea. Rev., 131, 3069–3076.
——, and J. E. Martin, 2005: Tropical plumes and extreme pre-
cipitation in subtropical and tropical West Africa. Quart. J.
Roy. Meteor. Soc., 131, 2337–2365.
——, and ——, 2007: A Pacific moisture conveyor belt and its
relationship to a significant precipitation event in the semi-
arid southwestern United States. Wea. Forecasting, 22,
125–144.
——, A. H. Fink, A. Reiner, and P. Speth, 2003: Three late summer/
early autumn cases of tropical–extratropical interactions caus-
ing precipitation in Northwest Africa. Mon. Wea. Rev., 131,
116–135.
Mass, C., 2008: The Weather of the Pacific Northwest. University of
Washington Press, 281 pp.
Matthews, A. J., and G. N. Kiladis, 1999: Interactions between
ENSO, transient circulation, and tropical convection over the
Pacific. J. Climate, 12, 3062–3086.
McGuirk, J. P., A. H. Thompson, and N. R. Smith, 1987: Moisture
bursts over the tropical Pacific Ocean. Mon. Wea. Rev., 115,
787–798.
Newell, R. E., and Y. Zhu, 1994: Tropospheric rivers: A one-year
record and a possible application to ice core data. Geophys.
Res. Lett., 21, 113–116.
——, N. E. Newell, Y. Zhu, and C. Scott, 1992: Tropospheric
rivers?—A pilot study. Geophys. Res. Lett., 19, 2401–2404.
Ninomiya, K., and Y. Shibagaki, 2007: Multi-scale features of the
Meiyu–Baiu front and associated precipitation systems. J. Meteor.
Soc. Japan, 85B, 103–122.
Pauluis, O., A. Czaja, and R. Korty, 2008: The global atmospheric
circulation on moist isentropes. Science, 321, 1075–1078.
Peixoto, J. P., and A. H. Oort, 1992: Physics of Climate. American
Institute of Physics, 520 pp.
Ralph, F. M., P. J. Nieman, and G. A. Wick, 2004: Satellite and
CALJET aircraft observations of atmospheric rivers over the
eastern North Pacific Ocean during the winter of 1997/98.
Mon. Wea. Rev., 132, 1721–1745.
Rasmusson, E. M., and K. Mo, 1993: Linkages between 200-mb
tropical and extratropical circulation anomalies during the
1986–1989 ENSO cycle. J. Climate, 6, 595–616.
Reed, R. J., M. D. Albright, A. J. Sammons, and P. Unden, 1988:
The role of latent heat release in explosive cyclogenesis:
Three examples based on ECMWF operational forecasts.
Wea. Forecasting, 3, 217–229.
Rodwell, M. J., and B. J. Hoskins, 1995: A model of the Asian
summer monsoon. Part II: Cross-equatorial flow and PV
behavior. J. Atmos. Sci., 52, 1341–1356.
Sanders, F., and J. R. Gyakum, 1980: Synoptic-dynamic climatol-
ogy of the ‘‘bomb.’’ Mon. Wea. Rev., 108, 1589–1606.
Shapiro, M. A., H. Wernli, N. A. Bond, and R. Langland, 2001: The
influence of the 1997–99 El Nino Southern Oscillation on
extratropical baroclinic life cycles over the eastern North
Pacific. Quart. J. Roy. Meteor. Soc., 127, 331–342.
Stohl, A., C. Forster, and H. Sodemann, 2008: Remote sources of
water vapor forming precipitation on the Norwegian west
coast at 608N—A tale of hurricanes and an atmospheric river.
J. Geophys. Res., 113, D05102, doi:10.1029/2007JD009006.
Uppala, S. M., and Coauthors, 2005: The ERA-40 Re-Analysis.
Quart. J. Roy. Meteor. Soc., 131, 2961–3012.
Walker, C. C., and T. Schneider, 2006: Eddy influences on Hadley
circulations: Simulations with an idealized GCM. J. Atmos.
Sci., 63, 3333–3350.
Wernli, H., 1997: A Lagrangian-based analysis of extratropical
cyclones. II: A detailed case study. Quart. J. Roy. Meteor. Soc.,
123, 1677–1706.
——, and H. C. Davies, 1997: A Lagrangian-based analysis of
extratropical cyclones. I: The method and some applications.
Quart. J. Roy. Meteor. Soc., 123, 467–489.
Xie, P., and P. A. Arkin, 1996: Analyses of global monthly pre-
cipitation using gauge observations, satellite estimates, and
numerical model predictions. J. Climate, 9, 840–858.
——, and ——, 1997: Global precipitation: A 17-year monthly
analysis based on gauge observations, satellite estimates, and
numerical model outputs. Bull. Amer. Meteor. Soc., 78, 2539–
2558.
Zhu, Y., and R. E. Newell, 1994: Atmospheric rivers and bombs.
Geophys. Res. Lett., 21, 1999–2002.
——, and ——, 1998: A proposed algorithm for moisture fluxes
from atmospheric rivers. Mon. Wea. Rev., 126, 725–735.
15 FEBRUARY 2010 K N I P P E R T Z A N D W E R N L I 1003
Copyright © 2022 FDOKUMEN