‘Pour votre tranquillité’: Ambiance, atmosphere, and surveillance
Upload
independentCategory
view
2download
0
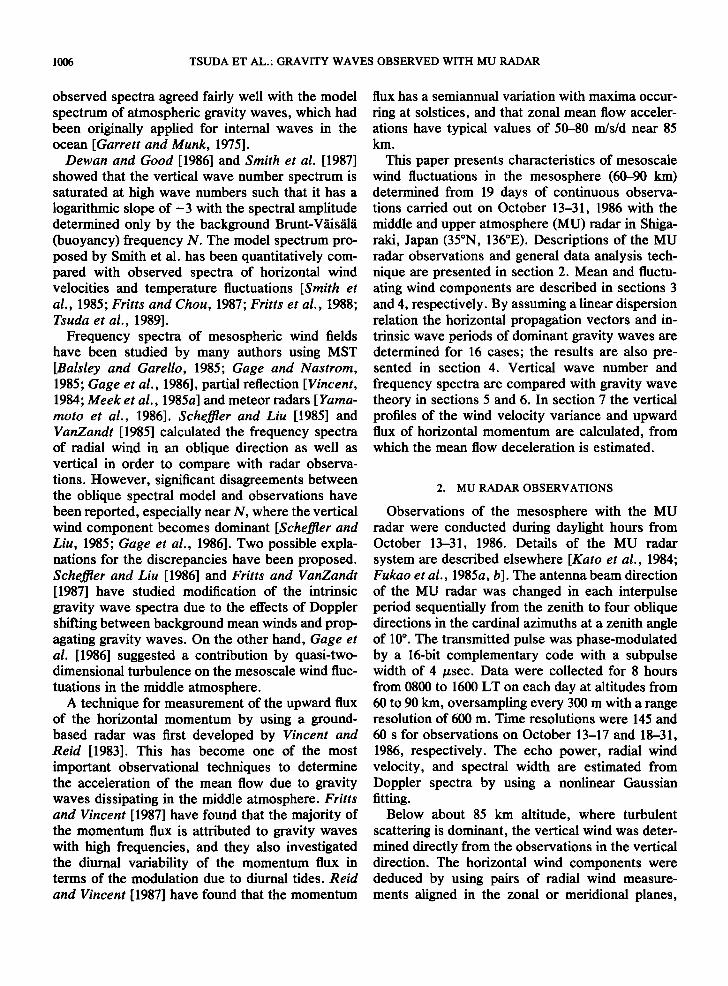
Radio Science, Volume 26, Number 5, Pages 1005-1018, September-October 1990
Gravity waves in the mesosphere observed with the middle and upper atmosphere radar
T. Tsuda, • S. Kato, • T. Yokoi, •,2 T. Inoue, 1,3 M. Yamamoto, • T. E. VanZandt, 4 S. Fukao, • and T. Sato 5
(Received May 31, 1989; revised September 28, 1989; accepted October 11, 1989.)
We have observed wind motions from 60 to 90 km altitudes with the middle and upper atmosphere (MU) radar during daylight hours (0800-1600 LT) from October 13 to 31, 1986. Gravity waves with fairly sinusoidal vertical structure were evident on 16 days of the 19 days of observations. They were characterized by a typical vertical wavelength of 5-15 km and intrinsic periods centered at about 8.6 hours. The propagation velocity of these waves was determined using the linear gravity wave theory. All of the waves propagated downward and had an equatorward component of the meridional propagation. The median direction of horizontal propagation was slightly east of south, and the mean horizontal phase speed was 35.3 m/s. The vertical wave number spectra of horizontal components of mesoscale wind fluctuations agree well with the theoretical spectrum of saturated gravity waves. At frequencies from 1 x 10 -5 to about 4 x 10 -5 c/s frequency spectra of vertical and radial wind components had logarithmic slopes of 1/3 and -5/3, respectively, which agree fairly well with a model gravity wave spectrum. The effects of Doppler shifting on frequency spectra are most obviously recognized at large frequencies near the Brunt Vfiisfilfi frequency. We have also determined the upward flux of horizontal momentum induced by waves with periods from 10 min to 8 hours and further esffmated the westward and northward body force of 5.1 and 4.0 m/s/d, respectively.
1. INTRODUCTION
A number of recent theoretical studies of satura-
tion, dissipation, and momentum deposition of gravity waves have emphasized the important role of gravity waves in transporting energy and momen- tum from the lower atmosphere to upper middle atmosphere and decelerating the mean flow there [Houghton, 1978; Lindzen, 1981; Matsuno, 1982; Holton, 1982, 1983; Fritts and Rastogi, 1985]. These studies have stimulated radar experiments designed to clarify these processes and other as- pects of the gravity wave field in the middle atmo- sphere [e.g., Fritts, 1984].
The horizontal phase velocity and period of grav-
I Radio Atmospheric Science Center, Kyoto University, Uji, Kyoto, Japan.
2 Now at Osaga Gas Company, Limited, Osaka, Japan. 3 Now at Kokusai Denshin Denwa Company, Limited, To-
kyo, Japan. 4 Environmental Research Laboratory, National Oceanic and
Atmospheric Administration, Boulder, Colorado. 5 Department of Electrical Engineering, Kyoto University,
Uji, Kyoto, Japan.
Copyright 1990 by the American Geophysical Union.
Paper number 89RS03246. 0048-6604/90/89RS-03246508.00
ity waves have been determined by using a cross- correlation analysis of wind fields measured by radars in regions horizontally separated by several tens to a few hundred kilometers [Vincent and Reid, 1983; Meek et al., 1985a; Yarnarnoto et al., 1986; Manson and Meek, 1988]. For gravity waves with periods less than 1 hour, Vincent and Reid deter- mined typical values of about 70 km and 70 m/s for the zonal horizontal wavelength and zonal phase velocity at 80-94 km. Meek et al. determined hori- zontal scales ranging from 68 km to 119 km and phase velocity from 20 to 93 m/s for waves with intrinsic periods of 10-100 min. From meteor radar observations at 90-100 km Yamamoto et al. have
determined ---25 m/s and ---360 km for mean values
of zonal phase velocity and wavelength for waves with periods from 2 to 8 hours, and they also found that the westward propagating waves are dominant in winter. By using a linear dispersion relation Hirota and Niki [1985] studied characteristics of gravity waves from rocketsonde observations col- lected at 30-60 km altitudes.
Since mesoscale wind fluctuations in the middle
atmosphere are frequently observed as superposi- tion of many waves with various wave numbers and frequencies, they are sometimes better interpreted by using spectra. VanZandt [1982] showed that the
1005
1006 TSUDA ET AL.: GRAVITY WAVES OBSERVED WITH MU RADAR
observed spectra agreed fairly well with the model spectrum of atmospheric gravity waves, which had been originally applied for internal waves in the ocean [Garrett and Munk, 1975].
Dewan and Good [1986] and Smith et al. [1987] showed that the vertical wave number spectrum is saturated at high wave numbers such that it has a logarithmic slope of-3 with the spectral amplitude determined only by the background Brunt-V•is•l• (buoyancy) frequency N. The model spectrum pro- posed by Smith et al. has been quantitatively com- pared with observed spectra of horizontal wind velocities and temperature fluctuations [Smith et al., 1985; Fritts and Chou, 1987; Fritts et al., 1988; Tsuda et al., 1989].
Frequency spectra of mesospheric wind fields have been studied by many authors using MST [Balsley and Garello, 1985; Gage and Nastrom, 1985; Gage et al., 1986], partial reflection [Vincent, 1984; Meek et al., 1985a] and meteor radars [Yama- moto et al., 1986]. Scheffier and Liu [1985] and VanZandt [1985] calculated the frequency spectra of radial wind in an oblique direction as well as vertical in order to compare with radar observa- tions. However, significant disagreements between the oblique spectral model and observations have been reported, especially near N, where the vertical wind component becomes dominant [Scheffier and Liu, 1985; Gage et al., 1986]. Two possible expla- nations for the discrepancies have been proposed. Scheffier and Liu [1986] and Fritts and VanZandt [1987] have studied modification of the intrinsic gravity wave spectra due to the effects of Doppler shifting between background mean winds and prop- agating gravity waves. On the other hand, Gage et al. [1986] suggested a contribution by quasi-two- dimensional turbulence on the mesoscale wind fluc-
tuations in the middle atmosphere. A technique for measurement of the upward flux
of the horizontal momentum by using a ground- based radar was first developed by Vincent and Reid [1983]. This has become one of the most important observational techniques to determine the acceleration of the mean flow due to gravity waves dissipating in the middle atmosphere. Fritts and Vincent [1987] have found that the majority of the momentum flux is attributed to gravity waves with high frequencies, and they also investigated the diurnal variability of the momentum flux in terms of the modulation due to diurnal tides. Reid
and Vincent [1987] have found that the momentum
flux has a semiannual variation with maxima occur-
ring at solstices, and that zonal mean flow acceler- ations have typical values of 50-80 m/s/d near 85 km.
This paper presents characteristics of mesoscale wind fluctuations in the mesosphere (60-90 km) determined from 19 days of continuous observa- tions carried out on October 13-31, 1986 with the middle and upper atmosphere (MU) radar in Shiga- raki, Japan (35øN, 136øE). Descriptions of the MU radar observations and general data analysis tech- nique are presented in section 2. Mean and fluctu- ating wind components are described in sections 3 and 4, respectively. By assuming a linear dispersion relation the horizontal propagation vectors and in- trinsic wave periods of dominant gravity waves are determined for 16 cases; the results are also pre- sented in section 4. Vertical wave number and
frequency spectra are compared with gravity wave theory in sections 5 and 6. In section 7 the vertical profiles of the wind velocity variance and upward flux of horizontal momentum are calculated, from which the mean flow deceleration is estimated.
2. MU RADAR OBSERVATIONS
Observations of the mesosphere with the MU radar were conducted during daylight hours from October 13-31, 1986. Details of the MU radar system are described elsewhere [Kato et al., 1984; Fukao et al., 1985a, b]. The antenna beam direction of the MU radar was changed in each interpulse period sequentially from the zenith to four oblique directions in the cardinal azimuths at a zenith angle of 10 ø. The transmitted pulse was phase-modulated by a 16-bit complementary code with a subpulse width of 4 /zsec. Data were collected for 8 hours from 0800 to 1600 LT on each day at altitudes from 60 to 90 km, oversampling every 300 m with a range resolution of 600 m. Time resolutions were 145 and
60 s for observations on October 13-17 and 18-31, 1986, respectively. The echo power, radial wind velocity, and spectral width are estimated from Doppler spectra by using a nonlinear Gaussian fitting.
Below about 85 km altitude, where turbulent scattering is dominant, the vertical wind was deter- mined directly from the observations in the vertical direction. The horizontal wind components were deduced by using pairs of radial wind measure- ments aligned in the zonal or meridional planes,
TSUDA ET AL.' GRAVITY WAVES OBSERVED WITH MU RADAR 1007
assuming horizontal homogeneity of wind fields over -•30 km separation of the radar sampling volumes. Above about 85 km, turbulent scattering is usually not significant, but wind can be deter- mined from meteor echoes, which are frequently detected in this height region [Avery et al., 1983; Tsuda et al., 1985]. However, since meteor echoes have a much more sporadic time-height distribution than turbulent echoes, the winds derived from them were not used in the present analyses of gravity waves.
The wind profiles determined every 145 or 60 s are used to calculate the frequency spectrum and momentum flux described in sections 6 and 7. The
wind profiles are subsequently averaged for 2 hours on center time 1 hour apart, while normally con- structing seven profiles each day, which are used to calculate vertical wave number spectrum. These profiles are also used to derive the horizontal prop- agation direction and intrinsic frequency of domi- nant gravity waves by analyzing their hodographs.
3. MEAN WINDS
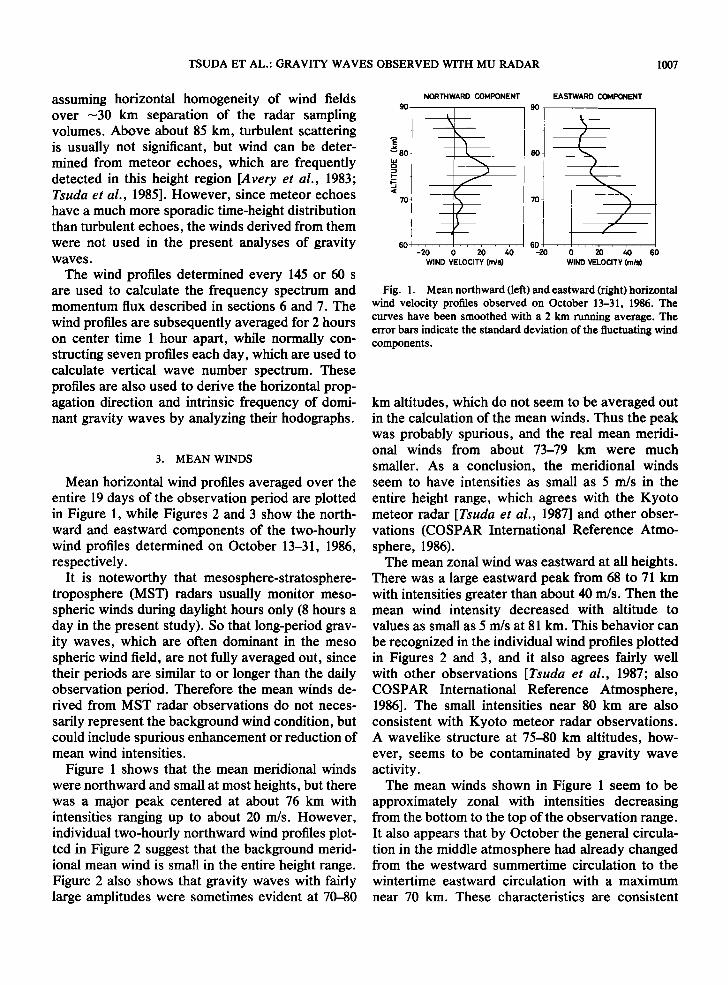
Mean horizontal wind profiles averaged over the entire 19 days of the observation period are plotted in Figure 1, while Figures 2 and 3 show the north- ward and eastward components of the two-hourly wind profiles determined on October 13-31, 1986, respectively.
It is noteworthy that mesosphere-stratosphere- troposphere (MST) radars usually monitor meso- spheric winds during daylight hours only (8 hours a day in the present study). So that long-period grav- ity waves, which are often dominant in the meso spheric wind field, are not fully averaged out, since their periods are similar to or longer than the daily observation period. Therefore the mean winds de- rived from MST radar observations do not neces-
sarily represent the background wind condition, but could include spurious enhancement or reduction of mean wind intensities.
Figure 1 shows that the mean meridional winds were northward and small at most heights, but there was a major peak centered at about 76 km with intensities ranging up to about 20 m/s. However, individual two-hourly northward wind profiles plot- ted in Figure 2 suggest that the background merid- ional mean wind is small in the entire height range. Figure 2 also shows that gravity waves with fairly large amplitudes were sometimes evident at 70-80
NORTHWARD COMPONENT
90 90
704
-20 0 20 40
WIND VELOCITY (m/s)
80
EASTWARD COMPONENT
-20 0 20 60 60
WIND VELOCITY (m/s)
Fig. 1. Mean northward (left) and eastward (right) horizontal wind velocity profiles observed on October 13-31, 1986. The curves have been smoothed with a 2 km running average. The error bars indicate the standard deviation of the fluctuating wind components.
km altitudes, which do not seem to be averaged out in the calculation of the mean winds. Thus the peak was probably spurious, and the real mean meridi- onal winds from about 73-79 km were much
smaller. As a conclusion, the meridional winds seem to have intensities as small as 5 m/s in the
entire height range, which agrees with the Kyoto meteor radar [Tsuda et al., 1987] and other obser- vations (COSPAR International Reference Atmo- sphere, 1986).
The mean zonal wind was eastward at all heights. There was a large eastward peak from 68 to 71 km with intensities greater than about 40 m/s. Then the mean wind intensity decreased with altitude to values as small as 5 m/s at 81 km. This behavior can
be recognized in the individual wind profiles plotted in Figures 2 and 3, and it also agrees fairly well with other observations [Tsuda et al., 1987; also COSPAR International Reference Atmosphere, 1986]. The small intensities near 80 km are also consistent with Kyoto meteor radar observations. A wavelike structure at 75-80 km altitudes, how- ever, seems to be contaminated by gravity wave activity.
The mean winds shown in Figure 1 seem to be approximately zonal with intensities decreasing from the bottom to the top of the observation range. It also appears that by October the general circula- tion in the middle atmosphere had already changed from the westward summertime circulation to the
wintertime eastward circulation with a maximum
near 70 km. These characteristics are consistent
1008 TSUDA ET AL.: GRAVITY WAVES OBSERVED WITH MU RADAR
12-15 LT 13 OCT 9-15 LT 14 OCT ,9-!5 ,LT, ]5,0,CT, 9-15 LT 16 OCT 9-15 LT 17 OCT i i i i i i i , i i i i I . i i , , , , . i , ,
? : •-1• LT 18 OCT 12-•5 L]' 19 OCr ' '
!
. . •-!5 •T: •,0 iOCT: ?-15 LT 21 OCT ?-15 LT 22 OCT
, ... ',: S-15,LT •5 '0• '" ...... ............. ::': ' -15LT 23 OCT 9-15 LT 24 OCT 9-15 LT 26 •T , . .
, . • '•% •','
90 9215'Lf 28'OCf 9:15'L• 29'O•f ,9:15'Lf •0'O•f 10-•5'gf •1 'O•f ....... • i . , , , i i i i
i i
0 • (mls) NORTHWARD COMPONENT
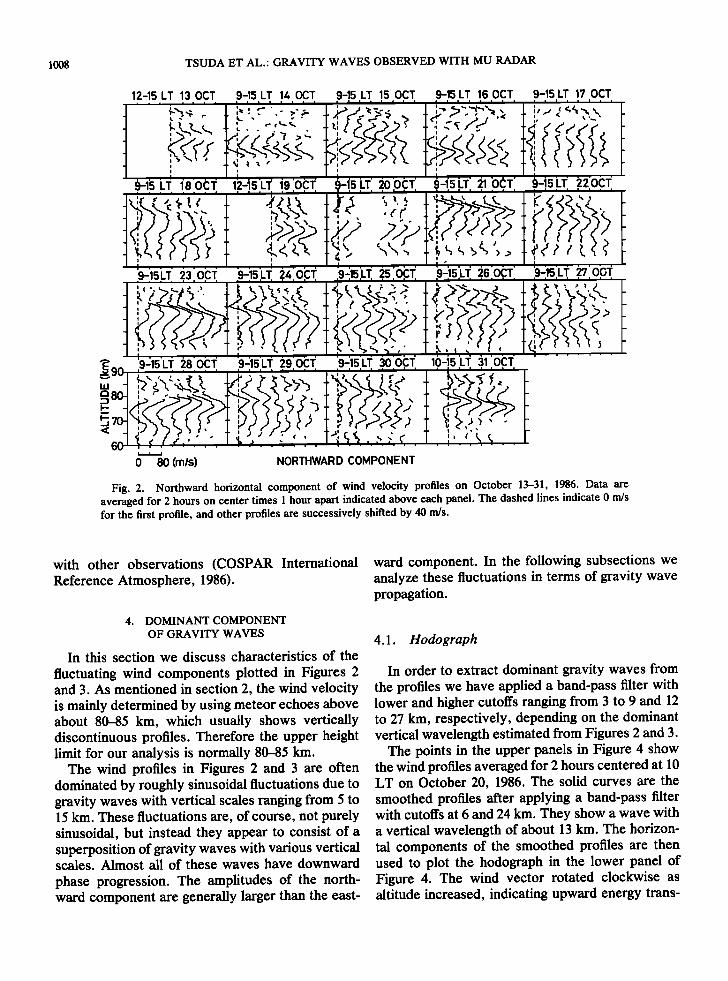
Fig. 2. Northward horizontal component of wind velocity profiles on October 13-31, 1986. Data are averaged for 2 hours on center times I hour apart indicated above each panel. The dashed lines indicate 0 m/s for the first profile, and other profiles are successively shifted by 40 m/s.
with other observations (COSPAR International Reference Atmosphere, 1986).
4. DOMINANT COMPONENT OF GRAVITY WAVES
In this section we discuss characteristics of the fluctuating wind components plotted in Figures 2 and 3. As mentioned in section 2, the wind velocity is mainly determined by using meteor echoes above about 80-85 km, which usually shows vertically discontinuous profiles. Therefore the upper height limit for our analysis is normally 80-85 km.
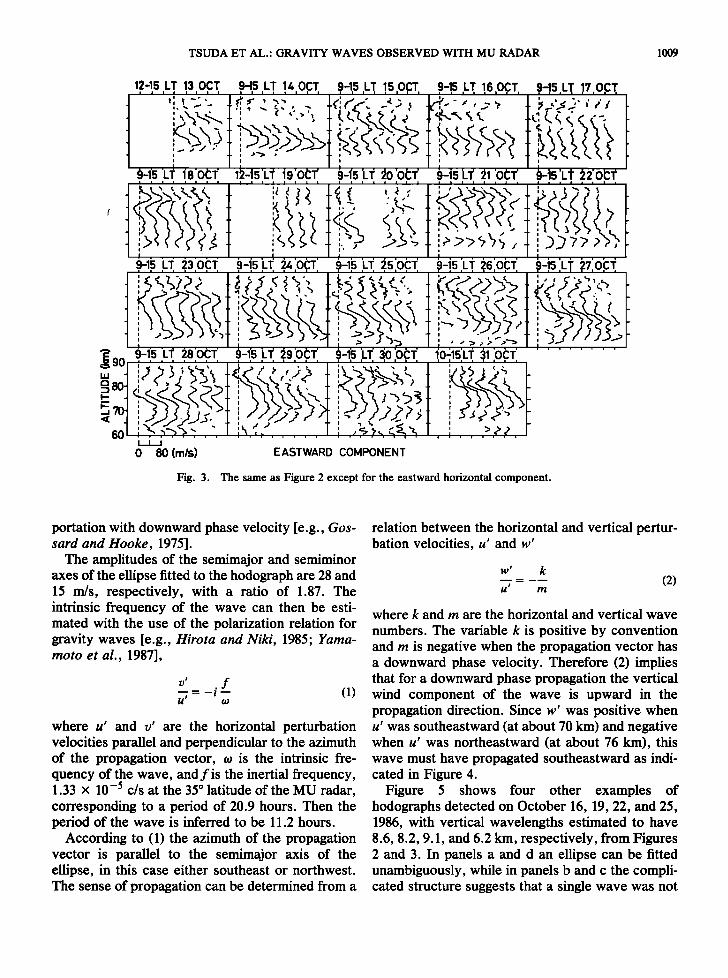
The wind profiles in Figures 2 and 3 are often dominated by roughly sinusoidal fluctuations due to gravity waves with vertical scales ranging from 5 to 15 km. These fluctuations are, of course, not purely sinusoidal, but instead they appear to consist of a superposition of gravity waves with various vertical scales. Almost all of these waves have downward phase progression. The amplitudes of the north- ward component are generally larger than the east-
ward component. In the following subsections we analyze these fluctuations in terms of gravity wave propagation.
4.1. Hodograph
In order to extract dominant gravity waves from the profiles we have applied a band-pass filter with lower and higher cutoffs ranging from 3 to 9 and 12 to 27 km, respectively, depending on the dominant vertical wavelength estimated from Figures 2 and 3.
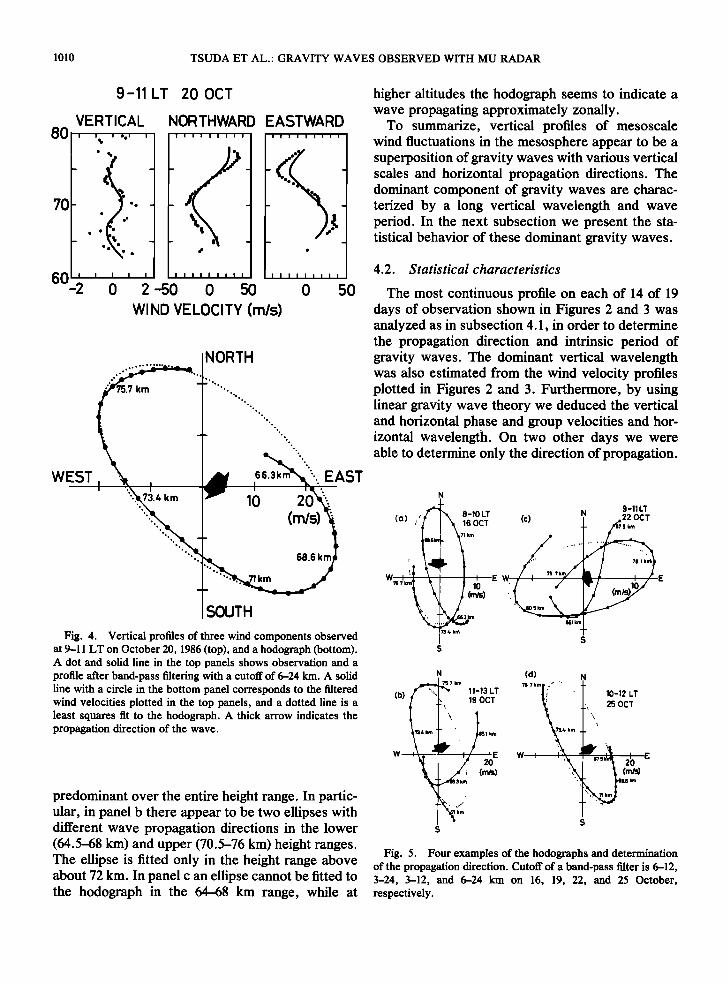
The points in the upper panels in Figure 4 show the wind profiles averaged for 2 hours centered at 10 LT on October 20, 1986. The solid curves are the smoothed profiles after applying a band-pass filter with cutoffs at 6 and 24 km. They show a wave with a vertical wavelength of about 13 km. The horizon- tal components of the smoothed profiles are then used to plot the hodograph in the lower panel of Figure 4. The wind vector rotated clockwise as altitude increased, indicating upward energy trans-
TSUDA ET AL.' GRAVITY WAVES OBSERVED WITH MU RADAR 1009
12-15 LT 13 OCT _ i i ii i i i i i
9-1'5 'LI , . i , ! i i i i i i i i i i • i i , i i i i i , i i i i , i , , , , i i i i i
...... . . . , i . , I . ! . . ! ,
.9-1.5 .LT. 2,3,0,CT, ',9-!5 ,LT, 2, z,,O,CT, ,9-1,5 ,LT, 2,5,0,c'r, ,9-!5 ,LT t6,0,C'l', I)-!5,L T ,2?,O,C:T,
' ' . , . ,'•, . i ,':>.',:'.-•.'•.. •-1'5 'u' •e'o•:t' •-1'S L'• •9'O(:T' ,9-•,S ,LT, 3,0,0,CT, 10-•5Lt 3• OCT, •' i i ! i i i i i i • ... ,,,
j ix.' ......... i . i.,, ::. I I I
0 80 (m/s) EASTWARD COMPONENT
Fig. 3. The same as Figure 2 except for the eastward horizontal component.
portation with downward phase velocity [e.g., Gos- sard and Hooke, 1975].
The amplitudes of the semimajor and semiminor axes of the ellipse fitted to the hodograph are 28 and 15 m/s, respectively, with a ratio of 1.87. The intrinsic frequency of the wave can then be esti- mated with the use of the polarization relation for gravity waves [e.g., Hirota and Niki, 1985; Yama- moto et al., 1987],
v' f -- = -i -- (1)
where u' and v' are the horizontal perturbation velocities parallel and perpendicular to the azimuth of the propagation vector, to is the intrinsic fre- quency of the wave, and f is the inertial frequency, 1.33 x 10 -5 c/s at the 35 ø latitude of the MU radar, corresponding to a period of 20.9 hours. Then the period of the wave is inferred to be 11.2 hours.
According to (1) the azimuth of the propagation vector is parallel to the semimajor axis of the ellipse, in this case either southeast or northwest. The sense of propagation can be determined from a
relation between the horizontal and vertical pertur- bation velocities, u' and w'
w' k
•'= m (2)
where k and m are the horizontal and vertical wave
numbers. The variable k is positive by convention and m is negative when the propagation vector has a downward phase velocity. Therefore (2) implies that for a downward phase propagation the vertical wind component of the wave is upward in the propagation direction. Since w' was positive when u' was southeastward (at about 70 km) and negative when u' was northeastward (at about 76 km), this wave must have propagated southeastward as indi- cated in Figure 4.
Figure 5 shows four other examples of hodographs detected on October 16, 19, 22, and 25, 1986, with vertical wavelengths estimated to have 8.6, 8.2, 9.1, and 6.2 km, respectively, from Figures 2 and 3. In panels a and d an ellipse can be fitted unambiguously, while in panels b and c the compli- cated structure suggests that a single wave was not
1010 TSUDA ET AL ß GRAVITY WAVES OBSERVED WITH MU RADAR
8O
7O
9-11LT 20 OCT
VERTICAL I I I ß I
'i ' 0 I I I I I
-2 0 2 -50
NORTHWARD EASTWARD i i i I I i i i i i
I I I I I I I I I
o 50
i I I i i i i i i
_
I I I I I I I I I
o 50
WIND VELOCITY (m/s)
WEST
NORTH
66.3km"•AST ' N 73.4km 1(• 20•:
Fig. 4. Vertical profiles of three wind components observed at 9-11 LT on October 20, 1986 (top), and a hodograph (bottom). A dot and solid line in the top panels shows observation and a profile after band-pass filtering with a cutoff of 6-24 km. A solid line with a circle in the bottom panel corresponds to the filtered wind velocities plotted in the top panels, and a dotted line is a least squares fit to the hodograph. A thick arrow indicates the propagation direction of the wave.
predominant over the entire height range. In partic- ular, in panel b there appear to be two ellipses with different wave propagation directions in the lower (64.5-68 km) and upper (70.5-76 km) height ranges. The ellipse is fitted only in the height range above about 72 km. In panel c an ellipse cannot be fitted to the hodograph in the 64-68 km range, while at
higher altitudes the hodograph seems to indicate a wave propagating approximately zonally.
To summarize, vertical profiles of mesoscale wind fluctuations in the mesosphere appear to be a superposition of gravity waves with various vertical scales and horizontal propagation directions. The dominant component of gravity waves are charac- terized by a long vertical wavelength and wave period. In the next subsection we present the sta- tistical behavior of these dominant gravity waves.
4.2. Statistical characteristics
The most continuous profile on each of 14 of 19 days of observation shown in Figures 2 and 3 was analyzed as in subsection 4.1, in order to determine the propagation direction and intrinsic period of gravity waves. The dominant vertical wavelength was also estimated from the wind velocity profiles plotted in Figures 2 and 3. Furthermore, by using linear gravity wave theory we deduced the vertical and horizontal phase and group velocities and hor- izontal wavelength. On two other days we were able to determine only the direction of propagation.
.. • .-'"•• 8-10 LT • 9-11LT (c) ? 22 OCT
.......'/ \ ß ' .... '78 1
' • •/ (mls"Y E
I s s
N (d) N
(h• '"'•'• • 11-13 LT • ?•! ............. JI-
'-' (-,,_ I"'""': 19 OCT •,• ....... .I 10-12 LT '""'"",... :•,. ,. •...,.,..,,..,
$ s
Fig. 5. Four examples of the hodographs and determination of the propagation direction. Cutoff of a band-pass filter is 6-12, 3-24, 3-12, and 6-24 km on 16, 19, 22, and 25 October, respectively.
TSUDA ET AL.' GRAVITY WAVES OBSERVED WITH MU RADAR 1011
NORTH
20
ß
SOUTH
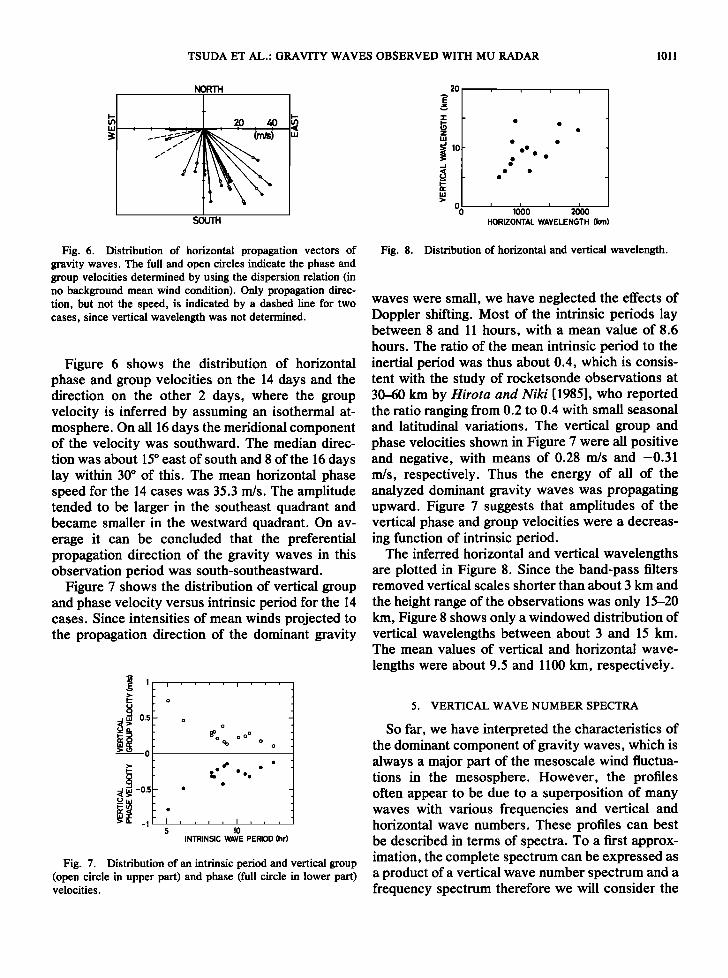
Fig. 6. Distribution of horizontal propagation vectors of gravity waves. The full and open circles indicate the phase and group velocities determined by using the dispersion relation (in no background mean wind condition). Only propagation direc- tion, but not the speed, is indicated by a dashed line for two cases, since vertical wavelength was not determined.
Figure 6 shows the distribution of horizontal phase and group velocities on the 14 days and the direction on the other 2 days, where the group velocity is inferred by assuming an isothermal at- mosphere. On all 16 days the meridional component of the velocity was southward. The median direc- tion was about 15 ø east of south and 8 of the 16 days lay within 30 ø of this. The mean horizontal phase speed for the 14 cases was 35.3 m/s. The amplitude tended to be larger in the southeast quadrant and became smaller in the westward quadrant. On av- erage it can be concluded that the preferential propagation direction of the gravity waves in this observation period was south-southeastward.
Figure 7 shows the distribution of vertical group and phase velocity versus intrinsic period for the 14 cases. Since intensities of mean winds projected to the propagation direction of the dominant gravity
< >• -o.s
>o. -1
o
øo o oø o o o o
i i i J i i i
lO INTRINSIC WAVE PERIOD (hr)
Fig. 7. Distribution of an intrinsic period and vertical group (open circle in upper part) and phase (full circle in lower part) velocities.
20
z
(..) _
ß
ß
ß
looo 2 oo HORIZONTAL WAVELENGTH (km)
Fig. 8. Distribution of horizontal and vertical wavelength.
waves were small, we have neglected the effects of Doppler shifting. Most of the intrinsic periods lay between 8 and 11 hours, with a mean value of 8.6 hours. The ratio of the mean intrinsic period to the inertial period was thus about 0.4, which is consis- tent with the study of rocketsonde observations at 30-60 km by Hirota and Niki [1985], who reported the ratio ranging from 0.2 to 0.4 with small seasonal and latitudinal variations. The vertical group and phase velocities shown in Figure 7 were all positive and negative, with means of 0.28 m/s and -0.31 m/s, respectively. Thus the energy of all of the analyzed dominant gravity waves was propagating upward. Figure 7 suggests that amplitudes of the vertical phase and group velocities were a decreas- ing function of intrinsic period.
The inferred horizontal and vertical wavelengths are plotted in Figure 8. Since the band-pass filters removed vertical scales shorter than about 3 km and
the height range of the observations was only 15-20 km, Figure 8 shows only a windowed distribution of vertical wavelengths between about 3 and 15 km. The mean values of vertical and horizontal wave-
lengths were about 9.5 and 1100 km, respectively.
5. VERTICAL WAVE NUMBER SPECTRA
So far, we have interpreted the characteristics of the dominant component of gravity waves, which is always a major part of the mesoscale wind fluctua- tions in the mesosphere. However, the profiles often appear to be due to a superposition of many waves with various frequencies and vertical and horizontal wave numbers. These profiles can best be described in terms of spectra. To a first approx- imation, the complete spectrum can be expressed as a product of a vertical wave number spectrum and a frequency spectrum therefore we will consider the
1012 TSUDA ET AL.' GRAVITY WAVES OBSERVED WITH MU RADAR
16 OCT
10 ? 10-12 LT
10 • :• .
'•. 10 5
lO" • 10 31'"1 , ,,;&
< 27 OCT
•) 10 ? 12-14 LT
•j 10 s
10s L-. •
ld/' 10 -3
19 OCT 25 OCT 12-14 LT 12-14 LT
"1 ........ I
28 OCT 10-12 LT
,,,
ß
29 OCT 8-10 LT
lO'
10 5
10 s
lO'
I I i i I ii I
103 ld• 1• 3
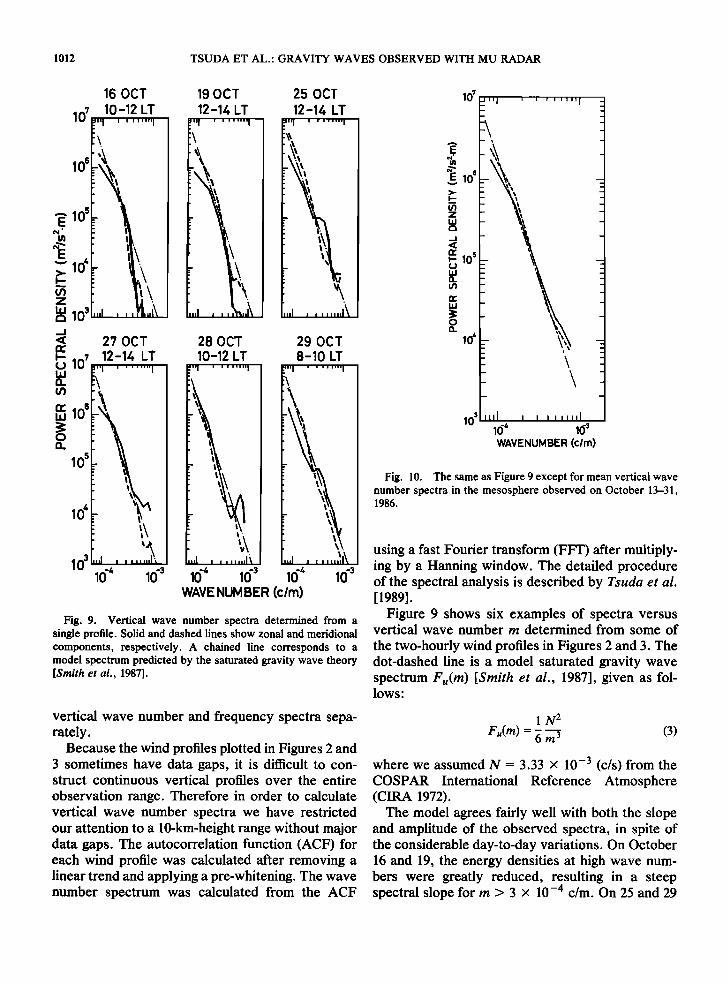
,I ', , ,', WAVENUMBER (c/m) Fig. 10. The same as Figure 9 except for mean vertical wave
number spectra in the mesosphere observed on October 13-31, 1986.
•i\ using a fast Fourier transform (FFT) after multiply- ing by a Hanning window. The detailed procedure
WAVE NUMBER (c/m)
Fig. 9. Vertical wave number spectra determined from a single profile. Solid and dashed lines show zonal and meridional components, respectively. A chained line corresponds to a model spectrum predicted by the saturated gravity wave theory [Smith et al., 1987].
vertical wave number and frequency spectra sepa- rately.
Because the wind profiles plotted in Figures 2 and 3 sometimes have data gaps, it is difficult to con- struct continuous vertical profiles over the entire observation range. Therefore in order to calculate vertical wave number spectra we have restricted our attention to a 10-km-height range without major data gaps. The autocorrelation function (ACF) for each wind profile was calculated after removing a linear trend and applying a pre-whitening. The wave number spectrum was calculated from the ACF
of the spectral analysis is described by Tsuda et al. [1989].
Figure 9 shows six examples of spectra versus vertical wave number rn determined from some of
the two-hourly wind profiles in Figures 2 and 3. The dot-dashed line is a model saturated gravity wave spectrum Fu(m) [Smith et al., 1987], given as fol- lows:
I N 2
Fu(m) = 6 m 3 (3)
where we assumed N = 3.33 x 10 -3 (c/s) from the COSPAR International Reference Atmosphere (CIRA 1972).
The model agrees fairly well with both the slope and amplitude of the observed spectra, in spite of the considerable day-to-day variations. On October 16 and 19, the energy densities at high wave num- bers were greatly reduced, resulting in a steep spectral slope for rn > 3 x 10 -4 c/m. On 25 and 29
TSUDA ET AL.' GRAVITY WAVES OBSERVED WITH MU RADAR 1013
10 5
z I.iJ ½:3
.u 0 3
- x¾..--VZ85 model (10 ø) - \ - \
-
\ -- ß
i i i i i ! ii
(o',o') (•10')
....... (90:10) (180', 10')
.... (270', 10 ø
85 model (0')
102 1(• • 1(• 3 1([ 2
FREQUENCY (c/s)
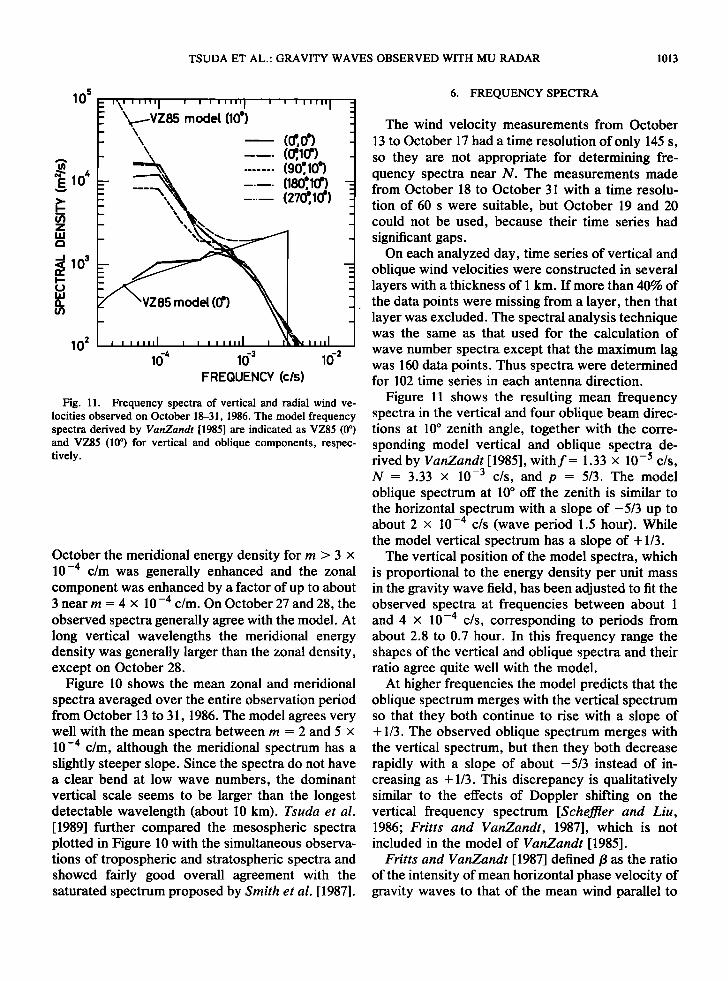
Fig. 11. Frequency spectra of vertical and radial wind ve- locities observed on October 18-31, 1986. The model frequency spectra derived by VanZandt [1985] are indicated as VZ85 (0 ø) and VZ85 (10 ø) for vertical and oblique components, respec- tively.
October the meridional energy density for m > 3 x 10 -4 c/m was generally enhanced and the zonal component was enhanced by a factor of up to about 3 near m = 4 x 10⁻⁴ c/m. On October 27 and 28, the observed spectra generally agree with the model. At long vertical wavelengths the meridional energy density was generally larger than the zonal density, except on October 28.
Figure 10 shows the mean zonal and meridional spectra averaged over the entire observation period from October 13 to 31, 1986. The model agrees very well with the mean spectra between m - 2 and 5 x 10 -4 c/m, although the meridional spectrum has a slightly steeper slope. Since the spectra do not have a clear bend at low wave numbers, the dominant vertical scale seems to be larger than the longest detectable wavelength (about 10 km). Tsuda et al. [1989] further compared the mesospheric spectra plotted in Figure 10 with the simultaneous observa- tions of tropospheric and stratospheric spectra and showed fairly good overall agreement with the saturated spectrum proposed by Smith et al. [1987].
6. FREQUENCY SPECTRA
The wind velocity measurements from October 13 to October 17 had a time resolution of only 145 s, so they are not appropriate for determining fre- quency spectra near N. The measurements made from October 18 to October 31 with a time resolu-
tion of 60 s were suitable, but October 19 and 20 could not be used, because their time series had significant gaps.
On each analyzed day, time series of vertical and oblique wind velocities were constructed in several layers with a thickness of 1 km. If more than 40% of the data points were missing from a layer, then that layer was excluded. The spectral analysis technique was the same as that used for the calculation of
wave number spectra except that the maximum lag was 160 data points. Thus spectra were determined for 102 time series in each antenna direction.
Figure 11 shows the resulting mean frequency spectra in the vertical and four oblique beam direc- tions at 10 ø zenith angle, together with the corre- sponding model vertical and oblique spectra de- rived by VanZandt [1985], with f= 1.33 x 10 -5 c/s, N = 3.33 x 10 -3 c/s, and p = 5/3. The model oblique spectrum at 10 ø off the zenith is similar to the horizontal spectrum with a slope of-5/3 up to about 2 x 10 -4 c/s (wave period 1.5 hour). While the model vertical spectrum has a slope of + 1/3.
The vertical position of the model spectra, which is proportional to the energy density per unit mass in the gravity wave field, has been adjusted to fit the observed spectra at frequencies between about 1 and 4 x 10 -4 c/s, corresponding to periods from about 2.8 to 0.7 hour. In this frequency range the shapes of the vertical and oblique spectra and their ratio agree quite well with the model.
At higher frequencies the model predicts that the oblique spectrum merges with the vertical spectrum so that they both continue to rise with a slope of + 1/3. The observed oblique spectrum merges with the vertical spectrum, but then they both decrease rapidly with a slope of about -5/3 instead of in- creasing as + 1/3. This discrepancy is qualitatively similar to the effects of Doppler shifting on the vertical frequency spectrum [Scheffier and Liu, 1986; Fritts and VanZandt, 1987], which is not included in the model of VanZandt [1985].
Fritts and VanZandt [1987] defined/3 as the ratio of the intensity of mean horizontal phase velocity of gravity waves to that of the mean wind parallel to

1014 TSUDA ET AL.' GRAVITY WAVES OBSERVED WITH MU RADAR
8O
•- 70- I.- -
<[ -
-
--
-
6O 0
MERIDIONAL COMPONENT I i I i
10 rnin - 8 hr
o NORTHWARD ß SOUTHWARD
2
I I 1-8 hr
0 2 0 2
I I
10-60 rnin
8O i i I i
ZONAL COMPONENT
I' ' I I
o EASTWARD
ß WESTWARD
60 • • 0 2 4 0 2 0 2
VARIANCE (mZls z)
Fig. 12. Variance of radial wind velocities for meridional (top) and zonal (bottom) components. Waves with periods from 10 min to 8 hours (left), I to 8 hours (center), and 10 to 60 min (fight) are filtered out.
the wave propagation direction. Since frequency spectra shown in Figure 11 are averaged over the entire observation altitudes, it is difficult to estimate /3 accurately. However, by assuming a mean hori- zontal phase velocity of about 30 m/s, which is comparable to the mean intensity of the background winds shown in Figure 1, we could assume that/3 is smaller than 1, because gravity waves do not nec- essarily propagate parallel to the mean wind direc- tion. Thus/3 in the mesosphere is much smaller than that in the lower atmosphere, where/3 could some- times exceed 10. Fritts and VanZandt have shown
that the vertical energy density near N is signifi- cantly reduced even for small/3. So that the distor- tion of the vertical frequency spectrum at high frequencies shown in Figure 11 is consistent with the effects of Doppler shifting.
The present set of spectra can be compared with the spectra observed during summer at about 87 km by the Poker Flat radar (65øN, 147øW) [Gage et al., 1986]. The oblique spectra at the two radars are quite consistent in both shape and amplitude (taking into account that the observations were made at
zenith angles of 10 ø at the MU radar and 15 ø at Poker Flat, respectively).
But the spectra of vertical wind component differ a great deal. While the MU radar spectrum has a slope of + 1/3 up to about 4 x 10 -4 c/s and then decreases with a slope of about -5/3, the Poker Flat spectra have a slope of about -1 over the entire frequency range from about 10 -5 to 8 x 10 -4 c/s. The Poker Flat spectral densities decreased from 2 x 10³ to 102 m2/s 2 in a frequency range from 5 x 10 -5 to 10 -3 c/s, which are about an order of magnitude smaller than the MU radar observations. The variance or energy density integrated over the common frequency range is also about an order of magnitude smaller at Poker Flat.
The model gravity wave spectrum [Schemer and Liu, 1985; VanZandt, 1985] also predicts that a ratio of the energy densities between the 10 ø oblique and vertical spectra becomes 2 at 3.9 x 10 -4 (43 min), i.e., contributions to the 10 ø oblique energy density from the vertical and horizontal components be- come comparable at this frequency. MU radar observations show relatively good agreement with the model. On the other hand, Gage et al. [1986] detected the ratio as large as 50 at 1/10 of N from the Poker Flat MST radar observations done at a zenith
angle of 15 ø, while the model predicts the ratio of about 4.5.
The comparisons of the vertical spectra described above suggests that the vertical energy density detected at Poker Flat near the mesopause is con- siderably smaller than the determination by using the MU radar.
7. WIND VELOCITY VARIANCE
AND MOMENTUM FLUX
In this section we present a profile of the wave- induced upward flux of horizontal momentum using the technique developed by Vincent and Reid
TSUDA ET AL.: GRAVITY WAVES OBSERVED WITH MU RADAR 1015
[1983]. For each range gate and each day the linear trend was subtracted from the 8-hour time series of
radial wind velocities. Then the fluctuating radial wind components were extracted by using filters with pass bands from 10 min to 8 hr, 1 to 8 hr, and 10 to 60 min. The variance for each range gate and each day was calculated for each band, and the results were averaged over the 19 days of observa- tions. The results are shown in Figure 12.
In the band from 10 min to 8 hours (left panels) the northward variances are generally larger than the southward and the westward are larger than the eastward. Both components increase irregularly from roughly 2.5 m2/s 2 near 65 km to 4.0 m2/s 2 at 75 km.
If kinetic energy were conserved, then these variances would increase with the atmospheric scale height of about 6.3 km, that is, by a factor of 4.9 from 65 to 75 km. The observed increase is only about 1.6, so most of the wave energy must have been dissipated during the upward propagation.
In the band from 1 to 8 hours (middle panels) the variance profiles have shapes similar to those in the 10-min to 8-hour band, but with amplitudes only about half as large. The anisotropy between the northward and southward and the eastward and
westward variances is also similar, but somewhat smaller. The meridional variance with periods 1-8 hour increased from about 1 to 2 m2/s 2 between 65 and 75 km. The zonal variance increased only from about 1 to 1.5 m2/s 2, but it had a peak of about 2 m2/s 2 near 73 km. Since in this period range the principal contribution to the radial variance comes from the horizontal wind component, then the hor- izontal variances can be estimated by dividing the radial variances by sin 2 10 ø. The resulting meridi- onal and zonal variances from 65 to 75 km were
then 33 to 66 rn2/s2 and 33 to 50 rn2/s2, respec- tively.
Meek et al. [1985b] observed the seasonal varia- tion at Saskatoon, Canada, of the horizontal vari- ance for periods between 1 and 8 hours. They found that in October the meridional variance increased
from about 85 m2/s 2 at 65 km to 110 m2/s 2 at 75 km, while the zonal variance had a fairly constant value of 130 m2/s 2. These values were larger than ours by factors of 1.7 to 4, and their rates of increase with height were smaller for both the meridional and zonal components.
Vincent and Fritts [1987] found that the total horizontal variance at Adelaide, Australia, from 1
8O
tl.I
•70
60
EASTWARD COMPONENT -
..... NORTHWARD COMPONENT - .,.
-0.5 0 0.5 1
MOMENTUM FLUX (kg. rr[•Z')x10 -"
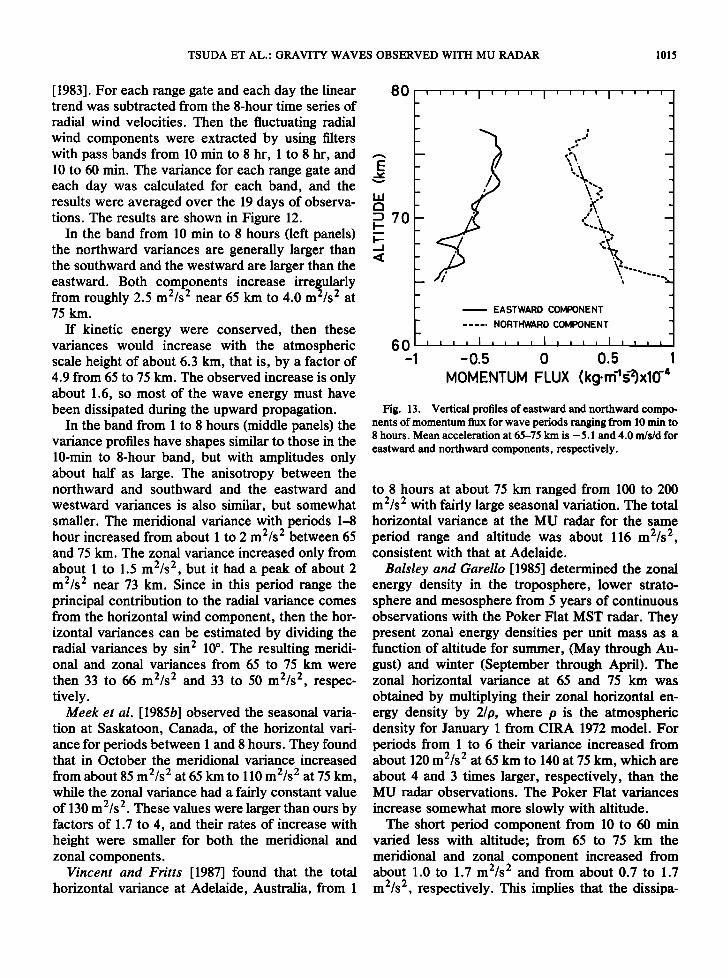
Fig. 13. Vertical profiles of eastward and northward compo- nents of momentum flux for wave periods ranging from 10 min to 8 hours. Mean acceleration at 65-75 km is -5.1 and 4.0 m/s/d for
eastward and northward components, respectively.
to 8 hours at about 75 km ranged from 100 to 200 m2/s 2 with fairly large seasonal variation. The total horizontal variance at the MU radar for the same
period range and altitude was about 116 m2/s 2, consistent with that at Adelaide.
Balsley and Garello [1985] determined the zonal energy density in the troposphere, lower strato- sphere and mesosphere from 5 years of continuous observations with the Poker Flat MST radar. They present zonal energy densities per unit mass as a function of altitude for summer, (May through Au- gust) and winter (September through April). The zonal horizontal variance at 65 and 75 km was
obtained by multiplying their zonal horizontal en- ergy density by 2/p, where p is the atmospheric density for January 1 from CIRA 1972 model. For periods from 1 to 6 their variance increased from about 120 m2/s 2 at 65 km to 140 at 75 km, which are about 4 and 3 times larger, respectively, than the MU radar observations. The Poker Flat variances
increase somewhat more slowly with altitude. The short period component from 10 to 60 min
varied less with altitude; from 65 to 75 km the meridional and zonal component increased from about 1.0 to 1.7 m2/s 2 and from about 0.7 to 1.7 m2/s 2, respectively. This implies that the dissipa-
1016 TSUDA ET AL.: GRAVITY WAVES OBSERVED WITH MU RADAR
tion of energy was severer for the short period waves. Note that the contributions to the variance
from waves with periods longer and shorter than one hour are comparable. Also, the difference be- tween the northward and southward or the east-
ward and westward components is fairly small throughout the observed height range, which im- plies that the upward momentum flux was small for the short period waves.
Meek et al. [1985b] found that for periods less than one hour in October the zonal horizontal variance was about 100 m•/s • between 65 and 75 km. At the MU radar the zonal horizontal variance
in this range varied from 25 to 50 m•/s •. Since the contribution of the vertical wind component to the radial wind velocity variance is significant in this period range, division by sin • 10 ø actually overesti- mates the horizontal variance. Thus the variance of
waves with periods shorter than 1 hour is at most half of that at Saskatoon.
These comparisons suggest that the total horizon- tal variance from waves with periods from 1 to 6 hours ranged from 100 to 200 m•/s • from 65 to 75 km, with fairly large seasonal and global variations. Furthermore, the variance with periods from 10 min to 1 hour seemed to be comparable with that at longer periods.
Although the variance increased with altitude, the growth rate was obviously smaller than the dissipationless case, in which the variance would increase exponentially with the density scale height.
•According to the method introduced by Vincent and Reid [1983] the vertical flux of horizontal mo- mentum plotted in Figure 13 is determined from the difference between the northward and southward
and the eastward and westward total variances
shown in Figure 12. The mean flow acceleration or body force per unit mass can be estimated from the vertical gradient of the momentum flux. The mean meridional and zonal accelerations from the gradi- ent of the lines fitted to the curves between 65 and
75 km are +4.0 (i.e., northward) and =5.1 m/s/d (westward), where the atmosphere density is as- sumed as 8.2 x 10 -5 at 70 km from the CIRA 1972 model.
8. CONCLUDING REMARKS
This paper presents the behavior of gravity waves in the mesosphere observed by the MU radar from
October 10 to October 31, 1986. The behavior of the dominant component of gravity waves with vertical scales from 5 to 15 km is analyzed by assuming a linear dispersion, relation of gravity waves. Spectral analyses are also conducted in order to describe gravity waves observed as a superposition of many waves with various wavenumbers and frequencies. Characteristics of the gravity waves are summa- rized as follows'
1. All of the observed dominant gravity waves propagated in the equatorward direction with a median direction about 15 ø east •of south, which is nearly normal to the mean wind direction. The mean amplitude of horizontal phase velocity was 35.3 m/s. The horizontal phase velocities were generally larger than the mean winds projected in the propagation direction, suggesting that the ef- fects of Doppler shifting were not significant to these dominant gravity waves.
2. The dominant gravity waves showed down- ward phase progression with the mean amplitude of -0.31 m/s, indicating an upward energy transporta- tion.
3. Most of the intrinsic periods of the waves lay between 8 and 11 hours with a mean of 8.6 hours.
The mean vertical and horizontal wavelengths were 9.5 km and about 1100 km, respectively.
4. Vertical wave number spectra determined from the 2-hour average profiles agreed well with the theory of saturated gravity waves [Smith et al., 1987], although there was significant day-to-day variability. The dominant vertical scale estimated from the spectra was longer than about 10 km.
5. Frequency spectra of the vertical and radial wind component had slopes of about •1/3 and -5/3, respectively, for wave periods longer than about 30 min. At high frequencies near N the energy density of the vertical and radial frequency spectra decreased fairly rapidly, suggesting the importance of the effects of Doppler shifting on short-period gravity waves [Scheffier and Liu, 1986; Fritts and VanZandt, 1987].
6. In the entire observation altitudes the upward flux of horizontal momentum was westward and
northward for the zonal and meridonial compo- nents, respectively. The direction of the meridional momentum flux is opposite to the propagation di- rection of the dominant gravity waves, suggesting that the dominant gravity waves with low intrinsic frequencies are not effective in transporting the momentum flux, and short-period gravity waves
TSUDA ET AL.: GRAVITY WAVES OBSERVED WITH MU RADAR 1017
that are carrying large momentum flux mostly prop- agate in the northward direction in the meridional plane.
7. Between 65 and 75 km the gradient of the measured vertical flux of horizontal momentum
resulted in estimated northward and westward
mean flow accelerations of 4.0 and 5.1 m/s/d, re- spectively.
Acknowledgments. Helpful comments by D.C. Fritts are warmly acknowledged. The MU radar is operated by Radio Atmospheric Science Center, Kyoto University. This study is partially supported by the International Communications Foun- dation.
REFERENCES
Avery, S. K., A. C. Riddle, and B. B. Balsley, The Poker Flat, Alaska, MST radar as a meteor radar, Radio Sci., 18, 1021- 1027, 1983.
Balsley, B. B., and R. Garello, The kinetic energy density in the troposphere, stratosphere and mesosphere: A preliminary study using the Poker Flat MST radar in Alaska, Radio Sci., 20, 1355-1361, 1985.
Dewan, E. M., and R. E. Good, Saturation and the "universal" spectrum for vertical profiles of horizontal scalar winds in the atmosphere, J. Geophys. Res., 91, 2742-2748, 1986.
Fritts, D.C., Gravity wave saturation in the middle atmosphere: A review of theory and observations, Rev. Geophys. Space Phys., 22, 275-308, 1984.
Fritts, D.C., and H. G. Chou, An investigation of vertical wavenumber and frequency spectra of gravity wave motions in the lower stratosphere, J. Atmos. Sci., 44, 3610-3624, 1987.
Fritts, D.C., and P. K. Rastogi, Convective and dynamical instabilities due to gravity wave motions in the lower and middle atmosphere: Theory and observations, Radio Sci., 20, 1247-1277, 1985.
Fritts, D.C., and T. E. VanZandt, Effects of Doppler shifting on the frequency spectra of atmospheric gravity waves, J. Geo- phys. Res., 92, 9723-9732, 1987.
Fritts, D.C., and R. A. Vincent, Mesospheric momentum flux studies at Adelaide, Australia: Observations and a gravity wave-tidal interaction model, J. Atmos. Sci., 44, 605-619, 1987.
Fritts, D.C., T. Tsuda, T. Sato, S. Fukao, and S. Kato, Observational evidence of a saturated gravity wave spectrum in the troposphere and lower stratosphere, J. Atmos. Sci., 45, 1741-1759, 1988.
Fukao, S., T. Sato, T. Tsuda, S. Kato, K. Wakasugi, and T. Makihira, The MU radar with an active phased array system, 1, Antenna and power amplifiers, Radio Sci., 20, 1155-1168, 1985a.
Fukao, S., T. Tsuda, T. Sato, S. Kato, K. Wakasugi, and T. Makihira, The MU radar with an active phased array system, 1, In-house equipment, Radio Sci., 20, 1169-1176, 1985b.
Gage, K. S., and G. D. Nastrom, On the spectrum of atmo- spheric velocity fluctuations seen by MST/ST radar and their interpretation, Radio Sci., 20, 1339-1347, 1985.
Gage, K. S., B. B. Balsley, and R. Garello, Comparisons of horizontal and vertical velocity spectra in the mesosphere, stratosphere and troposphere: Observations and theory, Geo- phys. Res. Lett., 13, 1125-1128, 1986.
Garrett, C., and W. Munk, Space-time scales of internal waves: A progress report, J. Geophys. Res., 80, 291-297, 1975.
Gossard, E. E., and W. H. Hooke, Waves in the Atmosphere, Elsevier, New York, 1975.
Hirota, I., and T. Niki, A statistical study of inertia-gravity waves in the middle atmosphere, J. Meteorol. Soc. Jpn., 63, 1055-1066, 1985.
Holton, J. R., The role of gravity waves-induced drag and diffusion in the momentum budget of the mesosphere, J. Atmos. Sci., 39, 791-799, 1982.
Holton, J. R., The influence of gravity wave breaking on the ,
general circulation of the middle atmosphere, J. Atmos. Sci., 40, 2497-2507, 1983.
Houghton, J. T., The stratosphere and mesosphere, Q. J. R. Meteorol. Soc., 104, 1-29, 1978.
Kato, S., T. Ogawa, T. Tsuda, T. Sato, I. Kimura, and S. Fukao, The middle and upper atmosphere radar: First results using a partial system, Radio Sci., 19, 1475-1484, 1984.
Lindzen, R. S., Turbulence and stress due to gravity wave and tidal breakdown, J. Geophys. Res., 86, 9707-9714, 1981.
Manson, A. H., and C. E. Meek, Gravity wave propagation characteristics (60-120 km) as determined by the Saskatoon MF Radar (GRAVNET) system: 1983-85 at 52øN, 107øW, J. Atmos. Sci., 45,932-946, 1988.
Matsuno, T., A quasi-one-dimensional model of the middle atmospheric circulation interacting with internal gravity waves, J. Meteorol. Soc. Japan, 60, 215-226, 1982.
Meek, C. E., I. M. Reid, and A. H. Manson, Observations of mesospheric wind velocities, 1, Gravity wave horizontal scales and phase velocities determined from spaced wind observations, Radio Sci., 20, 1363-1382, 1985a.
Meek, C. E., I. M. Reid, and A. H. Manson, Observations of mesospheric wind velocities, 2, Cross sections of power spectral density for 48-8 hours, 8-1 hours, I hour-10 min over 60-110 km for 1981, Radio Sci., 20, 1383-1402, 1985b.
Reid, I. M., and R. A. Vincent, Measurements of the horizontal scales and phase velocities of short period mesospheric gravity waves at Adelaide, Australia, J. Atmos. Terr. Phys., 49, 1033-1048, 1987.
Scheffier, A. O., and C. H. Liu, Observation of gravity wave spectra in the atmosphere using MST radars, Radio Sci., 20, 1309-1322, 1985.
Scheffier, A. O., and C. H. Liu, The effects of Doppler shift on the gravity wave spectra observed by MST radar, J. Atmos. Terr. Phys., 48, 1225-1231, 1986.
Smith, S. A., D.C. Fritts, and T. E. VanZandt, Comparison of mesospheric wind spectra with gravity wave model, Radio Sci., 20, 1331-1338, 1985.
Smith, S. A., D.C. Fritts, and T. E. VanZandt, Evidence of a saturation spectrum of atmospheric gravity waves, J. Atmos. Sci., 44, 1404-1410, 1987.
Tsuda, T., M. Yamamoto, T. Sato, S. Kato, and S. Fukao, Comparison observations between the MU radar and the Kyoto meteor radar, Radio Sci., 20, 1241-1246, 1985.
Tsuda, T., T. Nakamura, and S. Kato, Mean winds observed by the Kyoto meteor radar in 1983-1985, J. Atmos. Terr. Phys., 49, 461-466, 1987.
1018 TSUDA ET AL.: GRAVITY WAVES OBSERVED WITH MU RADAR
Tsuda, T., T. Inoue, D.C. Fritts, T. E. VanZandt, S. Kato, T. Sato, and S. Fukao, MST radar observations of a saturated gravity wave spectrum, J. Atmos. Sci., 46, 2440-2447, 1989.
VanZandt, T. E., A universal spectrum of buoyancy waves in the atmosphere, Geophys. Res. Lett., 9, 575-578, 1982.
VanZandt, T. E., A model for gravity wave spectra observed by Doppler sounding systems, Radio Sci., 20, 1323-1330, 1985.
Vincent, R. A., Gravity wave motions in the mesosphere, J. Atmos. Terr. Phys., 46, 119-128, 1984.
Vincent, R. A., and D.C. Fritts, A climatology of gravity wave motions in the mesopause region at Adelaide, Australia, J. Atmos. Sci., 44, 748-760, 1987.
Vincent, R. A., and I. M. Reid, HF doppler measurements of mesospheric gravity wave momentum fluxes, J. Atmos. Sci., 40, 1321-1333, 1983.
Yamamoto, M., T. Tsuda, and S. Kato, Gravity waves observed by the Kyoto meteor radar in 1983-1985, J. Atmos. Terr. Phys., 48, 597-603, 1986.
Yamamoto, M., T. Tsuda, S. Kato, T. Sato, and S. Fukao, A saturated inertia gravity wave in the mesosphere observed by the middle and upper atmosphere radar, J. Geophys. Res., 92, 11,993-11,999, 1987.
S. Fukao, S. Kato, T. Tsuda, and M. Yamamoto, Radio Atmospheric Science Center, Kyoto University, Uji, Kyoto 611, Japan.
T. Inoue, Kokusai Denshin Denwa Company, Limited, Me- guro, Tokyo, 153, Japan.
T. Sato, Department of Electrical Engineering, Kyoto Univer- sity, Uji, Kyoto 611, Japan.
T. E. VanZandt, Environmental Research Laboratory, Na- tional Oceanic and Atmospheric Administration, Boulder, CO 80303.
T. Yokoi, Osaga Gas Company, Limited, Chuo-ku, Osaka 541, Japan.
Copyright © 2022 FDOKUMEN