Building a Public Transportation System in Hanoi: Between emergency and constraints
Upload
khangminh22Category
view
2download
0
Technical Report Documentation Page 1. Report No. FHWA/TX-10/0-6608-2
2. Government Accession No.
3. Recipient's Catalog No.
4. Title and Subtitle INTEGRATING THE TRANSPORTATION SYSTEM WITH A UNIVERSITY CAMPUS TRANSPORTATION MASTER PLAN: A CASE STUDY
5. Report Date September 2009 Published: April 2010 6. Performing Organization Code
7. Author(s) Rafael Aldrete-Sanchez, Jeff Shelton, and Dr. Ruey Long Cheu, P.E.
8. Performing Organization Report No. Report 0-6608-2
9. Performing Organization Name and Address Texas Transportation Institute The Texas A&M University System College Station, Texas 77843-3135
10. Work Unit No. (TRAIS) 11. Contract or Grant No. Project 0-6608
12. Sponsoring Agency Name and Address Texas Department of Transportation Research and Technology Implementation Office P.O. Box 5080 Austin, Texas 78763-5080
13. Type of Report and Period Covered Technical Report: May 2009–August 2009 14. Sponsoring Agency Code
15. Supplementary Notes Project performed in cooperation with the Texas Department of Transportation and the Federal Highway Administration. Project Title: Integrating the Transportation System with a University Campus Transportation Master Plan URL: http://tti.tamu.edu/documents/0-6608-2.pdf 16. Abstract University campuses are considered major trip attractors. This intense level of activity generates significant congestion levels within the campuses and in their vicinity, particularly in urban campus settings. With university enrollment trends expected to increase substantially in the next decade, this problem can only be expected to become worse. In addition, university campus settings are multi-modal and complex in nature, incorporating vehicular traffic, transit, and pedestrians into one transportation system. This creates a significant challenge for university campus planners when trying to incorporate their campus master plan into the overall regional or metropolitan transportation system. Systematic approaches to planning for the interaction of the various transport modes (including auto, transit, bicycle, and pedestrians) within the university campus system, and for the integration of these different modes with the larger transportation system, have not been documented. The mix of concentrated levels of pedestrian and bicycle traffic with vehicular congestion in a campus setting creates a number of significant conflict areas that range from pedestrian and cyclist safety to traffic and transit operations. These conflicts are exacerbated by the multi-jurisdictional nature of these interactions, which involve authorities at the campus, city, and state level. The objective of this research is to document a systematic approach to analyze the problems associated with the interaction and integration between university campus transportation systems and the larger metropolitan transportation system, in order to develop solutions to these problems. 17. Key Words University Campus Master Plan, Transportation System, Pedestrian Safety, Transportation System Integration, Best Practices
18. Distribution Statement No restrictions. This document is available to the public through NTIS: National Technical Information Service Springfield, Virginia 22161 http://www.ntis.gov
19. Security Classif.(of this report) Unclassified
20. Security Classif.(of this page) Unclassified
21. No. of Pages 138
22. Price
Form DOT F 1700.7 (8-72) Reproduction of completed page authorized


INTEGRATING THE TRANSPORTATION SYSTEM WITH A UNIVERSITY CAMPUS TRANSPORTATION MASTER PLAN:
A CASE STUDY
by
Rafael Aldrete-Sanchez Research Engineer
Texas Transportation Institute
Jeff Shelton Associate Transportation Researcher
Texas Transportation Institute
and
Dr. Ruey Long Cheu, P.E. Associate Professor Civil Engineering
University of Texas at El Paso
Report 0-6608-2 Project 0-6608
Project Title: Integrating the Transportation System with a University Campus Transportation Master Plan
Performed in cooperation with the Texas Department of Transportation
and the Federal Highway Administration
September 2009 Published: April 2010
TEXAS TRANSPORTATION INSTITUTE The Texas A&M University System College Station, Texas 77843-3135

v
DISCLAIMER
This research was performed in cooperation with the Texas Department of Transportation
(TxDOT) and the Federal Highway Administration (FHWA). The contents of this report reflect
the views of the authors, who are responsible for the facts and the accuracy of the data presented
herein. The contents do not necessarily reflect the official view or policies of FHWA or TxDOT.
This report does not constitute a standard, specification, or regulation. The engineer in charge of
the project was Rafael Aldrete (Texas P.E. # 98740).

vi
ACKNOWLEDGMENTS
This project was conducted in cooperation with the Texas Department of Transportation
(TxDOT). Thanks are also extended to the University of Texas at El Paso (UTEP) and Dr. Ruey
Long (Kelvin) Cheu, Greg McNicol, Jason Parry, and Elizabeth Gates as an integral partner in
the research effort. The researchers also acknowledge the following members of the Project
Monitoring Committee for their leadership, time, efforts, and contributions:
Project Director
Lonnie Gregorcyk, P.E., Yoakum District, TxDOT
Current Technical Panel
Chuck Berry, P.E., El Paso District, TxDOT
Aldo Madrid, P.E., El Paso District, TxDOT
Omar Madrid, P.E., El Paso District, TxDOT
Martha Gandara, P.E., El Paso District, TxDOT
Mark Wooldridge, P.E., Yoakum District, TxDOT
Paul Frerich, P.E., Yoakum District, TxDOT
Research and Technology Implementation Office
Duncan Stewart, P.E., Ph.D., Research Engineer, Research and Technology
Implementation Office, TxDOT
Sylvia Medina, Contract Specialist, RMC 2

vii
TABLE OF CONTENTS
Page
List of Figures ................................................................................................................................ x
List of Tables ............................................................................................................................... xii
Background and Task 1 ............................................................................................................... 1 Project Background ..................................................................................................................... 1 Task 1 .......................................................................................................................................... 1
Task 2 – Conduct Literature Review .......................................................................................... 3 Introduction ................................................................................................................................. 3
University Campus Master Planning ...................................................................................... 3 Campus Master Transportation Planning................................................................................ 4
Simulation for University Transportation Planning .................................................................. 12 References ................................................................................................................................. 16
Task 3 – Review Crash Locations.............................................................................................. 19 Introduction and Methodology ................................................................................................. 19 Traffic Crashes Statistical Analysis .......................................................................................... 20
Demographics and Enrollment Trends at UTEP .................................................................. 20 Crashes’ Peak Periods, Patterns, and Trends at UTEP ......................................................... 21 Visibility Conditions ............................................................................................................. 24 Crashes per Transportation Mode ......................................................................................... 25
Crashes Location Analysis ........................................................................................................ 26 Corridor Analysis .................................................................................................................. 26 Traffic Crashes inside the UTEP Campus ............................................................................ 28 Traffic Crashes outside the UTEP Campus .......................................................................... 29 Traffic Crashes Hotspots....................................................................................................... 31
References ................................................................................................................................. 36
Task 4 – Develop and Perform Faculty, Staff, and Student Surveys ..................................... 37 Survey Design and Marketing .................................................................................................. 37 Profile of Respondents .............................................................................................................. 38 Transportation Modes ............................................................................................................... 38 Trip Origins and Access to Campus ......................................................................................... 39 Arrival Times ............................................................................................................................ 40 Parking Lots and Destinations .................................................................................................. 41 Traffic Safety Problems ............................................................................................................ 41 Drop-off Points ......................................................................................................................... 42 Use of Public Transit ................................................................................................................ 42 Campus Shuttle Bus .................................................................................................................. 42 Bicycle Use ............................................................................................................................... 43 Pedestrians and Walking ........................................................................................................... 44

viii
Task 5 – Characterize Current and Future Systems ............................................................... 45 Introduction ............................................................................................................................... 45 Current Infrastructure ................................................................................................................ 45 Parking at UTEP ....................................................................................................................... 48 Miner Metro Shuttle Bus and Sun Metro Service ..................................................................... 48 Special Events ........................................................................................................................... 52 Surrounding Area ...................................................................................................................... 53 Future Infrastructure ................................................................................................................. 54 References ................................................................................................................................. 61
Task 6 – Identify Gaps and Develop Scenarios ........................................................................ 63 Introduction ............................................................................................................................... 63 Methodology ............................................................................................................................. 63 Accident Location Data Analysis ............................................................................................. 64
I-10 & Schuster Ave. ............................................................................................................ 64 N. Mesa St. & Cincinnati Ave. ............................................................................................. 65 N. Mesa St. & Glory Rd........................................................................................................ 66 N. Mesa St. & Schuster Ave. ................................................................................................ 67 N. Mesa St. & E Hague Rd. .................................................................................................. 67 N. Mesa St. & W University Ave. ........................................................................................ 67
UTEP Surveys ........................................................................................................................... 68 Modes of Transportation Utilized ......................................................................................... 68 UTEP Parking Demand and Shuttle Service ........................................................................ 69
Visual Inspection of the Campus Transportation Infrastructure ............................................... 69 Traffic Control ...................................................................................................................... 69 Pathways ............................................................................................................................... 71 Additional Concerns ............................................................................................................. 72
Literature Review...................................................................................................................... 74 Improving Pedestrian Crossings ........................................................................................... 74 Bike Riding Incentives .......................................................................................................... 75 Transit Related Incentives..................................................................................................... 75 Parking Management ............................................................................................................ 75
References ................................................................................................................................. 77
Task 7 – Analyze Transportation System Integration and Interactions .............................. 79 Introduction ............................................................................................................................... 79 Existing Network Conditions .................................................................................................... 80 Future Network Conditions....................................................................................................... 82 Integration between Systems .................................................................................................... 84
Task 8 – Estimate Costs .............................................................................................................. 85 Introduction ............................................................................................................................... 85 Recommended Infrastructure Improvements ............................................................................ 85 UTEP Proposed Transportation Improvements ........................................................................ 87 Cost Estimation ......................................................................................................................... 88
From Recommended Infrastructure Improvements .............................................................. 88 From UTEP Proposed Transportation Improvements .......................................................... 89
ix
References ................................................................................................................................. 91
Task 9 – Case Study Conclusions and Recommendations ...................................................... 93 Introduction ............................................................................................................................... 93 Traffic Control .......................................................................................................................... 93 Pedestrian Crossings ................................................................................................................. 97 Transit ....................................................................................................................................... 98 Walk and Bike Paths ............................................................................................................... 101 Infrastructure Improvement Recommendations ..................................................................... 101 Transportation Improvements Prioritized List ........................................................................ 105
Appendix A – English Version of the Survey ......................................................................... 109
Appendix B – Spanish Version of the Survey ......................................................................... 115
Appendix C – Analysis of Sun Bowl and University Avenue Intersection ......................... 121

x
LIST OF FIGURES
Page Figure 1. The Campus Master Transportation Planning Components. .......................................... 5 Figure 2. MRSA Modeling Framework. ....................................................................................... 15 Figure 3. Definition of UTEP Traffic Crashes Impact Area. ....................................................... 20 Figure 4. UTEP Enrollment Trends and Projections (5). .............................................................. 21 Figure 5. Traffic Crashes Served by UTEP-PD. ........................................................................... 22 Figure 6. Percentage of Crashes on a Monthly Basis Served by UTEP-PD (2006-2009*). ......... 22 Figure 7. Traffic Crashes inside UTEP Campus per Day of the Week. ....................................... 23 Figure 8. Peak Days of Student’s Attendance (7). ........................................................................ 23 Figure 9. Traffic Crashes inside UTEP Campus per Time of the Day. ........................................ 24 Figure 10. Peak Hour of Student Attendance in 2002 (7). ............................................................ 24 Figure 11. Visibility Conditions of Crashes inside UTEP (2006-2009*). .................................... 25 Figure 12. Percentages of Crashes per Transportation Mode. ...................................................... 25 Figure 13. Crash Location Analysis in UTEP Campus Impact Area. .......................................... 27 Figure 14. Frequency of Crashes at Specific Locations. .............................................................. 33 Figure 15. High Priority Traffic Crashes Hotspots along N Mesa St. .......................................... 34 Figure 16. Traffic Crashes Hotspots on Campus Access Points. .................................................. 35 Figure 17. Screen Shot of the Survey Web Site........................................................................... 38 Figure 18. Mode Shares. .............................................................................................................. 39 Figure 19. Trip Origins. ............................................................................................................... 39 Figure 20. Entry Points to Campus. ............................................................................................. 40 Figure 21. Distribution of Arrival Times. .................................................................................... 40 Figure 22. Distribution of Parking Lots Used. ............................................................................. 41 Figure 23. Frequency of Miner Metro Usage. ............................................................................. 43 Figure 24. Directory of UTEP Buildings. .................................................................................... 46 Figure 25. UTEP Campus Layout. ............................................................................................... 47 Figure 26. Layout of Route 1 (East). ........................................................................................... 49 Figure 27. Layout of Route 2 (Campus Loop). ............................................................................ 49 Figure 28. Layout of Route 3 (West). .......................................................................................... 50 Figure 29. Layout of Route 4 (CHS/Nursing). ............................................................................ 51 Figure 30. The Black Frame Shows the Area Where Sun Metro Stops Are Located near UTEP.
............................................................................................................................................... 52 Figure 31. Distribution of Land Use by UTEP and Its Surrounding Area. ................................. 53 Figure 32. Layout of Proposed Buildings in Phase I. .................................................................. 54 Figure 33. Layout of Proposed Buildings in Phase II. ................................................................. 55 Figure 34. Layout of Proposed Open Spaces and Walkways in Phase I. .................................... 55 Figure 35. Layout of Proposed Open Spaces and Walkways in Phase II. ................................... 56 Figure 36. Layout of Proposed Parking Garages in Phase I. ....................................................... 56 Figure 37. Layout of Proposed Parking Garages in Phase II. ...................................................... 57 Figure 38. Screen Shot of Current Parking Lot by the Don Haskins Center. .............................. 58 Figure 39. Screen Shot of Transit Terminal and Parking Garage from the Don Haskins Center.58 Figure 40. View of the Transit Terminal from the Memorial Gym Parking Lot. ........................ 59 Figure 41. Screen Shot of Proposed Closed Campus Core. ......................................................... 60

xi
Figure 42. During Morning Peak Hours There Is a Spillback on Both Schuster Off-Ramps. ..... 65 Figure 43. Vehicle-Pedestrian Conflict on Mesa St. at Cincinnati Ave. ..................................... 66 Figure 44. The Crossing Striping on Hague Rd. near N Mesa St. Not Visible to Drivers. ......... 68 Figure 45. A Special Roundabout Design Needs to be Considered due to the Current Slope. ... 70 Figure 46. Portable Radar Speed Signs Proved to be Effective in Controlling Traffic along Sun
Bowl Dr. ................................................................................................................................ 71 Figure 47. Pathway Issues Encountered at Sun Bowl Dr. near the Don Haskins Center. ........... 71 Figure 48. Visibility Issues in the Inner Campus and Missing Sidewalks Creates Safety
Concerns in the Area. ............................................................................................................ 72 Figure 49. The Striping of Certain Pedestrian Crossings Are Barely Visible. ............................ 72 Figure 50. Drop-off Spots with Most Activity Create Significant Delays during Peak Hours. .. 73 Figure 51. Schuster Ave. Reduces from 2 Lanes to 1 Lane due to On-Street Parking. ............... 74 Figure 52. Active HAWK Signal Device in Tucson, Arizona (2). .............................................. 75 Figure 53. Transportation System Architecture. .......................................................................... 79 Figure 54. Microscopic Network - Existing Conditions. ............................................................. 80 Figure 55. Queue Spillback on Sun Bowl Dr. ............................................................................. 81 Figure 56. Hourly Volume on Proposed W Schuster Ave. Access. ............................................ 83 Figure 57. Comparison of Traffic Volume –Sun Bowl Dr. vs. New Campus Entrance. ............. 83 Figure 58. Sun Metro Transit Route Travel Time and Headway. ............................................... 84 Figure 59. Location of Proposed Transportation Improvements with Legend. ........................... 86 Figure 60. Location of the Modified Proposed Transportation Improvements. .......................... 88 Figure 61. Proposed Locations for Signalized Intersections. ...................................................... 93 Figure 62. Recommended Locations for Dynamic Radar Signs.................................................. 95 Figure 63. Proposed Locations of On-Street Parking Removal. .................................................. 96 Figure 64. Proposed Locations for Pedestrian Bridges. ............................................................... 98 Figure 65. Recommended Transit Route 1. ................................................................................. 99 Figure 66. Recommended Transit Route 2. ................................................................................. 99 Figure 67. Recommended Transit Route 3. ............................................................................... 100 Figure 68. Recommended Transit Route 4. ............................................................................... 100 Figure 69. Roadway Improvement Recommendations (P2 & P3). ........................................... 101 Figure 70. Roadway Improvement Recommendations (P4 & P5). ........................................... 102 Figure 71. Roadway Improvement Recommendations (P6 & P7). ........................................... 103 Figure 72. Recommended Drop-off Locations. ......................................................................... 104 Figure 73. Capacity Comparison of Single and Double Lane Roundabouts. ............................. 121 Figure 74. Queue Measurement Locations. ................................................................................ 122 Figure 75. Simulation Results - Queue Length. .......................................................................... 122 Figure 76. Delay and Travel Time Measurement Locations. ..................................................... 123 Figure 77. Simulation Results – Delay. ...................................................................................... 124 Figure 78. Simulation Results – Travel Time. ............................................................................ 124

xii
LIST OF TABLES
Page Table 1. Campus Transportation Planning Best Practices Analysis Matrix. ............................... 13 Table 2. Corridors within the Study Limits. ................................................................................. 26 Table 3. Corridors outside UTEP Campus with More than 5 Crashes. ........................................ 26 Table 4. Corridor Analysis inside UTEP Campus. ....................................................................... 28 Table 5. Traffic Injuries Reported inside UTEP Campus. ............................................................ 29 Table 6. Intersection Analysis of Traffic Crashes outside UTEP Campus. .................................. 30 Table 7. Traffic Injuries Type and Approximate Location (EPPD). ............................................ 31 Table 8. Prioritization of Traffic Crashes Hotspots. ..................................................................... 32 Table 9. Reasons for Not Using Bicycle on Campus. .................................................................. 44 Table 10. Costs Obtained from TTI Recommendations. ............................................................. 88 Table 11. Estimated Cost Obtained for Each Priority. ................................................................. 89 Table 12. Transportation Improvement Projects Priority List. .................................................. 107 Table 13. Average Queue Length (ft). ........................................................................................ 123
1
BACKGROUND AND TASK 1
PROJECT BACKGROUND
The University of Texas at El Paso (UTEP) is conducting several projects that will have a substantial impact in the transportation network in El Paso. Consequently, the Texas Department of Transportation (TxDOT) has requested the assistance from the Texas Transportation Institute (TTI) to perform a study of the integration of the transportation system with UTEP’s transportation master plan and to develop a synthesis of best practices of transportation systems integration employed by universities from across the country. The objective of this research is to document a systematic approach to analyze the problems associated with the interaction between university transportation systems and the metropolitan transportation system. The results of this research will have a near-term applicability for TxDOT particularly in urban areas where there is highly dense university campus populations. In order to conduct the technical evaluation, the research team proposed the following nine tasks:
Conduct Literature Review (Task 2).
Review Crash Locations (Task 3).
Develop and Perform Faculty, Staff, and Student Surveys (Task 4).
Characterize Current and Future Systems (Task 5).
Identify Gaps and Develop Scenarios (Task 6).
Analyze Transportation System Integration and Interactions (Task 7).
Estimate Costs (Task 8).
Case Study Conclusions and Recommendations (Task 9).
Synthesize Best Practices and Lessons Learned (Task 10).
TASK 1
Task 1 was a kick-off meeting for this research project, which was held on May 18, 2009. During the kick-off meeting, schedule, assigned tasks, deliverables, and timeline were finalized by the research team, program director, and RTI. Task 1 has no deliverables documentation and does not constitute as a technical evaluation, therefore it is not listed in the subsequent tasks listed above.


3
TASK 2 – CONDUCT LITERATURE REVIEW
INTRODUCTION
University campuses and their host communities are symbiotic. A successful campus master plan thus requires cooperative planning efforts of both campus and regional planners. It should be developed from a much extended perspective that involves not only the campus itself, but also the host and other affected communities. Campus transportation planning has been one of the most important chapters within a campus master plan for many universities. A transportation system of a university involves the planning and operation of various traffic modes as a whole, including motor vehicles, transit, pedestrians, and bicycles. This section synthesizes the practices that universities across the country use to manage the multi-modal campus traffic and to integrate campus transportation systems with metropolitan transportation systems. It starts with an overview of campus master planning, followed by a summary of university transportation planning practices as gathered primarily through a literature review complemented with telephone/e-mail interviews. In addition, this section includes a brief review of simulation methods used for campus transportation planning.
University Campus Master Planning
University campus master planning is a comprehensive decision-making process of which the final product is a medium- or long-term plan that outlines the future development of various campus components necessary for supporting the core functions of a university. Most major universities across the nation, if not all, regularly develop and update campus master plans to facilitate and steer the strategic development of their campuses. The Florida Board of Governors, for example, requires each member of the public university system in Florida to develop a campus master plan that covers a 10 to 20 year horizon and is updated every five years (1). These plans are formulated to meet a set of clearly defined development goals, frequently with participation of neighboring communities and/or local public agencies (LPAs). Campus master plans typically address a wide range of topics that require continuous assessment as a university grows over time. Listed below are some broad topics into which most of the planning areas can be grouped. Depending on planning needs and priorities, different universities may exclude or jointly address some of the areas. They may also include additional elements that are uniquely important to their campuses. Most of these topics are interrelated and planning on one of them requires careful addressing of others:
Transportation. The transportation component of a university master plan addresses the current and future transportation facilities and services on and around the planning campuses to meet the transportation needs of campus users and adjacent communities.
Land use and development (1). Campus master plans typically include sections assessing current land uses and developments on or around university campuses and outlining future land use and development needs. This area covers academic, support, housing, and recreational facilities that are needed for maintaining and enhancing daily university functions and activities. Universities carry out this planning based on current and projected student enrollments and university-related activities while taking into
4
consideration factors such as aesthetics, safety, security, and environmental impact. Different campuses have different priorities and may address certain elements in this topic separately, such as housing and recreational facilities.
General infrastructure (1). General infrastructure planning assesses and projects several basic infrastructural components that can be vital to general campus users, such as storm water management, portable water facilities, sanitary sewer and treatment, and solid waste facilities.
Campus safety and security. Campuses may face safety and security issues such as crime, terrorism, natural disasters, and other emergency events. Many universities therefore address this issue in their master plans by evaluating current and future strategies pertaining to campus safety facilities (e.g., lighting and emergency telephone system), security enforcement, emergency evacuation, and incident management (2).
Intergovernmental coordination and public relations. Many universities emphasize intergovernmental coordination and public relations during campus master planning to ensure the proposed university development goals compatible with and/or accepted by adjacent communities and symbiotic government agencies (1). The proper planning of this subject helps to reduce development redundancy and/or conflicts and to achieve development goals collaboratively with interrelated communities and agencies. It also helps to bridge any gap between a seemingly isolated campus and its host communities so that both live in harmony and mutually benefit from each other.
Conservation and efficiency. The goal of this planning is to develop a campus into an eco-friendly and sustainable environment through energy and natural resource conservation and environmental protection (1). These conservation strategies are particularly important to campuses with large populations.
Capital improvements (1). This subject assesses the financial capacity of a university and its capital needs required to maintain the university functions and to realize all necessary future developments as scheduled.
Other topics. Universities may also include other considerations in their master plans, such as technology advances, major social events (e.g., Olympics and major national/international conferences), and diversity support (2, 3).
Campus Master Transportation Planning
The mix of concentrated levels of pedestrian and bicycle traffic with motor vehicles in a campus setting creates a number of conflict areas causing safety and operational problems. These conflicts are exacerbated at border areas by the multi-jurisdictional nature involving the campus itself and the public agencies at the city, county, and state level. Therefore, many universities carry out their campus transportation planning in conjunction with interrelated LPAs. A campus master transportation plan is frequently an important accompanying document of or a major chapter in a campus master plan. Campus transportation planning is a comprehensive process that involves careful considerations of different modes of travel, transportation elements, and planning goals. It also requires collection and analyses of a large variety of existing and projected transportation data, such as traffic counts, crash data, campus population, and infrastructure. In addition, it is desirable for the planning process to involve activities such as student and employee surveys, travel surveys on campus and within the host community, public

5
outreach events, and coordination with interrelated public agencies. As such, many general transportation planning principles are applicable to campus transportation planning, although focuses or priorities can vary. A final product typically outlines sets of goals, principles, recommendations, and implementation guidelines, with discussions about current and proposed measures addressing major transportation challenges. Figure 1 illustrates the major components considered in a comprehensive campus transportation plan, including common planning goals, modes of travel, and planning elements.
Figure 1. The Campus Master Transportation Planning Components.
The following section summarizes the transportation-related practices used by universities as identified based on a comprehensive literature review. Given the scope and objectives of this study, the review was primarily focused on master transportation plans of those large-scale campuses located in urban areas facing transportation challenges. The researchers organized the practices generally based on modes of travel with relevant planning elements and goals jointly addressed, followed by a comparison analysis of best practices.
Collaborative Transportation Planning
Universities have long been planning and managing on-campus transit services collaboratively with local transit agencies. More and more universities extend the collaborative planning beyond transit to all transportation areas, such as bicycle and pedestrian planning, transportation infrastructure planning, and traffic control. The University of Washington’s campus planning efforts took into consideration the urban neighborhoods surrounding the campus by involving the Seattle City Council and a City/University Community Advisory Committee (CUCAC) to ensure

6
that the campus plan complemented elements of the city plan (4). The university also identified needs in their transportation plan to improve bicycle/pedestrian connectivity by improving the host street network through strategies such as filling in gaps within the network, changing signal timing to establish pedestrian priority over vehicles, and improving lighting. The University of Colorado (5) works with several transportation service providers including the Department of Transportation, Boulder County, the City of Boulder, and other affected cities to help ensure reasonable access to the campus. The university has a relatively compact, high-density campus at Boulder where it has been continuously developing a multi-modal transportation system well integrated with host systems. To relieve congestion on the major roadways surrounding the main campus, the City of Boulder uses various management strategies such as coordinating traffic signals, providing actuated control, and limiting turning movements. The University of Wyoming (6) jointly developed a Transportation and Parking Master Plan in coordination with the Wyoming Department of Transportation and the City of Laramie. Through close collaboration with these stakeholders, the master plan addressed key elements in a much broader context, including traffic and roads, bicyclists and pedestrians, and parking management, incorporating factors such as safety, wayfinding (refer to parking management strategies that help drivers to find parking garages), transit and growth, and new construction. The University of California, Davis, approved its Long Range Development Plan in 2003 in preparation for the projected growth before 2015 (7). The planning process utilized a multi-agency partnership involving the University of California’s Partners for Advanced Transit and Highways program (California PATH) and California Department of Transportation. As part of the planning effort, the agencies worked collaboratively to identify innovative mobility services and technologies to alleviate the transportation problems on the campus and in the surrounding region (8).
Pedestrian and Bicycle Practices
Pedestrian and bicycle traffic are the most common traffic modes on campus, and it is the goal of many universities across the nation to develop their campuses as a safe and accessible environment for pedestrians and cyclists. Some plans have included policy statements explicitly ranking pedestrian, bicycle, and transit as high-priority modes of travel on campus over personal vehicles. The observed best practices on pedestrian and bicycle planning are summarized as follows. Pedestrian and bicycle network. To facilitate bicyclists and pedestrians, universities continuously develop and improve their pedestrian and bicycle networks to improve accessibility and connectivity. Campus bicycle and pedestrian networks typically consist of various types of pathways, such as sidewalks, crosswalks, pedestrian bridges, underground pedestrian walkways, and bike paths/lanes. Many universities (4, 5, 9) plan and design the networks collaboratively with host cities to ensure smooth connectivity between the campuses and the cities. Pedestrian/bicycle bridges or tunnels are frequently provided for purposes such as passing over/under streets with heavy vehicular traffic, connecting with popular pedestrian destinations (e.g., transit stations and major student activity centers), and connecting major campus buildings. Some universities also used exclusive bike paths to improve bike mobility while reducing

7
bicycle-pedestrian conflicts (9). Ryerson University in downtown Toronto has developed an underground pedestrian network connecting several campus buildings and the Toronto downtown underground walkway system (10). Facilities and incentives. Most universities have pedestrian-friendly facilities such as seating facilities, shelters, drinking fountains, and lights along major pedestrian routes and bicycle racks and/or covered bicycle parking at major campus buildings. The University of Colorado uses colorful Tuscan vernacular architecture, diverse plant palette, and water features to create a very enjoyable walking environment on their Boulder campus (5). The University of California, Davis, is looking into Segway Human Transporters (HTs) (electric mobility devices for individual travel over short distances) to facilitate campus pedestrians and improve accessibility (8). Other innovative on-campus pedestrian movement concepts such as automatic people mover (APM) and personal rapid transit (PRT) have also been used (11, 12). To encourage the use of bikes on campus, the University of Washington has bike lockers that can be rented for a small fee (4). It also provides clothes lockers and showers on campuses to facilitate cyclists, and has been looking into programs to facilitate the purchase and/or lease of bicycles by faculties, staff, and students and to create bike centers on campus that rent and store campus bikes. Some universities or cities have established bicycle sharing programs that provide free bikes to students for personal use, public bikes on campus for student sharing at no cost, bikes that can be rented at little cost, or discounted bicycles for student purchase. However, issues such as maintenance, theft, and vandalism of these bicycles remain to be a challenge, forcing programs of this kind to be terminated at a few universities (13). Voluntary or mandatory bicycle registration programs can be a potential countermeasure to bicycle theft. In addition, due to abandoned bicycles occupying popular bicycle racks or other on-campus bicycle parking facilities, universities such as Texas A&M University have established policies to routinely remove these bicycles. Pedestrian and bicyclist safety. Bicycle and pedestrian crashes that involve motor vehicles are one of the major safety concerns on many campuses. Bicycle and pedestrian safety may be improved using the following strategies (14, 15, 16):
Improve campus pedestrian/bicycle networks (e.g., intersection design, roadway geometry and condition, bicycle/pedestrian bridges, bicycle paths, crosswalks, and sidewalks).
Improve traffic control (e.g., signal timing, detection, signage and warning, traffic calming, and motor vehicle restriction).
Improve safety awareness (e.g., educational programs/campaigns and bicycle/pedestrian regulations/laws).
Use safety equipment such as helmets, flashers, and safety vests. Most campuses across the nation are developed to be a pedestrian- and bicycle-friendly environment by restricting motor vehicular traffic and providing infrastructural support and necessary facilities. Because of these efforts, campuses are generally safe places for pedestrians and cyclists. Rather, campus border and peripheral areas can be problematic due to risks caused by conflicts between frequent vehicular traffic and pedestrians or cyclists accessing or egressing the campus. Other than causing safety problems, major arterials surrounding campuses can be
8
significant barriers for pedestrians and cyclists as well. To improve safety and connectivity, traffic calming mechanisms complemented by pedestrian-friendly roadway features and traffic control devices at conflicting areas should be used. Pedestrian/bicycle overpasses or underpasses are another potential solution but need to be designed properly to ensure cost-effectiveness. Some universities have established or been considering programs that specifically target pedestrian and bicyclist safety, such as selling discounted helmets and fluorescent vests and provide maps of high risk locations to campus cyclists (4). Researchers at the University of North Carolina used a GIS application by mapping both actual pedestrian crash locations and potential crash locations identified through a pedestrian survey to pinpoint high-risk locations and to facilitate safety awareness education and countermeasure development (17). Many universities also have measures such as campus lighting, emergency light/phone system, and escort and patrol services to reduce on-campus crime involving pedestrians (2). Traffic control devices at pedestrian crossings. Studies showed that a large percent of bicycle and pedestrian crashes that involve motor vehicles occurred during road crossings when either of the parties failed to yield to the other (14, 18). Many traffic control devices have been used to improve pedestrian safety at crosswalks on roadways carrying vehicular traffic (19, 20, 21, 22). Effective strategies frequently involve combinations of various treatments, such as median refuge islands, traffic calming mechanisms, and warning signs and signals. Listed below are some examples of high-visibility warning devices for reducing crashes at pedestrian crossings (22):
Pedestrian signals with red beacon display. These signals typically have displays with solid or flashing red beacons and include the “half signals” (as used in Seattle and Portland), midblock signal (as used in Los Angeles), and the high-intensity activated crosswalk (HAWK) signal (as used in Tucson). Operations evaluations showed that these devices are effective especially for high-volume, high-speed arterials. For example, the HAWK device, first used in Tucson, Arizona, has been currently installed at more than 60 locations. The signal is initially dark and cycles through flashing yellow, steady yellow, steady red, and flashing red upon actuation (23). A recent safety study of the HAWK based on data for 21 HAWK sites and 102 reference sites found the following changes in crashes after the HAWK beacon was installed: between 13 and 29 percent reduction in all crashes and approximately 50 percent reduction in pedestrian crashes (24).
Flashing beacons. Flashing beacons may be installed overhead, on roadside, or in pavement and are often manually or automatically actuated by pedestrians. In-roadway warning lights, for example, are flashing warning lights mounted in pavement that, when maintained properly, are effective in warning drivers about pedestrians crossing streets.
Other high-visibility warning devices. Devices such as warning signs with built-in illumination devices and crossing flags carried by pedestrians may also effectively raise drivers’ cautions and thus reduce crashes.
9
Transit-Related Practices
Transit is an important transportation component for most universities in urban settings. Depending on campus conditions and host city transit service availability, universities typically provide their own transit services and/or utilize services from host cities. Summarized below are some recommendable practices used by universities across the nation in relation to transit planning. Collaboration on transit services. It is common that universities collaboratively plan and manage transit services on their campuses with external transit providers in terms of fare/pass, schedule, routes, and terminal locations to maximize serviceability, flexibility, and connectivity (2, 4). For example, the University of Texas at Austin collaborates with the regional transit authority, Capital Metropolitan Transportation Authority (Capital Metro), to provide transit services on and off campus. Student fees are the source of 60 percent of the service costs, and Capital Metro contributes the rest from its sales tax revenues. In addition, a significant proportion of the capital costs of the buses were invested by federal funds. In terms of transit fare, it is common for universities and transit agencies to collaboratively establish fare agreements such as special pass and unlimited-access programs, special reduced-fare arrangements, and joint transit agency-university electronic fare card programs (25). Such an example is the U-Pass program at the University of Washington that allows full-fare coverage on the transit systems of several transportation authorities in the area (4). Ridership incentives. Universities frequently offer incentives to encourage students and employees to use transit, such as the aforementioned fare discounts or free services for riders with valid university ID. Some universities have or have considered transit malls/hubs at locations with high pedestrian volume to facilitate the use of transit services (5). Other methods such as improving conditions at transit stops (e.g., providing shelters, lighting, and safety measures) and service flexibility is also effective in increasing transit ridership. In addition, universities may consider bikes-on-buses or comparable programs for off-campus bus routes that encourage both transit ridership and bicycle usage. Common challenges pertaining to transit services that universities face include funding availability, service frequency, and transit capacity at peak hours (9). Potential improvements. Universities continuously look into improvements to campus transit services in their transportation plans. Some have used or been considering using Intelligent Transportation Systems (ITS) to provide vehicle location and arriving time to riders at a real-time basis (4, 9). Services may be increased during peak hours and evenings to better fit the student schedule. Universities may also schedule classes taking into consideration transit schedules and route/terminal locations or the other way around. University of Washington has plans to utilize the light-rail services in Seattle and to build direct pedestrian bridges connecting to light-rail stations on or close to campus (4). During on-campus special events that generate a large vehicular volume, it is also desirable that universities or event sponsors provide additional transit services to mitigate traffic demand.

10
Parking-Related Practices
Campus parking has been a major challenge for many universities in urban areas due to limited capacity. It is an important component of a campus transportation system and is therefore often addressed separately in a campus transportation plan. Effective parking planning and management, however, should consider the needs and challenges of all components of a campus transportation system as a whole. The following summarizes the practices in campus parking management. Campus Parking Management. Most universities manage their limited on-campus parking spaces using parking permits that are available for purchase by different groups of faculty, staff, and students. As such, parking pricing has been widely used as a mechanism to leveraging parking availability and demand. Visitor parking facilities and metered parking spaces are provided on many campuses for short-term parking at higher costs. Many universities also have off-campus parking lots connected by shuttle buses at little or no cost for employees and students. When off-campus parking lots are available, it is important to provide security bike parking facilities, frequent shuttle services, sufficient lighting, and security patrols and cameras to ensure connectivity and safety (2). The University of California, Davis, proposes to utilize advanced techniques such as wireless services, mobile phones, internet, and in-vehicle communication devices available from private service providers to more efficiently manage and utilize campus parking facilities (8). The University of Texas at Austin has looked into intelligent parking management mechanisms such as using an Advanced Parking Management System (APMS) software tool linked with dynamic message signs (DMS) and possibly other information dissemination tools including cell phones and internet (26). As experienced by many universities, students or university visitors frequently park on nearby neighborhood streets, resulting in traffic safety and parking problems at these locations and consequent complaints. To manage the parking at nearby neighborhoods, Oregon State University works with the surrounding neighborhoods to establish two neighborhood parking districts (27). Residents within these districts purchase annual parking permits at a little cost and vehicles without parking permits are limited to a two-hour stay. However, local residents indicated inconvenience in obtaining a parking permit and disinclination for the parking cost. The university is looking into improvements such as reducing parking time limits to one hour and allowing residents to park free. Campus resident parking. Depending on availability, universities with parking challenges may provide limited or no parking for students living on campuses (7, 9). When available, resident parking is typically subject to university general parking regulations, and permits can be purchased by campus residents selected based on certain criteria or through lotteries. Some universities have used or are looking to strategies such as preferential car-free housing for students without on-campus parking needs, and off-campus parking locations with secure bike parking facilities and/or transit services for campus residents with infrequent car-trip needs (9).
Motor Vehicular Traffic Practices
While many universities devote efforts on reducing personal vehicles, vehicular traffic remains to be a common transportation mode for university employees and students to travel to

11
campuses. Personal motor vehicles frequently cause congestions, parking shortage, and safety issues on and near campuses. In addition to apply strict restrictions to vehicular traffic on campuses, many universities with campuses in metropolitan areas devote significant efforts to discourage personal vehicles as a method to travel to campuses. Summarized below are some practices used by universities for managing motor vehicle traffic. Campus vehicular traffic control. For safety and other considerations, universities typically close or control the roadways passing through or entering their campuses. The University of Texas at Austin closed its major campus arterial from pass-through traffic, which facilitated the creation of a pedestrian mall (28). The University of Texas at El Paso is considering closing the entire campus core in conjunction with realignment of a major campus entrance, redesign of accesses to nearby interstate freeways, construction of parking garages, and reconfiguration of campus-wide traffic circulation (29). In addition, the master plan of the University of Colorado recommends the university to shift activities and employees to areas of the campus where the local street network is less congested (5). Vehicular traffic and parking demand reduction. Reducing vehicular traffic helps to mitigate transportation problems and protect the environment, and therefore has been a major goal of sustainable planning. Vehicular traffic and parking demand may be reduced through strategies such as maximizing the use of transit and bicycles, encouraging carpools and vanpools, and using parking management skills. Some universities have strategies such as using flexible work schedules and telecommunication technologies (e.g., electronic commuting and distance education) to reduce university employee work trips, adjusting class schedules to reduce or manage student parking demand, and providing preferred, discounted, and/or designated parking spaces for carpool/vanpool commuters and less frequent drivers (4, 5, 9, 27). Oregon State University also has guaranteed emergency ride home service for those who carpool, vanpool, or ride transit to work to encourage the use of alternative modes (27). The U-Pass program at the University of Washington facilitates the systematic management of campus transportation including transit, parking, carpool/vanpool, bicycle, and pedestrian (4). The program has helped to reduce personal vehicular traffic, to increase the use of transit and bicycles, and to relieve parking pressure. For example, the university offers carpoolers an on-campus parking subsidy through the U-PASS program. Vanpools are coordinated through local transit agencies, and participants are provided a monthly subsidy through the program as well. The university also considers a program that charges all employees and students an access fee with rebates for use of alternative modes. The University of California, Davis, has been evaluating the feasibility of using Neighborhood Electric Vehicles (NEVs) (small, low-speed electric vehicles) through a car-sharing system on campus and in its close vicinity to reduce regular personal motor vehicles in the area while increasing accessibility and mobility (8). Vehicular traffic accessibility. For safety, security, and accessibility purposes, university campuses should also plan roadway networks such that all major campus buildings are within a reasonable distance from where motor vehicles can access. This would provide necessary accessibility for general service vehicles, vehicles serving persons with special needs, and special vehicles in case of emergencies. The University of Colorado transportation plan provides such an example where accessibility for motor vehicles is addressed by eliminating obstacles and
12
providing access routes for vehicles in case of emergencies such as fire, flood, chemical release, hazardous material spill, or gas leakage (5).
Best Practices Analysis
Based on the literature review, the researchers further conducted a comparison analysis to conclude the best practices pertaining to campus transportation planning and management. To compare the practices, the research team defined three stages to measure their level of advance, including least advanced, moderately advanced, and most advanced. The practices observed during the literature review were grouped under each stage, as shown in Table 1. To categorize a practice, the researchers considered several factors, such as perceptual effectiveness, representativeness of the technology trends, consistency with contemporary transportation developments, and applicability on other campuses. Readers should notice that some practices, regardless of their level of advance as assigned herein, may still be able to sufficiently address transportation needs in their context and, therefore, best practices should be the practices that best meet given transportation needs.
SIMULATION FOR UNIVERSITY TRANSPORTATION PLANNING
The available literature regarding the transition between the network and university system mostly pertains to subjective solutions without a clear methodology that identifies how traffic redistributes when network infrastructure is changed. Metropolitan Planning Organizations (MPOs) for the most part use the traditional four-step travel demand (macroscopic) model that models traffic streams in a highly aggregated manner. Traffic details such as lane change maneuvers cannot be represented at all at the macroscopic level. Macroscopic simulation models deal with vehicle platoons rather than individual vehicles. Such a model is suitable when it is designated for freeways characterized by limited merging, and lane-change interactions are not of great importance. Their level of aggregation is frequently found in static planning models of large areas. These types of models usually display outputs as 24-hour Measures-of-Effectiveness (MOEs), and therefore, they cannot give an accurate description of traffic flow during specific periods of the day (30). Mesoscopic simulation models fill the gaps between the aggregated approach of macroscopic models and the detail-oriented microscopic ones. Mesoscopic models normally describe the traffic entities at a high level of detail, but their behavior and interactions are described at a lower level of detail and can take varying forms. In these models, vehicles are grouped into packets and routed through a network (31). A packet of vehicles acts as one entity, and its speed on each link is derived from a speed-density function defined for that link based on the density on that link at the moment of entry. The density on a link is defined as the number of vehicles per mile per lane. If there is significant traffic on the link, the speed-density function will assign a low speed to the vehicles, whereas a low density will result in high speeds. Another mesoscopic paradigm is that of individual vehicles that are grouped into cells that control their behavior. A cell is simply a platoon of vehicles grouped together. It traverses a link, and vehicles can enter and leave it when needed, but not be overtaken. In addition, the speed of the vehicles is determined by the cell, not the individual driver’s decisions (32).

13
Table 1. Campus Transportation Planning Best Practices Analysis Matrix. Least Advanced Moderately Advanced Most Advanced
Collaborative Transportation Planning Limited or no
coordination with LPAs and other stakeholders
Coordination with some LPAs and stakeholders on a limited number of planning topics (e.g., transit and/or congestion management)
Extensive coordination with all affected LPAs (e.g., city, county, and state Department of Transportation) and stakeholders on most or all transportation topics including transit, parking, pedestrian and bicycle, congestion management, and environmental impact
Pedestrian and Bicycle Minimum provisions for
pedestrian mobility and accessibility—narrow sidewalks, inconvenient pedestrian crossings, lack of sidewalk connectivity, etc.
Limited or poorly maintained bicycle routes; limited bicycle facilities (e.g., racks)
No pedestrian and bicycle incentives
No pedestrian and bicycle safety programs
No coordination with LPAs on pedestrian and bicycle planning
Network for basic pedestrian mobility and accessibility needs; a limited number of shaded paths, seating areas, grade-separated crossings, etc.
Some bicycle routes; basic bicycle facilities (e.g., racks, shaded parking spaces, etc.)
Limited pedestrian and bicycle incentives
Basic pedestrian and bicycle safety measures (e.g., routine traffic control, dedicated routes, etc.)
Some collaborative planning for limited connectivity, but barriers on or around campus exist
Extensive pedestrian network with enjoyable walking environment connecting to all major campus buildings, transit stations, and other popular pedestrian destinations
Extensive bicycle network with large numbers of exclusive bicycle paths, shaded bicycle parking, bicycle lockers, clothes lockers, showers, maintenance centers, etc.
Safe-walk programs, pedestrian transporters (e.g., HTs, APMs, and PRTs), bicycle sharing programs, bicycle purchase incentives, etc.
Pedestrian and bicycle safety education programs; use of advanced technologies (e.g., GIS and ITS) for safety improvement; and safety equipment (e.g., helmets, flashers, and safety vests) sharing programs
Collaborative planning on pedestrian and bicycle safety and network with maximum accessibility and connectivity on and around campus.
Transit No or limited transit
services and routes on campus; no pedestrian-friendly facilities at stations
No ridership incentives
No collaborative transit planning with local transit providers
Regular transit services provided by both university and local providers; limited facilities (e.g., shelters, seating, and lighting) at transit stops
Basic ridership incentives such as fare discount for students
Basic collaborative planning on routes, stops, and fare price
Adequate transit services on or around campus; convenient facilities (e.g., shelters, seating, lighting, emergency phone system, drinking fountains, etc.) at most transit stops; use of transit malls and hubs
Multiple ridership incentives such as little or no cost for students and employees, extended services during after hours, ready accessibility to transit stations, park and ride facilities, class schedules in coordination with transit availability, and ITS for transit vehicle location and schedule information
Well coordinated planning on transit services on or off campus for maximum connectivity and consistent service

14
Table 1. Campus Transportation Planning Best Practices Analysis Matrix (Continued). Least Advanced Moderately Advanced Most Advanced
Parking Poorly managed and
enforced parking facilities; no or very limited visitor parking
No regular parking inventory and/or studies; discrepancies exist between parking capacity and permits issued
No parking management in surrounding neighborhoods
Fairly designed parking facilities; regular parking enforcement; limited traffic signs for parking location; some visitor parking spaces
Limited parking inventory studies; moderate discrepancy between parking capacity and permits issued
Limited involvement in managing student parking within surrounding neighborhoods
Well designed and managed campus parking facilities; off-campus parking facilities with reliable shuttle service and safety measures; advanced parking management and information tools (e.g., APMS, DMS, and internet); convenient and clearly guided visitor parking
Regular parking inventory studies; clear understanding of parking availability and demand; up-to-date parking management strategies
Extensive collaboration and involvement in parking management within surrounding neighborhoods using mechanisms such as establishing collaboratively managed parking districts
Motor Vehicle Traffic No or implicit policy
statements discouraging use of personal vehicles in campus plans
Limited traffic control at very few entrances
Vehicular traffic restriction primarily by parking availability
No particular incentives for carless commuting
Statements included in campus plans emphasizing the importance of pedestrian, bicycle, and transit modes on campus
Traffic control at major campus entrances
Parking management skills used for vehicular traffic reduction, such as preferential parking for carpoolers/vanpoolers and infrequent drivers
Basic incentives for commuting by bicycles or transit as previously noted
Policy statements included in campus plans and explicitly rank pedestrian, bicycle, and transit as high-priority modes of travel on campus while personal vehicles are the least preferred
Traffic control at all major campus entrances as well as other strategic locations; campus roads with heavy pedestrian traffic closed to motor vehicles; sufficient auto accessibility for emergency events
Flexible working schedules; class schedule and location with consideration of parking availability and avoiding peak hours; use of telecommunication technologies
Guaranteed emergency ride home programs for people who commute by alternative modes; systematic incentive programs to encourage all alternative modes; other innovative incentives such as campus access fees with rebate for use of alternative modes
University planners often utilize microscopic simulation to analyze the interactions of various modes of traffic at a very fine-grained detail level. The details of microscopic models yield the flexibility to add many more modeling contexts and options than mesoscopic and macroscopic models (33). Microscopic models, though requiring more computing time and resources to run, generally represent vehicles more realistically. These models theoretically are more responsive to different traffic control strategies, produce more accurate MOEs, and provide more flexibility to test various combinations of capacity and demand strategies (34). They have been used to

15
analyze traffic and transit operations under constraints such as lane configuration, various vehicle compositions, traffic control strategies, and transit terminals. Microscopic simulation modeling is often confined to a limited study area (e.g., university campus) and does not consider system changes outside modeling areas (e.g., surrounding neighborhood). On the other hand, mesoscopic models are not detailed enough to analyze the interactions of individual modes or specific lanes. Herein is where the problem lies. Using either type of models, planners cannot consistently simulate the detailed interactions of a multi-modal university campus transportation system while simultaneously modeling the surrounding transportation networks both temporally and spatially. However, changes to the campus transportation system (i.e., campus entrance realignment) will undoubtedly redistribute traffic either inside the campus or on the surrounding network. A solution to this dilemma is a Multi-Resolution Simulation Assignment (MRSA) modeling approach that integrates both mesoscopic and microscopic models and can be applied to any number of campus settings to determine traffic flow redistribution at both the system-wide and localized levels simultaneously. The MRSA approach was during the UTEP campus master planning process. Figure 2 depicts the MRSA modeling framework.
Figure 2. MRSA Modeling Framework.
The MRSA model uses Dynamic Traffic Assignment (DTA) logic and simulates the regional network to equilibrium conditions. A sub-area of the university campus and surrounding neighborhood will then be converted to a microscopic model for detailed analyses including pedestrian/vehicle interactions, transit service, and parking distribution. It must be noted that a mode split between transit service and auto (park and ride) use was not explicitly modeled in this study. However, the transit service was included in the simulation network as this mode significantly impacts traffic congestion—especially at stop point locations. Scenarios will be modeled in accordance with both the UTEP campus master plan and TxDOT planned infrastructure improvements. In addition, results of student/staff surveys regarding problem locations and review of best practices from other universities were included in the overall modeling efforts. Various MOEs were analyzed from both the mesoscopic and microscopic models and presented in graphical, tabular, and simulation-based format.
16
REFERENCES
1. Florida Board of Governors. Rules of the Department of Education Board of Regents, Chapter 6C-21: Campus Master Plans, 2009. http://www.flbog.org/about/regulations/proposed.php. Accessed June 5, 2009.
2. University of Illinois at Chicago. UIC Master Planning Home. http://www.uic.edu/master_plan/index.htm. Accessed June 12, 2009.
3. University of Washington Tacoma. Campus Master Plan 2008 Update. http://www.tacoma.washington.edu/chancellor/masterplan/overview.html. Accessed June 12, 2009.
4. University of Washington. Overview of Campus Master Plan. Approved 2003. http://www.washington.edu/community/cmp_site/final_cmp.html. Accessed June 17, 2009.
5. University of Colorado at Boulder. Campus Master Plan. 2001. http://www.colorado.edu/masterplan/plan/index.html. Accessed July 3, 2009.
6. University of Wyoming. Transportation and Parking Master Plan. 2008. http://www.uwyo.edu/images/DOCUMENTS/finalptplan.pdf. Accessed July 6, 2009.
7. University of California, Davis. UC Davis 2003 Long Range Development Plan. http://www.ormp.ucdavis.edu/environreview/lrdp.html#2003LRDP. Accessed June 22, 2009.
8. Shaheen, S. “University of California, Davis, Long-Range Development Plan: A Davis Smart Mobility Model.” Paper UCD-ITS-RR-03-14, Institute of Transportation Studies, 2004.http://repositories.cdlib.org/itsdavis/UCD-ITS-RR-03-14. Accessed June 22.
9. Fehr & Peers Transportation Consultants. “Transportation Demand Management Draft Report.” March 2009, Roseville, California. http://www.csuchico.edu/fcp/docs/tdm_revised_draft_report_03112009.pdf. Accessed June 18, 2009.
10. Ryerson University. Ryerson University Master Plan. March 2008. http://www.ryerson.ca/about/masterplan/Ryerson%20MP_march2008.pdf. Accessed June 18, 2009.
11. Young, S. E., R. W. Miller, and E. D. Landman. “Automated People Mover on a University Campus-Mobility Impact Analysis.” Transportation Research Record 1872, Transportation Research Board, Washington, D. C., 2004, pp. 56 – 61.
12. Muller, P. J., S. E. Young, M. Vogt. “Personal Rapid Transit Safety and Security on a University Campus.” Transportation Research Record 2006, Transportation Research Board, Washington, D. C., 2007, pp. 95 – 103.

17
13. Zezima, K. “With Free Bikes, Challenging Car Culture on Campus.” The New York Times, October 19, 2008. http://www.nytimes.com/2008/10/20/education/20bikes.html. Accessed July 6, 2009.
14. Raborn, C., D. J. Torbic, D. K. Gilmore, L. J. Thomas, J. M. Hutton, R. Pfefer, T. R. Neuman, K. L. Slack, V. Bond, and K. K. Hardy. “Guidance for Implementation of the AASHTO Strategic Highway Safety Plan, Volume 18: A Guide for Reducing Collisions Involving Bicycles.” NCHRP Report 500, Transportation Research Board, Washington, D. C., 2008.
15. Zegeer, C. V., L. Sandt, M. Scully, M. Ronkin, M. Cynecki, P. Lagerwey, H. Chaney, B. Schroeder, and E. Snyder. “How to Develop a Pedestrian Safety Action Plan.” Publication FHWA-SA-05-12, University of North Carolina, Chapel Hill, North Carolina, 2009.
16. Warren, A., A. Davidson, A. Cervenka, L. Davey, and K. Parsons. Higher Education: Bicycle Safety for Colleges and Universities. Tulane University and Regional Planning Commission, New Orleans, Louisiana, 2009.
17. Schneider, R. J., A. J. Khattak, and C. V. Zegeer. “Pedestrian Safety Proactively with Geographic Information Systems: Example from a College Campus.” Transportation Research Record 1773, Transportation Research Board, Washington D. C., 2001, pp. 97 – 107.
18. Zegeer, C. V., D. L. Carter, W. W. Hunter, J. R. Stewart, H. Huang, A. Do, and L. Sandt. “Index for Assessing Pedestrian Safety at Intersections.” Transportation Research Record 1982, Transportation Research Board, Washington D. C., 2006, pp. 76 – 83.
19. Manual on Uniform Traffic Control Devices for Streets and Highways (MUTCD), 2003 Edition. Federal Highway Administration, Washington D. C., 2003.
20. Lalani, N. “Alternative Treatments for At-Grade Pedestrian Crossings.” Informational Report, Pedestrian and Bicycle Council Task Force Committee, Institute of Transportation Engineers, Washington D. C., 2001.
21. Zegeer, C., C. Seiderman, P. Lagerwey, M. Cynecki, M. Ronkin, and R. Schneider. „Pedestrian Facilities User Guide – Providing Safety and Mobility.” Publication FHWA-RD-00-103, Federal Highway Administration, Washington D.C., 2002.
22. Fitzpatrick, K., S. Turner, M. Brewer, P. Carlson, B. Ullman, N. Trout, E. S. Park, J. Whitacre, N. Lalani, and D. Lord. “Improving Pedestrian Safety at Unsignalized Crossings.” TCRP Report 112/NCHRP Report 562, Transportation Research Board, Washington D. C., 2006.
23. Saferoutesinfo.org. Putting It into Practice: HAWK Signals. http://www.saferoutesinfo.org/guide/case_studies/case_study.cfm?CS_ID=CS651& CHAPTER_ID=C353. Accessed June 22, 2009.
24. Fitzpatrick, K. and E. S. Park. “Safety Effectiveness of the HAWK Pedestrian Treatment.” Transportation Research Record, Transportation Research Board, 2009. Accepted for publication.

18
25. “Fare Policies, Structures, and Technologies, Update.” TCRP Report 94, Transit Cooperative Research Program, Transportation Research Board, Washington, D. C., 2003.
26. Crowder, M. and C. M. Walton. “Developing an Intelligent Parking System for the University of Texas at Austin.” Center for Transportation Research, University of Texas at Austin, 2003.
27. Lloyd, J., V. Martorello, P. McIntosh, D. VanVliet, and C. Munford. Campus Master Plan 2004 – 2015. Oregon State University, 2004. http://oregonstate.edu/facilities/Campus%20Master%20Plan.pdf. Accessed July 6, 2009.
28. University of Texas at Austin. University of Texas at Austin Campus Master Plan. 1999. http://www.lib.utexas.edu/books/campusmasterplan/toc.html. Accessed June 22, 2009.
29. University of Texas at El Paso. The University of Texas at El Paso Master Plan Update 2005. 2005. http://irp.utep.edu/Portals/1108/Planning%20Resources/2005%20UTEP%20MP%201% 20.pdf. Accessed June 22, 2009.
30. Shelton, J. “A Dynamic Modeling Approach for Analyzing Managed Lane Strategies to Freeway Ramps, in Civil Engineering.” University of Texas at El Paso, El Paso, Texas, 2007. p. 74.
31. Leonard, D. R., P. Power, and N. B. Taylor. “CONTRAM: Structure of the Model.” TRL Report RR 178, Transportation Research Laboratory, Crowthorne, UK, 1989.
32. Ben-Akiva, M. E. “Development of a Deployable Real-Time Dynamic Traffic Assignment System.” Task D interim report: Analytical Developments for DTA System, ITS Program, Massachusetts Institute of Technology, Cambridge, Massachusetts, 1996.
33. Jayakrishnan, R., C. E. Cortes, R. Lavanya, and L. Pages. “Simulation of Urban Transportation Networks with Multiple Vehicle Classes and Services: Classifications, Functional Requirements and General-purpose Modeling Schemes.” Publication UCI-ITS-WP-02-18, Institute of Transportation Studies, University of California, Irvine, California, August 2002.
34. Chien, S. and X. Liu. “The Development of Dynamic Travel Time Prediction Models for South Jersey Real-Time Motorist Information System.” New Jersey Institute of Technology, New Jersey, 2002.

19
TASK 3 – REVIEW CRASH LOCATIONS
INTRODUCTION AND METHODOLOGY
Universities across the country demand a significant level of multimodal mobility, and this has a severe impact on metropolitan transportation systems. The interaction among cars, public transit, pedestrians, bicycles, and motorcycles in universities is becoming an increasing source of problems. Universities with a large population of commuters require more transportation infrastructure including pedestrian ways, bike lanes, parking facilities, etc. The influence of campus transportation design on safety has become a challenge for many university planners. There is an overwhelming amount of information available on traffic-safety engineering design; however, researchers have found that many university planners are not familiar with crash data sources, what parameters bear in mind for crash analyses, and how to propose practical solutions. The objective of this task is to provide a practical methodology for planners of high-activity centers—in this case university planners—to identify traffic crashes hotspots. Several factors that contribute to these traffic crashes hotspots and the strategies to solve this increasing problem in many universities will be analyzed in Task 6 of this project. University campuses in large cities serve a large segment of the population. As specialized activity centers, universities are considered major trip generators. An increase in the number of trips in a specific location increases the probability of having more crashes in that location. This report summarizes the findings and crash locations as part of the research applied to the integration of the UTEP transportation systems with the larger metropolitan transportation system. Our study area—UTEP’s traffic crashes impact area—is defined as shown in Figure 3. In order to identify the traffic crash hotspots, traffic crashes reports from the UTEP Police Department (UTEP-PD) and the El Paso Police Department (EPPD) form the basis of the crash location analysis. One common problem found in universities with an accelerated growth is to mitigate traffic crashes in corridors near campus. In order to address this problem, researchers formulated the methodology described in the following section. In order to identify the traffic crashes hotspots in and around the UTEP campus, the project-team developed the following 5-step methodology based on a formal crash analysis (1):
1. Describe the area demographics and UTEP-enrollment patterns. 2. Perform spreadsheet statistical analysis using historical data. 3. Explore crashes’ peak periods, patterns, and locations. 4. Classify the crashes’ visibility conditions and transportation mode. 5. Identify and prioritize traffic crashes hotspots.

20
TRAFFIC CRASHES STATISTICAL ANALYSIS
The objectives of the statistical analysis are:
Describe the area demographics and UTEP-enrollment patterns. Explore their relationship with crashes’ peak periods, patterns and location. Classify the crashes’ visibility conditions and transportation mode.
Demographics and Enrollment Trends at UTEP
According to data from the City of El Paso, El Paso population in July 2007 was 606,913. This represents an increase in habitants of 6.6 percent from year 2000. The total population in the study area known as the University District is 18,846, which is 3 percent of El Paso County’s population (2). For population 25 years and over, educational demographics are as follows: High school or higher: 68.6 percent; Bachelor’s degree or higher: 18.3 percent; and Graduate or professional degree: 6.2 percent (3).
Figure 3. Definition of UTEP Traffic Crashes Impact Area.

21
According to data from the Texas Higher Education Coordinating Board (THECB), for the last four years, enrollment in public universities in Texas has been increasing at an annualized growth rate of 1.4 percent (4). Enrollment at UTEP has been increasing at 2.0 percent per year for the same period of time; exceeding by 0.6 percent the average enrollment of public universities. In 2007, enrollment at UTEP—with 20,154 students was already exceeding the 2010 projection as shown in brackets in Figure 4.
Figure 4. UTEP Enrollment Trends and Projections (5).
The population in El Paso, Texas, will continue to increase over the next years, and the demand for higher education will follow this trend—enrollment is already exceeding projections. This will increase the demand for fast, reliable, and safe transportation to and from the university campus.
Crashes’ Peak Periods, Patterns, and Trends at UTEP
One of the emerging problems of accelerated growth in universities is to mitigate traffic crashes in corridors near campus. Many universities realized that as a major travel attractor, traffic congestion does not simply stay on campus; congestion could propagate outward and substantially impact the mobility of the surrounding areas (6). As population and enrollment increase, traffic crashes near universities will follow these trends as well unless planners pay special attention to safety. The growth rate of crashes per year is very similar to the enrollment growth rate trends of students’ at UTEP. The number of crashes per year reported to the UTEP-PD has been increasing at 1.5 percent per year from 2006 to 2009* (year 2009 includes crash data only until the month of May as indicated with an “*” symbol). The UTEP enrollment growth rate was of 1.1 percent for the same period of time. These numbers include minor collisions that occurred inside the university parking facilities. However, they show a clear trend of the growth number of crashes each year and the correlation with enrollment trends at UTEP. Figure 5 shows the number of crashes per year reported to the UTEP-PD.
Source: UTEP-Fact book 2008-2009

22
Figure 5. Traffic Crashes Served by UTEP-PD.
After analyzing the trends of crashes per year, the research team proceeded to identify the months with the highest number of crashes. The mobility needs of the population determine the time when the number of trips observed is at its maximum in a specific area. For the population served by UTEP, these peaks are identified during the first month of classes every semester. These months show an increased volume of vehicles in all the arteries in the vicinity. Researchers found that the months with highest number of crashes were consistently February and September as shown in Figure 6 having 12 and 13 percent of all the crashes served by UTEP-PD.
Figure 6. Percentage of Crashes on a Monthly Basis Served by UTEP-PD (2006-2009*).
After identifying the months with the highest number of crashes, the research team proceeded to find the weekday with peak number of crashes. Figure 7 shows a bar chart with the distribution of percentage crashes per weekday from 2006 to 2009. By comparing these days with the peak days of student attendance in Figure 8, it can be seen that both graphs follow similar patterns with peaks identified during Mondays and Wednesdays and also having a significant number of crashes during Tuesdays and Thursdays. A possible explanation for these patterns is that class schedules are similar for Mondays and Wednesdays and for Tuesdays and Thursdays. It can be concluded, therefore, that class schedules have a severe influence on the number of crashes.

23
Figure 7. Traffic Crashes inside UTEP Campus per Day of the Week.
Figure 8. Peak Days of Student’s Attendance (7).
After analyzing the peak weekdays, the team identified the rush-hours in the UTEP campus and analyzed its relationship with the timeframes with the highest number of crashes. Figure 9 shows the crashes classified by their time of occurrence. The timeframes with the highest frequency of crashes were from 8:00 a.m. to 12:00 p.m. and from 1:00 p.m. until 7:00 p.m. with lower but also significant number of crashes. The hours with highest frequency of crashes are very similar to the peak hours of student’s attendance. Next, the team proceeded to estimate an approximation of the visibility conditions at the time when the crashes occurred (Figure 10).
0
5000
10000
15000
20000
25000
30000
35000
Mon Tue Wed Thu Fri Sat
stu
den
t-cl
ass-
atte
nd
ed (
SC
A)

24
Figure 9. Traffic Crashes inside UTEP Campus per Time of the Day.
Figure 10. Peak Hour of Student Attendance in 2002 (7).
Visibility Conditions
The team was only able to classify crashes’ visibility conditions in two categories: Daylight or Nighttime (8). The classification was done using the crashes time of the day and following the official Daylight Savings average times for sunrises and sunsets from 2006 to 2009 (9). Figure 11 shows the findings of this classification, with 16 percent of the crashes inside UTEP campus taking place at night and 84 percent during the day.
0
5000
10000
15000
20000
25000
30000
35000
6~7 7~8 8~9 9~10 10~11 11~12 12~13 13~14 14~15 15~16 17~18 18~19 19~20
Time during the day
Stu
de
nt-
cla
ss
-att
en
de
d (
SC
A)
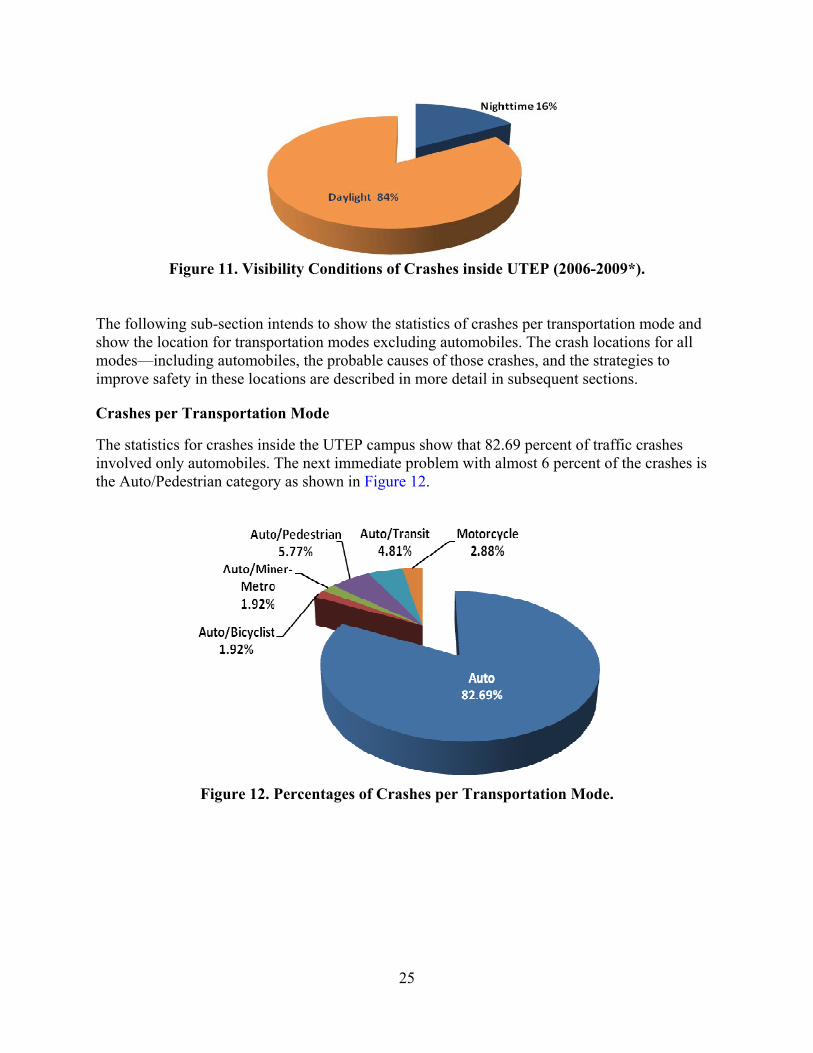
25
Figure 11. Visibility Conditions of Crashes inside UTEP (2006-2009*).
The following sub-section intends to show the statistics of crashes per transportation mode and show the location for transportation modes excluding automobiles. The crash locations for all modes—including automobiles, the probable causes of those crashes, and the strategies to improve safety in these locations are described in more detail in subsequent sections.
Crashes per Transportation Mode
The statistics for crashes inside the UTEP campus show that 82.69 percent of traffic crashes involved only automobiles. The next immediate problem with almost 6 percent of the crashes is the Auto/Pedestrian category as shown in Figure 12.
Figure 12. Percentages of Crashes per Transportation Mode.

26
CRASHES LOCATION ANALYSIS
Corridor Analysis
The objective of this section is to identify the number of crashes along entire corridors as a preliminary step to subsequently identify traffic crashes hotspots at intersections or more specific locations. Table 2 shows the corridors within the study limits.
Table 2. Corridors within the Study Limits. Major Corridors Minor
Corridors Interstate 10 (I-10) W University Ave. W Schuster Ave. N Mesa St. Sun Bowl Dr. N Oregon St. Hawthorne St. Porfirio Diaz St. Glory Rd.
Wiggins Dr. W Rim Rd. Cincinnati Ave.Robinson Ave.Boston Ave. Randolph Dr. Main St. Kern Dr. N El Paso St.
Dawson Dr. Dormitory Rd. Electric Rd. Circle Dr. Kerbey Ave. W Crosby Ave. W Hague Rd.
Table 3 shows the corridors with the highest frequency of crashes. Corridors with less than 6 crashes from January 2006 to May 2009 were excluded from this table.
Table 3. Corridors outside UTEP Campus with More than 5 Crashes.
Corridors outside UTEP campus
Number of
crashes Corridors outside
UTEP campus
Number of
crashes N Mesa St. 408 Kerbey Ave. 9 I-10 and W Schuster Ave. 132 W University Ave. 9 N Oregon St. 65 E Robinson Ave. 8 W Schuster Ave. 56 Boston Ave. 8 I-10 and Porfirio Diaz St. 46 W Rim Rd. 7 Sun Bowl Dr. 45 W Hague Rd. 6 Porfirio Diaz St. 11 Blanchard Ave. 6
Because of time and data constraints, a formal crash-analysis was not performed. However, in order to identify more specific traffic crashes hotspots, these corridors were analyzed and prioritized based on the following two parameters:
frequency of the crashes at specific locations and number and severity of the injuries at specific locations.
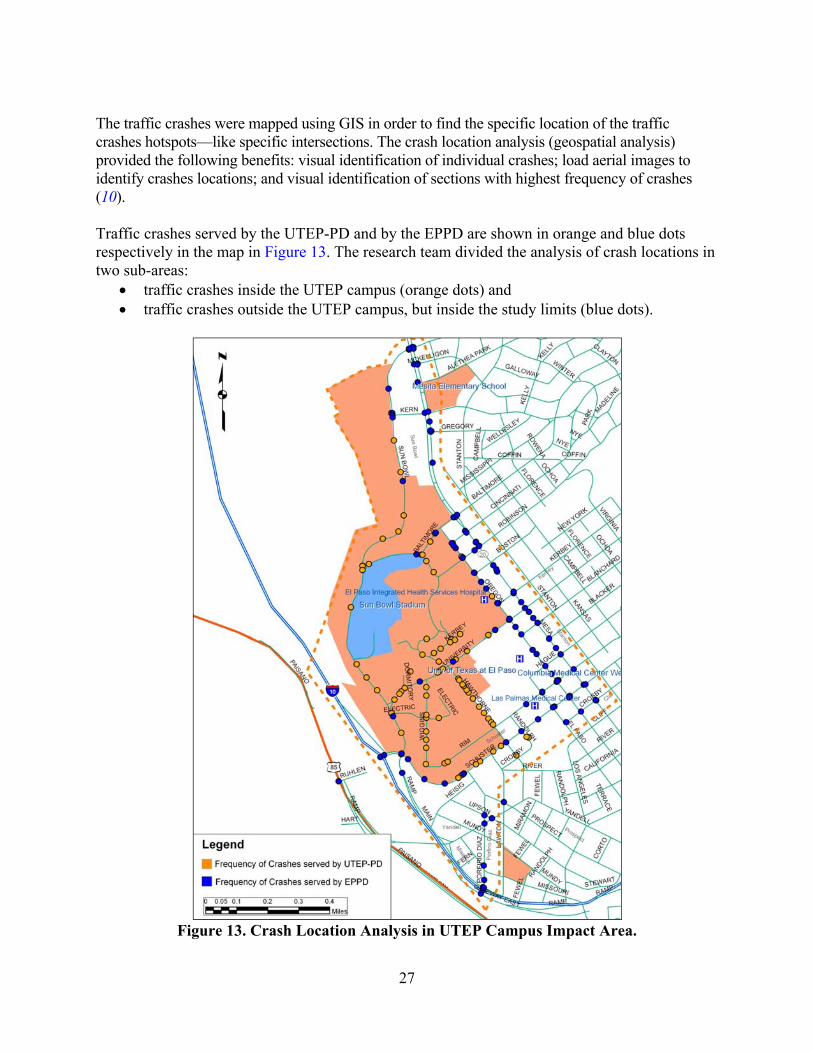
27
The traffic crashes were mapped using GIS in order to find the specific location of the traffic crashes hotspots—like specific intersections. The crash location analysis (geospatial analysis) provided the following benefits: visual identification of individual crashes; load aerial images to identify crashes locations; and visual identification of sections with highest frequency of crashes (10). Traffic crashes served by the UTEP-PD and by the EPPD are shown in orange and blue dots respectively in the map in Figure 13. The research team divided the analysis of crash locations in two sub-areas:
traffic crashes inside the UTEP campus (orange dots) and traffic crashes outside the UTEP campus, but inside the study limits (blue dots).
Figure 13. Crash Location Analysis in UTEP Campus Impact Area.

28
Traffic Crashes inside the UTEP Campus
This section describes the findings of crashes inside the UTEP campus. Table 4 below summarizes the corridors with the highest frequency of crashes, and the following bullets highlight our findings:
461 traffic crashes served by the UTEP-PD (Jan06 to May09), no fatalities were reported, 99 were crashes on corridors, 22 reported injuries, 5 were collisions at corridors and parking lots entrance intersections, and 357 were minor crashes inside the parking lots.
Table 4. Corridor Analysis inside UTEP Campus. Crash locations
(excludes crashes in P-lots)
Number of
crashes W University Ave. 19 Sun Bowl Dr. 18 Hawthorne St. 16 Wiggins Dr. 15 Kerbey Ave. 7 Dormitory Rd. 6 Robinson Ave. 5
There were 22 injuries in traffic crashes reported to the UTEP-PD; 21.2 percent of the crashes reported inside campus. There was not enough information to determine the severity of the injuries; however, the team was able to identify the exact locations where each of these injuries were reported (Table 5). Most of the traffic crashes inside parking lots were minor collisions; nevertheless, 7 injuries occurred inside parking lots.

29
Table 5. Traffic Injuries Reported inside UTEP Campus.
Name Crash location
Number of crashes
Sun Bowl Dr. On the corridor 8 Glory Rd. & Lot P-10 Inside P-Lot 2 Sun Bowl Dr. & Lot P-6 Inside P-Lot 2 Dawson Dr. & Lot P-5 Inside P-Lot 1 Hawthorne St. & Lot S-1 Inside P-Lot 1 Hawthorne St. On the corridor 1 Kerbey Ave. On the corridor 1 N Mesa St. On the corridor 1 Oregon St. & University Ave. On the corridor 1 W Schuster Ave. On the corridor 1 W Schuster Ave. & Lot S-2 Inside P-Lot 1 Sun Bowl Dr. & W Schuster Ave. On the corridor 1 W University Ave. On the corridor 1
Traffic Crashes outside the UTEP Campus
This section refers to crashes served by EPPD in corridors outside the UTEP campus but inside the study limits. Table 6 summarizes the corridors with the highest frequency of crashes and the following bullets summarize the findings:
837 traffic crashes served by the EPPD (Jan06 to May09); 3 fatalities were reported;
o 2 on N Mesa St. and Cincinnati Ave.(1-pedestrian and 1-car driver) o 1 on N Mesa St. and E Hague Rd. (pedestrian) and
224 reported injuries. Furthermore, the research team was able to approximate specific crash locations summarized in Table 6.

30
Table 6. Intersection Analysis of Traffic Crashes outside UTEP Campus.
Approximate crash location No. of crashes Approximate crash location No. of
crashes
I-10 & Exit18A Westbound 65 2500 N Mesa St. & E Robinson Ave. 9
I-10 & Exit18A Eastbound 65 2500 N Mesa St. & Boston Ave. 9
2800 N Mesa St. & Glory Rd. 30 2400 N Mesa St. & Boston Ave. 9
Sun Bowl Dr. & W Shuster Ave. 30 1800 N Mesa St. & E Hague
Rd. 8
I-10 & Exit18B Westbound 25 3500 N Mesa St. & Sun Bowl Dr. 8
2700 N Mesa St. & Cincinnati Ave. 25 1900 N Mesa St. & E Hague
Rd. 8
2600 N Mesa St. & Cincinnati Ave. 24 2300 N Mesa St. & Kerbey
Ave. 7
I-10 & Exit18B Eastbound 23 2100 N Mesa St. & Blanchard Ave. 7
1700 N Mesa St & W Schuster Ave. 22 2800 N Mesa St. & Baltimore
Dr. 7
2700 N Mesa St. & Glory Rd. 20 3400 N Mesa St. & McKelligon Dr. 6
1600 N Mesa St. & W Schuster Ave. 19 100 W Schuster Ave. & N El
Paso St. 6
2200 N Mesa St. & W University Ave. 16 100 Boston Ave. & N Mesa St. 6
100 N Oregon St. & W Schuster Ave. 15 3600 N Mesa St. & Sun Bowl
Dr. 6
1800 N Mesa St. & Rim Rd. 12 3600 N Mesa St. & Mesita Dr. 6 500 W Schuster Ave. & Hawthorne St. 11 100 E Robinson Ave. & N
Mesa St. 6
200 W Schuster Ave. & N El Paso St. 11 2000 N Mesa St. & Blacker
Ave. 6
1900 Sun Bowl Dr. & W Schuster Ave. 10 2100 N Mesa St. & W
University Ave. 6
2200 N Mesa St. & Kerbey Ave. 9 - -
A total of 224 traffic injuries were reported to EPPD in the corridors shown in Table 7, with the injuries classified according to the following criteria (11):
Fatality

31
Incapacitating injury, officer notices possible life threatening injuries like a broken bone, deep lacerations, unconscious victims, etc.
Non-incapacitating, officer notices cuts and scrapes which do not hinder the mobility of the victim, but do require medical attention.
Minor injury, officer notices very minor injuries which may or may not require medication attention.
No injury, officer consults with those involved in the crash, and they indicate that they have no visible injuries.
Table 7. Traffic Injuries Type and Approximate Location (EPPD).
Location Minor Non-incapacitating Incapacitating Fatality Total
N Mesa St. 94 28 2 3 127 I-10 and W Schuster Ave.
17 7 1 - 25
Sun Bowl Dr. 10 - - - 10 W Schuster Ave. 10 8 - - 18 N Oregon St. 10 4 - - 14 I-10 and Porfirio Diaz St.
8 1 - - 9
W University Ave. 3 1 - - 4 W Rim Rd. 1 2 - - 3 Cincinnati Ave. - 1 - - 1 Glory Rd. - - 1 - 1
Traffic Crashes Hotspots
Based on the results from our previous data-analysis and the geospatial analysis on Figure 14, researchers identified the most relevant problem-specific locations on the UTEP campus and surrounding neighborhoods as shown in Table 8. Because of data constraints it was not possible to differentiate between crashes caused by UTEP traffic and through traffic. The prioritization was done based on a combination of the frequency of crashes and the frequency and severity of the injuries (12). Some intersections scored higher in the frequency of crashes; however, they scored lower in the frequency and severity of the injuries (Figures 14–16).
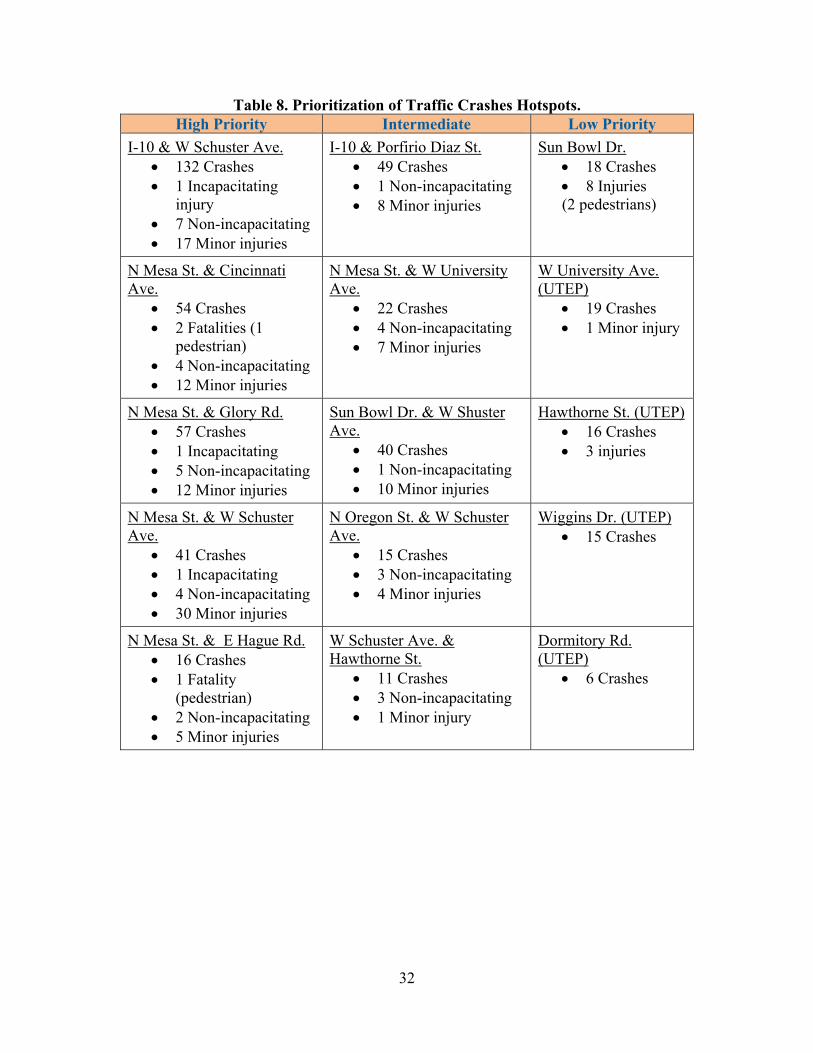
32
Table 8. Prioritization of Traffic Crashes Hotspots. High Priority Intermediate Low Priority
I-10 & W Schuster Ave. 132 Crashes 1 Incapacitating
injury 7 Non-incapacitating 17 Minor injuries
I-10 & Porfirio Diaz St. 49 Crashes 1 Non-incapacitating 8 Minor injuries
Sun Bowl Dr. 18 Crashes 8 Injuries (2 pedestrians)
N Mesa St. & Cincinnati Ave.
54 Crashes 2 Fatalities (1
pedestrian) 4 Non-incapacitating 12 Minor injuries
N Mesa St. & W University Ave.
22 Crashes 4 Non-incapacitating 7 Minor injuries
W University Ave. (UTEP)
19 Crashes 1 Minor injury
N Mesa St. & Glory Rd. 57 Crashes 1 Incapacitating 5 Non-incapacitating 12 Minor injuries
Sun Bowl Dr. & W Shuster Ave.
40 Crashes 1 Non-incapacitating 10 Minor injuries
Hawthorne St. (UTEP) 16 Crashes 3 injuries
N Mesa St. & W Schuster Ave.
41 Crashes 1 Incapacitating 4 Non-incapacitating 30 Minor injuries
N Oregon St. & W Schuster Ave.
15 Crashes 3 Non-incapacitating 4 Minor injuries
Wiggins Dr. (UTEP) 15 Crashes
N Mesa St. & E Hague Rd. 16 Crashes 1 Fatality
(pedestrian) 2 Non-incapacitating 5 Minor injuries
W Schuster Ave. & Hawthorne St.
11 Crashes 3 Non-incapacitating 1 Minor injury
Dormitory Rd. (UTEP)
6 Crashes
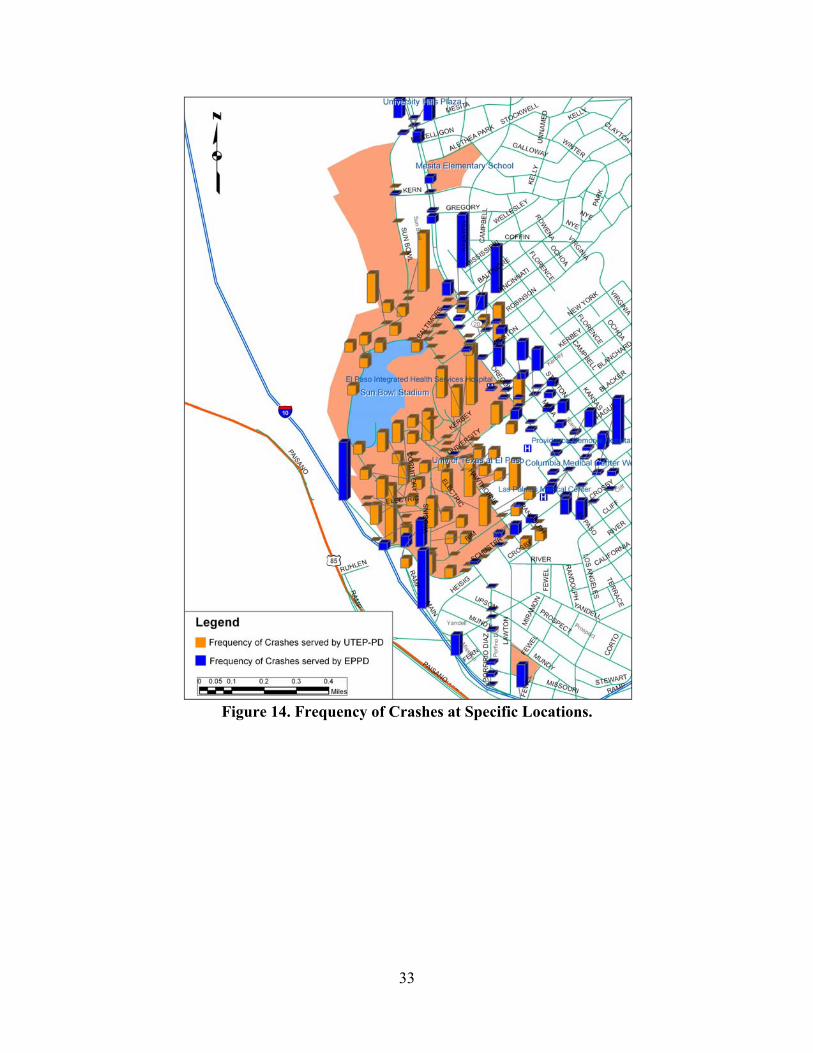
33
Figure 14. Frequency of Crashes at Specific Locations.
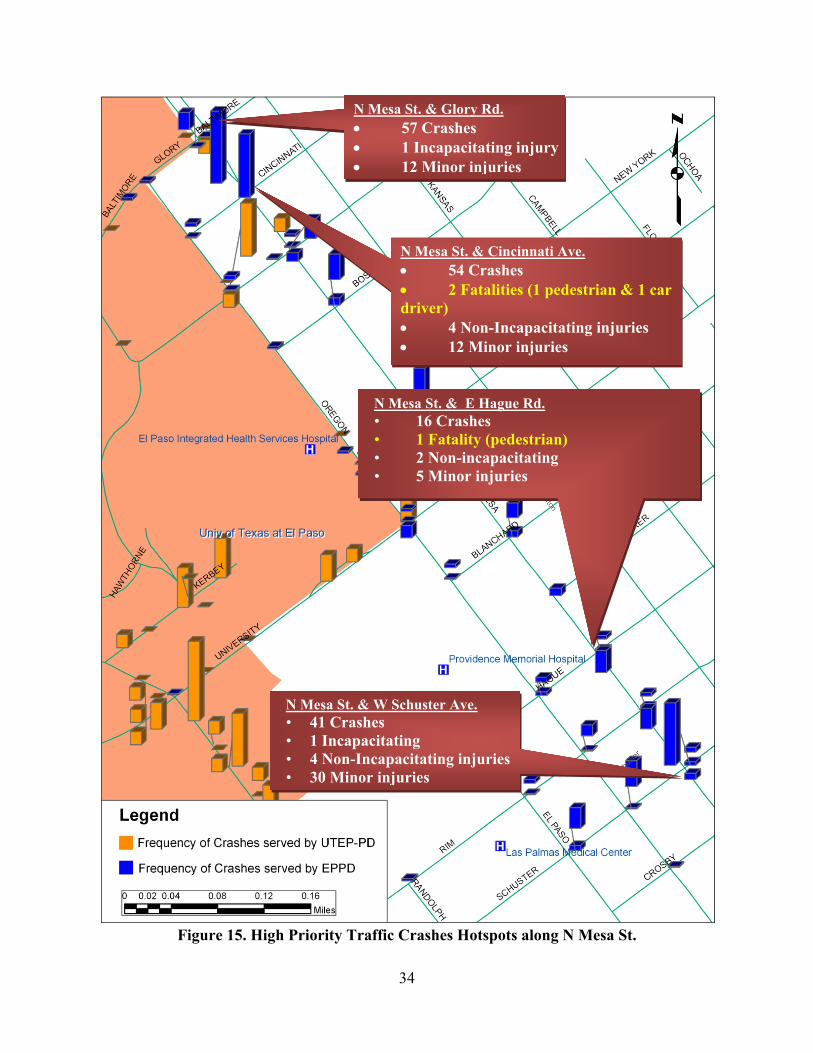
34
Figure 15. High Priority Traffic Crashes Hotspots along N Mesa St.
N Mesa St. & Cincinnati Ave. 54 Crashes 2 Fatalities (1 pedestrian & 1 car driver) 4 Non-Incapacitating injuries 12 Minor injuries
N Mesa St. & W Schuster Ave. • 41 Crashes • 1 Incapacitating • 4 Non-Incapacitating injuries • 30 Minor injuries
N Mesa St. & E Hague Rd. • 16 Crashes • 1 Fatality (pedestrian) • 2 Non-incapacitating • 5 Minor injuries
N Mesa St. & Glory Rd. 57 Crashes 1 Incapacitating injury 12 Minor injuries
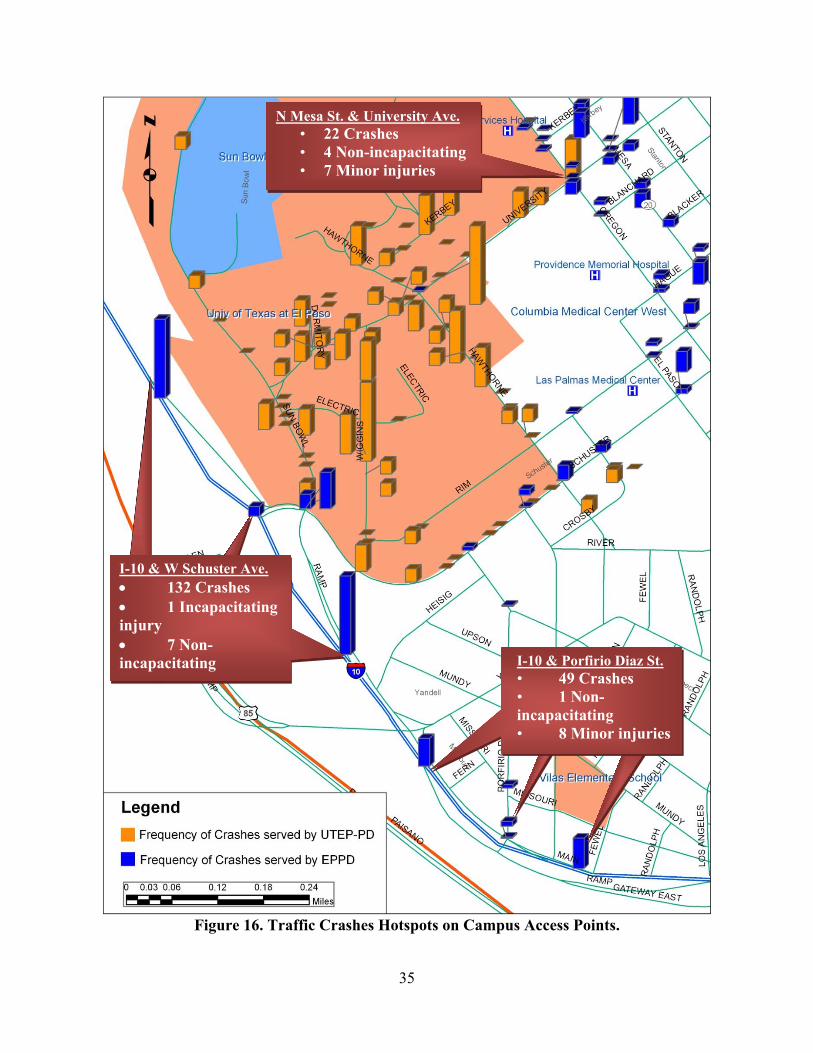
35
Figure 16. Traffic Crashes Hotspots on Campus Access Points.
N Mesa St. & University Ave. • 22 Crashes • 4 Non-incapacitating • 7 Minor injuries
I-10 & Porfirio Diaz St. • 49 Crashes • 1 Non- incapacitating • 8 Minor injuries
I-10 & W Schuster Ave. 132 Crashes 1 Incapacitating injury 7 Non-incapacitating
36
REFERENCES
1. Iowa Department of Transportation. Iowa Department of Transportation. Crash Analysis Resources, 2007. http://www.ctre.iastate.edu/pubs/traffichandbook/5CrashAnalysis.pdf. Accessed June 3, 2009
2. U.S. Census Bureau. Fact Sheet. El Paso city, Texas, 2000. http://factfinder.census.gov. Accessed June 30, 2009
3. The City of El Paso. The City of El Paso, Texas. El Paso-Ciudad Juarez Fact Sheet Jan 2008. http://www.ci.el-paso.tx.us/demo.asp. Accessed June 30, 2009
4. Texas Higher Education Coordinating Board. Texas Higher Education Data. Texas Higher Education Coordinating Board, 2009. http://www.txhighereddata.org/. Accessed June 30, 2009
5. The University of Texas at El Paso. “UTEP Factbook 2008-2009.” El Paso : The University of Texas at El Paso, 2009.
6. Chiu, Y.-C., B. Bustillow, and J. Shelton. “Urban University Campus Transportation and Parking Planning through a Dynamic Traffic Simulation and Assignment Approach.” The University of Arizona, Tucson, Arizona.
7. Chiu, Y.-C.. “Preliminary Findings on the UTEP Classroom Utilization and Students Campus Activity Data.” El Paso: Report to UTEP Campus Traffic Improvement Committee. El Paso, Texas, 2002.
8. Federal Highway Administration. “Roadway Departure Safety.” FHWA Safety Program, 2009. http://safety.fhwa.dot.gov/roadway_dept/. Accessed July 7, 2009
9. Institute for Dynamic Educational Advancement. “Daylight Saving Time, in Color Vision & Art 2007.” Institute for Dynamic Educational Advancement. http://www.webexhibits.org/daylightsaving/b2.html. Accessed June 5, 2009
10. Iowa State University. “Systematic Identification of High Crash Locations.” Iowa State University Institute for Transportation., 2001. http://www.intrans.iastate.edu/reports/hcl.pdf. Accessed July 8, 2009
11. Transportation, Texas Department of Annual Motor Vehicle Crash Data Report Definitions.: Texas Department of Transportation, Austin, Texas.
12. Federal Highway Administration. Strategic Intersection Safety Program Guide. FHWA Safety Program. http://safety.fhwa.dot.gov/intersection/resources/fhwasa09004/page3.cfm. Accessed June 3, 2009
37
TASK 4 – DEVELOP AND PERFORM FACULTY, STAFF, AND STUDENT SURVEYS
SURVEY DESIGN AND MARKETING
A survey of UTEP constituents about their perception on the campus transportation systems was conducted as Task 4 of this project. The survey data were gathered in two ways:
internet; and student surveys completed in the classrooms.
Irrespective of the method of gathering survey feedbacks, all participants answered the same set of questions as shown in Appendix A (English version) and Appendix B (Spanish version). A total of 22 questions were designed with the assistance of UTEP Facility Services. The sequence of questions was arranged in the order of participant’s travel to, within, and from campus in a typical day. They cover travel by car, city transit bus, campus shuttle, bicycle, and walking. The research team has found it useful to discuss with staff in the Facility Services, several faculty, staff, and students in identifying survey questions. Since UTEP has a significant number of constituents who are more proficient in Spanish, the survey material is translated into Spanish as well. Once the survey form had been designed, the questions were tested with a few independent students and subsequently improved. The internet survey was hosted by Survey Monkey at www.surveymonkey.com. The invitation of the internet survey was sent by the office of Vice President (Business Affairs) via e-mails to all the faculty, staff, and students on July 8, 2009. The e-mail led the participants to the web site to read and answer the questions. The research team has found that, as expected, conducting a survey by internet is very efficient in gathering and organizing data. The survey web site has a default tool for showing the results in simple charts. The answers provided by each respondent are combined into a Microsoft Excel® file, which can be downloaded for further analysis. Figure 17 shows the screen shot of the survey (English version) of the web site. On July 8 and 9, 2009, with the consent of the instructors, the research teams visited several classes to hand out the printed survey forms and have students answer the questions in forms. The purpose of the classroom survey was to gather more samples from the student body and serve as a backup in case the response to the internet survey was too low. To make the visit more efficient, the class visits targeted courses with large class sizes. Once the survey forms were collected, the answers were manually entered into the Survey Monkey web site so that all the data can be analyzed together. The survey web site was closed during noon time on July 10, 2009, and all data was manually entered in the afternoon of the same day. The remaining sections of this chapter report the important findings from this survey.

38
Figure 17. Screen Shot of the Survey Web Site.
PROFILE OF RESPONDENTS
A total of 964 persons out of 22,822 responded to this survey. Of the 964 participants, 937 answered the English version of the survey while the remaining 27 answered the Spanish version of the survey. The status of the participants are: 59 faculty (6.1 percent), 188 staff (19.5 percent), 713 students (74.0 percent), and 4 visitors (0.4 percent). According to the 2007 UTEP statistics, there were 5.1 percent faculty, 6.6 percent staff, and 88.3 percent students. The factions of the faculty and staff in the samples are higher than their proportions in the population. As expected, students tend to have a lower response rate. The response rates for faculty and students may be higher if the survey was conducted in the fall or spring semester.
TRANSPORTATION MODES
Figure 18 shows the breakdown of the modes of transportation among the respondents. The number of the respondents that drive to campus alone was 79.9 percent. This mode share percent is important for UTEP to plan for parking spaces. There are 9.1 percent that carpool and 2.6 percent have someone drop them off on campus. The percentage of commuters who carpool appears higher than expected. This may indicate a potentially higher market for carpooling, and hence campaigns or policies to encourage carpooling have a good chance for success.

39
Figure 18. Mode Shares.
TRIP ORIGINS AND ACCESS TO CAMPUS
Figure 19 gives the areas and percentage shares of the trips origins. From all the trips, 32.0 percent of them come from Upper Valley and West El Paso. These are the trips that are likely to use I-10 EB or Mesa St to access the campus. On the other hand, 62.2 percent of the trips originated from Horizon City, East, Lower Valley, Northeast, Central El Paso, and Juarez. These are the trips that are likely to use the I-10 WB or Yandell to approach the campus.
Figure 19. Trip Origins.
As for the entry point to UTEP (Figure 20), 44.1 percent enter the campus via the I-10 exit at Schuster Ave. and another 15.2 percent enter via the I-10 exit at Porfirio Diaz St. These two groups of users, plus the 3.3 percent of the users at Yandell Dr., add up to 62.6 percent, which is approximately the same as the fractions who live in the east of UTEP campus. The high percentages result in heavy congestion at these two exits in the morning peak hours. A
Drive alone, 79.9%
Carpool, 9.1%
Drop off, 2.6%
Bus, 3.8%Bicycle, 1.0%
Walking, 3.6%
West, 28.8%
Upper Valley, 3.2%
Central, 10.9%
Northeast, 10.6%
East, 24.1%
Lower Valley, 9.8%
Horizon City, 2.5%
Juarez, 4.3% Other, 5.9%

40
significant percentage of users (29.3 percent) enter the campus from Mesa St. via the various streets connected to it.
Figure 20. Entry Points to Campus.
ARRIVAL TIMES
Figure 21 shows the arrival time distribution of the 881 participants who provided this information. The morning peak hour occurs between 8:00 a.m. to 9:00 a.m. with 35 percent of the respondents entering the campus during that hour. Overall, 82 percent of the trips arrive on campus between 7:00 a.m. and 10:00 a.m. The peak hour loading, combined with the percentages at the various campus entrances, may be used to estimate the peak hour volume at these locations.
Figure 21. Distribution of Arrival Times.
I-10 (to Schuster Ave.), 44.1%
I-10 (to Porfirio Diaz St.), 15.2%
Yandell Dr., 3.3%
Mesa St. (to Schuster Ave.),
5.6%
Mesa St. (to Rim Rd.), 2.2%
Mesa St. (to University Ave.),
9.8%
Mesa St. (to Glory Road), 4.9%
Mesa St. (to Sun Bowl Dr.), 6.8%
Not applicable, 8.1%
0%
5%
10%
15%
20%
25%
30%
35%
40%
Percent of all Trips
Arrival Time

41
PARKING LOTS AND DESTINATIONS
Once the vehicles arrive on campus, they head toward the parking lots. Figure 22 shows the parking lots used by the respondents.
Figure 22. Distribution of Parking Lots Used.
The percentage distribution is an indication on the popularity of the parking lots. The percentages also indicate the traffic loading at the surrounding streets and the entrances to campus. It also reflects the number of pedestrians that can be expected from the parking lots to the nearby campus buildings. In UTEP, the inner campus area is reserved for faculty and staff only. The majority of drivers coming to UTEP prefer to park around the Academic Services Building area because of its close proximity to campus buildings and easy access to I-10. The remote lots at Sun Bowl Dr., Swimming and Fitness Center, and Don Haskins Center accommodate 17.1 percent of the vehicles. These parking choices imply a potential demand for shuttle bus service from these parking lots to the main campus.
TRAFFIC SAFETY PROBLEMS
Several survey questions are related to traffic safety. A question was asked on whether closing the inner campus to vehicular traffic will help to improve the safety of pedestrians and bicyclists. Of the respondents, 59.9 percent answered Yes, while 40.1 percent of the respondents answered No. Although the majority of the respondents support the closing of inner campus to vehicular traffic, only 32.5 percent of the respondents thought there were too many pedestrian-vehicle conflicts on campus. This means that there is a significant fraction of the campus community who supports the closure of inner campus to vehicular traffic for aesthetic, environmental, and other reasons. About 36.6% of the respondents thought there were traffic safety problems on campus. Among these respondents, 319 commented on the nature of the problem. The most frequently cited problems and their frequencies are:
vehicles do not yield to pedestrians/bicyclists (64 counts or 20 percent of the comments); jaywalking (57 counts or 18 percent of the comments);
Academic Services
Building Area (A), 27.4%
Inner Campus (B), 16.2%
Sun Bowl Parking Garage
(C), 15.3%
Along Sun Bowl Dr. (D),
7.3%
Memorial Gym Area (E), 4.7%
Between Don Haskins
Center/Fitness Area (F), 9.8%
Mesa Street Business
District East of Campus (G),
3.7%
Not applicable, 15.6%

42
too many pedestrians at Hawthorne/University intersection (47 counts or 15 percent of the comments);
traffic congestion at I-10 exit at Schuster (44 counts or 14 percent of the comments); vehicle speeding on campus roads (41 counts or 13 percent of the comments); and parking related problems (22 or 7 percent of the comments).
Based on the comments, it appears that more facilities are needed to separate pedestrian-vehicle conflicts. Attention needs to be paid to segregate pedestrians and vehicles at the Hawthorne and University intersection. The comments supported the proposal to improve the I-10 exit at Schuster Ave. Some traffic calming measures also need to be implemented on campus roads to discourage speeding.
DROP-OFF POINTS
One of the questions asked if students were being dropped off and if yes, where was the drop-off location. A total of 449 respondents answered this question, out of which the Union Building and Academic Services Building each had 142 entries (31.6 percent). The third location, Burges Hall has 24 entries (5.3%). Another 141 drop-off locations are scattered throughout the campus. There is a designated drop-off location at University Ave near the Union Building. At least one designated drop-off driveway with easy access and egress should be implemented at the Academic Services Building.
USE OF PUBLIC TRANSIT
The survey included questions regarding the use of the Sun Metro bus service. As shown in Figure 4-2, 3.8 percent of the respondents travel to UTEP by bus. This can be translated into approximately 800 Sun Metro bus riders on campus. Of the 954 respondents, 151 (15.6 percent) indicated the bus stops they used. UTEP campus is served by four Sun Metro bus stops. The following bus stop locations are listed in decreasing order of their ridership among the respondents: Oregon St./University Ave. intersection, Mesa St. /University Ave. intersection, Schuster Ave./Hawthorne St. intersection, and Oregon St./Robinson Ave. intersection. As also noted in Figure 4-2, 96.2 percent of the trips were made by modes other than bus. A question was asked why respondents do not ride a bus to UTEP. The three most frequent reasons given, in decreasing order of frequency count, are: the bus trip takes too much time; there is no bus route or bus stop near home, and unreliable service.
CAMPUS SHUTTLE BUS
Figure 23 shows the trip frequency distribution of Miner Metro (campus shuttle bus) riders. Of the respondents, 65 percent have never used the free campus shuttle bus service. They either park in the inner campus or perimeter lots or then walk to their final destinations. About 14 percent of them use the shuttle service at least a few times per week. They are most likely students who park at remote lots and go to classes.

43
Figure 23. Frequency of Miner Metro Usage.
Another question was posed on the mode of transportation one would use to get from their parked vehicles to classrooms or offices. Of the respondents, 8.0 percent said that they use campus shuttle bus service. This is expected as there is a long walking distance between the remote parking lots from the main campus. The campus shuttle bus does not appear to be popular among the respondents as a mode of transportation on campus between classes/meetings. Only 1.7 percent of the respondents regularly use the shuttle bus service for travel between campus buildings. The survey has also asked the respondents to write down their most frequently used origins and destinations of shuttle bus stops. Entries of 339 origins and 320 destinations were received. The most frequent used stops are at:
Remote parking lots (consistent with an earlier finding), Swimming & Fitness Center/Softball Complex, Don Haskins Center/Memorial Gym, Physical Plant, and College of Health Science.
The respondents were also asked to write down the comments on how the Miners Metro shuttle bus service can be improved. The two most frequent requests are:
routes to serve inner campus and more frequent services.
BICYCLE USE
Bicycle is yet to be a popular mode of transportation on the UTEP campus. Only 1.0 percent of the respondents ride bicycles to/on campus. These are the respondents who use bicycles to travel between classes and meetings. Those who do not ride bicycles to/on campus were asked to state their reasons. The participants were presented with four specific reasons plus an option to state their own reasons. They can select more than one reason. Table 9 shows the number of
Never65%
Seldom (less than once a week)18%
About once a week3%
A few times per week
6%
Every school day
8%
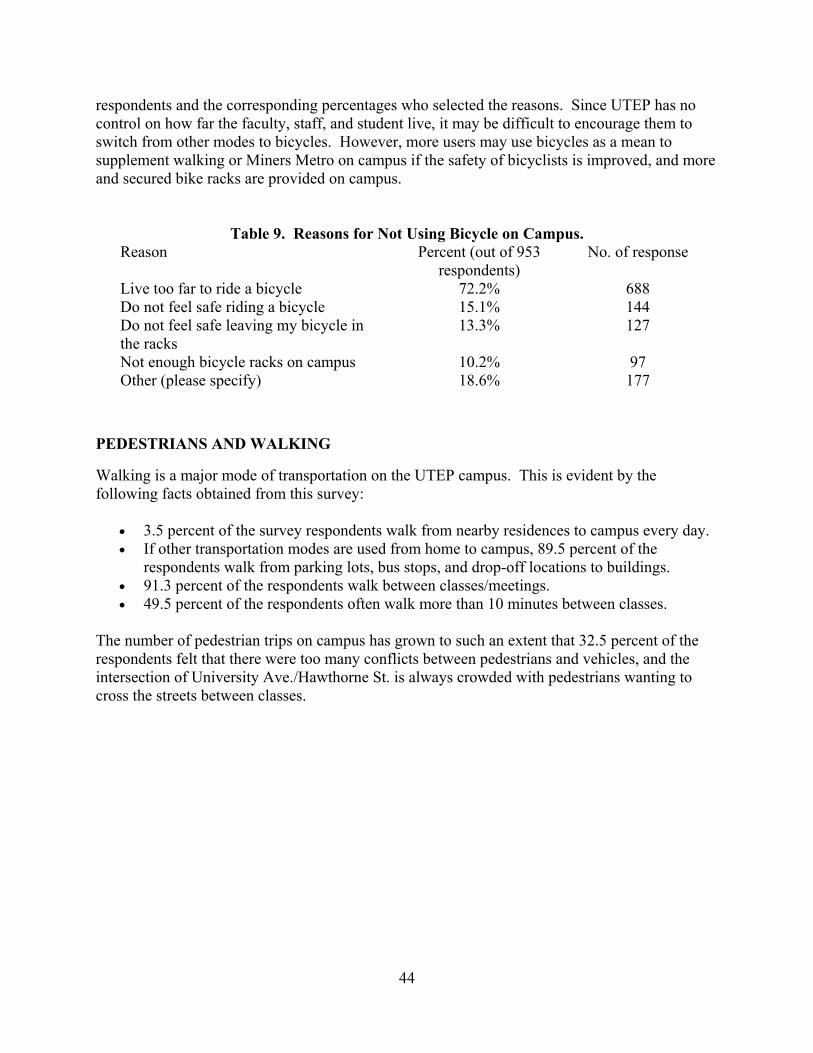
44
respondents and the corresponding percentages who selected the reasons. Since UTEP has no control on how far the faculty, staff, and student live, it may be difficult to encourage them to switch from other modes to bicycles. However, more users may use bicycles as a mean to supplement walking or Miners Metro on campus if the safety of bicyclists is improved, and more and secured bike racks are provided on campus.
Table 9. Reasons for Not Using Bicycle on Campus. Reason Percent (out of 953
respondents) No. of response
Live too far to ride a bicycle 72.2% 688 Do not feel safe riding a bicycle 15.1% 144 Do not feel safe leaving my bicycle in the racks
13.3% 127
Not enough bicycle racks on campus 10.2% 97 Other (please specify) 18.6% 177
PEDESTRIANS AND WALKING
Walking is a major mode of transportation on the UTEP campus. This is evident by the following facts obtained from this survey:
3.5 percent of the survey respondents walk from nearby residences to campus every day. If other transportation modes are used from home to campus, 89.5 percent of the
respondents walk from parking lots, bus stops, and drop-off locations to buildings. 91.3 percent of the respondents walk between classes/meetings. 49.5 percent of the respondents often walk more than 10 minutes between classes.
The number of pedestrian trips on campus has grown to such an extent that 32.5 percent of the respondents felt that there were too many conflicts between pedestrians and vehicles, and the intersection of University Ave./Hawthorne St. is always crowded with pedestrians wanting to cross the streets between classes.

45
TASK 5 – CHARACTERIZE CURRENT AND FUTURE SYSTEMS
INTRODUCTION
The scope of this task is to obtain information regarding the current and future transportation plans. In order to collect this information, this task is subdivided into two parts:
characterize the Current Infrastructure and Transportation Systems, and identify Future Infrastructure and Transportation Plans.
For the current infrastructure sub-task, the most recent information obtained was for the 2007-2008 school year (1). This information includes faculty, staff, and student population; number of parking lots and spaces; major streets in and around campus; Miner Metros Shuttle Bus service, Sun Metro routes and stops; major events; and land use around the UTEP campus. Regarding the future infrastructure, most of the information obtained was gathered from the 2005 UTEP Master Plan (2). This information includes the proposed buildings and parking garages in UTEP along with recreational areas and closure of inner core campus. Regarding the transit terminal that will be constructed by Glory Rd. and Mesa St., some preliminary numbers and pictures are included in this report.
CURRENT INFRASTRUCTURE
As of the 2007-2008 school year, the population at UTEP was 22,822 including faculty, staff, and students. Faculty makes up 5.1 percent of the population (1,157), staff makes up for 6.6 percent (1,511), and students 88.3 percent (20,154). Out of those 20,154 students, 12,214 are full-time and 8,040 are part-time students (1). The campus layout is as follows:
Streets within campus o Major
University Ave., W Schuster Ave., Sun Bowl Dr., Hawthorne St., Wiggins Rd., Rim Rd., Glory Rd., Robinson Ave., Randolph Dr.
o Minor Dawson Dr., Dormitory Rd., Electric Rd., Circle Dr., Kerbey Ave.
Access points o University Ave. and Sun Bowl Dr. o University Ave. and Oregon St. o Hawthorne St. o Rim Rd.
Figures 24 and 25 show the building directory of UTEP and the campus map along with the parking areas.
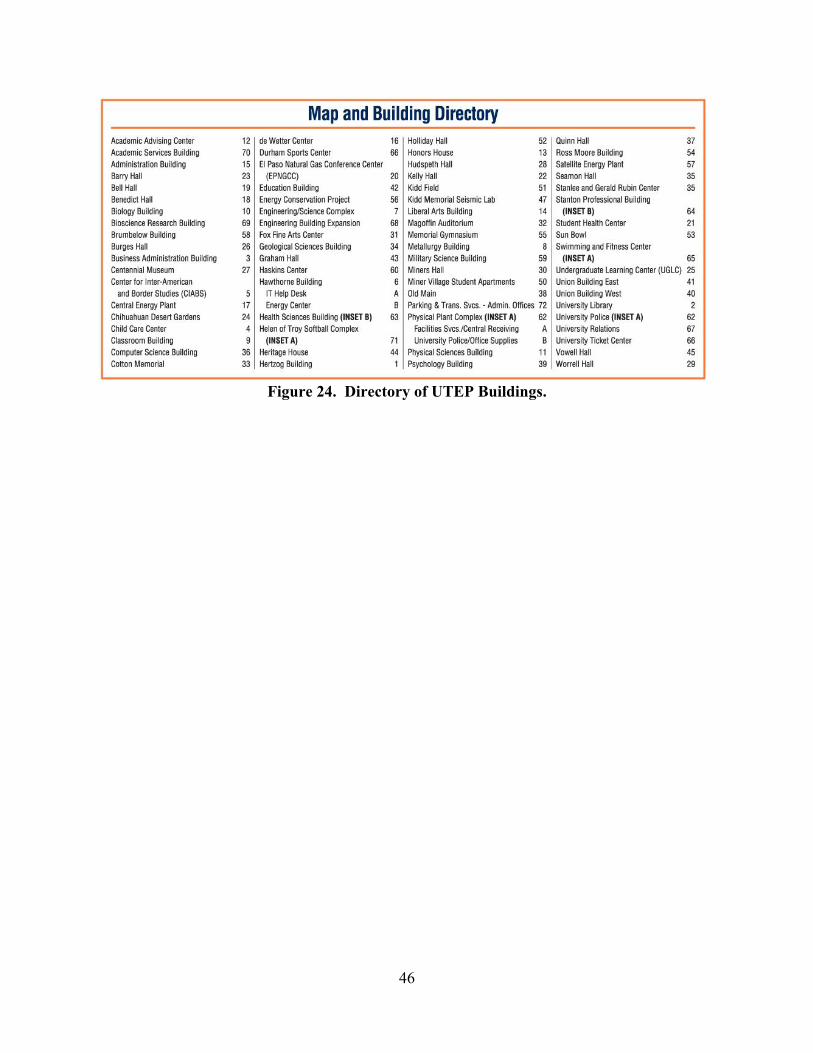
46
Figure 24. Directory of UTEP Buildings.
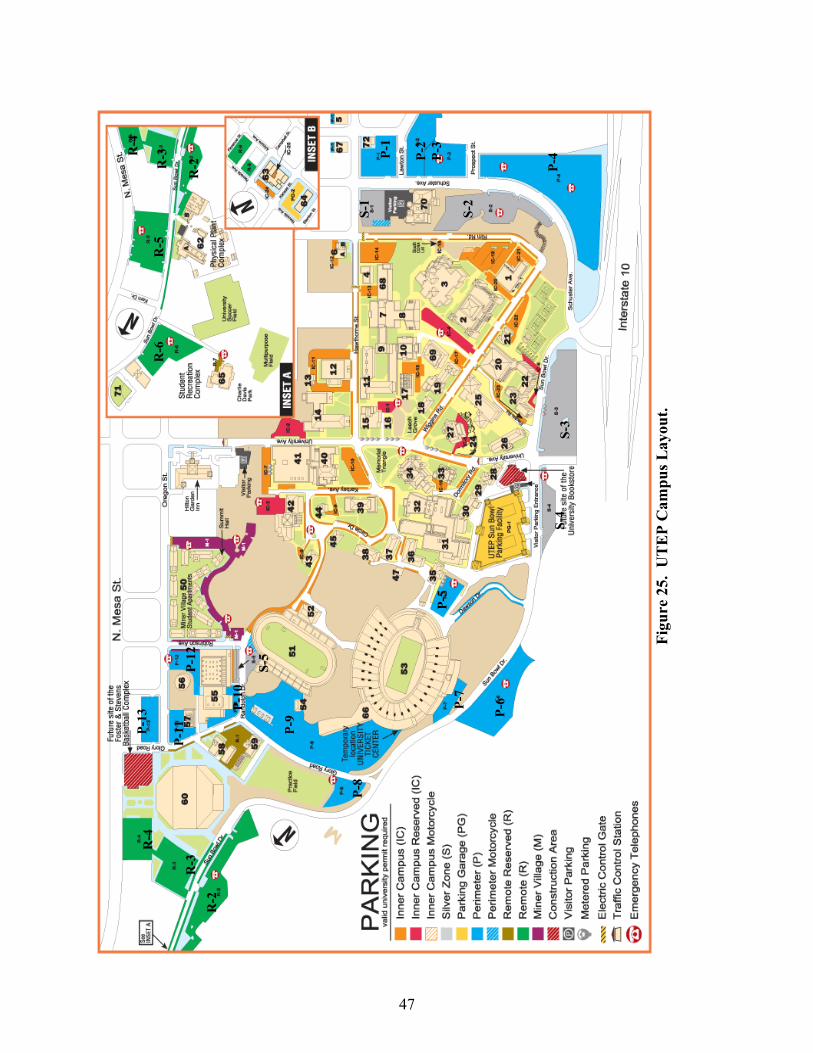
47
Fi
gure
25.
UT
EP
Cam
pus L
ayou
t.
P-4 P-
1
P-2
P-3
P-5
P-6 P-
7
P-8
P-9
R-2
R
-3 R
-4
P-10
P-11
P-
12
P-13
S-1
S-2
S-3
S-4
S-5
R-5
R
-6
R-2
R-3
R-4

48
PARKING AT UTEP
There are over 9,800 available parking spaces distributed among 54 parking lots. These lots are arranged and labeled according to their proximity to the main campus. The parking spaces inside the campus are reserved only for faculty and staff, and the color associated is orange. The closest parking spaces for students are located in the Silver and Perimeter (blue) parking lots. The remote parking lots are located between the Don Haskins Center and the Swimming and Fitness Center in the northern part of campus. Students living in the dormitories in Miner Village have a reserved parking lot labeled with the purple color. Until now, there is only one parking garage (labeled with yellow color), which is located by University Avenue and Sun Bowl Dr. For references regarding the parking lots please see Figure 25.
MINER METRO SHUTTLE BUS AND SUN METRO SERVICE
UTEP students have access since 2003 to a shuttle bus service given by the university. This shuttle service provides transportation mainly from the remote parking lots to stops located near the main campus. The Miner Metro shuttles are free to all UTEP faculty, staff, students, and visitors, and it is available Monday through Friday when classes are in session during the fall, spring, and summer semesters. This service does not operate during wintermester, maymester, university holidays, or intersession (3). As of today, there are four routes distributed as follows:
Route 1: East (Figure 26) o It runs Monday through Thursday between 6:35 a.m. and 9:30 p.m. in 15-minute
intervals and Friday between 6:35 a.m. and 6:30 p.m. during spring and fall semesters
o It runs Monday through Friday between 6:45 a.m. and 5:30 p.m. in 25-minute intervals during summer semester
o Streets used: Sun Bowl Dr, Glory Road, Randolph Dr, Robinson Ave, Oregon St and Rim Rd
o Shuttle stops: lot R6, lot R5, lot R3, lot R2, lot P9, lot S5, Hilton Garden Inn and corner of Hawthorne and Rim
Route 2: Campus Loop (Figure 27) o It runs Monday through Friday between 7:00 a.m. and 5:30 p.m. in 25-minute
intervals during spring and fall semesters o It runs Monday through Friday between 8:00 a.m. and 5:30 p.m. in 15-minute
intervals during summer semester o Streets used: Rim Rd., Hawthorne St., Schuster Ave., Sun Bowl Dr., Glory Rd.
and Oregon St. o Shuttle stops: corner of Hawthorne St. and Rim Rd. Academic Services Building;
lot S2, Sun Bowl Parking Facility, lot P6, Lot P9, Lot P12, and Hilton Garden Inn

49
Figure 27. Layout of Route 2 (Campus Loop).
Figure 26. Layout of Route 1 (East).

50
Route 3: West (Figure 28) o It runs Monday through Thursday between 6:35 a.m. and 9:30 p.m. and Friday
between 6:35 a.m. and 6:30 p.m. during spring and fall semesters o It runs Monday through Friday between 6:45 a.m. and 5:30 p.m. in 15-minute
intervals during summer semester o Streets used: Sun Bowl Dr. and Dawson Dr. o Shuttle stops: lot R6, lot R5, lot R3, lot R2, lot P6, and lot P5
Figure 28. Layout of Route 3 (West).

51
Route 4: CHS/Nursing (Figure 29) o It runs Monday through Friday between 7:00 a.m. and 5:45 p.m. during spring
and fall semesters o It runs Monday through Friday between 7:00 a.m. and 5:30 p.m. in 15-minute
intervals during summer semester o Streets used: Arizona Ave., Oregon St., Rim Rd., Hawthorne St., Schuster Ave.
and Florence St. o Shuttle stops: College of Health Sciences and corner of Hawthorne St. and Rim
Rd.
Figure 29. Layout of Route 4 (CHS/Nursing).

52
El Paso’s Sun Metro Service has the following routes that allow people primarily students reach UTEP facilities (Figure 30) (4):
o Routes 10, 11, 12, 13, 14, 15, 16, 70, and Smart 101 pass by UTEP main campus Route 70 only operates in the spring and fall semesters
o Most of the stops for these routes where students get off are located near the intersection of Oregon St. and University Ave. and Mesa St. and University Ave.
o Student fare: $0.75
Figure 30. The Black Frame Shows the Area Where Sun Metro Stops Are Located near
UTEP.
SPECIAL EVENTS
Around the year there are events held in a UTEP facility that affects traffic in and around the UTEP campus. There are three main facilities where the majority of the events are held: Don Haskins Center, Sun Bowl stadium, and Magoffin Auditorium (1). The Sun Bowl stadium has a capacity for 52,000 people that will attend UTEP football games, sports events, and concerts. To accommodate this amount of people, lots P-5 to P-10 and the parking garage are reserved. The Don Haskins Center has a capacity of 11,676. The major events held are UTEP basketball

53
games, other sports events, concerts, and high school and UTEP graduation ceremonies. Parking lot P-11 is closed either for trucks and buses related to the event or for students to meet their relatives once the ceremony is over. Parking lots P-9, P-10, P-12, P-13, R-2, R-3, and R-4 are reserved for people attending the event. The Magoffin Auditorium can seat 1,156 people attending concerts, plays, and pre-commencement ceremonies, which will take up the parking spaces along Circle Dr. and Kerbey Ave. Please see Figure 25 to locate the parking lots mentioned above.
SURROUNDING AREA
The land use in the area of study, which in this case involves UTEP and its surroundings, is dominated by single-family homes and the university campus (Figure 31). The campus is surrounded by commercial, residential, and medical facilities along its eastern side and by mountains and the I-10 freeway in the west side (5). Land use in the area is distributed as follows.
Figure 31. Distribution of Land Use by UTEP and Its Surrounding Area.
Single-family homes 32%
Multi-family homes 7%
Commercial 8%UTEP 20%
Hospitals 2%
Parks & open spaces 9%
Churches and schools 3%
ASARCO 11%
Highways and roads 8%

54
FUTURE INFRASTRUCTURE
UTEP’s 2005 Campus Master Plan was mainly used as a reference to find information regarding the future infrastructure (2). Many of the following constructions are being proposed and therefore may vary somewhat with the final design. Future campus infrastructure improvements include buildings, new pedestrian walkways, parking garages, and transit terminals as listed below.
New Buildings o Proposed Phase I (Figure 32) will consist of 1,633,300 ft2 of buildings distributed
among: North Campus – 558,000 ft2 Core Campus – 1,000,300 ft2 W Schuster Ave. – 75,000 ft2
Figure 32. Layout of Proposed Buildings in Phase I.
o Proposed Phase II (Figure 33) will consist of 1,434,000 ft2 of buildings distributed
among: North Campus – 303,000 ft2 Core Campus – 388,300 ft2 W Schuster Ave. – 743,000 ft2
Sun Bowl Dr.
University Ave.
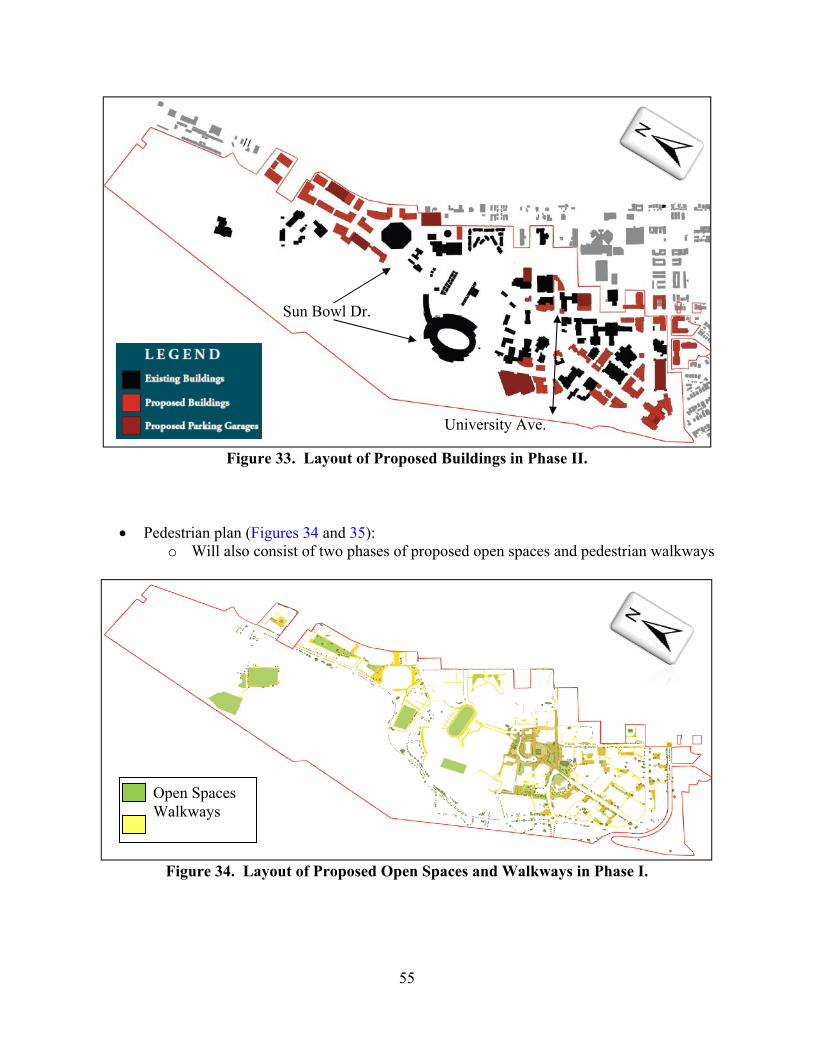
55
Figure 33. Layout of Proposed Buildings in Phase II.
Pedestrian plan (Figures 34 and 35): o Will also consist of two phases of proposed open spaces and pedestrian walkways
Figure 34. Layout of Proposed Open Spaces and Walkways in Phase I.
Open Spaces Walkways
Sun Bowl Dr.
University Ave.

56
Figure 35. Layout of Proposed Open Spaces and Walkways in Phase II.
New Parking Garages o Proposed Phase I (Figure 36) will consist of 5,013 parking spaces distributed
among: North Campus – 1,297 Core Campus – 2,798 W Schuster Ave. – 918
Figure 36. Layout of Proposed Parking Garages in Phase I.
Open Spaces Walkways
Sun Bowl Dr.
Schuster Ave.
University Ave. Rim Rd.
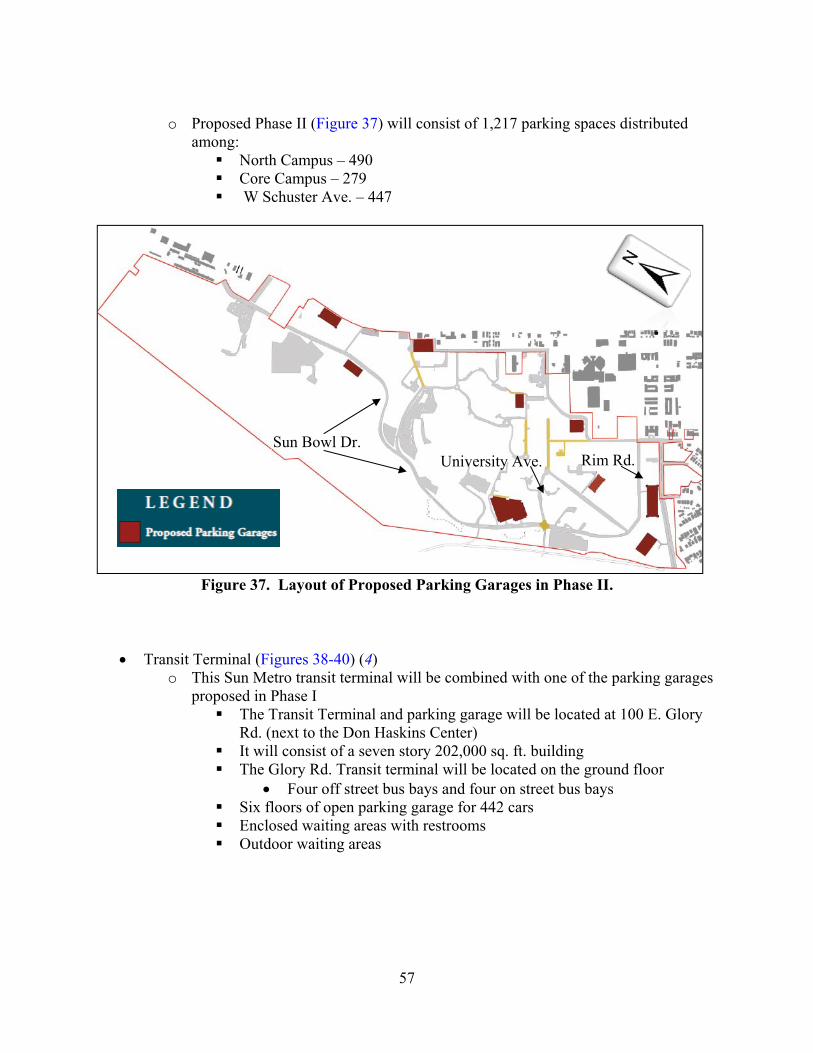
57
o Proposed Phase II (Figure 37) will consist of 1,217 parking spaces distributed
among: North Campus – 490 Core Campus – 279 W Schuster Ave. – 447
Figure 37. Layout of Proposed Parking Garages in Phase II.
Transit Terminal (Figures 38-40) (4) o This Sun Metro transit terminal will be combined with one of the parking garages
proposed in Phase I The Transit Terminal and parking garage will be located at 100 E. Glory
Rd. (next to the Don Haskins Center) It will consist of a seven story 202,000 sq. ft. building The Glory Rd. Transit terminal will be located on the ground floor
Four off street bus bays and four on street bus bays Six floors of open parking garage for 442 cars Enclosed waiting areas with restrooms Outdoor waiting areas
Sun Bowl Dr. University Ave. Rim Rd.

58
Figure 38. Screen Shot of Current Parking Lot by the Don Haskins Center.
Figure 39. Screen Shot of Transit Terminal and Parking Garage from the Don Haskins
Center.

59
Figure 40. View of the Transit Terminal from the Memorial Gym Parking Lot.
Closure of inner campus to traffic (Figure 41) (2)
o Some of the features and modifications of closing part of the inner campus include: University Ave. is closed from the Union on the east to Wiggins Rd. and
Hawthorne St. is closed from University Ave. to the Physical Sciences Building
A new pedestrian zone at the core of campus around Memorial Triangle Closing the streets above mentioned along with parking lot IC-10 provides
opportunity to create a new campus center and this open space would be well used for formal and informal campus gatherings
Pedestrian circulation will flow through the center of campus and vehicular circulation will be kept at the perimeter except for special occasions
Smaller pedestrian paths connect between buildings and spaces creating a fine grain circulation network
Added green space will provide an area for passive recreation and socialization currently not found on campus
Closing University Ave. in this zone will ensure a safe environment for pedestrians
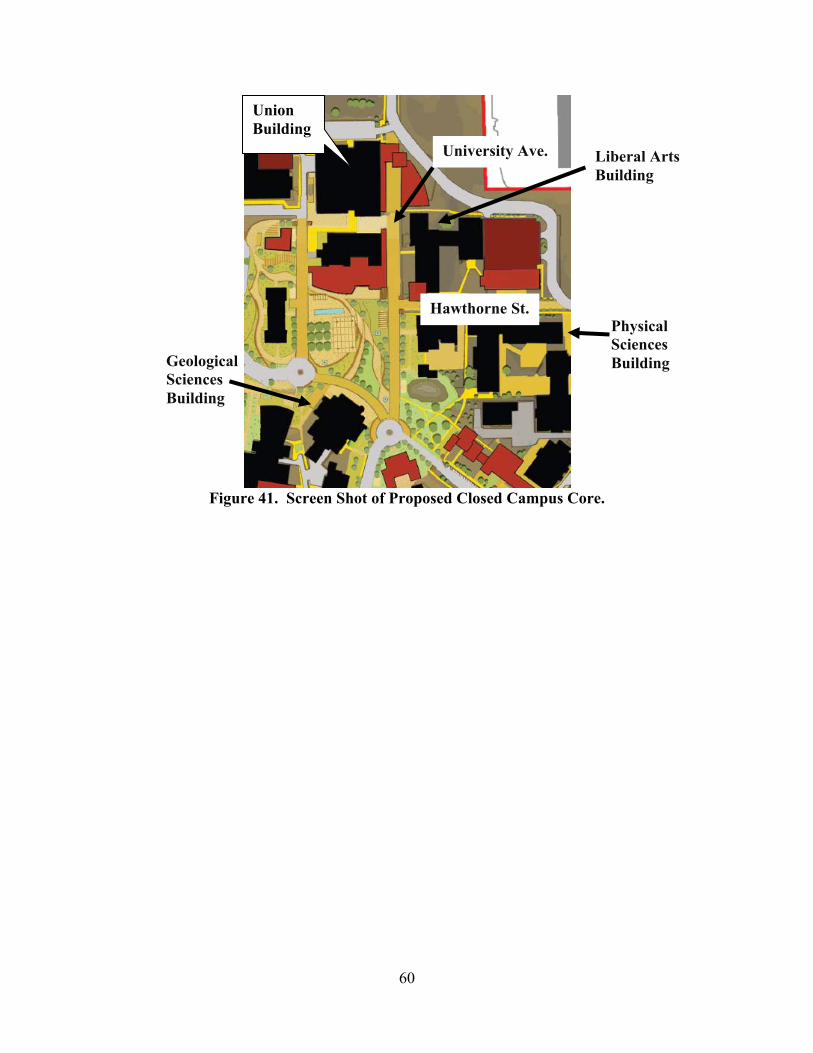
60
Figure 41. Screen Shot of Proposed Closed Campus Core.
Hawthorne St.
University Ave.
Union Building
Liberal Arts Building
Geological Sciences Building
Physical Sciences Building

61
REFERENCES
1. UTEP Facts. The University of Texas at El Paso. http://www.admin.utep.edu/Default.aspx?tabid=50864. Accessed August, 2009.
2. University of Texas at El Paso. The University of Texas at El Paso Master Plan Update 2005. http://irp.utep.edu/Portals/1108/Planning%20Resources/2005%20UTEP%20MP%201%20.pdf. Accessed August, 2009.
3. Miner Metro Shuttle Bus Service. Parking and Transportation Services. http://admin.utep.edu/Default.aspx?tabid=50775. Accessed August, 2009.
4. El Paso Sun Metro. El Paso City Government: Sun Metro Information http://www.elpasotexas.gov/sunmetro/. Accessed August, 2009.
5. Peña, S., L. R. Alarcon, P. M. Boyd Jr., D. Garcia, N. I. Georgieva, S. B. Katona-Wallet, L. P. Mendoza, and C. C. Villa. 2007. “Spaces, Places, and People: A Comprehensive Study of the Needs of Students, Faculty, Staff and Neighbors.” University of Texas at El Paso, 57-60.


63
TASK 6 – IDENTIFY GAPS AND DEVELOP SCENARIOS
INTRODUCTION
The identification of gaps between the transportation systems within the UTEP campus and its surroundings were gathered as they present an important decision aspect to develop the needed improvements around the area. Furthermore, the detection of such was provided by analyzing the results from the following sources:
accident location data analysis, student/faculty surveys, visual inspection of the campus transportation infrastructure,1 and literature review.
The infrastructure issues identified across the campus included concerns with traffic control devices, pathways, inadequate or missing crosswalks, roadway construction improvements, bike paths, transit routes, parking lots and spaces, as well as the analysis of proposed parking facilities (e.g., new parking garages). Once the gap identification was completed, the research team recognized what was mostly needed to provide a safer transportation infrastructure. The identification of the transportation needs within and around the campus was also critical to develop the simulation-based models for Task 7. Such gap data provided information on routing (e.g., campus entrance realignment) and operational strategies (e.g., pedestrian crossings) that were taken into account to develop the simulation-based scenarios for both base case and future models. This report summarizes the findings from all the sources previously mentioned concerning the UTEP transportation infrastructure.
METHODOLOGY
In order to obtain the desirable information regarding the gap identification, various sources were utilized for a more complete and detailed analysis. The methods used cover both research findings on transportation infrastructure issues across different universities in the U.S. as well as the public opinion obtained from the surveys conducted at UTEP. The sources that supported the transportation infrastructure gap identification as well as a short summary regarding their relevance to this task are briefly described below.
Accident Location Data Analysis – The historical data accident analysis conducted within and around the UTEP campus helped identify various hotspots that might need future improvements due to possible bad roadway designs, signal design deficiencies, or any other transportation infrastructure issues that might contribute to a specific accident location.
1 TTI Researchers conducted the field study around the UTEP campus.

64
UTEP Surveys – The surveys conducted at UTEP provided the researchers feedback from the primary users of it (students and faculty) to identify their current transportation issues as well as their preferences on the future transportation system on campus.
Visual Inspection of the Campus Transportation Infrastructure – TTI researchers conducted a field study around the UTEP campus to identify problems regarding traffic control, pathways, crosswalks, parking, transit routes, and any other additional concerns on the current UTEP transportation infrastructure.
Literature Review – The information gathered for different universities on pedestrian/biking safety and the potential strategies that can be applied to enhance the safety for both bikers and pedestrians helped recognize possible solutions for the UTEP campus safety issues. The interaction between different transportation modes within the campus as well as the current practices on how to coordinate them assisted the researchers on the strategies that can be applied to enhance the campus safety in an efficient manner.
ACCIDENT LOCATION DATA ANALYSIS
In order to identify the locations within and around the UTEP campus with safety issues, a crash data analysis was conducted by the research team that categorized accidents by various factors such as frequency, fatalities, injuries, etc. The results from such analysis revealed several intersections (with higher priority) that might require a variety of improvements to enhance safety. The intersections included are the following:
I-10 & Schuster Ave.; N. Mesa St. & Cincinnati Ave.; N. Mesa St. & Glory Rd.; N. Mesa St. & Schuster Ave.; N. Mesa St. & E Hague Rd.; and N. Mesa St. & W University Ave.
The next section provides a summary of the gaps and the possible needs for each of the intersections previously mentioned.
I-10 & Schuster Ave.
One of the main access points to the university is through I-10 since it serves as an entry location to both west and eastbound drivers. Usually during morning peak hours, the east and westbound off ramps show a significant amount of traffic that exceeds the capacity causing a spillback into the freeway as shown in Figure 42. The spillback caused on I-10 West often propagates all the way back to Porfirio Diaz St. and thus requires vehicles to merge right with higher anticipation for them to exit at Schuster Ave. Also, the amount of weaving increases, due to the spillback, and imposes a safety issue to those traveling along I-10. Furthermore, there is also a visibility issue because vehicles driving on the westbound side can hardly see if there is any spillback due to the curvature present at the area (as seen on Figure 42). Because of the lack of sight, drivers often decelerate on the freeway and compromise the heavy traffic approaching the off-ramp.

65
However, the cause of the spillback onto the freeway is most likely due to the high pedestrian activity at the Sun Bowl Dr./University Ave. intersection. The lack of a signalized pedestrian crossing or a pedestrian bridge within that area interrupts traffic and thus creates the queuing of vehicles. A solution could be to place a pedestrian bridge and channel all of the pedestrians to avoid any traffic delay. This way, both pedestrians and vehicles would have a safer environment overall.
Figure 42. During Morning Peak Hours There Is a Spillback on Both Schuster Off-Ramps.
N. Mesa St. & Cincinnati Ave.
It is no surprise to see the high rate of accidents at this location (including 2 fatalities) because of the great amount of nightclubs, restaurants, and other recreational places nearby (shown in Figure 43). Many college students as well as other citizens frequently visit the area due to the proximity of many apartment complexes including miner village. At night, the pedestrian demand across N Mesa St. dramatically increases, however, most of the people have the

66
tendency to cross wherever possible (e.g., jaywalking). This problem has caused a lot of pedestrian and vehicle conflicts in the area and has led to many reports of incidents in the past three years. In addition, a lot of vehicles traveling both north and southbound along Mesa tend to speed and thus become more of a threat (because of their decreased visibility or the influence of alcohol) to pedestrians. It would be optimal to build a pedestrian bridge across Mesa St.; however, people will still tend to cross at different locations along the street. To avoid this, a rail would have to be installed as well (along Mesa St. on certain sections) in order to channelize the pedestrians through the designated pedestrian bridge. With the designated crossing and more adequate traffic control (e.g., reduced speed areas) the safety issues currently encountered along Mesa St. near Cincinnati Ave. could be significantly reduced.
Figure 43. Vehicle-Pedestrian Conflict on Mesa St. at Cincinnati Ave.
N. Mesa St. & Glory Rd.
This intersection was also identified as being one with the most accidents reported around the campus. One of the reasons that might contribute to such frequency is the slope configuration that reduces the line of sight of vehicles when driving southbound along N Mesa St. In addition, the steep grades encountered causes drivers to sometimes be unaware of the pedestrians that might be crossing the street. Furthermore, the proximity of the Don Haskins Center and a shopping center (as well as the planned bus terminal) generates a lot of pedestrian demand that crosses through that intersection. A way to solve the safety problem in this area would be to let vehicles know with a higher anticipation (e.g., by deploying signals or portable speed radars) of

67
the upcoming pedestrian crossings. Increasing the traffic control around the area is a feasible way to protect all of the people who utilize the pedestrian crossings.
N. Mesa St. & Schuster Ave.
Schuster Ave. is one of the busiest streets around the campus because of all the adjacent parking lots and nearby hospital entry points. However, along N Mesa St. the slopes are quite steep and sometimes block the visibility of those traveling along it. If going southbound on Mesa the negative grade makes it harder for vehicles traveling along it to brake in time if necessary. As a consequence of the high amount of traffic observed in the intersection, improvements have been made to provide a safer driving environment. A pavement overlay project conducted on the area provided N Mesa St. with a new asphalt surface (i.e., HMAC—Hot Mix Asphalt Concrete) to improve the overall life of the pavement as well as handling the high average daily traffic numbers.
N. Mesa St. & E Hague Rd.
It was observed from the accident data analysis that at this intersection there was one fatality (pedestrian) reported. The proximity of the hospitals and the Sun Metro stop across the street causes most of the pedestrian demand at this location. As shown in Figure 44, the pedestrian crossing striping along Hague Rd. does not stand out as it should and thus makes it harder for vehicles (especially at night) to notice it. Also, another issue spotted around that section was the lack of adequate lighting that might compromise the pedestrian safety. Since there is no signal at this intersection, it is of great importance to have appropriate lighting placed to avoid any accidents where cars tend to speed. Currently, the city of El Paso is addressing the crossing striping problem on various locations around the UTEP campus.
N. Mesa St. & W University Ave.
This particular intersection currently experiences both heavy vehicle and pedestrian demand since it serves as one of the main entry points into the university. In addition, there is a bus stop located just in that intersection that several students utilize to arrive and leave the UTEP campus. Even though there have been no fatalities reported at this location there are still a significant amount of accidents (some with minor injuries). One of the problems often encountered is that vehicles usually drive through at high speeds and even ignore the fact that there are pedestrians waiting to cross the street. The addition of signs to indicate a reduced speed area or lowering the speed limit could aid this problem.
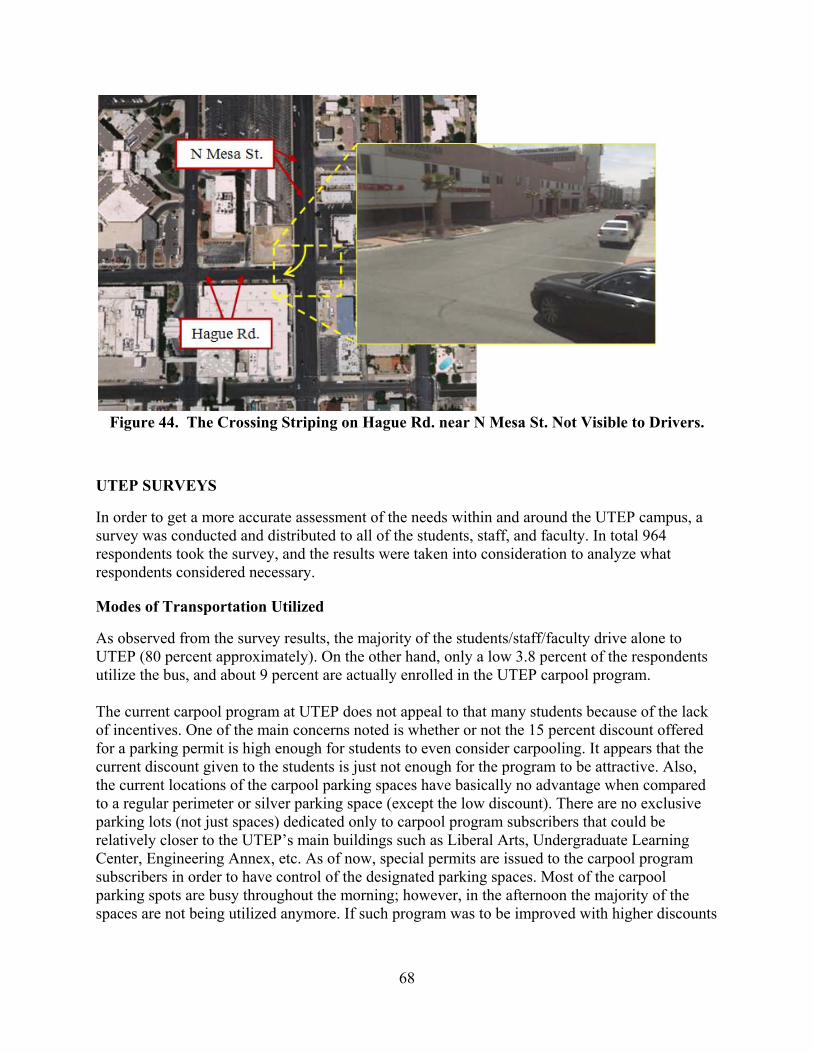
68
Figure 44. The Crossing Striping on Hague Rd. near N Mesa St. Not Visible to Drivers.
UTEP SURVEYS
In order to get a more accurate assessment of the needs within and around the UTEP campus, a survey was conducted and distributed to all of the students, staff, and faculty. In total 964 respondents took the survey, and the results were taken into consideration to analyze what respondents considered necessary.
Modes of Transportation Utilized
As observed from the survey results, the majority of the students/staff/faculty drive alone to UTEP (80 percent approximately). On the other hand, only a low 3.8 percent of the respondents utilize the bus, and about 9 percent are actually enrolled in the UTEP carpool program. The current carpool program at UTEP does not appeal to that many students because of the lack of incentives. One of the main concerns noted is whether or not the 15 percent discount offered for a parking permit is high enough for students to even consider carpooling. It appears that the current discount given to the students is just not enough for the program to be attractive. Also, the current locations of the carpool parking spaces have basically no advantage when compared to a regular perimeter or silver parking space (except the low discount). There are no exclusive parking lots (not just spaces) dedicated only to carpool program subscribers that could be relatively closer to the UTEP’s main buildings such as Liberal Arts, Undergraduate Learning Center, Engineering Annex, etc. As of now, special permits are issued to the carpool program subscribers in order to have control of the designated parking spaces. Most of the carpool parking spots are busy throughout the morning; however, in the afternoon the majority of the spaces are not being utilized anymore. If such program was to be improved with higher discounts

69
and exclusive parking lots to those enrolled in carpooling then the user base might experience on a significant increase and thus alleviate part of the current traffic congestion at UTEP. As noted before, the low utilization of the public transportation system by students is a big concern since it can make a direct impact on alleviating traffic congestion and reducing parking demand. The low demand for public transportation, however, might be due to the fact that the bus stops are usually somewhat far from the main UTEP buildings. As a result, students have to take long walks in order to reach their destination. Therefore, the majority of students just feel that parking closer to their usual classrooms is more convenient than riding the bus to UTEP. It is also worth mentioning that no current transit systems go through campus due to the amount of pedestrians crossing within it (e.g., right after classes are over on University Ave. and Hawthorne St). These limitations make it difficult for the transit system to maintain a constant headway throughout their route if it were to cross through the campus to board and alight students at more convenient locations.
UTEP Parking Demand and Shuttle Service
The increasing enrollment of students to the university has posed a concern for available parking in the surrounding areas. The survey results show that almost 30 percent of students park at the south side of the campus where large parking lots are located (such as P-4). However, the problem to find an available parking space still persists during morning peak hours. Aware of the parking demand and the available supply, the university officials plan to build a new parking garage (near lot P-4 which is between Prospect St. and Sun Bowl Dr.) that will significantly improve the parking demand problem. Another issue encountered with the survey respondents is that the majority do not consider riding the UTEP shuttle to get to the various distant parking lots. The low demand for the shuttle service might be the consequence of large headways encountered making students wait between 10 to 30 minutes depending on the route. Students who need to get to their destination as soon as possible might consider walking or asking a friend to drop them off as a better option. The shuttles should consider running express routes to the parking lots with the most demand for its service, therefore, increasing the incentives for students to stay just a couple of minutes for the shuttle to arrive instead of the current longer waiting times experienced. The slow shuttle service system also contributes to the fact that remote parking lots are less appealing to the students. They cannot rely on its service and take the risk of being late to a class, job, meeting, or any other attendance need.
VISUAL INSPECTION OF THE CAMPUS TRANSPORTATION INFRASTRUCTURE
The field study at the UTEP campus helped identify, by observation, any concerns that might impose a safety issue to the current or planned transportation infrastructure.
Traffic Control
Currently, Schuster Ave./Hawthorne St. is one of the busiest intersections (four-stop) around the campus with its high pedestrian and vehicle demand due to the proximity of various apartment
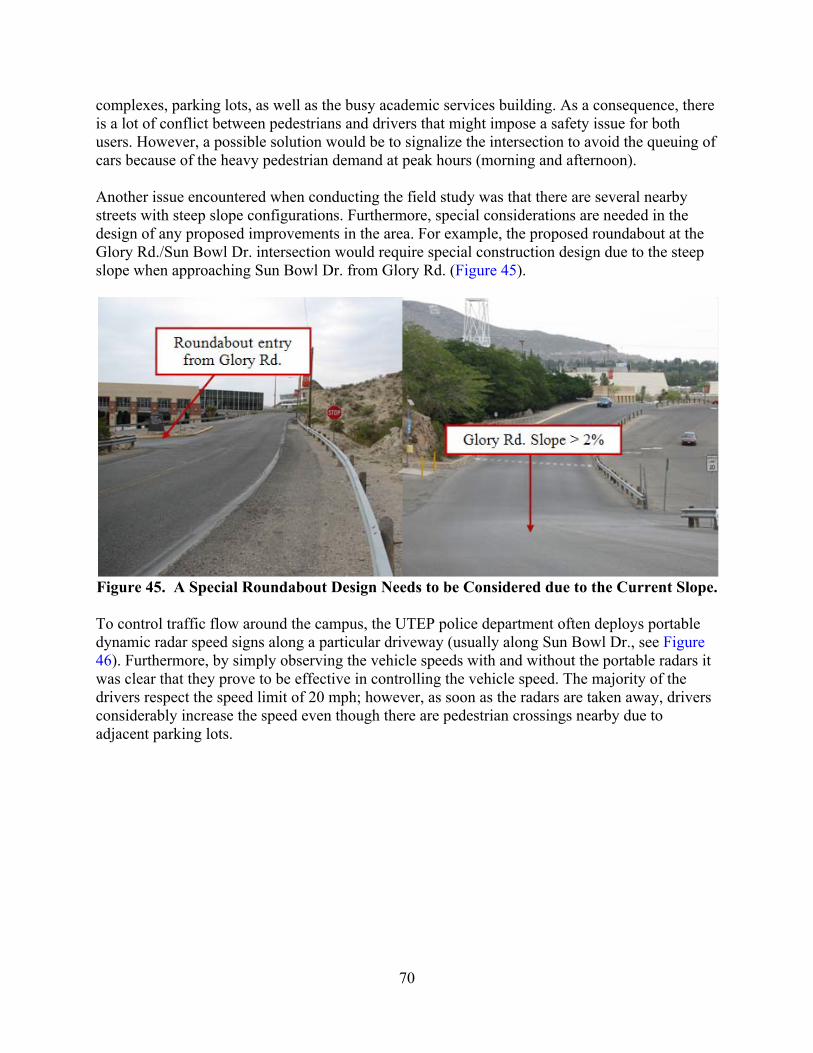
70
complexes, parking lots, as well as the busy academic services building. As a consequence, there is a lot of conflict between pedestrians and drivers that might impose a safety issue for both users. However, a possible solution would be to signalize the intersection to avoid the queuing of cars because of the heavy pedestrian demand at peak hours (morning and afternoon). Another issue encountered when conducting the field study was that there are several nearby streets with steep slope configurations. Furthermore, special considerations are needed in the design of any proposed improvements in the area. For example, the proposed roundabout at the Glory Rd./Sun Bowl Dr. intersection would require special construction design due to the steep slope when approaching Sun Bowl Dr. from Glory Rd. (Figure 45).
Figure 45. A Special Roundabout Design Needs to be Considered due to the Current Slope. To control traffic flow around the campus, the UTEP police department often deploys portable dynamic radar speed signs along a particular driveway (usually along Sun Bowl Dr., see Figure 46). Furthermore, by simply observing the vehicle speeds with and without the portable radars it was clear that they prove to be effective in controlling the vehicle speed. The majority of the drivers respect the speed limit of 20 mph; however, as soon as the radars are taken away, drivers considerably increase the speed even though there are pedestrian crossings nearby due to adjacent parking lots.

71
Figure 46. Portable Radar Speed Signs Proved to be Effective in Controlling Traffic along
Sun Bowl Dr.
Pathways
Some of the pathways around and within the campus were identified with some of the following common issues:
inadequate lighting in certain driveways, no available bike lanes, non-compliant (or missing) ADA sidewalks, and visibility issues caused by on-street parking or landscape.
Figure 47 shows some of the encountered issues along Sun Bowl Dr. by simple inspections of the area.
Figure 47. Pathway Issues Encountered at Sun Bowl Dr. near the Don Haskins Center.
There were also some visibility issues encountered in the inner campus because of on-street parking that might cause a conflict with pedestrians or even vehicles leaving their parking spot.

72
In addition, a missing sidewalk was identified near the W Schuster Ave. / Hawthorne St. intersection that causes pedestrians to walk on the street and expose themselves to the oncoming traffic. Figure 48 shows these two problems encountered during the field study.
Figure 48. Visibility Issues in the Inner Campus and Missing Sidewalks Creates Safety
Concerns in the Area.
As other universities have experienced, pedestrian crossings are abundant within and around the campus to handle pedestrian demand at different locations. However, there were certain cases spotted in which the crosswalk striping is barely visible (see Figure 49). This problem might cause drivers to unexpectedly stop to yield to pedestrians crossing the driveway.
Figure 49. The Striping of Certain Pedestrian Crossings Are Barely Visible.
Additional Concerns
There is a large tendency for many students to be dropped off (or picked up) during peak hours near the surroundings of the UTEP campus. Even though there is a lack of designated drop-off

73
areas for students there are four locations in which most activity has been reported as can be seen in Figure 50. Most of the drop-off locations are near the main entrances of the campus due to the proximity of the main classroom buildings such as liberal arts, undergraduate learning center, and the engineering complex. As a consequence of this activity it creates significant delays, long queues, and safety concerns.
Figure 50. Drop-off Spots with Most Activity Create Significant Delays during Peak
Hours. As previously stated, the Schuster Ave./Hawthorne St. intersection is one of the busiest around the UTEP campus. If driving along Schuster Ave. toward N Mesa St. or Oregon St. the two- lane avenue reduces to only one lane because of on-street parking (Figure 51). Furthermore, the parked vehicles along Schuster Ave. (near Hawthorne St.) cause a significant capacity reduction in the avenue contributing to higher queues and delays.

74
Figure 51. Schuster Ave. Reduces from 2 Lanes to 1 Lane due to On-Street Parking.
LITERATURE REVIEW
The literature review conducted helped the research team identify and analyze what the best practices are in terms of handling pedestrian and bicyclist’s safety, incentives for bike riding, as well as transit related.
Improving Pedestrian Crossings
As stated before, there are several intersections (mostly around the UTEP campus) that are in need of improvements in order to enhance the safety of both the pedestrians and vehicles. One of the solutions currently used in high-risk intersections (such as N Mesa St./Cincinnati Ave.) is to apply a HAWK signal device (Figure 52). This signal has proven to be effective on high speed and volume arterials; therefore, it could improve safety problems around busy intersections near the UTEP campus such as the intersection of Mesa St. at Cincinnati Ave.

75
Figure 52. Active HAWK Signal Device in Tucson, Arizona (2).
Bike Riding Incentives
Several universities across the U.S. aim to preserve a friendly bicycle network by providing safer bicycle paths, improving traffic control, educating through programs or campaigns, and showing the importance of wearing safety equipment. Also, they offer safety gear (e.g., vests, helmets) at discounted prices for students to prioritize safety for the riders. Bike locker rentals (for minimal fees) can also be employed to support the bike riding program. As of now, UTEP lacks bicycle pathways along some major streets such as Sun Bowl Dr. where riders have to either use the sidewalk or ride along the street. The infrastructure should be improved to at least provide a safer bike ride and thus increasing the demand for bike paths.
Transit Related Incentives
It is clear from the survey results that the public transportation system is not very popular among students at the university. Furthermore, the lack of incentives along with the delays by the local agency makes the mode unpopular among daily commuters. However, the newly deployed Smart-101 (i.e., the new bus rapid transit system) intends to address this issue by offering 10-minute headways during weekdays between the UTEP campus and downtown El Paso (1). In addition, the new Bus Rapid Transit system also drops students at University and Oregon, which is relatively close to the Union and the Liberal Arts building. Other universities try to coordinate with the local public transportation agency to meet the needs of the students when they need it most (e.g., afternoon peak hours). Also, to increase the ridership of the transit system, discounts are usually offered to students who use it on a more regular basis.
Parking Management
Students are more prone to park in the surrounding neighborhoods due to the growing demand for parking spots at UTEP as well as price increase for parking permits. However, the affected

76
neighborhoods constantly complain about the lack of enforcement or regulations from the university. To avoid this problem, the campus parking management office should have extensive collaboration with the neighborhoods of interest to establish effective parking mechanisms and strategies. Such collaboration could also help identify any problems within the parking management of the university such as fees, available parking spaces, etc.

77
REFERENCES
1. The University of Texas at El Paso. Parking and Transportation Services http://admin.utep.edu/Default.aspx?tabid=50621. Accessed July 6, 2009.
2. USDOT Federal Highway Administration. RSA’s for Safety. November 2006. http://www.tfhrc.gov/pubrds/06nov/05.htm. Accessed July 8, 2009.


79
TASK 7 – ANALYZE TRANSPORTATION SYSTEM INTEGRATION AND INTERACTIONS
INTRODUCTION
The successful analysis of the integration of the campus transportation master plan with the surrounding transportation system required researchers to perform a multi-resolution modeling approach. Multi-resolution refers to simulation modeling at both the mesoscopic and microscopic levels. This dual simulation process allowed the research team to analyze the interactions of various modes of transportation within the university campus setting while simultaneously analyzing how the campus system integrates with the surrounding regional network. The UTEP campus master plan was used as a case study to analyze the interactions of both systems for present and future conditions. The gaps identified and all relevant data provided from reviewed literature, crash reports, and surveys conducted specified what improvements were missing or needed improvement within and between transportation systems. All aspects of transportation including auto, transit, pedestrians, and bicyclists were integrated into the existing surrounding network and analyzed through the use of dynamic simulation-based modeling software’s VISSIM and DynusT. Due to the complexity of a university campus vehicle composition set, auto vehicles were further defined as “student, faculty, staff, and ambient 2 traffic.” Figure 53 depicts the overall transportation system integration architecture.
Figure 53. Transportation System Architecture.
2 Ambient traffic refers to “pass-thru” traffic not destined within the campus zones.

80
The existing network was modeled with the improvements to Sun Bowl Dr. (i.e., widen to 4 lanes to match current improvements, and the east side campus was realigned (P-2, P-3) to complete the first section of the university campus loop. P-2 and P-3 realign the eastern portion of the campus entrance by bypassing the W University Ave./Hawthorne St. intersection; this bypass ties back into Hawthorne St. adjacent to the engineering building. The new Sun Metro transit terminal was also included into the existing model. The terminal will also house approximately 400 additional parking spaces for UTEP students. A roundabout traffic control device at W University Ave./Sun Bowl Dr. was incorporated into the existing network conditions given that UTEP has already retained funding for this section of roadway improvements. Figure 54 shows the microscopic model under existing conditions.
Figure 54. Microscopic Network - Existing Conditions.
EXISTING NETWORK CONDITIONS
The existing model showed significant queuing on the Schuster Ave. off ramps in both the east and west directions with heavier volume traveling westbound. Queue spills back to I-10 main lanes, which pose hazardous conditions for both commuters to UTEP as well as pass-through traffic. The horizontal alignment of I-10 before the Porfirio Diaz exit allows only limited sight distance ahead. Vehicles traveling on the freeway main lanes often do not see the spillback as they approach the curve and as a result cause extreme braking conditions. Numerous accidents have been attributed to a combination of adverse traffic conditions, excessive speeds, and driver inattentiveness. UTEP has tried to alleviate the problem by manually overriding the traffic control (signalize intersection) at Sun Bowl Dr. and W Schuster Ave. to provide additional green

81
time to off-ramp traffic. However, heavy pedestrian traffic crossing Sun Bowl Dr. from parking lot S-3 further hinders and delays vehicles traveling on Sun Bowl Dr. Parking lot S-3 sits adjacent to Sun Bowl Dr. between W Schuster Ave. and W University Ave. Figure 55 shows the simulation model with queue spillback caused by heavy peak hour traffic and pedestrians crossing Sun Bowl Dr.
Figure 55. Queue Spillback on Sun Bowl Dr.
Modifications to the existing network also included widening Sun Bowl Dr. from W University Ave. to 300 yards north of Glory Rd. Traffic control remained an all-way traffic control (AWTC). The simulation showed that previous queuing caused by morning peak hour traffic was virtually eliminated with the addition of an extra travel lane in each direction. Sun Metro and UTEP have recently broken ground on a new transit terminal on the northeastern portion of the campus. The terminal sits adjacent to N Mesa St. and Glory Rd. and will service multiple city routes. The transit terminal will also house an additional (400+) parking spaces for UTEP on the above floors. This parking structure/transit terminal was modeled as part of the “existing” network. The model showed that buses traveling southbound on Mesa Blvd. and turning right onto Glory Rd. have a short distance before entering transit terminal. Simulation showed that when seven to eight vehicles queue at the signalized intersection, the shuttle is unable to enter the garage. The latest signal timing data provided by the city of El Paso show that N Mesa St. is allocated a maximum green time of 60 seconds. This caused vehicles on Glory Rd. (east) to queue back to the proposed transit terminal entrance on a few occasions. The current configuration of Glory Rd. is one lane in each direction with a width of 22 feet. Even though there is enough room for two travel lanes, buses often take wide turns and prevent vehicles from
I-10 WB
W Schuster Ave. off-ramp WB
Sun Bowl Dr.
Pedestrian crossing
Parking lot S-3

82
passing. In addition, there are instances where multiple buses arrive at the terminal at the same time period.3 The current N Mesa St. layout has a dedicated right-turn lane, which provides storage when queuing propagates to the intersection. The addition of P-2 and P-3 reduced the overall amount of traffic flow on N Oregon St. between W University Ave. and W Rim Rd. This is critical as this area is the main service entrance to the hospitals that sit adjacent to the campus. Traffic flow on W Rim Rd. was also reduced as vehicles began using the new entrance on the eastern portion of the campus. The Hawthorne St./W Schuster Ave. intersection is currently modeled as the existing AWTC. This intersection is heavily utilized by pedestrians crossing from lots P-1, P-2, and the surrounding neighborhoods. In addition, W Schuster Ave. east from Hawthorne St. to W Rim Rd. allows on-street parking. This reduces the capacity in half and allows only one lane of traffic flow in each direction. The existing model showed significant queuing during several periods of simulation due to both lack of storage capacity and pedestrian flow. The pedestrian crossing at Schuster Ave. and lot P-4 has heavy flow during morning peak hours. Even though the simulation did not show significant queuing on this segment of roadway, vehicles do travel at higher speeds than the posted 20 mph speed limit.
FUTURE NETWORK CONDITIONS
The research team modeled the entire El Paso metropolitan area using a mesoscopic simulation tool—DynusT. The future conditions were modeled for the year 2030 using the El Paso Metropolitan Planning Organizations (EPMPO) travel demand model. Researchers had to include all the transportation system improvements into the model. System improvements for UTEP campus were:
modify Glory Rd. between Sun Bowl Dr. and Randolph Rd.4 (P-4); modify Randolph Rd. and W Robinson Ave. between Glory Rd. and Oregon St. (P-5); modify Rim Rd. between Hawthorne St. and Wiggins Dr. (P-6); and connect Rim Rd. to Sun Bowl Dr. (P-7).
In addition, the simulation model included future roadway improvement projects, which included the realignment of the UTEP campus entrance from I-10 westbound and realigning W Schuster Ave. to connect with W Paisano Dr. (State Rd. 85). The reconfiguration of W Schuster Ave. to W Paisano Dr. included managed lanes. For this reason, researchers included the toll lanes that stretch from the proposed Sunland Park collector/distributor configuration on the west side of town to Loop 375/I-10 interchange (Americas) on the eastern portion of El Paso. Assumptions were made when developing the base model including toll rates and access points for the proposed W Paisano Dr. elevated toll lanes. For this analysis, TTI used a toll rate of $0.16/mile for auto and $0.46/mile for trucks. Access control points were provided at S Zaragoza
3 Transit routes and timings were input using the latest data provided by Sun Metro. 4 Randolph Rd. sits adjacent to the UTEP Memorial gymnasium between Glory Rd. and Robinson Ave.

83
Rd., S Yarbrough Dr., US 54 interchange, downtown and W Schuster Ave. connection to W Paisano Dr. Both ingress and egress points were provided in both directions. Once all variables were coded and input to the simulation model, it was run through an iterative process to equilibrium conditions. Simulation results showed that the majority of vehicles destined for the UTEP campus utilized the existing entrances. I-10 off-ramps in both the east and west directions show no improvements between the base and W Schuster Ave. realigned scenarios. N Mesa St. also exhibited similar results. TTI analyzed the traffic flow volume on the new Schuster Ave. access, and results showed an average hourly volume of approximately 150–200 veh/hr utilizing this access location. Figure 56 depicts the output results from the mesoscopic simulation model. Traffic flow into the proposed new campus entrance was also analyzed. Simulation results compared traffic volume using Sun Bowl Dr. and the new entrance adjacent to parking lot S-3 as shown in Figure 57. The proposed new campus entrance carried the majority of traffic flow into the campus when compared to Sun Bowl Dr.
Figure 56. Hourly Volume on Proposed W Schuster Ave. Access.
Figure 57. Comparison of Traffic Volume –Sun Bowl Dr. vs. New Campus Entrance.

84
INTEGRATION BETWEEN SYSTEMS
The research team analyzed the transit service to the campus area. Currently there are nine transit routes that provide access to the university. All transit routes originate from downtown except for route 70, which is an express bus service. The remaining eight routes that service UTEP are destined for various locations on the western portion of El Paso. These routes were identified from their farthest location from campus, and the travel time and headways were documented. Routes 12, 13, and 16 had the longest travel times at 50, 40, and 45 minutes, respectively. The headways for these same three routes were 1 hr, 1 hr, and 2 hr as shown in Figure 58.
Figure 58. Sun Metro Transit Route Travel Time and Headway.
Route 70, which is an express bus route from a terminal on the eastern portion of the city, is the only one that provides service to UTEP. Given that the majority of trips that enter campus are from the eastern, lower valley, and northeast sections of the city, the city transit service is extremely biased toward westside residents. Simulation of transit service showed only limited results. Researchers were able to estimate the discrepancies between arrival times for city and campus transit and were able to make reasonable assessments on campus shuttle routes and headways.
SunMetro routes
Origin DestinationTravel time from farthest stop
point to UTEP (Approx)Average Headway
10San Jacinto
PlazaStation at Coffin
Ave.7 min 30 min
11Downtown Station
Camelot Apartments
10 min 1 hr
12Downtown Station
Redd Rd. at Doniphan Dr.
50 min 1 hr
13Downtown Station
N Mesa St. at Pitts St.
40 min 1 hr
14Downtown Station
N Mesa St. at Doniphan Dr.
1 hr 30 min
15Downtown Station
N Mesa St. at Doniphan Dr.
30 min 25 min
16DowntownStation
Westside at Gomez Rd.
45 min 2 hrs
70Eastside Terminal
N Oregon St. at W University
Ave.30 min 30 min
101DowntownTransit Center
N Oregon St. at W University
Ave. 20min 10 min
85
TASK 8 – ESTIMATE COSTS
INTRODUCTION
Cost estimation was performed on the different transportation improvements proposed on the UTEP campus. These improvements consist of eight segments distributed around the central part of the campus with an extra segment already being funded and will consist of a roundabout or signalized intersection at Sun Bowl Dr. and W University Ave. Also due to pending funding, these improvements are being prioritized as follows: Sun Bowl Dr. Central, W University Ave. Re-Alignment, Hawthorne St., Glory Rd., W Robinson Ave./Randolph Dr., W Rim Rd, Sun Bowl Dr. Re-Alignment, and Sun Bowl Dr. North. Along with the costs of these improvements proposed, the costs derived from the recommendations given by the research team are also included in the estimation.
RECOMMENDED INFRASTRUCTURE IMPROVEMENTS
The following items were recommended by the research team in order to improve and integrate the transportation system to UTEP campus (Figures 59 and 60):
Traffic lights (1) in four intersections o Hawthorne St. and W Schuster Ave. o Prospect St. and W Schuster Ave. o Sun Bowl Dr. and W University Ave. o Glory Rd. and Sun Bowl Dr.
Four dynamic radar signs (1) mounted by o Sun Bowl Dr. next to the Don Haskins Center o Sun Bowl Dr. next to the Sun Bowl Stadium o W Robinson Ave. and N Mesa St. o W Schuster Ave. next to P-4
HAWK signals (1) by o N Mesa St. and W Hague Rd. o Schuster Ave. between P-4 and S-2
Two pedestrian bridges by o Sun Bowl Dr. connecting the S-3 parking lot with the new College of Health
Sciences building, library, and UGLC o Mesa St. between Glory Rd. and Cincinnati Ave. connecting the entertainment
district with the parking lots Lighted in-ground crosswalk (2) by
o Schuster Ave. between P-3 and the Academic Services Building Variable signs (3)
o Approximately 10 “No Parking” signs o Approximately 20 “Bus Stop” signs (Miner Metro Shuttle) o Five “Drop-off location” signs

86
Traffic Light Dynamic Radar Sign
Pedestrian Bridge HAWK Signal
Illuminated Crosswalk No Parking
Drop-off Sign
Legend
Figure 59. Location of Proposed Transportation Improvements with Legend.

87
UTEP PROPOSED TRANSPORTATION IMPROVEMENTS
Figure 60 illustrates the location of the different modifications that were proposed by the research team. The following items are the proposed projects that will help improve the transportation system in and around campus. Priority 1- Sun Bowl Drive Central The goal is to widen the existing two-lane street that is located next to the stadium to a four-lane street. This widening will help improve the traffic flow between I-10 and N Mesa St. especially during special events held at the Sun Bowl and Don Haskins Center. Also, walkways and bike lanes will be provided. Priority 2- University Re-Alignment W University Ave. is realigned such that it will pass behind the Liberal Arts building and connect with Hawthorne St. The purpose of this realignment is to create a loop and reduce or eliminate any vehicle-pedestrian conflict generated primarily between classes. Again, with this improvement traffic flow will be optimized. Priority 3- Hawthorne Street The improvement on this street is a continuation of Priority 2 in order to help control and ease traffic flow. Sidewalks will be widened, and bike lanes will be added to this section of the street. Priorities 4 and 5- Glory Rd. and W Robinson Ave./Randolph Dr. These two priorities include the remodeling of Glory Rd., Randolph Dr., and W Robinson Ave. between Sun Bowl Dr. and N Oregon St. Sidewalks, bike lanes, signage, and bus stops will be added along with right-of-way landscaping. Priority 6- W Rim Rd. The scope of this part of the project is to extend W Rim Rd. in order for it to connect with Sun Bowl Dr. This extension will help improve traffic flow around the campus loop and pedestrian safety. Also sidewalks, bike panes, signage, and bus stops are considered. Priority 7- Sun Bowl Dr. Realignment The design includes the realignment of Sun Bowl Dr. in order to connect with Wiggins Dr. and W Rim Rd. and disconnecting it with W Schuster Ave. This design is associated with the realignment of W Schuster Ave. and how it will connect to I-10. Priority 8- Sun Bowl Dr. North The goal of this segment is to improve the current conditions of the section of Sun Bowl Dr. that is between Glory Rd. and N Mesa St. The traffic flow will be optimized thus creating safer sidewalks and bike lanes for people who use this part of campus. Figure 60 shows the locations of these eight proposed improvements.

88
Figure 60. Location of the Modified Proposed Transportation Improvements.
COST ESTIMATION
From Recommended Infrastructure Improvements
Table 10 shows an estimation cost derived from the recommendations given by the research team. This amount is approximately $2,329,200.
Table 10. Costs Obtained from TTI Recommendations. Unit Price Quantity Cost Traffic light $150,000 4 $600,000 Dynamic radar signs $4,000 4 $16,000 No Parking signs $20 10 $200 HAWK $40,000 2 $80,000 Lighted in-ground crosswalk $32,000 1 $32,000 Pedestrian bridge $800,000 2 $1,600,000 Bus Stop signs $40 20 $800 Drop-off location signs $40 5 $200
$2,329,200
Sun Bowl Dr.
N Mesa St.
W University Ave.

89
From UTEP Proposed Transportation Improvements
Table 11 gives a summary of the budget estimated for each project proposed by UTEP.
Table 11. Estimated Cost Obtained for Each Priority. Proposed Improvements Cost
Priority 1- Sun Bowl Dr. Central $4,581,250 Priority 2- W University Ave. Realignment $3,525,000 Priority 3- Hawthorne St. $1,625,000 Priority 4- Glory Rd. $1,487,000 Priority 5- W Robinson Ave./Randolph Dr. $1,837,500 Priority 6- W Rim Rd. $1,950,000 Priority 7- Sun Bowl Dr. Realignment $3,468,750 Priority 8- Sun Bowl Dr. North $4,525,000
$22,999,500 Adding both quantities, the total cost estimation is approximately $25,328,700.


91
REFERENCES
1. Public Signals. Texas Department of Transportation. 2006. ftp://ftp.dot.state.tx.us/pub/txdot-info/pio/casbrochures/pub_signals.pdf. Accessed August, 2009.
2. Dannemiller, M.. Illuminated Crosswalk. RBA Group. http://www.walkinginfo.org/pedsafe/casestudy.cfm?CS_NUM=25. Accessed August, 2009.
3. USA Custom Signs. USA Traffic Signs. August 2009. http://www.usa-traffic-signs.com/Custom_s/24.htm. Accessed August, 2009.


93
TASK 9 – CASE STUDY CONCLUSIONS AND RECOMMENDATIONS
INTRODUCTION
Case study results and conclusions were presented to TxDOT and UTEP at the conclusion of the research project. The overall findings of the study involve the UTEP campus master plan as a case study on how the transportation system integrates with the surrounding system. A multi-resolution simulation modeling methodology provided output of existing and future transportation system scenarios as they pertain to both the transportation system integration and interactions between modes within the university campus. The findings of the simulation, along with the accident reports, surveys conducted, and site investigation throughout the campus will help both university campus planners and various stakeholders in the region in determining optimal transportation strategies for both the campus setting and the surrounding areas. In addition, the results can assist the university in allocating funding for proposed projects and provide specific guidance to safety concerns around campus as they pertain to all modes of transport. The following sections for recommendations will be outlined as traffic control, pedestrian crossings, transit routes, bike/walk paths, and infrastructure improvements.
TRAFFIC CONTROL
Traffic control strategies for various intersections were analyzed based upon the research performed. Four key intersections were analyzed for traffic throughput, concentration of pedestrian crossings, and proposed new parking facilities for the southern portion of the campus as shown in Figure 61.
Figure 61. Proposed Locations for Signalized Intersections.
94
The first intersection was at Sun Bowl Dr. and W University Ave. The final design of the roundabout and southern Sun Bowl Dr. corridor had been completed prior to this analysis, and the project is scheduled to letting in December of 2009. However, TTI researchers were asked to analyze the efficiency and functionality of the roundabout versus a signalized intersection. After reviewing all data from the simulation model, literature review and field studies, the researchers concluded that both the roundabout and signalized intersection scenarios would be efficient enough to handle traffic flow, and queuing would not spillback onto I-10 freeway main lanes. Signalization would provide specified green time phases for pedestrians and eliminate the need for a “pedestrian specific signal” downstream of the intersection. Signalization would also provide gap time for vehicles entering the garage and allow any queuing that may form at the entrance to somewhat dissipate. However, due to the advanced stages of the roundabout design, improvements can be made to improve traffic flow and reduce the pedestrian safety issue including closing the at-grade pedestrian crossing south of the roundabout with fencing. The fencing can channel the pedestrians to the proposed bridge and reduce the delay caused on Sun Bowl Dr. Second, the closure of the small parking lot across from the parking garage would eliminate the issue of pedestrians north of the roundabout. Finally, keeping the parking garage gates open during the morning peak hour would reduce the risk of cars queuing back from the garage to the roundabout. The second proposed intersection is at the Sun Bowl Dr./Glory Rd. intersection. Even though the model showed no significant queuing due to the widening of Sun Bowl Dr., the simulation modeled during morning peak hour congestion. During special events, the northern portion of the campus (i.e., parking adjacent to football stadium and Haskins Center) becomes extremely congested. Traffic flow into the intersection becomes quite profound, and signalization would help alleviate queuing in all directions. In addition, regular commuter traffic that passes through Sun Bowl Dr. destined to or from I-10 could benefit from signal coordination between the two proposed traffic signals. The third proposed intersection to signal is at W Schuster Ave. and Hawthorne St. This intersection experiences some of the heaviest flows of pedestrians not only during peak hours, but throughout the day. Traffic flow continuously has to wait for pedestrians crossing without coordination. Survey results showed that this was the number one problem area for congestion from respondents. Signalization would allow pedestrians to cross at predetermined phases per cycle. The fourth proposed signal was at W Schuster Ave. and Prospect St. The university plans to construct a large parking garage in lot S-2, which sits adjacent to W Schuster Ave. and behind the new Academic Services Building. The proposed new parking garage would store over 900 vehicles. This lot is also considered a premium lot, and demand is high given its proximity to the interior campus. Simulation model showed a high concentration of vehicles traveling east on W Schuster Ave. and turning left into the parking facility. The campus has stated that this parking entrance would align with Prospect St. Given the high demand and flow of left turning vehicles, a signalized intersection would be warranted.

95
Researchers also recommended traffic control devices in the form of dynamic radar signs (mounted). Previous site investigation showed that UTEP campus police currently utilize two portable radar signs on campus. However, these are portable and need to be dropped off and picked up each day. In addition, the devices were only placed in two key locations. Researchers recommended that these dynamic radar signs be placed in four locations in and around campus as shown in Figure 62. Research of similar studies showed that dynamic radar signs (changeable message signs) equipped with a radar unit offers a more dynamic speed control environment and therefore may prove to be more effective in influencing drivers to reduce their speeds. The results of this study indicated that the duration of exposure of the changeable message sign does not have a significant impact on speed characteristics and driver behavior. Therefore, the radar signs continue to be effective in controlling speeds for long durations.5 A similar study conducted in Bellevue, Washington, found that permanent radar signs retain their effectiveness two years or more after installation.6
Figure 62. Recommended Locations for Dynamic Radar Signs.
The first location would be on Sun Bowl Dr. southbound adjacent to the Don Haskins Center. The second location is also on Sun Bowl Dr. approximately 300 yards south of the Glory Rd. The third location is on W Schuster Ave. adjacent to lot P-4. This is one of the largest parking lots on campus with heavy pedestrian traffic flow crossing the street. In addition, W Schuster Ave. westbound has a steep negative grade—causing many vehicles to accelerate through the crosswalk. Furthermore, the crosswalk is on a horizontal curve further hindering the sight distance to the crosswalk. The researchers recommend a dynamic radar sign upstream of the
5 N. Garber Ph.D., Effectiveness of Changeable Message Signs in Controlling Vehicle Speeds in Work Zones: Phase II, Virginia Transportation Research Council, 1998. 6 Permanent Radar Signs Other Agencies Experience, Bellevue, WA. 2006. Cited from http://www.ci.kirkland.wa.us

96
crosswalk in both directions. The last proposed location would be on Mesa St. between Cincinnati Ave. and Glory Rd. This area contains multiple bars and restaurants with an extremely high concentration of pedestrians at night. This is also the location of a recent fatality between an auto and a pedestrian. Radar signs are excellent traffic-calming devices and would greatly benefit all the proposed locations. The last recommendation for traffic control would be the removal of on-street parking at various locations in and around campus as depicted in Figure 63. The research team analyzed traffic flow in and around the UTEP campus and determined that on-street parking in several locations was detrimental to the overall transportation system and recommended the removal of street parking in key locations. The first location is on W Schuster Ave. between Hawthorne St. and N Oregon St. W Schuster Ave. goes from a two-lane arterial to one lane after the intersection. Vehicles and buses are often competing for one lane as they transverse through the intersection. This would also allow two lanes of traffic flow in both directions, reducing the queuing at the Hawthorne St./ W Schuster Ave. intersection. On-street parking should also be removed on W Robinson Ave., which currently services the UTEP on-campus housing—Miner Village. Removal of on-street parking would allow two lanes of traffic to flow east. This is significant during special events as this side of the campus holds a tremendous number of vehicles during events. Two lanes of outbound traffic would help disperse vehicles more quickly and also provide additional room for large vehicles (trucks/buses). Inner campus on-street parking should be removed on Randolph Dr., W Rim Rd. between Hawthorne St. and Wiggins Dr., Hawthorne St. between W Rim Rd. and new campus entrance realignment, and on University Ave. between the western campus entrance (guard station) and Wiggins Dr. All the on-street parking removal, with the exception of W Schuster Ave., can be supplemented with current or proposed parking structures and lots.
Figure 63. Proposed Locations of On-Street Parking Removal.

97
PEDESTRIAN CROSSINGS
Researchers also recommended signalized crosswalks at three locations around campus. The HAWK pedestrian control was recommended at two locations. The first location was on Schuster Ave., adjacent to parking lot P-4. This is where vehicles travel at their highest speed, and pedestrian safety is often compromised. A HAWK crosswalk is also proposed at the intersection of N Mesa St. and W Hague Rd. This location has several issues including a steep grade change on N Mesa St. southbound and proximity of building structures to roadway. In addition, this intersection provides access to the hospitals in the area. A HAWK crosswalk would provide much needed pedestrian safety when crossing the heavily congested N Mesa St. The last location for a signalized crosswalk would be on W Schuster Ave. adjacent to the Academic Services Building. Pedestrians routinely emerge from behind the building and cross W Schuster Ave., often without the westbound traffic clearly seeing the conflicts. Inadequate lighting at this location further hinders driver’s ability to see pedestrians crossing the street. A lighted in-ground crosswalk would help distinguish pedestrians when crossing the street by alerting drivers with flashing lights on the street. The research team also recommended two pedestrian bridges. The first would be on Sun Bowl Dr. just downstream of the Schuster intersection. This pedestrian bridge would service parking lot S-3, a premium lot on the western side of campus and provide access to the newly constructed college of nursing, library, and business buildings. This bridge, in addition to the signalized crosswalk at Sun Bowl Dr. and W University Ave. would almost completely eliminate pedestrians crossing Sun Bowl Dr., which contributes to the spillback on the I-10 main lanes. The second location, shown in Figure 64, would be on N Mesa St. between Glory Rd. and Cincinnati Ave. This pedestrian bridge would remove a great number of pedestrians trying to cross N Mesa St. during sporting events or on weekends, when the entertainment district has a high number of patrons.

98
Figure 64. Proposed Locations for Pedestrian Bridges.
TRANSIT
The current miner metro transit system routes do not enter the center core of the campus due to heavy pedestrian flow at the intersection of Hawthorne St. and W University Ave., especially during time periods between classes. In general, all vehicular traffic stopped at this intersection is severely delayed due to pedestrian traffic. Miner metro shuttle routes do not enter the campus core due to this impedance. The research team proposed four alternative campus shuttle routes to service various locations on campus. In addition, stop points for each route were also provided. Figures 65–68 depict the proposed transit routes for the UTEP campus. Transit route 1 provides service from remote parking on the northern end of campus to the southwestern portion of campus (i.e., library, UGLC, business). The second proposed transit route also provides access from the remote northern lots to the southeastern portion of campus (i.e., engineering, liberal arts). The third route provides a “loop” for the campus. This route stays on the perimeter of campus and services Miner Village in addition to all the stops on the outer edge of campus. This route has the longest travel time. The fourth route also provides service from the remote lots to the southwest portion of the campus. This route also services the Fox Fine Arts building. Routes 2 and 3 provide transfers from the Sun Metro terminal to the miner metro shuttle. The research team proposed 10-minute headways between shuttles to provide adequate service for students, faculty, and staff.

99
Figure 65. Recommended Transit Route 1.
Figure 66. Recommended Transit Route 2.
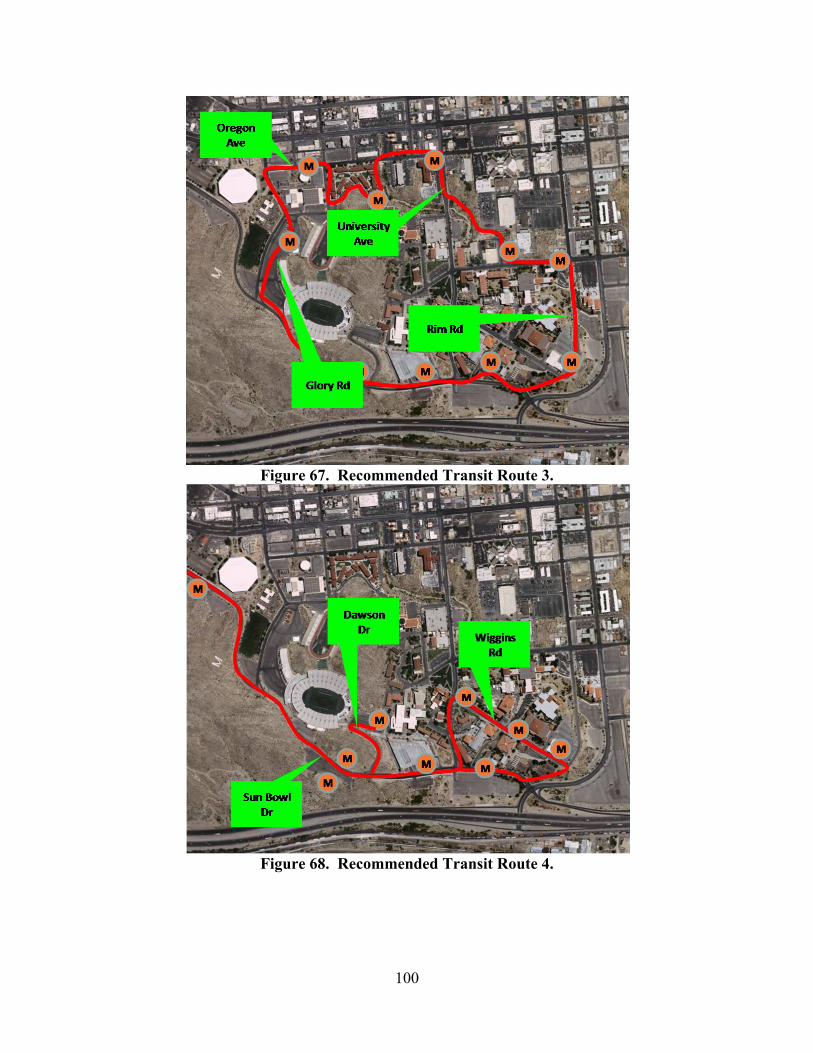
100
Figure 67. Recommended Transit Route 3.
Figure 68. Recommended Transit Route 4.

101
WALK AND BIKE PATHS
The research team recommended enhancing UTEPs existing campus walkways. The current campus infrastructure has three on-campus outdoor walking trails where designated pathway and distance traveled are marked. However, pathway markings are not highly visible, and certain sections have inadequate sidewalk width to accommodate both pedestrians and bicyclists. The research team recommends that all designated walkway sidewalks be upgraded to accommodate both pedestrian and bicyclists. In addition, outdoor-shaded seating is recommended on Rim Rd. and W Schuster Ave. Furthermore, it is recommended that UTEP begin an outreach program to surrounding neighborhoods to utilize the pathways and provide free parking during off-peak campus hours.
INFRASTRUCTURE IMPROVEMENT RECOMMENDATIONS
The research team proposed several roadway improvements that coincide with the university campus master plan. However, there are project specific improvements at various locations that came as a result of data acquisition and analysis. The first recommendation is to provide one travel lane in each direction for the proposed P2 and P3 roadway improvements. Simulation showed that one travel lane in each direction would be sufficient to traffic flow in this area. Figure 69 depicts roadway improvement recommendations.
Figure 69. Roadway Improvement Recommendations (P2 & P3).

102
The second set of recommendations would be to widen Glory Rd. to two lanes in each direction from Sun Bowl Dr. to Randolph Dr. This added capacity would alleviate concentrated congestion during major sporting and concert events. Recommendations also include widening Randolph Dr. southbound to two lanes and W Robinson Ave. eastbound to N Oregon St. to two lanes. This combination of roadway improvements would create much needed circulation of traffic around the Haskins Center and football stadium. The research team also recommends widening Glory Rd. between N Oregon St. and Randolph Dr. This extra lane will help large service vehicles (i.e., semi-truck and buses) when loading and unloading at the Haskins Center. Figure 70 shows the proposed recommendations.
Figure 70. Roadway Improvement Recommendations (P4 & P5).
The third set of recommendations would be to leave W Rim Rd. between Hawthorne St. and Wiggins Dr. as is. Only on-street parking removal is suggested and recommended for efficient campus loop traffic flow. The research team recommends connecting Rim Rd. to Sun Bowl Dr. with the connection directly adjacent to the new college of nursing as shown in Figure 71. Connections to Sun Bowl Dr. should only allow right turns. Allowing left turns, especially during peak congestion periods creates significant queuing.

103
Figure 71. Roadway Improvement Recommendations (P6 & P7).
The final two infrastructure improvements include proposed drop-off locations for pedestrians at various locations on campus and final recommendations regarding the W Schuster Ave. realignment. Figure 72 shows the proposed locations around campus for student drop-off. There are two proposed eastern locations, one proposed southern location, one proposed western location, and one proposed northern location. The two eastern locations (one for each direction of traffic) should be incorporated with the construction of P2. The southern drop-off location should be incorporated into the construction of P7. The western drop-off location is located in parking lot S-4. The last drop-off location should be incorporated into the construction of P5. The locations recommended are based upon the major classroom areas with access from different locations. A “cell-phone” should be considered for afternoon student pick-up as this will reduce the amount of traffic idling while waiting for students. Parking lot P-7, which sits adjacent to the football stadium, is used during regular school hours and close proximity and easy access to the western portion of the campus on Sun Bowl Dr. However, this would only benefit the afternoon student pick-ups and not morning drop-off since morning peak hours are the immediate concern as far as traffic congestion, queue spillback, and pedestrian safety.

104
The last improvement project is the realignment of W Schuster Ave. Based upon the mesoscopic simulation model; the research team does not recommend this roadway realignment until further studies are conducted. This is a major construction project with high costs, and it is the recommendation of the team that TxDOT perform a more thorough analysis of traffic utilizing the proposed managed lanes.
Figure 72. Recommended Drop-off Locations.

105
TRANSPORTATION IMPROVEMENTS PRIORITIZED LIST
The TTI researchers developed a prioritized project list based on the various recommendations given with the purpose of improving issues such as pedestrian safety and traffic congestion within and around the campus. In total, 31 infrastructure improvements are listed in the table below, which includes a short description of the project, the benefits as well as an estimated cost.


107
Tab
le 1
2. T
rans
port
atio
n Im
prov
emen
t Pro
ject
s Pri
ority
Lis
t.
Prio
rity
R
anki
ng
Proj
ect D
escr
iptio
n B
enef
its
Cos
t
1
Sun
Bow
l Dr.
Impr
ovem
ents
Rou
ndab
out a
t Sun
Bow
l Dr./
W U
nive
rsity
Ave
.
Dro
p-of
f loc
atio
n (p
arki
ng lo
t S-3
)
Fenc
ing
alon
g si
dew
alk
on S
un B
owl D
r. ad
jace
nt
to p
arki
ng lo
t S-3
Rou
ndab
out w
ill re
duce
del
ay a
nd q
ueui
ng d
urin
g m
orni
ng
peak
hou
r and
impr
ove
over
all a
esth
etic
s of c
ampu
s en
tranc
e. D
rop-
off l
ocat
ion
will
redu
ce c
onge
stio
n sp
illba
ck/d
elay
s cau
sed
by id
ling
vehi
cles
. Fen
cing
alo
ng
Sun
Bow
l Dr.
will
elim
inat
e m
id-b
lock
cro
ssin
gs a
nd
chan
nel p
edes
trian
s to
desi
gnat
ed c
ross
wal
ks.
$225
,000
2 Pe
dest
rian
Brid
ge
B
ridge
ove
r Sun
Bow
l Dr.
that
link
s par
king
lot
S-3
with
the
Col
lege
of H
ealth
Sci
ence
Pede
stria
n br
idge
will
redu
ce v
ehic
ular
/ped
estri
an c
onfli
ct
poin
ts a
nd im
prov
e pe
dest
rian
safe
ty. I
mpr
ove
traff
ic fl
ow
on S
un B
owl D
r.
$800
,000
3
W S
chus
ter A
ve. I
mpr
ovem
ents
Sign
aliz
e H
awth
orne
St./
W S
chus
ter A
ve.
R
emov
e on
-stre
et p
arki
ng o
n W
Sch
uste
r A
ve./a
cqui
re R
OW
for s
idew
alk
Si
dew
alk
on so
uth
side
of W
Sch
uste
r Ave
. be
twee
n H
awth
orne
St.
and
N E
l Pas
o St
.
AD
A ra
mps
at i
nter
sect
ion
H
AW
K si
gnal
on
W S
chus
ter A
ve. c
ross
wal
k
Traf
fic si
gnal
will
impr
ove
over
all t
raff
ic fl
ow o
n W
Sc
hust
er A
ve. a
nd re
duce
del
ays c
ause
d by
hea
vy p
edes
trian
cr
ossi
ng. R
emov
al o
f on-
stre
et p
arki
ng w
ill in
crea
se
capa
city
and
pro
vide
muc
h ne
eded
seco
nd la
ne fo
r em
erge
ncy
vehi
cles
. Sid
ewal
ks, A
DA
ram
ps a
nd H
AW
K
sign
al w
ill im
prov
e th
e ov
eral
l saf
ety
for p
edes
trian
s.
$2,2
91,5
00
4
Glo
ry R
d Im
prov
emen
ts
W
iden
to 2
lane
s eac
h di
rect
ion
from
Sun
Bow
l Dr.
to R
ando
lph
Dr./
side
wal
k &
bik
e pa
th
Si
gnal
ize
Sun
Bow
l Dr./
Glo
ry R
d
Strip
e G
lory
Rd
to 2
lane
s wes
tbou
nd b
etw
een
N
Mes
a St
./Ran
dolp
h D
r.
Impr
ove
traff
ic fl
ow o
n no
rther
n si
de o
f cam
pus,
espe
cial
ly
durin
g sp
ecia
l eve
nts.
Side
wal
ks a
nd b
ike
lane
s will
pro
vide
sa
fer p
athw
ays f
orm
par
king
lot P
-9 to
inne
r cam
pus a
nd
Don
Has
kins
Cen
ter.
Sign
al o
n G
lory
Rd.
/Sun
Bow
l Dr.
will
pr
ovid
e gr
een
time
for p
edes
trian
s and
bic
yclis
ts a
nd a
ssis
t in
traf
fic d
ispe
rsio
n af
ter s
peci
al e
vent
s.
$2,3
62,0
00
5
Ran
dolp
h D
r. an
d W
Rob
inso
n A
ve. I
mpr
ovem
ents
Wid
en (r
estri
pe) R
ando
lph
Dr.
sout
hbou
nd to
2
lane
s/si
dew
alks
and
bik
e pa
ths
R
emov
e on
-stre
et p
arki
ng o
n W
Rob
inso
n A
ve.
Impr
ove
over
all t
raff
ic fl
ow a
nd p
edes
trian
safe
ty o
n no
rther
n en
d of
cam
pus.
Hel
p al
levi
ate
cong
estio
n du
ring
spec
ial e
vent
s and
pro
vide
add
ition
al tu
rnin
g ra
dius
for l
arge
tru
cks/
buse
s.
$1,8
37,5
00
6
Cen
tral S
un B
owl D
r. Im
prov
emen
ts
W
iden
Sun
Bow
l Dr.
to 2
lane
s eac
h di
rect
ion
from
no
rth o
f par
king
gar
age
to 2
00 n
orth
of G
lory
Rd.
/s
idew
alks
and
bik
e la
nes
This
road
way
impr
ovem
ent w
ill h
elp
alle
viat
e tra
ffic
co
nges
tion
on S
un B
owl D
r. co
rrid
or, e
spec
ially
dur
ing
peak
ho
urs w
hen
ambi
ent t
raff
ic u
ses S
un B
owl D
r. as
an
acce
ss
poin
t to
I-10
. Med
ians
will
impr
ove
safe
ty b
y pr
ovid
ing
$9,1
07,0
00
107

108
Prio
rity
R
anki
ng
Proj
ect D
escr
iptio
n B
enef
its
Cos
t
Le
ft-tu
rn b
ay, m
edia
n, c
ross
wal
ks
pede
stria
n re
fuge
are
as.
7
Sign
aliz
e W
Sch
uste
r Ave
./Pro
spec
t St.
Fe
ncin
g on
nor
ther
n si
de o
f W S
chus
ter A
ve.
side
wal
k
Rem
ove
2 cr
ossw
alks
imm
edia
tely
adj
acen
t to
Aca
dem
ic S
ervi
ces b
ldg.
on
W. S
chus
ter A
ve.
Prov
ide
smoo
ther
traf
fic fl
ow o
n W
Sch
uste
r Ave
. and
ne
wly
con
stru
cted
par
king
gar
age
in p
arki
ng lo
t S-2
. Fe
ncin
g on
side
wal
k an
d re
mov
al o
f exi
stin
g m
id-s
tream
cr
ossw
alks
will
forc
e pe
dest
rians
to c
ross
at 2
sign
aliz
ed
inte
rsec
tions
thus
elim
inat
ing
dela
ys o
n W
Sch
uste
r Ave
.
$210
,000
8
Tran
sit I
mpr
ovem
ents
New
Sun
Met
ro e
xpre
ss ro
utes
from
Low
er V
alle
y,
far E
ast a
nd N
orth
east
New
Min
er M
etro
Shu
ttle
rout
es
Prom
ote
mod
e sh
ift to
pub
lic tr
ansi
t. R
educ
e ov
eral
l co
nges
tion
and
need
for p
arki
ng. I
mpr
ove
over
all c
ampu
s co
nges
tion
and
qual
ity o
f life
for s
urro
undi
ng
neig
hbor
hood
s. N
ew c
ampu
s shu
ttles
will
pro
vide
stud
ents
ex
pres
s shu
ttle
serv
ice
to c
ampu
s fro
m p
erim
eter
and
rem
ote
park
ing
lots
.
$420
,000
per
bu
s (Su
n M
etro
) +
$672
,000
per
se
mes
ter
(Min
er M
etro
)
9
W U
nive
rsity
Ave
./Haw
thor
ne S
t Rea
lignm
ent
A
dd si
dew
alks
and
bik
e pa
ths
M
iner
Met
ro b
us st
ops
D
rop-
off l
ocat
ion
Prov
ide
addi
tiona
l lin
k to
ove
rall
cam
pus o
uter
loop
syst
em.
Prov
ide
stor
age
for b
us st
ops o
n in
terio
r of c
ampu
s and
pr
ovid
e dr
op-o
ff lo
catio
n on
eas
tern
por
tion
of c
ampu
s. N
ew
alig
nmen
t wou
ld re
duce
con
gest
ion
in th
e ho
spita
l/med
ical
di
stric
t.
$5,1
53,0
00
10
Clo
sure
of I
nner
Cam
pus
Im
prov
e si
dew
alks
and
bik
e pa
ths W
Sch
uste
r A
ve.,
Wig
gins
Rd.
Rou
ndab
outs
at W
Uni
vers
ity A
ve./W
iggi
ns R
d an
d W
Uni
vers
ity A
ve./H
awth
orne
St.
(new
ca
mpu
s ent
ranc
e re
alig
nmen
t)
Prov
ide
addi
tiona
l cap
acity
for p
edes
trian
tran
sitio
n be
twee
n cl
asse
s. En
cour
age
non-
mot
oriz
ed m
odes
of t
rans
porta
tion
and
prom
ote
a “P
edes
trian
Frie
ndly
” en
viro
nmen
t for
U
TEP.
Rou
ndab
outs
will
impr
ove
traff
ic fl
ow a
nd o
vera
ll ae
sthe
tics o
f inn
er U
TEP
cam
pus.
$692
,000
11
ITS
Impr
ovem
ents
Inst
all p
arki
ng g
uida
nce
syst
em (I
TS D
ecis
ion)
on
W S
chus
ter A
ve. o
ff-r
amps
for b
oth
the
east
and
w
estb
ound
dire
ctio
ns
Gui
danc
e sy
stem
will
pro
vide
stud
ents
with
adv
ance
d tra
vele
r inf
orm
atio
n (a
mou
nt o
f par
king
spac
es a
vaila
ble
in
exis
ting
and
prop
osed
gar
ages
). H
elp
redu
ce th
e am
ount
of
stud
ent v
ehic
le d
rivin
g/id
ling
whi
le se
arch
ing
for p
arki
ng.
Info
rmat
ion
can
also
be
post
ed o
n th
e in
tern
et, c
ell p
hone
s.
$933
,000
+
$50,
000
(ann
ual
mai
nten
ance
)
Tot
al c
apita
l cos
ts (e
xclu
des m
aint
enan
ce a
nd o
pera
tion)
$2
4,03
1,00
0
108

109
APPENDIX A – ENGLISH VERSION OF THE SURVEY
The University of Texas at El Paso (UTEP) and the Texas Transportation Institute (TTI) are conducting a study regarding transportation issues on the UTEP campus and its surrounding areas. The purpose of this survey is to know the transportation problems faced by students, faculty, and staff. The feedback will be helpful for UTEP, the City, and the Texas Department of Transportation (TxDOT) to plan for a better transportation system. We appreciate you spending the next few minutes to answer the following questions. 1. Which of the following best describes your status at UTEP?
a) Faculty b) Staff c) Student d) Visitor
2. In what part of the El Paso/Juarez or New Mexico area do you live?
a) West b) Central c) Northeast d) East e) Upper Valley f) Lower Valley g) Horizon City h) Juarez i) Other (please specify) ____________________________________________________
3. What is your most frequently used mode of transportation to UTEP?
a) Drive alone b) Carpool c) Drop-off d) Bus e) Bicycle f) Walking
4. What time do you normally arrive at UTEP?
Please specify_______________________________________________________________

110
5. If coming by car to UTEP, which route do you use most often?
a) I-10 (to Schuster Ave.) b) I-10 (to Porfirio Diaz St.) c) Yandell Dr. d) Mesa St. (to Glory Road) e) Mesa St. (to Rim Rd.) f) Mesa St. (to University Ave.) g) Mesa St. (to Sun Bowl Dr.) h) Mesa St. (to Schuster Ave.) i) Not applicable
6. How congested is the street you use when you arrive at UTEP?
a) Very congested b) Somewhat congested c) Occasionally congested d) Not congested e) Not applicable
7. Where do you usually park while at UTEP? (See map for reference.)
a) Academic Services Building Area (A) b) Inner Campus (B) c) Sun Bowl Parking Garage (C)

111
d) Along Sun Bowl Dr. (D) e) Memorial Gym Area (E) f) Between Don Haskins Center/Fitness Area (F) g) Mesa Street Business District East of Campus (G)
8. If riding the bus to UTEP, which bus stop do you most frequently use?
a) Mesa St./University Ave. b) Oregon St./University Ave. c) Schuster Ave./Hawthorne St. d) Oregon St./Robinson Ave. (Memorial Gym Area) e) Not applicable
9. If someone is dropping you off at UTEP, which location do you most frequently use?
a) The Union Building b) Burges Hall c) Academic Services Building d) Not applicable e) Other (Please specify) ________________________________________
10. After arriving on campus, how do you reach your final destination at UTEP?
a) Miner Metro (Shuttle Bus) b) Walk c) Bicycle d) Other
11. Do you use the same mode of transportation when you leave campus?
a) Yes b) No, explain _____________________________________________________________
12. Do you often walk more than 10 minutes between classes/meetings?
a) Yes b) No
13. Between classes/meetings on campus, what type of transportation do you most often use?
a) Walk b) Bicycle c) Miner Metro (Shuttle Bus) d) Drive

112
14. How often do you use the Miner Metro Shuttle Bus?
a) Never b) Seldom (less than once a week) c) About once a week d) More than once a week but not every school day e) Every school day
15. If you use the Miner Metro Shuttle Bus, please indicate your most frequently used origin and
destination.
a) Origin (parking lot or nearest building): ______________________________________ b) Destination (parking lot or nearest building): __________________________________ c) Not applicable
16. How can the Miner Metro Shuttle Bus service be improved?
__________________________________________________________________________ 17. In the future, UTEP may need to close part of the inner campus to traffic. The main campus
may be closed from the intersection of University Avenue to the Union Building, on Hawthorne Street from the Physical Sciences Building to Kerbey Avenue, and on Kerbey Avenue from the Psychology Building to the Education Building. See Map. Do you think that closing this area of campus would make it safer for walking and bicycling?
a) Yes b) No
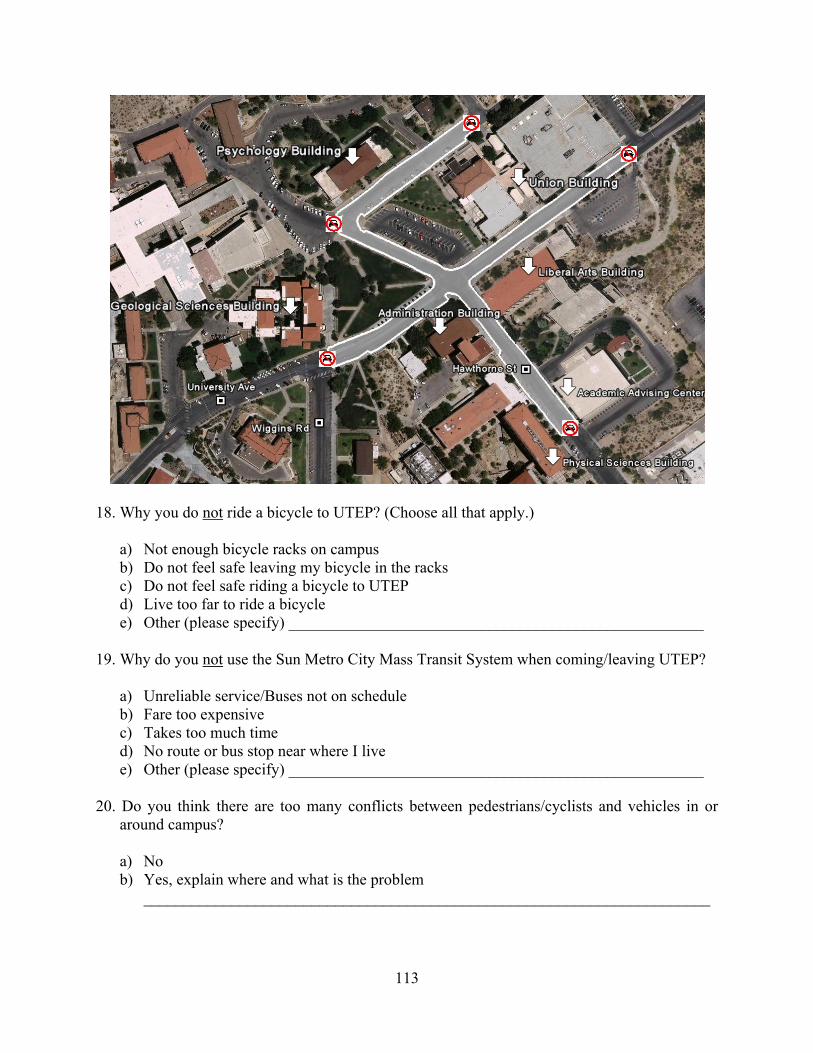
113
18. Why you do not ride a bicycle to UTEP? (Choose all that apply.)
a) Not enough bicycle racks on campus b) Do not feel safe leaving my bicycle in the racks c) Do not feel safe riding a bicycle to UTEP d) Live too far to ride a bicycle e) Other (please specify) ____________________________________________________
19. Why do you not use the Sun Metro City Mass Transit System when coming/leaving UTEP?
a) Unreliable service/Buses not on schedule b) Fare too expensive c) Takes too much time d) No route or bus stop near where I live e) Other (please specify) ____________________________________________________
20. Do you think there are too many conflicts between pedestrians/cyclists and vehicles in or
around campus?
a) No b) Yes, explain where and what is the problem
_______________________________________________________________________

114
21. Do you think there are traffic safety problems in and around UTEP?
a) No b) Yes, explain where and what is the problem
_______________________________________________________________________ 22. Any additional comments or suggestions?
Thank you for taking part in this survey!

115
APPENDIX B – SPANISH VERSION OF THE SURVEY
La Universidad de Texas en El Paso y el Instituto de Transporte de Texas están llevando a cabo un estudio acerca de los problemas de transporte que existen dentro del campus universitario y en los alrededores. El propósito de esta encuesta a realizar es el saber que tipos de problemas enfrentan los estudiantes, personal docente y personal laboral referente al área de transporte. La retroalimentación que se obtenga será de mucha ayuda para la universidad (UTEP), la ciudad de El Paso y el Departamento de Transporte de Texas (TxDOT) para poder planear un mejor sistema de transporte. Agradecemos su tiempo para contestar las siguientes preguntas. 1. ¿Cuál de las siguientes opciones lo describe?
a) Personal docente b) Personal laboral c) Estudiante d) Visitante
2. ¿En qué parte de El Paso/Cd. Juárez vive?
a) Lado oeste b) Centro c) Lado noreste d) Lado este e) Valle alto f) Valle bajo g) Horizon h) Juárez i) Otra área (por favor especifique) ____________________________________________
3. ¿Qué tipo de transporte usa frecuentemente para llegar a UTEP?
a) Maneja solo b) Comparte vehículo c) Lo dejan d) Camión (Sun Metro)s e) Bicicleta f) Caminar
4. ¿A qué hora normalmente llega a UTEP en los semestres de primavera y otoño?
Por favor especifique _______________________________________________________

116
5. ¿Si llega en carro, cual ruta usa normalmente para llegar a UTEP?
a) I-10 (Schuster) b) I-10 (Porfirio) c) Yandell d) Mesa (Glory Road) e) Mesa (Rim) f) Mesa (University) g) Mesa (Sun Bowl Dr.) h) Mesa (Schuster) i) No aplica
6. ¿Qué tan congestionada esta la ruta que toma para llegar a UTEP?
a) Muy congestionada b) Mas o menos congestionada c) Ocasionalmente congestionada d) No se cogestiona e) No aplica
7. ¿Donde se estaciona usualmente en UTEP? (Ver mapa para referencia)
a) Por el Academic Services Building (A) b) Dentro del campus (B) c) Parking Garage (C) d) Sun Bowl (D) e) Memorial Gym (E)

117
f) Por Don Haskins/Gimnasio (F) g) Calles aledañas al este del campus (G) h) No aplica
8. ¿Si toma el camión (Sun Metro) para llegar a UTEP, donde se baja regularmente?
a) Mesa y University b) Oregon y University c) Schuster y Hawthorne d) Oregon y Robinson (Memorial Gym) e) No aplica
9. ¿Si alguien lo deja en UTEP, en donde normalmente lo dejan?
a) Unión b) Burges Hall c) Academic Services Building d) No aplica e) Otra área (Por favor especifique) ____________________________________________
10. ¿Después de estacionarse ó que lo hayan dejado ó haberse bajado del camión (Sun Metro),
como llega a su destino final en UTEP?
a) Miner Metro (camión proporcionado por UTEP) b) Caminando c) En bicicleta
11. ¿Se va del campus de la misma manera en que llegó?
a) Si b) No,
explique _____________________________________________________________ 12. ¿Normalmente tiene que caminar más de 10 minutos para ir de una clase a otra?
a) Si b) No
13. ¿Entre clases ó juntas en el campus, que tipo de transporte usa normalmente?
a) Camina b) Bicicleta c) Miner metro (camión proporcionado por UTEP) d) Maneja
14. ¿Qué tan seguido usa Miner Metro?

118
a) Nunca b) Rara vez (de vez en cuando, una vez o menos por semana) c) Mas o menos una vez por semana d) Más de una vez por semana pero no todos los días e) Todos los días
15. Si usted usa Miner Metro para llegar al campus, por favor indique normalmente su punto de
origen y destino (donde lo toma y en donde se baja regularmente).
a) Origen (estacionamiento ó edificio más cercano): _______________________________ b) Destino (estacionamiento ó edificio más cercano): ______________________________ c) No aplica
16. ¿Cómo cree que el servicio dado por Miner Metro puede ser mejorado? Comentarios ___________________________________________ 17. En un futuro, UTEP podría verse obligado a cerrar algunas calles del campus (alrededor de la
intersección de la avenida Universidad y la calle Hawthorne) al tráfico vehicular. ¿Usted piensa que con esto sería más seguro caminar y andar en bicicleta? (Ver mapa para saber qué calles se piensan cerrar)
a) Si b) No

119
18. ¿Porque no viene en bicicleta a UTEP? (Escoja cuantas opciones crea sean necesarias)
a) No hay suficientes plataformas para amarrar la bicicleta en el campus b) No me siento seguro al dejar mi bicicleta amarrada en alguna de las plataformas c) No me siento seguro andando en bicicleta para llegar a UTEP d) Vivo muy lejos para andar en bicicleta e) Otra razón (por favor especifique) ___________________________________________
19. ¿Porque no toma algún camión de Sun Metro para llegar ó irse de UTEP?
a) El servicio proporcionado no es muy confiable ó no es puntual b) La tarifa que cobran es muy cara c) Me toma mucho tiempo d) No hay ruta ó parada cerca de donde vivo e) Otra razón (especifique) __________________________________________________
20. ¿Usted piensa que hay bastantes conflictos entre los peatones ó gente que anda en bicicleta y
los vehículos dentro y alrededor del campus?
a) No b) Si, explique donde y cuál es el problema
_______________________________________________________________________ 21. ¿Usted piensa que hay un problema de seguridad debido al tráfico dentro y alrededor de
UTEP?
a) No b) Si, explique donde y cuál es el problema
______________________________________________________________________ 22. ¿Algún comentario adicional ó sugerencias?
¡Gracias por tomar parte de esta encuesta!


121
APPENDIX C – ANALYSIS OF SUN BOWL AND UNIVERSITY AVENUE INTERSECTION
The UTEP campus master plan had this intersection designed for a dual-lane roundabout. Simulation results showed heavy vehicle interactions from both Sun Bowl northbound and the proposed new campus entrance. TTI researchers analyzed the intersection more carefully, utilizing the Federal Highway Administrations (FHWA) Roundabouts: An Informational Guide7. Under these guidelines, researchers were able to better assess circulatory flow out of the roundabout. Figure 73 depicts the circulatory flow (veh/h) given the maximum entry flow rate.
Figure 73. Capacity Comparison of Single and Double Lane Roundabouts. The number of lanes and the size of the diameter of the roundabout have a significant effect on circulatory flow. The proposed roundabout at the intersection of Sun Bowl Dr. and University Ave. can be considered an “Urban Compact Roundabout” as defined by FHWA. Utilizing existing data, the team determined that the maximum entry flow rate to be approximately 1100 – 1200 veh/h. The researchers also simulated the Sun Bowl Dr. corridor in micro-simulation using both signalized and roundabout for traffic control at the Sun Bowl Dr./University Ave. intersection. Different measures-of-effectiveness (MOEs) including queue length, travel time, and delay were used to analyze the performance of both traffic control scenarios. Queue length was measured on Sun Bowl Dr. (northbound) from the stop line and on the new campus entrance (eastbound) as shown in Figure 74. Measurements were taken every 60 seconds during the simulation for both campus entrances and compiled to graphical format as shown in Figure 75. The queue length for the roundabout was considerably longer on Sun Bowl Dr. as compared to the signalized scenario. Vehicles entering a roundabout must yield to vehicles already traveling
7 http://www.tfhrc.gov/safety/00068.htm

122
inside the circle. This becomes apparent when vehicles yield to opposing traffic approaching from their left. Since the Sun Bowl Dr. (northbound) and new campus entrance (eastbound) are the two dominant flows of traffic, the new campus entrance dominates the flow of traffic into the roundabout and vehicle queuing on Sun Bowl Dr. grows as vehicles wait for adequate gap time. The signalized intersection has defined green time for all approaches and therefore promotes a more balance flow of traffic through the intersection and therefore queue length in heavy flow approaches is reduced as compared to the roundabout scenario.
Figure 74. Queue Measurement Locations.
Figure 75. Simulation Results - Queue Length.
0
200
400
600
800
1000
1200
0 900 1800 2700 3600
Queue (ft)
Time (sec)
Queue LengthSun Bowl Dr
Roundabout Signalized
0
100
200
300
400
500
0 900 1800 2700 3600
Queue (ft)
Time (sec)
Queue LengthNew Entrance
Roundabout Signalized

123
Table 13. Average Queue Length (ft).
Sun Bowl Dr. New Entrance
Roundabout 416.54 81.08
Signalized 199.16 60.38
Delay and travel times were also measured from the microscopic simulation. Both MOEs were measured from the Schuster off-ramp to Sun Bowl Dr. north of the University Ave. intersection (i.e., in front of the new bookstore) as shown in Figure 76. The simulation model takes into account both the Sun Bowl Dr. path and the newly constructed campus entrance and averages both delay and travel times every 60 seconds until the end of the simulation. The simulation outputs for both MOEs are shown in Figure 77 and Figure 78 respectively.
Figure 76. Delay and Travel Time Measurement Locations.

124
Figure 77. Simulation Results – Delay.
Figure 78. Simulation Results – Travel Time.
The results of the simulation model showed that the average delay per vehicle was 37.3 seconds for the roundabout and 50.7 seconds for the signalized intersection. The signalized intersection had a higher delay time per vehicle due to the green time per cycle length associated with a signalized intersection. Even though the average delay was lower for the roundabout, it had periods of fluctuation ranging from less than 10 seconds per vehicle to as high as over 140
020406080
100120140160
0 900 1800 2700 3600
Delay (sec/veh)
Time (sec)
Delay
Roundabout Signalized
94.86
99.89
92.00
93.00
94.00
95.00
96.00
97.00
98.00
99.00
100.00
101.00
Roundabout Signalized
Average Travel Time
Travel Time (sec)

125
seconds per vehicle. The average travel time for the roundabout was also slightly lower (< 6 sec) as compared to the signalized intersection. The conclusions from the simulation models showed that signalized intersections promoted a balanced flow of traffic through the intersection with the queue lengths shorter from both the Sun Bowl Dr. (northbound) and new campus entrance (eastbound) approaches. The roundabout model scenario had a lower delay per vehicle for the entire simulation but had fluctuations ranging from less than 10 seconds to as high as 140 seconds. These unbalanced flows of traffic where there are higher accelerations and decelerations can create higher risks of rear-end collisions. The average travel time was only 6 seconds more per vehicle for the signalized intersection as compared to the roundabout.

Copyright © 2022 FDOKUMEN