Marine Transportation System Performance Measures ...
31
Marine Transportation System Performance Measures & Waterway Travel Time Estimates Transportation Research Board Webinar Recorded November 9, 2015 Marin Kress U.S. Committee on the Marine Transportation System, contractor & Dr. Patricia DiJoseph Coastal & Hydraulics Lab, U.S. Army Engineer Research and Development Center
-
Upload
khangminh22 -
Category
Documents
-
view
0 -
download
0
Transcript of Marine Transportation System Performance Measures ...

Marine Transportation System Performance Measures &
Waterway Travel Time Estimates Transportation Research Board Webinar
Recorded November 9, 2015
Marin Kress U.S. Committee on the Marine Transportation System, contractor
& Dr. Patricia DiJoseph
Coastal & Hydraulics Lab, U.S. Army Engineer Research and Development Center

LEARNING OBJECTIVES • Locate and access relevant
marine transportation system data to perform their own analysis
• Summarize the current performance of the overall marine transportation system in selected categories
• Demonstrate the application of Automatic Identification System (AIS) data to estimate waterway transit times
Marine Transportation System Performance Measures (Marin Kress)
• Summary of agencies that manage and provide data about the marine transportation system
• Data sources discovered and available to the general public
• Summary of current MTS performance assessment across different categories: economic benefits, safety and security, capacity and reliability, environmental stewardship, and resilience
• Next steps for future research, available publications and products from this work
Waterway Transit Time Estimates Using Archived Data (Patricia DiJoseph)
• Description of Automatic Information System (AIS) data
• Method for developing waterway transit time estimates
• Case study results
• Other applications / future research in this area
Outline & Learning Objectives
2
OUTLINE

Marine Transportation System Performance Measures Research Marin Kress
3
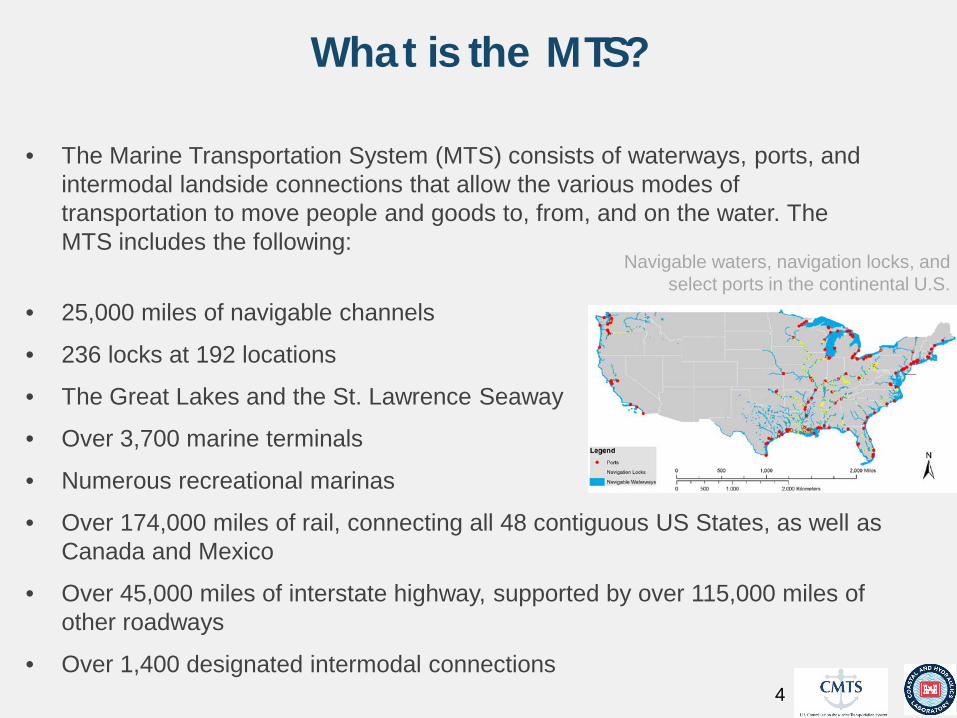
What is the MTS?
• The Marine Transportation System (MTS) consists of waterways, ports, and intermodal landside connections that allow the various modes of transportation to move people and goods to, from, and on the water. The MTS includes the following:
• 25,000 miles of navigable channels
• 236 locks at 192 locations
• The Great Lakes and the St. Lawrence Seaway
• Over 3,700 marine terminals
• Numerous recreational marinas
• Over 174,000 miles of rail, connecting all 48 contiguous US States, as well as Canada and Mexico
• Over 45,000 miles of interstate highway, supported by over 115,000 miles of other roadways
• Over 1,400 designated intermodal connections
Navigable waters, navigation locks, and select ports in the continental U.S.
4

Study Motivation
• The CMTS is a Federal effort to coordinate the myriad partners involved in the MTS. Chaired by the Secretary of Transportation, the CMTS is tasked with ensuring the development and implementation of national MTS policies consistent with national needs and to report to the President its views and recommendations for improving the MTS.
• The USACE Navigation Mission facilitates the safe, reliable, and economically efficient movement of vessels on the nation’s waterways
• Waterborne transport is a major mode of transportation, serving both
recreational and commercial users
• Multiple MTS stakeholders have an interest in quantifying MTS performance to support informed decision-making
5

GPRA Modernization Act
of 2010 Public Law 111-352
TRB-CMTS Conference
Diagnosing the MTS: Measuring
Performance & Targeting Improvement
June 2012 Washington, D.C.
2008 2009 2010 2011 2012 2013 2014 2015
TRB-CMTS Conference Innovative
Technologies for a Resilient MTS
June 2014 Washington, D.C.
Timeline of Select Publications Related to Performance Measures
6
6
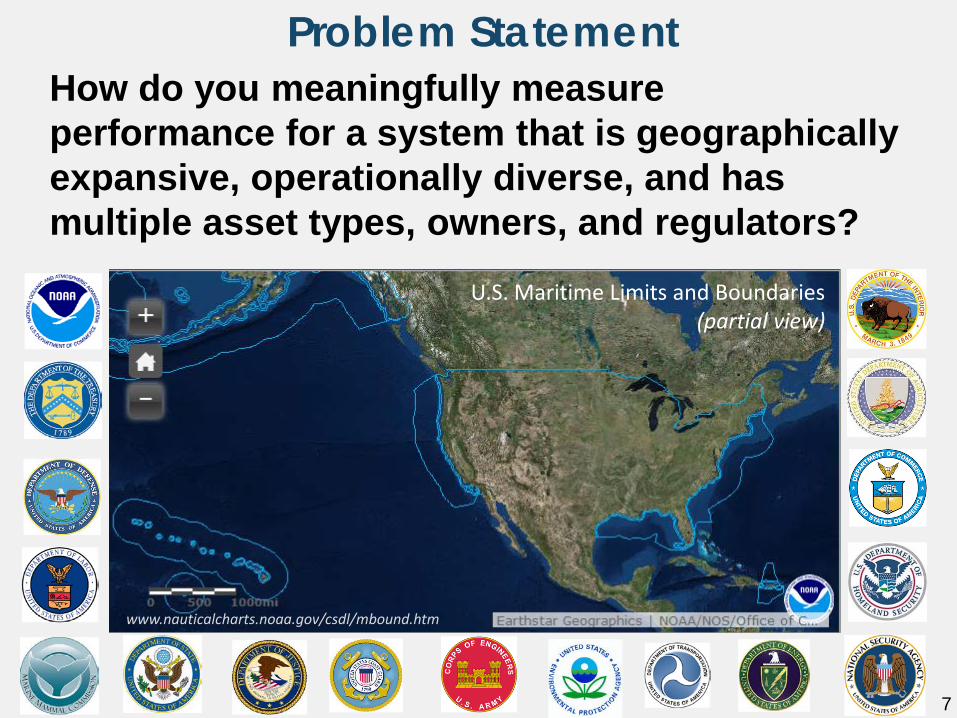
How do you meaningfully measure performance for a system that is geographically expansive, operationally diverse, and has multiple asset types, owners, and regulators?
www.nauticalcharts.noaa.gov/csdl/mbound.htm
U.S. Maritime Limits and Boundaries (partial view)
7
Problem Statement

Performance Measure Categories
• Economic Benefits
• Capacity & Reliability
• Safety & Security
• Environmental Stewardship
• Resilience
Performance Measure Data Requirements
• Authoritative
• National scale
• Publicly available
• Regularly collected
Categories Development Sources
• Expert elicitation
• Feedback from TRB-CMTS
conferences
• PIANC 2010 report www.pianc.org/2872231836.php
8
Performance Measure Categories, Development Sources, and Data Requirements
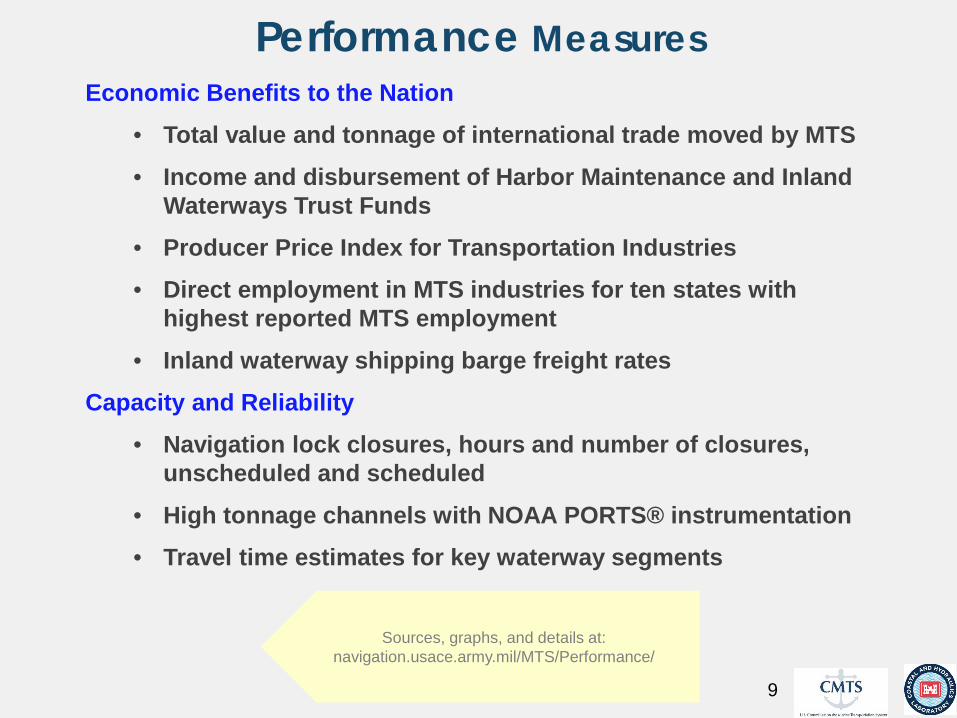
Economic Benefits to the Nation
• Total value and tonnage of international trade moved by MTS
• Income and disbursement of Harbor Maintenance and Inland Waterways Trust Funds
• Producer Price Index for Transportation Industries
• Direct employment in MTS industries for ten states with highest reported MTS employment
• Inland waterway shipping barge freight rates
Capacity and Reliability
• Navigation lock closures, hours and number of closures, unscheduled and scheduled
• High tonnage channels with NOAA PORTS® instrumentation
• Travel time estimates for key waterway segments
Sources, graphs, and details at: navigation.usace.army.mil/MTS/Performance/
9
Performance Measures

Safety and Security • Number of commercial vessel accidents (collisions, allisions, groundings)
• Number of commercial mariner and passenger casualties (personal injuries, deaths)
• Number of U.S. Coast Guard incident investigations
Environmental Stewardship • U.S. petroleum-based fuel sales to the maritime industry (diesel fuel, residual fuel)
• Vessel pollution incidents (petroleum and other types)
• Amount of dredged material reclaimed for beneficial use
• Number of reported whale strikes by vessels
Resilience • Physical condition ratings of critical coastal navigation infrastructure
• Age of federally owned and operated navigation locks
Sources, graphs, and details at: navigation.usace.army.mil/MTS/Performance/
10
Performance Measures - continued

11
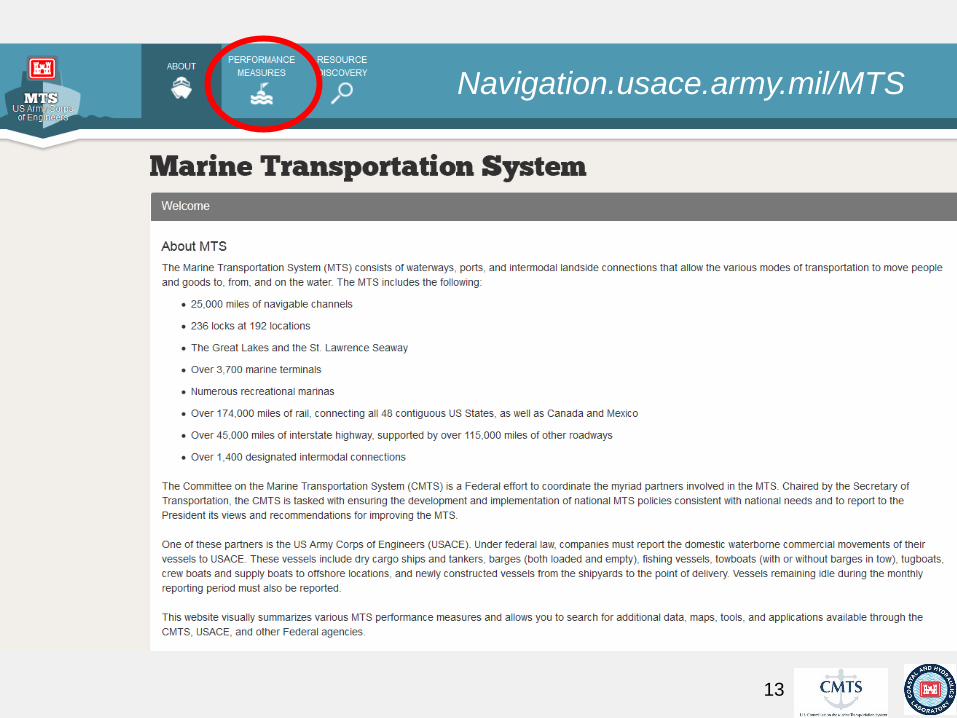
Performance measures website
• All MTS performance measures assembled have been published online
• Each performance measure includes a brief description and a graph to show changes over time
• Each graph includes the URL for the source data and other relevant information
• http://navigation.usace.army.mil [Marine Transportation System]
• Related information available through the same portal • Survey & Mapping • Systems Approaches

Navigation.usace.army.mil/DIF/Explore
12
13
13
Navigation.usace.army.mil/MTS

Navigation.usace.army.mil/MTS/Performance
Source Info 14

Navigation.usace.army.mil/MTS/Performance
15
15

Publically Available Technical Report
(in press)
Sample from Appendix 16

Future Work: Using Machine Readable Data Machine readable = format that can be understood by a computer
Original Served to Actively and Assemble Publish for data Internet automatically data and users across published in search for MTS data update graphics all disciplines machine- readable format
QA QC
This part of the update process can be automated, if machine-readable data is published by authoritative sources at the start. 17
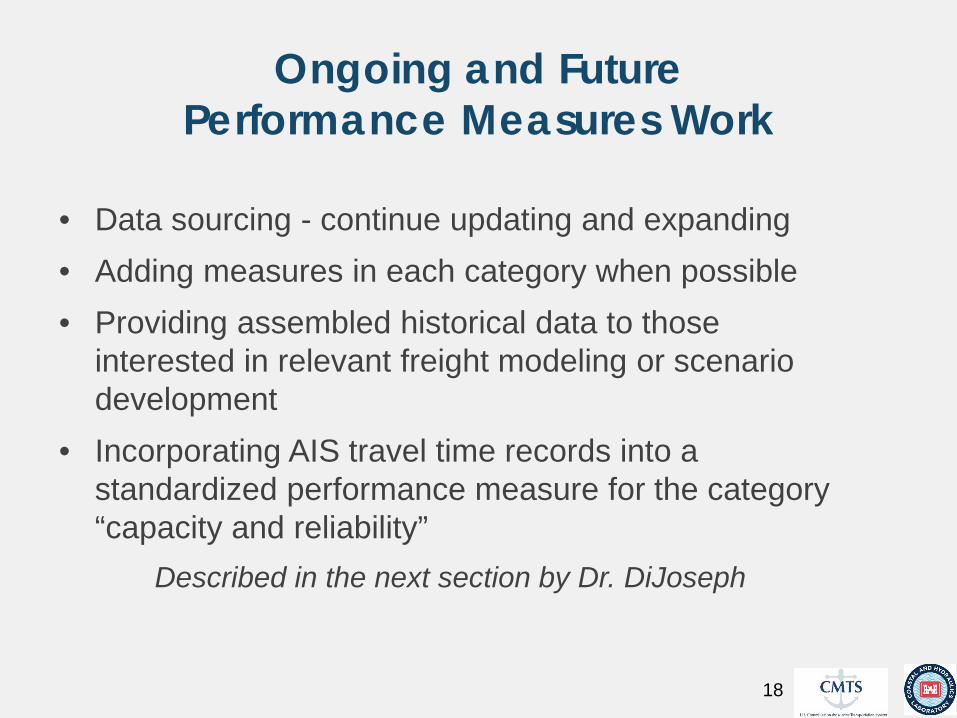
Ongoing and Future Performance Measures Work
• Data sourcing - continue updating and expanding • Adding measures in each category when possible • Providing assembled historical data to those
interested in relevant freight modeling or scenario development
• Incorporating AIS travel time records into a standardized performance measure for the category “capacity and reliability” Described in the next section by Dr. DiJoseph
18

Vessel Transit Time Statistics via Automatic Identification System (AIS) Data Patricia K. DiJoseph, PhD Coastal and Hydraulics Laboratory United States Army Engineer Research and Development Center
19
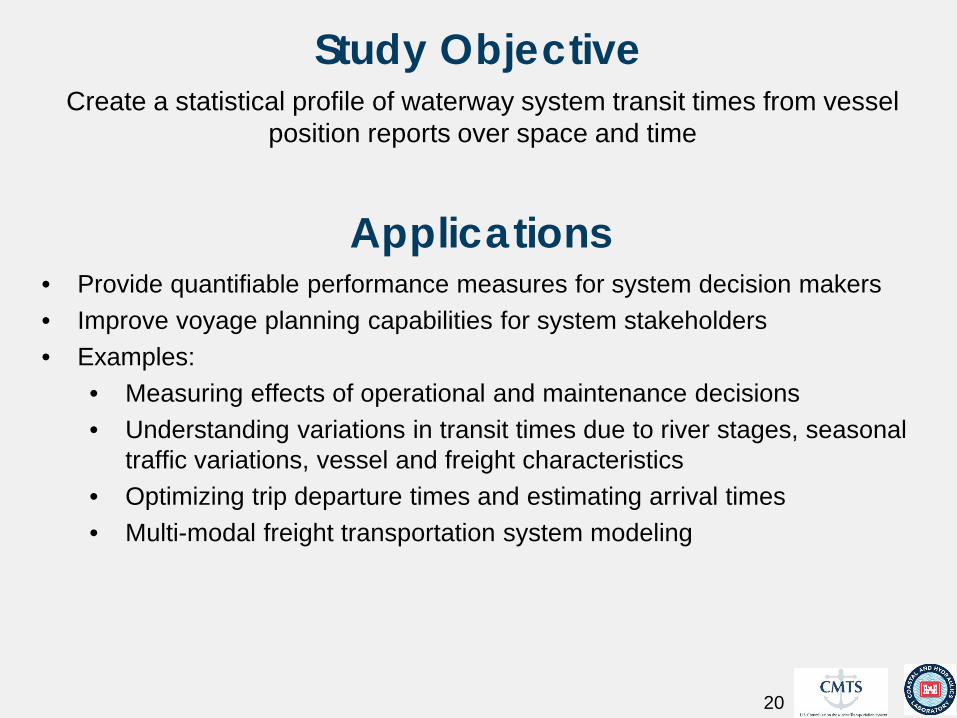
Study Objective Create a statistical profile of waterway system transit times from vessel
position reports over space and time
20
Applications • Provide quantifiable performance measures for system decision makers • Improve voyage planning capabilities for system stakeholders • Examples:
• Measuring effects of operational and maintenance decisions • Understanding variations in transit times due to river stages, seasonal
traffic variations, vessel and freight characteristics • Optimizing trip departure times and estimating arrival times • Multi-modal freight transportation system modeling

Automatic Identification System (AIS) Data • Vessels broadcast information via VHF radio
waves every 2-6 seconds: • Vessel identification • Location (longitude and latitude) • Time stamp • Heading • Speed • Vessel size characteristics
• Landside receivers collect the broadcasts • Broadcasts are stored in a database • Each broadcast is processed into a
readable record • Records are analyzed for navigation patterns
and travel time statistics
21

AIS Data Acquisition Options
• Personal data collection • USCG Navigation Center
• Government agency requestors: http://www.navcen.uscg.gov/?pageName=AISmain
• Private individual requestors: http://www.uscg.mil/foia/
• Commercial sources
22

Methodology to Estimate Individual Transit Times
1. Designate the waterway link 2. Geofence upstream and
downstream ends of the link 3. Determine the AIS records
corresponding to the geofence
4. Set the departure time equal to the time stamp of the last record in the upstream geofence
5. Set the arrival time equal to the time stamp of the first, subsequent record in the downstream geofence
6. Estimate travel time = arrival – departure time 7. Apply method for all vessels
and waterways of interest
1/13/2013 5:30 PM
23
1/13/2013 5:00 PM
Travel time = 30 minutes Red and blue dots are separate vessels
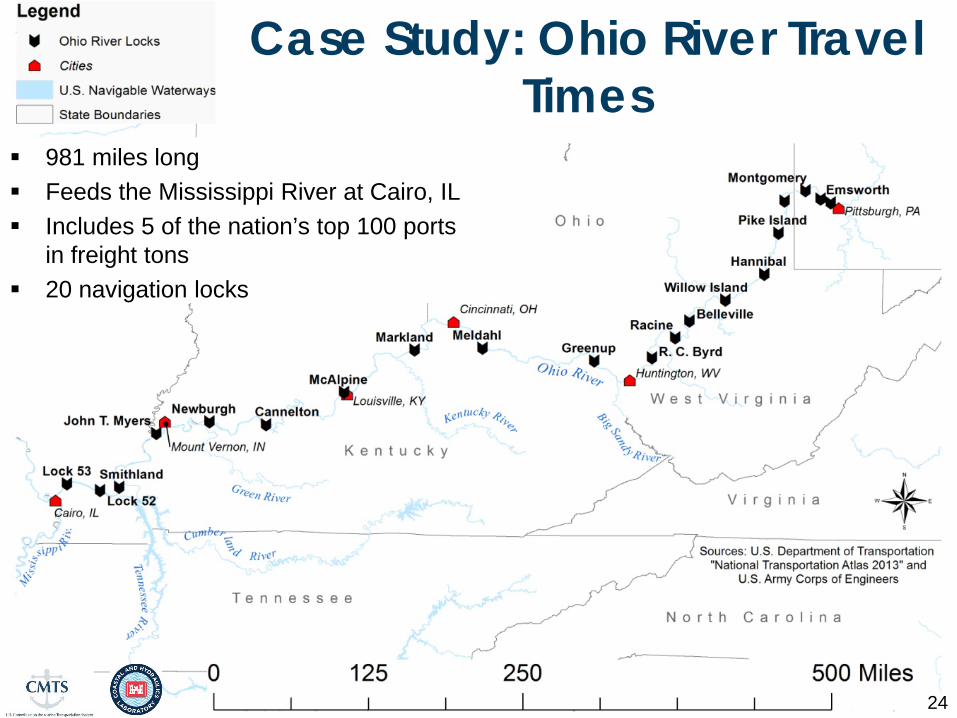
Case Study: Ohio River Travel Times
981 miles long Feeds the Mississippi River at Cairo, IL Includes 5 of the nation’s top 100 ports
in freight tons 20 navigation locks
24
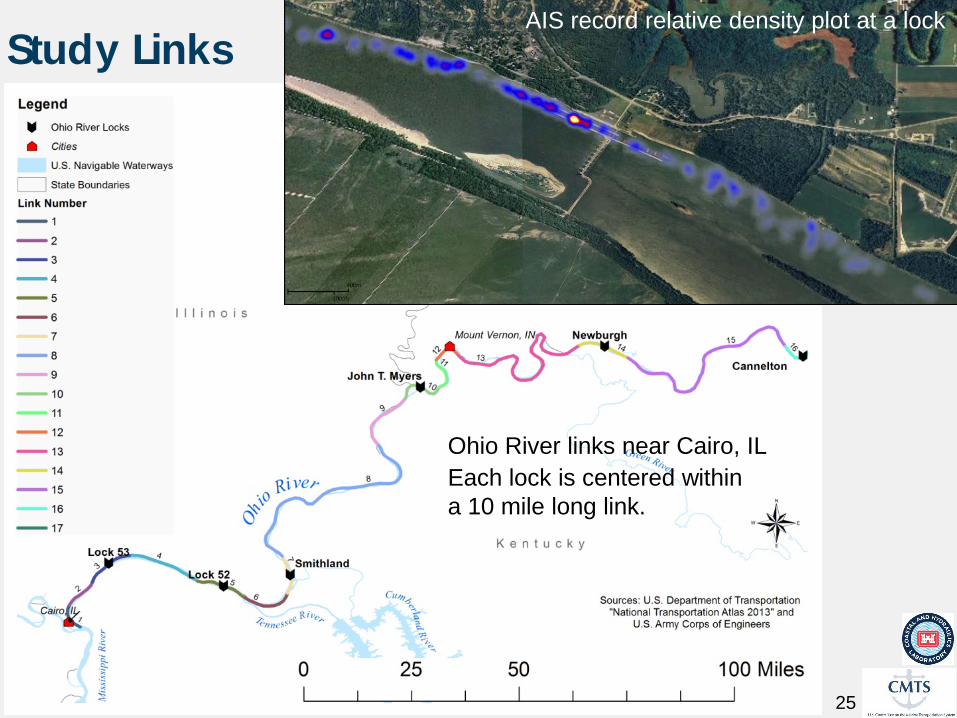
Study Links
Ohio River links near Cairo, IL Each lock is centered within a 10 mile long link.
AIS record relative density plot at a lock
25
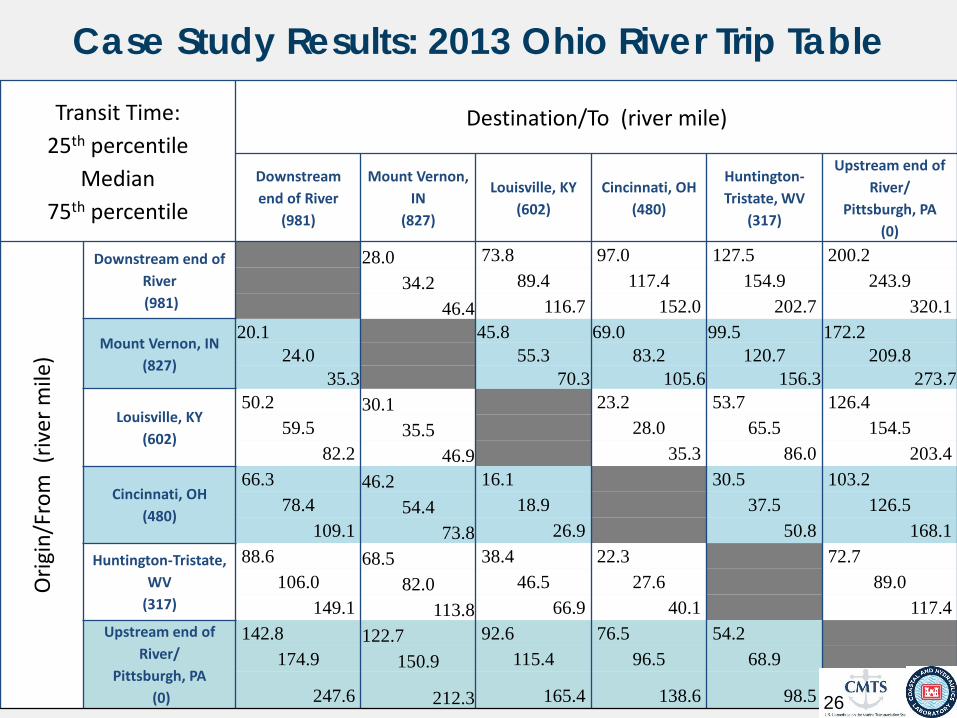
Transit Time: 25th percentile
Median 75th percentile
Destination/To (river mile)
Downstream end of River
(981)
Mount Vernon, IN
(827)
Louisville, KY (602)
Cincinnati, OH (480)
Huntington-Tristate, WV
(317)
Upstream end of River/
Pittsburgh, PA (0)
Orig
in/F
rom
(riv
er m
ile)
Downstream end of River (981)
28.0 73.8 97.0 127.5 200.2 34.2 89.4 117.4 154.9 243.9
46.4 116.7 152.0 202.7 320.1
Mount Vernon, IN (827)
20.1 45.8 69.0 99.5 172.2 24.0 55.3 83.2 120.7 209.8
35.3 70.3 105.6 156.3 273.7
Louisville, KY (602)
50.2 30.1 23.2 53.7 126.4 59.5 35.5 28.0 65.5 154.5
82.2 46.9 35.3 86.0 203.4
Cincinnati, OH (480)
66.3 46.2 16.1 30.5 103.2 78.4 54.4 18.9 37.5 126.5
109.1 73.8 26.9 50.8 168.1 Huntington-Tristate,
WV (317)
88.6 68.5 38.4 22.3 72.7 106.0 82.0 46.5 27.6 89.0
149.1 113.8 66.9 40.1 117.4 Upstream end of
River/ Pittsburgh, PA
(0)
142.8 122.7 92.6 76.5 54.2 174.9 150.9 115.4 96.5 68.9
247.6 212.3 165.4 138.6 98.5
Case Study Results: 2013 Ohio River Trip Table
26

Case Study Results: Cumulative Delay at Locks • For this study, delay is defined as any additional transit time above what is
expected under normal operating conditions • The 25th percentile transit time is applied as a proxy for the expected
transit time • Cumulative delay is the sum of individual transit delay over time
Cumulative Annual Downstream Delay by Date and
Lock, Ohio River, 2013 27
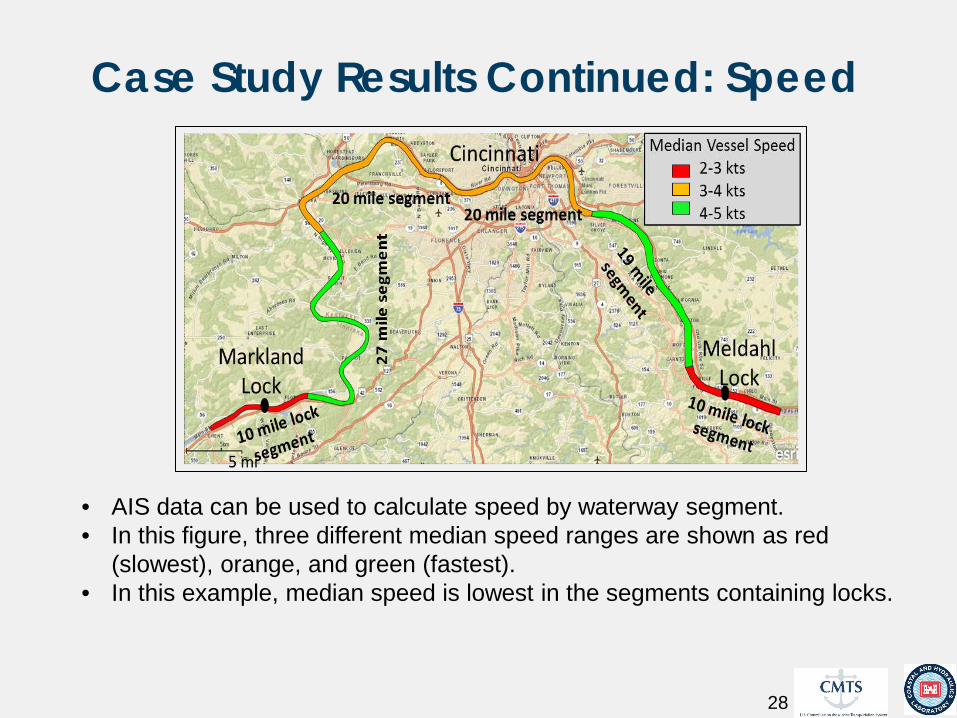
Case Study Results Continued: Speed
28
• AIS data can be used to calculate speed by waterway segment. • In this figure, three different median speed ranges are shown as red
(slowest), orange, and green (fastest). • In this example, median speed is lowest in the segments containing locks.

Additional AIS Applications
29
• Port connectivity, trip chaining, and port dwell time analysis
• Transit time variability by independent variable (e.g., water level, vessel type) research
• Vessel incident, collision, or grounding investigations
• Environmental studies

Conclusions
• MTS performance measures have been assembled and published. Future work will continue to incorporate new data when available
• AIS data can be used to calculate waterway transit times and results can be used for multiple applications
• Waterway transit time estimates can be published as part of future MTS performance measures work
30