A closer look : the 1982 World's Fair transportation system
252
HE 203 • A 5 , 6 no. 83-29 I © U.S. Department of Transportation July 1983 A Closer Look: The 1982 World’s Fair Transportation System^ Phase II Report
-
Upload
khangminh22 -
Category
Documents
-
view
2 -
download
0
Transcript of A closer look : the 1982 World's Fair transportation system
HE203• A5 ,
6
no.83-29
I
©U.S. Department of
Transportation
July 1983
A Closer Look:The 1982 World’s FairTransportation System^Phase II Report

I
2-0 3
4*z>
Ouo,
?3 'if A Closer Look:The 1962 World’s Fair
Transportation SystemPhase II Report
July 1983
department ofTR-* ‘Station
MAY 1 8 im
LIBRARY
Prepared by• The Knoxville-Knox County Metropolitan Planning
Commission• Barton-Aschman Associates, Inc.
• K-TRANS• City of Knoxville
Prepared for
Office of Planning Assistance
Urban Mass Transportation Administration
Washington, D.C. 20590
In Cooperation WithTechnology Sharing ProgramOffice of the Secretary of Transportation
DOT- 1-83-29
A CLOSER LOOK:THE 1982 WORLD'S FAIR TRANSPORTATION SYSTEMPHASE II REPORT
PROJECT STAFF
KNOXVILLE-KNOX COUNTY METROPOLITANPLANNING COMMISSION
Wayne Blasius, Project Manager / Co-Editor
Tamra Hipp, Co-Editor / Contributor
Rich Margiotta,
Transportation Planning Coordinator / Contributor
Keith Thelen, Consultant
Gary Lundy, Graphic Design
Kathryn B Rutherford, Graphics
Patricia Phillips, Graphics
Linda Upton, Typist
Melissa Faubert, Typist
BARTON-ASCHMAN ASSOCIATES, INC.
Brian S. Bochner
David R. Miller
M. Janet Reid
CITY OF KNOXVILLE
Samuel L. Parnell, Chief Traffic Engineer
K-TRANS
Jeffrey L. Gubitz, General Manager
Margo Hart
Derrick Lightfoot
David R. Peironnet
Martin B. Sennett
Melissa Trevathan
The preparation of this report was financed through an Urban Mass T ransportation Grant from the U S Department of Transportation under the provisions
of the Urban Mass Transportation Act of 1964 as amended and prepared in cooperation with the Tennessee Department of Transportation.
Project No TN-09-0051
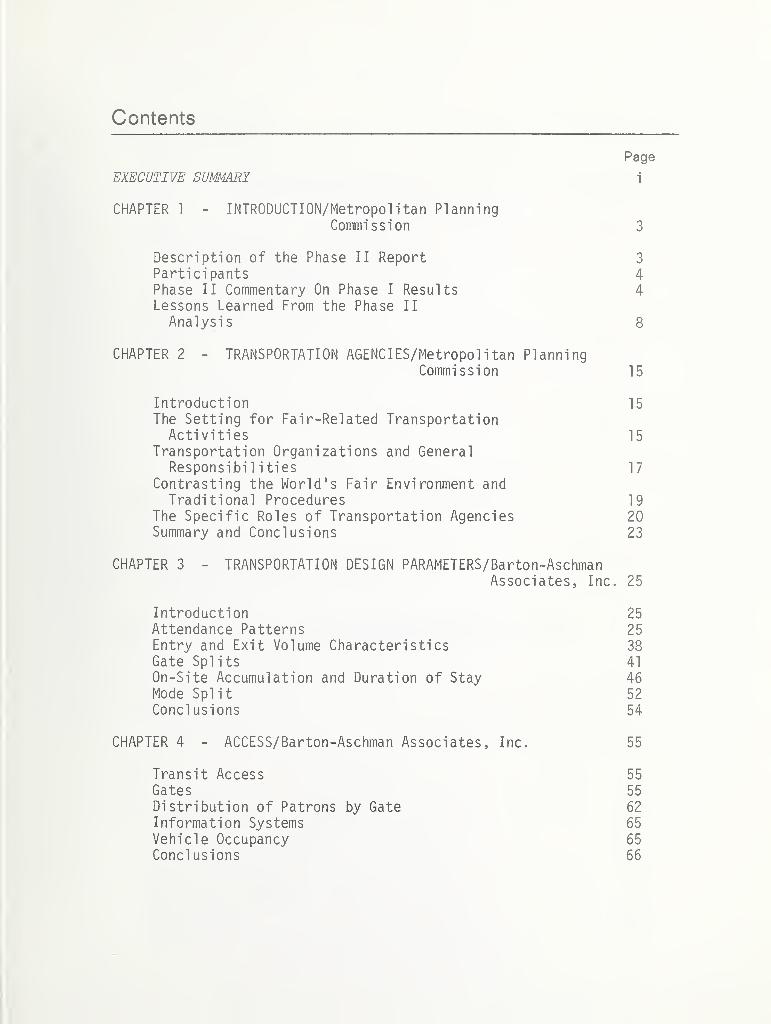
Contents
Page
EXECUTIVE SUMMARY i
CHAPTER 1 - INTRODUCTION/Metropol i tan PlanningCommission 3
Description of the Phase II Report 3
Participants 4
Phase II Commentary On Phase I Results 4
Lessons Learned From the Phase II
Analysis 8
CHAPTER 2 - TRANSPORTATION AGENCIES/Metropol i tan PlanningCommission 15
Introduction 15
The Setting for Fair-Related TransportationActivities 15
Transportation Organizations and GeneralResponsibilities 17
Contrasting the World's Fair Environment andTraditional Procedures 19
The Specific Roles of Transportation Agencies 20Summary and Conclusions 23
CHAPTER 3 - TRANSPORTATION DESIGN PARAMETERS/Barton-AschmanAssociates, Inc. 25
Introduction 25
Attendance Patterns 25Entry and Exit Volume Characteristics 38
Gate Splits 41
On-Site Accumulation and Duration of Stay 46
Mode Split 52
Conclusions 54
CHAPTER 4 - ACCESS/Barton-Aschman Associates, Inc. 55
Transit Access 55
Gates 55
Distribution of Patrons by Gate 62
Information Systems 65
Vehicle Occupancy 65Conclusions 66
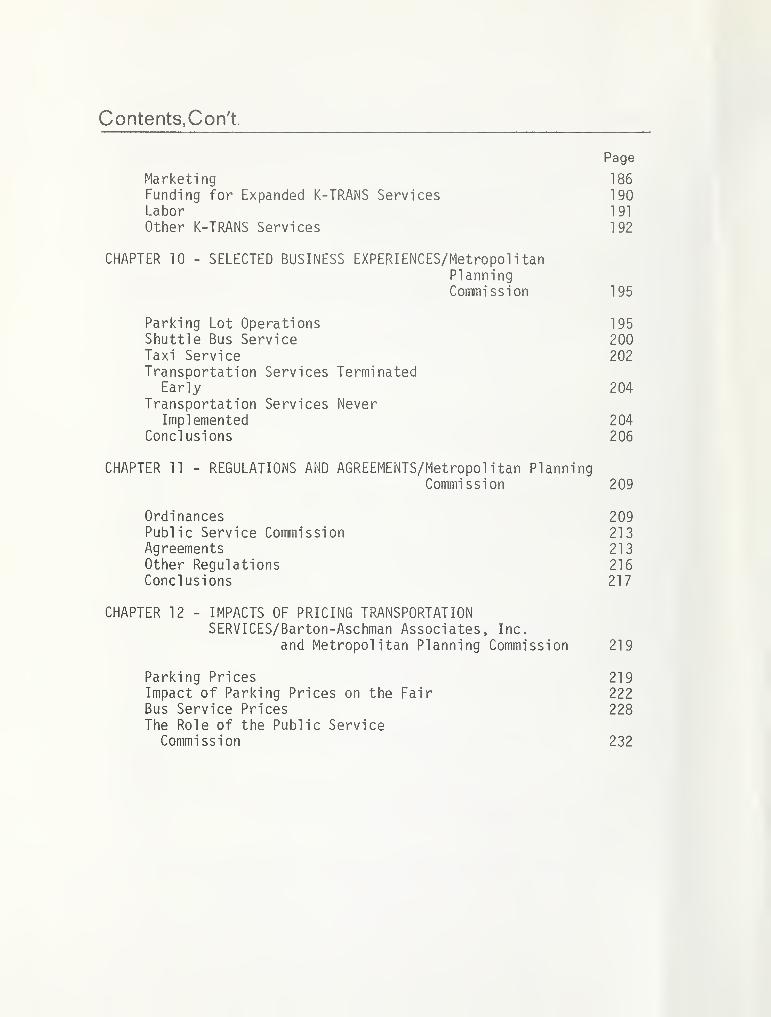
Contents, Con't.
Page
Marketing 186Funding for Expanded K-TRANS Services 190Labor 191
Other K-TRANS Services 192
CHAPTER 10 - SELECTED BUSINESS EXPERIENCES/Metropol i tan
PlanningCommission 195
Parking Lot Operations 195Shuttle Bus Service 200Taxi Service 202Transportation Services Terminated
Early 204Transportation Services Never
Implemented 204Conclusions 206
CHAPTER 11 - REGULATIONS AND AGREEMENTS/Metropol i tan PlanningCommission 209
Ordinances 209Public Service Commission 213Agreements 213Other Regulations 216Conclusions 217
CHAPTER 12 - IMPACTS OF PRICING TRANSPORTATIONSERVICES/Barton-Aschman Associates, Inc.
and Metropolitan Planning Commission 219
Parking Prices 219Impact of Parking Prices on the Fair 222Bus Service Prices 228The Role of the Public Service
Commission 232
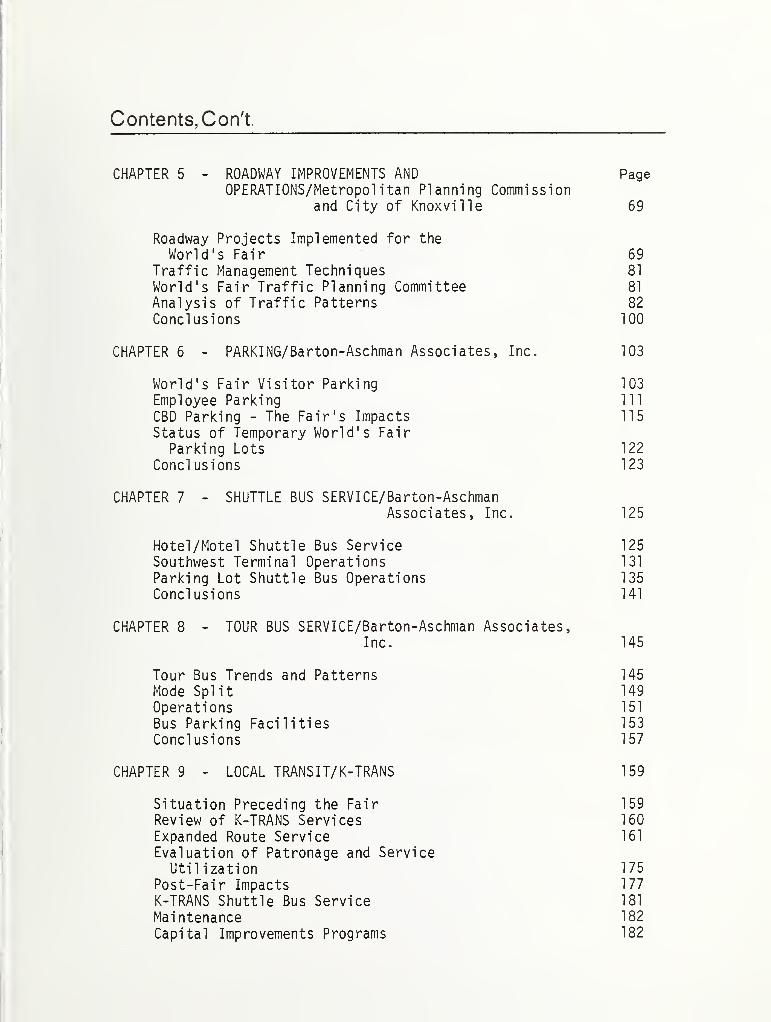
Contents, Con't.
CHAPTER 5 - ROADWAY IMPROVEMENTS AND PageOPERATIONS/Metropolitan Planning Commission
and City of Knoxville 69
Roadway Projects Implemented for the
World's Fair 69
Traffic Management Techniques 81
World's Fair Traffic Planning Committee 81
Analysis of Traffic Patterns 82
Conclusions 100
CHAPTER 6 - PARKING/Barton-Aschman Associates, Inc. 103
World's Fair Visitor Parking 103
Employee Parking 111
CBD Parking - The Fair's Impacts 115
Status of Temporary World's FairParking Lots 122
Conclusions 123
CHAPTER 7 - SHUTTLE BUS SERVICE/Barton-AschmanAssociates, Inc. 125
Hotel/Motel Shuttle Bus Service 125
Southwest Terminal Operations 131
Parking Lot Shuttle Bus Operations 135
Conclusions 141
CHAPTER 8 - TOUR BUS SERVICE/Barton-Aschman Associates,Inc. 145
Tour Bus Trends and Patterns 145
Mode Split 149
Operations 151
Bus Parking Facilities 153
Conclusions 157
CHAPTER 9 - LOCAL TRANS IT/ K-TRANS 159
Situation Preceding the Fair 159
Review of K-TRANS Services 160
Expanded Route Service 161
Evaluation of Patronage and ServiceUtilization 175
Post-Fair Impacts 177
K-TRANS Shuttle Bus Service 181
Maintenance 182
Capital Improvements Programs 182

Tables
Page
2-
1: Transportation Agencies and Functions 18
3-
1: Attendance Variations by Day-of-Week 333-2: Attendance Variations by Month 34
3-3: Attendance Planning and Design Day
Statistics 37
3-4: 1982 World's Fair Hourly AttendanceVolume Planning Estimates 42
3-5: Average Duration of Stay 47
3-
6: Estimated 1982 World's Fair VisitorMode Split 53
4-
1: Visitor Gates and Modes of Access 59
4-2: North Gate Inbound Maximum RecordedTurnstile Volumes 61
4-3: Projected and Actual Gate VisitorDistribution 63
4-
4: Changes in Gate Distribution by Season 64
5-
1: Summary of Transportation ProjectsImplemented for the World's Fair 71
5-2: Comparison of 1981 and 1982 KnoxvilleAccidents 97
5-3: Historical Accident Data for Knoxville 98
5-
4: Weekday Traffic Increases AcrossSelected Cordons During the Fair 100
6-
1: Visitor Parking Supply by Area-Weekday 1046-2: Permits Sold for World's Fair Employee
Parking Lots 114
6-
3: CBD Parking Space Increase as a Resultof World ' s Fair 1 1
9
7-
1: Trailways Gatl inburg/Pigeon ForgeService 130
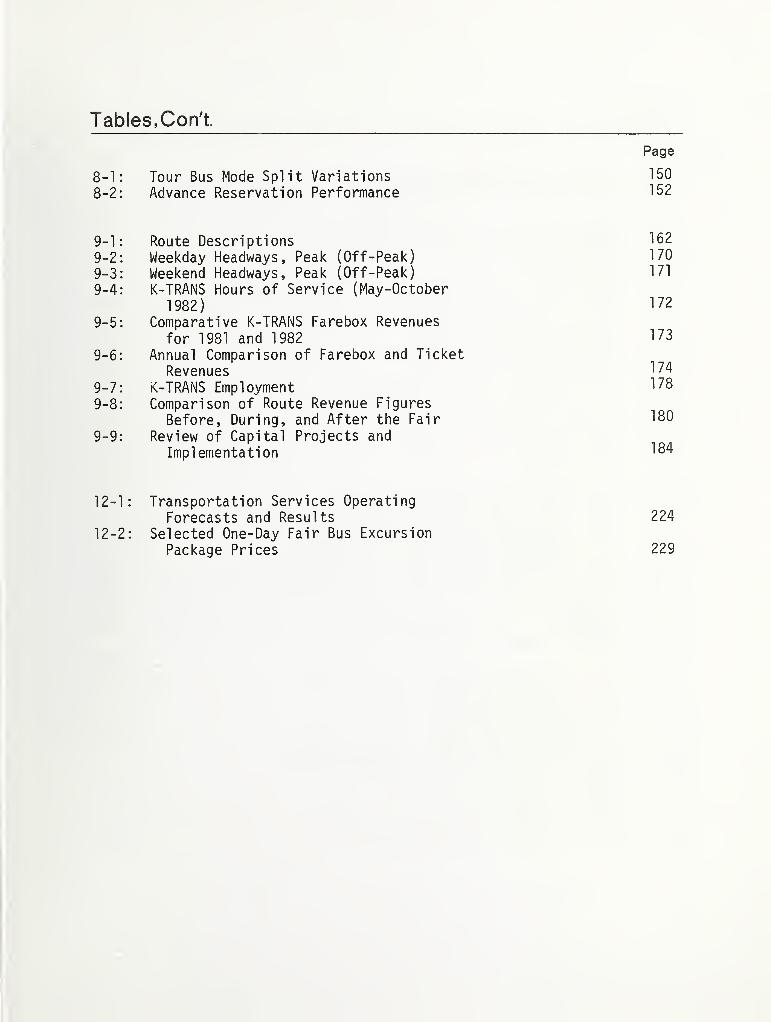
Tables, Con't.
Page
8-1: Tour Bus Mode Split Variations 150
8-2: Advance Reservation Performance 152
9-1: Route Descriptions 162
9-2: Weekday Headways, Peak (Off-Peak) 170
9-3: Weekend Headways, Peak (Off-Peak) 171
9-4: K-TRANS Hours of Service (May-October
1982) 172
9-5: Comparative K-TRANS Farebox Revenues
for 1981 and 1982 173
9-6: Annual Comparison of Farebox and TicketRevenues 174
9-7: K-TRANS Employment I 78
9-8: Comparison of Route Revenue FiguresBefore, During, and After the Fair 180
9-9: Review of Capital Projects and
Implementation 184
12-1: Transportation Services OperatingForecasts and Results 224
12-2: Selected One-Day Fair Bus ExcursionPackage Prices 229
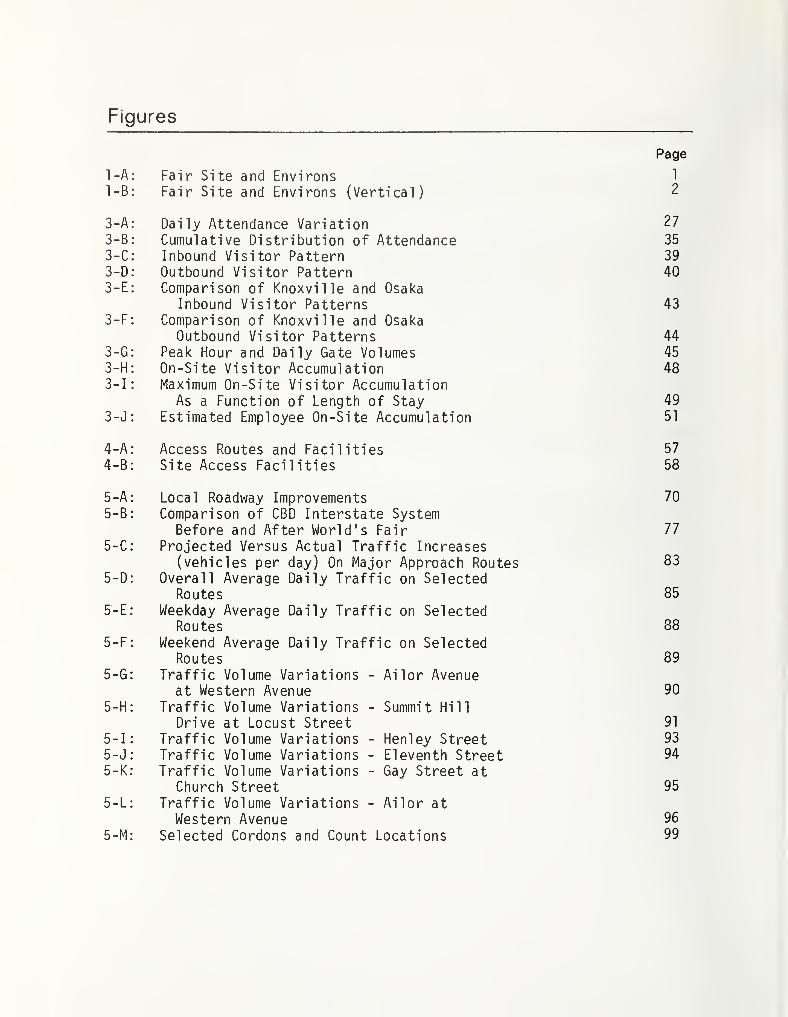
Figures
Page
1 -A : Fair Site and Environs 1
1-B: Fair Site and Environs (Vertical) 2
3-A: Daily Attendance Variation 27
3-B: Cumulative Distribution of Attendance 35
3-C: Inbound Visitor Pattern 39
3-D: Outbound Visitor Pattern 403-E: Comparison of Knoxville and Osaka
Inbound Visitor Patterns 43
3-F: Comparison of Knoxville and OsakaOutbound Visitor Patterns 44
3-G: Peak Hour and Daily Gate Volumes 45
3-H: On-Site Visitor Accumulation 483-1: Maximum On-Site Visitor Accumulation
As a Function of Length of Stay 49
3-
J: Estimated Employee On-Site Accumulation 51
4-
A: Access Routes and Facilities 57
4-
B: Site Access Facilities 58
5-
A: Local Roadway Improvements 70
5-B: Comparison of CBD Interstate SystemBefore and After World's Fair 77
5-C: Projected Versus Actual Traffic Increases(vehicles per day) On Major Approach Routes 83
5-D: Overall Average Daily Traffic on SelectedRoutes 85
5-E: Weekday Average Daily Traffic on SelectedRoutes 88
5-F: Weekend Average Daily Traffic on SelectedRoutes 89
5-G: Traffic Volume Variations - Ailor Avenueat Western Avenue 90
5-H: Traffic Volume Variations - Summit HillDrive at Locust Street 91
5-1: Traffic Volume Variations - Henley Street 93
5-J: Traffic Volume Variations - Eleventh Street 94
5-K: Traffic Volume Variations - Gay Street atChurch Street 95
5-L: Traffic Volume Variations - Ailor atWestern Avenue 96
5-M: Selected Cordons and Count Locations 99
Figures,Con't.
6-A: Proportional Distribution of WeekdayVisitor Parking 106
6-B: Numerical Distribution of WeekdayVisitor Parking, May 10, 1982 108
6-C: Weekday Visitor Parking SpaceUtilization May 10, 1982 109
6-D: Inbound and Outbound Movement fromEmployee Remote Lot 112
6-E: Additional Available Parking SpaceResulting from the Fair 116
6-
F: Changes in CBD Parking Fees 118
7-
A: Inbound Shuttle Bus Riders 1287-B: Outbound Shuttle Bus Riders 1297-C: Southwest Shuttle Bus Terminal 1327-D: Locust Street Shuttle Bus Terminal 1367-E: Inbound Shuttle Bus Ridership Pattern 1397-F: Outbound Shuttle Bus Ridership Pattern 140
7-
G: Parking as a Function of Attendance 142
8-
A: Distribution of Daily Tour Bus Volumes 1468-B: Tour Bus Trends by Season 148
8-
C: Bus Parking/Terminal Concepts 156
9-
A: UT/Ft. Sanders Hospital’s Route Revision 165
9-B: Westhaven Route Revision 166
9-C: College Street Route Revision 167
9-D: Sutherland Avenue Route Revision 168
9-E: Employee Overtime as a Percent of Total
Hours 169

EXECUTIVE SUMMARY
Each World's Fair is a unique event. Many of the lessonslearned in transportation planning are, however, transferableto other special events. The Urban Mass TransportationAdministration (UMTA) sponsored this study to identify andevaluate the experiences of the 1982 World's Fair in Knoxville.
In late 1982, key participants in transportation planning forthe Knoxville World's Fair cooperated in the development of an
overview analysis of the effort. The work resulted in the
1982 WORLD'S FAIR TRANSPORTATION SYSTEM EVALUATION - Phase I
report. The Phase I report was intended as a wide ranging,general analysis of the planning and results for transportationin and around the Fair.
Following the completion of that report the project staff beganon the Phase II report, to take advantage of all available dataand the time to collect and analyze it. While the purpose is
the same--to transfer the experiences here to other specialevents planners--this Phase II report is much more quantitativethan the earlier report. Because of the nature of the processthe resulting reports should be used together but yet are notmutually exclusive in their coverage. Generally, however, the
information provided here is either new or more detailed than
that in the Phase I report.
Topics covered in this report include: the involvement of trans-portation agencies, planning standards used in designing the
transportation system, functional components such as roadways,parking, and buses, regulations pertaining to services, and
the effects of the cost of the services. Each of these topicsare discussed in depth and conclusions drawn.
Chapter 1 lists lessons learned from the analysis of Phase II.
These cover: organization, planning, access, parking, transit,tour and shuttle buses, market forces, and regulations and
agreements. Due to the extensive data collection and analysis,there are 45 lessons learned as opposed to the 9 lessonslearned in the Phase I report.


FAIR SITE AND ENVIRONS
FIGURE I -A
1
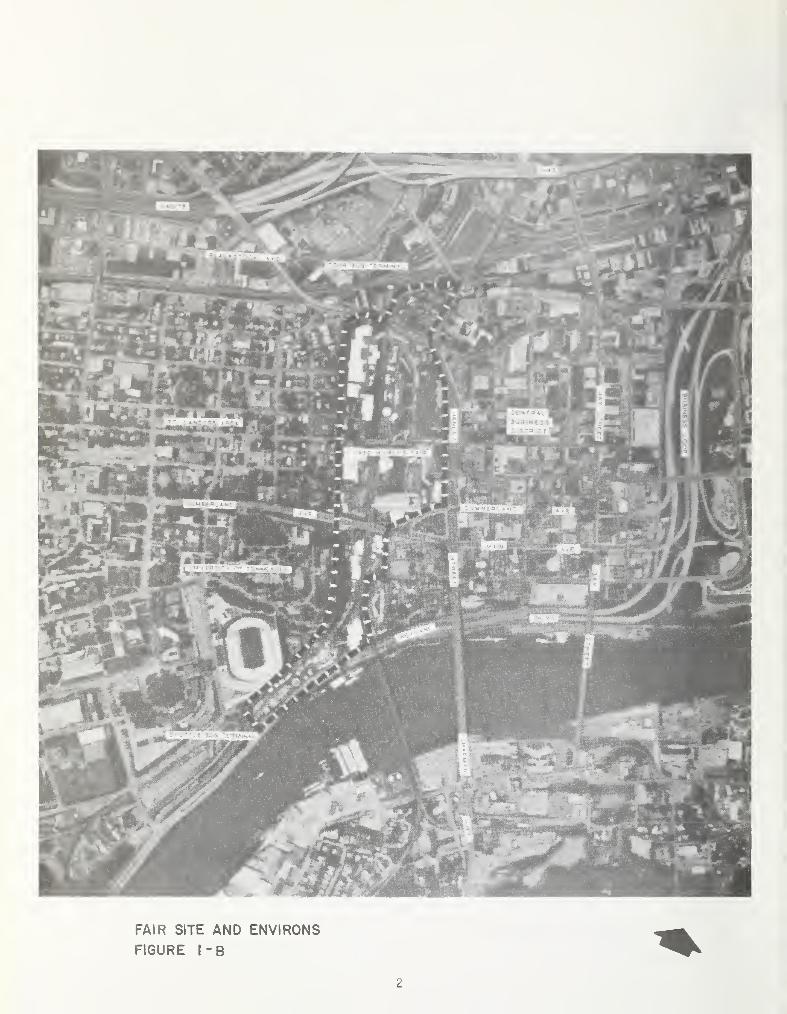
FAIR SITE AND ENVIRONS
FIGURE l-B
2
OOP
Chapter One:
INTRODUCTION AND LESSONS-LEARNED
The "Lessons Learned" and overall results of Phase I of thisevaluation were relatively general, process and organization-oriented, and based predominantly on experiences related by Fairplanners and government officials. The intention of the Phase II
analysis was to provide quantified verification or modification of
those conclusions and augment them with additional lessons broughtto light through further research from a post-Fair perspective.The deeper analysis carried out during Phase II did indeed coveradditional and more detailed conclusions, and provide furtherinformation on the Phase I conclusions.
As described in the Phase I report this study was commissioned by
the Urban Mass Transportation Administration to broaden theKnowledge available on transportation planning and operations for
use in future major events. Therefore, a goal throughout thisevaluation has been to identify especially those issues andfindings that are transferable to other localities and events,under various circumstances.
DESCRIPTION OF THE PHASE II REPORT
The Phase II evaluation is intended to document and verify or
refute the findings of Phase I based on analysis of more completedata. The array of topics covered in this report is somewhatnarrower than in Phase I. A limited number of completely newareas are included, as well. For the majority of the report in
which similar topics are covered, this report goes much furtherin data review. As you will see in reading the "Lessons Learned"portion of this chapter, the Phase II evaluation substantiatedmany of the earlier report's conclusions. In many other cases,however, deeper analysis led to conclusions and/or lessonslearned which address considerably different issues or levels
of detail than those of the first report.
As planned the report covers a variety of topics. Several
different topics were added as we began work and realized thatthe original outline omitted some important points. The reportcovers: the relationships between transportation agencies, the
parameters used in planning for the Fair, parking, buses, roadwayimprovements and traffic considerations, regulatory and other
legal considerations, business experiences and pricing relatedimpacts.
3
PARTICIPANTS
The project staff for Phase II was virtually identical to that ofthe initial effort. Again the Knoxvi 1 1 e-Knox County MetropolitanPlanning Commission served in the role of project coordinator.Barton-Aschman Associates, Inc., K-TRANS (Knoxville's local tran-sit company), and Keith Thelen ( transportation planning coordina-tor for MPC during Fair planning), served as consultants,contributing various chapters to the report. The major authorshipfor each chapter is identified in the table of contents.
The most significant difference between Phase I and II in termsof participants is in the use of the project advisory committee.Due to the extremely short time frame allowed for completion ofPhase I it was necessary to cull information from those individualswho were actually involved in planning for the Fair. For thatpurpose, a committee of KIEE, local government officials andprivate consultants (see Phase I report for details) was formedto represent the major perspectives of those who actuallybrought about the Fair-related transportation system. Theirreported experiences and a series of additional interviews formedthe majority of the Phase I report information base. The PhaseII evaluation, as described, relied predominantly on the collec-tion and analysis of available data, and as such did not utilizethe committee directly.
Interviews, advice and other input by various individuals from the
committee are, however, an important part of this report. In
particular, thanks go to Ed Keen, formerly with KIEE, for his
review and suggestions on Chapter 2, Transportation Agencies.Thanks also are expressed to Tony Dittmeier of UMTA's Region IV
for guidance throughout the project and Norm Paul hum at US-DOTTechnology Sharing, for support and assistance in printing and
distribution of this report. Additionally, Sue Adams, MPC DeputyExecutive Director, and Greg Errett, MPC planner, helped in
reviewing sections of the draft. Finally, the authors would liketo thank the many people interviewed in compiling the wealth ofinformation included here.
PHASE II COMMENTARY ON PHASE I RESULTS
Based on the conclusions drawn in Phase I a series of nine general"Lessons Learned" were formulated. These lessons covered a
variety of topics and provided an overview of recommendedapproaches to these issues. The following discussion gives an
indication of the validity of the original lessons based on the
4
Phase II evaluation. A brief discussion following each of thePhase I lessons indicates whether the Phase II evaluationverifies, refutes or goes no further than the original analysis.
Permit Applications
A cut-off date 90-120 days prior to opening of the Fairshould have been established for parking lot, shuttleservice and taxi operation permit applications . The earlyapplication date and a published listing of the number of
services, parking spaces, etc., permitted, would havehelped to lessen the speculative fever which rose in the
final weeks before opening. No date or efforts to disclosepermit information was established because of a feelingthat everyone was entitled to a share of the "success" andhence, no restrictions should be imposed. Consequently,there were far too many providers, with the resultingcongestion, low revenues, and the social impacts of numerousbusiness failures.
Phase II Result . Chapters 6 and 10 of this report furtheranalyze this issue. The results here confirm that the idea
is valid, but identify serious problems in practical
appl ication.
Parking
The private sector is typically able to provide an adequatesupply of parking facilities . The early cut-off date,
described previously, would have helped potential providersbetter assess the market conditions. KIEE could have
avoided getting into the parking lot business to a large
degree had there been documentation that adequate parkingwould be provided. Experiences at the Spokane and SeattleWorld's Fairs showed private development of adequate parking
but KIEE eventually developed its own visitors lots under
pressure from people within and outside the organizationconcerned with the lack of assured, adequate parking
facilities.
Phase II Results . Discussion in Chapter 6 of this reportverifies this lesson. Further analysis of previous Fairs,
as well as Knoxville's experience, indicate that the
private sector provided a major portion of needed parking
space.
5

Marketing to Tours
Marketing and facility provision aimed at attracting bus tourpromotions had a significant impact on the Fair's attendancetotals and pattern . Provision of a tour bus terminal at the
north gate and early, aggressive marketing targeted at the
tour industry dramatically raised the number of visitors whocame via bus, skewed the attendance pattern toward springand fall rather than summer, and increased national awarenessof the Fair at low cost to KIEE due to advertising sponsoredby tour groups.
Phase II Results . Chapter 8 of this report verifies anddocuments that special attention to tour groups increasedoverall attendance, and affected mode split and attendancepatterns with respect to season and time of day.
Transportation Plan Implementation
Implementation of the transportation plan and establishmentof a transportation operating staff must be timed to balancenecessary staff functions with limited resources to supportpersonnel . Implementation began nine months prior toopening of the World's Fair. At that point the staff wasforced to deal with a multitude of brush fires at theexpense of some important overall planning and managementactivities. The large number of critical components to be
staffed for a successful Fair, coupled with a limitedpersonnel budget, dictated that all could not be developedto the ideally desired level. The transportation systemfunctioned very well despite the late start up ofimplementation.
Phase II Results . No significant additional findings as a
result of this evaluation.
Determination of Promoter's Role
The promoter must determine as early as possible whichfunctions are legitimately within its sphere or responsibilityand capability, and which are not . The decisions to getinvolved in parking provision and housing reservations weredifficult, and in some respects disastrous, in Knoxville. Anearly determination of the essential roles for the promoter,and an associated effort to delegate or avoid the inappro-priate, will improve performance in the chosen roles. Thisalso gives clearer signals to the other potential serviceproviders in the community regarding their roles.
6
Phase II Results . No significant additional findings as a
result of this evaluation, however a parallel argument is
made with respect to transportation agencies in Chapter 8.
Cooperation Between Promoter and Transit Company
Negotiations with the local transit company (K-TRANS)could have been~improved two ways: (l) by an earlydetermination by KIEE of transit services it would provide,thereby identifying what would be left to K-TRANS, and
(2) earlier negotiations between K-TRANS and KIEE, allowingtime to reach needed compromises on service contracts . Thenegotiations which took place were hampered by delayeddecisions on service needs and delayed agreement on contractterms.
Phase II Results . No significant additional findings as a
result of this evaluation.
Overall Cooperative Atmosphere
Inter and intra organization cooperation in the public andprivate sectors was absolutely essential to the success of
the 1982 World's Fair . All participants were generallydirected toward a common objective. Decision makingauthority was either delegated to or assumed at the stafflevel to insure prompt attention to actions which could notafford to be delayed by lengthy debate. Because the speedof these decisions often precluded public discussion, the
system was sometimes perceived to be secretive.
Phase II Results . Additional discussion in Chapter 2, of
decision-making and general procedural characteristics forthe Fair versus the traditional approach, verifies the
validity of this lesson.
Roadway Improvements
Roadway and interstate improvements must be envisioned veryearly in planning for a special event to allow the necessarylead time for planning, funding, design and construction . A
minimum of six years for interstate and four years for majorlocal road improvements is considered essential.
7

Phase II Results . Chapter 5 describes in detail the variousroadway facilities and traffic changes made. This evaluationfurther substantiates the importance of long lead times.
Pedestrians
Pedestrian movement and safety were maximized by: (1) separa-tum of pedestrian from vehicle access points, (2) design of
pedestrian access so that large crowds would not have to crossmajor thoroughfares, and (3) supplementing signals with policetraffic control during peak periods . The segregation of
pedestrian from vehicle access also improved vehiculartraffic flow around the 1982 World's Fair site.
Phase II Results . No significant further lessons resultedfrom the Phase II evaluation but details of pedestrian relatedcapital expenditures are identified in Chapter 5.
LESSONS-LEARNED FROM THE PHASE II ANALYSIS
As in the first phase report, specific conclusions drawn in variouschapters have been massaged here to formulate broader lessons. In
some instances specific conclusions from several chapters areconceptually similar and have been combined into one generallesson.
Included with each are page number references to discussion of thetopic in the text. These refer the interested reader to theappropriate section to foster an understanding of the lesson in
context. The list of 1 essons-learned is divided into topicalsub groups.
ORGANIZATION
* To be most effective, transportation agencies and organizationsinvolved with a major event should limit their activities to
those areas considered to be the agency's strengths. (See also
PP: 17, 18, 20, 21,23,24)
* There must be a forging of public and private leadership thatcan get the job done by maximizing the strengths of each, in
instances where responsibilities do not clearly fall in therealm of either group. (See also pp: 15-21, 23, 24)
8

* A transit system representative should be included on the event'straffic planning committee. (See also pp: 81, 82)
* A central clearinghouse for all transportation information shouldbe made available to visitors of the event. (See also pp: 186-189)
PLANNING
* The purpose of transportation services was to create adequate,economical access to the event. Viewed in that context, lossesthe Fair incurred outside the gates may well have been offset by
adding spending inside. (See also pp: 223, 228)
* Site and transportation system design should be based on theestimated 80th and 90th percentile day's attendance instead ofpeak day of week or month percentage. (See also pp: 35, 36, 54)
* Variations in total attendance, mode split, gate use and demandfor transportation services were experienced based on season, dayof week, and time of day. (See pp: 25-34,41,45,54,201,203,206)
* Attendance and gate volume information from the Knoxville Fair
is comparable to previous recent World's Fair and so may be
used for planning purposes. (See also pp: 26,33,34,36,37,41-44,54)
* The levels of both revenues and expenses for the transportationsystem at the World's Fair were lower than had been forecasteven as late as June of 1982. (See also pp: 223-225)
* In Knoxville, as with other recent fairs, the site locationadjacent to the downtown area created a need to consider Fair
parking and other transportation facilities in relation to theirCBD counterparts
.(See also pp: 103-110,115,117,118,120,121,123,124)
ACCESS
* Good access was provided to the Knoxville Fair as a result of
four major actions: (1) major road improvements made in the
area, (2) an over supply of parking (3) smaller than expectednumber of visitors travelling by car coupled with a higherthan expected vehicle occupancy rate and, (4) multi gateaccess system which segregated types of ingress and egress.(See also Chapter 4)
9
ROADWAYS AND TRAFFIC
* Planning and implementation of transportation services for a
major event differs from routine transportation services in
that the importance of the event elevates the activities to a
high priority in the mind of business and community leaders,and the opening date of the event becomes a critical benchmark,a condition not experienced in routine projects. (See also pp:
17, 19, 20, 22, 23)
* Almost all the major roadway improvements made for the KnoxvilleWorld's Fair will have residual benefits. Many of theseprojects were already included in long range plans, howeverthe presence of the World's Fair accelerated their implementa-tion. (See also pp: 69, 76, 79, 80, 81, 100)
* Analysis of traffic during and after the Fair reveals that the
specific hourly and daily distribution characteristics of the
traffic patterns which developed helped to avoid the seriouscongestion which some anticipated. Fair related traffic peakswere noticeably different from local traffic peaks. (See also
pp: 87, 92, 98, 100, 101)
* The existence of four visitor gates probably spread trafficwhich would have been more concentrated if fewer gates wereavailable. (See also pp: 55, 56, 101)
PARKING
* The impact on entrepreneurs of the announced $6.00 official
parking fee and the City's decision to not control the numberof parking lots to be developed led to a surplus of World'sFair parking spaces. (See also p. 123)
* While it is clear that the "official" parking fee was above the
equal ibrium price, it is not clear that a lower announced pricewould have encouraged as much parking development as wasrequired. (See also pp: 105, 219, 227, 228)
* Numerous entrepreneurs, like KIEE itself, considered the costof developing and operating their proposed lots carefully butwere unaware of the extent to which others were making similarplans. (See also p. 220)
* As with fairs in Seattle, San Antonio, and Spokane, remoteparking lots proved unattractive to visitors and employees in
Knoxville. (See also pp: 111, 113, 123)
10
* Post Fair parking rates in the downtown area appear to havestabilized at about ten percent above the pre-Fair level formonthly parking and 25 percent higher for hourly rates.(See also pp: 117, 118, 120, 123, 124)
* Development of parking facilities for the Fair resulted in thecreation of several new permanent parking facilities in thedowntown area and near the University. (See also: 115, 116,
118, 119)
TRANSIT, TOUR AND SHUTTLE BUSES
* Provision of off-street parking facilities for tour and shuttlebus loading and unloading is imperative. The size and type offacilities is dependent on the trade-off between needs of the
terminal and the alternative land uses. Terminals should be
located adjacent to visitor gates. (See also pp: 131, 135, 138,
141, 144, 151, 153-157)
* The distribution of bus terminals at the three differentvisitor gates helped to reduce congestion. (See also p: 144)
* An active marketing program to attract tours to the World'sFair resulted in an unusually high percentage of visitorsarriving by tour bus. (See also pp: 145, 157)
* For planning purposes the high volume of tour buses thatarrived in Knoxville during the spring and fall months can be
expected at other major events in the south. This is due to
the large number of older visitors on tours wishing to avoidthe hot weather and high attendance of the mid-summer period.
(See also pp: 145, 147, 157)
* The Knoxville experience showed that the demand for shuttlebus service was related more to a per-bed measure than to the
total number of lodging units reserved. (See also pp: 126,
127, 144)
* Shuttle bus service for remote lots was over-supplied, sincethe level of shuttle service was tied to an over-estimatedneed for parking facilities. (See also pp: 137, 138, 141)
* Given auto occupancy rates and bus operating costs, it appearsunlikely that any price for shuttle bus service from outlyingareas could have enabled operators to break even. (See also pp:
229, 230)
* There is a small market segment with relatively inelastic demand,
for whom shuttle bus service will be a viable choice at virtuallyany price. (See also p. 231)
11

* Demographic characteristics of riders on various transit routeswill affect demand for service during a special event, so
adjustments should be on a route basis rather than for the
entire system. (See also pp: 162-164, 175)
* Substantial farebox and ticket revenues for regular route transitservice were experienced during the Fair, with up to 100 percentincreases on a few routes and a decrease on only one route.(See also pp: 175, 179)
* Regular route patronage remained above pre-Fair levels after the
Fair, although express-route ridership decreased during and
after the Fair. (See also pp: 175, 176, 179)
* Patronage increases during a special event will decay over a
period of about 90 days after the event. (See also p: 179)
* Special transportation services for elderly and handicappedvisitors must be considered early in the planning process.(See also p: 194)
MARKET FORCES
* The operations of different transportation services were inter-related. Since in many cases various modes, parking facilities,and other services were complementary to or substitutes for oneanother, the price and availability of one affected the demandfor another. (See also pp: 207, 225, 228, 230)
* Transportation service operations which expanded existing businesson an as-needed basis where generally more successful than thosewhich were begun explicitly for the Fair. (See also pp: 202,204,206)
* Visibility was generally more important to the success of thetransportation services than quality, price, convenience, andother service characteristics. Since out-of-town visitors wereunfamiliar with the alternatives, the most obvious servicestended to be most heavily patronized. (See also pp: 107, 110, 198,
199, 202, 203, 204, 206, 207)
REGULATIONS AND AGREEMENTS
* The nature of special events dictates that special agreementsand ordinances be enacted to provide for successful, effectivetransportation services. (See also pp: 209, 217)
* The special regulations and agreements pertaining to Fairtransportation in Knoxville were adhered to, generated fewcomplaints, and were considered effective. (See also pp: 209,217)
12
* Regulatory agencies must be willing to modify normal proceduresin order to effectively handle a large volume of applicationsfor temporary operating authority for a special event.(See also pp : 144, 213, 217)
* Regulatory agencies charged with granting operating authoriza-tion must allow sufficient time for business start-up whendeveloping their timetable for decisions on licensing.(See also p. 144)
* The inability to predict market size was a fundamental problemin the regulation of transportation services. As such, it is
probably not appropriate to suggest a stronger role for the
regulatory body other than vigorous enforcement of criteriafor fitness to provide service. (See also pp: 143, 144)
* Although not easily accomplished, the over supply of parkingmight have been reduced by earlier disclosure of the number of
permitted lots. (See also p. 124)
* The provision of shuttle services by private non-Fair operatorslimited KIEE control over quality of service, treatment of
passengers, and changes in service (such as termination of
service). (See also p. 143)
* Due to the unpredictability of demand for transportation services,cancellation clauses based on insufficient demand are justified in
contracts. (See also pp: 138, 143, 144, 181, 215, 217)

Chapter Two:
TRANSPORTATION AGENCIES
INTRODUCTION
This chapter provides an overview of how transportation agenciesfunctioned during the World's Fair. General information on how
existing agencies adapted to the World's Fair and how Knoxville'sexperience may be used by transportation agencies in other citiesis offered.
This chapter is organized as follows. The first section describes"the setting", which is background data on the environment in whichthe World's Fair took place. Next, is a brief description of the
transportation agencies and their general responsibilities. Thethird section draws contrasts between the setting and traditionalprocedures that are carried out by transportation agencies. Thesecontrasts are important because they provide some insight as to how
existing agencies can more effectively contribute to a major event.
The fourth section categorizes the roles played by differentagencies during a major event. These roles are suggested as a wayfor agencies in other cities to maximize their contribution to a
major event. Finally, some differences are pointed out betweenproviding transit services and providing highway facilities for a
major event.
THE SETTING FOR FAIR-RELATED TRANSPORTATION ACTIVITIES
The 1982 World's Fair was originally conceived in 1974 by indivi-
duals within the business and governmental community who wished to
revitalize the downtown area. The Fair was seen as a means for
redeveloping vacant and dilapidated downtown areas and also as a
means for attracting businesses to the downtown area.
Once it was determined that hosting a World's Fair was possible and
that it was a desirable undertaking, it was necessary to secure the
support of key individuals within the business and political com-
munity. Two types of support were needed. Broad based support by
influential community leaders was neeaed to promote and support the
Fair. Secondly, very strong and influential leadership was needed
to assume responsibil ity for gaining a concensus of support despite
any political and economic obstacles which might arise. This
leadership had to have influence and power that transcendedentrenched bureaucracies and small scale or parochial power bases.
Without this strong leadership the World's Fair would not have
15

occurred. A key element in the process of gathering support for
the Fair among business and governmental leaders was the assumptionof a leadership role for undertaking and implementing the Fair by a
small core of individuals.
The individuals who assumed the leadership role for implementingthe Fair had to be capable of cooperating with and influencingState and National leaders in a variety of ways. The first and
most obvious need was to obtain approval for the Fair from finan-cial institutions and the city. For example, it was necessary to
/
secure commitments from banks for loans for the Fair. It was also'necessary to secure commitments for financial backing from local
government. The third responsi bi 1 i ty of Fair leadership was to
secure political support at the national, state, and local level.
This meant that Fair leadership had to have a strong influencepolitically at many levels, as well as the ties and knowledgeneeded to operate within financial circles. Therefore, it is
apparent that those who took a leadership role for implementing the
1982 World's Fair had to operate outside of the traditional govern-mental process. A separate and powerful entity was necessary to
make the World's Fair a reality. This entity (the KnoxvilleInternational Energy Exposition— KIEE) strongly, though indirectly,impacted transportation agencies.
Before discussing the effects of having a second power base, a
related but different type of phenomenon should be mentioned. This
can be characterized as the opposing or skeptical element withinthe community. Whenever a new and unknown venture is about to be
undertaken, it is natural for fear and skepticism to be felt by the
average person. This fear and skepticism manifested itself throughsubstantial controversy about the Fair within the community. Sincethe skepticism and negative reactions of many local citizens wasconsistently aired at public meetings and in the press, manypolitical and business leaders did not wish to associate themselvesdirectly with the Fair. Direct association with the Fair duringthe period of intense controversy was seen as a political or publicrelations liability. This controversy was a frustration to the
complete formation of a strong and unified partnership between KIEE
and political leaders. Therefore, KIEE and the traditional govern-mental structure, which were two distinct centers of influence andpower, at times worked toward different objectives.
It should be pointed out here that many of the same people who sawthe Fair as somewhat of a personal public image liability also sawit as a means to make a positive impact on the community. Thepublicity, prestige, and monetary benefits in having 11,000,000visitors to a community are obvious. In addition, the residual on
site values of a World's Fair can be quite positive.
16

This was the environment in which transportation agencies functionedwhile preparing for the World's Fair.
KIEE was established as an independent corporation for financialand legal reasons, since under U.S. law the public sector can notsponsor a fair. Its functional and political independence wasnecessitated by the environment just described, as well. Thisindependence had an effect on transportation planning and imple-mentation. Two centers of influence had to be dealt with by thetransportation agencies--one outside of the traditional process,and the traditional process itself (including political bodies).Because two centers of power existed, gaps in responsibilityexisted, decision-making was fragmented, and questions of who hadauthority and decision-making responsibility were many times notclearly resolved.
TRANSPORTATION ORGANIZATIONS AND GENERAL RESPONSIBILITIES
There are several reasons for outlining the participation offederal, state, and local agencies involved in providing trans-portation facilities and services related to the Fair. First, it
illustrates the large number of agencies involved in planning,administering, and providing transportation facilities and services.
Secondly, it provides an overview of the large number of duties of
those agencies along with the procedures and processes required to
implement a project.
Because of time constraints, the importance of the event, and the
influence asserted by influential outsiders, traditional trans-
portation procedures cannot easily serve the needs of a major
event. The highly decentralized, methodical, and participatory
decision making process traditionally used to plan and implement
transportation services is not well suited to responding to the
conditions of a major event such as a World's Fair. What is neededin some situations is a centralized power structure capable of
making binding and expeditious decisions.
A listing of the transportation agencies involved in providingtransportation facilities and services along with a brief descrip-tion of their responsibilities is provided in Table 2-1.
17

TABLE 2-1 : TRANSPORTATION AGENCIES AND FUNCTIONS
AGENCY FUNCTION
Federal Government[Federal Highway Administration(FHWA) and Urban Mass TransitAdministration (UMTA)]
Tennessee Department ofTransportation (TDOT)-Headquarters Office
TDOT - Knoxville RegionalOffice
Knoxville City EngineeringDepartment
Knoxville/Knox CountyMetropolitan PlanningCommissi on
K-TRANS
Knoxville Department ofTransportation Services
Knox County Departmentof Highways
*Fund transportation projects (90%Interstate Highways, 50-75% StateHighways, 80% transit capitalassistance, 50% transit operatingassistance)
.
*Review planning, conduct admin-stration and approval process.implement national policies.
*Approve and fund road constructionprograms.
*Fund transit capital and operatingcosts.
*Administer federal highway programs
*Provide maintenance and operationof state roads.Coordinate planning with local
engineering departments and countyhighway departments.
^Administer and operate City relatedhighway projects.Participate in planning and designof state and federal highwayprojects impacting local area.
Collect data.*Analyze data.
Prepare general system plans.*Administer requirements imposedby state and federal government.
Provide city transit service.
Jurisdiction over K-TRANS, taxi
service, service to the elderlyand handicapped and other intra-city public transportationservices.
Construct road improvements withinKnox County but outside city limits
18
CONTRASTING THE WORLD'S FAIR ENVIRONMENT AND TRADITIONAL PROCEDURES
The World's Fair was a major national, state, and local event, withpeak crowds expected to be over 100,000 people per day, over a sixmonth period. As such, transportation related facilities andservices took on an unusual importance. The image of both the cityand state would be affected by visitor satisfaction with suchthings as transportation and housing services as well as theirsafety and comfort at the Fair. The number of repeat visitorswould also be influenced by word of mouth descriptions and mediapublicity on the Fair itself, as well as related facilities andservices. In addition, the number of mid-summer and late summervisitors would also be affected by the above.
Contributing to the success of the Fair was an important objectiveof the city, and in many ways the state. This included the provi-sion of transportation facilities and services. Transportationsupport and services therefore, became a high priority within thestate and municipality. This is a departure from normal conditionswhere transportation projects are only one of the many servicesprovided by national, state, and local government. Because of the
magnitude and importance of the event, and the corresponding imageof the city and state in providing for the World's Fair, trans-portation facilities were elevated above their usual positionwithin the group of services offered by government. This meantthat external forces governed or strongly influenced the provisionof facilities and services rather than the usual situation wheretransportation agencies alone directed the course of projects.
The second contrast between the Fair and traditional procedures was
the opening date of the Fair, which served as a strong external
influence. Normally time constraints do not strictly govern trans-portation planning and implementation. However, the need to have
adequate transportation facilities in place by opening day on May
1, 1982, added a sense of urgency to the work on transportationfacilities and plans for service. This crucial time constraint is
not typically present in routine transportation planning and
implementation.
The third major contrast was the direct interest and occasionallyactive role played by business and community leaders. In order to
insure completion of transportation projects by opening date, and
because loans for the World's Fair were tied to the timely comple-tion of highway projects, business and community leaders had a
strong interest in transportation projects. Therefore they exertedtheir influence through the upper levels of state and national
government. This is also somewhat of a departure from traditionaltransportation decision making patterns. Normally, the staff oftransportation agencies generates what are considered to be
reasonable solutions to a problem and submits them to the higher
19
levels of the departments and government for their approval.
However, in the case of the World's Fair, the influence of businessand community leaders was felt from the top down. The directors of
departments and key governmental leaders took an active interest in
completion of key projects and exerted this influence at the higherlevels of government and transportation related agencies.
Another contrast with traditional procedures was that limitinginvolvement by agencies and groups was both desirable and necessaryto expedite preparations for the Fair. Involvement was generallylimited to implementing agencies directly responsible for buildingor operating the Fair and support facilities. For example, thestaff of the Metropolitan Planning Commission did not participatein a large share of the meetings that involved planning and opera-tions for the World's Fair. The same is true of certain state andfederal departments, various authorities, commissions, the regionalplanning agency, etc. Although involvement of these groups is verydesirable for traditional transportation planning and implementa-tion, it would not have been effective in this case. Involvementof a large number of groups is extremely time consuming and in-
creases the need of group concensus for a final decision. The"process" was less important than the product under thesecondi tions
.
It should also be pointed out that one of the biggest problems in
providing transportation facilities and services were those situa-tions where established agencies could not effectively respond to
the unique needs of a major event. For example, the TennesseePublic Service Commission failed to become actively involved in
service issues within their jurisdiction, while K-TRANS wished to
play a more active role but could not because of limited serviceboundaries. Other examples of authority and responsibi lity gapsincluded parking and miscellaneous service providers. The pointhere is that traditional agencies served the Fair well within theirtraditional, functional limits. However many situations arosewhich were beyond the traditional limits of clear responsi bi 1 ityand authority. In these cases expeditious decisions were not made,were made by default, or made by other organizations.
THE SPECIFIC ROLES OF TRANSPORTATION AGENCIES
The roles of transportation agencies are broadly categorized belowto more specifically define the functions of agencies during a
major event. Once their appropriate role is understood, eachagency can concentrate on making its maximum contribution. Whilethe following description is an oversimplification, it is intendedto suggest that each agency can best contribute by using itsspecific strengths in pursuit of a defined mission.
20
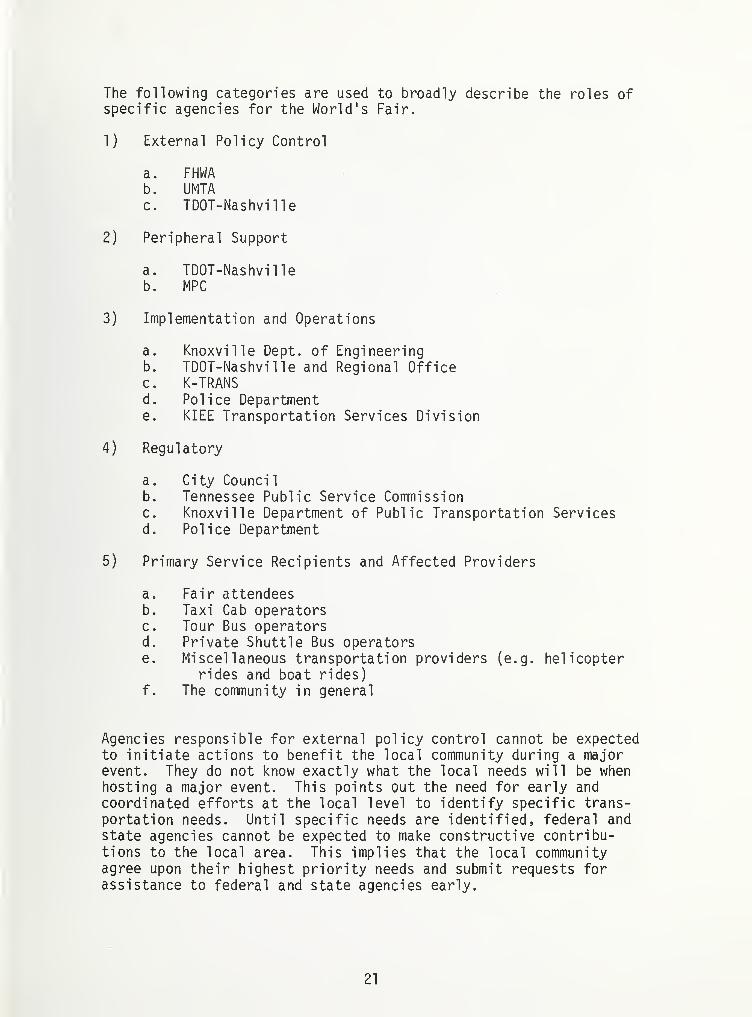
The following categories are used to broadly describe the roles ofspecific agencies for the World's Fair.
1) External Policy Control
a. FHWAb. UMTAc. TDOT-Nashville
2) Peripheral Support
a. TDOT-Nashvilleb. MPC
3) Implementation and Operations
a. Knoxville Dept, of Engineeringb. TDOT-Nashville and Regional Officec. K-TRANSd. Police Departmente. KIEE Transportation Services Division
4) Regulatory
a. City Councilb. Tennessee Public Service Commissionc. Knoxville Department of Public Transportation Servicesd. Police Department
5) Primary Service Recipients and Affected Providers
a. Fair attendeesb. Taxi Cab operatorsc. Tour Bus operatorsd. Private Shuttle Bus operatorse. Miscellaneous transportation providers (e.g. helicopter
rides and boat rides)f. The community in general
Agencies responsible for external policy control cannot be expectedto initiate actions to benefit the local community during a majorevent. They do not know exactly what the local needs will be whenhosting a major event. This points out the need for early and
coordinated efforts at the local level to identify specific trans-
portation needs. Until specific needs are identified, federal and
state agencies cannot be expected to make constructive contribu-tions to the local area. This implies that the local communityagree upon their highest priority needs and submit requests forassistance to federal and state agencies early.
21

Peripheral support agencies are those which provide data collection
and analysis work for implementation. Those agencies must take the
initiative early if they are to provide constructive contributionstoward transportation services during a major event. There is a
limited amount of time for detailed studies, broad agency and
citizen involvement, lengthy approval processes and the reaching of
a concensus on any issue. Planning and peripheral support agenciescan best contribute by limiting their efforts to projects that will
directly impact implementation and operation. This can be done by
offering help directly to the operating and implementation agenciesand/or undertaking very compressed studies that suggest specificcourses of action on specific issues. Peripheral support agenciesmust either have funding readily available for such studies or be
able to secure that funding within a very short period of time.
The agencies responsible for operation and implementation will
carry the greatest responsibilities during the course of the majorevent as well as during preparations for the event. As the openingday for the major event draws near, these agencies will have to
assume greater decision making responsibility. There will not be
enough time for those involved with the event to concern themselveswith transportation related issues except on an emergency basis.
Furthermore, the time required to obtain approvals and satisfytraditional processes might postpone decisions and action untilafter the event is over. Therefore, the responsibility for makingfinal decisions will be with those who actually carry out the work.
Agencies involved in regulating various transportation servicesduring a major event have an extremely difficult time in handlingthe various requests that come before them. Since a major eventwill probably happen only once in the lifetime of all but the
largest cities, regulatory agencies often have difficulty antici-pating the nature of requests they will face. Furthermore, thereis the problem of jurisdictional boundaries which leave gaps andoverlaps in the decision process. In addition, there are often no
ordinances or statutes to handle the unique character of peripheraltransportation services during a major event (e.g., temporaryparking lots, shuttle buses, atypical modes). It may be in thisarea where planning agencies can contribute most of providing a
rational approach to handling the various regulatory problems.
One approach to anticipating the needs generated by a major eventis to start with the service recipients and potential transporta-tion providers. By listing the groups in this category and listingtheir transportation needs, some general conclusions can be drawnabout the transportation needs they will generate. By identifyingservice recipients and their needs, the local planning and supportagencies can start to organize the required responses of agencieswho will be providing transportation facilities and support.
22
The single, most important factor that determined the success oftransportation agencies in preparing for the World's Fair was theattitude of the people who staffed the agencies. The importance ofhaving positive, cooperative attitudes, and a sense of commonpurpose cannot be overemphasized. Fortunately, Knoxville was in a
position where, with few exceptions, the individuals involved werededicated to the success of the World's Fair.
SUMMARY AND CONCLUSIONS
The environment for providing transportation facilities and servicesfor the World's Fair had the following characteristics: 1) strongsupport by influential community leaders was needed to bring the
Fair to reality; 2) assumption of a leadership role by politicallyinfluential and financially knowledgeable individuals to overcomeobstacles and transcend smaller power bases; and 3) communityopposition contributing to the apparent separation between KIEE and
local government. Because of this transportation agencies had to
deal with two power centers--one outside of the traditional process,plus the process itself. Thus, there were frequent authority and
responsibility gaps and decision-making strayed from the typical
path.
There are two important differences between carrying out routine
transportation planning and implementation, and the needs of this
type of major event:
1. The importance of the event elevates transportation
services to a high priority in the minds of business
and community leaders. This can be a great benefit
if the needs of the major event are identified early.
Leaders at the higher political and departmental
levels can be called upon to authorize funds and
programs that are needed to adequately provide
transportation services and facilities.
2. The opening date of the major event significantly
affects the way in which agencies must operate. Time
limitations mean that transportation agencies must
operate in a decisive and expeditious manner. Broad
group concensus and lengthy decision processes are
not practical under these circumstances. Therefore,
departments must be prepared to delegate substantialdecision-making authority to operating personnel and
those at the functional levels of the organizational
chart.
23
*The roles of transportation agencies should be limited to
those areas considered agency "strengths".
- External policy agencies need unified and early inputfrom the local area on what their specific needs arefor the major event.
- Peripheral support departments can best contribute by
limiting their efforts to projects that will directlyimpact implementation and operations. They must takethe initiative early and offer help to operating and
regulatory agencies.
- Operating agencies must be given or assume substantialdecision-making authority. Regulatory agencies shouldattempt to close regulatory gaps and they should takethe initiative early in identifying the unique needsof the event.
- In determining the success of transportation agenciesin preparing for a major event, the importance of a
cooperative attitude and a sense of common purposeand timeliness by their management and staffs shouldbe emphasized.
*A1 though there was an apparent overall distinction betweenKIEE and local government in many respects, there was closecooperation on critical issues in which both parties saw an
opportunity for gain.
*There must be a forging of public and private leadershipthat can get the job done by maximizing the strengths ofeach, in instances where the responsibility does not clearlyfall in the realm of either group.
24

Chapter Three.
TRANSPORTATION PLANNING DESIGN PARAMETERS
INTRODUCTION
The access, terminal, parking, and gate facilities for a World'sFair are designed on the basis of several parameters. Theseinclude:
-- design day attendance
-- mode split
hourly inbound and outbound volumes
-- on-site accumulation
-- gate distribution
This chapter provides the statistical information from The 1982World's Fair, as well as selected data from other World's Fairs,used to determine the appropriate design parameters. The methodsfor estimating each parameter for The 1982 World's Fair are alsoreviewed, including the level of accuracy. Conclusions and recom-mendations for future design parameter estimates are provided wherepossible.
ATTENDANCE PATTERNS
Total Attendance
The 1982 World's Fair attracted 11.1 million visitors over 184
days. Several economic feasibility studies and updates conductedduring the six years preceding the fair generated planning esti-
mates. The final estimate was for an attendance of 11 million.The most optimistic estimate had been for about 13 million, so all
estimates were within the same order of magnitude.
While it is beyond the scope of this report to describe how economicfeasibility studies for World's Fairs are performed, total atten-
dance estimates are based on (1) the type of attraction, (2) past
experience with market penetration for similar events, (3) popu-
lation distribution within the area of influence, and (4) other
local factors which may affect attendance.
Transportation system planning for the fair accepted total atten-dance as a basic assumption. Given the total attendance and fairduration, an average day attendance of about 60,000 could be
determi ned
.
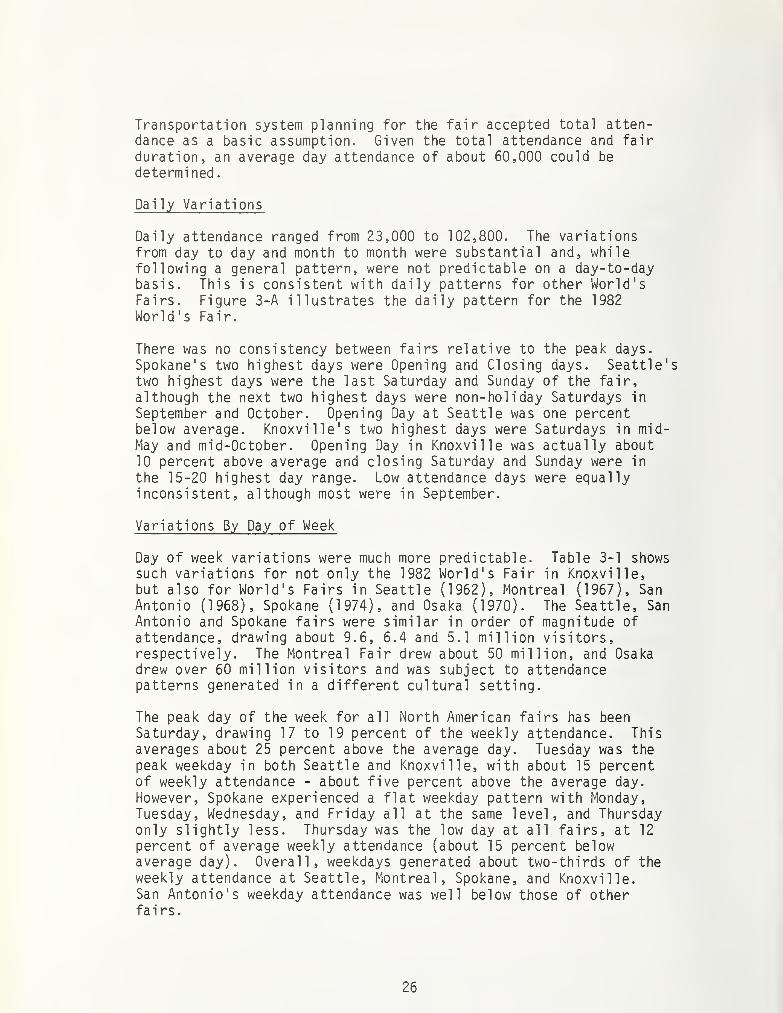
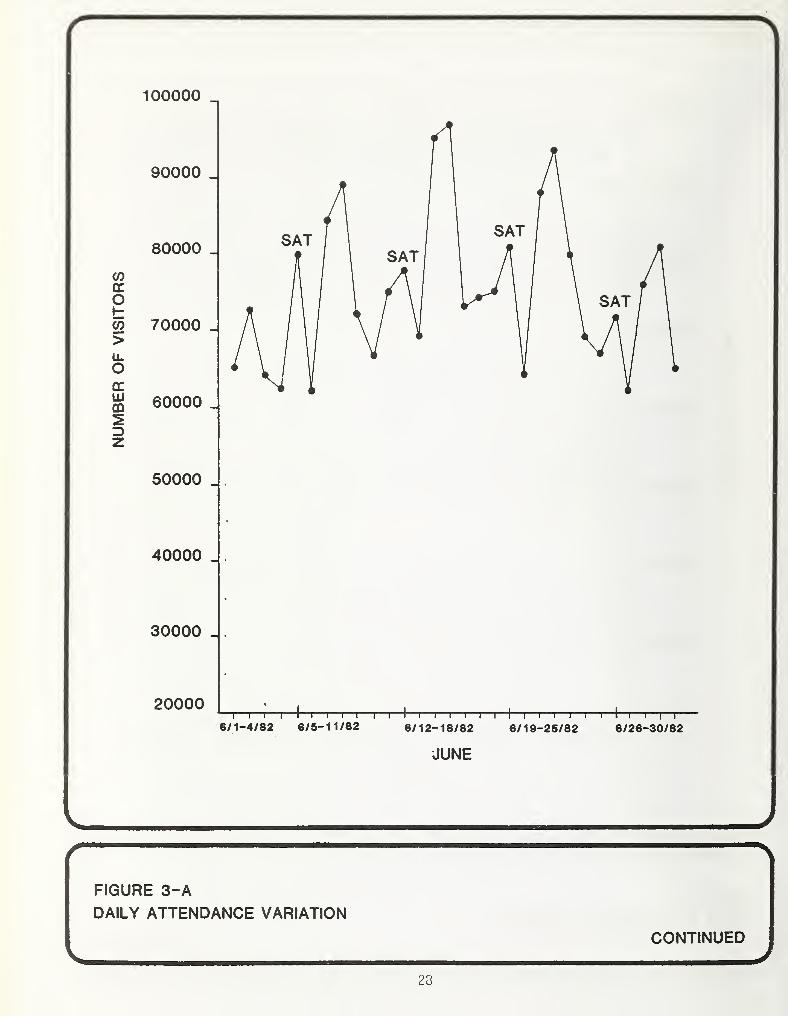
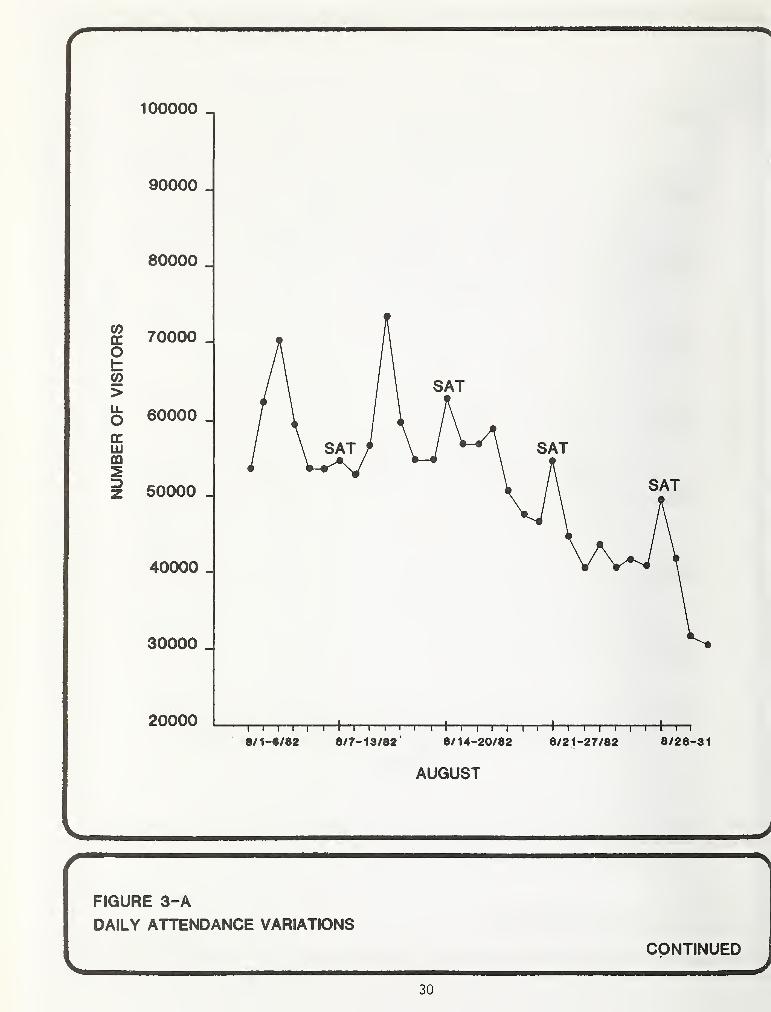
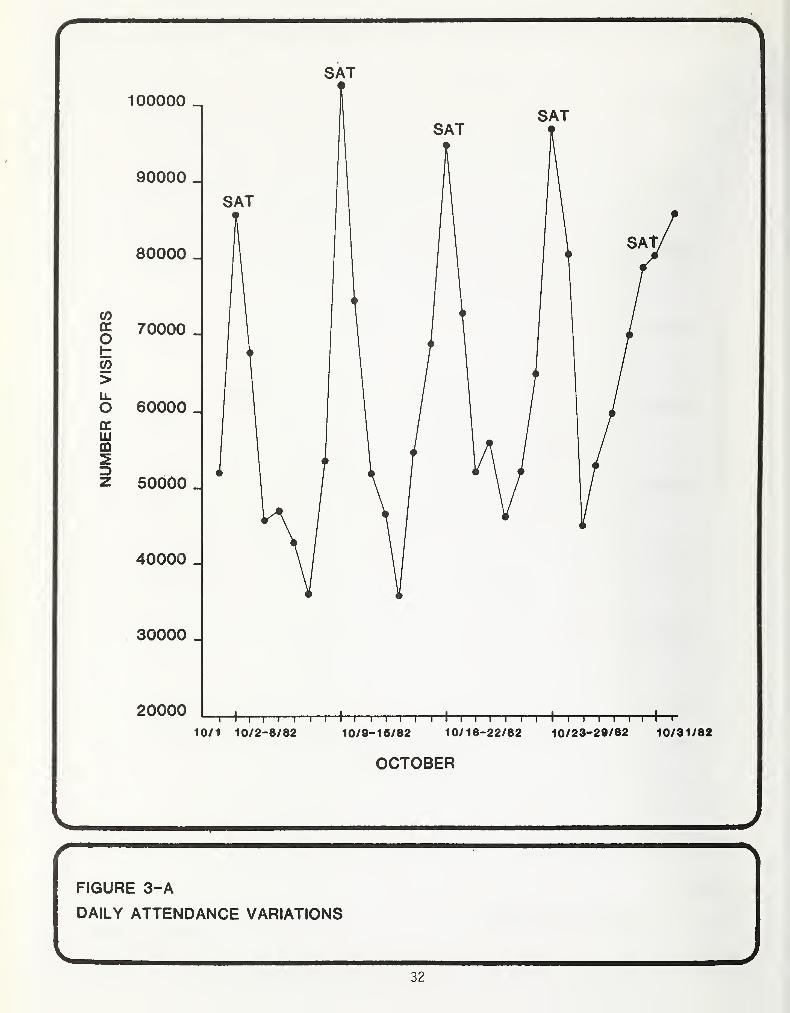
Daily Variations
Daily attendance ranged from 23,000 to 102,800. The variationsfrom day to day and month to month were substantial and, whilefollowing a general pattern, were not predictable on a day-to-daybasis. This is consistent with daily patterns for other World'sFairs. Figure 3-A illustrates the daily pattern for the 1982
World's Fair.
There was no consistency between fairs relative to the peak days.
Spokane's two highest days were Opening and Closing days. Seattle'stwo highest days were the last Saturday and Sunday of the fair,
although the next two highest days were non-holiday Saturdays in
September and October. Opening Day at Seattle was one percentbelow average. Knoxville's two highest days were Saturdays in mid-May and mid-October. Opening Day in Knoxville was actually about
10 percent above average and closing Saturday and Sunday were in
the 15-20 highest day range. Low attendance days were equallyinconsistent, although most were in September.
Variations By Day of Week
Day of week variations were much more predictable. Table 3-1 showssuch variations for not only the 1982 World's Fair in Knoxville,but also for World's Fairs in Seattle (1962), Montreal (1967), San
Antonio (1968), Spokane (1974), and Osaka (1970). The Seattle, San
Antonio and Spokane fairs were similar in order of magnitude of
attendance, drawing about 9.6, 6.4 and 5.1 million visitors,respectively. The Montreal Fair drew about 50 million, and Osakadrew over 60 million visitors and was subject to attendancepatterns generated in a different cultural setting.
The peak day of the week for all North American fairs has beenSaturday, drawing 17 to 19 percent of the weekly attendance. Thisaverages about 25 percent above the average day. Tuesday was the
peak weekday in both Seattle and Knoxville, with about 15 percentof weekly attendance - about five percent above the average day.
However, Spokane experienced a flat weekday pattern with Monday,Tuesday, Wednesday, and Friday all at the same level, and Thursdayonly slightly less. Thursday was the low day at all fairs, at 12
percent of average weekly attendance (about 15 percent belowaverage day). Overall, weekdays generated about two-thirds of the
weekly attendance at Seattle, Montreal, Spokane, and Knoxville.San Antonio's weekday attendance was well below those of otherfairs.
26

NUMBER
OF
VISITORS
MAY
Vr
FIGURE 3-A
DAILY ATTENDANCE VARIATION
CONTINUED
27
JUNE
J
)FIGURE 3-A
DAILY ATTENDANCE VARIATION
CONTINUEDV J
23

NUMJ3ER
OF
VISITORS
V— /
29
NUMBER
OF
VISITORS
100000 _
90000 _
80000 _
70000 _
60000 _
60000 _
40000 „
30000 _
20000i—
i r"
i—r i I i i
—r—t—i
—rH—r
—i
—i
—i
—i
—i i i i
—i i i
—t—
I
—i
—i
8/1-8/82 8/7-13/82 8/14-20/82 8/21-27/82 8/28-31
AUGUST
*
FIGURE 3-A
DAILY ATTENDANCE VARIATIONS
J
CONTINUEDJ
r J
FIGURE 3-A
DAILY ATTENDANCE VARIATIONS
CONTINUED— JV31
SAT
cooc
OtCO
>Li.
OOCLUm23Z
100000 _
90000 _
80000 -
70000 _
60000 _
50000 _
40000 _
30000 _
20000 1—l—i—r—i—r—r—
r
10/1 10/2-8/82i—i—i—i—i—
r
10/9-15/82• i i—i i r
10/16-22/82H—i—i—i—i—i—!—I—
r
10/23-29/82 10/31/82
OCTOBER
FIGURE 3-A
DAILY ATTENDANCE VARIATIONS
32

Table 3-1 shows the composite distribution for the U.S. fairslisted. With relatively minor variations, these patterns wereconsistent from week to week at the Knoxville fair. Nearly all ofthe ten highest attendance days occurred on Saturdays and Tuesdays.
Monthly Variations
Table 3-2 shows attendance variations by month. No two fairs have
experienced close similarities in monthly variations. However,with the exception of the Knoxville fair, all have started slowly,peaked during the summer (August high month), dipped in September,and finished stronger in October.
The Knoxville fair had May, June, and October as peak months, withits low in August, Spokane's low was also in August. A majorfactor contributing to the May-June peak in Knoxville was the heavyinflux of tour groups often amounting to over 15,000 persons daily.Those numbers dropped by 50 percent or more during the summer.Since this was the first U.S. World's Fair to heavily market to
tour operators, such a peak would not be expected for fairs withoutan equally agressive tour marketing effort.
TABLE 3-1: ATTENDANCE VARIATIONS BY DAY-OF-WEEK
PERCENT OF TOTAL WEEKLY ATTENDANCE1968 1982 U.S.
1962 1967 San 1970 1974 Knox- Compo-Day Seattle Montreal Antonio Osaka Spokane v i 1 1 e si te
Monday 13% 13% 11% 14% 13% 14% 13%
Tuesday 15% 14% 12% 12% 13% 15% 14%
Wednesday 13% 14% 12% 13% 13% 14% 13%
Thursday 12% 12% 11% 12% 12% 12% 12%
Friday 13% 13% 13% 14% 13% 14% 13%
Saturday 18% 17% 21% 17% 19% 17% 18%
Sunday 16% 17% 20% 18% 17% 14% 17%
SOURCE: Barton-Aschman Associates, Inc.
33
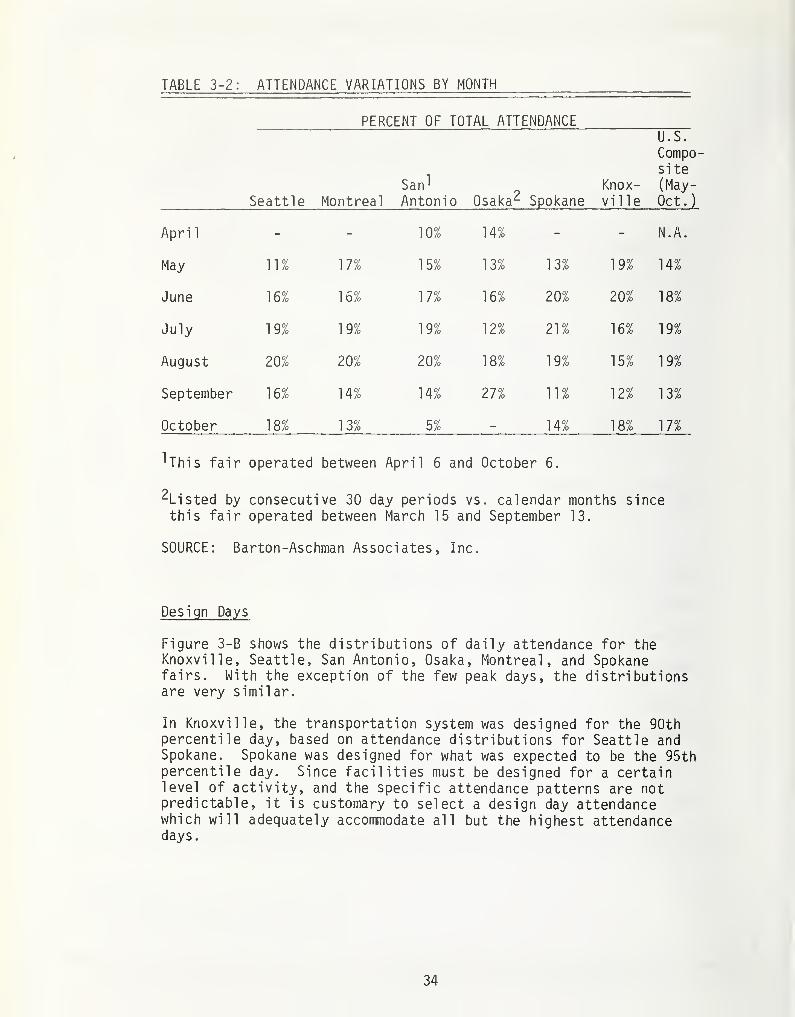
TABLE 3-2: ATTENDANCE VARIATIONS BY MONTH
PERCENT OF TOTAL ATTENDANCE
Seattle MontrealSan^
Antonio Osaka 2 SpokaneKnox-ville
U.S.
Compo-site(May-
Oct.
)
Apri 1- - 10% 14% - - N.A.
May 11% 17% 15% 13% 13% 19% 14%
June 16% 16% 17% 16% 20% 20% 18%
July 19% 19% 19% 12% 21% 16% 19%
August 20% 20% 20% 18% 19% 15% 19%
September 16% 14% 14% 27% 11% 12% 13%
October 18% 13% 5% - 14% 18% 17%
1 Thi s fair operated between April 6 and October 6.
^Listed by consecutive 30 day periods vs. calendar months sincethis fair operated between March 15 and September 13.
SOURCE: Barton-Aschman Associates, Inc.
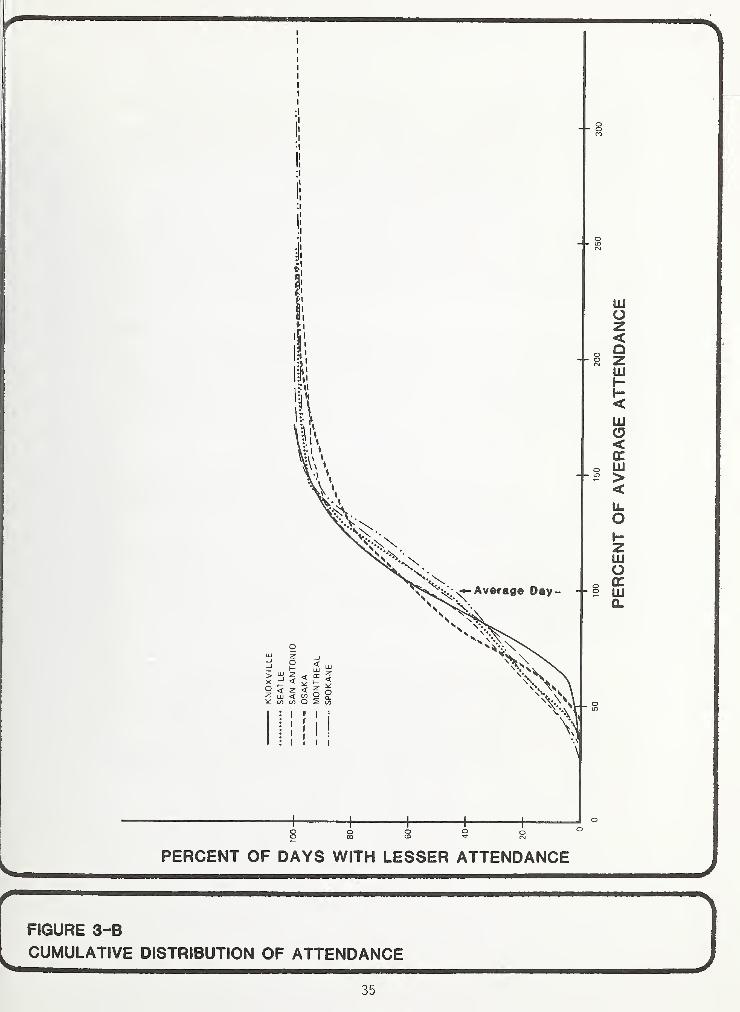
Design Days
Figure 3-B shows the distributions of daily attendance for theKnoxville, Seattle, San Antonio, Osaka, Montreal, and Spokanefairs. With the exception of the few peak days, the distributionsare very similar.
In Knoxville, the transportation system was designed for the 90thpercentile day, based on attendance distributions for Seattle andSpokane. Spokane was designed for what was expected to be the 95thpercentile day. Since facilities must be designed for a certainlevel of activity, and the specific attendance patterns are notpredictable, it is customary to select a design day attendancewhich will adequately accommodate all but the highest attendancedays.
34
I
PERCENT OF DAYS WITH LESSER ATTENDANCE
FIGURE 3-B
CUMULATIVE DISTRIBUTION OF ATTENDANCE
J
35
As is readily apparent from the distributions in Figure 3-B, there
is a break in the curve near the 90th percentile. Above that
level, a small percentile increase represented very few days and
relatively large increases in attendance. As such it becomes very
expensive to meet the additional facility needs, particularly in
light of the few times they will be needed.
Economics controlled the choice of design day level for the on-
site improvements. Because of the cost and difficulty of acquiringadditional land, planning for the site in Knoxville was intended to
meet 80th percentile daily attendance levels. Knoxville'stransportation system, however, was designed for 90th percentiledaily attendance.
Table 3-3 shows the peak, 90th and 80th percentile daily attendancefor the Seattle, Montreal, San Antonio, Osaka, Spokane andKnoxville fairs as a percentage of average daily attendance. Thepercentage by which peak days exceeded average days varied substan-tially. The highest at each fair was a Saturday. Peak weekdayswere 60 to 80 percent above average. The relationships of the90th and 80th percentile days to average days are consistent forKnoxville, Seattle, and Spokane.
The estimate of the 90th percentile day for Knoxville was quiteaccurate. The projection was 80,000, based on 11 million total
attendance, while the actual 90th percentile day was about 83,000reflecting the 11.1 million total attendance.
Because all of the U.S. fair sites studied were in or immediatelyadjacent to downtown, weekday vs. weekend conditions represent a
significant difference. In Knoxville, the Fair site was alsoflanked by the University of Tennessee, so there was even a dif-ference between weekday conditions during regular sessions and thesummer period.
There is a major difference between comparable weekdays and weekenddays, although design weekdays and total days are similar. It is
advantageous to fair transportation designers for downtown sites touse the 80th or 90th percentile weekday estimates. It should berecognized that there will still be a number of peak days onweekends when the weekday system will not be adequate, even afterallowing for capacity convertible from weekday CBD use to weekendfair use.
36

TABLE
3-3:
ATTENDANCE
PLANNING
AND
DESIGN
DAY
STATISTICS
oa)T3c 03O) OE • 1
—E i- O C?c>
O O c P— 0<_) 4- 03 1 CO 1
O) r—00 D_
c.03 <UO 03
-C -r- 03+-> S- S- CO r^. COi- CD CD CT> co 03O E > C\J 1
— CM3 C <C
00 o oco co 10
LD 1— LOCO CO LO
^5w o inCM C\J
CM 03 OCM 1—
O21=cQ
<Q
CJ3Cca
<u_o
C_)
cc
<L)
CL)
cft!
OcM00
03
<n1/3o
c c03 O00 4->
03CDS_+->
co
CL)
+J+->
03CL)
00
000NON
CM O CMCO CO CO
I— 'd-
^03 LO 03co cn coCM I— CM
c5« 5-SCM 'S3’ 03m in -stCO I— CO
00 LO COo oCM I— CM
CO O co00 '=3-
CM I— CM
00 O COCO CO LO
1— I— 'Of-
00 CO CO
lo oCO CO 00
00 LO LO>3-
I— CMr— 1— CM
03 ^3" LOCO CO LO
CO >— CDCO CO cl-
t— COCM <— CO
r— CM LOCM CM
CM O LOCM CM CO
CO O 00CM O LO
rs. cm loCM CM CO
CO O r—CM CM "=3"
cd
oc03-acaj+->
03
03-a
cd0303s-<D>03
O+->
CD CD CD
Oc >3 • 1
— >3 •r— >303 03 4—
>
03 +J 03T3 Q SZ Q C OC CD CDCD >3"0 U >3"0 O >3-0+-> 03 C s_ 03 O S- 03 E+-> -O CD CD -O CD CD T3 CD
<C Q_ Q_>3 CD CD >3 CD CD >3 CD CD
03 CD CD -C 03 <D CD JZ 03 CD CD03 O 3 3 +-> 0 3 3 +-> O 3 3CD 0 OQ. 03 CO
03C•r—
-as_ooCJ03
COcd
s_03
37
SOURCE:
Barton-Aschman
Associates,
Inc.
Weather Impact on Attendance
The 1982 World's Fair experienced only five days of heavy rains
during the morning or afternoon, with few lasting more than two
hours. Attendance on each of the five days was comparable to the
same day of the previous and following weeks. At least for the
1982 Fair, rain had no major impact on daily attendance.
During extended heavy rains in the afternoons, many people left the
Fair early, but the great majority sought cover until rains ended.
The only impact rain may have had was to skew inbound and outboundflows to earlier or later times. Significant amounts of rain never
fell all day during the Knoxville fair. This may be why no impacts
were noted.
Temperature may have played a greater role. There were insuffi-
cient shaded and cooled areas on the site. The site also had
little air movement due to its valley floor location. Hence, heatbuilt up to the point that it became uncomfortable for many on hot
days. This could be overcome by providing more shaded areas and
better air circulation (including in bus terminals). The site
development team has stated that this would be done if they were to
design the Knoxville Fair again.
ENTRY AND EXIT VOLUME CHARACTERISTICS
Fair entry and exit gates need to be sized to meet peak hourvolumes. Entry and exit volume characteristics for The 1982World's Fair were examined for the peak weekday (Tuesday) andweekend day (Saturday).
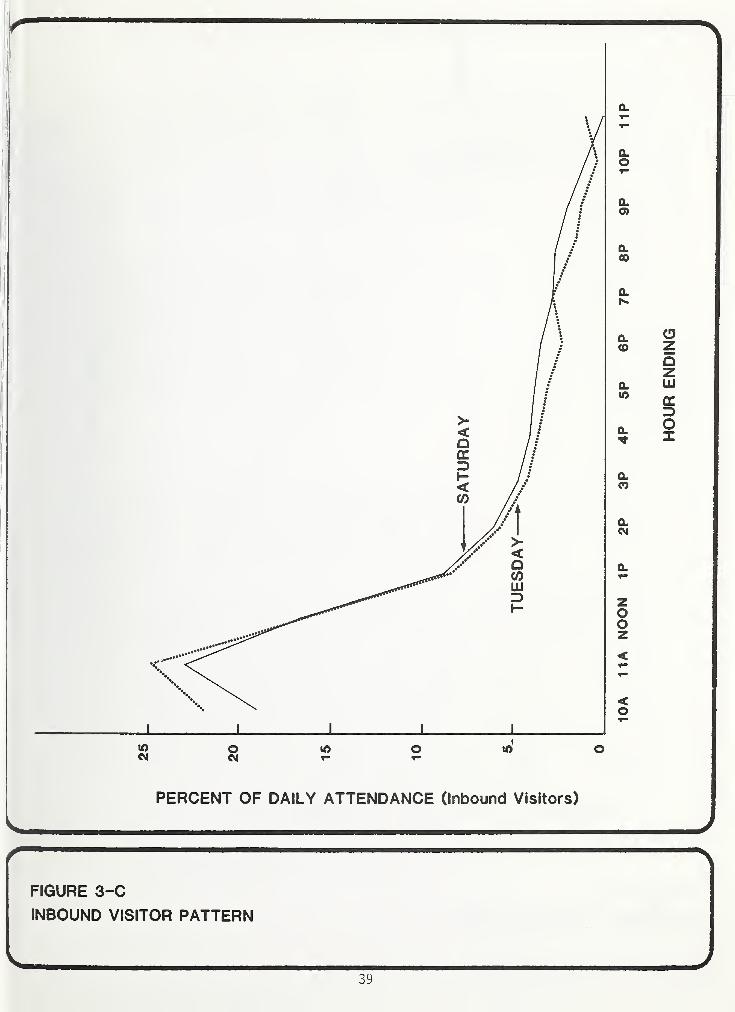
Figures 3-C and 3-D illustrate the inbound and outbound patterns,respectively. The patterns for Tuesday and Saturday are shownand both are very similar. Entry peaks occur between 10 A.M. and11 A.M., with 23 (Saturday) and 25 (weekday) percent of the dailyattendance entering. Inbound volumes drop off rapidly after noon.
Exits increase gradually starting at noon, reaching a plateau of 9
to 10 percent per hour at about 6 P.M. until closing at 10 P.M.,then peaking at 24 to 26 percent during the hour following closing(10 P.M.). For late closings, the total outbound volumes between10 P.M. and 1 A.M. were only about 10 percent higher than the 10-11P.M. hour on early closing nights. As with inbound volumepatterns, exit volumes for Tuesday and Saturday are distributedvery similarly.
38
-J I I I 1
»o O W O U) oCM CM i- r-
CLO
0.
0>
Q.CO
CL
0.
(0
0.
IA
CL
a.CO
a.CM
a.
zooz<
<o
PERCENT OF DAILY ATTENDANCE (Inbound Visitors)
\FIGURE 3-C
INBOUND VISITOR PATTERN
HOUR
ENDING
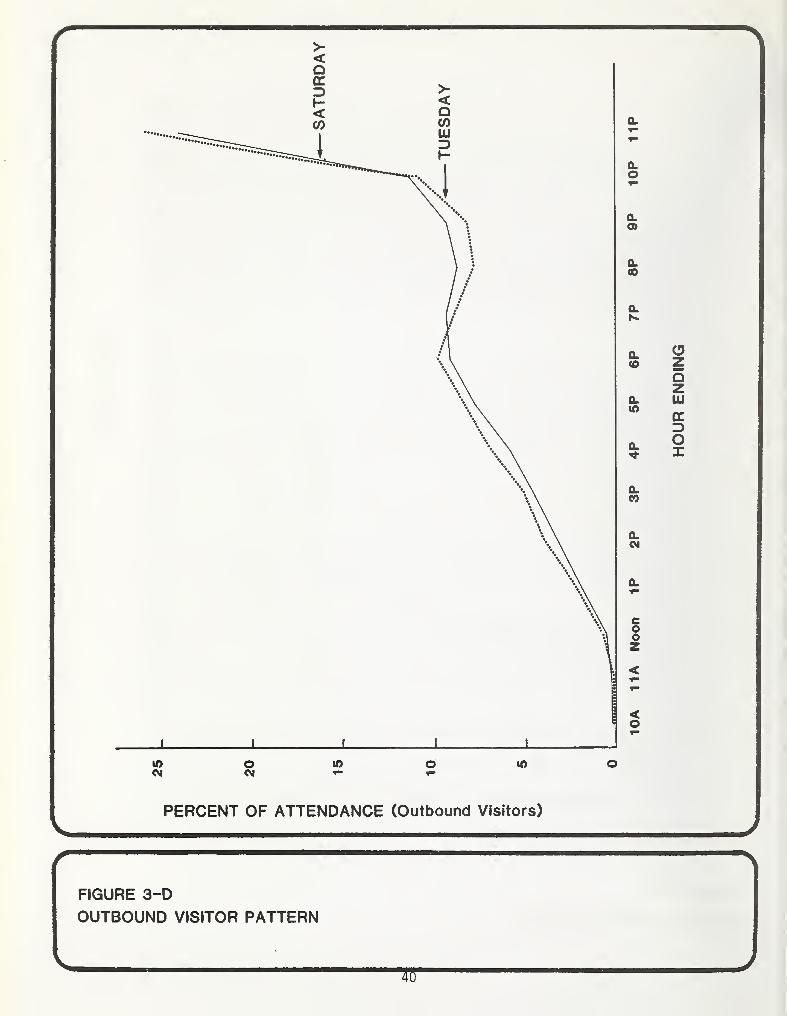
FIGURE 3-D
OUTBOUND VISITOR PATTERN
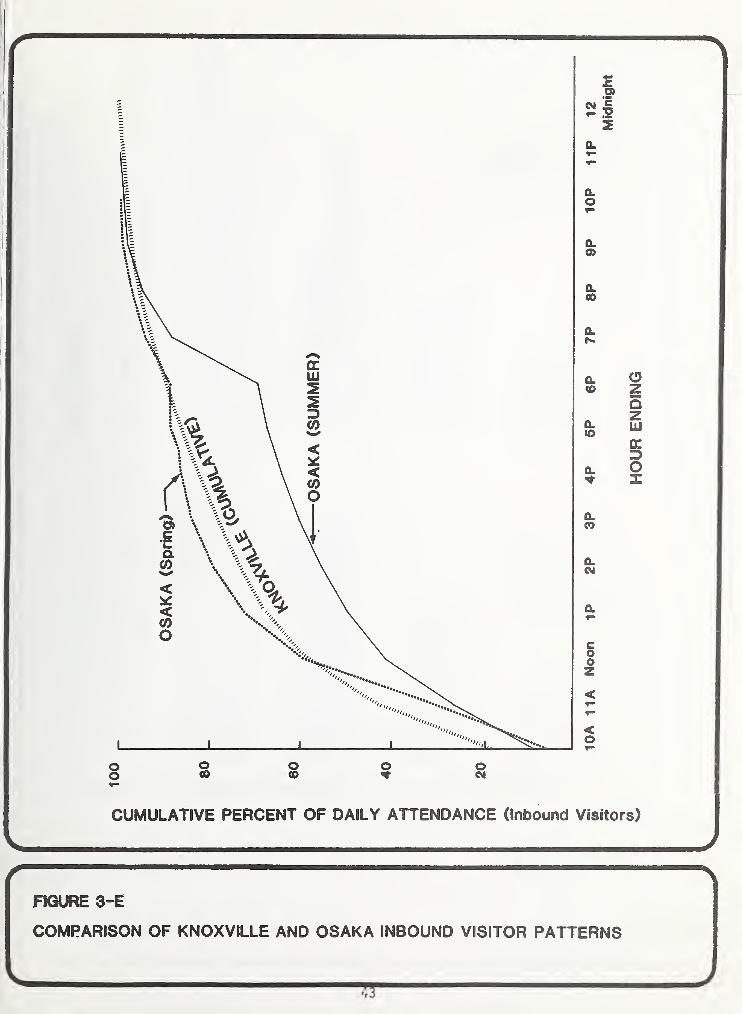
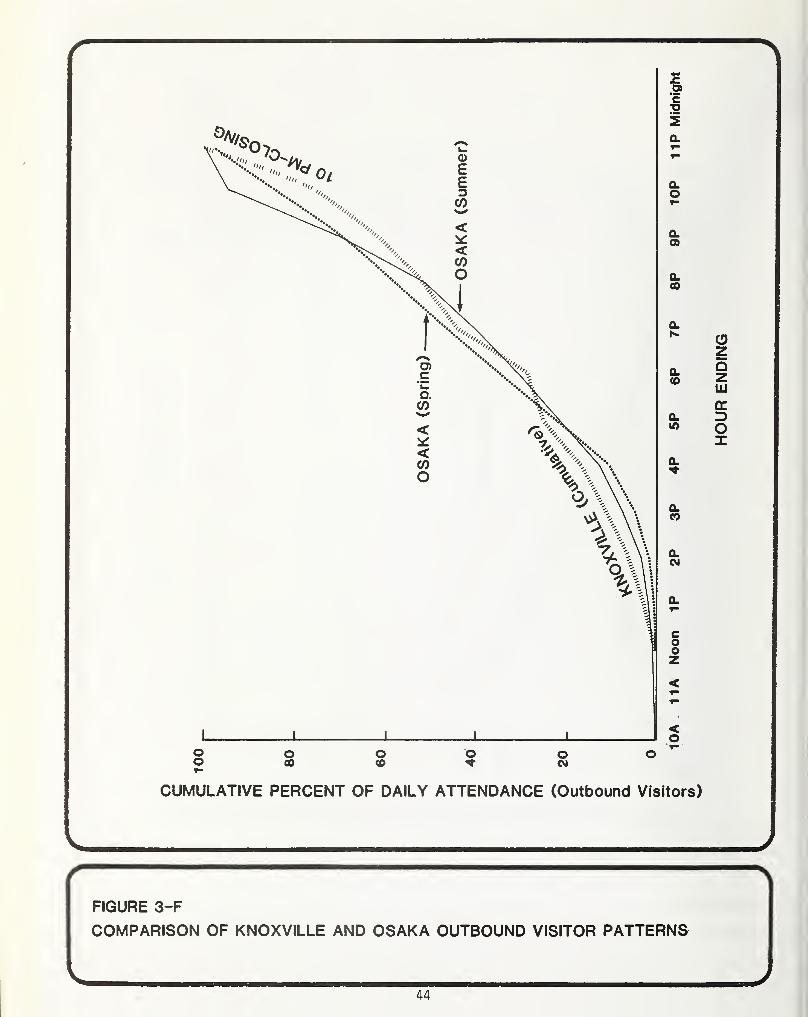
Figures 3-E and 3-F show cumulative entry and exit volume distri-butions for Saturdays for Knoxville and Osaka, the only otherWorld's Fair to have registering outbound turnstiles. The cumula-tive inbound distributions for Knoxville are similar to the springseason pattern at Osaka. The summer in Osaka had an evening peakfrom 6 to 7 P.M.; otherwise the summer pattern is similar to
Knoxville. The outbound cumulative curves are very similar.Based on this, the Knoxville hourly patterns do appear to be usablefor estimating hourly volume distributions.
Theme parks and the State Fair of Texas were used in planninghourly gate capacities for the Knoxville fair. Table 3-4 shows theprojected and actual hourly distributions. The inbound theme parkbased estimates were not far off. However, the state fair inboundand outbound estimates were not representati ve of World's Fairpatterns. Nevertheless, all were reasonably close on the peak hourvolume in each direction. It can be concluded that the peak hourvolume magnitudes may well be determined from several sources. Theactual time of day when the peak will occur is not as easilydetermined, except from World's Fair data (Figures 3-E, 3-F).
GATE SPLITS
The number of gates at recent World's Fairs has varied; Knoxvillehad four. As Figure 3-G illustrates, the peak hour and daily gatevolumes were not evenly distributed among the gates. Daily splitsranged from 10 and 39 percent, while peak hour splits showed an
even wider spread -- between 10 and 50 percent of the hourlyvolume.
Attempts were made during early Knoxville planning stages to spread
the volumes to meet capacity constraints at each gate -- particu-larly the east gate. This was done by increasing or decreasingplanned parking spaces near gates and locating bus terminals or
parking areas at particular gates. While this was a good exercise,site and financial constraints ultimately played a bigger part .in
determining parking and terminal locations than did the desiredvolume distribution. Nevertheless, the decision to have four gates
and the relative magnitude of volumes at each, was planned.
The procedure used was as follows:
1. Estimate volumes by primary mode of arrival (walk,
drive, shuttle bus, local bus, tour bus, taxi, etc.)
2. Determine sources of walking visitors; distributeprojected volume to each area; estimate numberwhich will enter each gate.
41
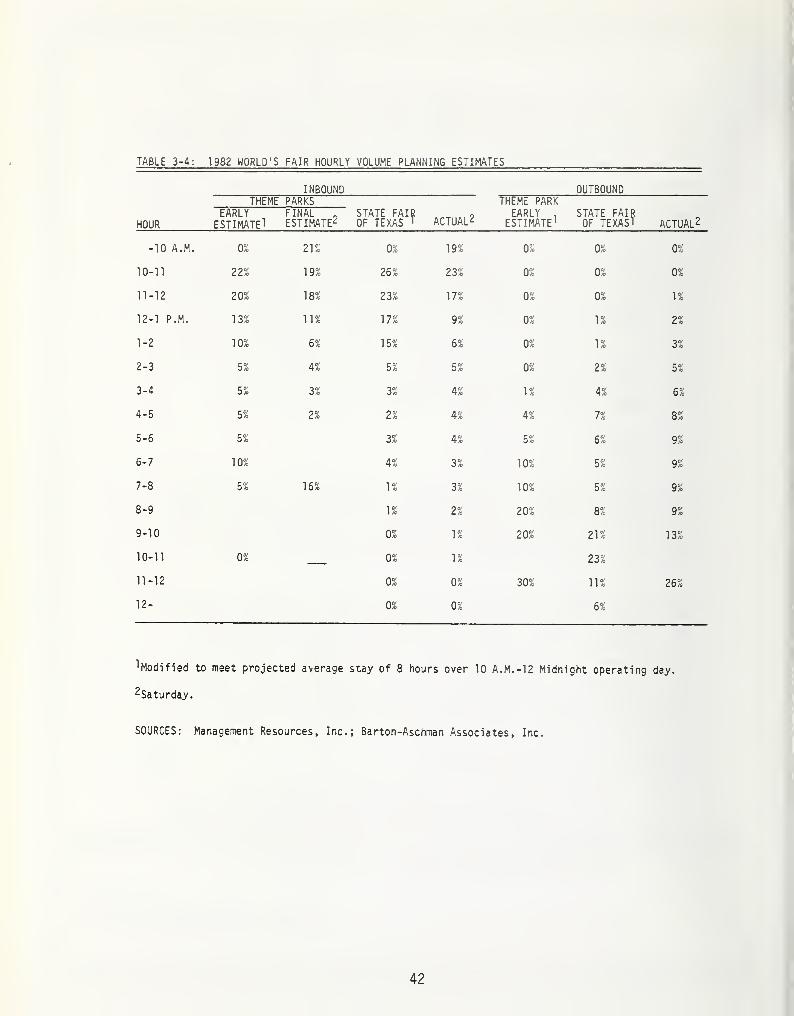
TABLE 3-4: 1982 WORLD'S FAIR HOURLY VOLUME PLANNING ESTIMATES
HOUR
INBOUND OUTBOUNDTHEME
EARLYESTIMATE"!
PARKSFINAL ,ESTIMATE2
STATE FAIROF TEXAS T ACTUAL 2
THEME PARKEARLY .
ESTIMATE'STATE FAIROF TEXAS' ACTUAL 2
-10 A.M. 0% 21% 0% 19% 0% 0% 0%
10-11 22% 19% 26% 23% 0% 0% 0%
11-12 20% 18% 23% 17% 0% 0% 1%
12-1 P.M. 13% 11% 17% 9% 0% 1% 2%
1-2 10% 6% 15% 6% 0% 1% 3%
2-3 5% 4% 5% 5% 0% 2% 5%
3-4 5% 3% 3% 4% 1% 4% 6%
4-5 5% 2% 2% 4% 4% 7% 8%
5-6 5% 3% 4% 5% 6% 9%
6-7 10% 4% 3% 10% 5% 9%
1 oo 5% 16% 1% 3% 10% 5% 9%
8-9 1% 2% 20% 8% 9%
9-10 0% 1% 20% 21% 13%
10-11 0% 0% 1% 23%
11-12 0% 0% 30% 11% 26%
12- 0% 0% 6%
Edified to meet projected average stay of 8 hours over 10 A.M.-12 Midnight operating day.
^Saturday.
SOURCES: Management Resources, Inc.; Barton-Aschman Associates, Inc.
42
CUMULATIVE PERCENT OF DAILY ATTENDANCE (Inbound Visitors)
V, - —r m "" " ,l
FIGURE 3-E
COMPARISON OF KNOXVILLE AND OSAKA INBOUND VISITOR PATTERNS
\
VTS
J
HOUR
ENDING
r
v/" - —\
FIGURE 3-F
COMPARISON OF KNOXVILLE AND OSAKA OUTBOUND VISITOR PATTERNS
V >44

r
\/
—
— 1 —FIGURE 3-G
PEAK HOUR AND DAILY GATE VOLUMES
J45

3. From economic feasibility study and population (census)
data, determine arriving visitor population distribution
by approach route; determine probable parking location
from each approach route, adjusting to reflect any
parking space capacity limitations; determine access
gate for each lot; and estimate number to enter each
gate.
4. Identify gate(s) where shuttle bus stops will be located;
estimate shuttled visitors to enter those gates.
5. Identify gates were local bus stops will be located(near); from distribution of Fair visitors within
local transit service area, estimate patronage by
route; estimate number to enter each gate based on
where each route will serve each gate.
6. Identify gate were tour buses will unload; determinenumber of visitors to enter gate.
7. Taxi and other volumes may be so low as not to affectgate distribution. If they need to be estimated,determine distribution of visitors by geographiclocation; determine approach routes and gates mostlikely to be used; estimate number of visitors to
use each gate.
8. Sum volume (or percentages) by gate.
This procedure will yield daily gate volume splits. Peak hourvolumes must be estimated by using hourly distributionsprojected for visitors arriving by each mode.
At the Knoxville Fair, the most severe peaking of inbound volumeswas generated by tour buses which used a terminal at the NorthGate. This gate operated at capacity many days starting at 9:30-9:45 A.M. Most buses arrived (or tried to) at about 10 A.M. Hadboth the gate and terminal capacities not constrained arrivalpatterns, it is possible that the peak hour percentage at the gatemight have been several percent higher (inbound North Gate capacitywas 12,000 per hour; as many as 25,000 or more were brought in tourbuses as close to the 10 A.M. opening time as possible).
ON-SITE ACCUMULATION AND DURATION OF STAY
The estimate of on-site accumulation is the base for determiningsite size and quantity of facilities and parking space needs.These are based on maximum accumulation during the day.
46
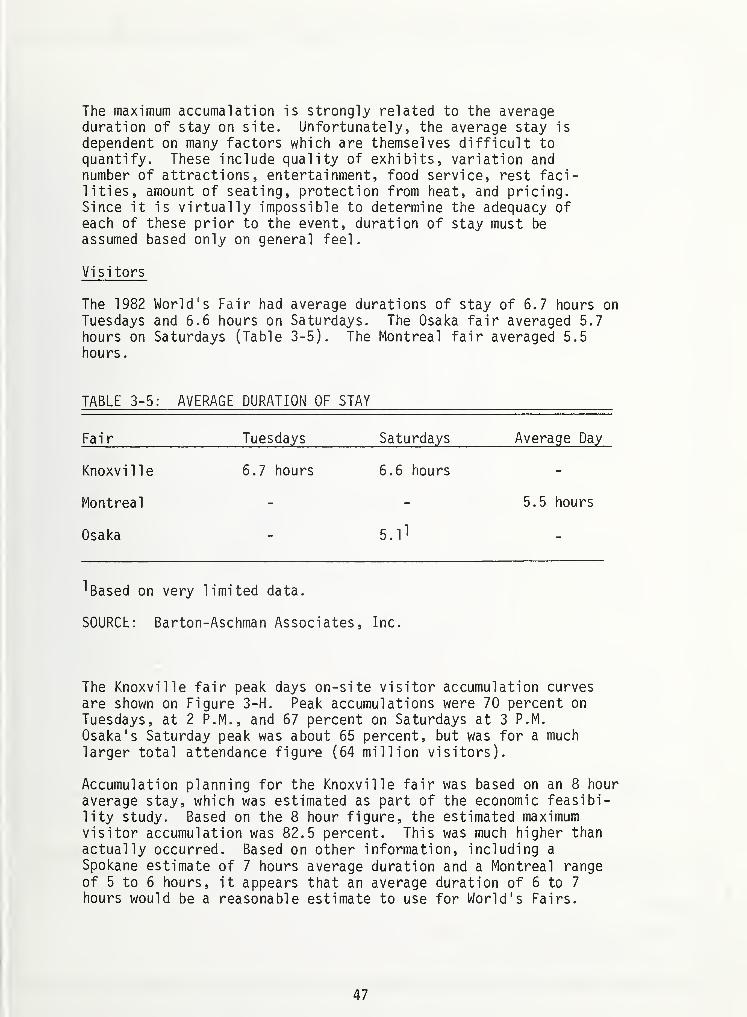
The maximum accumalation is strongly related to the averageduration of stay on site. Unfortunately , the average stay is
dependent on many factors which are themselves difficult to
quantify. These include quality of exhibits, variation andnumber of attractions, entertainment, food service, rest faci-lities, amount of seating, protection from heat, and pricing.Since it is virtually impossible to determine the adequacy ofeach of these prior to the event, duration of stay must be
assumed based only on general feel.
Visitors
The 1982 World's Fair had average durations of stay of 6.7 hours on
Tuesdays and 6.6 hours on Saturdays. The Osaka fair averaged 5.7
hours on Saturdays (Table 3-5). The Montreal fair averaged 5.5
hours.
TABLE 3-5: AVERAGE DURATION OF STAY
Fair Tuesdays Saturdays Average Day
Knoxville 6.7 hours 6.6 hours -
Montreal - - 5.5 hours
Osaka - 5.
1
1 -
1 Based on very limited data.
SOURCE: Barton-Aschman Associates, Inc.
The Knoxville fair peak days on-site visitor accumulation curvesare shown on Figure 3-H. Peak accumulations were 70 percent on
Tuesdays, at 2 P.M., and 67 percent on Saturdays at 3 P.M.
Osaka's Saturday peak was about 65 percent, but was for a muchlarger total attendance figure (64 million visitors).
Accumulation planning for the Knoxville fair was based on an 8 hour
average stay, which was estimated as part of the economic feasibi-lity study. Based on the 8 hour figure, the estimated maximumvisitor accumulation was 82.5 percent. This was much higher than
actually occurred. Based on other information, including a
Spokane estimate of 7 hours average duration and a Montreal rangeof 5 to 6 hours, it appears that an average duration of 6 to 7
hours would be a reasonable estimate to use for World's Fairs.
47

yr~ \
FIGURE 3-H.
ON-SITE VISITOR ACCUMULATION
L ___ )48
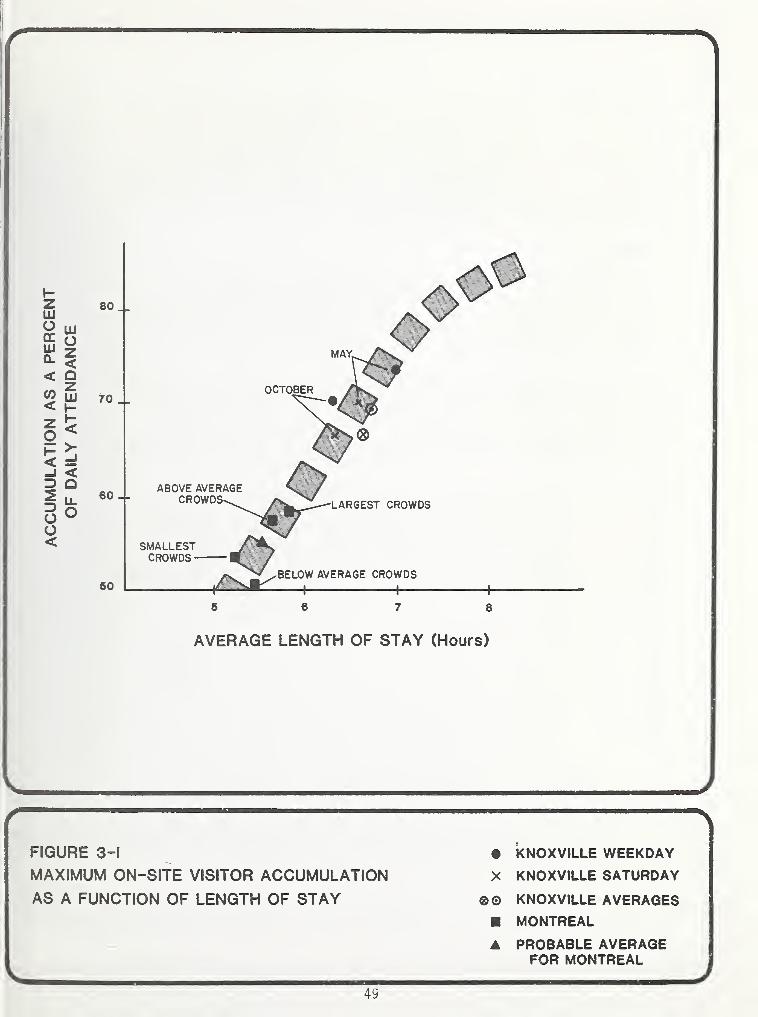
zLU
rr WOC QLU ^<
< QCO ^< H-
-J <3 QIo°O<
80
70
60
50
OCTOBER
ABOVE AVERAGECROWDS
SMALLESTCROWDS -
LARGEST CROWDS
.BELOW AVERAGE CROWDS
—i —\
5 0 7 8
AVERAGE LENGTH OF STAY (Hours)
FIGURE 3-1
MAXIMUM ON-SITE VISITOR ACCUMULATIONAS A FUNCTION OF LENGTH OF STAY
• KNOXVILLE WEEKDAY
X KNOXVILLE SATURDAY
®© KNOXVILLE AVERAGES
MONTREAL
PROBABLE AVERAGEFOR MONTREAL
J4S
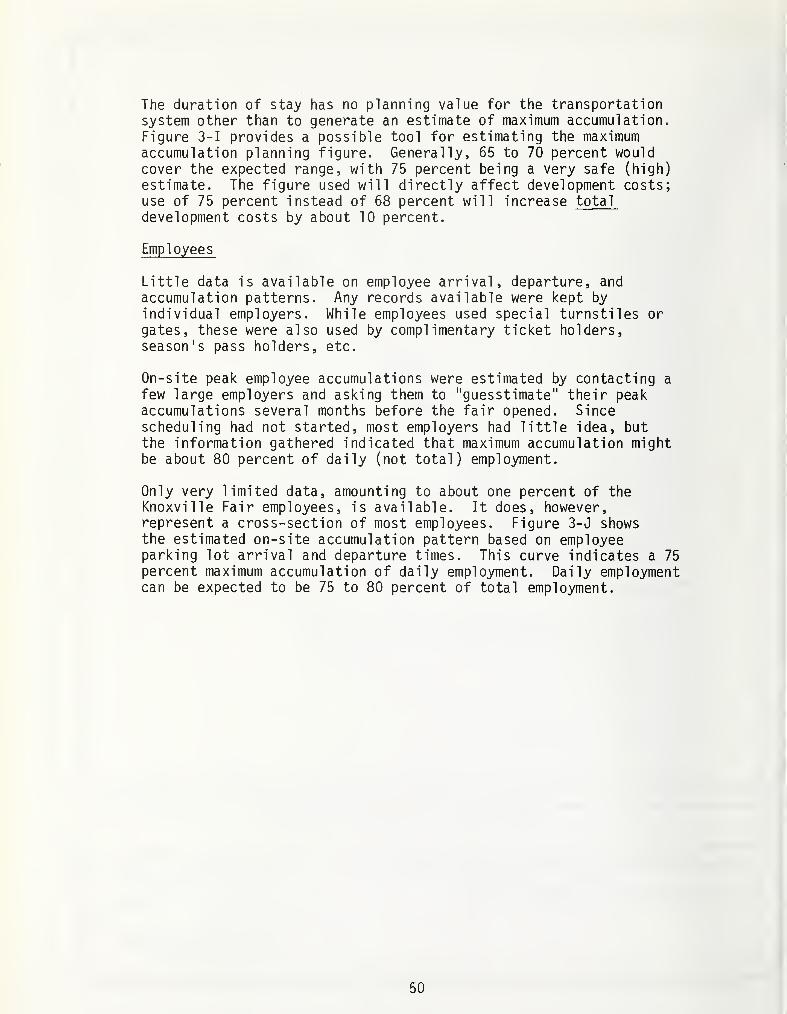
The duration of stay has no planning value for the transportationsystem other than to generate an estimate of maximum accumulation.Figure 3-1 provides a possible tool for estimating the maximumaccumulation planning figure. Generally, 65 to 70 percent wouldcover the expected range, with 75 percent being a very safe (high)estimate. The figure used will directly affect development costs;use of 75 percent instead of 68 percent will increase total
development costs by about 10 percent.
Employees
Little data is available on employee arrival, departure, andaccumulation patterns. Any records available were kept by
individual employers. While employees used special turnstiles or
gates, these were also used by complimentary ticket holders,season's pass holders, etc.
On-site peak employee accumulations were estimated by contacting a
few large employers and asking them to "guesstimate" their peakaccumulations several months before the fair opened. Sincescheduling had not started, most employers had little idea, butthe information gathered indicated that maximum accumulation mightbe about 80 percent of daily (not total) employment.
Only very limited data, amounting to about one percent of theKnoxville Fair employees, is available. It does, however,represent a cross-section of most employees. Figure 3-J showsthe estimated on-site accumulation pattern based on employeeparking lot arrival and departure times. This curve indicates a 75
percent maximum accumulation of daily employment. Daily employmentcan be expected to be 75 to 80 percent of total employment.
50
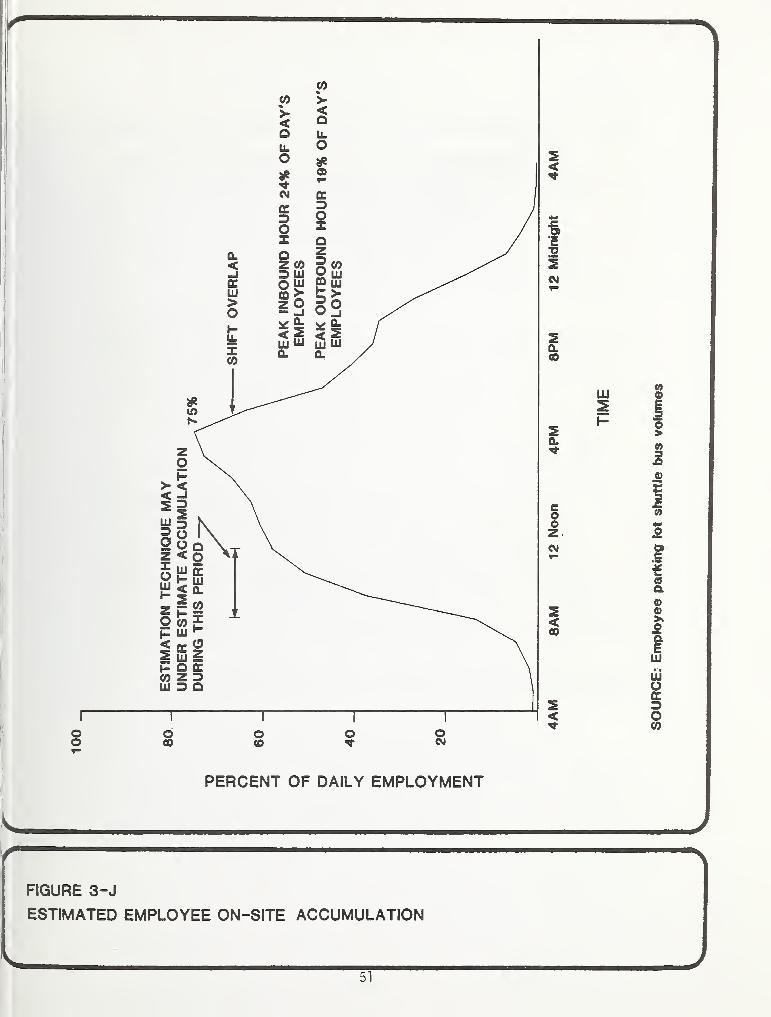
3<
m0.
00
5Q.5T
C©OZ-CM
s<oo
5<
ID
5
o»
£0a00>*
2ILU
ill
occ3oCO
PERCENT OF DAILY EMPLOYMENT
L
FIGURE 3-J
ESTIMATED EMPLOYEE ON-SITE ACCUMULATION
51
MODE SPLIT
Vi si tors
The mode split of arriving visitors is very dependent on the amountof tour bus, shuttle bus, and local bus service to be provided.
The 1982 World's Fair had major tour bus volumes, amounting to 18
percent of total attendance. Other fairs have had very small
percentages. There was only limited use of the abundant shuttlebus services over the course of the Fair due to wide availabilityof convenient parking at a cost lower than two round trip bus
fares. Other fairs have had little shuttle bus activity. Local
bus service has been available to all World's Fair sites.
As shown in Table 3-6, mode split at The 1982 World's Fair was
different in May and June than the following four months. It alsowas different on the peak days of Saturdays and Tuesdays. Tour bus
volumes dropped off near the end of June, and remained relativelystable, as a percentage of total attendance, through the July to
September period. Shuttle buses provided an extremely high level
of service during the first days of the fair. Service quicklydecreased with lower demand levels, leveling off by mid-summer.Local bus usage was lower than originally expected, but wasrelatively stable, as were the taxi and walking modes of access.
It should be noted that the figures in Table 3-6 are estimatesonly. Surveys necessary to accurately determine mode split werenot conducted. However, daily counts of tour buses, selectedcounts of shuttle bus passengers, and changes in local bus usageprovided a basis for estimating use of those modes. Walk estimateswere based on variations in gate volumes at the West and Southwestgates under varying conditions plus an estimate of East and NorthGate walk-ins. The taxi/limousine estimate is a guess based on
observations of taxi operations; this estimate may even be high.
The remainder was attributed to personal vehicles, substantiatedwith a lot occupancy count in May. The estimates in Table 3-6 areconsistent with visitor interview results which were compiled in a
way that is not directly usable for transportation purposes.
52

TABLE 3-6: ESTIMATED 1982 WORLD'S FAIR VISITOR MODE SPLIT
May-June Jul.y-OctoberMode Tuesday Saturday Tuesday Saturday Total
PersonalVehicle 59% 53% 66% 66% 64%
Tour Bus 19% 30% 17% 21% 18%
Shuttle Bus^ 11% 5% 6% 2% 7%
Local ScheduledFixed RouteBus 2% 3% 2% 2% 2%
Taxi, Limousine,etc. 1% 1% 1% 1% 1%
Walk 8% 8% 8% 8% 8%
100% 100% 100% 100% 100%
^Excludes shuttle buses from remote [h~lh miles) officialWorld's Fair parking lots.
Based on past experience, it is not likely that the May-Junepercentage of tour bus riders will be much higher at future
World's Fairs. The management of The 1982 World's Fair aggres-
sively pursued tour group business, and hired marketing staff
which were very experienced and highly regarded in tour operatorcircles.
It is very possible that the combination of shuttle and local bus
percentages can be exceeded in the future. More crowded parking
and/or traffic conditions, more local bus service to visitor
lodging locations, and more effective and efficient (and less
competitive) shuttle service could increase the local shuttle
share. Taxi/limousine access will be quite limited under any
circumstances in almost any city. Walk-ins will be very dependent
on the amount of lodgings within walking distance. Parking prices
($4-$10) in Knoxville do not appar to have deterred many people
from driving, since their other possible choices, except for local
bus, would have been more costly and no more convenient.
53
CONCLUSIONS
The attendance and gate volume information presented in this
chapter provide a good basis for estimating transportation systemdesign parameters for future World's Fairs. On-site accumulationdata is very limited due to the absence of registering turnstilesat all but one previous World's Fairs (World's Fair managers havetrusted their abilities to "judge" on-site accumulations for laborand entertainment scheduling rather than counting). Theme parksand state fairs appear to have somewhat different attendancepatterns.
Gate volume splits can be estimated based on mode splits; availa-ble modal loading locations, and directions of approach, con-strained by capacity availability. However, daily or monthlyvariations of mode split may well change gate splits (and percentof daily volume during peak hours). If adequate capacity cannotbe provided at a given gate, it is desirable to shift some faci-lities for serving transportation vehicles to another gate wheresufficient capacity can be developed.
Finally, site and transportation system design should be based on
the estimated 80th or 90th percentile day's attendance (whichfigure depends on financial and/or physical capabilities), not on
peak day of week percentage or peak month percentage as is
commonly done in economic feasibility studies. This will providemore predictable results.
54

Chapter Four:
ACCESS TO THE FAIR
The 1982 World's Fair site was located in a valley on the west sideof downtown Knoxville. Most of the site was developed on a formerrailroad yard. While close to the CBD and crossed by severalstreets, the site initially had somewhat limited accessibility on
two of its four sides.
Visitors were expected to arrive in personal vehicles, local buses,tour buses, shuttle buses, taxis, and on foot. Adequate vehicularand gate access had to be developed. Employees were expected to
come to the fair by personal vehicle, local bus, and on foot. Theyalso had to be accommodated in the access system, although notnecessarily through the same gates. Service and delivery vehiclesalso had to be provided access to the fair. To the extent possible,this was to be separated from the other access systems.
The access system consisted of the approach road system, nearbylocal bus route segments, parking and terminal facilities includingpassenger loading zones, and gate areas. The Phase 1 reportdescribes the roadway access plan; it is not repeated here. Figure4-A does recap access routes and parking concentrations.
TRANSIT ACCESS
K-TRANS provided service to the Fair via nine routes. No routeswere changed for the Fair, but service was increased by adding
additional sections (extra buses to increase capacity) as warranted,and hours extended to cover Fair operating hours. Existing bus
stops were located at two of the Fair's four gates (see Figure 4-B).
Chapter 9 describes K-TRANS Service more completely.
GATES
Prior to the Knoxville Fair, it was feared that the road system,
serving the Fair would become very congested, since problems alreadyoccurred during local peak periods. The most obvious gate locationwas on the most congested area approach route and had limited nearby
parking. Other locations were similar in nature with limited access
potential
.
It was decided early in the planning process that several gates
would be needed. In the end, it was determined that limited gate
accessibility and capacity necessitated four visitor gates, an
55
employee gate (employees could also use visitor gates), and a
service/delivery vehicle gate. These six gates were to be spreadaround the site to take advantage of existing or developableapproach routes, potential parking areas, and site potential toprovide exciting visitor entry to the Fair. Figures 4-A and 4-Bshow the location of each gate, major approach routes, and majorparking concentrations. Also shown is the on-site warehouse andemployee check-in building.
Visitor Gate Distribution
It was desirable to spread the gate volumes as evenly as possiblefor several reasons:
- Access roadway capacity was expected to be limited neareach gate.
- Potential parking areas were limited at some of the gatelocations.
- Major volumes of visitor circulation were desired for all
parts of the Fair site; the site configuration and
topography made this difficult to achieve with only oneor two access points.
To this end, plans were prepared to assign certain access modes to
each gate to achieve a desirable distribution. Table 4-1 shows this
assignment. In addition to the desired gate volume distribution,these assignments were based on the ability to provide the necessaryaccess and parking or terminal facilities nearby.
The mode split estimates were not sufficiently detailed or accurateestimate gate volumes. As a result, the actual daily gate distri-bution was different than had been projected, although the
orders of magnitude on a daily basis were similar.
Little was known about peaking characteristics by mode. Peakingforecasts were not accurate, but were used only in developing gatecapacity requirements (turnstiles, queuing area). Information on
hourly variations by mode presented in Chapter 3 was not availablefor previous fairs due to the limited data available. The lack of
data is due in part to the short term nature of the events, whichsponsors could not justify the cost to collect data for others'benefit.
56

NFIGURE 4 -A
ACCESS ROUTES ANDFACILITIES
# FAIR GATES
MAJOR PARKING CONCENTRATION
TOUR /SHUTTLE BUS TERMINALOR STOPS
MAJOR VEHICULAR ACCESS ROUTE
/V57

SITE
ACCESS
FACILITIES
r
V
CO
<22<EUiH0)oCD
CO0.
0h<0
<03CD
CO
z.<cI-1
X
COoz<KCO
X<
J58
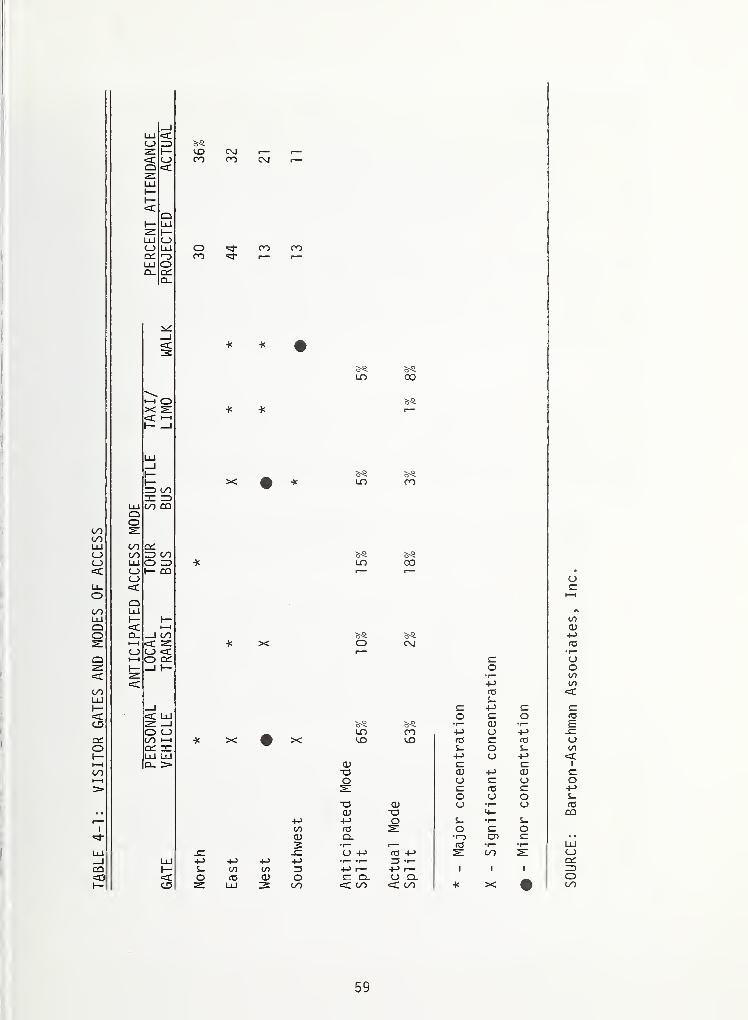
TABLE
4-1:
VISITOR
GATES
AND
MODES
OF
ACCESS
CD
c
CDcm
UJOooo00LUOCDC
CLi—
i
cd
_l
1-1 Ox s<C I—
I
ZD OOnr idoo CO
ccooZDCQ
_J OOC 2ZCD <co cm
COOO
CMOO CM
OOO
3- OO oo
LO CO
oo
co CO
CM
+J03S-
_J d 4-> d=C LU O SC 02: _j •f— aj •r—O CD uo CO +J u +->
00 1—
1
X X • X CO CO 03 sc 03cm nr d 0 dUJ UJ +-> 0 +JQ_ > QJ d d
-O OJ +J QJ
O a d CDd 05 d0 CD O
T3 O) 0 • 1— CD
cu -0 0-•*-> 4-> 0 d •p— dto fO 2: 0 d OQJ Q. •<-> CO d2 • 1
— n— 03 •1
—
•r-
-d -d CD 4-> 03 4-> 21 00 21UJ 4-> +-> +-> +D 1
— i“ O •!-
f— d to to Z3 +-> 1— 4-> r— 1 1 1
C o 03 <D O O Q. O CLo 3 UJ 3 00 C 00 <C OO * X •
59
SOURCE:
Barton-Aschman
Associates,
Inc.
Access Provisions . Each visitor gate contained ticket booths and
turnstiles. The booths were placed away from the turnstiles to
avoid conflicts between any gate queues and people waiting and
circulating around the ticket booths. Most turnstiles handled two-
way movement. This reversible feature permitted a lower total
number of turnstiles to accommodate inbound and outbound peaks. All
turnstiles had built-in counters to enable volumes and trends to be
monitored. Just inside the turnstiles there was a clear area forvisitors to reorganize their groups and proceed. At some gates thisclear area was limited and congestion developed at the turnstiles.While crowd control personnel were able to minimize these problems,a better solution would have been to provide more space and no
sharp turns in the gate departure area. Separate turnstiles wereprovided for employees, pass holders, and other special types of
admissions. A swinging gate was provided for wheelchair accessat each gate.
Resul ts
Only the North visitor gate operated at or above capacity with anygreat frequency. This gate had to accommodate tour bus volume peaksstarting at 10 A.M. During May, when tour bus volumes were attheir highest, queues reaching over 1,000 people developed andremained for up to an hour. This occurred for two reasons, in
addition to underestimating the tour bus split:
- Nearly all tour operators wanted to arrive at 10 A.M. Thedesired peaking would have absorbed all available capacityof the terminal in which the buses unloaded and/or thegates, whichever was lower.
- The tour bus terminal capacity, which had been anticipatedto be 180 unloading buses per hour, was increased to 275
buses hourly by modifying the operating procedures. Thishigher terminal capacity could by itself generate enoughvisitors to absorb all North Gate capacity. The severalthousand parking spaces near the North Gate also generatedup to two thousand inbound visitors hourly. Hence, thecapacities of the access system exceeded the capacity ofthe turnstiles.
Over a period of time, three changes occurred which reduced thisproblem to a manageable level: (1) gates were opened at 9:30A.M. to handle early arrivals and reduce the initial queue,(2) tour operators realized not everyone could arrive at the sametime and many rescheduled their arrival times to the 11 A.M. - 12
noon period, and (3) tour bus volumes dropped somewhat from theirearly peaks.
60
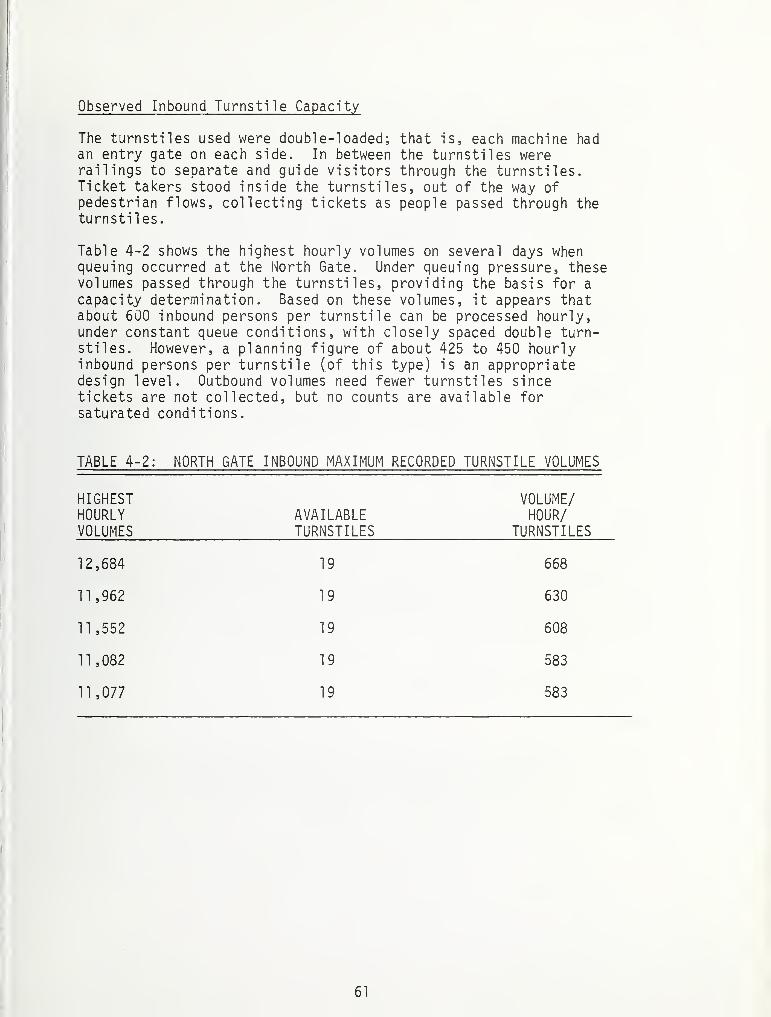
Observed Inbound Turnstile Capacity
The turnstiles used were double-loaded; that is, each machine hadan entry gate on each side. In between the turnstiles wererailings to separate and guide visitors through the turnstiles.Ticket takers stood inside the turnstiles, out of the way ofpedestrian flows, collecting tickets as people passed through theturnstiles
.
Table 4-2 shows the highest hourly volumes on several days whenqueuing occurred at the North Gate. Under queuing pressure, thesevolumes passed through the turnstiles, providing the basis for a
capacity determination. Based on these volumes, it appears thatabout 600 inbound persons per turnstile can be processed hourly,under constant queue conditions, with closely spaced double turn-stiles. However, a planning figure of about 425 to 450 hourlyinbound persons per turnstile (of this type) is an appropriatedesign level. Outbound volumes need fewer turnstiles sincetickets are not collected, but no counts are available forsaturated conditions.
TABLE 4-2: NORTH GATE INBOUND MAXIMUM RECORDED TURNSTILE VOLUMES
HIGHESTHOURLYVOLUMES
AVAILABLETURNSTILES
VOLUME/HOUR/
TURNSTILES
12,684 19 668
11,962 19 630
11 ,552 19 608
11,082 19 583
11,077 19 583
61

Employees Gate
A special gate was provided for employees near the building wheremost on-site employees of the fair corporation worked. This gate
was needed so other gates could be closed down outside operatinghours. Site planners also intended to separate employees fromvisitors during peak periods to avoid further accentuating the
peaks. The employee gate was patrolled by fair security staff,with employee identification badges being used to gain entry.
The employee gate was located at the far north end of the Fairsite. While convenient to the KIEE employee check-in location, it
was far from many of the exhibitors' and concessionaires'employee check-in areas. Because of this the employee gate wasnot widely used. A major remote employee parking facility was
provided with shuttle bus service to the employee gate. Several
on-site employees lobbied to have the employee shuttle pick up anddrop off employees at the more centrally located East Gate.
In hindsight, if an employee gate was actually needed, a morecentral location would have been no more difficult to patrol.The actual operating benefits of the employee gate, as used in
Knoxville, were not evident.
Service/Del i very Vehicle Gate
The service/del ivery vehicle gate was also located at the northend of the site (see Figure 4-B). It was not necessary for thesevehicles to enter the Fair site itself; all deliveries were madeto the warehouse and moved from there to specific locations late
at night when the Fair was closed. In practice, the employee gatewas used for some deliveries outside of Fair hours. This arrange-ment worked well and no conflicts arose between service/del iveryvehicles and other fair functions, including vehicular or pedes-trian access to other gates.
DISTRIBUTION OF PATRONS BY GATE
Projections
Estimates of gate usage were based on the anticipated distributionof visitor trip origin locations. Since few visitors from beyond100 to 150 miles were expected to visit for one day only, it wasassumed that all visitors would come from "local" residences orlodgings.
62
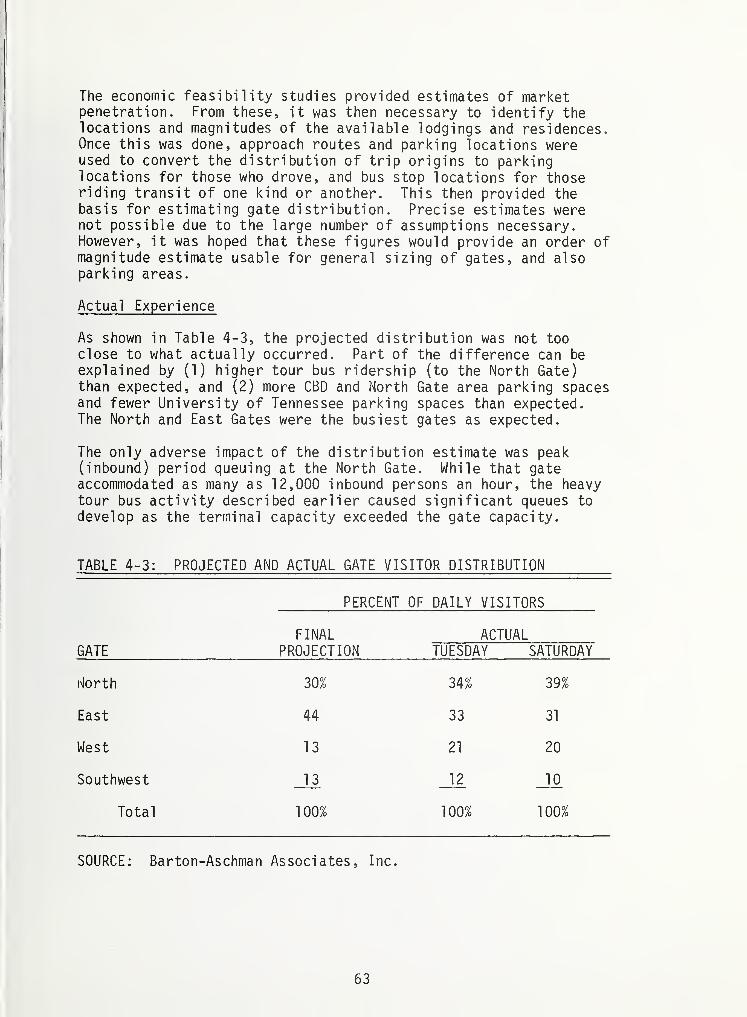
The economic feasibility studies provided estimates of marketpenetration. From these, it was then necessary to identify thelocations and magnitudes of the available lodgings and residences.Once this was done, approach routes and parking locations wereused to convert the distribution of trip origins to parkinglocations for those who drove, and bus stop locations for thoseriding transit of one kind or another. This then provided thebasis for estimating gate distribution. Precise estimates werenot possible due to the large number of assumptions necessary.However, it was hoped that these figures would provide an order ofmagnitude estimate usable for general sizing of gates, and alsoparking areas.
Actual Experience
As shown in Table 4-3, the projected distribution was not tooclose to what actually occurred. Part of the difference can be
explained by (1) higher tour bus ridership (to the North Gate)than expected, and (2) more CBD and North Gate area parking spacesand fewer University of Tennessee parking spaces than expected.The North and East Gates were the busiest gates as expected.
The only adverse impact of the distribution estimate was peak(inbound) period queuing at the North Gate. While that gateaccommodated as many as 12,000 inbound persons an hour, the heavytour bus activity described earlier caused significant queues to
develop as the terminal capacity exceeded the gate capacity.
TABLE 4-3: PROJECTED AND ACTUAL GATE VISITOR DISTRIBUTION
GATE
PERCENT OF DAILY VISITORS
FINALPROJECTION
ACTUALTUESDAY SATURDAY
North 30% 34% 39%
East 44 33 31
West 13 21 20
Southwest 13 12 10
Total 100% 100% 100%
SOURCE: Barton-Aschman Associates, Inc.
63
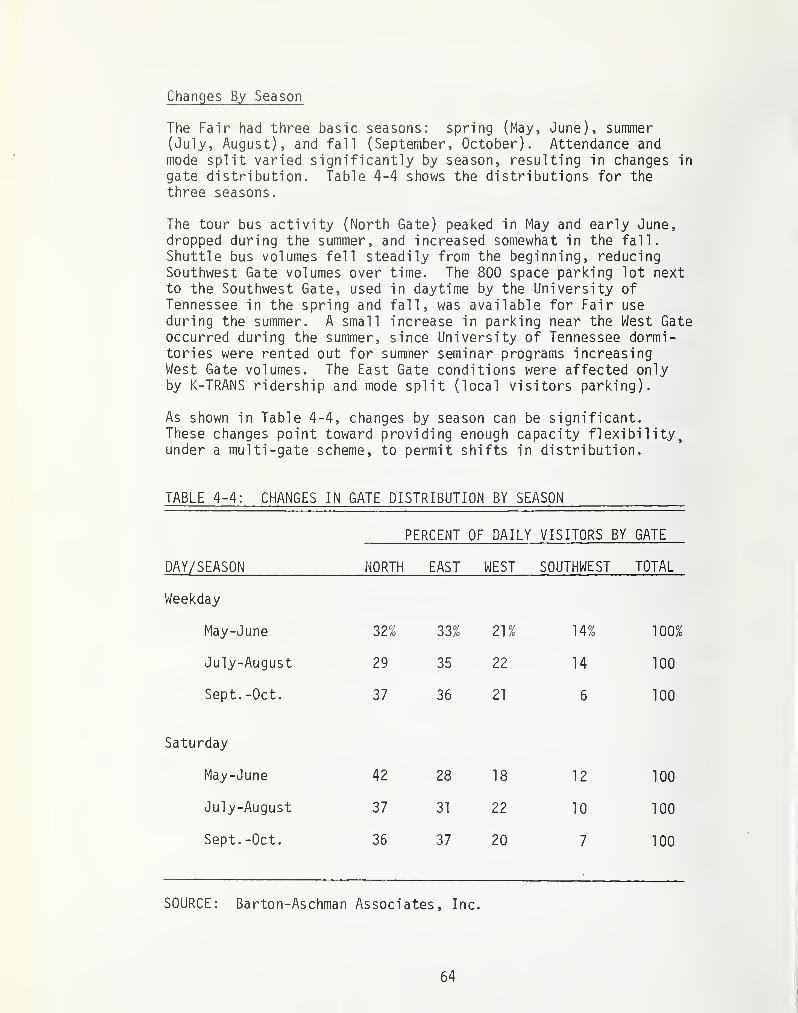
Changes By Season
The Fair had three basic seasons: spring (May, June), summer(July, August), and fall (September, October). Attendance andmode split varied significantly by season, resulting in changes in
gate distribution. Table 4-4 shows the distributions for the
three seasons.
The tour bus activity (North Gate) peaked in May and early June,dropped during the summer, and increased somewhat in the fall.
Shuttle bus volumes fell steadily from the beginning, reducingSouthwest Gate volumes over time. The 800 space parking lot nextto the Southwest Gate, used in daytime by the University of
Tennessee in the spring and fall, was available for Fair useduring the summer. A small increase in parking near the West Gateoccurred during the summer, since University of Tennessee dormi-tories were rented out for summer seminar programs increasingWest Gate volumes. The East Gate conditions were affected onlyby K-TRANS ridership and mode split (local visitors parking).
As shown in Table 4-4, changes by season can be significant.These changes point toward providing enough capacity flexibility,under a multi -gate scheme, to permit shifts in distribution.
TABLE 4-4: CHANGES IN GATE DISTRIBUTION BY SEASON
PERCENT OF DAILY VISITORS BY GATE
DAY/SEASON NORTH EAST WEST SOUTHWEST TOTAL
Weekday
May-June 32% 33% 21% 14% 100%
July-August 29 35 22 14 100
Sept. -Oct. 37 36 21 6 100
Saturday
May-June 42 28 18 12 100
July-August 37 31 22 10 100
Sept. -Oct. 36 37 20 7 100
SOURCE: Barton-Aschman Associates, Inc.
64
INFORMATION SYSTEMS
Four basic types of information systems were utilized to assistvisitors' access:
- roadway trail blazer signing (see Phase I Report, p. 59-65).
- color coding of gates
- directional signage inside the Fair
- transportation pamphlets [see Phase I Report, p. 163-166)
Trailblazer signing brought visitors to parking lots. Bus drivers,taxi drivers, and other professional service drivers were expectedto know their way, either through local familiarity or brochuresmailed directly to them. No special signs brought visitors fromlots to gates. This caused a problem for some, but did notgenerate many complaints.
The pamphlets also helped provide directions to parking areas, butnot to gates (intentionally). This was done to discourage "cruising"for parking or sightseeing near gates and minimize the correspondingtraffic congestion.
Gates were each decorated in a bright color (yellow, blue, green,red). This was supposed to help identify the gate to visitorsand help them remember where to exit. However, interior signingdid not provide directions to gates by name, direction, or color.
Consequently, some value was lost since the visitor had to go to
an information booth (several provided - near gates) to find outwhere a particular gate was located. Directional signage wasplaced on site, but was not very prominent. There appeared to
be great need for more signing only to gates and restrooms.
VEHICLE OCCUPANCY
Visitors
Based on experience at other special events, non-bus vehicleoccupancy was projected to be about 3. 5-3. 6. The lower figure was
used to provide a conservative base for planning.
Only limited surveys were made of vehicle occupancies during the
Fair. Relatively extensive data for remote parking lots (which
attracted mainly out-of-town and out-of-state visitors unfamiliar
with the area) showed an average of about 3.9 persons per vehicle.Since local families and friends came in smaller groups (and did
65

not park in remote lots), it is estimated that the overall averageoccupancy for personal vehicles was probably closer to 3.75
(vehicle occupancies experienced at Seattle were estimated to
range between 3.6 and 4.0).
In terms of parking requirements, this higher figure had the
affect of reducing the actual need by some seven percent. Withthe vast oversupply of parking, it made little difference in
Knoxville.
Employees
Only limited data was collected for employee parking. Counts at
the remote employee lot averaged 1.14 persons per vehicle comparedto an expected 2.0. This was even lower than the 1.39 averagecounted during morning rush hours in downtown Knoxville.
It is possible that employees who sought parking closer to the
Fair, in more expensive and/or less plentiful areas, may haveridden in larger groups. No data were collected to substantiatethis assumption, however.
CONCLUSIONS
Access to The 1982 World's Fair was very good. Certainly, majorroadway improvements (discussed in Chapter 5) had a significantpositive impact, as did the over supply of parking. A smallerthan projected percentage of people driving personal vehicleswas an additional benefit.
Four visitor gates were used to spread access traffic and compen-sate for limited gate capacity at some locations. Projections ofgate usage were based on several assumptions; accuracy was onlyadequate for "order of magnitude" use. In addition, gate distribution, which was sensitive to changes in mode split and parkingavailability, varied by season. Hence, if a multi-gate accessapproach is to be utilized, capacity should be provided at eachgate to accommodate fluctuations in distribution or a means ofadjusting the distribution should be devised. In addition, gateshandling tour and shuttle buses should be designed to accommodateshort, sharp peaks, and their capacities should at least equalthose of the bus terminal or parking facilities to unload visitors
A separate employee gate will probably not be fully utilizedunless centrally located relative to all bus stops and employeeparking facilities (official and unofficial), and most employeecheck-in areas. A poor location in either respect will result in
employees using visitor gates.
66
An effective information system is necessary to direct visitors to
parking areas and gates. Such systems should emphasize parkingarea rather than gate locations to discourage "cruising" pastgates.
Visitor vehicle occupancies are likely to be higher than for otherevents. Seattle's 3. 6-4.0 and Knoxville's 3.75 for visitors pointto using higher than the 3.25 used in planning for the Seattlefair and the 3.5 used for the fairs in San Antonio and Knoxville.
67

Chapter Five:
ROADWAY AND TRAFFIC CONSIDERATIONS
During the planning stages of the 1982 World's Fair, many citizensand government officials feared that the Fair would cause sixmonths of constant traffic congestion. This fear was based on the
projected 60,000+ people per day that would attend the Fair com-pounded by the fact that Knoxville's Interstate Highway and streetsystem had been inadequate to meet traffic needs even without the
presence of such an event. Further, the traffic problems thatoccur in conjunction with University of Tennessee home footballgames led many people to equate the World's Fair with six monthsof similar traffic congestion. These perceptions strongly moti-vated Fair organizers and City and State officials to take an
aggressive posture in implementing planned roadway improvementsprior to the opening of the Fair. Fair planners strove to providegood access to the Fair and its terminal and parking facilitieswhile maintaining good levels of service on central area streets.
As it turned out, the roadway improvements were well planned and
were aided by the traffic patterns that materialized during the
Fair. Both of these subjects will be dealt with in this chapter.
ROADWAY PROJECTS IMPLEMENTED FOR THE WORLD'S FAIR
Since it is not the intent of Phase II to duplicate informationpreviously presented, the reader is referred to the Phase I reportfor general information on this subject. This section will
present details on much of the same information.
Table 5-1 lists the various roadway improvements and projects thatwere planned and implemented for the Fair; these are located on
Figure 5-A. In some cases, the projects were part of the long
range transportation plan for the Knoxville area but were advancedin scheduling for the Fair (see Phase I, page 57). The Fair had a
positive impact on the overall transportation system in that
Knoxville received several large-scale road improvements in a
short span of time that will continue to operate efficiently well
into the future. Table 5-1 attempts to quantify the scheduling,
cost, and approximate increase in capacity effected by the
projects. Also included are general comments concerning what the
projects were expected to do and reflections on their resultingoperation.
69
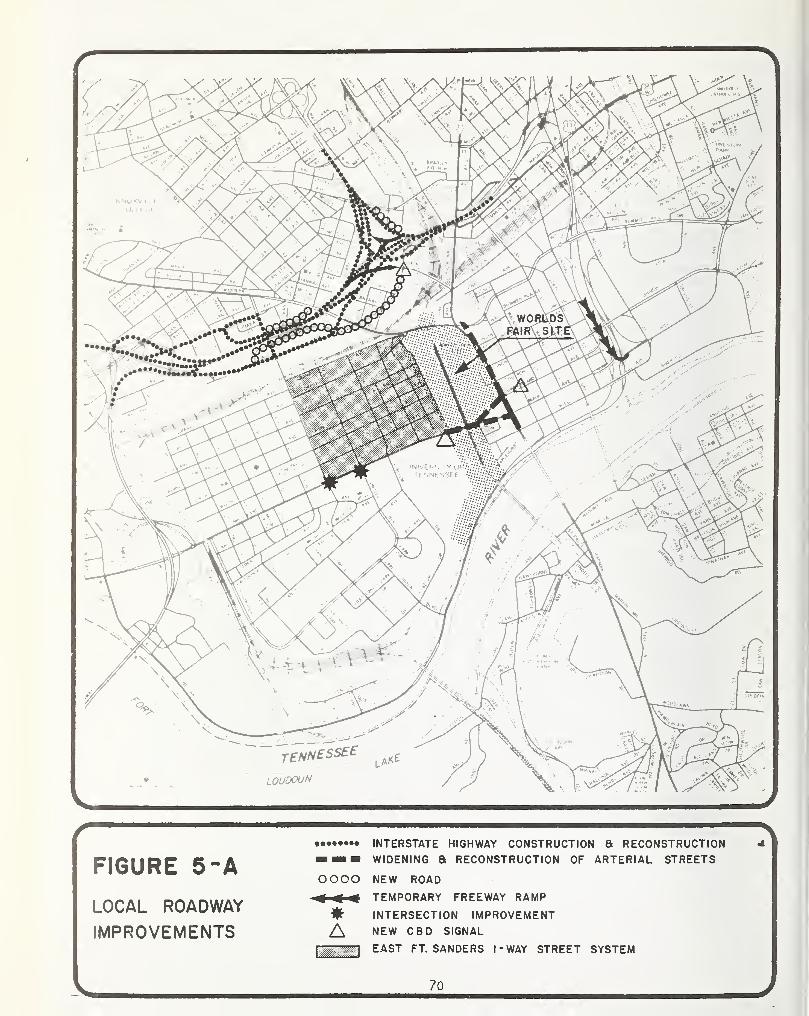
KNOXVILLECOLLEGE
TENNESSEE
LOUDOUN
l aK£
rFIGURE 5-A
\•••••••• INTERSTATE HIGHWAY CONSTRUCTION a RECONSTRUCTIONw am m WIDENING 8 RECONSTRUCTION OF ARTERIAL STREETS
OOOO NEW ROAD
LOCAL ROADWAY
IMPROVEMENTS
< TEMPORARY FREEWAY RAMP
Jfr INTERSECTION IMPROVEMENT
A NEW CBD SIGNAL
EAST FT. SANDERS I -WAY STREET SYSTEM

TABLE
5-
1:
SUMMARY
OF
TRANSPORTATION
PROJECTS
IMPLEMENTED
FOR
THE
WORLD'S
FAIR
CDcCl.
C/3
ocd
a;cr>
3 -3O 03
O i“” • ** 34— 03 ai o<D 11 QJ C i.-Q > i- 4-J .3
03 <2 4-> •
T3 -3 CD S-
0) O 3 r— -r-
4-> 4-J -r- 03
D I— £- ro Ll.•<- 00 3
Q. 2 4-> 02 02 CDE •«- D 30 0 4—. l -r-
O D <— 02 s-LO 3 D 3 3
-3 I aj 5 03 T3ar*—« 42 -3o -a coo « <u QJ • *-3 i. C7> -X S- u4-> -r- 3 S- -r- 3
1— 03 03 O 03 i-
«=C U_ i» 5 U_ 4->
D 4--3 o4-J 00
S- 4->
QHU Cc -a d•<- E 02s- ZJ -r-
cj 3 o“O u
*— oa1— 03i— +j aiCD O 4->
2 h- 03 •
+-> 0202 co 0J
d • i- u^ i. flj 3L-r- 4JT3O oo 3 CD3 Lu •*- S-
CD3s-3“O
d2
3 OO -r-
o 03 U •* 034-> _C 3 (D i-
4-> 3 i- 4->
CO 4-33 E 4-> 02o a» o 3 oj•i— 4-> 4-> 4- 4->
4-» cO ro>, ai ajr—
13 IA 3 C QJ02 3 4-J i-ro d •<— i
4-J 4-> O S- ED 03 3 4-> -r- Di— 4-J O 3 03 -342 C0 O *i— Ll- 4-J
03 S-3 D 43 02<— 4-> r— i— U QJro 3 !— CD 3 co> -r- ^ 5 E 3
>>
420342OS-CL
•* S-•**(/) -r—i- 4-> 03•r- SLL03 DU.T3 i.
•r- d3 U 4J3 U 4-•r~ 03 03S-3 -0-002 D D
U >-0 3 0an: =CO CD CDID S- S-
LU >-on h—<=£
LU CDct cc_) Q_z <
• CD
3oi-
2CD3
34Z O >>O.T- r—> 4-> 3u aO CD
03 L CDCXI *r- 3LO *0
O CD 3O 3 •»-
LO O 03c^n— E
3O
uQJ
-3 S-Q-*t-> -o
O CDCD 3
O
I— CdCD •—
i
C <CCl. ll.
CD I—LU CCl. _J
3 U «—O •«- ro£- 4- i-
(D 4->
>O cOE rxCD I
Cd
S-o
CD 4—-o o•r- CD «d-> > I
O -r- —
•
i- 4->
CL 03 -3 U3 0>-r-
••• i- 3 4-03 CD O 4-CD 4-J S- 03S- r— JC i-03 03 D D
>> CD03 U2 3CD -OCD (D 4-J 4-J
L QQ 03 (D L4- 03 O
• CO 3 -3>, 4-J 03 COCD
co03 *r- U OCD Ur— S- 4-J
S- 03 4- CDu a 3 4J qj3 03 O 3 3*—
• U U -r- “O
>>03£0)
CDU
CD >>C0 4-J
03 *p-
<D US- 03U CL3 03
CJ
O «
4-J CO
co •«—
CD • •* 4-U Q 4-U CQ 03
CD “O S-i/l 3 Q» fl03 03 4Ji
—
QJ 3S- S- 42 UU *r— *i— CD3 03 L >
O
4-
> 033
CO v—co 4*:
(D S-U 03U Q.03
ECD 3TJ QJ•r- l/>
> 03O r— CD5- O S-Cl U <
onOCD
coCD
Lf3 03i— 00 3I— CD 03<^-3-0-3
O 3 UCD -r- r— i_4-> r— u <D03 r— 3 4-J
+->*,-• r- 3on E —t-
LO3O
CD -r-
C/3 E
co^ 3O
0) -r-
OO E
TJ ^CD CXI
“O '
3— EU CD3 4-J
CDU1
CXI
coI
<d-
CXI CXI
CO coI I
«sr co
COIo
CQ 3O
4- S-
O 03
CdCDC/3
Q
3 D >,O 4-> 4->
•<- 3 -r-4-J O U
03 4-J
Q. 3CD
• ** 1/3
>, CD 03 CD 033 03 03 O r—
COCD 53 U 03 COCDCD CD -3 03 i— C2 03-33 ^ C7> -3 «=£ 4-»
03 4-J -r— U 4-J S_i— <D 3IS--OUt-S-
-Q CD 3 3 03 OLO (3 4J (13 i- Q_ 4—
I 3 O 3 4-J
O U*r-LO LO TD•i— -— N 3 03 0304-JC 4-CXI 020 •
4-J U o I U I £- <D<D “O *—
• CD 4-J
03 S-33 •- C 0) 033 -r- 03 033 >>0 03 4-J
•r- TJ -i— D 03 (3 l/l
3 in (A aj $ L 4J L<D-3 f^D ^-303 CD"O U CXI "O 4-J 03 r— O 4-J
-I— ra l QJ CD *r- -r- t- 33 D • L Z I < 4- -r-
U 0303 OQJ U I—
-D a_CD-Q “O
•r— 4-J 033 U 2 •
CD QJ -3 ^O02 U C7l 03•r~ t- -r- Q20IQQ
CD -3U 4-J
3 J-03 C 02U ^ 34-J 03
O*3-
3 LO EQj P*^ 4-J O
CXJ 00 S-O I QJ 4-
CL3 O O EO 4-J "vj" 03•r- I U4J (A m•i— CL 4-J 4-J
-O E "O •<- CA02 03 3 X 03< L OJ QJLU
CLE03s- a.o
4-J o•r— __l •
X QJQJ <S) 3
c/3 3ODD4-J 3 >— <3 L0O o I—•r CQr-
02 O02 U Oc£ 4- -U
X>- I—C CD
O<=3-
C£>O
Q ^< OO QCQC Q.
Or
D>3 4->
U 03ro 4-J
S- LO
O L lAQ- D CLE 4-J ED 3 03
I— *—• Cd
ES- O 03(13 L (Ai- 4- (DO 3Q- CLE E ooD 03 3(-3 3
71
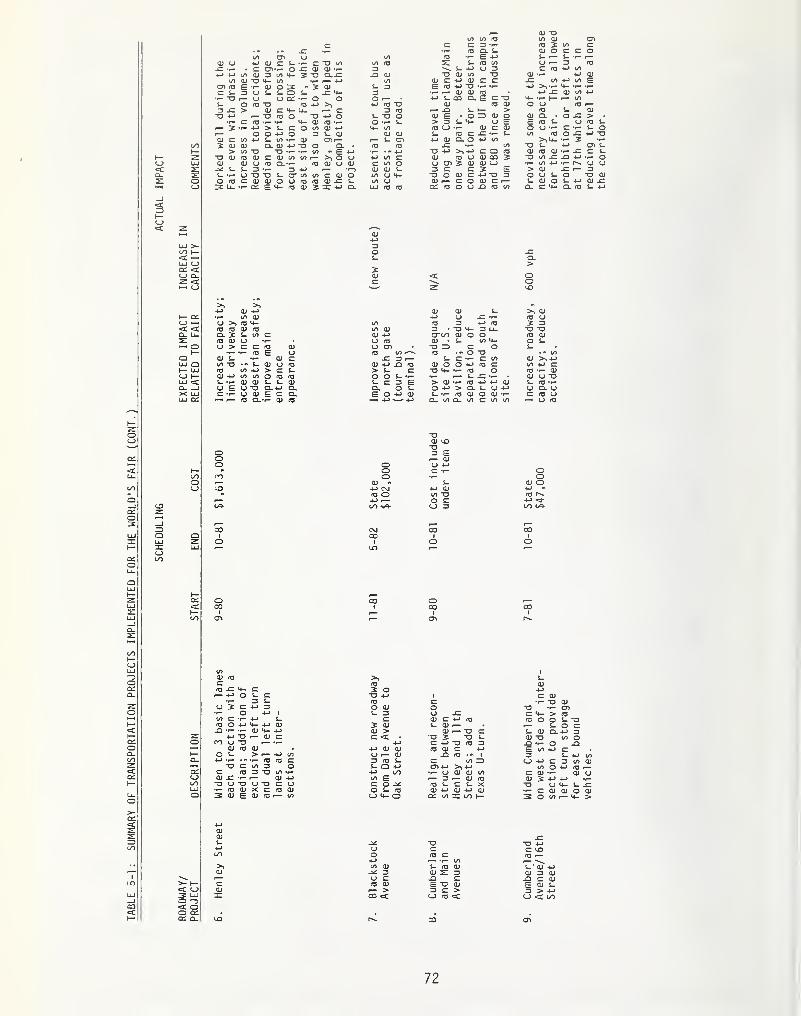
TABLE
5-1:
SUMMARY
OF
TRANSPORTATION
PROJECTS
IMPLEMENTED
FOR
THE
WORLD'S
FAIR
(CONT.)
cn h-c ~UJ oon CPJ Q_z <
—« oh-Q
PJ h-uj CQ 1X UJuj cz
QUJm
(U U MCUCU-r-C'OCOJZ -r- • Z CD*r- o -C 03 CD *r-j p ia a) 3 iAf- ju ar
CO 03 T3 4- 1/1 •!— i— 4->
cn E •<- (U O 3 -3 0)ci-zjus-i-Oi- -c= 4-•*- UJ r— u UOt- o OP- O 1X3 TD 03 4-> >»Z -C > (U CPU. r— Z-oj-> r— -Ofoo m +-> o
T- C 03 -p- -r- 4- 03 ro *r--— Jt-P>LCOiAOJP«— OO-MO D i- (UOJCl/lPtl/l-rOJ CD Ia (u p u o clJ UJ dJ>00-00 03 03 0)O) 03 O^ i- L 3 -r
to
O T3
03QC
P- CT tO tO C 03 O03 O U A3 AJ 03 JC P-EPflOJjIPO
•r- tO 03(J >> 03 4-03 03 03 03CL 3 S- 00 C03 03 O *r-
U > Z Z fO 03
CD
•r- 03•r- 03 Z
•- S- 03 03 03t/> 4-> > Z P-to to o fl3 03L -r O) 03 L L 03
U E U T) CL 4-> CLc -r u 0) E c a*—« •— 03 a-»- QJ 03
ooo
oCO
4-> to ZC to O03 03 s-tO (J H-to (JUJ 03 03
-QE
03 CL P-•r- E 4->
i- 03 tOP- 4-> CJ Z03 tO TD4-3 03 C C4-> “O *r- -r-
03 03 03co a E Z T3
03 03
03
03 CD03 tO •—
-
C Dr-03 +-> JO 03> P- Zo o p- •*-
P- C Z ECL O P-
E OP 03
oooQJ4-> C\J
03 O4-> r—OO
Z • TD 4-crco a) o03 to «
03 5 to03 O Z ZP- r— 0. ,
Ur- ZC 03 4-> tO
>l*r- 4- -r- -r-
P- 03 SZ JZ -r- P_p oj ao p iaJZ •!— to
-a 4-3 >> 4—3 Z O 0303 03 03 03 CO 503 CD 5 03 03 0JZJ Z Z 5 ET3 O 03 C 4-> T3 Zajf-coajcr—QC 03 O O JO 03 tO
£= -r- P_ Oor p z•r- 3: •*-
4-> cn p_•r- JZ c s_
0303 P-03 OZ 4-
O "O 03S- 4-> 03 -ZCL 03 U P
"O ID Z O03 • - O TO
S_ Z -r- c: to03 O O 4-3 ro C”C3 *4— 03 O> 03 *r- 03 P P 03OP > OL UPL'rAJdJOdJ'r-CL tO CL tO C tO l/)
<— 0303 4-i
Z *r-
ooto
>> 0303 U5 13TD TJ03 03O P-p.
• " to03 >, 4->
on 4-> c03 *r- 0303 L3 TDP- 03u auc 03 u*—
• L3 03
OO03 O4-> -
os4-> <3-
cn cn-
cnPJ<ynUJQ
I JZ <4- C4-3 O S- Z•r- Z P.
* 2 Z 4-> 3O 4-3 I
I Z -f- 4-3 S-\ O 4-3 tf— 4-3 03I
•*- -r— 03 <4- 4-3
4-3 -O r— 03 Z' PJ ~D f— -r-
03 03 03i P- > i— 4-> c/>’ •»- *- r- 03 03 Z-o Z on 3 O
(U Z3 "O (/)
I -Z t— r— 03 4->
I PJ -CJ U TD Z U3• 03 03 X Z 03 03: 03 E 03 03 '— tO
035 O“O 4-J
5 0303 >z c4—3 03 O)U3 r— 033 A} Li- Q 4-3
4-> OO(D £z o -xO i- 03UPO
zoU -Z03 Z P 03P dJr-
O) r— -C3 Z0 5 *OS-z 4-j -a 03 z03 03 Z 4-J
-Q 03 I
CD 4-3 >, 4—3
•i— 03 03 0) tOr— Z r— 03 0303 P Z P X
P-034->
Z 03“O O)O T- CD
Z 4- > 0303 o o p- -ar— i- O ZS_ 03 CL4P ZO) TD cn o-Q O ZiE tO 4-> Z13 P- 4-> l/TUP Z Z irt 03
(A O P 0}i
—
Z 03 •*— 03 (J03 5 4-3 4-3 -r-
“O L3 4- S_ re•r- Z 03 03 O 032 O to — 4- >
>- h-C Z3
QCoQC
-DOQCCL
030)L -X •a TD 4-34—3 CJ z z tocn o 03 Z 03 r—
4-3 <— cn r— \^3 cn qj P 03 QJ J-' QJ 4-3
03 -X z 03 S Z 03 Z 03r— o z _Q Z -Q Z 03Z 03 03 E TD QJ E a» p0J .— > z z > Z > 4Jz CQ C U 03 < p; < oo
to r^. X) on
72
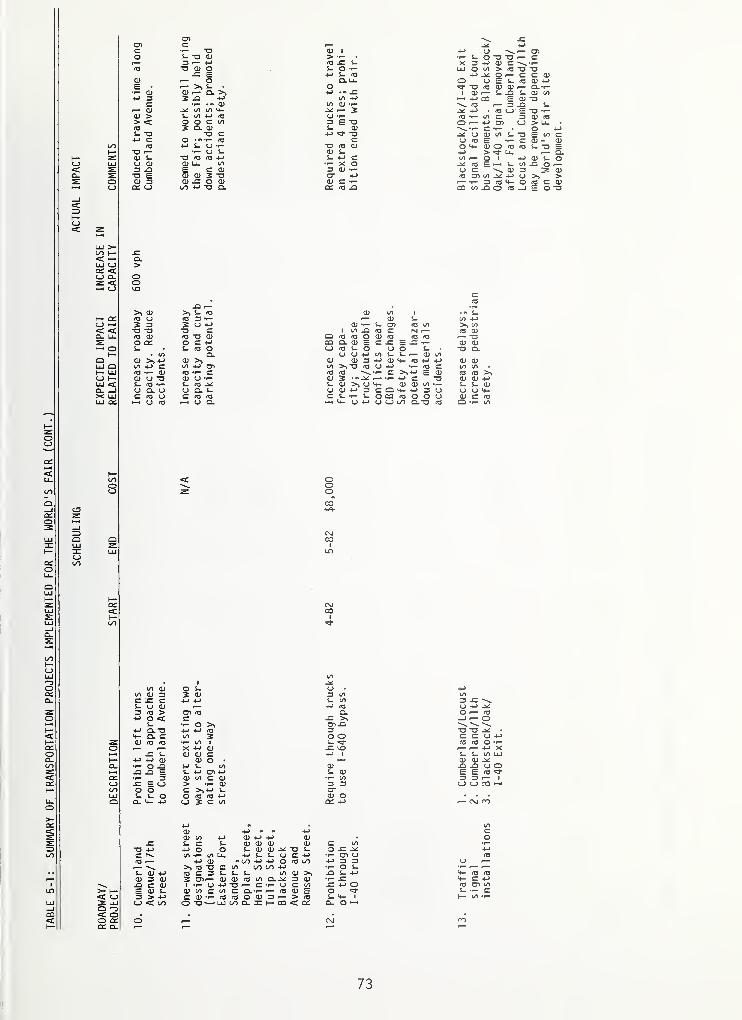
on
3
Cno
onO
^0ocn
cnoQ-00
LJcQ_
OO h-«=£
LU Ooc <lj Q_z <—« o
>> O) >> i- 3 0) CO i ... L.h- QC 3 CJ 3 3 •r— r— CD CO P->
LJ t—
•
5 3 5 CJ PJ O) •r— S— CJ> 3 CO >> COc < TO T3 TO C 1 LO -Q 3 c Ni 1
—
3 CDCL LU 3 0) 3 "O 0) a 3 3 O O) 3 3 3 TOs: O on O c PJ co CL 0) E c J= E JC •r— CD CD•—
i
O i- S. 3 o LJ 3 S- O U o i- TO CLh- • CO CL CJ CJ pJ CO s- s. 0) coQ 0) 0) >» 0) 0) 3 PJ O) p- 3 pp p-> 0) a>
LU Q CO PJ c co P-> cn CO >> •a 3 CJ p-> 3 £Z CO cO
K- LU 3 •r- CD 3 •p— c 3 3 •f— c >> P-> E O) 3 3C-J 1— 0) U TO 0) CJ •r— 0) 5 . *« r— •I— pj C TO a> CD PJLU <c S- 3 •«- S- 3 -X S- CD >> u P- 0) 0) co •r— i- S- 0)Q_ u CL U CJ CL S- CJ 0) pj 3 C Q <4- p-> 3 CJ <j CJ P-X LU c 3 CJ c 3 3 c L- •r— S- o QC 3 o O CJ a) 3 3LU o: CJ 3 CJ CL P- CJ P-> u C_) on CL TO 3 Q *r“ CO
QLU
CGcQ '“O< oO QCon cl
a;e •
•«- aiP-> 3
Cr— cdCD >> c3
TO r—a) l.CJ CD13 -Q
-0 0)0-c E
r— Or- i- .
CD r— Q_ >,5 -Q P->
•r- CD.x co co L-L U1 -P 03O O C t/>
5 0-0)-a c
O • " •»— 3P-> L. CJ *•"
•r- U i-TO 3 3 P->
0) U_ CO
E CO)
CD <U 5 TOa; -c o O)(/) P T3 Q.
(/> CDCO CD 3c ^ cS- CJ CDC3 03 >+J o<
s-P-> CL TOP— CL C0) 03 03
JZ S-P P 0)•r- O -OG G E-CEOO Os- s- oCL P- 4P
3 .
—
— \i- O) +P0)0 0)C C <11
E O) L13 > 4Po<oo
•*- oP-> P-> 3CO 5•r— CO I
X P CDO) O) C
CD O •
PJ L_ cOL P Q)P0) co c a;> -r- O)C >>4P s-
O 03 03 pO 5 c co
CD l
> *r- .
a3 .C S_s- O -f-
CO 4PCO O)-x «— 5<J -r-
3 E TOL- O)P-> TO
CQ 03 <DO) s-i- 4P C•r- X O3 CD *r-
cr pjO) c -r-
QC 3 -Q
ooo
cd0) co -MS- C S-.
p-> o oCO •*— CO Lu
p-> 0)>, 03 3 C3 C 3 £-
3 CD r— O) CDI -r- CJ +p -o
4P * * -L>
CD +-> PJ 0)
0) 0) 0) 0)
L O) (U ^ 3 LP L L (J C P•* (S) P-> PJ O 3 C/>0 (/)(/) PS- S- co O) >
03 CO CL -PC 13 CDC *p“ U C i/l
O) CO C CO C CL-»— '
—
CO)-r-03'T300)3i— >03o 3— Luooa_mi
—
co-dice:
CL-C >,CD-Q3O Os- <3-
CDS- 0)•r- co3 3CO"
o> oon pj
P-> 3 3•r- O s-3 L P•i- _Cr poO 3-S- P- l
Cl O •—
'
L 0333 PJ O) CO CO > 03P -X O r—
U E La 03 CD 0)O) r— _QPJ CQ E
.03 r— 03! P-> • 03 C_J•r- CO Ci— p-> cn
to -ac c CD03 O pr— Q--r-i- O) CO0) TO_a s-
E TO -r-
0 0) 0]
_xoo) coi-“oEcoc:
p- CD O 03> Lu
I r— O I
: as E •— s-' C \ O)
. cn co _x p->
•r- 3 3 P—CO PC O 3
CD -3 S- TO E
i— CLp aj l oCO JC o
—
3 3 CDCJ >> >O 3 C CD_J E O -Q
3 JZ \C_) P-> -XO i— 3-J r— o3 3 -X •
C C CJ PJ3 3 Or— f— PJ XS- S- CO LUCD CD -XDC UOE E 3 *3-
3 3 i— Io o ro •—
»
3 CD COS- -r- SCh— CO -r-
73
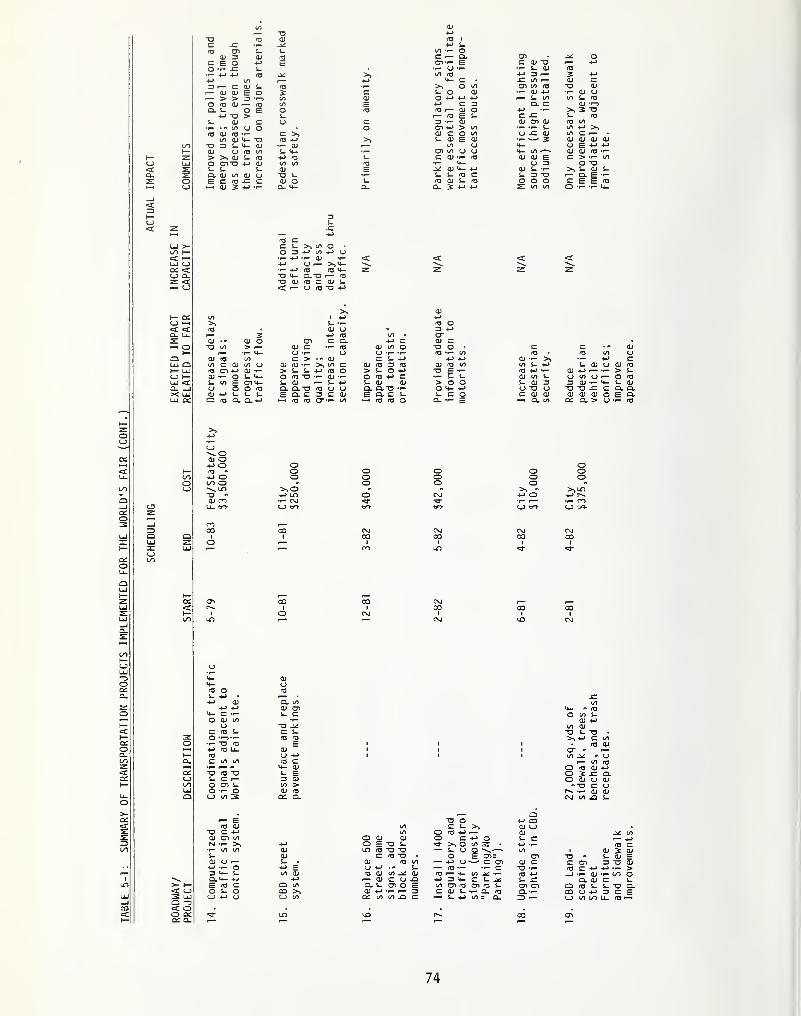
TABLE
5-1:
SUMMARY
OF
TRANSPORTATION
PROJECTS
IMPLEMENTED
FOR
THE
WORLD'S
FAIR
(CONT.)
4J<
r— > >O 03 CDCL L-
4-> TDS- a;••—•«*</>03 CD 03
00 CD
O £
3 S-CD D> >y CDO cn-os- s-d <d toE c 03
<d J
4- T34- CD03 COt- 03 4-» 03
CO COCDTO S-
CD OQ_ 4-
03 •
4-> S-CO -r- OC r— Q.cn-r- E•r- CJ -r-
CO 034- C •
>> O COS- O CDO 4-> 4-» 4->
4-» C 303 r— CD Or— 03 E S-
3 CD03 4-3 > COCD C O CO
CD E CDCO u
CD co cj (J
«D <+— 4->
S- 03 CCD i- 03U 4-> 4->
CD "O f—S- CD 033 r— £CO r— CD
CD 03 CD•r- S-U C CD
S- -r-
3 “OO OCO CO
CD•r- CD CJCO i- 03
CD •r-j
>» 2 “OS- 0303 COCO 4-> >>CO C r— .
CD CD CD CDu E+Jp<D CD 03 •»—
C > co
O TD>-, L- CD i-^- CL Ec E E 03O t- -r- Li-
00 I
<cLU OC£ Cc~> Cl20 <
03 CC S- >> GO O •
O 3 4-> CO -M U•r- 4-> -r- CD -r-4-> CJ r— >->4-•r- 4-> 03 03 4-TD 4- CLT3 r— 03~0 CD 03 CZ CD 0.< r- CJ 03 TD 4->
h- a:o *—
«
< <Cl u_
O I
LU CQ IX LULU CXl
CD 03
5CD O> r—•r- 4-CO
CD cO CJ03 03 4-> CD -r-
<D •»— O S- 4-S- CO E 034-CJ O O 03(D +J i. L LC H3 a Q.-M
03 CCD C *r-
(J *r—
c > aj<D Oj •!— >> CO> S- S_ 4-> 03O 03 X3 •*- CDS- CD r— S_Q. CLT3 03 CJ
E Q- C 3 C• 03 03 cr-<-
CDC S-
3 03O 4-3
O 03 4J CL- CD <Daa-a-rEQ.cs-1—4 03 03 O
QJ 03 COO E -r-
•i- S- S-> O OO 4- 4->
S- C OQ- -r- E
03 •
CD >>CO S_ 4->
03 4-> -r-
CD CO S-S- CD 3CJ TJ CJC CD CD*—
4
Q- cO
S- CDa> +jo co cj .
3 CD «
TD TD -Cl
CD CD O)Cxi CL >
OLU3=C-Jon
OJ
CD O4—3 O03 *»
-M Oon o\>-nTD *cd onll. on-
ooo>>04-3 CT)•r- C\Jo on-
oooocfon-
oooC\J
on-
ooo-MOo on-
ooo>> lo4-> r>.•r- ono on-
cj
4- C *r—
O CD CO<J
C 03 LO •'“)•»—
•r- TO 034-3 03 Ll03C CO CO
ccCJonuJQ
0 03*0i- C r-O 03 LO -r- OO CO 3
CDCJ03
CL cOCD CT)
L- CoC i-03 03
<DCJ<0 c4- CDi- E3 CDCO >a> 03C£ Q.
co4- ** 03O co S-
CD 4-)
co a>*0 L*D>^4-> C
• 03
i— COO 03 <D •
o ^ JZO QJ CJ* “O c
-f— CDCM CO d
Q r“0
< Oo cccc: q_
03 D-a c -m<D O') coM -r- >,•i— CO COS-D CJ i
—
COCOO D <DO E TO S-
LD 03 TO TOc 03 -a •
CD 03 COU4J •• S-(Q D cO CDr— D C U -QaL CTO £D 4-) •<—
I— 3CxL cO c0 d C
r— OTO O 4-> COQ S- >, Q3 UO 03 4-> i— QJO C 4-3 O S- C
*3* >J O CO 3 • 4-3 -r—i— LUO co
O E CD= CD•— 4-3 CJ >— CCD QJ C'— ra -r- -r- c T3 -r-03' 4-COL^-r- 03 4->
4-3 3 <4— C $ ^ L-C1/3 03 fl3 03 fl L Q) 03COL -r- Q_ 03 CL-r-—
• L. 4-> 00 = CL D r-
TD *c cn03 C 4-3
1 T- CDCL CDQ 03 M
CQ u 4-3
lj co on
74
Furniture
receptacles.
conflicts;
and
Sidewalk
improve
Improvements.
appearance.

TABLE
5-1:
SUMMARY
OF
TRANSPORTATION
PROJECTS
IMPLEMENTED
FOR
THE
WORLD’S
FAIR
(CONT.)
LTi I< '
LU OC£L <.C_> CL.Z <•—
< o
cc
O oos- cQ. re
QJ i-*0 4->•
r— on> <DO “Ds- QJG- Q.
J QJ 3O • * _Qr— S- “O•— QJ QJ *
O NJ £- »—re qj 3r— 4-> 4-
O -Q 3 QJr— 3 on
U -U QJ LC QJQJ 4-> >> >4-1 lA QJL£r-flj-r +Jr-
ocj ov-n
3 4->
00 • r— XP N QJ3 re -•->
QJ r~E -3 QJQ> •— Q>> -r- OO
ore>
—
s- s-CL4-> L.
E Q>•I- QJ 4JO 4->
3 re qj•p- E -Q
4-> QJ -Xo qj re qj i- > i-
qj re o- 5QJ -3 -3 >Q_ -t-J +-> O
h- cr:O *-4
c <cQ. U-
—< ofQ
O h-LU ccCl IX LU
-Q CJ 00 CD•r-r 3 3^ 4- O *f-4-> 4-on re i-•i- s- re reo +j > o.
QJ QJ4-J >, cnre l- re4-> re co*«- oo 3i— onM- QJ JOcj cj s-
re qj 3
ooo
ooo O0 0)00-0 *
0 3 0* r— re-O CJ XJO-
lO 3430- *
1— I
'— reQJ >4-> >> Ore +-> E
ooo
430-
>>
c_j
LUo
L- 4-> L-
o u re•f-5 QJre i- cd -' *
E -i- 3 oo"O •*- 3
3 US' oo 00 S-
aj re 4Joo -u Q. re3 3 CJCD O O OL 4->r-
o
n
oo o4-> CO
re o4-> i- s-00 Q. 33 CL O
S- 00 QJ o
o oCl OO QQCC D_
oo re cj 4->
qj 3 qj re"O DOr— <JQJ -i- QJ OQ. on oo .
—
OC\J
s-•f- s-
re qjLi_ M
re •
on p— cd- -Q 3"O r— - f—<— -I- 3i- re CDO J- •»-
2 p
CNJ
CD3
CD -X* 3 i-
•> s- -r- re•r QJTJ QX CD re I
re 3 o o •
4-> QJ I— 3 OOCD QJ
2 oo on "O 3QJ re 3 3 oz cl -Q re ni
oooo
75
Interstate Improvements
By far the most important set of transportation improvements to
occur in conjunction with the World's Fair were those to the
interstate system. To understand their significance it is
necessary to know what conditions were like prior to the Fair.
When the interstate system was constructed in Knoxville it
followed the alignment of an already existing expressway systemlocated on the northern border of the CBD. It was heavilytraveled because 1-40 (an east-west route) traversed the mid-townarea and 1-75 (a north-south route) interchanged with 1-40 imme-diately north of the CBD. As both regional and local traffic grewduring the late 1 960 * s and 1970's the sections of interstateadjacent to this cloverleaf design interchange experiencedfrequent and severe traffic congestion. This led to its nicknameof "Malfunction Junction."
Even without the World's Fair it was obvious that improvementswere necessary, but once the Fair plans were firm it becameimperative that the schedule be advanced to accommodate Fairtraffic. Improvements to the interstate system were seen to be so
vital that the $30 million loan to the World's Fair developerdepended on monthly written assurances from the Governor ofTennessee to the banks involved that the construction was pro-ceeding on schedule. If construction had lagged, it is possiblethat financial backing could have been withdrawn. To expedite the
situation, TDOT carefully orchestrated construction with as manyas 28 different concurrent contracts.
Figure 5-B shows the CBD section of 1-40 before and after improve-ments were made. Some of the major differences are: the redesignof the 1-275/ 1-40 interchange (formerly "Malfunction Junction"),the elimination of the Western Avenue interchange, the incorpora-tion of Dale and Ailor Avenues as a one-way pair of frontageroads, and the redesign of the Alcoa Highway interchange.
The addition of Blackstock Avenue had a specific use during the
Fair as an access point to the tour bus terminal and north parkinglot and is now functioning as a frontage road to the temporaryinterstate ramps. These ramps were constructed to provide accessto the CBD area during the Fair because it was not possible to
build the final I -275/ I -40 interchange design with several rampstieing directly into Henley Street before the Fair opened. The
ramps were not designed to FHWA standards but were allowed to be
constructed as "temporary" ramps. They will remain until the
final design is implemented.
76

FIGURE 5 - B
COMPARISON OF CBD INTERSTATE SYSTEM BEFOREAND AFTER WORLD'S FAIR
400 800
SCALE
77
Another change that occurred in the CBD section of the interstatewas that 1-75 was signed along the western leg of 1-640, the semi-circumferential bypass route. This removed through 1-75 trafficfrom the downtown area. That section of interstate which previouslyhad been 1-75 was designated as 1-275 (see Figure 5-A)
.
Traffic management during the reconstruction of the CBD section of
the interstate was necessary to accommodate as many as 100,000vehicles per day. This required that construction be divided into
stages, each with a plan for handling the large volumes of traffic,as well as some temporary facilities. A traffic management programwas also used to alleviate problems. This included the establish-ment of a radio frequency that broadcasted updated detour andconstruction information, the use of police officers instead offlagmen to direct traffic, and coordination among contractorsworking on adjacent sections of the interstate. In a project of
this magnitude, vehicular delays had to be expected. Fieldobservations indicated that after the traffic management programwas in full swing, delays averaged 20 to 30 minute per vehicle.Considering that whole sections of interstate had to be totallyreconstructed, it is felt that this level of delay was not exces-sive in the managing of traffic through a major work zone.
The interstate improvements that have been completed cost nearly$180 million. Ordinarily this would have been an extremely largeamount of money to dedicate to improvements over such a short spanof time. However, FHWA announced the availability of a largediscretionaly sum of interstate improvement funds in the late
1 970 ' s at the same time Tennessee identified the need to improveand reconstruct the Knoxville interstate system. These funds werepreviously committed funds that had not been used. As a result,Tennessee was able to secure $120 million of these funds for
Knoxville's interstate improvements.
Local Street Improvements
Perhaps the most important of the local street improvements in the
vicinity of the Fair were those to Henley Street, which forms mostof the eastern border of the Fair site. Prior to the Fair this
street suffered from congestion due to the large number of signa-lized intersections with inadequate numbers of lanes (the old
cross-section was four lane undivided with a continuous centerturn lane). TD0T and the City had agreed that even without the
Fair some improvements were necessary but the right-of-way costswere extremely high. However, when the Fair site was purchasedthe right-of-way needed to expand Henley Street was included. The
improvements on Henley were crucial to handle the substantialamount of Fair-related traffic (see next section of this chapterfor discussion of "during" and "after" traffic volumes andpatterns on the street network).
78
In order to take advantage of the parking facilities at theKnoxville Civic Coliseum, a temporary exit ramp from the businessloop (which interchanges with 1-40) to Hill Avenue was built.Similar to the temporary interstate ramps, this was not built tostandard and was removed after the Fair. During the Fair thisramp carried slightly over 1,000 vehicles per day. Given the lowutilization of the Coliseum parking lots, it is likely that muchof this volume was local traffic. Although the ramp did removethese vehicles from entering into the CBD via the CumberlandAvenue exit, this seems to be the one project that was onlymarginally needed to handle Fair traffic.
Blackstock Avenue was not originally planned but was soon realizedto be essential to provide adequate access to the tour bus terminal.The construction of Blackstock was a joint venture: the City paidfor the right-of-way; KIEE paid for railroad track relocation andmodification of an overpass bridge structure; and TDOT paid forconstruction.
The improvements to the Cumberland Avenue/Main Avenue one-way pairwere required for several reasons. First, it was necessary to
realign these streets to provide an adequate site for the U.S.
Pavilion, which was one of the dominant structures planned for the
Fair site. Second, as this pair divided the Fair site, it was
desirable to move them closer together. Third, the closing of
Clinch Avenue, a parallel route which traverses the Fair site on a
viaduct, would divert approximately 10,000 vehicles per day to
other routes. Increased capacity was needed and this also spurred
intersection improvements further west on Cumberland Avenue at
16th and 17th Streets. (The Texas U-turn referred to in Table 5-
1 allows for a U-turn movement from the westbound direction on
Cumberland to eastbound on Main.)
The one-way street designations referred to in Table 5-1 are
difficult to assess. Even with a one-way street system in the
Fort Sanders residential area west of the Fair site, the number of
accidents did not decline. It is possible that the number of
accidents could have been higher if the one-way system had not
been implemented. In other areas such as 11th Street, Poplar,and Ramsey, it is probable that congestion would have resulted on
Cumberland Avenue and Blackstock Avenue. Uncongested traffic flowon the peripheral streets was important for emergency access as
well as convenience.
The final two years before the opening of the World's Fair pre-
sented a significant work program for the City Traffic Signal
Construction Division. Thirty-five intersections were signalized
as new installations or existing signals were replaced due to
extensive geometric construction. Thirty intersections had the
traffic signal displays modernized to comply with Manual on
Uniform Traffic Control Devices (MUTCD) standards. A $40,000
79

program for pedestrian display addition or modernization in the
CBD was also accomplished. The pedestrian displays were convertedfrom the "WALK -DON'T WALK" legends to the international symbolsof the walking man and the hand. Three signal installations werewarranted as a result of the Fair. These were at the intersectionsof Cumberland/Locust, Cumberland/llth, and Blackstock/0ak/I-40Eastbound exit ramp. The traffic signal at Blackstock/0ak/I-40Ramp has since been removed. The other two are being evaluatedfor signal removal.
The Knoxville computerized traffic signal system was partiallyoperational during the World's Fair. Group 1, which consisted of68 intersections, included the Central Business District,Cumberland Avenue, and Kingston Pike west to Northshore Drive.
It also included Seventeenth Street, Dale Avenue, Ailor Avenue andWestern Avenue in the fringe area of the CBD. Group 2, whichincluded outlying roadways, was operational by midsummer. Therewas no assessment made during the Fair, but a study of CumberlandAvenue between Henley Street and Alcoa Highway (U.S. 129) indi-cates that, although traffic volumes between 1980 and 1983 have
increased by 7,500 vehicles per day (35 percent), travel timeshave decreased by an average of 33 percent. While some of this
can be attributed to the prohibition of left turns at two inter-sections, it is likely that most of it is due to the high degreeof progressive movement provided by the system. Group 2 beingoperational was probably only marginally beneficial to Fair
visitors.
Street Lighting
Seventy square blocks in the CBD were converted from mercury vaporto high pressure sodium type of street lighting. Many overheadservices on wood poles were replaced with underground services on
aluminum poles. The current cost of energy made this a break-evenproject. A cost of $10,000 was required to pay for the salvagevalue of some fixtures that had not fully depreciated in the
downtown area. Street lighting was especially important aroundthe periphery of the Fair site for property and pedestrian security.Overall, the installation was for crime prevention and aesthetics.
CBD landscaping, installation of street furniture, and sidewalkimprovements were also part of the preparations made for the Fair.
An adhoc committee called the "Community Appearance Committee" wasformed to oversee aesthetic improvements to the downtown area. It
was mainly composed of bank presidents and architects. Thiscommittee commissioned a landscape architect to develop a CBDbeautification plan. The work included $325,000 for sidewalkrepair or replacement and $50,000 for landscaping and streetfurniture. Over 100 trees were planted in the CBD, 25 bencheswere installed, 50 pole mounted trash receptacles were placedthroughout the downtown area, and 25 large trash receptacles wereplaced outside the Fair site.
80
TRAFFIC MANAGEMENT TECHNIQUES
Because a large number of through 1-40 trucks (roughly 5,000 perday) would have passed very close to the Fair, a decision was madejointly by TDOT and the City to prohibit through 1-40 trucks fromthe downtown area, requiring instead that they use the 1-640bypass route. This was done to preserve freeway capacity and to
move potential hazardous material accidents away from the highconcentration of people in the CBD area. It required trucks to
travel an extra four miles. However, there existed ample capacityon the interstate through town during the Fair. Although theprohibition ended with the Fair, residents in downtown neighbor-hoods are advocating that it be reinstated to avoid hazardousmaterial accidents in the downtown area.
There are several ways the planners at TDOT responsible forimplementing the trailblazer system felt it could have beenimproved. First, adequate time should be given to develop a
signing concept and for installation (the Knoxville project was on
a very tight schedule). Second, the signing plans should be doneon good quality aerial photographs preferably at a one inch to 100
feet scale. Third, if done again, trailblazer signs might havebeen better used if they had directed southbound 1-75 trafficaround the 1-640 bypass and into town on 1-40 eastbound. This
would have taken some pressure off the 17th Street exit which was
heavily utilized during the Fair. Also, this traffic would have
exited directly onto Dale Avenue from 1-40 eastbound instead of
making a left turn onto Dale Avenue enroute to the north parkingarea
.
There was a continuation by the City of the street name signingprogram in the Central Business District and fringe area. This
included approximately 400 of the city's 5,000 intersections. The
City installed 1,400 signs of various other types, but they wereprimarily related to parking. The "Parking/No Parking" signs were
a necessity.
WORLD'S FAIR TRAFFIC PLANNING COMMITTEE
Because there was so much concern about transportation prior to
the World's Fair, a committee was formed to discuss the problems
and possible solutions. The World's Fair Traffic Planning Committee
was composed of representatives of the City Department of Engineer-
ing, Knoxville Police Department, KIEE's Transportation Consultant,
Tennessee Department of Transportation, University of Tennessee
Transportation Research Center, Tennessee Highway Patrol, and
81
AAA. This group met weekly or monthly for 14 months prior to theFair. During the final 12 weeks before the Fair, KIEE's transpor-tation consultant, the city traffic engineer, and the citydesignated police lieutenant for traffic control met weekly to
resolve traffic issues.
The group was involved in gathering and sharing as much informationas possible that related to World's Fair transportation. Thisinformation included activities related to parking lot operations,anticipated traffic patterns of World's Fair pedestrians, buses,taxis, and auto drop-offs. This information was overlayed on
existing traffic patterns to anticipate potential problems andreach possible solutions through design.
An example of work of the committee was designation of the World'sFair local street loading areas for shuttle buses and taxis.Another example was meeting with Downtown merchants and theirsuppliers prior to the Fair to discuss anticipated trafficpatterns.
The formation of the committee helped foster a very positiveworking relationship among the parties involved in providingtransportation i nfrastructure, which had begun to develop duringthe initial phases of interstate reconstruction. In some casesthe City and TDOT exchanged responsibilities across their normal
jurisdictional boundaries. Another related aspect is that the
TDOT main office in Nashville delegated to the regional office in
Knoxville the responsibility to make many decisions that normallywould have been retained in Nashville.
ANALYSIS OF TRAFFIC PATTERNS
Daily Traffic Volume Comparisons
Figure 5-C shows the projected and actual daily increases in
traffic on major approach routes to the World's Fair. Interstatecounts were made on single days two weeks before and two weeksafter the Fair opened. The remaining counts were made at varioustimes during and after the Fair and were generally taken over the
course of several days. Unfortunately , counts were not availablefor 1-275 or Broadway. During the planning stages of the Fair,
traffic was projected to increase by approximately 33,000 vehiclesper day on major approach routes. This is in close agreement withwhat actually occurred as depicted by the traffic counts on Figure
5-C. However, two locations showed significant discrepancies; it
appears that more trips used Alcoa Highway than expected and less
used 1-40 West. Fortunately, major improvements were made on 1-40
east of the Alcoa Highway interchange to accommodate expectedheavy traffic on 1-40 east of Alcoa Highway. These improvements
82

f\
RGURE 5-C
PROJECTED VERSUS ACTUAL TRAFFIC INCREASES ooo actual increase
(vehicles per day) ON MAJOR APPROACH ROUTES <ooo) projected increase
83

ultimately accommodated the increased number of trips apparentlyoriginating from Alcoa Highway. Further analysis of interstatetraffic shows that volumes on 1-40 inside the 1-640 loop increasedby seven percent. Traffic on the east leg of the 1-640 loopincreased only two percent (300 vpd) even though through 1-40
trucks were required to use 1-640 during the Fair. The small
difference may be due to the fact that interstate counts werelimited during the Fair and, hence, subject to large randomvariation.
Traffic on the west leg of 1-640 (which is also the signed routefor 1-75) increased by nine percent. Again, trucks accounted fora large portion of this increase, but it is likely that some of it
is due to Fair-related 1-75 traffic going around central Knoxvilleto use the Dale Avenue approach to the north parking lots and bus
terminal. Also, many local trips may have used this leg to avoidcentral area congestion. No comparable data exists for 1-275 or1-75 and 1-40 beyond the 1-640 loop.
More extensive traffic count data was available for the localstreet system. This data was collected by the City Department ofEngineering during and after the Fair in two forms: (1) tubecounts at selected locations and (2) one-way counts made down-stream from intersections by the newly installed computerizedsignal control system. Figure 5-D shows overall average dailytraffic (ADT) volumes on the local street system adjacent to theFair site during and after the Fair (these are average counts forboth weekdays and weekends). Fair planners had originally expectedvery slight volume gains in the immediate vicinity of the site dueto the distribution of parking space but, as can be seen, signifi-
cant increases actually materialized. Much of this can be attri-buted to people driving close to the Fair site to get a glimpse of
it before parking. This situation was perpetuated by the overalllack of traffic congestion around the site. (As will be shownlater, the increases did not significantly affect traffic opera-tions due to roadway improvements and Fair arrival/departurepatterns.
)
On major arterial streets, the most dramatic increase occurred on
Broadway (+43 percent) north of the Fair site. This was due to
increased use of the temporary interstate ramps and BlackstockAvenue during the Fair as well as increased through traffic on
Broadway itself (which is signed as U.S. 441). Henley Street (the
natural southern extension of Broadway) which borders the entireeast side of the Fair site experienced a 37 percent increase. TheCumberland/Main one-way pair, which traverses the Fair site,
showed a 32 percent increase.
84

KNOXVILLECOLLEGE
Vist.%
(8122 )
3^,834(14,909)
fNiv'EPSi l Y v>TENNESSEE
> 20,060
(18,756)
42,420
TENNESSEE
LOUDOUN
FIGURE 5-D
OVERALL AVERAGE DAILY TRAFFIC
ON SELECTED ROUTES
000 DURING
(000) AFTER
—
ONE WAY COUNT
s85
J

There were also several arterial s in the area that showed onlymarginal or no increases in traffic. Neyland Drive, which bordersthe site on the south, exhibited little increase. Since this wasthe primary access route to the shuttle bus terminal, it is
possible that local trips avoided this area because of the pre-sence of the buses. Also the underutilization of several World'sFair parking areas maintained by the University of Tennesseecontributed to the lack of traffic increase on Neyland Drive.Western Avenue, which crossed over the north end of the site via a
bridge, also showed only a small increase. This was probably dueto lack of access to the site and parking facilities. Gay Street,
the major north-south route within the CBD, showed no increase at
all, indicating that Fair visitors concentrated their efforts on
the Fair itself rather than the downtown area. This contention is
supported by the experiences of downtown merchants who saw verylittle growth in business during the Fair. It is presumed Fair-related trips accessing the interstate system via the businessloop led to the 38 percent increase on Main Avenue in the CBD.
The effectiveness of the trail blazer signing system was likelyresponsible for only marginal increases in traffic on CumberlandAvenue and 17th Street several blocks away from the site.
The few collector-type streets counted showed large increases.Traffic on 11th Street along the western border of the Fair sitemore than doubled during the Fair since it provided a view of thesite before parking.
Traffic on Clinch Avenue, the major east-west route through the
residential neighborhood of Fort Sanders, almost doubled. Obser-vations on other Fort Sanders streets show that traffic as a wholeincreased in the neighborhood. These increases may be associatedwith the proliferation of small parking lots and apartmentscatering to Fair visitors. If neither of these had occurred,traffic impact on the neighborhood would probably not have been as
great, with the exception of 11th Street which was on the Fair'sperimeter.
The Dale/Ailor one-way pair, which was instituted to serve as a
collector/ distributor to the interstate system, experiencedsignificant increases during the Fair. The largest increase wason Dale Avenue east of 17th Street where both eastbound and west-bound 1-40 traffic was directed on their way to the north parkingareas. The temporary entrance ramps to 1-40 west and 1-275 northin the immediate vicinity of the North gate were also heavilyutilized during the Fair.
86
The most dramatic increase in traffic on any street where countswere available was Blackstock Avenue where an increase of 477
percent was experienced. (In terms of absolute volumes this wasnot the largest increase, however.) This street was constructedto handle tour bus traffic to the north terminal. It also appearsthat a large number of visitors arriving by car used it. The factthat traffic decreased dramatically after the Fair is a reflectionof the low level of development and, hence, lack of trafficgenerators in the area.
The comparison of overall ADTs does not give a full picture of the
impact of Fair traffic on daily commuting and business travel by
area residents. Figures 5-E and 5-F depict ADTs derived from
weekday and weekend counts. In nearly every case, the weekenddifference in traffic is far greater than the weekday difference.This indicates that the differences shown in Figure 5-D are
attributable to large increases in weekend traffic during the
Fair. The weekday ADT map shows that, in most cases, the weekdayeffects of Fair traffic are minimal. For example, the weekdayincrease on Henley Street was 17 percent but the weekend increase
was 60 percent. If weekday versus weekend ADT's for during the
Fair are compared to weekend versus weekday ADT's after the Fair,
it is found that traffic varied much more after the Fair than
during the Fair. This implies that traffic during the Fair
distributed itself more evenly through the week. Thus, the excess
in capacity that normally exists on weekends due to lack of
commuters and business travel was used by Fair traffic. The fact
that weekend Fair traffic was generally higher than weekday Fair
traffic is due to the fact that weekend attendance was higher than
for weekdays (the average weekday saw 13.8 percent of total weekly
attendance while weekends experienced 15.5 percent).
Hourly Traffic Volume Comparisons
Graphs of hourly variations in traffic during and after the Fair
were compiled from both tube and computer counts and represent
volumes factored for day and month. These show the variations in
traffic patterns caused by the Fair.
Figure 5-G shows Friday traffic on westbound Ailor Avenue just
west of its intersection with Western Avenue. As previously
mentioned, this route serves as a coll ector/distributor to 1-40.
Hourly variations were similar for low and high Fair attendance
days as well as for after the Fair. The exception is the sharp
spike between 10 and 11 P.M. during the Fair. This represents
traffic leaving the Fair after it closed (10 P.M.). Figure 5-H
shows westbound Summit Hill Drive just west of Locust Street one
block from the Fair site. This also exhibits the 10-11 P.M. spike
37

TENNESSEE ^LOUDOUN
FIGURE 5-E
WEEKDAY AVERAGE DAILY TRAFFICON SELECTED ROUTES
OOO DURING
(000) AFTERONE WAY COUNT
Jcsb

r A
FIGURE 5-F
WEEKEND AVERAGE DAILY TRAFFICON SELECTED ROUTES
OOO DURING
(000) AFTER
ONE WAY COUNT
V. J89

rFIGURE 5-GTRAFFIC VOLUME VARIATIONS
Note: Attendance
90
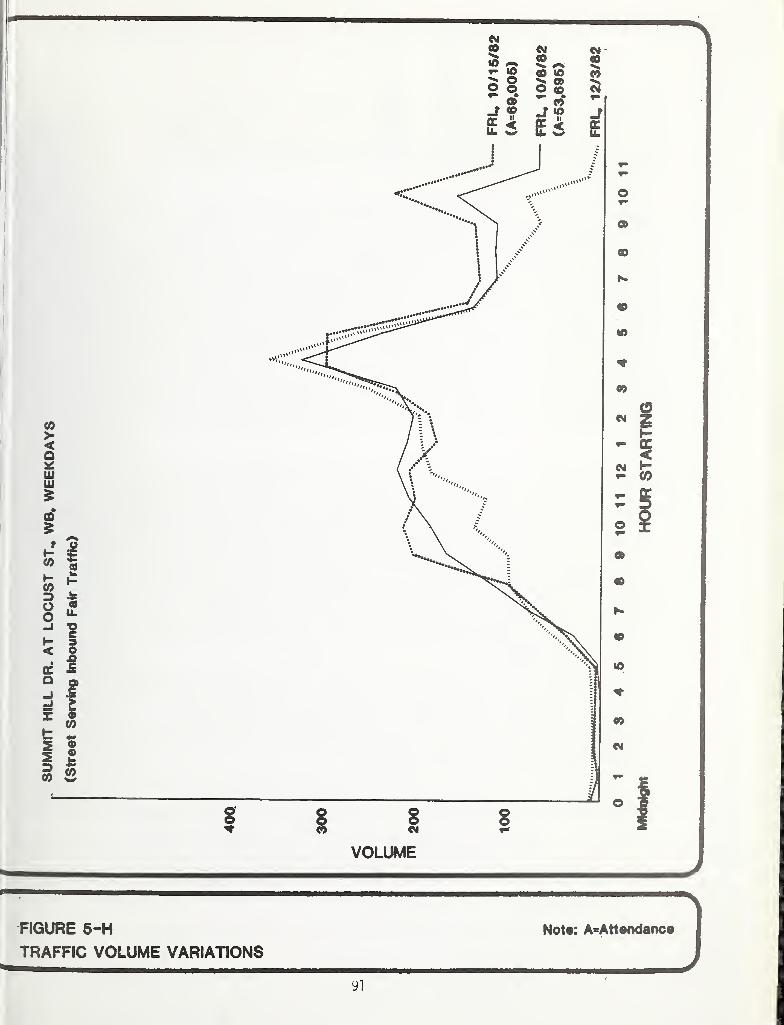
SUMMIT
HILL
DR.
AT
LOCUST
ST,
WB,
WEEKDAYS
(Street
Serving
Inbound
Fair
Traffic)
FIGURE 5-H
TRAFFIC VOLUME VARIATIONS
Note: A=Attendance
91
HOUR
STARTING
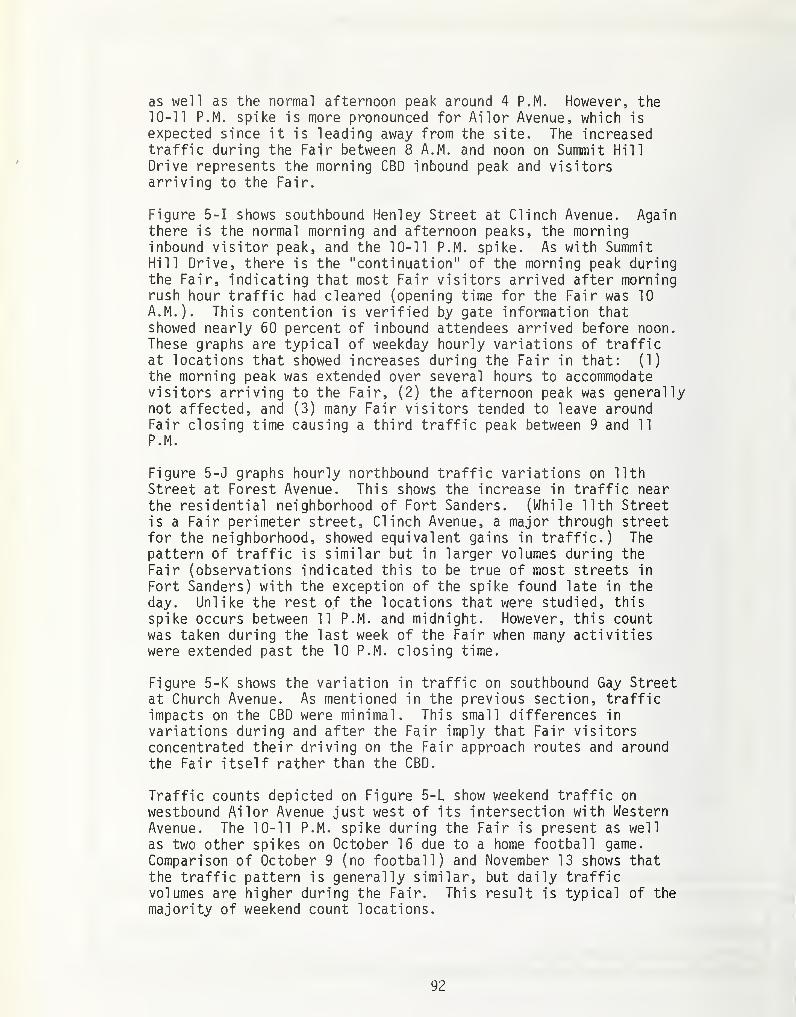
as well as the normal afternoon peak around 4 P.M. However, the10-11 P.M. spike is more pronounced for Ailor Avenue, which is
expected since it is leading away from the site. The increasedtraffic during the Fair between 8 A.M. and noon on Summit Hill
Drive represents the morning CBD inbound peak and visitorsarriving to the Fair.
Figure 5-1 shows southbound Henley Street at Clinch Avenue. Againthere is the normal morning and afternoon peaks, the morninginbound visitor peak, and the 10-11 P.M. spike. As with SummitHill Drive, there is the "continuation" of the morning peak duringthe Fair, indicating that most Fair visitors arrived after morningrush hour traffic had cleared (opening time for the Fair was 10
A.M.). This contention is verified by gate information thatshowed nearly 60 percent of inbound attendees arrived before noon.These graphs are typical of weekday hourly variations of trafficat locations that showed increases during the Fair in that: (1)
the morning peak was extended over several hours to accommodatevisitors arriving to the Fair, (2) the afternoon peak was generallynot affected, and (3) many Fair visitors tended to leave aroundFair closing time causing a third traffic peak between 9 and 11
P.M.
Figure 5-J graphs hourly northbound traffic variations on 11th
Street at Forest Avenue. This shows the increase in traffic nearthe residential neighborhood of Fort Sanders. (While 11th Streetis a Fair perimeter street, Clinch Avenue, a major through streetfor the neighborhood, showed equivalent gains in traffic.) Thepattern of traffic is similar but in larger volumes during the
Fair (observations indicated this to be true of most streets in
Fort Sanders) with the exception of the spike found late in the
day. Unlike the rest of the locations that were studied, this
spike occurs between 11 P.M. and midnight. However, this countwas taken during the last week of the Fair when many activitieswere extended past the 10 P.M. closing time.
Figure 5-K shows the variation in traffic on southbound Gay Streetat Church Avenue. As mentioned in the previous section, trafficimpacts on the CBD were minimal. This small differences in
variations during and after the Fair imply that Fair visitorsconcentrated their driving on the Fair approach routes and aroundthe Fair itself rather than the CBD.
Traffic counts depicted on Figure 5-L show weekend traffic on
westbound Ailor Avenue just west of its intersection with WesternAvenue. The 10-11 P.M. spike during the Fair is present as well
as two other spikes on October 16 due to a home football game.
Comparison of October 9 (no football) and November 13 shows that
the traffic pattern is generally similar, but daily trafficvolumes are higher during the Fair. This result is typical of the
majority of weekend count locations.
92
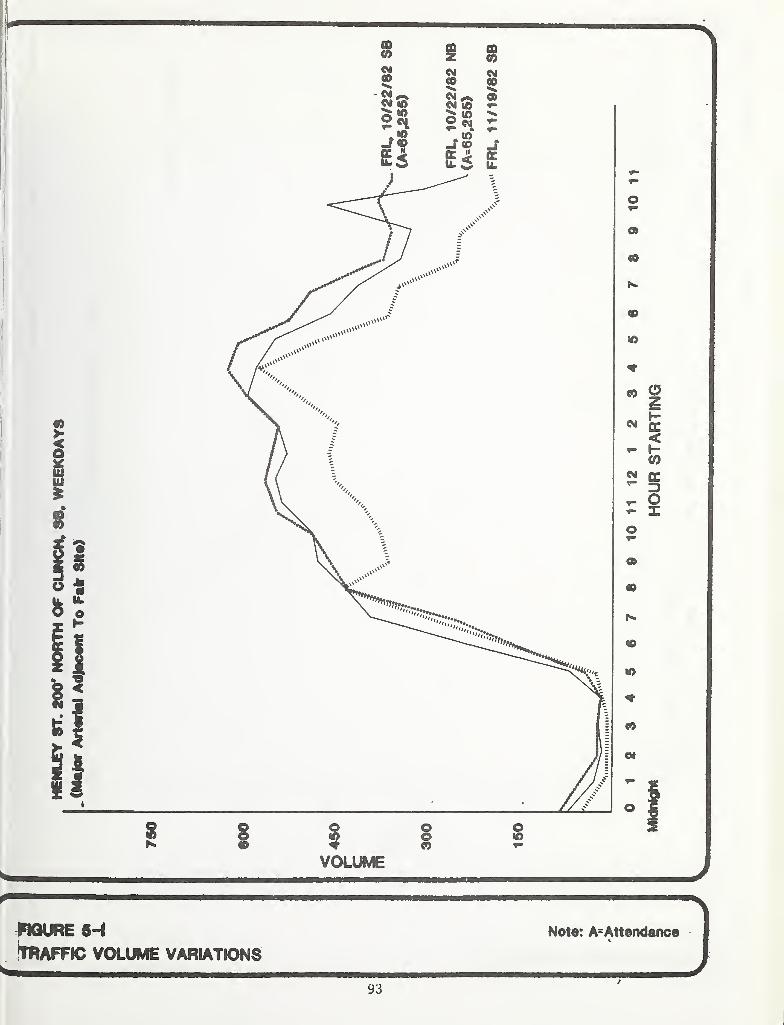
HENLEY
ST.
*00*
NORTH
OF
CLINCH,
SB,
WEEKDAYS
(Major
Arterial
Adjacant
To
Fair
Site)
VOLUME
not, .£ s~i Note: A=Attendance
[TRAFFIC VOLUME VARIATIONS
93
HOUR
STARTING

sCMco
VOLUME
Vr~
"
FIGURE 5-J
^TRAFFIC VOLUME VARIATIONS
Note: A=Attendance
^4

VOLUME
FIGURE 5-K
TRAFFIC VOLUME VARIATIONS
Not#: A*Att«ndanc«
95
HOUR
STARTING
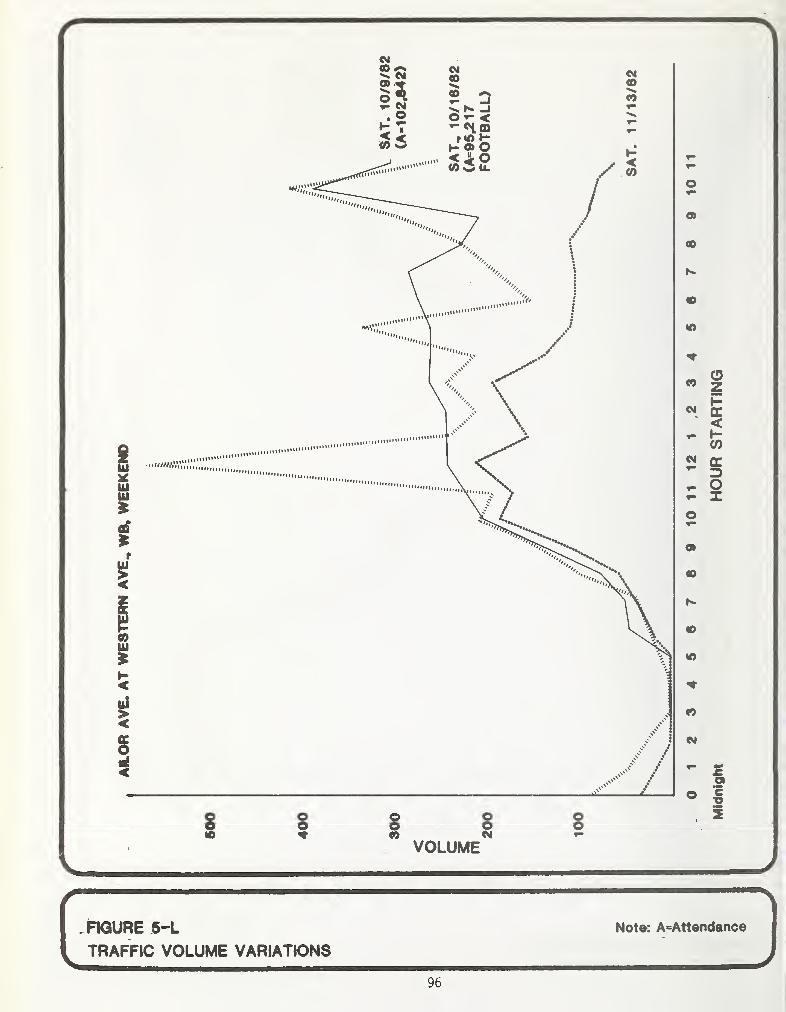
VOLUMEV J
.FIGURE 5-L
L TRAFFIC VOLUME VARIATIONS
96
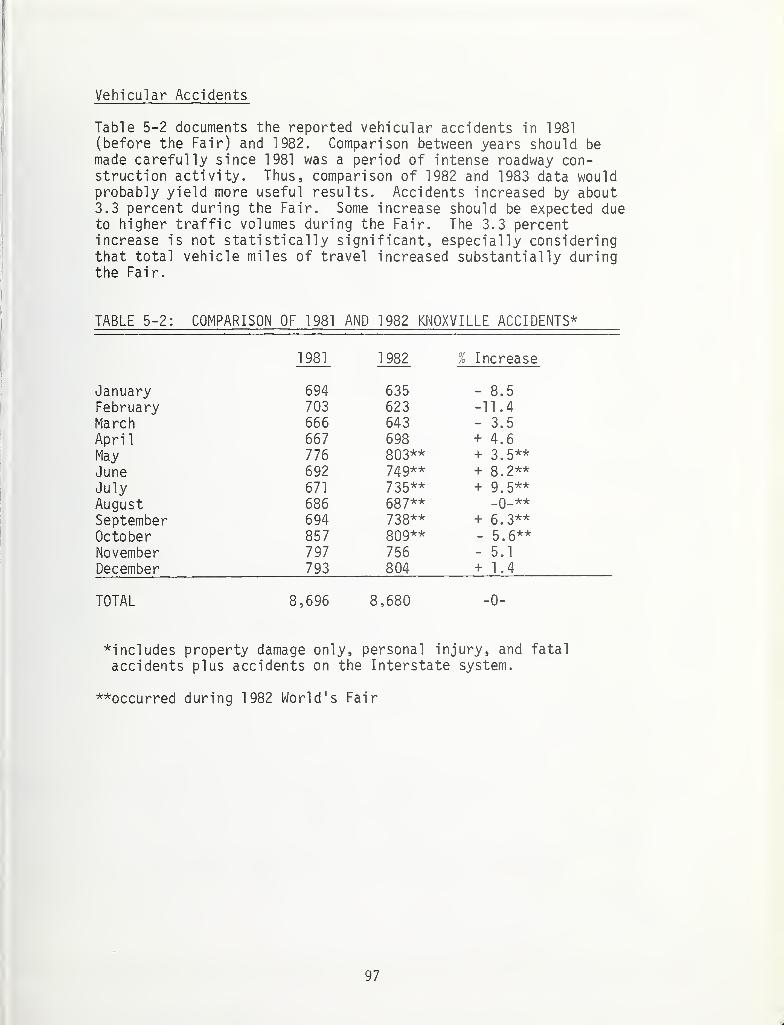
Vehicular Accidents
Table 5-2 documents the reported vehicular accidents in 1981(before the Fair) and 1982. Comparison between years should be
made carefully since 1981 was a period of intense roadway con-struction activity. Thus, comparison of 1982 and 1983 data wouldprobably yield more useful results. Accidents increased by about3.3 percent during the Fair. Some increase should be expected dueto higher traffic volumes during the Fair. The 3.3 percentincrease is not statistically significant, especially consideringthat total vehicle miles of travel increased substantially duringthe Fair.
TABLE 5-2: COMPARISON OF 1981 AND 1982 KNOXVILLE ACCIDENTS*
1981 1982 1 Increase
January 694 635 - 8.5February 703 623 -11.4
March 666 643 - 3.5
Apri 1 667 698 + 4.6
May 776 803** + 3.5**
June 692 749** + 8 . 2 **
July 671 735** + 9.5**
August 686 687** _Q_**
September 694 738** + 6.3**
October 857 809** - 5.6**
November 797 756 - 5.1
December 793 804 + 1.4
TOTAL 8,696 8,680 - 0 -
includes property damage only, personal injury, and fatal
accidents plus accidents on the Interstate system.
**occurred during 1982 World's Fair
97
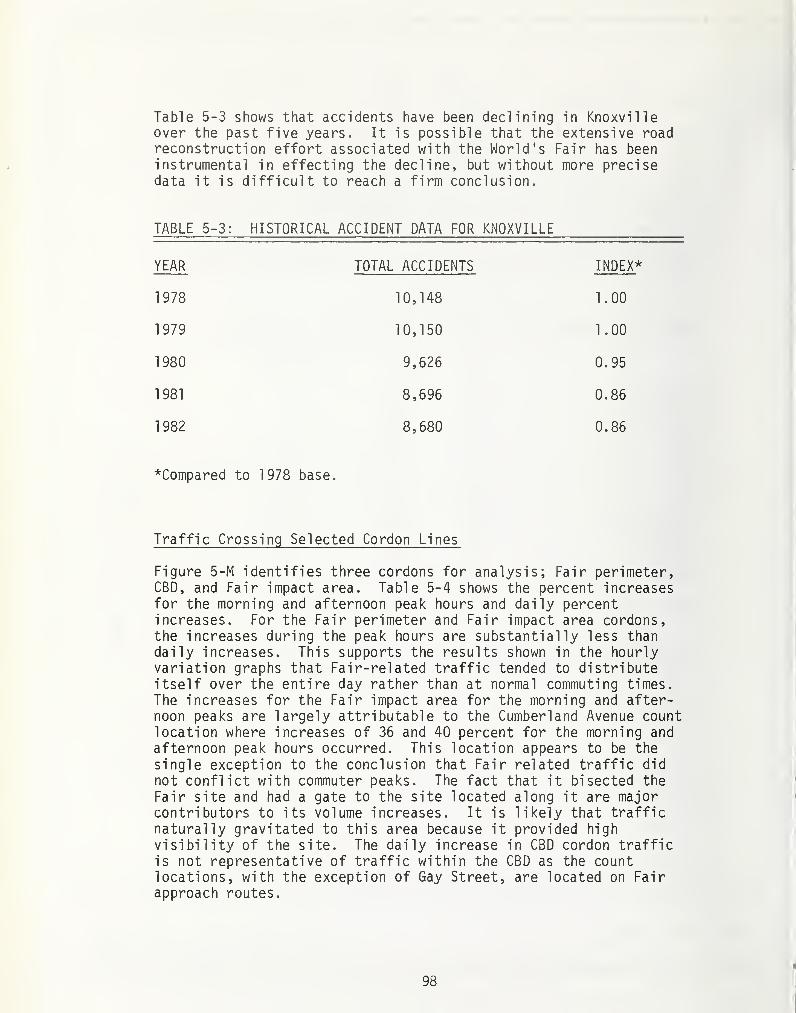
Table 5-3 shows that accidents have been declining in Knoxvilleover the past five years. It is possible that the extensive roadreconstruction effort associated with the World's Fair has beeninstrumental in effecting the decline, but without more precisedata it is difficult to reach a firm conclusion.
TABLE 5-3: HISTORICAL ACCIDENT DATA FOR KNOXVILLE
YEAR TOTAL ACCIDENTS INDEX*
1978 10,148 1.00
1979 10,150 1.00
1980 9,626 0.95
1981 8,696 0.86
1982 8,680 0.86
^Compared to 1978 base.
Traffic Crossing Selected Cordon Lines
Figure 5-M identifies three cordons for analysis; Fair perimeter,CBD, and Fair impact area. Table 5-4 shows the percent increasesfor the morning and afternoon peak hours and daily percentincreases. For the Fair perimeter and Fair impact area cordons,the increases during the peak hours are substantially less thandaily increases. This supports the results shown in the hourlyvariation graphs that Fair-related traffic tended to distributeitself over the entire day rather than at normal commuting times.The increases for the Fair impact area for the morning and after-noon peaks are largely attributable to the Cumberland Avenue countlocation where increases of 36 and 40 percent for the morning and
afternoon peak hours occurred. This location appears to be the
single exception to the conclusion that Fair related traffic did
not conflict with commuter peaks. The fact that it bisected the
Fair site and had a gate to the site located along it are majorcontributors to its volume increases. It is likely that trafficnaturally gravitated to this area because it provided highvisibility of the site. The daily increase in CBD cordon trafficis not representative of traffic within the CBD as the countlocations, with the exception of Gay Street, are located on Fairapproach routes.
98
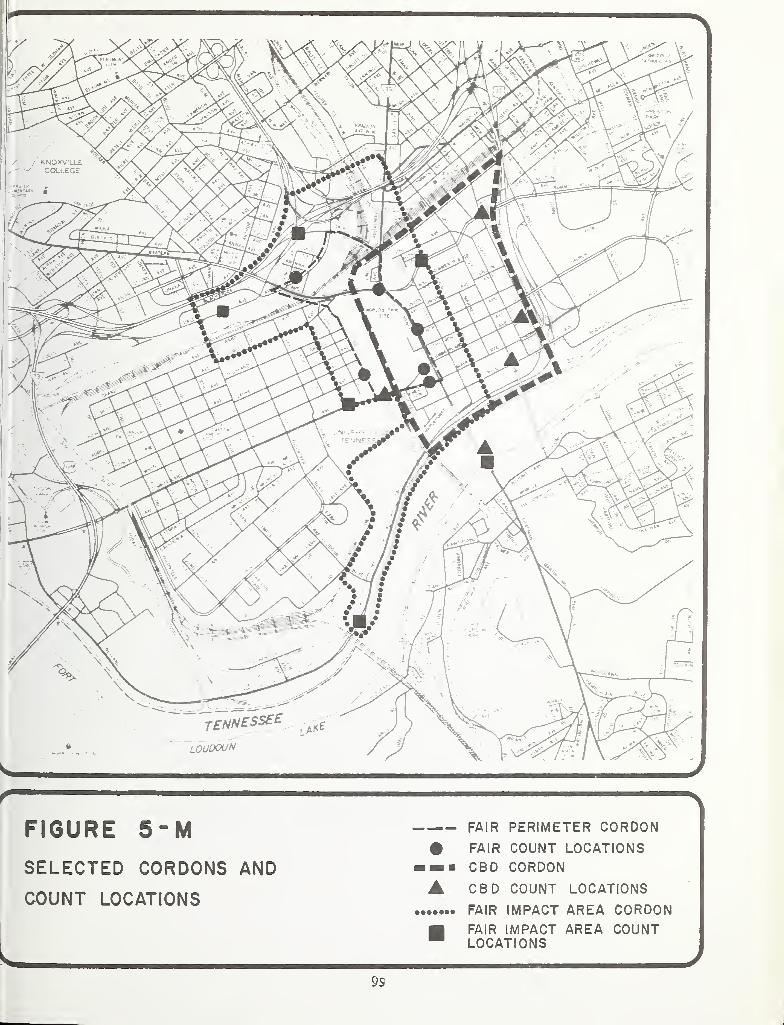
f AFIGURE 5-MSELECTED CORDONS AND
COUNT LOCATIONS
L
FAIR PERIMETER CORDON
FAIR COUNT LOCATIONSCBD CORDON
CBD COUNT LOCATIONS
FAIR IMPACT AREA CORDONFAIR IMPACT AREA COUNTLOCATIONS
9S
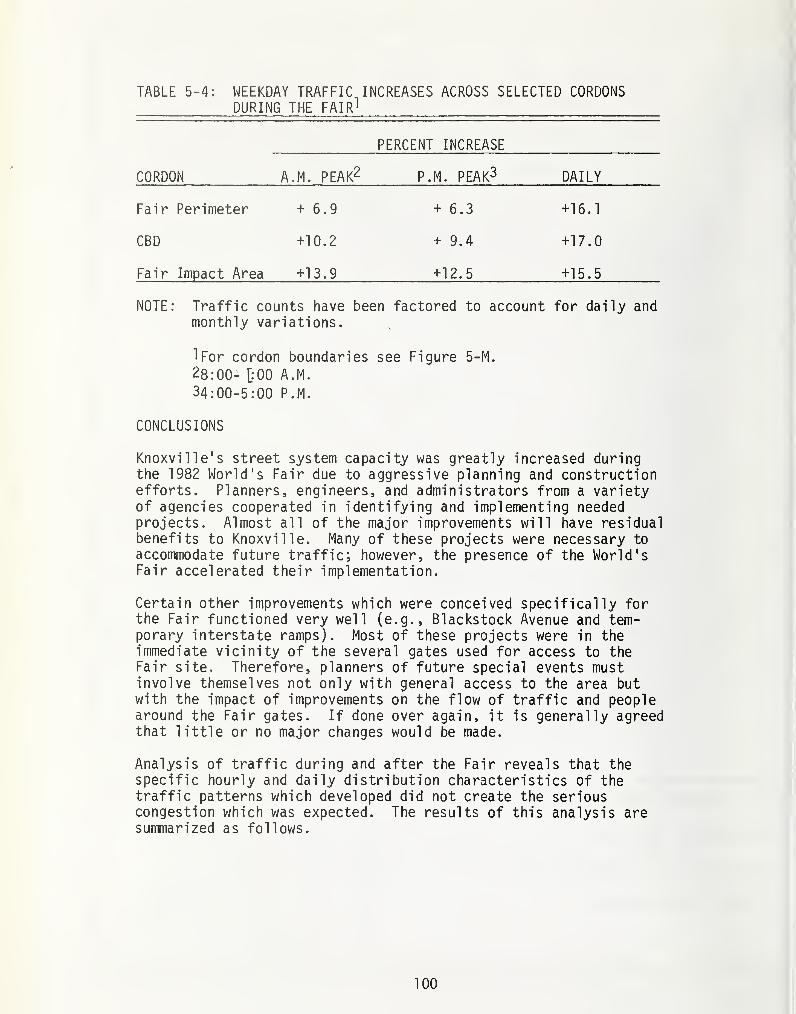
TABLE 5-4: WEEKDAY TRAFFIC INCREASES ACROSS SELECTED CORDONSDURING THE FAIR 1
CORDON
PERCENT INCREASE
A.M. PEAK2 P.M. PEAK3 DAILY
Fair Perimeter + 6.9 + 6.3 +16.1
CBD +10.2 + 9.4 +17.0
Fair Impact Area +13.9 +12.5 +15.5
NOTE: Traffic counts have been factored to account for daily andmonthly variations.
TFor cordon boundaries see Figure 5-M.
28:00- [: 00 A.M.
34:00-5:00 P.M.
CONCLUSIONS
Knoxville's street system capacity was greatly increased duringthe 1982 World's Fair due to aggressive planning and constructionefforts. Planners, engineers, and administrators from a varietyof agencies cooperated in identifying and implementing neededprojects. Almost all of the major improvements will have residualbenefits to Knoxville. Many of these projects were necessary to
accommodate future traffic; however, the presence of the World'sFair accelerated their implementation.
Certain other improvements which were conceived specifically forthe Fair functioned very well (e.g., Blackstock Avenue and tem-porary interstate ramps). Most of these projects were in theimmediate vicinity of the several gates used for access to theFair site. Therefore, planners of future special events mustinvolve themselves not only with general access to the area butwith the impact of improvements on the flow of traffic and peoplearound the Fair gates. If done over again, it is generally agreedthat little or no major changes would be made.
Analysis of traffic during and after the Fair reveals that thespecific hourly and daily distribution characteristics of thetraffic patterns which developed did not create the seriouscongestion which was expected. The results of this analysis aresummarized as follows.
100
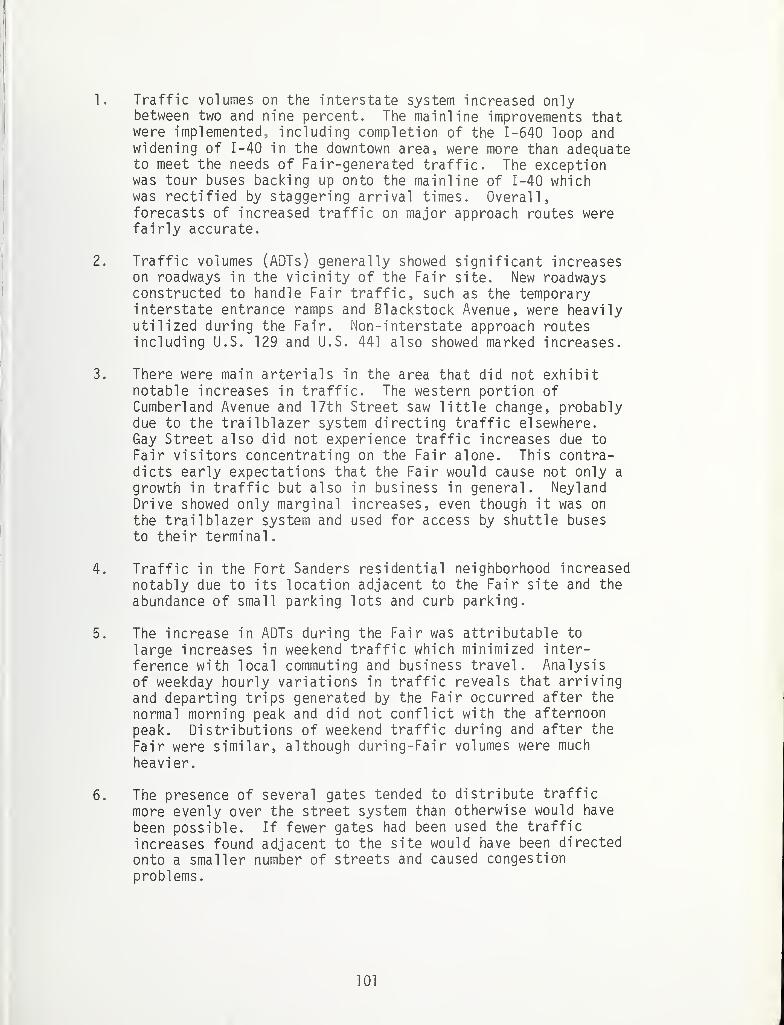
1. Traffic volumes on the interstate system increased onlybetween two and nine percent. The mainline improvements thatwere implemented, including completion of the 1-640 loop andwidening of 1-40 in the downtown area, were more than adequateto meet the needs of Fair-generated traffic. The exceptionwas tour buses backing up onto the mainline of 1-40 whichwas rectified by staggering arrival times. Overall,forecasts of increased traffic on major approach routes werefairly accurate.
2. Traffic volumes (ADTs) generally showed significant increaseson roadways in the vicinity of the Fair site. New roadwaysconstructed to handle Fair traffic, such as the temporaryinterstate entrance ramps and Blackstock Avenue, were heavilyutilized during the Fair. Non-interstate approach routesincluding U.S. 129 and U.S. 441 also showed marked increases.
3. There were main arterial s in the area that did not exhibitnotable increases in traffic. The western portion ofCumberland Avenue and 17th Street saw little change, probablydue to the trailblazer system directing traffic elsewhere.Gay Street also did not experience traffic increases due to
Fair visitors concentrating on the Fair alone. This contra-dicts early expectations that the Fair would cause not only a
growth in traffic but also in business in general. NeylandDrive showed only marginal increases, even though it was on
the trailblazer system and used for access by shuttle buses
to their terminal
.
4. Traffic in the Fort Sanders residential neighborhood increasednotably due to its location adjacent to the Fair site and the
abundance of small parking lots and curb parking.
5. The increase in ADTs during the Fair was attributable to
large increases in weekend traffic which minimized inter-
ference with local commuting and business travel. Analysisof weekday hourly variations in traffic reveals that arriving
and departing trips generated by the Fair occurred after the
normal morning peak and did not conflict with the afternoon
peak. Distributions of weekend traffic during and after the
Fair were similar, although during-Fair volumes were much
heavier.
6. The presence of several gates tended to distribute traffic
more evenly over the street system than otherwise would have
been possible. If fewer gates had been used the traffic
increases found adjacent to the site would have been directed
onto a smaller number of streets and caused congestion
problems.
101
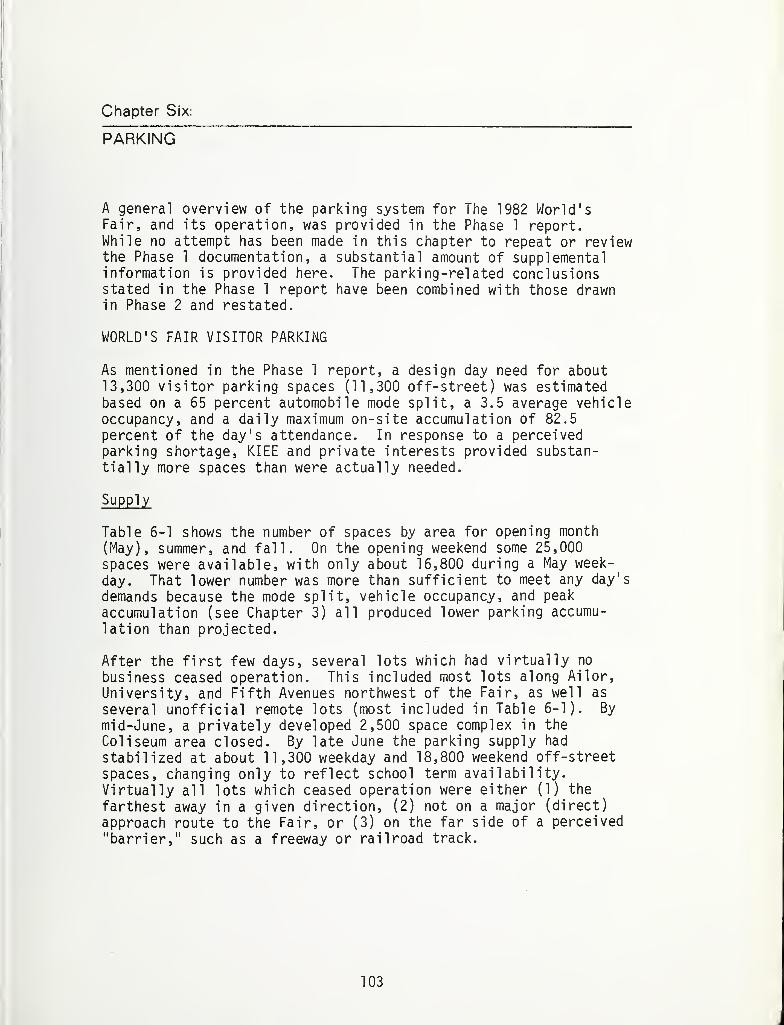
Chapter Six:
PARKING
A general overview of the parking system for The 1982 World'sFair, and its operation, was provided in the Phase 1 report.While no attempt has been made in this chapter to repeat or reviewthe Phase 1 documentation, a substantial amount of supplementalinformation is provided here. The parking-related conclusionsstated in the Phase 1 report have been combined with those drawnin Phase 2 and restated.
WORLD'S FAIR VISITOR PARKING
As mentioned in the Phase 1 report, a design day need for about13,300 visitor parking spaces (11,300 off-street) was estimatedbased on a 65 percent automobile mode split, a 3.5 average vehicleoccupancy, and a daily maximum on-site accumulation of 82.5
percent of the day's attendance. In response to a perceivedparking shortage, KIEE and private interests provided substan-tially more spaces than were actually needed.
Supply
Table 6-1 shows the number of spaces by area for opening month
(May), summer, and fall. On the opening weekend some 25,000spaces were available, with only about 16,800 during a May week-
day. That lower number was more than sufficient to meet any day's
demands because the mode split, vehicle occupancy, and peak
accumulation (see Chapter 3) all produced lower parking accumu-
lation than projected.
After the first few days, several lots which had virtually no
business ceased operation. This included most lots along Ailor,
University, and Fifth Avenues northwest of the Fair, as well as
several unofficial remote lots (most included in Table 6-1). By
mid-June, a privately developed 2,500 space complex in the
Coliseum area closed. By late June the parking supply had
stabilized at about 11,300 weekday and 18,800 weekend off-street
spaces, changing only to reflect school term availability.
Virtually all lots which ceased operation were either (1) the
farthest away in a given direction, (2) not on a major (direct)
approach route to the Fair, or (3) on the far side of a perceived
"barrier," such as a freeway or railroad track.

TABLE 6-1: VISITOR PARKING SUPPLY BY AREA - WEEKDAY
Area Opening Week Summer Fall
1-275 1,350 450 450
Ail or/University 1,240 - -
Dale Avenue - North Gate 3,130 2,780 2,910
Grand Avenue 370 370 370
Ft. Sanders (lots and availablecurb space) 540 740 540
CBD - Fair lots 2,550 2,300 2,300
Other Available 1,000 1 ,000 1,000
Church Avenue Area 4,550 1,850 1,850
Neyland Drive 360 1,160 360
Chapman Highway 1,700 710 710
Total Weekday 16,790 11,360 10,490
Additional Weekend Spaces 9,050 7,500 8,500
Total Weekend 25,840 18,860 18,990
SOURCE: Barton-Aschman Associates, Inc.
104

Di stri bution
Figure 6-A shows the percentage distribution of the spaces by areafor early May and October weekdays. Initially, spaces wereavailable in almost every direction both within walking distanceand beyond (when shuttle buses provided transportation ) . Approxi-mately 46 percent of all weekday spaces were within relativelyeasy walking distance to a gate. After the unused lots closed, 68percent of the weekly spaces were within walking distance.
It had been intended to locate visitor parking along approachroutes in proportion to the projected directional distribution ofapproaching Fair traffic. With the exception of the more distantlots, the ultimate distribution was similar to the directionaldistribution of approaching Fair visitor traffic. In this case,the market forces of supply and demand helped shape the ulitmatesystem.
Pricing
Designated "Official" World's Fair visitor parking lots all main-tained a daily parking rate of $6.00, with one exception discussedin Chapter 12. Unofficial lots had daily rates which variedbetween two and ten dollars per day. These rates were modified on
an hourly basis, if necessary, to try to fill lots. Most hourlyrate changes occurred by 11 A.M.; many by 10 A.M. after operatorsbecame more experienced and could predict lot usage based on the
amount of business before 10 A.M.
Theoretical ly, pricing changes were directed toward achievingincreased revenue and not necessarily maximizing the number of
vehicles parked. However, many operators perceived that a lot had
to be almost full to be profitable. Hence, some cut prices until
the lot could be mostly filled, regardless of the impact on
revenues.
Many of the daily price changes were meant to be competitive withnearby (within sight) lots. Generally, when changes were made,
daily rates were dropped to a dollar lower than the nearby lot(s).
However, some parking operators dropped the opening rate to four
dollars or even two dollars. By October most successful lots
close to the Fair charged $6.00 per day. Those which were less
successful had lowered their prices, generally to $4.00.
Location was observed to influence parking selection more than
price. Often a lot could command one to two dollars more than
another just one block further from a gate.
105
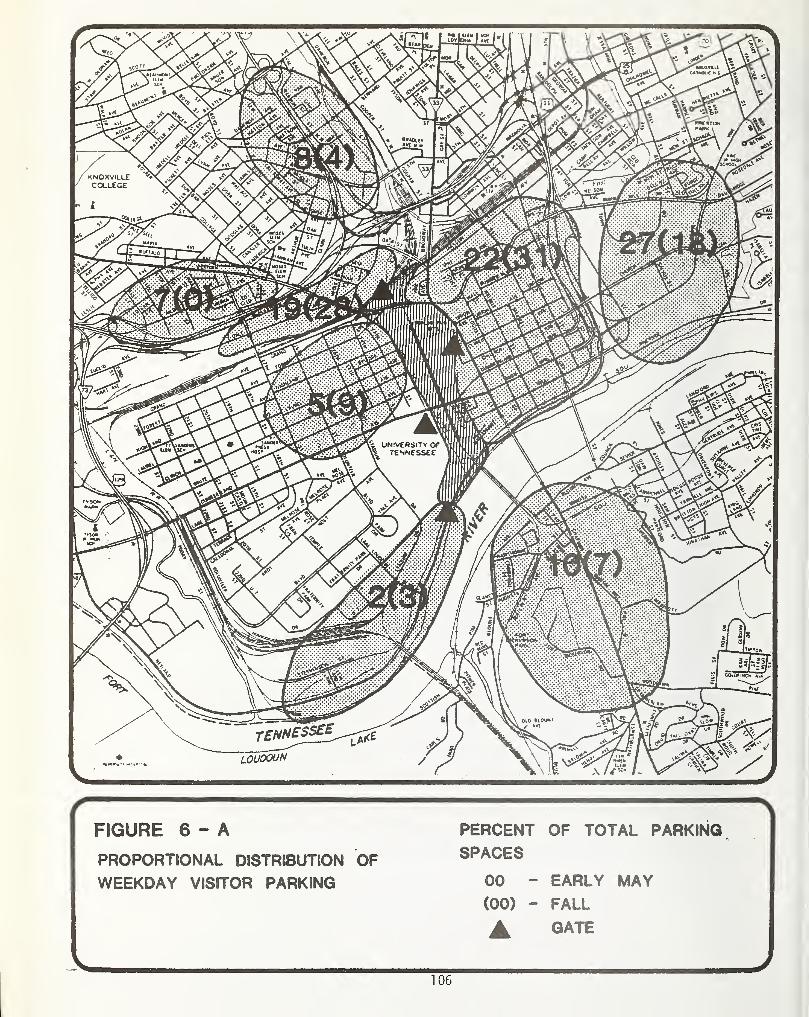
FIGURE 6 - A
PROPORTIONAL DISTRIBUTION OFWEEKDAY VISITOR PARKING
PERCENT OF TOTAL PARKING
SPACES
00 - EARLY MAY(00) - FALL
A GATE
10G
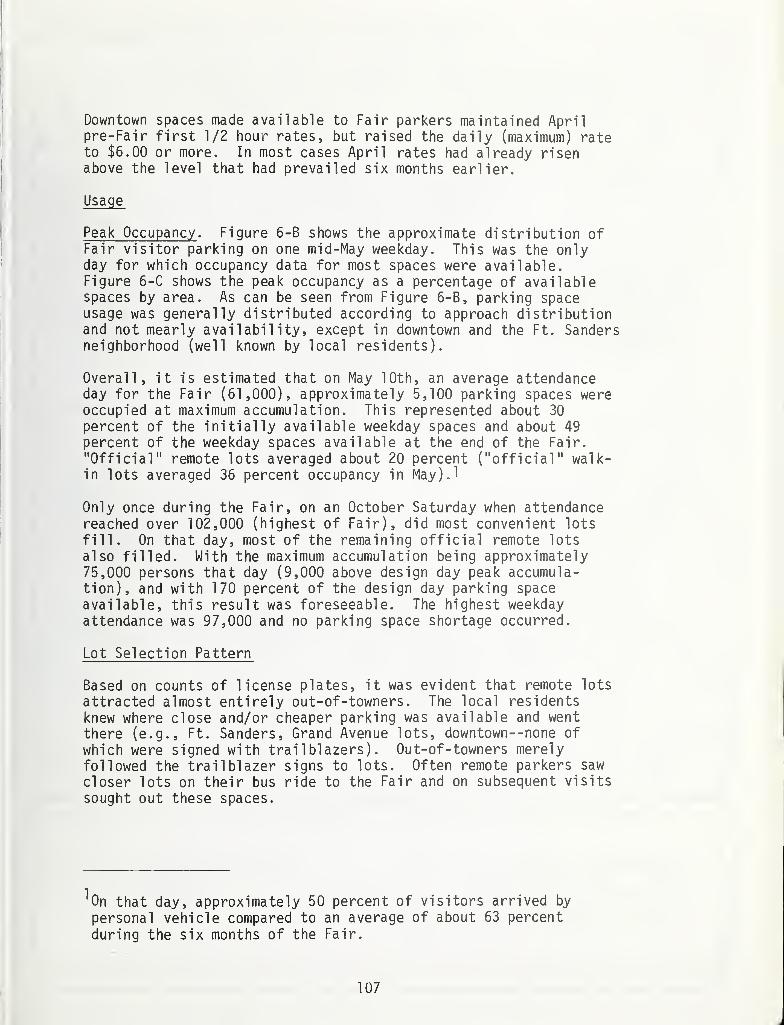
Downtown spaces made available to Fair parkers maintained Aprilpre-Fair first 1/2 hour rates, but raised the daily (maximum) rateto $6.00 or more. In most cases April rates had already risenabove the level that had prevailed six months earlier.
Usage
Peak Occupancy . Figure 6-B shows the approximate distribution ofFair visitor parking on one mid-May weekday. This was the onlyday for which occupancy data for most spaces were available.Figure 6-C shows the peak occupancy as a percentage of availablespaces by area. As can be seen from Figure 6-B, parking spaceusage was generally distributed according to approach distributionand not mearly availability, except in downtown and the Ft. Sandersneighborhood (well known by local residents).
Overall, it is estimated that on May 10th, an average attendanceday for the Fair (61,000), approximately 5,100 parking spaces wereoccupied at maximum accumulation. This represented about 30
percent of the initially available weekday spaces and about 49
percent of the weekday spaces available at the end of the Fair.
"Official" remote lots averaged about 20 percent ("official" walk-in lots averaged 36 percent occupancy in May)J
Only once during the Fair, on an October Saturday when attendancereached over 102,000 (highest of Fair), did most convenient lots
fill. On that day, most of the remaining official remote lots
also filled. With the maximum accumulation being approximately75,000 persons that day (9,000 above design day peak accumula-tion), and with 170 percent of the design day parking spaceavailable, this result was foreseeable. The highest weekdayattendance was 97,000 and no parking space shortage occurred.
Lot Selection Pattern
Based on counts of license plates, it was evident that remote lots
attracted almost entirely out-of-towners. The local residentsknew where close and/or cheaper parking was available and wentthere (e.g.. Ft. Sanders, Grand Avenue lots, downtown--none of
which were signed with trailblazers) . Out-of-towners merelyfollowed the trail blazer signs to lots. Often remote parkers saw
closer lots on their bus ride to the Fair and on subsequent visits
sought out these spaces.
On that day, approximately 50 percent of visitors arrived by
personal vehicle compared to an average of about 63 percent
during the six months of the Fair.
107
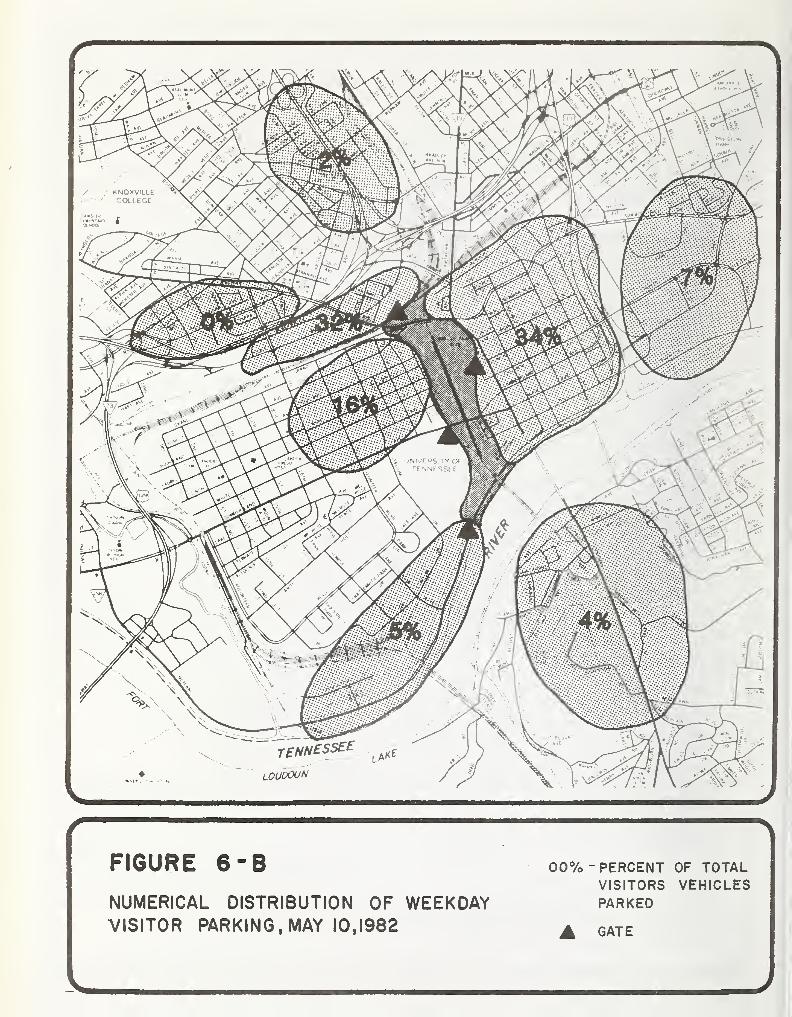
'PWESTOf*"AW-
,
mxaou
KNOXVILLECOLLEGE
;A>c>tH'
' TENNESSEE
LOUDOUN
FIGURE 6 "B
NUMERICAL DISTRIBUTION OF WEEKDAYVISITOR PARKING, MAY 10,1982
00% -PERCENT OF TOTALVISITORS VEHICLESPARKED
A gate
V
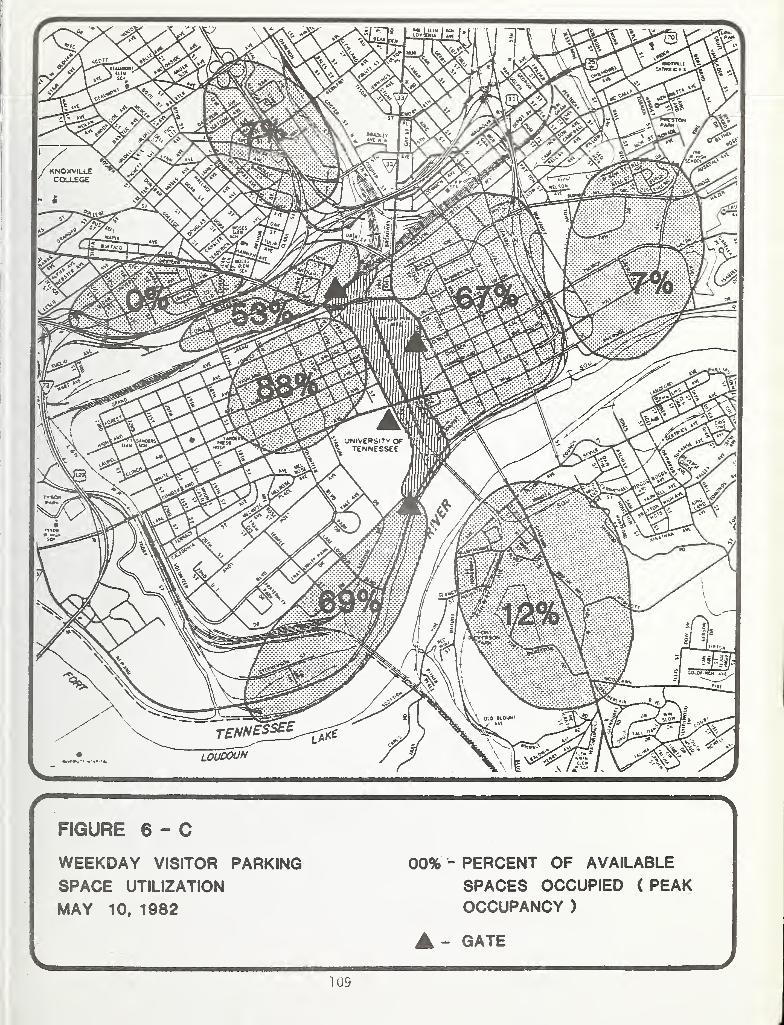
FIGURE 6 - C
WEEKDAY VISITOR PARKING
SPACE UTILIZATION
MAY 10, 1982
00% - PERCENT OF AVAILABLE
SPACES OCCUPIED ( PEAKOCCUPANCY )
A - GATEJ
10S
Once off the freeway, and on a given approach route, driverstended to select lots they felt were going to be closest to a
gate. Sometimes they knew where the gates were. Other times(first visits) many guessed that gates were where pedestriansdisappeared from sight (turned a corner). Many used that criterionto select parking locations. Others kept driving until they saw a
gate or ran out of lots and then turned back. At other timesvisitors parked in the first lot they found without knowingthey could continue along that approach and find a space nearer to
the gate.
Because of the excess supply of spaces, competition on someapproach routes was very keen. This was especially true along theDale/Blackstock Avenue approach where many lots were operated by
different parties. Pricing, flagmen, appealingly dressed flag-women, large bright signing, and souvenir stands were all used to
try to attract parkers. A heavily advertised Laurel and Hardypromotion was even attempted on one lot. Each method attractedsome parkers; however, it is difficult to conclude how effectiveeach method was when almost all operators used them.
Fate of Remote Lots
As mentioned above, the remote lots were able to attract mainlyout-of-towners making their first visit to the Fair. The distantlocation of these lots which were not lower in price, combinedwith almost constant availability of closer spaces, discourageduse of remote lots.
The high cost of providing sufficiently frequent shuttle bus
service, coupled with low revenues, caused most remote lots closedquickly. KIEE, under contract to provide shuttle service to the
remote facilities, tried in late May and again in July to termi-nate shuttle service due to the financial burden. Both times the
remote lot operators succeeded in forestalling the termination ofservice, although one operator accepted termination in June andmade other arrangements. Finally, KIEE succeeded in terminatingits contract shuttle service in early October. The remoteoperators arranged with K-TRANS to provide similar service for the
last 3h weeks of the Fair.
Both KIEE and the remote operators knew that both the lots and the
shuttle service required a substantial level of parking to covercapital and operating costs. Remote lots were felt by KIEE to be
needed to meet total parking demands. Once committed, bothparties had to follow through even though speculators developedmany new walk-in lots during the last 60 days before opening day.
In hindsight, KIEE should probably not have subsidized the shuttle
110
service so heavily. If lot operators had to pay all or most ofthe cost, the results might have been different Chapter 7
contains additional information concerning temporal use of remoteparking lots and shuttle service.
Conclusions
Visitor parking has been oversupplied at most recent World'sFairs, including Seattle, San Antonio, Spokane, and Knoxville.Even though this history has been known to fair sponsors, they all
have feared that there would not be enough parking. As a result,they provided enough themselves, then had an excess created at the
last minute when private interests created additional parking in
temporary facilities. The same is true for remote lots, which all
the above fairs had despite knowledge that they were always littleused.
It is difficult to accurately predict how many spaces privateinterests will create at the "last minute." However, experiencein the four above cities points toward these "last minute" lots
providing 30 to 40 percent as many spaces as are provided by
the Fair sponsor itself. In Knoxville the last minute walk-inlots accounted for over 3,000 spaces, about 20 percent of earlyMay weekday spaces. This amounted to about double the "official"walk-in spaces.
EMPLOYEE PARKING
Inbound, Outbound, and Accumulation Variations
Little information on employee parking is available to supplementthat presented in the Phase 1 report. However, 24-hour counts of
employee ingress and egress to the Fair from the remote employeelot by shuttle bus were made and have been summarized in graphicform in Figure 6-D. This represents a very limited sample, but
nonetheless, it is the only information of this type available.Figure 6-D shows hourly inbound and outbound movements plus on-
site accumulation. The accumulation closely parallels visitoraccumulation, as would be expected, except for an overlap whereshifts change in mid-afternoon.
^Land and development costs for temporary lots comprised the
largest part of the total 6-month cost. These costs were
incurred prior to opening day. The cost to operators to
remain open during the Fair was low. Hence, with only a small
amount of parking, most operators could generate enough revenueto exceed daily operating costs. Parking operators paid KIEE
for shuttle bus service based upon the number of cars parked.
Hence, the financial risk for shuttle service was mainly KIEE's.
Ill
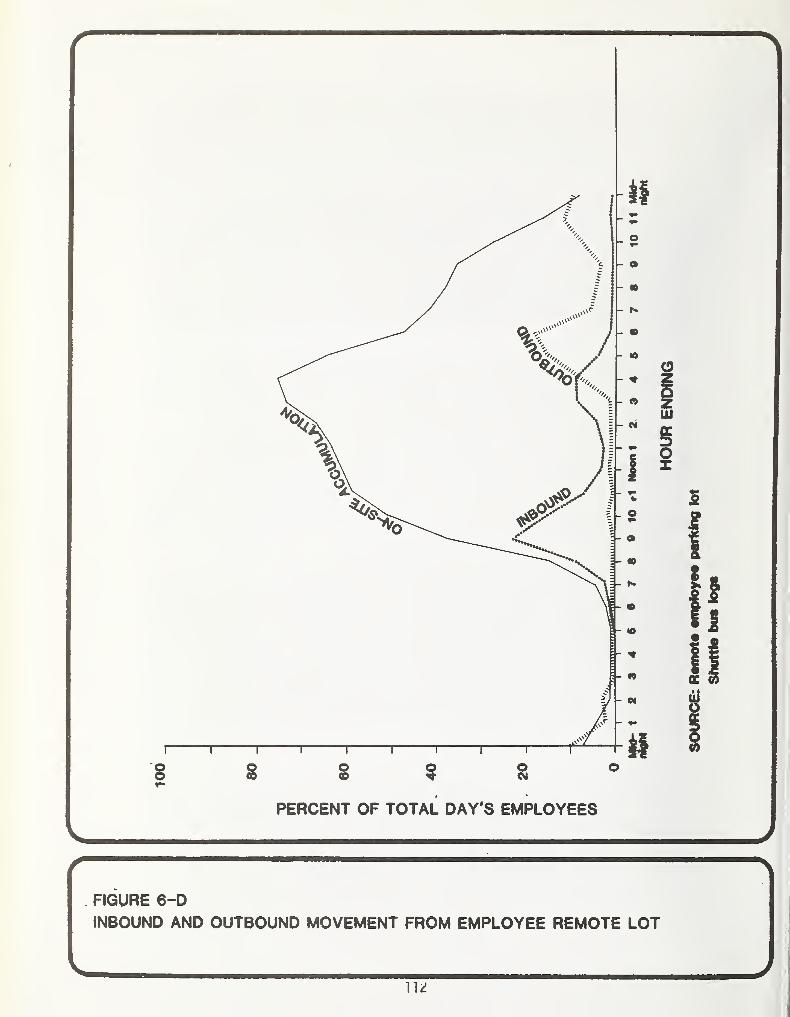
r~ — 1 1 * \
. FIGURE 6-D
INBOUND AND OUTBOUND MOVEMENT FROM EMPLOYEE REMOTE LOT
J11 *
It should be noted that the percentages shown on Figure 6-D are ofthe total employees working on a given day, not overall totalemployees. It should also be noted that the number of employeesworking from day to day varies, peaking on Saturdays (peak day ofweek)
.
Parking in Official Employee Lots
KIEE provided employee lots adjacent to the Fair site and at oneremote location. Use of these lots required a $20 monthly park-ing permit, although a daily fee was used in one lot during May.
Even at that low rate (downtown parking was typically $40 to $50per month where available), most employees were able to eventuallymake other parking arrangements.
Table 6-2 shows the monthly permits sold for employee lots.
Permit sales, and therefore employee lot usage, fell steadily fromAugust to the end of the Fair. Some of this decrease can be
attributed to overall Fair staff reduction. However, the dropsduring the last two months are substantially greater than employ-ment decreases.
The initial May employment at the Fair was estimated to total
5,000 to 6,000. Using 5,500 as a working estimate together with
the surveyed 1.14 employee vehicle occupancy, the June permit
sales represent only one permit for every 13 total employees and
one person in 11 using the employee lots as a driver or rider.
This compares to an estimate that about two persons in five would
use the lots as a driver or rider. While no similar statistics
were available for other World's Fairs, interviews indicated a
similar experience in Spokane.

TABLE 6-2: PERMITS SOLD FOR WORLD'S FAIR EMPLOYEE PARKING LOTS
LotsWalk-In Remote Total
May _0) .(2) -
June 205 223 428
July 232 185 417
August 246 120 366
September 195 _(3) 222
October 195 _(3) 195
) Information Not Available.
(^)Not Applicable. Employees were allowed to use lot with eitherpermit or daily fee.
(3)|_ot closed in August.
SOURCE: Knoxville International Energy Exposition, Inc.
114
CBD PARKING - THE FAIR'S IMPACTS
Parking Supply
Prior to the Fair, about 10,000 parking spaces existed in downtownKnoxville. As a result of the Fair, a number of additional park-ing facilities were added to the downtown parking supply. Thosewhich remain in use or were available for use after the Fair arelisted in Table 6-3 and shown on Figure 6-E. The hotels listedwere built to meet projected lodging needs in Central Knoxville,but were precipitated by the Fair. The two lots listed were builtas "temporary" lots for the Fair, but were paved and remainavailable for downtown parking. Several other small lots wereconstructed in the CBD for the Fair, but have been converted backto their prior uses or closed.
One lot, totalling about 150 spaces, has been created since the
Fair closed. It is on the Fair site near the L & N Stationcomplex and will support residual restaurant activities. This
lot raised the total residual parking supply increase due to the
Fair to 1,740 spaces, or about 15 percent of the pre-Fair CBD
parking supply.
Two other residual lots in the central area, but not actually in
the CBD, remain in use or available for use. A temporary lot
across from the Civic Coliseum on Mulvaney Avenue at Church Avenue
contains about 200 spaces. It has not been paved and could be
removed if not used. The other residual lot is actually an
expansion of an existing University of Tennessee commuter student
parking lot. This lot was expanded to accommodate its original
number of spaces plus the shuttle bus terminal. With the terminal
removed, an additional 300 spaces were created on a campus which
has been short of parking.
Rate Structure
Parking rates in downtown Knoxville have varied from lot to lot as
well as by area. These rates are structured in a four tier system:
- first half-hour rate
- additional half-hour or hour rate
- daily maximum rate
- monthly rate
Rate changes made between late 1981 and early 1983 have tended to
decrease the variation in rates, but some differences remain.
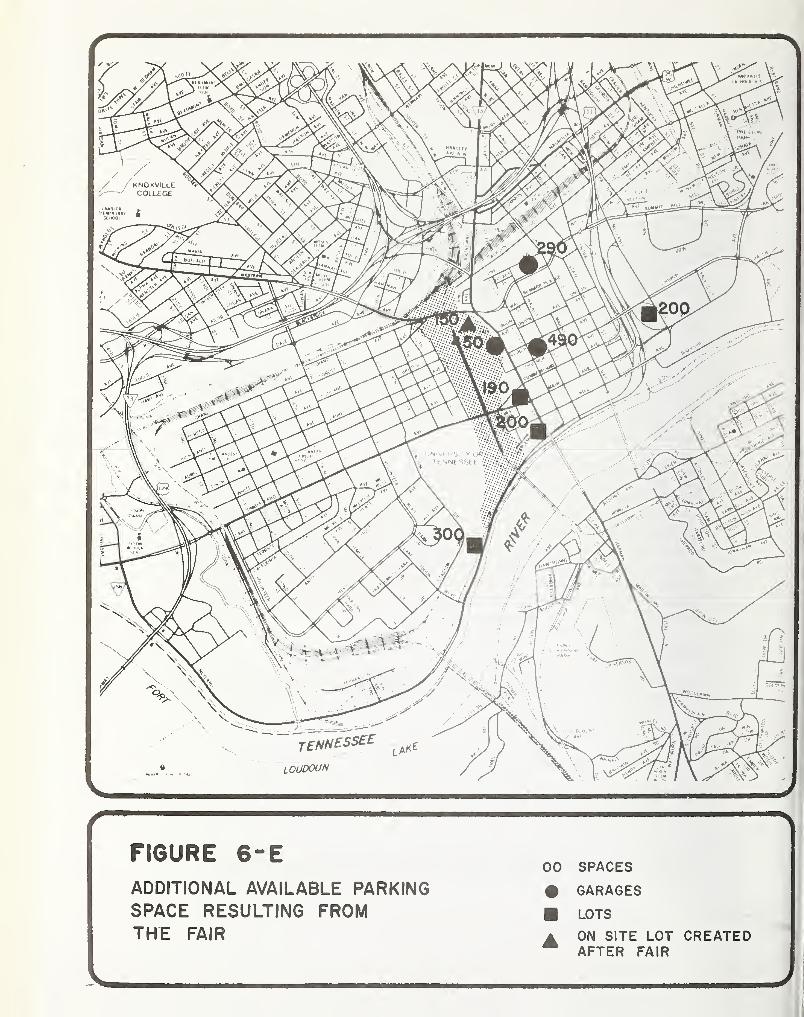
M
FIGURE 6-EADDITIONAL AVAILABLE PARKINGSPACE RESULTING FROMTHE FAIR
00 SPACES
# GARAGES
LOTS
ON SITE LOT CREATEDAFTER FAIR
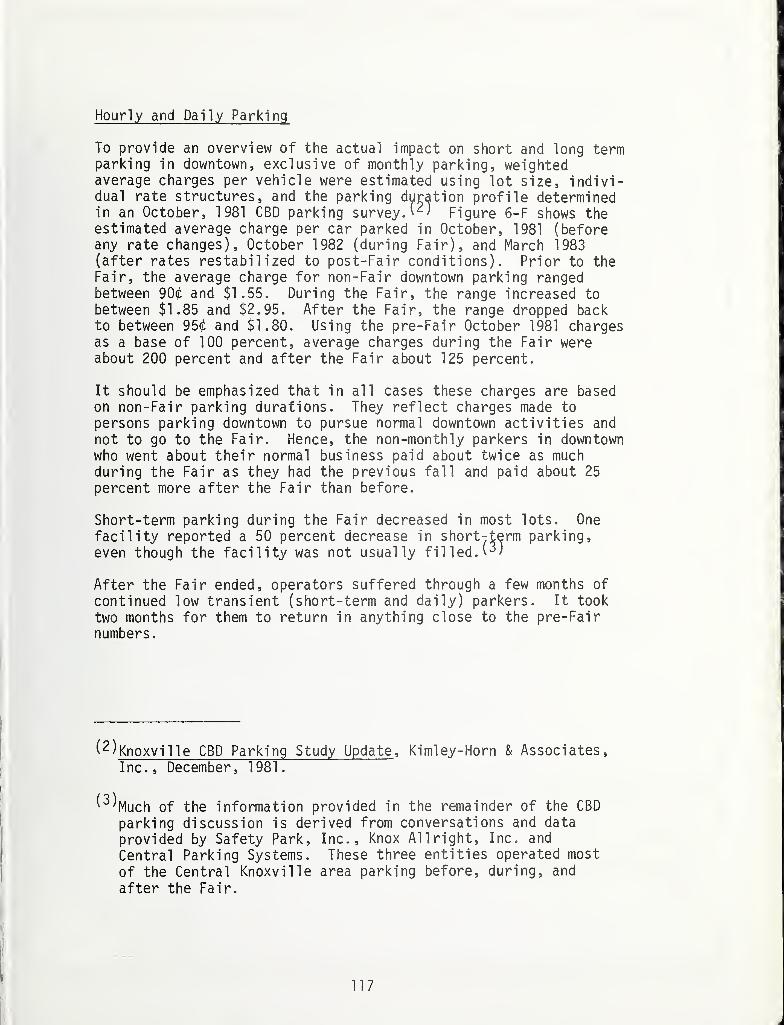
Hourly and Daily Parking
To provide an overview of the actual impact on short and long termparking in downtown, exclusive of monthly parking, weightedaverage charges per vehicle were estimated using lot size, indivi-dual rate structures, and the parking duration profile determinedin an October, 1981 CBD parking survey. Figure 6-F shows theestimated average charge per car parked in October, 1981 (beforeany rate changes), October 1982 (during Fair), and March 1983(after rates restabilized to post-Fair conditions). Prior to theFair, the average charge for non-Fair downtown parking rangedbetween 90$ and $1.55. During the Fair, the range increased to
between $1.85 and $2.95. After the Fair, the range dropped backto between 95$ and $1.80. Using the pre-Fair October 1981 chargesas a base of 100 percent, average charges during the Fair wereabout 200 percent and after the Fair about 125 percent.
It should be emphasized that in all cases these charges are basedon non-Fair parking durations. They reflect charges made to
persons parking downtown to pursue normal downtown activities and
not to go to the Fair. Hence, the non-monthly parkers in downtownwho went about their normal business paid about twice as muchduring the Fair as they had the previous fall and paid about 25
percent more after the Fair than before.
Short-term parking during the Fair decreased in most lots. One
facility reported a 50 percent decrease in shortyterm parking,
even though the facility was not usually filled, w)
After the Fair ended, operators suffered through a few months of
continued low transient (short-term and daily) parkers. It took
two months for them to return in anything close to the pre-Fairnumbers.
(2) Knoxville CBD Parking Study Update , Kimley-Horn & Associates,
Inc., December, 1981.
(^Much of the information provided in the remainder of the CBD
parking discussion is derived from conversations and data
provided by Safety Park, Inc., Knox A1 1 right, Inc. and
Central Parking Systems. These three entities operated most
of the Central Knoxville area parking before, during, and
after the Fair.
117
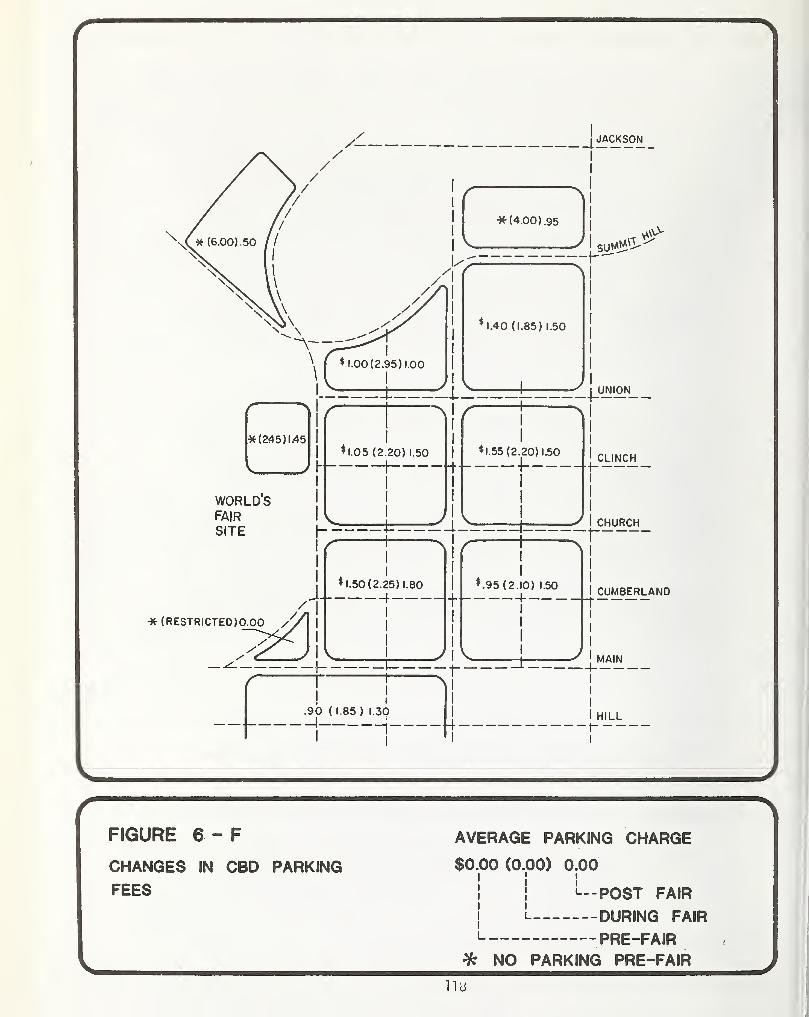
FIGURE 6 - F
CHANGES IN CBD PARKING
FEES
AVERAGE PARKING CHARGE
$0.00 (0 .00) 0.00i
y
•—POST FAIR
i l DURING FAIRi PRE-FAIR
Hz NO PARKING PRE-FAIR
na
TABLE 6-3: CBD PARKING SPACE INCREASE AS RESULT OF WORLD'S FAIR
Facility Spaces
Constructed In Conjunction With Fair
Hilton Hotel Garage 490
Holiday Inn Garage 450
Quality Inn Garage 260
Main-Cumberland-Henley Lot 190
Hi 11 -Broadway-Neyl and-Locust Lot 200
Subtotal 1,590
Created After Fair To Serve Residual Activities
L & N Station Lot 150
TOTAL 1,740
SOURCE: Barton-Aschman Associates, Inc.

Monthly Parking
Monthly charges for downtown employee parking in late 1981 typi-cally ranged between $27 and $37, with several exceptions.Beginning around January, 1982, monthly rates began to increase.These increases varied, mainly by operator rather than facility,due to different approaches adopted to balance increased revenuepotential with long-term business objectives. The intent was to
capitalize on the change in the demand/supply balance during theFair without driving off monthly parkers who generate much of the
revenue in many facilities.
Monthly rate increases generally ranged between $5 and $15, or 20
to 40 percent. In some cases the increases were made a fewdollars at a time. In others, the increase was made all at once.
In addition to rate increases, the supply of monthly parking waslimited. By May, it was nearly impossible to obtain a new monthlyparking space. Most operators stopped selling new monthly permitsprior to the Fair (some as early as January), although theyrenewed all existing commitments. In several cases, monthlyparking for the entire six months had to be paid for in advance to
ensure space would be secured. In other cases a small surchargewas added. However, in only a few cases was the monthly parkingintentially not renewed by the operators. In both known cases,monthly business was hard to regain after the Fair since the
operators or owners had forced out previous parkers.
A check of selected downtown parking facilities indicated thatduring the Fair (June), monthly parkers were down from pre-Fair(January, 1982) levels by about 20 percent. By January 1983,
three months after the Fair, the monthly permits had returned to
only five percent below pre-Fair levels. This later decrease maybe due as much to the effects of the ongoing recession's impact on
CBD employment as to parking system workings.
After the Fair, monthly rates returned to or near pre-Fair rates.While specific average rates are not available, monthly rates werereported by CBD operators to typically average ten percent higherthan pre-Fair rates.
The parking operators stated that monthly parking during the Fairwas very stable, with little turnover despite rate increases.Most monthly parkers were reported to have felt they were treatedfairly, given the increased demand and revenue potential foregoneby operators in retaining monthly parking (monthly parkingrevenues averaged only about $2.00 to $2.50 per day compared to
the $6.00 prevailing daily rate).
120

Operating Cost and Revenue Impacts
In the few years prior to the Fair, parking rates were held at a
constant level or lowered slightly to meet the rates offered atthe City of Knoxville's State Street Garage. This facility ofnearly 800 spaces was opened in the late 1970's. Its rates werebelow those charged in other downtown facilities. As a result,other operators were forced to lower or maintain their rates overan extended period to maintain their business. Finally, in late1981, rates began to increase for the first time in over twoyears, although operating costs had been increasing the entiretime.
During the Fair, all lots which had operated with coin box feecollection were converted to attendant controlled facilities.While attendants parked cars in a few lots, nearly all remainedself-park. In addition, operators increased staffing from oneeight-hour shift five days per week to two eight-hour shifts sevendays per week. On some lots, additional labor was added duringpeak activity periods. Overall labor costs during the Fair wereabout triple pre-Fair levels. Land/lease and other costs alsoincreased, but to a much lesser degree. Total CBD operating costsduring the Fair were reported to have increased to about doublepre-Fair levels.
Revenues during the Fair increased dramatical ly. Within two
blocks of the Fair, downtown parking revenues tripled. Smaller
increases were experienced farther away, although not many World's
Fair visitors parked east of Walnut Street.
After the Fair, rates returned to near pre-Fair levels. Operators
retained some of the increases to offset cost increases incurred
during 1979-1981 when rates were constant. Post-Fair revenues
have typically run between ten percent below and ten percent above
1981 revenues. The increased supply has resulted in fewer cars
being parked in facilities which existed before the Fair. Opera-
tors also said the return of some short-term parkers to downtown
was slow and some apparently decided to do business in outlyingareas instead of the CBD.
Overall Impacts
Overall, the Fair had a beneficial impact on downtown parking
conditions as experienced in a period of four months after closing.
Some of the impacts are:
- The parking supply is up by about 15 percent
- Revenues during the Fair were up by as much as 200 percent,
although operating costs increased only 100 percent
121
- Post-Fair monthly rates returned to near pre-Fair rates
- Post-Fair 1st \ hour rates are higher, making the averageparking fee about 25 percent above pre-Fair levels;overall this probably brings costs and revenues closeto their 1978 balance.
It is not yet known if the 15 percent increase in supply willresult in the same reduction in rates as was experienced when the
State Street Garage opened several years ago. As of March, 1983,operators of some of the new facilities were either not chargingfor parking (indicating that costs to monitor lots would be higherthan projected revenues), were still adjusting rates to try to
attract parking, or were subsidizing their parking operations from
other revenues (for example, hotel) while maintaining ratessimilar to other downtown facilities. Business in pre-Fairfacilities is down near these new facilities and this could lead
to further changes in pricing or removal of some of the low demandsurface lots from (public) parking use.
STATUS OF TEMPORARY WORLD'S FAIR PARKING LOTS
According to provisions in the City's temporary parking lot
ordinance, all temporary lots were to be "reclaimed" after the
Fair. The few temporary lots that remained in downtown are
paved or mostly paved. Temporary lots elsewhere remained as
gravel covered land with almost no reclamation activity.
One small temporary lot was returned to its pre-Fair condition as
a neighborhood playground on private land. Several other lots
were slowly returned to pre-Fair uses, mostly as materials storageyards utilizing gravel surfaces. The majority of lots lay idlefour months after the Fair.
While the City ordinance required reclamation within three monthsof the Fair's end, it was felt by City officials that gravel lotsare preferable to bare dirt lots. While both would eventually be
covered by weeds, the existing gravel surfaces would provide muchbetter erosion control. In the long run, while weeds and grasswould take longer to grow on gravel lots, the ultimate appearancewould be similar. Efforts to enforce the reclamation provision of
the ordinance had not been initiated as of four months after the
Fair.
122
CONCLUSIONS
The single most important decision made relative to parking wasKIEE's decision to break even financially on transportation. Thisdecision, combined with the resulting $6.00 parking fee and theCity's determination to limit its control of temporary parkingfacilities to meeting standards and zoning regulations, generateda surplus of World's Fair parking space. This surplus had far-reaching consequences in the financial problems it created forKIEE as well as private operators of temporary parking lotsoutside of downtown.
On the supply side, there was more than enough parking to meetdesign day demand. Parking was widely available along all
approach routes to the Fair. Operational ly , the available spacewas generally well located. Access to parking facilities workedwell due to prior roadway improvements, an effective trail blazersigning system, and location of parking on Fair approach routes to
intercept vehicles before they reached the site. Also the down-town and University of Tennessee parking supply was increased withseveral permanent facilities created in the process.
Downtown parking facility owners and operators recovered profitsnot made during the prior two to three years due to a depressedrate structure resulting from an excess supply and artificiallylow rates at the largest CBD parking facility. Post-Fair ratesappear to have stabilized at only about ten percent above pre-
Fair rates for monthly parking. Hourly and daily rates rose and
then fell. This resulted in a doubling of the average non-FairCBD parking charge during the Fair. Rates after the Fair stayedat about 25 percent above pre-Fair levels.
Temporary gravel lots, which had been expected to be eyesoresafter the Fair, were ultimately felt to be preferable to cleared
dirt lots and provided better erosion control characteristics.Despite ordinance requirements to reclaim the land from Fair
conditions, enforcement did not occur for the aforementionedreason.
As with Fairs in Seattle, San Antonio, and Spokane, remote lots
again proved unattractive to visitors and employees. It is
possible that the 1982 World's Fair could have survived with
virtually no lots beyond 1/3 to 1/2 mile distance from its gates,
since approximately 8,000 off-street visitor spaces were available
on "school weekdays" within this distance. This is further
supported by the fact that most downtown parking by Fair visitors
occurred within about two blocks of the Fair, although trailblazer
signs generally did not lead to CBD parking facilities.
123

The relationship between parking supply and demand might have beenbetter balanced if information on the number of permitted temporarylots were disclosed earlier. This was complicated, however, by
the unwillingness of entrepreneurs to make firm commitments andthe desire of the Transportation Services Division to keep negoti-ations private. However, it should be noted that this would nothave met sponsor desires for "guaranteed" space since verbalcommitments or permit applications did not always result in lotsactually being constructed.
World's Fair parking prices drove up downtown parking rates. Somemonthly parkers changed parking locations to other less desirablelocations or were encouraged to change modes of access to down-town. Some visitors to downtown business decided to do businesselsewhere during the Fair, affecting those businesses. After the
Fair, all parking rates stabilized at levels above pre-Fair levels.Average non-monthly charges per car parked were up by 25 percent.It is possible that earlier negotiations might have reduced the
cost of providing the parking system. However, given the relativeportion of parking costs attributable to land costs, it is un-
likely that rates would have been much below the $6.00 fee unlessremote parking was eliminated and/or the cost of shuttle buses wasnot covered from parking revenues. On the other hand, lower fees
would probably have resulted in decreased private sector interest.Precisely how much sensitivity entrepreneurs would have to a lowerdaily rate could not be determined. Neither could the parkingrate at which supply and design day demand were nearly in balance.
Most recent World's Fairs have been located in or adjacent to
downtowns. The following suggestions are made for considerationswhen creating a supply of parking for a downtown World's Fair:
- Permit temporary parking lots
- Provide close walk-in parking adequate to meet averageweekday needs
- Assume private enterpreneurs will develop additionalparking facilities adequate to meet most of the
remaining (peak) demand
- Make final commitments for any additional "official" orFair-sponsored parking no more than one month beforeopening day
- Avoid remote parking facilities beyond 1/2 mile from a
Fair gate.
124
Chapter Seven:
SHUTTLE BUS SERVICE
There were three types of shuttle service to carry visitors to
the 1982 World's Fair. Long-distance shuttle buses operated fromoutlying communities as far as 100 to 200 miles from Knoxville ona daily basis. Some of them sold transportation and Fair admis-sion as a package deal. Most of those carriers used the charterand tour bus terminal at the North Gate.
Other shuttle buses served hotels, motels, and campgrounds in
Knoxville and the surrounding area. They had agreements wherebythe bus operator would provide transportation for the peoplestaying at a given lodging and the lodging operator would sell
tickets for the bus operator. Some of those arrangements wereexclusive and in some cases the bus driver sold tickets but the
lodging operator received a commission. Most of the hotel/motel/campground shuttles used the Southwest Bus Terminal at the begin-ning of the Fair.
In addition, some private bus operators contracted with operatorsof remote parking lots to carry their patrons to and from theFair. Shuttle buses from remote unofficial parking lots also usedthe Southwest Terminal.
HOTEL/MOTEL SHUTTLE BUS SERVICE
Prior to opening day, over 70 shuttle operators (buses and vanscombined) had informed the Fair's Transportation Services Divisionof their intent to provide service to the Fair and requested an
allocation of space in the Southwest Bus Terminal. Operatorsindicated they could provide over 600 full-size buses, plus almost100 vans, with a total seating capacity of over 26,000 passengersfor service to the Fair. The total of all the individual operators'projections forecast daily passenger volumes would range from50,000 to 68,000. This contracted with the Fair's transportationconsultant design day forecast of 11,000-12,000 shuttle bus and
local transit passengers. Of those, only 4,000 were anticipatedto arrive as shuttle bus passengers, with the remainder distri-buted by local transit to the East and West gates. The shuttle
operators' projections were 12 to 17 times higher than the Fair's
projections on ridership.
As noted in the Phase 1 report, demands for loading space in the
shuttle (Southwest) terminal far exceeded the available space.
However, the Fair's Transportation Services staff attempted to
allocate the available space as equitably as possible and assuredoperators that space would be reallocated after an initial periodallowed for attrition.
Operation Attrition
Unfortunately, precise shuttle operation service records were notkept. Hence, only sketchy statistics can be presented for the
operation. Initially, 66 shuttle and van operators were assignedspace in the Southwest terminal. Eight additional van operatorswere directed to a curbside loading area on 11th Street north ofCumberland adjacent to the West Gate. Although it is known thatsome of the applicants never operated in the terminal, it cannot be stated with certainty that none of the terminal "no-shows"operated at all. Some may have found other loading spaces at
other gates. The dispatchers who operated the shuttle terminalrecalled the names of approximately 35 firms that had remained in
operation through the first month or two of the Fair. By the endof October, between 12 and 15 operators remained in business, andsome of them only ran one or two trips per day.
Demand Estimates
The original demand estimates developed by the transportationconsultant for the Fair indicated that a total of 15 percent ofthe Fair visitors would use local transit. This would be comprisedof approximately 10 percent on the local K-TRANS buses (scheduledfixed route service) and the remaining five percent on the hotel/motel shuttle bus system. These estimates were derived based on
the number of hotel rooms and other lodging facilities and the
estimated propensity of the visitors to use their personal auto-mobiles.
The shuttle bus operators serving the hotels and motels typicallyestimated the demand for their service on the basis of 3.5 occu-pants per room and a mode split of 30 percent for transit. Thisyields an average daily ridership estimate roughly equal to thenumber of lodging units at each facility. This estimate wasunrealistically high.
For reasons stated in Chapter 12, many of those who drove to theirlodging chose to drive to the Fair. Those who arrived at thelodging as part of a tour group typically traveled to the Fairwith the charter bus that brought them to the Knoxville area.It may also be conjectured that many people staying in the resort
126
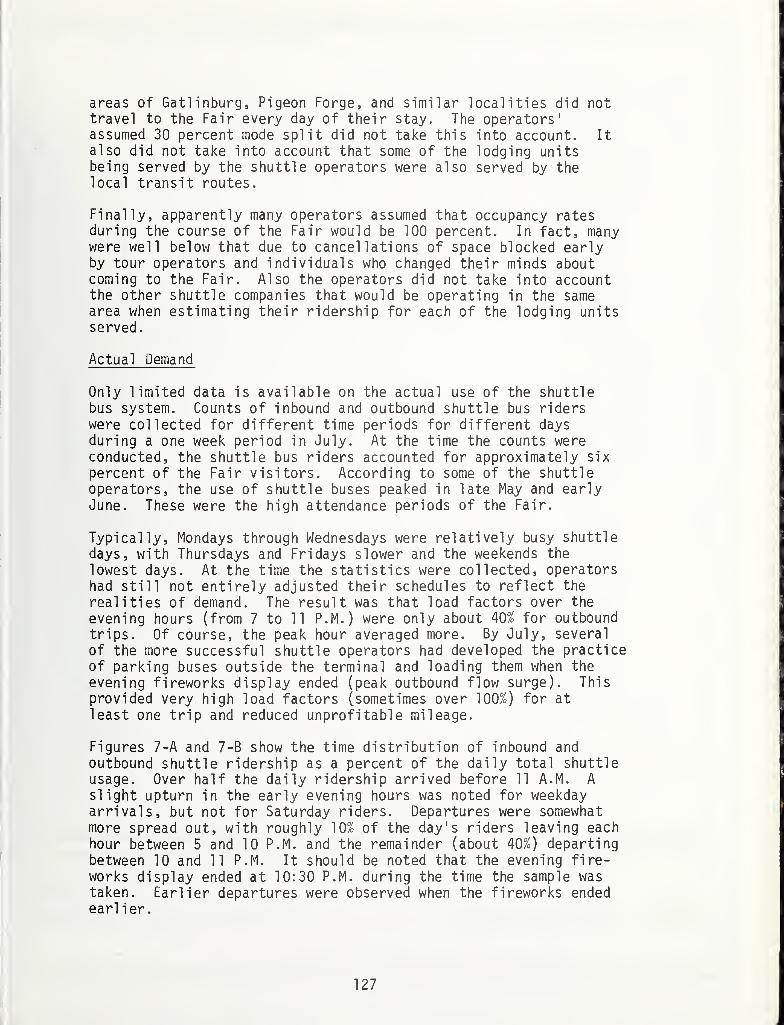
areas of Gatlinburg, Pigeon Forge, and similar localities did nottravel to the Fair every day of their stay. The operators'assumed 30 percent mode split did not take this into account. It
also did not take into account that some of the lodging unitsbeing served by the shuttle operators were also served by thelocal transit routes.
Finally, apparently many operators assumed that occupancy ratesduring the course of the Fair would be 100 percent. In fact, manywere well below that due to cancellations of space blocked earlyby tour operators and individuals who changed their minds aboutcoming to the Fair. Also the operators did not take into accountthe other shuttle companies that would be operating in the samearea when estimating their ridership for each of the lodging unitsserved.
Actual Demand
Only limited data is available on the actual use of the shuttlebus system. Counts of inbound and outbound shuttle bus riderswere collected for different time periods for different daysduring a one week period in July. At the time the counts wereconducted, the shuttle bus riders accounted for approximately six
percent of the Fair visitors. According to some of the shuttleoperators, the use of shuttle buses peaked in late May and earlyJune. These were the high attendance periods of the Fair.
Typically, Mondays through Wednesdays were relatively busy shuttledays, with Thursdays and Fridays slower and the weekends the
lowest days. At the time the statistics were collected, operatorshad still not entirely adjusted their schedules to reflect the
realities of demand. The result was that load factors over the
evening hours (from 7 to 11 P.M.) were only about 40% for outboundtrips. Of course, the peak hour averaged more. By July, severalof the more successful shuttle operators had developed the practiceof parking buses outside the terminal and loading them when the
evening fireworks display ended (peak outbound flow surge). This
provided very high load factors (sometimes over 100%) for at
least one trip and reduced unprofitable mileage.
Figures 7 -A and 7-B show the time distribution of inbound and
outbound shuttle ridership as a percent of the daily total shuttleusage. Over half the daily ridership arrived before 11 A.M. A
slight upturn in the early evening hours was noted for weekdayarrivals, but not for Saturday riders. Departures were somewhatmore spread out, with roughly 10% of the day's riders leaving eachhour between 5 and 10 P.M. and the remainder (about 40%) departingbetween 10 and 11 P.M. It should be noted that the evening fire-works display ended at 10:30 P.M. during the time the sample wastaken. Earlier departures were observed when the fireworks endedearl ier.
127
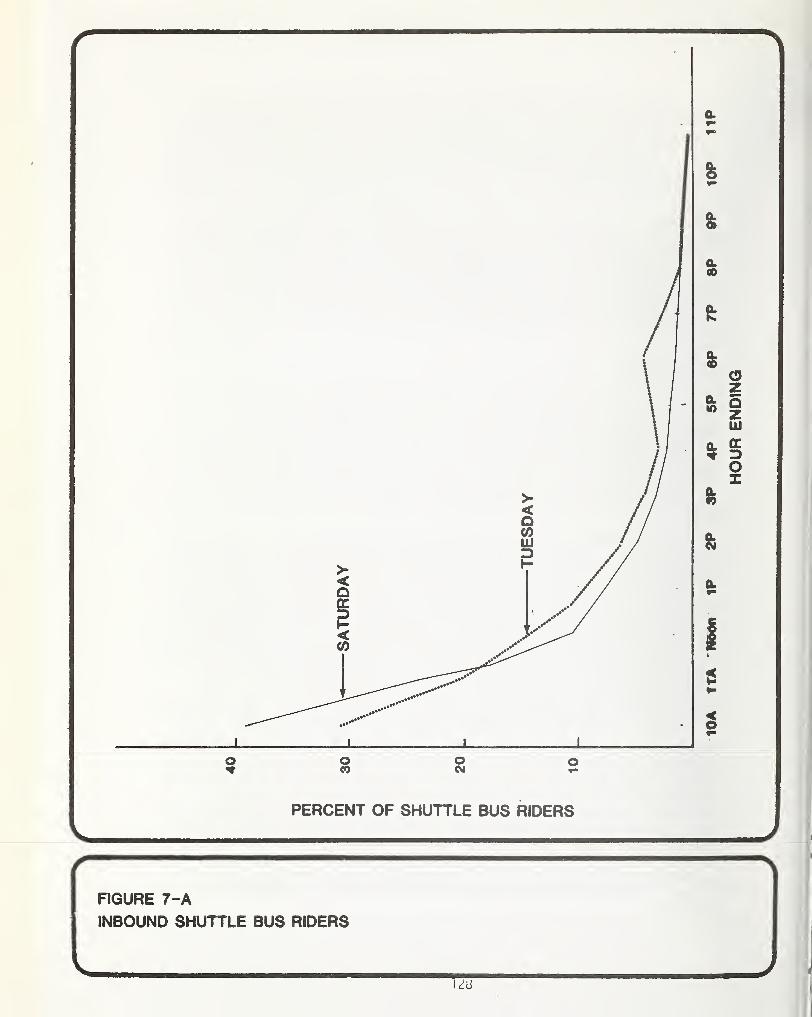
o1 i
o«0
oCM
PERCENT OF SHUTTLE BUS RIDERS
FIGURE 7-A
INBOUND SHUTTLE BUS RIDERS
r
r—
—
1 ! 11 1 1 1 — —
FIGURE 7-B
OUTBOUND 8HUTTLE BUS RIDERS
^
J\
129
HOUR
ENDING

Gatl inburg-Pigeon Forge Shuttle Service
The service operated by Trailways, Inc. from a parking lot at the
edge of Gatl inburg to the shuttle terminal was one of the moreaggressively promoted services. It offered round trip servicebetween Gatl inburg and the Fair for $10 per person ($9 from PigeonForge) and frequent departures. Trailways also sold one-waytickets at the Fair for the return ride. This service was pro-moted to individuals and tour operators as an alternative forpeople who came to the Fair with a group, but wished to return to
a Gatl inburg or Pigeon Forge lodging at a different hour than the
group's schedule. In total, this service carried approximately70,000 passengers (one-way) during the course of the Fair. At the
start of the Fair they were running 36 trips per day. By the endof October, the schedule had been reduced to eight daily trips on
weekdays and five on Saturdays and Sundays. Passenger volumesdeclined steadily, month by month, as shown in Table 7-1.
TABLE 7-1: TRAILWAYS GATL I NBURG/ P I GEOiT FORGE SERVICE
Month Passengers
May 20,000
June 18,500
July 10,800
August 8,300
September 6,600
October 5,400
The Gatl inburg-Pigeon Forge area was the site of active competi-tion among shuttle bus operators. In addition to Trailways,service was provided by Gatl inburg Coach and Stage Line, Transpo,Peak Transportation, Smoky Mountain Transit, and at least one van
operator. All operators reduced service quickly when the realitiesof demand became apparent. None claimed the service wasprofitable.
One attempt to reduce competition and adjust supply to demand wasmade by an operator who advanced the concept of a "universalticket" to be sold at the public parking lots in Pigeon Forge.
This ticket would be honored by any carrier serving the area.
KIEE's Transportation Services Division endorsed the idea as a way
130
to increase load factors and reduce congestion in the bus terminal,but the other operators denounced it as an attempt by one carrierto increase his revenue at the expense of others. The poolingarrangement to reduce the total number of bus trips was nevertried.
SOUTHWEST TERMINAL OPERATIONS
Figure 7-C, provides a detailed illustration of the shuttle busterminal. Built on a narrow strip of land created by adding fillto the edge of an existing University of Tennessee parking lot, it
operated under significant constraints. Not only was the terminalarea itself narrow, but the placement of the entry relative to theintersection of Lake Loudoun Boulevard and Neyland Drive createdsome traffic management challenges. The site did not have enoughland area to permit bus staging within the terminal, which in turnforced shuttle operators to dispatch and schedule to meet theterminal constraints as well as the traffic demands.
The description of terminal staffing and operations which followsis intended to show what is possible given a constrained site.
Terminal Operations and Staffing
The operating concept originally developed for the shuttle bus
terminal envisioned buses arriving in the morning and beingdirected by a KIEE dispatcher to the nearest available unloadingposition. Buses would pull in, unload, and leave the terminalimmediately. Each carrier was also assigned a specific loadingberth for departures from the Fair. Depending on the carrier'sprojected volume, the loading berth was assigned on a shared or an
exclusive basis. For afternoon and evening trips leaving the
Fair, the carrier pulled into the dedicated loading berth no morethan ten minutes before the scheduled departure time, loaded anddeparted promptly (all trips leaving the Fair were required to be
scheduled unless the carrier had exclusive use of the space).
Carriers were only to be allowed to bring as many buses into the
terminal at one time as they had spaces. For the largest carriers,this meant a maximum of four buses.
The original plan to have buses unload at locations other than
their assigned departure berths resulted from an attempt to
minimize walking in the terminal. The long, narrow terminal
layout resulted in a distance of almost 1,000 feet between the
most remote bus loading berth and the beginning of the walkway to
the Southwest Gate. There appeared to be no need to forcevisitors to walk that far, since the anticipated arrival patternfor buses would have enabled virtually all of them to unload
within 200 feet of the walkway.

FIGURE 7-C
SOUTHWEST SHUTTLE BUS TERMINAL* DISPATCHER
(Dark Areas Are Pedestrian Islands)
132
Berth allocation was governed by two general principles. First,the carriers with the highest projected volumes were assignedberths nearest the gate, using the prinicple of minimizing totalwalking distance within the terminal area. The three high-volumecarriers who had arranged to interchange passengers (Trailways,Energy Express, and Southern Cartage) were assigned adjacentloading areas for the same reason. An agreement between thesecarriers allowed passengers of Energy Express and Southern Cartageto spend the day in Gatl inburg rather than at the Fair. Thepassengers could purchase tickets to ride on the empty backhaulTrailways buses to Gatl inburg in the morning and return on theempty buses coming back to Knoxville in the evening.
Second, capacities of loading positions were assumed to be sixbuses per hour for exclusive use; four buses per hour for shareduse. Carriers' estimated demand and initial schedules were takeninto account in space assignments and the KIEE TransportationServices Division staff judgments were used to deflate overlyoptimistic projections of need for space. Carriers who sharedloading spaces were contacted when necessary and asked to shiftarrival or departure times slightly to make space utilization moreefficient.
Under the original staffing plan, one KIEE dispatcher was scheduledto stand at the entry of the terminal to regulate the flow ofbuses and assure that carriers did not attempt to bring more busesinto the terminal than they had berths assigned. In the morning,the second and third staff members were to stand in the mainportion of the terminal directing buses to the first availableunloading slot and assisting traffic to clear the terminalpromptly. In the evening, one dispatcher was to be stationed in
the main portion of the terminal to insure that carriers sharingloading berths did not remain past their scheduled departure time,
with an assistant dispatcher to help.
Changes in Staffing and Operation
Within the first week of the Fair, it became apparant that the
original unloading scheme was unnecessary. Carriers with slots
near the walkway to the gate preferred to use their assignedloading zones for unloading, and it was neither necessary nor
possible to make them stop. Carriers who shared spaces more
distant from the walkway divided into two groups. One group used
the loading zone for unloading, on the theory that passengerswould be less confused if they were told to find the bus in the
evening at the very spot where they left it in the morning.Their passengers arriving at the Fair seemed willing to walk to
the gate, even from the far ends of the terminal. The other groupof carriers would slow down when passing their loading zone,
tell their passengers where to find the bus in the evening, and
133

drive up as close to the gate as possible before unloading. Both
systems appeared to work equally well, once terminal volumesstabilized at rates appropriate to demand.
The dispatcher stationed at the lot entrance found a major portionof the workload consisted of barring unauthorized vehicles fromthe terminal rather than regulating the flow of authorized vehicles.Since a sheriff's deputy paid by KIEE was also stationed at that
location during peak hours, it became apparent that the dispatcher'sjob was somewhat redundant, although the position was retained.With hindsight, either the communications between the terminal
itself and the entryway should have been improved (walkie-talkiesproved unreliable due to electrical interference from high-tensionlines close to the site) or the entry dispatcher should have been
ordered and trained to keep a strict tally of loading zone occu-pancy and only allow vehicles into the terminal when space was
available. In a similar situation in the future, one person at
the terminal entry can be used to control entry by unauthorizedvehicles. The staff in the middle of the terminal can enforceberth allocations by directing excess vehicles to leave the
terminal without loading. This was done on several occasions atthe shuttle terminal.
Once demand and schedules stabilized and drivers became familiarwith the terminal, the KIEE staff's main responsibility turned out
to be safety. The terminal configuration unfortunately made it
tempting for passengers to ignore the pedestrian zones and walkdirectly across the terminal bus drive to the waiting buses.Hence, pedestrian-vehicle separation became the major safetyconcern and the lot dispatchers often had their hands full whenthe post-closing crowd arrived in the terminal. Given the spaceavailable, a better design to reduce conflict may only have been
achieved at the cost of the 10 bus and 10 van berths in the middleof the terminal
.
The original design also called for individual bus berths , each ofwhich could accommodate only one vehicle, to be assigned to
individual carriers or to be shared among carriers. The berthswere separated by 40' of unassigned space to permit one bus to
pull out and depart without waiting for the bus ahead to leave.
It soon became obvious that this concept was creating a hardshipfor some carriers who might be prevented from entering the terminal
since another carrier was using their berth while an adjacentberth stood empty. At the urging of both KIEE staff and severalcarriers, the assignments were converted to loading zones , each of
which accommodated three buses (again, with pull-out space betweenbuses). Passengers had no difficulty finding their own bus in a
group of three within a 200-foot segment of platform and operators
134
had the added convenience of reducing delays at the entry to theterminal. Pooling the berths in groups of three increased utili-zation and made the terminal function more efficiently.
PARKING LOT SHUTTLE BUS OPERATIONS
Shuttles from unofficial parking lots used the Southwest Terminaland were handled in the same way as hotel/motel shuttles. It wasnoted that two of the more successful shuttle operations, at leastas far as load factors were concerned, were privately operatedfrom parking lots relatively close to the Fair. These shuttlesused school buses and appeared to be fairly busy even on days whenplenty of parking space was available in the "Official" lot nextto the shuttle bus terminal.
Shuttles from "Official" World's Fair parking lots used an on-street terminal on Locust Street between Clinch and Church Avenuesa block away from the Fair's East Gate. The terminal was situatedat the end of the pedestrian bridge which spanned Henley Streetand led directly to the East Gate. By locating the parkingshuttle terminal on Locust Street, the Fair's planners hoped to
achieve several objectives:
1) To reduce the number of pedestrians attempting to crossHenley Street at grade.
2) To reduce traffic congestion on Henley Street by having
the buses unload on another street.
3) To reduce shuttle bus cycle times by avoiding the
congestion anticipated on Henley Street, yet still
operating to the gate closest to the remote lots.
4) To avoid overtaxing the capacity of the other bus
terminals.
Terminal Operations
The terminal was located on the west side of Locust Street in the
block between Clinch and Church Avenues. (See Figure 7-D). It
was determined that the block face along Locust could only accommo-
date four buses at one time. Four of the five shuttle routes were
assigned to load and unload at that location. These buses were
allowed to layover at their loading zones between trips when there
was slack time in the schedule. Layovers were to be taken at the
parking lot end of the line during hours when the peak demand was
inbound to the Fair.
135
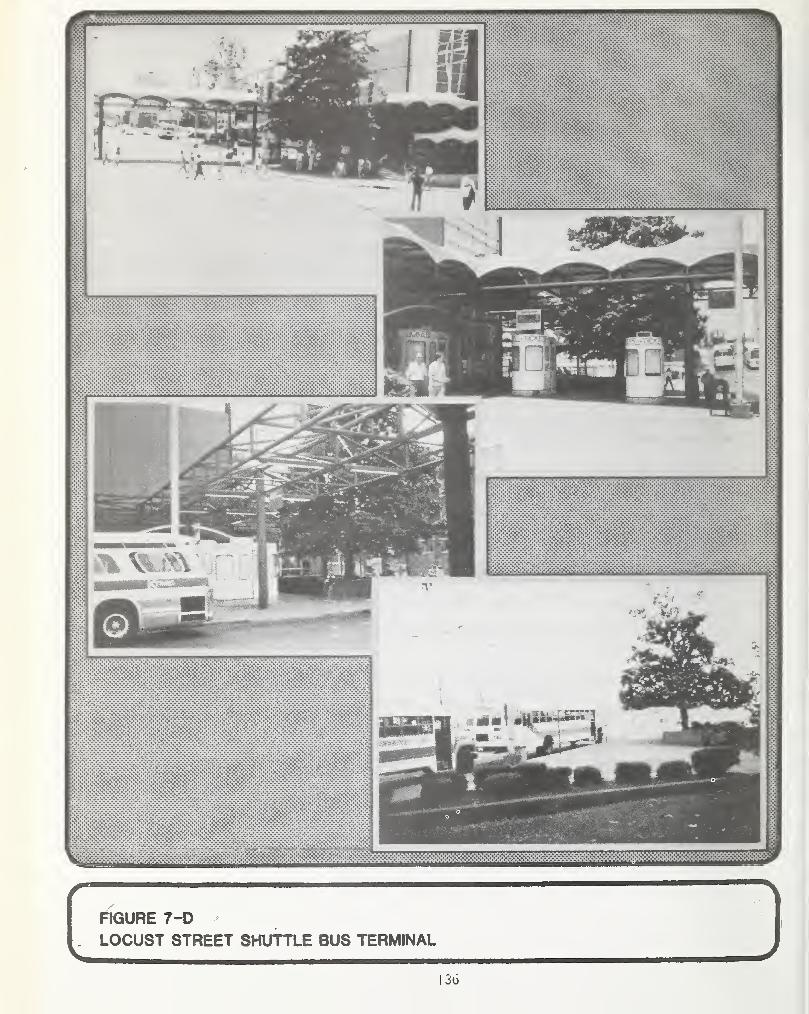
gfc %-ifS.
OTI-Tv?^
FIGURE 7-D
LOCUST STREET SHUTTLE BUS TERMINAL

The fifth route, serving the Willow Street lot, operated west onClinch Avenue and stopped on the north side of Clinch Avenue justeast of the intersection of Locust Street. Layovers were notpermitted at that location by order of the Knoxville PoliceDepartment, which felt that Clinch Avenue was not wide enough tohandle the traffic volume with the curb lane blocked by buses.Fortunately, the Willow Street lot was one of the routes operatedby K-TRANS and there was already an established bus stop at thatlocation. Hence, K-TRANS could use this stop in ways similar toits normal operations.
As mentioned in the Phase I report, the "official" parking lotshuttle services operated under contract to KIEE were dividedbetween two carriers: K-TRANS and Transportation Enterprises, Inc.
(TEI). K-TRANS initially served the Willow Street and Coliseumlots east of the Fair site. TEI served the Baxter Avenue lotsnorth of the Fair and the Hawthorne Street and Martin Mill Roadlots off Chapman Highway south of the river. Each route had a
designated loading berth initially, although when shuttle bus
volumes declined the operators became somewhat more casual aboutthe precise loading zone.
Original plans called for the terminal to operate on a rapid flow-
through basis, with buses stopping in the downtown area only long
enough to unload or load and then proceeding immediately back to the
parking lot. The initial schedule called for a maximum of 16
buses in service for the Coliseum, 3 for Willow Street, 7 for the
Chapman Highway lots, and 8 for Baxter Avenue. If operated, these
schedules would have resulted in an aggregate flow of 43 buses per
hour through the terminal. At peak hours, schedules were planned
on the basis of loads of 55 passengers per bus and the passenger
volume through the terminal would have amounted to 2300-2400
persons per hour.
Dwell times were estimated at three minutes to unload and five
minutes to load. Since the peak direction of travel was always
expected to carry virtually all the traffic with very little
reverse-flow riding, the layover time was based on time of day
with shorter layovers in the morning and longer ones in the
afternoon and evening. The bus capacity of the terminal was thus
estimated at 100 per hour for arrivals (20 turnovers per space per
hour) and 60 per hour for departures.
Little effort went into attempting to determine the pedestriancapacity of the terminal area since there was no choice open to
the Fair in terms of the layout of the pedestrian space on the
sidewalk adjacent to the bus loading zone.
137
The capacity of the bus terminal was never tested. Remote parkinglots and their associated shuttles never experienced enough demandto heavily load the terminal except for very brief evening periodsafter the end of the nightly fireworks display. Therefore, it is
not possible to make an informed judgment about the adequacy ofthe terminal design.
Carrier Operations
The two shuttle carriers operated in relative harmony once bound-aries of their respective loading zones were clarified. TheKnoxville Police Department enforced the no-layover rule. Thismade it necessary for both operators to time their departures fromthe parking lots in evening hours to afford them just enough timeto load and leave the downtown terminal without lingering.
Carriers responded quickly to cut back service at KIEE's directiononce it became obvious that the demand was not going to live up to
forecasts. KIEE's incentive to cut back TEI's service was somewhattempered by the fact that the contract between TEI and KIEE calledfor a guaranteed minimum of ten hours' of service per day by eachof 16 buses for the first 60 days of the contract. There wereminor cancellation penalties for buses released from the fleetbefore August 25, 1982. There was barely enough demand for TEI
to provide the daily minimum number of hours of service. Even
with TEI responsible for operating the employee shuttle from theremote employee parking lot, the total number of hours of servicepurchased tended to remain near the contract guarantee figureuntil after July 1. Thus, KIEE had contracted for more servicethan was needed.
Hourly Distributions
Limited data are available indicating the hourly distribution of
ridership to and from the Fair on the remote parking shuttles.Figures 7-E and 7-F show the inbound and outbound distribution fora typical Tuesday and Saturday. Shuttle operators commented thatthey often found loads waiting at the lots well before 9 A.M. andthat they felt it would be advisable to begin the shuttle serviceas early as 8:30 A.M. With high daily ridership of approximately2000 one-way trips per route, TEI found peak-hour inbound loadswere approximately 30% to 45% of the daily inbound movements.Outbound movements were somewhat more evenly spaced, with the
outbound peak hour of 20-25 percent of the daily outbound trafficoccurring between the hours of 10:00 and 12:00 P.M. This was the
result of activities ending on the Fair site such as the fireworksdisplay. However, the outbound distribution from remote parkinglots was not as peaked as that at the gates.
138

\
J\
FIGURE 7-E
INBOUND SHUTTLE BUS RIDERSHIP PATTERN
w

J\
FIGURE 7-F
OUTBOUND SHUTTLE BUS RIDERSHIP PATTERN
140

Seasonal Variations
Figure 7-6 shows the number of vehicles parked in the remote lotsper 100 attendance for the course of the Fair. As seen in theplot, there is a wide variation in the parking rate per 100attendance. The parking rate peaked in mid-June, was stablethrough July, and declined significantly in August. The generalfeeling was that the remote lots tended to serve out-of-townvisitors who were not familiar with the area and parked in thefirst space that was available.
CONCLUSIONS
Several conclusions can be drawn about hotel/motel shuttle opera-tions from the Knoxville experience. A terminal facility needs to
be provided to accommodate the shuttle operations. The terminalshould be located close to a Fair gate to encourage passengers to
use the shuttle buses. One problem that arose in Knoxville wasthat the terminal was located adjacent to a major parking lot thatwas available for Fair patrons. The parking lot was typically notfull and shuttle operators lost passengers as they found theycould park as close to the Fair as the shuttle terminal and payless to park than they were paying to ride the shuttle service.
Shuttle terminals designed for future Fairs or major specialevents should incorporate the following features, where possible:
-- Permanent loading zones for each carrier or group ofcarriers.
-- Sufficient flexibility in the layout to permit shiftingcarriers to other locations to reflect changes in bus
volumes or berthing requirements.
-- Maximum feasible separation of pedestrian and vehiculartraffic.
-- Clear identification of location of carrier loading zones,
preferably with a graphic display of the terminal for
reference.
The excess supply of shuttle operators, as discussed in the Phase
I report and sections of this report, might have been alleviated
by different methods. Had it been able to commit the necessarymanpower, the Fair could have acted as a broker between shuttle
operators and lodging operators to combine the service being
provided by each of the operators into efficient patterns. This
could also have been accomplished through the Public ServiceCommission's regulatory process by awarding the right to provide
service on a route by route basis. In the absence of this strong

—CM
CARS/ 100'S ATTENDEES
f"FIGURE 7-G
PARKING AS A FUNCTION OF ATTENDANCE
regulatory action, it is doubtful that any effort undertaken bythe Fair to combine the service into efficient patterns would havebeen beneficial. The regulatory agency could have intervened to
limit overall supply to more closely match demand. However, thedegree of uncertainty about the size of demand would have made theregulators' task extremely difficult.
A more drastic alternative would have been for the Fair itself to
operate the lodging shuttles. This option was discarded early by
KIEE's Management Committee, in line with the general policy ofallowing the private sector to provide as much of the auxiliaryservices as possible. In retrospect, while the supply could havemore closely matched the demand, the risk of substantial loss in
shuttle operations was far greater than the profit potential. TheFair's main interest in transportation was to ensure that visitorshad easy access to the site and the private sector respondedadequately without any stimulus from the Fair.
While KIEE Transportation Services Division staff were subjectedto intense pressure to allocate more space to individual carriersduring the final few weeks before the Fair opened, the consensusafterward was that the allocation had generally been equitable.Furthermore, the fact that the shuttle terminal closed on September
4, with operations transferred to the tour bus terminal, provedthat allocating more space overall to shuttle operations would not
have been justified.
One drawback to the market sector arrangement for shuttle servicewas the ability of shuttle operators to terminate service abruptlywithout warning. KIEE management had no effective way to preventan unscrupulous operator from providing service. Only the City of
Knoxville and State Public Service Commission had this ability.
In some cases visitors who had pre-purchased shuttle bus ticketsas part of a lodging package were left without transportation to
the Fair. In one instance, a shuttle operator cancelled some but
not all of his routes and refused to honor requests for refunds of
prepaid transportation. KIEE management responded by barring the
operator from the shuttle terminal, but he continued to operateservice to a downtown, on-street bus stop. Management of future
special events might consider requiring that operators post a cash
bond to guarantee service if they are pre-selling tickets.
However, this provision is difficult to enforce and may have the
effect of making the special event management liable for defaults
by the carrier.
Another key in the oversupply of shuttle service was the timing in
the granting of licenses by the Public Service Commission. Due to
weather constraints discussed in the Phase I report, the hearingswere held late. By the time the licenses were granted, no one had
sufficient time to evaluate the service that was being provided.If the hearings had been held earlier, the prospective operatorswould have had a better understanding of what the service levelswould be. Given the time to assimilate the information, there mayhave been an opportunity to coordinate the services being offeredand bring the supply into line with the demand.
It is also important in the future that the licensing of the shuttlecarriers occur so that the prospective operators have sufficienttime to gather the necessary information to provide the servicewithout oversupplying. This is particularly important if theregulatory agency controlling the licensing is not going to
regulate the number of operators that will be issued permits.
For future special events of this type it is important for the
demand for shuttle service to be defined. From the serviceprovided by one of the operators in Knoxville, it is seen that the
actual demand for the shuttle service correspond to two passengersper 100 hotel beds. This differs substantially from the one
passenger per lodging unit used in the projections by the
operators.
The small on-street terminal operated well, although it was nevertested to the design capacity because of the underutilization of
the remote parking lots. Flowever, it could not have accommodatedthe lodging shuttles or tour buses.
The distribution of the terminals among three different gatesundoubtedly helped minimize the traffic congestion near the Fairsite on busy days. The merging of the shuttle and tour bus
terminals near the end of the Fair helped to reduce operatingcosts. When the terminals were merged, the tour bus volumes wereat or below average day volumes. The shuttle bus volumes at thetime of the merger were also low with only 12 to 15 of the originaloperators still in existance.
The procedure of sizing the terminal to the anticipated passengerflow, rather than to the anticipated bus volumes, also turned outto be appropriate, given the excess supply at the start of the
Fair.
In both the shuttle and tour bus terminal experience, it is
possible to conjecture that initial space requirements, aresignificantly greater than space requirements once everyone has
become familiar with the facility.
144

Chapter Eight:
TOUR BUS SERVICE
The Phase I report outlined the operations and facilitiesprovided at the 1982 World's Fair to accommodate charter and tourbus operations. The intent of this chapter is not to restate theinformation contained in that report, but rather to document theresulting operations, trends, and provide some guidelines forplanning for tour and charter buses at future events.
One of KIEE's objectives in providing transportation facilitieswas to facilitate the arrival of the desired number of visitorsarriving in shuttle and tour buses. To accomplish this, KIEE hada strong market thrust to tour and charter organizations, includ-ing a group ticket sale discount program. The marketing effortwas successful and the 1982 World's Fair had a larger than expectedtour bus volume.
The pre-Fair estimates indicated that, because of this majormarking thrust, approximately 15 percent of the Fair visitorswould travel in tour groups. Approximately 500 buses wereanticipated on peak days, 300 on a design day, and 225 on averagedays. Actual bus volumes exceeded the projections, with over 700
buses accommodated on the peak day, approximately 425 buses
accommodated on the 90th percentile (design) day, and over 275
buses on an average day.
Figure 8-A illustrates the cumulative tour bus volumes for the
Fair. As seen in the figure, the top 10 days are fairly similar.
Over 600 buses arrived on these top 10 days and substantiallyless arrived on other days. The 600 buses correspond to the 95th
percentile day. The 90th percentile day accommodated 415 buses
and was 150 percent of the average day. The 80th percentile day
accommodated approximately 360 buses and was 130 percent of an
average day. An average day of 275 buses was the 63rd percentileday.
TOUR BUS TRENDS AND PATTERNS
Monthly Trends
There was significant seasonal variation in tour bus volumes
throughout the course of the Fair. Bus volumes were very high in
May and June, with over 12,000 buses using the terminal in May
and almost 11,000 buses in June. The volume dropped sharplyduring the summer, with 7,600 and 5,800 buses using the terminal
145
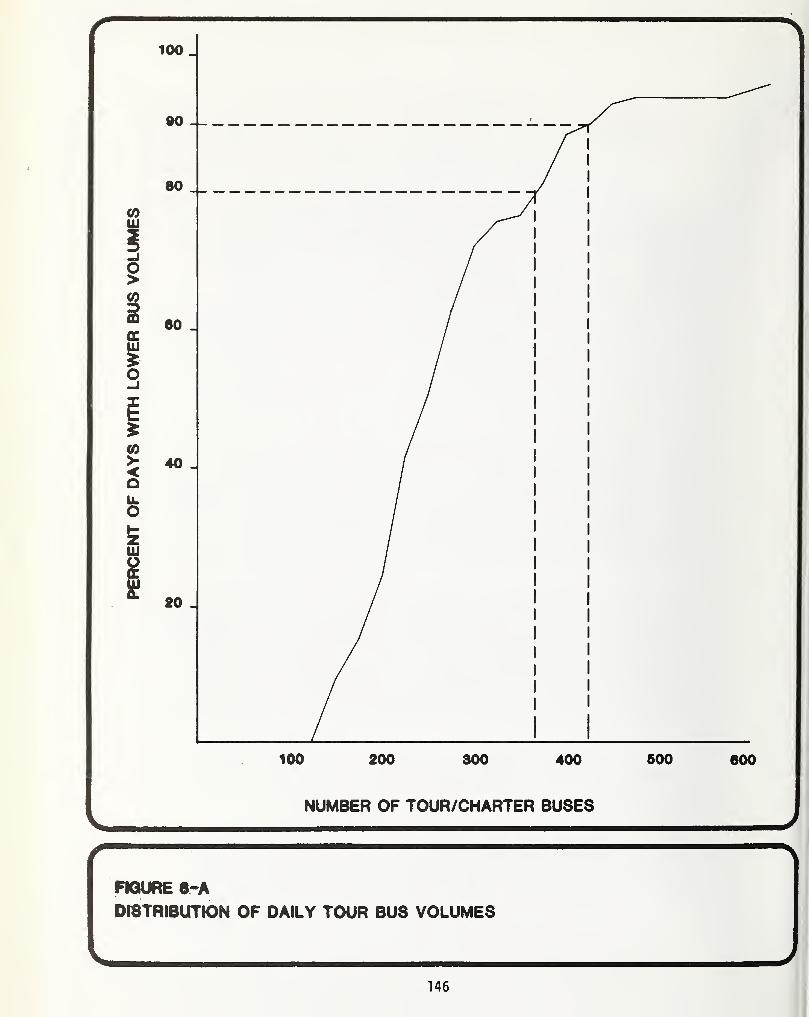
146
in July and August, respectively. Volumes picked up slightly in
September, with over 6,800 buses using the terminal. Data forbus volumes in October was incomplete; however, from October 1stto October 20th, 4,176 buses used the terminal. It is estimatedbetween 90 and 120 buses used the terminal daily during theremainder of the month.
The bus volumes as a percentage of total Fair attendance shown in
Figure 3-B illustrates these trends. It should be noted thatthese trends reflect the percentage of Fair patrons arriving bycharter and/or tour bus, not the actual number of tour buses.
Daily Variations
There was also a marked variation in tour bus volumes by day ofweek. (See Figure 8-B) During the spring season (May and June),the Friday and Saturday tour bus volumes were 71 to 110 percenthigher than the weekday volumes. During the summer (July andAugust), the Saturday volumes were still about 60 to 80 percenthigher than weekday volumes, although weekday volumes were morestable during this period. During the fall (September andOctober), the trend reversed itself, with Wednesdays being the
peak bus days and Fridays and Saturdays being average days.
Throughout the course of the Fair, the highest tour bus volumesoccurred on Fridays and Saturdays and the lowest volumes on
Sundays and Mondays.
Tour Scheduling in the South
Discussions with several of the major tour operators and carriers
indicated that the seasonal and day-of-week patterns experiencedin Knoxville were reflective of what was anticipated by the tour
industry. Most tours were scheduled to arrive in Knoxville for
the weekend; thus, the high bus volumes on Fridays and Saturdays.
The seasonal trend of more tours in the spring and fall withlower volumes in the summer is typical of tour operations in the
South. The general concensus is that major special events in the
South could expect the same seasonal and day-of-week trends seen
in Knoxville.
Another point raised by the tour operators was the effect that
publicity had on Fair tour groups. During May and June, the
publicity about room reservations being unavailable in Knoxvillemade tours more desirable. The negative publicity received at
the beginning of the Fair may have deterred people, although the
extent of any such impacts are unquantifiable.
147
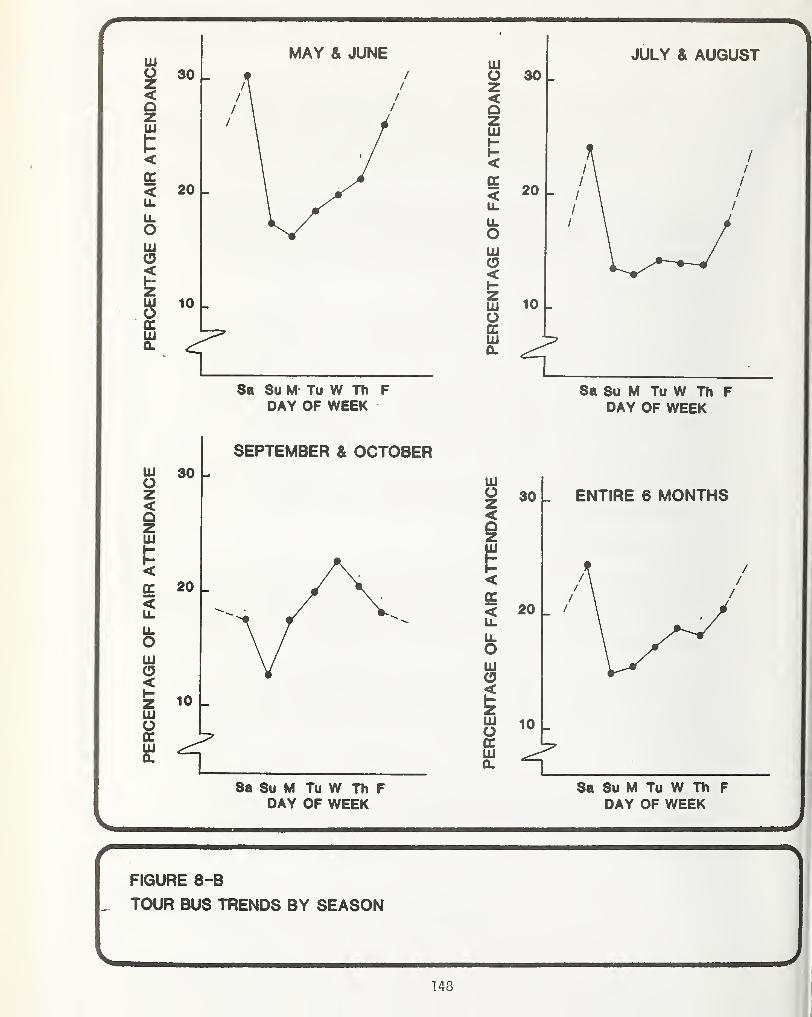
r
DAY OF WEEK DAY OF WEEK
DAY OF WEEK DAY OF WEEKV /r >
FIGURE 8-B
. TOUR BUS TRENDS BY SEASON
148
Hourly Trends
Arrival patterns, as discussed in the Phase 1 report, were basedon the 10:00 A.M. opening time. Early in the Fair, departureswere scheduled around the 10:00 P.M. fireworks display time. Asthe Fair progressed, some tour operators changed their schedulesto accommodate their patron's desires . Thus, arrival anddeparture patterns varried with many arrivals before 10:00 A.M.and many departures after 10:00 P.M.
The buses traveled in mixed traffic which resulted in long queues.On the heaviest bus volume days, arriving buses would queue fromthe terminal entrance up to one mile or more. For future events,if possible, it would be advisable to separate charter bus trafficfrom regular automobile traffic due to the bus queues.
MODE SPLIT
An analysis of the percentage of Fair patrons arriving by charterbus indicated that there was little or no correlation between bus
volumes and daily attendance. Mode split varied from a low of
approximately 9 percent on a Sunday in October to a high of 36
percent on a Saturday in June. Table 8-1 lists the percent ofFair visitors arriving by charter bus. The overall average for
the entire Fair was 18 percent. As is seen in the table, the
percentage of charter bus patrons decreased throughout the courseof the Fair, as did the actual number of buses.
Due to the variable relationship between daily attendance and
tour bus volumes, it is difficult to use overall mode split as a
predictor of design day bus volumes. The average day attendancein Knoxville was approximately 60,550, with an average bus volumeof 275 buses. The mode split was 18 percent (assuming 40 passengers
per bus) or 4.55 buses per 1,000 attendance. Using only the
Knoxville experience as a predictor, and assuming the inten-
sity of the tour marketing thrust used in Knoxville, future
special events could expect approximately the same bus volumes.
With the 90th percentile (design day) being 150 percent of an
average day, the design day bus volume mode split would be 27
percent of average day attendance, or about 6.8 buses per 1,000
average day attendance.
149

TABLE
8-1:
TOUR
BUS
MODE
SPLIT
VARIATIONS
150
OPERATIONS
As discussed in Phase I, the terminal operated efficiently.Discussions with major carriers after the Fair indicated thatthey were pleased with the terminal operations and theirpassengers were pleased with the proximity of the terminal to
the gates. Overall, the operations were better than had beenoriginally anticipated. The Phase I report describes theoperation in some detail.
Platforms
As discussed in the Phase I report, the platforms were fenced to
prevent passengers from crossing between platforms. Breaks in
the fencing were provided to allow KIEE staff to move betweenplatforms; however, passengers also used these breaks to traversethe terminal. Traffic and crowd control staff were necessaryduring peak periods to keep pedestrians in the marked crosswalksand out of the bus lanes. While physically possible, it was
economically infeasible and impractical in a temporary terminalto grade-separate bus and pedestrian movements in the terminal.Crowd control personnel generally resolved the problems.
Information
One problem noted during the course of the Fair was the qualityof information to tour bus passengers inside the Fair. The Fairinformation staff were not well informed as to the differencesbetween the various bus terminals. Occasionally, passengers weresent to the wrong gate, which was approximately one mile from
their intended gate. This could have been alleviated by havingthe on-site Fair staff better informed.
Advance Reservation System
With the exception of Greyhound and Trailways, all buses weredispatched by KIEE. All groups used a first-come, first-servedarrival system and a reservation departure system. Trailways and
Greyhound assigned departure slots as each group arrived.
KIEE had an advance reservation system for departures. Buses
that arrived without advance departure reservations were
accommodated where possible. Table 8-2 lists the percentage of
departure reservations that were used, the actual volume as a
percent of reservations, the percentage of the actual volume with
reservations, and the percentage of the actual volume that arrived
without reservations . Data from a typical week for each month
were used.
151

As shown in the table, less than 50 percent of the advancereservations were claimed. The resulting no-show average of
slightly over 50 percent may be somewhat overstated due to
misidentification of buses either in the terminal or on the
advance reservation log sheets. Another reason why the no-showreservations are high is that, despite initial warnings to
carriers, consistent no-shows were never purged from the reserva-tion logs. On the average, only 42 percent (ranging from 34 to
60 percent) of the buses actually handled in the terminal arrivedwith advance reservations.
One purpose of the advance reservation system was to preventbuses from crowding the terminal at the 10:00 P.M. closing hour.
The reboarding check element of this system enabled KIEE staff to
assist lost passengers in locating their buses. It also helpedto control pedestrian flows in the terminal since passengers knewwhere and when the bus would be in the terminal. Another reasonfor the advance reservation system was to assure tour groups of a
specific departure time. This was important if the tour had
other plans after leaving the Fair.
TABLE 8-2: ADVANCE RESERVATION PERFORMANCE
Month
PercentReservationsUsed
ActualVolume asPercent ofReservations
Pop-ups^
)
as Percentof Actual
ClaimedReservationsas Percentof Actual
May 52% 89% 41% 59%
June^) -- --- -- —
July 46 118 61 39
August 42 118 64 36
September 39 114 66 34
Fair Sample 46 108 58 42
^Pop-ups refer to buses arriving without an advance reservation.
( 2 )Data for June reservations was not available.
152
On many days it appeared that departure time slots were full whenin reality they were not due to a high percentage of no-shows.Except on the peak bus days (Saturdays in May and June), KIEEstaff was able to give a departure slot to every "pop-up" withina half hour of their desired departure time despite the slotsbeing shown as "filled" by no-shows. Upon arrival, it tookslightly longer to process a bus without a departure reservationthan a bus with a reservation.
For future special events, there is a trade-off between the costsof the labor-intensive advance reservation system and the longerbus processing times upon arrival. The substantial number of"pop-ups" that occurred in Knoxville and were processed should be
taken into account when assessing this trade-off.
If an advance reservation system is used at future events, it is
recommended that future reservations for consistent no-showcarriers be cancelled and the carrier informed. This will permitmore efficient allocation of departure reservations. If no
advance reservations are used, the longer processing time per bus
will require more terminal staff and affect terminal capacity;however, it would eliminate the office reservation staff. It
should be noted that the pre-arrival guarantee of departure time
alleviated some of the carriers concerns about terminal operations.
Yet, Greyhound and Trailways operated out of the same terminal in
Knoxville without advance reservations and felt their operationworked well. In any case, some sort of departure reservationsystem is strongly recommended if a terminal is to be used to
handle tour buses at future special events.
The windshield cards issued upon arrival indicated the passengerreboarding check number, departure platform, and departure time.
These cards were 8h x 11 on white cardboard. The cards allowedthe buses to enter the terminal for their evening departure. The
cards were difficult to see at night, particularly through the
tinted windshields on the newer buses. For future events, it is
recommended that bus identification be larger to be more visible
to terminal staff.
BUS PARKING FACILITIES
The remote bus parking facilities provided by the Fair were not
heavily utilized. This was partially due to the poor accessibility
of the selected sites and the provision of bus parking and servicing
facilities by private entrepreneurs closer to the bus terminal and
Fair gates. Trailways and Greyhound provided facilities for
their own fleets.
153
The facilities for bus parking provided by KIEE were remotebecause of the lack of available land close to the site. Duringthe last months prior to the opening of the Fair, it appearedthat no private entrepreneur would provide bus parking. There-fore, KIEE contracted with a local firm to provide the parking in
return for being described as the "Designated World's Fair bus
parking-servicing facility" in information sent to carriers by
KIEE.
In addition to the "designated" remote bus lot, one of the northparking lots was made available for tour bus parking in mid-Maybecause it was underutilized during the first weeks of the Fair.
Approximately 30 to 90 buses used this lot daily during the
months of May and June. Discussions with tour operators who usedthis parking indicated that it would have been more desirable if
sanitary dumping and servicing facilities were available.
As discussed in the Phase I report, once the drivers becamefamiliar with the area, they secured their own parking locationand the private sector was capable of providing adequate bus
parking without stimulus from the Fair. Where parking is to be
provided for tour buses at future special events, sanitarydumping facilities should be provided. Minor servicing facilitieswould be desirable. One entrepreneur even provided bus fuelingand sanitary dumping service from trucks based on a parking lot
located four blocks from the North Gate.
Alternate Facilities Concepts
The policy decision was made by KIEE to encourage tour groups to
attend the Fair and to provide facilities for tour buses adjacentto the North Gate. The two major types of facilities evaluatedwere: (1) a bus terminal at the gate with remote bus parking (as
provided) and (2) a bus terminal/parking area as close to the
gate as possible. In Knoxville, the terminal with remote parkingconcept was selected principally because of lack of availableland adjacent to the North Gate to provide a terminal/parkingfacility. Because of the KIEE policy decision to provideofficial automobile parking at the North Gate, sufficient landwas not available to also provide bus parking. For futurespecial events, trade-offs need to be made between providing bus
parking or car parking adjacent to the gate. The followingdescribes guidelines that can be used in evaluating the trade-offs.
Two concepts of bus parking were considered. The first had busesplatooned for departure, thus necessitating only an absoluteminimum distance between buses. The second concept allowed forindividual buses to pull out of bus bays. These concepts are
154

illustrated in Figure 8-C. The area required to park the busesis 760 square feet per bus for the platooned concept ahd 1,350square feet per bus for the independent pull-out concept. Forthe design day in Knoxville (425 buses) land areas of 7.4 to 13.2acres would have been needed. If the equivalent land areas wereused for automobile parking, they would accommodate 1,000 to
1 ,800 vehicles.
Another aspect that needs to be considered is the number of Fairvisitors who would be served by the facility. As a bus terminal,the area would serve approximately 17,000 patrons. As a parkinglot, the area would serve 3,700 to 6,600 persons, or 22 to 39percent as many as with buses. The associated parking revenueswould also need to be compared. Bus revenues (at $10 per bus)would yield $4,250 per day with the lot full, while auto revenueswould yield $6,000 to $10,800 per day with the lot full. If
the area was used as bus parking, the pavement would need to be
heavier, thus substantially increasing construction costs overvehicle parking. It should be noted that the terminal used in
Knoxville occupied approximately two and one-half acres of land,or less than one-third of the minimum amount of space that wouldhave been required for the parking facility.
Caution should be used in assuming the absolute minimum design.Buses for each departure time would be required to park in theirown line, as no bus could move without the bus in front moving.Given the variability of the distribution of departure times, the
efficiency of the lot would not be 100 percent as had been
assumed in the previous calculations. Also, bus breakdowns,while not prevalent in Knoxville, could cause significant delaysin the lot. This layout also precludes a tour from changing the
desired departure time after arriving at the Fair. The terminal/parking concept providing more space between buses is the morepractical and preferred concept.
In sizing the bus terminal, there may have to be more than one
line for each departure time given the variation in distributionof desired departure times. The parcel also will have to be
approximately rectangular in shape to accommodate the buses,
preferably long and relatively narrow. Odd-shape parcels would
probably be relatively inefficient for use as a bus parking area.
In sizing the parking/terminal facility, the fact that all buses
may not need to remain parked at the Fair for the day also needs
to be considered. This was evidenced in Knoxville by the number
of charter buses parked at area hotels during the middle of the
day. Parking was needed for no more than 50 percent of the
arriving buses (this does not include Greyhound and Trailways who
provided their own facilities).
155
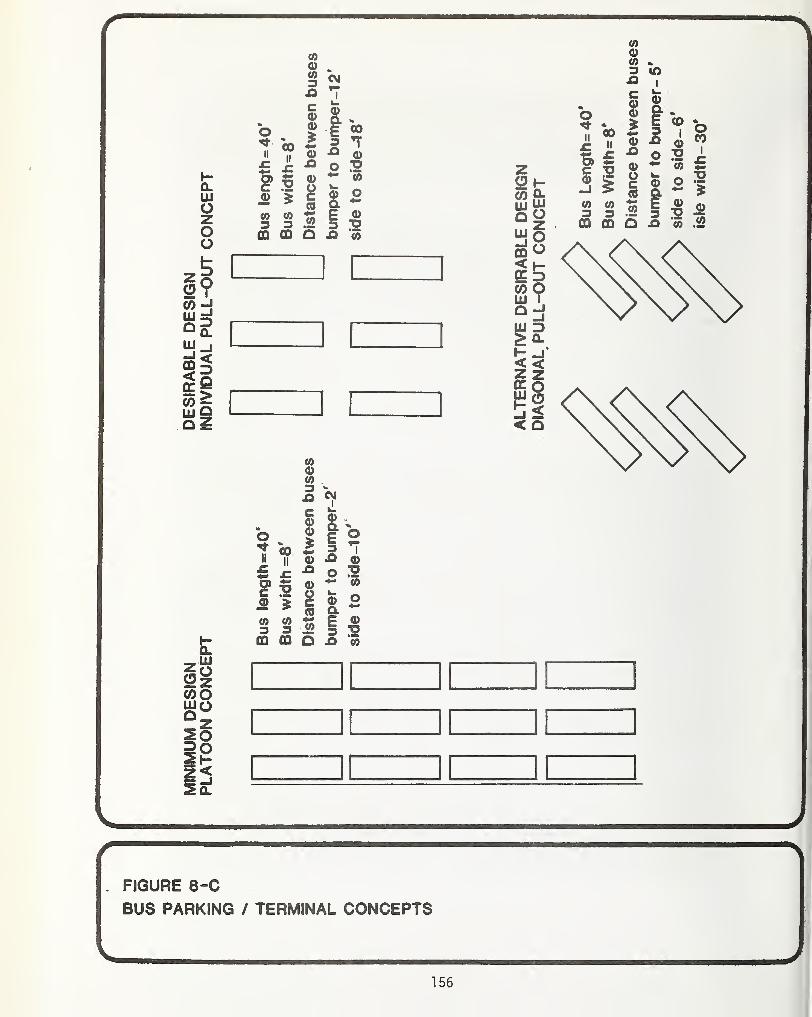
/
——
"
—
—. FIGURE 8"C
BUS PARKING / TERMINAL CONCEPTS
156

If the bus parking/terminal concept is to be used, provisionsneed to be made for accommodating buses that need to unload neara gate but not park on-site. Also provisions are needed foroverflow situations when buses arrive in excess of the capacityof the parking facility. For buses not parking at the Fair, a
terminal facility similar to that provided in Knoxville should becreated, although on a much smaller scale.
Another factor in sizing the bus parking facility is the unrelia-bility of bus projections. The industry and the Fair's transpor-tation consultant projected peak bus days of 500 and a design busday of 300. Actual bus volumes in Knoxville were 650 to 700buses on peak days, with a design bus day of 425. On 50 days in
Knoxville, the bus volumes exceeded 300. The ability to projectbus volumes for future special events is limited to the Knoxvilleexperience. It is also very sensitive to the Fair's marketingefforts to tour operators, and the tour operators' acceptance ofthe Fair as an attraction.
CONCLUSIONS
Overall, the tour bus operations were a highly successful componentof the transportation system provided for the Fair. With an
aggressive marketing campaign undertaken by KIEE, the volume of
tour groups exceeded original projections. The terminal conceptused allowed the operations to be flexible and to accommodate the
increased volume. The provision of the terminal adjacent to the
gate enhanced its desirability.
In projecting bus volumes for future special events, the Knoxvilleexperience indicated design day bus volumes of 6.8 buses per
1,000 average day attendance. This volume was achieved by an
aggressive tour marketing program sponsored by the Fair resultingin 18 percent of total attendance arriving by tour bus (not to be
confused with total persons with group tickets admitted). Tourbus trends of high volumes on Friday and Saturday and lowervolumes during the week can also be expected. The staffing of
the bus facilities should take this into account. According to
major carriers, the seasonal variation of high volumes in the
spring and fall and lower volumes in the summer could also be
expected at special events in the South.
Some type of off-street bus terminal and/or parking facilityneeds to be provided to accommodate the large number of buses.
The evaluation of the type of facility is a trade-off between the
use of available land. If a terminal concept is used, it is
recommended that a departure reservation system be used. Thetrade-off evaluation of an advance reservation system versusa system of reservation upon arrival will need to be made.
157
Chapter Nine:
LOCAL TRANSIT
K-TRANS is Knoxville's urban mass transit system. All equipment,buildings, facilities, etc. are owned by the City of Knoxvilleand it is legally restricted to serving Knoxville and Knox County.
The 1982 World's Fair was keenly anticipated by K-TRANS manage-ment, employees, and its governing board, the Knoxville Transpor-tation Authority. Management viewed the Fair as an opportunity to
introduce long desired changes. Employees saw a choice of betterruns and hours along with the potential for lucrative overtimework. The City of Knoxville and the Knoxville TransportationAuthority saw the potential of providing additional service atwhat was hoped to be relatively minimal public expense.’
K-TRANS significantly increased service for the 1982 World's Fair.
Additional hours of service were provided on every regular route.Service frequency was increased on several routes. Certain minorroute revisions were also made before or during the Fair.
This chapter focuses on two major areas. One area is changes in
K-TRANS prior to the opening of the Fair as well as changes duringthe Fair itself. The other area is the impact of the Fair on
K-TRANS before, during, and after the Fair.
SITUATION PRECEDING THE FAIR
Proposals by K-TRANS for special Fair associated service wereperceived as discriminatory by local citizens in light of the fare
increase and service reductions authorized by the KnoxvilleTransportation Authority. In a public hearing, critics accusedK-TRANS of trying to reduce service to residents while planningto offer special transportation services to out of town visitorsduring the Fair. They believed that resources were actuallyavailable to maintain existing service levels, but that the moneywas instead being used to pay for Fair-associated service.
The Knoxville Transportation Authority expressed a policy for K-
TRANS operations during the Fair. The policy:
* Directed K-TRANS to spend no money out of its regularbudget for operations of World's Fair associatedservice.
* K-TRANS must at least break even on all World's Fair
associated service and preferably turn a profit.
159

* Profits from operations of World's Fair associatedservices would be used exclusively to support the
K-TRANS regular route system.
The policy was primarily directed toward special World's Fairservices such as park & ride shuttles, hotel/motel/campgroundshuttles, and similar operations which were dedicated to exclusiveuse by the World's Fair visitors. However, the policy was muchmore loosely interpreted by both K-TRANS and the Knoxville Trans-portation Authority when it came to expansion of the K-TRANSregular route system.
Another concern which was frequently expressed at KnoxvilleTransportation Authority meetings was that K-TRANS would likelyassign its newer and more desirable buses to World's Fair shuttlesand use older equipment on regular routes. Although some buseswere assigned to World's Fair shuttles, most of the better equip-ment was placed on regular routes. This was done for fourreasons:
1) Newer and more reliable buses could be assigned to
routes with more demanding service. Most regularroutes had runs with a greater number of hours ofservice per day while Fair routes had fewer hoursand came relatively close to the K-TRANS maintenancefacility. In the event of a road failure, the shopcould respond more quickly.
2) Frequent passengers rode the regular route buses whileFair passengers used the service only occasionally.K-TRANS considered better equipment to be importantin passenger satisfaction and an aid in retainingriders after the Fair.
3) Assignment of the best equipment to regular routescould reinforce local perceptions that K-TRANS wasa responsive municipal service.
4) Compliance with federally mandated Title VI regulationswas achieved which prohibit discrimination in assign-ment of equipment.
REVIEW OF K-TRANS SERVICES
K-TRANS provided both conventional transit service and specialFair associated service. It was well suited to offer theseservices during the Fair because it was an established localoperator, had an existing fleet of buses, a maintenance facility,and a two-way radio system.
loU
One important factor in providing service was the ability totransfer both people and resources from one type of service to
another. For example, a bus and driver which ran an express tripin the morning peak could become a park and ride shuttle when Fairvisitors began to arrive.
EXPANDED ROUTE SERVICE
K-TRANS made a variety of service improvements. This includedadditional hours of service on all routes, service adjustments androute revisions, and more frequent service on certain routes. Dueto the location of the Fair site, most K-TRANS routes served atleast one gate of the World's Fair and all but one route operatedwithin one block of the Fair. That remaining route primarilyserved residential areas and operated within three blocks of theFair's East gate.
Route Descriptions
K-TRANS' regular routes provide coverage throughout the City ofKnoxville, serving all major residential areas with the exceptionof northwest Knoxville and most commercial and employment areas in
the city. Table 9-1 lists the routes and gives a brief descrip-tion of major transit origins and destinations and general demo-graphic characteristics of riders.
Route Revisions
There were several route changes before and during the 1982
World's Fair. Route #4 Kingston Pike was split so that tripswhich operated via Sutherland Avenue were redesignated as #10
Sutherland Avenue. The remaining portion of #4 Kingston Pike wasextended from the West Hills subdivision to Downtown West shoppingcenter. This expansion provided additional service to the Fairsite and to downtown Knoxville from a large parking lot at Down-town West shopping center.
The closing of the Clinch Avenue viaduct necessitated the reroutingof the UT and Fort Sanders Hospitals line to run along CumberlandAvenue to 16th Street, then to return to Clinch Avenue fartherwest. Before the opening of the Fair, Routes #3 Westhaven, #7
College Street, and #10 Sutherland Avenue had been rerouted awayfrom Summit Hill/Western Avenue to avoid heavy construction on
Interstate 40 and concurrent improvements on nearby major arterial s.
These routes continued to be detoured away from Summit Hill/WesternAvenue after the opening of the Fair to avoid expected heavytraffic at the Fair site. Figures 9-A through 9-D show route
modifications made prior to the opening of the Fair.
161
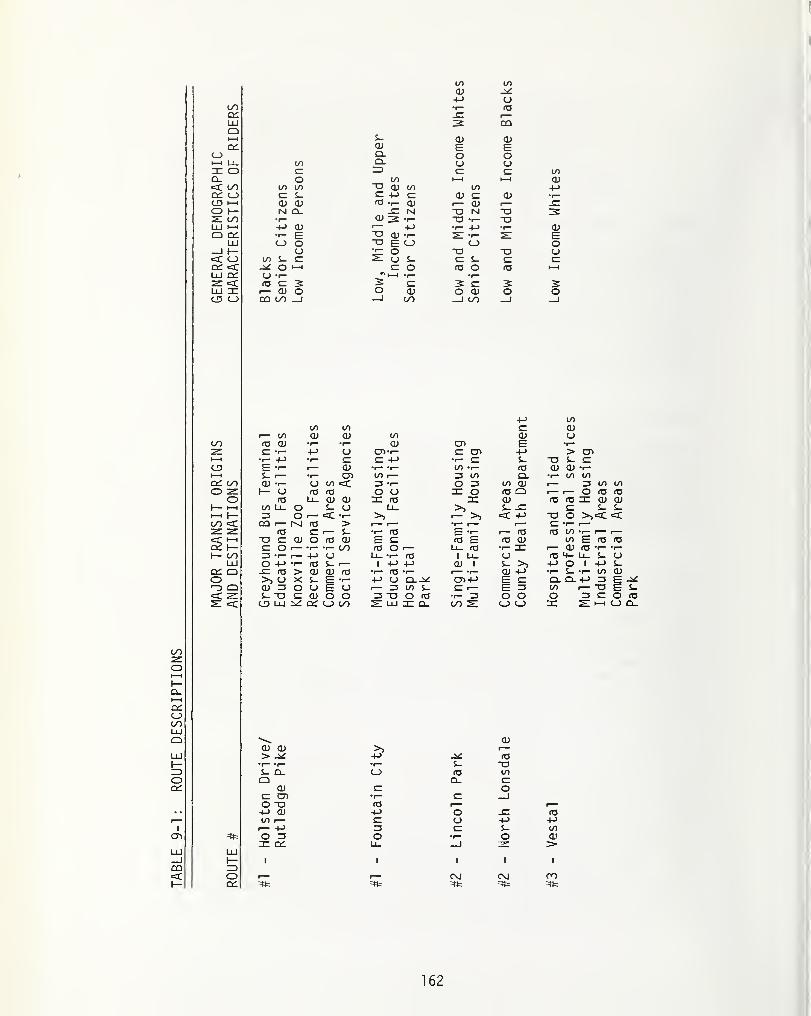
TABLE
9-1:
ROUTE
DESCRIPTIONS
oo OO(U+-> cd
OO • 1— fd
cc -E i
—
LlJ 3 CDQI—
i
s_ O) aicc CD E Eo CL o o
i—i Li- OO CL CD cdre o e ro e e OOQ- o OO 1
—1 t—
1
ai<C oo to oo 0(1)1/) oo +->
CC <_) e s_ £= 4-> E aj e a> •i
—
CD i—
i
CD CL) <d -r- a) r— O) i
—
-EO 1— Nl Ci_ -E N •o N a 32: oo •i— O) 3 -r- -a •!- -aLU l—
l
4-> CD 1— +-> •r- 4-3 •i
—
<DQ CC •i— E "O (X) -i— 2 s: ELU CD o o E CD o O—11— CD •r: o -a •o a
<c o OO S_ E ^ CD E e E e eCC -X O 1—
1
E O ca o <d >—i
lu or CD -r- "i—i *r- •i—3 <XL rd E 3 s e 3 c 3 3lu re r— CD o O QJ o aj o oCD CD CD OO —1 oo —1 oo _i _i
+-> OOoo OO e CD
1— oo 0) CD to CD CDOO fd O) •i
—
i— CD 03 E •r—3 e •>- +-> CD OVr- E 03 +J > 03
i—
i
•i- 4-> • i
—
E E +-> •1- O E "D E c
CD E T- r— CD •i— • i
—
OO -r- fd CL) CD -r-i—
i
E r— •i
—
CD to i
—
O OO CL •r— OO OOCC oo ai -r- CD OO c Z3 •!— O O OO CD r— 0 COo 3 h- cd fd fd o o 3 O fd CD 1
—1— 0 fdo fd u_ CD ai 3 fd 3 CD 03 fd 3 CD
(— 1—
1
OO Ljl_ O e cd Li_ >3 E 3 C S-i—
i
1— o O
—
<C •i— >3 <— >3 <c +-> -a 0 >,ecoo c CD .
—
1—
1
fd > 1— c •1— 1
—
3 3 fd e p— e •i— rd E "f— p— rd <TJ 00 •!— 1
cC i—i -o E a) o fd CD E e fd E fd CD 00 E fdCC h— e o i
—
•r— •i
—
OO rd O r— Li— rd •r— 3 1— CD fd t-
\— OO o •<-i
—
4-> CD Lc 03 1 Li_ CD fd 4- u_ eLU o +-> • i
—
fd E 1 1 4-> CD 1 E >3 4-> 0 1 +->
CC o -E fd > a) cd rd •i- fd •r— 1—- • 1— CD 4-> •
1— i- -r- tOo CD X e E •i
— +-> cd CL-X CD 4-> E E Cl Cl -t-> 0“D Q CD =J o CD E CD i— 13 OO E E 1
— E O 00 r— TO<c 3 E "O e CD o O 13 -O O rd •
1- O O O O O C=C CD LU CC CD OO 2Z LU 3 D- OO 21 0 CD 3 SI >-H
oCC
\ CDCD CD >3 1
—
> -X +J CC fd• 1— • 1
—
• 1— s- -0C. CL O fd toQ o_ E
CD C O0 cm • 1
—
cr _]0 3) fd r— 1
—
+-> CD +J 0 -E rdOO 1
—
c: CD +-> 4-3
r- 4-> 0 E E 00
O Z3 0 •1
—
O CD3 CC
I
U_ 1
I
>1
J. C\J
1
C\J CO=)fe =tfc
162
Commercial
Areas
Park
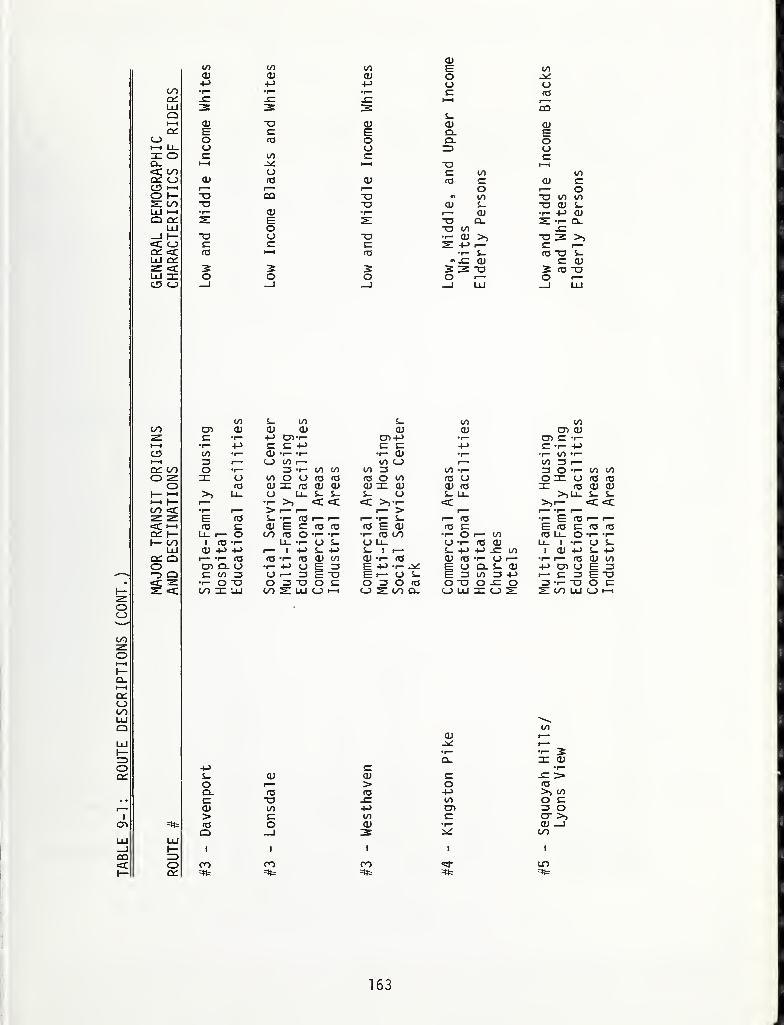
MAJOR
TRANSIT
ORIGINS
GENERAL
DEMOGRAPHIC
ROUTE
#
AND
DESTINATIONS
CHARACTERISTICS
OF
RIDERS
CDCO co co E coCD CD CD o jo4-> 4-> +-> o O•r- •r— •f— e ca3 3 3 »—13 3 3
eCQ
a) x) CD CD CDE e E Q. EO co o Cl ocj o ZD oe co e e1—
1
1—
1
-o 1—
i
cj E CO coCD ca CD CO E CD Er— r— r— O 1— o-a CO XJ « co "0(0(0-a -O CD E DOS.•r- CD •1— i— CD •I- +-> CD
E -O Cl. S T- Q_o "O co -Eo cj •o •r— CD XJ 3 >>
e e e s: -t-> e i—
ca i—i CO •r- e CO XJ E*3 CD E CD2 2 2 2 3-0 2 ca XJo O O O i— o_l _l _l _l LU _1 LU
co E CO E co COco CD CD CD CD CD CO CDe •r— -t-> OVr- 0>4-> •f— DIE 'r
•1— +-> E E 4-> E E 4-> E t— +JlO •1— CD -1— !— •r- CD •i
—
•i— CO •(—
3 1— O CO 1
—
co c_> i
—
(O 3 i—o •1
—
O -r- CO CO CO 3 to -r— 3 O •<- CO CO3 CJ CO O O CO (O co O CO CO U O 3 a ca caCO CD 3 CO CD CD CD 3 CD CD CO 3 ro a> cd
>> Lo- CJ Ll. E E E CJ E U_ >,Ll- E E•i— >> <C <C <C >v* <C >><— c c
•r— r- > 1— > i r— t— r—E ca E T- COi—r— r— •!— E i— co •r E CO 1— 1
—(O e CD E E CO CO co E a> CO E E CO E ra caU_ 1
—
o CO) CO O *r— •>— •r— CO CO) •r- O <— CO (O Ll- O •r— *r—
1 CO •f— Ll_ m- CJ E CJ U_ a -r- ca cd U_ 1 •(- CJ ECD +j +-> r— | 4J E +J E 1 i— E 4-> 4-> -E CO 1 CD 4-> E +->
r— *1— CO co *1— CO CD CO CD *i- cO CDcO-r-CJi— •i— i— CO CD CO
di a u •r- 4J O E D E +->•!- E O CL E <D -(-> CO CJ E 3E CO 3 CJ r— 3 £ XJ E r- CJ E E 3 CO 3 -t-> 1— E 3 E XJ•r- o x> o o -a o e O 3 O CO O X) O 3 o 3 XJ O ELO 3 LU CO) s: LU CJ 1—1 c_> ^ CO) o_ CJ LU 3 o s: 2! CO) LU CJ 1—(
CD r—r-
•t— •r- 2Cl 3 CD
+-> E r—E CD CD E 3 >O r— > O CO
CL CO CO 4-> >, CO
E -a 3 CO O ECD co -E> CO 3 O> E co E cr >,CO O CD •r— CD —IO _l 3
1
CO)
1
CO
1
CO
1
CO
1 1
LT)
=tt=
163
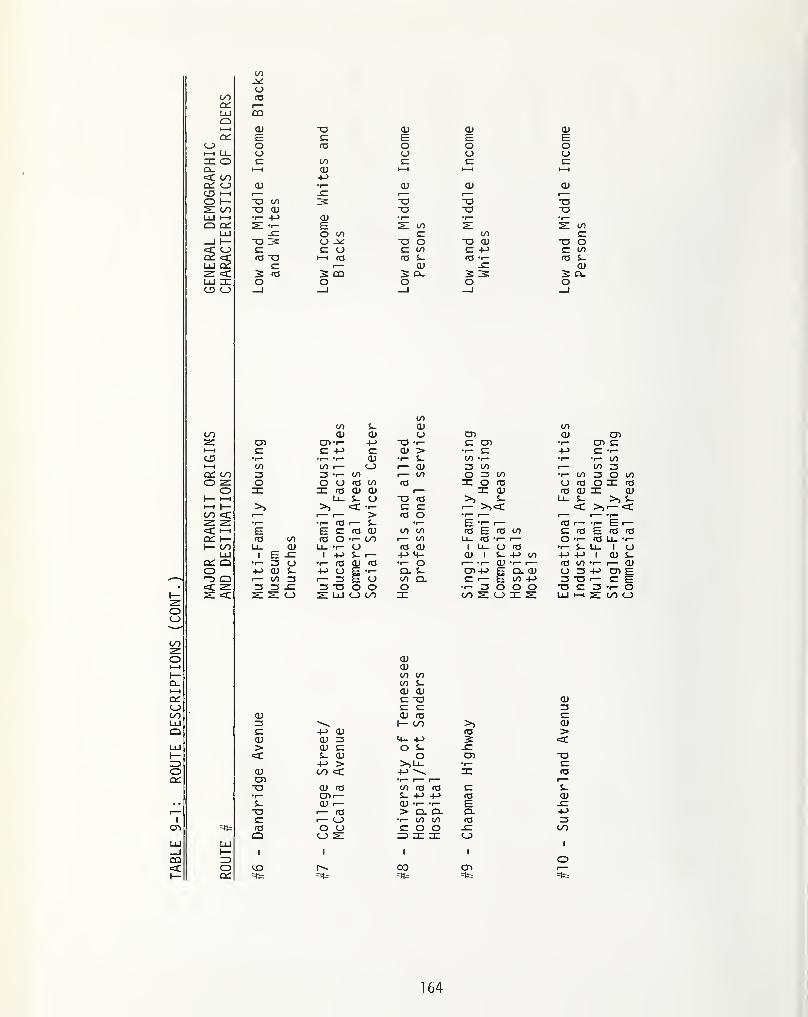
TABLE
9-1:
ROUTE
DESCRIPTIONS
(CONT.)
COccu
OO <0CC 1
—
UJ CQQi—
i
a> 73 CD CD CDcc E c E E E
c_> o CO O o o1—
1
u_ o o c_> cjzn o c CO cz c cQ- 1—
1
cu 1—
1
1—
1
1—
1
C OO +->
cc c_J cd •r— CD CD CDCD i—
i
i—
-
_C i
—
i
—
1
—
O 1— -a co 3: -a 73 -O2: oo -a aj -o -a -a1 1 1
1
—i •r- +J a) •i
—
•i— • 1—
o cc S -r- E 2: c/i 2: 21 COUJ .C O CO cz CO cz—1 1
—
-u rs U -JC -D O -a cd 73 oc cj c c u CZ CO CZ 4J c cocc <C CO 73 i
—i CO CO i- 75 -I— to c
UJ cc c i
—
CD cz CD2: c 2 73 2 CD 2 Cc 2 3 2 CcUJ Zn O O O o oCD CJ _J _l _l _i
CO ECOaj CO
OO CD CD cj CD CDSZ OO CTI-r- 4-> TO • 1
—
CZ CO •i
—
C3>1—
1
c CZ +-> c a> > •r- CZ +-> CZCD 1
—
•i— *i
—
CD •i
—
E CO *i
—
•i
—
* 1
—
i—
i
co 00 1
—
O i— CD 3 CO i
—
coCC OO 3 3 •(— CO i
—
CO O 3 CO •i
—
CO 3o o O CJ <73 CO <c zn o co CJ C73 oo zn ZC 73 CD CD r— zn cd CO a) zn1— c 1 Lu S- CJ to <C >> e Lu Et-H \— >> >7 <c •i— cz c r- >,<C c >>OO c r— i— i
—
> cc o “t— r— r
—
zn zn •i
—
•i— <o r— e •1
—
£= *«“i
—
CO 1 r—<c i—
i
E E c <a CD CO CO ca E <o CO C ro Ecc l
—
to CO <73 O •i
—
OO 1
—
CO U_ CO *i
—
r— o •i— CO1— OO Lu CD U_ *1— CJ <c CD i u_ a 03 •r- E Lu
UJ 1 E -CZ 1 +J s- 1
—
+J 4- CD 1 E 4-> CO +J 1
cc CZl * i
—
3 CJ •1— CO CD ro •1
—
O < r- CD •i— i—
-
CO co •r—o +-> CD s- +> CJ E • 1
—
CO- E CT34J E Q. CD O 3 +JTJ o r— CO 3 c— 3 E CJ CO Q- C r- E CO +j 3 73<c 3 3 -C 3 TO o o o •>-3 0 O o 73 CZ 32: c 21 21 CJ 21 UJ CJ 00 zn OOSO ZIZ 2: UJ i—
1
21
=8=
LU(—=>occ
<ua)CO COCO S-
a> a>C 73 CDC C 3
CD CD CO C3 — 1— C/0 >> CDC -E> CD ca >CD CD 3 4- 4-J 2 =t> CD CZ O S_ -C<C E CD O 07 73
+-> > >,LU •r— CCD C/0 C +-> \ zn COcn i— p— i
—
i—
-
73 CD CO W ro fO c s-•p* 07 1— S- +J +J CO CDe CD r— CD *i— <— E -C73 >— CO > Q. CL CL 4JC r— O •t— CO CO ca 3to O CJ COO -C OOo O 21 zo zn zn o
,
' 1 i 1 oCO r^. CO cn (
—
4t= =n= =t1= =tt=
164
Single-Family
Housing
Commercial
Areas

a*t
FIGURE 9-A UT/FT. SANDERS HOSPITALS ROUTE REVISIONREGULAR UT/FT. SANDERS HOSPITALS ROUTING
__ REVISED ROUTING
WORLD'S FAIR GATES
1 65
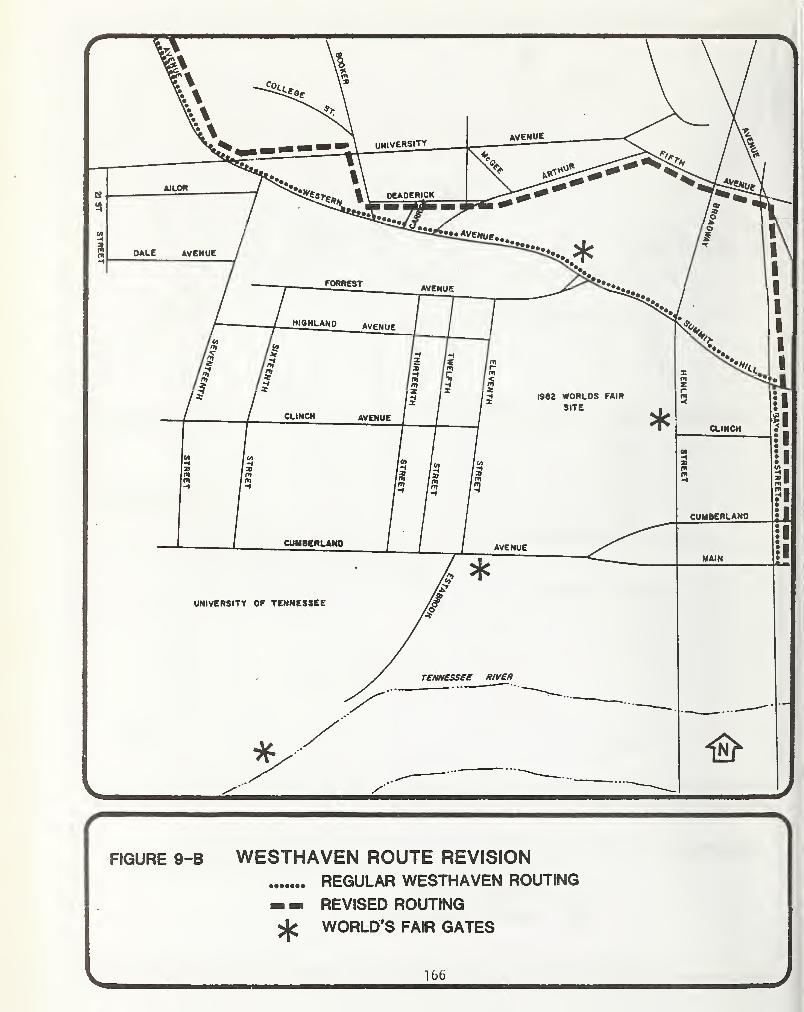
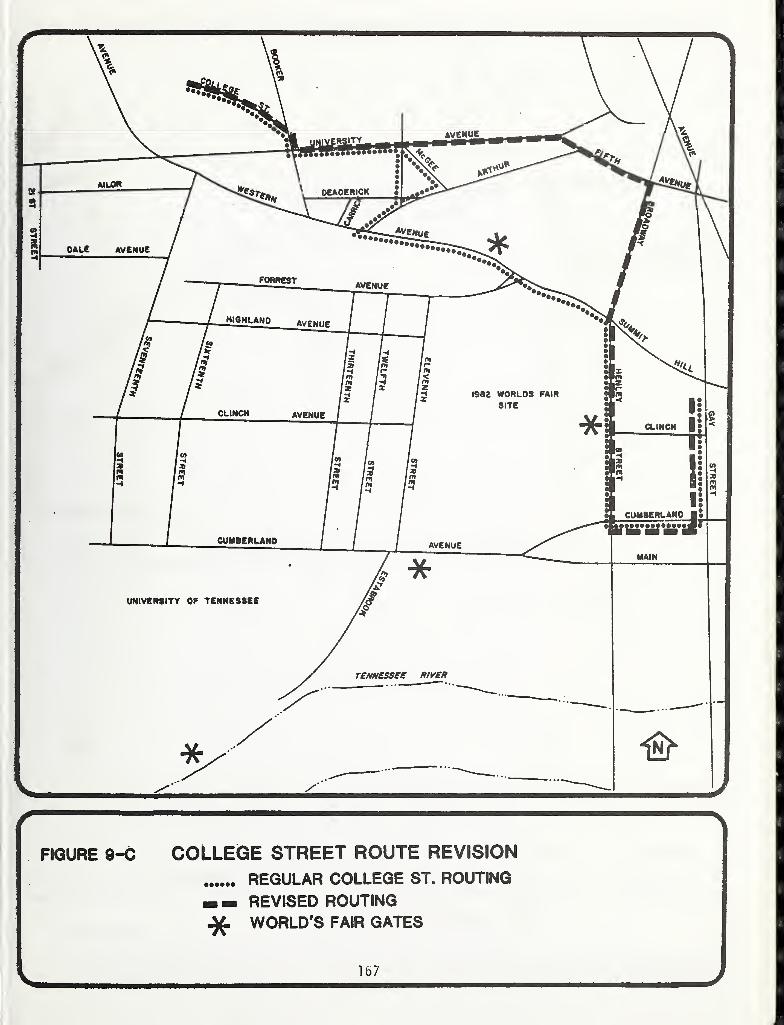
1»«
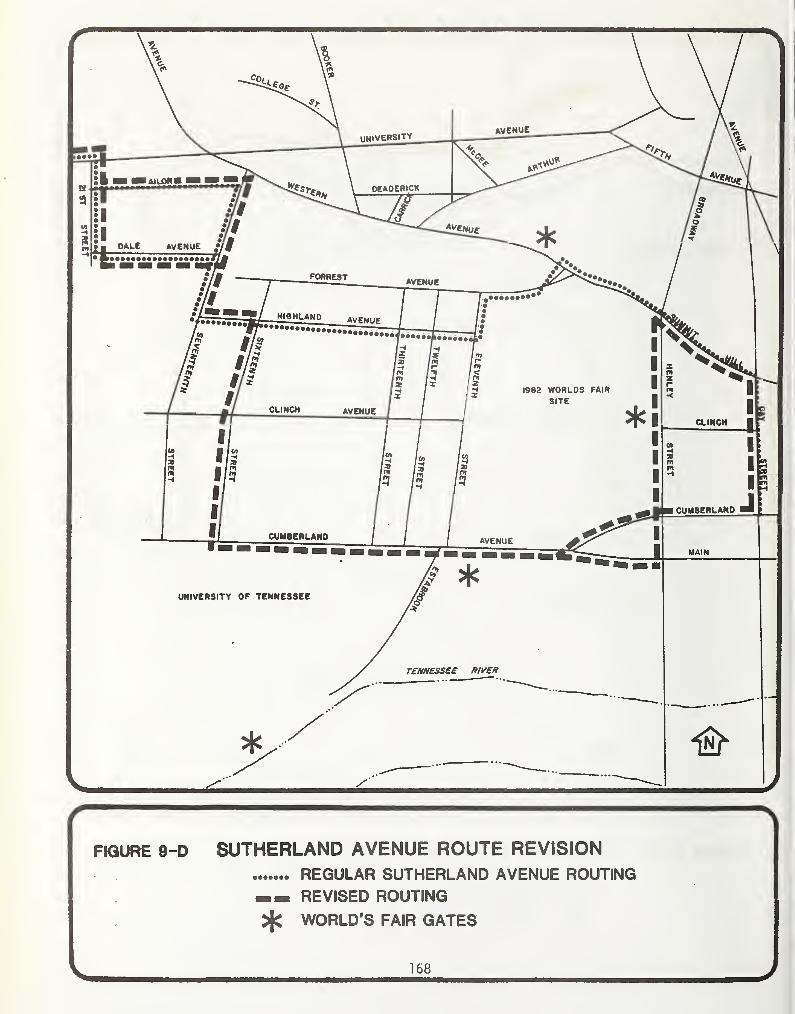
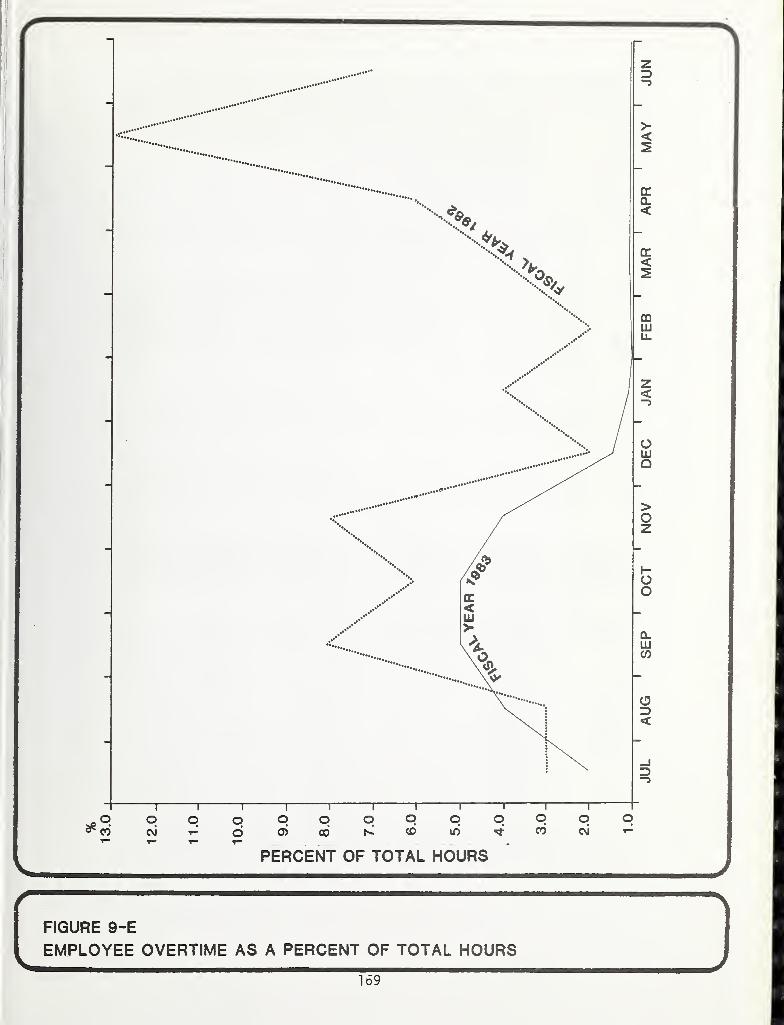
—
PERCENT OF TOTAL HOURS
FIGURE 9-E
EMPLOYEE OVERTIME AS A PERCENT OF TOTAL HOURS
169
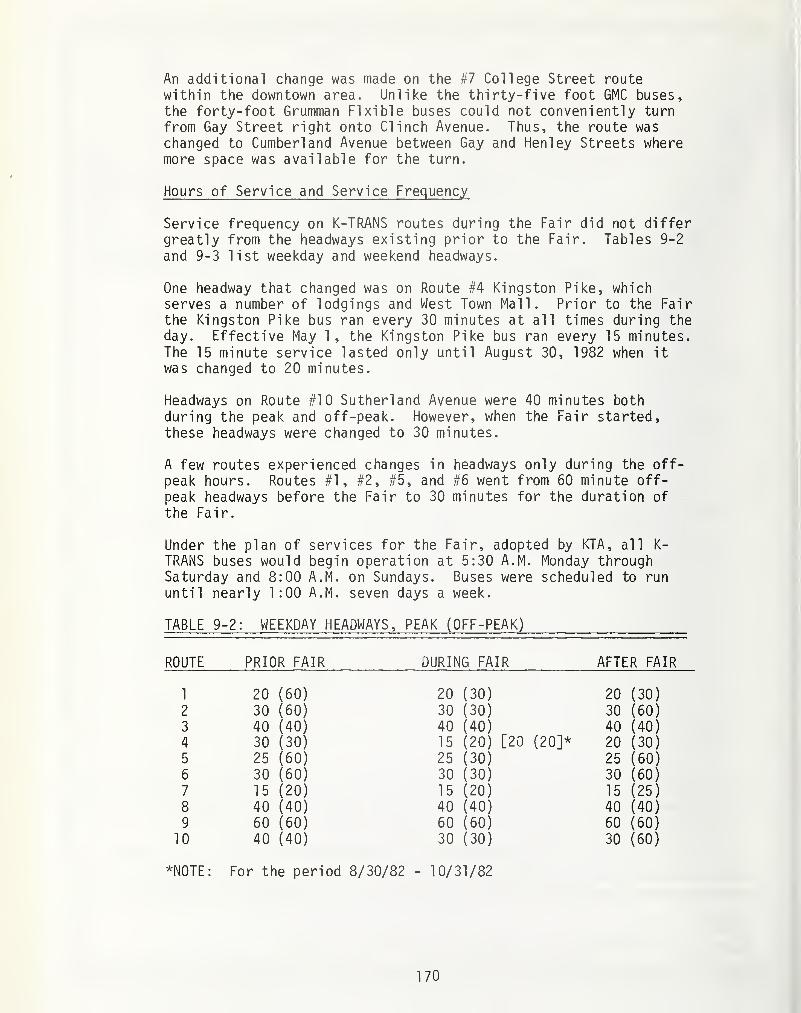
An additional change was made on the #7 College Street routewithin the downtown area. Unlike the thirty-five foot GMC buses,the forty-foot Grumman Flxible buses could not conveniently turnfrom Gay Street right onto Clinch Avenue. Thus, the route waschanged to Cumberland Avenue between Gay and Henley Streets wheremore space was available for the turn.
Hours of Service and Service Frequency
Service frequency on K-TRANS routes during the Fair did not differgreatly from the headways existing prior to the Fair. Tables 9-2
and 9-3 list weekday and weekend headways.
One headway that changed was on Route #4 Kingston Pike, whichserves a number of lodgings and West Town Mall. Prior to the Fairthe Kingston Pike bus ran every 30 minutes at all times during theday. Effective May 1, the Kingston Pike bus ran every 15 minutes.The 15 minute service lasted only until August 30, 1982 when it
was changed to 20 minutes.
Headways on Route #10 Sutherland Avenue were 40 minutes both
during the peak and off-peak. However, when the Fair started,these headways were changed to 30 minutes.
A few routes experienced changes in headways only during the off-peak hours. Routes #1, #2, #5, and #6 went from 60 minute off-
peak headways before the Fair to 30 minutes for the duration of
the Fair.
Under the plan of services for the Fair, adopted by KTA, all K-
TRANS buses would begin operation at 5:30 A.M. Monday throughSaturday and 8:00 A.M. on Sundays. Buses were scheduled to run
until nearly 1:00 A.M. seven days a week.
TABLE 9-2: WEEKDAY HEADWAYS, PEAK (OFF-PEAK)
ROUTE PRIOR FAIR DURING FAIR AFTER FAIR
1 20 (60) 20 (30) 20 (30)
2 30 (60) 30 (30) 30 (60)
3 40 (40) 40 (40) 40 (40)
4 30 (30) 15 (20) [20 (20]* 20 (30)
5 25 (60) 25 (30) 25 (60)
6 30 (60) 30 (30) 30 (60)
7 15 (20) 15 (20) 15 (25)
8 40 (40) 40 (40) 40 (40)
9 60 (60) 60 (60) 60 (60)
10 40 (40) 30 (30) 30 (60)
*N0TE : For the period 8/30/82 - 10/31/82
170

TABLE 9-3: WEEKEND HEADWAYS, PEAK (OFF-PEAK)
SATURDAYS
BEFORE EARLY MIDDLE LATE AFTERROUTE FAIR FAIR FAIR FAIR FAIR
(4-24-82) (5-1-82) (6-12-82) (9-4-82) (11-6-82)
1 60 30 (60) 30 (60) 30 (60) 60
2 60 30 (60) 30 (60) 30 (60) 60
3 60 40 (60) 40 (60) 40 (60) 60
4 30 (60) 15 (30) 15 (30) 20 30 (60)
5 60 30 (60) 30 (60) 25 (60) 60
6 60 30 30 (60) 60 60
7 30 25 (30) 25 (30) 25 (30) 30
8 60 40 (60) 40 (60) 40 60
9 60 60 60 60 6010* 30 (60) 30 (60) 30 (60) 60
*Sutherland Avenue and Kingston Pike were separated during and
after the Fair.
SUNDAYS
BEFORE EARLY MIDDLE LATE AFTER
ROUTE FAIR FAIR FAIR FAIR FAIR
(4-25-82) (5-2-82) (6-13-82) (9-05-82) (11-07-82)
1 60 30 (60) 30 (60) 30 (60) 60
2 60 30 (60) 30 (60) 30 (60) 60
3 60 60 60 60 60
4 60 15 (30) 15 (30) 20 60
5 60 30 (60) 30 (60) 60 60
6 DNO 30 (60) 60 ** DNO
7 30 30 30 30 30
8 DNO 60 60 60 DNO
9 DNO 60 60 60 DNO
10 •k 30 (60) 30 (60) 30 (60) *
DNO - Did not operate .
** _ Washington Avenue was served by Holston Drive/Rutledge Pike.
Dandridge Avenue was served by McCall a via Bethel •
171

Saturday service for the Fair resembled weekday service exceptsome of the peak headways differed on Saturday. For example.Route #1 Fountain City had 30 minute headways on Saturday whereasthere were 20 minute headways during the week. The #7 CollegeStreet and McCalla Avenue routes had 25 minute headways during the
peaks instead of the normal weekday peak headways of 15 minutes.
Table 9-4 shows the hours of service of K-TRANS. Sunday servicestarted considerably later in the day than weekday or Saturdayservice. Most service started around 8:30 A.M. The headways werereduced around the middle of the day to help alleviate over-crowding after Sunday worship services.
There were several changes in Sunday service. Effective September
5, #6 Dandridge Avenue and Washington Avenue Sunday routes wereserved by two different lines during the day. The day service was
identical to weekday service provided by #1 Holston Drive/RutledgePike and #7 McCalla/ Bethel routes. Late in the Fair, Sunday head-ways for routes #4 and #5 were increased to 60 minutes all day.
Express service frequencies and special extra service remainedunchanged throughout the duration of the Fair. On occasion,several lines required double or triple sections in the morningsaround 9:00 A.M. to 10:00 A.M. and in the evenings around 10:15P.M.
TABLE 9-4: K-TRANS HOURS OF SERVICE (MAY-0CT0BER 1982)
WEEKDAYS AND SATURDAYS
ROUTE TIME ON TIME OFF PERIOD
1,2, 4,
7
5:35-6:05 A.M. 1 : 00-1 : 1 0 A.M. 5/1/82-10/31/82
3,8 5:30-6:105:30-6:10
A.M.
A.M.
12:15-1 : 00 A.M.
9:00-9:15 P.M.5/1/82-8/29/828/30/82-10/31/82
5,9,10 5:35-6:105:35-6:10
A.M.
A.M.
1 : 00-1 :20 A.M.12:00-12:10 A.M.
5/1/82-8/29/828/30/82-10/31/82
6 5:40 A.M.
5:40 A.M.
1 : 00 A.M.6:40 P.M.
5/1/82-8/29/828/30/82-10/31/82
SUNDAYS
1,4, 6,
7
7:55-8:50 A.M. 12:55-1 : 00 A.M. 5/1/82-10/31/82
2 8:30 A.M.8:30 A.M.
1 :00 A.M.11:15 P.M.
5/1/82-8/29/828/30/82-10/31/82
3,8 8:15-8:358:15-8:35
A.M.A.M.
12:15-1 :00 A.M.9:15-9:25 P.M.
5/1/82-8/29/828/30/82-10/31/82
5,9,10 8:30-8:558:30-8:55
A.M.
A.M.
1 : 00 A.M.
12:00 A.M.
5/1/82-8/29/82
8/30/82-10/31/82
172

TABLE
9-5:
COMPARATIVE
K-TRANS
FA1RBOX
REVENUES*
FOR
1981
AND
1982
1
1
TOTAL
107,04568,032 85,801
©©ro©
72,500 52,559
I
130,060
[
25,520 18,847J
653.416
OCTOBER
REVENUE20,979 13,988
©©
F^-'3"
ID
CO
I
15,002 11,164
|
27,2064,899
I
S6V‘fr
!
1
1
130,999
SEPTEMBER
REVENUE16,531
r
12,205
CMlf>©co
15,191
©©C\J
I
10,494 19,528
[
3,891
1
ecz‘e
1
1
106,784
1981
AUGUST
REVENUE
16,489
9,364
1
14,379
©coCNJ
nr
roor-*
©
IDO ©r>*
©3,658
|
2,588 1
198,223
*
FOR
1981
AND
1982
JULY
REVENUE
15,9379,856
eg
©13,820 10,083
M07
[
20,6423,756
CO
CM
1
195,144
IANS
FAIRBOX
REVENUES
JUNE
REVENUE18,051 10,980
\
13,296
i
74,498
COCOCM
CM
©
CD
nTrr>
CMCM
4,302
|
2,654 1
1 106,344
TABLE
9-5:
COMPARATIVE
K-TF
MAY
ROUTE
REVENUE
1
19,058
©ro©
CM 3
15,043
4
16,660
5
13,215
6
8,197
7
23,849
53*
©©
00 9
3,247 1
1
o TOTAL
115,922
CMCOO'!
<o-o
ecLUco
Cl.UJ©
ifi©o©c
UJ2©©
INCREASE (DECREASE)
OVER
1981
49.5%
OS
o**
CM
OSr-*
i
113.2%15.1%
os os©6.2%
os©co© !
38%
© co CO © ^5= r>^. © © CO © CMLU -J co rv. © OS © © ro © ©t— < © nr CM CO <3- © © © «3"
ZD 1—o o © CD CO CO CO r>* © f—
>
eg 1— © © CO © CO © CM CM co na* O,©
LU UJ COCO (S) O'*
OS OS OS ** OS OS os os osUJ UJ CD © nr © CO ©tt fiC Cg 1 p—U U LU O** CM © CO © CO ©2UJ> p-= co © co CM **3"
*=• o o*
—
r>- CO © © © CM © © nr r>»
UJ CD VD © co co © © F— co ©ZD VD CM CM © CM © *— © © ©Z •UJ nr CM © r**. CM co © © ©> CM CM CM ©UJCg
UJ UJ 00 OS OS OS os OS os OS OS osCO tO © p— CO CM (X) © © © ©c c • • • • • • • 1 •
UJ UJ CO t*— © i*= © co r?r p-=» © I
DC eg QC nr co F“» CM M—
»
co CM «3- CMU U UJ^ LU >— o ov—
'
© co CM © © •3 © © r>. CMUJ © © © r**> CM CM CO © o*. r-*
=0 *3* © © © © © © coz *UJ nT CO CO CM © © co © © ©>> CM *=*= co COUJ p—
»
Cg
U UJ SO(/!(/) ^ OS OS OS os os os os OS os
<c p- co LD CO •*3* co © © r^.
UJ UJ 1 •
Cg Cg £g nr © © «3* CM CM © r^. 1O O UJ © «T CM CM © nrZLU>— o o—UJ co cr» © *3- © © co © co CM© co r—
.
co co © © CM ©z © © CM CM CO © © CM
>> CO co co f— CM © © nr nr © ©UJ CM CO roCg
to-
—CO CO © OS o? OS OS os os os os< < *— CM CM © *35" «3= © © © ©UJ UJCg DC DC © CO co CO © © CM co 1 ©O O UJ co co CM co CM ©ZUJ>—• © ©
'
—
UJ CD © © co © © r^. CM© CM CM © CM © © © © © CM ©z © VD co © © © © © COUJ> CO © co CO F=*» co © © ©UJ CM CO CM nrQC <=
toO-
—~r-co co © OS OS ** OS OS os OS os os< < •— CD CM © CO co © r^L
UJ UJ 1
eg cc oc CD CM TO fVL co CM r-» ©UUUJ vD CM CM CO CM nr ©Z UJ >— o o
1
r
UJ co CO CM ID © © CM © © co© nr F= CO co- CO o CO CM © nrz *3“ vD r*=>. © CO *9* *3" ©UJ * *> © © © CM © © © © © © p—UJ CO »=> f= co p— CM ©Cg
•bO-
uj uj eoCO l/J Oi< =£ »— OS OS ** OS os OS OS OS osUJ UJ CO r^. co © *3" © ©eg eg eg • • • • • • • • • 1 •
u uu CM co © © © © nr CM 1 ©ZUJ> <53> CM CM CO CM co «d- co^ © © t—
UJ© © © © © CO nr © © ©z nT © © co r
^
© nr © ©Ul f—
i
© © © CM © r>* © © CM>UJ © CO © © CM © r>* r>» CMeg CM t= CO p— p— CM ©
-faO-
LIT —ih° «© f=> CM CO <*3“ © © © © © F—© ©eg 1— *
173
Figures
do
not
include
ticket
sales
revenue.
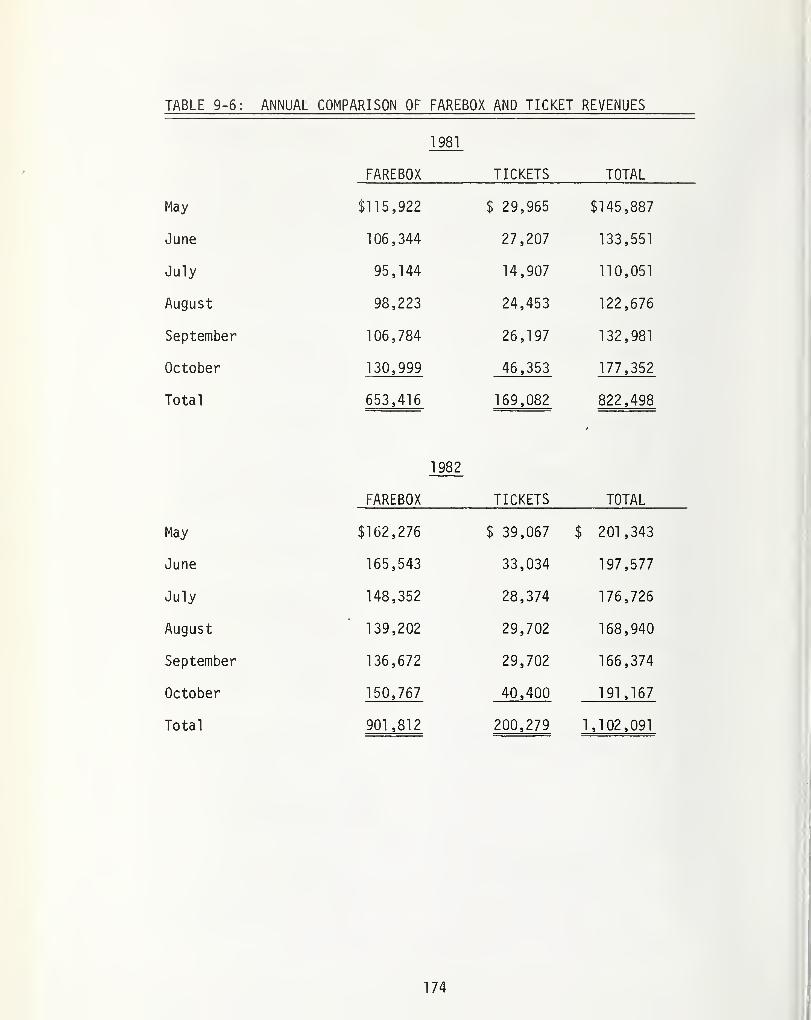
TABLE 9-6: ANNUAL COMPARISON OF FAREBOX AND TICKET REVENUES
1981
FAREBOX TICKETS TOTAL
May $115,922 $ 29,965 $145,887
June 106,344 27,207 133,551
July 95,144 14,907 110,051
August 98,223 24,453 122,676
September 106,784 26,197 132,981
October 130,999 46,353 177,352
Total 653,416 169,082 822,498
1982
FAREBOX TICKETS TOTAL
May $162,276 $ 39,067 !& 201,343
June 165,543 33,034 197,577
July 148,352 28,374 176,726
August 139,202 29,702 168,940
September 136,672 29,702 166,374
October 150,767 40,400 191,167
Total 901 ,812 200,279 1,102,091
174
EVALUATION OF PATRONAGE AND SERVICE UTILIZATION
Patronage By Route
During the six month period of the 1982 World's Fair revenue forall routes combined was substantially higher than during thesame period in 1981. Farebox revenue was up 38% during thisperiod. Farebox and ticket revenues combined for routes wasup 34%. All regular routes except one experienced an overallincrease in farebox revenue for the period of May throughOctober 1982 over the same period in 1981. Tables 9-5 and 9-6
list farebox and ticket revenue by month and compare it to
1981.
Routes with the highest increases in farebox revenue during theWorld's Fair were Routes #1 Holston Drive/Rutledge Pike - FountainCity, #4 Kingston Pike, and #9 Chapman Highway, with increases in
revenue of 49.5%, 113.2%, and 93.8% respectively. These increasesare probably due to the location of hotels and motels along theseroutes which accommodated many World's Fair visitors.
Only one route, #7 College Street/McCal 1 a Avenue, experienced an
overall decrease in farebox revenue over the six month period of
the Fair from the same period the preceding year. Lack of a
substantial increase may partially reflect demographics along this
route. Both the College Street and McCalla Avenue segments of the
route serve low income residential areas which did not attractout-of-town visitors. Rerouting both before and during the Fairmay also have had an effect on patronage.
The largest percentage increases occurred in the summer months of
June, July, and August. This increase over the preceding year can
be partly attributed to the number of Fair-related jobs availableto high school age children who normally would not be riding the
bus on a daily basis during the summer months. Also, familieswith children attended the Fair while school was not in session.
A portion of the total increase in revenue is the result of
separating Route #10 Sutherland Avenue from #4 Kingston Pike in
April 1982.
Utilization of Service
During the months of May through October, K-TRANS was able to
attract new passengers who worked in the downtown area. A
dramatic increase in passengers was noted in the mornings and
during late afternoon rush hours. For example, the increase on
the 5:00 Fountain City bus was so great that an additional section
was added to the route. Also, several trips on Route #4 Kingston
175

Pike received double sections to take care of the extra workers.Much of the increase was attributed to the sudden rise in the
price of parking.
The high downtown parking prices also encouraged Fair visitors to
use the regular K-TRANS service. The A.M. peak would normally endaround 9:00 A.M. Since the Fair gates eventually opened at 9:00A.M. and the exhibits at 10:00 A.M., the influx of Fair visitorsmade the A.M. rush continue until 11:00 A.M. In order to handlethe extended peak, K-TRANS increased the number of mid-day busesby 31% from before the Fair through August.
The late evening use of service during the Fair had severaldifferent patterns. On different occasions, the World's Fairchanged the timing of the evening fireworks. The fireworks were a
signal that the Fair was about to close. As soon as the fireworksended, the #4 Kingston Pike, #1 Fountain City, Holston Drive, andRutledge Pike buses would fill up to the point that double and
triple sections were needed. During the months of July andAugust, the Fair experienced a slump in attendance. The regularroute buses were carrying passengers close to capacity, but did
not require double sections on a regular basis during thesemonths.
In late July, K-TRANS conducted a passenger count on all routesafter the 6:15 P.M. Gay Street departure. Several routes-#3Davenport, Vestal, Lonsdale, West Haven, and #8 UT Hospi tal -weredetermined to be the least patronized. Route #6 Dandridge Avenue/Washington Avenue also had low levels of patronage. Due to the
lack of passengers, all UT Hospital, Davenport Road, Vestal, WestHaven, and Lonsdale buses curtailed downtown departures after 8:15P.M., as of August 30. Dandridge Avenue and Washington Avenueafter 6:15 P.M. departures were discontinued, but were served by
#7 McCal la/Bethel (Dandridge) and #1 Holston Drive/Rutledge Pike(Washington). Route #5 Sequoyah Hill s/Lyons View Pike, #5Fairmont Boul evard/North Hills, #10 Sutherland Avenue and #9
Chapman Highway stopped operating after their 11:15 P.M. trip wascomplete.
176
POST-FAIR IMPACTS
Retention of Route Revision
During the World's Fair, it became apparent that traffic volumeson Summit Hi 11 /Western Avenue had been overestimated. Therefore,Route #3 Westhaven and Route #7 College Street were returned totheir original routings. This was the only Fair related routerevision to revert to the original routing during or following theFair. The Kingston Pike/Sutherland Avenue route separation hasbeen maintained, along with the extension of the #4 Kingston Pikeroute to Downtown West shopping center. The #10 Sutherland Avenueline continues to follow its revised routing on Cumberland Avenue.These revised routings avoid substandard streets and provideincreased service along Cumberland Avenue. The #8 UT and FortSanders Hospitals line retains its revised routing for similarreasons, in addition to the fact that the City has decided to
close the Clinch Avenue viaduct permanently to allow developmentof the former Fair site.
Service Retentions
K-TRANS was able to provide improved service compared to pre-Fairlevels on certain routes. Some evening service was retained, withthe last trips leaving downtown on routes #1, 2, 3, 4, 5, 7 and 10
at 8:15. Prior to the Fair the last trip was at 7:15 P.M.
On Route #2, Lincoln Park, the Montrose and Inskip legs of the
route were no longer linked as of May 1982. These legs were run
separately throughout the Fair and continued to be run this wayafter the Fair.
Service Reductions
One service reduction was made for the Fair on Sutherland Avenueand retained for post-Fair service. This was the change in the
off-peak headway from 30 minutes to 60 minutes.
Headways for routes #1, #4, and #7 were also changed from pre-Fairlevels and retained for post-Fair service. The headways on Route
#1 Holston Drive/Rutledge Pike/Fountain City were changed from 6
minutes in the off-peak to 30 minutes. The 30 minute headways
were retained for post-fair Service. Route #7 College Street/
McCall a Avenue went from 20 minute off-peak headways before the
Fair to 25 minutes after the close of the Fair.
177

Employee Reductions and Retained Employees
A total of 104 new employees were hired specifically for dutiesduring the 1982 World's Fair. Of these, 74 were bus operators, 9
were maintenance personnel, 7 were telephone information operators,12 were transportation agents at shuttle bus lots, one was a
clerical employee, and one was Director of Fair Services. Theseemployees were hired and trained during March and April of 1982 in
order to begin operations with a full staff when the Fair openedMay 1st. The original number of World's Fair employees was re-duced when a few bus operators and transportation agents left the
company before the end of the Fair.
As of November 2, 1982, the K-TRANS work force had been reduced by
90 World's Fair employees, representing an 86% increase. Ten of
the bus operators and seven of the maintenance personnel wererehired as permanent employees to fill positions created throughattrition or positions which had been vacant prior to opening of
the Fair.
Table 9-7 illustrates the breakdown of employees in the categoriesthat were affected by the World's Fair and the changes thatoccurred over the time period.
TABLE 9-7: K-TRANS EMPLOYMENT
CATEGORYJANUARY1982
MAY1982
JULY1982
AUGUST1982
NOVEMBER
1, 1982NOVEMBER
30, 1982
JANUARY1983
Bus
Operators 93 163 159 149 148 99 98
TelephoneInformation 2 11 10 9 10 4 3
Clerical 3 4 4 4 4 3 3
Maintenance 23 32 32 31 31 30 30
Transporta-tion Agents 0 13 12 4 2 0 0
TOTAL 121 223 217 197 195 136 134
178
Retained Patronage
K-TRANS continued to realize increases in both regular routefarebox revenue and ticket revenue after the close of the 1982World's Fair. As shown in Table 9-8, regular route fareboxrevenue was up 88% during the first three months of the Fair overthe three months immediately preceding the opening of the Fair.The same revenue figure during the last three months of the Fairremained up 69% over the three month period preceding the Fair'sopening. Part of this increase was sustained, as regular routefarebox revenue was up 9.9% for the three months following theFair compared to the same period in the previous year.
Ticket sales rose at a substantial rate throughout the Fair andcontinued to rise to an even higher sales level after the close ofthe Fair. Route ticket sales rose 6% from May to October, 1982,and rose another 6% over the next three month period. This boostin ticket sales resulted in a 26.7% increase in the three monthperiod following the Fair from the same period in 1981.
Knoxville citizens apparently responded favorably to K-TRANSadvertising run in the early months of 1982 featuring the low costand convenience of riding K-TRANS and using multi-ride tickets.There was also a general feeling throughout Knoxville that trafficcongestions and parking prices would make driving in the downtownarea both time-consuming and expensive. These factors, along withpatronage from World's Fair visitors, gave K-TRANS a 15.4% increasein revenues for regular routes and expresses combined fromNovember 1981 to November 1982.
One factor which detracted from the total retained patronage was
the drop in express patronage which occurred during the World'sFair and continued in the months following. K-TRANS experienced a
36.4% decrease in express revenue from January of 1982 to Januaryof 1983 with no substantial increases occurring during the monthsin which the Fair was being held (see Table 9-8). Thus, whenisolating express revenue from regular route farebox and ticketrevenue, the regular route revenue increased 28.1% from November1981 to November 1982. This decrease can be attributed to three
main factors. First is the redeployment of 400 TVA employees from
the downtown office. Second, K-TRANS express fares increased from
$.90 to $1.30 in October of 1981. Finally, relatively inexpensiveand free parking is available in the downtown area. Thus, whenisolating express revenue from regular route farebox and ticketrevenue, the regular route revenue increased 28.1% from November1981 to November 1982. Table 9-8 lists revenue figures for
November 1981 through January 1983.
179

TABLE 9-8: COMPARISON OF ROUTE REVENUE FIGURES BEFORE, DURING , AND AFTER THE FAIR
ROUTE TICKETS ROUTE FAREBOX EXPRESS TRANSFER RIDE & SHOP TOTAL
November 1981
December 1981
January 1982
$ 25,969.5025,931.0031,589.50
$74,150.3073,476.2369,382.68
$22,508.7018,542.6019,106.10
$2,635.802,731 .35
2,922.20
$ 231.87314.94210.96
Subtotal 83,490.00 217,009.21 $369,703.73
February 1982March 1982April 1982
30,707.9031,944.5031,415.40
76,334.1887,675.4988.144.55
17,693.0018,778.5020,996.60
2,808.403,294.252,869.76
262.36300.81
254.72
Subtotal 94,067.80 252,154,22 413,480.42
May 1982June 1982July 1982
39,067.4033,033.8028,374.00
162,275.55164,541.60148,351.50
19,432.7018,961.1018,983.90
2,847.852,465.372,378.75
156.93181.55203.91
Subtotal 100,475.20 475,168.65 641,255.91
August 1982September 1982October 1982
29.702.0029,701.5040.400.00
139,202.47136,672.40150,766.45
17,198.7016,247.9015,185.45
2,358.212,058.031 ,968.99
223.58239.29268.25
Subtotal 99,803.50 426,641.32 582,193.22
November 1982December 1982January 1983
45.667.5035.809.5024,271.60
84,064.7077,707.7576,777.20
12,948.0013,677.3012,153.70
1,943.101,894.872,028.81
209.40275.88205.74
Subtotal 105,748.60 238,549.65 389,635.05
NOTE: Route ticket revenue increased 75.9% in November 1982 over November 1981.The total revenue increase from November 1981 to November 1982 is 15.4%.The route revenue increase (excluding express decrease) from November 1981 toNovember 1982 is 28.1%.
180

K-TRANS SHUTTLE BUS SERVICE
Shuttle buses were operated for both the KIEE organization and forseveral private operators. Most of the shuttle service operatedby K-TRANS was for park & ride lots, although two campgrounds wereserved as well. Also, several parking lots and campgrounds werelocated on or near K-TRANS regular routes.
Both KIEE and independent operators contracted with K-TRANS forsignificant levels of service, particularly during the morninghours just before the Fair opened. K-TRANS developed operatingschedules which reflected this demand. K-TRANS also employedadditional bus operators. Both operators and vehicles wereutilized in such a way that they could be assigned to both conven-tional K-TRANS service and World's Fair shuttles.
Several problems were encountered. The oversupply of parkingfacilities in turn resulted in an oversupply of shuttle buses.Equally important was the fact that traffic congestion was less ofa factor than expected. Also a complete round trip of shuttlebuses took considerably less time than projected. At the CivicColiseum, for example, a complete round trip including loading andunloading of passengers took only about 20 minutes rather than the42 minutes as was scheduled.
K-TRANS did not have to lay off any bus operators due to the lossof some shuttle contracts. In May, overtime hours represented 13%of all hours worked based on total hours of service on bothshuttles and on the regular route system. By June this had beenreduced to 7% (see Figure 9-E). K-TRANS was able to adjustvacation schedules of regular employees and permit more days of
vacations to be taken during the summer. Ordinarily, vacationsmust be spread more evenly throughout the year. In addition,available employees to fill runs meant that K-TRANS could accom-modate more requests for time off from its regular drivers.
Financially, the loss of shuttle contracts meant that K-TRANS waslosing revenue. K-TRANS generally took shuttle contracts only on
a revenue guarantee basis figured on hours of service for each
bus. K-TRANS was therefore being paid whether buses being used by
the parking lot operator were full or not. Contracts were re-
negotiated wherever possible in order to sustain service using a
smaller number of vehicles. By the end of the Fair, nearly all of
the contracts were re-negotiated or terminated because the demand
for parking was less than necessary to sustain the service.
Prior to the World's Fair, K-TRANS had negotiated contracts with
Regency Square and KIEE for service to and from shuttle lots. K-
TRANS anticipated $737,000.00 in revenue from the Regency Square
operation, and $445,936.00 from the KIEE shuttles. K-TRANS
actually received $80,262.92 from Regency Square and $296,665.13from various KIEE shuttle lot operations. On these two accounts
alone, K-TRANS experienced a revenue shortfall of $806,007.95
between what was expected and what was received.
181

MAINTENANCE
During the World's Fair, the K-TRANS maintenance facility operated24 hours each day in an attempt to keep all buses in the fleet in
condition to meet increased service demands. K-TRANS hired andtrained nine additional employees for the maintenance staff in
March and April of 1982. Seven of these employees were rehiredfor permanent positions with K-TRANS maintenance facility afterthe Fair closed.
Following the closing of the Fair, the maintenance facilitycontinues to operate 24 hours each day, except from 12:00 A.M.Friday to 5:00 A.M. Saturday and from 8:30 P.M. Saturday to 8:00A.M. Sunday. K-TRANS employs 30 maintenance personnel, comparedwith 23 employees in the period before the World's Fair. Theincrease in personnel is primarily due to the additional demandsof new equipment. Prior to the Fair, the K-TRANS operation wasaveraging 24.74 maintenance hours per thousand miles of service.During the Fair, 20.12 maintenance hours per thousand miles ofservice was the average. Following the Fair, the maintenancefacility has averaged 25.14 maintenance hours per thousand milesof service as a result of an increase in maintenance personnel anda decrease in miles traveled by buses in the system. While this
average is 24,95% higher than the period during the World's Fair,it is only up 1% over the period prior to the opening of the Fair.
Because of the influx of new equipment and underutilization of the
fleet due to reductions in shuttle service, the maximum fleetutilization at the P.M. rush hour was 82 vehicles, or 67% of the
total fleet during the Fair, Since the Fair closed, the maximumfleet utilization at the P.M. rush hour is 63 vehicles, or 51% of
the total fleet. During the Fair, the average number of bus unitsout of service and awaiting repairs numbered nine per day, whichincluded one bus per week scheduled in the repainting program.Since the Fair, the average number of bus units out of service and
awaiting repairs numbers six per day and the repainting programhas been completed.
CAPITAL IMPROVEMENTS PROGRAMS
Four different capital improvements projects were initiatedpreceding the Fair. Some of the items would have been acquiredregardless of the Fair. Other items were projected for purchase,
but the timetable for acquisition was advanced because of the
Fair. Additionally, a few items were acquired specifically for
use during the 1982 World's Fair. A description of these capital
projects and completion dates are included in Table 9-9.
182

Vehicles
K-TRANS had an extremely old fleet of buses prior to opening ofthe 1982 World's Fair. Before delivery of 40 new Grumman Flxible870 class buses, the average age of a K-TRANS bus was nearlyeighteen years. The newest buses were nearly ten years old andthe oldest bus had over thirty years of service. Fleet conditionwas generally acceptable, although maintenance costs were risingsharply. Even the newer buses were beginning to deterioratebecause scheduled maintenance had fallen while the shop attendedto repairs needed to keep older buses on the streets.
A comprehensive capital improvements program had been recommendedas early as 1976, but had not been undertaken due to the lack oflocal funding. Finally, in 1978 the City of Knoxville authorizedapplication to the U.S. Urban Mass Transportation Administrationfor ten new buses. K-TRANS and the Knoxville TransportationAuthority subsequently recommended that additional buses be
acquired and the bus replacement program be accelerated. A secondapplication was filed in late 1979 to purchase thirty more buses,partially on the basis that new vehicles would be needed for theWorld's Fair. UMTA, the City, and K-TRANS agreed that the twocapital projects should be handled together to get the best priceon the buses. Thus, the fleet was expanded by 40 buses to provideadditional service required by the Fair. After the Fair 40 olderbuses were placed in the reserve fleet.
Purchase of the forty new buses, which represented half of the
existing fleet, would have occurred regardless of whether therehad been a World's Fair. The primary impact of the Fair was to
speed up the schedule of providing the local contribution neces-sary to secure federal funding. A more favorable price for newbuses was probably obtained by purchasing forty buses in one orderrather than the original plan which provided for purchase of ten
vehicles per year.
Maintenance
A variety of equipment and supplies were purchased through three
grant projects for use in the K-TRANS maintenance facility. Most
items were purchased in conjunction with the two earlier grants
(1978 and 1979) which provided funding to acquire buses. Acquisi-
tion of these items would have occurred regardless of the World's
Fair, although purchase was hastened due to the heavier demand on
the maintenance facility.
Funding through a third grant project filed in 1981 provided
funding to install a fuel tank, a tow truck, additional small
pickup trucks and related servicing equipment, and two new cars
for use by road supervisors.
183
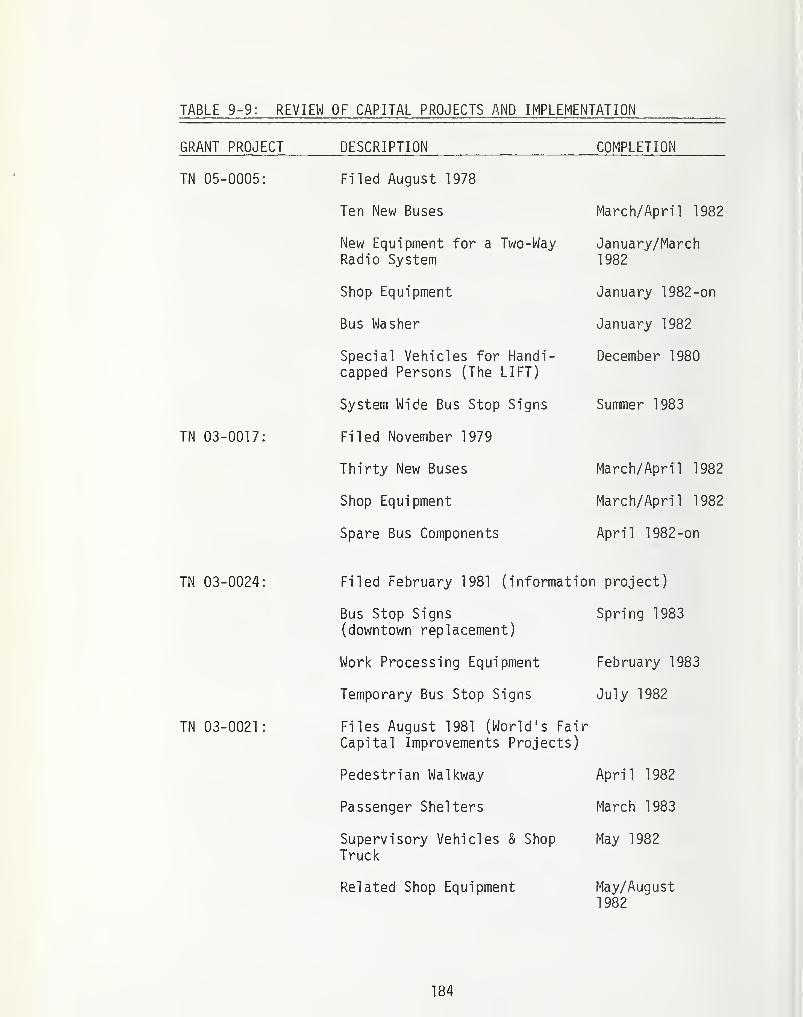
TABLE 9-9: REVIEW OF CAPITAL PROJECTS AND IMPLEMENTATION
GRANT PROJECT
TN 05-0005:
TN 03-0017:
DESCRIPTION COMPLETION
Filed August 1978
Ten New Buses March/April 1982
New Equipment for a Two-WayRadio System
January/March1982
Shop Equipment January 1982-on
Bus Washer January 1982
Special Vehicles for Handi-capped Persons (The LIFT)
December 1980
System Wide Bus Stop Signs Summer 1983
Filed November 1979
Thirty New Buses March/April 1982
Shop Equipment March/April 1982
Spare Bus Components April 1982-on
TN 03-0024:
TN 03-0021:
Filed February 1981 (information project)
Bus Stop Signs Spring 1983
(downtown replacement)
Work Processing Equipment February 1983
Temporary Bus Stop Signs July 1982
Files August 1981 (World's FairCapital Improvements Projects)
Pedestrian Walkway April 1982
Passenger Shelters March 1983
Supervisory Vehicles & Shop May 1982
Truck
Related Shop Equipment May/August1982
184

Signing Program
K-TRANS bus stop signing consisted almost exclusively of signswhich had been installed well in advance of the opening of theWorld's Fair. Only a few signs were installed specifically for useduring the Fair. Three grant projects contained funding forimprovements or replacement of signs, but installation was notpossible until after the Fair had closed.
One grant project was not approved until after the Fair had begun.Funding was not available for the other two projects until the costof other project elements had been confirmed. K-TRANS updatedexisting signs and added portable signs which were sufficient to
meet information needs by passengers at points where signs were to
be installed.
Pedestrian Overpass
A special World's Fair transportation grant project was developedby the City of Knoxville. The largest item in the project was the
construction of a pedestrian overpass over Henley Street (U.S. 441)
a major downtown thoroughfare. The intent of the pedestrianoverpass was to link an "East-West Mall" redevelopment project to
the Fair and on-site Exhibition Center.
Passenger Shelters & Amenities
Ten passenger shelters were included with the pedestrian overpass
to provide new passenger services during the 1982 World's Fair.
However, these were not installed until 1983 because the staff was
occupied on other projects of higher priority.
Other Capital Items
The K-TRANS two way radio communications system was replaced in
early 1982 with a new and more technologically advanced system.
Replacement of an older system was projected several years before
and new equipment was included in the 1978 capital improvements
project.
Conclusions
Capital projects intended to assist the transit system specifically
in serving the World's Fair were generally developed too late to
make any significant contribution toward improving conventional
transit services. Although several project elements of the
"World's Fair Grant" were beneficial to K-TRANS, many of the
elements were not completed until after the Fair had closed.
Capital projects filed well in advance of the Fair were the most
185

successful. The primary impact of the 1982 World's Fair was to
quicken the pace in completing projects which had already beenprogrammed. Careful advance planning and programming of capitalneeds is strongly recommended for any event of the magnitude of the1982 World's Fair.
MARKETING
K-TRANS marketed transportation services during the 1982 World'sFair as an extension of an existing marketing program. This
includes advertising K-TRANS service, providing schedule informa-tion by telephone, on signs, and through printed schedules andmaps.
Background and Original Concept
There was a proposal developed by K-TRANS for a comprehensiveintra-city transportation marketing and information program for all
operators, whether related to K-TRANS services or not. This wasnever accomplished because the grant for a transportation infor-mation project was approved too late to implement any but a fewelements of the original project.
Three factors prevented implementation of the consolidated trans-portation information project as it was originally envisioned.First, federal "front" money needed to initiate the project was not
available. The original plan envisioned a start-up date of October1, 1981 in order to develop the service. The City of Knoxville did
not actually receive a grant contract until September, 1982, aboutfive weeks before the close of the Fair. The second reason is that
the Fair's management sought a much more active role in transpor-tation than was expected in early 1981. Third, the City of
Knoxville did not get involved in coordinating intra-city trans-portation. In order for a consolidated transportation informationservice to function on a "revenue financed" basis, it is necessaryfor there to be some means to compel operators to participate. In
the absence of outside support, K-TRANS withdrew from its effortsto provide a consolidated transportation information service.Although the concept of a consolidated information service period-ically resurfaced, no efforts were made to implement the concept.
The marketing and information program implemented by K-TRANSconsisted of an enlargement of existing services. These includedthe telephone information service, the printed bus schedules, and
the bus stop signs.
186
Telephone Information
Enlargement of the telephone information service was the largestand perhaps most important aspect of the program. Prior to theWorld's Fair, staff time required to answer both information linesand business lines represented about 2^ positions. Phones wereanswered from early in the morning until the close of businesshours on weekdays, with the dispatcher handling calls on eveningsand Sundays. With the beginning of the World's Fair, it requiredten positions with staff exclusively committed to telephone infor-mation at all hours. As shown on Table 8-2 and Figure 8-2 on pages136 and 137 of the Phase I Report, the number of calls increasedgreatly during the Fair.
Calls began to increase in March (prior to May 1 opening) asparking lot operators in the downtown area began raising prices.The complexity of calls also became a factor in the assignment ofpersonnel. Knoxville residents who had not used K-TRANS servicebefore generally required more information than did other callers.Out-of-town visitors also required considerably more assistance.
Advertising
K-TRANS marketing activities included radio advertising program.The first phase occurred in April prior to the Fair's opening.During this period, parking lot operators in the downtown arearaised prices and this fact was emphasized in K-TRANS advertising.Considerable press attention was also given to anticipated parkingshortages and traffic jams. K-TRANS directed its advertising to
these concerns and presented its services as a solution to the
problems. A second series of radio advertisements ran July throughOctober and emphasized the telephone information service as a
source for answers to specific transportation questions.
Newspaper advertising was also run prior to opening of the Fair. A
multi page section was published in a special insert of the
Knoxville News Sentinel Sunday edition which appeared immediatelyprior to opening of the Fair. This section showed all weekdayschedules operated by K-TRANS. Although many schedule changes
occurred just after the Fair opened, it clearly demonstrated the
extent of K-TRANS service which was being offered and helped people
who were unfamiliar with the K-TRANS system understand whereservice was being offered. Other advertising was run in the
University of Tennessee Daily Beacon . Low cost parking in the UT
area was virtually eliminated during the Fair and the ads
encouraged students to ride the bus. Newspaper advertising was
also run in several neighborhood newspapers. However, this was
primarily intended to support the radio ad campaign.
187
Signs
The K-TRANS bus stop signing program was essentially in place priorto opening of the Fair. Signs at major points in downtown Knoxvillealready illustrated routes with a route map and schedule times.
Temporary signs were placed where special signs were necessary.Portable signs were used to meet additional signing needs. The
system which proved to be the most effective was a Transi-Tube typesign which was mounted on a steel fence post with a bus brake drumbase.
Several signs were placed in locations where it was either imprac-tical or undesirable to place a permanent sign. The relativelyhigh cost of the Transi-Tubes and the shop time required to fabri-cate the heavy base was more than offset by the flexibility of the
design. Transi-Tubes have a large working area for information and
contained full route and schedule information along with a systemmap where practical. The heavy base made the signs difficult to
steal and none were lost. K-TRANS continues to use the temporarysigns which were made during the Fair.
Bus Schedules
Bus schedules were a weakness in the information program. Funding
to support the expanded route system was not finalized until
relatively late. Consequently, the K-TRANS Transportation Depart-
ment was unable to develop quality public schedules. Minorrevisions in schedule times also occurred relatively frequentlyduring the first few weeks of the expanded service until the
Transportation Department was able to work out problems. Schedules,
although functional, were consequently not as attractive and infor-
mative as had been hoped.
Publication of inadequate public schedules proved to be less of a
problem than an annoyance. The telephone information service was
able to overcome whatever shortcomings existed with the publicschedules. Publication of bus schedules is a major undertaking,particularly since schedules are likely to change frequently during
the first few weeks, making it difficult to know what is worthprinting on a "permanent" schedule. Adequate time is essential to
develop workable running and public schedules.
Maps
Maps are generally seen as an expensive but extremely desirablemeans of advertising. K-TRANS therefore negotiated an agreementwith a private company for a joint map production venture.
The joint participation project with the Sunsphere, themestructure for the 1982 World's Fair, included K-TRANS, Hardee'srestaurants whose specialty food division operates the restaurantsin the Sunsphere, the Sun Oil Company which operated an exhibit
188
I
and ride at the Sunsphere, and the Sunsphere's owner and developer.The "K-TRANS/Sunsphere Street Guide to Knoxville" was the result.The Sunsphere purchased 2,500 maps with the understanding that K-
TRANS would distribute about two thirds of them to Knoxvilleresidents. The Sunsphere distributed the remaining supply.
K-TRANS agreed to make the maps available on buses (which consti-tuted distributing Sunsphere advertising to passengers) and to
include a mention of the Street Guides in radio advertising whichK-TRANS was running at the time.
K-TRANS produced a second run of the route maps in October, 1982following signing of a contract between UMTA and the City ofKnoxville. This was also a joint participation project between K-
TRANS and private businesses. K-TRANS acquired the maps usingfunding in the grant. A local radio station, WIMZ AM & FM, wasselected on the basis of written proposals to promote the map.WIMZ also secured the support of a local convenience food andgasoline store chain, the Smoky Mountain Markets, to distribute themaps and to purchase advertising for additional advertising value.K-TRANS consequently received advertising value from either WIMZ or
Smoky Mountain Markets roughly equal to the value of maps which K-
TRANS had planned to produce anyway.
Evaluation of Marketing Activities
K-TRANS marketing and information efforts were generally effective.Among the most successful aspects of the information program werethe joint participation projects with private businesses.
Where marketing activities were less effective than desired, it wasoften a result of insufficient lead time. The primary result of
insufficient planning time for the information program was a muchgreater dependence upon the telephone information service than
desired. This service was valuable in that it provided person to
person contact in response to questions from people who are un-
familiar with transit service. Even if printed materials had been
available far in advance of the Fair's opening day, the telephone
information service would likely have been the backbone of the
marketing and information program.
However, the telephone information service is extremely expensiveand possibly the least cost-effective system of disseminating
information where other options are available. Additional lead
time to develop other aspects of the information program might have
reduced the number of calls which needed to be handled by the phone
service.
189
FUNDING FOR EXPANDED K-TRANS SERVICES
Costs of operating the K-TRANS system increased due to increasedservices associated with the 1982 World's Fair. The largest andmost significant increase in costs occurred during the three monthspreceding the World's Fair when K-TRANS was incurring costs asso-ciated with preparation for the Fair, but before revenues offsetthe expenditures.
Total operating expenses for K-TRANS were under $4.16 million in
fiscal year 1981 (July 1980 - June 1981). For fiscal year 1982(July 1981 -June 1982), costs had increased to $4.85 million, an
increase of 16.6%. FY 1982 contained expenses associated withpreparation for the Fair along with two months of operation of theexpanded regular route system.
Total operating revenues increased from $1.89 million in FY 1981 to
$2.42 million in FY 1982. This represents an increase of 28%.
Revenues also reflect the increased regular route service as well
as receipts from operation of contract parking lot shuttle service.
Expenses for the period of time beginning July 1, 1982 and con-tinuing through June 30, 1983 are not final as of this time.
K-TRANS projects expenditures to increase to just under $5.5million. Operating revenues are projected to decline slightly to
$2.33 million. This primarily represents the end of profitableshuttle contracts in July and August of 1982. The K-TRANSoperating deficit increased substantially because shuttle servicewas providing some cross subsidy to the regular route system.
The operating loss increased from $2.27 million in FY 1981 (July
1, 1981 -June 30, 1982) to $2.43 million in FY 1982. Projectionsby K-TRANS are that the operating deficit will further increase in
FY 1983 to about $3.43 million. Figures do not include non-
operating income however, this contribution is minimal.
The City of Knoxville's contribution from the General Fund towardoperating purposes remained stable at $910,000, as it has since FY
1979. Other contributions toward the operating loss includereceipts to the City of Knoxville from the collection of a statefuel tax in the amount of $150,000. The State of Tennessee has
also contributed between $65,000 and $74,000 each year. K-TRANSconstructed its local contribution to maximize UMTA assistance.
K-TRANS anticipated that service expansions would be necessary forthe Fair and that secure and committed funding would be essential.UMTA's Atlanta regional office staff discovered a substantialsurplus in allocations to the State of Tennessee for support to
190
transit systems in cities of under 200,000 population. Thissurplus occurred because allocations had been made to two Tennesseecities which did not have transit systems. UMTA and TD0T thenreviewed the possibilities of "re-allocating" apportionments toKnoxvi lie.
Knoxville had been classified as a city of under 200,000 in the1970 census. By 1980, growth here as in other "sunbelt" states hadbrought the Knoxville urbanized area to well above this level. TheUrban Mass Transportation Act permitted a "re-allocation" fromcities of under 200,000 to cities which had just gone over thatmark in the 1980 census. The Governor of Tennessee acted to makethe "re-allocation" and $1.5 million was transferred into Knoxville's"account"
.
The 1.5 million dollars extra allocation enabled K-TRANS to initiatea number of improvements which would have been otherwise impossible.Additionally, it provided K-TRANS management with the flexibilityneeded to develop a broad variety of services.
Probably the most important long term aspect of the additionalfunding was that of giving K-TRANS the opportunity to develop a
larger patronage base which will be needed to sustain transitoperations and revenues in future years.
LABOR
Incidental to opening of the World's Fair was the expiration of the
labor agreement between K-TRANS and its employees who are repre-
sented by Local 1164 of the Amalgamated Transit Union. An older 30
month agreement expired on December 31, 1981 and both K-TRANS and
Union representatives began negotiations for another two-yearagreement well in advance of the expiration date.
The subsequent agreement represented a continuation of pastpractices on wages and benefits. Benefit improvements in the area
of major medical and dental insurance coverage, and in the pensionplan, met with mutual agreement. More unusual issues related to
job security and the World's Fair.
Job security was less of a formal issue than an indirect one.
Discussions of service reductions during the summer and autumn of
1981 were clearly an influence in the Union's negotiations. The
Union expressed two general points. First, they sought preferenceon any new work for existing employees as well as preference when
overtime work was available. Second, the Union was interested in
assurances that existing employees would not be replaced at the
conclusion of the Fair with newly hired employees.
191

K-TRANS management favored giving existing employees the firstopportunity for new work and overtime in accord with existingseniority practices. Thus, negotiations focused more on techni-cal aspects of the contract than on resolving major, substantivedisagreements. Permanent job security was more difficult to
address since K-TRANS (the Knoxville Transit Division of AmericanTransit Corporation) contracts with the City to operate themunicipal bus service.
Contract negotiations were notable in their lack of controversy andattention to technical details. Due to bi-lateral schedule con-flicts, negotiations could not be concluded prior to December 31,
1981. Both parties agreed to an extension of the existing contractuntil a new one could be concluded. A severe winter storm furtherhampered negotiations. Nonetheless, they were successfully con-
cluded on January 20, 1982. The solution to the employment ofstaff for the duration of the Fair was accomplished through a "sideletter" agreement. The key issues resolved through this "sideletter" were:
(1) Employees would be considered as "temporary" and not
"Part-time" for the period immediately preceding theFair and during the Fair.
(2) The integrity of the bargaining unit would be maintainedduring the Fair.
(3) Existing seniority practices would be recognized in the
assignment of overtime, work schedules, etc.
(4) An unlimited number of temporary employees could be hired
in all job classifications.
(5) A pay rate equal to 65% of top wages in a classificationwould be paid to "temporary" employees.
OTHER K-TRANS SERVICES
Charters
K-TRANS has always been available to provide charter service for
groups and events in and around Knoxville. Groups chartered K-
TRANS buses to provide transportation to the Fair site from motels.
Conventions used K-TRANS charters to get to the Fair site and
around town. K-TRANS' revenue from charters rose dramatically in
the months during the World's Fair.
During May through October of 1981, revenues to K-TRANS fromcharters totaled $20,600 for the six-month period, or approximately
$3,400 per month. In the six months immediately preceding the
World's Fair, the revenue that accrued to K-TRANS from charters
192
1
totaled $37,600, or an average of about $6,300 per month. Duringthe six month duration of the Fair, charters totaled $65,500, or anaverage of about $10,900 per month. Revenues to K-TRANS fromcharters increased 74% during the Fair over the preceding period.Revenues to K-TRANS from charters increased 74% during the Fairover the preceding six month period and 218% during the Fair overthe corresponding six month period in 1981.
Shuttles for Special Events
Some special events which involved K-TRANS were the "Star SpangledSpectacular", a giant fireworks show in Neyland Stadium and a
National Football League Exhibition Game, also played in NeylandStadium. The regular University of Tennessee football season alsostarted while the Fair was in progress.
The "Star Spangled Spectacular", the professional football game,and the first two games of the UT football season were all held atnight. Major conflicts occurred when exhibits at the Fair closedat approximately the same time as these events ended at the stadium,usually about 10:00 P.M. Major traffic problems occurred on
Cumberland Avenue, which was used by cars coming from the downtownparking areas, campus parking. Fort Sanders area parking, K-TRANSshuttle and charter buses, and private charter buses. Trafficincreased by approximately 33 percent during the Fair on thisroute.
Traffic problems created by daytime special events such as UT
football games in October were not as extensive as those during the
evening. One reason was that large amounts of Fair traffic did not
occur during the day. Fair activities were still in progress while
traffic from football games was filling the streets during the
early evening hours. Thus, the traffic load on both city streets
and major highways was staggered.
Other major traffic problems occurred near the parking areas in
which K-TRANS operated shuttle parking service for special events.
Outside Maintenance
K-TRANS has a policy of performing maintenance functions, for a
fee, for equipment that is owned and operated by other passenger
carriers. Bus parts are also sold in emergency situations. Most
of the tour buses and independent carriers serving the 1982 World's
Fair were without maintenance facilities in Knoxville and the K-
TRANS maintenance facility was called upon to provide services
ranging from bus washing to engine repair and supply of emergency
parts.
193

In the six months immediately preceding the World's Fair, the total
revenue that accrued to K-TRANS from performance of outside main-tenance totaled $1,250.85, or an average of about $210 per month.During the six-month duration of the Fair, outside maintenancerevenue totaled about $2,900, or about $500 per month. Revenues to
K-TRANS from outside maintenance sales increased 35% during theFair over the preceding six-month period. Access to maintenancefacilities in the Knoxville area was important to outside carriersduring the World's Fair.
The LIFT
The LIFT staff was not equipped to handle tourist transportation in
addition to their regular passengers. In the spring of 1982, TheLIFT had 4 vehicles, operated 12 hours per day, 5 days per week,and carried an average of 72 passengers per day. This figure wasup from 62 passengers per day in the previous six-month period.Therefore, the decision was made to prioritize trip destinations by
servicing trips to medical facilities first followed by trips to
educational institutions, employment, and social service agencies,and then shopping and recreational trips. Of the 10,572 trips madebetween January, 1981, and November, 1982, only 44 trips were to
other than medical, educational or employment destinations. Thispolicy essentially excluded trips to the World's Fair from The LIFTprogram's service area.
It is recommended that paratransit needs be considered when plan-ning for an event on the scale of the 1982 World's Fair. Local
transit providers should be consulted regarding their paratransitcapacity and their ability to service requests from special travel
groups. It is suggested that a coach equipped with a lift and
wheelchair lockdowns, perhaps providing space for two ambulatorypassengers, would serve the needs of special tour groups attendingsuch events.
194
Chapter Ten:
SELECTED BUSINESS EXPERIENCES
A variety of transportation operations were initiated to serve visitorsto the Fair. A series of interviews were conducted to help determinewhy they decided to provide service, what they expected, and whatactually occurred. Services covered range from those which were neverstarted, those which were terminated early, and these which operatedthe duration of the Fair. Some of the operators interviewed weremore successful than others. Conclusions are drawn from these in-
vestigations and suggestions offered for future special events.
PARKING LOT OPERATIONS
The primary motivation for most of these who entered the parking lot
business during the Fair was to make a profit. However, other reasonsprompted some operators, such as a Fair area businessman who fearedtraffic congestion would adversely affect his business. He trans-
formed part of his property to parking in an effort to make up for
the anticipated revenue losses.
Preparations
The acquisition, grading, and graveling of land for temporary parking
lots was the largest part of preparations according to operatorsinterviewed. Other items included providing lighting on the lots and
insurance. Specifications for these preparations were listed in the
City design standards for temporary parking lots.
Because of the minimum lot size requirement in the temporary parking
lot ordinance, parcels too small to be developed individually were,
in several cases, acquired and developed as a larger unit. Most
operators attempted to develop as much land for parking as possible
to increase their potential revenue. Negotiations were sometimes
difficult because landowners felt their land was valuable due to
the presence of the World's Fair. The key one operator claimed was
to acquire one large tract of land and tack on smaller parcels.
Several types of deals were arranged to acquire the land. While
most parcels were rented, some landowners received a cut based on
the total number of cars parked. The amount of rent for the land
differed, but one operator paid $1000 per month for about one- tenth
of an acre of vacant land. Another operator paid $50,000 during the
Fair to rent a five acre parcel. Costs varied dramatically depending
on proximity to the Fair and the relationship of the property to
other land in assembling an adequately large tract.
195

Thus, there were various approaches by individual operators to pre-paring their temporary parking lots. Costs of preparations tendedto be variable depending on the location of the land and how muchclearing it needed. One operator even had to fence off an existingpark on the land he acquired and restore it after the Fair.
Land preparation costs varied significantly depending on site-specificconditions. As examples, one five acre lot reportedly cost $50,000for grading and graveling. Another lot had $30,000 in grading andgraveling costs for one acre, plus $2,000 to rent lights, installfencing and acquire permits and insurance. Overall, grading andgraveling were the major expenditures in preparations next toacquisition of land.
Insurance was felt to be very costly by several operators interviewed.It cost one operator $3,000 per lot during the Fair for insurance.Alternative approaches were suggested such as some type of grouppolicy for all "official" lots. This would have been difficult toacquire, however, since all were operated as separate businesses.
Operati ons
While most of the parking lot operators interviewed managed their ownlots, one hired a management firm. He did not have prior experiencein the parking lot business and felt he would be getting in over his
head. The management firm provided paving at entrances and exits,lot attendants, lot attendant booths, signs, insurance, and counters.The management firm collected the money and the parkinq lot operatorwas paid on a sliding scale. The owner received 50% of the monthlyrevenues. If the total net revenue at the end of the Fair exceededa certain level, the owner received an additional 17%, or 75% oftotal revenue. If the total net revenue exceeded a higher level,the owner received an additional 15%, or 90% of total revenue. Themanagement firm also provided the owner with a certified statementof revenue on the 15th of every month and a certified statementof the number of cars parked in the lot every day.
The number of lot attendants varied among the operators interviewedbecause it depended on such factors as the flow of traffic, whethercars were being charged as they came in or left, and where entrancesand exits were located. One of those interviewed had 12 attendantsin an average week for approximately 600 parking spaces. Anotheroperator had four or five lot attendants present for approximately200 parking spaces during very busy times.
196
The lot attendants were hired from various places. One operatorwent through the Fair personnel office and the Council on Aaingto employ lot attendants. According to one operator, the lotattendants made approximately $5 an hour, which was minimum wageplus fringe benefits. Another paid $20-$30,000 in personnel costduring the Fair. The shifts varied during the Fair according toparking demand at particular lots. As an example, one lot had an8:30 a.m. to 5:00 p.m. shift and a 5:00 p.m. to 1:00 a.m. shift7 days a week.
Whose interviewed stressed the importance of employing lot attend-ants who would work the duration of the Fair. Attendants at onelot were paid a bonus of 10% of their gross wages if they workedfrom the first day of the Fair to the last day without unscheduledi nterrupti on.
Money handling was an important element of parking lot management.Operators felt it was important to make mid-day deposits to deterrobbery as large sums were accumulated. At least one lot report-edly had no set schedule for money collection so it would be diffi-cult to stake out the lot and determine what times to rob it.
The fee charged by these operators varied throughout the Fair, exceptfor operators of KIEE "official" lots. The average fee charged bythe operators interviewed was approximately $6 per day, the sameas the KIEE fee.
The fees varied during the day, with higher fees charged in the morn-ing and lower fees in the evening. The fees ranged between $3 and
$10 per day and were based on what other nearby lots were charging.
Some operators would simply walk outside and look across the streetto see what other lots were charging. Others would get in theircar and drive around to see what other lots were charging.
While certain elements of the business (e.g. lot attendants) werecommon to all operators interviewed, other elements varied. For
example, the lots did not all charge the same fee nor did they all
provide shuttle bus service.
Results
Approximately half the spaces in the lots of operators interviewedwere occupied on an average day. All of the lots operated for the
duration of the Fair and ranged in size from 50 to 400 spaces. There
were some lots that achieved higher occupancies, such as one with
200 spaces which had 160 cars on an average day and some that
achieved lower occupanices, such as one with 200 spaces which parked
50 cars on an average day.
197
Transportation cost were the major component of one "official" lotoperator's expenses, totaling $90,000 during the course of the Fair.
The termination of the KIEE contract with K-TRANS and TEI for shuttlebus service forced operators of official parking lots to contractprivately for shuttle bus service. This had the effect of increasingthe cost to the operator from $1.40 per car parked per day to $2.25.One operator stated if he had it to do all over again, he would havenegotiated differently and insisted on a no termination contract as
opposed to the ten day termination provision in the KIEE contract.
While none of the operators interviewed claimed to have lost money,none felt their financial outcome met their expectations. One operator,stated he made a 3.9% profit on gross revenue. Parking is considereda service industry for which 10% is a reasonable profit.
Concl usions
Visibility Visibility was very important and one operator suggestedtall signs visible from the interstates and other major access routeswould help attract business. Vistors were unfamiliar with the areaand did not know where parking was located.
Ironically one operator said he lost business to lots further awayfrom the Fair site. There were several parking lots located alongthe same approach to his lot. In his experience, people would parkin these lots, unaware that they could continue down the road and
park closer to the Fair.
Flagmen also provided visibility for parking lots. However, manyoperators complained the flagman obstructed the flow of traffic bystanding in the streets trying to persuade drivers to park in the
lot. Also, other gimmicks such as a Laurel and Hardy promotionalroutine obstructed the flow of traffic by distracting drivers.
Location Open areas were believed to be more attractive by severaloperators than buildings or other structures. One parking lot waslocated in an old warehouse and the operator felt it detracted frombusiness. The warehouse was enclosed and not aesthetically appealing.
Surrounding land uses were an important factor in the success ofparking lots. One operator who had a lot near the downtown areasaid it was located in a bad area of town which discouraged peoplefrom parking there. The operator of a lot located in an old ware-house district felt people were not compelled to park in such an
area. On the other hand, one operator who leased a church parkinglot felt the surrounding land uses were an asset. He believed the
location of the parking lot on church property and in a low crimearea made people feel safe about parking their car in the lot.
198
Most operators were willing to speculate that their location would beone of the successful ones.
Access . Access was important, both in the distance of a parking lotfrom a Fair gate and in the quality of the roads which led to it. Oneoperator attributed the success of his lot to the fact that it was theclosest parking area to one of the qates. Another operator who had a
lot close to downtown, but not on a major artery, thought the inaccessiblenature of his lot made it fare poorly.
While the quality of a road a parking lot is located on or near is
important, the traffic flow on the road must be considered. It wasanticipated that lots located in South Knoxville would attract trafficcoming to the Fair from Gatlinburg. Instead, most of that traffictraveled other routes to reach the Fair.
Traffic congestion was not a major problem for any of the operatorsinterviewed. It was suggested by one operator that providing a sheetof paper or postcard to drivers with directions out of the parkinglot to major access routes would reduce congestion even further.
"Official" vs Unofficial lots.
There were good and bad points concerning "official" lots according to
operators interviewed. On the positive side, "official" parking lotswere seen as a type of "good-will center" where people could go forinformation and assistance. Visitors knew "official" lots werelegitimate and connected with Fair operations.
On the negative side, there was some animosity between operators of
"official" and unofficial parking lots. An operator of an "official"lot felt operators of unofficial lots would not put up adequate signingsince nearby "official" lots were well signed and attracted trafficto the area. Also unofficial lots near "official" lots could competeunfairly by lowering their price below the $6 "official" parking fee.
On the other hand, an operator of an unofficial lot felt operators of
"official" lots were given preferential treatment. He said they werenot inspected very closely for conformance to temporary parking lot
specifications. One "official" parking lot was cited by an operatoras having a steeper grade than allowed for temporary parking lots
and a driveway which was not in conformance with regulations.
Other
Although not directly related to parking lot operations, one problem
cited by nearly every parking lot operator interviewed was people
leaving pets in their cars. One operator even kept dogs in his air-
conditioned office. In a few cases the humane officer was called.
At future events it is suggested that people be forewarned not to
leave their pets in cars and kennels or directions to nearby animal
shelters should be provided.
199

SHUTTLE BUS SERVICE
Specific perceptions of demand for shuttle service led various operatorsto pursue different markets or approaches. Some operators attemptedto provide service for Fair vistors staying in and around nearbycommunities, while others concentrated on lodgings along major accessroutes or parking areas.
Preparations
Most of the bus operators interviewed were already in the transportationbusiness and, thus, had vehicles, drivers, and maintenance facilitiesavailable. Their committment in terms of money, labor, facilities andequipment was limited.
The number of buses owned by these operators ranged from 3 to 44 buses.However, these were not necessarily the number of buses which ran everyday. The buses had an average seating capacity of 40 passengers.
One operator who did not already own shuttle buses purchased used heavy-duty buses and refurbished them. This included painting, putting in
new upholstry, and installing air conditioning.
Preparations were not a major component of providing shuttle bus servicefor the operators interviewed since most were already in the transportationbusiness. This reduced their investment and, hence, their risk in
providing service.
Operations
Provision of frequent service was a goal of most of the shuttle operatorsinterviewed. One operator ran buses every 30 minutes and another ran
every two hours.
However, demand for transportation to the Fair was not consistent through-out the day. This was reflected in one operating schedule which consistedof several morning runs for the opening of the Fair, a lunch run, an
early evening run, and a late evening run when the Fair closed.
While some operators covered a large area in an attempt to maximizethe number of places they served, other operators serviced only a few
places with a large concentrations of Fair visitors. For example, oneoperator interviewed had agreements with 50 campgrounds, hotels, and
motels whereas another had agreements with only six campgrounds, hotels,and motels. The rationale for serving as many places as possiblewas that the potential number of riders was increased. The rationalefor serving a few large areas was that it provided an established areawhere a group of potential riders was assured.
200
Another aspect of serving only a few large areas was that it allowedthe operator to estimate ridership. Operators who served many areascould not really know how many riders they would carry each day.Operators who served only a few areas could accurately project thenumber of riders based on the number registered at the motel or camp-ground.
The price of round trip tickets ranged from $4 to $10. The averageticket price was $5 for an average trip length of 15 to 20 miles oneway. Children under 12 usually rode free or at a reduced cost. Oneoperator charged two dollars more to ride in the air conditionedbuses. Some of the hotels, motels, and campgrounds sold tickets totheir patrons for shuttle bus service.
Advertising was not actively pursued by the operators interviewed. Thecampgrounds, hotels and motels advertised the shuttle bus service byselling tickets and some operators put up posters. Tickets for oneoperator were also sold at a World's Fair Information Center (notoperated by KIEE).
Results . Demand for shuttle bus service remained stable for the firstthree months of the Fair and then declined, according to operatorsinterviewed. One operator ran two runs per day and ceased operatingat the beginning of July. He originally ran two buses each run. Whenthe occupancy decreased to ten passengers on each bus in June, he used
two buses to bring people to a central point and then only one bus
would make the trip to and from the Fair. Another operator whooriginally had 25 buses was only running three buses by August. Anotherwho had 44 buses available consistently ran only 11 of the buses.
Parking lot operators near the Fair site who began reducing theirprices were blamed by one operator for the decline. When people saw
the low parking prices they quit riding shuttle buses.
Operators observed that the days at the beginning of the week were the
highest demand days. As the week progressed, patronage steadilydecreased and the weekends were the lowest demand days. Holidays were
also low volume days for the shuttle bus business. It was speculated
this was because they served mostly out-of-town visitors who avoided
the Fair on weekends and holidays for fear of large crowds.
Operational procedures differed among those interviewed. Hours of
operation as well as the number of places served varied. These
differences had effects on the financial outcomes of the shuttle
businesses.
201
Concl usions
The shuttle bus operators interviewed all thought there was an over-supply of shuttle bus service. They also felt the Public ServiceCommission moved too slow in approving applications. The time elementforced many operators to go ahead and commit resources before officialverification that they would be granted operating authority. It wassuggested that applications at future special events be approved earlyenough to allow for adequate lead time.
Many operators emphasized the importance of knowledge concerningattendance projections, mode split, and the number of reservationsat campgrounds, hotels, and motels. This information is vital to
determine ridership levels and the number of shuttle buses needed.
The more successful operators were those which served only a few placesthat accommodated large groups of people rather than trying to serveas many places as possible. Also the more successful operators werethose that concentrated on serving areas near interstates and othermajor access routes. Since out-of-town people were unfamiliar withthe area, they would stay at lodgings near these routes.
Experience was another critical factor in success. The more successfuloperators were those that were already in the transportation business.Many of them suggested that other people at future special events shouldnot consider providing shuttle bus service unless they knew the business.
In addition, the more successful operators expanded their existingfleet by only a small number of buses. The advice given by operatorsfor future special events was to utilize what you already have andexpand as needed. Those with no existing fleet were advised to startwith only one or two buses.
TAXI SERVICE
Taxi service did not emerge as a major component of transportationservices during the Fair. There was an overabundance of taxi operatorsand limited demand. Operators claimed they suffered from a lack of
visible cab stand space close to the Fair gates, despite the fact thatspace existed near each gate.
There were two types of increases in taxi service offered at the
beginning of the Fair. One type of increase was the entry of existingout-of-town and new taxi operators into the local market. One suchoperator interviewed had a fleet of 55 cabs.
The other type of increase was the expansion of existing fleets by local
taxi operators. One local taxi operator interviewed increased his fleetfrom 20 to 30 cabs and another operator increased his fleet from 14 to
114 cabs.
202
Demand
The taxi operators interviewed attributed the excess supply of taxisto overly optomistic projections of 500 to 600 taxis needed during theFair. Instead, there was only enough demand for about 100 taxis.Competition from shuttle buses and the expanded local transit servicealso decreased taxicab patronage.
Demand for taxi service was directly related to the daily attendancefigures at the Fair. High attendance days were high volume days fortaxi companies. One taxi operator reported a 25 percent increase inservice at the beginning of the Fair, with July and August being slowmonths.
Most of the taxi operators interviewed reduced the number of cabs in theirfleets within the first few months of the Fair. One operator decreasedhis fleet by 50 percent after the first 30 days of the Fair. Anotheroperator had only half the original number of cabs by the last twomonths of the Fair.
Fares
The maximum metered price for taxis set by the City is $1.25 meterdrop charge and 10<£ for every 10th of a mile. While most taxi operatorscharged this rate, one operator charged 50<t per mile. Some operatorscharged less than the maximum metered price for outlying areas eightor ten miles from the Fair site. Another operator sold round triptickets.
While there were some complaints by customers of being overcharged, the
City Taxicab Inspector said he received very few complaints. Overchargingand fare competition were not perceived as problems by taxi operatorsi ntervi ewed.
Cab Stands
The location and number of cab stands close to gates was another problem.The taxi operators interviewed felt the stands should have been locatedcloser to the gates and that access lanes for taxis should have beenprovided directly to the gates.
The South Gate was particularly important to one taxi operator. It
was the gate closest to the amusement area, which stayed open until
midnight. There was no cab stand space provided by the City in the
immediate area of this gate. Therefore, a taxi operator leased enoughprivate property from a railroad for ten to twelve cab spaces alongNeyland Drive.
203

Marketi nq
There was very little marketing conducted by taxi operators. Oneoperator tried unsuccessfully to sponsor tours to Gatlinburg. Heconcluded that tours of nearby areas were unproductive because peoplewere only interested in going to the Fair.
Conclusions
The successful taxi operators seemed to be those which increasedtheir fleet by only a few cabs. Most of the successful operatorsalso concentrated on serving their regular customers, supplementingthat business with Fair service when possible. This seems to be
reflected by the statements of many operators that they would usefewer vehicles if they had it to do over.
Access to gates and corresponding cab stand space was very importantto taxis. Many operators interviewed felt there had been inadequateplanning for taxi service at the Fair. They suggested access lanesat the gates should be considered for future special events.
TRANSPORTATION SERVICES TERMINATED EARLY
There were several transportation services which were terminated priorto the end of the Fair. This was mostly due to lack of demand orexcessive costs involved with the business. Examples of two suchservices are helicopter and ferry boat service.
Helicopter Service. A few individuals attempted to offer helicopterservice for sightseeing tours and commuters. Significant demand forservice never materialized due to the high cost of the trip. This typeof transportation was also considered noisy, obtrusive, and unsafeleading KIEE management to arrange for a restricted airspace zone to
be established around the Fair site, (see also: Phase I Report,
pp. 147-48).
Ferry Boat Service. Ferry boat service, including service to someparking lots, transportation to and from the Fair, and tours did
not do well at the Fair. It was difficult to fill the large passengercapacity of the vessels. Also, the cost of the service was moreexpensive than other types of transportation and took longer to travelthe same distance. Even the best of the ferry services were not ableto offer the low cost or speed of other transportation services.
TRANSPORTATION SERVICES NEVER IMPLEMENTED
There were several transportation services never implemented. Horse-
drawn carriages and a monorail system are two examples. Their inclusionhere is intended to relate the reasons why certian transportationservices never operated. They are important for planners of futurespecial events to take into consideration when planning transportationservices.
204

Horse Drawn Carriages
There were three proposals for horse drawn carriage service around theWorld's Fair site. One of these involved operating three carriages, eachof which seats four passengers in addition to the driver. The carriageswould have brakes installed due to the hilly terrain of Knoxville and be
pulled by Belgian draft horses.
The three companies proposing service submitted applications for authorityto operate. Confusion resulted from the fact that there was no agencyspecifically responsible for this type of transportation. The applicationswere sent to the City Division of Public Transportation Services, althoughthis Division is usually only responsible for motorized vehicles. All
three applications were denied on the recommendation of the City PoliceDepartment and City Engineering Department.
There were several reasons for denial of the applications. It wasbelieved intolerable traffic congestion in downtown Knoxville would resultfrom the horse drawn carriages. The proposals claimed the carriages wouldtravel at 12 to 16 M.P.H. over four to five blocks on an average day.
One operator stated the carriages could travel faster than this on and
around the University of Tennessee campus.
In addition, the carriages would travel over several steep and narrow
streets. As a result the carriages would be traveling slower than normal
to climb the upgrade and narrowness of the streets would prohibit
vehicular traffic from maneuvering around the carriages.
There was also the problem of the horse manure nuisance. In response
to this, the carriages were to be equipped with diapers to catch the
horse droppings.
All three companies appealed the denial to the Knoxville Transportation
Authority (KTA). At the appeal, the City stated it would not oppose
the licensing if the following three conditions were met: (1) the
nature of the ride would be for amusement and not public conveyance,
(2) the area of operation would need to be defined and this area
should be completely outside the Central Business District and (3)
the applicants must show that the animals will be treated in a
humane fashion and that traffic would not be hindered.
The Police Department stated the horse-drawn carriages were incompatible
with the objective of the Fair traffic plans, which was to move traffic
as fast and efficiently as possible. The proposed carriage routes were
the same ones intended for major traffic movement. This posed the
additional problem of passenger safety in boarding and on the road.
The KTA substained the DPTS denial of the applications for operating
authori ty.
205

A similar type of service operated in Cincinnati, Ohio and provides an
example of the impacts of such a service. The regulations pertainingto the service were that it operate only on specified routes between6 p.m. and 10 p.m. , load and unload only at designated points, andprovide sanitation.
The advantages of the service were that it had good public acceptanceand increased shopper traffic. The problems associated with itincluded proper lighting of the carriages (both front and rear),frightened horses (horn blowing, etc.), observance of boarding pointsand traffic having to change lanes to pass.
Monorai
1
There was a proposal to relocate a monorail system from Love Field in
Dallas, Texas to Knoxville, Tennessee. The sponser proposed that themonorail be relocated as a permanent transit system to operate betweenthe Coliseum and University of Tennessee, with intermediate stops in
downtown and the Fair site. After studying the proposal, it wasdetermined it would not be feasible or desirable to relocate the
monorail to Knoxville.
Among the reasons for this were the inability to cover capital, operating,and management costs with system revenues during or after the Fair. Thesponser proposed no detailed performance schedule and the system couldonly provide one-half of the capacity required for Knoxville. Therelocation required the system to be refurbished and expanded and a
new control system to be developed. The City also required a per-formance bond and it was questionable whether such bonding couldbe obtained.*
While some transportation services may appear desirable for theirspeed or aesthetic appeal, these factors have to be weighed againstother considerations such as the cost or the effects on traffic flow.
CONCLUSIONS
The more successful operators interviewed were those who only startedon a small scale or expanded their service only slightly. Theseoperators were able to utilize all of their equipment efficiently and
did not have a large investment in the service. Also the more successful
operators were those with prior transportation experience.
Several operators stated demand for services fluctuated. It vairedaccording to season, day of week, and time of day.
* U.S. Department of Transportation, UMTA, Assessment of the Titan/PRT Proposal to Knoxville, Tennessee , prepared for House Subcommitteon Transportation Committee on Appropriations, August 15, 1980.
206

Fees for services among the operators interviewed varied. Parkingprices were especially competitive. It is difficult to determinethe appropriate charge since costs for providing service differedamong operators.
Transportation services are inter-related. Changes in operation in
one service affected the other services.
Access and location were determining factors in the success of mostparking operators interviewed. Since many visitors were unfamiliarwith the area, they went to the most visible parking lot or the closetlodging with shuttle bus service.
207
Chapter Eleven:
REGULATIONS AND AGREEMENTS
There were many City Ordinances, agreements, and other regula-tions which affected transportation related services supportingthe 1982 World's Fair. They outlined procedures to be followedand/or specified the type of service provided. This chapterdiscusses the provisions in some of these regulations and agree-ments and how effective they were in regulating service.
ORDINANCES
Several City Ordinances had impacts on Fair-related services.Some of the ordinances pertained to transportation servicesexisting prior to the Fair and others were created specificallyto address services proposed for the Fair.
Existing Ordinances
City Taxi Ordinance . Taxi service was one component of the
transportation services offered during the Fair. The City
Division of Public Transportation Services is responsible for
granting Certificates of Public Convenience and Necessity to
taxicab operators.
According to the City Taxicab Ordinance No. 0-99-81, applicantsmust pay a fee of $100 per car for the certificate and registra-tion stickers to be affixed on each vehicle used. They must
also file a return with the Business Tax Office for the minimum
gross receipt tax. There is also a $15 per vehicle maintenance
inspection fee.
Each taxicab must display a chart of meter rates published by
the Division of Public Transportation Services. However, charges
by the hour for tours are negotiable between the taxicab company
and the driver/passengers. Ridesharing is also allowed and a
passenger is not required to pay an additional charge if the
taxicab deviates from its intended destination to pick up a
subsequent passenger.
While most of the provisions of the Ordinance were adhered to
by taxicab operators during the Fair, there were some complaints
by passengers that they were overcharged. However, the City
Taxicab Inspector did not perceive the number of complaints
filed to be in an excessive amount.
209
There was also discussion that the City Division of Public Trans-portation Services should have limited the number of certificatesit granted to taxicab operators. The Director of the Divisionfelt this was not within the scope of the responsibilities of theDivision and the City Taxicab Ordinance contained no provisionsrelating to limiting the number of certificates issued.
City Shuttle Bus Ordinance . The City Shuttle Bus Ordinance No.
0-46-82 provides for the issuance of Certificates of Convenienceand Necessity by the City Division of Public TransportationServices for the operation of shuttle buses. Shuttle service is
defined as "service provided by a self-propelled motor vehicle...picking up groups of passengers at one or more points of origin,with a common purpose and common point of destination, andreturn to the same point or points of origin..." The City has
jurisdiction over shuttle bus service operating within a sevenmile radius of the City limits.
Some of the criteria in determining whether to approve an appli-cant include services being furnished by other carrier or carriersin the territory, type of service to be provided by the applicant,the financial condition and character of the applicant, the publicdemand and need for the proposed service, what, if any, permissionthe applicant has to pick up and discharge passengers on privateproperty, and the effect the proposed service will have on othertransportation services.
The Certificate of Public Convenience and Necessity specifies
the exact terms of the grant, points of origin and destination,
and the amount of insurance coverage. The applicant must pay a
$200 registration fee per vehicle used and a shuttle registration
sticker is affixed to the bumper of each vehicle.
The applicant must have insurance limits of at least the minimumextent required by the State of Tennessee for common carriersand each shuttle vehicle must be inspected.
Fair Related Ordinances
Temporary Parking Lot Ordinance . The City Zoning Ordinance wasamended in September 1981 by adding Section 18 to Article V
(Ordinance No. 0-223-81) to allow for the development of
temporary parking lots. It stated specifications for the
development of temporary parking lots to ensure they metminimum standards. The temporary parking lots were definedas "a facility used for off-street parking in accordance withthe terms of this ordinance which shall cease to be used forparking on or before November 30, 1982."
210

The enabling clause stated the zoning districts in which landcould be converted into temporary parking lots. Applicationswere submitted to the Division of Engineering with a $500 non-refundable fee. The Director of the Division approved ordenied applications.
Factors to be considered in approving the applications included:
(1) Impact on traffic congestion and other development inthe area.
(2) The need for the lot at the site under consideration.
(3) The drainage plan and reclamation plan offered byappl icant.
(4) Standards set forth by the Knox County HealthDepartment.
(5) Impact upon adjacent residential properties, eventhough subject property is within an acceptablezoning district.
(6) Displacement of valuable housing stock.
(7) Such other factors relating to the health, safety andwelfare of the City as in the Director's opinion arein the public's interest.
There were minimum lot requirements that included the lot be
no less that 15,000 square feet and, if the parking lot wasoutside a two mile radius of the intersection of Henley Streetand Clinch Avenue, it had to be within 500 feet of a transitroute or else the operator had to make arrangements for somekind of public transportation. Overnight parking was prohibitedon temporary parking lots.
The applicant was required to submit a performance bond to ensurethat the land was reclaimed after the Fair. There was much concernthat the temporary parking lots would negatively impact neighbor-hoods or the lots would be used for commercial uses in nonconformingareas. The original intent of the term reclamation was to have
the lots returned to their use and appearance before the Fair.
However, since many of these lots were formerly junkyards or other
unsightly areas they have been termed reclaimed even though they
were not restored after the Fair. In most instances the gravel
lots look better than what existed before the Fair.
211

Another issue concerning the reclamation bond is that the CityCouncil envisioned the temporary parking lots being developedin rural areas and reclamation consisting of returning the lotsto grassy fields. However, it turned out the temporary parkinglots were located in industrial and commercial areas withreclamation having a different meaning.
Strict enforcement of the reclamation bonds has not occurred.Even though many of the temporary parking lots remain, this is
an improvement over how they looked before the Fair. Also, mostof these property owners have stated they have not decided whatthey are going to use the land for and need more time before thereclamation bonds are enforced. There is very little pressurefor enforcement because there have been no complaint calls aboutthe temporary parking lots.
City Temporary Campground Ordinance . The City Zoning Ordinancewas amended on December 8, 1981 by adding Section 19 to Article V
(Ordinance No. 0-271-81) to allow for the provision of temporarycampground facilities. It stated specifications for the develop-ment of temporary campgrounds to ensure they met minimum standards.These were defined as "an organized camp in which provisions aremade for the accommodation of travel trailers, truck coaches orcampers, tent campers, tents and vehicles in accordance with theterms of this ordinance and which shall not begin operation beforeApril 1, 1982 and shall cease operation on or before November 30,1982."
According to the Ordinance, the campground must be located on a
tract of land two acres or larger in size and can be located in
a Planned Residential, Commercial, Office or Industrial Use
District with a few exceptions.
The Plans Review Office of the City Community and EconomicDevelopment Department reviewed the applications which had to
include a survey or plan of the proposed Temporary Travel TrailerCampsite and a reclamation proposal. Within 48 hours of filingof the survey or plan, notices were required to be posted at the
proposed campsite containing the name of the developer, a
general description of its intended use, and the proposed durationof its use. This informed surrounding property owners of the
intended use and objections could be filed with the Plans Review
Office.
The applicants were required to meet all applicable codes,
regulations, and standards governing building, electrical,plumbing, mechanical, and health and safety matters. Each appli-cant paid a $500 non-refundable fee for review of the survey or
plan and issuance of permits.
212

Performance bonds were required to ensure reclamation of theland after the Fair. The amount of the bond was determined bythe Director of Engineering.
The applicants were permitted to have one office building at thecampsite. Additional structures were allowed if they wereincluded in the approved plan.
PUBLIC SERVICE COMMISSION
All shuttle buses which operated during the Fair outside a sevenmile radius of the City limits were required to apply to the
Tennessee Public Service Commission for operating authority. Theapplicant had to pay a $50 application fee and submit a detailedroute description and financial statement of assets and liabili-ties. They also were required to list the equipment they woulduse and whether it was to be leased or owned as well as a tableof the fares they would charge, a time schedule of service, and
proof of insurance liability.
After the application was filed, all carriers operating in the areaof proposed service were notified that the application has been
filed with the PSC and a hearing date was scheduled. At the
hearing, Public Service Commissioners determined whether to grant
operating authority based on the applicant's experience in pro-
viding the service, the need for the proposed service, and
comments from other carriers at the hearing.
According to a staff member of the Transportation Division, the
Tennessee PSC received approximately 200 applications to provide
shuttle bus service at the Fair. Of those, only six or seven
were denied. The only change in procedure by the PSC was to
hold special hearings in Knoxville at which as many applications
as possible were heard. The applications were heard in the
order in which they were filed.
AGREEMENTS
There were many types of agreements related to Fair transporta-
tion. The agreements were similar to the Ordinances in that
they specified the service to be provided and any conditions
pursuant to the provision of service.
213
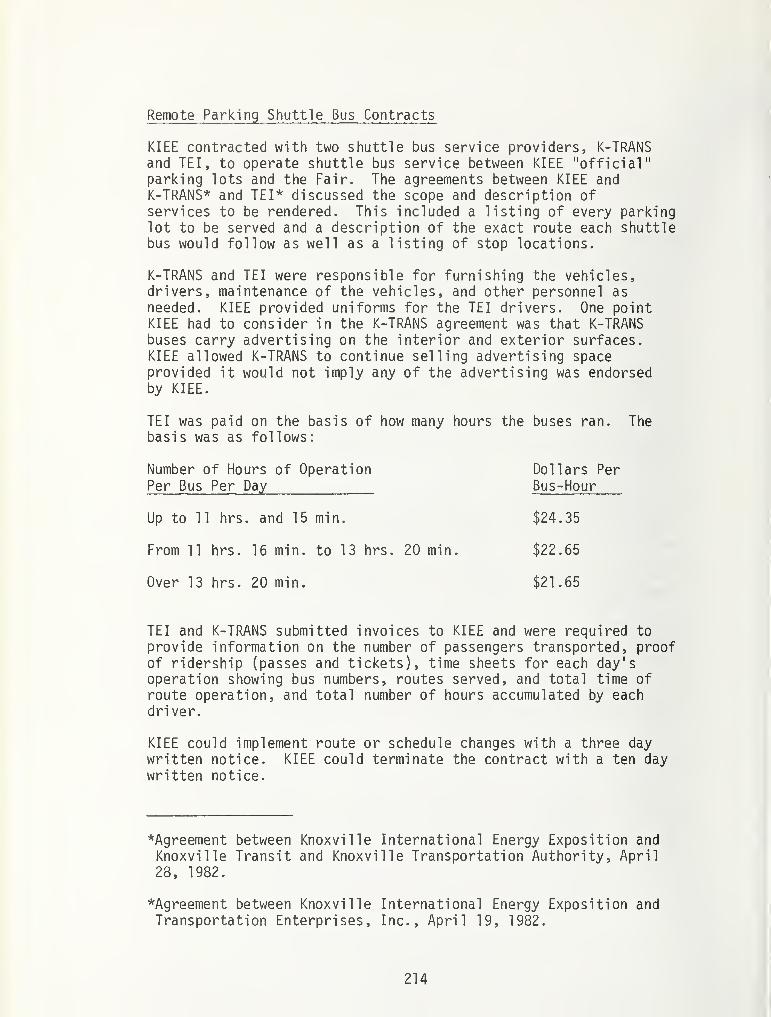
Remote Parking Shuttle Bus Contracts
KIEE contracted with two shuttle bus service providers, K-TRANSand TEI, to operate shuttle bus service between KIEE "official"parking lots and the Fair. The agreements between KIEE andK-TRANS** and TEI* discussed the scope and description ofservices to be rendered. This included a listing of every parkinglot to be served and a description of the exact route each shuttlebus would follow as well as a listing of stop locations.
K-TRANS and TEI were responsible for furnishing the vehicles,drivers, maintenance of the vehicles, and other personnel as
needed. KIEE provided uniforms for the TEI drivers. One pointKIEE had to consider in the K-TRANS agreement was that K-TRANSbuses carry advertising on the interior and exterior surfaces.KIEE allowed K-TRANS to continue selling advertising spaceprovided it would not imply any of the advertising was endorsedby KIEE.
TEI was paid on the basis of how many hours the buses ran. Thebasis was as follows:
Number of Hours of Operation Dollars Per
Per Bus Per Day Bus-Hour
Up to 11 hrs. and 15 min. $24.35
From 11 hrs. 16 min. to 13 hrs. 20 min. $22.65
Over 13 hrs. 20 min. $21.65
TEI and K-TRANS submitted invoices to KIEE and were required to
provide information on the number of passengers transported, proofof ridership (passes and tickets), time sheets for each day'soperation showing bus numbers, routes served, and total time ofroute operation, and total number of hours accumulated by eachdri ver.
KIEE could implement route or schedule changes with a three daywritten notice. KIEE could terminate the contract with a ten daywritten notice.
*Agreement between Knoxville International Energy Exposition and
Knoxville Transit and Knoxville Transportation Authority, April
28, 1982.
*Agreement between Knoxville International Energy Exposition andTransportation Enterprises, Inc., April 19, 1982.
214
The agreements also listed the insurance requirements and reasonsallowed for unavoidable delay. The agreement between TEI and KIEElisted the specifications for vehicles to be used by TEI. Thebuses had to be equipped with two passenger doors and have a
seating capacity of at least 44 passengers. TEI was responsiblefor any operating permits or taxes.
The major difference between the two agreements was that K-TRANSwas an already existing transportation service provider in
Knoxville. It was also necessary for KIEE to get the approval ofthe Knoxville Transportation Authority on the K-TRANS agreement.Since TEI was not an established operator in Knoxville, KIEE hadto provide lot space for parking and servicing buses and conductingoffice operations. Payment was based on total operating costinstead of incremental costs. There was also a minimum commitmentper bus.
KIEE had difficulty terminating the contracts when low demand wasmaking service unprofitable. Although KIEE had ten day termina-tion rights according to the contract, remote parking lot operatorsobjected strongly. They claimed they had expended resources to
provide service because of KIEE 1
s commitment. It required severalattempts on the part of KIEE to finally terminate the parking lotand shuttle contracts. (See Phase I Report for additionalexplanation.
)
There were three other types of parking related KIEE agreements.One type was lease agreements whereby KIEE leased land for
parking lot and bus terminal operations. Another kind wasagreements with operators to manage "official" KIEE lots. The
other type of contract was with Central Parking Systems Inc. to
operate KIEE's own visitor lots.
Agreements Between K-TRANS and Parking Lot Operators for ShuttleBus Service
Many parking lot operators had agreements with K-TRANS to provideshuttle bus service between their lot and theFair.* * The agree-ments discussed the scope and description of services to be
rendered. The agreements included a listing of service hours broken
down by time periods and number of departures during each time
period from the parking lot and from the Fair site.
*Agreement between Preston Haag, Trustee and Knoxville Transit and
Knoxville Transportation Authority, April 28, 1982.
*Agreement between M.F.M. Ltd. and Knoxville Transit and Knoxville
Transportation Authority, April 28, 1982.
*Agreement between Wood Properties, Inc. and Knoxville Transit and
Knoxville Transportation Authority, April 28, 1982.
215
The parking lot operators were required to provide loading andunloading areas on their lots for the buses. K-TRANS wasresponsible for furnishing the vehicles, drivers, maintenance,and supervision. There was a stipulation that no school buseswould be used and there would be no stops along the route.
One parking lot operator paid K-TRANS $1.50 per person perround trip and $1.00 for children under twelve years of age.Another operator sold round trip tickets for 75<£ per ticketand paid K-TRANS $28.12 per hour of bus service. The parkinglot operator and K-TRANS shared equally in revenue from ticketsales which exceeded $28.12 per hour of service.
K-TRANS submitted to these parking lot operators an invoicestatement on a weekly basis. K-TRANS also supplied informationconcerning the number of passengers transported as determinedby ticket sales, number of buses provided, and hours of busservice provided per bus. K-TRANS could terminate the contractwith a five day advance notice if the parking lot operator did
not pay the invoice within ten days after the payment due date.
K-TRANS Agreement With the Transit Union
K-TRANS obtained an agreement with Amalgamated Transit Union #164
concerning the hiring of temporary personnel for the 1982 World'sFair.*
The temporary bus operators were paid $3.35 per hour during
training and $7.02 per hour after completion of training. They
were not subject to progression and were not eligible for time
or pay guarantee nor holiday pay. They received seniority for
the purpose of choosing runs by picking numbers from a hat upon
completion of training.
K-TRANS reserved the right to keep any temporary operators on a
permanent basis at the end of the Fair.
OTHER REGULATIONS
Tri-Shaws
Tri-shaws had to obtain a license to operate from both theCity Business Tax and County Business Tax Offices. Each of
these offices charged $18.50 for the licenses. While the
licenses granted the tri-shaws the authority to operate, theywere subject to any applicable Federal, State, County, or CityOrdinances, Codes, or Laws.
*Letter of Understanding between Knoxville Transit, Division ofATC (K-TRANS) and Amalgamated Transit Union #1164.
216
Ferry-Boats
Ferry Boat operators were required to have their vesseldocumented by the Coast Guard and obtain a license to operate.If the boat was classified as a pleasure craft the operatorhad to pay a $100 application fee.
CONCLUSIONS
The special regulations and agreements pertaining to Fairtransportation were effective. They were adhered to and therewere few complaints.
It will be necessary to create ordinances or codes for certaintemporary services provided during special events. The CityTemporary Parking Lot and Temporary Campground Ordinancesallowed for the provision of these services during the World'sFair in Knoxville.
State agencies like the Public Service Commission can expect a
substantial number of applications for temporary authority to
operate transportation services. This may necessitate changesin procedures to process the large number of applications.
The hiring of temporary employees where the regular employees are
unionized will probably require some negotiation. K-TRANS had a
letter of agreement with the transit union concerning the hiring
of temporary employees.
One notable feature of the contract between KIEE and shuttle bus
operators was the termination of the contracts due to lack of
demand. It should be remembered that this type of service is
dependent on demand which is difficult to predict for special
events.
217


Chapter Twelve:
IMPACTS OF TRANSPORTATION SERVICE PRICING
The prices charged for transportation services during the World'sFair were discussed in context in various chapters of the Phase I
and this report. Here, the secondary or side effects of pricesare analyzed and their impacts identified. Other economic issues,including decision-making under uncertainty and impact of imper-fect knowledge; establishing market-clearing prices in real-time;own-price and cross-elasticity of demand; and the choice betweenregulated and free entry to and exit from markets are considered,as well. The two main sections of the chapter deal with parkingprices and shuttle bus prices.
PARKING PRICES
Chapter 5 of the Phase I report and Chapter 6 of this report
outline the parking situation at the Fair and the key decisionswhich resulted in the "official" parking lot system and its uniform
$6.00 fee. The description and analysis of the visitor parking
plan and its implementation in Phase I (pp. 75-77) provides a
useful introduction to this economic analysis.
In summary, Fair management was interested in assuring an adequate
supply of visitor parking, as well as uniform pricing, hours of
operation, and advance information about lot locations. By
reducing the visitors' uncertainty about parking availability and
cost, the Fair itself could be more effectively promoted and the
goals of the transportation plan better realized.
The $6.00 "official" parking price was based on the Fair's pro-
jected costs to construct and operate the entire transportation
system, including roadway improvements, parking lot paving,
shuttle bus services, employee and VIP parking, a radio system,
signage, equipment, and other system elements. This decision had
several unforeseen results, some of which appeared on the supply
side of the market and some on the demand side. The equilibrium
price appears to have been below $6.00, but significant variations
existed.
219
Supply Impacts
The magnitude of the initial excess supply of parking was docu-mented in the Phase I report. The existence of the $6.00 parkingfee for "official" lots attracted numerous entrepreneurs who, likeKIEE itself, considered the cost of developing and operating theirproposed lots carefully but were unaware of the extent to whichothers were making similar plans.
The supply issue was complicated for any potential parkingentrepreneur by several factors. These included: the proximityof a parking lot site to a Fair gate, access to the site from a
major approach route, and the number of competitors along the sameapproach. The occupancy rates on which an entrepreneur could basehis decision to enter the parking market would be affected by
these factors, yet it was difficult to judge in advance how the
particular market segment in which any given parcel was locatedwould respond. Excessive optimism in the private sector aboutdemand characterized the pre-Fair parking supply. The Fair's owndemand estimates also erred on the high side, as discussed in
Chapter 6.
The reality of excess supply was readily apparent within the firstweek of the Fair. Two responses were possible and both wereobserved: (1) Prices were lowered and (2) some parking was
withdrawn from the market. Both types of actions moved the
parking market closer to equilibrium.
Price Reductions . Three types of price reductions were observed.First, the base level of prices was reduced in those sub-marketscharacterized by excess supply and a high degree of competition.This situation prevailed in the Dale Avenue/Blackstock Avenuecorridor leading to the North gate, the Fort Sanders neighborhood/Grand Avenue lots, the area east of the CBD and the Business Loop;
and the remote lot areas in the Chapman Highway corridor south of
the river. Prices near the Southwest gate were firmer, since the
University of Tennessee controlled all the "unofficial" lots
within walking distance of the gate. Prices in the CBD adjacentto the East gate also held near the $6.00 mark, with a tendencytoward premium prices (above $6.00) on very busy days.
The second type of price reduction observed was a tendency on the
part of the "unofficial" lots to lower prices for the eveninghours. A $2.00 to $3.00 charge for cars entering after 5:00 or
6:00 P.M. was common; the University reduced the price in its lots
to $1.50 for evening hours.
220

The third type of price reduction was observed primarily in theCBD lots although it was practiced to some extent along DaleAvenue. The more experienced operators began the day with highprices--in some cases as high as $8.00-$10.00. By 10:00 A.M.however, they reduced the prices to the level they judged neces-sary to fill their lots, based on how quickly the lots filled in
the period prior to the 10:00 A.M. opening time.
Market Exit . As the problem of excess supply became more obvious,and experience indicated that price cuts could not fill all lots,operators began to leave the market. One of the earliest, andmost dramatic, departures was a major "unofficial" lot well eastof the downtown in the Coliseum area. The operator had investedwell over $100,000 in developing 2,500 spaces, and had initiallyattempted to charge a $6.00 parking fee, plus 75 d per person forthe shuttle bus ride to the East gate. The added charge for thebus service was quickly dropped (an implicit price reduction), butby the end of May it became obvious that the market could notsupport 4,300 spaces east of downtown (including 1,800 at the
Coliseum garages). The private operator withdrew from the marketshortly after Memorial Day; KIEE and the Coliseum agreed to cancelthe "official" status of the latter effective July 10.
Near the North gate, several of the more distant parcels in the
KIEE-operated complex never opened; one such area close to the
gate, was converted to bus parking. "Unofficial" lots more than
one-half mile from the gate tended to close, though a few competedby lowering prices. The latter phenomenon was also observed along
Chapman Highway, with "free" shuttle bus service frequentlyappearing as an implicit price reduction.
A Note About Elasticity
The Phase I report suggested that Phase II would include a discus-
sion of the elasticity of demand; that is, the change in demand
based on changes in the price of parking. Unfortunately, it has
not been possible to draw strong inferences about price elasticity
due to the lack of data.
A brief explanation of elasticity will help illustrate why this
lack of data precluded use of the concept. Own-price elasticity
of demand is defined as the percent change in the quantity of
commodity A demanded associated with a one percent change in the
price of A. Cross-elasticity of demand is defined as the percent
change in the quantity of A demanded associated with a one percent
change in the price of B.
In order to apply the elasticity model, the change in quantitydemanded must be observed following a change in price, while all
other factors remain constant . In fact, on any given day the
overall demand for parking at the Fair (due to attendance, visitororigin, etc.), the number of available spaces, and the generallevel of prices in a given submarket, all fluctuated. It is
therefore impossible to isolate the impacts of changes in price on
the demand for parking, even if better data were available.
The lack of data results from the fact that, with one exception,only "unofficial" lots changed parking fees. No records showingthe impact of price changes on demand for space could be obtainedby the team preparing this report (it is suspected that noneexist)
.
"Official" lots, with one exception, held the $6.00 rate at all
times during the Fair. Thus, there was no variation in price to
correlate with variations in demand. The exception was an experi-ment in which an "official" lot, the Parking Barn on Dale Avenueabout two blocks from the North gate, was authorized to reduce theparking fee to $4.00 to meet competition from "unofficial" lots in
the vicinity. Results of the experiment indicated that demand wasinelastic; that is, total revenue (adjusted for daily attendance)was lower at $4.00 than at $6.00. The experiment was terminatedand the $6.00 rate restored.!
At first glance, the experiment described above appears to be an
illustration of own-price elasticity. However, if one asks wherethe 22 percent of new parkers came from, it appears that the gainat the Parking Barn was at the expense of other nearby lots. In
fact, the experiment was initiated in large measure as a responseto a loss of market share. Viewed in this light, it appears thatthe real issue is cross-elasticity. In examining the effect of
price changes at individual lots, we are looking at goods (a
parking space in Lot A versus a space in Lot B) which are closesubstitutes for one another, but not identical because of
locational differences.
IMPACT OF PARKING PRICES ON THE FAIR
The "official" lots faced the worst of all possible worlds, in a
narrow sense. When parking was scarce, official lots in choicelocations were a "bargain" and could not maximize profits by
raising price. When parking was plentiful relative to demand,
% change in quantity
iThe formula for calculating elasticity is: E = % change in priceIn the experiment cited, a 22 percent increase in demand was asso-
ciated with a 33 percent price decrease, for an E = -0.67. By
definition, any E - value (ignoring the minus sign) lower than 1.0
is inelastic demand. That is, with E less than 1, raising price
will increase total revenue.
222

"official" lots could not even reduce evening prices, to bring inmore customers. Remote lots, with one exception, were in an evenworse position, since bus service expense raised their operatingcosts and they could not adjust by closing on weekends, whenadditional downtown space made them redundant.
In a broader sense, however, the Fair's larger purposes wereserved. Plentiful parking certainly helped induce people to visitthe Fair (or at least kept them from being deterred), resulting inhigher total revenue to the Fair than if parking had been barelyadequate.
Table 12-1 summarizes projected and actual financial outcomes ofthe Fair's transportation operations. The April forecast was madeafter development costs were almost entirely known but before anyrevenues were received. The June forecast reflects the firstmonth's operating experience, and the November summary indicatesthe final results.
Reasons for the Deficit
Although previous estimates, even as late as February, 1982, hadpredicted that all of the Transportation Services operations atthe Fair would break even, it was apparent even before the Fairopened that this would not be so. KIEE management said in early1982 that it would rather have its support systems lose moneythan break even financially with a system that failed to functionproperly. This was an example of a very functional system whichdid not break even. The April estimate projected higher shuttlebus operating costs which were the result of a change in the
original agreement between K-TRANS and KIEE. The price ultimatelydemanded for remote employee parking was higher than the earlierforecasts had anticipated, as was the cost of leasing the land
needed for the employee shuttle bus turn around area. Costs to
develop both bus terminals and the parking lots developed by KIEE
were also higher than anticipated, due to a combination of
unforeseen subsoil conditions and adverse weather early in the
spring. To make matters worse, time was on the side of the
contractors rather than KIEE, in the sense that the longer the
KIEE management delayed making decisions, the higher the price
the contractors could charge, given KIEE's desire to have all
construction completed by opening day.
The April revenue estimate reflected some of the additional private
lots that had begun to appear by the end of March. KIEE parking
revenues in April were projected at $2,900,000. The February
forecast was $3,300,000.
The June budget estimate reflected several other changes in the
situation, all of them adverse to the profit picture. Last
minute expansion of the land area available for the north bus
terminal had significantly increased the cost of developing that
223

TABLE 12.1: TRANSPORTATION SERVICES OPERATING FORECASTS AND RESULTS
APRIL JUNE NOVEMBERFORECAST FORECAST SUMMARY
(All figures X $1000)Visitor Parking
Site Leasing and Development Costs $ 481 $ 611 $ 611
Shuttle Bus Costs 1,350 860 555
Administrative Costs 165 173 163
Total Visitor Parking Costs: $ 1,996 $ 1,644 $ 1 ,329
Visitor Parking Revenues 2,900 1,175 800
Revenues Less Costs $ (904) 469 529
Other Transportation Services Costs
Employee, VIP Lot Leasing andDevelopment Costs $ 656 $ 781 $ 644
Lot Operations 375 395 320Administrative Costs 36 39 39
Total Other Parking Costs: $ 1 ,067 $ 1,143 $ 920
Employee Parking Revenues 118 72 43
Net Other Parking Costs $ 949 $ 1,143 $ 920
Bus Terminals
Site Leasing and Development Costs $ 440 $ 645 $ 720Operating Costs 240 240 225
Administrative Costs 60 99 99
Total Terminal Operation Costs $ 740 $ 984 $ 1 ,044
System Access Costs 214 254 274General + Administrative Expenses 123 150 150
Net Total: Other TransportationServices Costs $ 1,077 $ 1,388 $ 1 ,468
Net Income (Deficit) fromTransportation Services $0,122) $(3,000) $(2,957)
224
site, although the improved operation made the extra cost worth-while. Both bus terminals had developed significant deteriorationin the most heavily traveled portions of the paving, requiringrepairs and suggesting that maintenance costs for pavement wouldbe a continuing item through the life of the Fair. The latterproved untrue due largely to decreased bus volume. Virtually nomaintenance was needed on bus terminal paving after the end ofJune.
The June estimates also reflected higher bus terminal operatingcosts, based on experience to date with the number of peopleneeded to operate the terminals during busy times. On the otherhand, shuttle bus services had already been cut back, so somesaving was forecast in that area.
Perhaps the most damaging condition reflected in the June fore-cast was the low demand for, and hence revenue from, officialparking spaces. Earlier forecasts had expected that the mainofficial lot complex near the north gate would fill up practicallyevery day of the Fair, generating revenues of nearly $5,000 perday. These estimates were revised downward substantially in theJune forecast. Estimates for revenues from other official lots
were also adjusted downward.
In the final analysis, the deficit was fairly close to the
$3,000,000 projected in June, although the absolute levels of
both revenues and expenses were lower than the June forecast. As
bus terminal volumes declined and familiarity with terminal on the
part of the bus drivers increased, it proved possible to operate
the terminal with fewer employees and ultimately to close the
shuttle bus terminal entirely. Staffing hours in the close-in
visitor and VIP parking lots were reduced, reflecting the availa-
bility of parking and hence a diminished need to enforce parking
restrictions.
Shuttle bus services were reduced even below the levels antici-
pated in June and ultimately the remote official parking lot
shuttles were terminated. The employee remote parking lot
contract and its associated shuttle service were also terminated.
Despite these cost reduction measures, revenues from parking
continued to fall below forecasts, so that the ultimate effect
was merely to hold the deficit at the $3,000,000 level projected
in June.
Impact on Private Operators
The ability of private operators to adjust prices to market
conditions was a mixed blessing. By keeping prices relatively
high on busy days, operators certainly acted to maximize profits.
However, the need to meet the competitive (lower) price resulted
in revenues which barely covered operating expenses for some
marginal lot operators on slow days. And, the initial excess
225
supply forced many to make an early exit from the market. Giventhe substantial front-end cost for lot development encountered bymany operators, it is almost certain that operators of the 5,000spaces withdrawn from the market by mid-summer suffered signifi-cant capital losses. An approximation of the investment involvedmay be calculated as follows:
Site acquisition--six to nine monthslease @ 40<£ sq.ft. - - $140 per space
Site Preparation (no major demolitionor grading! 40<£ sq.ft, (typical)
Permits, Insurance, Administration
Total Investment:
- 140 per space
- 20 per space
$300 per space
Impacts on private operators were not uniformly distributed, ofcourse. In general, the closer a lot was to a gate, the higherthe probability that the operator could command the $6.00 price;the further the lot, the higher the likelihood of price-cutting.However, prices were also sensitive to the supply within the sub-markets around each gate and approach routes.
The University of Tennessee's decision to enter the parkingbusiness also affected private sector operations and KIEE itself.During the summer months there was substantial excess supply ofparking near the Southwest gate. However, except for the lowevening rate, the University did not engage in daily or hourlyrate changes. In the absence of price-cutting by the two majoroperators (the University and KIEE), the private operators nearthe Southwest gate were able to avoid some of the price competi-tion which erupted at other locations.
Conclusions
Despite incomplete information, some conclusions about the wisdomof attempting to establish parking rates well ahead of an eventmay be drawn. The Fair's intent was to insure that an adequatesupply of parking would be available to accommodate Fair visitors,at a price known in advance, and in lots conforming to highstandards in keeping with the Fair's overall image. This may be
viewed as an attempt to reduce uncertainty for visitors. In the
end, reducing uncertainty turned out to be costly, as it has at
prior World's Fairs.
The fixed $6.00 rate failed to allow for adjustment to somerealities of the marketplace. With hindsight, an evening rate(e.g., $2.00 after 6:00 P.M.) would certainly have increased carsparked at "official" lots at little or no cost, given that"unofficial" lots were resorting to price competition.
226
The fragmentary evidence of elasticity, however, does not indicatethat "official" lot operators were hurt by the inability to lowerdaytime rates to meet the competition. An operator who cut hisrate from $6.00 to $4.00 would have needed 50 percent more carsjust to maintain the same revenue as before the price cut. It is
by no means clear that price reductions (including evening hours)would have been advantageous to "official" lot operators. TheFair itself was a victim of its desire for consistent, predictablepricing. Lower prices in "official" lots operated by others wouldhave increased the Fair's revenue, since their contracts calledfor per-car fee payment, unless KIEE would have agreed to lowerthe fee. Keeping the price at $6.00 was probably the beststrategy for those lots the Fair itself controlled (at the Northand Southwest gates), since price-cutting at those locations wouldalmost certainly have yielded lower total revenue.
Another cost of reducing uncertainty, cited in the Phase I report,was associated with the remote "official" parking lots requiringshuttle bus service. Despite evidence that such ventures had all
failed at previous World's Fairs, the Fair opted to make commit-ments to remote lot operators early on, to insure the adequacy ofthe parking supply. In so doing, Fair management committed to a
relatively high-cost operation to serve lots which were located(as it turned out) in very poor competitive positions. Had it
been possible to defer the commitments, few, if any, remote lots
would have been needed or committed to by KIEE.
It also is apparent that the $6.00 price was above the equilibriumlevel. Over the run of the Fair, on the average, the equilibriumprice was probably in the $4.00 range, except in downtown whereit was close to $6.00. Given its desire to break even on parking,
KIEE undertook to develop some parking lots which had higher per-
space costs than others which ultimately came on the market,
expecting to recover their costs at the $6.00 price. Had KIEE
attempted to set an equilibrium price without regard for their own
costs, it is likely that none of the remote lots would have
received "official" designation. The amount of "official" parking
would, then, have been reduced by almost 3,500 spaces. However,
it is not clear that an announced price of $4.00 would have
encouraged as much parking development as was required. In a
sense, the equilibrium price is the crucial question for future
special events, along with a corollary issue of whether parking
and transportation operations should be expected to break even.
227
Conclusions about parking pricing in Knoxville may be summarizedas follows:
1. Where demand was high relative to a lot's capacity,the lot would probably fill at any price up to andincluding $6.
2. Where demand was low relative to the lot's capacity,price-changing could influence the number of vehiclesparked, but was not likely to increase revenue abovewhat it would have been at the higher price.
3. Since most people parked along their approach routeswithout searching for cheap parking from one gatearea to another, prices could be different in differentareas at the same time.
4. Price variations affected lot occupancy when thosewith different prices were in sight of each other;there were no apparent impacts when lots were notvisible from one another.
5. Future special events planners should try to determinethe equilibrium parking price because of its impact on
setting the official lot price, encouraging private lot
development and determining potential revenues to help
support the overall transportation system.
It is important to remember that transportation services areperipheral, not central, to a special event. The purpose oftransportation services is to create adequate, economical accessto the event. Viewed in that context, losses the Fair incurredoutside the gates may well have been offset by added spendinginside. The ease of access may have resulted in longer averagestays at the Fair as well.
BUS SERVICE PRICES
Shuttle bus prices must be examined in relation to parking prices.Shuttles serving outlying communities, hotels, and motels offeredFair visitors a choice of mode. Hence, bus service and Fairparking were substitute goods for some visitors. The fate ofshuttles serving remote parking lots was not in the operator'shands. Once the choice was made to park in a remote lot, the
shuttle ride was a complementary good needed to accompany the
rental of the remote parking space. Until that decision was made,remote parking and the accompanying shuttle bus trip competed withclose-in parking (and possibly with a shuttle bus from the pointof origin).
228
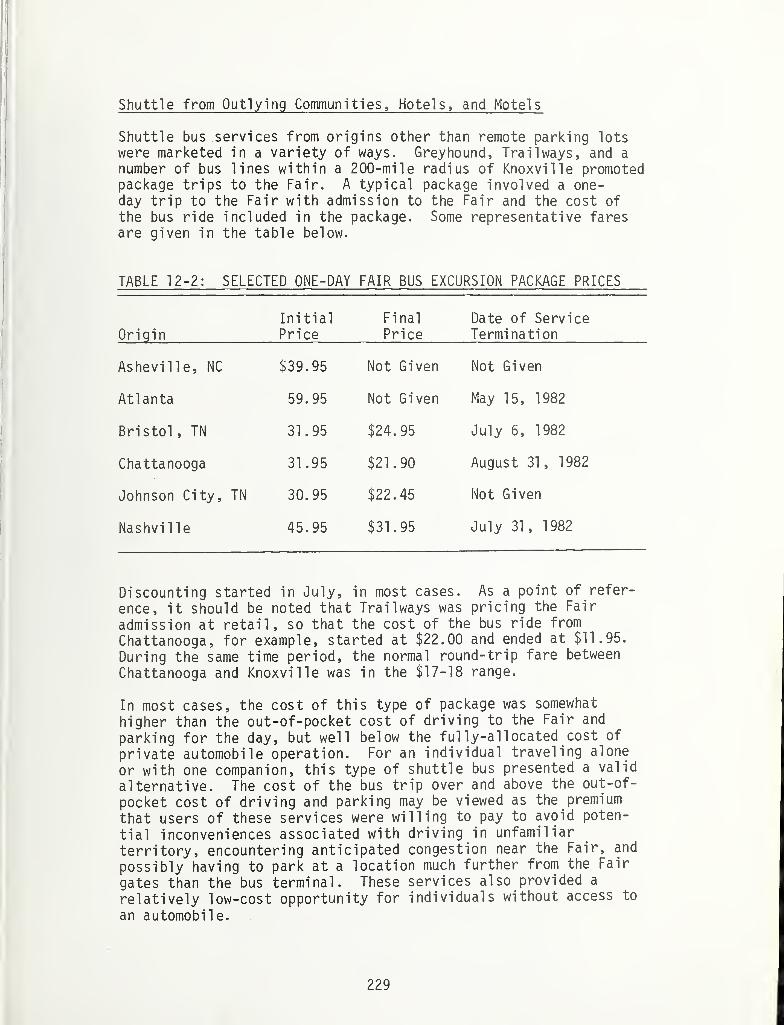
Shuttle from Outlying Communities, Hotels, and Motels
Shuttle bus services from origins other than remote parking lotswere marketed in a variety of ways. Greyhound, Trailways, and a
number of bus lines within a 200-mile radius of Knoxville promotedpackage trips to the Fair. A typical package involved a one-day trip to the Fair with admission to the Fair and the cost ofthe bus ride included in the package. Some representative faresare given in the table below.
TABLE 12-2: SELECTED ONE-DAY FAIR BUS EXCURSION PACKAGE PRICES
OriginInitialPrice
Final
PriceDate of ServiceTermination
Asheville, NC $39.95 Not Given Not Given
Atlanta 59.95 Not Given May 15, 1982
Bristol , TN 31.95 $24.95 July 6, 1982
Chattanooga 31.95 $21.90 August 31 , 1982
Johnson City, TN 30.95 $22.45 Not Given
Nashvi lie 45.95 $31.95 July 31, 1982
Discounting started in July, in most cases. As a point of refer-
ence, it should be noted that Trailways was pricing the Fair
admission at retail, so that the cost of the bus ride from
Chattanooga, for example, started at $22.00 and ended at $11.95.
During the same time period, the normal round-trip fare between
Chattanooga and Knoxville was in the $17-18 range.
In most cases, the cost of this type of package was somewhat
higher than the out-of-pocket cost of driving to the Fair and
parking for the day, but well below the ful ly-allocated cost of
private automobile operation. For an individual traveling alone
or with one companion, this type of shuttle bus presented a valid
alternative. The cost of the bus trip over and above the out-of-
pocket cost of driving and parking may be viewed as the premium
that users of these services were willing to pay to avoid poten-
tial inconveniences associated with driving in unfamiliar
territory, encountering anticipated congestion near the Fair, and
possibly having to park at a location much further from the Fair
gates than the bus terminal. These services also provided a
relatively low-cost opportunity for individuals without access to
an automobile.
229

Trailways, Inc. aggressively marketed a shuttle service fromGatl inburg to the Fair. This service originated at a park-and-ride lot on the outskirts of Gatlinburg, and offered frequentservice between Gatlinburg and the Fair for $10 round trip. The
price included only the cost of the bus ride; tickets could be
purchased just prior to boarding the bus. The frequency ofservice provided was curtailed after the first few weeks of the
Fair, when the anticipated volume of riders did not materialize.However, the service did continue, albeit at a reduced level, forthe duration of the Fair.
With hindsight, it appears that this service was actually in a
less favorable competitive position than some of the longer-di stance shuttles. Gatlinburg is a resort community. Most Fairvisitors who stayed there had arrived either on tour or charterbuses or in their own automobiles. In either case, most of themhad an alternative means of transportation to the Fair. For thosewith private automobiles, an out-of-pocket cost of approximately10<£ per mile for operation of a private vehicle translated to an
outlay of $15 for driving to and from the Fair and parking in oneof the "official" lots. Even with a half-fare tariff for childrenunder 12, a group of more than two people was financially betteroff driving to the Fair than taking the bus. Although somefamilies paid the price for shuttle transportation on the firstday of their visit to the Fair, many of them noticed that trafficon the approach routes flowed well and that parking was readilyavailable immediately adjacent to the shuttle bus terminal. As a
result, repeat shuttle business from visitors spending more than
one day at the Fair was rare.
Other shuttle operators serving the Gatlinburg market were moreprone to tie their service to exclusive pickup arrangements at
specific motels or campgrounds. In some cases, the motel opera-tors sold individual tickets on a commission basis; in others the
shuttle bus ride to the Fair was part of a pre-sold lodgingpackage. While some of these services charged less than the
Trailways tariff, and provided more convenient pickup and dropoffpoints in Gatlinburg, they were at the same competitive disadvan-tage with respect to the relative price of driving and ease of
parking.
Conclusions on Shuttle Services
Given auto occupancy rates and bus operating costs, it appearsunlikely that any price for shuttle bus service from outlyingcommunities could have enabled operators to break even and carrylarge numbers of people. The prices recommended by the PSC forthe service appeared to be related to the PSC
1
s perception of the
cost to provide service rather than the demand curve. Even so
some operators claimed they would have needed load factors in
excess of 100% to break even at the PSC-recommended rates.
230
On the other hand, comments from some shuttle bus operatorsindicated that there is a small market segment with relativelyinelastic demand for whom shuttle bus service will always be a
viable choice, at virtually any price. This market is composed ofpeople who do not wish to drive to the Fair, due to fear ofcongestion, unfamiliarity with the route, not having a car, notbeing able to drive, etc. The residual group of shuttle operatorswho continued service throughout the Fair were, in all likelihood,serving primarily this market. Since the market is fairly small,a viable shuttle service must also have fairly low costs in orderto survive. Operators with low capital investment and low fixedcosts were the most viable in Knoxville.
Remote Parking Shuttles
As noted, the demand for shuttle bus service from a remote parkinglot is complementary to the demand for parking in the lot. One ortwo parking lot operators attempted to separate parking andshuttle bus costs, and to advertise very low parking rates, in
some cases without plainly indicating that the bus ride costextra. Research indicated that even in those cases, the busoperator's revenues were established by some agreement with thelot operator (unless the lot and the bus were operated by the sameperson or firm) and did not depend on bus ridership.
The "official" remote lot operators who contracted on their ownwith bus operators after KIEE cancelled the remote lot contractshad to pay more per car parked for the bus service than KIEE had
charged them. Given the overall parking situation in Knoxville,and judging by experience at past World's Fairs, financial successis no more likely for remote shuttle bus operations than for
remote parking lot operations.
Remote parking lot operators, as noted above, attempted to employa pricing strategy which separated the cost of the parking and the
cost of the shuttle. It is difficult to judge the success of this
marketing strategy, and no attempt was made to collect data from
the operators who used it. In one case, an unofficial lot opera-
tor was directly opposite an official lot. It became clear that
the obvious price competition which existed between the two was
not the most important difference. A concealed aspect was the
unofficial lot operator's attempt to control his costs by reducing
the level of his shuttle bus service to barely tolerable
frequencies--in some cases to the half-hour or forty minutes it
took for one bus to make a round trip. By contrast the "official"
lot shuttle service operated every 10 minutes during the early
days of the Fair, then every 12 to 18 minutes as service was
reduced in the Fair's attempt to cut costs. Unfortunately,
quality of service was impossible for a Fair visitor to judge
before selecting a lot.
231

THE ROLE OF THE PUBLIC SERVICE COMMISSION
Many bus operators felt that the PSC should have restricted marketentry to provide some degree of economic security for thoseauthorized to operate. The PSC apparently viewed its rolesomewhat differently. The rates they recommended appeared to
strike a balance between the cost of providing service for the bus
industry in Tennessee and the interests of consumers. They werereluctant, for several reasons, to deny entry to any operator whoappeared fit.
First, there was really no good way to accurately predict the sizeof the market. Thus, there was no basis for determining how manycarriers should be authorized to serve. Second, for valid politi-cal reasons, they did not wish to be placed in a position ofhaving to decide which firms might profit by the Fair and whichwould be denied entry to the market entirely. Third, the currenttrend to deregulation and free entry probably affected theirdecision to not limit carriers. Therefore, the decision of thePSC to limit its intervention to establishing rates was a veryprudent one.
At the same time, the shuttle operators who were establishedcarriers in the Knoxville area felt that the PSC should, at thevery least, have given some preferential consideration to esta-blished firms. This view also has some merit. Established firms,
local to an area, have a slightly greater stake in protectingtheir reputations than outsiders who come in solely to serve a
special event. It is likely that the assurance of adequate supplyachieved by allowing all comers to serve the market could have
been achieved by allowing local operators to lease equipment(which was permitted anyway), encouraging them to serve, and
maintaining a reasonable pricing structure. However, underexisting law, contracts between non-local operators and hotel/motel/campground operators could not have been barred, so the
outcome of such a strategy is unclear.
Conclusions on PSC
Although the consequences of the strategy pursued by the PSC werepainful to many operators, no other policy short of very strictentry regulation would have achieved any better results, and it is
not clear that entry regulations would have been preferable,because:
1) the size of the market would have to be accuratelyestimated,
2) the "best" carrier(s) would have to be selected, and
3) some means would have to be available to assure thatthe chosen carrier(s) maintained compliance with the
standards established.
232
The underlying problem was the inability to predict the marketsize. Under the circumstances, it is probably not appropriate to
suggest a stronger role for the PSC or other regulatory body thanvigorous enforcement of criteria for fitness to serve. It wassuggested that the PSC could have helped the market regulateitself, by requiring a cut-off date for licensing 2-3 months in
advance and posting a running total of the number of buses for
which licenses had been applied. By this the potential carriercould estimate how large his competition would be.
1) . S. GOVERNMENT PRINTING 0 F F I C E : 1 9 8 3 - 3 8 1 - 4 2 8 / 3 3 3 0
233


NOTICEThis document is disseminated under the sponsorship of the
Department of Transportation in the interest of information
exchange. The United States Government assumes no liability
for its contents or use thereof.
This document is being distributed through the U.S. Departmentof Transportation’s Technology Sharing Program.
> zcm
OfNJ
o Oif) Co(0
•
J>t—
>
OlO O'
DOT-l-83-29
OOT I IRDadv
00014734
TECHNOLOGY SHARINGSPECIAL STUDIES IN TRflWSPnRTflTJQW PLANNING (SSTP)
PROGRAMS OF THE U.S. DEPARTMENT OF TRANSPORTATION