State of the World's Children 2007
160
THE STATE OF THE WORLD’S CHILDREN 2007 Women and Children The Double Dividend of Gender Equality
-
Upload
khangminh22 -
Category
Documents
-
view
0 -
download
0
Transcript of State of the World's Children 2007
United Nations Children’s Fund
3 United Nations PlazaNew York, NY 10017, [email protected]
US $20.00 UK £10.60 €15.75ISBN-13: 978-92-806-3998-8ISBN-10: 92-806-3998-6Sales no.: E.07.XX.1
© The United Nations Children’s Fund (UNICEF)December 2006
THE STATE OF THE WORLD’S CHILDREN 2007
TH
E S
TA
TE
OF
TH
E W
OR
LD
’S C
HIL
DR
EN
20
07
TH
E D
OU
BL
ED
IVID
EN
DO
FG
EN
DE
RE
QU
AL
ITY
Women andChildrenThe Double Dividend
of Gender Equality


THE STATE OF THEWORLD’S CHILDREN2007
© The United Nations Children’s Fund (UNICEF), 2006
Permission to reproduce any part of this publicationis required. Please contact the Editorial, Design andPublications Section, Division of Communication,UNICEF NY (3 UN Plaza, NY, NY 10017) USA, Tel: 212-326-7434 or 7286, Fax: 212-303-7985, Email: [email protected]. Permissionwill be freely granted to educational or non-profitorganizations. Others will be requestedto pay asmall fee.
Commentaries represent the personal views of the authors and do not necessarily reflect UNICEF positions.
ISBN-13: 978-92-806-3998-8ISBN-10: 92-806-3998-6
UNICEF, UNICEF House, 3 UN Plaza,New York, NY 10017, USA
Email: [email protected]: www.unicef.org
Cover photo: © UNICEF/HQ95-0980/Shehzad Noorani

Acknowledgements
This report was made possible with the advice and contributions of many people, both in and outside of UNICEF. Importantcontributions were received from the following UNICEF field offices: Bangladesh, Bolivia, Brazil, China, the Gambia, India,Islamic Republic of Iran, Jamaica, Jordan, Madagascar, Montenegro, Mozambique, Nepal, Nicaragua, Papua New Guinea,Serbia, Sri Lanka, Tajikistan, Uganda, Uzbekistan and Zimbabwe. Input was also received from Programme Division,Division of Policy and Planning, Office of UN Affairs and External Relations, and Division of Communication at New YorkHeadquarters, UNICEF regional offices and the Innocenti Research Centre.
Sincere thanks to Casimira Rodríguez Romero, Minister of Justice, Bolivia, for her special contribution.
EDITORIAL
Patricia Moccia, Editor-in-Chief; David Anthony, Editor;Allyson Alert; Chris Brazier; Christine Dinsmore; Hirut Gebre-Egziabher; Emily Goodman; Paulina Gruszczynski; Tamar Hahn; Pamela Knight; Amy Lai; Catherine Langevin-Falcon; Jodi Liss; Najwa Mekki; Lorna O’Hanlon; Catherine Rutgers
STATISTICAL TABLES
Tessa Wardlaw, Acting Chief, Statistical InformationSection, Division of Policy and Planning; Priscilla Akwara;Claudia Cappa; Friedrich Huebler; Rouslan Karimov;Edilberto Loaiza; Nyein Nyein Lwin; Mary Mahy;Maryanne Neill; Ngagne Diakhate; Khin Wityee Oo; Emily White Johansson
DESIGN AND PRE-PRESS PRODUCTION
Prographics, Inc.
STEERING COMMITTEE
Rima Salah, Chair; Gordon Alexander; Maie Ayoub von Kohl; Liza Barrie; Wivina Belmonte; Samuel Bickel; Susan Bissell; Mark Hereward; Eva Jespersen; Afshan Khan;Gabriele Koehler; Erma Manoncourt; Peter Mason; Sidya Ould El-Hadj; David Parker; Mahesh Patel; Marie-Pierre Poirier; Dorothy Rozga; Fabio Sabatini;Christian Schneider; Susana Sottoli; Yves Willemot;Alexandre Zouev
RESEARCH AND POLICY GUIDANCE
Elizabeth Gibbons, Chief, Global Policy Section, Divisionof Policy and Planning; David Stewart, Senior PolicyAdvisor, Global Policy Section; Raluca Eddon; Ticiana Maloney; Annalisa Orlandi; Kate Rogers
PRODUCTION AND DISTRIBUTION
Jaclyn Tierney, Production Officer; Edward Ying, Jr.;Germain Ake; Eki Kairupan; Farid Rashid; Elias Salem
TRANSLATION
French edition: Marc Chalamet Spanish edition: Carlos Perellón
PHOTO RESEARCH
Allison Scott; Susan Markisz
PRINTING
Gist and Herlin Press
EXTERNAL ADVISORY PANEL
Anne Marie Goetz; Edmund Fitzgerald; Geeta Rao Gupta; Kareen Jabre; Sir Richard Jolly; Azza M. Karam; Elizabeth M. King; Laura Laski; Joyce Malombe; Carolyn Miller; Agnes Quisumbing;Gustav Ranis
BACKGROUND PAPERS
Lori Beaman, Esther Duflo, Rohini Pande and Petia Topalova; Elizabeth Powley; Sylvia Chant; Leslie A. Schwindt-Bayer
CONTENTSForewords
Kofi A. Annan Secretary-General of the United Nations ........................vi
Ann M. Veneman Executive Director, UNICEF ..............vii
Chapter 1 ................................................1
Chapter 2 ..............................................17
Chapter 3 ..............................................37
Chapter 4 ..............................................51
Chapter 5 ..............................................69
References ............................................88
Statistical Tables ..................................98General note on the data..................99Under-five mortality rankings ........101Table 1: Basic Indicators ................102Table 2: Nutrition ............................106Table 3: Health ................................110Table 4: HIV/AIDS ............................114Table 5: Education ..........................118Table 6: Demographic Indicators....122Table 7: Economic Indicators..........126Table 8: Women ..............................130Table 9: Child Protection ................134Summary Indicators........................136Measuring human development....137Table 10: The Rate of Progress ......138
Index......................................................142
Glossary ..............................................147
UNICEF Offices ....................................148
Summary....................................viii
PanelsGender discrimination across the life cycle ..............................................4
Gender discrimination and inequalities across regions ................8
Figures1.1 In many developing regions,
girls are more likely than boys to miss out on a secondary education......................................3
1.2 Men’s discriminatory attitudestowards women vary acrossregions but are significant everywhere..................................6
1.3 In sub-Saharan Africa, young women are more vulnerable to HIV infection but have lesscomprehensive knowledge about HIV than young men......11
1.4 More than 1 out of every 4 births to an adolescent mother(aged 15–19) occurs in the least developed countries ........13
1.5 High rates of maternal death are associated with limitedaccess to health-care services for expectant mothers ..............14
Summary ....................................16
PanelsDomestic violence against children..............................................24
Grandmothers and HIV/AIDS..........30
Mother Centres in Central andEastern Europe and the Gambia....34
Figures2.1 Many husbands are making
the decisions alone on theirwife’s health................................18
2.2 Many husbands are making the decisions alone on dailyhousehold expenditure..............19
2.3 Many husbands are making thedecisions alone on visits tofriends and relatives..................20
2.4 Underweight prevalence among children under five in the developing regions..........23
2.5 Despite recent improvements,women’s literacy rates are generally lower than men’s......27
1 A call forequality
2 Equality in thehousehold
iv

THE STATE OF THE WORLD’S CHILDREN 2007
Women and ChildrenThe Double Dividend of Gender Equality
Summary ....................................68
PanelsPartnerships for girls’ education....70
Monitoring governments’ commitments to women’s empowerment through gender-responsive budgets..........................74
Partnering to promote child rights and gender equality in political agendas..............................76
Quotas: One size does not fit all ....79
Women’s participation in community-based initiatives across the developing world ..........82
Program H: Challenging genderstereotypes and changing attitudesin Brazil and other countries..........84
Partnering to provide improved estimates of maternal mortality......86
Figures5.1 The majority of countries with
the most women in parliamentuse political quotas....................78
5.2 Countries with the most women in parliament are alsothe most likely to use quotas....80
5.3 In many countries sex-disaggregated data are not available for key indicators......85
Summary ....................................50
PanelsWomen and politics: Realities and myths..........................................54
Women’s groups: A force for political change ................................59
Women and the Darfur PeaceAgreement ........................................62
Women as mediators and peacekeepers....................................63
The hope of justice for Bolivia’swomen and children, by CasimiraRodríguez Romero............................66
Figures4.1 Bill sponsorship in Argentina
and New Zealand ......................53
4.2 In most of the countries sur-veyed, a majority of the publicagrees or strongly agrees thatmen make better political leaders than women..................55
4.3 Women’s participation in national parliaments acrossregions........................................56
4.4 Women in governance..............58
Summary ....................................36
PanelsDo girls risk missing out on school when women work?............41
The impact of family-friendly workplaces in industrialized countries............................................46
Child labour: Are girls affected differently from boys?......................48
Figures3.1 Women are working longer
hours than men across thedeveloping world......................38
3.2 Nominal wages for women are significantly lower than for men ......................................40
3.3 Estimated earnings for women are substantially lower than for men....................41
3.4 Significant male-female gaps in land ownership in Latin America........................42
3.5 Many women across the developing world work in the informal sector................44
3 Equality in employment
4 Equality in politics and government
5 Reaping the double dividend ofgender equality
v

Message from the United NationSecretary-General
Eliminating gender discrimination and empowering women are among the paramount challenges facingthe world today. When women are healthy, educated and free to take the opportunities life affords them,children thrive and countries flourish, reaping a double dividend for women and children.
In the 27 years since the adoption of the Convention on the Elim-ination of All Forms of Discrimination against Women, much hasbeen done to advance the progress of women. But we have fallen farshort of what we need to achieve the Millennium Development Goals.Until there is gender equality, there can be no sustainable development.It is impossible to realize our goals while discriminating against halfthe human race.
As study after study has taught us, there is no tool for developmentmore effective than the empowerment of women. No other policy is aslikely to raise economic productivity or to reduce child and maternalmortality. No other policy is as sure to improve nutrition and promotehealth, including the prevention of HIV/AIDS. No other policy is aspowerful in increasing the chances of education for the next generation.That is why discrimination against women of all ages deprives theworld’s children – all of them, not just the half who are girls – of thechance to reach their potential. This is an issue that goes to the heartof UNICEF’s mission: protecting the rights of all children.
In my 10 years as Secretary-General, I have been proud to add my voice to UNICEF’s in calling on theworld to pay more attention to children’s lives, needs and rights. Among the many issues UNICEF hasaddressed over the past decade, none is more central to its mandate than the rights of women.
Kofi A. AnnanSecretary-General of the United Nations
Message from the
Secretary-General of the United Nations
© U
N/D
PI/S
erge
y B
orm
enie
v
vi

Foreword
The State of the World’s Children 2007 reports on the lives of women around the world for asimple reason: Gender equality and the well-being of children go hand in hand. When womenare empowered to live full and productive lives, children prosper. UNICEF’s experience alsoshows the opposite: When women are denied equal opportunity within a society, children suffer.
Working within countries to achieveMillennium Development Goal 3 –promoting gender equality andempowering women – will reap thedouble dividend of bettering thelives of both women and children.It will also contribute to achievingall the other goals, from reducingpoverty and hunger to savingchildren’s lives, improving maternalhealth, ensuring universal education,combating HIV/AIDS, malaria andother diseases, ensuring environ-mental sustainability, and developingnew and innovative partnerships for development.
Despite the international community’s commitment to gender equality, the lives of millions of women and girls throughout the world are plagued by discrimination, disempowerment and poverty. This report illustrates the many challenges that remain. Women and girls aredisproportionately affected by the AIDS pandemic. Many girls are forced into child marriages,some before they are 15 years old. Maternal mortality figures remain indefensibly high in manycountries. In most places, women earn less than men for equal work. Around the world,millions of women and girls suffer from physical and sexual violence, with little recourse tojustice and protection.
Declarations, conventions and goals are not enough. It is imperative that we move resolutelyfrom the realm of words to the realm of concrete action. As these pages will make clear, the daywhen women and girls have equal opportunities to be educated, to participate in government, toachieve economic self-sufficiency and to be secure from gender violence and discrimination willbe the day when the promise of gender equality is fulfilled and UNICEF’s mission of a world fitfor children can be realized.
Ann M. VenemanExecutive DirectorUnited Nations Children’s Fund
© U
NIC
EF/
HQ
05-2
284/
Chr
istin
e Jo
hnst
on
vii

Gender equality iscentral to realiz-
ing the Millennium agenda, whichrisks failure without the full participa-tion of all members of society. Withinthe Millennium Declaration and theMillennium Development Goals, andat the heart of the United Nationsitself, is the acknowledgement that thevulnerable, especially children, requirespecial care and attention. Genderequality will not only empowerwomen to overcome poverty, but alsotheir children, families, communitiesand countries. When seen in this light,gender equality is not only morallyright – it is pivotal to human progressand sustainable development.
Moreover, gender equality produces a double dividend: It benefits bothwomen and children. Healthy, educat-ed and empowered women havehealthy, educated and confidentdaughters and sons. The amount ofinfluence women have over the deci-sions in the household has been
shown to positively impact the nutri-tion, health care and education oftheir children. But the benefits of gen-der equality go beyond their directimpact on children. Without it, it willbe impossible to create a world ofequity, tolerance and shared responsi-bility – a world that is fit for children.
Yet, despite substantial gains inwomen’s empowerment since theConvention on the Elimination of All Forms of Discrimination againstWomen was adopted by the UNGeneral Assembly in 1979, genderdiscrimination remains pervasive in every region of the world. Itappears in the preference for sonsover daughters, limited opportunitiesin education and work for girls andwomen, and outright gender-basedviolence in the forms of physical andsexual violence.
Other, less obvious, forms of genderdiscrimination can be equally destruc-tive. Institutional discrimination is
harder to identify and rectify. Culturaltraditions can perpetuate social exclusion and discrimination fromgeneration to generation, as genderstereotypes remain widely acceptedand go unchallenged.
Eliminating gender discrimination and empowering women will requireenhancing women’s influence in thekey decisions that shape their livesand those of children in three distinctarenas: the household, the workplaceand the political sphere. A change forthe better in any one of these realmsinfluences women’s equality in theothers and has a profound and posi-tive impact on children everywhere.This report intends to provide a roadmap to accelerate progess towardsgender equality and empoweringwomen through education, financing,legislation, legislative quotas, engag-ing men and boys, women empower-ing women and improved researchand data.
SUMMARY
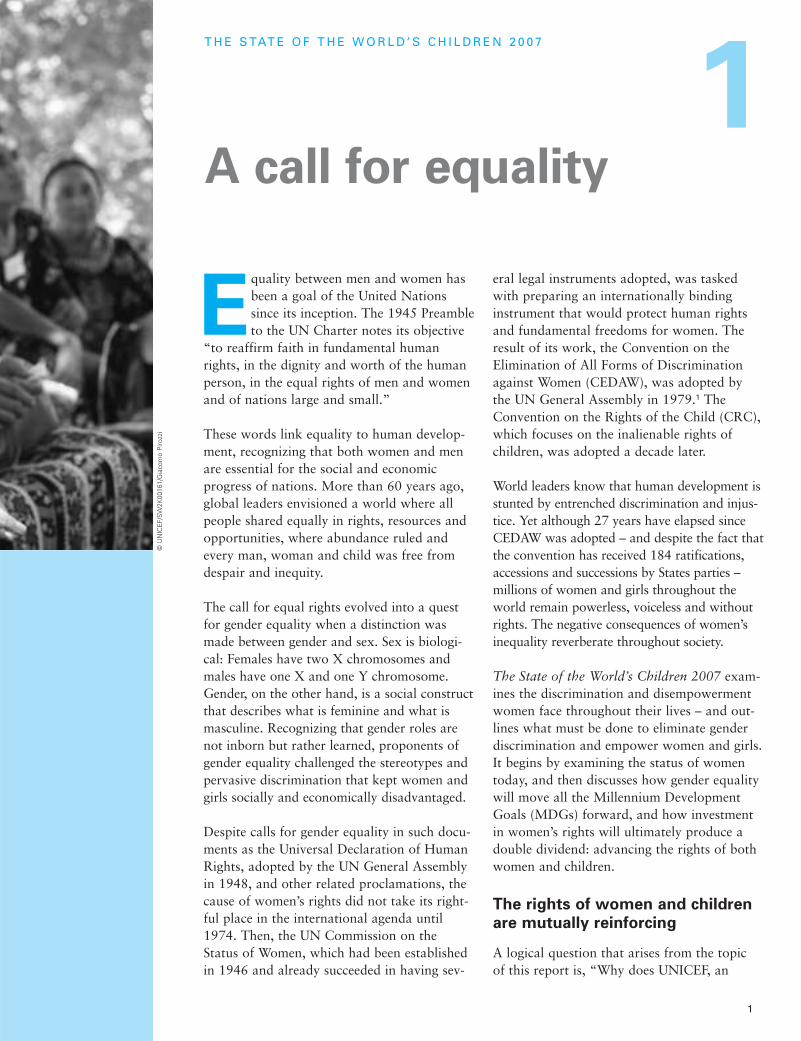
T H E S TAT E O F T H E W O R L D ’ S C H I L D R E N 2 0 0 7
A call for equality
Equality between men and women hasbeen a goal of the United Nationssince its inception. The 1945 Preambleto the UN Charter notes its objective
“to reaffirm faith in fundamental humanrights, in the dignity and worth of the humanperson, in the equal rights of men and womenand of nations large and small.”
These words link equality to human develop-ment, recognizing that both women and menare essential for the social and economicprogress of nations. More than 60 years ago,global leaders envisioned a world where allpeople shared equally in rights, resources andopportunities, where abundance ruled andevery man, woman and child was free fromdespair and inequity.
The call for equal rights evolved into a questfor gender equality when a distinction wasmade between gender and sex. Sex is biologi-cal: Females have two X chromosomes andmales have one X and one Y chromosome.Gender, on the other hand, is a social constructthat describes what is feminine and what ismasculine. Recognizing that gender roles arenot inborn but rather learned, proponents ofgender equality challenged the stereotypes andpervasive discrimination that kept women andgirls socially and economically disadvantaged.
Despite calls for gender equality in such docu-ments as the Universal Declaration of HumanRights, adopted by the UN General Assemblyin 1948, and other related proclamations, thecause of women’s rights did not take its right-ful place in the international agenda until1974. Then, the UN Commission on theStatus of Women, which had been establishedin 1946 and already succeeded in having sev-
eral legal instruments adopted, was tasked with preparing an internationally bindinginstrument that would protect human rightsand fundamental freedoms for women. Theresult of its work, the Convention on theElimination of All Forms of Discriminationagainst Women (CEDAW), was adopted bythe UN General Assembly in 1979.1 TheConvention on the Rights of the Child (CRC),which focuses on the inalienable rights of children, was adopted a decade later.
World leaders know that human development isstunted by entrenched discrimination and injus-tice. Yet although 27 years have elapsed sinceCEDAW was adopted – and despite the fact thatthe convention has received 184 ratifications,accessions and successions by States parties –millions of women and girls throughout theworld remain powerless, voiceless and withoutrights. The negative consequences of women’sinequality reverberate throughout society.
The State of the World’s Children 2007 exam-ines the discrimination and disempowermentwomen face throughout their lives – and out-lines what must be done to eliminate genderdiscrimination and empower women and girls.It begins by examining the status of womentoday, and then discusses how gender equalitywill move all the Millennium DevelopmentGoals (MDGs) forward, and how investmentin women’s rights will ultimately produce adouble dividend: advancing the rights of bothwomen and children.
The rights of women and children
are mutually reinforcing
A logical question that arises from the topic of this report is, “Why does UNICEF, an
1©
UN
ICE
F/S
W2K
0016
1/G
iaco
mo
Piro
zzi
1

organization that advocates for children, mon-itor women’s rights?” The answer is twofold.
First, as this report demonstrates, genderequality furthers the cause of child survival anddevelopment. Because women are the primarycaregivers for children, women’s well-beingcontributes to the well-being of their offspring.Healthy, educated and empowered women aremore likely to have healthy, educated and con-fident daughters and sons. Women’s autonomy,defined as the ability to control their own livesand to participate in making decisions thataffect them and their families, is associatedwith improved child nutrition (see Chapter 2,pages 24). Other aspects of gender equality,such as education levels among women, alsocorrelate with improved outcomes for chil-dren’s survival and development.2
By upholding women’s rights, societies alsoprotect girl children and female adolescents.Gender equality means that girls and boys
have equal access to food, health care, educa-tion and opportunities. Evidence has shownthat women whose rights are fulfilled aremore likely to ensure that girls have access toadequate nutrition, health care, education andprotection from harm.
Second, gender equality is essential to creatingthe world envisioned in the MillenniumDeclaration, a world of peace, equity, toler-ance, security, freedom, respect for the envi-ronment and shared responsibility, in whichspecial care and attention is given to the mostvulnerable people, especially children. This isthe world that the international communityhas pledged to strive for – a world fit for bothwomen and children.
Nothing less than the full participation of allmembers of society is needed to ensure sufficienthuman progress to meet the Millennium Agenda.World leaders at the UN Millennium Summit in2000 understood this. They acknowledged thatgender equality will empower women to over-come poverty, with multiple benefits for theirfamilies, communities and countries.
The Millennium agenda reflects this recog-nition of the centrality of gender equality to human development. The MillenniumDeclaration specifically calls for the full implementation of both the Convention on theElimination of All Forms of Discriminationagainst Women and the Convention on theRights of the Child; the conventions are identi-fied as key human rights standards for meetingthe Millennium Development Goals. Thesegoals, the international community’s guides to sustainable development, set time-sensitivebenchmarks for promoting gender equality and empowering women. But gender equality,according to the Millennium agenda, is notsimply a method for accelerating human development: It is also morally right.
Complementarities and tensions between
the two conventions
Since the status of women and the well-being of children are deeply intertwined, advocatesfor children would be remiss if they failed tochampion the cause of gender equality. TheConvention on the Elimination of all Forms
© U
NIC
EF/
HQ
04-1
287/
Gia
com
o P
irozz
i
2 T H E S T A T E O F T H E W O R L D ’ S C H I L D R E N 2 0 0 7
of Discrimination against Women (CEDAW)and the Convention on the Rights of the Child(CRC) are sister treaties – inexorably linked inmoving communities towards full humanrights. Each delineates specific entitlementsthat cannot be abrogated due to age, gender,economic class or nationality. The two treatiesare complementary, overlapping in their callfor precise rights and responsibilities and fill-ing in crucial gaps that may exist when eitherstands alone.
Several articles of CEDAW address rights pertinent to children, including equality (arti-cles 2 and 15), protecting maternity (article 4),adequate health care (article 12) and sharedparental responsibility (article 16). The CRCcalls for equal access for girls and boys to education and health care. Both conventionsdemand freedom from violence and abuse andare based on principles of non-discrimination,participation and accountability.
The treaties are not perfectly harmonious: Thereare areas of tension. For instance, some support-ers of gender equality believe that the CRCstereotypes women as mothers, limiting their life
options. Some child rights advocates think thatCEDAW focuses too much on a woman’s rightto self-actualization and may unintentionallysubvert the importance of motherhood. Despitethese differences, the two conventions holdmore in common than in opposition – they setthe standards for an equitable world in whichthe rights of every human being – female andmale, old and young – are respected.
The rights of women are less widely
accepted than those of children
Although both treaties have gained widespreadendorsement, CEDAW has had the tougherroad to acceptance and ratification. Somenations that readily accept the concept thatchildren have rights are less willing to concedethat women also have rights. And while 184countries are parties to CEDAW, many of thesignatures were submitted with reservations to specific articles. In fact, CEDAW containsamong the highest number of reservations ofany United Nations treaty, underscoring world-wide resistance to women’s rights.3
Rhetorical support for CEDAW and the CRChas been strong. In practice, however, neither
0
20
40
60
80
100
Easternand
SouthernAfrica
West and
CentralAfrica
Middle East and
NorthAfrica
SouthAsia
East Asiaand
Pacific
LatinAmerica
andCaribbean
MaleFemale
CEE/CIS
Per
cen
t
Easternand
SouthernAfrica
West and
CentralAfrica
Middle East and
NorthAfrica
SouthAsia
East Asiaand
Pacific**
LatinAmerica
andCaribbean
Per
cen
t
0
10
20
30
40
50
60
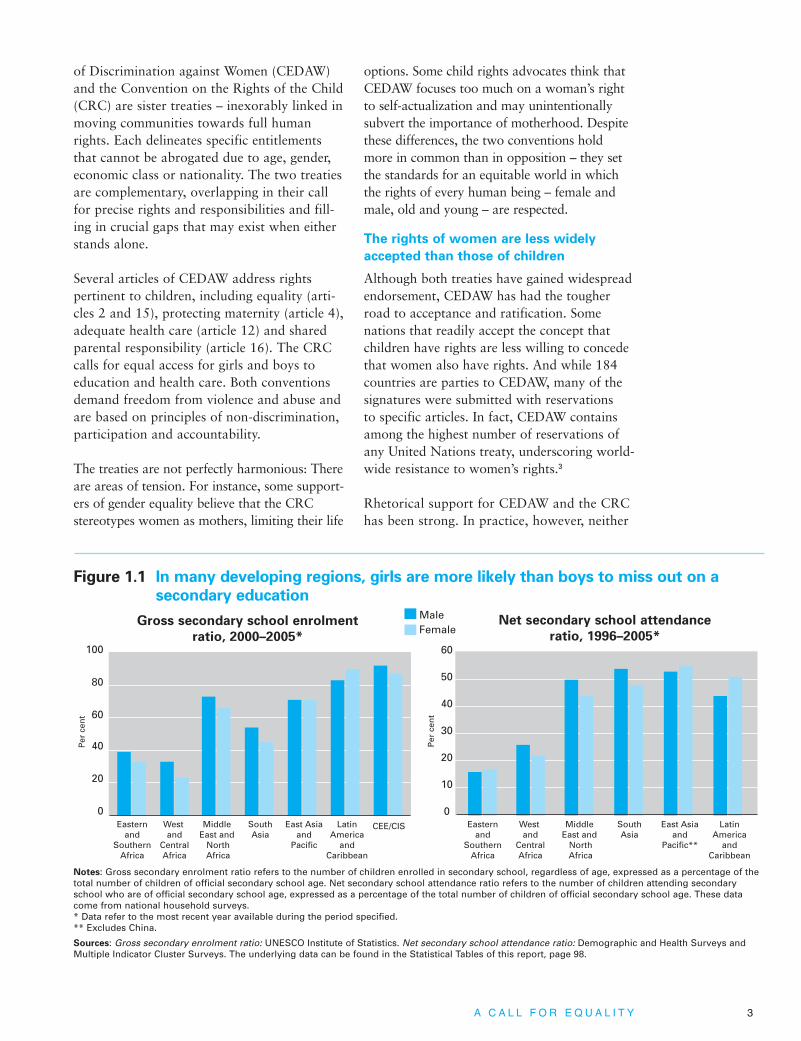
Figure 1.1 In many developing regions, girls are more likely than boys to miss out on a
secondary education
Notes: Gross secondary enrolment ratio refers to the number of children enrolled in secondary school, regardless of age, expressed as a percentage of thetotal number of children of official secondary school age. Net secondary school attendance ratio refers to the number of children attending secondaryschool who are of official secondary school age, expressed as a percentage of the total number of children of official secondary school age. These datacome from national household surveys. * Data refer to the most recent year available during the period specified.** Excludes China.
Sources: Gross secondary enrolment ratio: UNESCO Institute of Statistics. Net secondary school attendance ratio: Demographic and Health Surveys andMultiple Indicator Cluster Surveys. The underlying data can be found in the Statistical Tables of this report, page 98.
Gross secondary school enrolment
ratio, 2000–2005*
Net secondary school attendance
ratio, 1996–2005*
A C A L L F O R E Q U A L I T Y 3

Foeticide and infanticide
Gender discrimination begins early.Modern diagnostic tools for pregnan-cy have made it possible to determinea child’s sex in the earliest phase.Where there is a clear economic orcultural preference for sons, the mis-use of these techniques can facilitatefemale foeticide. Although there is noconclusive evidence to confirm suchillegal misuse, birth histories and census data reveal an unusually highproportion of male births and malechildren under five in Asia, notably in China and India, suggesting sex-selective foeticide and infanticide inthe world’s two most populous coun-tries – despite initiatives to eradicatethese practices in both countries.
The middle years
A principal focus of the middle yearsof childhood and adolescence isensuring access to, and completionof, quality primary and secondaryeducation. With a few exceptions, it is mostly girls who suffer from educa-tional disadvantage.
Primary education
For every 100 boys out of school,there are 115 girls in the same situa-tion. Though the gender gap has been closing steadily over the pastfew decades, nearly 1 of every 5 girlswho enrols in primary school indeveloping countries does not com-plete a primary education. Missingout on a primary education deprives agirl of the opportunity to develop toher full potential. Research has shownthat educated women are less likely to die in childbirth and are more likelyto send their children to school.Evidence indicates that the under-five mortality rate falls by about half for mothers with primary school education.
Secondary education
Recent UNICEF estimates indicate that an average of only 43 per cent of girls of the appropriate age in thedeveloping world attend secondaryschool. There are multiple reasons for this: There may simply be no secondary school for girls to attend –many developing countries anddonors have traditionally focused on offering universal primary educa-tion and neglected to allocate theresources to increase enrolment andattendance in secondary education. A girl’s parents may conclude thatthey cannot afford secondary educa-tion or may take the traditional viewthat marriage should be the limit ofher ambitions.
Secondary education has multiplebenefits for women and children. It is singularly effective in delayingthe age at which a young woman firstgives birth and it can enhance free-dom of movement and maternalhealth. It also strengthens women’sbargaining power within households(see Chapter 2), and is a crucial factorin providing opportunities for women’seconomic and political participation(see Chapters 3 and 4).
Adolescence
Among the greatest threats to adoles-cent development are abuse, exploita-tion and violence, and the lack of vitalknowledge about sexual and repro-ductive health, including HIV/AIDS.
Female genital mutilation/cutting
Female genital mutilation/cutting(FGM/C) involves partial or totalremoval of, or other injuries to,female genitalia for cultural, non-medical reasons. The practice ofFGM/C mainly occurs in countries insub-Saharan Africa, the Middle East
and North Africa and some parts ofSouth-East Asia. It is estimated thatmore than 130 million women andgirls alive today have been subjectedto FGM/C. FGM/C can have gravehealth consequences, including thefailure to heal, increased susceptibilityto HIV infection, childbirth complica-tions, inflammatory diseases and uri-nary incontinence. Severe bleedingand infection can lead to death.
Child marriage and premature
parenthood
Child or early marriage refers to marriages and unions where one orboth partners are under the age of 18.Globally, 36 per cent of women aged20–24 were married or in union beforethey reached their 18th birthday, mostcommonly in South Asia and sub-Saharan Africa. Child marriage is along-standing tradition in areas whereit is practised, making protest some-times barely possible. Parents mayconsent to child marriages out of economic necessity, or because theybelieve marriage will protect girlsfrom sexual assault and pregnancyoutside marriage, extend girls’ child-bearing years or ensure obedience totheir husband’s household.
Premature pregnancy and motherhoodare an inevitable consequence of childmarriage. An estimated 14 million ado-lescents between 15 and 19 give birtheach year. Girls under 15 are five timesmore likely to die during pregnancyand childbirth than women in theirtwenties. If a mother is under 18, herbaby’s chance of dying in the first yearof life is 60 per cent greater than thatof a baby born to a mother older than19. Even if the child survives, he or sheis more likely to suffer from low birth-weight, undernutrition and late physi-cal and cognitive development.
Gender discrimination across the life cycle
4 T H E S T A T E O F T H E W O R L D ’ S C H I L D R E N 2 0 0 7

Sexual abuse, exploitation and
trafficking
The younger girls are when they firsthave sex, the more likely it is thatintercourse has been imposed onthem. According to a World HealthOrganization study, 150 million girlsand 73 million boys under the age of18 experienced forced sexual inter-course or other forms of physical andsexual violence in 2002. The absenceof a minimum age for sexual consentand marriage exposes children topartner violence in some countries.
An estimated 1.8 million children areinvolved in commercial sex work.Many are forced into it, whether theyare sold into sexual slavery by des-perately poor families or abductedand trafficked into brothels or otherexploitative environments. Childrenexploited in the commercial sexindustry are subjected to neglect, sexual violence and physical and psychological abuse.
Sexual and reproductive health
Because unprotected sex carries the risk of pregnancy and sexuallytransmitted infection, including HIV,knowledge of sexual and reproductivehealth is essential for the safety ofyoung people. Information alone cannot provide protection, but it iscertainly a first step. Nonetheless,adolescents around the world contin-ue to have limited knowledge ofreproductive health issues and therisks they face.
HIV/AIDS
By 2005, nearly half of the 39 millionpeople living with HIV were women. In parts of Africa and the Caribbean,young women (aged 15–24) are up tosix times more likely to be infectedthan young men their age. Women
are at greater risk of contracting HIVthan men. One important explanationis physiological – women are at leasttwice as likely as men to becomeinfected with HIV during sex. Theother crucial, and largely reversible,factor is social – gender discrimina-tion denies women the negotiatingpower they need to reduce their riskof infection. High rates of illiteracyamong women prevent them fromknowing about the risks of HIV infec-tion and possible protection strate-gies. A survey of 24 sub-SaharanAfrican countries reveals that twothirds or more of young women lackcomprehensive knowledge of HIVtransmission.
The dramatic increase in infectionamong women heightens the risk ofinfection among children. Infantsbecome infected through their moth-ers during pregnancy, childbirth orbreastfeeding. In 2005, more than 2 million children aged 14 years oryounger were living with HIV.
Motherhood and old age
Two key periods in many women’slives when the pernicious effects ofboth poverty and inequality can com-bine are motherhood and old age.
Maternal mortality
It is estimated that each year morethan half a million women – roughlyone woman every minute – die as aresult of pregnancy complications andchildbirth. Some 99 per cent of allmaternal deaths occur in developingcountries, with over 90 per cent ofthose in Africa and Asia. Two thirds ofmaternal deaths in 2000 occurred in13 of the world’s poorest countries.The same year, India alone accountedfor one quarter of all maternal deaths.One out of every 16 sub-Saharan
African women will die as a result ofpregnancy or childbirth, compared tojust 1 out of every 4,000 in industrial-ized countries. Moreover, motherless newborns are between 3 and 10 timesmore likely to die than newbornswhose mothers survive.
Many of these women’s lives could besaved if they had access to basichealth care services, including skilledattendants at all births and emer-gency obstetric care for women whodevelop complications.
Women in old age
Elderly women may face double discrimination on the basis of both gender and age. Women tend to livelonger than men, may lack control offamily resources and can face dis-crimination from inheritance andproperty laws. Many older women are plunged into poverty at a time oflife when they are very vulnerable.Only a few developing countries havesafety nets for older people in theform of non-contributory or means-tested pensions.
Grandmothers in particular possess agreat deal of knowledge and experi-ence related to all aspects of maternaland child health and care. In manyfamilies, they are a mainstay of child-care for working parents. Experiencehas shown that children’s rights areadvanced when programmes thatseek to benefit children and familiesalso include elderly women.
See References, page 88.
A C A L L F O R E Q U A L I T Y 5

convention has been fully implemented. While giving lip service to equality, govern-ments often fail to invest often limited publicresources in women and children or to challenge discriminatory customs, attitudesand beliefs.
Too often, legal watchdogs, civil society organizations and the media also shirk theirresponsibilities when they fail to monitor, publicly scrutinize or hold officials account-able for unfulfilled promises.
Enforcement of international conventions andnational laws pertaining to women and childrenfalls mainly to governments, and they must beultimately held accountable for the slow pace ofprogress. But resistance by individuals, familiesand communities has also waylaid genderequality and children’s rights. Male privilege, orthe belief that girls and women must be submis-sive, can leave them last in line for food, healthcare, education and economic opportunity.
All obstacles to gender equality, regardless of origin, must be dismantled so that deve-lopment can move forward. Although womenand girls are most directly harmed by genderinequality, its pernicious effects reverberateacross societies. Failure to secure equality for all has deleterious consequences for the moral, legal and economic fabric ofnations.
The pernicious nature of
gender inequality
Gender discrimination is pervasive. While the degrees and forms of inequality may vary,women and girls are deprived of equal accessto resources, opportunities and political powerin every region of the world. The oppressionof girls and women can include the preferencefor sons over daughters, limited personal andprofessional choices for girls and women, thedenial of basic human rights and outright gender-based violence.
Agree or strongly agree that “men make better political leaders than women do”
Proportion of male respondents who:
Agree or strongly agree that “when jobs are scarcemen should have more right to a job than a woman”
Agree or strongly agree that “university is more important for a boy than a girl”
7 countries inMiddle East and
North Africa
Per
cen
t
3 countries inSouth Asia
4 countries insub-Saharan
Africa
6 countries inEast Asia and Pacific
22 countries intransition
0
20
40
60
80
100
5 countries inLatin Americaand Caribbean
19 industrializedcountries
Figure 1.2 Men’s discriminatory attitudes towards women vary across regions but are
significant everywhere
UNICEF calculations are based on data derived from the World Values Survey, Round 4 (1999–2004). Data for each country and territory in the regionalaggregates are for the latest year available in the period specified. The following countries and territories are included in the regional aggregates cited:Middle East and North Africa: Algeria, Egypt, Islamic Republic of Iran, Iraq, Jordan, Morocco, Saudi Arabia. Latin America and Caribbean: Argentina,Bolivarian Republic of Venezuela, Chile, Mexico, Peru. South Asia: Bangladesh, India, Pakistan. East Asia and Pacific: China, Indonesia, Philippines, Republicof Korea, Singapore, Viet Nam. Sub-Saharan Africa: Nigeria, South Africa, Uganda, United Republic of Tanzania. Countries in transition: Albania, Belarus,Bosnia and Herzegovina, Bulgaria, Croatia, Czech Republic, Estonia, Hungary, Kyrgyzstan, Latvia, Lithuania, Montenegro, Poland, Romania, Republic ofMoldova, Russian Federation, Serbia, Slovakia, Slovenia, Ukraine, The former Yugoslav Republic of Macedonia, Turkey. Industrialized countries: Austria,Belgium, Canada, Denmark, Finland, France, Greece, Iceland, Ireland, Italy, Japan, Luxembourg, Malta, Netherlands, Portugal, Spain, Sweden, UnitedKingdom, United States. Notes on the methodology employed can be found in the References section, page 88.
Source: World Values Survey, <www.worldvaluessurvey.org>, accessed June 2006.
6 T H E S T A T E O F T H E W O R L D ’ S C H I L D R E N 2 0 0 7

Inequality is always tragic and sometimesfatal. Prenatal sex selection and infanticide,prevalent in parts of South and East Asia,show the low value placed on the lives of girlsand women and have led to unbalanced popu-lations where men outnumber women.4
Despite overall growth in educational enrol-ment, more than 115 million children of primary school age do not receive an elemen-tary education. With few exceptions, girls aremore likely than boys to be missing fromclassrooms across the developing world. Girlswho do enrol in school often drop out whenthey reach puberty for many reasons – thedemands of household responsibilities, a lackof school sanitation, a paucity of female rolemodels, child marriage or sexual harassmentand violence, among others.
Violence against women and girls
Girls and women are frequently victims ofphysical and sexual violence inside and outside
the home. Although such assaults are under-reported because of the stigma of the crime, a recent multi-country study by the WorldHealth Organization revealed that between 15 per cent and 71 per cent of women hadexperienced physical or sexual assault from an intimate partner.5 Domestic violence is themost common form of violence perpetratedagainst women.6
During armed conflict, rape and sexual assaultare often used as weapons of war. When complex emergencies force people to be dis-placed from their homes, women and girls are at increased risk of violence, exploitationand abuse – sometimes from the very securitypersonnel or other persons charged with theirprotection and safety.
Insidious forms of gender inequality
As despicable as deliberate negligence or brutal violence can be, insidious genderinequality may be equally destructive.
© U
NIC
EF/
HQ
06-0
510/
Indr
ias
Get
ache
w
A C A L L F O R E Q U A L I T Y 7

Attitudes, beliefs and practices thatserve to exclude women are oftendeeply entrenched, and in manyinstances closely associated with cultural, social and religious norms.Surveys, opinion polls and case stud-ies provide a good indication of theprevalence of gender discriminationin many countries.
A Gallup Poll conducted in five LatinAmerican countries (Argentina,Brazil, Colombia, El Salvador andMexico) found that half of therespondents believed society favoursmen over women. In Brazil, only 20per cent of respondents, both menand women, believe that societytreats both sexes equally, while morethan half of respondents in that coun-try, and in neighbouring Argentina,consider that women and men do not enjoy equal job opportunities.Although these results are drawnfrom a small sample, they may wellbe indicative of a broader recognitionof gender discrimination in society.
Examining social attitudes on specificissues, such as access to educationand income-generating opportunitiesfor women, reveals even more clear-ly the extent of gender discrimina-tion and how it compares acrosscountries. The World Values Surveyreveals that an alarmingly largenumber of men – who, as this reportwill show, often hold power in thehousehold allocation of resources for vital services such as educationand health care – believe that univer-sity education is more important fora boy than for a girl (see Figure 1.2,page 6 ).
Around two thirds of male respon-dents in Bangladesh indicate that uni-versity education for boys should be
prioritized over that of girls – an opin-ion echoed by around one third ormore of male respondents from theIslamic Republic of Iran, Mexico andUganda, among others. In some coun-tries, men’s opinions on this particularissue were less discriminatory, withonly 1 out of every 10 male respon-dents in China and less than 1 out ofevery 13 male respondents in theUnited States holding the same view.
These views on education are largelymirrored in attitudes to women’s workand participation in politics. Morethan 80 per cent of men in sevencountries surveyed in the Middle Eastand North Africa believe that whenjobs are scarce, men have more rightto work than women, and that theymake better political leaders thanwomen. In other regions, the propor-tion of men holding these views islower, but still significant.
The survey revealed that women’sviews can also be equally discrimina-tory towards their own sex, if notquite as extreme. A surprisingly largenumber of women respondents fromthe survey agreed or strongly agreedwith the statement that men makebetter political leaders than women –including over half of women respon-dents from Bangladesh, China,Islamic Republic of Iran and Uganda,over one third from Albania andMexico, and one out of every fivefrom the United States. This under-lines the fact that discriminatory atti-tudes towards women and girls arenot simply held by men, but alsoreflect norms and perceptions thatmay be shared by the entire society.Research has shown that whenwomen set aside these norms and thepressure to conform is relaxed, theirchoices and values are very different.
While such opinion polls and surveysoffer a window into the views of societies, they cannot show the trueextent of gender discrimination.Quantifiable indicators are needed in order to gain a clearer picture of theinequalities and inequities producedby gender discrimination againstwomen and girls. But as many nation-al and international surveys and cen-suses are often not disaggregated bysex, such indicators are relativelyscarce. Nonetheless, the data avail-able point to a clear conclusion: gen-der inequalities remain stubbornlyentrenched in all regions of the world.
An attempt to capture gender discrim-ination in a single indicator is theUnited Nations Development Pro-gramme Gender EmpowermentMeasure (GEM), which assesses gen-der equality in key areas of economicand political participation in decision-making. The measure includes esti-mated earned income (a crucialdeterminant of a family member’sinfluence on household decisions), thepercentage of women working in sen-ior positions and the percentage ofwomen in parliament. Genderempowerment as measured by GEMis lowest in countries in the MiddleEast and North Africa and South Asia,and highest in industrialized countries,although there is wide variationacross regions.
While poorer countries tend to havelower levels of gender empower-ment, there is no clear evidence thatgender inequalities automaticallydiminish at higher levels of income.Accordingly, low income need not bea barrier to higher levels of genderempowerment.
See References, page 88.
Gender discrimination and inequalities across regions
8 T H E S T A T E O F T H E W O R L D ’ S C H I L D R E N 2 0 0 7
Institutional discrimination is harder to identify and rectify. Cultural traditions canperpetuate inequality and discrimination fromgeneration to generation, as gender stereotypesremain accepted and unchallenged.
The unequal division of household labour,such as requiring girls and women to trekmany kilometres to fetch water and fire-wood, or the uneven allocation of householdresources, such as giving women and girlsless food or medical care, are examples of more subtle forms of inequality. Theseingrained forms of discrimination often keepindividuals, families and societies trapped inpoverty and undermine economic, politicaland social development.
If poverty is to become history, then genderinequality must first be eliminated. Bold initiatives and unflinching determination
are required to end individual and institu-tional gender discrimination. Attitudes, cus-toms and values that are detrimental towomen and girls must be confronted. Nohistory, legacy, religion or cultural traditioncan justify inequality and disempowerment.
The double dividend
of gender equality
Despite ingrained gender inequality, the statusof women has improved in the past threedecades. An increased awareness of discrimina-tory practices and outcomes – including physi-cal and sexual violence, female genitalmutilation/cutting (FGM/C), disproportionatenumbers affected by HIV/AIDS and femaleilliteracy, among others – has fostered greaterdemand for change. By promoting legal andsocial reforms, proponents of gender equalityhave begun to reshape the social and political
© U
NIC
EF/
HQ
05-1
568/
Gia
com
o P
irozz
i
A C A L L F O R E Q U A L I T Y 9

landscape. And while gender continues toinfluence people’s choices and challenges, inmany parts of the world a girl born in 2007will probably have a brighter future than a girlborn when CEDAW was adopted in 1979.
Today, women and girls have access to opportunities that were previously restricted.Primary school enrolment rates for girls havejumped and the educational gender gap is nar-rowing. Women are entering the labour forcein greater numbers. And women’s politicalrepresentation is increasing in many parts ofthe world.
In 2006, for instance, Chile and Jamaicaelected women for the first time as theirheads of government. (Chile’s president,Michelle Bachelet, is also head of state.) Inaddition, the Republic of Korea appointed itsfirst woman prime minister in April 2006,bringing the total number of female heads ofstate or government in the world to 14.7
While that number is miniscule, consideringthat there are 192 UN Member States, femalegovernment leadership was unheard of lessthan 50 years ago.8
Gains in gender equality not withstanding,far too many women and girls have been left behind and remain voiceless and power-less. Women are disproportionately affectedby poverty, inequality and violence. It iswidely estimated that women make up themajority of the world’s poor,9 comprise nearly two thirds of the people who are illiterate,10 and, along with children, accountfor 80 per cent of civilian casualties duringarmed conflict.11
All Member States of the United Nations,regardless of their political, religious or ethnic composition, spoke with one voicewhen the UN pledged to make the world fit for children at the General AssemblySpecial Session on Children in May 2002.
© U
NIC
EF/
HQ
05-1
597/
Gia
com
o P
irozz
i
10 T H E S T A T E O F T H E W O R L D ’ S C H I L D R E N 2 0 0 7
Rwanda
Nigeria
Namibia
Mozambique
Mali
Malawi
Madagascar
Lesotho
Kenya
Ghana
Gabon
Congo
Chad
Cameroon
Burkina Faso
Botswana
Benin
0 10 20 30 40 50 60
Tanzania, UnitedRep. of
0 5 10 15 20
FemaleMale
FemaleMale
Rwanda
Nigeria
Namibia
Mozambique
Mali
Malawi
Madagascar
Lesotho
Kenya
Ghana
Gabon
Congo
Chad
Cameroon
Burkina Faso
Botswana
Benin
Tanzania, UnitedRep. of
Per cent
Per cent
Zambia
Uganda
Zambia
Uganda
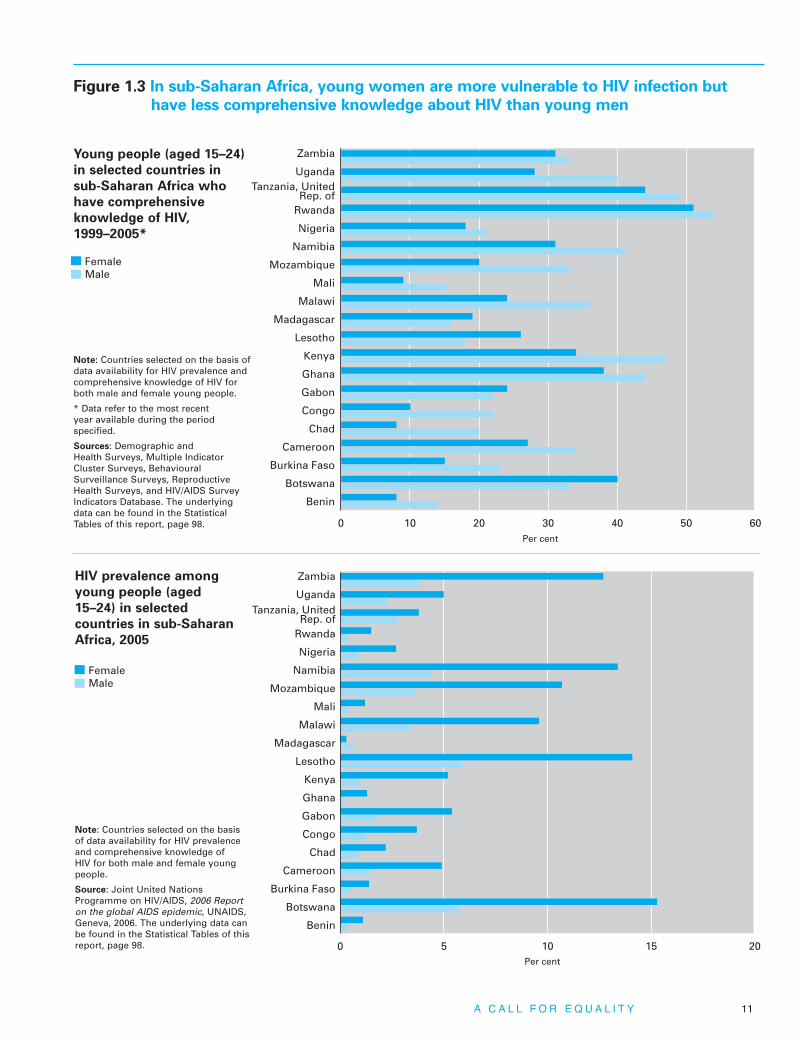
Figure 1.3 In sub-Saharan Africa, young women are more vulnerable to HIV infection but
have less comprehensive knowledge about HIV than young men
Young people (aged 15–24)
in selected countries in
sub-Saharan Africa who
have comprehensive
knowledge of HIV,
1999–2005*
Note: Countries selected on the basis ofdata availability for HIV prevalence andcomprehensive knowledge of HIV forboth male and female young people.
* Data refer to the most recent year available during the period specified.
Sources: Demographic and Health Surveys, Multiple IndicatorCluster Surveys, BehaviouralSurveillance Surveys, ReproductiveHealth Surveys, and HIV/AIDS SurveyIndicators Database. The underlyingdata can be found in the StatisticalTables of this report, page 98.
HIV prevalence among
young people (aged
15–24) in selected
countries in sub-Saharan
Africa, 2005
Note: Countries selected on the basisof data availability for HIV prevalenceand comprehensive knowledge of HIV for both male and female youngpeople.
Source: Joint United NationsProgramme on HIV/AIDS, 2006 Reporton the global AIDS epidemic, UNAIDS,Geneva, 2006. The underlying data canbe found in the Statistical Tables of thisreport, page 98.
A C A L L F O R E Q U A L I T Y 11

But rallying around the cause of childrenwithout championing gender equality is likestocking a sports team with players but fail-ing to teach them how to play the game.
The intergenerational dividends
of gender equality
Women are the primary caregivers for children and thus ultimately shape children’slives. This is especially true in the most traditional, patriarchal societies where rolesand responsibilities are strictly delineated by gender. The well-being of women and children is inseparable. What is good forwomen is good for children with few, if any,exceptions.
Nations bear the consequences when womenare disempowered and deprived of humanrights. The cycle of poverty and despair is passed from generation to generation.Conversely, countries reap double dividendswhen gender equality is promoted and
ultimately attained. Women become healthy,educated, productive and able to help their children survive and thrive. These benefits are bequeathed to current and futuregenerations.
To maximize gender equality’s impact onpoverty reduction, education and sustainabledevelopment, women must have influence indecision-making in three distinct areas: thehousehold, the workplace and the politicalsphere. A change for the better in any one ofthese realms influences women’s equality inthe others. But halfway measures towardshuman rights are unacceptable. Anything lessthan unqualified support for gender equalityin all three areas will sabotage meaningfulprogress towards fulfilling the MDGs.
Equality in the household (Chapter 2)
Women’s access to power at the householdlevel has the most direct impact on familiesand children. Here is where decisions are
© A
rege
Dou
glas
Mog
eni/2
006
12 T H E S T A T E O F T H E W O R L D ’ S C H I L D R E N 2 0 0 7

made about the allocation of resources forfood, health care, schooling and other familynecessities.
When women are locked out of decisionsregarding household income and otherresources, they and their children are morelikely to receive less food, and to be deniedessential health services and education.Household chores, such as fetching water,gathering firewood or caring for the young orinfirm, are delegated to mothers and daugh-ters, which keeps them out of the paid labourforce or school. When women share equallyin household decisions, they tend to providemore adequately and fairly for their children.
Equality in the workplace (Chapter 3)
At work, women are often victimized by discrimination. They may be excluded frommore highly remunerated occupations andare frequently paid less than men for thesame work. Women and girls are oftenrecruited into domestic work outside theirown homes and may be forced to live awayfrom their families, at times in oppressive,dangerous conditions. Destitute women andgirls may find the sex trade their only option
for employment when all other economicdoors have been shut.
Ending the wage gap, opening higher-payingfields to women and allowing female workersmore decision-making power will greatly ben-efit children. As women become economicallyproductive, their spheres of influence increase.They become able to make choices not onlyfor themselves, but also for their children.When a woman brings income or assets intothe household, she is more likely to be includ-ed in decisions on how the resources will bedistributed. Historically, when women holddecision-making power, they see to it thattheir children eat well, receive adequate med-ical care, finish school and have time for recre-ation and play. Women who have access tomeaningful, income-producing work are morelikely to increase their families’ standards ofliving, leading children out of poverty.
Equality in government and politics
(Chapter 4)
Increasing women’s political participation isan MDG objective in its own right (MDG 3,Target 4, Indicator 12). Empowering womenin the political arena can help change societies.
More developed regions
Less developed regionsexcluding theleast developedcountries
Least developedcountries
China
6%1%
28%
65%
12%
14%12%
62%
Figure 1.4 More than 1 out of every 4 births to an adolescent mother (aged 15–19)
occurs in the least developed countries
Source: United Nations Population Division, ‘World Population Prospects: The 2004 Revision Database’, <www.esa.un.org/unpp/>, accessed September 2006. Note: The country composition of each regional group can be found in References, page 88.
Global births by mothers aged 15–19,
2000–2005
Global population of female adolescents,
aged 15–19, 2005
A C A L L F O R E Q U A L I T Y 13

Easternand
SouthernAfrica
West and
CentralAfrica
Middle East and
NorthAfrica
SouthAsia
East Asiaand
Pacific
LatinAmerica
andCaribbean
Antenatal care coverage
Skilled attendant at delivery
CEE/CIS
Per
cen
t
Industrializedcountries
South Asia
4,000
770
160
360
43
100
16
15
1 in:
0
20
40
60
80
100
Latin America andCaribbean
Middle East andNorth Africa
Eastern andSouthern Africa
East Asia and Pacific
Industrialized countries
West and Central Africa
CEE/CIS
Figure 1.5 High rates of maternal death are associated with limited access
to health-care services for expectant mothers
Note: Antenatal care coverage refers to the percentage of women aged 15–24 attended at least once during pregnancy by askilled attendant (doctor, nurse or midwife). Data on antenatal care coverage are not available for industrialized countries.Skilled attendant at delivery refers to the percentage of births attended by skilled health personnel (doctors, nurses or midwives).
* Data refer to the most recent year available during the period specified.
Sources: Demographic and Health Surveys, Multiple Indicator Cluster Surveys, World Health Organization and UNICEF. The underlying data can be found in the Statistical Tables of this report, page 98.
Health-care services for expectant mothers, 1997–2005*
Lifetime risk of maternal death, 2000
Note: The lifetime risk of maternal death takes into account both the probability of becoming pregnant and the probability of dying as a result of that pregnancy, accumulated across a women's reproductive years.
Source: World Health Organization and UNICEF. The underlying data can be found in the Statistical Tables of this report, page 98.
14 T H E S T A T E O F T H E W O R L D ’ S C H I L D R E N 2 0 0 7

Their involvement in governing bodies,whether local or national, leads to policiesand legislation that focus on women, chil-dren and families. In a survey of 187women who hold public office in 65 coun-tries, the Inter-Parliamentary Union foundthat about nine-tenths believe they have aresponsibility to represent women’s interestsand advocate for other members of society.12
Women can play key roles in securing peace.Female representation in peace negotiationsand post-conflict reconstruction is vital to ensuring the safety and protection of children and other vulnerable populations.Women’s direct influence on politics andpublic policy bodes well for peace, securityand prosperity.
Empowering women and girls
The status of women is a crucial element foraccurately gauging the state of the world’schildren and assessing what the future holdsfor them. Disaggregated data on life expectan-cy, infant and under-five mortality, educationalenrolment and completion, as well as otherquantifiable statistics, are necessary to assessprogress towards the MDGs. But attitudes,cultural beliefs and ingrained bigotry are difficult to quantify; consequently, qualitativeevidence and women’s reporting on their experiences are also needed to promote genderequality, poverty reduction and sustainabledevelopment.
The following chapters will analyse both quantitative indicators and qualitative evi-dence about the status of women and its relationship to child survival and develop-ment. The final chapter of the report intendsto provide a road map for maximizing genderequality through seven key modes: education,financing, legislation, legislative quotas, engag-ing men and boys, women empowering
women, and improved research and data. Foronly when equality is achieved will women beempowered, and only then will they and theirchildren thrive.
It has been nearly 30 years since CEDAW was adopted by the United Nations. One canonly imagine what the lives of girls born in1979 would have been like had the convention been fully supported and implemented. A generation of empowered women would have made a world of difference.
As a Chinese adage says, “Women hold uphalf the sky.” The next generation cannot wait another three decades for its rights.Women and girls must have the means andsupport to fulfil their potential and fully enjoy their rights.
A world fit for women is a world
fit for children
Two years after the Millennium Summit, theUN General Assembly Special Session onChildren in May 2002 linked economic devel-opment to the creation of a world fit for chil-dren. A world fit for children is also a worldfit for women. They are inseparable and indi-visible – one cannot exist without the other.
Lofty ambitions, good intentions and catchyslogans will not produce human progress. Theroad to sustainable development cannot bepaved with half measures. Sound investmentsand a resolute commitment to justice, genderequality and children are required.
If all citizens are allowed the opportunity to reach their potential, then nations willthrive. No argument against gender equality,whether based on traditions, customs or outright bigotry, can disprove the claim thatwomen’s rights are good for children and ultimately good for the world.
A C A L L F O R E Q U A L I T Y 15

For children, themost important
actors in the world are not politicalleaders and heads of developmentagencies, but the parents and care-givers who make crucial householddecisions each day. Evidence sug-gests that men and women frequentlyhave very different roles and priori-ties when it comes to household decision-making. Women generallyplace a higher premium on welfare-related goals and are more likely touse their influence and the resourcesthey control to promote the needs of families, particularly children.
• A growing body of evidence indi-cates that household decisions are often made through a bargain-ing process that is more likely tofavour men than women. Factorsunderlying women’s influence indecision-making processes includecontrol of income and assets, ageat marriage and level of education.
• According to data from the Demo-graphic and Health Surveys, in only10 out of the 30 developing countriessurveyed did half or more of womenparticipate in all household deci-sions, including those regardingmajor household spending, theirown health care and their visits withfriends or relatives outside the home.
• The consequences of women’s exclu-sion from household decisions canbe as dire for children as they are forwomen themselves. According to astudy conducted by the InternationalFood Policy Research Institute, ifmen and women had equal influencein decision-making, the incidence ofunderweight children under threeyears old in South Asia would fall by up to 13 percentage points, result-ing in 13.4 million fewer undernour-ished children in the region; insub-Saharan Africa, an additional 1.7 million children would be ade-quately nourished.
• A woman’s empowerment withinthe household increases the likeli-hood that her children, particularlygirls, will attend school. A UNICEFsurvey of selected countries acrossthe developing world found that, on average, children with unedu-cated mothers are at least twice as likely to be out of school thanchildren whose mothers attendedprimary school.
• Men play a vital role in promotingegalitarian decision-making. Throughsimple and direct strategies, such assharing responsibility for householdchores and childcare, men can helpcombat gender discrimination inhouseholds and communities.
• Women themselves are the mostimportant catalysts for change. Bychallenging and defying discrimina-tory attitudes in their communities,women’s groups can advance therights of girls and women for generations to come.
SUMMARY

T H E S TAT E O F T H E W O R L D ’ S C H I L D R E N 2 0 0 7
Equality in the household
Everyone interested in development andthe progress of the world’s childrenwaits on the ‘big’ decisions: the con-clusions of the G8 on aid and debt;
the outcome of the Doha Round of tradenegotiations; statements by internationalorganizations and world leaders on major ini-tiatives and positions. There is no doubtingthe importance of these negotiations in deter-mining development outcomes. But there areother decisions, closer to home, that can havea larger and more direct impact on children’slives: How will scarce food be divided amongparents and siblings? Who will go to schooland who will work in the field? Is a child’stemperature high enough to warrant a costlyand distant trip to the doctor’s office?
For children, the most important actors in theworld are not political leaders and heads ofdevelopment agencies, but the parents andcaregivers who make these crucial householddecisions on a daily basis. How members ofthe household use their collective resourcesdetermines the levels of nutrition, health care,education and protection that each familymember receives.
Household decisions: More
bargaining than cooperation
Every family is unique, and there is no simpleset of rules that can explain the dynamic ofdecision-making processes. Studies that exam-ine the dynamics of family decision-makingoften focus on the household. While this focusdoes not necessarily represent all interactionsamong family members, it does provide apractical means of understanding andanalysing everyday family dynamics.
Much of the study of household dynamics ispredicated on the assumption that house-holds function as a unit in which familymembers pool their time and resources toachieve a common set of goals (the unitarymodel). While many households are charac-terized by such cooperation and act as aredistributive or sharing unit, individualhousehold members do not always share the same priorities or preferences. Evidencesuggests that men and women frequentlyhave very different roles and priorities whenit comes to household decision-making.Decisions are often made through a bargain-ing process in which household memberseach attempt to use the resources they control for their own priorities.
Inequalities in household decision-making
The factors that determine which familymember will have the strongest say in house-hold decisions vary among households andacross cultures. The Demographic and HealthSurveys provide one of the most directsources of information on household decision-making dynamics. Questions from the sur-veys, which asked women in developingcountries to specify their level of influence inhousehold decisions, were aggregated by theresearch team to examine regional patterns of gender influence in household decision-making. Overall, the data paint a picture of extreme gender inequality. In only 10 ofthe 30 countries surveyed did 50 per cent ormore of women participate in all householddecisions, including those taken in regard to their own health care, major householdpurchases, daily household spending, andtheir visits with family or relatives outside of the household.1
2©
UN
ICE
F/H
Q98
--060
9/A
leja
ndro
Bal
ague
r
17

Percentage of women who say their husbands alone make the decisions regarding their health, 2000-2004*
10 20 30 40 50 60 700 80
Sub-Saharan Africa
Burkina Faso
Mali
Nigeria
Malawi
Benin
Cameroon
Rwanda
Zambia
Kenya
Tanzania (United Rep. of)
Uganda
Ghana
Mozambique
Zimbabwe
Madagascar
Eritrea
74.9
74.1
73.4
70.6
12.4
31.8
32.1
34.9
37.6
38.5
42.9
46.5
47.557.6
60.8
East Asia and
Pacific
Indonesia
Philippines
CEE/CIS
Armenia
Turkmenistan
Latin America and
Caribbean
Haiti
Peru
Nicaragua
Bolivia
Colombia
South Asia
Nepal
Bangladesh
Middle East and
North Africa
Egypt
Morocco
Jordan
12.7
4.9
20.2
9.3
21.3
15.7
11.3
10.4
51
48.1
41.1
33.1
11.7
9.3
8.5
Figure 2.1 Many husbands are making the decisions alone on their wife’s health
*Data refer to the most recent year available during the period specified. All countries with available data are presented in the chart.
Source: UNICEF calculations based on the data derived from Demographic and Health Surveys. The data were accessed from the DHS Statcompilerin June 2006. Notes on the methodology employed can be found in the References section, page 88.
18 T H E S T A T E O F T H E W O R L D ’ S C H I L D R E N 2 0 0 7

0 10 20 30 40 50 60 70 80
Sub-Saharan Africa
Malawi
Nigeria
Mali
Burkina Faso
Uganda
Tanzania (United Rep. of)
Rwanda
Cameroon
Kenya
Mozambique
Benin
Ghana
Eritrea
Zimbabwe
Madagascar
65.7
64.5
63.4
55.9
5.8
16.2
27
31.8
32.8
35.3
37.3
39
43.1
45.9
52.5
East Asia and
Pacific
Philippines
Indonesia
CEE/CIS
Armenia
Turkmenistan
Latin America and
Caribbean
Colombia
Peru
Haiti
Bolivia
South Asia
Bangladesh
Nepal
Middle East and
North Africa
Morocco
Jordan
Egypt
9
2.4
18
10.9
13.7
10.8
10
6.7
34.2
30.3
34.4
31.2
24.3
Percentage of women who say their husbands alone make the decisions on daily household expenditure, 2000-2004*
Figure 2.2 Many husbands are making the decisions alone on daily household
expenditure
*Data refer to the most recent year available during the period specified. All countries with available data are presented in the chart.
Source: UNICEF calculations based on the data derived from Demographic and Health Surveys. The data were accessed from the DHS Statcompilerin June 2006. Notes on the methodology employed can be found in the References section, page 88.
E Q U A L I T Y I N T H E H O U S E H O L D 19

Percentage of women who say their husbands alone make the decisions regarding visits to friends and relatives, 2000-2004*
10 20 30 40 50 60 700 80
Sub-Saharan Africa
Mali
Burkina Faso
Nigeria
Zambia
Tanzania (United Rep. of)
Benin
Cameroon
Uganda
Kenya
Malawi
Ghana
Mozambique
Rwanda
Zimbabwe
Eritrea
Madagascar
61.661.5
59.7
56.1
19.8
20.8
29.2
32.1
33.7
36.2
39.4
41.7
43.845
47.3
East Asia and
Pacific
Indonesia
Philippines
CEE/CIS
Armenia
Turkmenistan
Latin America and
Caribbean
Nicaragua
Peru
Bolivia
Colombia
Haiti
South Asia
Bangladesh
Nepal
Middle East and
North Africa
Morocco
Egypt
Jordan
10.8
10
16.2
10.4
18.4
12.5
12.4
8.7
35.9
33.7
28.8
25.8
16.8
9.2
7
Figure 2.3 Many husbands are making the decisions alone on visits to friends
and relatives
*Data refer to the most recent year available during the period specified. All countries with available data are presented in the chart.
Source: UNICEF calculations based on the data derived from Demographic and Health Surveys. The data were accessed from the DHS Statcompilerin June 2006. Notes on the methodology employed can be found in the References section, page 88.
20 T H E S T A T E O F T H E W O R L D ’ S C H I L D R E N 2 0 0 7

• Lack of control over health-care needs:Decisions on women’s health care are vital tothe health and well-being of both womenand children. In many households, notably inthose countries examined in South Asia andsub-Saharan Africa, women have little influ-ence in health-related decisions. In BurkinaFaso, Mali and Nigeria, for example, almost75 per cent of women reported that hus-bands alone make decisions about women’shealth care; in the two countries surveyed inSouth Asia, Bangladesh and Nepal, this ratiowas around 50 per cent. This exclusion com-promises the health and well-being of allfamily members, particularly children.
• Limited management of daily householdexpenditure: Household decisions on dailyexpenditure have a decisive impact on chil-dren’s well-being, education and, particularly,their health. Whether a family decides tospend its financial resources on the needs ofchildren or the personal preferences of adultsoften depends on which family members areinvolved in the decision-making process. Inmany households across the developingworld, men have a firm upper hand in deci-sions on household expenditures. In 7 of the15 countries surveyed in sub-Saharan Africa,more than 40 per cent of women indicatedthat their husbands had exclusive controlover daily household expenditures. In thecountries examined in the Middle East andNorth Africa and South Asia, approximately30 per cent of women felt excluded fromdecisions on household purchases, while in those countries surveyed CEE/CIS, EastAsia and Pacific and Latin America andCaribbean, women reported having a greaterdegree of control over these decisions.
• Exclusion from decisions on major house-hold purchases: Household decisions onlarge expenditures such as land, cars andlivestock can be crucial for families. Moneyspent on large purchases may be regarded asa wise long-term investment. However, theshort-term cost of acquiring these assets canconsume a large share of household incomethat might otherwise be used for moreimmediate household needs, such as medi-cine, school supplies and food.
Data from the Demographic and HealthSurveys suggest that men generally decide how much the household will allocatetowards major expenditures. In Nigeria, forexample, 78 per cent of women indicatedthat their husbands have exclusive controlover large purchases. Approximately 60 percent of women in Egypt and over a third ofwomen in Bangladesh and Nepal felt exclud-ed from such decisions. This contrasts withattitudes in the two countries surveyed inEast Asia and Pacific, Indonesia and thePhilippines, where fewer than 18 per cent ofwomen in both countries felt that they hadno say in such matters.
• Restricted mobility and freedom: Householddecisions regarding women’s mobility direct-ly affect their ability to provide for theirown needs as well as the needs of their children. Survey data suggest a high degreeof male control over women’s mobility ineach of the regions surveyed. In BurkinaFaso and Mali, approximately 60 per cent of women reported that husbands alonedecide when wives can visit with family orrelatives. One third of Bangladeshi husbandscontrol their wives’ mobility outside of thehome. In Latin America and the Caribbean,data from Nicaragua show that 18 per centof women require a man’s permission beforeleaving home to visit friends and family; in CEE/CIS, 16 per cent of Armenianwomen need to first secure their husbands’permission.2
Factors underlying household
decision-making processes
Household assessments such as Demographicand Health Surveys can provide a good indi-cation of which family members are likely toparticipate in household decisions, but they cannot explain why certain individuals in eachhousehold are able to dominate decision-makingprocesses. To understand the dynamics thatinfluence household decision-making processes,it is useful to consider the factors that determinethe structure of the family unit, as well as eachfamily member’s role within the household.
Gender discrimination in household decision-making is often rooted in patriarchal attitudes
E Q U A L I T Y I N T H E H O U S E H O L D 21

that value the social status of men overwomen. But the extent to which individualhouseholds conform to ‘traditional’ ideasabout the roles of men and women varies. Theability of family members to impose their ownpreferences in household decisions (bargainingpower) is influenced by social attitudes andother, more tangible, factors.3
According to a study based on householddecisions and gender, major determinants of influence in household decision-makinginclude control of income and assets, age,and access to and level of education.Examining these factors across a wide range of countries offers insights into the distribution of bargaining power in individ-ual households.4
Control of income and assets: The familymember who controls the greatest share ofhousehold income and assets often has thestrongest say in deciding whether thoseresources will be used to meet householdneeds.5 As the next chapter will illustrate, inboth industrialized and developing countries,women continue to lag behind men in terms ofincome-earning opportunities and ownershipand management of assets.
Age gaps: The distribution of household bar-gaining power is also influenced by a woman’sage at marriage and the age difference betweena woman and her husband. Evidence fromaround the world shows that the age gapbetween husbands and wives can vary enor-mously among households. The average age atfirst marriage in Western Europe is estimated tobe 27 for women and 30 for men. In develop-ing countries, age differences are far greater. InSouth Asia, for example, husbands are approxi-mately five years older than their wives; the gaprises to six years in sub-Saharan Africa (exclud-ing southern Africa).6 In cases of child marriage(defined as customary or statutory union whereone or both of the partners is under the age of18 years old), when the age gap between spous-es is most extreme, the burden of domesticwork and childcare severely constrains the lifechoices available to married girls and childmothers.7 This, in turn, affects the power thatwomen have over household decisions.
Levels of education: In addition to increasedlevels of knowledge, self-confidence andassertiveness, education confers social statusand increases income-earning potential. Aswith age gaps between married couples, thelevels of education of spouses vary among
© U
NIC
EF/
HQ
94-1
532/
Ras
heed
un N
abi
22 T H E S T A T E O F T H E W O R L D ’ S C H I L D R E N 2 0 0 7

households. The findings of a study undertak-en in 40 developing countries indicate that, onaverage, men tend to spend more time in education than women.
The education gap is widest in South Asia,where men on average spend 2.5 years morein school than women, declining to 1.3 yearsin sub-Saharan Africa, and 1 year in LatinAmerica and the Caribbean.8 Disparate levelsof education between men and women mayreinforce household gender inequalities, ensur-ing that women remain disadvantaged.
Domestic violence
Levels of education, earnings and asset owner-ship and age gaps are key in determining bar-gaining power between men and women withinthe household. Arguably of equal importance isthe threat of domestic violence. While physicaland sexual violence and other forms of abuseoccur in different domestic environments and indifferent guises, there is substantial evidence tosuggest that such acts are mainly perpetrated byadult men against women and girls.9 Domesticviolence threatens the physical health and emo-tional well-being of its victims and often forcesthem to endure subordinate positions and eco-nomic insecurity within their households.10
Household gender inequalities foster a permis-sive context for abusive relationships. AUNICEF study indicates that women whomarry at a young age are more likely tobelieve that it is sometimes acceptable for ahusband to beat his wife, and are more likelyto experience domestic violence than womenwho marry at an older age. In Kenya, forexample, 36 per cent of women who weremarried before the age of 18 believe that aman is sometimes justified in beating his wife,compared to 20 per cent of those who weremarried as adults.11
Violence against women and girls crosses the boundaries of race, culture, wealth andreligion. Every year, thousands of women are maimed or killed by rejected suitors inmany countries.12 A landmark World HealthOrganization multi-country study on women’shealth and domestic violence against womenreveals that of those interviewed, 37 per cent
of women in a Brazilian province, 56 per centof women in a province in the UnitedRepublic of Tanzania, and 62 per cent ofwomen in a province in Bangladesh reportedhaving experienced physical or sexual violenceby an intimate partner.13
The pattern is broadly similar for industrializedcountries. According to another key reportfrom the same organization, the World reporton violence and health, studies show that 40 per cent to 70 per cent of female murdervictims in Australia, Canada, Israel, SouthAfrica and the United States were killed bytheir husbands or boyfriends – often within the context of an ongoing abusive relation-ship.14 In the United Kingdom, 40 per cent of female homicide victims are killed by theirintimate partners.15
Where women have a fair say,
children benefit
The consequences of women’s exclusion fromhousehold decisions can be as dire for childrenas they are for women themselves. In familiesin which women are key decision-makers, theproportion of resources devoted to children isfar greater than in those in which women havea less decisive role. This is because women gen-erally place a higher premium than men on
East Asia and Pacific,22 million
West and Central Africa,
17 million
Eastern and SouthernAfrica, 16 million
Middle East andNorth Africa, 8 million
Latin America andCaribbean, 4 million
CEE/CIS,1 million
South Asia,78 million
Figure 2.4 Underweight prevalence among children
under five in the developing regions*
*UNICEF analysis is based on estimates of underweight prevalence in developing countries (1996-2005).
Source: United Nations Children’s Fund, Progress for Children: A report card on nutrition,Number 4, UNICEF, New York, May 2006, page 2.
E Q U A L I T Y I N T H E H O U S E H O L D 23
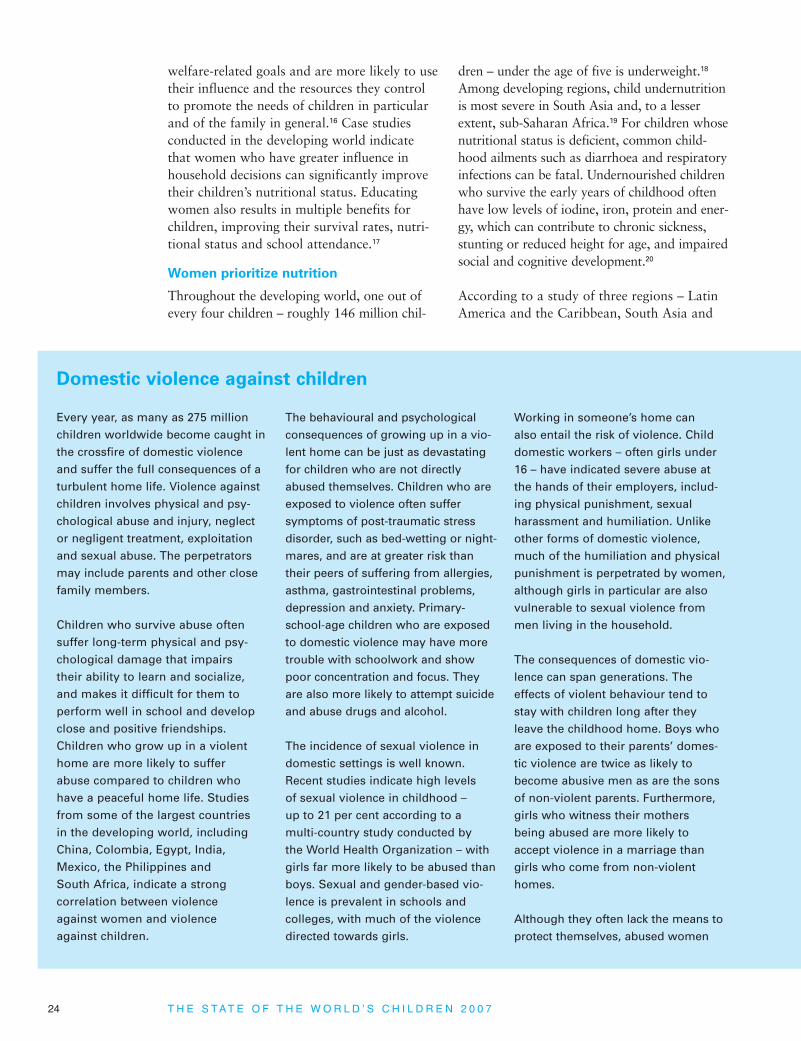
welfare-related goals and are more likely to usetheir influence and the resources they controlto promote the needs of children in particularand of the family in general.16 Case studiesconducted in the developing world indicatethat women who have greater influence inhousehold decisions can significantly improvetheir children’s nutritional status. Educatingwomen also results in multiple benefits forchildren, improving their survival rates, nutri-tional status and school attendance.17
Women prioritize nutrition
Throughout the developing world, one out ofevery four children – roughly 146 million chil-
dren – under the age of five is underweight.18
Among developing regions, child undernutritionis most severe in South Asia and, to a lesserextent, sub-Saharan Africa.19 For children whosenutritional status is deficient, common child-hood ailments such as diarrhoea and respiratoryinfections can be fatal. Undernourished childrenwho survive the early years of childhood oftenhave low levels of iodine, iron, protein and ener-gy, which can contribute to chronic sickness,stunting or reduced height for age, and impairedsocial and cognitive development.20
According to a study of three regions – LatinAmerica and the Caribbean, South Asia and
Every year, as many as 275 millionchildren worldwide become caught inthe crossfire of domestic violenceand suffer the full consequences of aturbulent home life. Violence againstchildren involves physical and psy-chological abuse and injury, neglector negligent treatment, exploitationand sexual abuse. The perpetratorsmay include parents and other close family members.
Children who survive abuse oftensuffer long-term physical and psy-chological damage that impairstheir ability to learn and socialize,and makes it difficult for them toperform well in school and developclose and positive friendships.Children who grow up in a violenthome are more likely to sufferabuse compared to children whohave a peaceful home life. Studiesfrom some of the largest countriesin the developing world, includingChina, Colombia, Egypt, India,Mexico, the Philippines and South Africa, indicate a strong correlation between violenceagainst women and violence against children.
The behavioural and psychologicalconsequences of growing up in a vio-lent home can be just as devastatingfor children who are not directlyabused themselves. Children who areexposed to violence often suffersymptoms of post-traumatic stressdisorder, such as bed-wetting or night-mares, and are at greater risk thantheir peers of suffering from allergies,asthma, gastrointestinal problems,depression and anxiety. Primary-school-age children who are exposedto domestic violence may have moretrouble with schoolwork and showpoor concentration and focus. Theyare also more likely to attempt suicideand abuse drugs and alcohol.
The incidence of sexual violence indomestic settings is well known.Recent studies indicate high levels of sexual violence in childhood – up to 21 per cent according to a multi-country study conducted by the World Health Organization – withgirls far more likely to be abused thanboys. Sexual and gender-based vio-lence is prevalent in schools and colleges, with much of the violencedirected towards girls.
Working in someone’s home can also entail the risk of violence. Childdomestic workers – often girls under16 – have indicated severe abuse atthe hands of their employers, includ-ing physical punishment, sexualharassment and humiliation. Unlikeother forms of domestic violence,much of the humiliation and physicalpunishment is perpetrated by women,although girls in particular are alsovulnerable to sexual violence frommen living in the household.
The consequences of domestic vio-lence can span generations. Theeffects of violent behaviour tend tostay with children long after theyleave the childhood home. Boys whoare exposed to their parents’ domes-tic violence are twice as likely tobecome abusive men as are the sonsof non-violent parents. Furthermore,girls who witness their mothersbeing abused are more likely toaccept violence in a marriage thangirls who come from non-violenthomes.
Although they often lack the means toprotect themselves, abused women
Domestic violence against children
24 T H E S T A T E O F T H E W O R L D ’ S C H I L D R E N 2 0 0 7

sub-Saharan Africa – conducted by theInternational Food Policy Research Institute, a leading global research organization onhunger and nutrition, there is a clear linkbetween regional differences in children’snutritional status and women’s decision-makingpower. Where women have low status and aredenied a voice in household decisions, they are more likely to be undernourished them-selves and less likely to have access toresources that they can direct towards chil-dren’s nutrition.21 In South Asia, wherebetween 40 per cent and 60 per cent ofwomen are underweight,22 approximately 45 per cent of children were born with low
birthweight in 2005 – the highest incidence ofunderweight births in the world.23
The same study concluded that if men andwomen had equal influence in decision-making,24 the incidence of underweight children under three years old in South Asiacould fall by up to 13 percentage points,resulting in 13.4 million fewer undernourishedchildren.25 In sub-Saharan Africa, where one in every six women and around one third of children under the age of five are under-weight,26 increasing gender equality wouldhave smaller but still significant benefits forchildren’s nutritional status. It would reduce
often provide protection for childrenwho are exposed to domestic vio-lence. But without the legal or eco-nomic resources to prosecute abusivespouses, countless women and chil-dren remain trapped in harmful situa-tions. Government-led efforts to createprotective policies for victims ofdomestic violence require a paralleleffort to change social attitudes thatcondone such violence.
Shattering the silence that surroundsdomestic violence is key to endingviolent behaviour in the home. TheReport of the Independent Expert forthe United Nations Study on Violenceagainst Children represents a crucialstep towards unmasking the issue ofviolence against children, includingabuses perpetrated in the household.The report’s six guiding principles –quoted at right – are clear, none moreso than the first: No violence against
children is justifiable. Its recommen-dations are comprehensive, with over-arching precepts complemented byspecific measures to combat violenceagainst children in the home and fam-ily, in schools and other educationalsettings, in care and justice systems,
in the workplace and community.These measures also include advisinggovernments to establish anombudsperson or commission forchildren’s rights in accordance withthe ‘Paris Principles’. The report advocates for the establishment of a Special Representative to theSecretary-General on Violence againstChildren to advocate at the interna-
tional level, in conjunction withUNICEF, the World Health Organi-zation and the Office of the UN HighCommissioner for Human Rights, andthe creation of a UN inter-agencygroup on violence against children,with representation from NGOs andchildren themselves.
See References, page 88.
The guiding principles of the Report of the Independent Expert
for the United Nations Study on Violence against Children
• No violence against children is justifiable. Children should never receive less protection than adults.
• All violence against children is preventable. States must invest in evidence-based policies and programmes to address factors that give rise to violence against children.
• States have the primary responsibility to uphold children’s rights to protection and access to services, and to support families’ capacity to provide children with care in a safe environment.
• States have the obligation to ensure accountability in every case of violence.
• The vulnerability of children to violence is linked to their age and evolving capacity. Some children, because of gender, race, ethnic origin, disability or social status, are particularly vulnerable.
• Children have the right to express their views, and to have these viewstaken into account in the implementation of polices and programmes.
E Q U A L I T Y I N T H E H O U S E H O L D 25
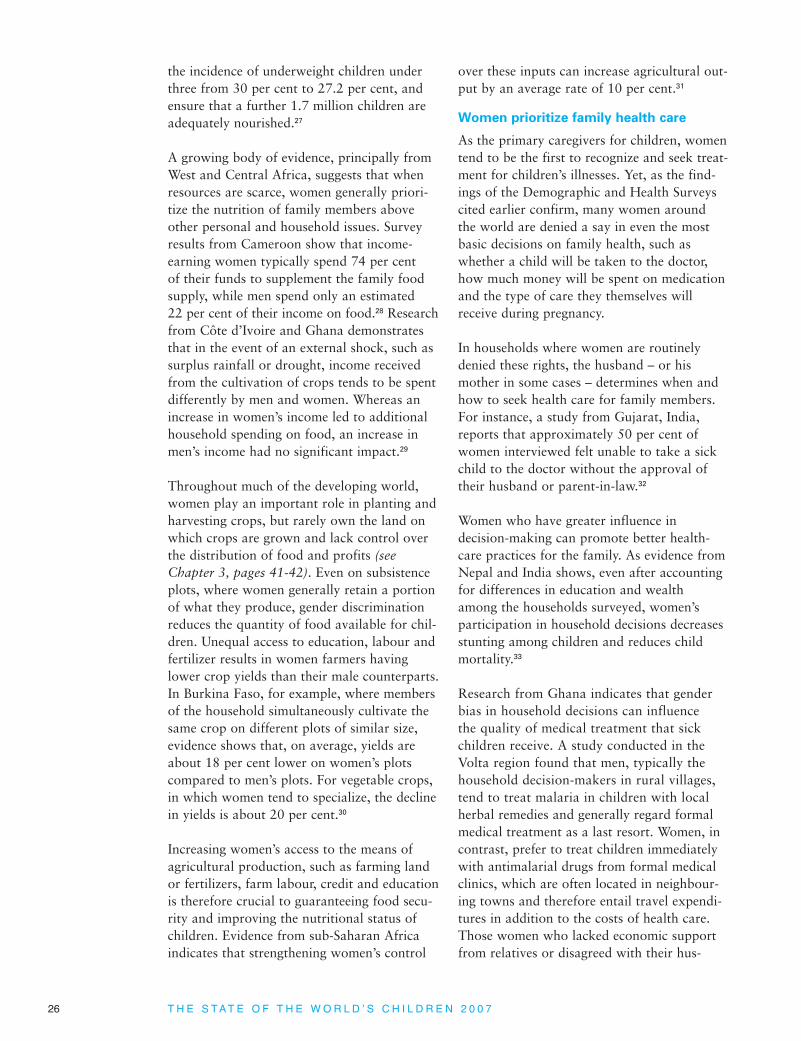
the incidence of underweight children underthree from 30 per cent to 27.2 per cent, andensure that a further 1.7 million children areadequately nourished.27
A growing body of evidence, principally fromWest and Central Africa, suggests that whenresources are scarce, women generally priori-tize the nutrition of family members aboveother personal and household issues. Surveyresults from Cameroon show that income-earning women typically spend 74 per cent of their funds to supplement the family foodsupply, while men spend only an estimated 22 per cent of their income on food.28 Researchfrom Côte d’Ivoire and Ghana demonstratesthat in the event of an external shock, such assurplus rainfall or drought, income receivedfrom the cultivation of crops tends to be spentdifferently by men and women. Whereas anincrease in women’s income led to additionalhousehold spending on food, an increase inmen’s income had no significant impact.29
Throughout much of the developing world,women play an important role in planting andharvesting crops, but rarely own the land onwhich crops are grown and lack control overthe distribution of food and profits (seeChapter 3, pages 41-42). Even on subsistenceplots, where women generally retain a portionof what they produce, gender discriminationreduces the quantity of food available for chil-dren. Unequal access to education, labour andfertilizer results in women farmers havinglower crop yields than their male counterparts.In Burkina Faso, for example, where membersof the household simultaneously cultivate thesame crop on different plots of similar size,evidence shows that, on average, yields areabout 18 per cent lower on women’s plotscompared to men’s plots. For vegetable crops,in which women tend to specialize, the declinein yields is about 20 per cent.30
Increasing women’s access to the means ofagricultural production, such as farming landor fertilizers, farm labour, credit and educationis therefore crucial to guaranteeing food secu-rity and improving the nutritional status ofchildren. Evidence from sub-Saharan Africaindicates that strengthening women’s control
over these inputs can increase agricultural out-put by an average rate of 10 per cent.31
Women prioritize family health care
As the primary caregivers for children, womentend to be the first to recognize and seek treat-ment for children’s illnesses. Yet, as the find-ings of the Demographic and Health Surveyscited earlier confirm, many women around the world are denied a say in even the mostbasic decisions on family health, such aswhether a child will be taken to the doctor,how much money will be spent on medicationand the type of care they themselves willreceive during pregnancy.
In households where women are routinelydenied these rights, the husband – or hismother in some cases – determines when andhow to seek health care for family members.For instance, a study from Gujarat, India,reports that approximately 50 per cent ofwomen interviewed felt unable to take a sickchild to the doctor without the approval oftheir husband or parent-in-law.32
Women who have greater influence in decision-making can promote better health-care practices for the family. As evidence fromNepal and India shows, even after accountingfor differences in education and wealthamong the households surveyed, women’sparticipation in household decisions decreasesstunting among children and reduces childmortality.33
Research from Ghana indicates that genderbias in household decisions can influence the quality of medical treatment that sickchildren receive. A study conducted in theVolta region found that men, typically thehousehold decision-makers in rural villages,tend to treat malaria in children with localherbal remedies and generally regard formalmedical treatment as a last resort. Women, incontrast, prefer to treat children immediatelywith antimalarial drugs from formal medicalclinics, which are often located in neighbour-ing towns and therefore entail travel expendi-tures in addition to the costs of health care.Those women who lacked economic supportfrom relatives or disagreed with their hus-
26 T H E S T A T E O F T H E W O R L D ’ S C H I L D R E N 2 0 0 7

bands or family elders about how the childrenshould be treated struggled to obtain appro-priate treatment for their ailing children. As a result, the local remedies preferred by mentended to prevail over formal medical treat-ment, often to the sick children’s detriment.34
Even when women can influence householddecisions on medical care, they may still needthe help of family members, particularly hus-bands or mothers-in-laws, to carry out theirdecision. In Bangladesh, Egypt and India, forexample, social norms often discourage orrestrict women’s mobility outside of the home.Restrictions on women’s movement can com-promise children’s access to emergency healthcare by preventing women from travellingindependently to shops, pharmacies or hospi-tals, and limiting women’s direct contact withunrelated males, including doctors.35
Women prioritize education
Empirical research on the links betweenwomen’s decision-making power in the house-hold and children’s education is in its infancy.Yet the evidence available indicates thatwomen’s empowerment within the householdincreases the likelihood that children, particu-larly girls, will attend school. Recent studieshave found that where gender influences
outcomes for children, it tends to be related to the gender of the parent who controls the distribution of resources. A study of poorBrazilian households reveals that girls livingwith mothers who are educated and decision-makers are more likely to be enrolled inschool and kept out of the informal labour market.36
Empowering women to prioritize girls’ educa-tion generates positive outcomes that spangenerations. A UNICEF survey of selectedcountries across Latin America and theCaribbean, South Asia and sub-Saharan Africa– including Cameroon, Côte d’Ivoire, Eritrea,Guinea-Bissau, Guyana, India and Suriname –finds that on average, children with uneducat-ed mothers are at least twice as likely to beout of primary school than children whosemothers attended primary school.37 Theimportance of mothers’ education is supportedby a separate study of children aged 7 to 14years in 18 sub-Saharan African countries; the study found that 73 per cent of childrenwith educated mothers were in school, com-pared with only 51 per cent of children whosemothers lacked schooling.38 Moreover, chil-dren with a formally educated primary care-giver are less likely to repeat a grade or leaveschool early.39
Least developed countries
Developing countries
CEE/CIS
Latin America and Caribbean
East Asia and Pacific
South Asia
Middle East and North Africa
West and Central Africa
Eastern and Southern Africa
0 20 40 60 80 100
Adult literacy rate: females as a percentage of males, 2000-2004*
71
85
97
99
92
64
77
63
85
Figure 2.5 Despite recent improvements, women’s literacy rates are generally
lower than men’s
Notes: Adult literacy rate refers to the percentage of persons aged 15 and over who can read and write.
* Data refer to the most recent year available during the period specified.
Source: UNESCO Institute of Statistics. The underlying data can be found in the Statistical Tables of this report, page 98.
E Q U A L I T Y I N T H E H O U S E H O L D 27

Female-headed households:
Proving that empowered women
benefit children
The impact of women’s decision-making onchildren’s development is keenly evident infemale-headed households. It was estimated in1998 that roughly 20 per cent of householdsworldwide are headed by women.40 Based onthis estimate, female-headed householdsaccount for 24 per cent of all households inLatin America, 22 per cent in sub-SaharanAfrica, 16 per cent in Asia, and 13 per cent in the Middle East and North Africa.
It is often assumed that households headed by women represent the poorest of the poor.This belief is grounded in the reality that inmany countries and societies, men enjoy supe-rior social status and earning power.41 Theevidence, however, is far less conclusive.Research on Latin America has shown thatfemale-headed households may even generatehigher earnings, or have more income earnersthan their male equivalents due to more effec-tive use of household labour.42
Female-headed households do not fit neatlyinto any one social category or income brack-et. The factors that motivate or force womento head households independently may deter-mine a household’s economic status.43 Awoman may have decided not to marry at all,or she may have chosen to leave her partner.She may head the household due to personalor economic circumstances that are beyondher control, as is the case for many widows,abandoned wives, or married women whobecome de facto household heads when theirpartners are migrant workers. Even amongfemale heads of households who did not con-sciously choose to live without a partner, oneshould be wary of labelling them and childrenwho live in these households as the ‘poorestof the poor’. For instance, a 2005 study fromrural Bangladesh shows that the proportionof female-headed households compared tomale-headed households was highest amongthe poorest quintile (5.2 per cent) and thewealthiest quintile (7.4 per cent), while theintermediate quintiles had lower proportionsranging from 3.3 per cent to 4.5 per cent.44
© U
NIC
EF/
HQ
05-1
159/
Rog
er L
eMoy
ne
28 T H E S T A T E O F T H E W O R L D ’ S C H I L D R E N 2 0 0 7

Extended family members and community support systems can result in female-headedhouseholds being less disadvantaged in prac-tice than they are often believed to be in princi-ple. Among poor neighbourhoods in urbanMexico, for instance, more than half of female-headed households are extended families compared with just over one quarter of male-headed units.45
A study based on data from 17 developingcountries in which at least 15 per cent of children lived in female-headed householdsreveals that single mothers manage to raisetheir children with outcomes similar to thoseof two-parent families, despite the numerouschallenges they face.46 Furthermore, levels ofchild work and labour are not significantlyhigher in female-headed households. In bothmale- and female-headed households, approx-imately 5 per cent of children reported help-ing with domestic work, 14 per cent workedon a family farm or business, and around 8 per cent worked outside the home.47
Children may benefit from the fact that afemale household head has full control overthe allocation of household income.48 Evidencefrom rural Bangladesh indicates that the
prevalence of undernutrition in children underfive in female-headed households comparedwith male-headed households was significantlylower across income quintiles. Even thoughfemale household heads faced restricted accessto employment opportunities, land holdingsand social services, across all income quintilesthey spent relatively more on food and health-care services, suggesting different priorities inhousehold management that helped to achievebetter nutritional outcomes. Children living infemale-headed households consume a morediverse diet than those in male-headed house-holds, especially micronutrient and protein-rich foods that provide the necessary nutrientsfor the growth and mental development ofyoung children.49 Furthermore, the proportionof mothers with at least one year of secondaryeducation in female-headed households isgreater across all quintiles than in male head-ed households, which may contribute to thebetter nutritional status of children observedin the former group.50
Men must play a crucial role
in the lives of children
The interests of children are best served whenthe dynamic between men and women in thehousehold is based on mutual respect and
© U
NIC
EF/
HQ
04-0
489/
Loui
se G
ubb
E Q U A L I T Y I N T H E H O U S E H O L D 29

shared responsibilities, and both mother andfather are involved in the care, nurture andsupport of their children.51
Men play a pivotal role in promoting egalitari-an decision-making. From the decisions they
make about resource allocation to the careand support they give to women and children,they can help fight gender discrimination intheir families and communities. The absenceof fathers from the lives of their children canaffect children’s emotional, physical, and
One of the rarely told stories fromsub-Saharan Africa is that of thegrandparents who care for childrenorphaned by AIDS. Research in sevencountries (Burkina Faso, Cameroon,Ghana, Kenya, Mozambique, Nigeriaand the United Republic of Tanzania)with recent data reveals the enormous burden that orphaning is exerting on the extended family in general and grandparents – often grandmoth-ers – in particular. By the end of 2005,12 million children across sub-SaharanAfrica had been orphaned by AIDS.
Children who have lost their fathers(paternal orphans) usually stay withtheir mothers; over 50 per cent of children in each of the seven countriesassessed did so. However, fewer thanhalf of the children who lost theirmothers (maternal orphans) continuedto live with their fathers. Women aretherefore more likely to take care oforphaned children, irrespective ofwhether they have lost their mothers,fathers or both parents.
The strain of caring for orphans istelling on female-headed households,which have among the highestdependency ratios. Many of thesehouseholds are headed by elderlywomen, often grandmothers, whostep in to raise orphans and vulnera-ble children when their own childrensicken and die. Grandparents – partic-ularly grandmothers – care for around40 per cent of all orphans in the United
Republic of Tanzania, 45 per cent in Uganda, more than 50 per cent in Kenya and around 60 per cent inNamibia and Zimbabwe.
In many poor countries, elderlywomen are among the most vulnera-ble and marginalized members ofsociety. Unequal employment oppor-tunities and discriminatory inheritanceand property laws force many womento continue working well into old age.Following the deaths of husbands,many elderly women subsist on lowwages earned in physically arduousjobs in the informal sector. Forinstance, in Uganda, a study by theUN Food and Agricultural Orga-nization found that widows wereworking two to four hours more eachday to make up for reduced incomefollowing their husbands’ deaths.
HIV/AIDS is straining elderly peoplealready struggling to make ends meet.Evidence shows that poverty rates inhouseholds with elderly people are upto 29 per cent higher than in house-holds without. Elderly women whoassume responsibility for family mem-bers affected by HIV/AIDS are oftenforced to work longer hours and sellpersonal possessions and householdassets in order to pay for medicines,health care and funeral costs.Household studies conducted in Côted’Ivoire found that families where onemember was living with HIV/AIDS hadroughly double the health spending
but only half the income of house-holds in a control group where no onewas living with HIV/AIDS. Funeralscan absorb a large share of income; infour provinces in South Africa, a studyshowed that households with anAIDS-related death in the previousyear spent an average of one third oftheir annual income on funerals.
The financial burden of caring fororphans can threaten household foodsecurity. A study in Dar es Salaam,United Republic of Tanzania, found thatorphans are more likely to go to bedhungry than non-orphans. In Malawi,moderate to severe hunger is also moreprevalent among households withmore than one orphan. The latter studyhas suggested that although extendedfamily members may be able to carefor one orphan, the demands of caringfor any additional orphans underminetheir food security and, by extension,the nutritional well-being of all childrenin the household.
Against the odds, grandparents andsingle mothers make enormousefforts to send children to school.Research from 10 sub-Saharan Africancountries has found a strong positivecorrelation between school enrolmentand biological ties between the childand the head of household. But thefinancial strain may prove too great ifthe household has to accommodatemore than one orphan. While there isno conclusive evidence to suggest
Grandmothers and HIV/AIDS
30 T H E S T A T E O F T H E W O R L D ’ S C H I L D R E N 2 0 0 7

intellectual development.52 Researchers esti-mate that one in three children living in theUS – numbering roughly 24 million – live inhomes without their biological fathers.53
Evidence shows that children can suffer emo-tionally and psychologically if they feel that they
are not part of a family that conforms to whatis considered ‘normal’ in their community.54
A recent study examining the issue of familylife from a male perspective revealed that mostmen aspire to be good fathers and to care for
that orphaning per se increases therisk of children missing school,research from Uganda suggests that double-orphans – children whohave lost both parents – are mostlikely to miss out on an education.
A deepening crisis for orphans
and caregivers
UNICEF predicts that the number ofchildren who have lost one or bothparents due to AIDS will rise to 15.7million by 2010. At that point, around12 per cent of all children in sub-Saharan African countries will beorphans due to all causes, with onequarter of these orphaned by AIDS.Disaggregated data provide an evenbleaker panorama: Roughly one inevery five children aged 12–17, andone in every six children aged 6–11were orphans in 2005. At the sametime, the number of widows is rising.HelpAge International estimates thatthe highest growth rate of any agegroup will be among those aged 80and over, most of whom are women.
Programmes designed to providecash and other forms of assistanceto elderly household heads can helpease the burden of caring for youngorphans. In Zambia, a pilot cashtransfer scheme for older people caring for orphans has resulted inimproved school attendance ratesamong children. In South Africa, girls living in households with olderwomen in receipt of a pension have
been found to be 3–4 centimetrestaller than girls in households witholder women who do not receive apension. Despite these successes,these programmes represent a short-term solution at best.
Addressing the crisis facing orphansand elderly women in sub-SaharanAfrica, and elsewhere, requires along-term strategy aimed at rever-sing the discriminatory social atti-tudes and customs that keep womenand children mired in poverty. Manycountries in sub-Saharan Africa, and in other regions, are developingnational plans to address these challenges based on the five coreprinciples of The Framework for theProtection, Care and Support ofOrphans and Vulnerable ChildrenLiving in a World with HIV and AIDS.This framework, endorsed by interna-tional agencies and non-governmentalorganization partners in 2004, isbased on five key principles:
• Strengthen the capacity of familiesto protect and care for orphans andvulnerable children by prolongingthe lives of parents and providingeconomic, psychosocial and othersupport.
• Mobilize and support community-based responses.
• Ensure access for orphans and vulnerable children to essential
services, including health care and birth registration.
• Ensure that governments protectthe most vulnerable childrenthrough improved policy and legis-lation and by channelling resourcesto families and communities.
• Raise awareness at all levelsthrough advocacy and social mobilization to create a supportive environment for children and families affected by HIV and AIDS.
Across sub-Saharan Africa, initiativesare transforming the five principlesinto action. These include abolishingschool fees in Kenya and Uganda;community-level interventions tosupport households in Malawi,Rwanda, Swaziland and the UnitedRepublic of Tanzania; and improveddata collection through large popula-tion-based surveys. UNICEF is provid-ing support and advocacy throughthe Global Campaign on Children andAIDS – Unite for Children. Uniteagainst AIDS. Despite these efforts,however, coverage remains limited inall areas. With research revealing thedisproportionate burden on female-headed households, there is anurgent need to provide them withassistance as part of broader actionsto support orphans and vulnerablechildren and their families.
See References, page 88.
E Q U A L I T Y I N T H E H O U S E H O L D 31

their children.55 But fathers often receivemixed messages regarding their rights andresponsibilities as parents.56 Existing socialand cultural norms can have a strong influ-ence on parents’ levels of involvement withtheir children. The message that some meninternalize is that it is not a father’s place to become heavily involved in the lives ofyoung children.57
Conventional notions about the roles of menand women in families are changing, albeitslowly. One reason is the high rate of divorcein many regions. Data from 2002 show thedivorce rate in Western Europe at approxi-mately 30 per cent, while in the Scandinaviancountries, the United Kingdom and the UnitedStates, it was closer to 50 per cent.58 In LatinAmerica and the Caribbean, divorce ratesamong women aged 40 to 49 who have beenmarried at least once range from 25 per centto nearly 50 per cent, with the median havingnearly doubled between the mid-1980s andlate 1990s.59
In many parts of the world, rising living costs and the growing number of dual-incomehouseholds are also transforming familydynamics. Evidence from the United Kingdomshows that in 36 per cent of two-income families, it is the father, more than any other
individual, who cares for children whilewomen are at work.60 In families throughoutthe Middle East and North Africa, studiesindicate a significant change in householdpower dynamics. Whereas the 1980s saw university-educated Saudi men shy away fromthe prospect of marrying university-educatedwomen, recent research shows a shift in atti-tudes: Saudi men now report that they valuewives who can assist with the high costs ofurban living. Moreover, Saudi wives whoshare the responsibility for family expenseshave a greater say in household decisions.61
These trends are not unique to Saudi Arabia.In the El Mashrek region of Morocco, womenenter the workforce on account of personalpreference rather than financial necessity,62
and are less inclined to resign from their jobsafter having children.63
Women’s participation
in the community
Social attitudes towards gender can and dochange. The most important catalysts forchange are women themselves. Through social groups and networks, both formal and informal, women interact with eachother, pool their economic and humanresources, and collectively decide how thoseresources will be used or invested. Womenwho come together to challenge and defy discriminatory attitudes can have a dramaticimpact on their communities.64 By publiclydenouncing discrimination and motivatingother women to claim their social, economicand political rights, women’s groups can setin motion a process of broad social changethat promotes the rights of girls and womenfor generations to come.
Social networks increase women’s
influence at the community level
Social groups and networks encourage and support women’s participation in decision-making at the community level. Evidence drawnfrom Demographic and Health Surveys suggeststhat in some developing countries much of theimpact of women’s overall decision-makingpower is concentrated at the community level.65
Where women’s access to community resourcesis severely restricted by physical impediments or
© U
NIC
EF/
2005
/War
pins
ki
32 T H E S T A T E O F T H E W O R L D ’ S C H I L D R E N 2 0 0 7

gender discrimination, women collaborate tohelp provide each other and children with food,water, childcare, medicines and labour for farm-ing – often beyond the purview of the men whocontrol the formal decision-making processes.66
Community-based social networks can alsoprovide women with an important source ofmoral support. If, for instance, a woman isdenied a say in household decisions but islinked to a strong social network that pro-motes women’s empowerment, peer supportmay persuade her to make independent deci-sions on issues such as children’s health care.67
But the impact of women’s networks goesbeyond merely helping their own members: By challenging the status quo, these networksand organizations are also proving to be powerful agents of social change.68
South Asia provides numerous examples ofsuch efforts. One such initiative is BRAC, anon-governmental organization in Bangladeshthat provides credit and employment opportu-nities for women. BRAC has strengthenedwomen’s bargaining power in their householdsand communities. For example, through col-lective action, women have successfully per-
suaded community elders to refrain from criticizing and ridiculing those women whowork outside the home.69 This social sanction-ing of women’s work empowers women whowish to pursue employment opportunities and increases the economic incentives for girls’ education.
Women’s groups throughout sub-SaharanAfrica are mounting similar challenges to maledominance in community decision-making. InMozambique, women’s organizations arefighting discrimination by contesting the 1997Land Law that denies them the right to ownand sell land independently.70 Another exam-ple can be found in Angola, where theAngolan Association for Women’s Lawyersled a national campaign for legal reforms to protect women’s rights.71
While some women’s groups have beeninstrumental in lobbying policymakersthrough formal political channels, othergroups have successfully mobilized con-stituency-level support for female legislators.These efforts are helping to turn the tide ofgender discrimination in formal politicalprocesses (see Chapter 4).
© U
NIC
EF/
HQ
06-0
088/
She
hzad
Noo
rani
E Q U A L I T Y I N T H E H O U S E H O L D 33
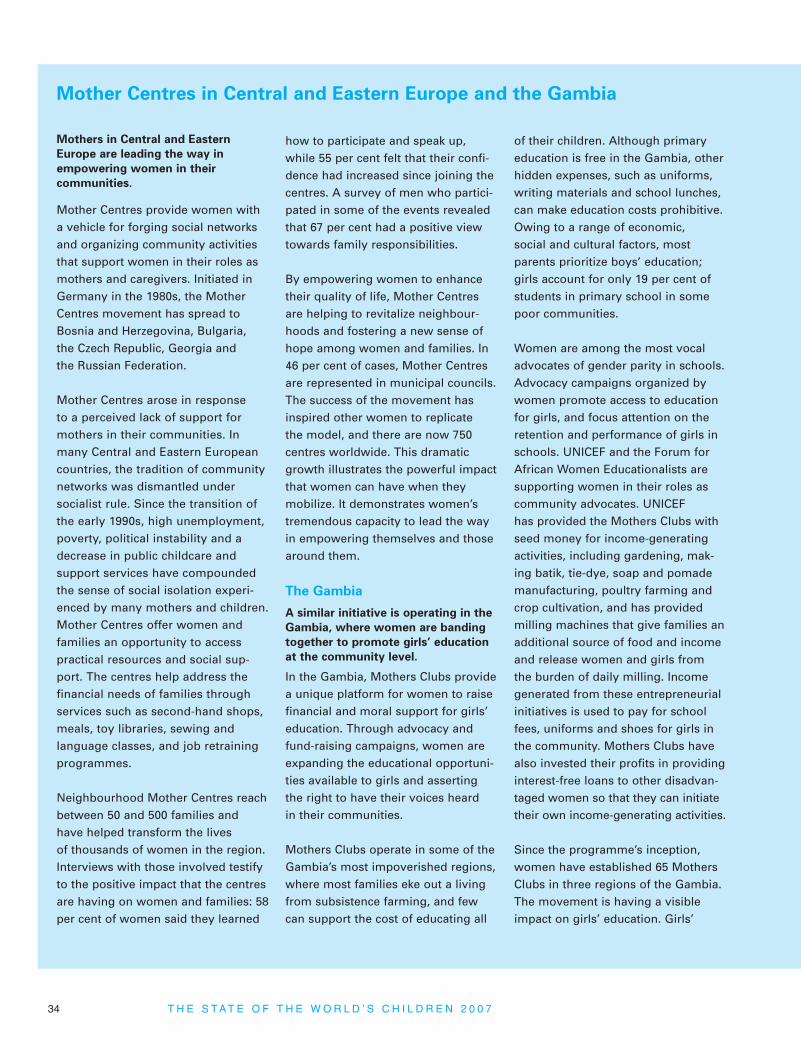
Mothers in Central and Eastern
Europe are leading the way in
empowering women in their
communities.
Mother Centres provide women witha vehicle for forging social networksand organizing community activitiesthat support women in their roles asmothers and caregivers. Initiated inGermany in the 1980s, the MotherCentres movement has spread toBosnia and Herzegovina, Bulgaria, the Czech Republic, Georgia and the Russian Federation.
Mother Centres arose in response to a perceived lack of support formothers in their communities. Inmany Central and Eastern Europeancountries, the tradition of communitynetworks was dismantled undersocialist rule. Since the transition ofthe early 1990s, high unemployment,poverty, political instability and adecrease in public childcare and support services have compoundedthe sense of social isolation experi-enced by many mothers and children.Mother Centres offer women andfamilies an opportunity to accesspractical resources and social sup-port. The centres help address thefinancial needs of families throughservices such as second-hand shops,meals, toy libraries, sewing and language classes, and job retrainingprogrammes.
Neighbourhood Mother Centres reachbetween 50 and 500 families and have helped transform the lives of thousands of women in the region.Interviews with those involved testifyto the positive impact that the centresare having on women and families: 58per cent of women said they learned
how to participate and speak up,while 55 per cent felt that their confi-dence had increased since joining thecentres. A survey of men who partici-pated in some of the events revealedthat 67 per cent had a positive viewtowards family responsibilities.
By empowering women to enhancetheir quality of life, Mother Centresare helping to revitalize neighbour-hoods and fostering a new sense ofhope among women and families. In46 per cent of cases, Mother Centresare represented in municipal councils.The success of the movement hasinspired other women to replicate the model, and there are now 750centres worldwide. This dramaticgrowth illustrates the powerful impactthat women can have when theymobilize. It demonstrates women’stremendous capacity to lead the wayin empowering themselves and thosearound them.
The Gambia
A similar initiative is operating in the
Gambia, where women are banding
together to promote girls’ education
at the community level.
In the Gambia, Mothers Clubs providea unique platform for women to raisefinancial and moral support for girls’education. Through advocacy andfund-raising campaigns, women areexpanding the educational opportuni-ties available to girls and assertingthe right to have their voices heard in their communities.
Mothers Clubs operate in some of theGambia’s most impoverished regions,where most families eke out a livingfrom subsistence farming, and fewcan support the cost of educating all
of their children. Although primaryeducation is free in the Gambia, otherhidden expenses, such as uniforms,writing materials and school lunches,can make education costs prohibitive.Owing to a range of economic, social and cultural factors, most parents prioritize boys’ education;girls account for only 19 per cent of students in primary school in somepoor communities.
Women are among the most vocaladvocates of gender parity in schools.Advocacy campaigns organized bywomen promote access to educationfor girls, and focus attention on theretention and performance of girls inschools. UNICEF and the Forum forAfrican Women Educationalists aresupporting women in their roles ascommunity advocates. UNICEF has provided the Mothers Clubs withseed money for income-generatingactivities, including gardening, mak-ing batik, tie-dye, soap and pomademanufacturing, poultry farming andcrop cultivation, and has providedmilling machines that give families anadditional source of food and income and release women and girls from the burden of daily milling. Incomegenerated from these entrepreneurialinitiatives is used to pay for schoolfees, uniforms and shoes for girls inthe community. Mothers Clubs havealso invested their profits in providinginterest-free loans to other disadvan-taged women so that they can initiatetheir own income-generating activities.
Since the programme’s inception,women have established 65 MothersClubs in three regions of the Gambia.The movement is having a visibleimpact on girls’ education. Girls’
Mother Centres in Central and Eastern Europe and the Gambia
34 T H E S T A T E O F T H E W O R L D ’ S C H I L D R E N 2 0 0 7

Including women
in decision-making
Ensuring that women have a greater voice inhousehold and community decisions is criticalto fulfilling their rights as well as the rights ofchildren. While international agencies, govern-ments, civil society organizations and womenthemselves have made significant progress inpromoting a more egalitarian dynamic, muchremains to be done. Some key areas thaturgently require attention include:
• Increasing women’s employment andincome-earning opportunities: Ownership or control of household assets and income is an important determinant of householdbargaining power. Ensuring that womenhave opportunities to earn income, acquireland, a house and other property can help tostrengthen women’s bargaining power andinfluence in household decisions. Chapter 3discusses in more detail initiatives that canincrease women’s employment and income-earning opportunities.
• Involving men: Persuading individuals tochange their attitudes and behaviour is aslow and complex process. Through simple,direct and effective strategies, such as per-suading other men to contribute to domesticchores, men are partnering with women tocombat gender discrimination in householdsand communities. By creating specific rolesfor men in advocacy programmes, govern-ments and development agencies can alsopromote men’s involvement in child-friendlyinitiatives in parliament, schools and theworkplace (see Chapter 5).
• Supporting women’s organizations: One ofthe most important and effective avenues forwomen’s empowerment is the dynamic ofcooperation among women. Informalwomen’s collectives that organize aroundissues such as nutrition, food distribution,education and shelter help improve the stan-dard of living for women, their families andcommunities. Women’s organizatioins canalso be catalysts for change in the politicalarena (see Chapter 4).
enrolment rates increased on average by 34 per cent, and the incidence of girls with-drawing from school due to early marriagehas diminished sharply.
Mothers Clubs are creating new opportuni-ties for women, in addition to girls. By pro-viding women with the skills and resourcesneeded to generate their own sources ofincome, Mothers Clubs are helping toempower women in their communities.Moreover, by persuasively arguing the casefor girls’ education, women are challenginggender discrimination and highlighting theimportance of women’s involvement incommunity decision-making processes, anachievement that will benefit current andfuture generations of women and girls.
See References, page 88.
E Q U A L I T Y I N T H E H O U S E H O L D 35

While there hasbeen great progress
in recent decades in engaging women inthe labour force, there has been consid-erably less advance on improving theconditions under which they work, recog-nizing their unpaid work, eliminating dis-criminatory practices and laws related toproperty and inheritance rights, and pro-viding support for childcare. Ensuring thatwomen and men have equal opportuni-ties to generate and manage income is an important step towards realizingwomen’s rights. Moreover, children’s rightsare more likely to be fulfilled when womenfully enjoy their social and economic rights.
• For many women, unpaid work inand for the household takes up themajority of their working hours, withmuch less time spent in remunerativeemployment. Even when they partici-pate in the labour market for paidemployment, women still undertakethe majority of the housework.
• When women work outside thehousehold, they earn, on average, far
less than men. They are also morelikely to work in more precariousforms of employment with low earn-ings, little financial security and fewor no social benefits.
• Women not only earn less thanmen but also tend to own fewerassets. Smaller salaries and lesscontrol over household incomeconstrain their ability to accumulatecapital. Gender biases in propertyand inheritance laws and in otherchannels of acquiring assets alsoleave women and children atgreater risk of poverty.
• Paid employment for women doesnot automatically lead to better out-comes for children. Factors such asthe amount of time women spendworking outside the household, theconditions under which they areemployed and who controls theincome they generate determine howthe work undertaken by women inthe labour market affects their ownwell-being and that of children.
• In many countries, high-quality child-care remains prohibitively expensivefor low-income families in theabsence of state provision or subsi-dies. Parents often rely on extendedfamily members or older children –most often girls – to provide childcarewhile they work, often at the expenseof children’s education.
• Challenging attitudes towardswomen at work requires a multifac-eted approach. Governments shouldundertake legislative, financial andadministrative measures to create astrong and enabling environmentfor women’s entrepreneurship andparticipation in the labour market.Social policies should be promotedto tackle discrimination in the work-place and to enable women andmen to reconcile their work andfamily responsibilities. For children,the most important strategies forensuring that girls and boys willhave equal income-earning opportu-nities as adults is to give themequal access to education.
SUMMARY

T H E S TAT E O F T H E W O R L D ’ S C H I L D R E N 2 0 0 7
Equality in employment
The story of women’s economicempowerment is an account of greatpotential, all too often unfulfilled. Itis not that women do not work –
they often work longer hours than men – butthey almost invariably earn less income as aresult of their labours and own less property.While there has been progress in recentdecades in engaging women in the globallabour force, there has been considerably lessadvance on improving the conditions underwhich they work, recognizing their unpaidwork, eliminating discriminatory practices andlaws related to property and inheritance rightsand providing childcare support.
Ensuring that women and men have equalopportunities to generate and manage incomeis an important step towards realizingwomen’s rights under the Convention on theElimination of All Forms of Discriminationagainst Women (CEDAW) and enhancing their development, self-esteem and influenceboth within the household and in society.Furthermore, children’s rights are more likelyto be realized when women fully enjoy theirsocial and economic rights.
Policymakers are becoming attuned to thereality that women have an important eco-nomic role in addressing the poverty experi-enced by children; an increasing number ofcountries are channelling provisions to fulfilchildren’s rights – such as cash transfers contingent on sending children to school –directly to mothers. Across the world, thelivelihoods of households are already oftensustained and enhanced by women who workoutside the home – from those who cultivatesubsistence crops or work on large farmswhere they oversee the output and marketing
of produce, to those labouring in factories andoffices. In both the Caribbean and sub-SaharanAfrica, for example, women produce about 80per cent of household food consumed.1
Women are working more but
earning less than men
Whether they live in industrialized or developingcountries, in rural or urban settings, in general,women work longer hours than men. Whiledata on the way men and women use theirtime are sparse, surveys conducted in recentyears confirm the validity of this assertionacross developing countries. Oxfam estimatesthat women work around 60 to 90 hours perweek,2 and time-use surveys reveal that across aselection of developing countries in Asia, LatinAmerica and sub-Saharan Africa, women’sworking hours exceed those of men, often bya wide margin3 (see Figure 3.1, page 38).
For many women, unpaid chores in and forthe household take up the majority of theirworking hours, with much less time spent inremunerative employment. Data from urbanareas in 15 Latin American countries revealthat unpaid household work is the principalactivity for 1 in every 4 women; the corre-sponding ratio for men is 1 in every 200.4
Even when they participate in the labour mar-ket for paid employment, women still under-take the majority of work in the home. Hereagain, this finding is substantiated by researchin countries across developing regions. InMexico, for example, women in paid employ-ment also perform household tasks thatabsorb 33 hours of their time each week; incontrast, men’s contribution to domesticchores amounts to just 6 hours per week.5
3©
UN
ICE
F/H
Q05
-219
2/G
iaco
mo
Piro
zzi
37

Time-use surveys in six states in India revealthat women typically spend 35 hours per weekon household tasks and caring for children,the sick and elderly, against 4 hours per weekfor men.6
The division of household labour is not dis-similar in industrialized countries. Although
gender disparities in the overall work burdenare less marked than in developing countries,women in the more affluent nations still spenda far greater proportion of working hoursthan men in unpaid work.7
Despite the limited time that many womenspend in paid employment and their pivotal
Benin (1998)
Mexico (2002)
India (2000)
South Africa (2000)
Rep. of Korea (1999)
Madagascar (2001)
Mongolia (2000)
Mauritius (2003)
Average for 8developing countries
0 2 4 6 8 10
2 hours 25 minutes more
1 hour 45 minutes more
1 hour 6 minutes more
59 minutes more
58 minutes more
51 minutes more
44 minutes more
24 minutes more
1 hour 9 minutes more
Number of hours worked each day
Additional number of hours a day women work
How much longer do women work than men each day?
Number of hours worked each dayby both women and men
Figure 3.1 Women are working longer hours than men across the developing world*
*It is important to note that the data represent averages across each country that reflect high levels of underemployment. In some settings, women areworking more than 12 hours a day.
Source: UNICEF calculations based on data derived from United Nations Development Programme, Human Development Report 2006, Beyond Scarcity:Power, poverty and the global water crisis, Oxford University Press for UNDP, New York, 2006, page 379.
© U
NIC
EF/
HQ
05-1
679/
Josh
Est
ey
38 T H E S T A T E O F T H E W O R L D ’ S C H I L D R E N 2 0 0 7
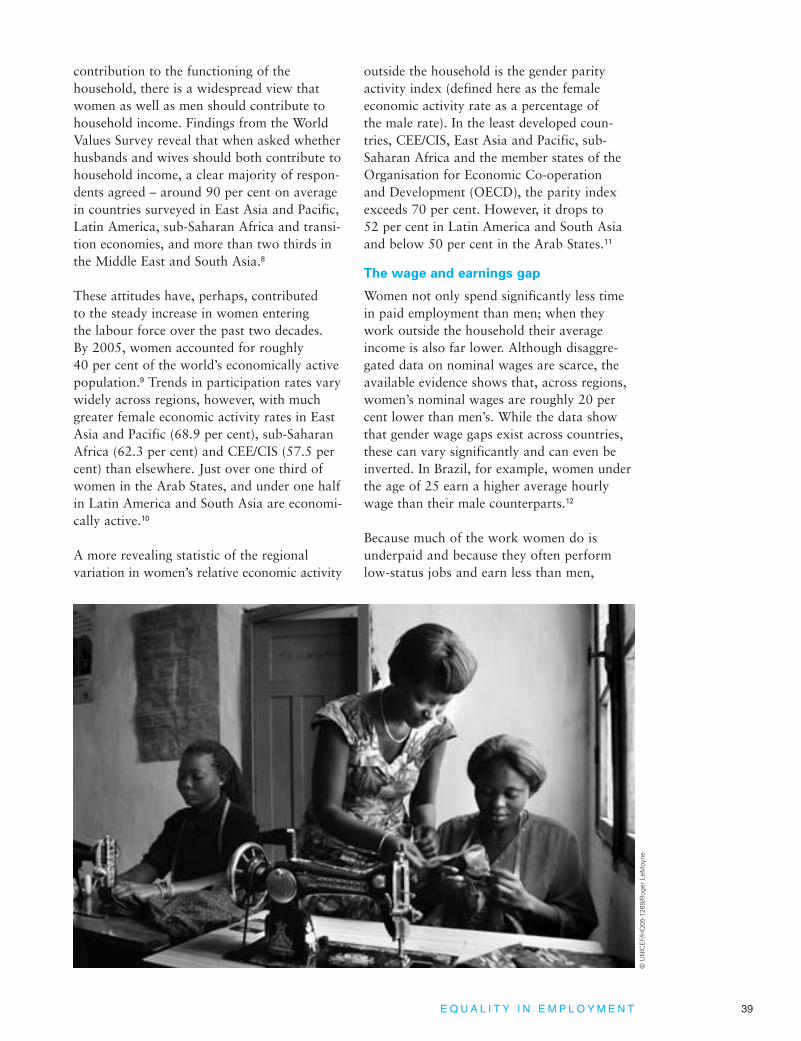
contribution to the functioning of the household, there is a widespread view thatwomen as well as men should contribute tohousehold income. Findings from the WorldValues Survey reveal that when asked whetherhusbands and wives should both contribute tohousehold income, a clear majority of respon-dents agreed – around 90 per cent on averagein countries surveyed in East Asia and Pacific,Latin America, sub-Saharan Africa and transi-tion economies, and more than two thirds inthe Middle East and South Asia.8
These attitudes have, perhaps, contributed to the steady increase in women entering the labour force over the past two decades. By 2005, women accounted for roughly 40 per cent of the world’s economically activepopulation.9 Trends in participation rates varywidely across regions, however, with muchgreater female economic activity rates in EastAsia and Pacific (68.9 per cent), sub-SaharanAfrica (62.3 per cent) and CEE/CIS (57.5 percent) than elsewhere. Just over one third ofwomen in the Arab States, and under one halfin Latin America and South Asia are economi-cally active.10
A more revealing statistic of the regional variation in women’s relative economic activity
outside the household is the gender parityactivity index (defined here as the female economic activity rate as a percentage of the male rate). In the least developed coun-tries, CEE/CIS, East Asia and Pacific, sub-Saharan Africa and the member states of theOrganisation for Economic Co-operation and Development (OECD), the parity indexexceeds 70 per cent. However, it drops to 52 per cent in Latin America and South Asiaand below 50 per cent in the Arab States.11
The wage and earnings gap
Women not only spend significantly less timein paid employment than men; when theywork outside the household their averageincome is also far lower. Although disaggre-gated data on nominal wages are scarce, theavailable evidence shows that, across regions,women’s nominal wages are roughly 20 percent lower than men’s. While the data showthat gender wage gaps exist across countries,these can vary significantly and can even beinverted. In Brazil, for example, women underthe age of 25 earn a higher average hourlywage than their male counterparts.12
Because much of the work women do isunderpaid and because they often performlow-status jobs and earn less than men,
© U
NIC
EF/
HQ
05-1
269/
Rog
er L
eMoy
ne
E Q U A L I T Y I N E M P L O Y M E N T 39

women’s per capita average earned income –measured by applying women’s share of non-agricultural wages to gross domestic product– is far lower than men’s (see Figure 3.3, page41). Estimates based on wage differentialsand participation in the labour force suggestthat women’s estimated earned income isaround 30 per cent of men’s in the countriessurveyed in the Middle East and NorthAfrica, around 40 per cent in Latin Americaand South Asia, 50 per cent in sub-SaharanAfrica and around 60 per cent in CEE/CIS,East Asia and industrialized countries.13 AsChapter 2 shows, income in the hands ofwomen can reap benefits for children. Gendergaps in earnings, therefore, can decrease orlimit the resources available to meet children’srights, such as health care, adequate nutritionand education.
With both parents working outside the home,and in the absence of adequate social supportsystems, children’s rights to education, restand leisure, care and protection are also atrisk. One example of this negative externalityis the mother-daughter substitute effect. Asmothers take on paid work outside the home,children, especially girls, assume the domesticresponsibilities, looking after the home and
taking care of siblings – often at the expenseof their education.14 This highlights the impor-tance of the role played by both parents incaring for children, whether or not they workoutside the home (see Panel, page 41).
The asset gap
Women not only earn less than men, theyalso tend to own fewer assets. Smallersalaries and less control over householdincome constrain their ability to accumulatecapital. But these are not the only reasons.Gender biases in property and inheritancelaws and in other channels of acquiringassets – even state land distribution pro-grammes – leave women and children atgreater risk of poverty.15
The consequences of being excluded fromowning property or assets can be even moredirect, particularly when a marriage breaksdown or a husband dies. Widows who upontheir husband’s death lose the right to theirownership of the family home or land, ordivorced women who are driven from the husband’s home, are easily pushed into themargins of society, further exacerbating thestruggle to achieve health and well-being forthemselves and their children.16
4 countries in the MiddleEast and North Africa
0 20 40
81
80
80
76
73
70
60 80 100
Proportion of women’s wages to men’s wages outside of agriculture
6 countries in East Asiaand Pacific
22 industrialized countries
10 countries in transition
8 countries in LatinAmerica and Caribbean
4 countries insub-Saharan Africa
Figure 3.2 Nominal wages for women are significantly lower than for men*
* UNICEF calculations for Developing countries include countries and territories in the following regional groups. Middle East and North Africa: Bahrain, Egypt,Jordan, Occupied Palestinian Territory. East Asia and Pacific: Malaysia, Myanmar, Philippines, Republic of Korea, Singapore, Thailand. Countries in transition:Bulgaria, Croatia, Czech Republic, Georgia, Kazakhstan, Latvia, Lithuania, Romania, Turkey, Ukraine. Latin America and Caribbean: Brazil, Colombia, Costa Rica,El Salvador, Mexico, Panama, Paraguay, Peru. Sub-Saharan Africa: Botswana, Eritrea, Kenya, Swaziland.
Industrialized countries: Australia, Austria, Belgium, Cyprus, Denmark, Finland, France, Germany, Greece, Hungary, Iceland, Ireland, Japan, Luxembourg,Malta, Netherlands, New Zealand, Norway, Portugal, Sweden, Switzerland, United Kingdom.
Source: International Labour Organization, LABORSTA database, <http://laborsta.ilo.org>, accessed March 2006.
40 T H E S T A T E O F T H E W O R L D ’ S C H I L D R E N 2 0 0 7

Although there are even fewer statistics ongender asset gaps than on wage disparities, theevidence available suggests that the pattern ofdiscrimination is broadly similar across thedeveloping world. A study covering five Latin
American countries indicates that women ownonly a fraction of the land compared with men(see Figure 3.4, page 42).17 In other regionswhere data are available, women face similarinequalities. For example, in Cameroon, while
0
5
10
15
20
25
30
35
40Women’s estimated earned income
Men’s estimated earned income
Est
imat
ed e
arn
ing
s ea
ch y
ear,
mea
sure
d
in t
ho
usa
nd
s o
f U
S d
olla
rs a
t 20
03 p
rice
s ad
just
ed f
or
pu
rch
asin
g p
ow
er p
arit
y
Sub-SaharanAfrica
South AsiaMiddle East andNorth Africa
East Asiaand Pacific
Latin Americaand Caribbean
CEE/CISIndustrializedcountries
59%
of
men
’s e
arn
ing
s
40%
of
men
’s e
arn
ing
s
62%
of
men
’s e
arn
ing
s
28%
of
men
’s e
arn
ing
s
39%
of
men
’s e
arn
ing
s
51%
of
men
’s e
arn
ing
s
57%
of
men
’s e
arn
ing
s
Figure 3.3 Estimated earnings* for women are substantially lower than for men
*Estimated earnings are defined as gross domestic product per capita (measured in US dollars at 2003 prices adjusted for purchasing power parity)adjusted for wage disparities between men and women.
Source: United Nations Development Programme, Human Development Report 2005: International cooperation at a cross roads: Aid, trade and securityin an unequal world, Oxford University Press for UNDP, New York, 2005, Table 25, pages 299-302.
Although increasing numbers ofwomen are entering the workforce,their expanded participation is notalways matched by an improvement inchildren’s welfare. The need for substi-tute caregivers while mothers are atwork places many children – mostoften girls – at risk of being kept out ofor dropping out of school in order tocare for younger siblings or performhousehold work, or both. The univer-sally recognized rights of children toplay, to receive an education and to becared for by both parents are at risk,with negative implications for theirwell-being and future economic status.Evidence of these trends is consistentacross many developing countries.
A recent survey in Nepal shows that eldest daughters tend to be at greatest risk of being withdrawnfrom school to help their workingmothers take care of younger siblings and to assume householdresponsibilities. Evidence from theUnited Republic of Tanzania indicatesthat a lack of childcare facilitiesforces parents to take their childrento work or pass on childcare respon-sibilities to their elder siblings.Increasing female employment inPeru has resulted in children, particu-larly girls, dedicating more time tohousehold activities. Similarly, incountries in South-East Asia, as moremothers work outside the home, the
increased need for childcare is metby older children, aunts and grand-mothers, who often become the primary caregivers of young childrenin rural areas.
See References, page 88.
Do girls risk missing out on school when women work?
E Q U A L I T Y I N E M P L O Y M E N T 41

women undertake more than 75 per cent of agricultural work they own less than 10 per cent of the land. Comparable disparitieshave been identified in Kenya, Nigeria, theUnited Republic of Tanzania and other coun-tries in sub-Saharan Africa.18 In Pakistan,research reveals that women owned less than 3 per cent of plots in sampled villages, despitehaving the right to inherit land in most villages.19
Where women own assets they have morecontrol over household decision-making. Forexample, in rural Bangladeshi households,when women’s shares of pre-wedding assetsare higher than their husbands’, their influencein household decisions is greater and levels ofsickness among their daughters decrease.20
The benefits of ownership can also extendbeyond household bargaining dynamics, withpositive implications for productivity andgrowth, particularly in agriculture. Givingwomen greater control over land and farmplanning and management can enhance agricultural productivity. A study by theInternational Food Policy Research Institutesuggests that if gender inequalities werereduced in Burkina Faso, and men and womenfarmers given equal access to quality agricul-tural inputs and education, agricultural pro-
ductivity could rise by as much as 20 per cent.21
An earlier study on women farmers in Kenyarevealed that crop yields could be increased by24 per cent if all women farmers were toreceive a primary education.22 Another studyin Bangladesh reached a similar conclusion,showing that providing women with specificresources such as high-yielding vegetable seedsand polyculture fish technology in fish pondsleased to groups of low-income women has agreater impact on poverty reduction thanuntargeted technology dissemination, which ismore likely to benefit men and more affluenthouseholds.23
Empowering women through other types ofinvestment can also have positive effects oneconomic growth and poverty reduction.Research indicates that providing women with skills training and access to new tech-nologies gives them greater mobility andincreases their control over resources,enhances their political awareness and reduces instances of domestic violence.24
Where women work matters
for children
Female participation in the workforce can bebeneficial to children, because it often results
0
20
40
60
80
11
89
22
100Land owned by womenLand owned by menLand jointly titled between women and men
Brazil(2000)
Per
cen
t
Mexico(2002)
Nicaragua(1995)
Paraguay(2001)
Peru(2000)
78
16
81
27
70
13
74
13
34
Figure 3.4 Significant male-female gaps in land ownership in Latin America
Note: No data were available for land jointly titled between women and men in Brazil and Mexico. Totals may not add up to 100 per cent due to rounding.
Source: Grown, Caren, Geeta Rao Gupta and Aslihan Kes,Taking Action: Achieving gender equality and empowering women, UN Millennium ProjectTaskforce on Education and Gender Equality, Earthscan, London/Virginia, 2005, page 78.
42 T H E S T A T E O F T H E W O R L D ’ S C H I L D R E N 2 0 0 7

in women gaining greater access to, and con-trol of, economic resources. But paid employ-ment for women does not automatically leadto better outcomes for children. Factors suchas the amount of time women spend workingoutside the household, the conditions underwhich they are employed and who controls theincome they generate determine how theiremployment affects their own well-being andthat of their children.
Women’s informal employment and its
impact on children
The increased participation of women in thelabour force has not always been matched byan equivalent improvement in their workingconditions or job security. Women are less like-ly than men to enjoy job security, working inpositions with low earnings, little financialsecurity and few or no social benefits. Asgrowing numbers of women join the labourforce, there has been a parallel increase ininformal and non-standard forms of employ-ment. In developing countries, the majority ofwomen workers outside agriculture are concen-trated in the informal sector. They are morelikely than men to be own-account workers,domestic workers, industrial outworkers orunpaid workers in family enterprises.25
By its very nature, informal work is less visiblein national statistics due to the lack of system-
atic reporting. Collecting accurate and comprehensive information on the informalsector remains problematic because of thewide-ranging nature of activities, non-formal organizational structures and diverse modes of operation involved.26
In nearly all developing regions, 60 per cent ormore of women engaged in non-agriculturalwork activities are in informal employment.The exception is North Africa, where women’sparticipation in the informal sector is 43 percent. Of the developing regions, sub-SaharanAfrica has the highest rate of informallyemployed women (84 per cent).27 Individualdeveloping countries show wide variationacross regions (see Figure 3.5, page 44).
Women working in the informal sector oftenface difficult working conditions, long hoursand unscheduled overtime. The lack of jobsecurity and benefits such as paid sick leave andchildcare provisions can leave women and theirchildren at a higher risk of poverty.28 Whenmothers are poor, engaged in time-intensive,underpaid and inflexible informal work, andhave little control over their earnings and fewalternative caregivers, children are significantlymore at risk of poor health and growth.29
Such conditions are prevalent in many areas ofboth informal employment and low-income
© U
NIC
EF/
HQ
05-1
213/
Rog
er L
eMoy
ne
E Q U A L I T Y I N E M P L O Y M E N T 43

work in the formal sector. One particular areathat has received increasing scrutiny in recentyears is domestic service. Women make up themajority of domestic workers, most of theminformally employed. When mothers whowork in domestic service take on childcareresponsibilities for the employer’s family, thisoften results in a conundrum: The day-to-daysecurity of the employer’s children is depend-ent on an employee who has to be away fromher own children in order to work.30
A childcare crisis in the formal sector
The increasing participation of women in thelabour force is challenging the traditional breadwinner-homemaker model of paid workby men and unpaid work by women. In itsplace, a new model is prevalent in many coun-tries, such as the high-income OECD countries,transition economies and the rapidly growingnations of East Asia, where both men andwomen engage in paid employment.31 In theUnited Kingdom and the United States, forexample, two out of every three families are cur-rently double-income families.32 In the RussianFederation, in 52 per cent of households inwhich there are young children, all adults betweenthe ages of 25 and 55 are working. The corre-sponding figure for Viet Nam is 88 per cent.33
But even as this new model of householdincome generation steadily takes root, in gen-eral women are still expected to take on themajority of the housework and childcare. As aresult, and in the absence of greater participa-tion by men in both domestic chores andchildcare, it is becoming increasingly difficultfor working mothers to reconcile work andfamily responsibilities.34
Women working in the formal sector are more likely to have shorter careers than menof equivalent age because there may be peri-ods during their careers when they are unableto engage in full-time employment. Manywomen in high- and middle-income countriestend either to leave their jobs or work part-time to raise children – typically between theages of 25 and 35 – and return to full-timeemployment at a later stage.35 In theEuropean Union, around half of workingmothers with a child aged six or youngerwork part-time.36 These temporary absencesfrom full-time employment can result in lowerpay or fewer promotions. In addition, posi-tions that require long working hours, travelor even relocation may be less of an optionfor mothers in paid employment because oftheir family commitments.37
Wo
men
’s in
form
al e
mp
loym
ent
as a
per
cen
tag
eo
f w
om
en’s
no
n-a
gri
cult
ura
l em
plo
ymen
t,19
94–2
000*
(%
)
India Kenya Indonesia El Salvador Brazil South Africa Mexico Tunisia0
20
40
60
80
8683
77
69 67
5855
39
100
Figure 3.5 Many women across the developing world work in the informal sector
* Data refer to the most recent year available during the period specified.
Source: Employment Sector, International Labour Office, Women and Men in the Informal Economy: A statistical picture, International Labour Organization,Geneva, 2002, page 19.
44 T H E S T A T E O F T H E W O R L D ’ S C H I L D R E N 2 0 0 7

In the absence of policies to support workingmothers, childbearing and childcare can inter-rupt women’s careers and permanently constraintheir earning power. Research indicates thatmothers in paid employment tend to earn evenless than other women. According to recentresearch in several industrialized countries, onechild could lead to a ‘penalty’ of 6 per cent to 7 per cent of earnings for women; the penaltyfor two children can be as high as 13 per cent.38
Although research shows that quality parentalcare is an essential component of child devel-opment and that the early experiences of children have a significant impact on their futurewelfare,39 working families are often strugglingto balance the demands of work and childcare.
The demands of work also often leave parentswith less time to spend with their children. Astudy from the United Kingdom shows thatparents there are working longer hours or areincreasingly focused on work activities.40
Working long hours can be problematic forlower-income families, yet many employers donot regard work-schedule flexibility to be anoption for low-wage workers.41 More thantwo thirds of the low-income parents inter-viewed in a recent study in the United Statesreported having at least one child with either achronic health issue or a special learning need,and that they were often unable to devotequality time to their children without jeopard-izing their ability to support their families.42
These difficulties are exacerbated by a lack ofaffordable, quality, childcare facilities. Childrenwho receive high-quality childcare that providesa safe, stable and stimulating environment andfosters their learning skills demonstrate strongermathematical ability, cognitive skills and alert-ness and exhibit fewer behavioural problemsthan children who receive low-quality care.43
In many countries, the absence of state provi-sions or subsidies results in high-quality child-care remaining prohibitively expensive forlow-income families. In others, quality child-care is expensive even for middle-income fami-lies.44 Parents often rely on extended familymembers to care for their children while theywork. Studies conducted in China and in West
Java, Indonesia, for example, show thatgrandmothers, in particular, play an active rolein childcare when mothers are away at work.45
The availability of affordable, quality childcareoutside the home increases the probability thatmothers will enter the labour force. In poorareas in Rio de Janeiro, Brazil, access to publicchildcare facilities enables mothers to work out-side the home, in full- or part-time employ-ment. This also holds true for the RussianFederation, where subsidized out-of-homechildcare raises maternal and householdincomes and brings mothers into the labourmarket. In Kenya, the reduction of childcarecosts has been shown to have a positive correla-tion with higher wages for working mothers.46
Some countries – notably those Scandinaviannations with high levels of gender equality asmeasured by the GEM (see Chapter 1, page 8)– have managed to attain and sustain elevatedlevels of high-quality, affordable childcare.One example is Sweden, where municipalitiesprovide public childcare nurseries and centres,as well as publicly paid and regulated care forchildren in private homes and subsidized pri-vate childcare centres with fees based onincome.47 In the Netherlands, the ChildcareAct (which entered into force in January2005) places responsibility for the cost ofchildcare jointly on parents, employers and the government. The government providessubsidies directly to parents, who choose theday-care centre for their children. Employersare required to contribute one sixth of the cost of childcare per employee, while the local government monitors quality and regu-lates operators.48
In many industrialized countries, large compa-nies have introduced family-friendly initiativesincluding parental leave, maternity benefits,career breaks, flexible hours, childcarearrangements and work-share schemes (seePanel, page 46).49 Such initiatives can havesubstantial benefits for employers as well asemployees. Working parents and employersagree that work-schedule flexibility reducesthe conflict between work and family life, giv-ing parents the opportunity to attend to theirchildren’s health and educational needs.50
E Q U A L I T Y I N E M P L O Y M E N T 45

The impact on children of women
migrating for work
Around the world there are between 185 mil-lion and 192 million migrants living outsidetheir country of birth, of whom roughly half
are women.51 While women’s migration couldpotentially be beneficial, it also engenders newvulnerabilities for individuals and families.52
One such risk is separation, as migrationsometimes forces parents to leave their chil-
Following the 1994 InternationalConference on Population andDevelopment in Cairo, and the FourthWorld Conference on Women inBeijing the following year, the ensuingdecade saw the launch of many family-related initiatives focusing on gender equality and work-familyreconciliation. The rationale for thisincreasing interest was the recogni-tion that dual-working parents requirespecial support and that, in theabsence of such support, genderequality in the workplace cannot beachieved. In several industrializedcountries, state and private supportfor working families, in particular forworking women with young children,are composed of a broad range of ini-tiatives. These include flexible work-ing hours, telecommuting or workingat home, parental leave, medical carefor sick children and childcare provi-sions. In the absence of childcare pro-visions, part-time work may also helpreconcile work and family life.
Some companies have begun imple-menting family-friendly initiatives. InAustralia, in addition to flexible work-ing hours, 35 per cent of labour agree-ments in large firms and 8 per cent insmall firms include at least one family-friendly policy. BMW, the Germanautomobile manufacturer, allocatesfunds for the family-related needs ofits employees, such as purchase ofbaby carriages, children’s clothing orhearing aids for elderly relatives. Thecompany also provides facilities andfinancial support for childcare.
Family-friendly initiatives can be ben-eficial to both businesses and employ-ees. Research conducted in Canada,Finland, Sweden and the UnitedKingdom shows that companies thathave introduced family-friendly meas-ures experience significant reductionsin staff turnover, recruitment andtraining costs and absenteeism, andhave increased the likelihood thatmothers return to work after materni-ty leave. It is estimated that compa-nies can generate a return of around 8 per cent by adopting family-friendlypolicies. AMP, a leading Australianwealth-management corporation, esti-mates that making its workplace morefamily-friendly has achieved as muchas a 400 per cent return on investment,mainly through increasing staff returnafter maternity leave. However, furtherresearch shows that family-friendlypolicies are more likely to offerparental leave or childcare subsidies,or both, to highly paid employeesrather than those with lower salaries.Such policies are particularly neededby low-wage working mothers whostruggle with poor working condi-tions, low compensation and a lack ofchildcare facilities.
Family-friendly provisions are by nomeans uniform across industrializedcountries. While in some countriesparents may take up to three yearsof leave with some financial com-pensation, in others paid leave isrestricted to the periods immediatelybefore and after childbirth. InScandinavian countries, employ-
ment-protected leave with relativelyhigh compensation rates is an inte-gral part of a family-friendly policymodel. In Sweden, for example,working families are allowed 12months of paid parental leave, to bedivided between parents as theydesire, provided that only one parentis on leave at any given time. Aidedby the right to reduce their workinghours until children go to school,almost half the mothers in dual-earnerfamilies in Sweden work less than 35 hours per week. Yet, while somecountries encourage fathers to taketemporary leave to care for theirnewborns, most countries continueto accept a traditional gender divi-sion of labour in which women stayat home, out of the labour force.
The lack of systematic reporting ham-pers measurement of the effectivenessof family-friendly policies (i.e., howwell they achieve a balance betweenwork and family life). While seeminglypositive, two challenges remain evenin the presence of family-friendlyworkplaces. First, working motherscontinue to be the primary caregiversfor their children, experience careerinterruptions and suffer from the dou-ble burden of working within and out-side the household throughout theirlives. Second, the family-friendly poli-cy model frequently excludes low-skilled and low-wage workers, workingmothers in particular, and typicallybenefits higher-paid workers.
See References, page 88.
The impact of family-friendly workplaces in industrialized countries
46 T H E S T A T E O F T H E W O R L D ’ S C H I L D R E N 2 0 0 7

dren behind. In the Philippines, for example,an estimated 3 million to 6 million children(10 per cent to 20 per cent of all under-18s)have been left by parents working overseas.53
Evidence from the Philippines, along withresearch on Indonesia and Thailand, suggeststhat, compared with non-migrants, the chil-dren of migrants might not be a particularlydisadvantaged group in terms of income oraccess to basic services such as health care andeducation. This is because migration is gener-ally an effective way for households to allevi-ate poverty, and because extended familieshelp fill the gap left by absent parents.54
Remittances sent by parents who have migrat-ed are often an important source of incomefor the families left behind.55
Migration may improve women’s self-esteemand status as they are able to assume a keyrole as providers by sending remittances hometo their families and communities.56 Severalacademic studies have found an increase inschool attendance and an improvement in chil-dren’s access to health-care services in house-holds with parents working abroad.57
Although remittances sent by migrant workers can bolster household income, themigration of one or both parents can havenegative effects on children, jeopardizingtheir development and well-being.58 Researchfrom Ecuador, Mexico and the Philippinessuggests that children whose parents havemigrated can suffer negative psychologicaleffects.59 In the Philippines, the children ofmigrant mothers reported feeling angry, lone-ly and afraid.60 In other countries, the risksof abuse and trafficking increase when rela-tives and friends gain custody of children leftbehind – risks particularly emphasized instudies conducted in Albania and theRepublic of Moldova.61
‘Involuntary migration’ also poses especiallyhigh risks to children. Refugee and internallydisplaced children face particular threats.62
They may be separated from their families,lose their homes and find themselves living in poor conditions with grave risks to theirhealth and education.63
Migrant women and girls are uniquely vulner-able to abuse and exploitation. With a greaterlikelihood of entering into low-status jobs,such as domestic service, migrant womenoften face human rights violations.64 AnInternational Labour Organization studyreports that half of foreign female domesticworkers interviewed said they were or hadbeen victims of verbal, physical or sexualabuse.65 When migrants have children in for-eign countries they may also face discrimina-tion in passing their nationality on to theirchildren, or, if they are undocumented, may bereluctant to register their children for fear ofdeportation.66
A number of countries have made positiveefforts to address migration and its effects on women and their families. In 2003, theJordanian Government endorsed the SpecialUnified Working Contract for non-Jordaniandomestic workers. The Philippines and Sri Lanka require that departing workers register with the government. Italy’s immigra-tion law provides a number of protections formigrants and their families.67 However, whilemigration is moving up the development agen-da, the significant implications for childrenstill receive little focus and research.
Challenging attitudes towards
women and work
The Convention on the Elimination of AllForms of Discrimination against Women guarantees women’s equality before the lawand establishes specific measures to eradicatediscrimination against women in all areas oftheir lives, including those related to education,health, employment, marriage and the family.68
While all but a handful of countries haveendorsed CEDAW – albeit some with reserva-tions – much more can be done to ensure discrimination does not exclude women from opportunities to work productively.
The workplace must be transformed to recog-nize the role that both parents play in child rear-ing, as required by article 18 of the Conventionon the Rights of the Child. Social policies andprogrammes should be promoted to enablewomen and men to reconcile their work and
E Q U A L I T Y I N E M P L O Y M E N T 47
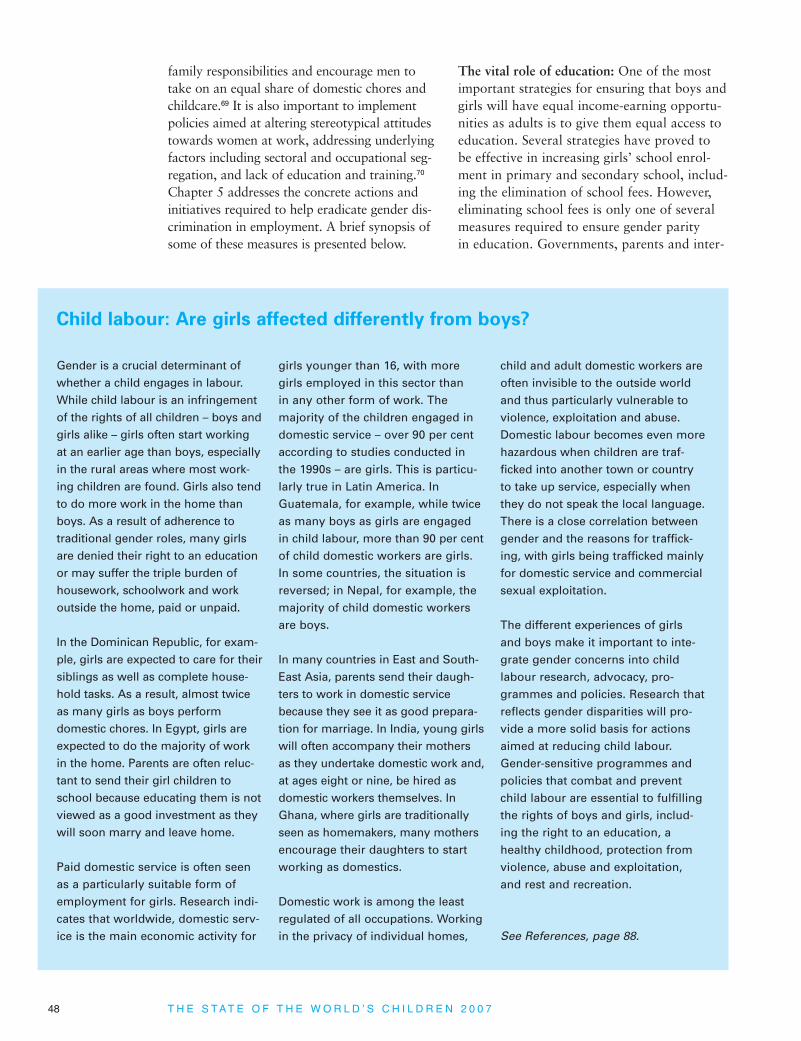
family responsibilities and encourage men totake on an equal share of domestic chores andchildcare.69 It is also important to implementpolicies aimed at altering stereotypical attitudestowards women at work, addressing underlyingfactors including sectoral and occupational seg-regation, and lack of education and training.70
Chapter 5 addresses the concrete actions andinitiatives required to help eradicate gender dis-crimination in employment. A brief synopsis ofsome of these measures is presented below.
The vital role of education: One of the mostimportant strategies for ensuring that boys andgirls will have equal income-earning opportu-nities as adults is to give them equal access toeducation. Several strategies have proved to be effective in increasing girls’ school enrol-ment in primary and secondary school, includ-ing the elimination of school fees. However,eliminating school fees is only one of severalmeasures required to ensure gender parity in education. Governments, parents and inter-
Gender is a crucial determinant ofwhether a child engages in labour.While child labour is an infringementof the rights of all children – boys andgirls alike – girls often start workingat an earlier age than boys, especiallyin the rural areas where most work-ing children are found. Girls also tendto do more work in the home thanboys. As a result of adherence to traditional gender roles, many girlsare denied their right to an educationor may suffer the triple burden ofhousework, schoolwork and workoutside the home, paid or unpaid.
In the Dominican Republic, for exam-ple, girls are expected to care for theirsiblings as well as complete house-hold tasks. As a result, almost twiceas many girls as boys performdomestic chores. In Egypt, girls areexpected to do the majority of workin the home. Parents are often reluc-tant to send their girl children toschool because educating them is notviewed as a good investment as theywill soon marry and leave home.
Paid domestic service is often seenas a particularly suitable form ofemployment for girls. Research indi-cates that worldwide, domestic serv-ice is the main economic activity for
girls younger than 16, with moregirls employed in this sector than in any other form of work. Themajority of the children engaged indomestic service – over 90 per centaccording to studies conducted inthe 1990s – are girls. This is particu-larly true in Latin America. InGuatemala, for example, while twiceas many boys as girls are engagedin child labour, more than 90 per centof child domestic workers are girls.In some countries, the situation isreversed; in Nepal, for example, themajority of child domestic workersare boys.
In many countries in East and South-East Asia, parents send their daugh-ters to work in domestic servicebecause they see it as good prepara-tion for marriage. In India, young girlswill often accompany their mothersas they undertake domestic work and,at ages eight or nine, be hired asdomestic workers themselves. InGhana, where girls are traditionallyseen as homemakers, many mothersencourage their daughters to startworking as domestics.
Domestic work is among the leastregulated of all occupations. Workingin the privacy of individual homes,
child and adult domestic workers areoften invisible to the outside worldand thus particularly vulnerable toviolence, exploitation and abuse.Domestic labour becomes even morehazardous when children are traf-ficked into another town or countryto take up service, especially whenthey do not speak the local language.There is a close correlation betweengender and the reasons for traffick-ing, with girls being trafficked mainlyfor domestic service and commercialsexual exploitation.
The different experiences of girlsand boys make it important to inte-grate gender concerns into childlabour research, advocacy, pro-grammes and policies. Research thatreflects gender disparities will pro-vide a more solid basis for actionsaimed at reducing child labour.Gender-sensitive programmes andpolicies that combat and preventchild labour are essential to fulfillingthe rights of boys and girls, includ-ing the right to an education, ahealthy childhood, protection fromviolence, abuse and exploitation,and rest and recreation.
See References, page 88.
Child labour: Are girls affected differently from boys?
48 T H E S T A T E O F T H E W O R L D ’ S C H I L D R E N 2 0 0 7

national donors must work together to ensurethat schools are ‘girl-friendly’ through severalmeasures:
• Encouraging local school authorities andteachers to adopt flexible scheduling.
• Allowing married adolescents and unmarriedparents to attend classes.
• Making school facilities safe from gender-based violence.
• Ensuring that schools have separate latrinesfor girls.
• Building schools close to girls’ homes.
• Encouraging parents and community leaders to be actively involved in schoolmanagement.71
In addition, it is important to emphasize thatschool curricula help students understand theimportance of gender equality.
Eliminating gender disparities in legislation:Critical measures to eliminate gender discrimi-nation in women’s land and property rightsmust include, but should not be limited to:
• Bringing national legislation in line withinternational human rights standards.
• Reforming land and property rights to elimi-nate discrimination against women.
• Involving international agencies and non-governmental organizations in efforts totrack and expose violations of women’sproperty rights and in monitoring govern-ment compliance with international humanrights treaties.72
The role of government in supporting workingfamilies: Governments should undertake leg-islative, administrative and financial measuresto create a strong and enabling environment
for women’s entrepreneurship and participa-tion in the labour market, including:
• Improved employment conditions.
• Creating career development opportunities.
• Eliminating pay gaps based solely on gender.
• Providing safe, affordable, high-qualitychildcare arrangements.73
A further step towards ensuring women’srights, greater public transparency and eco-nomic efficiency is the increasing use of gen-der-responsive budgets (see Chapter 5, page74). This mechanism analyses the impact ofgovernment expenditure and revenue onwomen and girls compared to men and boys.It neither requires separate budgets forwomen, nor does it aim to solely increasespending on women-specific programmes.Instead, it helps governments decide how poli-cies should be adjusted, and where resourcesneed to be reallocated to address poverty andgender inequalities.
Budget initiatives aimed at eliminating genderdisparities focus on national, provincial andmunicipal processes and may cover the overallbudget or only selected parts of it. They canbe carried out within government by theMinistry of Finance in conjunction with theMinistry of Women’s Affairs or other branchesof government related to social welfare, or bynon-governmental organizations and inde-pendent researchers.74
The need for better data and analysis:Although there are sufficient data to showthat women tend to work more and earn lessthan men, a lack of sex-disaggregated labourstatistics precludes a more detailed analysis ofthe disparities. Better data on employment andincome disaggregated by sex could significant-ly improve the analysis underlying policies andprogrammes – with benefits to women, chil-dren, families and entire economies.
E Q U A L I T Y I N E M P L O Y M E N T 49

Women’s politicalparticipation is a
Millennium objective in its own right.Empowering women in the politicalarena has the potential to change soci-eties. Their involvement in governingbodies at the national and local levelsleads to policies and legislation thatare focused on women, children and families.
• A growing body of evidence sug-gests that women in politics havebeen especially effective advocatesfor children at all levels, sponsoringlegislation and fostering tangiblechanges in policy outcomes thatreflect the rights, priorities, experi-ences and contributions of women,children and families.
• Though women’s parliamentary rep-resentation has steadily increased inthe past decade, they remain under-represented in almost all nationallegislatures – accounting for justunder 17 per cent of parliamentariansworldwide. Many of the perniciouseffects of gender discrimination,
from lower levels of education toprevailing social attitudes that chal-lenge women’s competence as deci-sion makers, as well as women’sgreater work burden, continue to hinder their participation in politics.
• The participation of women in localpolitics can have an immediateimpact on outcomes for women andchildren, particularly in the distribu-tion of community resources and inpromoting provisions for childcare.
• Women’s participation in peace nego-tiations and post-conflict reconstruc-tion is vital to ensure the safety andprotection of children and other vulnerable populations. Yet women’srole in most peace processes re-mains, at best, informal. While gov-ernments and other political actorsappear content to encourage engage-ment between women’s groups thatoften cut across conflict lines, womenrarely make it to peace table.
• Despite limited participation innational and local politics and inpost-conflict reconstruction, women
in politics and government are help-ing change the political environ-ment. Their influence is not justbeing felt in stronger legislation forchildren and women; they are alsohelping decision-making bodiesbecome more democratic and gender-sensitive.
• Increasing women’s participation inpolitics is vital to promote genderequality, empower women and fulfilchildren’s rights. The remaining for-mal entry barriers must be disman-tled, and women encouraged andsupported by political parties tostand for office. Legislative quotasare also gaining increasing recogni-tion as a potentially effective vehiclefor bolstering women’s representa-tion in local government, and insome countries, at the national levelas well. Gender initiatives also needthe involvement and support of men,especially male parliamentarians andpolitical leaders. Better data andresearch are required to fully assessthe impact of women legislators onpolicies related to children.
SUMMARY

T H E S TAT E O F T H E W O R L D ’ S C H I L D R E N 2 0 0 7
Equality in politics
and government
Children have a powerful stake in politi-cal outcomes, but they have little powerto shape them. Unable to vote or direct-ly represent their own interests in gov-
erning bodies, their ability to influence policy islimited. The advocates who speak on their behalf– if there is anyone at all to do so – can make avast difference to the fulfilment of children’srights to survival, development and protection.
A growing body of evidence suggests thatwomen in politics have been especially effectiveadvocates for children at the national and locallevels. They are equally powerful advocateswhen represented in peace processes and post-conflict reconstruction. Women’s participationin politics can significantly transform the gover-nance of a country by making it more receptiveto the concerns of all of its citizens. As thischapter will attest, their involvement in politicsalso fosters direct and tangible changes in policyoutcomes that reflect the priorities, experiencesand contributions of women, children and fami-lies. When women lack a voice in politics, pow-erful advocates for children remain unheard.
Women’s participation in politics, however,remains limited. Although women’s parliamen-tary representation has steadily increased overthe past decade, gender parity in politics at alllevels is still a long way off. At current annualrates of growth in the proportion of womenmembers of national parliaments – about 0.5per cent worldwide – gender parity in nationallegislatures will not be achieved until 2068.1
Advocating for women, children
and families
For several reasons, assessing the impact ofwomen’s participation in politics in general,
and on child-related outcomes in particular, isa complex and challenging task. First, in manycountries there are still far too few women inpolitics, and they have been in public life fortoo short a time, for their impact to be mean-ingfully assessed. Second, the behaviour of allparliamentarians is still an emerging area ofinvestigation in political science. Third, thereis the challenge of indicators: What is an adequate measure to gauge a legislator’simpact? While bill sponsorship, voting pat-terns and political seniority are all significant,they represent relative rather than absolutemeasures of influence.
Despite these constraints, those cases wherethere is both a significant level of female polit-ical representation and a sufficient amount ofdata to assess its impact point to an unequivo-cal conclusion: Women in politics are makinga difference in at least three important arenas –national legislatures, local government andpost-conflict reconstruction.
• National politics. A better representation ofwomen in parliament can make legislaturesmore gender- and child-sensitive and caninfluence legislation and policies thataddress the rights of both groups.
• Local politics. The presence of women leadersin local politics often serves to focus greaterattention on issues related to women and children. Evidence from India shows that women’s participation in local politics can significantly tilt the distribution of communityresources in favour of women and children.2
• Peace processes and post-conflict reconstruc-tion. There is an increasing recognition that
4©
UN
Pho
to/P
aulo
Filg
ueira
s
51

the contribution of women is critical both to the long-term success of peace processes andto post-conflict stability.
Women in national politics
Promoting the interests of children
and women
Research on the priorities of women parlia-mentarians comes mostly from industrializedcountries, where there has been greater scruti-ny of legislative behaviour than in developingcountries.3 Case studies examining lawmakers’patterns of bill sponsorship and legislative outcomes across a range of industrializedcountries confirm a strong commitment bywomen legislators to issues related to children,women and families. This commitment trans-lates into both active sponsorship of legisla-tion in these areas and to ensuring that thebills become law. A number of studies haveexpanded this area of enquiry to developingcountries, with similar findings.4
It would be a mistake to assume on the basisof these results that every woman legislatoractively advocates on behalf of women andchildren; some certainly do not. What the following studies indicate, however, is thatmany of the issues of particular relevance andimportance to women and children might notreach parliamentary agendas without thestrong backing of women legislators.
A pioneering study of women legislators inLatin America found that in the 1993–1994parliament, women deputies in Argentina were9.5 per cent more likely to sponsor childrenand family bills than their male counterparts.5
Furthermore, despite representing only 14 percent of deputies, Argentina’s women parlia-mentarians introduced no fewer than 78 percent of the bills related to women’s rights.6
Recent evidence suggests that this pattern of behaviour held true over the subsequentdecade. In 1999, women legislators inArgentina played a critical role in ensuring thepassage of a law that modified the country’spenal code to explicitly define sexual crimesagainst women and children and toughenedthe penalties for such egregious acts. Several
years later, in the 2004–2005 parliament,women legislators helped pass the Law on theIntegral Protection of the Rights of Childrenand Adolescents.7
Other Latin American countries display similartendencies. In 1999, women deputies in CostaRica initiated and helped pass the Law againstSexual Exploitation of Minors, together withreforms of the national penal code that tough-ened penalties for those convicted of sexualassault against children and the disabled. In2003, women senators in Colombia helpedpromote groundbreaking equal opportunitylegislation. The laws carry wide-ranging provi-sions to promote and guarantee the rights ofgirls and women, remove obstacles to the exer-cise of their rights, and incorporate gender-equitable policies at all levels of the State.8
This pattern of advocacy by women legislatorson behalf of women and children is also foundin industrialized countries. A recent examina-tion of New Zealand’s parliamentary debateson childcare and parental leave over a 25-yearperiod (1975–1999) revealed similar tenden-cies on the part of women legislators (seeFigure 4.1, page 53).9 In the United Kingdom,a forthcoming analysis of more than 3 millionwords of text from the plenary debates of theNational Assembly of Wales also finds impor-tant differences between the willingness offemale and male legislators to engage indebate about childcare.10
Parliamentary advocacy on behalf of childrenand families can also bridge party and ideo-logical lines. Countries where cross-partyalliances of women parliamentarians have successfully advanced the cause of women and children include Egypt, France, theNetherlands, South Africa, Sweden, theRussian Federation and Rwanda.11
In the case of the Russian Federation, anexamination of the role of women legislatorsin the 1995–1999 Duma (parliament) showsthat they were able to set aside ideological andparty differences to promote legislation bene-fiting children and families. The proposedmeasures favoured childcare and child support; benefits to citizens with children;
52 T H E S T A T E O F T H E W O R L D ’ S C H I L D R E N 2 0 0 7
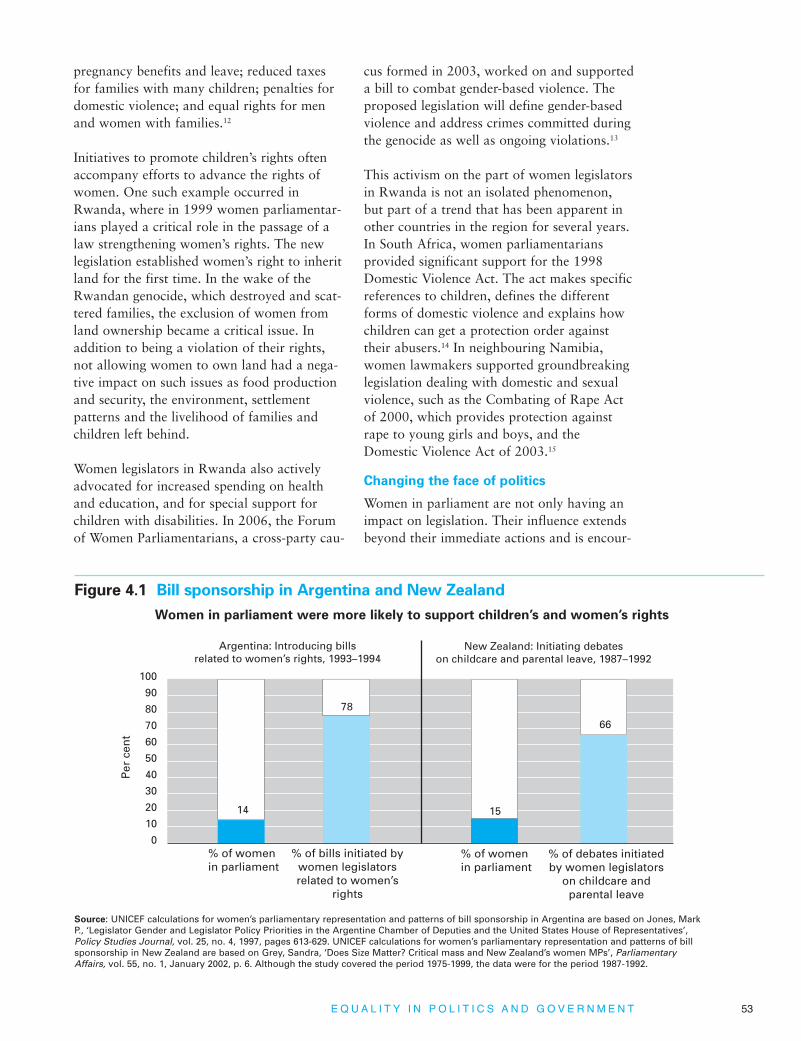
pregnancy benefits and leave; reduced taxesfor families with many children; penalties fordomestic violence; and equal rights for menand women with families.12
Initiatives to promote children’s rights oftenaccompany efforts to advance the rights ofwomen. One such example occurred inRwanda, where in 1999 women parliamentar-ians played a critical role in the passage of alaw strengthening women’s rights. The newlegislation established women’s right to inheritland for the first time. In the wake of theRwandan genocide, which destroyed and scat-tered families, the exclusion of women fromland ownership became a critical issue. Inaddition to being a violation of their rights,not allowing women to own land had a nega-tive impact on such issues as food productionand security, the environment, settlement patterns and the livelihood of families andchildren left behind.
Women legislators in Rwanda also activelyadvocated for increased spending on healthand education, and for special support forchildren with disabilities. In 2006, the Forumof Women Parliamentarians, a cross-party cau-
cus formed in 2003, worked on and supporteda bill to combat gender-based violence. Theproposed legislation will define gender-basedviolence and address crimes committed duringthe genocide as well as ongoing violations.13
This activism on the part of women legislatorsin Rwanda is not an isolated phenomenon,but part of a trend that has been apparent inother countries in the region for several years.In South Africa, women parliamentarians provided significant support for the 1998Domestic Violence Act. The act makes specificreferences to children, defines the differentforms of domestic violence and explains howchildren can get a protection order againsttheir abusers.14 In neighbouring Namibia,women lawmakers supported groundbreakinglegislation dealing with domestic and sexualviolence, such as the Combating of Rape Actof 2000, which provides protection againstrape to young girls and boys, and theDomestic Violence Act of 2003.15
Changing the face of politics
Women in parliament are not only having animpact on legislation. Their influence extendsbeyond their immediate actions and is encour-
% of women in parliament
0
10
20
30
40
50
60
70
80
90
100
% of debates initiatedby women legislators
on childcare andparental leave
% of women in parliament
% of bills initiated bywomen legislatorsrelated to women’s
rights
15
66
14
78
New Zealand: Initiating debateson childcare and parental leave, 1987–1992
Argentina: Introducing billsrelated to women’s rights, 1993–1994
Per
cen
t
Figure 4.1 Bill sponsorship in Argentina and New Zealand
Source: UNICEF calculations for women’s parliamentary representation and patterns of bill sponsorship in Argentina are based on Jones, MarkP., ‘Legislator Gender and Legislator Policy Priorities in the Argentine Chamber of Deputies and the United States House of Representatives’,Policy Studies Journal, vol. 25, no. 4, 1997, pages 613-629. UNICEF calculations for women’s parliamentary representation and patterns of billsponsorship in New Zealand are based on Grey, Sandra, ‘Does Size Matter? Critical mass and New Zealand’s women MPs’, ParliamentaryAffairs, vol. 55, no. 1, January 2002, p. 6. Although the study covered the period 1975-1999, the data were for the period 1987-1992.
Women in parliament were more likely to support children’s and women’s rights
E Q U A L I T Y I N P O L I T I C S A N D G O V E R N M E N T 53

Should one expect the involvement of women parliamentarians to leadto different policy outcomes? Thereasons one can assume womenmight act from a different perspec-tive than their male counterparts arepractical rather than theoretical.
An alternative perspective
In an extensive survey of 187 womenparliamentarians from 65 countriesconducted by the Inter-ParliamentaryUnion (IPU) in 1999, the respondentsconsistently portrayed women as hav-ing different priorities from men. Fourout of every five respondents believed that women held conceptually differentideas about society and politics. Morethan 90 per cent agreed that women’sgreater participation would bringabout change, and almost 9 out ofevery 10 considered that women’s par-ticipation in the political process signif-icantly changed political outcomes.
Three reasons women
politicians are likely to approach
politics differently
Women’s motivation for entering
politics is often different from that
of men. In the IPU survey, 40 per centof the respondents stated that theyhad entered politics as a result oftheir interests in social work and 34per cent through non-governmentalorganizations, as opposed to themore ‘conventional’ path of party politics often embraced by men. Thisfinding accurately reflects a well-established tendency among womento engage in civil society as a way of promoting projects that supporthousehold survival, and to focus theirenergies at the local level.
Women are often exposed to differ-
ent patterns of socialization and
have different life experiences than
men and are likely to bring theirexperience and expertise to bear ontheir political decisions. While impor-tant changes have been taking placeover the past few decades, in mostcountries, women still bear the maincaregiving responsibilities for theirfamilies, including children and theelderly.
Women are more likely to see them-
selves as representatives of women.
A study of legislators in the UnitedStates, for example, found thatwomen feel a special responsibilityto represent other women and consider themselves more capable of representing their interests. InNorthern Ireland, for example,almost one third of women who vote thought a woman would betterrepresent their interests.
Why are there still so few
women in politics?
Given their potential contribution tothe political process, an obvious ques-tion arises: Why then are there still sofew women participating in politics?The answer is multifaceted and differsacross countries, societies and com-munities. But several commonthreads are outlined below.
Women are unlikely to run for politi-
cal office. While exact numbers aredifficult to come by, existing studiesindicate that women are less likelythan men to run for office. In theUnited States, for example, men areat least 50 per cent more likely tohave investigated how to place theirname on the ballot, or to have dis-cussed running with potential donors,party or community leaders, familymembers or friends.
• Double burden of public and privateresponsibilities: As the precedingchapters have shown, women’s workburdens are generally much heavierthan men’s, leaving less time andenergy for involvement in politicallife. In the United States, evidenceshows that as women’s responsibili-ties for household tasks and care-giving decrease, their interest in running for office increases.
• A culture of exclusion: In manycountries, both political and financialnetworks are controlled by men.Cultural practices that serve to nur-ture and consolidate bonds of malesolidarity within these networks,such as drinking, smoking or golf-ing, are key stepping stones on thepath to political office. A study inThailand found that men typicallydominate recruitment committeesand tend to bypass women candi-dates, both in order to retain a structure they are familiar with andbecause they are more likely to knowthe male candidates personally.
• Higher participation in education:Those women who run for officesuccessfully, especially in develop-ing countries, tend to be educated to tertiary level at least. Out of the 187 women from 65 countries sur-veyed by the IPU in 1999, 73 per centheld an undergraduate degree and14 per cent also held graduatedegrees. The lack of women educatedto tertiary levels in many countries cantherefore act as a barrier to their par-ticipation in politics and government.
Women face an uphill struggle to win
over public opinion. There are veryfew statistics about how manywomen run but fail to get elected.
Women and politics: Realities and myths
54 T H E S T A T E O F T H E W O R L D ’ S C H I L D R E N 2 0 0 7
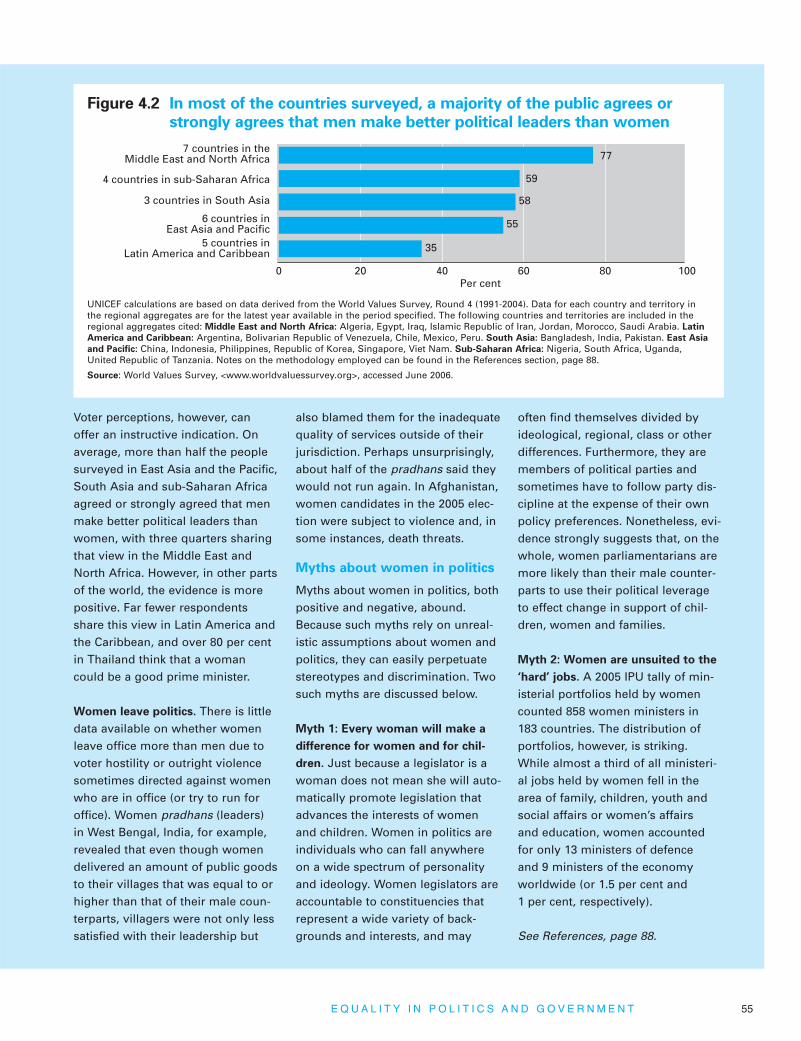
Voter perceptions, however, canoffer an instructive indication. Onaverage, more than half the peoplesurveyed in East Asia and the Pacific,South Asia and sub-Saharan Africaagreed or strongly agreed that menmake better political leaders thanwomen, with three quarters sharingthat view in the Middle East andNorth Africa. However, in other partsof the world, the evidence is morepositive. Far fewer respondentsshare this view in Latin America andthe Caribbean, and over 80 per centin Thailand think that a womancould be a good prime minister.
Women leave politics. There is littledata available on whether womenleave office more than men due tovoter hostility or outright violencesometimes directed against womenwho are in office (or try to run foroffice). Women pradhans (leaders) in West Bengal, India, for example,revealed that even though womendelivered an amount of public goodsto their villages that was equal to orhigher than that of their male coun-terparts, villagers were not only lesssatisfied with their leadership but
also blamed them for the inadequatequality of services outside of theirjurisdiction. Perhaps unsurprisingly,about half of the pradhans said theywould not run again. In Afghanistan,women candidates in the 2005 elec-tion were subject to violence and, insome instances, death threats.
Myths about women in politics
Myths about women in politics, bothpositive and negative, abound.Because such myths rely on unreal-istic assumptions about women andpolitics, they can easily perpetuatestereotypes and discrimination. Twosuch myths are discussed below.
Myth 1: Every woman will make a
difference for women and for chil-
dren. Just because a legislator is awoman does not mean she will auto-matically promote legislation thatadvances the interests of womenand children. Women in politics areindividuals who can fall anywhereon a wide spectrum of personalityand ideology. Women legislators areaccountable to constituencies thatrepresent a wide variety of back-grounds and interests, and may
often find themselves divided by ideological, regional, class or otherdifferences. Furthermore, they aremembers of political parties andsometimes have to follow party dis-cipline at the expense of their ownpolicy preferences. Nonetheless, evi-dence strongly suggests that, on thewhole, women parliamentarians aremore likely than their male counter-parts to use their political leverageto effect change in support of chil-dren, women and families.
Myth 2: Women are unsuited to the
‘hard’ jobs. A 2005 IPU tally of min-isterial portfolios held by womencounted 858 women ministers in183 countries. The distribution ofportfolios, however, is striking.While almost a third of all ministeri-al jobs held by women fell in thearea of family, children, youth andsocial affairs or women’s affairsand education, women accountedfor only 13 ministers of defenceand 9 ministers of the economyworldwide (or 1.5 per cent and 1 per cent, respectively).
See References, page 88.
0 20 40 60 80 100Per cent
7 countries in theMiddle East and North Africa
4 countries in sub-Saharan Africa
3 countries in South Asia
6 countries inEast Asia and Pacific
5 countries inLatin America and Caribbean
77
59
58
55
35
Figure 4.2 In most of the countries surveyed, a majority of the public agrees or
strongly agrees that men make better political leaders than women
UNICEF calculations are based on data derived from the World Values Survey, Round 4 (1991-2004). Data for each country and territory inthe regional aggregates are for the latest year available in the period specified. The following countries and territories are included in theregional aggregates cited: Middle East and North Africa: Algeria, Egypt, Iraq, Islamic Republic of Iran, Jordan, Morocco, Saudi Arabia. Latin
America and Caribbean: Argentina, Bolivarian Republic of Venezuela, Chile, Mexico, Peru. South Asia: Bangladesh, India, Pakistan. East Asia
and Pacific: China, Indonesia, Philippines, Republic of Korea, Singapore, Viet Nam. Sub-Saharan Africa: Nigeria, South Africa, Uganda,United Republic of Tanzania. Notes on the methodology employed can be found in the References section, page 88.
Source: World Values Survey, <www.worldvaluessurvey.org>, accessed June 2006.
E Q U A L I T Y I N P O L I T I C S A N D G O V E R N M E N T 55
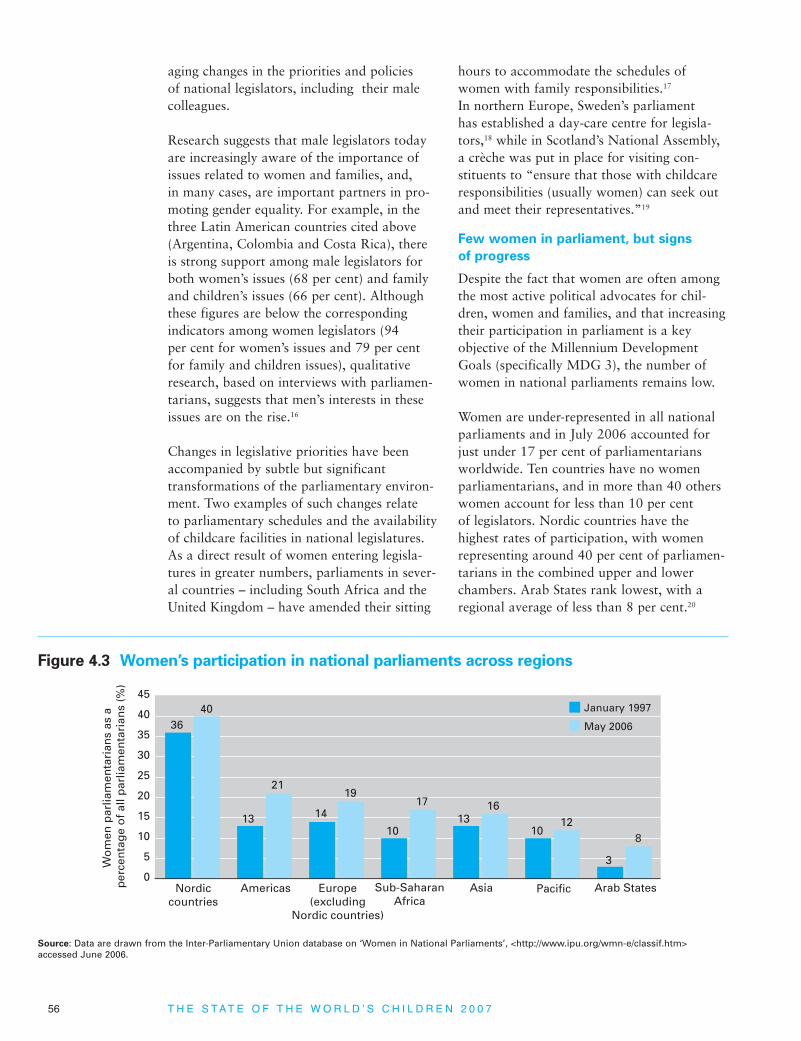
aging changes in the priorities and policies of national legislators, including their malecolleagues.
Research suggests that male legislators todayare increasingly aware of the importance ofissues related to women and families, and, in many cases, are important partners in pro-moting gender equality. For example, in thethree Latin American countries cited above(Argentina, Colombia and Costa Rica), thereis strong support among male legislators forboth women’s issues (68 per cent) and familyand children’s issues (66 per cent). Althoughthese figures are below the corresponding indicators among women legislators (94 per cent for women’s issues and 79 per centfor family and children issues), qualitativeresearch, based on interviews with parliamen-tarians, suggests that men’s interests in theseissues are on the rise.16
Changes in legislative priorities have beenaccompanied by subtle but significant transformations of the parliamentary environ-ment. Two examples of such changes relate to parliamentary schedules and the availabilityof childcare facilities in national legislatures. As a direct result of women entering legisla-tures in greater numbers, parliaments in sever-al countries – including South Africa and theUnited Kingdom – have amended their sitting
hours to accommodate the schedules ofwomen with family responsibilities.17
In northern Europe, Sweden’s parliament has established a day-care centre for legisla-tors,18 while in Scotland’s National Assembly,a crèche was put in place for visiting con-stituents to “ensure that those with childcareresponsibilities (usually women) can seek outand meet their representatives.”19
Few women in parliament, but signs
of progress
Despite the fact that women are often amongthe most active political advocates for chil-dren, women and families, and that increasingtheir participation in parliament is a keyobjective of the Millennium DevelopmentGoals (specifically MDG 3), the number ofwomen in national parliaments remains low.
Women are under-represented in all nationalparliaments and in July 2006 accounted forjust under 17 per cent of parliamentariansworldwide. Ten countries have no women parliamentarians, and in more than 40 otherswomen account for less than 10 per cent of legislators. Nordic countries have the highest rates of participation, with women representing around 40 per cent of parliamen-tarians in the combined upper and lowerchambers. Arab States rank lowest, with aregional average of less than 8 per cent.20
0
5
10
15
20
25
30
35
40
45
Nordiccountries
Americas Europe(excluding
Nordic countries)
Sub-SaharanAfrica
Asia Pacific Arab States
3640
13
21
14
19
10
17
1316
1012
3
8
January 1997
May 2006
Wo
men
par
liam
enta
rian
s as
a p
erce
nta
ge
of
all p
arlia
men
tari
ans
(%)
Figure 4.3 Women’s participation in national parliaments across regions
Source: Data are drawn from the Inter-Parliamentary Union database on ‘Women in National Parliaments’, <http://www.ipu.org/wmn-e/classif.htm> accessed June 2006.
56 T H E S T A T E O F T H E W O R L D ’ S C H I L D R E N 2 0 0 7
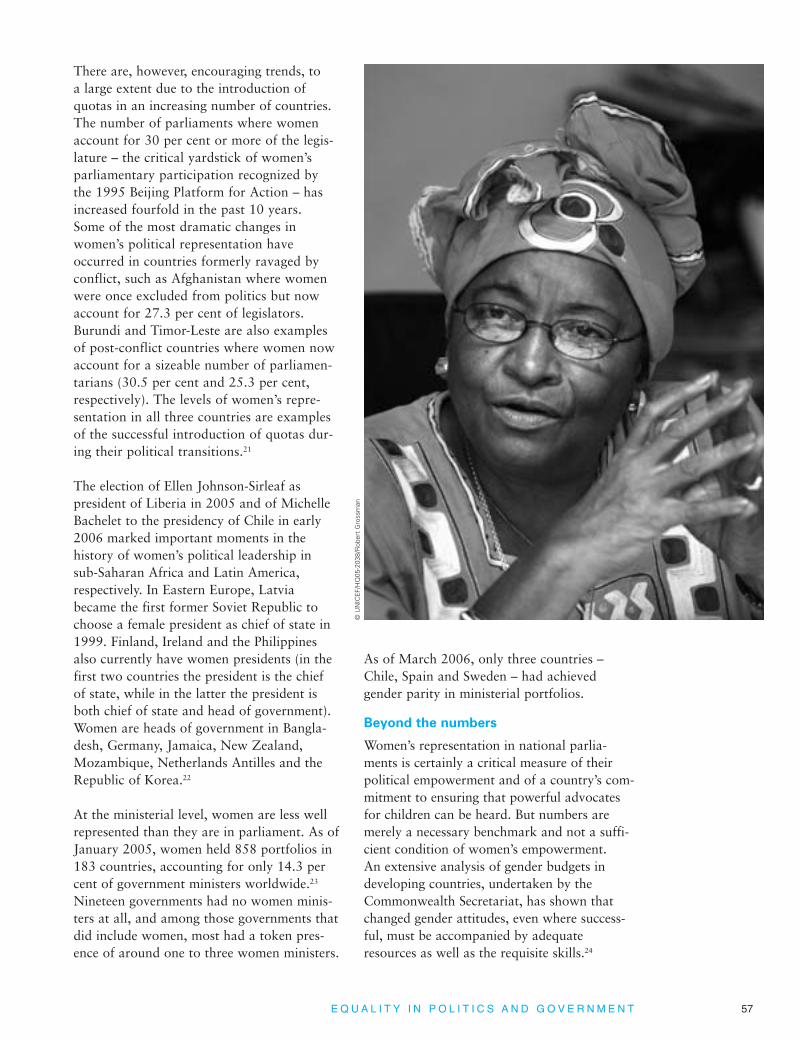
There are, however, encouraging trends, to a large extent due to the introduction of quotas in an increasing number of countries.The number of parliaments where womenaccount for 30 per cent or more of the legis-lature – the critical yardstick of women’s parliamentary participation recognized by the 1995 Beijing Platform for Action – hasincreased fourfold in the past 10 years.Some of the most dramatic changes inwomen’s political representation haveoccurred in countries formerly ravaged byconflict, such as Afghanistan where womenwere once excluded from politics but nowaccount for 27.3 per cent of legislators.Burundi and Timor-Leste are also examplesof post-conflict countries where women nowaccount for a sizeable number of parliamen-tarians (30.5 per cent and 25.3 per cent,respectively). The levels of women’s repre-sentation in all three countries are examplesof the successful introduction of quotas dur-ing their political transitions.21
The election of Ellen Johnson-Sirleaf as president of Liberia in 2005 and of MichelleBachelet to the presidency of Chile in early2006 marked important moments in the history of women’s political leadership insub-Saharan Africa and Latin America,respectively. In Eastern Europe, Latviabecame the first former Soviet Republic tochoose a female president as chief of state in1999. Finland, Ireland and the Philippinesalso currently have women presidents (in thefirst two countries the president is the chiefof state, while in the latter the president isboth chief of state and head of government).Women are heads of government in Bangla-desh, Germany, Jamaica, New Zealand,Mozambique, Netherlands Antilles and theRepublic of Korea.22
At the ministerial level, women are less wellrepresented than they are in parliament. As ofJanuary 2005, women held 858 portfolios in183 countries, accounting for only 14.3 percent of government ministers worldwide.23
Nineteen governments had no women minis-ters at all, and among those governments thatdid include women, most had a token pres-ence of around one to three women ministers.
As of March 2006, only three countries –Chile, Spain and Sweden – had achieved gender parity in ministerial portfolios.
Beyond the numbers
Women’s representation in national parlia-ments is certainly a critical measure of theirpolitical empowerment and of a country’s com-mitment to ensuring that powerful advocatesfor children can be heard. But numbers aremerely a necessary benchmark and not a suffi-cient condition of women’s empowerment. An extensive analysis of gender budgets indeveloping countries, undertaken by theCommonwealth Secretariat, has shown thatchanged gender attitudes, even where success-ful, must be accompanied by adequateresources as well as the requisite skills.24
© U
NIC
EF/
HQ
05-2
038/
Rob
ert
Gro
ssm
an
E Q U A L I T Y I N P O L I T I C S A N D G O V E R N M E N T 57

Governments, in conjunction with women’sorganizations and political parties, have a vital role in ensuring women’s empowerment.They do so by promoting gender-sensitivityamong officials or establishing comprehensivewomen’s policy forums, such as women’s ministries and equal opportunity bureaus.
A comprehensive study of governments’responsiveness to violence against womenbetween 1974 and 1994, for example, foundno linear relationship between the number ofwomen in parliament and policy initiativesaimed at reducing violence against women.Drawing on examples from 36 countries, thestudy revealed that governments with a highrepresentation of women in parliament – suchas Sweden, Finland and Denmark – sometimeslagged in their anti-violence policies behindsuch countries as Australia and Israel wherethe presence of women in the legislature wasfar weaker. The study concluded that whatmatters most in terms of a government’sresponse to the needs and interests of womenis not simply the number of women in parlia-ment. Of equal importance are institutionalmechanisms, such as support from politicalparties for women’s rights, and the strengthand coherence of women’s organizations.25
Political parties and women’s groups are central to the advancement of women’s partic-ipation in politics. Parties have a critical func-tion in recruiting and endorsing candidates for elections and putting their weight behind specific items in parliamentary agendas.26
Women’s groups often provide the civil societyimpetus and expertise that are required to pro-mote, develop and sustain the legislative initia-tives and accountability mechanisms that canadvance the rights of women and children (see Panel, page 59).
Women in local politics
Prioritizing investments that benefit
women and girls
The participation of women in local politicscan have an even more immediate and directimpact on outcomes for women and childrenthan national legislation or policies. Althoughevidence about the behaviour of local politi-cians is limited, a number of studies from bothindustrialized and developing countries indi-cate that women in local government tend toprioritize social issues. Moreover, in oneimportant documented case in the developingworld (India), women’s increasing participa-tion in local politics has led to a more equi-table distribution of community resources,with direct benefits for women and children,especially girls.
In Norway, children’s issues, and particularlythe lack of childcare spaces, are one of themost frequently cited reasons for womenentering local politics. A recent study, trackingdata as far back as 1975, shows that duringthe first year when women were around some 30 per cent of local council members, thenumber of children receiving benefits increased.The most significant finding of the Norwaystudy is that women in local government havethe greatest policy impact early on in theircareers because they bring a new set of con-cerns to the political agenda.27
In the United States, a 1994 analysis of morethan 9,800 bills introduced in three states overa two-year period found that women legisla-tors were twice as likely as their male counter-parts to sponsor child health bills.28 Another
Women inparliament
Womenministers
Women heads ofgovernment
0
10
20
30
World averages
17
Per
cen
t
14
6
Figure 4.4 Women in governance
Source: Data on women in parliament and women ministers are drawn from the Inter-Parliamentary Union database on ‘Women in National Parliaments’,<http://www.ipu.org/wmn-e/classif.htm>, accessed June 2006. Data on womenheads of government are derived from official websites of national governments.
58 T H E S T A T E O F T H E W O R L D ’ S C H I L D R E N 2 0 0 7

study, which examined women’s political representation, showed that US states with ahigh percentage of women in the legislatureare likely to be more supportive of efforts toaddress violence against women, increase childsupport, provide women with more extensiveemployment and unemployment benefits, andpromote reproductive health care.29
In developing countries, research on theimpact of women in local government is anemerging area of enquiry. The most compre-hensive findings currently available come fromIndia, where in 1998 one third of all leader-ship positions in village councils were reservedfor women.30 An extensive research projectexamining the impact of the reservation policyinitially surveyed 165 village councils in thestate of West Bengal. The study examined the
level of public goods provision in councils thathad reservation policies compared to thosewithout such quotas.
The study found that in villages with reserva-tion policies, investment in drinking-waterfacilities was double that of villages withoutquotas and that the roads were almost twiceas likely to be in good condition. Furthermore,major roadways were 20 per cent more likelyto have been recently repaired; new biogas (a substitute for cooking fuel and electricity)projects were introduced in 26 per cent of thevillages with reservation policies (compared to6 per cent in the villages without quotas); and,due to active monitoring, the number of visitsby health workers in the six months coveredby the study was significantly higher. Theseimprovements were highly beneficial to
There are at least two ways in whichwomen’s groups can be an impor-tant force for political change. First,these groups often provide supportto women who have been elected topolitical office. Second, they conducttheir own advocacy efforts on behalfof women, children and families.Across the world, women’s groupsand networks are providing exam-ples of how grass-roots mobilizationcan advance human rights, especial-ly for the most vulnerable.
Afghanistan: Women’s groups haveprovided significant support in mobi-lizing women to participate in thepresidential and parliamentary elec-tions and in monitoring the electoralprocess. They have also organizedworkshops for women refugees inorder to expand their awareness oftheir rights.
Australia: Women’s groups, alongwith other groups in civil society,played an important role as advo-
cates for the rights of children inimmigration detention. They havelobbied for changes in domestic lawand social policy and for improvedservices to enhance the ability ofrefugee families to rebuild their lives.
Morocco: In 2004, the advocacy and awareness-raising efforts ofwomen’s rights activists associatedwith the organization Printemps del’Egalité (Spring of Equality) helpedpersuade government leaders tosupport a landmark family law thatis meant to address women’sinequality, protect children’s rightsand safeguard men’s dignity.
Mozambique: A campaign againstchild marriage by several localwomen’s groups contributed to the passage of a new family law in 2004 that raised the legal age ofmarriage without parental consentfrom 16 years to 18 years, and withparental consent from 14 years to 16 years.
Rwanda: In 2002, women parliamen-tarians and community leaders col-laborated during the drafting of anational convention to supportwomen’s educational opportunities,small business loans provided byrural banks and the creation of acommission to lobby on behalf ofvulnerable young people.
Tajikistan: The Tajikistan League ofWomen Lawyers drafted a nationallaw on violence, which is currentlypending approval by the president.The drafting of the law was a diffi-cult task, but the League organized32 workshops across the country for more than 1,100 participants, and eventually succeeded in obtain-ing the cooperation of local authori-ties, law enforcement and judicial bodies, ministries and other nationalinstitutions.
See References, page 88.
Women’s groups: A force for political change
E Q U A L I T Y I N P O L I T I C S A N D G O V E R N M E N T 59

women and girls, who bear the primaryresponsibility for collecting fuel and water and looking after family health-care needs,particularly those of children.
Building on these initial results, the researchproject was expanded to examine the impactof the reservation policies on child immu-nization and schooling. In a survey covering100 villages in Rajasthan, immunization surveys were administered to 30 householdsin each village. The surveys collected infor-mation on the immunization record of everychild under the age of five. The findingsindicated that a child between the age of one and five years old residing in a villagereserved for a woman pradhan (leader) has a slightly higher probability of having com-pleted all vaccinations. The impact of thewomen leaders on the school attendance of girls is even more significant: The studyrevealed that the presence of a woman prad-han reduces the gender gap in school atten-dance by 13 percentage points.31
Simply having a greater number of women inlocal government, however, will not guaranteetheir effectiveness as advocates for the inter-ests and rights of children, women and fami-
lies. In South Africa, for example, an analysisof the problems and opportunities faced bywomen in local government revealed that, aswith their colleagues in parliament, their effec-tiveness was largely determined by factorsother than their numerical presence. Theseincluded cultural norms and expectations ofwomen’s roles; local hierarchies; the abilitiesand attributes of individual councillors; andthe extent of political parties’ commitment togender equality.32
Catalysts of change
According to a comparative analysis ofwomen in local government in 13 countries in East Asia and the Pacific, women haveenjoyed more success at gaining access todecision-making positions in local govern-ment than at the national level. Local gov-ernment tends to be easier for women to fitinto their lives along with family and workresponsibilities. It also tends to be moreaccessible to them, with more positions available and less competition than for parlia-mentary seats. Moreover, women’s decision-making roles in city and communitygovernment may be more easily acceptedbecause they are seen as an extension ofwomen’s involvement in their communities.33
© U
NIC
EF/
HQ
05-1
609/
Gia
com
o P
irozz
i
60 T H E S T A T E O F T H E W O R L D ’ S C H I L D R E N 2 0 0 7

Yet in many countries, women’s participationin local politics is often undermined by genderinequality within families, by an inequitable division of labour within households, and by deeply entrenched cultural attitudes aboutgender roles and the suitability of women fordecision-making positions34 (also see Chapter1, page 8). According to United Cities and Local Governments, an organization that has been collecting data on women inlocal decision-making since 1998, womenaccount for just over 9 per cent of mayorsworldwide and almost 21 per cent of localcouncillors.35
In spite of these obstacles, as more womenare elected to local government, they areincreasingly becoming important agents ofchange. In the previously cited example of villages with a reservation policy in WestBengal, India, the presence of women leadersat village meetings encouraged additionalpolitical interest and activism by otherwomen. The attendance of women at villagecouncil meetings grew by a considerable margin – from 6.9 per cent to 9.9 per cent –when the chair was a woman pradhan.36
Women, war and peace
Women’s ability to actively shape politicalprocesses at the national and local levels, asillustrated by the case studies above, is predi-cated on the existence of democratic institu-tions and a stable political environment.However, over the past few years there hasbeen an increasing recognition that in conflictsituations characterized by instability and weakapplication of the rule of law, women’s partici-pation in peace processes is essential to ensuretheir long-term success.37 Preliminary researchand case studies suggest that peace agreements,post-conflict reconstruction and governancehave a better chance of success when womenare involved, in part because women adopt amore inclusive approach towards security andaddress key social and economic issues thatmight otherwise be ignored.38
Recognizing the unique contribution that womencan make to peace processes, in October 2000the UN Security Council unanimously passed
resolution 1325, which specifically addressesthe impact of war on women, and women’scontributions to conflict resolution and sus-tainable peace. Yet women’s role in peaceprocesses remains, at best, informal. Whilegovernments and other political actors appearcontent to encourage engagement withwomen’s groups that often cut across the linesof conflict, women rarely make it to the peacetable. On the few occasions that they do, theirvoices are rarely heard.
Women’s exclusion from peace negotiationsmeans that their rights and views – as citizens,as former combatants and as victims – are notfully represented in post-conflict reconstruc-tion processes. A recent report examining 13 peace agreements reached between 1991and 2001 that put an end to conflicts inAfghanistan, Bosnia and Herzegovina,Bougainville (Pacific Islands), Cambodia, El Salvador, Eritrea, Ethiopia, Guatemala,Kosovo, Liberia, Rwanda and Sierra Leoneand Timor-Leste, among others, concludedthat “there is no peace agreement that pro-vides an overall model for appropriate provi-sions for ensuring that the needs of women areserved alongside those of men.”39 These agree-ments included, in fact, few if any provisionsthat related specifically or even indirectly towomen – an omission reflective of the over-whelming gender imbalance among the nego-tiators. While resolution 1325 has broughtattention to the critical importance of includ-ing women in peace negotiations, half of theagreements signed since its adoption haveomitted references to the needs of women and a gender perspective.40
Would women at the peace table make a
difference?
The success of women’s participation in otherpolitical arenas (as discussed earlier in thischapter) suggests that there is every reason to believe that the presence of women at the peace table would make an important difference for women and children. In thewords of a former international mediator,when women are present, “the talks tend toadopt a more inclusive view of security andaddress issues related to the reintegration ofchildren and women, preventing domestic
E Q U A L I T Y I N P O L I T I C S A N D G O V E R N M E N T 61

violence when ex-combatants return to theirhomes, getting landmines out of the groundto allow women and girls to gather firewoodand water more safely, and ensuring post-conflict accountability for human rightsabuses against children and women.”41 Inother words, the involvement of womenincreases the likelihood of issues critical to
the rights and well-being of children, womenand families being included in negotiations.
This notion is borne out by experiences in sev-eral countries across the world. Most famously,representatives of over 200 women’s organiza-tions met in 1996 to create the NorthernIreland Women’s Coalition, the first female-dominated political party. The movement,which included members from both Protestantand Catholic communities, worked as a cross-community party to promote civil, human andworkers’ rights.42 The coalition was eventuallycredited by George Mitchell, the US senatorwho mediated the Northern Ireland peacetalks, with helping to achieve an agreement in those negotiations.43
Women’s participation in conflict
resolution processes
Across the world, women have becomeincreasingly involved in conflict resolutionprocesses. The Bonn talks on Afghanistan in late 2001 included 5 women out of approx-imately 60 delegates and advisers. During thenegotiations, the women representativesfought hard for women’s rights, and theirachievements included the creation of aMinistry of Women’s Affairs.44 In Guatemala,the participation of women in the formalpeace process of 1996 led to a national healthprogramme for women and girls and a pro-gramme to reunite families and locate missingor separated children and orphans.45 In thePhilippines, women have held influential posi-tions in formal peace processes and havepushed for cooperation across party and reli-gious lines in the interests of peace.46 In SierraLeone, two women were involved in the Lomepeace process. Although they were not chiefnegotiators, a key article of the final agree-ment calls for special attention to be paid tovictimized women and girls in formulating andimplementing rehabilitation, reconstructionand development programmes.47 More recent-ly, women have made a critical contribution to the Darfur peace talks (see Panel at left).
These experiences notwithstanding, in mostconflicts women are either entirely excludedfrom peace negotiations or relegated to a ‘par-allel’ track. Even establishing this type of track
In 2005, a Gender Experts Support Team, composed of 20 womenmembers and backed by the governments of Canada, Norwayand Sweden and by the UN Development Fund for Women wasinvited to participate in the seventh and decisive round of theDarfur Peace Agreement negotiations. The team gathered womenfrom a variety of tribal and ethnic backgrounds in Darfur to createa unified platform of women’s priorities and gender issues. Theoutcome document, ‘Women’s Priorities in the Peace Process andReconstruction in Darfur’, contains a number of key provisionsrelated to women and children, including:
• Specific protections for women and children in conflict situations.
• Priority treatment for women and children in assessments related to compensation/reparations for damages and destruction caused by the war.
• An appeal to the government to pay particular attention to the education of women and children as a means of ensuring security.
• Provision of secondary education in the camps for refugees and internally displaced persons.
• A call to the international community to focus on the educationneeds of refugee girls.
• The creation of an institution to provide legal support, psychological counselling and other relevant services to women and children.
During the three short weeks that women were allowed to participate in the talks, they were able to negotiate for the inclusion of an impressive number of their priorities in the finalagreement. The accord includes language that is gender-sensitiveand, among other priorities, calls for the participation of womenin decision-making bodies and in peace-building.
See References, page 88.
Women and the Darfur Peace Agreement
62 T H E S T A T E O F T H E W O R L D ’ S C H I L D R E N 2 0 0 7
is a challenge that requires women to fighthard to gain even limited representation, andoften brings only modest success. Examples ofsuch parallel tracks include:
• Burundi: In 2000, women overcame theresistance of the Burundian parties andwere included as informal observers inpeace talks held in Arusha, United Republicof Tanzania.48
• Liberia: Even though the Liberian Women’sInitiative was unable to become an officialparticipant in the regional peace talks of 1994, its leaders proved to be highlyinfluential consultants during the process.49
• Somalia: In May 2000, 92 women delegatesto the Somali National Peace Conferencepresented themselves as a ‘sixth clan’ forpeace (Somalia has several major ethnic
An increased presence of womenamong peace negotiators and peace-keeping forces, among other criticalactors, would greatly enhancewomen’s contributions to conflictresolution and post-conflict rehabili-tation. As a District Officer from theIturi Province in the DemocraticRepublic of the Congo explained in a report to the UN Department of Peacekeeping Operations (DPKO),“Local women [and girls] have difficulty in talking freely to uni-formed men, such as male militaryobservers, especially about sensitiveissues such as sexual violence andabuse…. In many cases, especiallywhere there is endemic violence,local women [and girls] prefer tospeak to a woman peacekeeperbecause they fear further violence,including from male peacekeepers.”
The UN is fully aware of this fact.While the number of women amongthe uniformed personnel (militaryand police forces) deployed by DPKOremains miniscule – at 4 per centand 1 per cent, respectively – activesteps taken by the department inrecent years have increased thenumber of civilian positions held bywomen. These steps reflect a grow-ing recognition that the presence ofwomen among peacekeeping forcesis critical to the success of their mis-sions, and can reduce the possibility
that peacekeepers engage in acts of sexual exploitation and abuseagainst the very populations they are mandated to protect, especiallyyoung girls. Among the key findingsof an investigation initiated by theUN Secretary-General into suchcases was the recognition that “thepresence of more women in a mis-sion, especially at senior levels, willhelp to promote an environment that discourages sexual exploitationand abuse, particularly of the localpopulation.”
At the behest of the UN GeneralAssembly, as well as the SpecialCommittee on PeacekeepingOperations, in June 2006 the UNSecretary-General issued a compre-hensive strategy for assistance tovictims of sexual abuse by UN per-sonnel. This policy, which UNICEFhelped formulate, proposes a com-prehensive approach to victim support, including basic health, psychosocial, legal and administra-tive assistance for all victims and, in exceptional cases, financial assis-tance. Building on this policy,UNICEF, DPKO, the UN Office for theCoordination of Humanitarian Affairsand the United Nations DevelopmentProgramme are organizing a high-level meeting to further address sexual exploitation and abuse in acomprehensive manner.
In addition to peacekeepers, media-tors who represent the internationalcommunity can act as ‘tippingpoints’ to help women secure repre-sentation in peace processes andpost-conflict reconstruction. A recentassessment of women’s participationin peace processes as ‘track one’mediators – those involved in officialnegotiations through formal chan-nels rather than unofficial contacts(‘track two’ mediators) – found thatwomen remain largely excludedfrom conflict mediation and resolu-tion processes. At the United Nations,women hold only 6.5 per cent ofsenior peace-related positions, whilethe European Union counts nowomen at all among its current and former high-level mediators.Similarly, despite Africa’s deservedreputation of having strong femalerole models, women are entirelyabsent from the driving seat of thePeace and Security Council of theAfrican Union. In conflicts wherepre-agreement peace processes areongoing, stalled or forthcoming, andwhere the United Nations or theEuropean Union is not taking thelead role, only Uganda stands outfor the presence of a lone femalemediator.
See References, page 88.
Women as mediators and peacekeepers
E Q U A L I T Y I N P O L I T I C S A N D G O V E R N M E N T 63

clans, all of which were represented bymen). Despite resistance from some of theirmale colleagues, the group helped draft anational charter that guaranteed women 25 seats in the 245-member TransitionalNational Assembly.50
• Sri Lanka: In December 2002, a Subcommitteeon Gender Issues was established, with amandate to identify issues of concern towomen and include them in the agenda ofthe peace process. The committee included10 members, with each side appointing fivewomen to focus on the gender dimension ofpost-conflict reconstruction. Among the toppriorities of the committee were the equalrepresentation of women in politics, educa-tional structures and gender bias, and violence against women and girls.51
Conflict as an opportunity for change
The recognition that women are not merelyvictims of conflict, but critical actors whosecontribution is essential to the success of peaceprocesses and to long-term political stability is strikingly recent. As the renowned Indianeconomist Devaki Jain writes in Women,Development and the United Nations, “Until
1975, UN discussions on aspects of securityand defence almost never referred to women;in the post-war conventions, male nouns andpronouns were used to represent both men andwomen.”52 It is therefore perhaps unsurprisingthat, as with other levels of political decision-making, the inclusion of women in peaceprocesses requires far more than increasingtheir numbers and often depends on the activesupport of the international community.
As groundbreaking efforts by the UNDevelopment Fund for Women to support the participation of women in peace processesin such countries as Burundi, Liberia andSomalia demonstrate, it takes many years ofstruggle and overcoming setbacks for theseefforts to come to fruition. Sometimes simplethings are needed to get women to peacenegotiations. In the case of Burundi, thewomen’s participation hinged on obtainingfunding for two taxis, which enabled them to get to the peace talks in Arusha, UnitedRepublic of Tanzania. While the male partici-pants travelled on officially sponsored planesfor less than one hour, it took the women twodays to get to Arusha – but they eventuallyarrived. Although their participation did not
© U
NIC
EF/
HQ
04-1
224/
Gia
com
o P
irozz
i
64 T H E S T A T E O F T H E W O R L D ’ S C H I L D R E N 2 0 0 7
result in a formal mechanism for women’spolitical participation, the group’s influencedid lead to the adoption of a number of gender-specific measures in the agreements in 2000.53
Inspiring the next generation
Women’s participation in national legislatures,local government and peace processes are notonly transforming the politics of the present – it is also altering its future, as women in poli-tics are changing prevailing attitudes towardswomen and girls in decision-making roles.While patterns of causality are difficult to define across countries and societies, recentresearch suggests a strong relationshipbetween the number of women in office andpositive public attitudes towards women polit-ical leaders.54 This correlation does not provethat the presence of women in politics is shift-ing public opinion towards greater genderequality. But it does show a strong linkbetween the public’s confidence in women’sleadership abilities and its growing expecta-tion of seeing women in office.
In Rwanda, for example, women’s role in the transition to peace and democracy haspaved the way for future generations of girls to assume public roles that would have beeninconceivable only a generation ago.55 In India,new associations are strengthened by electedwomen representatives, as well as women whowere previously elected but who no longer for-mally participate in local councils.56 These twocountries represent just a sample of the grow-ing involvement of women in politics acrossthe world. Their influence is not just being feltin stronger legislation for children and women;they are also helping decision-making bodiesbecome more democratic and gender sensitive. Despite discrimination and setbacks, youngwomen and men who enter politics enter aworld significantly transformed by the presenceof women.57
Empowering women to participate
in politics
Increasing women’s participation in politics is vital to promoting gender equality and
empowering women, the two tenets ofMillennium Development Goal 3. As thischapter has shown, women in politics advo-cate more often and more strongly for therights of women, children and families. Yet, at current rates of progress, we are still more than 60 years away from a world wherewomen have an equal say in national parlia-ments. The situation is equally unbalanced atthe local level where, today, women accountfor less than 1 in 10 of the world’s mayors.58
While formal barriers to entering national andlocal parliaments have been eliminated in vir-tually every country, this has been insufficientto address gender imbalances in governance.Even when political spaces and processes haveopened up, the number of women in decision-making positions has not automaticallyincreased. Beginning in childhood women facediscrimination, which ranges from lower levelsof education to prevailing social attitudesdoubting their competence as decision-makers.This discrimination, as well as women’s signif-icantly greater work burden, discourages andprevents women from entering politics andleaves them less time and energy for publiclife. Each of these issues needs to be addressedin its own right. Key measures – summarizedbelow, but explored in greater detail inChapter 5 – to ensure that women participatefully in politics include:
• Education. As previous chapters have under-scored, a girl who is denied the right to goto school is denied much more than theknowledge she would have gained in theclassroom. She is deprived of the opportuni-ty to develop to her full potential in everyarea of life, including the right to politicalparticipation.
• The involvement and support of men (invoting and in parliament). While women’spresence and active participation in politicsis critical to advancing gender equality, gen-der initiatives require the involvement andsupport of men, especially male parliamen-tarians and political leaders.
• Quotas. The introduction of quotas has led to dramatic changes in women’s political
E Q U A L I T Y I N P O L I T I C S A N D G O V E R N M E N T 65
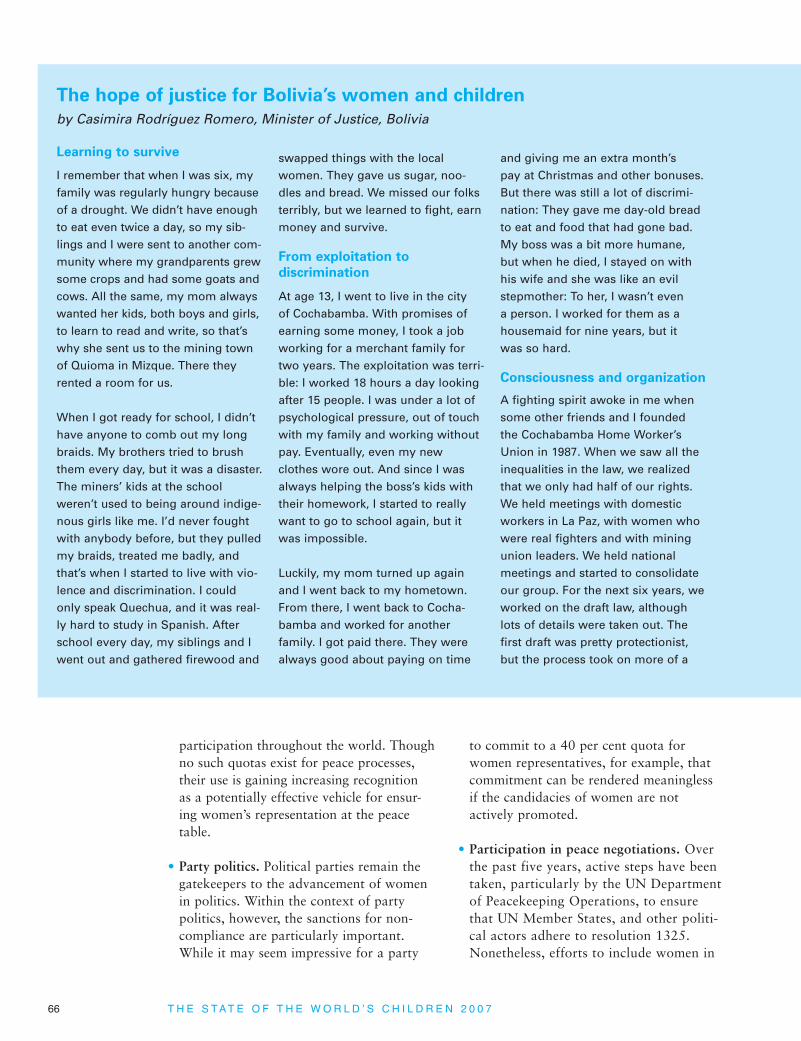
participation throughout the world. Thoughno such quotas exist for peace processes,their use is gaining increasing recognition as a potentially effective vehicle for ensur-ing women’s representation at the peacetable.
• Party politics. Political parties remain thegatekeepers to the advancement of womenin politics. Within the context of party politics, however, the sanctions for non-compliance are particularly important.While it may seem impressive for a party
to commit to a 40 per cent quota forwomen representatives, for example, thatcommitment can be rendered meaningless if the candidacies of women are not actively promoted.
• Participation in peace negotiations. Over the past five years, active steps have beentaken, particularly by the UN Department of Peacekeeping Operations, to ensure that UN Member States, and other politi-cal actors adhere to resolution 1325.Nonetheless, efforts to include women in
Learning to survive
I remember that when I was six, myfamily was regularly hungry becauseof a drought. We didn’t have enoughto eat even twice a day, so my sib-lings and I were sent to another com-munity where my grandparents grewsome crops and had some goats andcows. All the same, my mom alwayswanted her kids, both boys and girls,to learn to read and write, so that’swhy she sent us to the mining townof Quioma in Mizque. There theyrented a room for us.
When I got ready for school, I didn’thave anyone to comb out my longbraids. My brothers tried to brushthem every day, but it was a disaster.The miners’ kids at the schoolweren’t used to being around indige-nous girls like me. I’d never foughtwith anybody before, but they pulledmy braids, treated me badly, andthat’s when I started to live with vio-lence and discrimination. I couldonly speak Quechua, and it was real-ly hard to study in Spanish. Afterschool every day, my siblings and Iwent out and gathered firewood and
swapped things with the localwomen. They gave us sugar, noo-dles and bread. We missed our folksterribly, but we learned to fight, earnmoney and survive.
From exploitation to
discrimination
At age 13, I went to live in the city of Cochabamba. With promises ofearning some money, I took a jobworking for a merchant family fortwo years. The exploitation was terri-ble: I worked 18 hours a day lookingafter 15 people. I was under a lot ofpsychological pressure, out of touchwith my family and working withoutpay. Eventually, even my newclothes wore out. And since I wasalways helping the boss’s kids withtheir homework, I started to reallywant to go to school again, but itwas impossible.
Luckily, my mom turned up againand I went back to my hometown.From there, I went back to Cocha-bamba and worked for another family. I got paid there. They werealways good about paying on time
and giving me an extra month’s pay at Christmas and other bonuses.But there was still a lot of discrimi-nation: They gave me day-old breadto eat and food that had gone bad.My boss was a bit more humane,but when he died, I stayed on withhis wife and she was like an evilstepmother: To her, I wasn’t even a person. I worked for them as ahousemaid for nine years, but it was so hard.
Consciousness and organization
A fighting spirit awoke in me whensome other friends and I foundedthe Cochabamba Home Worker’sUnion in 1987. When we saw all theinequalities in the law, we realizedthat we only had half of our rights.We held meetings with domesticworkers in La Paz, with women whowere real fighters and with miningunion leaders. We held nationalmeetings and started to consolidateour group. For the next six years, weworked on the draft law, althoughlots of details were taken out. Thefirst draft was pretty protectionist,but the process took on more of a
The hope of justice for Bolivia’s women and children
by Casimira Rodríguez Romero, Minister of Justice, Bolivia
66 T H E S T A T E O F T H E W O R L D ’ S C H I L D R E N 2 0 0 7

peace processes and post-conflict resolu-tion remain confined to a handful of examples.
• Better data and research. Research on theimpact of women on legislation and policyrelated to children remains limited, even inthe industrialized countries. While UNICEFcan and must play a critical role in childadvocacy at all levels of government, thiseffort needs to be supported by better research on, and analysis of, the broaderdynamic of decision-making and policy
outcomes, with a particular focus on womenand girls.
• Creating an environment where womencan make a difference. The presence ofwomen in politics is a necessary but notsufficient condition for their politicalempowerment. Women’s ministries andother women’s political forums, as well asthe commitment of governments to greaterparticipation of women in parliament, areequally important factors in advancinggender equality.
rights focus. We were able to turnour fears into courage and make theauthorities listen to us. At first, ourfriends and even our own brothersand sisters didn’t want to have any-thing to do with us, saying we werecity folk now. But we took heart andstarted to hold demonstrations inorder to open doors. Convinced thatwhat we were doing was right, westarted to break down the walls ofdiscrimination – and, by insisting somuch, we managed to gather sup-port and seats on the councils ofrural women’s organizations. Wemade alliances with our peasantbrothers, workers, miners, coca-leafgrowers, indigenous groups andother sectors. It was a very interest-ing process that truly bore fruit.
The male world of politics
Along the way, we started to get sup-port from Evo Morales’s movement;as leaders, we started meeting hereand there, coordinating nationalactivities and international events.When they offered me the post ofMinister of Justice, I didn’t knowwhat to do – I had to make a quick
decision! You have your (personal)plans, your family…but I put it allaside. We’re going through a historicprocess that I just couldn’t say no to.There was no way to talk it over withmy colleagues. If I said no, theywould have never let me live it down.So I accepted, knowing it would behard, but it was all about recognizingthat this was the next step in every-thing we’d been doing so far.
At first I was very worried – soon I’dbe entering a very different world. In our organizations, we always justworked around other women. Theworld of politics is a man’s worldand full of professionals with differ-ent types of education and experi-ences; I entered into this realm verycarefully. When you are a leader, youhave the freedom to say what youlike, but now I have to be carefulabout what I say, and at the sametime I have to leave somethingbehind for other women and ourcompañeros (comrades).
There’s still a long way to go. In thispost, I want to meet the expectations
of my brothers and sisters who havedifferent kinds of problems. I want tofulfil the people’s hopes for justice.
The boys and girls of Bolivia are liv-ing in difficult circumstances. Thereare huge inequalities. There are still lots of children who are goingthrough what I did as a girl – notbeing able to go to school, not hav-ing safe food to eat. Our wawas (chil-dren) are the first ones to suffer fromabuse, violence and rape. I would liketo see a day when Bolivia’s wawascan grow up enjoying the love oftheir parents without going hungry. Itis a huge challenge. We have to makean effort to make everyone’s dreamof having a good life come true.
Casimira Rodríguez Romero, the current Minister of Justice in Bolivia,was born in a Quechua communityin the valley of Mizque, Cochabamba.She is the fourth of 10 brothers andsisters. Her life was marked bypoverty and discrimination, and herpresence in Bolivia’s cabinet repre-sents the historically marginalizedindigenous woman.
E Q U A L I T Y I N P O L I T I C S A N D G O V E R N M E N T 67

The final chapterof the report pro-
vides a road map for maximizing genderequality through seven key modes:education, financing, legislation, leg-islative quotas, women empoweringwomen, engaging men and boys, andimproved research and data.
• Education: Ensuring that girls and boyshave equal educational opportunities is one of the most powerful stepstowards combating gender discrimina-tion. Key actions include abolishingschool fees, encouraging parents andcommunities to invest in girls’ educa-tion, and creating girl-friendly schoolsthat are safe and without bias.
• Focusing additional resources on
achieving gender equality: Far too little recognition has been given tothe resources required to meet thegoal of gender equality and women’sempowerment.
• Levelling the playing field in national
legislation: Legislative reform can bea powerful strategy of empowerment
for women and girls and for the safe-guarding of their rights.
• Quotas can encourage women’s
participation in politics: Quotas are aproven method of ensuring womenbreak through the political glass ceil-ing. To be truly effective, however,quotas must to be supported by politi-cal parties and electoral systems that are committed to encouragingwomen’s participation in politics and government.
• Women empowering women:
Grass-roots women’s movementshave been the most vocal championsof women’s equality and empower-ment, but they are sometimes over-looked by national governments andinternational agencies. Involvingwomen in the early stages of policyformulation helps ensure that pro-grammes are designed with the needsof women and children in mind.
• Engaging men and boys. Men can bepowerful allies in the struggle forwomen’s equality. Advocacy initia-
tives designed to educate bothwomen and men on the benefits ofgender equality and joint decision-making can help nurture a more cooperative relationship betweenthem.
• Research and data on the situation
of women and girls are sorely lacking:
An overwhelming lack of sex-disaggregated statistics often resultsin scant or weak quantitative evidenceon the issues that affect women and,in turn, children. Better and moreextensive data and analysis are urgently required.
Eliminating gender discrimination willproduce a double dividend, fulfillingthe rights of women and going a longway towards realizing those of childrenas well. Effective partnerships, involv-ing governments, donors and interna-tional agencies, can support thisprocess through the design and imple-mentation of human rights-baseddevelopment strategies. For women,men, and for children, the time to refocus our efforts is now.
SUMMARY

T H E S TAT E O F T H E W O R L D ’ S C H I L D R E N 2 0 0 7
Reaping the double dividend of gender equality
For children to achieve their fullest potential and to grow up in families andsocieties where they can thrive, genderdiscrimination must be banished once
and for all. A world free of discrimination mayseem like an impossible dream, but it is a dreamwithin our reach. In recent decades, the goal ofreducing gender discrimination has steadilygrown in importance on the international agen-da. Corresponding successes in empoweringwomen and girls have become increasinglyapparent. Since 1945, the proportion of womenin parliament has increased more than fivefold.1
Girls’ education has increased dramatically inmany regions, and more than 90 developingcountries are on course to achieve the goal ofgender parity in primary education, albeit onlyby 2015, which is already 10 years later thanthe original deadline set by the internationalcommunity.2 Discriminatory attitudes towardswomen and girls have been changing, not onlyover the course of generations, but also in some cases, through focused campaigns and discussion forums, in a matter of months.3
Throughout the preceding chapters of thisreport, it has been clear that great change infavour of women and girls is possible and thatfor all children, such change is essential.
Progress is reflected in statistical outcomes andin the underlying social and political processesthat have resulted in a strong internationalconsensus in support of gender equality andthe rights of girls and women. The ratificationof the Convention on the Elimination of AllForms of Discrimination against Women by
184 countries by September 2006, and severalworld conferences on women, culminating inthe Beijing Declaration and Platform forAction in 1995, have established in ever moreconcrete terms the challenges faced and actionsrequired to empower women. But despite thesegains and commitments, for many women,adolescent girls and girl children, the promiseshave not materialized. From children excludedfrom education because of their gender, to ado-lescent girls who may die from problems relat-ed to pregnancy and childbirth or face violenceand sexual abuse, gender discrimination leadsto rights violations that reverberate throughoutthe life cycle (see Chapter 1, page 4).
This final chapter brings together a number of concrete and achievable cross-cuttingactions in several critical areas that can addressthis challenge. These actions will make anunprecedented difference to the lives of womenand children and the achievement of theMillennium Development Goals. Measuresinclude education, financing for development,legislation, legislative quotas, women empow-ering other women, engaging men and boys,and research and data. These recommendationsare less about radical new ideas than they areabout a firm commitment to and focus onwhat has proven to work and what needs to bedone – as well as an equally firm commitmentto working together in order to achieve genderequality and women’s empowerment.
At its core, the goal of gender equality callsfor a change in social attitudes and institutions
5©
UN
ICE
F/H
Q05
-156
6/G
iaco
mo
Piro
zzi
69

that is based on the principles of equality andrespect for human rights. Achieving socialchange at the local level, in communities andhouseholds, requires concerted and deliberateaction by a broad array of actors, includingmen and boys, husbands and fathers, voters,teachers, religious and civic leaders, the media,the private sector and, indeed, women andgirls themselves. Actions taken at the locallevel need to be encouraged and reinforced bygovernments and international donors, whichhave a pivotal role in the design and imple-mentation of appropriate legislation and pro-grammes that protect and advance the rightsof women and girls.
Effective partnerships are essential to accelerat-ing progress in all of the areas cited. Whileacross the international community partner-ships are being recognized as the most effectivemeans to bring about real and lasting change,their role in tackling gender discrimination –an issue that cuts across all aspects of develop-ment – is of especially critical importance.
Establishing effective partnerships that bringtogether diverse actors with different agendas,perspectives and affiliations is an objective notwithout problems or costs. Each of the sevenrecommendations will focus on the role ofpartnerships in tackling gender discrimination.
Gender parity in primary and sec-ondary education is a central tenetof the Millennium agenda, and part-nerships at all levels are increa-singly recognized as the conduit toreaching this objective. The UnitedNations Girls’ Education Initiative(UNGEI), launched in 2001, is a part-nership between UN agencies and abroad spectrum of partners dedicat-ed to achieving gender equality ineducation. UNGEI facilitates thecoordination of girls' educationstrategies and interventions at thecountry level through partnershipswith governments, donor countries,non-governmental organizations,civil society, the private sector, communities and families.
Other partnerships are also workingtowards the same objective. In1999, four international civil societyorganizations – Oxfam International,ActionAid International, EducationInternational, and the Global Marchagainst Child Labour – establishedthe Global Campaign for Education(GCE) to work towards eliminationof gender disparities in education
by 2015. Based on research in nineAfrican and Asian countries, areport issued by the GCE entitled A Fair Chance identifies key actionsto eliminate gender disparities ineducation.
The Forum for African WomenEducationalists (FAWE), based inKenya, is a non-governmental organ-ization made up of cabinet ministersand other high-level educators fromsub-Saharan African. Since 1993,FAWE has worked with governments,donors, non-governmental organiza-tions, universities, communities andothers to promote gender equity ineducation. Partners focus on influen-cing policy, increasing public aware-ness, practical interventions andmainstreaming best practices. Thepartnership’s achievements includethe publication of the ABC of GenderResponsive Education Policies:Guidelines for analysis and planning,which details the process for eval-uating gender responsiveness innational education action plans and provides guidance on gendermainstreaming. So far, FAWE has
analysed and influenced action plansin 17 countries.
Reaching girls in rural areas of sub-Saharan African is the focus ofthe Campaign for Female Education(CAMFED), which currently operatesprogrammes in Ghana, Zambia andZimbabwe. CAMFED reports havingenabled more than 56,000 girls toremain in primary school, with 98 per cent graduating to secondaryschools, by working with a widerange of partners, including parents,local authorities and patriarchalchiefs. CAMFED’s communityapproach includes establishing dis-trict committees to raise and distrib-ute resources, building communityconfidence through dialogue andaddressing threats to girls’ health andsafety. The ‘virtuous cycle of girls’education’ means that the youngwomen who benefit from these inter-ventions subsequently support themby contributing their insights and perspectives to local authorities andchildren in their communities.
See References, page 88.
Partnerships for girls’ education
70 T H E S T A T E O F T H E W O R L D ’ S C H I L D R E N 2 0 0 7
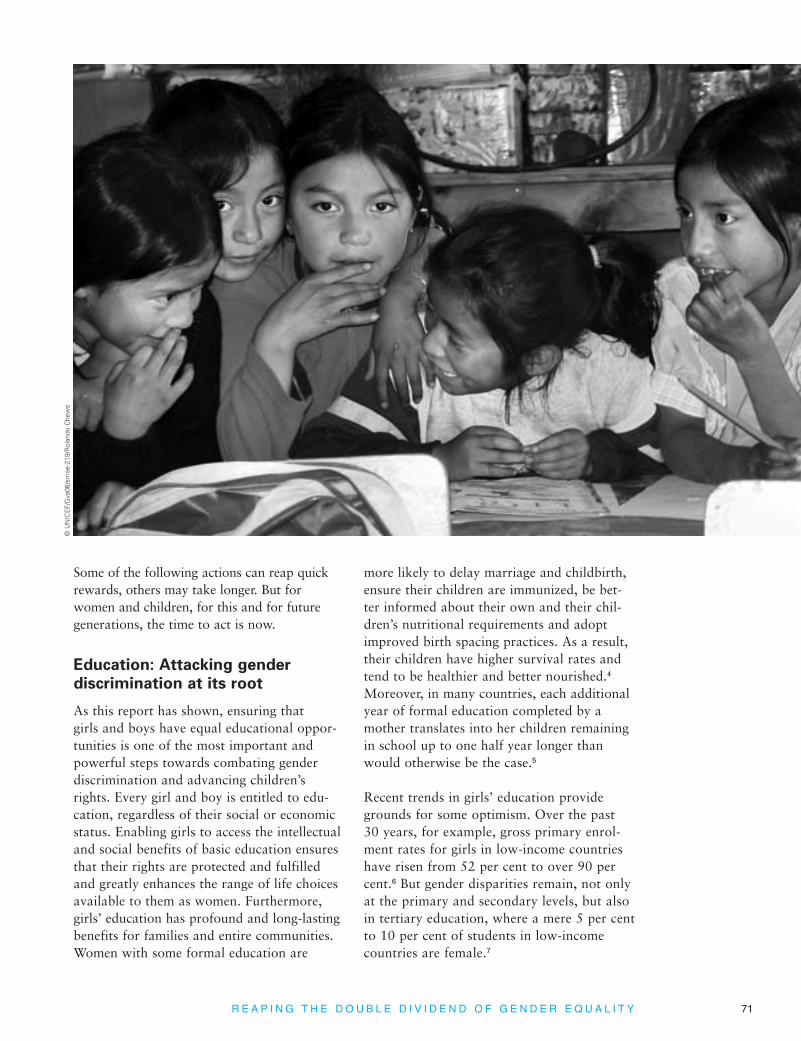
Some of the following actions can reap quickrewards, others may take longer. But forwomen and children, for this and for futuregenerations, the time to act is now.
Education: Attacking gender
discrimination at its root
As this report has shown, ensuring that girls and boys have equal educational oppor-tunities is one of the most important andpowerful steps towards combating gender discrimination and advancing children’srights. Every girl and boy is entitled to edu-cation, regardless of their social or economic status. Enabling girls to access the intellectualand social benefits of basic education ensuresthat their rights are protected and fulfilledand greatly enhances the range of life choicesavailable to them as women. Furthermore,girls’ education has profound and long-lastingbenefits for families and entire communities.Women with some formal education are
more likely to delay marriage and childbirth,ensure their children are immunized, be bet-ter informed about their own and their chil-dren’s nutritional requirements and adoptimproved birth spacing practices. As a result,their children have higher survival rates andtend to be healthier and better nourished.4
Moreover, in many countries, each additionalyear of formal education completed by amother translates into her children remainingin school up to one half year longer thanwould otherwise be the case.5
Recent trends in girls’ education provide grounds for some optimism. Over the past 30 years, for example, gross primary enrol-ment rates for girls in low-income countrieshave risen from 52 per cent to over 90 percent.6 But gender disparities remain, not onlyat the primary and secondary levels, but alsoin tertiary education, where a mere 5 per centto 10 per cent of students in low-incomecountries are female.7
© U
NIC
EF/
Gva
06/s
mse
-219
/Rol
ando
Che
ws
R E A P I N G T H E D O U B L E D I V I D E N D O F G E N D E R E Q U A L I T Y 71
Abolishing school fees
In many developing countries, the direct andindirect costs of schooling represent one of the most significant barriers to education forboth girls and boys, particularly those frompoor families living in rural areas.8 Abolishingschool fees is one of the most effective policymeasures for accelerating progress in this area. In 2005, UNICEF and the World Banklaunched the School Fee Abolition Initiative(SFAI), which aims to increase access to basiceducation and scale up progress to meet theMDGs and the Education for All targets in the next decade. In Ethiopia, Ghana, Kenya,Malawi, Mozambique, the United Republic ofTanzania and other countries participating in the SFAI (Burundi and the DemocraticRepublic of the Congo are planning to abolishfees shortly), the elimination of school fees ismaking it possible for girls from disadvantagedbackgrounds to enrol in primary education.9
Encouraging parents and communities to
invest in girls’ education
Even where schools fees are not an issue, the perceived and real opportunity costs asso-
ciated with sending children to school can discourage parents from supporting girls’ education.10 Encouraging poor families toinvest in their daughters’ education mayrequire such incentives as conditional cashtransfers, meals, subsidies and other types ofincome support. Conditional cash transfersprovide families with food and compensateparents for the opportunity costs associatedwith child labour on the condition that par-ents send their children to school and takethem to health clinics for regular vaccinationsand check-ups.
Girl-friendly schools: Safe and without bias
Children who are not in school tend to comefrom the poorest and most marginalized house-holds and often live in remote rural areas.11
Parents may object to sending their daughtersto school because they feel the facility isunsafe, or that the long journey to schoolexposes girls to risk of sexual assault or otherforms of violence.12 Governments, parents andinternational donors must work together topromote flexible scheduling, increase the safetyof school facilities, ensure that schools haveseparate hygiene and sanitation facilities forgirls, and build schools close to their homes.
The school curriculum must impress uponteachers, as well as students, the importanceof gender equality, and address male bias inthe classroom. Studies show that teachers whoperceive girls to be less intelligent than boystend to treat boys and girls differently. Malestudents receive preferential treatment and aregiven time to learn and play at school. Girls,in contrast, are often encouraged to be sub-servient and to sit close to the back of theclassroom. In some communities, girls areassigned janitorial work in schools while theboys play in the schoolyard.13
Girls outperform boys throughout much of the industrialized world. The picture is differ-ent in the developing world, however, whereboys tend to achieve higher results on schoolexams than girls. A recent survey of franco-phone Africa and Eastern and Southern Africashows that boys are outperforming girls in allof the low-income countries surveyed in theassessment.14
© U
NIC
EF/
HQ
00-0
623/
Rog
er L
eMoy
ne
72 T H E S T A T E O F T H E W O R L D ’ S C H I L D R E N 2 0 0 7

One way to help eliminate bias is to increasethe number of female teachers in the class-room. In addition, textbooks and relatedschool materials should avoid replicatinggender stereotypes, such as those that por-tray women cleaning and cooking while men are shown as professional engineers and doctors.15
Focusing more resources on
achieving gender equality
In addition to sound legislation, robustresearch and bold policies, achieving genderequality and fulfilling women’s and children’srights also requires resources. Without finan-cial resources to incorporate new laws andpolicies, strong legislation and better researchwill mean little. Equitable and efficient socialinvestment to eliminate gender discriminationis a key strategy for the promotion of genderequality and the empowerment of women.
Perhaps because gender discrimination is sooften viewed as the result of social attitudes
alone, far too little consideration has beengiven to the financial resources required toachieve the goal of gender equality andwomen’s empowerment. A great deal ofknowledge exists about the policies andactions required to address gender inequality,but much more needs to be done to turn theory into practice.
The UN Millennium Project has taken the lead in assessing how much it will cost toachieve the Millennium Development Goals.16
Detailed country assessments focus on thegoods, services and infrastructure required, as well as capital and recurrent costs. Asintensive and detailed as these projections are,they are unable to specify with precision thefinal cost of meeting the MDGs. Uncertaintyarises from the inability to know how theMillennium Declaration is being implementedin specific communities and countries, as wellas the variable costs associated with each ofthe eight MDGs.17 Because gender equalitycuts across all of the Goals, assessing the costof achieving MDG 3 – promoting gender
© U
NIC
EF/
HQ
05-0
391/
Pal
ani M
ohan
R E A P I N G T H E D O U B L E D I V I D E N D O F G E N D E R E Q U A L I T Y 73
Budgets reflect the social and eco-nomic priorities of governments. A government budget that can bebroken down according to its impacton women and men is considered‘gender-responsive’. The UnitedNations Development Fund forWomen (UNIFEM) defines gender-responsive budgeting as “the analysis of actual governmentexpenditures and revenue onwomen and girls as compared tomen and boys.”
According to a report by theCommonwealth Secretariat, the aimof gender budgets is fourfold:
• Improve the allocation of resourcesto women.
• Support gender mainstreaming inmacroeconomics.
• Strengthen civil society’s participa-tion in economic policymaking, and
• Track public expenditure againstgender and development commit-ments and contribute to the attainment of the MillenniumDevelopment Goals.
Gender-responsive budget analysiscan provide a clear picture of theways in which the distribution, useand generation of public resourcesaffect women and men differently. Itis an immensely useful tool not onlyto highlight the links between socialinvestment and the realization ofwomen’s rights, but also to holdgovernments accountable for theircommitments to gender equality and women’s empowerment.
UNIFEM has strongly promotedgender-responsive budgets, which
are currently being applied in over50 countries. South Africa wasamong the first to implement gender-responsive budgeting in1995. Rwanda’s budget currentlyprioritizes gender equality, and allof the country’s sectoral budgets areprepared with the participation ofthat country’s Ministry of Gender.
In Latin America, UNIFEM has sup-ported gender-responsive budgetinitiatives in Bolivia, Brazil, Chile,Colombia, Ecuador, Mexico andPeru. Such analyses have becomecodified in the formal budgetingprocess in Chile, where gender isone of six mandatory areas onwhich government ministries mustreport. Other interventions in theregion have also included gender-based budget analyses at national,provincial and municipal levels,technical support to budget plan-ning institutions, and advocacy initiatives with civil society and public sector organizations.
In India, female parliamentarianshave taken a leading role in raisinggender-based budgeting initiativesat the parliamentary level. Somestates have gone even further bylegislating for people’s audits oflocal planning and spending, andenacting measures to ensurewomen’s participation in theseprocesses. For the 2005/6 fiscal year,18 departments were directed tosubmit budgets showing resourceallocations and expenditures bene-fiting women.
In Morocco, the 2006 budget con-tained an annex on gender equitypriorities. This unprecedented
development followed four years ofcollaboration between UNICEF andthe Ministry of Finance in Morocco.The annex assesses the implicationsthat the national budget has forgender equality and outlines specif-ic gender targets. Key ministries,including education, finance, health,agriculture and rural development,participated in the preparation ofthe annex.
Gender-responsive budgets areproving to be effective in focusingattention on where financialresources are required to promotegender equality and empowerwomen. Along with child budgets,which are also gaining increasingrecognition as effective advocacyand policy instruments, they arepractical tools to show whether sufficient resources are being dedicated to realize the rights ofwomen and children.
See References, page 88.
Monitoring governments’ commitments to women’s empowerment
through gender-responsive budgets
74 T H E S T A T E O F T H E W O R L D ’ S C H I L D R E N 2 0 0 7

equality and empowering women – has provedespecially difficult. The UN MillenniumProject has taken steps to modify its method-ology in the hope of distilling more accurateestimates of the costs involved in meetingMDG 3.18 The initial estimates come from adetailed analysis of Bangladesh, Cambodia,Ghana, the United Republic of Tanzania andUganda that has subsequently been extendedto cover all low-income countries.
In the initial group of five countries studied, itwas estimated that between US$37 and US$57per capita (measured in constant 2003 US dollars) was needed annually for supplies andservices in girls’ education, women’s health andother areas. The MDG 3 specific interventionsrepresent only 6-10 per cent of the total cost ofinterventions required to achieve the MDGs.19
Estimating costs requires outlining concreteareas where investments are needed. Manyexercises estimating the cost of MDG 3 havefocused solely on eliminating gender disparityin education,20 which, however vital, is onlypart of the puzzle. A more complete cost esti-mation focuses on the seven strategic priori-ties identified in the Millennium Project taskforce report on gender equality and achievingthe Millennium Development Goals:
• Strengthen opportunities for post-primaryeducation for girls while meeting commit-ments to universal primary education.
• Guarantee sexual and reproductive healthand rights.
• Invest in infrastructure to reduce women’sand girls’ time burdens.
• Guarantee women’s and girls’ property andinheritance rights.
• Eliminate gender inequality in employmentby decreasing women’s reliance on informalemployment, closing gender gaps in earningsand reducing occupational segregation.
• Increase women’s share of seats in nationalparliaments and local government bodies.
• Combat violence against girls and women.21
How much additional financing in total isrequired to meet MDG 3 depends on how government resources change between now and 2015, and how much of those resources are dedicated to gender equality and women’sempowerment. According to a realistic sce-nario, low-income countries would need anadditional US$28 billion (measured in con-stant 2003 US dollars) in 2006 from donorcountries, rising to US$73 billion in 2015.Available estimates suggest, however, that gov-ernments currently target fewer resources togender equality than other MDG areas.22
Getting the financing right is only the firststep. Money must be put to the right use, and it must be integrated within existing gov-ernment budgets and plans, as well as alignedwith poverty reduction strategy papers andother planning processes in which all stake-holders participate. The road to gender equali-ty can be long and complex, but withoutsufficient resources the destination will beimpossible to reach.
Levelling the playing field in
national legislation
Legislative reform can be a powerful strategyfor empowering women and girls and safe-guarding their rights. Over the past year alone,women obtained the right to vote and to standfor election in Kuwait,23 pushed for legislationthat would criminalize domestic violence inTajikistan,24 called for the greater inclusion ofgender concerns in peace-agreement and post-conflict processes in Somalia,25 and were adriving force behind the ratification of theProtocol on the Rights of Women in Africa,which entered into force in November 2005.26
Nevertheless, in many countries, women stilllack equal access to justice and legal protec-tion, and in some countries, powerful legalobstacles continue to undermine their rights in key areas.
Domestic violence and gender-based
violence in conflict
Violence against women and children has devastating consequences. It fills their liveswith pain and terror, from which some maynever recover.27 It knows no boundaries of
R E A P I N G T H E D O U B L E D I V I D E N D O F G E N D E R E Q U A L I T Y 75
geography, culture or wealth. Anti-violencemeasures often require specific legislation, aswell as a strong commitment by policymakers,the judiciary and law enforcement officials,and, in some cases, the international commu-nity, to ensure that perpetrators are prosecutedand that victims receive the full support theyneed to rebuild their lives.
The Report of the Independent Expert for theUnited Nations Study on Violence againstChildren, released in August 2006, confirms awidely held perception that domestic violence
has incalculable consequences for children.28
Children suffer both directly, as targets of vio-lence, and indirectly, as first-hand witnesses tothe devastating impact that violence has onthe family and household. Worldwide, at least45 countries have specific legislation againstdomestic violence, 21 others are drafting morelaws, and numerous countries have amendedcriminal laws to include domestic violence.29
But the gap between the laws on the books andtheir implementation often remains as wide as it is deadly, and important regional differ-ences prevail. While more than 80 per cent
Partnerships between parliamentari-ans and advocates for women andchildren are also helping to focusgreater attention on gender equalityand protection against harm,exploitation, abuse and violence.One such partnership is the collabo-ration between Inter-ParliamentaryUnion (IPU) and UNICEF, whichdates back over a decade and a half beginning with IPU’s supportfor the Convention on the Rights of the Child. More recently, IPUjointly organized with UNICEF theParliamentary Forum on Childrenduring the UN Special Session onChildren in May 2002. Since then, astrong partnership has developedbetween the two organizations,especially in the area of child pro-tection and the promotion of genderequality. Some of the key jointactions have included:
• Child protection handbook for par-
liamentarians: Child Protection: AHandbook for Parliamentarians,launched in 2004, covers a widerange of themes related to childprotection, including trafficking ofchildren, violence against children,female genital mutilation/cutting,the sexual exploitation of children,
children and war, and juvenile jus-tice. The handbook serves as a cat-alyst for action, providing concreteexamples of ways to build a protec-tive environment for children andparliamentarians’ responses to thechallenges of child protection.
• Child trafficking handbook: Thisjointly produced handbook by IPU and UNICEF was launched in 2005 at the IPU Assembly.Combating Child Trafficking servedas a tool for a regional parliamentaryseminar, ‘Developing a ProtectiveFramework for Children: The roleof parliaments’, in February 2006.The seminar, held in Hanoi at the invitation of the VietnameseNational Assembly, included parlia-mentarians from 13 countries.
• High-level panels on gender equali-
ty and child protection: In recentyears, the two organizations haveheld a series of panels at the annu-al IPU assemblies to focus atten-tion on gender equality and childprotection. The first panel, whichaddressed the issue of commercialsexual exploitation, took place atthe 2004 IPU Assembly in Mexico.The following year, the panel
addressed the issue of violenceagainst women and children in sit-uations of armed conflict. In 2006,the panel – which also featured thecollaboration of the Joint UnitedNations Programme on HIV/AIDS(UNAIDS) – examined the impactof HIV/AIDS on children.
• Regional forums: On the recom-mendation of the IPU Task Force of Parliamentarians against femalegenital mutilation, the AfricanParliamentary Union, UNICEF and IPU organized a regional con-ference in Dakar, in December 2005on parliamentary action to put anend to FGM/C. The conferencebrought together members ofParliament from 21 countries. Itaimed at strengthening their actionby familiarizing them with theexperience of TOSTAN – a non-governmental organization basedin Senegal whose CommunityEmpowerment Programme hasbeen successful in discouraging thepractice of FGM/C – and similarsuccessful initiatives to combatprotection abuses against children.
See References, page 88.
Partnering to promote child rights and gender equality in political agendas
76 T H E S T A T E O F T H E W O R L D ’ S C H I L D R E N 2 0 0 7

of Latin American countries have specific legislation against domestic violence, this istrue of less than 5 per cent of countries inEastern Europe and the Commonwealth ofIndependent States, Africa and East Asia andthe Pacific.30
Similarly, comprehensive mechanisms areneeded to prevent and respond to gender-based violence in conflict. The increased law-lessness that accompanies the breakdown ofsocial institutions and structures in times ofconflict can contribute to a high incidence ofsexual violence, exploitation and abuse. Warexacerbates the violence that girls and womenlive with in times of peace. Many women andgirls become victims of sexual slavery duringconflict, forced to provide sexual services toarmed forces or groups. In some cases, rape isemployed as a strategic method of warfare inorder to humiliate, degrade and displace com-munities, as well as to achieve wider militaryobjectives, including ethnic cleansing andpolitical terror.31 Rape has also been perpe-trated by those with a mandate to protect,including United Nations staff and peace-keeping personnel.32
Since all such acts of sexual exploitation andabuse take place within a broader context ofviolence, long-standing gender inequality anda lack of empowerment of women and girls,strategies to address gender-based violencemust address these underlying causes.Resolution 1325, adopted by the UN SecurityCouncil in 2000, took an important step forward by calling on “all parties to armedconflict to take special measures to protectwomen and girls from gender-based violence,particularly rape and other forms of sexualabuse, and all other forms of violence.”33
Much more remains to be done, however,including encouraging governments to codifyrape and other forms of sexual violence ascrimes in their national laws, holding statesaccountable for the actions of fighting forces,and increasing the numbers of women at allstages of peace-building.34
Property and inheritance rights
Equal land and property rights would repre-sent a significant step towards eliminating gender discrimination at the household level.For legal reform to change the lives of womenand children, national laws based on human
© U
NIC
EF/
HQ
06-0
321/
Gia
com
o P
irozz
i
R E A P I N G T H E D O U B L E D I V I D E N D O F G E N D E R E Q U A L I T Y 77

rights laws and principles must necessarily beupheld over male-biased customary laws andtraditional practices. National legal reforms inproperty law and inheritance rights representone of the most direct strategies for increasingwomen’s access to land and property. In thewake of land reform in Costa Rica, for exam-ple, women represented 45 per cent of land-titled beneficiaries between 1990 and 1992,compared with only 12 per cent before thereform. Similarly, in Colombia, after a rulingin 1996 on joint titling, land titled jointly tocouples made up 60 per cent of land adjudica-tions, compared to 18 per cent in 1995.35
No compromise on protecting women
and girls
Legislative reform is likely to require differentactions in different legal contexts. The fulfil-ment of the rights of women and girls in onecountry may be contingent upon the abolitionor amendment of discriminatory legislation. Inother countries, equal access to justice andlegal protection may require the enactment ofnew laws or specific mechanisms that neutral-ize the power of other legal structures – such
as customary laws and religious codes – whichoften discriminate against women.36 However,while understanding that customary law andreligious codes are important, efforts at har-monizing these codes with statutory law can-not be conducted at the expense of the rightsand well-being of women and girls.
Quotas can encourage women’s
participation in politics
Chapter 4 showed that, whether women aretransforming political processes, directly repre-senting the interests of women and children, or inspiring the next generation of girls, thepolitical participation of women is vital forchildren. With Kuwait granting women theright to vote and stand for election in May2005, there are now very few countries withelected parliaments where women do not havethe right to vote and stand for public office.37
But while the legal barriers to entry into poli-tics and government for women have beenremoved, women still account for only oneout of every six national parliamentarians inthe world.38
Figure 5.1 The majority of countries with the most women in parliament
use political quotas
* There are several types of quotas, including (1) constitutional quotas; (2) election law quotas; and (3) political party quotasfor electoral candidates. For definitions, see Panel, page 79.
Sources: Data are drawn from the Inter-Parliamentary Union database on ‘Women in National Parliaments’,<http://www.ipu.org/wmn-e/classif.htm>, accessed May 2006. The figures for those legislatures using quotas are derived fromthe Global Database of Quotas for Women, <http://www.quotaproject.org/country.cfm>, also accessed May 2006.
Lower or single house of parliament
Date of % of women Does the country Types of
Rank Country elections in parliament have a quota? quota*
1 Rwanda September 2003 48.8 Yes 12 Sweden September 2002 45.3 Yes 33 Costa Rica February 2006 38.6 Yes 2,34 Norway September 2005 37.9 Yes 35 Finland March 2003 37.5 No -6 Denmark February 2005 36.9 Yes 37 Netherlands January 2003 36.7 Yes 38 Cuba January 2003 36.0 No -8 Spain March 2004 36.0 Yes 3
10 Argentina October 2005 35.0 Yes 1, 2, 311 Mozambique December 2004 34.8 Yes 312 Belgium May 2003 34.7 Yes 2,313 Austria November 2003 33.9 Yes 314 Iceland May 2003 33.3 Yes 315 South Africa April 2004 32.8 Yes 3
78 T H E S T A T E O F T H E W O R L D ’ S C H I L D R E N 2 0 0 7

Quotas can make an important difference.Whether legally mandated through constitu-tional or electoral law – often but not always the most effective approach – or based on vol-untary actions by political leaders, quotashave led to dramatic changes in women’spolitical participation throughout the world.According to the Inter-Parliamentary Union,as a result of the introduction of quotas,Rwanda, for example, jumped from 24thplace in 1995 to 1st place in 2003 in terms ofwomen’s representation in parliament, whileCosta Rica advanced from 25th in 1994 to
3rd place in 2006. Afghanistan, previouslyunranked as women were denied the right tovote under the Taliban regime, now stands inthe 25th position.39 Similar statistics hold truefor countries as diverse as Argentina, Burundi,Iraq, Mozambique and South Africa.40
Overall, of the 20 countries in the world withthe most women in parliament, 17 (or 85 percent) are using some form of quota system (seeFigures 5.1 and 5.2, pages 78 and 80). Whilequotas are most widely used to increase thepolitical representation of women in national
Quotas have proved effective inincreasing the participation ofwomen in politics in countries acrossthe world. The mechanisms bywhich they apply vary widely andhave differing effects in each coun-try. As a means to understanding theconcept of quotas, the following def-initions and associated terms arepresented, as classified by theInternational Institute for Democracyand Electoral Assistance, an inter-governmental organization whosemandate is to support sustainabledemocracy worldwide.
• Gender quota systems aim toensure that women constitute atleast a ‘critical minority’ of 20, 30 or40 per cent of legislators, or a truegender balance of 50 per cent. Insome countries quotas are appliedas a temporary measure, that is tosay, until the barriers to women’sentry into politics are removed. Mostcountries with quotas, however,have not limited their use over time.
• Legal quotas regulate the proceed-ings of all political parties in a coun-try and may also prescribe sanctionsin case of non-compliance. Legal
quotas can be mandated in a country’s constitution (as in BurkinaFaso, Nepal, the Philippines andUganda) or by law, usually elec-toral (as in many parts of LatinAmerica and, for example, inBelgium, Bosnia and Herzegovina,Serbia and Sudan).
• Voluntary party quotas are decidedby one or more political parties in acountry. In some countries, includ-ing Argentina, Bolivia, Ecuador,Germany, Italy, Norway andSweden, several political partieshave some type of quota. In manyothers, only one or two partieshave opted to use quotas. If theleading party in a country uses aquota, such as the African NationalCongress in South Africa, this canhave a significant impact on theoverall rate of female representa-tion. Most of the world’s politicalparties, however, do not employany kind of quota at all.
Quotas can target different
parts of the selection and
nomination process
• The first stage involves findingaspirants, or those willing to be
considered for nomination, eitherby a primary or by the nominationscommittee and other parts of theparty organization. Gender quotasat this stage are rules that demandthat a certain number or percent-age of women or either sex be rep-resented in the pool of potentialcandidates. This has been used incountries with plurality-majorityelectoral systems, like the contro-versial ‘women’s short lists’ in theUnited Kingdom.
• At the nomination stage, quotasare applied to the nomination ofcandidates to be placed on theparty ballot. This implies that a rule(legal or voluntary) requires that,for instance 20, 30, 40 or even 50 per cent of the candidates must be women.
• At the electoral stage, quotas areapplied as ‘reserved seats’, where a certain percentage or numberamong those elected must bewomen. Increasingly, gender quo-tas are being introduced usingreserved seat systems.
See References, page 88.
Quotas: One size does not fit all
R E A P I N G T H E D O U B L E D I V I D E N D O F G E N D E R E Q U A L I T Y 79

parliaments, to date there are 30 countries thathave constitutional or statutory quotas at thesubnational level. In India, for example, theresults have been dramatic, as one third ofseats in all local legislatures are reserved forwomen by a constitutional amendment. Thisstands in contrast to the national parliament,where women account for less than 10 per centof all parliamentarians.41
Quotas are also gaining increasing recognitionas a potentially effective vehicle for ensuringwomen’s representation at the peace table. In1999, for example, after women were key par-ticipants in helping settle hostilities in south-ern Sudan, the United Nations DevelopmentFund for Women partnered with a localorganization on the ‘People to People’ peaceprocess, which reserved a third of the seats inlocal and regional peace reconciliation meet-ings for women.42 Similarly, in South Africa,41 per cent of the commissioners of the Truth and Reconciliation Commission werewomen.43 Neither of these examples, however,involves formal peace processes. At present,no examples of such quotas exist.
While they can be effective, however, quotas are no panacea. To be effective, quotas have tomatch the electoral system of a country; unless
they do, and unless commitments are reinforcedby a political system in which rules matter andfailure to comply carries consequences, the roleof quotas is merely symbolic.44
Women empowering women
One of the most important and effectiveavenues for women’s empowerment is thedynamic of cooperation among women.Informal women’s collectives organize aroundsuch issues as nutrition, food distribution,education and shelter, contributing to animproved standard of living for women, theirfamilies and communities.45 But even thoughwomen’s social networks tend to be widerthan those of men, they tend to commandfewer economic resources.46
Women’s groups need to be recognized asimportant agents of empowerment and development. Governments and developmentagencies must include them in poverty reduc-tion strategies and nurture long-term partner-ships. By working with women’s organizationsat the community level and channelling devel-opment resources through them, internationaldevelopment agencies can help increase thelikelihood that resources will reach the mostvulnerable members of poor communities –
85%
60%
100
80
60
40
20
Number ofcountries with...
Percentage ofcountries usingquotas 55%
0
20
40
60
80
100
20
35
6760
More than 30% women MPs
Between 20% and 30%women MPs
Between 10% and 20%women MPs Less than
10% women MPs
28%
Figure 5.2 Countries with the most women in parliament are also the most likely to
use quotas
Note: Quotas include constitutional quotas, election law quotas and political party quotas for electoral candidates.
Sources: Women in parliament from the Inter-Parliamentary Union database on ‘Women in National Parliaments’, <http://www.ipu.org/wmn-e/classif.htm>,accessed May 2006. The figures for those legislatures using quotas are derived from the Global Database of Quotas for Women, <www.quotaproject.org/country.cfm>, also accessed May 2006.
80 T H E S T A T E O F T H E W O R L D ’ S C H I L D R E N 2 0 0 7

women and children. Involving women in theearly stages of policy development help ensurethat programmes will be designed with theneeds of women and children in mind.
Grass-roots women’s movements are vocal and active champions of women’s equality andempowerment and have campaigned success-fully for CEDAW and other conventions man-dated to improve the situation of women andgirls at the international level. The benefit ofwomen’s groups is even more evident at thelocal level, where they are working to improvethe quality of life for their families.
Engaging men and boys
Men can make a crucial contribution to ending gender discrimination. Globally, men continue to dominate decision-makingprocesses in households, economies and governments. In addition, men’s participationin initiatives to promote gender mainstreamingand gender equality remains low. Such initia-tives may be perceived as a threat to their status and power.
By making child-friendly choices and support-ing women in their capacities as decision-makers, men can be powerful allies in thestruggle for women’s equality. Evidence showsthat men are more likely to be active, hands-on fathers when they feel positive about them-selves and their relationship with the child’smother, when they have support for activeinvolvement in their children’s lives from family and friends, and when they are in employment.47
Involving men
Men are often the dominant household decision-makers, yet they tend to be over-looked by programmes that improve condi-tions for women and children.48 In one Indianstate, for instance, researchers discovered thatadvocacy campaigns on nutrition were target-ed to women, even though approximately 20 per cent of fathers made the decisionsregarding children’s nutrition.49
UNICEF’s experience shows that programmesthat focus on males provide ways to promotepositive gender socialization. Programmes that
© U
NIC
EF/
HQ
00-0
016/
Gia
com
o P
irozz
i
R E A P I N G T H E D O U B L E D I V I D E N D O F G E N D E R E Q U A L I T Y 81

encourage the participation of both men andwomen can help to increase communicationbetween the sexes and encourage a more evendivision of childcare responsibilities. In VietNam, for example, UNICEF has mobilized mento promote the use of oral rehydration salts totreat diarrhoea and to increase immunization
coverage. Throughout Afghanistan, Bangladesh,India, Nepal, Pakistan and Sri Lanka, male andfemale activists are campaigning against gender-based violence. In Uganda and Zimbabwe,UNICEF programmes are attempting to fosterthe socialization of girls and boys as a means ofstemming the spread of HIV/AIDS.50
Across the developing world, studiesshow that women’s participation incommunity initiatives can have long-lasting benefits for women and chil-dren. Women who are empoweredto take action, whether through programmes led by governments,non-governmental organizations orthose driven by the community,often have a positive influence onthe lives of other women.
Bangladesh. One example is the Foodfor Education (FFE) programme inBangladesh, which focused on female-headed households. Lessons learnedfrom the FFE programme, which ranfrom 1993 to 2002, were applied in afollow-up project by the World Bank.About 40 per cent of the 5.2 millionstudents enrolled in schools with FFE received food grains, primarilywheat. The programme successfullyincreased primary school enrolment,promoted school attendance andreduced drop-out rates. While boys’school enrolment increased by nearly30 per cent, the increase for girls was even more remarkable, at over40 per cent. In addition, there is someevidence that the programme alsoenabled girls to stay in school longer,thus delaying marriage and improv-ing their income-earning potential.
Guatemala. Families with workingmothers in need of childcare were
the focus of Programa de HogaresComunitarios, in Guatemala. Underthis government-sponsored initia-tive, a group of parents was giventhe opportunity to designate awoman from their community astheir childcare provider. The successof the programme, which began in1991, was reinforced by the positiveoutcomes for the children, who con-sumed, on average, 20 per cent more energy, proteins and iron and 50 per cent more vitamin A than children in the control group.Programme evaluations alsorevealed that mothers involved weremore likely to receive work-relatedsocial and medical benefits thanother non-participating workingmothers.
Indonesia. Non-governmental organ-izations are actively involved in thecampaign for women’s rights inIndonesia. Since 1986, the Centre for the Development of Women’sResources has been a leader in themovement to end violence againstwomen. The centre trains community-based groups on women’s issues,including survival strategies andskills for building support networksto cope with violence againstwomen. The groups are thenequipped with modules to conductsuccession training until the infor-mation reaches village level.
According to the Asian DevelopmentBank, the organization’s campaignand training has increased the num-ber of women requesting legal assis-tance from the Indonesia Women’sAssociation for Justice, another lead-ing non-governmental organization.
Uzbekistan. In Uzbekistan, thewomen of Angren City Municipalityhave given young disabled childrenand their mothers a new source ofhope. Developed by women in thecommunity who wanted to improvethe social services available to thefamilies of disabled children, theSunday School Programme provides an educational environment for children who are excluded from traditional classrooms.
Women play a crucial role in theschool’s success, organizing the pro-grammes and encouraging mothers,many of whom rarely participate insocial events outside of the house-hold, to enrol their children. By providing a safe and supportiveenvironment in which disabled chil-dren and their parents can learn andsocialize, the programme caters tothe emotional and practical needs of families.
See References, page 88.
Women’s participation in community-based initiatives across the
developing world
82 T H E S T A T E O F T H E W O R L D ’ S C H I L D R E N 2 0 0 7

Another strategy for increasing men’s supportfor gender equality involves policies that aimto redistribute benefits to men and womenmore equitably. Evidence from the ‘Nordicexperiment’ illustrates how this works. InScandinavian countries, a combination of government and non-government initiativescontributed to a dramatic increase in the avail-ability of paternity leave for men. In Sweden,for instance, fathers now assume responsibilityfor 45 per cent of childcare responsibilities,thanks in large part to the growing popularityof paternal leave.51
Challenging gender stereotypes and
changing attitudes
Advocacy initiatives designed to educate menand women on the benefits of gender equalityand joint decision-making can help nurture amore cooperative relationship between menand women. Evidence shows that fathers aremore likely to stop abusive treatment towardsmothers if they have been exposed to informa-tion on how gender-based violence adverselyaffects their children.52
Research and data on the
situation of women and girls
There is broad recognition of the impact thatdiscrimination has on the lives of women. Butan overwhelming lack of sex-disaggregatedstatistics often results in scant or weak quan-titative research on the issues that affectwomen and, in turn, children. This report has shown that there is sufficient data andresearch on women and girls to outline wheretheir rights are violated and illustrate the neg-ative impacts these violations can have onchildren. Nonetheless, much more needs to beknown about many of the most importantaspects of women’s lives and the impact discrimination has on those around them.Research and data are sorely lacking in several key areas listed below.
• Maternal mortality: While 111 countriesproduced data based on registration systemsand other surveys, for 62 countries no recentnational data were available and estimatestherefore had to be based on models.
© U
NIC
EF/
HQ
06-0
656/
Josh
Est
ey
R E A P I N G T H E D O U B L E D I V I D E N D O F G E N D E R E Q U A L I T Y 83
UNICEF has joined with other UN agenciesand institutions to create a partnership dedi-cated to producing more comprehensive andaccurate data.53
• Violence against women: Only 38 countries inthe world have conducted at least one nation-al survey on violence against women since1995. A further 30 countries have surveyscompleted that cover parts of the country.54
• Enrolment, school attendance and literacy:While there are significant data disaggregatedby sex on school enrolment, sex-disaggregateddata on literacy and school attendance areavailable for only 112 and 96 countries,respectively. Efforts to compile and releasesex-disaggregated data on female comple-tion rates at the primary, secondary and tertiary levels of education must also bestrengthened.55
• Labour force, unemployment and occupa-tional distribution: Just over half the world’s204 countries and territories provided sex-
disaggregated data on these fundamentalareas of work, with only 105 providing dataon occupational segregation by sex.56
• Wage statistics: This is a vital area wherediscrimination affects women and their chil-dren, and yet just under half (52) of the 108countries or territories that reported wagedata were also able to provide disaggrega-tion by sex. Europe and Asia account foralmost three quarters of these countries.57
• Informal employment: Even with an interna-tionally agreed-upon definition of informalemployment, only 60 countries have pro-duced data on informal employment, and in many cases these statistics are not fullycomparable.58
• Unpaid work and time use: Since 1995, 67 countries or areas have conducted time use surveys, with again the vast majority inCEE/CIS and South and East Asia. Onlyseven countries in Africa and three in SouthAmerica have collected such data.59
Advocacy initiatives designed toeducate men and women on thebenefits of gender equality and jointdecision-making can help nurture amore cooperative relationshipbetween them.
A Brazilian non-governmental organization, Instituto Promundo, is implementing one such gender-sensitive programme, with positiveresults for women, men and children. Program H (the H refers to homens, or men in Portuguese)encourages young men to respecttheir partners, to avoid using vio-lence against women, and to takeprecautions to avoid HIV and othersexually transmitted infections.
Through a creative blend of radioannouncements, billboards anddances, Promundo challenges tradi-tional male attitudes by promotingthe idea that it is ‘cool and hip’ to bea more gender-equitable man.
Evaluations of the group meetings,where young men discuss the conse-quences of high-risk lifestyle choices,show that men who complete theprogramme are less likely to supporttraditional gender norms (for exam-ple, the belief that childcare is awoman’s job and that there are timeswhen a woman deserves to be beat-en). The number of young male participants (aged 15 to 28) who supported the statement that “a
woman’s most important role is totake care of the home and cook”declined from 41 per cent in thepretest to 29 per cent after comple-tion of the programme.
The success of the Program H initia-tive in Brazil has inspired similarprogrammes in other countries in the region, as well as in Asia, sub-Saharan Africa and the UnitedStates. In India, for example, whereprogrammes modelled on theProgram H approach have beenadopted, preliminary findings sug-gest that men’s attitudes towardswomen have changed.
See References, page 88.
Program H: Challenging gender stereotypes and changing attitudes in
Brazil and other countries
84 T H E S T A T E O F T H E W O R L D ’ S C H I L D R E N 2 0 0 7
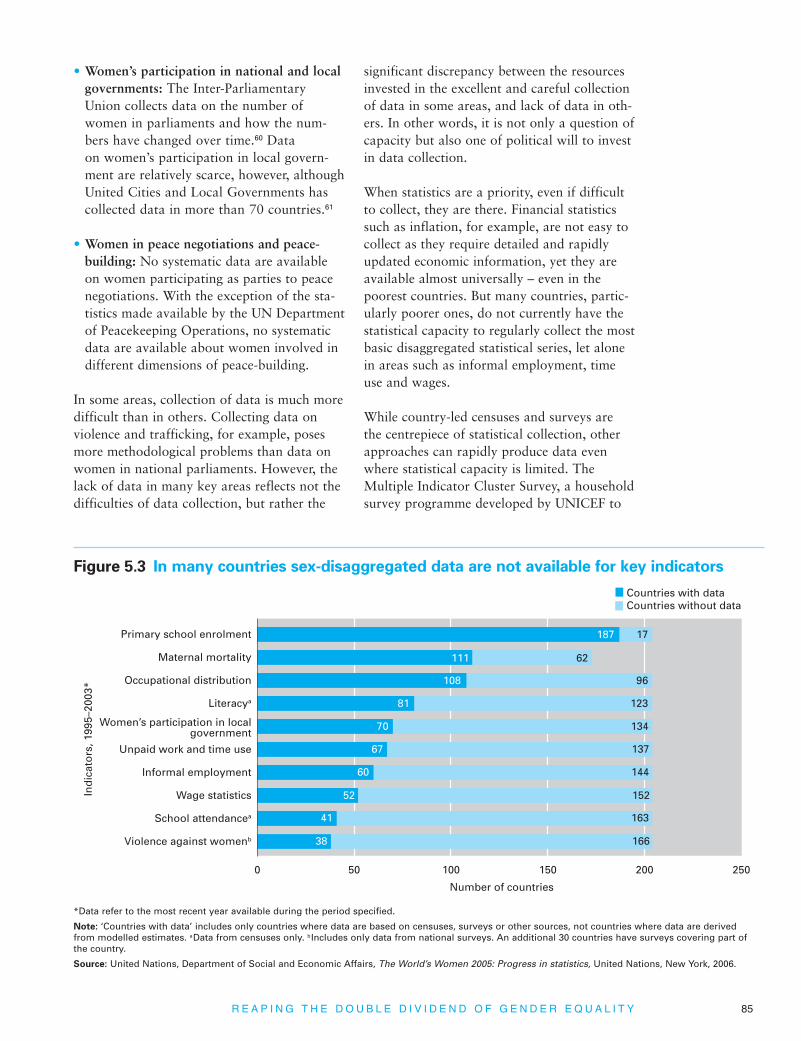
• Women’s participation in national and localgovernments: The Inter-ParliamentaryUnion collects data on the number ofwomen in parliaments and how the num-bers have changed over time.60 Data on women’s participation in local govern-ment are relatively scarce, however, althoughUnited Cities and Local Governments hascollected data in more than 70 countries.61
• Women in peace negotiations and peace-building: No systematic data are availableon women participating as parties to peacenegotiations. With the exception of the sta-tistics made available by the UN Departmentof Peacekeeping Operations, no systematicdata are available about women involved indifferent dimensions of peace-building.
In some areas, collection of data is much moredifficult than in others. Collecting data on violence and trafficking, for example, posesmore methodological problems than data onwomen in national parliaments. However, thelack of data in many key areas reflects not thedifficulties of data collection, but rather the
significant discrepancy between the resourcesinvested in the excellent and careful collectionof data in some areas, and lack of data in oth-ers. In other words, it is not only a question ofcapacity but also one of political will to investin data collection.
When statistics are a priority, even if difficultto collect, they are there. Financial statisticssuch as inflation, for example, are not easy tocollect as they require detailed and rapidlyupdated economic information, yet they areavailable almost universally – even in thepoorest countries. But many countries, partic-ularly poorer ones, do not currently have thestatistical capacity to regularly collect the mostbasic disaggregated statistical series, let alonein areas such as informal employment, timeuse and wages.
While country-led censuses and surveys are the centrepiece of statistical collection, otherapproaches can rapidly produce data evenwhere statistical capacity is limited. TheMultiple Indicator Cluster Survey, a householdsurvey programme developed by UNICEF to
Primary school enrolment
Maternal mortality
Occupational distribution
Literacya
Unpaid work and time use
Informal employment
Wage statistics
School attendancea
Violence against womenb
0 50 100 150 200 250
Countries with dataCountries without data
Number of countries
Women’s participation in localgovernment
Ind
icat
ors
, 199
5–20
03*
187 17
111 62
108 96
81 123
70 134
67 137
60 144
52 152
41 163
38 166
Figure 5.3 In many countries sex-disaggregated data are not available for key indicators
*Data refer to the most recent year available during the period specified.
Note: ‘Countries with data’ includes only countries where data are based on censuses, surveys or other sources, not countries where data are derivedfrom modelled estimates. aData from censuses only. bIncludes only data from national surveys. An additional 30 countries have surveys covering part ofthe country.
Source: United Nations, Department of Social and Economic Affairs, The World’s Women 2005: Progress in statistics, United Nations, New York, 2006.
R E A P I N G T H E D O U B L E D I V I D E N D O F G E N D E R E Q U A L I T Y 85

assist countries in filling data gaps for moni-toring the situation of children and women, iscapable of producing statistically sound, inter-nationally comparable estimates of key indica-tors. One of the three questionnaires focuseson women aged 15–49 and currently includesquestions on assets and security of tenure.Another valuable source of household data isthe Demographic and Health Surveys, whichinclude 200 surveys in 75 countries. Surveyssuch as these provide effective vehicles for get-ting in-depth information on the economic sit-uation of women, as well as the prevalence ofdomestic violence and other forms of genderdiscrimination at the household level.
The time is now
The progress that has been made fighting gender discrimination is positive: girls arecatching up with boys in school attendanceand performance, and in a few developingcountries and regions have surpassed them;more women are economically active and in higher level positions than ever before; and the number of women in parliament isincreasing year after year. But, in addition to
showing how far we have come, the assess-ment of this report underlines how far thereis to go.
Eliminating gender discrimination will pro-duce a double dividend, fulfilling the rights ofwomen and going a long way towards realiz-ing those of children as well. With concertedefforts, real progress, based on respect, univer-sal human rights and equal opportunities forwomen and men alike, can be made towardstransforming discriminatory attitudes behav-iours, customs, laws, institutions and practicesin society. Effective partnerships involvinggovernments, donors and international agen-cies, can support this process through thedesign and implementation of human-rights-based development strategies.
Tackling gender discrimination requires a dif-ferent approach to policymaking. Generally,the key actors in policy decisions are govern-ments. In areas such as debt or trade, forexample, economists, members of the publicand business leaders may be influential, butthe decision to act rests with the governingauthorities. Although governments and donors
Each year, over 500,000 women die as a result of pregnancy-relatedcauses, and many others suffer life-long health complications. Reducingmaternal mortality is one of theeight Millennium DevelopmentGoals, but it is also among the most difficult to monitor owing todifficulties in measuring maternalmortality. In some cases, measure-ment is complicated by a lack ofdata; maternal deaths often gounrecorded in countries that lackreliable civil registration of birthsand deaths, or where the cause ofdeath is not adequately classified orreported. Even in those countrieswith robust civil registration sys-tems, maternal deaths are often
misclassified or attributed to othercauses – particularly if the pregnan-cy status of the woman is notknown or recorded.
UNICEF is collaborating with theWorld Health Organization (WHO)and the United Nations PopulationFund (UNFPA) to improve the infor-mation base on maternal mortality.Building on more than a decade ofinter-agency collaboration and coop-eration, UNICEF, WHO and UNFPAare pooling their expertise to pioneera new approach to estimating thenumber of women dying from causes related to or aggravated by pregnancy. The methodologydeveloped for the project will correct
existing data discrepancies and gen-erate estimates for countries thatcurrently lack data.
The group’s joint work will alsoenhance data collection and dissemi-nation by compiling and reviewingcountry concerns to ensure wide-spread acceptance of final estimateson maternal mortality, obtaining themost recently reported national datafrom their country and regionaloffices and organizing interregionalconsultations to discuss underlyingstatistical issues.
See References, page 88.
Partnering to provide improved estimates of maternal mortality
86 T H E S T A T E O F T H E W O R L D ’ S C H I L D R E N 2 0 0 7

have a key role in addressing gender discrimi-nation and inequality through legislation, policies and funding for key programmes, the core agents of change are an altogether morediverse group that includes all members ofsociety, and women and girls themselves. Theseare the individuals and groups who hold thepower to eliminate gender discrimination andinequalities through everyday attitudes, behav-iours and practices.
The challenge to achieve such change is asexhilarating as it is daunting. It is not simply a question of producing a big decision by animportant body, which would be in manyways a simpler task to conceptualize andapproach. It requires societies to examineopenly and honestly the extent of gender discrimination and rights violations sufferedby women and girls, and commit themselvesto eliminating its root causes. Although chal-lenging at times, this process will be worth the
reward. Every person who argues that womenhave an equal place in decision-makingforums, every community that demands girlsgo to school, and every government commit-ted to ensuring that violence, abuse, exploita-tion and discrimination against women haveno place in society brings the double dividendof gender equality a step closer for this andfuture generations of women and children.
© U
NIC
EF/
HQ
05-1
068/
Rog
er L
eMoy
ne
R E A P I N G T H E D O U B L E D I V I D E N D O F G E N D E R E Q U A L I T Y 87

CHAPTER 11 Preparation of the text of the Convention on the
Elimination of All Forms of Discrimination againstWomen began in 1976.
2 King, Elizabeth M., and Andrew D. Mason,‘Engendering Development Through GenderEquality in Rights, Resources, and Voice’, WorldBank and Oxford University Press, Washington,D.C., January 2001, pp. 78-83.
3 Information derived from United Nations,‘Multilateral Treaties Deposited with theSecretary-General’, <http://untreaty.un.org/English/Bible/englishinternetbible/partI/chapterIV/treaty10.asp>, accessed September 2006.
4 Lawn, Joy E., Simon Cousens and Jelka Zupan,‘4 Million Neonatal Deaths: When? Where?Why?, Series on Neonatal Survival 1, TheLancet.com, March 2005, p. 5. Information onpopulation by sex in Asia derived from UnitedNations Population Division, ‘World PopulationProspects: The 2004 Revision Database’,<http://esa.un.org/unpp>, accessed September 2006.
5 World Health Organization, WHO Multi-CountryStudy on Women’s Health and DomesticViolence against Women: Initial results of preva-lence, health outcomes and women’s responses,Summmary Report, WHO, Geneva, 2005, p. xiii.
6 United Nations Population Fund, The State of the World’s Population, UNFPA, New York, 2005,p. 66.
7 Derived from websites of national governmentsand from Inter-Parliamentary Union, ‘Women inPolitics: 60 years in retrospect’, IPU, Geneva,February 2006, Data Sheet No. 4. Note: The figure for total women Heads of State andGovernment in 2006 includes of the Governmentof the Netherlands Antilles, which is anautonomous country within the Netherlands.Queens and Governor Generals are not includedin the figure cited.
8 Information derived from Inter-ParliamentaryUnion, ‘Women in Politics: 60 years in retro-spect’, op. cit.
9 United Nations International Research andTraining Institute for the Advancement ofWomen, ‘Beijing at 10: Putting policy into prac-tice’, in Women and Poverty: New challenge,INSTRAW, <www.un-instraw.org/en/images/stories/Beijing/womenandpoverty.pdf>.
10 UNESCO Institute for Statistics, ‘LiteracyEstimates, International Literacy Day 2005,<www.uis.unesco.org>.
11 Otunnu, Olara A., ‘Special Comment’ on Childrenand Security, Disarmament Forum, No. 3, UnitedNations Institute for Disarmament Research,Geneva, 2002, pp. 3-4.
12 Waring, Marilyn, et al., Politics: Women’sinsights, Inter-Parliamentary Union, Geneva,2000, p. 134.
CHAPTER 1 PANELS
Gender discrimination across the life cycle
Information derived from:
Gorman, Mark, Age and Security: How social pen-sions can deliver effective aid to poor older peopleand their families, HelpAge International, London,2004, p. 5.
Gupta, Neeru, and Mary Mahy, Adolescent Child-Bearing in Sub-Saharan Africa: Can increasedschooling alone raise ages at first birth?’,Demographic Research, vol. 8, 14 February 2003.
Joint United Nations Programme on HIV/AIDS, 2006 Report on the global AIDS epidemic, UNAIDS, Geneva, 2006, pp. 505-506. Based on2005 estimates.
REFERENCES
CHAPTER 1 FIGURES
Figure 1.2 Men’s discriminatory attitudes
towards women vary across regions but are
significant everywhere
Technical note: Methodology used to derive
regional and country aggregates from the
World Values Survey
The World Values Survey <www.worldvaluessurvey.org> is a worldwide investigation of socio-cultural and political change. It is conducted by anetwork of social scientists at leading universitiesaround the world. Interviews have been carriedout with nationally representative samples of thepublic in more than 80 societies on all six inhabit-ed continents. A total of four waves have beencarried out since 1981, with the latest wavebeing carried out between 1999 and 2004. All thedata used in this Report come from the latestwave (1999–2004).
Data for key questions regarding attitudestowards gender relations used for the reportwere accessed on 1 June 2006 for all countrieswith available data in the latest phase<www.worldvaluessurvey.org/services/index.html>.The data were then extracted using the WorldValues Survey data extraction tool (cross-tabs)and aggregated. In cases of countries with twosurveys, the most recent survey was used. Inthe rare case of countries with two surveys forthe same dates, an average of the two surveyswas used. Data were compiled for a series ofquestions relevant to the Report. For each ques-tion the World Values Survey provides data for‘Men’, ‘Women’ and ‘Total’. The data used in theReport vary according to the context, but areclearly labelled in each case.
In some figures and occasions in the text, datafrom countries within the same regional groupwere compiled as averages. Regions are basedon UNICEF classification with the exceptions ofclustering ‘countries in transition’ and ‘high-income countries’ separately, in order to separateopinions from these groupings of countries. Ineach case in the text or figure, the full list ofcountries used from each region is listed.
Countries with data from the World
Values Survey (year of survey indicated
in parentheses):
South Asia: Bangladesh (2002), India (2001),Pakistan (2001). Latin America and the
Caribbean: Argentina (1999), Bolivarian Republic of Venezuela (2000), Chile (2000),Mexico (2000), Peru (2001). Middle East and
North Africa: Algeria (2002), Egypt (2000),
Islamic Republic of Iran (2000), Iraq (2004), Jordan(2001), Morocco (2001), Saudi Arabia (2003). East
Asia and Pacific: China (2001), Indonesia (2001),Philippines (2001), Republic of Korea (2001),Singapore (2002), Viet Nam (2001). Sub-Saharan
Africa: Nigeria (2000), South Africa (2001),Uganda (2001), United Republic of Tanzania(2001). Higher income countires: Austria (1999),Belgium (1999), Canada (2000), Denmark (1999),Finland (2000), France (1999), Greece (1999),Iceland (1999), Ireland (1999), Israel (2001), Italy(1999), Japan (2000), Luxembourg (1999), Malta(1999), Netherlands (1999), Portugal (1999), Spain(2000), Sweden (1999), United Kingdom (1999),United States (1999). Countries in transition:
Albania (2002), Belarus (2000), Bosnia andHerzegovina (2001), Bulgaria (1999), Croatia(1999), Czech Republic (1999), Estonia (1999),Hungary (1999), Kyrgyzstan (2003), Latvia (1999),Lithuania (1999), Montenegro (2001), Poland(1999), Republic of Moldova (2002), Romania(1999), Russian Federation (1999), Serbia (2001),Slovakia (1999), Slovenia (1999), The formerYugoslav Republic of Macedonia (2001).
The percentages refer to the proportion ofrespondents who agreed or strongly agreed withthe following statements:
• “University is more important for a boy than fora girl.”
• “When jobs are scarce, men should have moreright to a job than a woman.”
• “Husbands and wives should both contribute toincome.”
• “Men make better political leaders thanwomen do.”
Figure 1.4 More than 1 our of every 4 births to
an adolescent mother (aged 15-19) occurs in
the least developed countries
Country composition of regional groups: Moredeveloped regions comprise all regions of Europeplus Northern America, Australia/New Zealandand Japan. Less developed regions comprise allregions of Africa, Asia (excluding Japan), LatinAmerica and the Caribbean plus Melanesia,Micronesia and Polynesia. The list of least devel-oped countries can be found in Summary indica-tors, p. 136. These countries are also included inthe less developed regions. For the full break-down of these regions, see United NationsPopulation Division, ‘ World PopulationProspects; The 2004 Revision Database’,<http://esa.un.org/unpp>.
88 T H E S T A T E O F T H E W O R L D ’ S C H I L D R E N 2 0 0 7

Joint United Nations Programme on HIV/AIDS, The Global Coalition on Women and AIDS, TheFemale AIDS Epidemic: 2005 statistics, UNAIDS,Geneva, 2005.
King, Elizabeth M., and Andrew D. Mason,‘Engendering Development Through GenderEquality in Rights, Resources, and Voice’, WorldBank and Oxford University Press, Washington,D.C., January 2001, pp. 78-83.
Lawn, Joy E., Simon Cousens and Jelka Zupan, ‘4 Million Neonatal Deaths: When? Where? Why?,op. cit.
Malhotra, Anju, Rohini Pande and Caren Grown,Impact of Investments in Female Education onGender Equality, paper commissioned by the WorldBank Gender and Development Group, InternationalCenter for Research on Women, Washington, D.C.,27 August 2003 (rev.).
United Nations Children’s Fund, Progress forChildren: A report card on gender parity and primaryeducation, Number 2, UNICEF, New York, April2005, pp. 2, 4 and 5.
United Nations Children’s Fund, Child ProtectionInformation Sheets, UNICEF, New York, 2006, pp. 17 and 25.
United Nations Children’s Fund, ‘Early Marriage:Child spouses’, Innocenti Digest No. 7, UNICEFInnocenti Research Centre, Florence, 2001, p. 11.
United Nations Population Division, ‘WorldPopulation Prospects: The 2004 Revision Database’,<http://esa.un.org/unpp>, accessed September2006.
United Nations Population Fund, The State of WorldPopulation 2005: The promise of equality, genderequity, reproductive health and the MillenniumDevelopment Goals, UNFPA, New York, 2005, pp. 34-38.
United Nations Population Fund and University ofAberdeen, Maternal Mortality Update 2004:Delivering into good hands, UNFPA, New York,2004.
United Nations, Report of the Independent Expertfor the United Nations Study on Violence againstChildren, United Nations, New York, 2006, pp. 12and 17.
World Health Organization, United NationsChildren’s Fund, and United Nations PopulationFund, Maternal Mortality in 2000: Estimates devel-oped by WHO, UNICEF and UNFPA, WHO, Geneva,2005. Based on 2000 estimates of maternal deaths.
Gender discrimination and inequalities
across regions
For the methodology and questions used to derivethe aggregates from the World Values Survey, seepage 88 of this report. Methodology used to deriveregional and country aggregates from the WorldValues Survey.
Gallup Poll, ‘Latin American Women LeadershipStudy: A look at changing attitudes of LatinAmericans toward gender and women’s leadershipcapabilities’, Report for the Inter-AmericanDevelopment Bank, Washington, D.C., November2000, pp. 7-8.
United Nations Development Programme, HumanDevelopment Report 2005: International cooperationat a crossroads: Aid, trade and security in anunequal world, Oxford University Press for UNDP,New York, 2005, pp. 303-306. See p. 345 of thereport for a full explanation of the methodology usedto calculate the gender empowerment measure.
CHAPTER 2 1 Vadnais, Daniel, Adrienne Kols and Noureddine
Abderrahim, Women’s Lives and Experiences:Changes in the past ten years, ORC Macro andUS Agency for International Development,Maryland, 2006, pp. 75-76. Data refer to womenwho do not participate in all four areas of house-hold decision-making assessed from theDemographic and Health Surveys. These includ-ed decisions regarding a woman’s own healthcare, major household purchases, purchases fordaily household needs, and timing of visits tofriends and relatives. The 10 countries (out of 30assessed) where more than half the women sur-veyed participated in all four areas of decision-making were Armenia, Bolivia, Colombia, Eritrea,Indonesia, Madagascar, Peru, Philippines,Rwanda and Turkmenistan.
2 UNICEF calculations based on Demographic andHealth Survey (DHS) data. All data available fromSTATcompiler at <www.measuredhs.com>,accessed June 2006.
3 Quisumbing, Agnes, ‘What Have We Learnedfrom Research on Intrahousehold Allocation?’,Chapter 1 in Agnes Quisumbing, ed., HouseholdDecisions, Gender and Development: A synthesisof recent research, International Food PolicyInstitute, Washington, D.C., 2003, pp. 1-6. Alsosee Chant, Sylvia, ‘Poverty begins at home?Questioning some (mis)conceptions about chil-dren, poverty and privation in female-headedhouseholds’, background paper written for TheState of the World’s Children 2007, UNICEF, New York, 2006.
4 Frankenberg, Elizabeth, and Duncan Thomas,‘Measuring Power’, Chapter 4 in AgnesQuisumbing, ed., Household Decisions, Genderand Development: A synthesis of recentresearch, International Food Policy ResearchInstitute, Washington, D.C., 2003, pp. 29-36.
5 Agarwal, Bina, ‘“Bargaining” and GenderRelations’, op. cit., pp. 11-12. Also see Nosseir,Nazek, ‘Family in the New Millennium: Majortrends affecting families in North Africa’, Chapter7 in United Nations, Major Trends AffectingFamilies: A background document, UN, NewYork, 2003, p. 189.
6 Smith, Lisa C., et al., The Importance ofWomen’s Status for Child Nutrition in DevelopingCountries, Research Report 131, InternationalFood Policy Research Institute, Washington D.C.,2003, p. 22.
7 United Nations Children’s Fund, Early Marriage: A harmful traditional practice, UNICEF, New York,2005, p. 1.
8 Smith, Lisa C., et al., The Importance ofWomen’s Status for Child Nutrition in DevelopingCountries, op. cit., p. 21.
9 United Nations Population Fund, The State ofWorld Population 2005, UNFPA, New York, 2005,p. 65.
10 Chant, Sylvia, ‘Poverty begins at home?’, op. cit.,p. 14.
11 United Nations Children’s Fund, Early Marriage,op. cit., 2005, p. 23.
12 United Nations Development Fund for Women,Not a Minute More: Ending violence againstwomen, UNIFEM, New York, 2003, p. 8.
13 World Health Organization, WHO Multi-CountryStudy on Women’s Health and DomesticViolence against Women: Initial results on preva-lence, health outcomes and women’s responses,Summary Report, WHO, Geneva, 2005, p. 6.
14 World Health Organization, The World Report onViolence and Health, WHO, Geneva, 2002, p. 93.
15 United Nations Development Fund for Women,Not a Minute More, op. cit., p. 8.
16 Desai, Sonalde, and Kiersten Johnson, ‘Women’sDecisionmaking and Child Health: Familial andsocial hierarchies’, in Sunitor Kishor, ed., A Focuson Gender: Collected papers on gender usingDHS data, ORC Macro and US Agency forInternational Development, Maryland, USA, 2005,p. 56.
17 Smith, Lisa C., et al., The Importance ofWomen’s Status for Child Nutrition in DevelopingCountries, op. cit., pp. 127-128.
18 UNICEF defines undernutrition as the outcome ofinsufficient food intake (hunger) and repeatedinfectious diseases. Undernutrition includes beingunderweight for one’s age, too short for one’sage (stunted), dangerously thin (wasted), anddeficient in vitamins and minerals (micronutrientmalnutrition). United Nations Children’s Fund,Progress for Children: A report card on nutrition,Number 4, UNICEF, New York, May 2006, pp. 1 and 3.
19 Ibid., p. 6.
20 Ibid., pp. 4 and 10.
21 Smith, Lisa C., et al., The Importance ofWomen’s Status for Child Nutrition in DevelopingCountries, op. cit., pp. 126-131.
22 Ibid., p. 3; and United Nations StandingCommittee on Nutrition, 5th Report on the WorldNutrition Situation, United Nations, Geneva,March 2004, p. 42.
23 The underlying data can be found in theStatistical Tables of this report, Table 2. Nutrition,p. 106.
24 Smith, Lisa C., et al., The Importance ofWomen’s Status for Child Nutrition in DevelopingCountries, op. cit., pp. 15-34. Within the study,women’s influence is measured by the differ-ences between men’s and women’s ages, levelsof education and control over assets and income.
25 Ibid., p. xi.
26 It is also important to note that in all the regionsstudied, improving a woman’s social status – ability to influence decision-making processes –
R E F E R E N C E S 89

corresponded to a reduction in breastfeeding,which is harmful to child nutrition. Efforts toimprove women’s status, therefore, must beaccompanied by efforts to protect, support andpromote breastfeeding. See Smith, Lisa C., et al.,The Importance of Women’s Status for ChildNutrition in Developing Countries, op. cit., p. xii.
27 Ibid., p. 127.
28 Floro, Maria Sagrario, and Stephanie Seguino,‘Gender Effects on Aggregate Saving: A theoreti-cal and empirical analysis’, Policy ResearchReport on Gender and Development, WorkingPaper Series No. 23, World Bank, Washington,D.C., 2000, p. 9.
29 Duflo, Esther, and Christopher R. Udry,‘Intrahousehold Resource Allocation in Côted’Ivoire: Social norms, separate accounts andconsumption choices’, Yale University EconomicGrowth Center Discussion Paper No. 857, SocialScience Research Network, June 2003, p. 31;and Doss, Cheryl R., ‘Do households fully sharerisks? Evidence from Ghana’, Department ofApplied Economics, University of Minnesota, St. Paul, July 1996, p. 18.
30 Alderman, Harold, et al., ‘Gender Differentials inFarm Productivity: Implications for household effi-ciency and agricultural policy’, Food Consumptionand Nutrition Division Discussion Paper No. 6,International Food Policy Research Institute,Washington, D.C., 1995, pp. 9-12.
31 Ibid., p. 22.
32 Visaria, Leela, ‘Female Autonomy and FertilityBehaviour: An exploration of Gujarat data,’ inProceedings of the International PopulationConference, Montreal 1993, volume 4,International Union for the Scientific Study ofPopulation, Liege (Belgium), 1993, pp. 263-275,in Sonalde Desai and Kiersten Johnson,‘Women’s Decisionmaking and Child Health:familial and social hierarchies,’ op. cit., p. 56.
33 Desai, Sonalde, and Kiersten Johnson, ‘Women’sDecisionmaking and Child Health’, op. cit., p. 66.Effects are the weakest in sub-Saharan Africa,with Latin America and the Caribbean falling inbetween.
34 ‘Gender Perspective in Malaria Management’,Malaria Knowledge Programme, Policy Brief,Liverpool School of Tropical Medicine, Liverpool,undated.
35 Desai, Sonalde, and Kiersten Johnson, ‘Women’sDecisionmaking and Child Health’, op. cit., p. 56.
36 Emerson, Patrick M., and Andre Portela Souza,‘Bargaining over Sons and Daughters: Child labor,school attendance and intra-household genderbias in Brazil’, Working Paper No. 02-W13,Vanderbilt University, Nashville, 2002, p. 14.
37 United Nations Children’s Fund, Progress forChildren: A report card on gender parity and pri-mary education, Number 2, UNICEF, New York,2005, p. 7.
38 Gibbons, Elizabeth, Friedrich Huebler andEdilberto Loaiza, ‘Child Labor, Education, and thePrinciple of Non-Discrimination’, Chapter 10 inPhilip Alston and Mary Robinson, eds., HumanRights and Development: Towards mutual rein-
forcement, Oxford University Press, Oxford,2005, p. 214.
39 Ibid., p. 222.
40 Delamonica, Enrique, Asmaa Donahue andAlberto Minujin, ‘Children Living Only with theirMothers: Are they disadvantaged?’ in AlbertoMinujin, Enrique Dalamonica and MarinaKomareci, eds., Human Rights and Social Policiesfor Children and Women: The Multiple IndicatorCluster Survey (MICS) in practice, New SchoolUniversity and UNICEF, New York, 2005, p. 201.
41 Bongaarts, John, ‘Household Size andComposition in the Developing World’, WorkingPaper No. 144, Population Council, New York,2001, p. 14.
42 Chant, Sylvia, ‘Poverty Begins at Home?’, op. cit.,p. 1.
43 Quisumbing, Agnes, Lawrence Haddad andChristine Peña, ‘Are Women Over-RepresentedAmong the Poor? An analysis of poverty in tendeveloping countries’, Journal of DevelopmentEconomics, vol. 66, no. 1, 2001, pp. 225-269; and FCND Discussion Paper No. 115, FoodConsumption and Nutrition Division, InternationalFood Policy Research Institute, Washington,D.C., 2001, pp. 8-9.
44 Helen Keller International, ‘Female Decision-Making Power and Nutritional Status withinBangladesh’s Economic Context’, NutritionalSurveillance Project, Bulletin No. 20, Dhaka,August 2006, p. 2.
45 Chant, Sylvia, ‘Poverty Begins at Home?’, op. cit.,p.10.
46 Delamonica, Enrique, Asmaa Donahue andAlberto Minujin, ‘Children Living Only with theirMothers’, op. cit., p.201.
47 Ibid., p. 220.
48 Chant, Sylvia, ‘Poverty Begins at Home?’, op. cit.,p. 11.
49 Expenditure patterns, rather than the total percapita amount, differed between female-headedhouseholds and male-headed households. Theexpenditures of female-headed and male-headedhouseholds, disaggregated by expenditure quin-tiles, did not differ except in the wealthiest quintile, where female-headed households hadhigher expenditures.
50 Helen Keller International, ‘Female Decision-Making Power and Nutritional Status withinBangladesh’s Economic Context,’ op. cit., p. 2.
51 United Nations Children’s Fund, Role of Men inthe Lives of Children: A study of how improvingknowledge about men in families helps strength-en programming for children and women,UNICEF, New York, 1997, p. 9.
52 Barker, Gary, et al., Supporting Fathers:Contributions from the International FatherhoodSummit 2003, Early Childhood Development:Practice and Reflections, no. 20, Bernard vanLeer Foundation, The Hague, April 2004, p. 12.
53 US Department of Health and Human Services,Child Care Bureau, ‘Promoting ResponsibleFatherhood through Child Care’, National Child
Care Information Center, Vienna (Virginia), April2004, p. 1.
54 Christian Children’s Fund, ‘Children in Poverty:Shaping a Reponse to Poverty: A conceptualoverview and implications for responding to children living in poverty’, Children and PovertySeries, Part III, CCF, Richmond, 2003, p 7.
55 Brown, Janet, and Gary Barker, ‘Global Diversityand Trends in Patterns of Fatherhood,’inSupporting Fathers, op. cit., p. 17
56 Barker, Gary, et al., Supporting Fathers, op. cit., p. 1.
57 Renk, Kimberly, et al., ‘Mothers, Fathers, Gender Role, and Time Parents Spend with theirChildren’, Sex Roles: A Journal of Research, vol. 48, nos. 7-8, April 2003. pp. 1-2.
58 Cliquet, Robert, ‘Major trends affecting families in the new millennium: Western Europe andNorth America’, Major Trends Affecting Families(background document), Division for Social Policyand Development, United Nations, New York,2003-2004, p. 5. These numbers are even higherwhen the separation figures of unmarried cohabi-tant couples and divorce rates are combined.
59 Brown, Janet, and Gary Barker, ‘Global Diversityand Trends in Patterns of Fatherhood’, op. cit., p. 22.
60 Joseph Rowntree Foundation, ‘A Man’s Place inthe Home: Fathers and families in the UK’,Foundations, No. 440, April 2000, <www.jrf.org.uk/knowledge/findings/foundations/440.asp>,accessed September 2006.
61 El-Haddad, Yahya, ‘Major Trends AffectingFamilies in the Gulf Countries’, Major TrendsAffecting Families, United Nations, New York,2003, p. 225.
62 Nosseir, Nazek, ‘Major trends affecting families inNorth Africa,’, op. cit., p. 194.
63 Badran, Hoda, ‘Major Trends Affecting Families inEl Mashrek El Araby’, Major Trends AffectingFamilies, United Nations, New York, 2003, p. 206.
64 Kabeer, Naila, ‘The Conditions and Consequencesof Choice: Reflections on the measurement ofwomen’s empowerment’ UNRISD DiscussionPaper No. 108, United Nations Research Institutefor Social Development, Geneva, August 1999, p. 55.
65 Desai, Sonalde, and Kiersten Johnson, ‘Women’sDecisionmaking and Child Health’, op. cit., p. 66.
66 Malombe, Joyce, ‘Women’s Groups and ShelterImprovement in Kenya,’ in Ann Schlyter, ed., APlace to Live: Gender research on housing inAfrica, Nordiska Afrikainstitutet, Uppsala, 1996, p. 167.
67 Desai, Sonalde, and Kiersten Johnson, ‘Women’sDecisionmaking and Child Health’, op. cit., p. 66.
68 Karl, Marilee, Women and Empowerment:Participation and Decision-Making, Zed Books,London, 1995, p. 19.
69 Agarwal, Bina, ‘“Bargaining” and GenderRelations’, op. cit., p. 32.
90 T H E S T A T E O F T H E W O R L D ’ S C H I L D R E N 2 0 0 7

70 United Nations Children’s Fund, Role of Men inthe Lives of Children, op. cit., p. 9.
71 McNulty, Stephanie, ‘Women’s OrganizationsDuring and After War: From service delivery topolicy advocacy’, Research and ReferenceServices Project, United States Agency forInternational Development Center forDevelopment Information and Evaluation,Washington, D.C., October 1998, p. 3.
CHAPTER 2 PANELS
Domestic violence against children
Information derived from:
Jaffe, P., and M. Sudermann, ‘Child Witness ofWomen Abuse: Research and community respons-es’ in Sandra M. Stith and Murray A. Straus,Understanding Partner Violence: Prevalence, caus-es, consequences, and solutions, Families in FocusServices, vol. II, Minneapolis, National Council onFamily Relations, 1995.
Strauss, Murray A., Richard J. Gelles and ChristineSmith, ‘Physical Violence in American Families: Riskfactors and adaptations to violence in 8,145 fami-lies’, Transaction Publishers, New Brunswick, 1990.
United Nations, Report of the Independent Expertfor the United Nations Study on Violence againstChildren, United Nations, New York, August 2006.
United Nations Children’s Fund, ‘Domestic Violenceagainst Women and Girls’ UNICEF InnocentiResearch Centre, Florence, 2000, pp. 9-12
Wolfe, D.A., et al., ‘Strategies to Address Violencein the Lives of High Risk Youth’ in Peled, E., P.G.Jaffe and J.L. Edleson, eds., Ending the Cycle ofViolence: Community responses to children of bat-tered women, Sage Publications, New York, 1995
Grandmothers and HIV/AIDS
Information derived from:
HelpAge International, ‘Age and Security: Howsocial pensions can deliver effective aid to poor
older people and their families’, HelpAgeInternational, London, 2004, pp. 7- 8.
United Nations Children’s Fund, Africa’s Orphanedand Vulnerable Generations: Children affected byAIDS, UNICEF, New York, 2006, pp. 10, 14-16, 27and 29-31.
United Nations Children’s Fund, Africa’s OrphanedGenerations, UNICEF, New York, 2003, pp. 15 and 17.
Mother Centres in Central and Eastern Europe
and the Gambia
Information derived from:
Jaffe, P., and Sudermann, M., ‘Child Witness ofWomen Abuse: Research and community responses’,op. cit.
Mothers Centres in Central and Eastern Europe:Mother Centres International Network forEmpowerment (MINE), and Laux, Andrea, and RutKolinska, ‘Mother Centres International NetworkEmpowerment’, Case Study for Workshop andNetworking Event ‘Building Bridges with theGrassroots: Scaling up through knowledge sharing’,World Urban Forum, Barcelona, 12-17 September2004.
Information on Mothers Clubs in the Gambia providedby UNICEF West and Central Regional Office.
CHAPTER 31 Grown, Caren, Geeta Rao Gupta and Aslihan Kes,
Taking Action: Achieving gender equality andempowering women, Earthscan, London/Virginia,for the UN Millennium Project Task Force onEducation and Gender Equality, 2005, p. 77.
2 Ibid., p. 89.
3 UNICEF calculations based on data derived fromUnited Nations Development Programme, HumanDevelopment Report 2006: Beyond scarcity:Power, poverty and the global water crisis,Oxford University Press for UNDP, New York,2006, p. 379.
4 Machinea, José Luis, Alicia Bárcena and ArturoLeón, The Millennium Development Goals: ALatin American and Caribbean perspective,United Nations, Santiago, 2005, p. 128.
5 De Ferranti, David, Inequality in Latin Americaand the Caribbean: Breaking with history?, WorldBank, Mexico, 2004, p. 19.
6 Unni, Jeemol, ‘Gender and Informality in LabourMarket in South Asia’, in Economic and PoliticalWeekly, vol. 36, no. 26, 30 June 2001, p. 2370.
7 United Nations Development Programme, HumanDevelopment Report 2005: International coopera-tion at a crossroads: Aid, trade and security in anunequal world, Oxford University Press for UNDP,New York, 2005, p. 315.
8 UNICEF calculations based on the World ValuesSurvey database, accessed June 2006. Theresults are based on the respondents whoagreed or strongly agreed that a “Husband andwife should both contribute to income.” (Note onthe methodology employed to calculate regionalaggregates can be found on p. 88.
9 International Labour Office, Global EmploymentTrends Brief, January 2006, International LabourOrganization, Geneva, 2006, p. 3.
10 United Nations Development Programme, HumanDevelopment Report 2005, op. cit., p. 314. Thefemale economic activity rate is calculated on thebasis of data on the economically active popula-tion and the total population.
11 Ibid. The gender parity activity rate is calculatedas the female economic activity rate as a percent-age of the male rate.
12 Son, Hyun H., and Nanak Kakwani, ‘The GenderPay Gap over Women’s Working Lifetime’,International Poverty Centre, United NationsDevelopment Programme, June 2006,<www.undp-povertycentre.org/newsletters/OnePager20.pdf>.
13 UNICEF calculations based on United NationsDevelopment Programme, Human DevelopmentReport 2005, op. cit., table 25, pp. 299-302.Aggregates weighed and based on UNICEFregions.
14 International Labour Organization, ‘NationalReport for Promoting the Linkages BetweenWomen’s Employment and the Reduction ofChild Labour’, ILO Area Office, Dar es Salaam,1994, p. 6; and Baidya, Bal Gopal, MadhupDhungana and Rojee Kattel, ‘The LinkagesBetween Women’s Employment, Family Welfareand Child Labour in Nepal’, GENPROM WorkingPaper No. 12, International Labour Organization,Gender Promotion Programme, Geneva, 2002, p. 1.
15 Grown, Caren, Geeta Rao Gupta and Aslihan Kes,Taking Action, op. cit., p. 78.
16 Steinzor, Nadia, Women’s Property andInheritance Rights: Improving lives in changingtimes, Women in Development TechnicalAssistance Projects, Washington, D.C., March2003, p. 6.
17 Grown, Caren, Geeta Rao Gupta and Aslihan Kes,Taking Action, op. cit., p. 78.
CHAPTER 2 FIGURES
Figures 2.1, 2.2 and 2.3
Technical note: Methodology used to derive
regional and country aggregates from the
Demographic and Health Surveys
The data on household decision-making (used in Chapter 2) come from the Demographic and Health Surveys (DHS), which are nationally-representative household surveys with large sample sizes (usually between 5,000 and 30,000households). DHS surveys provide data for awide range of monitoring and impact evaluationindicators in the areas of population, health and nutrition.
Data for the following questions were extractedfrom the DHS STATcompiler <www.measuredhs.com> in June 2006. The data used coveredwomen who were married or living with a part-ner, and their ability to participate in four keyareas of household decision-making: own healthcare; large household purchases; daily household
purchases; visits to family or relatives. There wasone answer out of three possible responses foreach question: decision made by wife alone;decision made jointly with husband; decisionmade by husband alone.
The countries included in the survey were
(year of survey in parenthesis):
CEE/CIS: Armenia (2000), Turkmenistan (2000).East Asia and Pacific: Indonesia (2002-2003),Philippines (2003). Latin America and
Caribbean: Bolivia (2003), Colombia (2005), Haiti(2000), Nicaragua (2001), Peru (2000). Middle
East and North Africa: Egypt (2000), Jordan(2002), Morocco (2003-2004). South Asia:
Bangladesh (2004), Nepal (2001). Sub-Saharan
Africa: Benin (2001), Burkina Faso (2003),Cameroon (2004), Eritrea (2002), Ghana (2003),Kenya (2003), Madagascar (2003-2004), Malawi(2000), Mali (2001), Mozambique (2003), Nigeria(2003), Rwanda (2000), Uganda (2000-2001),United Republic of Tanzania (2004), Zambia(2001/2002), Zimbabwe (1999).
R E F E R E N C E S 91

18 Ibid., p. 78.
19 Ibid.
20 Quisumbing, Agnes R., ed., HouseholdDecisions, Gender and Development: A synthesisof recent research, Johns Hopkins UniversityPress for International Food Policy ResearchInstitute, Washington D.C., 2003, p. 118.
21 Alderman, H., et al., ‘Gender Differentials in Farm Productivity: Implications for HouseholdEfficiency and Agricultural Policy,’ FCNDDiscussion Paper No. 6, Food Consumption and Nutrition Division, International Food PolicyResearch Institute, Washington, D.C., 1995, p. 22.
22 Quisumbing, Agnes R., ‘What Have We learnedfrom Research on Intra-household Allocation?’,op. cit., p. 54.
23 Hallman, Kelly, David Lewis and Suraiya Begum,‘An Integrated Economic and Social Analysis toAssess the Impact of Vegetable and FishpondTechnologies on Poverty in Rural Bangladesh’,Environment and Production Technology Division;Food Consumption and Nutrition Division, EPTDDiscussion Paper No. 112/FCND DiscussionPaper 163, International Food Policy ResearchInstitute, October 2003, p .50; and InternationalFood Policy Research Institute, ‘Women: Still thekey to food and nutrition security’, IFPRI,Washington, D.C., 2005, p. 1.
24 Hallman, Kelly, David Lewis and Suraiya Begum,‘An Integrated Economic and Social Analysis toAssess the Impact of Vegetable and FishpondTechnologies on Poverty in Rural Bangladesh’,op. cit., pp. 42-43.
25 United Nations Development Fund for Women,Progress of the World’s Women 2005: Women,work and poverty, UNIFEM, New York, 2005, p. 9.
26 United Nations, The World’s Women 2005:Progress in statistics, ST/ESA/STAT/SER.K/17,Department of Economic and Social Affairs,Statistics Division, United Nations, New York,2006, p. 55.
27 Chen, M. et al., Progress of the World’s Women2005: Women, work and poverty, United NationsDevelopment Fund for Women, New York, 2005,p. 39.
28 Ibid., pp. 63-64.
29 Ibid., pp. 27-29. Also Engle, Patrice L.,‘Urban Women: Balancing work and childcare’,Chapter 3 in 2020 Focus, Number 3, Brief 08,International Food Policy Research Institute,Washington, D.C., August 2000.
30 Ibid., p. 33.
31 International Labour Organization, GlobalEmployment Trends for Women 2004, ILO,Geneva, 2004, p. 9. The reference is based onthe increasing ratio of employment to populationratio for women. This ratio indicates the capacityof economies to create employment opportuni-ties for their population. Information on industrial-ized countries is derived from Eileen Appelbaum,et al., Shared work, Valued Care: New norms fororganizing market work and unpaid care work,
Economic Policy Institute, Washington, D.C.,2002, p. vii.
32 Gospel, Howard, ‘Quality of Working Life: Areview on changes in work organization, condi-tions of employment and work-life arrange-ments’, Conditions of Work and EmploymentSeries No. 1, International Labour Organization,Geneva, 2003, p. 17.
33 Heyman, Jody, ‘Social Transformations and theirImplications for the Global Demand for ECCE’,Policy Brief on Early Childhood No. 8, UnitedNations Educational, Scientific and CulturalOrganisation, Paris, November/December 2002,pp. 1-2.
34 Chen, M. et al., Progress of the World’s Women2005, op. cit., p. 29.
35 International Labour Office, Breaking Through theGlass Ceiling: Women in management,International Labour Organization, Geneva, 2004update, p. 29.
36 Organisation for Economic Co-operation andDevelopment, OECD Employment Outlook 2001:Reconciling social and employment goals, OECD,Paris, p. 132.
37 International Labour Office, Breaking Through theGlass Ceiling, op. cit., p. 29.
38 Ibid, p. 32.
39 Whiteford, Peter, ‘Reconciling Work and FamilyLife: A comparative analysis of OECD countries’,Organisation for Economic Co-operation andDevelopment, Paris, 2005, p. 5.
40 Gospel, Howard, ‘Quality of Working Life’, op. cit., p.17.
41 Dodson, Lisa, Tiffany Manuel and Ellen Bravo,‘Keeping Jobs and Raising Families in Low-Income America: It just doesn’t work’ – A Reportof the Across the Boundaries Project, TheRadcliffe Public Policy Center and 9to5 NationalAssociation of Working Women, Cambridge,Massachusetts, 2002, p. 1.
42 Ibid.
43 Peisner-Feinberg, Ellen S. et al., ‘The Children ofthe Cost, Quality, and Outcomes Study Go ToSchool: Technical report’, University of NorthCarolina at Chapel Hill, Frank Porter Graham ChildDevelopment Center, Chapel Hill, NC, 2000, p. 1;and Loeb, Susanna et al., ‘Child Care in PoorCommunities: Early learning effects of type, quali-ty and stability’, Child development, vol. 75, no. 1, 2004, pp. 47-65.
44 Dodson, Lisa, Tiffany Manuel and Ellen Bravo,‘Keeping Jobs and Raising Families in Low-Income America: It just doesn’t work’, op. cit.,pp. 6-7; and Lindars, Helen, ‘How Can Suitable,Affordable Child Care Be Provided For All ParentsWho Need To Work’, Equal OpportunitiesCommission submission to the Work andPensions Select Committee Inquiry, EqualOpportunities Commission, Manchester, UnitedKingdom, February 2003, p. 2, 3-5.
45 Aubel, Judi, ‘Grandmothers: A learning institu-tion’, United States Agency for InternationalDevelopment, Washington, D.C., August 2005, p. 81.
46 King, Elizabeth M., and Andrew D. Mason,‘Engendering Development 2001’ – A World BankPolicy Research Report’, World Bank,Washington, D.C., January 2001, pp. 24 and 170.
47 Appelbaum, Eileen, et al., Shared Work, ValuedCare, op. cit., pp. 29-30.
48 Ministry of Social Affairs and Employment, TheNetherlands, ‘Work/family arrangements’ and‘Childcare Act’, <http://internationalezaken.szw.nl/index.cfm?fuseaction=dsp_rubriek&rubriek_id=13039>, accessed September 2006.
49 Gospel, Howard, ‘Quality of Working Life’, op. cit., p. 17.
50 Dodson, Lisa, Tiffany Manuel and Ellen Bravo,‘Keeping Jobs and Raising Families in Low-Income America’, op. cit., p. 1.
51 International Organization for Migration, WorldMigration 2005: Costs and Benefits ofInternational Migration, IOM, Geneva, 2005, p. 13.
52 Cortés, Rosalía, ‘Remittances and Children’sRights: An overview of academic and policy literature’, internal document, United NationsChildren’s Fund, New York, February 2006, p. 4.
53 Bryant, John, ‘Children of International Migrantsin Indonesia, Thailand, and the Philippines: Areview of evidence and policies’, InnocentiWorking Paper 2005-05, UNICEF InnocentiResearch Centre, Florence, April 2005, p. iii.
54 Ibid, p. 23.
55 Cortés, Rosalía, ‘Remittances and Children’sRights’, op. cit., p. 8.
56 United Nations Development Fund for Women,‘Claim and Celebrate Women Migrants’ HumanRights through CEDAW – A UNIFEM BriefingPaper’, UNIFEM, Geneva, 2005, p. 36.
57 Cortés, Rosalía, ‘Remittances and Children’sRights’, op. cit., p. 4.
58 Ibid.
59 Ibid, p. 14.
60 Scalabrini Migration Center, ‘Filipino families inmotion’, in Hearts Apart: Migration in the eyes ofFilipino children, Scalabrini Migration Center,Manila, 2003, p. 50, <http://www.smc.org.ph/heartsapart/pdfs/Hearts%20Apart.pdf>.
61 Cortes, Rosalia, ‘Remittances and Children’sRights’, op. cit., p. 4.
62 United Nations High Commissioner for Refugees,Refugee Children: Guidelines on protection andcare, UNHCR, Geneva, 1994, p. 10.
63 United Nations High Commissioner for Refugees,‘Refugee Children’, Global Consultations onInternational Protection, 4th Meeting,EC/GC/02/9, 25 April 2002.
64 United Nations Development Fund for Women,Claim and Celebrate Women Migrants’ HumanRights through CEDAW, op. cit., p. 36.
65 Waldorf, Lee, ‘Human Rights ProtectionsApplicable to Women Migrant Workers’,UNIFEM-CEDAW Panel on Addressing WomenMigrant Workers’ Concerns’, United Nations
92 T H E S T A T E O F T H E W O R L D ’ S C H I L D R E N 2 0 0 7

Development Fund for Women, New York, July2003, p. 30.
66 Bryant, John, ‘Children of International Migrantsin Indonesia, Thailand, and the Philippines’, op. cit., p. 10.
67 UNIFEM East and Southeast Asia RegionalOffice, Empowering Women Migrant Workers inAsia, Bangkok, United Nations DevelopmentFund for Women, 2004, pp. 3-5.
68 United Nations, Convention on the Elimination ofAll Forms of Discrimination against Women,<www.unhchr.ch/html/menu3/b/e1cedaw.htm>.
69 United Nations, Commission on the Status ofWomen, Report on the forty-ninth session (28February-11 and 22 March 2005), E/2005/27 andE/CN.6/2005/11, United Nations, New York, pp. 24-28.
70 Ibid, pp. 27-28.
71 Grown, Caren, Geeta Rao Gupta and AshlihanKes, Taking Action, op. cit., p. 48.
72 Ibid.
73 United Nations, Commission on the Status ofWomen, Report on the forty-ninth session, op. cit., pp. 24-27.
74 United Nations Development Fund for Women,Gender Budget Initiatives, UNIFEM (New York),Commonwealth Secretariat (London), andInternational Development Research Centre(Ottawa), p. 1, <www.idrc.ca/gender-budgets/ev-66716-201-1-DO_TOPIC.html>.
CHAPTER 3 PANELS
Do girls risk missing out on school when
women work?
Information derived from:
Assaad, Ragui, Deborah Levison and Nadia Zibani,‘The Effect of Child Work on School Enrollment inEgypt’, Humphrey Institute of Public Affairs,University of Minnesota, Minneapolis, 2001 rev., p. 23.
Baidya, Bal Gopal, Madhup Dhungan and RojeeKattel, ‘The Linkages Between Women’sEmployment, Family Welfare and Child Labour inNepal’, GENPROM Working Paper No. 12,International Labour Office/International LabourOrganization, Geneva, 2002, p. 1.
Ilhai, Nadeem, ‘Children’s Work and Schooling:Does gender matter? Evidence from Peru LSMSPanel Data’, World Bank Policy Research WorkingPaper No. 2745, World Bank, Washington, D.C.,2001, p. 4.
International Labour Organization, ‘National Reportfor Promoting the Linkages Between Women’sEmployment and the Reduction of Child Labour’,Gender Promotion Programme, International LabourOrganization Area Office, Dar es Salaam, 2001,p. 101.
Kamerman, Sheila B., ‘Early Childhood Care andEducation and Other Family Policies and Programsin South-East Asia’, Early Childhood and FamilyPolicy Series, No.4, United Nations Educational,Cultural and Scientific Organization, Paris, 2002, p. 23.
The impact of family-friendly workplaces in
industrialized countries
Information derived from:
Appelbaum, Eileen et al., Shared Work, ValuedCare, op. cit., pp. 28-29.
Datta Gupta, Nabanita, Nina Smith, and MetteVerner, ‘Childcare and Parental Leave in the Nordiccountries: A model to aspire to?’, IZA, Institute forthe Study of Labor, IZA Discussion Paper No. 2014,Bonn, March 2006, Introduction; and United NationsPopulation Fund, The State of the World’sPopulation, UNFPA, New York, 2005, p. 15.
Dean, Hartley, ‘Business versus Families: Whoseside is New Labour on?’, Social Policy and Society,vol. 1, no. 1, Cambridge University Press, 2002, pp. 7-8.
Gauthier, Anne H., ‘’Trends in Policies for Family-Friendly Societies’, in Miroslav Macura, AlphoneseL. MacDonald and Werner Haug, eds., The NewDemographic Regime: Population, challenges andpolicy responses, United Nations, New York andGeneva, 2005, pp. 98 and 107.
Henry, Collen, Misha Werschkul and Manita C. Rao,‘Child Care Subsidies Promote Mothers’Employment and Children’s Development’, IWPRPublication # G714, Institute for Women’s PolicyResearch, Washington, D.C., October 2003, p. 1.
Organisation for Economic Co-operation andDevelopment, ‘Babies and Bosses: Reconcilingwork and family life, Volume 1, Australia, Denmarkand the Netherlands’, OECD, Paris, 2002, pp. 182-184 and 191-193.
Organisation for Economic Co-operation andDevelopment, ‘Babies and Bosses: Reconcilingwork and family life, Volume 4, Canada, Finland,Sweden and the United Kingdom’, OECD, Paris,2002, p. 28.
Peus, Claudia, ‘Work-Family Balance? The case ofGermany’, Working Paper WPC#0025, MITWorkplace Center, Sloan School of Management,Cambridge, Massachusetts, 2006.
Study of Work and Family Life commissioned byNovartis together with the Federation of MigrosCooperatives, the Raiffeisen Group, the Swiss PostOffice and the Swiss Federal Department ofEconomic Affairs. ETH Zürich. Nestlé Switzerlandand Victorinox also took part in the study.
Child labour: Are girls affected differently from
boys?
Information derived from:
Various publication of the International LabourOrganization, Geneva (years and page numberscited only for ease of reference): Child domesticlabour in Southeast and East Asia: Emerging goodpractices to combat it, 2006, p. 18. Every ChildCounts, 2002, p. 25. Promotion of Gender Equalityin Action Against Child Labour and Trafficking: Apractical guide for organizations, May 2003, pp. 15and 17. Gender, Education and Child Labour inEgypt, 2004, p. 9-10. Gender, Education and ChildLabour in Turkey, 2004, p. 112-113. Global ChildLabour Data Review: A gender perspective, 2004,pp. 7 and 157-158. Helping Hands or ShackledLives?, 2004, pp. ii, 2, 20, 22 and 37.
United Nations Children’s Fund, Child DomesticWork, UNICEF Innocenti Research Centre,Florence, 1999, p. 4.
CHAPTER 41 UNICEF calculations based on data from the
Inter-Parliamentary Union database,<www.ipu.org/wmn-e/world.htm>, accessed July2006.
2 Beaman, Lori, et al., ‘Women Politicians, GenderBias, and Policy-making in Rural India’, back-ground paper written for The State of the World’sChildren 2007, UNICEF, 2006, pp. 4 and 5.
3 See, for example, Susan J. Carroll, ed., TheImpact of Women in Public Office, IndianaUniversity Press, Bloomington, Indiana, 2001.
4 See, for example, Jones, Mark P., ‘LegislatorGender and Legislator Policy Priorities in theArgentine Chamber of Deputies and the UnitedStates House of Representatives’, Policy StudiesJournal, vol. 5, no.4, 1997, p. 615. See also Mala Htun, ‘Women in Political Power in LatinAmerica’, International IDEA, Women inParliament, International Idea, Stockholm, 2002, p. 9.
5 Jones, Mark P., ‘Legislator Gender and LegislatorPolicy Priorities in the Argentine Chamber ofDeputies and the United States House ofRepresentatives’, op. cit., p. 618.
6 Ibid., p. 621.
7 Schwindt-Bayer, Leslie, ‘Female Legislators andthe Promotion of Women, Children, and FamilyPolicies in Latin America’, background paper writ-ten for The State of the World’s Children 2007,UNICEF, New York, 2006, pp. 15.
8 Ibid., p. 14.
9 Grey, Sandra, ‘Women and Parliamentary Politics: Does Size Matter? Critical Mass andWomen MPs in the New Zealand House ofRepresentatives’, Political Science Program,Research School of Social Sciences, AustralianNational University, paper for the 51st PoliticalStudies Association Conference, Manchester, UK, 10-12 April 2001, pp. 5-6.
10 Childs, Sarah, Joni Lovenduski and RosieCampbell, Women at the Top 2005: Changingnumbers, changing politics?, Hansard Society,London, 2005, p. 56.
11 Karam, Azza, and Joni Lovenduski, ‘Women inParliament: Making a difference’, Chapter 5 inJulie Ballington and Azza Karam, eds., Women inParliament: Beyond numbers, A Revised Edition,International Institute for Democracy andElectoral Assistance, Stockholm, 2005, p. 194.For the inclusion of Rwanda, see ElizabethPowley, ‘Rwanda: The impact of women legisla-tors on policy outcomes affecting children andfamilies,’ background paper written for The Stateof the World’s Children 2007, UNICEF, New York,2006, p. 5.
12 Shevchenko, Iulia, ‘Who Cares about Women’sProblems? Female legislators in the 1995 and1999 Russian State Dumas’, Europe-Asia Studies,vol. 54, no. 8, 1 December 2002, p. 1208.
R E F E R E N C E S 93
13 Powley, Elizabeth, ‘Rwanda: The Impact ofWomen Legislators on Policy OutcomesAffecting Children and Families’, op. cit., pp. 10-11 and 15.
14 Vetten, Lisa, ‘Addressing Domestic Violence inSouth Africa: Reflections on strategy and prac-tice’, expert paper prepared for the Expert GroupMeeting on ‘Violence against Women: Good practices in combating and eliminating violenceagainst women’, United Nations Division for theAdvancement of Women, Vienna, 2005, pp. 3-4.
15 Stéphane Oertel, Governance Profile of Namibia:Measuring and monitoring progress towardsgood governance in Africa, United NationsEconomic Commission for Africa, Addis Ababa,September 2004, p. 4. Government of Namibia,‘Government Gazette of the Republic of Namibia,Government Notice, No. 126, Promulgation ofAct of Parliament’, Windhoek, 24 June 2003.
16 Schwindt-Bayer, Leslie, ‘Female Legislators andthe Promotion of Women, Children, and FamilyPolicies in Latin America’, op. cit., p. 10.
17 ‘Gender-Sensitizing Commonwealth Parliaments:The report of a Commonwealth ParliamentaryAssociation study group’, CommonwealthParliamentary Association Secretariat, London,2001, <www.cpahq.org/uploadstore/docs/gendersensitizingcwparliaments.pdf>, accessedSeptember 2006.
18 Wangnerud, Lena, ‘Case Study: Sweden: A step-wise development’ in Women in Parliament, op. cit., p. 246
19 Karam, Azza, and Joni Lovenduski, ‘Women inParliament: Making a difference’, op. cit., p. 198.
20 Data drawn from the Inter-Parliamentary Uniondatabase, ‘Women in National Parliaments’,<www.ipu.org/wmn-e/classif.htm>, accessedJuly 2006.
21 Data drawn from the Inter-Parliamentary Unionposter ‘Women in Politics, 2005’, <www.ipu.org/pdf/publications/wmnmap05_en.pdf>, accessedJuly 2006.
22 Derived from websites of national governmentsand from Inter-Parliamentary Union, ‘Women inPolitics: 60 years in retrospect’, IPU, Geneva,February 2006, Data Sheet No. 4. Note: Thecountries cited as examples of women Heads ofState and Government in 2006 includes theGovernment of the Netherlands Antilles, which isan autonomous country within the Netherlands.Queens and Governor-Generals are not includedin the figure cited.
23 Derived from websites of national governmentsand from the Inter-Parliamentary Union poster‘Women in Politics, 2005’, op. cit.
24 Budlender, Debbie, and Guy Hewittt, GenderBudgets Make More Cents: Country studies andgood practice, The Commonwealth Secretariat,London, August 2002, p. 11.
25 Weldon, S. Laurel, Protest, Policy, and theProblem of Violence Against Women: A cross-national comparison, University of PittsburghPress, Pittsburgh, 2002, pp. 19, 23, 88 and 103.
26 Matland, Richard E., ‘Enhancing Women’sPolitical Participation: Legislative recruitment and
electoral systems’, in Women in Parliament:Beyond numbers, A Revised Edition, Chapter 3,International Institute for Democracy andElectoral Assistance, Stockholm, 2005, pp. 96.
27 Bratton, Kathleen A., and Leonard P. Ray,‘Descriptive Representation, Policy Outcomes,and Municipal Day-Care Coverage in Norway’,American Journal of Political Science, vol. 46, no. 2, April 2002, p. 435.
28 Davis, Matthew M., and Amy M. Upston, ‘StateLegislator Gender and Other CharacteristicsAssociated With Sponsorship of Child HealthBills’, Ambulatory Pediatrics, vol. 4, no. 4, July-August 2004, pp. 295-302.
29 Caiazza, Amy, ‘Does Women’s Representation inElected Office Lead to Women-Friendly Policy?,Institute for Women’s Policy Research,Washington, D.C., May 2002, pp. 2, 4.
30 Chattopadhyay, Raghabendra, and Esther Duflo,‘Women as Policy Makers: Evidence from a randomized policy experiment in India’,Econometrica, vol. 72, no. 5, September 2004, pp. 1409-1443.
31 Beaman, Lori, et al., ‘Women Politicians, GenderBias, and Policy-making in Rural India’, op. cit.,pp. 11, 15 and 16.
32 Mbatha, Likhapha, ‘Democratising LocalGovernment: Problems and opportunities in theadvancement of gender equality in South Africa’,in Anne Marie Goetz and Shireen Hassim, eds.,No Shortcuts to Power: African women in politicsand policy making, Chapter 7, Zed Books, Londonand New York, 2003, pp. 196 and 201.
33 Drage, Jean, ‘Women in Local Government inAsia and the Pacific: A comparative analysis ofthirteen countries’, (based on country reports prepared for the United Nations Economic andSocial Commission for Asia and the Pacific, andLOGOTRI (Network of Local Government Trainingand Research Institutes in Asia and the Pacific)prior to the Asia-Pacific Summit of WomenMayors and Councilors, Thailand, 19-22 June2001), Victoria University of Wellington, NewZealand, 2001, p. 22.
34 Ibid.
35 United Cities and Local Governments, Statistics,World, <www.cities-localgovernments.org/uclg/index.asp?pag=wldmstatistics.asp&type=&L=EN&pon=1>.
36 Chattopadhyay, Raghabendra, and Esther Duflo,‘Women as Policy Makers’, op. cit, p. 1427.
37 International Crisis Group, ‘Beyond Victimhood:Women’s Peacebuilding in Sudan, Congo andUganda’, Africa Report No. 112, InternationalCrisis Group, 28 June 2006, p. i.
38 Chinkin, Christine, Peace Agreements as aMeans for Promoting Gender Equality andEnsuring the Participation of Women,EGM/PEACE/2003/BP.1, Division for theAdvancement of Women, United Nations, New York, 31 October 2003, p. 1.
39 Ibid., p. 2.
40 Francesc, Maria Cañadas, et al., ‘Alert 2005:Report on conflicts, human rights and peace-
building’, School for Peace Culture , Bellaterra,Spain, January 2005, p. 124.
41 Interview with Donald Steinberg, Vice Presidentfor Multilateral Affairs, International Crisis Group,and former United States Ambassador to Angola.Steinberg and The State of the World’s Children2007 research and editorial team discussed thepeace process in Angola on 12 June 2006.
42 Anderlini, Sanam Naraghi, ‘Women at the PeaceTable: Making a difference’, United NationsDevelopment Fund for Women, New York, 2000,p. 17.
43 Rhen, Elisabeth, and Ellen Johnson Sirleaf,Women, War and Peace: The IndependentExperts’ assessment on the impact of armedconflict on women and women’s role in peace-building, United Nations Development Fund forWomen, New York, 2002, p. 79.
For a more detailed discussion of women’s rolein the peace process in Northern Ireland, seeFionnuala Ni Aoláin, ‘Peace Agreements asMeans for Promoting Gender Equality andEnsuring the Participation of Women’, NorthernIreland Case Study, EGM/PEACE/2003/EP.4, written for United Nations Division for theAdvancement of Women, Expert Group Meeting,Ottawa, Canada, November 2003.
44 Sultan, Masuda, ‘From Rhetoric to Reality:Afghan women on the agenda for peace’,Women Waging Peace Policy Commission, HuntAlternatives Fund, Cambridge, Massachusetts,February 2005, pp. 6-7.
45 Conaway, Camille Pampell, and Kelly Fish,‘Children’s Security’, Inclusive Security,Sustainable Peace: A toolkit for advocacy andaction, International Alert (London) and WomenWaging Peace (Cambridge, Massachusetts andWashington, D.C.), 2004, p. 59.
46 Quintos-Deles, Teresita, ‘Corridors of Peace inthe Corridors of Power: Bridging spaces forwomen in governance for peace’, presented atthe Sixth Asia Pacific Congress of Women inPolitics and Decision-Making, Makati City,Philippines, 10-12 February 2006, p. 13.
47 Mazurana, Dyan, and Khristopher Carlson, ‘FromCombat to Community: Women and girls ofSierra Leone’, Women Waging Peace,Cambridge, Massachusetts and Washington,D.C., January 2004, p. 16.
48 Anderlini, Sanam Naraghi, ‘Women at the PeaceTable’, op. cit., p. 21.
49 Ibid., p. 20.
50 Rhen, Elisabeth, and Ellen Johnson Sirleaf,Women, War and Peace, op. cit., p. 78.
51 WomenWarPeace.org, <www.womenwarpeace.org/sri_lanka/sri_lanka.htm>, accessed October 2006.
52 Jain, Devaki, Women, Development and the UN:A sixty-year quest for equality and justice, UnitedNations Intellectual History Project, IndianaUniversity Press, Bloomington, Indiana, 2005, p. 71.
53 Camille Conaway and Anne-Marie Goetz, ‘BeyondNumbers: Supporting women’s political participa-tion and promoting gender equality in post-
94 T H E S T A T E O F T H E W O R L D ’ S C H I L D R E N 2 0 0 7
conflict governance in Africa, A review of the roleof the United Nations Development Fund forWomen’, UNIFEM, New York, January 2006, p. 6.
54 Pippa Norris and Donald Ingelhart, ‘CulturalBarriers to Women’s Leadership: A worldwidecomparison’, written for Special Session 16‘Social Cleavages and Elections’, InternationalPolitical Science Association World Congress,Quebec City, Canada, 3 August 2000, p. 8.
55 Powley, Elizabeth, ‘Rwanda: The impact ofwomen legislators on policy outcomes affectingchildren and families’, op. cit., p. 8.
56 Jayal, Niraja Gopal, ‘From Representation toParticipation: Women in local government’,EGM/EPWD/2005/EP.3, written for the ExpertGroup Meeting on Equal Participation of Womenand Men in Decision-Making Processes, withParticular Emphasis on Political Participation andLeadership, United Nations, Addis Ababa,Ethiopia, 24-27 October 2005, p. 8.
57 Drage, Jean, ‘Women in Local Government inAsia and the Pacific, op. cit, p. 44.
58 United Cities and Local Governments, Statistics,World, op. cit.
CHAPTER 4 PANELS
Women and politics: Realities and myths
Information derived from:
Beaman, Lori, et al., ‘Women Politicans, GenderBias and Policy-making in Rural India, op. cit., pp. 5and 16.
Goetz, Anne-Marie Goetz, ‘Political Cleaners: Howwomen are the new anti-corruption force. Does theevidence wash?’, paper prepared for the interna-tional workshop ‘Feminist Fables and GenderMyths: Repositioning gender in development policyand practice’, 2-4 July 2003, Institute ofDevelopment Studies, Sussex, 2003, p. 4.
Goetz, Anne-Marie, “Women’s political effective-ness: A conceptual framework,” in Anne-MarieGoetz and Shireen Hassim, eds., No Shortcuts toPower African Women in politics and policy making,Zed Books, London and New York, 2003, p. 36.
Human Rights Watch, ‘Between Hope and Fear:Intimidation and attacks against women in publiclife in Afghanistan’, Human Rights Watch BriefingPaper, October 2004, p. 29; Inter-ParliamentaryUnion. ‘Politics: Women’s insight’, IPU Survey,Geneva, 2000, pp. 1, 7, 30 and 31.
Inter-Parliamentary Union, ‘Women in Politics’,<www.IPU.org/wmne-e/suffrage.htm>, accessedJuly 2006.
Jones, Mark P., ‘Legislator Gender and LegislatorPolicy Priorities in the Argentine Chamber ofDeputies and the United States House ofRepresentatives’, Policy Studies Journal, vol. 5, no. 4, 1997, pp. 613-629.
Lawless, Jennifer L. and Richard L. Fox, It Takes aCandidate: Why women don’t run for office,Cambridge University Press, New York, 2005, pp. 84-85.
Lawless, Jennifer L. and Richard L. Fox, ‘Why Don’tWomen Run for Office?’, Brown Policy Report,Taubman Center for Public Policy, Brown University,Providence, Rhode Island, January 2004, pp. 1-7.
Poll conducted by Bangkok University and UnitedNations Development Programme, ‘Women’s Rightto a Political Voice in Thailand’, UNDP, New York,2006, p. 18.
Rheingold, Beth, ‘Concepts of Representationamong Female and Male State Legislators’Legislative Studies Quarterly, vol. 17, no. 4,November 1992, pp. 509-537; and Galligan,Yvonne, ‘Public Attitudes towards Women’s PoliticalParticipation in Northern Ireland’, Economic andSocial Research Council Research Report, 2004.
World Values Survey, <www.worldvaluessurvey.org>,accessed July 2006.
Women’s groups: A force for political change
Information derived from:
Afghan Women’s Network, ‘Afghan ParliamentaryElections: Report of Paghman Province’ and‘Women’s Participation in the DemocraticProcesses in Iraq and Afghanistan: Achievementsand challenges’, Position Paper, IndependentWomen’s Forum, Washington, D.C., June 2006.
Powley, Elizabeth, ‘Strengthening Governance: Therole of women in Rwanda’s transition,’ The Initiativefor Inclusive Security, Hunt Alternatives Fund,Women Waging Peace, Washington, D.C., 2003.
Submission to the National Inquiry into Children inImmigration Detention from the University of NewSouth Wales Centre for Refugee Research and theAustralian National Committee on Refugee Women,Human Rights and Equal Opportunity Commission,Government of Australia.
United Nations Children’s Fund, ‘National SituationalAnalysis of Children and Women’, UNICEFMozambique, 2006.
United Nations Development Fund for Women,Progress of Arab Women, UNIFEM Arab RegionalStates Office, Amman, p. 62.
United Nations Development Fund for Women,‘Tajikistan: Women demand law to criminalizedomestic violence’, Voices from the Field, UNIFEM,New York, November 2005, <www.unifem.org/gender_issues/voices_from_the_field/story.php?StoryID=366>.
Women and the Darfur Peace Agreement
Information derived from:
African Union, Report of the Chairperson of theCommission on the Situation in Darfur (the Sudan),African Union Peace and Security Council 45thmeeting, Addis Ababa, 12 January 2006, p. 9.
Darfur Peace Agreement, signed at Abuja, Nigeria,5 May 2006.
International Crisis Group, Beyond Victimhood:Women’s peacebuilding in Sudan, Congo andUganda, ICG, Washington, D.C., pp. 6 and 7.
‘Women’s Priorities in the Peace Process andReconstruction in Darfur’, 7th round of the Inter-Sudanese peace talks on the conflict in Darfur, Abuja(Nigeria), 30 December 2005, <www.peacewomen.org/resources/Sudan/Womens_Priorities.doc>.
Women as mediators and peacekeepers
Information derived from:
For a discussion of children’s vulnerability toexploitation and abuse during delivery of assistance
in Liberia, see Save the Children, ‘From Camp toCommunity: Liberia study on exploitation of chil-dren’, Save the Children, Monrovia, May 2006, p. 11. Also see United Nations, Special Measuresfor Protection from Sexual Exploitation and SexualAbuse, Report of the Secretary General, A/59/782,United Nations, New York, 15 April 2005.
Potter, Antonia, ‘We the Women: Why conflictmediation is not just a job for men’, Opinion, Centerfor Humanitarian Dialogue, Geneva, 2005.
United Nations Department of PeacekeepingOperations, Policy Dialogue to Review Strategiesfor Enhancing Gender Balance among UniformedPersonnel in Peacekeeping Missions, Final Report,United Nations, New York, 28-29 March 2006.
United Nations, A Comprehensive Strategy toEliminate Further Sexual Exploitation and Abuse in United Nations Peacekeeping Operations,A/59/710, United Nations, New York, 24 March2005, pp. 18-19.
CHAPTER 51 In 1945, 3 per cent of members of Parliament in
single or lower houses were women (Inter-Parliamentary Union, ‘Women in Parliaments1945-1995’, Reports and documents No. 23, IPU,Geneva, 1995, p. 28). In 2006, 16.8 per cent ofmembers of Parliament in single or lower houseswere women (‘Women in National Parliaments’,<www.ipu.org/wmn-e/world.htm>, accessedAugust 2006).
2 United Nations Children’s Fund, Progress forChildren: A report card on gender parity and pri-mary education, Number 2, UNICEF, April 2005,p. 2.
3 See, for example, Population Council andInternational Center for Research on Women,‘Involving Young Men in HIV Prevention Programs:Operations research on gender-based approachesin Brazil, Tanzania, and India’, Horizons Report,HIV/AIDS Operations Research, PopulationCouncil, Washington, D.C., December 2004.
4 World Bank, ‘Education and Development’,Education Advisory Service, World Bank,Washington, D.C., <http://siteresources.worldbank.org/EDUCATION/Resources/278200-1099079877269/547664-1099080118171/EducationBrochure.pdf>, accessed September2006.
5 Ibid.
6 Ibid.
R E F E R E N C E S 95
CHAPTER 4 FIGURES
In most countries surveyed, a majority of
the public agrees or strongly agrees that
men make better political leaders than
women
Derived from responses to the question ‘Domen make better political leaders thanwomen?’ For an explanation of the methodol-ogy employed to calculate regional aggregatesof the countries surveys, see technical noteunder References, Figure 1.2.

7 World Bank, ‘Engendering Change in theClassroom’, 11 November 2004, <http://web.worldbank.org/WBSITE/EXTERNAL/TOPICS/EXTEDUCATION/0,,contentMDK:20279910~menuPK:617572~pagePK:148956~piPK:216618~theSitePK:282386,00.html>, accessed 4 October 2006.
8 United Nations Children’s Fund and World Bank,‘Building on what we know and defining sus-tained support’, School Fee Abolition InitiativeWorkshop, organized by UNICEF and the WorldBank, Nairobi, 5-7 April 2006, p. 3.
9 Ibid.
10 United Nations Children’s Fund, The State of theWorld’s Children 2004: Girls’ education and devel-opment, UNICEF, New York, 2003, pp. 23-24.
11 United Nations Children’s Fund and World Bank,‘Building on what we know and defining sus-tained support’, op. cit., p. 3.
12 United Nations Children’s Fund, The State of theWorld’s Children 2004, op. cit., p. 23.
13 World Bank, ‘Engendering Change in theClassroom’, op. cit.
14 Ibid.
15 Ibid.
16 United Nations Millennium Project, Investing inDevelopment: A practical plan to achieve theMillennium Development Goals, Earthscan,London/Sterling, Virginia., 2005, pp. 239-256.
17 Vandemoortele, Jan, and Rathin Roy, ‘MakingSense of MDG Costing’, Bureau for DevelopmentPolicy, New York, August 2004, p. 3.
18 Grown, Caren, et al., ‘The Financial Requirementsof Achieving Gender Equality and Women’sEmpowerment’, The Levy Economics Institute ofBard College Working Paper No. 467, August2006, p. 2.
19 Figures derived from Ibid., p. 17.
20 Ibid., p. 3.
21 Grown, Caren, Geeta Rao Gupta and Aslihan Kes,Taking Action: Achieving gender equality andempowering women, UN Millennium Project,Earthscan, London/Sterling, Virginia, 2005, p. 29.
22 Grown, Caren, et al., ‘The Financial Requirementsof Achieving Gender Equality and Women’sEmpowerment’, op. cit., p. 17.
23 Ibid., p. 21.
24 International Helsinki Federation for HumanRights, Human Rights in the OSCE Region:Europe, Central Asia and North America, Report2006 (Events of 2005), IHF, Vienna, 2006, p. 429.
25 Intergovernmental Authority on Development,‘Declaration of the 4th Regular Meeting of IGADMinisters in Charge of Gender/Women Affairs’,Nairobi, 21-22 February 2006, <www.igad.org/gender/nairobi_gender_decl.htm>, accessed 4October 2006.
26 African Union, ‘Symposium on the AfricanUnion’s Protocol on the Rights of Women inAfrica’, keynote address by H.E. Mrs. Julia DollyJoiner, Commissioner for Political Affairs,
Commission of the African Union, Khartoum, 21January 2006, <www.oxfam.org.uk/what_we_do/issues/panafrica/>, accessed 4 October 2006.
27 United Nations Development Fund for Women,Not a Minute More: Ending violence againstwomen, UNIFEM, New York, pp. 8-15
28 United Nations, Report of the independent expertfor the United Nations study on violence againstchildren, Provisional version, UN A/61/150 andCorr. 1, United Nations, New York, 23 August2005.
29 United Nations Development Fund for Women,Not a minute more, op. cit., p. 39.
30 Ibid., p. 40.
31 United Nations Office for the Coordination ofHumanitarian Affairs/Integrated RegionalInformation Networks, ‘Sexual Violence in Timesof War’, Chapter 13 in Broken Bodies, BrokenDreams: Violence against women exposed,OCHA/IRIN, New York, 2005, pp. 179-205.
32 United Nations, General Assembly, 58th session,Special Measures for Protection from SexualExploitation and Sexual Abuse, Report of theSecretary-General (A/58/777), United Nations,New York, 23 April 2004, para. 3.
33 United Nations, Security Council Resolution 1325,para. 10, adopted by the Security Council at its4213th Meeting, United Nations, New York, 31 October 2000.
34 United Nations Office for the Coordination ofHumanitarian Affairs/Integrated RegionalInformation Networks, ‘Sexual Violence in Timesof War’, op. cit., p. 197.
35 King, Elizabeth M., and Andrew D. Mason,‘Engendering Development Through GenderEquality in Rights, Resources, and Voice’, WorldBank and Oxford University Press, Washington,D.C., January 2001, p. 120.
36 Ibid., pp. 117-122.
37 Inter-Parliamentary Union, ‘Women’s Suffrage’,<www.ipu.org/wmn-e/suffrage.htm>, accessedSeptember 2006.
38 Inter-Parliamentary Union database, ‘Women inNational Parliaments’, <www.ipu.org/wmn-e/world.htm>, accessed September 2006.
39 Ibid.
40 Inter-Parliamentary Union, ‘The Participation ofWomen and Men in Decision-Making: The parlia-mentary dimension’, Data Sheet No. 6 in Womenin Politics: 60 years in retrospect, IPU, Geneva,2006.
41 Inter-Parliamentary Union, ‘Women in Parliaments:World classification’, <www.ipu.org/wmn-e/classsif.htm>; and International Institute forDemocracy and Electoral Assistance andStockholm University, ‘Global Database of Quotas for Women’, <www.quotaproject.org/country.cfm?SortOrder=LastLowerPercentage%20DESC>, accessed 28 September 2006.
42 United Nations Development Fund for Women,‘On the Agenda: Women’s essential role inpeace-building’, UNIFEM 2005 World Summit,2005, UNIFEM, New York, p. 1.
43 Gobodo-Madikizela, Pumla, ‘Women’sContribution to South Africa’s Truth andReconciliation Commission’, Women WagingPeace Policy Commission, Cambridge,Massachusetts and Washington, D.C., February2005, p. 9.
44 Dahlerup, Drude, ‘Quotas are Changing theHistory of Women’, paper presented at theIDEA/EISA/SADC Parliamentary ForumConference, Pretoria, November 2003.
45 McNulty, Stephanie, ‘Women’s OrganizationsDuring and After War: From service delivery topolicy advocacy’, Research and ReferenceServices Project, United States Agency forInternational Development Center forDevelopment Information and Evaluation,Washington, D.C., 2 October 1998, p. 3.
46 Maluccio, John A., Lawrence Haddad and JulianMay, ‘Social capital and gender in South Africa,1993-98’, in Agnes R. Quisumbing, ed.,Household Decisions, Gender, and Development:A synthesis of recent research, International FoodPolicy Research Institute, Washington, D.C.,2003, p. 147.
47 Cowan, Carolyn Pape, et al., ‘Encouraging StrongRelationships Between Fathers and Children’,Working Strategies, vol. 8, no. 4, Summer 2005,p. 2.
48 Engle, Patrice, Tom Beardshaw and Craig Loftin,‘Local and International Policies andProgrammes’, in Linda Richter and RobertMorrell, eds., Baba: Men and fatherhood in SouthAfrica, Human Sciences Research Council, CapeTown, 2006, p. 294.
49 Ibid.
50 United Nations Children’s Fund, Role of Men inthe Lives of Children: A study of how improvingknowledge about men in families helps strength-en programming for children and women,UNICEF, New York, 1997, p. 9.
51 Fathers Direct, ‘Sweden may be leading Europein developing father-friendly policies and practices’,FatherWorld, vol. 3, no. 2, Fathers Direct, London,<www.fathersdirect.com/download.php?pID=2655.3>, accessed 24 April 2006; and Holter, OysteinGullvag, Can Men Do It? Men and Gender Equality:The Nordic experience, Nordic Council of Ministers,Copenhagen, 2003, p. 126 cited in R.W. Connell,‘The Role of Men and Boys in Achieving GenderEquality’, paper prepared for UN Division for theAdvancement of Women, ILO, UNAIDS, UNDPExpert Groups Meeting (21-24 October 2003,Brasilia), 7 October 2003, p. 8.
52 Tonkin, Bernard, ‘Men Reinventing Themselves:Recovery from hegemonic masculinity’, WorkingPaper No. 4, UN International Research andTraining Institute for the Advancement ofWomen, Santo Domingo, 2001, p. 5 and 18,<www.un-instraw.org/en/docs/mensroles/Tonkin.pdf>, accessed 4 October 2006.
53 United Nations, The World’s Women 2005:Progress in statistics, United Nations Division of Economic and Social Affairs, New York, 2006,p. 26.
54 Ibid., p. 71.
96 T H E S T A T E O F T H E W O R L D ’ S C H I L D R E N 2 0 0 7

55 Ibid., p. 44.
56 Ibid., p. 64.
57 Ibid., p. 55.
58 Ibid.
59 Ibid., p. 57.
60 Inter-Parliamentary Union database,<www.ipu.org/wmn-e/classif.htm>.
61 United Cities and Local Government statistics,<www.cities-localgovernments.org/uclg/index.asp?pag=wldmstatistics.asp&type=&L=EN&pon=1>.
CHAPTER 5 PANELS
Partnerships for girls’ education
Information derived from:
Campaign for Female Education,<www.camfed.org>, accessed September 2006.
Forum for African Women Educationalists,<www.fawe.org/content/aboutfawe.html>,accessed September 2006.
Forum for African Women Educationalists, The ABCof Gender Responsive Education Policies:Guidelines for developing Education for All policies,FAWE, Nairobi, 2002.
Global Campaign for Education, <www.campaignforeducation.org>, accessed September 2006
Oxfam, Partnerships for Girls’ Education, Oxfam,Oxford, 2005, pp. 23-38, 49-65 and 131-143.
Swainson, Nicola, and Global Campaign forEducation, A Fair Chance: Attaining gender equalityin basic education by 2005, Global Campaign forEducation, Johannesburg, April 2003, pp. 43-49.
United Nations Girls’ Education Initiative,<www.ungei.org>, accessed September 2006.
Monitoring government’s commitments
to women’s empowerment through
gender-responsive budgets
Information derived from:
Budlender, Debbie, and Guy Hewit, eds., GenderBudgets Make More Cents: Country studies andgood practice, Commonwealth Secretariat, London,pp. 13, 23-42, 84-97 and 117-132.
Kingdom of Morocco, Ministry of Finance andPrivatization, Direction of Studies and FinancialPreview, ‘Gender Report’, translated by Dr. IbrahimMoussabbir, 2006, <www.idrc.ca/gender-budgets/ev-104427-201-1-DO_TOPIC.html>.
Leadbetter, Helen, ‘Gender Budgeting’, inSpectrum: Policy and technical perspective forCIPFA members and students, Issue Number 4,The Charted Institute of Public Finance andAccountancy, London, March 2004, pp. 3-4.
United Nations Development Fund for Women,Gender Budget Initiatives, UNIFEM (New York),Commonwealth Secretariat (London), andInternational Development Research Centre(Ottawa), p. 1, <www.idrc.ca/gender-budgets/ev-66716-201-1-DO_TOPIC.html>; and International
Development Research Centre, ‘Moroccan NationalBudget includes Gender Report’, <www.idrc.ca/gender-budgets/ev-91685-201-1-DO_TOPIC.html>.
Partnering to promote child rights and gender
equality in political agendas
Information derived from:
Inter-Parliamentary Union and United NationsChildren’s Fund, Child Protection: A handbook forparliamentarians, IPU, Geneva, 2004.
Inter-Parliamentary Union and United NationsChildren’s Fund, Combating Child Trafficking: Ahandbook for parliamentarians, IPU/UNICEF, Genevaand New York, March 2005.
Quotas: One size does not fit all
Information derived from:
Dahlerup, Drude, ‘Increasing Women’s PoliticalRepresentation: New trends in gender quotas’, inJulie Ballington and Azza Karam, eds., Women inParliament: Beyond the numbers, A RevisedEdition, International Institute for Democracy andElectoral Assistance, Stockholm, 2005, pp. 141-143.
Dahlerup, Drude, ed., Women, Quotas and Politics,Routledge Research in Comparative Politics Series,Routledge, London/New York, 2006, Introduction.
Women’s participation in community initiatives
around the world
Information derived from:
Amhed, Akhter U., and Carlo del Ninno, ‘Food forEducation in Bangladesh’, in Agnes Quisumbing,ed., Household Decisions, Gender andDevelopment: A synthesis of recent research,International Food Policy Research Institute,Washington D.C., pp. 202-203.
Amhed, Akhter U., ‘Comparing Food and Cash forSchooling in Bangladesh’, in Linking Research andAction: Strengthening food assistance and food poli-cy research, Policy Brief of International Food PolicyResearch Institute and World Food Programme,Washington, D.C., and Rome, 2005.
Asian Development Bank, ‘Gender Activities’,Workshop on Violence against Women forGrassroots Women’s Groups, Centre for Women’sResource Development, <http://209.225.62.100/gender/working/ino002.asp>. Asian DevelopmentBank, ‘Ending Violence Against Women’, ADBReview, February 2004, p. 36.
Hallman, Kelly, et al., ‘Childcare, Mothers’ Work,and Earnings: Findings from the urban slums ofGuatemala City’, Policy Research Division WokingPapers No. 165, Population Council, New York,2002, pp. 25-26.
Information on the Sunday school programme isderived from UNICEF Uzbekistan.
Smith, Lisa C., et al., ‘The Importance of Women’sStatus for Child Nutrition in Developing Countries’,Research Report 131, International Food PolicyResearch Institute, Washington, D.C., 2003, p. 135.
World Bank, ‘Social Safety Nets in Banglandesh: Anassessment’, Bangladesh Development SeriesPaper No. 9, World Bank Office, Dhaka, January2006, pp. 14, 21-22.
Program H: Challenging gender stereotypes and
changing attitudes in Brazil and other countries
Information derived from:
Population Council, ‘Promoting HealthyRelationships and HIV/STI Prevention for YoungMen: Positive findings from an intervention study inBrazil, Horizons Research Update, PopulationCouncil/Horizons, Washington, D.C., April 2004.
Population Council, ‘Reducing HIV Risk Behaviorsamong Key Populations by Increasing CommunityInvolvement and Building Social Capital: Baselinefindings from Andhra Pradesh, India’, HorizonsResearch Update, Population Council/Horizons,New Delhi, April 2006.
Partnering to provide improved estimates of
maternal mortality
Information derived from:
AbouZahr, C., and Tessa Wardlaw, ‘MaternalMortality at the End of the Decade: Sign ofprogress?’, Bulletin of the World Health Organization,vol. 79, no. 6, Geneva, June 2001, pp. 561-573.
World Health Organization, United NationsChildren’s Fund and United Nations PopulationFund, Maternal Mortality in 2000: Estimates devel-oped by WHO, UNICEF and UNFPA, WHO, Geneva,2004, pp. 1-10.
Research commissioned for The State of the
World’s Children 2007
Background papers
Lori Beaman and Rohini Pande, Yale University;Esther Duflo, Jameel Poverty Action Lab,Massachusetts Institute of Technology; and PetiaTopalova, International Monetary Fund, ‘WomenPoliticians, Gender Bias, and Policy-making in RuralIndia’, 2006.
Sylvia Chant, London School of Economics, ‘PovertyBegins at Home? Questioning some (mis)concep-tions about children, poverty and privation infemale-headed households’, 2006.
Elizabeth Powley, Women Waging Peace, ‘Rwanda:The impact of women legislators on policy out-comes affecting children and families’, 2006.
Leslie Schwindt-Bayer, University of Mississippi,‘Female Legislators and the Promotion of Women,Children, and Family Policies in Latin America’,2006.
R E F E R E N C E S 97
Economic and social statistics on the countries and territories of the world, withparticular reference to children’s well-being.
General note on the data........................................................................................page 99
Explanation of symbols........................................................................................page 100
Under-five mortality rankings..............................................................................page 101
Summary indicators..............................................................................................page 136
Measuring human development:
An introduction to Table 10................................................................................page 137
STATISTICAL TABLES
TABLES 1 Basic indicators............................................................................page 102
2 Nutrition ......................................................................................page 106
3 Health ..........................................................................................page 110
4 HIV/AIDS ......................................................................................page 114
5 Education ....................................................................................page 118
6 Demographic indicators ............................................................page 122
7 Economic indicators ..................................................................page 126
8 Women ........................................................................................page 130
9 Child protection ..........................................................................page 134
10 The rate of progress ..................................................................page 138
98 T H E S T A T E O F T H E W O R L D ’ S C H I L D R E N 2 0 0 7

The data presented in the following statistical tables are accompanied by definitions, sources and explanations ofsymbols. Data from the responsible United Nations organiza-tion have been used wherever possible. Where such interna-tionally standardized estimates do not exist, the tables drawon other sources, particularly data received from the appro-priate UNICEF field office. Wherever possible, only compre-hensive or representative national data have been used.More detailed information on methodology and sources ofthe data presented are available at <www.childinfo.org>.
Data quality is likely to be adversely affected for countriesthat have recently suffered from human-caused or naturaldisasters. This is particularly true where basic country in-frastructure has been fragmented or major populationmovements have occurred.
Several of the indicators, such as the data for life ex-pectancy, total fertility rates and crude birth and deathrates, are part of the regular work on estimates and projec-tions undertaken by the United Nations PopulationDivision. These and other internationally produced esti-mates are revised periodically, which explains why somedata will differ from earlier UNICEF publications.
Mortality estimates
Each year, UNICEF includes in The State of the World’sChildren mortality estimates, such as the infant mortalityrate, under-five mortality rate, under-five deaths and, be-ginning this year, neonatal mortality rate, for at least tworeference years. These figures represent the best estimatesavailable at the time the report is produced and are basedon the work of the Interagency Group for MortalityEstimation, which includes UNICEF, the World HealthOrganization, the World Bank and the UN PopulationDivision. This Group updates these estimates every year,undertaking a detailed review of all newly available datapoints. At times, this review will result in adjustments topreviously reported estimates. Therefore, estimates pub-lished in consecutive editions of The State of the World’sChildren may not be comparable and should not be usedfor analyzing mortality trends over time. It is important tonote that comparable under-five mortality estimates for theperiod 1970 to present are available for all countries at<www.childinfo.org>, and that this time series is based onthe most recent estimates produced by the InteragencyGroup for Mortality Estimation.
Revisions
Several statistical tables have been revised this year.
Table 1. Basic Indicators: A new indicator – neonatal mor-tality rate – has been added to the Basic Indicators table.Estimates for this indicator are presented for the year 2000.
Table 3. Health: There are three major changes in thisyear’s child health indicators.
• Improved drinking water and adequate sanitation: Datahave been updated to include the latest estimates fromthe World Health Organization/UNICEF Joint MonitoringProgramme on Water Supply and Sanitation, which nowrefer to the year 2004.
• Immunization: Coverage estimates, specifically for he-patitis B (HepB) and Haemophilus influenzae type b (Hib),are now also presented for countries where these vac-cines have been dispensed in only parts of the country(such as India). In previous reports, no values were pro-vided for countries with only partial coverage from thesevaccines.
• Suspected pneumonia: The term ‘suspected pneumonia’is employed in place of ‘acute respiratory infections(ARI)’, which was used in previous editions. However, thedata collection methodology has not changed, and esti-mates presented in previous reports are comparable tothose in this year’s edition. The change in terminologywas initially proposed and supported at an inter-agencymeeting in 2004.
The term ‘suspected pneumonia’ is a more accurate description of the data collected, as these data refer to children under five with cough and fast or difficult breath-ing, which are the key symptoms of pneumonia. ‘Acuterespiratory infections’ is a more general term and refers to infections of either the upper or lower respiratory tract.Pneumonia is a severe infection of the lungs that accountsfor a significant proportion of the ARI disease burden.
Table 4. HIV/AIDS: Estimates of adults, children andwomen living with HIV have changed due to revisions by the Joint United Nations Programme on HIV/AIDS (UNAIDS) to the estimates of HIV prevalence. These revi-sions are based on better and more precise informationnewly available from countries on the number of infec-tions. UNAIDS also adjusted its reporting on the estimated
General note on the data
STATISTICAL TABLES Economic and social statistics on the countries and territories of the world,with particular reference to children’s well-being.
S T A T I S T I C A L T A B L E S 99

Because the aim of these statistical tables is to provide a broad picture of the situation of children and women worldwide,detailed data qualifications and footnotes are seen as more appropriate for inclusion elsewhere. The following symbols arecommon across all tables; symbols specific to a particular table are included in the table footnotes.
number of adults infected with HIV from 15–49 to 15+. Thiswas done to reflect the increasing number of older adultswho are infected.
The changes in HIV prevalence, and to some extentchanges in adult mortality estimates from the UNPopulation Division, have also affected the estimates of thenumbers of orphans due to AIDS and to all causes. In addi-tion, there have been changes to the organization of Table4 in this year’s report. The columns have been reordered toreflect the priorities of the global campaign Unite forChildren. Unite against AIDS, which focuses on preventionof mother-to-child transmission of HIV, prevention amongyoung people, paediatric HIV, and protection and supportfor children affected by AIDS (the ‘Four Ps’). An additionalindicator was included in the table that reports HIV preva-lence among young people (aged 15–24). Finally, the ‘com-prehensive knowledge of HIV’ indicator was changed toexclude two components previously included.
Multiple Indicator Cluster Surveys (MICS)
UNICEF supports countries in collecting statistically robustand internationally comparable data through the MultipleIndicator Cluster Surveys (MICS). MICS are a major datasource for monitoring important international goals andtargets, such as the Millennium Development Goals, ‘AWorld Fit for Children’ Plan of Action, the UN GeneralAssembly Special Session on HIV/AIDS targets and theAbuja targets for malaria. Around 50 countries conductedMICS in 2005–2006. However, while these surveys wereconducted in 2005-2006, the results were not available intime for inclusion in this edition of The State of the World’sChildren. These data will be included in the next edition,and will also be published at <www.childinfo.org>.
General note on the data (continued)
Explanation of symbols
STATISTICAL TABLES Economic and social statistics on the countries and territories of the world,with particular reference to children’s well-being.
- Data are not available.
x Data refer to years or periods other than those specified in the column heading, differ from the standard definition, orrefer to only part of a country. Such data are not included in the regional averages or totals.
y Data differ from the standard definition or refer to only part of a country but are included in the calculation of regionaland global averages.
* Data refer to the most recent year available during the period specified in the column heading.
‡ Due to the cession in June 2006 of Montenegro from the State Union of Serbia and Montenegro and its subsequent admis-sion to the UN on 28 June 2006, disaggregated data for Montenegro and Serbia as separate States are not yet available.Aggregated data presented are for Serbia and Montenegro pre-cession.
§ Includes territories within each country category or regional group. Countries and territories in each country category or regional group are listed on page 136.
100 T H E S T A T E O F T H E W O R L D ’ S C H I L D R E N 2 0 0 7

Under-5mortality
rate (2005)Value Rank
Sierra Leone 282 1Angola 260 2Afghanistan 257 3Niger 256 4Liberia 235 5Somalia 225 6Mali 218 7Chad 208 8Congo, Democratic Republic of the 205 9Equatorial Guinea 205 9Rwanda 203 11Guinea-Bissau 200 12Côte d’Ivoire 195 13Nigeria 194 14Central African Republic 193 15Burkina Faso 191 16Burundi 190 17Zambia 182 18Ethiopia 164 19Swaziland 160 20Benin 150 21Guinea 150 21Cameroon 149 23Mozambique 145 24Cambodia 143 25Togo 139 26Gambia 137 27Senegal 136 28Uganda 136 28Djibouti 133 30Lesotho 132 31Zimbabwe 132 31Iraq 125 33Malawi 125 33Mauritania 125 33Tanzania, United Republic of 122 36Botswana 120 37Haiti 120 37Kenya 120 37Madagascar 119 40Sao Tome and Principe 118 41Ghana 112 42Congo 108 43Myanmar 105 44Turkmenistan 104 45Yemen 102 46Pakistan 99 47Gabon 91 48Sudan 90 49Azerbaijan 89 50Lao People’s Democratic Republic 79 51Eritrea 78 52Bhutan 75 53India 74 54Nepal 74 54Papua New Guinea 74 54Bangladesh 73 57Kazakhstan 73 57Comoros 71 59Tajikistan 71 59South Africa 68 61Uzbekistan 68 61Kyrgyzstan 67 63Bolivia 65 64Kiribati 65 64
Guyana 63 66Namibia 62 67Timor-Leste 61 68Marshall Islands 58 69Korea, Democratic People’s Republic of 55 70Mongolia 49 71Georgia 45 72Guatemala 43 73Maldives 42 74Micronesia (Federated States of) 42 74Honduras 40 76Morocco 40 76Algeria 39 78Suriname 39 78Tuvalu 38 80Vanuatu 38 80Nicaragua 37 82Indonesia 36 83Iran (Islamic Republic of) 36 83Cape Verde 35 85Brazil 33 86Egypt 33 86Philippines 33 86Dominican Republic 31 89Lebanon 30 90Nauru 30 90Armenia 29 92Samoa 29 92Solomon Islands 29 92Turkey 29 92China 27 96El Salvador 27 96Mexico 27 96Peru 27 96Jordan 26 100Saudi Arabia 26 100Ecuador 25 102Panama 24 103Tonga 24 103Tunisia 24 103Occupied Palestinian Territory 23 106Paraguay 23 106Colombia 21 108Grenada 21 108Qatar 21 108Thailand 21 108Venezuela (Bolivarian Republic of) 21 108Cook Islands 20 113Jamaica 20 113Saint Kitts and Nevis 20 113Saint Vincent and the Grenadines 20 113Libyan Arab Jamahiriya 19 117Romania 19 117Trinidad and Tobago 19 117Viet Nam 19 117Albania 18 121Argentina 18 121Fiji 18 121Russian Federation 18 121Belize 17 125The former Yugoslav Republic of Macedonia 17 125Ukraine 17 125Moldova, Republic of 16 128Bahamas 15 129Bosnia and Herzegovina 15 129
Under-5mortality
rate (2005)Value Rank
Bulgaria 15 129Dominica 15 129Mauritius 15 129Serbia and Montenegro (pre-cession)‡ 15 129Syrian Arab Republic 15 129Uruguay 15 129Saint Lucia 14 137Sri Lanka 14 137Seychelles 13 139Antigua and Barbuda 12 140Barbados 12 140Belarus 12 140Costa Rica 12 140Malaysia 12 140Oman 12 140Bahrain 11 146Kuwait 11 146Latvia 11 146Palau 11 146Chile 10 150Brunei Darussalam 9 151Lithuania 9 151United Arab Emirates 9 151Hungary 8 154Slovakia 8 154Croatia 7 156Cuba 7 156Estonia 7 156Poland 7 156United States 7 156Australia 6 161Canada 6 161Ireland 6 161Israel 6 161Malta 6 161New Zealand 6 161United Kingdom 6 161Austria 5 168Belgium 5 168Cyprus 5 168Denmark 5 168France 5 168Germany 5 168Greece 5 168Korea, Republic of 5 168Luxembourg 5 168Monaco 5 168Netherlands 5 168Portugal 5 168Spain 5 168Switzerland 5 168Czech Republic 4 182Finland 4 182Italy 4 182Japan 4 182Liechtenstein 4 182Norway 4 182Slovenia 4 182Sweden 4 182Andorra 3 190Iceland 3 190San Marino 3 190Singapore 3 190Holy See - -Niue - -
Under-5mortality
rate (2005)Value Rank
Under-five mortality rankingsThe following list ranks countries and territories in descending order of their estimated 2005 under-five mortalityrate (U5MR), a critical indicator of the well-being of children. Countries and territories are listed alphabetically inthe tables that follow.
‡ Due to the cession in June 2006 of Montenegro from the State Union of Serbia and Montenegro, and its subsequent admission to the UN on 28 June 2006, disaggregated data for Montenegroand Serbia as separate States are not yet available. Aggregated data presented are for Serbia and Montenegro pre-cession.
S T A T I S T I C A L T A B L E S 101

Afghanistan 3 260 257 168 165 60 29863 1441 370 250x 47 28 53s - -Albania 121 45 18 37 16 12 3130 53 1 2580 74 99 52s 23 37Algeria 78 69 39 54 34 20 32854 684 27 2730 72 70 97 19 43Andorra 190 - 3 - 3 4 67 1 0 d - - 89 - -Angola 2 260 260 154 154 54 15941 767 199 1350 41 67 58s - -Antigua and Barbuda 140 - 12 - 11 8 81 2 0 10920 - - - - -Argentina 121 29 18 26 15 10 38747 687 12 4470 75 97 99 10 57Armenia 92 54 29 46 26 17 3016 34 1 1470 72 99 94 21 43Australia 161 10 6 8 5 3 20155 250 2 32220 81 - 96 18 41Austria 168 10 5 8 4 3 8189 74 0 36980 79 - - 22 38Azerbaijan 50 105 89 84 74 36 8411 134 12 1240 67 99 91s 28 31Bahamas 129 29 15 22 13 10 323 6 0 14920x 71 - 84 - -Bahrain 146 19 11 15 9 11 727 13 0 10840x 75 87 86s - -Bangladesh 57 149 73 100 54 36 141822 3747 274 470 64 - 84s 22 41Barbados 140 17 12 15 11 8 270 3 0 9270x 76 - 97 - -Belarus 140 19 12 16 10 5 9755 91 1 2760 68 100 90 22 38Belgium 168 10 5 8 4 3 10419 110 1 35700 79 - 99 22 41Belize 125 42 17 34 15 18 270 7 0 3500 72 - 95 - -Benin 21 185 150 111 89 38 8439 348 52 510 55 35 54s 19 45Bhutan 53 166 75 107 65 38 2163 64 5 870 64 - 70s,y - -Bolivia 64 125 65 89 52 27 9182 265 17 1010 65 87 78s 7 63Bosnia and Herzegovina 129 22 15 18 13 11 3907 36 1 2440 74 97 93s 24 36Botswana 37 58 120 45 87 40 1765 45 5 5180 34 81 82 7x 70xBrazil 86 60 33 50 31 15 186405 3726 123 3460 71 89 96s,y 9 62Brunei Darussalam 151 11 9 10 8 4 374 8 0 24100x 77 93 - - -Bulgaria 129 18 15 15 12 8 7726 67 1 3450 73 98 95 22 38Burkina Faso 16 210 191 113 96 36 13228 617 118 400 48 22 32s 18 47Burundi 17 190 190 114 114 41 7548 347 66 100 44 59 47s 15 48Cambodia 25 115 143 80 98 40 14071 429 61 380 57 74 65s 18 48Cameroon 23 139 149 85 87 40 16322 563 84 1010 46 68 79s 15 51Canada 161 8 6 7 5 4 32268 327 2 32600 80 - 99 20 40Cape Verde 85 60 35 45 26 10 507 15 1 1870 71 - 92 - -Central African Republic 15 168 193 102 115 48 4038 150 29 350 39 49 43s 7x 65xChad 8 201 208 120 124 45 9749 471 98 400 44 26 36s - -Chile 150 21 10 18 8 6 16295 249 2 5870 78 96 - 10 62China 96 49 27 38 23 21 1315844 17310 467 1740 72 91 99 14 50Colombia 108 35 21 26 17 14 45600 968 20 2290 73 93 91s 9 63Comoros 59 120 71 88 53 29 798 28 2 640 64 - 31s - -Congo 43 110 108 83 81 32 3999 177 19 950 53 - - - -Congo, Democratic
Republic of the 9 205 205 129 129 47 57549 2873 589 120 44 67 52s - -Cook Islands 113 32 20 26 17 12 18 0 0 - - - 77 - -Costa Rica 140 18 12 16 11 7 4327 79 1 4590 78 95 - 12 55Côte d’Ivoire 13 157 195 103 118 65 18154 665 130 840 46 49 56 14 51Croatia 156 12 7 11 6 5 4551 41 0 8060 75 98 87 21 40Cuba 156 13 7 11 6 4 11269 134 1 1170x 78 100 96 - -Cyprus 168 12 5 10 4 4 835 10 0 17580x 79 97 96 - -Czech Republic 182 13 4 11 3 2 10220 91 0 10710 76 - - 25 36Denmark 168 9 5 8 4 4 5431 62 0 47390 78 - 100 23 36Djibouti 30 175 133 116 88 38 793 27 4 1020 53 - 33 - -Dominica 129 17 15 15 13 7 79 2 0 3790 - - 88 - -Dominican Republic 89 65 31 50 26 19 8895 211 7 2370 68 87 86 12 57Ecuador 102 57 25 43 22 16 13228 295 7 2630 75 91 98 11 58Egypt 86 104 33 76 28 21 74033 1909 63 1250 70 71 83s 21 44El Salvador 96 60 27 47 23 16 6881 166 4 2450 71 - 92 10 56Equatorial Guinea 9 170 205 103 123 40 504 22 5 c 42 87 61s - -Eritrea 52 147 78 88 50 25 4401 170 13 220 55 - 67s - -Estonia 156 16 7 12 6 6 1330 13 0 9100 72 100 94 19 43Ethiopia 19 204 164 131 109 51 77431 3104 509 160 48 - 31s 22 39Fiji 121 22 18 19 16 9 848 19 0 3280 68 - 96 - -Finland 182 7 4 6 3 2 5249 55 0 37460 79 - 99 24 37France 168 9 5 7 4 3 60496 742 4 34810 80 - 99 20 40Gabon 48 92 91 60 60 31 1384 42 4 5010 54 - 94s - -Gambia 27 151 137 103 97 46 1517 52 7 290 57 - 53s 14 53
TABLE 1. BASIC INDICATORS
Under-5mortality
rate
1990 2005
Under-5mortality
rank
Infantmortality
rate(under 1)
1990 2005
Totalpopulation(thousands)
2005
Neonatalmortality
rate2000
Annualno. ofbirths
(thousands)2005
Annualno. of
under-5 deaths
(thousands)2005
GNIper capita
(US$)2005
Lifeexpectancy
at birth(years)
2005
Totaladult
literacyrate
2000-2004*
Net primaryschool
enrolment/attendance
(%)2000-2005*
% shareof household
income1994-2004*
lowest highest40% 20%
Countries andterritories
102 T H E S T A T E O F T H E W O R L D ’ S C H I L D R E N 2 0 0 7

…TABLE 1
Georgia 72 47 45 43 41 25 4474 49 2 1350 71 - 93 16 46Germany 168 9 5 7 4 3 82689 679 3 34580 79 - - 22 37Ghana 42 122 112 75 68 27 22113 683 76 450 57 58 65 16 47Greece 168 11 5 10 4 4 11120 101 1 19670 78 96 99 19 42Grenada 108 37 21 30 17 13 103 2 0 3920 - - 84 - -Guatemala 73 82 43 60 32 19 12599 437 19 2400 68 69 93 10 60Guinea 21 240 150 145 98 48 9402 387 58 370 54 29 57s 17 47Guinea-Bissau 12 253 200 153 124 48 1586 79 16 180 45 - 39s 14x 53xGuyana 66 88 63 64 47 25 751 15 1 1010 64 - 97s - -Haiti 37 150 120 102 84 34 8528 255 31 450 52 - 55s 9 63Holy See - - - - - - 1 0 - - - - - - -Honduras 76 59 40 44 31 18 7205 206 8 1190 68 80 91 11 58Hungary 154 17 8 15 7 6 10098 94 1 10030 73 - 89 23 37Iceland 190 7 3 6 2 2 295 4 0 46320 81 - 99 - -India 54 123 74 84 56 43 1103371 25926 1919 720 64 61 76s 21 43Indonesia 83 91 36 60 28 18 222781 4495 162 1280 68 90 94 20 43Iran (Islamic Republic of) 83 72 36 54 31 22 69515 1348 49 2770 71 77 89 15 50Iraq 33 50 125 40 102 63 28807 978 122 2170x 60 74 78s - -Ireland 161 10 6 8 5 4 4148 64 0 40150 78 - 96 20 42Israel 161 12 6 10 5 4 6725 134 1 18620 80 97 98 16 45Italy 182 9 4 9 4 3 58093 528 2 30010 80 98 99 19 42Jamaica 113 20 20 17 17 10 2651 52 1 3400 71 80 91 17 46Japan 182 6 4 5 3 2 128085 1162 5 38980 82 - 100 25x 36xJordan 100 40 26 33 22 17 5703 150 4 2500 72 90 99s 18 46Kazakhstan 57 63 73 53 63 32 14825 237 17 2930 64 100 93 19 42Kenya 37 97 120 64 79 29 34256 1361 163 530 48 74 76 16 49Kiribati 64 88 65 65 48 27 99 2 0 1390 - - 97x - -Korea, Democratic
People’s Republic of 70 55 55 42 42 22 22488 342 19 a 64 - - - -Korea, Republic of 168 9 5 8 5 3 47817 457 2 15830 78 - 99 22 38Kuwait 146 16 11 14 9 6 2687 51 1 16340x 77 93 86 - -Kyrgyzstan 63 80 67 68 58 31 5264 116 8 440 67 99 90 22 39Lao People’s
Democratic Republic 51 163 79 120 62 35 5924 205 16 440 55 69 62s 20 43Latvia 146 18 11 14 9 7 2307 21 0 6760 72 100 - 18 45Lebanon 90 37 30 32 27 20 3577 66 2 6180 72 - 93 - -Lesotho 31 101 132 81 102 28 1795 50 7 960 34 82 65s 6 67Liberia 5 235 235 157 157 66 3283 167 39 130 42 - 66 - -Libyan Arab Jamahiriya 117 41 19 35 18 11 5853 136 3 5530 74 - - - -Liechtenstein 182 10 4 9 3 - 35 0 0 d - - 88 - -Lithuania 151 13 9 10 7 5 3431 31 0 7050 73 100 89 18 43Luxembourg 168 10 5 7 4 4 465 6 0 65630 79 - 91 - -Madagascar 40 168 119 103 74 33 18606 712 85 290 56 71 76s 13 54Malawi 33 221 125 131 79 40 12884 555 69 160 40 64 82s,y 13 56Malaysia 140 22 12 16 10 5 25347 547 7 4960 74 89 93 13 54Maldives 74 111 42 79 33 37 329 10 0 2390 67 96 90 - -Mali 7 250 218 140 120 55 13518 661 144 380 48 19 39s 13 56Malta 161 11 6 9 5 5 402 4 0 13590 79 88 94 - -Marshall Islands 69 92 58 63 51 26 62 2 0 2930 - - 90 - -Mauritania 33 133 125 85 78 70 3069 126 16 560 53 51 44s 17 46Mauritius 129 23 15 21 13 12 1245 20 0 5260 73 84 95 - -Mexico 96 46 27 37 22 15 107029 2172 59 7310 76 91 98 13 55Micronesia (Federated States of) 74 58 42 45 34 12 110 3 0 2300 68 - - - -
Moldova, Republic of 128 35 16 29 14 16 4206 43 1 880 69 98 86 20 41Monaco 168 9 5 7 4 3 35 0 0 d - - - - -Mongolia 71 108 49 78 39 26 2646 58 3 690 65 98 84 16 51Montenegro‡ - - - - - - - - - - - - - - -Morocco 76 89 40 69 36 21 31478 717 29 1730 70 52 86 17 47Mozambique 24 235 145 158 100 48 19792 773 112 310 42 - 60s 17 47Myanmar 44 130 105 91 75 40 50519 976 102 220x 61 90 84s - -Namibia 67 86 62 60 46 25 2031 56 3 2990 46 85 74 4x 79xNauru 90 - 30 - 25 14 14 0 0 - - - - - -Nepal 54 145 74 100 56 40 27133 787 58 270 62 49 78 15 55
Under-5mortality
rate
1990 2005
Under-5mortality
rank
Infantmortality
rate(under 1)
1990 2005
Totalpopulation(thousands)
2005
Neonatalmortality
rate2000
Annualno. ofbirths
(thousands)2005
Annualno. of
under-5 deaths
(thousands)2005
GNIper capita
(US$)2005
Lifeexpectancy
at birth(years)
2005
Totaladult
literacyrate
2000-2004*
Net primaryschool
enrolment/attendance
(%)2000-2005*
% shareof household
income1994-2004*
lowest highest40% 20%
S T A T I S T I C A L T A B L E S 103

TABLE 1. BASIC INDICATORS
Netherlands 168 9 5 7 4 4 16299 187 1 36620 79 77 99 21 39New Zealand 161 11 6 8 5 4 4028 54 0 25960 79 - 99 18 44Nicaragua 82 68 37 52 30 18 5487 154 6 910 70 - 80s 15 49Niger 4 320 256 191 150 43 13957 750 192 240 45 29 30s 10 53Nigeria 14 230 194 120 100 53 131530 5377 1043 560 44 - 60 15 49Niue - - - - - 13 1 0 - - - - 99x - -Norway 182 9 4 7 3 3 4620 54 0 59590 80 - 99 24 37Occupied Palestinian
Territory 106 40 23 34 21 - 3702 138 3 1110x 73 92 92s,y - -Oman 140 32 12 25 10 6 2567 64 1 7830x 75 81 78 - -Pakistan 47 130 99 100 79 57 157935 4773 473 690 64 50 56s 22 40Palau 146 21 11 18 10 14 20 0 0 7630 - - 96 - -Panama 103 34 24 27 19 11 3232 70 2 4630 75 92 98 9 60Papua New Guinea 54 94 74 69 55 32 5887 174 13 660 56 57 - 12 57Paraguay 106 41 23 33 20 16 6158 177 4 1280 71 - 96s 9 61Peru 96 78 27 58 23 16 27968 628 17 2610 71 88 97 10 59Philippines 86 62 33 41 25 15 83054 2018 67 1300 71 93 88s 14 52Poland 156 18 7 19 6 6 38530 365 3 7110 75 - 97 19 42Portugal 168 14 5 11 4 3 10495 111 1 16170 78 - 99 17 46Qatar 108 26 21 21 18 5 813 14 0 12000x 73 89 95 - -Romania 117 31 19 27 16 9 21711 211 4 3830 72 97 92 21 39Russian Federation 121 27 18 21 14 9 143202 1540 28 4460 65 99 91 17 47Rwanda 11 173 203 103 118 45 9038 375 76 230 44 65 73 23x 39xSaint Kitts and Nevis 113 36 20 30 18 12 43 1 0 8210 - - 94 - -Saint Lucia 137 21 14 20 12 10 161 3 0 4800 73 - 98 - -Saint Vincent and the Grenadines 113 25 20 22 17 11 119 2 0 3590 71 - 94 - -
Samoa 92 50 29 40 24 13 185 5 0 2090 71 - 90 - -San Marino 190 14 3 13 3 2 28 0 0 d - - - - -Sao Tome and Principe 41 118 118 75 75 38 157 5 1 390 63 - 84s - -Saudi Arabia 100 44 26 35 21 12 24573 671 17 11770 72 79 59 - -Senegal 28 148 136 90 77 31 11658 423 58 710 56 39 66 17 48Serbia‡ - - - - - - - - - - - - - - -Seychelles 139 19 13 17 12 9 81 3 0 8290 - 92 96 - -Sierra Leone 1 302 282 175 165 56 5525 252 71 220 41 35 41s 3x 63xSingapore 190 9 3 7 3 1 4326 39 0 27490 79 93 - 14 49Slovakia 154 14 8 12 7 5 5401 51 0 7950 74 - - 24 35Slovenia 182 10 4 8 3 4 1967 17 0 17350 77 - 98 23 36Solomon Islands 92 38 29 31 24 12 478 15 0 590 63 - 80 - -Somalia 6 225 225 133 133 49 8228 366 82 130x 47 - 12s - -South Africa 61 60 68 45 55 21 47432 1082 74 4960 46 82 89 10 62Spain 168 9 5 8 4 3 43064 454 2 25360 80 - 99 19 42Sri Lanka 137 32 14 26 12 11 20743 329 5 1160 74 91 99 21 42Sudan 49 120 90 74 62 29 36233 1166 105 640 57 61 58s - -Suriname 78 48 39 35 30 18 449 9 0 2540 70 90 92 - -Swaziland 20 110 160 78 110 38 1032 29 5 2280 30 80 77 9 64Sweden 182 7 4 6 3 2 9041 96 0 41060 80 - 99 23 37Switzerland 168 9 5 7 4 3 7252 67 0 54930 81 - 94 20 41Syrian Arab Republic 129 39 15 31 14 9 19043 532 8 1380 74 80 95 - -Tajikistan 59 115 71 91 59 38 6507 185 13 330 64 99 89s 20 41Tanzania, United Republic of 36 161 122 102 76 43 38329 1408 172 340 46 69 73s 19 42Thailand 108 37 21 31 18 13 64233 1009 21 2750 71 93 - 16 49The former Yugoslav Republic of Macedonia 125 38 17 33 15 9 2034 23 0 2830 74 96 92 17 46
Timor-Leste 68 177 61 133 52 40 947 49 3 750 56 - 75s,y - -Togo 26 152 139 88 78 40 6145 236 33 350 55 53 70s - -Tonga 103 32 24 26 20 10 102 2 0 2190 73 99 91x - -Trinidad and Tobago 117 33 19 28 17 13 1305 19 0 10440 70 - 92 16x 46xTunisia 103 52 24 41 20 14 10102 166 4 2890 74 74 97 16 47Turkey 92 82 29 67 26 22 73193 1500 44 4710 69 87 89 15 50Turkmenistan 45 97 104 80 81 35 4833 108 11 1340x 63 99 76s 16 48Tuvalu 80 54 38 42 31 22 10 0 0 - - - - - -Uganda 28 160 136 93 79 32 28816 1468 200 280 49 67 87s 16 50Ukraine 125 26 17 19 13 9 46481 392 7 1520 66 99 82 23 38
Under-5mortality
rate
1990 2005
Under-5mortality
rank
Infantmortality
rate(under 1)
1990 2005
Totalpopulation(thousands)
2005
Neonatalmortality
rate2000
Annualno. ofbirths
(thousands)2005
Annualno. of
under-5 deaths
(thousands)2005
GNIper capita
(US$)2005
Lifeexpectancy
at birth(years)
2005
Totaladult
literacyrate
2000-2004*
Net primaryschool
enrolment/attendance
(%)2000-2005*
% shareof household
income1994-2004*
lowest highest40% 20%
104 T H E S T A T E O F T H E W O R L D ’ S C H I L D R E N 2 0 0 7

United Arab Emirates 151 15 9 13 8 5 4496 69 1 18060x 79 - 71 - -United Kingdom 161 10 6 8 5 4 59668 659 4 37600 79 - 99 18 44United States 156 12 7 9 6 5 298213 4165 29 43740 78 - 92 16 46Uruguay 129 23 15 21 14 7 3463 57 1 4360 76 - - 14 51Uzbekistan 61 79 68 65 57 27 26593 615 42 510 67 - 95s 23 36Vanuatu 80 62 38 48 31 19 211 6 0 1600 69 74 94 - -Venezuela (Bolivarian Republic of) 108 33 21 27 18 12 26749 593 12 4810 73 93 92 14 49
Viet Nam 117 53 19 38 16 15 84238 1648 31 620 71 90 94 19 45Yemen 46 139 102 98 76 37 20975 845 86 600 62 - 75 20 41Zambia 18 180 182 101 102 40 11668 472 86 490 38 68 57s 16 49Zimbabwe 31 80 132 53 81 33 13010 384 51 340 37 - 82 13 56
…TABLE 1
NOTES - Data not available.s National household survey data.x Data refer to years or periods other than those specified in the column heading, differ from the
standard definition, or refer to only part of a country.y Data differ from the standard definition or refer to only part of a country, but are included in the
calculation of regional and global averages.* Data refer to the most recent year available during the period specified in the column heading.
SUMMARY INDICATORSSub-Saharan Africa 188 169 112 101 44 713457 28715 4853 764 46 62 61 11 59
Eastern and Southern Africa 166 146 104 93 40 356126 13575 1982 1043 46 73 66 10 61West and Central Africa 209 190 119 108 48 357331 15140 2877 491 46 49 56 14 51
Middle East and North Africa 81 54 59 43 26 378532 9743 526 2627 69 72 80 16 47South Asia 129 84 89 63 44 1483358 37077 3114 691 64 59 74 22 41East Asia and Pacific 58 33 43 26 20 1952656 29820 984 2092 71 91 96 17 48Latin America and Caribbean 54 31 43 26 15 555853 11651 361 4078 72 90 94 13 53CEE/CIS 53 35 43 29 18 404322 5595 196 3433 67 97 90 22 39Industrialized countries§ 10 6 9 5 4 961191 10848 65 35410 79 - 96 21 40Developing countries§ 105 83 71 57 33 5238533 120128 9971 1801 65 79 81 17 48Least developed countries§ 182 153 115 97 43 759389 28258 4323 383 53 60 62 11 57World 95 76 65 52 30 6449371 133449 10142 7002 68 80 82 20 42
‡ Due to the cession in June 2006 of Montenegro from the State Union of Serbia and Montenegro, and its subsequent admission to the UN on 28 June 2006, disaggregated data for Montenegroand Serbia as separate States are not yet available. Aggregated data presented are for Serbia and Montenegro pre-cession (see Memorandum item).
§ Also includes territories within each country category or regional group. Countries and territories in each country category or regional group are listed on page 136.
a: Range low income ($875 or less).b: Range lower-middle income ($876 to $3,465).c: Range upper-middle income ($3,466 to $10,725).d: Range high income ($10,726 or more).
MAIN DATA SOURCES
Under-five and infant mortality rates – UNICEF, World Health Organization, United NationsPopulation Division and United Nations Statistics Division.
Neonatal mortality rate – World Health Organization using vital registration systems andhousehold surveys.
Total population – United Nations Population Division.
Births – United Nations Population Division.
Under-five deaths – UNICEF.
GNI per capita – World Bank.
Life expectancy – United Nations Population Division.
Adult literacy – United Nations Educational, Scientific and Cultural Organization (UNESCO) andUNESCO Institute for Statistics (UIS), including the Education for All 2000 Assessment.
School enrolment/attendance – UIS, Multiple Indicator Cluster Surveys (MICS) and Demographicand Health Surveys (DHS).
Household income – World Bank.
DEFINITIONS OF THE INDICATORS
Under-five mortality rate – Probability of dying between birth and exactly five years of ageexpressed per 1,000 live births.
Infant mortality rate – Probability of dying between birth and exactly one year of age expressedper 1,000 live births.
Neonatal mortality rate – Probability of dying during the first 28 completed days of life expressedper 1,000 live births.
GNI per capita – Gross national income (GNI) is the sum of value added by all resident producers,plus any product taxes (less subsidies) not included in the valuation of output, plus net receipts ofprimary income (compensation of employees and property income) from abroad. GNI per capita isgross national income divided by midyear population. GNI per capita in US dollars is convertedusing the World Bank Atlas method.
Life expectancy at birth – The number of years newborn children would live if subject to themortality risks prevailing for their cross section of the population at the time of their birth.
Adult literacy rate – Percentage of the population aged 15 and older who can read and write.Net primary school enrolment/attendance ratios – Derived from net primary school enrolment
rates as reported by UNESCO Institute for Statistics and from national household survey reports ofattendance at primary school or higher. The net primary school attendance ratio is defined as thepercentage of children in the age group that officially corresponds to primary schooling eligibilitywho attend primary school or higher.
Income share – Percentage of income received by the 20 per cent of households with the highestincome and by the 40 per cent of households with the lowest income.
Under-5mortality
rate
1990 2005
Under-5mortality
rank
Infantmortality
rate(under 1)
1990 2005
Totalpopulation(thousands)
2005
Neonatalmortality
rate2000
Annualno. ofbirths
(thousands)2005
Annualno. of
under-5 deaths
(thousands)2005
GNIper capita
(US$)2005
Lifeexpectancy
at birth(years)
2005
Totaladult
literacyrate
2000-2004*
Net primaryschool
enrolment/attendance
(%)2000-2005*
% shareof household
income1994-2004*
lowest highest40% 20%
MEMORANDUMSerbia and Montenegro
(pre-cession) 129 28 15 24 12 9 10503 121 2 3280 74 96 96 - -
S T A T I S T I C A L T A B L E S 105

TABLE 2. NUTRITION
Afghanistan - - 29 54 39 12 7 54 96t 28Albania 5 6 24 6 14 1 11 34 - 62Algeria 7 13 38 22 10 3 8 19 - 69Andorra - - - - - - - - - -Angola 12 11 77 37 31 8 6 45 77 35Antigua and Barbuda 8 - - - - - - - - -Argentina 8 - - - 4 - 1 4 - 90xArmenia 7 33 57 15 4 0 5 13 - 97Australia 7 - - - - - - - - -Austria 7 - - - - - - - - -Azerbaijan 12 7 39 16 7 1 2 13 14 26Bahamas 7 - - - - - - - - -Bahrain 8 34x,k 65x 41x 9x 2x 5x 10x - -Bangladesh 36 36 69 90 48 13 13 43 83t 70Barbados 11 - - - - - - - - -Belarus 5 - - - - - - - - 55Belgium 8x - - - - - - - - -Belize 6 24k 54 23 - - - - - 90xBenin 16 38 66 62 23 5 8 31 94t 72Bhutan 15 - - - 19 3 3 40 - 95Bolivia 7 54 74 46 8 1 1 27 42 90Bosnia and Herzegovina 4 6 - - 4 1 6 10 - 62Botswana 10 34 57 11 13 2 5 23 62w 66Brazil 8 - 30 17 6 1 2 11 - 88Brunei Darussalam 10 - - - - - - - - -Bulgaria 10 - - - - - - - - 98Burkina Faso 19 19 38 81 38 14 19 39 95t 45Burundi 16 62 46 85 45 13 8 57 94 96Cambodia 11 12 72 59 45 13 15 45 72t 14Cameroon 13 24 79 29 18 4 5 32 81 88Canada 6 - - - - - - - - -Cape Verde 13 57k 64 13 - - - - - 0xCentral African Republic 14 17 77 53 24 6 9 39 79 86Chad 22 2 77 65 37 14 14 41 84t 56Chile 6 63 47 - 1 - 0 1 - 100China 4 51 32 15 8 - - 14 - 93Colombia 9 47 65 32 7 1 1 12 - 92xComoros 25 21 34 45 25 - 8 44 7 82Congo - 19 78 21 15 3 7 26 94 -Congo, Democratic Republic of the 12 24 79 52 31 9 13 38 81t 72Cook Islands 3 19k - - - - - - - -Costa Rica 7 35x,k 47x 12x 5 0 2 6 - 97xCôte d’Ivoire 17 5 73 38 17 5 7 21 60 84Croatia 6 23 - - 1 - 1 1 - 90Cuba 5 41 42 9 4 0 2 5 - 88Cyprus - - - - - - - - - -Czech Republic 7 - - - - - - - - -Denmark 5 - - - - - - - - -Djibouti 16 - - - 27 8 18 23 - -Dominica 11 - - - - - - - - -Dominican Republic 11 10 41 16 5 1 2 9 - 18Ecuador 16 35 70 25 12 - - 26 - 99Egypt 12 38 67 37 6 1 4 18 - 78El Salvador 7 24 76 43 10 1 1 19 - 62Equatorial Guinea 13 24 - - 19 4 7 39 - 33Eritrea 14 52 43 62 40 12 13 38 50 68Estonia 4 - - - - - - - - -Ethiopia 15 49 54 86 38 11 11 47 52 28Fiji 10 47x,k - - - - - - - 31xFinland 4 - - - - - - - - -France 7 - - - - - - - - -
% of infants with low
birthweight 1998-2005*
exclusivelybreastfed
(<6 months)
breastfed withcomplementary
food(6-9 months)
still breastfeeding(20-23 months)
% of children (1996-2005*) who are:Vitamin A
supplementationcoverage rate(6-59 months)
2004
% of households consumingiodized salt1998-2005*
moderate & severe
underweight wasting
moderate & severesevere
stunting
moderate & severe
% of under-fives (1996-2005*) suffering from:
Countries and territories
106 T H E S T A T E O F T H E W O R L D ’ S C H I L D R E N 2 0 0 7

…TABLE 2
Gabon 14 6 62 9 12 2 3 21 - 36Gambia 17 26 37 54 17 4 8 19 27 8Georgia 7 18k 12 12 3 0 2 12 - 68Germany 7 - - - - - - - - -Ghana 16 53 62 67 22 5 7 30 95 28Greece 8 - - - - - - - - -Grenada 8 39k - - - - - - - -Guatemala 12 51 67 47 23 4 2 49 18w 67Guinea 16 27 41 71 26 7 9 35 95t 68Guinea-Bissau 22 37 36 67 25 7 10 30 64 2Guyana 13 11 42 31 14 3 11 11 - -Haiti 21 24 73 30 17 4 5 23 - 11Holy See - - - - - - - - - -Honduras 14 35 61 34 17 2 1 29 40 80Hungary 9 - - - - - - - - -Iceland 4 - - - - - - - - -India 30 37k 44 66 47 18 16 46 51w 57Indonesia 9 40 75 59 28 9 - - 73t 73Iran (Islamic Republic of) 7x 44 - 0 11 2 5 15 - 94Iraq 15 12 51 27 12 3 8 23 - 40Ireland 6 - - - - - - - - -Israel 8 - - - - - - - - -Italy 6 - - - - - - - - -Jamaica 10 - - - 4 - 4 3 - 100Japan 8 - - - - - - - - -Jordan 12 27 70 12 4 1 2 9 - 88Kazakhstan 8 36 73 17 4 0 2 10 - 83Kenya 10 13 84 57 20 4 6 30 63 91Kiribati 5 80x,k - - - - - - 58 -Korea, Democratic People’s Republic of 7 65 31 37 23 8 7 37 95t 40Korea, Republic of 4 - - - - - - - - -Kuwait 7 12k 26 9 10 3 11 24 - -Kyrgyzstan 7x 24 77 21 11 2 3 25 95 42Lao People’s Democratic Republic 14 23 10 47 40 13 15 42 48 75Latvia 5 - - - - - - - - -Lebanon 6 27k 35 11 4 - 5 11 - 92Lesotho 13 36 79 60 20 4 4 38 71 91Liberia - 35 70 45 26 8 6 39 95 -Libyan Arab Jamahiriya 7x - - 23x 5x 1x 3x 15x - 90xLiechtenstein - - - - - - - - - -Lithuania 4 - - - - - - - - -Luxembourg 8 - - - - - - - - -Madagascar 17 67 78 64 42 11 13 48 89t 75Malawi 16 53 78 80 22 5 5 48 57 49Malaysia 9 29k - 12 11 1 - - - -Maldives 22 10 85 - 30 7 13 25 - 44Mali 23 25 32 69 33 11 11 38 97 74Malta 6 - - - - - - - - -Marshall Islands 12 63x,k - - - - - - 24 -Mauritania - 20 78 57 32 10 13 35 95t 2Mauritius 14 21k - - 15x 2x 14x 10x - 0xMexico 8 - - - 8 1 2 18 - 91Micronesia (Federated States of) 18 60k - - - - - - 74 -Moldova, Republic of 5 46 66 2 4 1 4 8 - 59Monaco - - - - - - - - - -Mongolia 7 51 55 57 7 1 3 20 93t 75Montenegro‡ - - - - - - - - - -Morocco 15 31 66 15 10 2 9 18 - 59Mozambique 15 30 80 65 24 6 4 41 26 54Myanmar 15 15k 66 67 32 7 9 32 96t 60Namibia 14 19 57 37 24 5 9 24 - 63
% of infants with low
birthweight 1998-2005*
exclusivelybreastfed
(<6 months)
breastfed withcomplementary
food(6-9 months)
still breastfeeding(20-23 months)
% of children (1996-2005*) who are:Vitamin A
supplementationcoverage rate(6-59 months)
2004
% of households consumingiodized salt1998-2005*
moderate & severe
underweight wasting
moderate & severesevere
stunting
moderate & severe
% of under-fives (1996-2005*) suffering from:
S T A T I S T I C A L T A B L E S 107
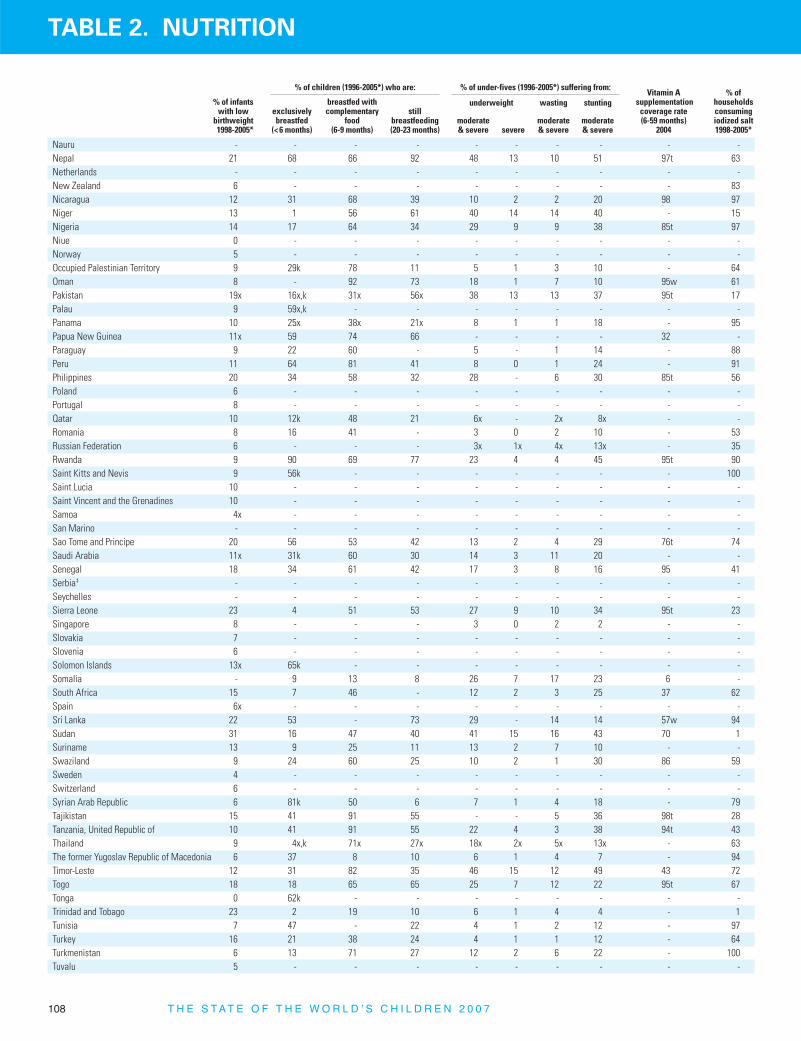
TABLE 2. NUTRITION
Nauru - - - - - - - - - -Nepal 21 68 66 92 48 13 10 51 97t 63Netherlands - - - - - - - - - -New Zealand 6 - - - - - - - - 83Nicaragua 12 31 68 39 10 2 2 20 98 97Niger 13 1 56 61 40 14 14 40 - 15Nigeria 14 17 64 34 29 9 9 38 85t 97Niue 0 - - - - - - - - -Norway 5 - - - - - - - - -Occupied Palestinian Territory 9 29k 78 11 5 1 3 10 - 64Oman 8 - 92 73 18 1 7 10 95w 61Pakistan 19x 16x,k 31x 56x 38 13 13 37 95t 17Palau 9 59x,k - - - - - - - -Panama 10 25x 38x 21x 8 1 1 18 - 95Papua New Guinea 11x 59 74 66 - - - - 32 -Paraguay 9 22 60 - 5 - 1 14 - 88Peru 11 64 81 41 8 0 1 24 - 91Philippines 20 34 58 32 28 - 6 30 85t 56Poland 6 - - - - - - - - -Portugal 8 - - - - - - - - -Qatar 10 12k 48 21 6x - 2x 8x - -Romania 8 16 41 - 3 0 2 10 - 53Russian Federation 6 - - - 3x 1x 4x 13x - 35Rwanda 9 90 69 77 23 4 4 45 95t 90Saint Kitts and Nevis 9 56k - - - - - - - 100Saint Lucia 10 - - - - - - - - -Saint Vincent and the Grenadines 10 - - - - - - - - -Samoa 4x - - - - - - - - -San Marino - - - - - - - - - -Sao Tome and Principe 20 56 53 42 13 2 4 29 76t 74Saudi Arabia 11x 31k 60 30 14 3 11 20 - -Senegal 18 34 61 42 17 3 8 16 95 41Serbia‡ - - - - - - - - - -Seychelles - - - - - - - - - -Sierra Leone 23 4 51 53 27 9 10 34 95t 23Singapore 8 - - - 3 0 2 2 - -Slovakia 7 - - - - - - - - -Slovenia 6 - - - - - - - - -Solomon Islands 13x 65k - - - - - - - -Somalia - 9 13 8 26 7 17 23 6 -South Africa 15 7 46 - 12 2 3 25 37 62Spain 6x - - - - - - - - -Sri Lanka 22 53 - 73 29 - 14 14 57w 94Sudan 31 16 47 40 41 15 16 43 70 1Suriname 13 9 25 11 13 2 7 10 - -Swaziland 9 24 60 25 10 2 1 30 86 59Sweden 4 - - - - - - - - -Switzerland 6 - - - - - - - - -Syrian Arab Republic 6 81k 50 6 7 1 4 18 - 79Tajikistan 15 41 91 55 - - 5 36 98t 28Tanzania, United Republic of 10 41 91 55 22 4 3 38 94t 43Thailand 9 4x,k 71x 27x 18x 2x 5x 13x - 63The former Yugoslav Republic of Macedonia 6 37 8 10 6 1 4 7 - 94Timor-Leste 12 31 82 35 46 15 12 49 43 72Togo 18 18 65 65 25 7 12 22 95t 67Tonga 0 62k - - - - - - - -Trinidad and Tobago 23 2 19 10 6 1 4 4 - 1Tunisia 7 47 - 22 4 1 2 12 - 97Turkey 16 21 38 24 4 1 1 12 - 64Turkmenistan 6 13 71 27 12 2 6 22 - 100Tuvalu 5 - - - - - - - - -
% of infants with low
birthweight 1998-2005*
exclusivelybreastfed
(<6 months)
breastfed withcomplementary
food(6-9 months)
still breastfeeding(20-23 months)
% of children (1996-2005*) who are:Vitamin A
supplementationcoverage rate(6-59 months)
2004
% of households consumingiodized salt1998-2005*
moderate & severe
underweight wasting
moderate & severesevere
stunting
moderate & severe
% of under-fives (1996-2005*) suffering from:
108 T H E S T A T E O F T H E W O R L D ’ S C H I L D R E N 2 0 0 7
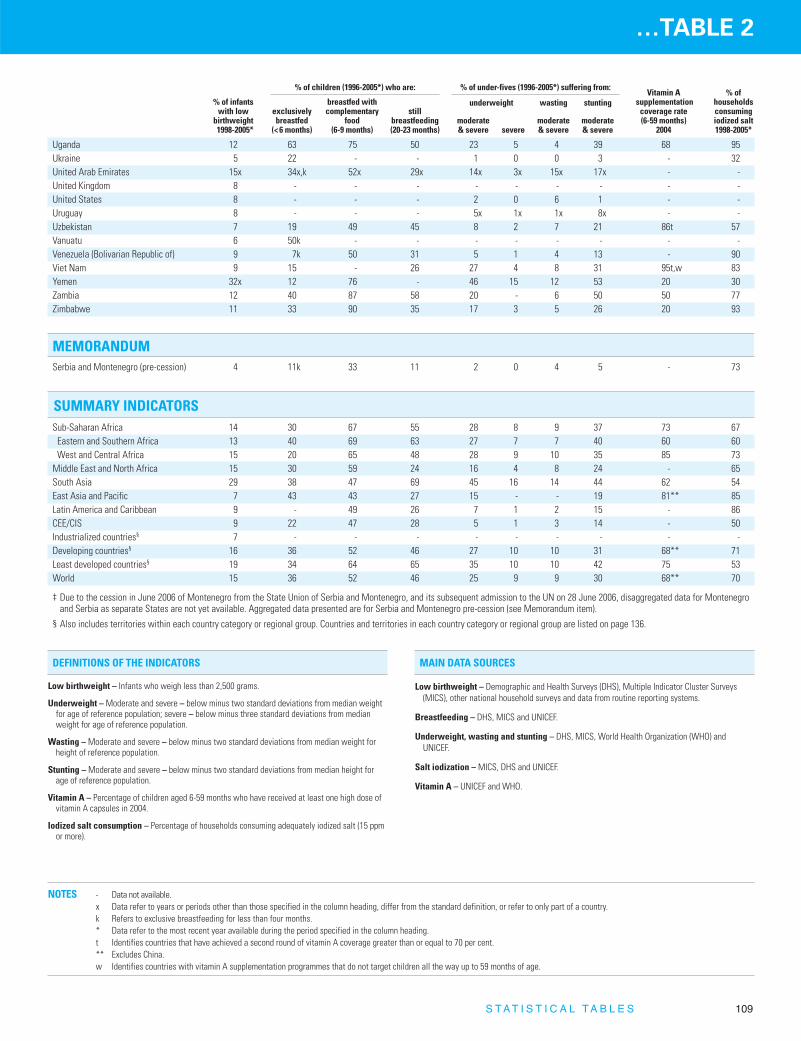
…TABLE 2
MAIN DATA SOURCES
Low birthweight – Demographic and Health Surveys (DHS), Multiple Indicator Cluster Surveys(MICS), other national household surveys and data from routine reporting systems.
Breastfeeding – DHS, MICS and UNICEF.
Underweight, wasting and stunting – DHS, MICS, World Health Organization (WHO) andUNICEF.
Salt iodization – MICS, DHS and UNICEF.
Vitamin A – UNICEF and WHO.
DEFINITIONS OF THE INDICATORS
Low birthweight – Infants who weigh less than 2,500 grams.
Underweight – Moderate and severe – below minus two standard deviations from median weightfor age of reference population; severe – below minus three standard deviations from medianweight for age of reference population.
Wasting – Moderate and severe – below minus two standard deviations from median weight forheight of reference population.
Stunting – Moderate and severe – below minus two standard deviations from median height forage of reference population.
Vitamin A – Percentage of children aged 6-59 months who have received at least one high dose ofvitamin A capsules in 2004.
Iodized salt consumption – Percentage of households consuming adequately iodized salt (15 ppmor more).
SUMMARY INDICATORSSub-Saharan Africa 14 30 67 55 28 8 9 37 73 67
Eastern and Southern Africa 13 40 69 63 27 7 7 40 60 60West and Central Africa 15 20 65 48 28 9 10 35 85 73
Middle East and North Africa 15 30 59 24 16 4 8 24 - 65South Asia 29 38 47 69 45 16 14 44 62 54East Asia and Pacific 7 43 43 27 15 - - 19 81** 85Latin America and Caribbean 9 - 49 26 7 1 2 15 - 86CEE/CIS 9 22 47 28 5 1 3 14 - 50Industrialized countries§ 7 - - - - - - - - -Developing countries§ 16 36 52 46 27 10 10 31 68** 71Least developed countries§ 19 34 64 65 35 10 10 42 75 53World 15 36 52 46 25 9 9 30 68** 70
‡ Due to the cession in June 2006 of Montenegro from the State Union of Serbia and Montenegro, and its subsequent admission to the UN on 28 June 2006, disaggregated data for Montenegroand Serbia as separate States are not yet available. Aggregated data presented are for Serbia and Montenegro pre-cession (see Memorandum item).
§ Also includes territories within each country category or regional group. Countries and territories in each country category or regional group are listed on page 136.
NOTES - Data not available.x Data refer to years or periods other than those specified in the column heading, differ from the standard definition, or refer to only part of a country.k Refers to exclusive breastfeeding for less than four months.* Data refer to the most recent year available during the period specified in the column heading.t Identifies countries that have achieved a second round of vitamin A coverage greater than or equal to 70 per cent.** Excludes China.w Identifies countries with vitamin A supplementation programmes that do not target children all the way up to 59 months of age.
% of infants with low
birthweight 1998-2005*
exclusivelybreastfed
(<6 months)
breastfed withcomplementary
food(6-9 months)
still breastfeeding(20-23 months)
% of children (1996-2005*) who are:Vitamin A
supplementationcoverage rate(6-59 months)
2004
% of households consumingiodized salt1998-2005*
moderate & severe
underweight wasting
moderate & severesevere
stunting
moderate & severe
% of under-fives (1996-2005*) suffering from:
Uganda 12 63 75 50 23 5 4 39 68 95Ukraine 5 22 - - 1 0 0 3 - 32United Arab Emirates 15x 34x,k 52x 29x 14x 3x 15x 17x - -United Kingdom 8 - - - - - - - - -United States 8 - - - 2 0 6 1 - -Uruguay 8 - - - 5x 1x 1x 8x - -Uzbekistan 7 19 49 45 8 2 7 21 86t 57Vanuatu 6 50k - - - - - - - -Venezuela (Bolivarian Republic of) 9 7k 50 31 5 1 4 13 - 90Viet Nam 9 15 - 26 27 4 8 31 95t,w 83Yemen 32x 12 76 - 46 15 12 53 20 30Zambia 12 40 87 58 20 - 6 50 50 77Zimbabwe 11 33 90 35 17 3 5 26 20 93
MEMORANDUMSerbia and Montenegro (pre-cession) 4 11k 33 11 2 0 4 5 - 73
S T A T I S T I C A L T A B L E S 109

TABLE 3. HEALTH
Afghanistan 39 63 31 34 49 29 0 73 88 76 76 64 - - 55 19 28 48 - - -Albania 96 99 94 91 99 84 80 98 98 98 97 97 98 - - 1 83 51 - - -Algeria 85 88 80 92 99 82 100 98 94 88 88 83 83 - - 9 52 - - - -Andorra 100 100 100 100 100 100 - - 98 98 98 94 79 97 - - - - - - -Angola 53 75 40 31 56 16 50 61 62 47 46 45 - - 75 8 58 32 10 2 63Antigua and Barbuda 91 95 89 95 98 94 100 - 99 99 98 99 99 99 - - - - - - -Argentina 96 98 80 91 92 83 100 99 90 92 92 99 87 92 - - - - - - -Armenia 92 99 80 83 96 61 35 94 96 90 92 94 91 - - 8 28 48 - - -Australia 100 100 100 100 100 100 100 - 97 92 92 94 94 94 - - - - - - -Austria 100 100 100 100 100 100 - - 91 86 86 75 86 86 - - - - - - -Azerbaijan 77 95 59 54 73 36 100 98 95 93 97 98 96 - - 3 36 40 12 1 1Bahamas 97 98 86 100 100 100 100 - 99 93 93 85 93 93 - - - - - - -Bahrain - 100 - - 100 - 100 - 99 98 98 99 98 98 - - - - - - -Bangladesh 74 82 72 39 51 35 16 99 96 88 88 81 62 - 89 21 20 52 - - -Barbados 100 100 100 100 99 100 94 - 97 92 91 93 92 92 - - - - - - -Belarus 100 100 100 84 93 61 100 99 99 99 98 99 99 - - - - - - - -Belgium - 100 - - - - - - 98 97 97 88 78 95 - - - - - - -Belize 91 100 82 47 71 25 100 96 97 96 96 95 97 96 - - 66 - - - -Benin 67 78 57 33 59 11 47 99 99 93 93 85 92 35 69 12 35 42 32 7 60Bhutan 62 86 60 70 65 70 0 99 97 95 95 93 95 - - - - - - - -Bolivia 85 95 68 46 60 22 40 93 94 81 79 64 81 81 - 22 52 54 - - -Bosnia and Herzegovina 97 99 96 95 99 92 80 95 95 93 95 90 93 50 - 2 80 23 - - -Botswana 95 100 90 42 57 25 100 99 98 97 97 90 85 - - 40 14 7 - - -Brazil 90 96 57 75 83 37 100 99 96 96 98 99 92 96 - 24x 46x 28x - - -Brunei Darussalam - - - - - - 100 96 99 99 99 97 99 99 - - - - - - -Bulgaria 99 100 97 99 100 96 100 98 97 96 97 96 96 - - - - - - - -Burkina Faso 61 94 54 13 42 6 100 99 99 96 94 84 - - 75 9 36 47 20 2 50Burundi 79 92 77 36 47 35 70 84 86 74 64 75 74 74 45 13 40 16 3 1 31Cambodia 41 64 35 17 53 8 7 87 85 82 82 79 - - 53 20 37 59 - - -Cameroon 66 86 44 51 58 43 34 77 85 80 79 68 79 - 65 11 40 43 12 1 53Canada 100 100 99 100 100 99 100 - 97 94 89 94 - 83 - - - - - - -Cape Verde 80 86 73 43 61 19 80 78 75 73 72 65 69 - - - - - - - -Central African Republic 75 93 61 27 47 12 0 70 65 40 40 35 - - 56 10 32 47 31 2 69Chad 42 41 43 9 24 4 78 40 45 20 36 23 - - 39 9 12 27 56 - 44Chile 95 100 58 91 95 62 100 95 92 91 92 90 - 91 - - - - - - -China 77 93 67 44 69 28 100 86 95 87 87 86 84 - - - - - - - -Colombia 93 99 71 86 96 54 100 87 95 87 87 89 87 87 - 10 57 39 27 - -Comoros 86 92 82 33 41 29 15 90 85 80 85 80 80 - 65 10 49 31 36 9 63Congo 58 84 27 27 28 25 70 - 73 65 65 56 - - 65 - - - - - -Congo, Democratic
Republic of the 46 82 29 30 42 25 0 84 82 73 73 70 - - 66 11 36 17 12 1 45Cook Islands 94 98 88 100 100 100 11 99 99 99 99 99 99 - - - - - - - -Costa Rica 97 100 92 92 89 97 100 88 89 91 91 89 90 89 - - - - - - -Côte d’Ivoire 84 97 74 37 46 29 53 - 71 56 56 51 56 - 73 4 38 34 14 4 58Croatia 100 100 100 100 100 100 100 98 96 96 96 96 99 96 - - - - - - -Cuba 91 95 78 98 99 95 99 99 99 99 99 98 99 94 - - - - - - -Cyprus 100 100 100 100 100 100 25 - 99 98 98 86 88 58 - - - - - - -Czech Republic 100 100 100 98 99 97 100 99 98 97 96 97 99 97 - - - - - - -Denmark 100 100 100 - - - 100 - 93 93 93 95 - 93 - - - - - - -Djibouti 73 76 59 82 88 50 85 52 73 71 71 65 - - - - - - - - -Dominica 97 100 90 84 86 75 70 98 98 98 98 98 - - - - - - - - -Dominican Republic 95 97 91 78 81 73 65 99 92 77 73 99 77 77 - 20 63 42 - - -Ecuador 94 97 89 89 94 82 100 99 99 94 93 93 94 94 - - - - - - -Egypt 98 99 97 70 86 58 100 98 98 98 98 98 98 - 80 9 73 29 - - -El Salvador 84 94 70 62 77 39 100 84 89 89 89 99 89 89 - 42 62 - - - -Equatorial Guinea 43 45 42 53 60 46 100 73 65 33 39 51 - - 48 - - 36 15 1 49Eritrea 60 74 57 9 32 3 0 91 91 83 83 84 83 - - 19 44 54 12 4 4Estonia 100 100 99 97 97 96 - 99 99 96 96 96 95 37 - - - - - - -Ethiopia 22 81 11 13 44 7 0 67 78 69 66 59 - - 45 24 16 38 2 1 3Fiji 47 43 51 72 87 55 100 90 80 75 80 70 75 75 - - - - - - -Finland 100 100 100 100 100 100 - 98 99 97 97 97 - 98 - - - - - - -France 100 100 100 - - - - 84 98 98 98 87 29 87 - - - - - - -
% of routineEPI
vaccinesfinanced bygovernment
2005
total
% of populationusing improveddrinking water
sources2004
total urban rural
% of populationusing adequate
sanitation facilities2004
total urban rural
Immunization 2005λ
1-year-old children immunized against:
corresponding vaccines:Countries and territories
%new-borns
protectedagainsttetanus
TB DPT Polio Measles HepB Hib
BCG DPT1β DPT3β polio3 measles HepB3 Hib3
% under-fives withdiarrhoeareceivingoral rehy-
dration andcontinued
feeding1998-2005*
%under-fives
sleepingunder a
mosquitonet
% under-fives
sleepingunder atreated
mosquitonet
% under-fives with
feverreceiving
anti-malarial
drugs
Malaria 1999-2005*% under-fives withsuspectedpneumonia
taken tohealth-
careprovider±
% under-fives withsuspected
pneumonia±
1999-2005*
110 T H E S T A T E O F T H E W O R L D ’ S C H I L D R E N 2 0 0 7

…TABLE 3
Gabon 88 95 47 36 37 30 100 89 69 38 31 55 55 - 60 13 48 44 - - -Gambia 82 95 77 53 72 46 60 89 94 88 90 84 88 88 - 8 75 38 42 15 55Georgia 82 96 67 94 96 91 20 95 94 84 84 92 74 - - 4 99 - - - -Germany 100 100 100 100 100 100 - - 96 90 94 93 84 92 - - - - - - -Ghana 75 88 64 18 27 11 55 99 88 84 85 83 84 84 84 10 44 40 15 4 63Greece - - - - - - - 88 96 88 87 88 88 88 - - - - - - -Grenada 95 97 93 96 96 97 100 - 93 99 99 99 99 99 - - - - - - -Guatemala 95 99 92 86 90 82 100 96 93 81 81 77 27 27 - 18 64 22 6 1 -Guinea 50 78 35 18 31 11 10 90 90 69 70 59 - - 76 15 33 44 25 4 56Guinea-Bissau 59 79 49 35 57 23 0 80 86 80 80 80 - - 54 10 64 23 67 7 58Guyana 83 83 83 70 86 60 60 96 93 93 93 92 93 93 - 5 78 40 67 6 3Haiti 54 52 56 30 57 14 10 71 76 43 43 54 - - 52 39 26 41 - - 12Holy See - - - - - - - - - - - - - - - - - - - - -Honduras 87 95 81 69 87 54 100 91 97 91 91 92 91 91 - - - - - - -Hungary 99 100 98 95 100 85 99 99 99 99 99 99 - 99 - - - - - - -Iceland 100 100 100 100 100 100 - - 95 95 95 90 - 95 - - - - - - -India 86 95 83 33 59 22 100 75 81 59 58 58 8 - 80 19 67 22 - - 12Indonesia 77 87 69 55 73 40 100 82 88 70 70 72 70 - 70 8 61 56 - 26 1Iran (Islamic Republic of) 94 99 84 - - - 100 99 97 95 95 94 94 - - 24 93 - - - -Iraq 81 97 50 79 95 48 95 93 93 81 87 90 81 - 70 7 76 54 7 0 1Ireland - 100 - - - - 100 93 96 90 90 84 - 90 - - - - - - -Israel 100 100 100 - 100 - 100 61 98 95 93 95 95 96 - - - - - - -Italy - - - - - - - - 97 96 97 87 96 95 - - - - - - -Jamaica 93 98 88 80 91 69 100 95 91 88 83 84 87 89 - 3 39 21 - - -Japan 100 100 100 100 100 100 100 - 99 99 97 99 - - - - - - - - -Jordan 97 99 91 93 94 87 100 89 98 95 95 95 95 95 - 6 78 44 - - -Kazakhstan 86 97 73 72 87 52 100 69 99 98 99 99 94 - - 3 48 22 - - -Kenya 61 83 46 43 46 41 80 85 85 76 70 69 76 76 72 18 49 33 15 5 27Kiribati 65 77 53 40 59 22 100 94 75 62 61 56 67 99 - - - - - - -Korea, Democratic People’s
Republic of 100 100 100 59 58 60 0 94 83 79 97 96 92 - - 12 93 - - - -Korea, Republic of 92 97 71 - - - 100 97 98 96 96 99 99 - - - - - - - -Kuwait - - - - - - 100 - 99 99 99 99 99 - - - - - - - -Kyrgyzstan 77 98 66 59 75 51 30 96 98 98 98 99 97 - - 4x 48x 16x - - -Lao People’s Democratic Republic 51 79 43 30 67 20 0 65 68 49 50 41 49 - 30 1 36 37 82 18 9Latvia 99 100 96 78 82 71 100 99 99 99 99 95 98 94 - - - - - - -Lebanon 100 100 100 98 100 87 100 - 98 92 92 96 88 92 - 4 74 - - - -Lesotho 79 92 76 37 61 32 9 96 95 83 80 85 83 - - 19 54 53 - - -Liberia 61 72 52 27 49 7 0 82 92 87 77 94 - - 72 39 70 - - - -Libyan Arab Jamahiriya - - - 97 97 96 100 99 98 98 98 97 97 - - - - - - - -Liechtenstein - - - - - - - - - - - - - - - - - - - - -Lithuania - - - - - - 100 99 98 94 93 97 95 61 - - - - - - -Luxembourg 100 100 100 - - - 100 - 99 99 99 95 95 98 - - - - - - -Madagascar 50 77 35 34 48 26 29 72 71 61 63 59 61 - 45 9 48 47 - - 34Malawi 73 98 68 61 62 61 20 - 99 93 94 82 93 93 - 27 27 51 20 15 28Malaysia 99 100 96 94 95 93 85 99 90 90 90 90 90 90 - - - - - - -Maldives 83 98 76 59 100 42 100 99 99 98 98 97 98 - - 22 22 - - - -Mali 50 78 36 46 59 39 71 82 95 85 84 86 85 3 75 10 36 45 72 8 38Malta 100 100 100 - 100 - 60 - 94 92 94 86 78 83 - - - - - - -Marshall Islands 87 82 96 82 93 58 - 93 89 77 88 86 89 69 - - - - - - -Mauritania 53 59 44 34 49 8 100 87 85 71 71 61 42 - 34 10 41 28 31 2 33Mauritius 100 100 100 94 95 94 100 99 99 97 97 98 97 - - - - - - - -Mexico 97 100 87 79 91 41 100 99 99 98 98 96 98 98 - - - - - - -Micronesia (Federated States of) 94 95 94 28 61 14 0 70 97 94 94 96 91 74 - - - - - - -Moldova, Republic of 92 97 88 68 86 52 86 97 98 98 98 97 99 - - 1 78 52 - - -Monaco 100 100 - 100 100 - - 90 99 99 99 99 99 99 - - - - - - -Mongolia 62 87 30 59 75 37 26 99 97 99 99 99 98 28 - 2 78 66 - - -Montenegro‡ - - - - - - - - - - - - - - - - - - - - -Morocco 81 99 56 73 88 52 100 95 99 98 98 97 96 - - 12 38 46 - - -Mozambique 43 72 26 32 53 19 47 87 88 72 70 77 72 - 70 10 54 47 10 - 15Myanmar 78 80 77 77 88 72 0 76 76 73 73 72 62 - 85 2 66 48 - - -Namibia 87 98 81 25 50 13 100 95 93 86 86 73 - - - 18 53 39 7 3 14
% of routineEPI
vaccinesfinanced bygovernment
2005
total
% of populationusing improveddrinking water
sources2004
total urban rural
% of populationusing adequate
sanitation facilities2004
total urban rural
Immunization 2005λ
1-year-old children immunized against:
corresponding vaccines:
%new-borns
protectedagainsttetanus
TB DPT Polio Measles HepB Hib
BCG DPT1β DPT3β polio3 measles HepB3 Hib3
% under-fives withdiarrhoeareceivingoral rehy-
dration andcontinued
feeding1998-2005*
%under-fives
sleepingunder a
mosquitonet
% under-fives
sleepingunder atreated
mosquitonet
% under-fives with
feverreceiving
anti-malarial
drugs
Malaria 1999-2005*% under-fives withsuspectedpneumonia
taken tohealth-
careprovider±
% under-fives withsuspected
pneumonia±
1999-2005*
S T A T I S T I C A L T A B L E S 111
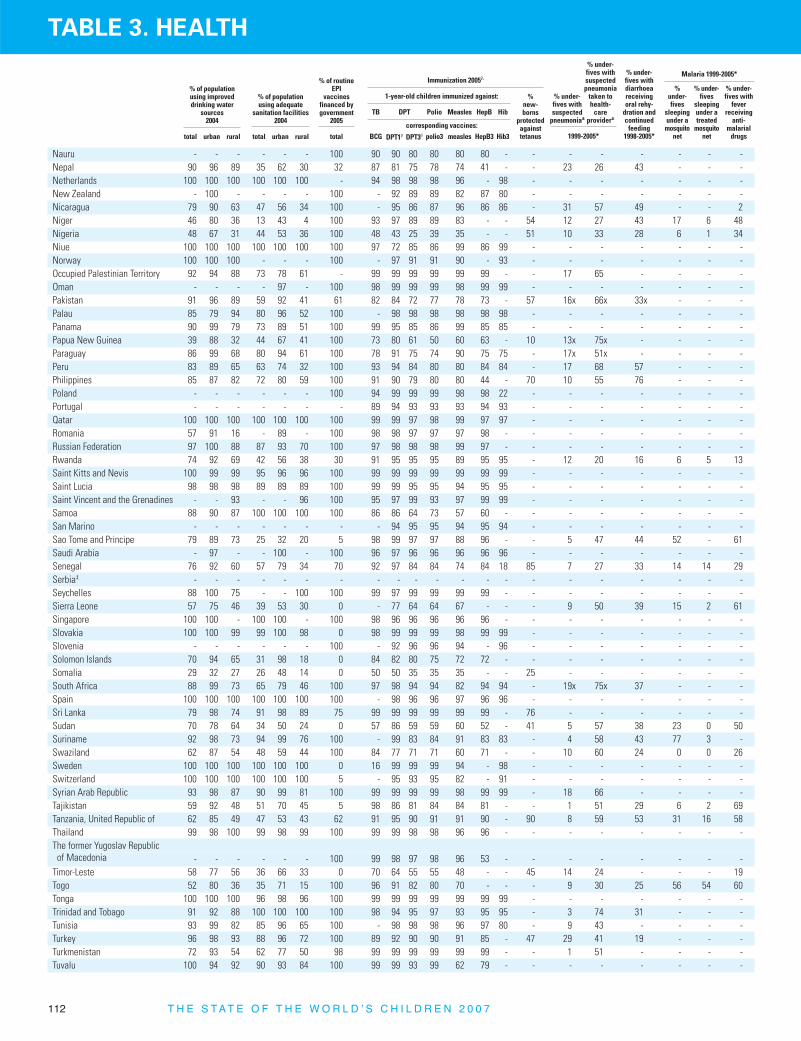
TABLE 3. HEALTH
Nauru - - - - - - 100 90 90 80 80 80 80 - - - - - - - -Nepal 90 96 89 35 62 30 32 87 81 75 78 74 41 - - 23 26 43 - - -Netherlands 100 100 100 100 100 100 - 94 98 98 98 96 - 98 - - - - - - -New Zealand - 100 - - - - 100 - 92 89 89 82 87 80 - - - - - - -Nicaragua 79 90 63 47 56 34 100 - 95 86 87 96 86 86 - 31 57 49 - - 2Niger 46 80 36 13 43 4 100 93 97 89 89 83 - - 54 12 27 43 17 6 48Nigeria 48 67 31 44 53 36 100 48 43 25 39 35 - - 51 10 33 28 6 1 34Niue 100 100 100 100 100 100 100 97 72 85 86 99 86 99 - - - - - - -Norway 100 100 100 - - - 100 - 97 91 91 90 - 93 - - - - - - -Occupied Palestinian Territory 92 94 88 73 78 61 - 99 99 99 99 99 99 - - 17 65 - - - -Oman - - - - 97 - 100 98 99 99 99 98 99 99 - - - - - - -Pakistan 91 96 89 59 92 41 61 82 84 72 77 78 73 - 57 16x 66x 33x - - -Palau 85 79 94 80 96 52 100 - 98 98 98 98 98 98 - - - - - - -Panama 90 99 79 73 89 51 100 99 95 85 86 99 85 85 - - - - - - -Papua New Guinea 39 88 32 44 67 41 100 73 80 61 50 60 63 - 10 13x 75x - - - -Paraguay 86 99 68 80 94 61 100 78 91 75 74 90 75 75 - 17x 51x - - - -Peru 83 89 65 63 74 32 100 93 94 84 80 80 84 84 - 17 68 57 - - -Philippines 85 87 82 72 80 59 100 91 90 79 80 80 44 - 70 10 55 76 - - -Poland - - - - - - 100 94 99 99 99 98 98 22 - - - - - - -Portugal - - - - - - - 89 94 93 93 93 94 93 - - - - - - -Qatar 100 100 100 100 100 100 100 99 99 97 98 99 97 97 - - - - - - -Romania 57 91 16 - 89 - 100 98 98 97 97 97 98 - - - - - - - -Russian Federation 97 100 88 87 93 70 100 97 98 98 98 99 97 - - - - - - - -Rwanda 74 92 69 42 56 38 30 91 95 95 95 89 95 95 - 12 20 16 6 5 13Saint Kitts and Nevis 100 99 99 95 96 96 100 99 99 99 99 99 99 99 - - - - - - -Saint Lucia 98 98 98 89 89 89 100 99 99 95 95 94 95 95 - - - - - - -Saint Vincent and the Grenadines - - 93 - - 96 100 95 97 99 93 97 99 99 - - - - - - -Samoa 88 90 87 100 100 100 100 86 86 64 73 57 60 - - - - - - - -San Marino - - - - - - - - 94 95 95 94 95 94 - - - - - - -Sao Tome and Principe 79 89 73 25 32 20 5 98 99 97 97 88 96 - - 5 47 44 52 - 61Saudi Arabia - 97 - - 100 - 100 96 97 96 96 96 96 96 - - - - - - -Senegal 76 92 60 57 79 34 70 92 97 84 84 74 84 18 85 7 27 33 14 14 29Serbia‡ - - - - - - - - - - - - - - - - - - - - -Seychelles 88 100 75 - - 100 100 99 97 99 99 99 99 - - - - - - - -Sierra Leone 57 75 46 39 53 30 0 - 77 64 64 67 - - - 9 50 39 15 2 61Singapore 100 100 - 100 100 - 100 98 96 96 96 96 96 - - - - - - - -Slovakia 100 100 99 99 100 98 0 98 99 99 99 98 99 99 - - - - - - -Slovenia - - - - - - 100 - 92 96 96 94 - 96 - - - - - - -Solomon Islands 70 94 65 31 98 18 0 84 82 80 75 72 72 - - - - - - - -Somalia 29 32 27 26 48 14 0 50 50 35 35 35 - - 25 - - - - - -South Africa 88 99 73 65 79 46 100 97 98 94 94 82 94 94 - 19x 75x 37 - - -Spain 100 100 100 100 100 100 100 - 98 96 96 97 96 96 - - - - - - -Sri Lanka 79 98 74 91 98 89 75 99 99 99 99 99 99 - 76 - - - - - -Sudan 70 78 64 34 50 24 0 57 86 59 59 60 52 - 41 5 57 38 23 0 50Suriname 92 98 73 94 99 76 100 - 99 83 84 91 83 83 - 4 58 43 77 3 -Swaziland 62 87 54 48 59 44 100 84 77 71 71 60 71 - - 10 60 24 0 0 26Sweden 100 100 100 100 100 100 0 16 99 99 99 94 - 98 - - - - - - -Switzerland 100 100 100 100 100 100 5 - 95 93 95 82 - 91 - - - - - - -Syrian Arab Republic 93 98 87 90 99 81 100 99 99 99 99 98 99 99 - 18 66 - - - -Tajikistan 59 92 48 51 70 45 5 98 86 81 84 84 81 - - 1 51 29 6 2 69Tanzania, United Republic of 62 85 49 47 53 43 62 91 95 90 91 91 90 - 90 8 59 53 31 16 58Thailand 99 98 100 99 98 99 100 99 99 98 98 96 96 - - - - - - - -The former Yugoslav Republicof Macedonia - - - - - - 100 99 98 97 98 96 53 - - - - - - - -
Timor-Leste 58 77 56 36 66 33 0 70 64 55 55 48 - - 45 14 24 - - - 19Togo 52 80 36 35 71 15 100 96 91 82 80 70 - - - 9 30 25 56 54 60Tonga 100 100 100 96 98 96 100 99 99 99 99 99 99 99 - - - - - - -Trinidad and Tobago 91 92 88 100 100 100 100 98 94 95 97 93 95 95 - 3 74 31 - - -Tunisia 93 99 82 85 96 65 100 - 98 98 98 96 97 80 - 9 43 - - - -Turkey 96 98 93 88 96 72 100 89 92 90 90 91 85 - 47 29 41 19 - - -Turkmenistan 72 93 54 62 77 50 98 99 99 99 99 99 99 - - 1 51 - - - -Tuvalu 100 94 92 90 93 84 100 99 99 93 99 62 79 - - - - - - - -
% of routineEPI
vaccinesfinanced bygovernment
2005
total
% of populationusing improveddrinking water
sources2004
total urban rural
% of populationusing adequate
sanitation facilities2004
total urban rural
Immunization 2005λ
1-year-old children immunized against:
corresponding vaccines:
%new-borns
protectedagainsttetanus
TB DPT Polio Measles HepB Hib
BCG DPT1β DPT3β polio3 measles HepB3 Hib3
% under-fives withdiarrhoeareceivingoral rehy-
dration andcontinued
feeding1998-2005*
%under-fives
sleepingunder a
mosquitonet
% under-fives
sleepingunder atreated
mosquitonet
% under-fives with
feverreceiving
anti-malarial
drugs
Malaria 1999-2005*% under-fives withsuspectedpneumonia
taken tohealth-
careprovider±
% under-fives withsuspected
pneumonia±
1999-2005*
112 T H E S T A T E O F T H E W O R L D ’ S C H I L D R E N 2 0 0 7

…TABLE 3
Uganda 60 87 56 43 54 41 9 92 94 84 83 86 84 84 56 22 67 29 7 0 -Ukraine 96 99 91 96 98 93 100 96 95 96 95 96 97 - - - - - - - -United Arab Emirates 100 100 100 98 98 95 100 98 97 94 94 92 92 94 - - - - - - -United Kingdom 100 100 100 - - - 100 - 97 91 91 82 - 91 - - - - - - -United States 100 100 100 100 100 100 56 - 99 96 92 93 92 94 - - - - - - -Uruguay 100 100 100 100 100 99 100 99 99 96 96 95 96 96 - - - - - - -Uzbekistan 82 95 75 67 78 61 64 93 99 99 99 99 99 - - 0 57 33 - - -Vanuatu 60 86 52 50 78 42 100 65 75 66 56 70 56 - - - - - - - -Venezuela (Bolivarian Republic of) 83 85 70 68 71 48 100 95 98 87 81 76 88 87 - 9 72 51 - - -Viet Nam 85 99 80 61 92 50 70 95 94 95 94 95 94 - - 20 71 39 96 16 7Yemen 67 71 65 43 86 28 13 66 99 86 87 76 86 57 24 24 47 23x - - -Zambia 58 90 40 55 59 52 10 94 94 80 80 84 80 80 98 15 69 48 16 7 52Zimbabwe 81 98 72 53 63 47 1 98 95 - 90 85 90 - - 16 50 80 3 - -
SUMMARY INDICATORSSub-Saharan Africa 55 81 41 37 53 28 50 76 77 66 68 65 37 - 61 13 39 35 14 4 37
Eastern and Southern Africa 55 76 40 36 49 26 36 81 85 76 75 72 57 - 61 17 43 40 11 5 27West and Central Africa 56 86 42 38 58 30 64 71 70 57 62 58 19 - 61 10 35 31 17 4 44
Middle East and North Africa 88 95 78 74 90 53 80 89 96 89 90 89 88 - - 13 66 39 - - -South Asia 85 94 81 37 63 27 81 79 83 65 65 64 23 - 77 19 59 27 - - 12East Asia and Pacific 79 92 70 51 73 36 91 87 92 84 84 84 78 - - 10** 62** 56** - - -Latin America and Caribbean 91 96 73 77 86 49 96 96 95 91 91 92 85 90 - - - - - - -CEE/CIS 91 98 79 84 93 70 90 93 96 95 95 96 92 - - 15 50 25 - - -Industrialized countries§ 100 100 100 100 100 99 75 - 98 96 94 92 64 90 - - - - - - -Developing countries§ 80 92 70 50 73 33 78 83 87 75 76 75 54 - 69 16** 54** 35** - - -Least developed countries§ 59 79 51 36 55 29 23 81 86 76 76 72 41 - 64 16 37 40 19 5 36World 83 95 73 59 80 39 78 83 88 78 78 77 55 - 69 15** 54** 35** - - -
‡ Due to the cession in June 2006 of Montenegro from the State Union of Serbia and Montenegro, and its subsequent admission to the UN on 28 June 2006, disaggregated data for Montenegroand Serbia as separate States are not yet available. Aggregated data presented are for Serbia and Montenegro pre-cession (see Memorandum item).
§ Also includes territories within each country category or regional group. Countries and territories in each country category or regional group are listed on page 136.
NOTES - Data not available.x Data refer to years or periods other than those specified in the column heading, differ from the standard definition, or refer to only part of a country.* Data refer to the most recent year available during the period specified in the column heading.** Excludes China.β Coverage for DPT1 should be at least as high as DPT3. Discrepancies where DPT1 coverage is less than DPT3 reflect deficiencies in the data collection and reporting process. UNICEF and WHO are working with national and
territorial systems to eliminate these discrepancies.± In this year’s report, we use the term ‘suspected pneumonia’ instead of ‘acute respiratory infections (ARI)’, which was employed in previous editions. However, the data collection methodology has not changed, and
estimates presented here are comparable to those in previous reports. For a more detailed discussion regarding this update, please see the ‘General note on the data’ on page 99.λ In this year’s report, immunization coverage estimates, specifically for hepatitis B and Haemophilus influenzae type b (Hib), are now also presented for countries where these immunizations have been only partially
introduced (such as India). In previous reports, no values were provided for countries with only partial introductions of these vaccines.
% of routineEPI
vaccinesfinanced bygovernment
2005
total
% of populationusing improveddrinking water
sources2004
total urban rural
% of populationusing adequate
sanitation facilities2004
total urban rural
Immunization 2005λ
1-year-old children immunized against:
corresponding vaccines:
%new-borns
protectedagainsttetanus
TB DPT Polio Measles HepB Hib
BCG DPT1β DPT3β polio3 measles HepB3 Hib3
% under-fives withdiarrhoeareceivingoral rehy-
dration andcontinued
feeding1998-2005*
%under-fives
sleepingunder a
mosquitonet
% under-fives
sleepingunder atreated
mosquitonet
% under-fives with
feverreceiving
anti-malarial
drugs
Malaria 1999-2005*% under-fives withsuspectedpneumonia
taken tohealth-
careprovider±
% under-fives withsuspected
pneumonia±
1999-2005*
MAIN DATA SOURCES
Use of improved drinking water sourcesand adequate sanitation facilities –UNICEF, World Health Organization (WHO),Multiple Indicator Cluster Surveys (MICS),and Demographic and Health Surveys (DHS).
Government funding of vaccines – UNICEFand WHO.
Immunization – UNICEF and WHO.Acute respiratory infection – DHS, MICS
and other national household surveys.Oral rehydration – DHS and MICS.Malaria – DHS and MICS.
DEFINITIONS OF THE INDICATORS
Government funding of vaccines – Percentage of vaccines that are routinely administered in a country to protect children and are financed by the national government (including loans).EPI – Expanded Programme on Immunization: The immunizations in this programme include those against tuberculosis (TB), diphtheria, pertussis (whooping cough) and tetanus (DPT), polio
and measles, as well as vaccination of pregnant women to protect babies against neonatal tetanus. Other vaccines, e.g., against hepatitis B (HepB), Haemophilus influenzae type b (Hib) oryellow fever, may be included in the programme in some countries.
BCG – Percentage of infants who received bacille Calmette-Guérin (vaccine against tuberculosis).DPT1 – Percentage of infants who received their first dose of diphtheria, pertussis (whooping cough) and tetanus vaccine.DPT3 – Percentage of infants who received three doses of diphtheria, pertussis (whooping cough) and tetanus vaccine.HepB3 – Percentage of infants who received three doses of hepatitis B vaccine.Hib3 – Percentage of infants who received three doses of Haemophilus influenzae type b vaccine.% under-fives with suspected pneumonia – Percentage of children (0-4 years) with suspected pneumonia in the past two weeks.% under-fives with suspected pneumonia taken to health-care provider – Percentage of children (0-4 years) with suspected pneumonia in the past two weeks taken to an appropriate
health-care provider.% under-fives with diarrhoea receiving oral rehydration and continued feeding – Percentage of children (0-4 years) with diarrhoea (in the two weeks preceding the survey) who
received either oral rehydration therapy (oral rehydration solutions or recommended home-made fluids) or increased fluids and continued feeding.Malaria:
% under-fives sleeping under a mosquito net – Percentage of children (0-4 years) who slept under a mosquito net.% under-fives sleeping under a treated mosquito net – Percentage of children (0-4 years) who slept under an insecticide-treated mosquito net.% under-fives with fever receiving antimalarial drugs – Percentage of children (0-4 years) who were ill with fever in the past two weeks and received any appropriate (locally
defined) antimalarial drugs.
MEMORANDUMSerbia and Montenegro (pre-cession) 93 99 86 87 97 77 100 98 98 98 98 96 65 - - 3 97 - - - -
S T A T I S T I C A L T A B L E S 113

TABLE 4. HIV/AIDS
Afghanistan <0.1 <1.0 <2.0 <0.1 - - - - - - - - - - 1600 -Albania - - <1.0 - - - - - - - 0 - - - - -Algeria 0.1 19 9.0 - 59 4.1 - - - - - - - - - - - -Andorra - - - - - - - - - - - - - - - -Angola 3.7 320 200 - 450 170 2004 2.8 35 0.9 2.5 - - - - 160 1200 90Antigua and Barbuda - - - - - - - - - - - - - - - -Argentina 0.6 130 80 - 220 36 - - - - - - - - - - 690 -Armenia 0.1 2.9 1.8 - 5.8 <1.0 - - - - - 8 7 44 - - - -Australia 0.1 16 9.7 - 27 <1.0 - - - - - - - - - - - -Austria 0.3 12 7.2 - 20 2.3 - - - - - - - - - - - -Azerbaijan 0.1 5.4 2.6 - 17 <1.0 - - - - - - 2 - - - - -Bahamas 3.3 6.8 3.3 - 22 3.8 - - <0.5 - - - - - - - 8 -Bahrain - <1.0 <2.0 - - - - - - - - - - - - -Bangladesh <0.1 11 6.4 - 18 1.4 - - - - - - - - - - 4400 -Barbados 1.5 2.7 1.5 - 4.2 <1.0 - - <0.1 - - - - - - - 3 -Belarus 0.3 20 11 - 47 5.1 - - - - - - - - - - - -Belgium 0.3 14 8.1 - 22 5.4 - - - - - - - - - - - -Belize 2.5 3.7 2.0 - 5.7 1.0 - - <0.1 - - - - - - - 5 -Benin 1.8 87 57 - 120 45 2003 1.7 - 2.1 9.8 0.4 1.1 14 8 34 19 62 370 -Bhutan <0.1 <0.5 <2.0 <0.1 - - - - - - - - - - 78 -Bolivia 0.1 7.0 3.8 - 17 1.9 - - - - - 18 - 37 20 - 310 -Bosnia and Herzegovina <0.1 <0.5 <1.0 - - - - - - - - - - - - -Botswana 24.1 270 260 - 350 140 2005 33.5 14 5.7 15.3 33 40 88 75 120 150 99Brazil 0.5 620 370 - 1000 220 - - - - - - - - - - 3700 -Brunei Darussalam <0.1 <0.1 <0.2 <0.1 - - - - - - - - - - 4 -Bulgaria <0.1 <0.5 <1.0 - - - - - - - - - - - - -Burkina Faso 2.0 150 120 - 190 80 2005 1.8 17 0.5 1.4 23 15 67 54 120 710 109Burundi 3.3 150 130 - 180 79 2004 8.6 20 0.8 2.3 - 24 - - 120 600 70Cambodia 1.6 130 74 - 210 59 2002 2.7 - - - - 37 - - - 470 71Cameroon 5.4 510 460 - 560 290 2002 7.0 43 1.4 4.9 34 27 57 46 240 1000 99Canada 0.3 60 48 - 72 9.6 - - - - - - - - - - - -Cape Verde - - - - - - - - - - - - - - - -Central African Republic 10.7 250 110 - 390 130 2002 14.0 24 2.5 7.3 - 5 - - 140 330 91Chad 3.5 180 88 - 300 90 2005 3.6 16 0.9 2.2 20 8 25 17 57 600 105Chile 0.3 28 17 - 56 7.6 - - - - - - - - - - 200 -China 0.1 650 390 - 1100 180 - - - - - - - - - - 20600 -Colombia 0.6 160 100 - 320 45 - - - - - - - - 30 - 870 -Comoros <0.1 <0.5 <1.0 <0.1 - - <0.1 <0.1 <0.1 - 10 - - - 33 59Congo 5.3 120 75 - 160 61 2002 3.0 15 1.2 3.7 22 10 38 20 110 270 -Congo, Democratic
Republic of the 3.2 1000 560 - 1500 520 2003 3.2 120 0.8 2.2 - - - - 680 4200 72Cook Islands - - - - - - - - - - - - - - - -Costa Rica 0.3 7.4 3.6 - 24 2.0 2002 5.2 - - - - - - - - 44 -Côte d’Ivoire 7.1 750 470 - 1000 400 2002 5.2 74 1.7 5.1 - 16 - - 450 1400 83Croatia <0.1 <0.5 <1.0 - - - - - - - - - - - - -Cuba 0.1 4.8 2.3 - 15 2.6 - - - - - - 52 - - - 120 -Cyprus - <0.5 <1.0 - - - - - - - - - - - - -Czech Republic 0.1 1.5 0.9 - 2.5 <1.0 - - - - - - - - - - - -Denmark 0.2 5.6 3.4 - 9.3 1.3 - - - - - - - - - - - -Djibouti 3.1 15 3.9 - 34 8.4 - - 1.2 0.7 2.1 - - - - 6 48 -Dominica - - - - - - - - - - - - - - - -Dominican Republic 1.1 66 56 - 77 31 - - 3.6 - - - - 52 29 - 220 96Ecuador 0.3 23 11 - 74 12 - - - - - - - - - - 230 -Egypt <0.1 5.3 2.9 - 13 <1.0 - - - - - - - - - - - -El Salvador 0.9 36 22 - 72 9.9 - - - - - - - - - - 150 -Equatorial Guinea 3.2 8.9 7.3 - 11 4.7 - - <1.0 0.7 2.3 - 4 - - 5 29 95Eritrea 2.4 59 33 - 95 31 - - 6.6 0.6 1.6 - 37 - - 36 280 83Estonia 1.3 10 4.8 - 32 2.4 - - - - - - - - - - - -Ethiopia - - 420 - 1300 - 2003 11.5 - - - - - 30 17 - 4800 60Fiji 0.1 <1.0 0.3 - 2.1 <0.5 - - - - - - - - - - 25 -Finland 0.1 1.9 1.1 - 3.1 <1.0 - - - - - - - - - - - -France 0.4 130 78 - 210 45 - - - - - - - - - - - -Gabon 7.9 60 40 - 87 33 - - 3.9 1.8 5.4 22 24 48 33 20 65 98Gambia 2.4 20 10 - 33 11 - - 1.2 0.6 1.7 - 15 - - 4 64 85
Paediatricinfections
Estimatednumber ofchildren
(0-14 years)living withHIV, 2005
(thousands)
Estimatednumber of
women (15+)living withHIV, 2005
(thousands) year median
HIV prevalencerate in young
pregnantwomen
(15-24 years) in capital city
Estimatedadult HIV
prevalencerate
(15+ years),end-2005
orphaneddue to allcauses,
2005
orphanedby AIDS,
2005
Orphanschool
attendanceratio
1999-2005*Countries and territories
Estimated number of people(all ages) living with HIV,
2005 (thousands)
Prevention among young peopleMother-to-child transmission Orphans
estimatelow
estimate -high
estimate
% whohave
compre-hensive
knowledgeof HIV,
1999-2005*
male female
% whoused
condom at last
high-risksex,
1999-2005*
male femaleestimate
(thousands)estimate
(thousands)
Children (0-17 years)
male female
HIV prevalenceamong young
people(15-24 years),
2005
114 T H E S T A T E O F T H E W O R L D ’ S C H I L D R E N 2 0 0 7

…TABLE 4
Georgia 0.2 5.6 2.7 - 18 <1.0 - - - - - - - - - - - -Germany 0.1 49 29 - 81 15 - - - - - - - - - - - -Ghana 2.3 320 270 - 380 180 2003 3.9 25 0.2 1.3 44 38 52 33 170 1000 79pGreece 0.2 9.3 5.6 - 15 2.0 - - - - - - - - - - - -Grenada - - - - - - - - - - - - - - - -Guatemala 0.9 61 37 - 100 16 - - - - - - - - - - 370 98Guinea 1.5 85 69 - 100 53 2004 4.4 7.0 0.5 1.4 - - 32 17 28 370 113Guinea-Bissau 3.8 32 18 - 50 17 - - 3.2 0.9 2.5 - 8 - - 11 100 103Guyana 2.4 12 4.7 - 23 6.6 - - <1.0 - - - 36 - - - 26 -Haiti 3.8 190 120 - 270 96 2000 3.7 17 - - 28 15 30 19 - 490 87Holy See - - - - - - - - - - - - - - - -Honduras 1.5 63 35 - 99 16 - - 2.4 - - - - - - - 180 -Hungary 0.1 3.2 1.9 - 5.3 <1.0 - - - - - - - - - - - -Iceland 0.2 <0.5 <1.0 <0.1 - - - - - - - - - - - -India 0.9 5700 3400 - 9400 1600 - - - - - 17 21 59 51 - 25700 -Indonesia 0.1 170 100 - 290 29 - - - - - - 7 - - - 5300 82Iran (Islamic Republic of) 0.2 66 36 - 160 11 - - - - - - - - - - 1500 -Iraq - - - - - - - - - - - - - - - -Ireland 0.2 5.0 3.0 - 8.3 1.8 - - - - - - - - - - - -Israel - 4.0 2.2 - 9.8 - - - - - - - - - - - - -Italy 0.5 150 90 - 250 50 - - - - - - - - - - - -Jamaica 1.5 25 14 - 39 6.9 - - <0.5 - - - - - - - 55 -Japan <0.1 17 10 - 29 9.9 - - - - - - - - - - - -Jordan - <1.0 <2.0 - - - - - - - - - - - - -Kazakhstan 0.1 12 11 - 77 6.8 - - - - - - - 65 32 - - -Kenya 6.1 1300 1100 - 1500 740 - - 150 1.0 5.2 47 34 47 25 1100 2300 95Kiribati - - - - - - - - - - - - - - - -Korea, Democratic
People’s Republic of - - - - - - - - - - - - - - - -Korea, Republic of <0.1 13 7.9 - 25 7.4 - - - - - - - - - - 450 -Kuwait - <1.0 <2.0 - - - - - - - - - - - - -Kyrgyzstan 0.1 4.0 1.9 - 13 <1.0 - - - - - - - - - - - -Lao People’s
Democratic Republic 0.1 3.7 1.8 - 12 <1.0 - - - - - - - - - - 290 -Latvia 0.8 10 6.1 - 17 2.2 - - - - - - - - - - - -Lebanon 0.1 2.9 1.4 - 9.2 <1.0 - - - - - - - - - - - -Lesotho 23.2 270 250 - 290 150 2004 27.3 18 5.9 14.1 18 26 48 50 97 150 95Liberia - - - - - - - - - - - - - - 250 -Libyan Arab Jamahiriya - - - - - - - - - - - - - - - -Liechtenstein - - - - - - - - - - - - - - - -Lithuania 0.2 3.3 1.6 - 10 <1.0 - - - - - - - - - - - -Luxembourg 0.2 <1.0 <1.0 - - - - - - - - - - - - -Madagascar 0.5 49 16 - 110 13 - - 1.6 0.6 0.3 16 19 12 5 13 900 76Malawi 14.1 940 480 - 1400 500 2001 15.0 91 3.4 9.6 36 24 47 35 550 950 93Malaysia 0.5 69 33 - 220 17 - - - - - - - - - - 480 -Maldives - - - - - - - - - - - - - - - -Mali 1.7 130 96 - 160 66 2002 2.5 16 0.4 1.2 15 9 30 14 94 710 104Malta 0.1 <0.5 <1.0 - - - - - - - - - - - - -Marshall Islands - - - - - - - - - - - - - - - -Mauritania 0.7 12 7.3 - 23 6.3 - - 1.1 0.2 0.5 - - - - 7 170 -Mauritius 0.6 4.1 1.9 - 13 <1.0 - - - - - - - - - - 23 -Mexico 0.3 180 99 - 440 42 - - - - - - - - - - 1600 -Micronesia (Federated States of) - - - - - - - - - - - - - - - -
Moldova, Republic of 1.1 29 15 - 69 16 - - - - - - 19 63 44 - - -Monaco - - - - - - - - - - - - - - - -Mongolia <0.1 <0.5 <2.0 <0.1 - - - - - - 32 - - - 79 -Montenegro‡ - - - - - - - - - - - - - - - - - -Morocco 0.1 19 12 - 38 4.0 - - - - - - 12 - - - - -Mozambique 16.1 1800 1400 - 2200 960 2002 14.7 140 3.6 10.7 33 20 33 29 510 1500 80Myanmar 1.3 360 200 - 570 110 - - - - - - - - - - 1700 -Namibia 19.6 230 110 - 360 130 2004 7.5 17 4.4 13.4 41 31 69 48 85 140 92Nauru - - - - - - - - - - - - - - - -Nepal 0.5 75 41 - 180 16 - - - - - - - - - - 970 -
Paediatricinfections
Estimatednumber ofchildren
(0-14 years)living withHIV, 2005
(thousands)
Estimatednumber of
women (15+)living withHIV, 2005
(thousands) year median
HIV prevalencerate in young
pregnantwomen
(15-24 years) in capital city
Estimatedadult HIV
prevalencerate
(15+ years),end-2005
orphaneddue to allcauses,
2005
orphanedby AIDS,
2005
Orphanschool
attendanceratio
1999-2005*
Estimated number of people(all ages) living with HIV,
2005 (thousands)
Prevention among young peopleMother-to-child transmission Orphans
estimatelow
estimate -high
estimate
% whohave
compre-hensive
knowledgeof HIV,
1999-2005*
male female
% whoused
condom at last
high-risksex,
1999-2005*
male femaleestimate
(thousands)estimate
(thousands)
Children (0-17 years)
male female
HIV prevalenceamong young
people(15-24 years),
2005
S T A T I S T I C A L T A B L E S 115
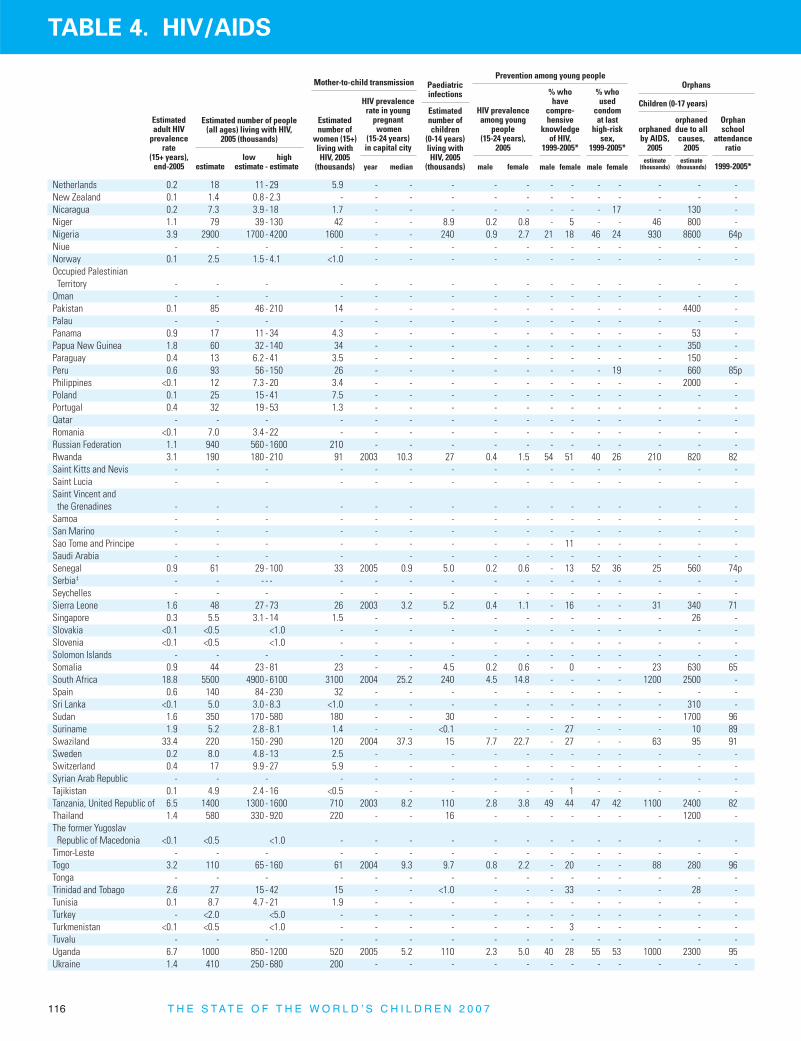
TABLE 4. HIV/AIDS
Netherlands 0.2 18 11 - 29 5.9 - - - - - - - - - - - -New Zealand 0.1 1.4 0.8 - 2.3 - - - - - - - - - - - - -Nicaragua 0.2 7.3 3.9 - 18 1.7 - - - - - - - - 17 - 130 -Niger 1.1 79 39 - 130 42 - - 8.9 0.2 0.8 - 5 - - 46 800 -Nigeria 3.9 2900 1700 - 4200 1600 - - 240 0.9 2.7 21 18 46 24 930 8600 64pNiue - - - - - - - - - - - - - - - -Norway 0.1 2.5 1.5 - 4.1 <1.0 - - - - - - - - - - - -Occupied Palestinian
Territory - - - - - - - - - - - - - - - -Oman - - - - - - - - - - - - - - - -Pakistan 0.1 85 46 - 210 14 - - - - - - - - - - 4400 -Palau - - - - - - - - - - - - - - - -Panama 0.9 17 11 - 34 4.3 - - - - - - - - - - 53 -Papua New Guinea 1.8 60 32 - 140 34 - - - - - - - - - - 350 -Paraguay 0.4 13 6.2 - 41 3.5 - - - - - - - - - - 150 -Peru 0.6 93 56 - 150 26 - - - - - - - - 19 - 660 85pPhilippines <0.1 12 7.3 - 20 3.4 - - - - - - - - - - 2000 -Poland 0.1 25 15 - 41 7.5 - - - - - - - - - - - -Portugal 0.4 32 19 - 53 1.3 - - - - - - - - - - - -Qatar - - - - - - - - - - - - - - - -Romania <0.1 7.0 3.4 - 22 - - - - - - - - - - - - -Russian Federation 1.1 940 560 - 1600 210 - - - - - - - - - - - -Rwanda 3.1 190 180 - 210 91 2003 10.3 27 0.4 1.5 54 51 40 26 210 820 82Saint Kitts and Nevis - - - - - - - - - - - - - - - -Saint Lucia - - - - - - - - - - - - - - - -Saint Vincent and the Grenadines - - - - - - - - - - - - - - - -
Samoa - - - - - - - - - - - - - - - -San Marino - - - - - - - - - - - - - - - -Sao Tome and Principe - - - - - - - - - - 11 - - - - -Saudi Arabia - - - - - - - - - - - - - - -Senegal 0.9 61 29 - 100 33 2005 0.9 5.0 0.2 0.6 - 13 52 36 25 560 74pSerbia‡ - - - - - - - - - - - - - - - - - -Seychelles - - - - - - - - - - - - - - - -Sierra Leone 1.6 48 27 - 73 26 2003 3.2 5.2 0.4 1.1 - 16 - - 31 340 71Singapore 0.3 5.5 3.1 - 14 1.5 - - - - - - - - - - 26 -Slovakia <0.1 <0.5 <1.0 - - - - - - - - - - - - -Slovenia <0.1 <0.5 <1.0 - - - - - - - - - - - - -Solomon Islands - - - - - - - - - - - - - - - -Somalia 0.9 44 23 - 81 23 - - 4.5 0.2 0.6 - 0 - - 23 630 65South Africa 18.8 5500 4900 - 6100 3100 2004 25.2 240 4.5 14.8 - - - - 1200 2500 -Spain 0.6 140 84 - 230 32 - - - - - - - - - - - -Sri Lanka <0.1 5.0 3.0 - 8.3 <1.0 - - - - - - - - - - 310 -Sudan 1.6 350 170 - 580 180 - - 30 - - - - - - - 1700 96Suriname 1.9 5.2 2.8 - 8.1 1.4 - - <0.1 - - - 27 - - - 10 89Swaziland 33.4 220 150 - 290 120 2004 37.3 15 7.7 22.7 - 27 - - 63 95 91Sweden 0.2 8.0 4.8 - 13 2.5 - - - - - - - - - - - -Switzerland 0.4 17 9.9 - 27 5.9 - - - - - - - - - - - -Syrian Arab Republic - - - - - - - - - - - - - - - -Tajikistan 0.1 4.9 2.4 - 16 <0.5 - - - - - - 1 - - - - -Tanzania, United Republic of 6.5 1400 1300 - 1600 710 2003 8.2 110 2.8 3.8 49 44 47 42 1100 2400 82Thailand 1.4 580 330 - 920 220 - - 16 - - - - - - - 1200 -The former Yugoslav Republic of Macedonia <0.1 <0.5 <1.0 - - - - - - - - - - - - -
Timor-Leste - - - - - - - - - - - - - - - -Togo 3.2 110 65 - 160 61 2004 9.3 9.7 0.8 2.2 - 20 - - 88 280 96Tonga - - - - - - - - - - - - - - - -Trinidad and Tobago 2.6 27 15 - 42 15 - - <1.0 - - - 33 - - - 28 -Tunisia 0.1 8.7 4.7 - 21 1.9 - - - - - - - - - - - -Turkey - <2.0 <5.0 - - - - - - - - - - - - -Turkmenistan <0.1 <0.5 <1.0 - - - - - - - 3 - - - - -Tuvalu - - - - - - - - - - - - - - - -Uganda 6.7 1000 850 - 1200 520 2005 5.2 110 2.3 5.0 40 28 55 53 1000 2300 95Ukraine 1.4 410 250 - 680 200 - - - - - - - - - - - -
Paediatricinfections
Estimatednumber ofchildren
(0-14 years)living withHIV, 2005
(thousands)
Estimatednumber of
women (15+)living withHIV, 2005
(thousands) year median
HIV prevalencerate in young
pregnantwomen
(15-24 years) in capital city
Estimatedadult HIV
prevalencerate
(15+ years),end-2005
orphaneddue to allcauses,
2005
orphanedby AIDS,
2005
Orphanschool
attendanceratio
1999-2005*
Estimated number of people(all ages) living with HIV,
2005 (thousands)
Prevention among young peopleMother-to-child transmission Orphans
estimatelow
estimate -high
estimate
% whohave
compre-hensive
knowledgeof HIV,
1999-2005*
male female
% whoused
condom at last
high-risksex,
1999-2005*
male femaleestimate
(thousands)estimate
(thousands)
Children (0-17 years)
male female
HIV prevalenceamong young
people(15-24 years),
2005
116 T H E S T A T E O F T H E W O R L D ’ S C H I L D R E N 2 0 0 7

…TABLE 4
United Arab Emirates - - - - - - - - - - - - - - - -United Kingdom 0.2 68 41 - 110 21 - - - - - - - - - - - -United States 0.6 1200 720 - 2000 300 - - - - - - - - - - - -Uruguay 0.5 9.6 4.6 - 30 5.3 - - - - - - - - - - 55 -Uzbekistan 0.2 31 15 - 99 4.1 - - - - - 7 8 50 - - - -Vanuatu - - - - - - - - - - - - - - - -Venezuela (Bolivarian Republic of) 0.7 110 54 - 350 31 - - - - - - - - - - 480 -
Viet Nam 0.5 260 150 - 430 84 - - - - - 50 42 68 - - 1800 -Yemen - - - - - - - - - - - - - - - -Zambia 17.0 1100 1100 - 1200 570 2004 20.7 130 3.8 12.7 33 31 40 35 710 1200 92Zimbabwe 20.1 1700 1100 - 2200 890 2004 18.6 160 4.4 14.7 - - 69 42 1100 1400 98
NOTES - Data not available.p Proportion of orphans (10-14 years) attending school is based on 25-49 cases.* Data refer to the most recent year available during the period specified in the column heading.
MAIN DATA SOURCES
Estimated adult HIV prevalence rate – Joint United Nations Programme on HIV/AIDS(UNAIDS), Report on the global AIDS epidemic, 2006.
Estimated number of people living with HIV – UNAIDS, Report on the global AIDSepidemic, 2006.
Estimated number of women (15+ years) living with HIV – UNAIDS, Report on theglobal AIDS epidemic, 2006.
HIV prevalence rate in young pregnant women in capital city – UNAIDS, Report onthe global AIDS epidemic, 2006.
Estimated number of children (0-14 years) living with HIV – UNAIDS, Report on theglobal AIDS epidemic, 2006.
HIV prevalence among young men and women – UNAIDS, Report on the globalAIDS epidemic, 2006.
Comprehensive knowledge of HIV – Demographic and Health Surveys (DHS),Multiple Indicator Cluster Surveys (MICS), Behavioural Surveillance Surveys (BSS),Reproductive Health Surveys (RHS) (1999-2005) and www.measuredhs.com/hivdata.
Condom use at last high-risk sex – DHS, BSS and RHS (1999-2005), andwww.measuredhs.com/hivdata.
Children orphaned by AIDS – UNICEF, UNAIDS and USAID, Africa’s Orphaned andVulnerable Generations: Children Affected by AIDS, 2006.
Children orphaned due to all causes – UNICEF, UNAIDS, and USAID, Africa’sOrphaned and Vulnerable Generations: Children Affected by AIDS, 2006.
Orphan school attendance ratio – MICS, DHS (1999-2005) andwww.measuredhs.com/hivdata.
DEFINITIONS OF THE INDICATORS
Estimated adult HIV prevalence rate – Percentage of adults (15-49 years) living with HIV as of end-2005.Estimated number of people (all ages) living with HIV – Estimated number of people (all ages) living with
HIV as of end-2005.Estimated number of women (15+ years) living with HIV – Estimated number of women living with HIV as
of end-2005.HIV prevalence rate in young pregnant women in capital city – Percentage of blood samples taken from
pregnant women (15-24 years) who test positive for HIV during ‘unlinked anonymous’ sentinel surveillance atselected antenatal clinics.
Estimated number of children (0-14 years) living with HIV – Estimated number of children 0-14 years livingwith HIV as of end-2005.
HIV prevalence among young men and women – Percentage of young men and women 15-24 years livingwith HIV as of end-2005.
Comprehensive knowledge of HIV – Percentage of young men and women (15-24 years) who correctlyidentify the two major ways of preventing the sexual transmission of HIV (using condoms and limiting sex toone faithful, uninfected partner), who reject the two most common local misconceptions about HIVtransmission, and who know that a healthy-looking person can have the AIDS virus.
Condom use at last high-risk sex – Percentage of young men and women (15-24 years) who say they used acondom the last time they had sex with a non-marital, non-cohabiting partner, of those who have had sex withsuch a partner in the past 12 months.
Children orphaned by AIDS – Estimated number of children (0-17 years) as of end-2005 who have lost one orboth parents to AIDS.
Children orphaned due to all causes – Estimated number of children (0-17 years) as of end-2005 who havelost one or both parents due to any cause.
Orphan school attendance ratio – Percentage of children (10-14 years) who lost both biological parents andwho are currently attending school as a percentage of non-orphaned children of the same age who live withat least one parent and who are attending school.
SUMMARY INDICATORSSub-Saharan Africa 6.1 24500 21600 - 27400 13200 - 9.7 2000 1.5 4.3 31 23 43 29 12000 46600 79
Eastern and Southern Africa 8.6 17500 15800 - 19200 9400 - 13.5 1400 2.1 6.1 40 31 41 30 8700 24300 80West and Central Africa 3.5 6900 5300 - 8700 3700 - 4.0 650 0.8 2.5 24 18 46 27 3300 22200 77
Middle East and North Africa 0.2 510 320 - 830 210 - - 33 - - - - - - - - -South Asia 0.7 5900 3600 - 9700 1600 - - 130 - - 17 21 59 51 - 37500 -East Asia and Pacific 0.2 2300 1800 - 3200 750 - - 50 - - - - - - - 34800 -Latin America and Caribbean 0.6 1900 1500 - 2800 640 - - 54 - - - - - - - 10700 -CEE/CIS 0.6 1500 1000 - 2300 450 - - 9 - - - - - - - - -Industrialized countries§ 0.4 2000 1400 - 3000 530 - - 13 - - - - - - - - -Developing countries§ 1.1 35100 30300 - 41900 16400 - - 2300 - - - - - - - - -Least developed countries§ 2.7 11700 10100 - 13500 6000 - 7.5 1100 - - - - - - - - 81World 1.0 38600 33400 - 46000 17300 - - 2300 - - - - - - 15200 132700 -
‡ Due to the cession in June 2006 of Montenegro from the State Union of Serbia and Montenegro, and its subsequent admission to the UN on 28 June 2006, disaggregated data for Montenegroand Serbia as separate States are not yet available. Aggregated data presented are for Serbia and Montenegro pre-cession (see Memorandum item).
§ Also includes territories within each country category or regional group. Countries and territories in each country category or regional group are listed on page 136.
MEMORANDUMSerbia and Montenegro
(pre-cession) 0.2 10 6.0 - 17 2.0 - - - - - - - - - - - -
Paediatricinfections
Estimatednumber ofchildren
(0-14 years)living withHIV, 2005
(thousands)
Estimatednumber of
women (15+)living withHIV, 2005
(thousands) year median
HIV prevalencerate in young
pregnantwomen
(15-24 years) in capital city
Estimatedadult HIV
prevalencerate
(15+ years),end-2005
orphaneddue to allcauses,
2005
orphanedby AIDS,
2005
Orphanschool
attendanceratio
1999-2005*
Estimated number of people(all ages) living with HIV,
2005 (thousands)
Prevention among young peopleMother-to-child transmission Orphans
estimatelow
estimate -high
estimate
% whohave
compre-hensive
knowledgeof HIV,
1999-2005*
male female
% whoused
condom at last
high-risksex,
1999-2005*
male femaleestimate
(thousands)estimate
(thousands)
Children (0-17 years)
male female
HIV prevalenceamong young
people(15-24 years),
2005
S T A T I S T I C A L T A B L E S 117

TABLE 5. EDUCATION
Afghanistan 43 13 3 0 127 56 - - 66 40 - 92 25 5 - - 18 6Albania 99 98 44 2 105 104 96 95 54 50 90y 9 79 77 75 73 39 39Algeria 80 60 22 3 116 107 98 95 94 93 96 95 78 84 65 68 - -Andorra - - 146 16 102 100 90 87 - - - - 80 83 71 72 - -Angola 83 54 3 1 69x 59x - - 58 59 - 75 19 15 - - 22 20Antigua and Barbuda - - 119 26 - - - - - - - - - - - - - -Argentina 97 97 58 16 113 112 99 98 - - 84 78 84 89 76 82 - -Armenia 100 99 21 4 99 103 92 95 96 97 - 99 90 93 88 90 91 95Australia - - 141 65 103 103 96 96 - - 86 - 152 145 85 86 - -Austria - - 144 48 106 106 - - - - - - 104 98 - - - -Azerbaijan 99 98 30 5 98 96 85 83 91 91 98y 99 84 82 78 76 87 84Bahamas - - 103 29 93 93 83 85 - - - - 76 84 70 78 - -Bahrain 89 84 117 21 104 104 96 97 86 87 100 99 96 102 87 93 77 85Bangladesh - - 3 0 107 111 92 95 82 86 65 87y 49 54 45 51 33 41Barbados - - 124 55 108 106 98 97 - - 97 - 109 111 93 98 - -Belarus 100 99 55 25 103 99 91 88 - - 100y - 93 94 87 88 - -Belgium - - 133 40 104 104 99 99 - - - - 111 107 96 97 - -Belize - - 48 13 126 123 95 96 - - 91 - 84 87 70 73 - -Benin 48 23 6 1 111 86 93 72 60 47 69 92 34 18 23 11 19 12Bhutan - - 6 3 - - - - 73y 67y 91 - - - - - - -Bolivia 93 81 27 4 114 113 95 96 78 77 86 50 90 87 74 73 57 56Bosnia and Herzegovina 99 94 58 6 - - - - 93 93 - 99 - - - - 68 71Botswana 80 82 41 4 105 104 81 83 83 86 91 96y 73 77 58 64 36 44Brazil 88 89 60 12 145 137 - - 96 96 84y 84x 97 107 73 78 42 50Brunei Darussalam 95 90 - 15 109 109 - - - - 93 - 91 96 - - - -Bulgaria 99 98 96 16 106 104 96 95 - - 94y - 104 100 90 87 - -Burkina Faso 29 15 4 0 59 47 46 35 35 29 76 93 14 10 11 8 12 10Burundi 67 52 1 0 87 73 60 54 50 44 63 80 14 10 - - 6 6Cambodia 85 64 4 0 142 131 100 96 66 65 60 92 35 24 30 22 17 11Cameroon 77 60 7 1 126 107 - - 80 78 64 96 51 36 - - 34 32Canada - - 111 62 100 100 99 100 - - - - 109 108 94x 94x - -Cape Verde - - 29 5 113 108 92 91 - - 91 - 63 69 52 58 - -Central African Republic 65 33 2 0 76 52 - - 47 39 - 70 - - - - 10 7Chad 41 13 2 0 86 56 68 46 41 31 46 64y 23 7 16 5 13 7Chile 96 96 84 28 106 101 - - - - 99 - 89 90 - - - -China 95 87 50 7 118 117 99 99 - - 99 - 73 73 - - - -Colombia 93 93 40 9 112 111 83 84 90 92 77 89 71 78 52 58 64 72Comoros - - 2 1 91 80 60 50 31 31 63 25 40 30 - - 10 11Congo - - 10 1 92 85 - - - - 66 - 42 35 - - - -Congo, Democratic
Republic of the 81 54 1 0 51x 46x - - 55 49 - 54 24 12 - - 18 15Cook Islands - - 43x 20x 83 81 78 77 - - - - 63 65 55 60 - -Costa Rica 95 95 53 24 112 111 - - - - 92 - 67 73 - - - -Côte d’Ivoire 61 39 9 1 80 63 62 50 62 53 88 94 32 18 26 15 20 16Croatia 99 97 106 30 95 94 88 87 - - 100y - 87 89 84 86 - -Cuba 100 100 7 1 103 98 97 95 - - 98 99 92 93 86 87 - -Cyprus 99 95 131 37 98 97 96 96 - - 99 - 96 99 92 95 - -Czech Republic - - 139 50 103 101 - - - - 98 - 95 96 - - - -Denmark - - 160 50 101 101 100 100 - - 100 - 122 127 91 94 - -Djibouti - - 7 1 44 35 36 29 - - 88 - 25 18 22 15 - -Dominica - - 88 29 96 95 87 88 - - 84 - 107 106 89 92 - -Dominican Republic 87 87 39 9 115 109 85 87 84 88 59 91 61 76 45 54 27 39Ecuador 92 90 39 5 117 117 97 98 - - 76 - 61 61 52 53 - -Egypt 83 59 24 6 103 98 97 94 84 82 99 99 90 84 81 77 73 68El Salvador - - 41 9 116 112 92 92 - - 73 - 60 61 47 49 - -Equatorial Guinea 93 80 9 1 133 121 92 78 61 60 33 72y 38 22 30 18 23 22Eritrea - - 1 1 71 57 50 42 69 64 80 82y 40 23 31 20 23 21Estonia 100 100 130 51 101 98 94 94 - - 99 - 97 99 89 91 - -Ethiopia - - 1 0 101 86 58 55 33 28 73y 65 38 24 34 22 13 10Fiji - - 26 7 107 105 97 96 - - 99 - 85 91 80 85 - -Finland - - 141 63 101 100 99 99 - - 100 - 107 112 94 94 - -France - - 130 41 105 104 99 99 - - 98x - 110 111 95 97 - -
Adult literacy rate2000-2004*
male femaleCountries and territories
Number per 100population2002-2004*
phones Internet users
Admin. data
2000-2004*
Survey data
1997-2005*
% of primary schoolentrants reaching
grade 5
Primary schoolPrimary school enrolment ratio attendance
ratio2000-2005*(1996-2005*)
gross net net
male female male female male female
Secondary schoolSecondary school enrolment ratio attendance
ratio2000-2005*(1996-2005*)
gross net net
male female male female male female
118 T H E S T A T E O F T H E W O R L D ’ S C H I L D R E N 2 0 0 7

…TABLE 5
Gabon - - 39 3 130 129 77 77 94 94 69 91y 49 42 - - 34 36Gambia - - 10 3 79 84 73 77 55 51 - 96 51 43 49 41 23 19Georgia - - 30 3 95 95 93 92 99y 100y 98y - 83 82 81 81 - -Germany - - 153 43 100 100 - - - - 99y - 101 99 - - - -Ghana 66 50 9 2 90 87 65 65 62 60 63 98 47 40 39 35 34 35Greece 98 94 143 18 102 101 100 99 - - - - 96 97 85 88 - -Grenada - - 74 17 94 90 84 84 - - 79 - 96 105 75 82 - -Guatemala 75 63 34 6 118 108 95 91 80 76 78 73y 51 46 35 32 23 24Guinea 43 18 2 1 87 71 69 58 60 54 82 94 34 17 28 14 28 19Guinea-Bissau - - 1 2 84 56 53 37 42 36 - 85 23 13 11 6 10 7Guyana - - 27 19 134 125 - - 96 97 64 97 92 95 - - 71 75Haiti - - 7 6 - - - - 52 57 - 87 - - - - 17 20Holy See - - - - - - - - - - - - - - - - - -Honduras 80 80 16 3 113 113 90 92 - - - - 58 73 - - - -Hungary - - 122 27 99 97 90 88 - - 97y - 97 96 91 90 - -Iceland - - 164 77 102 100 100 98 - - 100 - 111 118 85 88 - -India 73 48 8 3 120 112 92 87 79 72 79 95y 59 47 - - 54 46Indonesia 94 87 18 7 118 116 95 93 94 95 92 96y 64 64 57 57 54 56Iran (Islamic Republic of) 84 70 27 8 98 108 89 88 94y 91y 88 - 84 79 80 76 - -Iraq 84 64 6 0 108 89 94 81 84 72 66x 88 54 36 44 31 37 25Ireland - - 143 30 107 106 96 96 - - 100 - 108 116 84 89 - -Israel 98 96 149 47 110 111 97 98 - - 100 - 93 93 89 89 - -Italy 99 98 153 50 102 101 99 99 - - 96 - 100 98 92 93 - -Jamaica 74 86 97 40 95 95 90 91 93y 93y 90 92 87 89 78 81 - -Japan - - 118 50 100 101 100 100 - - - - 101 102 99 100 - -Jordan 95 85 39 11 98 99 90 92 99 99 99 99y 87 88 80 82 85 89Kazakhstan 100 99 34 3 110 109 93 92 98 99 100y 99 99 97 93 92 73 76Kenya 78 70 9 5 114 108 76 77 79 79 75 98 50 46 40 40 12 13Kiribati - - 6 2 113 116 96x 98x - - 82 - 82 100 65 76 - -Korea, Democratic
People’s Republic of - - 4 - - - - - - - - - - - - - - -Korea, Republic of - - 131 66 105 104 100 99 - - 98 - 93 93 90 91 - -Kuwait 94 91 98 24 96 97 85 87 - - 97y - 87 93 76 80 - -Kyrgyzstan 99 98 13 5 98 98 90 90 95 95 96y 100 88 88 - - 58 60Lao People’s
Democratic Republic 77 61 5 0 124 109 87 82 65 60 63 93 52 39 40 34 27 21Latvia 100 100 96 35 94 91 - - - - 98y - 97 96 - - - -Lebanon - - 43 17 109 105 94 93 97 97 98 96 85 93 - - 61 68Lesotho 74 90 11 2 131 131 83 88 62 69 63 89 32 41 18 28 12 17Liberia - - 0x 0x 115 83 74 58 59x,y 53x,y - - 37 27 22 12 - -Libyan Arab Jamahiriya - - 16 4 113 112 - - - - - - 101 107 - - - -Liechtenstein - - 131 64 106 107 87 89 - - - - 67 74 62 69 - -Lithuania 100 100 123 28 98 97 90 89 - - 99y - 99 98 93 93 - -Luxembourg - - 199 59 100 99 91 91 - - 92 - 92 98 77 82 17 21Madagascar 77 65 2 1 136 131 89 89 74 77 57 93 14x 14x 11x 11x 10 13Malawi 75 54 3 0 123 126 93 98 80y 84y 44 86 32 26 27 23 - -Malaysia 92 85 75 39 94 93 93 93 - - 98 - 71 81 71 81 - -Maldives 96 96 44 6 105 102 89 90 - - 99y - 68 78 48 55 15 11Mali 27 12 4 0 71 56 50 43 45 33 79 93 28 17 - - - -Malta 86 89 128 75 103 102 94 94 - - 99 - 109 102 85 90 - -Marshall Islands - - 9 4 116 109 90 89 - - - - 85 88 72 77 15 9Mauritania 60 43 19 0 95 93 75 74 46 42 82 69y 22 18 16 13 - -Mauritius 88 81 70 15 102 102 94 95 - - 99 - 89 88 82 83 - -Mexico 92 90 54 13 110 108 98 98 - - 93 - 77 82 63 65 - -Micronesia(Federated States of) - - 22 11 - - - - - - - - - - - - 79 82
Moldova, Republic of 99 98 39 10 95 94 86 86 87 87 90y 99 81 84 76 79 - -Monaco - - 149x 49x - - - - - - - - - - - - 59 71Mongolia 98 98 19 8 104 105 84 84 79 80 91y 95 84 95 77 88 39 36Montenegro‡ - - - - - - - - - - - - - - - - - -Morocco 66 40 36 12 111 100 89 83 91 87 76 86y 52 43 38 32 8 7Mozambique - - 4 1 104 86 75 67 63 57 49 84 13 9 5 4 51 48
Adult literacy rate2000-2004*
male female
Number per 100population2002-2004*
phones Internet users
Admin. data
2000-2004*
Survey data
1997-2005*
% of primary schoolentrants reaching
grade 5
Primary schoolPrimary school enrolment ratio attendance
ratio2000-2005*(1996-2005*)
gross net net
male female male female male female
Secondary schoolSecondary school enrolment ratio attendance
ratio2000-2005*(1996-2005*)
gross net net
male female male female male female
S T A T I S T I C A L T A B L E S 119

TABLE 5. EDUCATION
Myanmar 94 86 1 0 99 101 89 91 83 84 70 100 41 40 38 37 29 40Namibia 87 83 21 4 100 102 71 76 78 78 88 95 54 62 32 43 - -Nauru - - 29x 3x 84 83 - - - - 31 - 46 50 - - 35 27Nepal 63 35 2 0 118 108 83 73 80 67 61 92 49 42 - - - -Netherlands 77 77 140 62 109 106 99 98 - - 100 - 120 118 89 90 - -New Zealand - - 124 53 102 102 99 99 - - - - 110 119 93 96 35 47Nicaragua - - 17 2 113 111 89 87 77 84 59 63 59 68 38 43 6 6Niger 43 15 1 0 52 37 46 32 36 25 74 89 9 6 8 5 38 33Nigeria - - 8 1 107 91 64 57 66 58 36 97 38 31 30 25 - -Niue - - 84x 48x 80 95 99x 98x - - - - 100 95 91x 96x - -Norway - - 151 39 99 99 99 99 - - 100 - 114 117 96 97 80 83Occupied Palestinian Territory 97 88 36 4 93 93 86 86 91y 92y 98y 99 91 96 87 92 - -Oman 87 74 43 10 88 87 77 79 - - 98 - 88 85 74 75 81 80Pakistan 63 36 6 1 95 69 76 56 62 51 70 90y 31 23 - - - -Palau - - - - 111 91 98 94 - - - - 101 115 - - - -Panama 93 91 39 9 114 111 98 98 - - 84 - 68 73 61 67 - -Papua New Guinea 63 51 1 3 80 70 - - - - 68 - 29 23 - - 23 18Paraguay - - 35 2 108 104 - - 95 96 82 90x 62 63 - - 70 70Peru 93 82 22 12 114 114 97 97 94 94 90 95 91 92 69 69 55 70Philippines 93 93 44 5 113 111 93 95 88 89 75 93 82 90 56 67 - -Poland - - 77 23 99 99 97 98 - - 100 - 96 97 89 92 - -Portugal - - 139 28 119 114 99 99 - - - - 92 102 78 87 - -Qatar 89 89 92 22 102 101 95 94 - - - - 98 95 88 86 - -Romania 98 96 67 21 107 106 92 92 - - 95y - 85 86 80 82 - -Russian Federation 100 99 79 11 123 123 91 92 - - - - 93 93 - - 7 7Rwanda 71 60 2 0 118 120 72 75 75 75 46 78 15 14 - - - -Saint Kitts and Nevis - - 70 21 98 105 91 98 - - 87 - 111 108 100 97 - -Saint Lucia - - 41 37 108 103 99 96 - - 90 - 77 86 68 74 - -Saint Vincent and the Grenadines - - 75 7 109 103 95 92 - - 88 - 79 76 62 63 - -
Samoa - - 13 3 100 100 90 91 - - 94 - 76 85 62 70 - -San Marino - - 140 56 - - - - - - - - - - - - 38 39Sao Tome and Principe - - 8 12 134 132 98 98 83 85 66 69 39 41 25 27 - -Saudi Arabia 87 69 52 6 69 66 62 57 - - 94 - 72 64 54 51 16 10Senegal 51 29 13 5 78 74 68 64 71 67 78 93 22 16 18 13 - -Serbia‡ - - - - - - - - - - - - - - - - - -Seychelles 91 92 87 25 109 110 96 97 - - 99 - 98 106 90 96 14 12Sierra Leone 47 24 2 0 169 122 - - 43 39 - 93 14 14 - - - -Singapore 97 89 133 56 - - - - - - - - - - - - - -Slovakia - - 103 42 100 98 - - - - 98y - 94 95 - - - -Slovenia - - 128 48 123 122 98 98 - - 99y - 100 100 94 95 - -Solomon Islands - - 2 1 121 117 80 79 - - - - 33 26 28 24 1 0Somalia - - 6 0 - - - - 13 11 - 68 - - - - 41 48South Africa 84 81 47 8 107 103 88 89 80 83 84 98y 87 94 58 65 - -Spain - - 131 33 109 107 100 99 - - - - 116 123 95 99 - -Sri Lanka 92 89 16 1 102 101 99 98 - - - - 82 83 - - 19 20Sudan 71 52 6 3 64 56 47 39 60 57 92 71 34 32 - - 40 47Suriname 92 87 67 7 118 121 90 96 88 91 - 84 63 84 53 74 24 33Swaziland 81 78 13 3 103 98 76 77 73 72 77 89 42 42 26 32 - -Sweden - - 180 75 99 99 99 98 - - - - 101 105 97 100 - -Switzerland - - 156 47 103 102 94 94 - - - - 97 89 86 80 - -Syrian Arab Republic 86 74 27 4 126 120 97 92 - - 92 - 65 61 60 56 88 72Tajikistan 100 99 4 0 102 97 99 94 89 88 99y 99 89 75 86 73 7 8Tanzania, United Republic of 78 62 3 1 108 104 92 91 71 75 76 89y 6x 5x - - - -Thailand 95 91 55 11 100 95 - - - - - - 72 74 - - - -The former Yugoslav Republic of Macedonia 98 94 62 8 98 98 92 92 - - 98y - 85 83 82 80 - -
Timor-Leste - - - - - - - - 76y 74y - - - - - - 27 18Togo 69 38 6 4 110 92 85 72 75 65 76 88 52 26 30 14 - -Tonga 99 99 15 3 118 112 92x 89x - - 92 - 94 102 61 75 69 76Trinidad and Tobago - - 74 12 104 101 92 92 96 96 100 98 81 86 70 74 - -Tunisia 83 65 48 8 112 108 97 98 95y 93y 97 92 74 80 66 69 49 36Turkey 95 80 74 14 96 90 92 87 89 88 95 97 90 68 - - 85 85Turkmenistan 99 98 8 1 - - - - 77 75 - 100 - - - - - -Tuvalu - - - 30 95 102 - - - - 70 - 87 81 - - 14 15
Adult literacy rate2000-2004*
male female
Number per 100population2002-2004*
phones Internet users
Admin. data
2000-2004*
Survey data
1997-2005*
% of primary schoolentrants reaching
grade 5
Primary schoolPrimary school enrolment ratio attendance
ratio2000-2005*(1996-2005*)
gross net net
male female male female male female
Secondary schoolSecondary school enrolment ratio attendance
ratio2000-2005*(1996-2005*)
gross net net
male female male female male female
120 T H E S T A T E O F T H E W O R L D ’ S C H I L D R E N 2 0 0 7
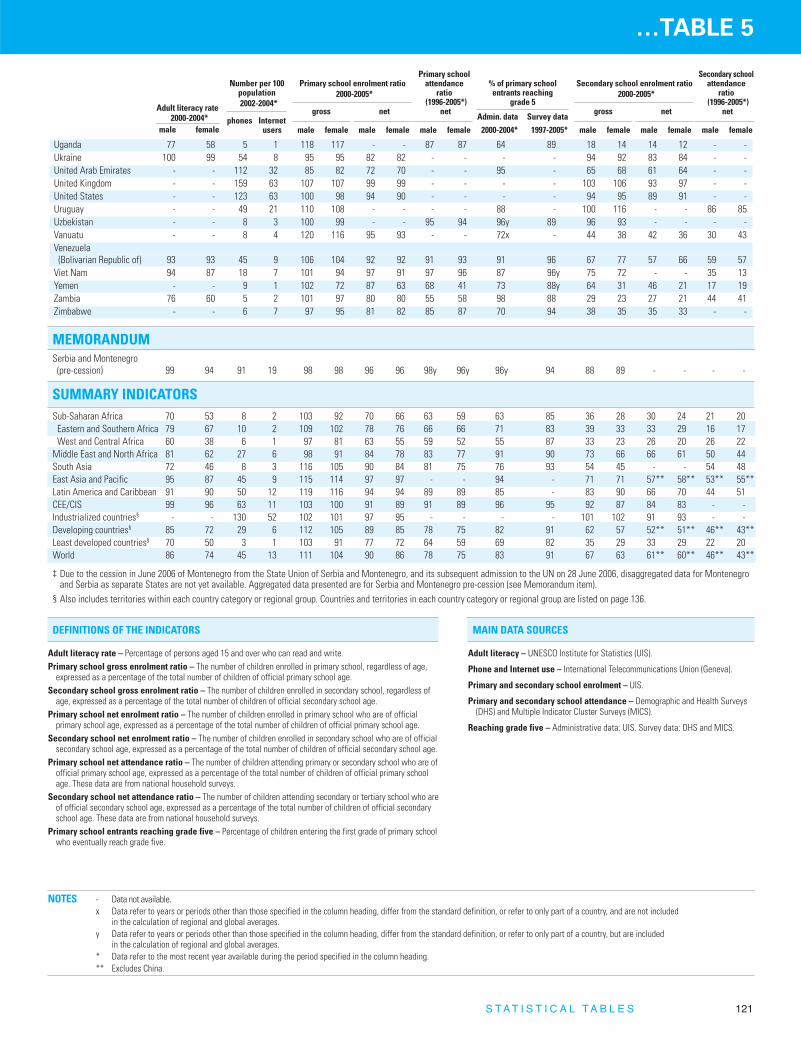
…TABLE 5
Uganda 77 58 5 1 118 117 - - 87 87 64 89 18 14 14 12 - -Ukraine 100 99 54 8 95 95 82 82 - - - - 94 92 83 84 - -United Arab Emirates - - 112 32 85 82 72 70 - - 95 - 65 68 61 64 - -United Kingdom - - 159 63 107 107 99 99 - - - - 103 106 93 97 - -United States - - 123 63 100 98 94 90 - - - - 94 95 89 91 - -Uruguay - - 49 21 110 108 - - - - 88 - 100 116 - - 86 85Uzbekistan - - 8 3 100 99 - - 95 94 96y 89 96 93 - - - -Vanuatu - - 8 4 120 116 95 93 - - 72x - 44 38 42 36 30 43Venezuela(Bolivarian Republic of) 93 93 45 9 106 104 92 92 91 93 91 96 67 77 57 66 59 57
Viet Nam 94 87 18 7 101 94 97 91 97 96 87 96y 75 72 - - 35 13Yemen - - 9 1 102 72 87 63 68 41 73 88y 64 31 46 21 17 19Zambia 76 60 5 2 101 97 80 80 55 58 98 88 29 23 27 21 44 41Zimbabwe - - 6 7 97 95 81 82 85 87 70 94 38 35 35 33 - -
SUMMARY INDICATORSSub-Saharan Africa 70 53 8 2 103 92 70 66 63 59 63 85 36 28 30 24 21 20
Eastern and Southern Africa 79 67 10 2 109 102 78 76 66 66 71 83 39 33 33 29 16 17West and Central Africa 60 38 6 1 97 81 63 55 59 52 55 87 33 23 26 20 26 22
Middle East and North Africa 81 62 27 6 98 91 84 78 83 77 91 90 73 66 66 61 50 44South Asia 72 46 8 3 116 105 90 84 81 75 76 93 54 45 - - 54 48East Asia and Pacific 95 87 45 9 115 114 97 97 - - 94 - 71 71 57** 58** 53** 55**Latin America and Caribbean 91 90 50 12 119 116 94 94 89 89 85 - 83 90 66 70 44 51CEE/CIS 99 96 63 11 103 100 91 89 91 89 96 95 92 87 84 83 - -Industrialized countries§ - - 130 52 102 101 97 95 - - - - 101 102 91 93 - -Developing countries§ 85 72 29 6 112 105 89 85 78 75 82 91 62 57 52** 51** 46** 43**Least developed countries§ 70 50 3 1 103 91 77 72 64 59 69 82 35 29 33 29 22 20World 86 74 45 13 111 104 90 86 78 75 83 91 67 63 61** 60** 46** 43**
‡ Due to the cession in June 2006 of Montenegro from the State Union of Serbia and Montenegro, and its subsequent admission to the UN on 28 June 2006, disaggregated data for Montenegroand Serbia as separate States are not yet available. Aggregated data presented are for Serbia and Montenegro pre-cession (see Memorandum item).
§ Also includes territories within each country category or regional group. Countries and territories in each country category or regional group are listed on page 136.
NOTES - Data not available.x Data refer to years or periods other than those specified in the column heading, differ from the standard definition, or refer to only part of a country, and are not included
in the calculation of regional and global averages.y Data refer to years or periods other than those specified in the column heading, differ from the standard definition, or refer to only part of a country, but are included
in the calculation of regional and global averages.* Data refer to the most recent year available during the period specified in the column heading.** Excludes China.
MAIN DATA SOURCES
Adult literacy – UNESCO Institute for Statistics (UIS).
Phone and Internet use – International Telecommunications Union (Geneva).
Primary and secondary school enrolment – UIS.
Primary and secondary school attendance – Demographic and Health Surveys(DHS) and Multiple Indicator Cluster Surveys (MICS).
Reaching grade five – Administrative data: UIS. Survey data: DHS and MICS.
DEFINITIONS OF THE INDICATORS
Adult literacy rate – Percentage of persons aged 15 and over who can read and write.Primary school gross enrolment ratio – The number of children enrolled in primary school, regardless of age,
expressed as a percentage of the total number of children of official primary school age.Secondary school gross enrolment ratio – The number of children enrolled in secondary school, regardless of
age, expressed as a percentage of the total number of children of official secondary school age.Primary school net enrolment ratio – The number of children enrolled in primary school who are of official
primary school age, expressed as a percentage of the total number of children of official primary school age.Secondary school net enrolment ratio – The number of children enrolled in secondary school who are of official
secondary school age, expressed as a percentage of the total number of children of official secondary school age.Primary school net attendance ratio – The number of children attending primary or secondary school who are of
official primary school age, expressed as a percentage of the total number of children of official primary schoolage. These data are from national household surveys.
Secondary school net attendance ratio – The number of children attending secondary or tertiary school who areof official secondary school age, expressed as a percentage of the total number of children of official secondaryschool age. These data are from national household surveys.
Primary school entrants reaching grade five – Percentage of children entering the first grade of primary schoolwho eventually reach grade five.
Adult literacy rate2000-2004*
male female
Number per 100population2002-2004*
phones Internet users
Admin. data
2000-2004*
Survey data
1997-2005*
% of primary schoolentrants reaching
grade 5
Primary schoolPrimary school enrolment ratio attendance
ratio2000-2005*(1996-2005*)
gross net net
male female male female male female
Secondary schoolSecondary school enrolment ratio attendance
ratio2000-2005*(1996-2005*)
gross net net
male female male female male female
MEMORANDUMSerbia and Montenegro
(pre-cession) 99 94 91 19 98 98 96 96 98y 96y 96y 94 88 89 - - - -
S T A T I S T I C A L T A B L E S 121

TABLE 6. DEMOGRAPHIC INDICATORS
Afghanistan 15849 5535 0.7 4.8 26 21 19 51 51 49 39 45 47 7.3 24 3.3 6.7Albania 1034 253 2.2 -0.3 8 6 7 33 24 17 67 72 74 2.2 45 2.8 1.1Algeria 11983 3160 3.0 1.7 16 7 5 49 32 21 53 67 72 2.4 60 4.4 2.8Andorra 12 3 3.8 1.7 - - - - - - - - - .- 91 3.8 1.4Angola 8502 2974 2.7 2.8 28 25 22 52 53 48 37 40 41 6.6 37 5.5 5.1Antigua and Barbuda 27 8 -0.2 1.7 - - - - - - - - - .- 38 0.0 2.2Argentina 12277 3340 1.5 1.2 9 8 8 23 22 18 66 71 75 2.3 91 2.0 1.4Armenia 819 162 1.7 -1.1 5 8 9 23 21 11 70 68 72 1.3 64 2.3 -1.4Australia 4797 1253 1.4 1.2 9 7 7 20 15 12 71 77 81 1.7 93 1.4 1.8Austria 1552 384 0.2 0.4 13 11 10 15 12 9 70 76 79 1.4 66 0.2 0.4Azerbaijan 2736 602 1.7 1.0 7 7 7 29 27 16 65 66 67 1.8 50 2.0 0.5Bahamas 108 30 2.0 1.6 7 7 7 31 24 19 66 68 71 2.2 90 2.8 2.1Bahrain 232 65 4.0 2.6 9 4 3 40 29 18 62 71 75 2.4 90 4.2 2.7Bangladesh 59402 17399 2.4 2.1 21 12 8 45 35 26 44 55 64 3.1 25 7.1 3.6Barbados 63 16 0.4 0.3 9 9 8 22 15 12 69 75 76 1.5 53 0.8 1.4Belarus 1967 449 0.6 -0.3 7 11 15 16 14 9 71 71 68 1.2 72 2.7 0.2Belgium 2120 563 0.2 0.3 12 11 10 14 12 11 71 76 79 1.7 97 0.3 0.4Belize 117 34 2.1 2.5 8 5 5 40 35 26 66 72 72 3.0 49 1.8 2.6Benin 4300 1441 3.0 3.3 22 15 12 47 47 41 46 53 55 5.6 46 6.7 5.2Bhutan 983 293 2.2 1.8 23 14 8 43 39 30 41 54 64 4.1 9 5.1 5.3Bolivia 4090 1239 2.3 2.1 20 11 8 46 36 29 46 59 65 3.7 64 4.0 3.1Bosnia and Herzegovina 807 186 0.9 -0.7 7 7 9 23 15 9 66 72 74 1.3 45 2.8 0.3Botswana 800 218 3.2 1.4 13 6 28 48 34 26 55 66 34 3.0 53 11.5 2.8Brazil 62229 18024 2.2 1.5 11 7 7 35 24 20 59 66 71 2.3 84 3.7 2.3Brunei Darussalam 130 40 3.4 2.5 7 3 3 36 28 23 67 74 77 2.4 78 3.7 3.6Bulgaria 1366 335 0.1 -0.8 9 12 14 16 12 9 71 71 73 1.2 70 1.4 -0.4Burkina Faso 7176 2459 2.4 2.9 23 18 16 50 50 47 43 48 48 6.5 19 6.6 5.0Burundi 3969 1326 2.4 1.9 20 20 18 44 47 46 44 45 44 6.8 11 7.2 5.4Cambodia 6242 1835 1.7 2.5 20 13 11 42 44 30 44 55 57 3.9 20 2.1 5.4Cameroon 7881 2453 2.8 2.2 21 14 17 45 42 35 44 53 46 4.4 53 6.2 4.1Canada 6970 1698 1.2 1.0 7 7 7 17 14 10 73 78 80 1.5 81 1.3 1.4Cape Verde 238 72 1.4 2.4 12 8 5 40 39 30 57 65 71 3.6 58 5.5 4.1Central African Republic 2021 640 2.4 2.0 22 17 22 43 42 37 42 49 39 4.8 44 3.4 3.0Chad 5257 1867 2.4 3.2 25 19 20 48 48 49 40 46 44 6.7 26 5.3 4.5Chile 4945 1237 1.6 1.4 10 6 5 29 23 15 62 73 78 2.0 88 2.1 1.8China 352718 84483 1.6 0.9 8 7 7 33 21 13 62 68 72 1.7 41 3.9 3.5Colombia 16755 4726 2.2 1.8 9 7 5 38 27 21 61 68 73 2.5 77 3.2 2.6Comoros 387 127 3.3 2.8 18 11 7 50 41 35 48 56 64 4.6 36 5.1 4.5Congo 2153 750 3.2 3.2 14 12 13 44 44 44 54 55 53 6.3 54 5.1 4.0Congo, Democratic Republic of the 31071 11209 3.0 2.8 20 19 20 48 49 50 45 46 44 6.7 33 2.6 3.9Cook Islands 7 2 -0.8 -0.2 - - - - - - - - - .- 73 -0.4 1.4Costa Rica 1496 393 2.6 2.3 7 4 4 33 27 18 67 75 78 2.2 62 4.2 3.2Côte d’Ivoire 8908 2773 4.3 2.4 18 14 17 51 45 37 49 52 46 4.8 46 6.2 3.3Croatia 873 207 0.4 0.1 10 11 12 15 12 9 69 72 75 1.3 60 1.9 0.7Cuba 2666 682 1.1 0.4 7 7 7 30 17 12 70 74 78 1.6 76 2.1 0.7Cyprus 205 49 0.5 1.4 10 8 7 19 19 12 71 77 79 1.6 69 2.8 1.8Czech Republic 1882 453 0.2 -0.1 13 12 11 16 12 9 70 72 76 1.2 75 2.1 -0.1Denmark 1211 326 0.2 0.4 10 12 11 16 12 11 73 75 78 1.8 86 0.5 0.4Djibouti 383 120 6.2 2.3 21 15 12 49 43 34 43 51 53 4.8 85 7.6 3.1Dominica 27 7 0.1 0.6 - - - - - - - - - .- 73 1.9 1.1Dominican Republic 3481 1003 2.4 1.5 11 7 6 42 30 24 58 65 68 2.6 60 3.9 2.1Ecuador 5100 1445 2.7 1.7 12 6 5 42 29 22 58 68 75 2.7 63 4.4 2.6Egypt 29691 8933 2.3 1.9 17 9 6 40 32 26 51 63 70 3.1 42 2.4 1.7El Salvador 2750 805 1.8 2.0 12 7 6 44 30 24 57 65 71 2.8 60 2.9 3.3Equatorial Guinea 257 88 0.9 2.4 25 20 21 42 44 43 40 46 42 5.9 50 2.2 4.8Eritrea 2266 759 2.5 2.5 21 16 11 47 42 39 43 48 55 5.3 21 4.0 4.3Estonia 265 64 0.7 -1.2 11 13 14 15 14 10 71 70 72 1.4 70 1.2 -1.3Ethiopia 39792 13063 2.7 2.8 21 18 16 49 47 40 43 47 48 5.7 16 4.6 4.4Fiji 317 92 1.6 1.1 8 6 6 34 29 23 60 67 68 2.8 53 2.5 2.7
Population(thousands)
2005
under under18 5
Populationannual
growth rate(%)
1970-1990 1990-2005
Crudedeath rate
1970 1990 2005
Crudebirth rate
1970 1990 2005
Lifeexpectancy
1970 1990 2005
Totalfertility
rate2005
% ofpopulationurbanized
2005
Averageannual
growth rateof urban
population (%)
1970-1990 1990-2005Countries and territories
122 T H E S T A T E O F T H E W O R L D ’ S C H I L D R E N 2 0 0 7

…TABLE 6
Finland 1100 279 0.4 0.3 10 10 10 14 13 11 70 75 79 1.7 61 1.4 0.3France 13271 3727 0.6 0.4 11 9 9 17 13 12 72 77 80 1.9 77 0.8 0.7Gabon 651 193 3.0 2.5 21 11 13 35 39 30 47 60 54 3.8 85 6.9 3.9Gambia 704 231 3.5 3.2 28 16 11 50 43 34 36 50 57 4.5 26 6.0 3.6Georgia 1080 242 0.7 -1.3 9 9 11 19 16 11 68 71 71 1.4 51 1.5 -1.8Germany 14707 3545 0.1 0.3 12 11 10 14 11 8 71 76 79 1.3 88 0.4 0.5Ghana 10159 3102 2.7 2.4 17 12 11 46 40 31 49 56 57 4.1 46 3.9 4.0Greece 1944 514 0.7 0.6 8 9 10 17 10 9 72 77 78 1.2 61 1.3 0.9Grenada 35 10 0.1 0.4 - - - - - - - - - .- 42 0.1 2.2Guatemala 6297 2020 2.5 2.3 15 9 6 44 39 35 52 61 68 4.4 47 3.2 3.2Guinea 4723 1590 2.2 2.8 27 18 13 50 45 41 38 47 54 5.7 36 5.2 5.2Guinea-Bissau 856 310 2.8 3.0 29 23 20 49 50 50 36 42 45 7.1 36 5.0 5.7Guyana 261 75 0.1 0.2 11 10 9 38 25 21 60 60 64 2.2 38 0.7 1.2Haiti 3846 1147 2.1 1.4 19 16 13 39 38 30 47 49 52 3.8 39 4.1 3.3Holy See - - .- .- - - - - - - - - - .- 100 .- .-Honduras 3317 979 3.2 2.6 15 7 6 48 38 29 52 65 68 3.5 46 4.8 3.6Hungary 1965 477 0.0 -0.2 11 14 13 15 12 9 69 69 73 1.3 66 1.2 0.2Iceland 78 21 1.1 1.0 7 7 6 21 18 14 74 78 81 1.9 93 1.4 1.1India 420678 120011 2.1 1.7 17 11 9 40 31 23 49 58 64 2.9 29 3.4 2.5Indonesia 75641 21571 2.1 1.4 17 9 7 41 26 20 48 62 68 2.3 48 5.0 4.4Iran (Islamic Republic of) 25243 6035 3.4 1.4 14 7 5 43 35 19 54 65 71 2.1 68 4.9 2.6Iraq 13759 4322 3.0 2.9 12 8 9 46 39 34 56 63 60 4.5 67 4.1 2.7Ireland 1007 303 0.9 1.1 11 9 7 22 15 16 71 75 78 2.0 60 1.3 1.5Israel 2200 666 2.2 2.7 7 6 6 27 22 20 71 76 80 2.8 92 2.6 2.8Italy 9837 2662 0.3 0.2 10 10 10 17 10 9 72 77 80 1.3 68 0.4 0.2Jamaica 992 258 1.2 0.7 8 7 8 35 25 20 68 72 71 2.4 52 2.3 0.8Japan 21770 5871 0.8 0.2 7 7 8 19 10 9 72 79 82 1.3 66 1.7 0.5Jordan 2477 732 3.5 3.7 16 6 4 52 37 26 54 67 72 3.3 79 4.7 4.4Kazakhstan 4394 1075 1.1 -0.7 9 8 11 26 22 16 62 67 64 1.9 56 1.8 -0.8Kenya 17214 5736 3.7 2.5 15 10 15 51 42 39 52 59 48 5.0 42 8.0 6.0Kiribati 39 12 2.5 2.2 - - - - - - - - - .- 50 4.0 4.6Korea, Democratic People’s Republic of 6756 1723 1.6 0.9 9 8 11 33 21 15 61 65 64 2.0 62 1.9 1.3Korea, Republic of 10795 2412 1.5 0.7 9 6 6 31 16 10 60 71 78 1.2 81 4.5 1.3Kuwait 764 241 5.3 1.5 6 2 2 48 24 19 66 75 77 2.3 96 6.3 1.6Kyrgyzstan 2016 541 2.0 1.2 11 8 7 31 31 22 60 66 67 2.6 34 2.0 0.5Lao People’s Democratic Republic 2830 895 2.1 2.4 23 17 12 44 43 35 40 50 55 4.6 22 4.5 4.7Latvia 448 101 0.7 -1.1 11 14 13 14 14 9 70 69 72 1.3 66 1.3 -1.5Lebanon 1225 322 0.7 1.8 8 8 7 33 26 18 65 69 72 2.2 88 2.4 2.2Lesotho 840 231 2.2 0.8 17 11 26 42 36 28 49 58 34 3.4 18 5.6 1.2Liberia 1769 631 2.2 2.9 22 21 21 50 50 50 42 43 42 6.8 48 4.6 3.7Libyan Arab Jamahiriya 2119 636 3.9 2.0 16 5 4 49 28 23 51 68 74 2.9 87 6.7 2.6Liechtenstein 7 2 1.5 1.2 - - - - - - - - - .- 22 1.6 1.5Lithuania 745 150 0.8 -0.5 9 11 12 17 15 9 71 71 73 1.3 67 2.4 -0.6Luxembourg 104 29 0.5 1.4 12 10 8 13 13 12 70 75 79 1.7 92 1.7 1.8Madagascar 9412 3106 2.8 2.9 21 15 12 47 44 38 44 51 56 5.1 27 5.3 3.8Malawi 6945 2340 3.7 2.1 24 19 21 56 51 43 41 46 40 5.9 17 7.0 4.6Malaysia 9603 2734 2.5 2.3 10 5 5 37 31 22 61 70 74 2.8 65 4.5 4.1Maldives 158 46 2.9 2.8 17 10 6 40 41 30 50 60 67 4.0 30 6.1 3.7Mali 7439 2602 2.5 2.8 28 20 17 55 50 49 37 46 48 6.8 34 5.0 5.1Malta 88 20 0.9 0.7 9 8 8 17 15 10 70 76 79 1.5 92 1.5 1.1Marshall Islands 24 7 4.2 1.8 - - - - - - - - - .- 67 4.3 2.0Mauritania 1513 526 2.4 2.8 21 17 14 46 43 41 42 49 53 5.6 64 8.2 5.3Mauritius 364 98 1.2 1.1 7 6 7 28 20 16 62 69 73 2.0 44 1.0 1.6Mexico 39654 10857 2.6 1.6 10 5 4 45 29 20 61 71 76 2.3 76 3.6 1.9Micronesia (Federated States of) 51 16 2.2 0.9 9 7 6 41 34 30 62 66 68 4.3 30 2.7 1.8Moldova, Republic of 1009 207 1.0 -0.2 10 10 11 18 19 10 65 68 69 1.2 46 2.9 -0.3Monaco 7 2 1.2 1.0 - - - - - - - - - .- 100 1.2 1.0Mongolia 998 270 2.8 1.2 14 9 7 42 32 22 53 61 65 2.3 57 4.0 1.2Montenegro‡ - - .- .- - - - - - - - - - .- - .- .-
Population(thousands)
2005
under under18 5
Populationannual
growth rate(%)
1970-1990 1990-2005
Crudedeath rate
1970 1990 2005
Crudebirth rate
1970 1990 2005
Lifeexpectancy
1970 1990 2005
Totalfertility
rate2005
% ofpopulationurbanized
2005
Averageannual
growth rateof urban
population (%)
1970-1990 1990-2005
S T A T I S T I C A L T A B L E S 123

TABLE 6. DEMOGRAPHIC INDICATORS
Morocco 11743 3378 2.4 1.6 17 8 6 47 29 23 52 64 70 2.7 59 4.1 2.9Mozambique 10049 3291 1.8 2.6 24 21 20 48 44 39 40 43 42 5.3 38 8.3 6.5Myanmar 17962 4657 2.1 1.4 18 12 9 41 31 19 48 56 61 2.2 31 2.5 2.8Namibia 993 268 3.0 2.5 15 9 16 43 42 27 53 62 46 3.7 33 4.8 4.0Nauru 5 2 1.9 2.4 - - - - - - - - - .- 100 1.9 2.4Nepal 12395 3639 2.3 2.3 21 13 8 42 39 29 43 54 62 3.5 16 6.4 6.1Netherlands 3559 973 0.7 0.6 8 9 9 17 13 11 74 77 79 1.7 67 1.0 1.3New Zealand 1048 274 1.0 1.1 9 8 7 22 17 14 71 75 79 2.0 86 1.2 1.2Nicaragua 2526 731 2.9 2.2 14 7 5 48 38 28 54 64 70 3.1 58 3.5 2.8Niger 7765 2851 3.1 3.3 28 26 20 58 57 54 38 40 45 7.7 23 6.3 5.8Nigeria 67371 22257 2.8 2.5 22 18 19 47 47 41 42 47 44 5.6 48 5.5 4.6Niue 1 0 .- .- - - - - - - - - - .- 37 .- .-Norway 1083 283 0.4 0.6 10 11 9 17 14 12 74 77 80 1.8 80 0.9 1.3Occupied Palestinian Territory 1938 646 3.4 3.6 19 7 4 50 46 37 54 69 73 5.3 72 4.4 4.2Oman 1054 301 4.5 2.2 17 4 3 50 38 25 50 70 75 3.4 79 13.0 3.8Pakistan 71800 21115 3.1 2.3 16 11 8 43 41 30 51 60 64 4.0 35 4.2 3.2Palau 8 2 1.5 1.8 - - - - - - - - - .- 68 2.4 1.7Panama 1163 343 2.4 2.0 8 5 5 38 26 22 65 72 75 2.6 58 3.0 2.4Papua New Guinea 2751 815 2.4 2.4 19 13 10 42 38 30 44 52 56 3.8 13 3.9 2.4Paraguay 2722 825 2.9 2.5 9 6 5 37 35 29 65 68 71 3.7 58 4.3 3.7Peru 10722 2997 2.5 1.7 14 7 6 42 30 22 53 65 71 2.7 75 3.4 2.2Philippines 34622 9863 2.6 2.0 11 7 5 40 33 24 57 65 71 3.0 63 4.5 3.7Poland 7984 1811 0.8 0.1 8 10 10 17 15 9 70 71 75 1.2 62 1.5 0.2Portugal 2007 561 0.7 0.3 11 10 11 21 12 11 67 74 78 1.5 56 3.6 1.5Qatar 204 67 7.2 3.7 13 3 3 34 23 18 61 69 73 2.9 92 7.5 3.9Romania 4366 1054 0.7 -0.4 9 11 12 21 14 10 68 69 72 1.3 55 2.1 -0.3Russian Federation 28830 7225 0.6 -0.2 9 12 16 15 13 11 70 69 65 1.4 73 1.5 -0.2Rwanda 4658 1500 3.2 1.6 21 33 18 53 48 41 44 32 44 5.5 22 5.7 11.0Saint Kitts and Nevis 14 4 -0.5 0.3 - - - - - - - - - .- 32 -0.4 -0.2Saint Lucia 56 14 1.4 1.0 8 7 7 41 26 19 64 71 73 2.2 31 2.2 2.1Saint Vincent and the Grenadines 43 12 0.9 0.6 11 7 7 40 25 20 61 69 71 2.2 60 3.0 3.2Samoa 88 26 0.6 0.9 10 7 6 39 34 27 55 65 71 4.2 22 0.9 1.2San Marino 5 1 1.2 1.0 - - - - - - - - - .- 89 3.1 0.9Sao Tome and Principe 73 23 2.3 2.0 13 10 8 47 37 33 56 62 63 3.8 38 4.4 2.2Saudi Arabia 10690 3200 5.2 2.7 18 5 4 48 36 27 52 68 72 3.8 88 7.6 3.5Senegal 5804 1845 2.8 2.5 25 14 11 49 44 36 39 53 56 4.8 51 3.7 4.1Serbia‡ - - .- .- - - - - - - - - - .- - .- .-Seychelles 41 14 1.4 0.8 - - - - - - - - - .- 50 4.6 0.8Sierra Leone 2722 958 2.1 2.0 29 26 23 48 48 46 35 39 41 6.5 40 4.8 4.0Singapore 1023 216 1.9 2.4 5 5 5 23 18 9 69 75 79 1.3 100 1.9 2.4Slovakia 1142 255 0.7 0.2 10 10 10 19 15 9 70 72 74 1.2 58 2.3 0.4Slovenia 345 86 0.7 0.1 10 10 10 17 11 9 69 73 77 1.2 51 2.3 0.2Solomon Islands 227 72 3.4 2.7 10 9 7 46 38 32 54 61 63 4.1 17 5.5 4.2Somalia 4152 1482 3.1 1.4 25 22 17 51 46 44 40 42 47 6.2 36 4.4 2.7South Africa 18417 5223 2.4 1.7 14 8 19 38 29 23 53 62 46 2.7 58 2.5 2.8Spain 7457 2217 0.8 0.6 9 9 9 20 10 11 72 77 80 1.3 77 1.4 0.7Sri Lanka 6054 1628 1.7 1.0 9 6 6 31 21 16 62 71 74 1.9 21 1.5 0.9Sudan 16547 5216 2.9 2.2 21 14 11 47 39 32 44 53 57 4.2 41 5.3 5.0Suriname 161 45 0.4 0.7 8 7 7 37 24 20 63 68 70 2.5 77 2.1 1.8Swaziland 514 136 3.2 1.2 18 10 30 50 41 29 48 58 30 3.7 24 7.5 1.5Sweden 1943 488 0.3 0.4 10 11 10 14 14 11 74 78 80 1.7 83 0.4 0.4Switzerland 1458 353 0.5 0.4 9 9 9 16 12 9 73 78 81 1.4 68 1.6 0.3Syrian Arab Republic 8375 2526 3.5 2.6 13 5 3 47 36 28 55 68 74 3.3 50 4.1 2.8Tajikistan 3055 834 2.9 1.4 10 8 7 40 39 28 60 63 64 3.6 24 2.2 -0.4Tanzania, United Republic of 19070 6045 3.3 2.5 17 13 17 48 44 37 48 54 46 4.8 38 9.2 6.2Thailand 18522 5012 2.1 1.1 9 6 7 37 21 16 60 68 71 1.9 32 3.8 1.7The former Yugoslav Republic of Macedonia 494 117 1.0 0.4 8 8 9 24 17 11 66 71 74 1.5 60 2.0 0.6Timor-Leste 463 179 1.0 1.6 22 18 12 46 40 51 40 45 56 7.8 8 0.1 1.6Togo 3095 1014 3.1 2.9 18 12 12 48 44 38 48 58 55 5.1 36 7.0 4.5
Population(thousands)
2005
under under18 5
Populationannual
growth rate(%)
1970-1990 1990-2005
Crudedeath rate
1970 1990 2005
Crudebirth rate
1970 1990 2005
Lifeexpectancy
1970 1990 2005
Totalfertility
rate2005
% ofpopulationurbanized
2005
Averageannual
growth rateof urban
population (%)
1970-1990 1990-2005
124 T H E S T A T E O F T H E W O R L D ’ S C H I L D R E N 2 0 0 7

…TABLE 6
Tonga 43 12 -0.2 0.5 6 6 6 37 30 23 65 70 73 3.3 34 1.6 1.1Trinidad and Tobago 355 90 1.1 0.5 7 7 8 27 20 14 66 72 70 1.6 76 1.6 1.1Tunisia 3259 806 2.4 1.4 14 6 5 39 27 16 54 69 74 1.9 64 3.7 2.1Turkey 25348 7212 2.3 1.6 12 8 7 39 25 20 56 65 69 2.4 67 4.5 2.5Turkmenistan 1882 488 2.6 1.8 11 8 8 37 35 22 58 63 63 2.6 46 2.3 1.9Tuvalu 4 1 1.3 0.7 - - - - - - - - - .- 57 4.6 2.9Uganda 16539 5970 3.2 3.2 16 18 15 50 50 51 50 46 49 7.1 12 4.9 3.9Ukraine 9084 1924 0.5 -0.7 9 13 17 15 13 8 71 69 66 1.1 67 1.5 -0.7United Arab Emirates 1192 337 10.6 5.9 11 3 1 36 27 16 61 73 79 2.4 85 10.7 6.1United Kingdom 13117 3367 0.2 0.3 12 11 10 16 14 11 72 76 79 1.7 89 0.9 0.4United States 74926 20408 1.0 1.0 9 9 8 17 16 14 71 75 78 2.0 81 1.1 1.5Uruguay 1001 282 0.5 0.7 10 10 9 21 18 16 69 72 76 2.3 93 0.9 1.0Uzbekistan 10742 2841 2.7 1.7 10 7 7 37 35 23 63 67 67 2.6 36 3.1 1.1Vanuatu 99 30 2.8 2.3 14 7 5 43 37 30 53 64 69 3.9 24 4.5 3.9Venezuela (Bolivarian Republic of) 9988 2860 3.1 2.0 7 5 5 37 29 22 65 71 73 2.6 88 3.9 2.3Viet Nam 30496 7969 2.2 1.6 18 8 6 41 31 20 49 65 71 2.2 27 2.7 3.5Yemen 11252 3668 3.2 3.7 26 13 8 54 51 40 38 54 62 5.9 26 5.6 5.1Zambia 6215 2011 3.3 2.2 17 17 22 51 46 40 49 47 38 5.4 37 4.7 1.7Zimbabwe 6256 1752 3.5 1.4 13 9 23 49 38 29 55 60 37 3.4 36 6.1 2.8
SUMMARY INDICATORSSub-Saharan Africa 361301 119555 2.9 2.5 20 16 17 48 45 40 45 50 46 5.4 37 4.8 4.3
Eastern and Southern Africa 177395 57670 2.9 2.4 19 15 17 47 43 38 47 51 46 5.0 31 4.7 4.2West and Central Africa 183906 61885 2.8 2.6 22 18 18 48 47 42 43 48 46 5.7 42 4.9 4.4
Middle East and North Africa 154130 44711 3.0 2.1 16 8 6 45 35 26 52 63 69 3.1 58 4.4 2.9South Asia 587319 169666 2.2 1.9 17 11 9 40 33 25 49 58 64 3.1 29 3.7 2.8East Asia and Pacific 572465 144948 1.8 1.1 10 7 7 35 22 15 59 66 71 1.9 43 3.9 3.4Latin America and Caribbean 199284 56538 2.2 1.6 11 7 6 37 27 21 60 68 72 2.5 77 3.3 2.2CEE/CIS 104278 26562 1.0 0.2 9 11 12 21 18 14 67 68 67 1.7 63 2.0 0.2Industrialized countries§ 204366 54239 0.7 0.6 10 9 9 17 13 11 71 76 79 1.6 77 1.1 0.9Developing countries§ 1928976 550130 2.1 1.6 13 9 9 38 29 23 55 62 65 2.8 43 3.8 3.0Least developed countries§ 368348 119352 2.5 2.5 21 16 14 47 43 37 44 50 53 4.9 28 4.9 4.4World 2183143 616219 1.8 1.4 12 10 9 32 26 21 59 65 68 2.6 49 2.7 2.2
‡ Due to the cession in June 2006 of Montenegro from the State Union of Serbia and Montenegro, and its subsequent admission to the UN on 28 June 2006, disaggregated data for Montenegroand Serbia as separate States are not yet available. Aggregated data presented are for Serbia and Montenegro pre-cession (see Memorandum item).
§ Also includes territories within each country category or regional group. Countries and territories in each country category or regional group are listed on page 136.
MAIN DATA SOURCES
Child population – United Nations Population Division.
Crude death and birth rates – United Nations Population Division.
Life expectancy – United Nations Population Division.
Fertility – United Nations Population Division.
Urban population – United Nations Population Division.
DEFINITIONS OF THE INDICATORS
Life expectancy at birth – The number of years newborn children would live if subject to themortality risks prevailing for the cross section of population at the time of their birth.
Crude death rate – Annual number of deaths per 1,000 population.
Crude birth rate – Annual number of births per 1,000 population.
Total fertility rate – The number of children that would be born per woman if she were to live tothe end of her childbearing years and bear children at each age in accordance with prevailing age-specific fertility rates.
Urban population – Percentage of population living in urban areas as defined according to thenational definition used in the most recent population census.
NOTES - Data not available.
MEMORANDUMSerbia and Montenegro (pre-cession) 2376 608 0.8 0.2 9 10 11 19 15 12 68 72 74 1.6 52 2.1 0.4
Population(thousands)
2005
under under18 5
Populationannual
growth rate(%)
1970-1990 1990-2005
Crudedeath rate
1970 1990 2005
Crudebirth rate
1970 1990 2005
Lifeexpectancy
1970 1990 2005
Totalfertility
rate2005
% ofpopulationurbanized
2005
Averageannual
growth rateof urban
population (%)
1970-1990 1990-2005
S T A T I S T I C A L T A B L E S 125

TABLE 7. ECONOMIC INDICATORS
Afghanistan 250x 1.6x - - - - - - 2190 40 - -Albania 2580 -0.7x 5.2 22 <2 4 2 4 362 5 4x 2xAlgeria 2730 1.6 1.1 14 <2 4 24 17 313 0 62 19xAndorra d - - - - - - - - - - -Angola 1350 0.4x 1.4 407 - 6x 15x 34x 1144 8 7 15Antigua and Barbuda 10920 6.5x 1.7 2 - - - - 2 0 - -Argentina 4470 -0.7 1.1 5 7 5 5 3 91 0 30 14Armenia 1470 - 4.4 89 <2 - - - 254 8 - 5Australia 32220 1.6 2.5 2 - 14 9 6 - - - -Austria 36980 2.4 1.8 2 - 14 10 2 - - - -Azerbaijan 1240 - 0.0 88 <2 1 3 11 176 2 - 4Bahamas 14920x 1.8 0.4x 3x - 16 20 3 - - - -Bahrain 10840x -1.3x 2.3 2 - 8 15 16 104 1 - -Bangladesh 470 0.6 2.9 4 36 7 18 10 1404 2 17 5Barbados 9270x 1.8 1.5 3x - - - - 29 - 14 5Belarus 2760 - 2.2 201 <2 3 4 3 - - - 1Belgium 35700 2.2 1.7 2 - 16 3 3 - - - -Belize 3500 2.9 2.3 1 - 8 20 5 7 1 5 62Benin 510 0.0 1.4 6 31 6x 31x 17x 378 10 7 6xBhutan 870 6.4x 3.0 8 - 8 13 0 78 12 5x 5xBolivia 1010 -1.1 1.3 7 23 10 22 6 767 9 31 18Bosnia and Herzegovina 2440 - 12.7x 3x - - - - 671 8 - 3Botswana 5180 8.3 3.8 8 24x 5 26 8 39 1 4 1xBrazil 3460 2.3 1.1 90 8 6 6 3 285 0 19 40Brunei Darussalam 24100x - - - - - - - - - - -Bulgaria 3450 3.4x 1.5 61 <2 12 5 6 - - 5x 15Burkina Faso 400 1.4 1.3 4 27 7x 17x 14x 610 14 6 10xBurundi 100 1.1 -2.8 12 55 2 15 23 351 52 41 63xCambodia 380 - 4.7x 3x 34 - - - 478 10 - 0Cameroon 1010 3.4 0.6 5x 17 3 12 10 762 6 18 11xCanada 32600 2.0 2.3 2 - 9 2 6 - - - -Cape Verde 1870 - 3.4 4 - - - - 140 16 5 5xCentral African Republic 350 -1.3 -0.6 3 67x - - - 105 9 8 12xChad 400 -0.9 1.7 6 - 8x 8x - 319 14 2 7xChile 5870 1.5 3.8 7 <2 14 18 7 49 0 20 24China 1740 6.6 8.8 5 17 0 2 12 1661 0 10 3Colombia 2290 2.0 0.6 16 7 9 20 13 509 1 39 32Comoros 640 0.1x -0.5 4 - - - - 25 8 2 3xCongo 950 3.1 -1.0 7 - 4 4 10 116 4 32 3xCongo, Democratic Republic of the 120 -2.4 -5.2 447 - 0 0 18 1815 28 5x 0xCook Islands - - - - - - - - 9 - - -Costa Rica 4590 0.7 2.3 14 2 21 22 0 13 0 21 7Côte d’Ivoire 840 -1.9 -0.5 6 15 4x 21x 4x 154 1 26 5Croatia 8060 - 2.5 41 <2 13 8 4 121 0 - 27Cuba 1170x - 3.5x 4x - 23x 10x - 90 - - -Cyprus 17580x 6.1x 2.5x 4x - 6 12 4 - - - -Czech Republic 10710 - 1.9 8 <2 17 10 5 - - - 10Denmark 47390 1.5 1.8 2 - 1 12 5 - - - -Djibouti 1020 - -2.4 3 - - - - 64 9 - 4xDominica 3790 4.7x 1.0 2 - - - - 29 11 4 13xDominican Republic 2370 2.0 3.8 11 3 10 13 4 87 0 7 6Ecuador 2630 1.3 0.7 4 16 11x 18x 13x 160 1 27 33Egypt 1250 4.3 2.6 7 3 3 15 9 1458 2 18 7El Salvador 2450 -1.8 1.6 5 19 13 15 3 211 1 14 8Equatorial Guinea c - 16.6x 17x - - - - 30 - 3 0xEritrea 220 - 0.3 11x - - - - 260 32 - 13xEstonia 9100 1.5x 4.2 28 <2 16 7 5 - - - 15Ethiopia 160 - 1.5 4 23 6 16 9 1823 24 33 5Fiji 3280 0.6x 1.3x 3x - 9 18 6 64 3 12 6xFinland 37460 2.9 2.6 2 - 3 10 4 - - - -France 34810 2.2 1.7 1 - 16x 7x 6x - - - -
GNI percapita(US$)2005
% ofpopulationbelow $1
a day1994-2004*
% of central governmentexpenditure (1994-2004*)
allocated to:
health education defence
ODA inflowin millions
US$2004
ODA inflowas a % ofrecipient
GNI2004
Debt serviceas a % ofexports of
goods and services
1990 2004
GDP per capitaaverage annualgrowth rate (%)
1970-1990 1990-2005
Averageannual rate of
inflation(%)
1990-2005Countries and territories
126 T H E S T A T E O F T H E W O R L D ’ S C H I L D R E N 2 0 0 7
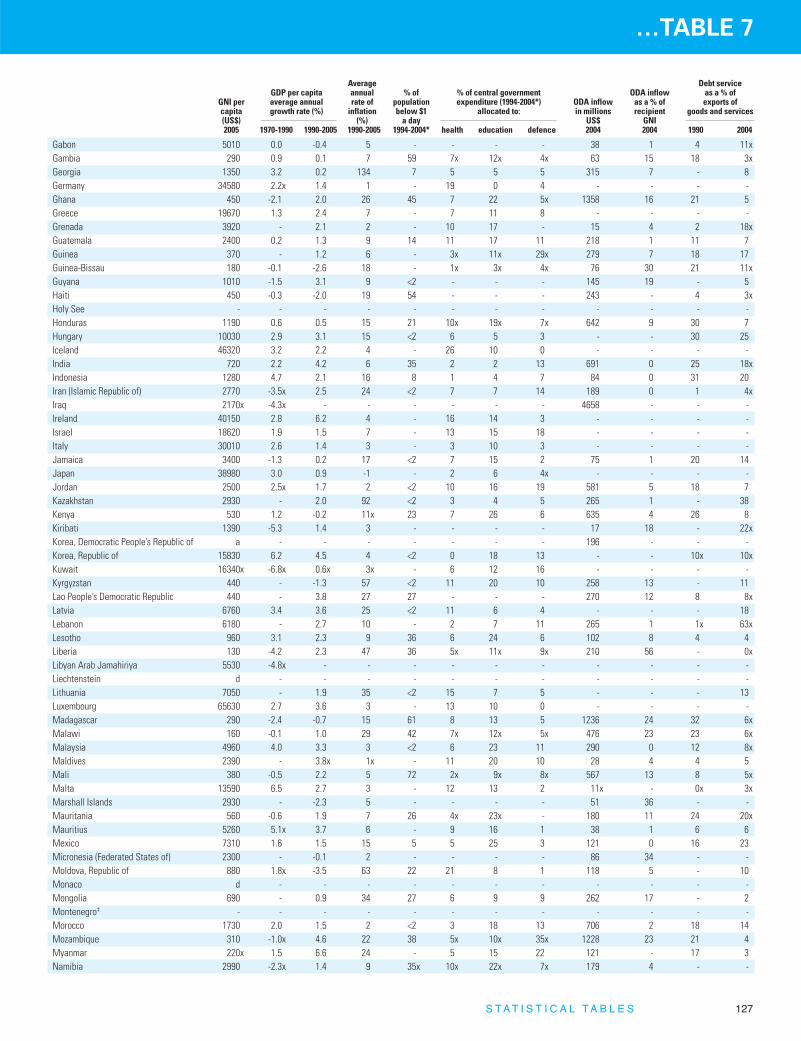
…TABLE 7
Gabon 5010 0.0 -0.4 5 - - - - 38 1 4 11xGambia 290 0.9 0.1 7 59 7x 12x 4x 63 15 18 3xGeorgia 1350 3.2 0.2 134 7 5 5 5 315 7 - 8Germany 34580 2.2x 1.4 1 - 19 0 4 - - - -Ghana 450 -2.1 2.0 26 45 7 22 5x 1358 16 21 5Greece 19670 1.3 2.4 7 - 7 11 8 - - - -Grenada 3920 - 2.1 2 - 10 17 - 15 4 2 18xGuatemala 2400 0.2 1.3 9 14 11 17 11 218 1 11 7Guinea 370 - 1.2 6 - 3x 11x 29x 279 7 18 17Guinea-Bissau 180 -0.1 -2.6 18 - 1x 3x 4x 76 30 21 11xGuyana 1010 -1.5 3.1 9 <2 - - - 145 19 - 5Haiti 450 -0.3 -2.0 19 54 - - - 243 - 4 3xHoly See - - - - - - - - - - - -Honduras 1190 0.6 0.5 15 21 10x 19x 7x 642 9 30 7Hungary 10030 2.9 3.1 15 <2 6 5 3 - - 30 25Iceland 46320 3.2 2.2 4 - 26 10 0 - - - -India 720 2.2 4.2 6 35 2 2 13 691 0 25 18xIndonesia 1280 4.7 2.1 16 8 1 4 7 84 0 31 20Iran (Islamic Republic of) 2770 -3.5x 2.5 24 <2 7 7 14 189 0 1 4xIraq 2170x -4.3x - - - - - - 4658 - - -Ireland 40150 2.8 6.2 4 - 16 14 3 - - - -Israel 18620 1.9 1.5 7 - 13 15 18 - - - -Italy 30010 2.6 1.4 3 - 3 10 3 - - - -Jamaica 3400 -1.3 0.2 17 <2 7 15 2 75 1 20 14Japan 38980 3.0 0.9 -1 - 2 6 4x - - - -Jordan 2500 2.5x 1.7 2 <2 10 16 19 581 5 18 7Kazakhstan 2930 - 2.0 92 <2 3 4 5 265 1 - 38Kenya 530 1.2 -0.2 11x 23 7 26 6 635 4 26 8Kiribati 1390 -5.3 1.4 3 - - - - 17 18 - 22xKorea, Democratic People’s Republic of a - - - - - - - 196 - - -Korea, Republic of 15830 6.2 4.5 4 <2 0 18 13 - - 10x 10xKuwait 16340x -6.8x 0.6x 3x - 6 12 16 - - - -Kyrgyzstan 440 - -1.3 57 <2 11 20 10 258 13 - 11Lao People’s Democratic Republic 440 - 3.8 27 27 - - - 270 12 8 8xLatvia 6760 3.4 3.6 25 <2 11 6 4 - - - 18Lebanon 6180 - 2.7 10 - 2 7 11 265 1 1x 63xLesotho 960 3.1 2.3 9 36 6 24 6 102 8 4 4Liberia 130 -4.2 2.3 47 36 5x 11x 9x 210 56 - 0xLibyan Arab Jamahiriya 5530 -4.8x - - - - - - - - - -Liechtenstein d - - - - - - - - - - -Lithuania 7050 - 1.9 35 <2 15 7 5 - - - 13Luxembourg 65630 2.7 3.6 3 - 13 10 0 - - - -Madagascar 290 -2.4 -0.7 15 61 8 13 5 1236 24 32 6xMalawi 160 -0.1 1.0 29 42 7x 12x 5x 476 23 23 6xMalaysia 4960 4.0 3.3 3 <2 6 23 11 290 0 12 8xMaldives 2390 - 3.8x 1x - 11 20 10 28 4 4 5Mali 380 -0.5 2.2 5 72 2x 9x 8x 567 13 8 5xMalta 13590 6.5 2.7 3 - 12 13 2 11x - 0x 3xMarshall Islands 2930 - -2.3 5 - - - - 51 36 - -Mauritania 560 -0.6 1.9 7 26 4x 23x - 180 11 24 20xMauritius 5260 5.1x 3.7 6 - 9 16 1 38 1 6 6Mexico 7310 1.6 1.5 15 5 5 25 3 121 0 16 23Micronesia (Federated States of) 2300 - -0.1 2 - - - - 86 34 - -Moldova, Republic of 880 1.8x -3.5 63 22 21 8 1 118 5 - 10Monaco d - - - - - - - - - - -Mongolia 690 - 0.9 34 27 6 9 9 262 17 - 2Montenegro‡ - - - - - - - - - - - -Morocco 1730 2.0 1.5 2 <2 3 18 13 706 2 18 14Mozambique 310 -1.0x 4.6 22 38 5x 10x 35x 1228 23 21 4Myanmar 220x 1.5 6.6 24 - 5 15 22 121 - 17 3Namibia 2990 -2.3x 1.4 9 35x 10x 22x 7x 179 4 - -
GNI percapita(US$)2005
% ofpopulationbelow $1
a day1994-2004*
% of central governmentexpenditure (1994-2004*)
allocated to:
health education defence
ODA inflowin millions
US$2004
ODA inflowas a % ofrecipient
GNI2004
Debt serviceas a % ofexports of
goods and services
1990 2004
GDP per capitaaverage annualgrowth rate (%)
1970-1990 1990-2005
Averageannual rate of
inflation(%)
1990-2005
S T A T I S T I C A L T A B L E S 127

TABLE 7. ECONOMIC INDICATORS
Nauru - - - - - - - - 14 - - -Nepal 270 1.1 1.9 6 24 5 17 10 427 6 12 5Netherlands 36620 1.5 1.9 2 - 10 11 4 - - - -New Zealand 25960 0.8 2.1 2 - 17 21 3 - - - -Nicaragua 910 -3.8 1.5 24 45 13 15 6 1232 27 2 5Niger 240 -2.2 -0.5 5 61 - - - 536 19 12 6xNigeria 560 -1.4 0.7 23 71 1x 3x 3x 573 1 22 8Niue - - - - - - - - 14 - - -Norway 59590 3.4 2.6 3 - 16 6 5 - - - -Occupied Palestinian Territory 1110x - -6.0x 9x - - - - 1136 - - -Oman 7830x 3.3 1.8x 1x - 7 15 33 55 0 12 7Pakistan 690 3.0 1.3 10 17 1 2 20 1421 2 16 18Palau 7630 - - 3x - - - - 20 15 - -Panama 4630 0.3 2.2 3 7 18 16 0 38 0 3 14Papua New Guinea 660 -0.7 0.0 8 - 7 22 4 266 8 37 12xParaguay 1280 2.8 -0.8 11 16 7 22 11x 0 - 12 13Peru 2610 -0.6 2.2 15 13 13 7 - 487 1 6 16Philippines 1300 0.8 1.5 7 16 2 19 5 463 0 23 20Poland 7110 - 4.3 15 <2 11 12 3 - - 4 34Portugal 16170 2.6 1.9 4 <2 16 16 3 - - - -Qatar 12000x - - - - - - - - - - -Romania 3830 0.9 1.6 67 <2 14 7 5 - - 0 16Russian Federation 4460 - -0.1 85 <2 1 3 12 - - - 9Rwanda 230 1.2 0.0 10 52 5x 26x - 468 25 10 11Saint Kitts and Nevis 8210 6.3x 2.9 3 - - - - 0 - 3 34xSaint Lucia 4800 5.3x 0.4 2 - - - - -22 -3 2 7xSaint Vincent and the Grenadines 3590 3.3 1.7 3 - 12 16 - 10 2 3 7xSamoa 2090 -0.1x 2.5 7 - - - - 31 9 5 5xSan Marino d - - - - 18 9 0 - - - -Sao Tome and Principe 390 - 0.5 34 - - - - 33 55 28 31xSaudi Arabia 11770 -1.5 -0.3 3 - 6x 14x 36x 32 0 - -Senegal 710 -0.3 1.2 4 22 3 14 7 1052 15 14 9xSerbia‡ - - - - - - - - - - - -Seychelles 8290 2.9 1.5 2 - 6 10 4 10 1 8 8Sierra Leone 220 -0.4 -1.4 21 57x 10x 13x 10x 360 32 8 10Singapore 27490 5.7 3.6 0 - 6 22 29 - - - -Slovakia 7950 - 2.8 8 <2 20 3 5 - - - 13xSlovenia 17350 - 3.2 18 <2 15 13 3 53x - 10x 16xSolomon Islands 590 3.4 -2.6 8 - - - - 122 46 10 7xSomalia 130x -0.9 - - - 1x 2x 38x 191 - 25x -South Africa 4960 0.1 0.7 9 11 - - - 617 0 - 6Spain 25360 1.9 2.3 4 - 15 2 4 - - - -Sri Lanka 1160 3.0 3.7 9 6 6 10 18 519 3 10 7Sudan 640 0.1 3.5 40 - 1 8 28 882 5 4 5Suriname 2540 -2.2x 1.1 59 - - - - 24 2 - -Swaziland 2280 2.1 0.2 12 8 8 20 8 117 6 6 2Sweden 41060 1.8 2.1 2 - 3 6 5 - - - -Switzerland 54930 1.2 0.6 1 - 0 4 6 - - - -Syrian Arab Republic 1380 1.9 1.3 7 - 2 9 24 110 0 20 2Tajikistan 330 - -4.0 121 7 2 4 9 241 14 - 6Tanzania, United Republic of 340 - 1.7 16 58 6x 8x 16x 1746 15 25 4Thailand 2750 4.8 2.7 3 <2 10 21 7 -2 0 14 10The former Yugoslav Republic of Macedonia 2830 - -0.1 38 <2 - - - 248 5 - 9Timor-Leste 750 - - - - - - - 153 30 - -Togo 350 -0.6 0.0 5 - 5x 20x 11x 61 3 8 0xTonga 2190 - 1.9 4 - 7x 13x - 19 10 2 2xTrinidad and Tobago 10440 0.5 4.3 5 12x 9 15 2 -1 0 18 4xTunisia 2890 2.5 3.3 4 <2 5 20 5 328 1 22 13Turkey 4710 1.9 1.6 61 3 3 10 8 257 0 27 28Turkmenistan 1340x - -4.7x 329x 12 - - - 37 - - 30xTuvalu - - - - - - - - 8 - - -
GNI percapita(US$)2005
% ofpopulationbelow $1
a day1994-2004*
% of central governmentexpenditure (1994-2004*)
allocated to:
health education defence
ODA inflowin millions
US$2004
ODA inflowas a % ofrecipient
GNI2004
Debt serviceas a % ofexports of
goods and services
1990 2004
GDP per capitaaverage annualgrowth rate (%)
1970-1990 1990-2005
Averageannual rate of
inflation(%)
1990-2005
128 T H E S T A T E O F T H E W O R L D ’ S C H I L D R E N 2 0 0 7

…TABLE 7
Uganda 280 - 3.2 8 85 2x 15x 26x 1159 17 47 5Ukraine 1520 - -2.4 117 <2 4 6 4 - - - 10United Arab Emirates 18060x -4.8x -1.0x 3x - 7 17 30 - - - -United Kingdom 37600 2.0 2.4 3 - 15 4 7 - - - -United States 43740 2.2 2.1 2 - 24 3 20 - - - -Uruguay 4360 0.9 0.8 21 <2 7 8 4 22 0 31 22Uzbekistan 510 - 0.3 129 17 - - - 246 2 - 21xVanuatu 1600 -0.5x -0.3 3 - - - - 38 13 2 1xVenezuela (Bolivarian Republic of) 4810 -1.6 -1.0 37 8 8 19 4 49 0 22 16Viet Nam 620 - 5.9 10 <2 4 14 - 1830 4 7x 3xYemen 600 - 2.0 17 16 4 22 19 252 2 4 3Zambia 490 -2.4 -0.3 37 76 13 14 4 1081 23 13 22xZimbabwe 340 -0.4 -2.1 63 56 8 24 7 186 2 19 6x
SUMMARY INDICATORSSub-Saharan Africa 764 - 1.1 36 46 - - - 22926 6 17 7
Eastern and Southern Africa 1043 - 1.1 36 40 - - - 13111 5 14 7West and Central Africa 491 - 1.0 34 54 - - - 9815 7 19 8
Middle East and North Africa 2627 2.4 2.2 11 4 5 14 17 11133 1 21 8South Asia 691 2.1 3.8 7 32 2 4 14 6758 1 21 -East Asia and Pacific 2092 5.7 6.6 6 14 1 8 12 6565 0 16 7Latin America and Caribbean 4078 1.9 1.4 37 9 7 16 4 5627 0 20 24CEE/CIS 3433 - - 81 4 4 6 9 - - - 15Industrialized countries§ 35410 2.3 1.9 2 - 16 4 12 - - - -Developing countries§ 1801 3.2 4.1 18 22 4 10 10 55058 1 19 13Least developed countries§ 383 - 2.4 59 41 5 15 13 24910 11 12 7World 7002 2.5 2.3 8 21 13 6 12 57748 0 18 14
‡ Due to the cession in June 2006 of Montenegro from the State Union of Serbia and Montenegro, and its subsequent admission to the UN on 28 June 2006, disaggregated data for Montenegroand Serbia as separate States are not yet available. Aggregated data presented are for Serbia and Montenegro pre-cession (see Memorandum item).
§ Also includes territories within each country category or regional group. Countries and territories in each country category or regional group are listed on page 136.
NOTES a: Range: low income ($875 or less). x Data refer to years or periods other than those specified in the column heading, differ from theb: Range: lower-middle income ($876 to $3,465). standard definition or refer to only part of a country. c: Range: upper-middle income ($3,466 to $10,725). * Data refer to the most recent year available during the period specified in the column heading.d: Range: high income ($10,726 or more). - Data not available.
MAIN DATA SOURCES
GNI per capita – World Bank.
GDP per capita – World Bank.
Rate of inflation – World Bank.
% of population below $1 a day – World Bank.
Expenditure on health, education and defence – International Monetary Fund (IMF).
ODA – Organisation for Economic Co-operation and Development (OECD).
Debt service – World Bank.
DEFINITIONS OF THE INDICATORS
GNI per capita – Gross national income (GNI) is the sum of value added by all resident producersplus any product taxes (less subsidies) not included in the valuation of output plus net receipts ofprimary income (compensation of employees and property income) from abroad. GNI per capita isgross national income divided by midyear population. GNI per capita in US dollars is convertedusing the World Bank Atlas method.
GDP per capita – Gross domestic product (GDP) is the sum of value added by all resident producersplus any product taxes (less subsidies) not included in the valuation of output. GDP per capita isgross domestic product divided by midyear population. Growth is calculated from constant priceGDP data in local currency.
% of population below $1 a day – Percentage of the population living on less than $1.08 a day at1993 international prices (equivalent to $1 a day in 1985 prices, adjusted for purchasing powerparity). As a result of revisions in purchasing power parity exchange rates, poverty rates forindividual countries cannot be compared with poverty rates reported in previous editions.
ODA – Net official development assistance.
Debt service – The sum of interest payments and repayments of principal on external public andpublicly guaranteed long-term debts.
GNI percapita(US$)2005
% ofpopulationbelow $1
a day1994-2004*
% of central governmentexpenditure (1994-2004*)
allocated to:
health education defence
ODA inflowin millions
US$2004
ODA inflowas a % ofrecipient
GNI2004
Debt serviceas a % ofexports of
goods and services
1990 2004
GDP per capitaaverage annualgrowth rate (%)
1970-1990 1990-2005
Averageannual rate of
inflation(%)
1990-2005
MEMORANDUMSerbia and Montenegro (pre-cession) 3280 - 5.2x 48x - - - - 1170 5 - 13x
S T A T I S T I C A L T A B L E S 129

TABLE 8. WOMEN
Life expectancy:females as a% of males
2005
Adult literacy rate:females as a% of males2000-2004*
Contraceptiveprevalence
(%)1997-2005*
Antenatalcare
coverage(%)
1997-2005*
Skilledattendantat delivery
(%)1997-2005*
Enrolment ratios:females as a % of males
primary school secondary school2000-2005* 2000-2005*
gross net gross netCountries and territories
Afghanistan 101 30 44 - 20 - 10 16 14 1600 1900 6Albania 108 99 99 99 97 97 75 91 98 17 55 610Algeria 104 75 92 97 108 105 57 81 96 120 140 190Andorra - - 98 97 104 101 - - - - - -Angola 107 65 86x - 79 - 6 66 45 - 1700 7Antigua and Barbuda - - - - - - 53 100 100 65 - -Argentina 111 100 99 99 106 108 - 98 99 40 82 410Armenia 110 99 104 103 103 102 53 93 98 22 55 1200Australia 106 - 100 100 95 101 - 100x 100 - 8 5800Austria 107 - 100 - 94 - 51x 100x 100x - 4 16000Azerbaijan 112 99 98 98 98 97 55 70 88 19 94 520Bahamas 109 - 100 102 111 111 - - 99 - 60 580Bahrain 104 94 100 101 106 107 62x 97x 98x 46 28 1200Bangladesh 103 - 104 103 110 113 58 49 13 320 380 59Barbados 109 - 98 99 102 105 55 100 100 0 95 590Belarus 118 99 96 97 101 101 50x 100 100 17 35 1800Belgium 108 - 100 100 96 101 78x - - - 10 5600Belize 107 - 98 101 104 104 56 96 83 140 140 190Benin 103 48 77 77 53 48 19 81 66 500 850 17Bhutan 104 - - - - - 31 51 37 260 420 37Bolivia 107 87 99 101 97 99 58 79 67 30 420 47Bosnia and Herzegovina 108 95 - - - - 48 99 100 8 31 1900Botswana 97 103 99 102 105 110 48 97 94 330 100 200Brazil 112 101 94 - 110 107 77x 97 97 72 260 140Brunei Darussalam 106 95 100 - 105 - - 100x 99 0 37 830Bulgaria 110 99 98 99 96 97 42 - 99 6 32 2400Burkina Faso 103 52 80 76 71 73 14 73 38 480 1000 12Burundi 104 78 84 90 71 - 16 78 25 - 1000 12Cambodia 114 75 92 96 69 73 24 38 32 440 450 36Cameroon 102 78 85 - 71 - 26 83 62 670 730 23Canada 106 - 100 101 99 100x 75x - 98 - 6 8700Cape Verde 109 - 96 99 110 112 53 99 89 76 150 160Central African Republic 103 51 68 - - - 28 62 44 1100 1100 15Chad 105 32 65 68 30 31 3 39 14 1100 1100 11Chile 108 100 95 - 101 - 56x 95x 100 17 31 1100China 105 92 99 100 100 - 87 90 97 51 56 830Colombia 109 100 99 101 110 112 78 94 96 84 130 240Comoros 107 - 88 83 75 - 26 74 62 380 480 33Congo 105 - 92 - 83 - 44 88 86 - 510 26Congo, Democratic Republic of the 105 67 90x - 50 - 31 68 61 1300 990 13Cook Islands - - 98 99 103 109 44 - 98 6 - -Costa Rica 106 100 99 - 109 - 80 92 99 36 43 690Côte d’Ivoire 103 64 79 81 56 58 15 88 68 600 690 25Croatia 110 98 99 99 102 102 - - 100 8 8 6100Cuba 105 100 95 98 101 101 73 100 100 37 33 1600Cyprus 107 96 99 100 103 103 - - - 0 47 890Czech Republic 109 - 98 - 101 - 72 99x 100 4 9 7700Denmark 106 - 100 100 104 103 - - - 10 5 9800Djibouti 104 - 80 81 72 68 9 67 61 74 730 19Dominica - - 99 101 99 103 50 100 100 67 - -Dominican Republic 111 100 95 102 125 120 70 99 99 180 150 200Ecuador 108 98 100 101 100 102 73 84 75 80 130 210Egypt 107 71 95 97 93 95 59 70 74 84 84 310El Salvador 109 - 97 100 102 104 67 86 92 170 150 180Equatorial Guinea 102 86 91 85 58 60 - 86 65 - 880 16Eritrea 107 - 80 84 58 65 8 70 28 1000 630 24Estonia 117 100 97 100 102 102 70x - 100 8 63 1100Ethiopia 104 - 85 95 63 65 15 28 6 870 850 14Fiji 107 - 98 99 107 106 44 - 99 38 75 360Finland 109 - 99 100 105 100 - 100x 100 6 6 8200France 109 - 99 100 101 102 75x 99x 99x 10 17 2700
1990-2005*reported adjusted
Lifetimerisk of
maternaldeath. 1 in:
Maternal mortality ratio†
2000
130 T H E S T A T E O F T H E W O R L D ’ S C H I L D R E N 2 0 0 7

…TABLE 8
Gabon 102 - 99 100 86 - 33 94 86 520 420 37Gambia 105 - 106 105 84 84 18 91 55 730 540 31Georgia 112 - 100 99 99 100 47 95 92 52 32 1700Germany 108 - 100 - 98 - 75x - - 8 8 8000Ghana 102 76 97 100 85 90 25 92 47 210x 540 35Greece 107 96 99 99 101 104 - - - 1 9 7100Grenada - - 96 100 109 109 54 99 100 1 - -Guatemala 111 84 92 96 90 91 43 84 41 150 240 74Guinea 101 42 82 84 50 50 7 82 56 530 740 18Guinea-Bissau 106 - 67 70 57 55 8 62 35 910 1100 13Guyana 110 - 93 - 103 - 37 81 86 120 170 200Haiti 103 - - - - - 28 79 24 520 680 29Holy See - - - - - - - - - - - -Honduras 106 100 100 102 126 - 62 83 56 110 110 190Hungary 112 - 98 98 99 99 77x - 100 7 16 4000Iceland 105 - 98 98 106 104 - - - - 0 0India 105 66 93 95 80 - 47 60 43 540 540 48Indonesia 106 93 98 98 100 100 57 92 72 310 230 150Iran (Islamic Republic of) 105 83 110 99 94 95 74 77 90 37 76 370Iraq 105 76 82 86 67 70 44 77 72 290 250 65Ireland 107 - 99 100 107 106 - - 100 6 5 8300Israel 105 98 101 101 100 100 - - - 5 17 1800Italy 108 99 99 100 98 101 60x - - 7 5 13900Jamaica 105 116 100 101 102 104 69 98 97 110 87 380Japan 109 - 101 100 101 101 56 - 100x 8 10 6000Jordan 104 89 101 102 101 103 56 99 100 41 41 450Kazakhstan 119 99 99 99 98 99 66 91 99 42 210 190Kenya 96 90 95 101 92 100 39 88 42 410 1000 19Kiribati - - 103 102x 122 117 21 88x 85 56 - -Korea, Democratic People’s Republic of 110 - - - - - 62x - 97 110 67 590Korea, Republic of 110 - 99 99 100 101 81 - 100 20 20 2800Kuwait 106 97 101 102 107 105 50x 95x 98x 5 5 6000Kyrgyzstan 113 99 100 100 100 - 60 97 98 49 110 290Lao People’s Democratic Republic 105 79 88 94 75 85 32 27 19 410 650 25Latvia 116 100 97 - 99 - 48x - 100 14 42 1800Lebanon 106 - 96 99 109 - 58 96 89x 100x 150 240Lesotho 104 122 100 106 128 156 37 90 55 760 550 32Liberia 104 - 72 78 73 55 10 85 51 580x 760 16Libyan Arab Jamahiriya 107 - 99 - 106 - 45x 81x 94x 77 97 240Liechtenstein - - 101 102 110 111 - - - - - -Lithuania 117 100 99 99 99 100 47x - 100 3 13 4900Luxembourg 108 - 99 100 107 106 - - 100 0 28 1700Madagascar 105 84 96 100 100x 100x 27 80 51 470 550 26Malawi 98 72 102 105 81 85 33 92 56 980 1800 7Malaysia 106 92 99 100 114 114 55x 74 97 30 41 660Maldives 99 100 97 101 115 115 39 81 70 140 110 140Mali 103 44 79 86 61 - 8 57 41 580 1200 10Malta 106 103 99 100 94 106 - - 98x - 0 0Marshall Islands - - 94 99 104 107 34 - 95 - - -Mauritania 106 72 98 99 82 81 8 64 57 750 1000 14Mauritius 110 92 100 101 99 101 76 - 98 22 24 1700Mexico 107 98 98 100 106 103 74 86x 83 63 83 370Micronesia (Federated States of) 102 - - - - - 45 - 88 120 - -Moldova, Republic of 111 99 99 100 104 104 68 98 100 22 36 1500Monaco - - - - - - - - - - - -Mongolia 106 100 101 100 113 114 69 94 97 93 110 300Montenegro‡ - - - - - - - - - - - -Morocco 107 61 90 93 83 84 63 68 63 230 220 120Mozambique 102 - 83 89 69 80 17 85 48 410 1000 14Myanmar 110 91 102 102 98 97 34 76 57 230 360 75Namibia 100 95 102 107 115 134 44 91 76 270 300 54
Life expectancy:females as a% of males
2005
Adult literacy rate:females as a% of males2000-2004*
Contraceptiveprevalence
(%)1997-2005*
Antenatalcare
coverage(%)
1997-2005*
Skilledattendantat delivery
(%)1997-2005*
Enrolment ratios:females as a % of males
primary school secondary school2000-2005* 2000-2005*
gross net gross net1990-2005*reported adjusted
Lifetimerisk of
maternaldeath. 1 in:
Maternal mortality ratio†
2000
S T A T I S T I C A L T A B L E S 131

TABLE 8. WOMEN
Nauru - - 99 - 109 - - - - - - -Nepal 101 56 92 88 86 - 38 28 11 540 740 24Netherlands 107 100 97 99 98 101 79x - 100 7 16 3500New Zealand 106 - 100 100 108 103 75x 95x 100x 15 7 6000Nicaragua 107 - 98 98 115 113 69 86 67 83 230 88Niger 100 35 71 70 67 63 14 41 16 590 1600 7Nigeria 101 - 85 89 82 83 13 58 35 - 800 18Niue - - 119 99x 95 105x - - 100 - - -Norway 106 - 100 100 103 101 - - - 6 16 2900Occupied Palestinian Territory 104 91 100 100 105 106 51 96 97 - 100 140Oman 104 85 99 103 97 101 32 100 95 23 87 170Pakistan 101 57 73 74 74 - 28 36 31 530 500 31Palau - - 82 96 114 - 17 - 100 0x - -Panama 107 98 97 100 107 110 - 72 93 40 160 210Papua New Guinea 102 81 88 - 79 - 26x 78x 41 370x 300 62Paraguay 107 - 96 - 102 - 73 94 77 180 170 120Peru 108 88 100 100 101 100 71 92 73 190 410 73Philippines 106 100 98 102 110 120 49 88 60 170 200 120Poland 111 - 100 101 101 103 49x - 100 4 13 4600Portugal 109 - 96 100 111 112 - - 100 8 5 11100Qatar 107 100 99 99 97 98 43 - 99 10 140 170Romania 110 98 99 100 101 103 70 94 99 17 49 1300Russian Federation 122 99 100 101 100 - - - 99 32 67 1000Rwanda 107 85 102 104 93 - 17 94 39 1100 1400 10Saint Kitts and Nevis - - 107 108 97 97 41 100 100 250 - -Saint Lucia 104 - 95 97 112 109 47 48 99 35 - -Saint Vincent and the Grenadines 108 - 94 97 96 102 58 99 100 93 - -Samoa 109 - 100 101 112 113 30x - 100 - 130 150San Marino - - - - - - - - - - - -Sao Tome and Principe 103 - 99 100 105 108 29 91 76 100 - -Saudi Arabia 106 79 96 92 89 94 32x 90x 91x - 23 610Senegal 105 57 95 94 73 72 12 79 58 430 690 22Serbia‡ - - - - - - - - - - - -Seychelles - 101 101 101 108 107 - - - 57 - -Sierra Leone 107 51 72 - 100 - 4 68 42 1800 2000 6Singapore 105 92 - - - - 62 - 100 6 30 1700Slovakia 111 - 98 - 101 - 74x - 99 4 3 19800Slovenia 110 - 99 100 100 101 74x 98x 100 17 17 4100Solomon Islands 102 - 97 99 79 86 11x - 85 550x 130 120Somalia 105 - - - - - - 32 25 - 1100 10South Africa 103 96 96 101 108 112 60 92 92 150 230 120Spain 110 - 98 99 106 104 81x - - 6 4 17400Sri Lanka 107 97 99 99 101 - 70 100 96 43 92 430Sudan 105 73 88 83 94 - 7 60 87 550x 590 30Suriname 110 95 103 107 133 140 42 91 85 150 110 340Swaziland 98 96 95 101 100 123 48 90 74 230 370 49Sweden 106 - 100 99 104 103 - - - 5 2 29800Switzerland 107 - 99 100 92 93 82x - - 5 7 7900Syrian Arab Republic 105 86 95 95 94 93 48 71 77x 65 160 130Tajikistan 109 99 95 95 84 85 34 71 71 37 100 250Tanzania, United Republic of 101 79 96 99 83x - 26 78 43 580 1500 10Thailand 111 96 95 - 103 - 79 92 99 24 44 900The former Yugoslav Republic of Macedonia 107 96 100 100 98 98 - 81 99 21 23 2100Timor-Leste 104 - - - - - 10 61 18 - 660 30Togo 107 55 84 85 50 47 26 85 61 480 570 26Tonga 104 100 95 97x 109 123 33 - 95 - - -Trinidad and Tobago 108 - 97 100 106 106 38 92 96 45 160 330Tunisia 106 78 96 101 108 105 66 92 90 69 120 320Turkey 107 84 94 95 76 - 71 81 83 130x 70 480Turkmenistan 115 99 - - - - 62 98 97 14 31 790Tuvalu - - 107 - 93 - 32 - 100 - - -
Life expectancy:females as a% of males
2005
Adult literacy rate:females as a% of males2000-2004*
Contraceptiveprevalence
(%)1997-2005*
Antenatalcare
coverage(%)
1997-2005*
Skilledattendantat delivery
(%)1997-2005*
Enrolment ratios:females as a % of males
primary school secondary school2000-2005* 2000-2005*
gross net gross net1990-2005*reported adjusted
Lifetimerisk of
maternaldeath. 1 in:
Maternal mortality ratio†
2000
132 T H E S T A T E O F T H E W O R L D ’ S C H I L D R E N 2 0 0 7

…TABLE 8
Uganda 102 75 99 - 78 86 20 92 39 510 880 13Ukraine 120 99 100 100 98 101 68 - 100 13 35 2000United Arab Emirates 106 - 96 97 105 105 28x 97x 99x 3 54 500United Kingdom 106 - 100 100 103 104 84 - 99 7 13 3800United States 107 - 98 96 101 102 76x - 99 8 17 2500Uruguay 110 - 98 - 116 - 84 94 100 26 27 1300Uzbekistan 110 - 99 - 97 - 68 97 96 30 24 1300Vanuatu 106 - 97 98 86 86 28 - 88 68 130 140Venezuela (Bolivarian Republic of) 108 100 98 100 115 116 77 94 95 58 96 300Viet Nam 106 93 93 94 96 - 77 86 85 170 130 270Yemen 105 - 71 72 48 46 23 41 27 370 570 19Zambia 97 79 96 100 79 78 34 93 43 730 750 19Zimbabwe 96 - 98 101 92 94 54 93 73 1100 1100 16
NOTES - Data not available.x Data refer to years or periods other than those specified in the column heading, differ from the standard definition or refer to only part of a country.* Data refer to the most recent year available during the period specified in the column heading.
** Excludes China.
MAIN DATA SOURCES
Life expectancy – United Nations Population Division.
Adult literacy – United Nations Educational, Scientific and Cultural Organization (UNESCO).
School enrolment – UIS and UNESCO.
Contraceptive prevalence – Demographic and Health Surveys (DHS), Multiple Indicator ClusterSurveys (MICS), United Nations Population Division and UNICEF.
Antenatal care – DHS, MICS, World Health Organization (WHO) and UNICEF.
Skilled attendant at delivery – DHS, MICS, WHO and UNICEF.
Maternal mortality – WHO and UNICEF.
Lifetime risk – WHO and UNICEF.
DEFINITIONS OF THE INDICATORS
Life expectancy at birth – The number of years newborn children would live if subject to themortality risks prevailing for the cross section of population at the time of their birth.
Adult literacy rate – Percentage of persons aged 15 and over who can read and write.Enrolment ratios: females as a % of males – Girls’ (gross or net) enrolment ratio divided
by that of boys’, as a percentage.The gross enrolment ratio – The number of children enrolled in primary or secondary school,
regardless of age, expressed as a percentage of the total number of children of official primaryor secondary school age.
The net enrolment ratio – The number of children enrolled in primary or secondary school whoare of official primary or secondary school age, expressed as a percentage of the total numberof children of official primary or secondary school age.
Contraceptive prevalence – Percentage of women in union aged 15-49 currently usingcontraception.
Antenatal care – Percentage of women aged 15-49 attended at least once during pregnancy byskilled health personnel (doctors, nurses or midwives).
Skilled attendant at delivery – Percentage of births attended by skilled health personnel (doctors,nurses or midwives).
Maternal mortality ratio – Annual number of deaths of women from pregnancy-related causes per100,000 live births. This ‘reported’ column shows country-reported figures that are not adjustedfor under-reporting and misclassification.
Lifetime risk of maternal death – The lifetime risk of maternal death takes into account boththe probability of becoming pregnant and the probability of dying as a result of that pregnancyaccumulated across a woman’s reproductive years.
† The maternal mortality data in the column headed ‘reported’ are those reported by nationalauthorities. Periodically, UNICEF, WHO and UNFPA evaluate these data and make adjustmentsto account for the well-documented problems of under-reporting and misclassification ofmaternal deaths and to develop estimates for countries with no data. The column with‘adjusted’ estimates for the year 2000 reflects the most recent of these reviews.
SUMMARY INDICATORSSub-Saharan Africa 102 76 89 94 78 80 24 68 43 940 16
Eastern and Southern Africa 102 85 94 97 85 88 30 71 39 980 15West and Central Africa 102 63 84 87 70 77 18 66 45 900 16
Middle East and North Africa 105 77 93 93 90 92 53 70 76 220 100South Asia 104 64 91 93 83 - 46 53 37 560 43East Asia and Pacific 106 92 99 100 100 102** 79 88 87 110 360Latin America and Caribbean 109 99 97 100 108 106 71 93 87 190 160CEE/CIS 115 97 97 98 95 99 65 87 93 64 770Industrialized countries§ 108 - 99 98 101 102 - - 99 13 4000Developing countries§ 106 85 94 96 92 98** 59 71 60 440 61Least developed countries§ 104 71 88 94 83 88 29 59 35 890 17World 106 86 94 96 94 98** 60 71 63 400 74
‡ Due to the cession in June 2006 of Montenegro from the State Union of Serbia and Montenegro, and its subsequent admission to the UN on 28 June 2006, disaggregated data for Montenegroand Serbia as separate States are not yet available. Aggregated data presented are for Serbia and Montenegro pre-cession (see Memorandum item).
§ Also includes territories within each country category or regional group. Countries and territories in each country category or regional group are listed on page 136.
MEMORANDUMSerbia and Montenegro (pre-cession) 107 95 100 100 101 - 58 - 92 7 11 4500
Life expectancy:females as a% of males
2005
Adult literacy rate:females as a% of males2000-2004*
Contraceptiveprevalence
(%)1997-2005*
Antenatalcare
coverage(%)
1997-2005*
Skilledattendantat delivery
(%)1997-2005*
Enrolment ratios:females as a % of males
primary school secondary school2000-2005* 2000-2005*
gross net gross net1990-2005*reported adjusted
Lifetimerisk of
maternaldeath. 1 in:
Maternal mortality ratio†
2000
S T A T I S T I C A L T A B L E S 133
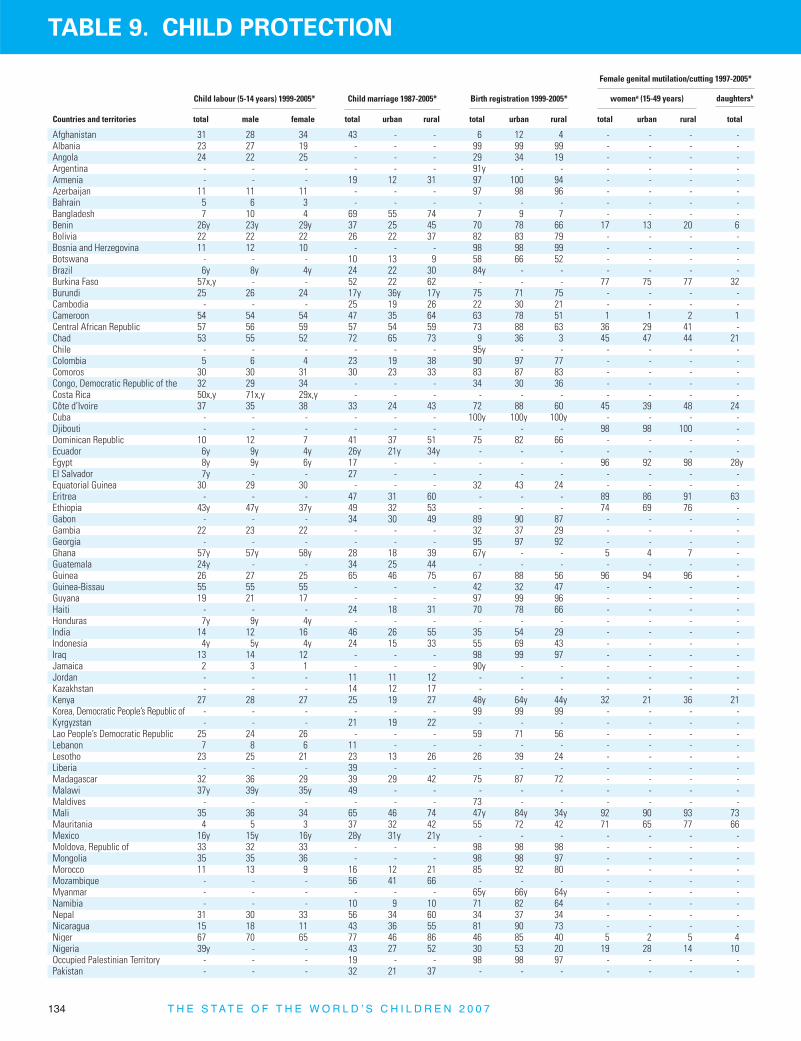
TABLE 9. CHILD PROTECTION
urban rural total
daughtersbwomena (15-49 years)
Afghanistan 31 28 34 43 - - 6 12 4 - - - -Albania 23 27 19 - - - 99 99 99 - - - -Angola 24 22 25 - - - 29 34 19 - - - -Argentina - - - - - - 91y - - - - - -Armenia - - - 19 12 31 97 100 94 - - - -Azerbaijan 11 11 11 - - - 97 98 96 - - - -Bahrain 5 6 3 - - - - - - - - - -Bangladesh 7 10 4 69 55 74 7 9 7 - - - -Benin 26y 23y 29y 37 25 45 70 78 66 17 13 20 6Bolivia 22 22 22 26 22 37 82 83 79 - - - -Bosnia and Herzegovina 11 12 10 - - - 98 98 99 - - - -Botswana - - - 10 13 9 58 66 52 - - - -Brazil 6y 8y 4y 24 22 30 84y - - - - - -Burkina Faso 57x,y - - 52 22 62 - - - 77 75 77 32Burundi 25 26 24 17y 36y 17y 75 71 75 - - - -Cambodia - - - 25 19 26 22 30 21 - - - -Cameroon 54 54 54 47 35 64 63 78 51 1 1 2 1Central African Republic 57 56 59 57 54 59 73 88 63 36 29 41 -Chad 53 55 52 72 65 73 9 36 3 45 47 44 21Chile - - - - - - 95y - - - - - -Colombia 5 6 4 23 19 38 90 97 77 - - - -Comoros 30 30 31 30 23 33 83 87 83 - - - -Congo, Democratic Republic of the 32 29 34 - - - 34 30 36 - - - -Costa Rica 50x,y 71x,y 29x,y - - - - - - - - - -Côte d’Ivoire 37 35 38 33 24 43 72 88 60 45 39 48 24Cuba - - - - - - 100y 100y 100y - - - -Djibouti - - - - - - - - - 98 98 100 -Dominican Republic 10 12 7 41 37 51 75 82 66 - - - -Ecuador 6y 9y 4y 26y 21y 34y - - - - - - -Egypt 8y 9y 6y 17 - - - - - 96 92 98 28yEl Salvador 7y - - 27 - - - - - - - - -Equatorial Guinea 30 29 30 - - - 32 43 24 - - - -Eritrea - - - 47 31 60 - - - 89 86 91 63Ethiopia 43y 47y 37y 49 32 53 - - - 74 69 76 -Gabon - - - 34 30 49 89 90 87 - - - -Gambia 22 23 22 - - - 32 37 29 - - - -Georgia - - - - - - 95 97 92 - - - -Ghana 57y 57y 58y 28 18 39 67y - - 5 4 7 -Guatemala 24y - - 34 25 44 - - - - - - -Guinea 26 27 25 65 46 75 67 88 56 96 94 96 -Guinea-Bissau 55 55 55 - - - 42 32 47 - - - -Guyana 19 21 17 - - - 97 99 96 - - - -Haiti - - - 24 18 31 70 78 66 - - - -Honduras 7y 9y 4y - - - - - - - - - -India 14 12 16 46 26 55 35 54 29 - - - -Indonesia 4y 5y 4y 24 15 33 55 69 43 - - - -Iraq 13 14 12 - - - 98 99 97 - - - -Jamaica 2 3 1 - - - 90y - - - - - -Jordan - - - 11 11 12 - - - - - - -Kazakhstan - - - 14 12 17 - - - - - - -Kenya 27 28 27 25 19 27 48y 64y 44y 32 21 36 21Korea, Democratic People’s Republic of - - - - - - 99 99 99 - - - -Kyrgyzstan - - - 21 19 22 - - - - - - -Lao People’s Democratic Republic 25 24 26 - - - 59 71 56 - - - -Lebanon 7 8 6 11 - - - - - - - - -Lesotho 23 25 21 23 13 26 26 39 24 - - - -Liberia - - - 39 - - - - - - - - -Madagascar 32 36 29 39 29 42 75 87 72 - - - -Malawi 37y 39y 35y 49 - - - - - - - - -Maldives - - - - - - 73 - - - - - -Mali 35 36 34 65 46 74 47y 84y 34y 92 90 93 73Mauritania 4 5 3 37 32 42 55 72 42 71 65 77 66Mexico 16y 15y 16y 28y 31y 21y - - - - - - -Moldova, Republic of 33 32 33 - - - 98 98 98 - - - -Mongolia 35 35 36 - - - 98 98 97 - - - -Morocco 11 13 9 16 12 21 85 92 80 - - - -Mozambique - - - 56 41 66 - - - - - - -Myanmar - - - - - - 65y 66y 64y - - - -Namibia - - - 10 9 10 71 82 64 - - - -Nepal 31 30 33 56 34 60 34 37 34 - - - -Nicaragua 15 18 11 43 36 55 81 90 73 - - - -Niger 67 70 65 77 46 86 46 85 40 5 2 5 4Nigeria 39y - - 43 27 52 30 53 20 19 28 14 10Occupied Palestinian Territory - - - 19 - - 98 98 97 - - - -Pakistan - - - 32 21 37 - - - - - - -
totalurban ruraltotaltotal ruralurbanfemalemaletotalCountries and territories
Female genital mutilation/cutting 1997-2005*
Child labour (5-14 years) 1999-2005* Child marriage 1987-2005* Birth registration 1999-2005*
134 T H E S T A T E O F T H E W O R L D ’ S C H I L D R E N 2 0 0 7

…TABLE 9
Paraguay 12y 16y 7y 24 18 32 - - - - - - -Peru - - - 17 13 30 93 93 92 - - - -Philippines 12 13 11 14 10 22 83 87 78 - - - -Romania 1y - - - - - - - - - - - -Rwanda 35 36 35 20 21 19 65 61 66 - - - -Sao Tome and Principe 15 16 14 - - - 70 73 67 - - - -Senegal 37 39 36 36 15 53 62 82 51 28 22 35 -Sierra Leone 59 59 59 - - - 46 66 40 - - - -Somalia 36 31 41 - - - - - - - - - -South Africa - - - 8 5 12 - - - - - - -Sri Lanka - - - 12y - - - - - - - - -Sudan 14 15 13 27y 19y 34y 64 82 46 90 92 88 58Suriname - - - - - - 95 94 94 - - - -Swaziland 10 10 10 - - - 53 72 50 - - - -Syrian Arab Republic 8y 10y 6y - - - - - - - - - -Tajikistan 10 9 11 13 - - 88 85 90 - - - -Tanzania, United Republic of 36 37 34 41 23 49 8 22 4 15 7 18 4Thailand - - - 21y 13y 23y - - - - - - -Timor-Leste 4y 4y 4y - - - 53y - - - - - -Togo 63 64 62 31 17 41 82 93 78 - - - -Trinidad and Tobago 2 3 2 34y 37y 32y 95 - - - - - -Tunisia - - - 10y 7y 14y - - - - - - -Turkey - - - 23 19 30 - - - - - - -Turkmenistan - - - 9 12 7 - - - - - - -Uganda 37 37 36 54 34 59 4 11 3 - - - -Ukraine 7 8 7 - - - - - - - - - -Uzbekistan 19 22 17 13 16 11 100 100 100 - - - -Venezuela (Bolivarian Republic of) 8 9 6 - - - 92 - - - - - -Viet Nam 24 24 24 11 5 13 72 92 68 - - - -Yemen - - - 37 - - - - - 23 26 22 20Zambia 11 10 11 42 32 49 10 16 6 1 1 1 -Zimbabwe 26y - - 29 21 36 42 56 35 - - - -
NOTES - Data not available.x Data refer to years or periods other than those specified in the column heading, differ from the standard definition, or refer to only part of a country.y Data differ from the standard definition or refer to only part of a country but are included in the calculation of regional and global averages.* Data refer to the most recent year available during the period specified in the column heading.
** Excludes China.
MAIN DATA SOURCES
Child labour – Multiple IndicatorCluster Survey (MICS) andDemographic and Health Surveys(DHS).
Child marriage – MICS, DHS and othernational surveys.
Birth registration – MICS, DHS, othernational surveys and vital registrationsystems.
Female genital mutilation/cutting –MICS, DHS and other national surveys.
DEFINITIONS OF THE INDICATORS
Child labour – Percentage of children aged 5-14 years involved in child labour at the moment of the survey. A child is considered to be involved in child labour under thefollowing conditions: (a) children 5-11 years of age who, during the week preceding the survey, did at least one hour of economic activity or at least 28 hours of domesticwork and, (b) children 12-14 years of age who, during the week preceding the survey, did at least 14 hours of economic activity or at least 28 hours of domestic work.
Child labour background variables – Sex of the child; urban or rural place of residence; poorest 20 per cent or richest 20 per cent of the population constructedfrom household assets (a more detailed description of the household wealth estimation procedure can be found at www.childinfo.org); mother’s educationreflecting mothers with and without some level of education.
Birth registration – Percentage of children less than five years of age who were registered at the moment of the survey. The numerator of this indicator includeschildren whose birth certificate was seen by the interviewer or whose mother or caretaker says the birth has been registered. MICS data refer to children alive atthe time of the survey.
Child marriage – Percentage of women 20-24 years of age who were married or in union before they were 18 years old.
Female genital mutilation/cutting – (a) Women – the percentage of women aged 15-49 years of age who have been mutilated/cut. (b) Daughters – thepercentage of women aged 15-49 with at least one mutilated/cut daughter. Female genital mutilation/cutting (FGM/C) involves the cutting or alteration of thefemale genitalia for social reasons. Generally, there are three recognized types of FGM/C: clitoridectomy, excision and infibulation. Clitoridectomy is the removalof the prepuce with or without excision of all or part of the clitoris. Excision is the removal of the prepuce and clitoris along with all or part of the labia minora.Infibulation is the most severe form and consists of removal of all or part of the external genitalia, followed by joining together of the two sides of the labiaminora using threads, thorns or other materials to narrow the vaginal opening. A more detailed analysis of these data can also be found atwww.measuredhs.com and www.prb.org.
urban rural total
daughtersbwomena (15-49 years)
totalurban ruraltotaltotal ruralurbanfemalemaletotal
Female genital mutilation/cutting 1997-2005*
Child labour (5-14 years) 1999-2005* Child marriage 1987-2005* Birth registration 1999-2005*
SUMMARY INDICATORSSub-Saharan Africa 37 38 37 40 25 48 40 54 32 36 29 40 16
Eastern and Southern Africa 34 36 32 36 21 43 33 44 28 - - - -West and Central Africa 42 41 42 44 28 56 44 59 34 28 29 29 16
Middle East and North Africa 10 12 9 - - - - - - - - - -South Asia 14 12 15 48 28 55 32 47 25 - - - -East Asia and Pacific 11** 11** 10** 20** 12** 25** 65** 77** 56** - - - -Latin America and Caribbean 9 10 8 25 24 31 89 92 78 - - - -CEE/CIS - - - - - - - - - - - - -Industrialized countries§ - - - - - - - - - - - - -Developing countries§ 17** 17** 18** 36** 23** 46** 46** 62** 34** - - - -Least developed countries§ 29 30 28 51 35 57 32 44 28 - - - -World - - - - - - - - - - - - -
§ Also includes territories within each country category or regional group. Countries and territories in each country category or regional group are listed on page 136.
S T A T I S T I C A L T A B L E S 135
Averages given at the end of each table arecalculated using data from the countries andterritories as grouped below.
Sub-Saharan Africa
Angola; Benin; Botswana; Burkina Faso;Burundi; Cameroon; Cape Verde; CentralAfrican Republic; Chad; Comoros; Congo;Congo, Democratic Republic of the; Côted’Ivoire; Equatorial Guinea; Eritrea; Ethiopia;Gabon; Gambia; Ghana; Guinea; Guinea-Bissau; Kenya; Lesotho; Liberia; Madagascar;Malawi; Mali; Mauritania; Mauritius;Mozambique; Namibia; Niger; Nigeria;Rwanda; Sao Tome and Principe; Senegal;Seychelles; Sierra Leone; Somalia; SouthAfrica; Swaziland; Tanzania, United Republicof; Togo; Uganda; Zambia; Zimbabwe
Middle East and North Africa
Algeria; Bahrain; Djibouti; Egypt; Iran(Islamic Republic of); Iraq; Jordan; Kuwait;Lebanon; Libyan Arab Jamahiriya; Morocco;Occupied Palestinian Territory; Oman; Qatar;Saudi Arabia; Sudan; Syrian Arab Republic;Tunisia; United Arab Emirates; Yemen
South Asia
Afghanistan; Bangladesh; Bhutan; India;Maldives; Nepal; Pakistan; Sri Lanka
East Asia and Pacific
Brunei Darussalam; Cambodia; China; CookIslands; Fiji; Indonesia; Kiribati; Korea,Democratic People’s Republic of; Korea,Republic of; Lao People’s DemocraticRepublic; Malaysia; Marshall Islands;Micronesia (Federated States of); Mongolia;Myanmar; Nauru; Niue; Palau; Papua NewGuinea; Philippines; Samoa; Singapore;Solomon Islands; Thailand; Timor-Leste;Tonga; Tuvalu; Vanuatu; Viet Nam
Latin America and Caribbean
Antigua and Barbuda; Argentina; Bahamas;Barbados; Belize; Bolivia; Brazil; Chile;
Colombia; Costa Rica; Cuba; Dominica;Dominican Republic; Ecuador; El Salvador;Grenada; Guatemala; Guyana; Haiti; Honduras;Jamaica; Mexico; Nicaragua; Panama;Paraguay; Peru; Saint Kitts and Nevis; SaintLucia; Saint Vincent and the Grenadines;Suriname; Trinidad and Tobago; Uruguay;Venezuela (Bolivarian Republic of)
CEE/CIS
Albania; Armenia; Azerbaijan; Belarus;Bosnia and Herzegovina; Bulgaria; Croatia;Georgia; Kazakhstan; Kyrgyzstan; Moldova,Republic of; Montenegro; Romania; RussianFederation; Serbia; Tajikistan; the formerYugoslav Republic of Macedonia; Turkey;Turkmenistan; Ukraine; Uzbekistan
Industrialized countries/territories
Andorra; Australia; Austria; Belgium;Canada; Cyprus; Czech Republic; Denmark;Estonia; Finland; France; Germany; Greece;Holy See; Hungary; Iceland; Ireland; Israel;Italy; Japan; Latvia; Liechtenstein; Lithuania;Luxembourg; Malta; Monaco; Netherlands;New Zealand; Norway; Poland; Portugal; SanMarino; Slovakia; Slovenia; Spain; Sweden;Switzerland; United Kingdom; United States
Developing countries/territories
Afghanistan; Algeria; Angola; Antigua andBarbuda; Argentina; Armenia; Azerbaijan;Bahamas; Bahrain; Bangladesh; Barbados;Belize; Benin; Bhutan; Bolivia; Botswana;Brazil; Brunei Darussalam; Burkina Faso;Burundi; Cambodia; Cameroon; Cape Verde;Central African Republic; Chad; Chile; China;Colombia; Comoros; Congo; Congo, DemocraticRepublic of the; Cook Islands; Costa Rica;Côte d’Ivoire; Cuba; Cyprus; Djibouti;Dominica; Dominican Republic; Ecuador;Egypt; El Salvador; Equatorial Guinea;Eritrea; Ethiopia; Fiji; Gabon; Gambia;Georgia; Ghana; Grenada; Guatemala;Guinea; Guinea-Bissau; Guyana; Haiti;Honduras; India; Indonesia; Iran (IslamicRepublic of); Iraq; Israel; Jamaica; Jordan;
Kazakhstan; Kenya; Kiribati; Korea, DemocraticPeople’s Republic of; Korea, Republic of;Kuwait; Kyrgyzstan; Lao People’s DemocraticRepublic; Lebanon; Lesotho; Liberia; LibyanArab Jamahiriya; Madagascar; Malawi;Malaysia; Maldives; Mali; Marshall Islands;Mauritania; Mauritius; Mexico; Micronesia(Federated States of); Mongolia; Morocco;Mozambique; Myanmar; Namibia; Nauru;Nepal; Nicaragua; Niger; Nigeria; Niue;Occupied Palestinian Territory; Oman;Pakistan; Palau; Panama; Papua NewGuinea; Paraguay; Peru; Philippines; Qatar;Rwanda; Saint Kitts and Nevis; Saint Lucia;Saint Vincent/Grenadines; Samoa; Sao Tomeand Principe; Saudi Arabia; Senegal; Seychelles;Sierra Leone; Singapore; Solomon Islands;Somalia; South Africa; Sri Lanka; Sudan;Suriname; Swaziland; Syrian Arab Republic;Tajikistan; Tanzania, United Republic of;Thailand; Timor-Leste; Togo; Tonga; Trinidadand Tobago; Tunisia; Turkey; Turkmenistan;Tuvalu; Uganda; United Arab Emirates;Uruguay; Uzbekistan; Vanuatu; Venezuela(Bolivarian Republic of); Viet Nam; Yemen;Zambia; Zimbabwe
Least developed countries/territories
Afghanistan; Angola; Bangladesh; Benin;Bhutan; Burkina Faso; Burundi; Cambodia;Cape Verde; Central African Republic; Chad;Comoros; Congo, Democratic Republic of the;Djibouti; Equatorial Guinea; Eritrea; Ethiopia;Gambia; Guinea; Guinea-Bissau; Haiti;Kiribati; Lao People’s Democratic Republic;Lesotho; Liberia; Madagascar; Malawi;Maldives; Mali; Mauritania; Mozambique;Myanmar; Nepal; Niger; Rwanda; Samoa;Sao Tome and Principe; Senegal; SierraLeone; Solomon Islands; Somalia; Sudan;Tanzania, United Republic of; Timor-Leste;Togo; Tuvalu; Uganda; Vanuatu; Yemen;Zambia
Summary indicators
136 T H E S T A T E O F T H E W O R L D ’ S C H I L D R E N 2 0 0 7

If development is to be measured by a com-prehensive and inclusive assessment, thenthe need arises for a method of measuringhuman as well as economic progress. FromUNICEF’s point of view, there is a need for anagreed method of measuring the level ofchild well-being and its rate of change.
The under-five mortality rate (U5MR) is usedin Table 10 (next page) as the principal indi-cator of such progress.
The U5MR has several advantages. First, itmeasures an end result of the developmentprocess rather than an ‘input’, such as schoolenrolment level, per capita calorie availabilityor the number of doctors per thousand popu-lation – all of which are means to an end.
Second, the U5MR is known to be the resultof a wide variety of inputs: the nutritionalhealth and the health knowledge of mothers;the level of immunization and oral rehydra-tion therapy use; the availability of maternaland child health services (including prenatalcare); income and food availability in thefamily; the availability of safe drinking waterand basic sanitation; and the overall safetyof the child’s environment.
Third, the U5MR is less susceptible to thefallacy of the average than, for example, percapita gross national income (GNI). This isbecause the natural scale does not allow thechildren of the rich to be one thousand timesas likely to survive, even if the man-madescale does permit them to have one thou-sand times as much income. In other words,it is much more difficult for a wealthy minor-ity to affect a nation’s U5MR, and it thereforepresents a more accurate, if far from perfect,picture of the health status of the majority ofchildren (and of society as a whole).
For these reasons, the U5MR is chosen byUNICEF as its single most important indicatorof the state of a nation’s children.
The speed of progress in reducing the U5MRcan be measured by calculating its averageannual reduction rate (AARR). Unlike thecomparison of absolute changes, the AARRreflects the fact that the lower limits toU5MR are approached only with increasingdifficulty. As lower levels of under-fivemortality are reached, for example, the sameabsolute reduction obviously represents agreater percentage of reduction. The AARRtherefore shows a higher rate of progress fora 10-point reduction, for example, if that re-duction happens at a lower level of under-five mortality. A fall in the U5MR of 10 pointsfrom 100 to 90 represents a reduction of 10per cent, whereas the same 10-point fallfrom 20 to 10 represents a reduction of 50per cent. (A negative value for the percent-age reduction indicates an increase in theU5MR over the period specified).
When used in conjunction with gross do-mestic product (GDP) growth rates, theU5MR and its reduction rate can thereforegive a picture of the progress being made byany country, territory or region, and over anyperiod of time, towards the satisfaction ofsome of the most essential of human needs.
As Table 10 shows, there is no fixed relation-ship between the annual reduction rate ofthe U5MR and the annual rate of growth inper capita GDP. Such comparisons help toshed light on the relationship between eco-nomic advance and human development.
Finally, the table gives the total fertility rate for each country and territory and thecorresponding average annual rate of reduc-tion. It is clear that many of the nations thathave achieved significant reductions in theirU5MR have also achieved significant reduc-tions in fertility.
Measuring human developmentAn introduction to Table 10
S T A T I S T I C A L T A B L E S 137
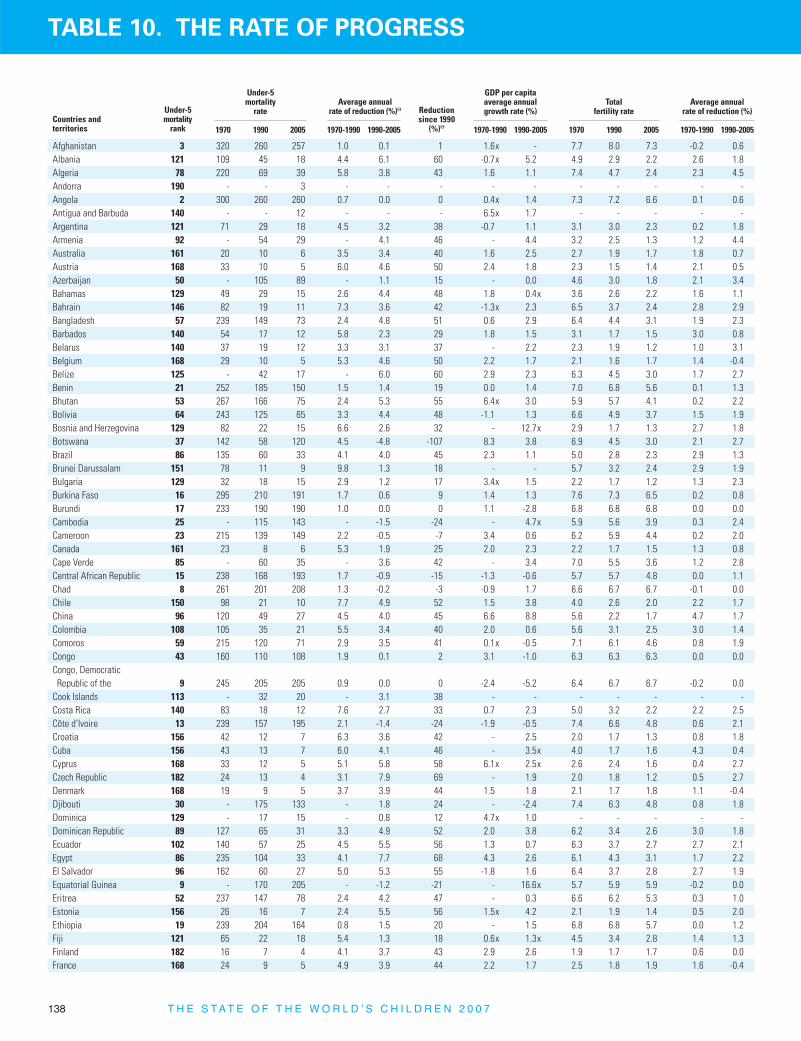
TABLE 10. THE RATE OF PROGRESS
Afghanistan 3 320 260 257 1.0 0.1 1 1.6,x - 7.7 8.0 7.3 -0.2 0.6Albania 121 109 45 18 4.4 6.1 60 -0.7,x 5.2 4.9 2.9 2.2 2.6 1.8Algeria 78 220 69 39 5.8 3.8 43 1.6 1.1 7.4 4.7 2.4 2.3 4.5Andorra 190 - - 3 - - - - - - - - - -Angola 2 300 260 260 0.7 0.0 0 0.4,x 1.4 7.3 7.2 6.6 0.1 0.6Antigua and Barbuda 140 - - 12 - - - 6.5,x 1.7 - - - - -Argentina 121 71 29 18 4.5 3.2 38 -0.7 1.1 3.1 3.0 2.3 0.2 1.8Armenia 92 - 54 29 - 4.1 46 - 4.4 3.2 2.5 1.3 1.2 4.4Australia 161 20 10 6 3.5 3.4 40 1.6 2.5 2.7 1.9 1.7 1.8 0.7Austria 168 33 10 5 6.0 4.6 50 2.4 1.8 2.3 1.5 1.4 2.1 0.5Azerbaijan 50 - 105 89 - 1.1 15 - 0.0 4.6 3.0 1.8 2.1 3.4Bahamas 129 49 29 15 2.6 4.4 48 1.8 0.4,x 3.6 2.6 2.2 1.6 1.1Bahrain 146 82 19 11 7.3 3.6 42 -1.3,x 2.3 6.5 3.7 2.4 2.8 2.9Bangladesh 57 239 149 73 2.4 4.8 51 0.6 2.9 6.4 4.4 3.1 1.9 2.3Barbados 140 54 17 12 5.8 2.3 29 1.8 1.5 3.1 1.7 1.5 3.0 0.8Belarus 140 37 19 12 3.3 3.1 37 - 2.2 2.3 1.9 1.2 1.0 3.1Belgium 168 29 10 5 5.3 4.6 50 2.2 1.7 2.1 1.6 1.7 1.4 -0.4Belize 125 - 42 17 - 6.0 60 2.9 2.3 6.3 4.5 3.0 1.7 2.7Benin 21 252 185 150 1.5 1.4 19 0.0 1.4 7.0 6.8 5.6 0.1 1.3Bhutan 53 267 166 75 2.4 5.3 55 6.4,x 3.0 5.9 5.7 4.1 0.2 2.2Bolivia 64 243 125 65 3.3 4.4 48 -1.1 1.3 6.6 4.9 3.7 1.5 1.9Bosnia and Herzegovina 129 82 22 15 6.6 2.6 32 - 12.7,x 2.9 1.7 1.3 2.7 1.8Botswana 37 142 58 120 4.5 -4.8 -107 8.3 3.8 6.9 4.5 3.0 2.1 2.7Brazil 86 135 60 33 4.1 4.0 45 2.3 1.1 5.0 2.8 2.3 2.9 1.3Brunei Darussalam 151 78 11 9 9.8 1.3 18 - - 5.7 3.2 2.4 2.9 1.9Bulgaria 129 32 18 15 2.9 1.2 17 3.4,x 1.5 2.2 1.7 1.2 1.3 2.3Burkina Faso 16 295 210 191 1.7 0.6 9 1.4 1.3 7.6 7.3 6.5 0.2 0.8Burundi 17 233 190 190 1.0 0.0 0 1.1 -2.8 6.8 6.8 6.8 0.0 0.0Cambodia 25 - 115 143 - -1.5 -24 - 4.7,x 5.9 5.6 3.9 0.3 2.4Cameroon 23 215 139 149 2.2 -0.5 -7 3.4 0.6 6.2 5.9 4.4 0.2 2.0Canada 161 23 8 6 5.3 1.9 25 2.0 2.3 2.2 1.7 1.5 1.3 0.8Cape Verde 85 - 60 35 - 3.6 42 - 3.4 7.0 5.5 3.6 1.2 2.8Central African Republic 15 238 168 193 1.7 -0.9 -15 -1.3 -0.6 5.7 5.7 4.8 0.0 1.1Chad 8 261 201 208 1.3 -0.2 -3 -0.9 1.7 6.6 6.7 6.7 -0.1 0.0Chile 150 98 21 10 7.7 4.9 52 1.5 3.8 4.0 2.6 2.0 2.2 1.7China 96 120 49 27 4.5 4.0 45 6.6 8.8 5.6 2.2 1.7 4.7 1.7Colombia 108 105 35 21 5.5 3.4 40 2.0 0.6 5.6 3.1 2.5 3.0 1.4Comoros 59 215 120 71 2.9 3.5 41 0.1,x -0.5 7.1 6.1 4.6 0.8 1.9Congo 43 160 110 108 1.9 0.1 2 3.1 -1.0 6.3 6.3 6.3 0.0 0.0Congo, Democratic
Republic of the 9 245 205 205 0.9 0.0 0 -2.4 -5.2 6.4 6.7 6.7 -0.2 0.0Cook Islands 113 - 32 20 - 3.1 38 - - - - - - -Costa Rica 140 83 18 12 7.6 2.7 33 0.7 2.3 5.0 3.2 2.2 2.2 2.5Côte d’Ivoire 13 239 157 195 2.1 -1.4 -24 -1.9 -0.5 7.4 6.6 4.8 0.6 2.1Croatia 156 42 12 7 6.3 3.6 42 - 2.5 2.0 1.7 1.3 0.8 1.8Cuba 156 43 13 7 6.0 4.1 46 - 3.5,x 4.0 1.7 1.6 4.3 0.4Cyprus 168 33 12 5 5.1 5.8 58 6.1,x 2.5,x 2.6 2.4 1.6 0.4 2.7Czech Republic 182 24 13 4 3.1 7.9 69 - 1.9 2.0 1.8 1.2 0.5 2.7Denmark 168 19 9 5 3.7 3.9 44 1.5 1.8 2.1 1.7 1.8 1.1 -0.4Djibouti 30 - 175 133 - 1.8 24 - -2.4 7.4 6.3 4.8 0.8 1.8Dominica 129 - 17 15 - 0.8 12 4.7,x 1.0 - - - - -Dominican Republic 89 127 65 31 3.3 4.9 52 2.0 3.8 6.2 3.4 2.6 3.0 1.8Ecuador 102 140 57 25 4.5 5.5 56 1.3 0.7 6.3 3.7 2.7 2.7 2.1Egypt 86 235 104 33 4.1 7.7 68 4.3 2.6 6.1 4.3 3.1 1.7 2.2El Salvador 96 162 60 27 5.0 5.3 55 -1.8 1.6 6.4 3.7 2.8 2.7 1.9Equatorial Guinea 9 - 170 205 - -1.2 -21 - 16.6,x 5.7 5.9 5.9 -0.2 0.0Eritrea 52 237 147 78 2.4 4.2 47 - 0.3 6.6 6.2 5.3 0.3 1.0Estonia 156 26 16 7 2.4 5.5 56 1.5,x 4.2 2.1 1.9 1.4 0.5 2.0Ethiopia 19 239 204 164 0.8 1.5 20 - 1.5 6.8 6.8 5.7 0.0 1.2Fiji 121 65 22 18 5.4 1.3 18 0.6,x 1.3,x 4.5 3.4 2.8 1.4 1.3Finland 182 16 7 4 4.1 3.7 43 2.9 2.6 1.9 1.7 1.7 0.6 0.0France 168 24 9 5 4.9 3.9 44 2.2 1.7 2.5 1.8 1.9 1.6 -0.4
Under-5mortality
rate
1970 1990 2005
Total fertility rate
1970 1990 20051970-1990 1990-2005
GDP per capita average annualgrowth rate (%)
1970-1990 1990-2005
Average annual rate of reduction (%)
1970-1990 1990-2005
Under-5mortality
rank
Average annual rate of reduction (%)Θ
Countries andterritories
Reductionsince 1990
(%)Θ
138 T H E S T A T E O F T H E W O R L D ’ S C H I L D R E N 2 0 0 7

…TABLE 10
Gabon 48 - 92 91 - 0.1 1 0.0 -0.4 4.9 5.4 3.8 -0.5 2.3Gambia 27 311 151 137 3.6 0.6 9 0.9 0.1 6.5 5.9 4.5 0.5 1.8Georgia 72 - 47 45 - 0.3 4 3.2 0.2 2.6 2.1 1.4 1.1 2.7Germany 168 26 9 5 5.3 3.9 44 2.2,x 1.4 2.0 1.4 1.3 1.8 0.5Ghana 42 186 122 112 2.1 0.6 8 -2.1 2.0 6.7 5.8 4.1 0.7 2.3Greece 168 54 11 5 8.0 5.3 55 1.3 2.4 2.4 1.4 1.2 2.7 1.0Grenada 108 - 37 21 - 3.8 43 - 2.1 - - - - -Guatemala 73 168 82 43 3.6 4.3 48 0.2 1.3 6.2 5.6 4.4 0.5 1.6Guinea 21 345 240 150 1.8 3.1 38 - 1.2 6.8 6.5 5.7 0.2 0.9Guinea-Bissau 12 - 253 200 - 1.6 21 -0.1 -2.6 6.8 7.1 7.1 -0.2 0.0Guyana 66 - 88 63 - 2.2 28 -1.5 3.1 5.6 2.6 2.2 3.8 1.1Haiti 37 221 150 120 1.9 1.5 20 -0.3 -2.0 5.8 5.4 3.8 0.4 2.3Holy See - - - - - - - - - - - - - -Honduras 76 170 59 40 5.3 2.6 32 0.6 0.5 7.3 5.1 3.5 1.8 2.5Hungary 154 39 17 8 4.2 5.0 53 2.9 3.1 2.0 1.8 1.3 0.5 2.2Iceland 190 14 7 3 3.5 5.6 57 3.2 2.2 3.0 2.2 1.9 1.6 1.0India 54 202 123 74 2.5 3.4 40 2.2 4.2 5.6 4.0 2.9 1.7 2.1Indonesia 83 172 91 36 3.2 6.2 60 4.7 2.1 5.4 3.1 2.3 2.8 2.0Iran (Islamic Republic of) 83 191 72 36 4.9 4.6 50 -3.5,x 2.5 6.6 5.0 2.1 1.4 5.8Iraq 33 127 50 125 4.7 -6.1 -150 -4.3,x - 7.2 5.9 4.5 1.0 1.8Ireland 161 27 10 6 5.0 3.4 40 2.8 6.2 3.9 2.1 2.0 3.1 0.3Israel 161 27 12 6 4.1 4.6 50 1.9 1.5 3.8 3.0 2.8 1.2 0.5Italy 182 33 9 4 6.5 5.4 56 2.6 1.4 2.4 1.3 1.3 3.1 0.0Jamaica 113 64 20 20 5.8 0.0 0 -1.3 0.2 5.5 2.9 2.4 3.2 1.3Japan 182 21 6 4 6.3 2.7 33 3.0 0.9 2.1 1.6 1.3 1.4 1.4Jordan 100 107 40 26 4.9 2.9 35 2.5,x 1.7 7.9 5.5 3.3 1.8 3.4Kazakhstan 57 - 63 73 - -1.0 -16 - 2.0 3.5 2.8 1.9 1.1 2.6Kenya 37 156 97 120 2.4 -1.4 -24 1.2 -0.2 8.1 5.9 5.0 1.6 1.1Kiribati 64 - 88 65 - 2.0 26 -5.3 1.4 - - - - -Korea, Democratic People’s
Republic of 70 70 55 55 1.2 0.0 0 - - 4.3 2.4 2.0 2.9 1.2Korea, Republic of 168 54 9 5 9.0 3.9 44 6.2 4.5 4.5 1.6 1.2 5.2 1.9Kuwait 146 59 16 11 6.5 2.5 31 -6.8,x 0.6,x 7.2 3.5 2.3 3.6 2.8Kyrgyzstan 63 130 80 67 2.4 1.2 16 - -1.3 4.9 3.9 2.6 1.1 2.7Lao People’s
Democratic Republic 51 218 163 79 1.5 4.8 52 - 3.8 6.1 6.1 4.6 0.0 1.9Latvia 146 26 18 11 1.8 3.3 39 3.4 3.6 1.9 1.9 1.3 0.0 2.5Lebanon 90 54 37 30 1.9 1.4 19 - 2.7 5.1 3.1 2.2 2.5 2.3Lesotho 31 186 101 132 3.1 -1.8 -31 3.1 2.3 5.7 4.9 3.4 0.8 2.4Liberia 5 263 235 235 0.6 0.0 0 -4.2 2.3 6.9 6.9 6.8 0.0 0.1Libyan Arab Jamahiriya 117 160 41 19 6.8 5.1 54 -4.8,x - 7.6 4.8 2.9 2.3 3.4Liechtenstein 182 - 10 4 - 6.1 60 - - - - - - -Lithuania 151 28 13 9 3.8 2.5 31 - 1.9 2.3 2.0 1.3 0.7 2.9Luxembourg 168 26 10 5 4.8 4.6 50 2.7 3.6 2.1 1.6 1.7 1.4 -0.4Madagascar 40 180 168 119 0.3 2.3 29 -2.4 -0.7 6.8 6.2 5.1 0.5 1.3Malawi 33 341 221 125 2.2 3.8 43 -0.1 1.0 7.3 7.0 5.9 0.2 1.1Malaysia 140 70 22 12 5.8 4.0 45 4.0 3.3 5.6 3.8 2.8 1.9 2.0Maldives 74 255 111 42 4.2 6.5 62 - 3.8,x 7.0 6.4 4.0 0.4 3.1Mali 7 400 250 218 2.4 0.9 13 -0.5 2.2 7.5 7.4 6.8 0.1 0.6Malta 161 32 11 6 5.3 4.0 45 6.5 2.7 2.1 2.0 1.5 0.2 1.9Marshall Islands 69 - 92 58 - 3.1 37 - -2.3 - - - - -Mauritania 33 250 133 125 3.2 0.4 6 -0.6 1.9 6.5 6.2 5.6 0.2 0.7Mauritius 129 86 23 15 6.6 2.8 35 5.1,x 3.7 3.7 2.2 2.0 2.6 0.6Mexico 96 110 46 27 4.4 3.6 41 1.6 1.5 6.8 3.4 2.3 3.5 2.6Micronesia (Federated States of) 74 - 58 42 - 2.2 28 - -0.1 6.9 5.0 4.3 1.6 1.0
Moldova, Republic of 128 70 35 16 3.5 5.2 54 1.8,x -3.5 2.6 2.4 1.2 0.4 4.6Monaco 168 - 9 5 - 3.9 44 - - - - - - -Mongolia 71 - 108 49 - 5.3 55 - 0.9 7.5 4.1 2.3 3.0 3.9Montenegro‡ - - - - - - - - - - - - - -Morocco 76 184 89 40 3.6 5.3 55 2.0 1.5 7.1 4.0 2.7 2.9 2.6Mozambique 24 278 235 145 0.8 3.2 38 -1.0,x 4.6 6.6 6.3 5.3 0.2 1.2
Under-5mortality
rate
1970 1990 2005
Total fertility rate
1970 1990 20051970-1990 1990-2005
GDP per capita average annualgrowth rate (%)
1970-1990 1990-2005
Average annual rate of reduction (%)
1970-1990 1990-2005
Under-5mortality
rank
Average annual rate of reduction (%)Θ Reduction
since 1990(%)Θ
S T A T I S T I C A L T A B L E S 139

TABLE 10. THE RATE OF PROGRESS
Myanmar 44 179 130 105 1.6 1.4 19 1.5 6.6 5.9 4.0 2.2 1.9 4.0Namibia 67 135 86 62 2.3 2.2 28 -2.3,x 1.4 6.5 6.0 3.7 0.4 3.2Nauru 90 - - 30 - - - - - - - - - -Nepal 54 250 145 74 2.7 4.5 49 1.1 1.9 5.9 5.2 3.5 0.6 2.6Netherlands 168 15 9 5 2.6 3.9 44 1.5 1.9 2.4 1.6 1.7 2.0 -0.4New Zealand 161 20 11 6 3.0 4.0 45 0.8 2.1 3.1 2.1 2.0 1.9 0.3Nicaragua 82 165 68 37 4.4 4.1 46 -3.8 1.5 7.0 4.9 3.1 1.8 3.1Niger 4 330 320 256 0.2 1.5 20 -2.2 -0.5 8.1 8.2 7.7 -0.1 0.4Nigeria 14 265 230 194 0.7 1.1 16 -1.4 0.7 6.9 6.8 5.6 0.1 1.3Niue - - - - - - - - - - - - - -Norway 182 15 9 4 2.6 5.4 56 3.4 2.6 2.5 1.9 1.8 1.4 0.4Occupied Palestinian
Territory 106 - 40 23 - 3.7 43 - -6.0,x 7.9 6.4 5.3 1.1 1.3Oman 140 200 32 12 9.2 6.5 63 3.3 1.8,x 7.2 6.6 3.4 0.4 4.4Pakistan 47 181 130 99 1.7 1.8 24 3.0 1.3 6.6 6.1 4.0 0.4 2.8Palau 146 - 21 11 - 4.3 48 - - - - - - -Panama 103 68 34 24 3.5 2.3 29 0.3 2.2 5.3 3.0 2.6 2.8 1.0Papua New Guinea 54 158 94 74 2.6 1.6 21 -0.7 0.0 6.2 5.1 3.8 1.0 2.0Paraguay 106 78 41 23 3.2 3.9 44 2.8 -0.8 6.0 4.7 3.7 1.2 1.6Peru 96 174 78 27 4.0 7.1 65 -0.6 2.2 6.3 3.9 2.7 2.4 2.5Philippines 86 90 62 33 1.9 4.2 47 0.8 1.5 6.3 4.4 3.0 1.8 2.6Poland 156 36 18 7 3.5 6.3 61 - 4.3 2.2 2.0 1.2 0.5 3.4Portugal 168 62 14 5 7.4 6.9 64 2.6 1.9 2.8 1.5 1.5 3.1 0.0Qatar 108 65 26 21 4.6 1.4 19 - - 6.9 4.4 2.9 2.2 2.8Romania 117 57 31 19 3.0 3.3 39 0.9 1.6 2.9 1.9 1.3 2.1 2.5Russian Federation 121 36 27 18 1.4 2.7 33 - -0.1 2.0 1.9 1.4 0.3 2.0Rwanda 11 209 173 203 0.9 -1.1 -17 1.2 0.0 8.2 7.6 5.5 0.4 2.2Saint Kitts and Nevis 113 - 36 20 - 3.9 44 6.3,x 2.9 - - - - -Saint Lucia 137 - 21 14 - 2.7 33 5.3,x 0.4 6.1 3.5 2.2 2.8 3.1Saint Vincent and the Grenadines 113 - 25 20 - 1.5 20 3.3 1.7 6.0 3.0 2.2 3.5 2.1
Samoa 92 101 50 29 3.5 3.6 42 -0.1,x 2.5 6.1 4.8 4.2 1.2 0.9San Marino 190 - 14 3 - 10.3 79 - - - - - - -Sao Tome and Principe 41 - 118 118 - 0.0 0 - 0.5 6.5 5.3 3.8 1.0 2.2Saudi Arabia 100 185 44 26 7.2 3.5 41 -1.5 -0.3 7.3 6.0 3.8 1.0 3.0Senegal 28 279 148 136 3.2 0.6 8 -0.3 1.2 7.0 6.5 4.8 0.4 2.0Serbia‡ - - - - - - - - - - - - - -Seychelles 139 59 19 13 5.7 2.5 32 2.9 1.5 - - - - -Sierra Leone 1 363 302 282 0.9 0.5 7 -0.4 -1.4 6.5 6.5 6.5 0.0 0.0Singapore 190 27 9 3 5.5 7.3 67 5.7 3.6 3.0 1.8 1.3 2.6 2.2Slovakia 154 29 14 8 3.6 3.7 43 - 2.8 2.5 2.0 1.2 1.1 3.4Slovenia 182 29 10 4 5.3 6.1 60 - 3.2 2.3 1.5 1.2 2.1 1.5Solomon Islands 92 97 38 29 4.7 1.8 24 3.4 -2.6 6.9 5.5 4.1 1.1 2.0Somalia 6 - 225 225 - 0.0 0 -0.9 - 7.3 6.8 6.2 0.4 0.6South Africa 61 - 60 68 - -0.8 -13 0.1 0.7 5.6 3.6 2.7 2.2 1.9Spain 168 34 9 5 6.6 3.9 44 1.9 2.3 2.9 1.3 1.3 4.0 0.0Sri Lanka 137 100 32 14 5.7 5.5 56 3.0 3.7 4.4 2.5 1.9 2.8 1.8Sudan 49 172 120 90 1.8 1.9 25 0.1 3.5 6.7 5.6 4.2 0.9 1.9Suriname 78 - 48 39 - 1.4 19 -2.2,x 1.1 5.7 2.7 2.5 3.7 0.5Swaziland 20 196 110 160 2.9 -2.5 -45 2.1 0.2 6.9 5.7 3.7 1.0 2.9Sweden 182 15 7 4 3.8 3.7 43 1.8 2.1 2.0 2.0 1.7 0.0 1.1Switzerland 168 18 9 5 3.5 3.9 44 1.2 0.6 2.0 1.5 1.4 1.4 0.5Syrian Arab Republic 129 123 39 15 5.7 6.4 62 1.9 1.3 7.6 5.3 3.3 1.8 3.2Tajikistan 59 140 115 71 1.0 3.2 38 - -4.0 6.9 5.2 3.6 1.4 2.5Tanzania, United Republic of 36 218 161 122 1.5 1.8 24 - 1.7 6.8 6.1 4.8 0.5 1.6Thailand 108 102 37 21 5.1 3.8 43 4.8 2.7 5.5 2.2 1.9 4.6 1.0The former Yugoslav Republic of Macedonia 125 119 38 17 5.7 5.4 55 - -0.1 3.2 1.9 1.5 2.6 1.6
Timor-Leste 68 - 177 61 - 7.1 66 - - 6.3 4.9 7.8 1.3 -3.1Togo 26 216 152 139 1.8 0.6 9 -0.6 0.0 7.0 6.4 5.1 0.4 1.5Tonga 103 50 32 24 2.2 1.9 25 - 1.9 5.9 4.6 3.3 1.2 2.2Trinidad and Tobago 117 57 33 19 2.7 3.7 42 0.5 4.3 3.5 2.5 1.6 1.7 3.0
Under-5mortality
rate
1970 1990 2005
Total fertility rate
1970 1990 20051970-1990 1990-2005
GDP per capita average annualgrowth rate (%)
1970-1990 1990-2005
Average annual rate of reduction (%)
1970-1990 1990-2005
Under-5mortality
rank
Average annual rate of reduction (%)Θ Reduction
since 1990(%)Θ
140 T H E S T A T E O F T H E W O R L D ’ S C H I L D R E N 2 0 0 7
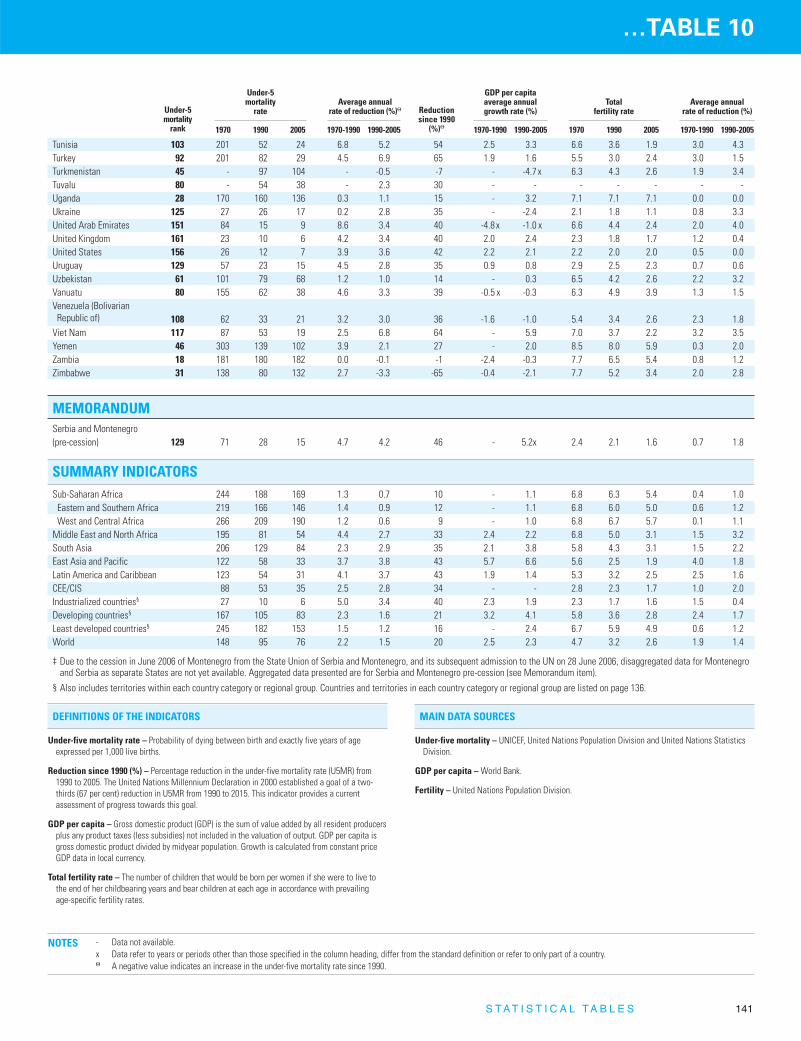
…TABLE 10
Tunisia 103 201 52 24 6.8 5.2 54 2.5 3.3 6.6 3.6 1.9 3.0 4.3Turkey 92 201 82 29 4.5 6.9 65 1.9 1.6 5.5 3.0 2.4 3.0 1.5Turkmenistan 45 - 97 104 - -0.5 -7 - -4.7,,x 6.3 4.3 2.6 1.9 3.4Tuvalu 80 - 54 38 - 2.3 30 - - - - - - -Uganda 28 170 160 136 0.3 1.1 15 - 3.2 7.1 7.1 7.1 0.0 0.0Ukraine 125 27 26 17 0.2 2.8 35 - -2.4 2.1 1.8 1.1 0.8 3.3United Arab Emirates 151 84 15 9 8.6 3.4 40 -4.8,,x -1.0,,,x 6.6 4.4 2.4 2.0 4.0United Kingdom 161 23 10 6 4.2 3.4 40 2.0 2.4 2.3 1.8 1.7 1.2 0.4United States 156 26 12 7 3.9 3.6 42 2.2 2.1 2.2 2.0 2.0 0.5 0.0Uruguay 129 57 23 15 4.5 2.8 35 0.9 0.8 2.9 2.5 2.3 0.7 0.6Uzbekistan 61 101 79 68 1.2 1.0 14 - 0.3 6.5 4.2 2.6 2.2 3.2Vanuatu 80 155 62 38 4.6 3.3 39 -0.5,,,x -0.3 6.3 4.9 3.9 1.3 1.5Venezuela (Bolivarian Republic of) 108 62 33 21 3.2 3.0 36 -1.6 -1.0 5.4 3.4 2.6 2.3 1.8
Viet Nam 117 87 53 19 2.5 6.8 64 - 5.9 7.0 3.7 2.2 3.2 3.5Yemen 46 303 139 102 3.9 2.1 27 - 2.0 8.5 8.0 5.9 0.3 2.0Zambia 18 181 180 182 0.0 -0.1 -1 -2.4 -0.3 7.7 6.5 5.4 0.8 1.2Zimbabwe 31 138 80 132 2.7 -3.3 -65 -0.4 -2.1 7.7 5.2 3.4 2.0 2.8
NOTES - Data not available.x Data refer to years or periods other than those specified in the column heading, differ from the standard definition or refer to only part of a country.Θ A negative value indicates an increase in the under-five mortality rate since 1990.
SUMMARY INDICATORSSub-Saharan Africa 244 188 169 1.3 0.7 10 - 1.1 6.8 6.3 5.4 0.4 1.0
Eastern and Southern Africa 219 166 146 1.4 0.9 12 - 1.1 6.8 6.0 5.0 0.6 1.2West and Central Africa 266 209 190 1.2 0.6 9 - 1.0 6.8 6.7 5.7 0.1 1.1
Middle East and North Africa 195 81 54 4.4 2.7 33 2.4 2.2 6.8 5.0 3.1 1.5 3.2South Asia 206 129 84 2.3 2.9 35 2.1 3.8 5.8 4.3 3.1 1.5 2.2East Asia and Pacific 122 58 33 3.7 3.8 43 5.7 6.6 5.6 2.5 1.9 4.0 1.8Latin America and Caribbean 123 54 31 4.1 3.7 43 1.9 1.4 5.3 3.2 2.5 2.5 1.6CEE/CIS 88 53 35 2.5 2.8 34 - - 2.8 2.3 1.7 1.0 2.0Industrialized countries§ 27 10 6 5.0 3.4 40 2.3 1.9 2.3 1.7 1.6 1.5 0.4Developing countries§ 167 105 83 2.3 1.6 21 3.2 4.1 5.8 3.6 2.8 2.4 1.7Least developed countries§ 245 182 153 1.5 1.2 16 - 2.4 6.7 5.9 4.9 0.6 1.2World 148 95 76 2.2 1.5 20 2.5 2.3 4.7 3.2 2.6 1.9 1.4
‡ Due to the cession in June 2006 of Montenegro from the State Union of Serbia and Montenegro, and its subsequent admission to the UN on 28 June 2006, disaggregated data for Montenegroand Serbia as separate States are not yet available. Aggregated data presented are for Serbia and Montenegro pre-cession (see Memorandum item).
§ Also includes territories within each country category or regional group. Countries and territories in each country category or regional group are listed on page 136.
MAIN DATA SOURCES
Under-five mortality – UNICEF, United Nations Population Division and United Nations StatisticsDivision.
GDP per capita – World Bank.
Fertility – United Nations Population Division.
DEFINITIONS OF THE INDICATORS
Under-five mortality rate – Probability of dying between birth and exactly five years of ageexpressed per 1,000 live births.
Reduction since 1990 (%) – Percentage reduction in the under-five mortality rate (U5MR) from1990 to 2005. The United Nations Millennium Declaration in 2000 established a goal of a two-thirds (67 per cent) reduction in U5MR from 1990 to 2015. This indicator provides a currentassessment of progress towards this goal.
GDP per capita – Gross domestic product (GDP) is the sum of value added by all resident producersplus any product taxes (less subsidies) not included in the valuation of output. GDP per capita isgross domestic product divided by midyear population. Growth is calculated from constant priceGDP data in local currency.
Total fertility rate – The number of children that would be born per women if she were to live tothe end of her childbearing years and bear children at each age in accordance with prevailing age-specific fertility rates.
Under-5mortality
rate
1970 1990 2005
Total fertility rate
1970 1990 20051970-1990 1990-2005
GDP per capita average annualgrowth rate (%)
1970-1990 1990-2005
Average annual rate of reduction (%)
1970-1990 1990-2005
Under-5mortality
rank
Average annual rate of reduction (%)Θ Reduction
since 1990(%)Θ
MEMORANDUMSerbia and Montenegro (pre-cession) 129 71 28 15 4.7 4.2 46 - 5.2x 2.4 2.1 1.6 0.7 1.8
S T A T I S T I C A L T A B L E S 141
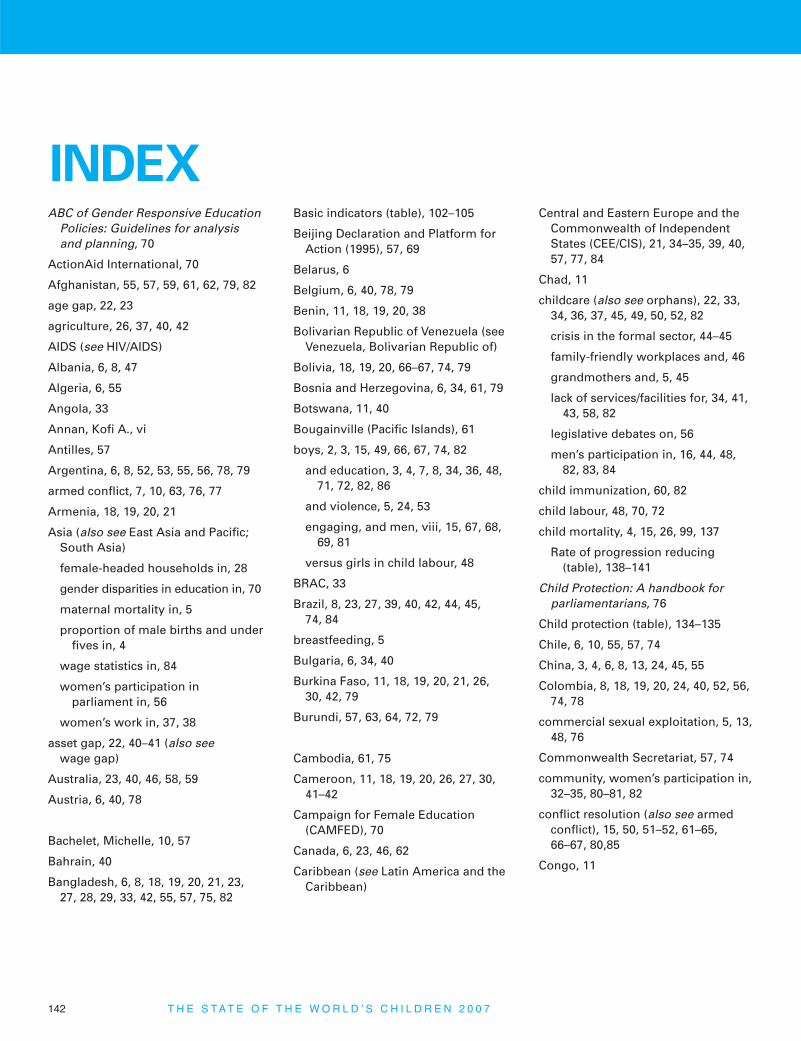
ABC of Gender Responsive EducationPolicies: Guidelines for analysisand planning, 70
ActionAid International, 70
Afghanistan, 55, 57, 59, 61, 62, 79, 82
age gap, 22, 23
agriculture, 26, 37, 40, 42
AIDS (see HIV/AIDS)
Albania, 6, 8, 47
Algeria, 6, 55
Angola, 33
Annan, Kofi A., vi
Antilles, 57
Argentina, 6, 8, 52, 53, 55, 56, 78, 79
armed conflict, 7, 10, 63, 76, 77
Armenia, 18, 19, 20, 21
Asia (also see East Asia and Pacific;South Asia)
female-headed households in, 28
gender disparities in education in, 70
maternal mortality in, 5
proportion of male births and underfives in, 4
wage statistics in, 84
women’s participation inparliament in, 56
women’s work in, 37, 38
asset gap, 22, 40–41 (also seewage gap)
Australia, 23, 40, 46, 58, 59
Austria, 6, 40, 78
Bachelet, Michelle, 10, 57
Bahrain, 40
Bangladesh, 6, 8, 18, 19, 20, 21, 23,27, 28, 29, 33, 42, 55, 57, 75, 82
Basic indicators (table), 102–105
Beijing Declaration and Platform forAction (1995), 57, 69
Belarus, 6
Belgium, 6, 40, 78, 79
Benin, 11, 18, 19, 20, 38
Bolivarian Republic of Venezuela (seeVenezuela, Bolivarian Republic of)
Bolivia, 18, 19, 20, 66–67, 74, 79
Bosnia and Herzegovina, 6, 34, 61, 79
Botswana, 11, 40
Bougainville (Pacific Islands), 61
boys, 2, 3, 15, 49, 66, 67, 74, 82
and education, 3, 4, 7, 8, 34, 36, 48,71, 72, 82, 86
and violence, 5, 24, 53
engaging, and men, viii, 15, 67, 68,69, 81
versus girls in child labour, 48
BRAC, 33
Brazil, 8, 23, 27, 39, 40, 42, 44, 45, 74, 84
breastfeeding, 5
Bulgaria, 6, 34, 40
Burkina Faso, 11, 18, 19, 20, 21, 26,30, 42, 79
Burundi, 57, 63, 64, 72, 79
Cambodia, 61, 75
Cameroon, 11, 18, 19, 20, 26, 27, 30,41–42
Campaign for Female Education(CAMFED), 70
Canada, 6, 23, 46, 62
Caribbean (see Latin America and theCaribbean)
Central and Eastern Europe and theCommonwealth of IndependentStates (CEE/CIS), 21, 34–35, 39, 40,57, 77, 84
Chad, 11
childcare (also see orphans), 22, 33,34, 36, 37, 45, 49, 50, 52, 82
crisis in the formal sector, 44–45
family-friendly workplaces and, 46
grandmothers and, 5, 45
lack of services/facilities for, 34, 41,43, 58, 82
legislative debates on, 56
men’s participation in, 16, 44, 48,82, 83, 84
child immunization, 60, 82
child labour, 48, 70, 72
child mortality, 4, 15, 26, 99, 137
Rate of progression reducing(table), 138–141
Child Protection: A handbook forparliamentarians, 76
Child protection (table), 134–135
Chile, 6, 10, 55, 57, 74
China, 3, 4, 6, 8, 13, 24, 45, 55
Colombia, 8, 18, 19, 20, 24, 40, 52, 56,74, 78
commercial sexual exploitation, 5, 13,48, 76
Commonwealth Secretariat, 57, 74
community, women’s participation in,32–35, 80–81, 82
conflict resolution (also see armedconflict), 15, 50, 51–52, 61–65,66–67, 80,85
Congo, 11
INDEX
142 T H E S T A T E O F T H E W O R L D ’ S C H I L D R E N 2 0 0 7

Convention on the Elimination of AllForms of Discrimination againstWomen (CEDAW), viii, 1, 2–3, 6,10,15, 37, 47, 69, 81
Convention on the Rights of the Child(CRC), 1, 2–3, 6, 47, 76
Costa Rica, 40, 52, 56, 78, 79
Côte d’Ivoire, 26, 27, 30
Croatia, 6, 40
Cuba, 78
Czech Republic, 6, 34, 40
Darfur Peace Agreement, 62
data collection, 31, 67, 83–86, 99
death, maternal, 5, 14, 83–84, 85, 86
Democratic Republic of the Congo,63, 72
Demographic and Health Surveys, 3,11, 14, 16, 17–21, 26, 32–33, 86
Demographic indicators (table),122–125
Denmark, 6, 40, 58, 78
domestic violence (also see violence),7, 23, 24–25, 42, 53, 75–77, 83
domestic work, children and, 13, 22,29, 40, 48
domestic workers, 24, 43, 44, 47, 48,66–67
East Asia and Pacific
women’s household decision-making in, 21
women’s employment in, 39, 40, 44, 84
women in politics in, 55, 56, 60, 61
Eastern and Southern Africa, 14, 72
Economic indicators (table), 126–129
Ecuador, 47, 74, 79
Education for All, 72
Education (table), 118–121 (also seeprimary education; secondaryeducation; tertiary education),
and income-earning opportunitiesfor women, 8, 26, 33, 36, 48, 82
gender gap in, 4, 10, 23, 60
initiatives, 31, 33, 34–35, 70, 72
Egypt, 6, 18, 19, 20, 21, 24, 27, 40, 48,52, 55
El Salvador, 8, 40, 44, 61
elderly, 5, 30–31, 38, 54
employment, 13, 33, 35, 37–49, 75, 85
empowerment, 8, 15, 27, 42, 65–67, 74
equality (also see gender equality),1–16
Eritrea, 18, 19, 20, 27, 40, 61
Estonia, 6
Ethiopia 61, 72
Europe (see Central and EasternEurope and the Commonwealth ofIndependent States (CEE/CIS);Western Europe)
European Union, 44, 63
A Fair Chance, 70
family-friendly initiatives, 45, 46
female genital mutilation/cutting(FGM/C), 4, 9, 76
female-headed households, 28–32
Finland, 6, 40, 46, 57, 58, 78
foeticide, 4, 7
Food and Agriculture Organization ofthe United Nations (FAO), 30
Forum for African WomenEducationalists (FAWE), 34, 70
Fourth World Conference on Women(1995), 46
The Framework for the Protection,Care and Support of Orphans andVulnerable Children Living in aWorld with HIV and AIDS, 31
France, 6, 40, 52
funding, for gender equity goals,73–75
Gabon, 11
Gallup Poll, on gender discrimination,8
Gambia, 34–35
grass-roots movements andempowerment, 68, 81
gender
and cooperation among women,80–81
empowerment measure (GEM), 45
equality, 2, 4–5, 6–7, 8, 9, 15, 65–66,67, 69–71, 73–75, 86–87, 78–80,83–86
equality and education, 70, 71–73
equality and legislative reform,75–78
equality and role of men and boys,81–83
parity activity index, 39
responsive budgets, 74
versus sex, 1
Georgia, 34, 40
Germany, 34, 40, 57, 79
Ghana, 11, 18, 19, 20, 26–27, 30, 48,70, 72, 75
Global Campaign for Education(GCE), 70
Global Campaign on Children andAIDS – Unite for Children. Uniteagainst AIDS, 31
I N D E X 143

144 T H E S T A T E O F T H E W O R L D ’ S C H I L D R E N 2 0 0 7
Global March against Child Labour, 70
grandmothers (also see HIV/AIDS;motherhood), 5, 30–31, 41, 45
Greece, 6, 40
Guatemala, 48, 61, 62, 82
Guinea-Bissau, 27
Guyana, 27
Haiti, 18, 19, 20
Health (table), 107-111
health care, 3, 5, 14, 18, 21, 26–27, 29,30, 60, 75
HelpAge International, 31
HIV/AIDS, 9, 76, (table) 114–117
children orphaned by, 30-31
female genital mutilation/cutting(FGM/C) and, 4
Framework for the Protection, Careand Support of Orphans andVulnerable Children Living in aWorld with HIV and AIDS, 31
Global Campaign on (Unite forChildren. Unite against AIDS), 31
grandmothers and, 30-31
knowledge of sexual and reproductive health and, 4, 5, 11, 84
people living with, 5
household decision-making, 12–13,17–36, 42
household labour, division of, 37–38
Hungary, 6, 40
Iceland, 6, 40, 78
income (also see employment;poverty), 8, 22, 35, 39–40, 41, 84
India, 4, 5, 6, 24, 26, 27, 38, 44, 48, 51,55, 58, 59–60, 61, 65, 80, 81, 82, 84
Indonesia, 6, 18, 19, 20, 21, 44, 45, 47,55, 82
infanticide, 4, 7
infants and HIV, 5
informal work, 43–44, 75, 84, 85
institutional discrimination, 7
Inter-Parliamentary Union (IPU),54–55, 76, 79, 85
International Conference on Populationand Development (1994), 46
International Food Policy ResearchInstitute, 16, 25, 42
International Institute for Democracyand Electoral Assistance, 79
International Labour Organization, 47
involuntary migration, 47
Iran (Islamic Republic of), 6, 8, 55
Iraq, 6, 55, 79
Ireland, Northern, 54, 62
Ireland, 6, 40, 54, 57
Israel, 23, 58
Italy, 6, 47, 79
Jain, Devaki ,64
Jamaica, 10, 57
Japan, 6, 40
Johnson-Sirleaf, Ellen, 57
Joint United Nations Programme onHIV/AIDS (UNAIDS), 11, 76
Jordan, 6, 18, 19, 20, 40, 47, 55
Kazakhstan, 40
Kenya, 11, 18, 19, 20, 23, 30, 31, 40,42, 44, 45, 72
Korea, Republic of (see Republic ofKorea)
Kosovo, 61
Kuwait, 75, 78
Kyrgyzstan, 6, 57
land (see asset gap)
Latin America and the Caribbean
education in, 16, 23, 27
land ownership gaps in, 42
household decision-making in, 20,21, 24, 25, 28
women’s employment in, 8, 37, 39, 41
women in politics in, 55, 56
Latvia, 6, 40, 57
Lesotho, 11
Liberia, women in politics in, 57, 61,63, 64
life cycle, gender discriminationacross, 4–5, 68
literacy, 5, 9, 10, 27, 66, 84, 85
Lithuania, 6, 40
Luxembourg, 6, 40
Madagascar, 11, 18, 19, 20, 38
Malawi, 11, 18, 19, 20, 30, 31, 72
Malaysia, 40
Mali, 11, 18, 19, 20, 21
Malta, 6, 40
marriage, child or early, 4, 7, 22, 23,35, 40, 59
maternal mortality, 5, 14, 83–84, 85, 86
Mauritania, 38
mediators, women as (also seeconflict resolution), 61–63
men, 6, 8, 29-32, 35, 56, 65, 81-83, 84
Mexico, 6, 8, 24, 29, 37, 38, 40, 42, 44,47, 55, 74, 76
Middle East and North Africa
education in, 27
female genital mutilation/cutting(FGM/C) in, 4
household decision-making in, 21,28, 32
household power dynamics in, 32
women in politics in, 8, 52, 55, 56

I N D E X 145
migrant workers, 28, 46–47
Millennium Agenda, viii, 2, 70
Millennium Declaration, 2, 73
Millennium Development Goals(MDGs), viii, 1, 2, 5, 6, 12, 13, 15, 56,65, 69, 72, 73, 74, 75, 86
Millennium Project, 42, 73, 75
Mitchell, George, 62
mobility, 21, 27, 42
Moldova, Republic of (see Republic of Moldova)
Mongolia, 38
Montenegro, 6
Morales, Evo, 67
Morocco, 6, 18, 19, 20, 32, 55, 59, 74
Mother Centres/Clubs, 34–35
mother-daughter substitute effect, 40, 41
motherhood (also see grandmothers),3–5, 30, 41, 45
Mozambique, 11, 18, 19, 20, 30, 33,57, 59, 72, 78, 79
Multiple Indicator Cluster Survey, 3,11, 14, 85
Myanmar, 40
Namibia, 11, 30, 53
Nepal, 18, 19, 20, 21, 26, 41, 48, 79, 82
Netherlands, 6, 40, 45, 52, 57, 78
New Zealand, 40, 52, 53, 57
Nicaragua, 18, 20, 21, 42
Nigeria, 6, 11, 18, 19, 20, 21, 30, 42, 55
North Africa (see Middle East andNorth Africa)
northern Europe, 56
Northern Ireland, 54, 62
Northern Ireland Women’s Coalition, 62
Norway, 40, 58, 62, 78, 79
nutrition, viii, 2, 17, 23, 24–26, 29, 30,35, 40, 71, 80, 81, (table) 106–109
Occupied Palestinian Territory, 40
Office of the United Nations HighCommissioner for Human Rights, 25
Organisation for Economic Co-operation and Development(OECD), 39, 44
orphans, 30–31, 62
Oxfam International, 37, 70
Pacific, 56, 61 (also see East Asia and Pacific)
Pakistan, 6, 42, 55, 82
Panama, 40
Paraguay, 40, 42
‘Paris Principles’ (Principles relatingto the status and functioning ofnational institutions for protectionand promotion of human rights), 25
Parliamentary Forum on Children, 76
partnerships, 68, 70, 76, 80, 86
peace processes, 50–52, 61–64, 65–67, 80
Peru, 6, 18, 19, 20, 40, 41, 42, 55, 74
Philippines, 6, 18, 19, 20, 21, 24, 40,47, 55, 57, 62, 79
Poland, 6
political parties, 50, 55, 58, 60, 66, 68, 79
politics, 8, 13, 15, 50, 55, 57, 58, 61,64, 65, 66, 67, 68, 78, 79
Portugal, 6, 40
poverty (also see income), 2, 5, 9, 10,12, 13, 15, 30, 31, 34, 36, 37, 38, 40,42, 43, 47, 49, 67, 75, 80
pregnancy (also see motherhood), 4,5, 14, 26, 53, 69, 86
primary education (also seeeducation), 4, 7, 34, 42, 69, 72, 75
property (see asset gap)
Protocol on the Rights of Women inAfrica (amendment to the AfricanCharter on Human and People’sRights), 75
quotas, viii, 15, 50, 57, 59, 65, 66, 68,69, 78, 79, 80
rape (also see violence, sexual), 4, 67
and resolution on impact of war onwomen, 61, 66, 77
armed conflict and, 7, 77
legislation against, 52, 53
Rate of progress (table), 138–141
refugees, 47, 59, 62
reproductive health (also seemotherhood), 4, 5, 11, 59, 75
Republic of Korea, 6, 10, 38, 40, 55, 57
Republic of Moldova, 6, 47
Romero, Casimira Rodríguez, 66–67
Russian Federation, 6, 34, 44, 45, 52
Rwanda, 11, 18, 19, 20, 31, 52, 53, 59,61, 65, 74, 78, 79
Saudi Arabia, 6, 32, 55
school fees, 31, 34, 48, 68, 72
School Fee Abolition Initiative (SFAI), 72
schools (see education)
Scotland, 56
secondary education (also seeeducation), 3, 4, 29, 48,62, 70, 71, 84
Senegal, 76
Serbia, 6, 79
sexually transmitted infections, 5, 84
Sierra Leone, 61, 62
Singapore, 6, 40, 55
Slovakia, 6
Slovenia, 6
social networks (see women’sgroups)
Somalia, 63–64, 75
South Asia
child marriage in, 4
education in, 3, 23, 27, 29

146 T H E S T A T E O F T H E W O R L D ’ S C H I L D R E N 2 0 0 7
household decision-making in, 17,21, 24–25
women’s empowerment in, 8, 33,39, 40
women in politics in, 55
South Asia, 3, 4, 6, 8, 14, 16, 18, 19,20, 21, 22, 23, 24, 25, 25, 26, 27, 33,39, 40, 41, 55
Spain, 6, 57, 78
Sri Lanka, 47, 64, 82
sub-Saharan Africa
child marriage in, 4, 59
education in, 3, 23, 26, 27, 34–35, 70
female genital mutilation/cutting(FGM/C) in, 4, 76
HIV/AIDS in, 4, 5, 11, 30–31, 82
household decision-making in, 16,21, 24–25, 28
women in politics in, 55, 56, 57
Sudan, 62, 79, 80
Swaziland, 31, 40
Sweden, 6, 40, 45, 46, 52, 56, 57, 58,62, 78, 79, 83
Switzerland, 40
Tajikistan, 59, 75
Tanzania (see United Republic ofTanzania)
tertiary education (also seeeducation), 54, 71, 84
Thailand, 40, 47, 54–55
The former Yugoslav Repubic ofMacedonia, 6
Timor-Leste, 57, 61
TOSTAN, 76
trafficking, of children, 5, 47, 48, 76,85
Tunisia, 44
Turkey, 6, 40
Turkmenistan, 18, 19, 20
Uganda, 6, 8, 11, 18, 20, 30, 31, 55, 63,75, 79, 82
Ukraine, 6, 40
under-five mortality, 4, 15, 99, (table),101, 137
underweight (also see nutrition;undernutrition), 16, 23, 24–26
undernutrition (also see nutrition), 4,16, 24, 29
United Cities and Local Governments,61, 85
United Kingdom, 6, 23, 32, 40, 44, 45,46, 52, 56, 79
United Nations (UN)
Charter, 1
Commission on the Status ofWomen, 1
Department of PeacekeepingOperations (DPKO), 63, 66, 77, 85
Development Fund for Women(UNIFEM), 62, 64, 74, 80
Development Programme (UNDP),8, 38, 41, 63
Food and Agricultural Organization(FAO), 30
General Assembly Special Sessionon Children (2002), 10, 15, 76
Girls' Education Initiative (UNGEI), 70
Joint United Nations Programmeon HIV/AIDS (UNAIDS), 11, 76
Millennium Summit, 2, 15
Population Fund (UNFPA), 86
Report of the Independent Expertfor the United Nations Study onViolence against Children, 25, 76
Security Council resolution 1325,61, 66, 77
Universal Declaration of HumanRights, 1
United Republic of Tanzania, 6, 11, 18,19, 20, 23, 30, 31, 41, 42, 55, 63,64–65, 72, 75
United States, 6, 8, 23, 32, 44, 45, 53,54, 58, 84
Uzbekistan, 82
Veneman, Ann M., vi
Venezuela (Bolivarian Republic of), 6, 55
Viet Nam, 6, 44, 55, 76, 82
violence (also see armed conflict;domestic violence)
Report of the Independent Expertfor the United Nations Study onViolence against Children, 25, 76
sexual, 5, 7, 9, 23, 24–25, 47, 53, 63,69, 72, 77
World report on violence and health, 23
wages (see income)
wage gap, 13, 39–40, 49, 75
war (see armed conflict)
water, 9, 13, 33, 59, 60, 62
West and Central Africa, 14, 26
Western Europe, 22, 32
widows, 28, 30–31, 40
Women, Development and the UnitedNations, 64
Women (table),130–133
women’s groups, 16, 32–35, 50, 58,59, 61, 80–81, 82
World Bank, 72, 82
World Health Organization (WHO), 5,7, 14, 23, 24, 25, 86
World Values Survey, 6, 8, 39, 55
Zambia, 11, 18, 20, 31, 70
Zimbabwe, 18, 19, 20, 30, 70, 82

GLOSSARY
G L O S S A R Y 147
AIDS acquired immune deficiency syndrome
CAMFED Campaign for Female Education
CEDAW Convention on the Elimination of All Forms of Discrimination against Women
CEE/CIS Central and Eastern Europe/Commonwealth of Independent States
CRC Convention on the Rights of the Child
DHS Demographic and Health Surveys
DPKO Department of Peacekeeping Operations, United Nations
FAWE Forum for African Women Educationalists
FFE Food for Education
FGM/C female genital mutilation/cutting
GCE Global Campaign for Education
GDP gross domestic product
GEM gender empowerment measure
HIV human immunodeficiency virus
IPU Inter-Parliamentary Union
MDGs Millennium Development Goals
MICS Multiple Indicator Cluster Surveys
OECD Organisation for Economic Co-operation and Development
SFAI School Fee Abolition Initiative
UN United Nations
UNAIDS Joint United Nations Programme on HIV/AIDS
UNDP United Nations Development Programme
UNESCO United Nations Educational, Scientific and Cultural Organization
UNFPA United Nations Population Fund
UNGEI United Nations Girls’ Education Initiative
UNIFEM United Nations Development Fund for Women
WHO World Health Organization

UNICEF Offices
UNICEF Headquarters
UNICEF House3 United Nations PlazaNew York, NY 10017, USA
UNICEF Regional Office for Europe
Palais des NationsCH-1211 Geneva 10, Switzerland
UNICEF Central and Eastern Europe,
Commonwealth of Independent
States Regional Office
Palais des NationsCH-1211 Geneva 10, Switzerland
UNICEF Eastern and Southern Africa
Regional Office
P.O. Box 44145-00100Nairobi, Kenya
UNICEF West and Central Africa
Regional Office
P.O. Box 29720 YoffDakar, Senegal
UNICEF The Americas and Caribbean
Regional Office
Avenida MorseCiudad del Saber ClaytonEdificio #131Apartado 0843-03045Panama City, Panama
UNICEF East Asia and the Pacific
Regional Office
P.O. Box 2-15419 Phra Atit RoadBangkok 10200, Thailand
UNICEF Middle East and North Africa
Regional Office
P.O. Box 1551Amman 11821, Jordan
UNICEF South Asia Regional Office
P.O. Box 5815
Lekhnath MargKathmandu, Nepal
Further information is available at our website <www.unicef.org>
148


United Nations Children’s Fund
3 United Nations PlazaNew York, NY 10017, [email protected]
US $20.00 UK £10.60 €15.75ISBN-13: 978-92-806-3998-8ISBN-10: 92-806-3998-6Sales no.: E.07.XX.1
© The United Nations Children’s Fund (UNICEF)December 2006
THE STATE OF THE WORLD’S CHILDREN 2007
TH
E S
TA
TE
OF
TH
E W
OR
LD
’S C
HIL
DR
EN
20
07
TH
E D
OU
BL
ED
IVID
EN
DO
FG
EN
DE
RE
QU
AL
ITY
Women andChildrenThe Double Dividend
of Gender Equality