Integrating multiple analytical approaches to spatially delineate and characterize genetic...
13
RESEARCH ARTICLE Integrating multiple analytical approaches to spatially delineate and characterize genetic population structure: an application to boreal caribou (Rangifer tarandus caribou) in central Canada Mark C. Ball • Laura Finnegan • Micheline Manseau • Paul Wilson Received: 18 September 2009 / Accepted: 8 June 2010 / Published online: 3 July 2010 Ó Springer Science+Business Media B.V. 2010 Abstract Individual-based clustering (IBC) methods have become increasingly popular for the characterization and delineation of genetic population units for numerous species. These methods delineate populations based on the genetic assumptions of a breeding unit which may provide a better representation of the behaviour of the species. The increasing use of IBC has resulted in the development of several analytical models all of which vary in their theo- retical assumptions to infer genetic population structure. In this paper, we report a comparative strategy utilizing three IBC methods to characterize the spatial genetic structure of the boreal population of woodland caribou (Rangifer tar- andus caribou) in central Canada. In addition, we imple- ment both tests for isolation-by-distance (IBD) and frequency-based assignment tests to validate the consensus genetic clusters as defined by IBC. We also compare indirect metrics of genetic diversity and gene flow using both a priori defined herds and the IBC defined popula- tions. Although our results show some concordance between both pre-defined herds and IBC derived genetic clusters, the IBC analyses identified a cluster that was cryptic to observation-based caribou herds and found no difference between several adjacent herds. By comparing multiple IBC methods and integrating both IBD and indi- rect genetic diversity metrics a posteriori, our strategy provides an effective means to delineate wildlife popula- tion structure and accurately assess genetic diversity and connectivity. Keywords Assignment test Á Population structure Á Bayesian Á Rangifer tarandus Á Faeces Á Range delineation Introduction For most wildlife species, populations are defined based on distribution of radio-collared animals or general range characteristics (e.g., Rettie and Messier 2001; Schaefer et al. 2001; Mosnier et al. 2003). In most cases, these populations are considered closed and regulated primarily by births and deaths rather than immigration and emigra- tion. This is no different for the delineation of boreal woodland caribou (Rangifer tarandus caribou), herein referred to as boreal caribou, herd boundaries (herd syn- onymous with subpopulation as in Cronin 2006). As a result, subsequent analyses such as enumeration, cohort descriptions and recruitment data are collected assuming the discrete nature of these herds even though the extent of dispersal events among herds is unconfirmed. Acknowl- edging this, classical genetic approaches used to indirectly infer genetic structure and associations through gene flow M. C. Ball Á L. Finnegan Á P. Wilson Natural Resources DNA Profiling and Forensic Centre, Trent University, 1600 East Bank Drive, Peterborough, ON K9J 7B, Canada M. Manseau Western Canada Service Centre, Parks Canada, 145 McDermot Avenue, Winnipeg, MB R3B 0R9, Canada M. Manseau Natural Resources Institute, University of Manitoba, 70 Dysart Road, Winnipeg, MB R3T 2N2, Canada M. C. Ball (&) Fisheries and Wildlife Management Division, Government of Alberta, 7th Floor, O.S. Longman Building, 6909-116 Street, Edmonton, AB T6H 4P2, Canada e-mail: [email protected] 123 Conserv Genet (2010) 11:2131–2143 DOI 10.1007/s10592-010-0099-3
Transcript of Integrating multiple analytical approaches to spatially delineate and characterize genetic...

RESEARCH ARTICLE
Integrating multiple analytical approaches to spatially delineateand characterize genetic population structure: an applicationto boreal caribou (Rangifer tarandus caribou) in central Canada
Mark C. Ball • Laura Finnegan • Micheline Manseau •
Paul Wilson
Received: 18 September 2009 / Accepted: 8 June 2010 / Published online: 3 July 2010
� Springer Science+Business Media B.V. 2010
Abstract Individual-based clustering (IBC) methods
have become increasingly popular for the characterization
and delineation of genetic population units for numerous
species. These methods delineate populations based on the
genetic assumptions of a breeding unit which may provide
a better representation of the behaviour of the species. The
increasing use of IBC has resulted in the development of
several analytical models all of which vary in their theo-
retical assumptions to infer genetic population structure. In
this paper, we report a comparative strategy utilizing three
IBC methods to characterize the spatial genetic structure of
the boreal population of woodland caribou (Rangifer tar-
andus caribou) in central Canada. In addition, we imple-
ment both tests for isolation-by-distance (IBD) and
frequency-based assignment tests to validate the consensus
genetic clusters as defined by IBC. We also compare
indirect metrics of genetic diversity and gene flow using
both a priori defined herds and the IBC defined popula-
tions. Although our results show some concordance
between both pre-defined herds and IBC derived genetic
clusters, the IBC analyses identified a cluster that was
cryptic to observation-based caribou herds and found no
difference between several adjacent herds. By comparing
multiple IBC methods and integrating both IBD and indi-
rect genetic diversity metrics a posteriori, our strategy
provides an effective means to delineate wildlife popula-
tion structure and accurately assess genetic diversity and
connectivity.
Keywords Assignment test � Population structure �Bayesian � Rangifer tarandus � Faeces � Range delineation
Introduction
For most wildlife species, populations are defined based on
distribution of radio-collared animals or general range
characteristics (e.g., Rettie and Messier 2001; Schaefer
et al. 2001; Mosnier et al. 2003). In most cases, these
populations are considered closed and regulated primarily
by births and deaths rather than immigration and emigra-
tion. This is no different for the delineation of boreal
woodland caribou (Rangifer tarandus caribou), herein
referred to as boreal caribou, herd boundaries (herd syn-
onymous with subpopulation as in Cronin 2006). As a
result, subsequent analyses such as enumeration, cohort
descriptions and recruitment data are collected assuming
the discrete nature of these herds even though the extent of
dispersal events among herds is unconfirmed. Acknowl-
edging this, classical genetic approaches used to indirectly
infer genetic structure and associations through gene flow
M. C. Ball � L. Finnegan � P. Wilson
Natural Resources DNA Profiling and Forensic Centre,
Trent University, 1600 East Bank Drive,
Peterborough, ON K9J 7B, Canada
M. Manseau
Western Canada Service Centre, Parks Canada, 145 McDermot
Avenue, Winnipeg, MB R3B 0R9, Canada
M. Manseau
Natural Resources Institute, University of Manitoba,
70 Dysart Road, Winnipeg, MB R3T 2N2, Canada
M. C. Ball (&)
Fisheries and Wildlife Management Division,
Government of Alberta, 7th Floor, O.S. Longman Building,
6909-116 Street, Edmonton, AB T6H 4P2, Canada
e-mail: [email protected]
123
Conserv Genet (2010) 11:2131–2143
DOI 10.1007/s10592-010-0099-3

typically ignore the systemic issues of these geographic
boundaries. Using a priori defined population units may
lead to the misinterpretation of genetic associations as a
response to the sampling scheme (i.e. overlapping seasonal
ranges) and may bias the results in favour of gene flow, or
the inability to accurately detect boundaries of genetic
structure (Pritchard et al. 2000; Mank and Avise 2004;
Latch and Rhodes 2006). Such inaccuracies in the delin-
eation of herds can have a significant impact on the pop-
ulation demographic parameters that are critical to the
management and conservation of this species.
Recent advances in molecular genetics have enabled
researchers to help clarify complexities in the relationships
between populations at varying scales (Falush et al. 2003;
Corander et al. 2004; Guillot et al. 2005a). A recent con-
tribution has been the development of individual-based
clustering analyses (IBC) where the operational units are
the individual genotypes rather than arbitrarily defined
population units, providing both the number of populations
and their spatial limits based on the genetic characteristics
of each sample (Mank and Avise 2004). This is an
advantage over other analyses that produce indirect esti-
mations of population structure and gene flow (F-statistics)
based on allele frequencies and under a priori designation
of population units. With these traditional approaches, the
use of pre-defined population units may hinder accurate
characterization of population structure (Rueness et al.
2003), the identification of populations with overlapping
seasonal ranges (Latch and Rhodes 2006) and the identi-
fication of cross-assigned and admixed individuals within
and among sub-populations (Mank and Avise 2004; Latch
and Rhodes 2006). This is particularly relevant in the
increasing number of studies examining fine-scale genetic
population structure (Rowe and Beebee 2007; Zamudio
and Wieczorek 2007; McDevitt et al. 2009).
Individual-based clustering approaches depict popula-
tion structure based on the genetic ancestry of individuals
which may or may not correspond to a priori defined
population units based on geographic sample sites, move-
ment data and taxonomy (Falush et al. 2003; Guillot et al.
2005b; Corander and Marttinen 2006). The estimation of
the number of genetic clusters (K) is based on probabilities
of individual genotypes to conform to prior assumptions of
theoretical population inheritance (e.g. Hardy–Weinberg
equilibrium (HWE), allele frequencies, inbreeding coeffi-
cients, admixture), using Bayesian statistics. The individual
proportional membership is then utilized to derive genetic
clusters and provides a direct assignment to a breeding unit
and admixture among populations. There are currently two
groups of IBC approaches that are widely used to delineate
population structure. These include spatially non-explicit
models such as that employed in the widely used clustering
program STRUCTURE (Pritchard et al. 2000; Falush et al.
2003) and spatially explicit models where explicit spatial
priors are directly added to the Bayesian model as in the
algorithm BAPS and GENELAND (Guillot et al. 2005a) or the
algorithm incorporates models for geographical continuity
of allele frequencies or cluster membership using hidden
Markov random fields (HMRF) as prior distributions as
used in TESS (Francois et al. 2006; Chen et al. 2007).
Although the development of IBC methods to assist with
population genetic analyses has proved valuable, these
methods do have limitations that can hinder interpretation
and may result in conflicting results among IBC algo-
rithms. For instance, Latch et al. (2006) described the
difference between two IBC algorithms, STRUCTURE 2.1 and
BAPS 3.1, to determine genetic structure using simulated
data sets with FST estimates as low as 0.02. Given the
ability of these analyses to differentiate genetic clusters
with low levels of genetic exchange, it is important to
discriminate such situations from instances of genetic iso-
lation. This is achievable using F-statistics (i.e. pairwise
FST) after the IBC characterization of spatial genetic
clusters. Furthermore, IBC methods do not provide
descriptive statistics such as inbreeding coefficients (e.g.
FIS, FST) or genetic diversity that are useful to the under-
standing of local genetic structure for recovery and man-
agement actions.
Additionally, there has been recent discussion on the
inability of various IBC algorithm to accurately charac-
terize genetic structure where patterns of genetic clines or
IBD occur (Rowe and Beebee 2007; Guillot et al. 2008;
Frantz et al. 2009). The response in such cases was the
overestimation of genetic structure by artefacts created by
the underlying IBD patterns (Frantz et al. 2009). Also, each
IBC algorithm varied in its ability to discern genetic
clusters under patterns of IBD and clines resulting in
conflicting results between applications (Rowe and Beebee
2007; Frantz et al. 2009). Guillot et al. (2008) strongly
suggested scrutinizing the outputs from several IBC algo-
rithms used on a single data set, in addition to testing for
patterns of IBD and cluster compliance to HWE to deci-
pher a genetic structure that can be explained empirically.
We used a broad analytical approach involving multiple
IBC analyses to first assess the genetic structure of the
boreal caribou in central Canada. Next, we verified the
strength of genetic structuring among the genetic clusters
using analyses of IBD, graph theory [isolation by graph
distance (IBGD)] and F-statistics, assessing both the levels
of gene flow and genetic diversity within and among each
of the genetic clusters. This comparative approach allows
us to critically refine the spatial partitioning of genetic
populations to reduce and eliminate many of the biases
inherent to ecologically pre-defined population units and
various deficiencies within and among IBC clustering
models.
2132 Conserv Genet (2010) 11:2131–2143
123

Methods and materials
Study area
For the purpose of this study, five caribou ranges were
studied. In Manitoba, the study area included ranges at the
southern boundaries of the species distribution, the North
Interlake herd, and from there extended to the west (The
Bog herd), to the northwest (the Kississing–Naaosap herd)
and to the north (Wabowden herd) (Fig. 1a). The range of
the Bog herd extended into Saskatchewan and included the
Pasquia Hill. The fifth herd, the Smoothstone–Wapeweka,
was in central Saskatchewan. Limited data are available on
these herds; a conservation strategy produced by Manitoba
Conservation suggest a population estimate of 50–75 ani-
mals for the North Interlake and The Bog respectively, the
Kississing–Naosap and Wabowden being larger at 150–275
and 200–225 animals, respectively and the Smoothstone–
Wapewaka being the largest at 700 animals (Environment
Canada 2008). The range of the Smoothsone-Wapewaka
herd has however experienced significant amount of
anthropogenic activities in the last 40 years and the popu-
lation is declining (Arsenault 2003; Arsenault and Manseau
2010; Arlt and Manseau 2010). Recent non-invasive fecal
DNA surveys have estimated caribou numbers in the North
Interlake at 100 animals and also declining (Hettinga 2010).
The other herds are stable (Manitoba Conservation 2005).
Sample collection
Collections of faecal samples took place from December
12, 2003 to January 25, 2006. Systematic aerial surveys
were conducted using fixed-wing aircraft following tran-
sects spaced 3 km apart. Flights occurred within 2–3 days
of a snowfall to allow for identification of recent caribou
cratering activity. Cratering sites were accessed the same
or following day by helicopter and the location recorded by
GPS. Only faecal pellets consolidated in a single mass and
of C20 pellets were collected as they are more likely
(compared to single pellets) to preserve embedded intesti-
nal epithelial cells for DNA extraction. Faeces were
scooped into separate, labelled freezer bags with the aid of
clean plastic spoons to avoid contamination.
DNA extraction and quantification
Extraction of all boreal caribou faecal samples was used to
qualify and quantify target DNA using the procedure out-
lined in Ball et al. (2007). As faecal material may contain
other sources of DNA (i.e. bacterial, plant), it is essential to
assess the quantity of target DNA from the total amount of
DNA extracted from the faecal samples. The method pro-
posed by Ball et al. (2007) provides a simple comparative
amplification assay, using species specific nuclear marker
amplification, to determine the target to total DNA ratio,
Fig. 1 Maps of study region
showing spatial delineation of:
a Sampled herds, b Genetic
clusters as determined by BAPS
5.1 using spatial data (K = 3),
c clusters defined by GENELAND
3.0. (K = 4) and d Genetic
clusters as determined by both
STRUCTURE 2.1 and TESS 2.1.
(Boundaries defined by areas
with 80% individuals
with [ 0.80 cluster probability)
Conserv Genet (2010) 11:2131–2143 2133
123

allowing researchers to enter appropriate amounts of target
DNA into PCR reactions reducing the problems of allelic
dropout and PCR inhibition. In summary, sex identification
using caribou-specific Zfx/Zfy amplification characterized
only the caribou nuclear template DNA and identified those
samples with quantities greater than 500 pg; the lower limit
to which there is limited risk for allele drop-out (Ball et al.
2007).
Microsatellite amplification
Following quantification, 5 ng of target caribou DNA from
each sample was amplified using 11 polymorphic, fluo-
rescent-labeled microsatellite markers (Multiplex 1: Rt6,
Rt9, Rt24 (Wilson et al. 1997); Multiplex 2: Map2C, Bl42
and BM848 (Bishop et al. 1994); Multiplex 3: Bms1788
and Rt7 (Cronin et al. 2005) and Multiplex 4: Rt5, BM888
and Rt30 (Wilson et al. 1997)). All reactions were con-
ducted in a 10 ll volume containing: 19 PCR buffer;
2.0 mM MgCl; 0.2 lg/ml of BSA; 0.4 lM of each of both
the forward and reverse primers (more than one set in
multiplex reactions); 0.2 lM of each dinucleotide tri-
phosphate; 0.5 unit of Taq polymerase (Invitrogen Life
Technologies) and 5 ng of DNA template. The thermocy-
cling protocol for individual and multiplexed loci consisted
of 94�C for 5 min, then 29 cycles of 94�C for 30 s, 56�C
for multiplex 1 and 3 (60�C for multiplex 2 and 4) for 30 s
and 72�C for 30 s, then a final extension time of 60�C for
45 min. Post-amplification, each sample was desalted prior
to genotyping using a MegaBace workstation 1000 (GE
Healthcare Life Sciences, Quebec). Alleles were defined
based upon size (base pairs) for each of the 11 amplified
loci. All samples were amplified and genotyped in tripli-
cate to verify profile data consistency and genotyping error.
Individual genotypes, Hardy–Weinberg equilibrium
and linkage disequilibrium
The complete genotypes of all samples were compared
using the Microsoft Excel Macro, GENECAP (Wilberg and
Dreher 2004) to determine the number of identical geno-
types contained in the sample set. Genotypes which dif-
fered by 1–2 alleles were re-genotyped to confirm the
profile. All duplicate genotypes were discarded from fur-
ther analysis. After comparing the triplicate profiles, in any
case where allele dropout was discovered in a single locus,
that locus was amplified separately (93) to confirm its
profile. FSTAT 2.1 (Goudet 1995) was utilized to evaluate
HWE and linkage disequilibrium (LD) for each of the 11
loci. LD was tested using a Markov Chain method utilizing
10,000 de-memorization, 5,000 batches and 10,000 itera-
tions. Sequential Bonferroni correction was used to adjust
a-values (0.05) for multiple comparisons (Rice 1989).
F-statistics (FST and FIS) were performed using the soft-
ware FSTAT 2.1 (Goudet 1995) with significance levels set
with a nominal level of 0.001 and 100,000 randomizations.
The presence of null alleles and loci deviating from LD
were further identified using the software package CERVUS
3.0 (Kalinowski et al. 2007) with an estimated null-allele
frequency greater than 5%.
Population structure [individual-based clustering (IBC)]
We utilized three different individual Bayesian software
packages to examine genetic population structure. These
included: STRUCTURE 2.1 (Pritchard et al. 2000; Falush et al.
2003); BAPS 5.1 (Corander and Marttinen 2006); and TESS
1.2 (Francois et al. 2006; Chen et al. 2007). Each of these
IBC methods estimate genetic structure based on different
assumptions of theoretical inheritance and from multi-
locus genotypes without assuming pre-defined populations.
STRUCTURE 2.1 (Pritchard et al. 2000; Falush et al. 2003)
is an IBC analysis commonly used in contemporary pop-
ulation genetics. This algorithm estimates Pr (X|K) prob-
ability of the data to conform to (K) assumed clusters. It
also estimates the probability of membership of each
individual q to each cluster through the use of a Monte
Carlo Chain maximizing HWE and minimizing LD of the
clustered group. To determine the optimal K-clusters for
the data set, we utilized a method developed by Evanno
et al. (2005) based on a rate of change in the log probability
of the data (DK) among 10 runs of each assumed K. This
method performs better at deciphering the appropriate K
in situations where gene flow patterns among populations
are not homogenous, which could lead to over or under
estimation of K when assuming the highest estimated Ln
probability of the data or Ln Pr(X|K) as proposed by
Pritchard et al. (2000). Clustering was performed under the
F-model as proposed by Falush et al. (2003) (assuming
admixture and correlated allele frequencies). Each run was
set to a burn-in of 500,000 and a MCMC data collection
chain of 500,000. These values were determined after
several trial runs to identify the size required for conver-
gence of the posterior distribution (Pritchard et al. 2000;
Falush et al. 2003). We tested K = 1–10 replicated 10
times as required by Evanno et al. (2005) to quantify
the standard deviation among each run for a particular
assumed K.
To define the geographic boundaries of each genetic
cluster using the STRUCTURE 2.1 results, we plotted the
location of all high ancestry individuals, characterized as
those having q C 0.80 using ArcGIS 9.2 (ESRI, Redlands,
California) and applied minimum convex polygons to
determine the extent of the cluster area. Next, all individual
samples collected within each of these newly defined areas
were used for the frequency-based individual assignment
2134 Conserv Genet (2010) 11:2131–2143
123

regardless of their genetic affiliation to confirm cluster
affiliation. The two frequency-based assignment tests we
applied consisted of the allele frequency assignment
approach (Paetkau et al. 1995, 1999, 2004) and the
Bayesian assignment method (Rannala and Mountain
1997) as implemented in Geneclass v2 (Piry et al. 2004).
Both assignment tests are commonly used in genetic
analyses (Kraaijeveld-Smit et al. 2005; Kim et al. 2006;
MacAvoy et al. 2007; Zamudio and Wieczorek 2007). For
the Bayesian assignment tests an assignment threshold of
P\0.01 was applied using the leave one out approach and
for the Paetkau et al. (1995) procedure a default frequency
for missing alleles was set at 0.01.
Secondly, the clustering program TESS 1.2 (Francois
et al. 2006; Chen et al. 2007) was used. This IBC utilizes a
MCMC approach to define genetic clusters under the
assumptions of HWE to reduce inbreeding coefficients
(Francois et al. 2006). This algorithm also utilizes a Hidden
Markov Random Field (HMRF) model on tessellations.
The developers of the algorithm claim it characterizes
spatial relationships to nearest neighbours, under the
assumption that individuals who are spatially, closely
located should be genetically similar (Francois et al. 2006).
An incremental increase of the HMRF parameter from 0
(full cline) to 1 (hard clusters) permits the user to visualize
genetic clustering that may be overestimated or diminished
using the previously described non-spatial IBC analyses,
which have difficulties differentiating genetic clusters
under various sampling distributions along a continuous
cline in genetic variation (Francois et al. 2006). Our anal-
yses using TESS involved the Markov chain Monte Carlo
algorithm under the assumption of admixture. The spatial
locations of all individuals were also incorporated. Ini-
tially, four starting values of the HMRF parameter at 0.2,
0.6, 0.8 and 0.9 were used to select the optimal HMRF,
determined to be 0.6. Next, we performed 50 independent
simulations for each assumed K over a range of values (1–
10) using a 30,000 cycles with a burn-in of 20,000 to
identify which assumed K produced the highest likelihoods
(Kmax). Kmax was then run 100 times and the estimated
cluster membership probabilities were determined from the
20 highest likelihood simulations (Chen et al. 2007; Fedy
et al. 2008; McDevitt et al. 2009).
BAPS 5.1 (Bayesian Analysis of Population Structure)
(Corander and Marttinen 2006; Corander et al. 2006), akin
to STRUCTURE and TESS, utilizes a Bayesian clustering
algorithm to determine hidden genetic structure of multi-
locus genotypic data. However, unlike the former pro-
grams, BAPS 5.1 infers clusters based upon similarities in
variance of baseline allele frequency data from assumed
source populations (i.e. a priori defined herds) (Corander
et al. 2006) and as such inference of K-clusters in indi-
vidual clustering approach is set not to exceed the number
of sampling areas (putative populations). This algorithm
infers the number of ancestral populations (K) utilizing a
stochastic optimization algorithm which significantly
reduces computational effort, a significant issue for users of
STRUCTURE 2.1 utilizing large data sets. Additionally, BAPS
5.1 permits users to define genetic structuring using the
spatial distribution of each individual in the data set. The
spatial prior distributions are then specified under the
constraint that Kmax is determined by the application, and
the corresponding posterior optimal number of clusters is
estimated using the stochastic learning algorithm (Coran-
der et al. 2006; Guillot et al. 2009). The spatial priors
provide more weight for clustering solutions that are
expected to be sensible from a biological perspective
a priori, which strengthens the inferences for sparse
molecular data. Using spatial clustering of individuals, we
inferred the maximum K to be between 1 and 10 with 20
replications of each inferred Kmax.
Finally, the IBC clustering algorithm GENELAND 3.0
(Guillot et al. 2005a, b, 2008; Guillot 2008) was used in the
comparison. This algorithm is implemented through an
extension of program R 2.4.1 (Ihaka and Gentleman 1996).
GENELAND uses individual multi-locus genotype data to
detect genetic population structure based on compliance to
best fit HWE and LE. It also incorporates spatial data
directly under the assumption that populations are spatially
organized. This model however does not assume admixture
and any genetic boundaries found are assumed to separate
K random mating populations (Manel et al. 2007; Guillot
et al. 2005b). Improvements to the model suggest the
ability to increase the detection of clusters having low
genetic differentiation (Guillot 2008). Our data set was
analysed over 20 independent runs assuming a Kmin = 1
and a Kmax = 20 using the dirichlet model as recom-
mended in (Guillot et al. 2005a) and filtering for null
alleles. Each run included 100,000 iterations, collecting or
thinning data at every 100th iteration. The maximum
number of nuclei was set at 400 and the maximum rate of
the Poisson process was fixed at 100. Once this initial run
converged on a K solution, this K was fixed for 20 inde-
pendent runs using the same parameters as mentioned
above.
Isolation-by-distance and graph theory
We tested for patterns of IBD and gene flow between the
inferred genetic clusters using a graph theoretic approach.
Graph theory allows the assessment of genetic connectivity
beyond the pairwise comparisons of FST. Nodes on the
graph represent sampling areas which are connected by
edges which represent gene flow (Dyer and Nason 2004;
Dyer 2007; Garroway et al. 2008). We calculated three
metrics to describe connectivity between nodes within our
Conserv Genet (2010) 11:2131–2143 2135
123

graph including: degree (a measure of node connectivity)
and eigenvalue centrality (how connected a node’s imme-
diate connections are) in either GENETIC STUDIO (Dyer 2009)
or IGRAPH (Csardi and Nepusz 2006) for R 2.7.1. (R
Development Core Team 2008). In our case, we were
particularly interested in IBD among our genetic clusters
and whether this was affecting patterns of genetic structure.
We compared the matrix of shortest path length between
nodes to FST and also to pairwise measures of geographic
distance using a Mantel test with 9,999 permutations
implemented in ADE4 (Chessel et al. 2004) for the R
package. Further, we assessed patterns of IBD between
individual node pairs, scaled against the overall pattern
within the sampling range, using the export to Google-
EarthTM function in GENETIC STUDIO. This function uses a
v2 test to test for edges between nodes which are outside
the 95% CI of the overall IBGD regression line. Those
nodes which are spatially more distant than expected from
graph distance are called extended, while those which are
closer are compressed.
Results
Tests of genetic diversity and disequilibrium
Genetic profiles at 11 microsatellite loci were obtained for
a total of 876 caribou samples. All profiles were genotyped
in triplicate (876 93), heterozygote allele dropout occur-
ring in eight profiles at various loci and genotyping error
occurring in nine profiles for an error rate of 1.0% each (or
an overall error rate of 1.9%). We attribute this success to
quantifying and qualifying the caribou DNA used for each
reaction (Ball et al. 2007). All samples consistently yielded
caribou DNA template in excess of amounts associated
with allelic dropout (range from 25 to 250 ng per indi-
vidual DNA extraction elute) (Ball et al. 2007). The
comparison of profiles identified 443 unique genotypes due
to multiple sampling of the same individuals. The number
of alleles ranged among the 11 loci from 9 (BM848) to 13
(BMS1788). Mean number of alleles per locus (Na) ranged
from 7.6 to 9.1 (Table 1). Bonferroni correction for mul-
tiple testing suggested the absence of non-random associ-
ation (i.e. LD) among all loci. Two of our loci (Rt30 and
Bm888) were found to be deviating from HWE in several
of our pre-determined local populations each having fewer
heterozygotes than expected following a Bonferroni cor-
rection on the P-value for each locus from each herd.
Locus Rt30 deviated from HWE in all local populations
and was removed from further analyses. Population struc-
ture analyses were performed both with and without
BM888 with no change in the clustering output. With the
exception of Wabowden, all the pre-defined populations
had positive FIS values; the highest being in North Interlake
(Table 2). These values suggest population deviation from
HWE as a response to several potential factors including a
Wahlund effect or non-random mating. We did not detect
the presence of null alleles for any of the amplified loci
used in downstream analyses.
Population structure (individual clustering)
Resolving DK through our STRUCTURE 2.1 data analyses
applying the method proposed by Evanno et al. (2005)
identified the presence of two modes (Fig. 2a). The heights
of each DK mode describe the strength of genetic struc-
turing at each assumed K (Evanno et al. 2005) with a first
mode at K = 2 (DK = 479.0) and the second mode at
K = 5 (DK = 67.5). As described by Evanno et al. (2005),
this bimodal phenomenon describes the presence of a
‘‘contact’’ zone, whereby the first mode at K = 2 is
describing the uppermost level of structuring occurring in
our dataset and where gene flow is restricted (FST between
regions = 0.047). The second mode at K = 5 defines sub-
structuring within each of these areas which was confirmed
by the spatial representation of those individuals having
Table 1 Descriptive statistics (mean ± SD) of each ‘‘a priori’’ defined boreal caribou herd
Herd n Hexp Hobs A FIS Pair wise FST \ Nei’s genetic distance
North
Interlake
The
Bog
Kississing–
Naaosap
Wabowden Smoothstone–
Wapeweka
North Interlake 101 0.68 ± 0.04 0.61 ± 0.02 7.6 ± 2.2 0.10 0 0.08 0.14 0.17 0.16
The Bog 117 0.72 ± 0.03 0.67 ± 0.01 7.5 ± 1.6 0.04 * 0.04 0 0.13 0.15 0.14
Kississing–Naaosap 109 0.76 ± 0.02 0.70 ± 0.01 9.1 ± 1.7 0.08 0.05 0.04 0 0.10 0.07
Wabowden 38 0.70 ± 0.03 0.73 ± 0.02 7.8 ± 2.2 -0.05 * 0.07 0.05 0.02 * 0 0.11
Smoothstone–Wapeweka 78 0.75 ± 0.02 0.71 ± 0.02 8.7 ± 1.4 0.06 0.06 0.04 0.02 0.04 0
All FST and FIS values significantly different from 0 (P \ 0.001) except those marked with *
2136 Conserv Genet (2010) 11:2131–2143
123

q C 0.80 assignment. In the southern area, three clusters
were defined, one in the Bog collection area and two
clusters in the North Interlake area. In the north, two
clusters were identified, one in the greater Smoothstone–
Wapeweka area and one containing both Kississing–Na-
aosap and Wabowden (Figs. 1d, 2d).
BAPS 5.1 detected a significant spatial partition at K = 3
(P = 1.0; Ln Pr (X|K) = -16,206) (Fig. 2b), remaining
consistent at greater inferred Kmax (K = 4–10). Geo-
graphically, these clusters defined as: Cluster 1: including
the Kississing–Naaosap, Wabowden and the Smoothstone–
Wapeweka sample areas; Cluster 2: The Bog and the
northern area of the North Interlake (UNI) sampling areas
and Cluster 3: exclusively the lower area of the North In-
terlake (LNI) sampling area (Figs. 1b, 2b).
Our results from TESS, using individual spatial infor-
mation showed that under HMRF = 0.6, and compared
over assumed various assumed K (1–10), Kmax was esti-
mated to be five (average log likelihood -12,334)
(Figs. 1d, 2c). This yielded a genetic structure comparable
to those results characterized by STRUCTURE.
GENELAND 3.0 characterized four genetic partitions
across our study area with a mean Ln Pr (X|K) = -13,562.
These clusters were defined as Cluster 1: Smoothstone–
Table 2 Number of alleles,
size range and Hardy–Weinberg
equilibrium deviation for each
of 11 loci used to generate
individual caribou profiles
Locus Alleles Size range (bp) Herds deviating
from HWE (of 5)
Reference
BMS1788 13 103–131 0 (Cronin et al. 2005)
BM888 12 170–192 0 (Bishop et al. 1994)
Rt5 12 90–124 0 (Wilson et al. 1997)
Rt7 12 212–238 0 (Wilson et al. 1997)
Bm848 9 360–380 2 (Bishop et al. 1994)
Rt9 12 109–131 0 (Wilson et al. 1997)
Rt6 10 95–117 0 (Wilson et al. 1997)
Map2C 10 93–115 0 (Bishop et al. 1994)
Bl42 10 235–253 0 (Bishop et al. 1994)
Rt30 10 185–203 5 (Wilson et al. 1997)
Rt24 12 204–236 5 (Wilson et al. 1997)
Fig. 2 Individual based clustering results: a Bimodal distribution of
STRUCTURE 2.1 generated DK at K = 2 and K = 5 based on Evanno
et al. (2005) (solid line) with LnP(d) values at each tested K as proposed
by Pritchard et al. (2000) (dashed line), b clusters as determined by BAPS
5.1, K = 3, c clusters as determined by TESS 2.1 K = 5, d box plot of
STRUCTURE 2.1 generated individual proportional membership at K = 2
and K = 5 and e probability maps of spatially derived genetic clusters
by GENELAND 3.0 (K = 4)
Conserv Genet (2010) 11:2131–2143 2137
123
Wapeweka; Cluster 2: Kississing–Naaosap, Wabowden;
Cluster 3: Bog and UNI and Cluster 4: LNI (Figs. 1c, 2e).
Additional analyses utilized the greater genetic sub-struc-
turing of K = 5 from STRUCTURE/TESS in an attempt to
describe a consensus genetic clustering pattern among all
IBC results.
Using both the proportional admixture and geographic
data for each individual from our consensus spatial
structure (K = 5) from STRUCTURE/TESS, it was possible to
ascertain information regarding migrants from the iden-
tification of cross-assigned individuals for each area.
Furthermore, comparison of these results with assignment
tests requiring a priori population information was used to
validate our geographic/genetic cluster association. From
our STRUCTURE/TESS results, we identified a total of 21
cross-assigned individuals relative to the 5 genetic clus-
ters (Table 3). The range of q value assignment to a
particular genetic cluster ranged from 0.60–0.99.
Although it is common when using STRUCTURE/TESS to
assess genetic cluster assignment based upon a stringent
criteria of proportionate membership of above 0.80
(Rueness et al. 2003), the range given here was evaluated
and compared against the assignment scores across other
commonly used assignment tests. Our comparisons
showed that among the cross-assigned individuals, we
achieved concordance of the STRUCTURE/TESS assignments
for 60% of the individuals when using the Rannala and
Mountain (1997) method and for 66% of the individuals
when using the Paetkau et al. (1995, 2004) method. By
incrementally increasing the lower limit of the q value by
0.1 from 0.60 to 1.0 when assigning individuals using the
STRUCTURE/TESS output, we observed an increase in con-
cordance with the frequency-based assignment tests.
Comparison of Rannala and Mountain (1997) assignments
to the STRUCTURE/TESS with a lower assignment threshold
of 0.75 and 0.80 showed 78 and 87% identical cross-
assignments respectively, while under the Paetkau et al.
(1995, 2004) method cross-assignments at the same
threshold increased to 84 and 92%. In all cases, where
both the Rannala and Mountain (1997) and Paetkau et al.
(1995, 2004) assignments differed from STRUCTURE/TESS,
the individual was assigned as a resident of the a priori
defined population and were not cross-assigned to another
population (Table 4). In addition, for each of these cases,
the second most likely population assignment, based on
the -log(L) of assignment, was the locality primarily
chosen by STRUCTURE/TESS. As a result, an ancestry or
membership (q) lower threshold of 0.80 was implemented
for this study.
There were few cross-assigned individuals among
localities within our sampling area. The largest numbers of
cross-assigned individuals were found in both the Kissis-
sing–Naaosap–Wabowden and Bog localities (total of 10
and 7 respectively). All individuals in the Lower North
Interlake were highly assigned to that area (Table 3).
Isolation-by-distance and graph theory
The graph that best fit our data had 10 edges connecting the
five nodes (i.e. was completely saturated), therefore con-
nectivity did not vary among nodes. The average path
length was 4.43. The mantel tests found no evidence for a
correlation between graph distance and FST (r = 0.151,
P = 0.378), nor evidence of overall IBD (r = -0.24,
P = 0.594) or IBGD (r = 0.473, P = 0.069). However
more subtle patterns were revealed after exporting the
graph to GoogleEarthTM (Fig. 3). Some patterns of sig-
nificant IBGD were now apparent as well as deviations
from IBGD. There was a greater geographic distance than
expected from graph distance between node 1 and 3, 4 and
5 (extended edges indicating high gene flow). Conversely
there was less gene flow than expected between the four
Manitoba nodes (2–5).
Descriptive statistics of genetic clusters
F-statistics derived for each of the described genetic
cluster areas showed moderate differentiation based upon
FST results (Table 3). There was a strong differentiation
between the northern and southern clusters alike our
previous descriptive analyses. One interesting finding was
the strong differentiation of the Lower North Interlake
(LNI) area with all other clusters (0.06 B FST C 0.08),
and in particular, its differentiation with the Upper North
Interlake (UNI) area; these two corresponding areas are
only 40 km apart and within a contiguous forest cover.
FIS values for each area were positive, ranging from 0.05
in the LNI to a high of 0.07 in the UNI. However, as
previously shown, some of these areas do contain a
number of migrants identified through our assignment
tests, as well as a number of admixed individuals which
are likely influencing a continued Wahlund effect in
these areas. The high FIS calculated for the LNI is likely
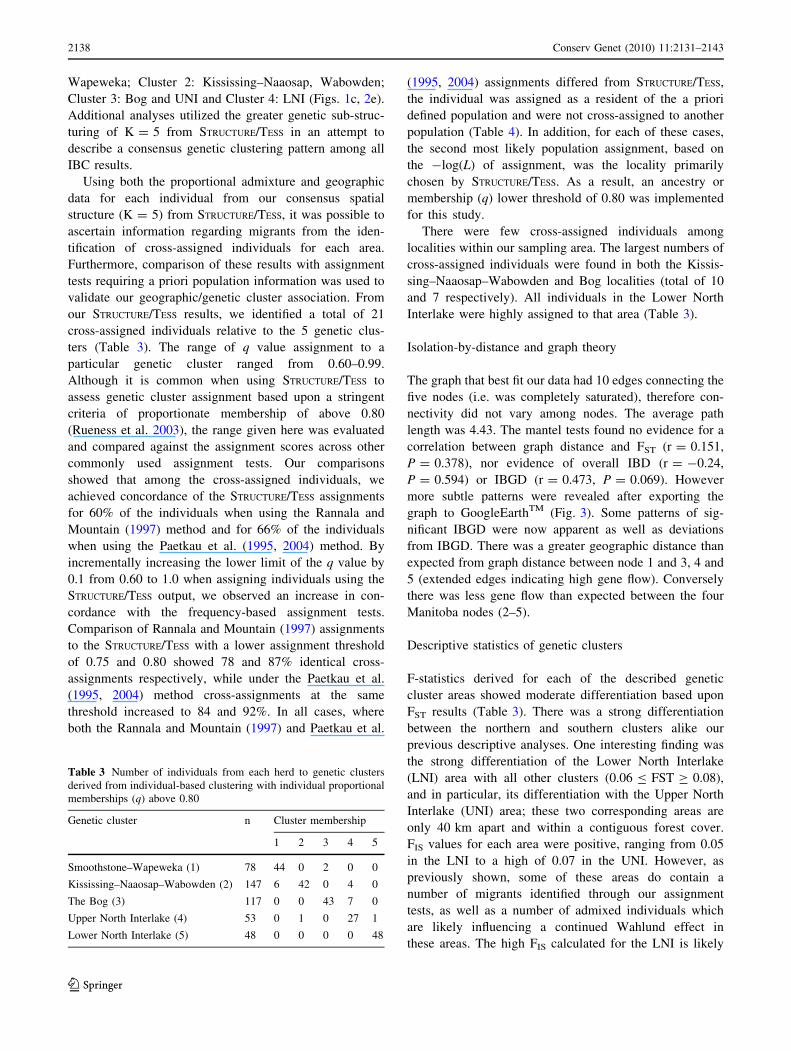
Table 3 Number of individuals from each herd to genetic clusters
derived from individual-based clustering with individual proportional
memberships (q) above 0.80
Genetic cluster n Cluster membership
1 2 3 4 5
Smoothstone–Wapeweka (1) 78 44 0 2 0 0
Kississing–Naaosap–Wabowden (2) 147 6 42 0 4 0
The Bog (3) 117 0 0 43 7 0
Upper North Interlake (4) 53 0 1 0 27 1
Lower North Interlake (5) 48 0 0 0 0 48
2138 Conserv Genet (2010) 11:2131–2143
123
to be accurately reflecting the effects of non-random
mating where the immigration and admixture is likely
limited.
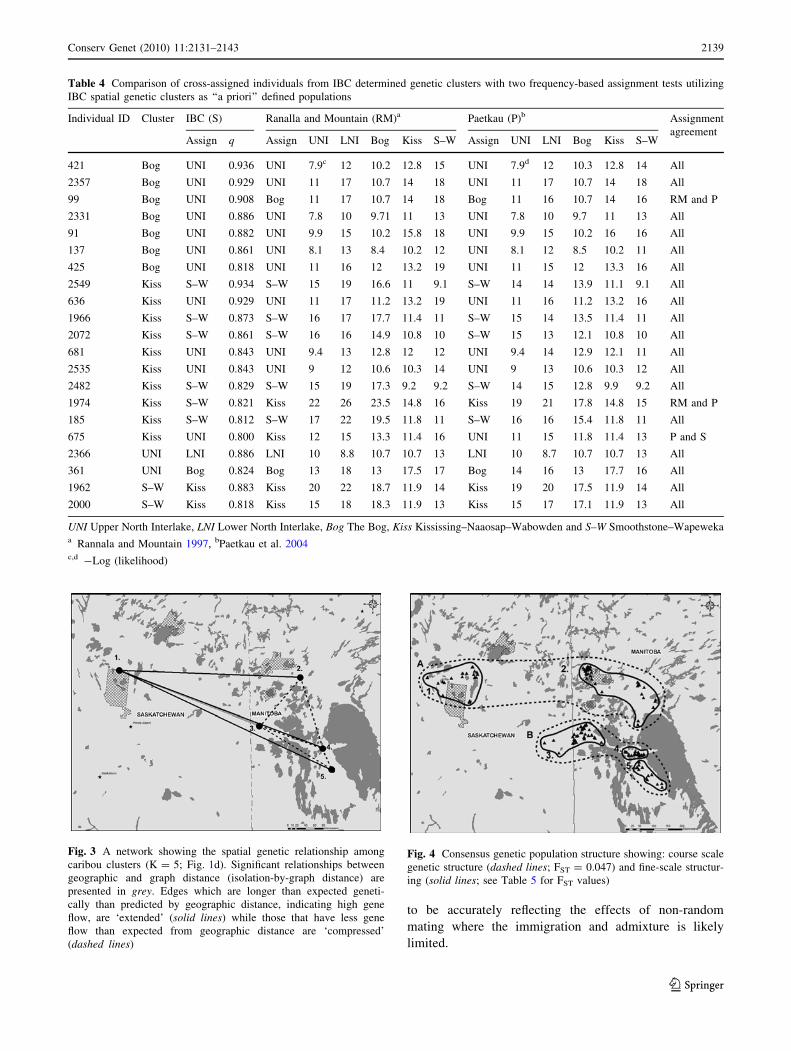
Fig. 3 A network showing the spatial genetic relationship among
caribou clusters (K = 5; Fig. 1d). Significant relationships between
geographic and graph distance (isolation-by-graph distance) are
presented in grey. Edges which are longer than expected geneti-
cally than predicted by geographic distance, indicating high gene
flow, are ‘extended’ (solid lines) while those that have less gene
flow than expected from geographic distance are ‘compressed’
(dashed lines)
Table 4 Comparison of cross-assigned individuals from IBC determined genetic clusters with two frequency-based assignment tests utilizing
IBC spatial genetic clusters as ‘‘a priori’’ defined populations
Individual ID Cluster IBC (S) Ranalla and Mountain (RM)a Paetkau (P)b Assignment
agreementAssign q Assign UNI LNI Bog Kiss S–W Assign UNI LNI Bog Kiss S–W
421 Bog UNI 0.936 UNI 7.9c 12 10.2 12.8 15 UNI 7.9d 12 10.3 12.8 14 All
2357 Bog UNI 0.929 UNI 11 17 10.7 14 18 UNI 11 17 10.7 14 18 All
99 Bog UNI 0.908 Bog 11 17 10.7 14 18 Bog 11 16 10.7 14 16 RM and P
2331 Bog UNI 0.886 UNI 7.8 10 9.71 11 13 UNI 7.8 10 9.7 11 13 All
91 Bog UNI 0.882 UNI 9.9 15 10.2 15.8 18 UNI 9.9 15 10.2 16 16 All
137 Bog UNI 0.861 UNI 8.1 13 8.4 10.2 12 UNI 8.1 12 8.5 10.2 11 All
425 Bog UNI 0.818 UNI 11 16 12 13.2 19 UNI 11 15 12 13.3 16 All
2549 Kiss S–W 0.934 S–W 15 19 16.6 11 9.1 S–W 14 14 13.9 11.1 9.1 All
636 Kiss UNI 0.929 UNI 11 17 11.2 13.2 19 UNI 11 16 11.2 13.2 16 All
1966 Kiss S–W 0.873 S–W 16 17 17.7 11.4 11 S–W 15 14 13.5 11.4 11 All
2072 Kiss S–W 0.861 S–W 16 16 14.9 10.8 10 S–W 15 13 12.1 10.8 10 All
681 Kiss UNI 0.843 UNI 9.4 13 12.8 12 12 UNI 9.4 14 12.9 12.1 11 All
2535 Kiss UNI 0.843 UNI 9 12 10.6 10.3 14 UNI 9 13 10.6 10.3 12 All
2482 Kiss S–W 0.829 S–W 15 19 17.3 9.2 9.2 S–W 14 15 12.8 9.9 9.2 All
1974 Kiss S–W 0.821 Kiss 22 26 23.5 14.8 16 Kiss 19 21 17.8 14.8 15 RM and P
185 Kiss S–W 0.812 S–W 17 22 19.5 11.8 11 S–W 16 16 15.4 11.8 11 All
675 Kiss UNI 0.800 Kiss 12 15 13.3 11.4 16 UNI 11 15 11.8 11.4 13 P and S
2366 UNI LNI 0.886 LNI 10 8.8 10.7 10.7 13 LNI 10 8.7 10.7 10.7 13 All
361 UNI Bog 0.824 Bog 13 18 13 17.5 17 Bog 14 16 13 17.7 16 All
1962 S–W Kiss 0.883 Kiss 20 22 18.7 11.9 14 Kiss 19 20 17.5 11.9 14 All
2000 S–W Kiss 0.818 Kiss 15 18 18.3 11.9 13 Kiss 15 17 17.1 11.9 13 All
UNI Upper North Interlake, LNI Lower North Interlake, Bog The Bog, Kiss Kississing–Naaosap–Wabowden and S–W Smoothstone–Wapewekaa Rannala and Mountain 1997, bPaetkau et al. 2004c,d -Log (likelihood)
Fig. 4 Consensus genetic population structure showing: course scale
genetic structure (dashed lines; FST = 0.047) and fine-scale structur-
ing (solid lines; see Table 5 for FST values)
Conserv Genet (2010) 11:2131–2143 2139
123

Discussion
In order to accurately define and characterize the genetic
attributes of a particular caribou herd, it is critical to first
delineate its spatial boundaries. While IBC analyses are
useful to identify genetic structure at varying spatial scales
and characterize genetic boundaries, these methods can
also be used to identify dispersing individuals (Cegelski
et al. 2003; Rueness et al. 2003; Berry et al. 2004) and
resolve incidents of genetic mixing among different clus-
ters/groups (Pritchard et al. 2000; Schaefer and Wilson
2002; Seldin et al. 2007). Analyses such as these afford
researchers the opportunity to more accurately define the
genetic identity of populations for genetic quantification
purposes Table 4.
Discerning the genetic structure of boreal caribou within
our sampling area was challenging. With the exception of
the STRUCTURE and TESS concordance in results, different
clustering solutions were attained by both BAPS and
GENELAND. However, examining these clustering solutions
with the aid of FST and IBD/IBGD metrics, we were able to
find agreement. All clustering solutions did acknowledge a
significant separation regionally between the northern areas
and the southern areas of our sampling area (FST = 0.047)
(Fig. 4). In the northern areas, both GENELAND and STRUC-
TURE/TESS characterized additional sub-structuring between
the Smoothstone–Wapeweka cluster and the Kississing–
Naaosap–Wabowden cluster which had an underlying
FST = 0.03. The inclusion of the Wabowden sampling area
with that of the Kississing–Naaosap sampling area as a
single cluster was not unexpected given the low FST (0.015)
between them (Table 1).There was no indication that this
structuring was a result of spurious clustering resulting
from patterns of IBD/IBDG.
In the southern areas, all IBC algorithms characterized a
single cluster in the LNI area, separating it from the UNI
area (FST = 0.07) (Table 3). Interestingly, UNI and LNI
animals were not previously considered as discrete herds
and are currently managed as one local population (Man-
itoba Conservation 2005) which may have introduced
inaccuracies to critical population demographic data
interpretation (i.e. sex-ratios, parturition rates). Further-
more, the separation of the NI into two discrete clusters
would have remained unidentified using a priori defined
populations in the analyses. As characterized through both
FST and BAPS and GENELAND methods, UNI caribou are
more genetically similar to the BOG (FST = 0.02) than to
its nearest neighbour the LNI. The most obvious reason for
this disconnect is the limited effective dispersal between
the LNI and UNI. The evidence provided by assignment
tests suggest that movement into the UNI from the LNI is
limited and asymmetrical northward as the only migrants
(one) found was located in the UNI. Coupled with this, is
the presence of a high percentage of admixed individuals in
addition to high residency UNI individuals, and migrants.
This is likely implying that the UNI is receiving genetic
contributions from several proximate herds, and is sus-
taining its own genetic identity through breeding in this
area. Considering this, the data are suggestive of a ‘‘sink
habitat’’ in the UNI (Watkinson and Sutherland 1995). The
marginal habitat of the UNI is supported by observational
data that suggest that there is high occurrence of highway
mortality and local harvest in this area, in addition to other
selective factors such as predation. Under these limitations,
the genetic cluster observed here is likely to be supple-
mented by emigration (e.g. density-dependant, rescue
effect) from the BOG and LNI. However, due to the sto-
chastic nature of demography in this area, allele
Table 5 Descriptive statistics (mean ± SD) of each geographic genetic cluster boundary and pairwise FST (below diagonal) and Nei’s genetic
distance (above diagonal)
Genetic cluster n Hexp Hobs A FIS Pair wise FST \ Nei’s genetic distance
Upper North
Interlake
Lower North
Interlake
The
Bog
Kississing–
Naaosap–
Wabowden
Smoothstone–
Wapeweka
Upper North
Interlake
48 0.69 ± 0.04 0.65 ± 0.02 6.9 ± 2.0 0.07 0 0.15 0.10 0.18 0.20
Lower North
Interlake
53 0.63 ± 0.04 0.58 ± 0.02 5.9 ± 1.7 0.05 0.07 0 0.14 0.19 0.22
The Bog 117 0.72 ± 0.03 0.67 ± 0.01 7.5 ± 1.6 0.04 * 0.02 0.06 0 0.13 0.14
Kississing–
Naaosap–
Wabowden
147 0.75 ± 0.02 0.71 ± 0.02 9.3 ± 1.5 0.06 0.05 0.07 0.04 0 0.07
Smoothstone–
Wapeweka
78 0.75 ± 0.02 0.71 ± 0.02 8.7 ± 1.4 0.06 0.07 0.08 0.04 0.03 0
All FST and FIS values significantly different from 0 (P \ 0.001) except those marked with *
2140 Conserv Genet (2010) 11:2131–2143
123
frequencies are unable to homogenize; limiting the occur-
rence of genetic panmixia with its most likely source the
BOG (Table 5). Recent data from DNA Capture-Mark-
Recapture work supports this theory as the North Interlake
herd is declining in numbers, and the results point to a
higher decline in females of the UNI when compared to the
LNI (Hettinga 2010).
Our results show that there is no significant overall
pattern of IBD or IBGD that would influence the discor-
dance of the clustering solutions determined by each IBC
used here. With this said and given our low sample size
(n = 5), it must be acknowledged that the power to detect a
significant pattern of IBD was low. Nevertheless, the
expansion of this analysis, using the graph theoretic
approach, supported the lack of significant IBD, with the
majority of edge lengths among nodes falling outside the
95% CI for IBGD (Fig. 3). This IBGD method, which
applies a graph theoretic approach, reveals patterns of
association between individual pairs of nodes, rather than
across the matrix as a whole. Therefore, it can reveal subtle
patterns of the effect of geographic distance on the genetic
differentiation among nodes, and can more easily be
compared with genetic clustering analyses. The increased
structuring found in the STRUCTURE/TESS results suggests, at
least for our data set, the inability of both BAPS and
GENELAND to differentiate genetic clusters at low FST val-
ues. BAPS did not characterize structure at FST B 0.03 and
GENELAND did not characterize structure at FST = 0.02.
We were able to delineate geographic boundaries
between each of the genetic clusters by examining the
spatial representation of each individual with proportional
assignment q C 0.80. In doing so, we were able to identify
genetic localities pertaining to a particular cluster as areas
with a high concentration of individuals with assignment to
a single cluster. Once these genetic localities were identi-
fied, all individuals within the area, regardless of assign-
ment, were assigned to this locality and subsequently used
for descriptive genetic and frequency-based assignment
tests. Comparison of the proportional assignment results
obtained from IBC analyses and the methods described by
Rannala and Mountain (1997) and Paetkau et al. (1995,
2004), showed high concordance of individual cluster
assignment when using q values above 0.80. Arbitrary
lower limit thresholds of q values in the range of 70–90%
ancestry are often used (Manel et al. 2002; Cegelski et al.
2003; Rueness et al. 2003) to identify individuals belong-
ing to genetic clusters; however the observed concordance
between Bayesian and frequency-based analyses validates
the 80% lower threshold used for this study. This validation
step can also be applied to the establishment of specific
thresholds of ‘‘core’’ individuals for other studies.
As allele frequency-based assignment tests would likely
produce individual assignment discordance to the IBC
assignment if our genetic clusters were erroneously delin-
eated, the fact that both of these methods were relatively
concordant provides a validation of each genetic cluster as
a discrete genetic unit. It should be noted here that the clear
identification of genetic clusters in this study is likely due
to the landscape characteristics of our study area. The
results may not be as clear in other parts of the overall
range (Thomas and Gray 2002) where animals present a
more contiguous distribution or demonstrate seasonal shifts
in distribution (Latch and Rhodes 2006).
Our comparison of descriptive statistics derived from
the pre-defined populations and IBC-based genetic clus-
ters, did not differ in the Bog and Smoothstone–
Wapeweka sampling areas as a result of genetic and
geographic concordance. There was no concordance
between surveyed area and genetic cluster identification
in the North Interlake area and subsequent the high FIS
value determined using all samples within the region
indicated a Wahlund effect which was later verified by
IBC analyses. This finding is significant to management
and recovery planning of boreal caribou in this area, as
characterization of both migrants and admixture events
using results from both IBC and assignment tests showed
that the LNI is likely isolated to immigration from all
proximate herds. We did not observe any cross-assigned
individuals in this genetic locality and all individuals here
were assigned to this cluster (q C 0.80) with no admixed
individuals observed. We did observe emigration events
away from this area into the UNI area, supporting
asymmetrical emigration as another likely contributor to
the significant genetic differentiation of this genetic
locality. As a result, the significant FIS value of 0.05 is
likely due to the effects of genetic drift or non-random
mating in this area.
It is clear from our analyses that the use of several IBC
techniques, IBD/IBGD analyses and comparative assign-
ment testing to delineate genetic areas can identify struc-
turing events that would not be characterized using pre-
defined units. Without IBC analyses, it would not have
been possible to determine spatial boundaries of the two
discrete genetic clusters of the North Interlake and the
relatively low structuring of caribou occurring over long
distances between Saskatchewan and the northern sampling
area of Manitoba. Although the limitations of specifically
using pre-defined populations has been recognized in the
literature (Mank and Avise 2004; Latch and Rhodes 2006),
these methods are still being used and their results continue
to be used to support research planning (Boulet et al. 2007).
We are not criticizing the importance of indirect estimates
of population structure, but rather we recommend that they
be used post hoc with estimates obtained from individually
based genetic clustering algorithms. Furthermore, it is
important to note that a complete depiction of population
Conserv Genet (2010) 11:2131–2143 2141
123

structure is only possible when sampling is done over the
entire range.
The results of this paper outline an analytical framework
for the integration of several IBC analyses, in association
with IBD/IBGD analyses, assignment testing and indirect
methods to provide an effective means to delineate and
characterize genetic populations for a proper assessment of
genetic diversity and connectivity. It is hoped that our results
will be useful for future management of boreal caribou in
this area and that our strategy to define genetic structure
amid the analytical discordance of several IBC algorithms
will aid other researchers examining other species.
Acknowledgments Financial support for this project was provided
in part by NSERC to PJW and an NSERC Graduate Scholarship to
MCB, Species at Risk Recovery Fund, Parks Canada, Manitoba
Department of Conservation, Manitoba Hydro, Saskatchewan Envi-
ronment and the Prince Albert Model Forest. We would also like to
express our appreciation to all those involved with winter field col-
lections, volunteering and technical support from the University of
Manitoba and Trent University.
References
Arlt M, Manseau M (2010) Changes in caribou distribution and landcover
in and around Prince Albert National Park: different management
strategies and different landscapes. Rangifer (in press)
Arsenault A (2003) Status and conservation management framework
for woodland caribou in Saskatchewan. Saskatchewan Environ-
ment, Fish and Wildlife Technical Report 2003-03
Arsenault A, Manseau M (2010) Land management strategies for the
recovery of boreal woodland caribou in central Saskatchewan.
Rangifer (in press)
Ball MC, Pither R, Manseau M et al (2007) Characterization of target
nuclear DNA from faeces reduces technical issues associated
with the assumptions of low-quality and quantity template.
Conserv Genet 8:577–586
Berry O, Tocher MD, Sarre SD (2004) Can assignment tests measure
dispersal? Mol Ecol 13:551–561
Bishop MD, Kappes SM, Keele JW et al (1994) A genetic-linkage
map for cattle. Genetics 136:619–639
Boulet M, Couturier S, Cote SD, Otto RD, Bernatchez L (2007)
Integrative use of spatial, genetic and demographic analyses for
investigating genetic connectivity between migratory, montane,
and resident caribou herds. Mol Ecol 16:4223–4240
Cegelski CC, Waits LP, Anderson NJ (2003) Assessing population
structure and gene flow in Montana wolverines (Gulo gulo) using
assignment-based approaches. Mol Ecol 12:2907–2918
Chen C, Durand E, Forbes F, Francois O (2007) Bayesian clustering
algorithms ascertaining spatial population structure: a new
computer program and a comparison study. Mol Ecol Notes
7:747–756
Chessel D, Dufour A-B, Thioulouse J (2004) The ade4 package-I: one
table methods. R News 4:5–10
Corander J, Marttinen P (2006) Bayesian identification of admixture
events using multilocus molecular markers. Mol Ecol 15:2833–
2843
Corander J, Waldmann P, Marttinen P, Sillanpaa MJ (2004) BAPS 2:
enhanced possibilities for the analysis of genetic population
structure. Bioinformatics 20:2363–2369
Corander J, Marttinen P, Mantyniemi S (2006) A Bayesian method
for identification of stock mixtures from molecular marker data.
Fish Bull 104:550–558
Cronin MA (2006) A proposal to eliminate redundant terminology for
intra-species groups. Wildl Soc Bull 34:237–241
Cronin MA, MacNeil MD, Patton JC (2005) Variation in mitochon-
drial DNA and microsatellite DNA in caribou (Rangifertarandus) in North America. J Mammal 86:495–505
Csardi G, Nepusz T (2006) The igraph software package for complex
network research. InterJournal, Complex Systems 1695. http://
igraph.sf.net
Dyer RJ (2007) The evolution of genetic topologies. Theor Popul Biol
71:71–79
Dyer RJ (2009) Genetic studio: a suite of programs from spatial
analysis of genetic-marker data. Mol Ecol Resour 9:110–113
Dyer RJ, Nason JD (2004) Population graphs: the graph theoretic
shape of genetic structure. Mol Ecol 13:1713–1727
Environment Canada (2008) Scientific Review for the Identification
of critical habitat for woodland caribou (Rangifer taranduscaribou), Boreal Population, in Canada. August 2008. Environ-
ment Canada, Ottawa
Evanno G, Regnaut S, Goudet J (2005) Detecting the number of
clusters of individuals using the software STRUCTURE: a simula-
tion study. Mol Ecol 14:2611–2620
Falush D, Stephens M, Pritchard JK (2003) Inference of population
structure using multilocus genotype data: linked loci and
correlated allele frequencies. Genetics 164:1567–1587
Fedy BC, Martin K, Ritland C, Young J (2008) Genetic and
ecological data provided incongruent interpretations of popula-
tion structure and dispersal in naturally subdivided populations
of white-tailed ptarmigan (Lagopus leucura). Mol Ecol 17:1905–
1917
Francois O, Ancelet S, Guillot G (2006) Bayesian clustering using
hidden Markov random fields in spatial population genetics.
Genetics 174:805–816
Frantz AC, Cellina S, Krier A, Schley L, Burke T (2009) Using
spatial Bayesian methods to determine the genetic structure of a
continuously distributed population: clusters or isolation by
distance? J Appl Ecol 46:493–505
Garroway CJ, Bowman J, Carr D, Wilson PJ (2008) Applications of
graph theory to landscape genetics. Evol Appl 1:620–630
Goudet J (1995) FSTAT (Version 1.2): a computer program to
calculate F-statistics. J Hered 86:485–486
Guillot G (2008) Inference of structure in subdivided populations at
low levels of genetic differentiation. The correlated allele
frequencies model revisited. Bioinformatics 24:2222–2228
Guillot G, Estoup A, Mortier F, Cosso JF (2005a) A spatial statistical
model for landscape genetics. Genetics 170:1261–1280
Guillot G, Mortier F, Estoup A (2005b) Geneland: a computer
package for landscape genetics. Mol Ecol Notes 5:712–715
Guillot G, Kan-King-Yu D, Michelin J, Huet P (2006) Inference of a
hidden spatial tessellation from multivariate data: application to
the delineation of homogeneous regions in an agricultural field. J
R Stat Soc Ser C Appl Stat 55:407–430
Guillot G, Santos F, Estoup A (2008) Analysing georeferenced
population genetics data with Geneland: a new algorithm to deal
with null alleles and a friendly graphical user interface.
Bioinformatics 24:1406–1407
Guillot G, Leblois R, Coulon A, Frantz AC (2009) Statistical methods
in spatial genetics. Mol Ecol 18:4734–4756
Hettinga P (2010) Use of sampled genetic information from woodland
caribou fecal pellets to estimate population demographics.
Dissertation, University of Manitoba
Ihaka R, Gentleman R (1996) R: a language for data analysis and
graphics. J Comput Graph Stat 5:299–314
2142 Conserv Genet (2010) 11:2131–2143
123

Kalinowski ST, Taper ML, Marshall TC (2007) Revising how the
computer program CERVUS accommodates genotyping error
increases success in paternity assignment. Mol Ecol 16:1006–
1099
Kim KS, Cano-Rios P, Sappington TW (2006) Using genetic markers
and population assignment techniques to infer origin of boll
weevils (Coleoptera : Curculionidae) unexpectedly captured near
an eradication zone in Mexico. Environ Entomol 35:813–826
Kraaijeveld-Smit FJL, Beebee TJC, Griffiths RA, Moore RD, Schley
L (2005) Low gene flow but high genetic diversity in the
threatened Mallorcan midwife toad Alytes muletensis. Mol Ecol
14:3307–3315
Latch EK, Rhodes E (2006) Evidence for bias in estimates of local
genetic structure due to sampling scheme. Anim Conserv 9:308–
315
Latch EK, Dharmarajan G, Glaubitz JC, Rhodes OE (2006) Relative
performance of Bayesian clustering software for inferring
population substructure and individual assignment at low levels
of population differentiation. Conserv Genet 7:295–302
MacAvoy ES, McGibbon LM, Sainsbury JP et al (2007) Genetic
variation in island populations of tuatara (Sphenodon spp)
inferred from microsatellite markers. Conserv Genet 8:3053
Manel S, Berthier P, Luikart G (2002) Detecting wildlife poaching:
identifying the origin of individuals with Bayesian assignment
tests and multilocus genotypes. Conserv Biol 16:650–659
Manel S, Berthoud F, Bellemain E, Gaudeul M, Luikart G, Swenson
JE, Waits LP, Taberlet P (2007) A new individual-based spatial
approach for identifying genetic discontinuities in natural
populations. Mol Ecol 16:2031–2043
Manitoba Conservation (2005) Manitoba’s conservation and recovery
strategy for woodland caribou (Rangifer tarandus caribou).
Manitoba Conservation—Wildlife Branch, Winnipeg
Mank JE, Avise JC (2004) Individual organisms as units of analysis:
Bayesian-clustering alternatives in population genetics. Genet
Res 84:135–143
McDevitt AD, Mariani S, Hebblewhite M, Decesare NJ, Morgantini
L, Seip D, Weckworth BV, Musiani M (2009) Survival in the
Rockies of an endangered hybrid swarm from diverged caribou
(Rangifer tarandus) lineages. Mol Ecol 18(4):665–679
Mosnier A, Ouellet JP, Sirois L, Fournier N (2003) Habitat selection
and home-range dynamics of the Gaspe caribou: a hierarchical
analysis. Can J Zool 81:1174–1184
Paetkau D, Calvert W, Stirling I, Strobeck C (1995) Microsatellite
analysis of population-structure in Canadian polar bears. Mol
Ecol 4:347–354
Paetkau D, Amstrup SC, Born EW, Calvert W, Derocher A, Garner G,
Messier F, Stirling I, Taylor M, Wigg O, Strobeck C (1999)
Genetic structure of the world’s polar bear populations. Mol Ecol
8:1571–1584
Paetkau D, Slade R, Burden M, Estoup A (2004) Genetic assignment
methods for the direct, real-time estimation of migration rate: a
simulation-based exploration of accuracy and power. Mol Ecol
13:55–65
Piry S, Alapetite A, Cornuet JM et al (2004) GENECLASS2: a
software for genetic assignment and first-generation migrant
detection. J Hered 95:536–539
Pritchard JK, Stephens M, Donnelly P (2000) Inference of population
structure using multilocus genotype data. Genetics 155:945–959
Rannala B, Mountain JL (1997) Detecting immigration by using
multilocus genotypes. Proc Natl Acad Sci USA 94:9197–9201
Rettie WJ, Messier F (2001) Range use and movement rates of
woodland caribou in Saskatchewan. Can J Zool 79:1933–1940
Rice WR (1989) Analyzing tables of statistical tests. Evolution
43:223–225
Rowe G, Beebee TJC (2007) Defining population boundaries: use of
three Bayesian approaches with microsatellite data from British
natterjack toads (Bufo calamita). Mol Ecol 16:785–796
Rueness EK, Jorde PE, Hellborg L et al (2003) Cryptic population
structure in a large, mobile mammalian predator: the Scandina-
vian lynx. Mol Ecol 12:2623–2633
Schaefer JA, Wilson CC (2002) The fuzzy structure of populations.
Can J Zool 80:2235–2241
Schaefer JA, Veitch AM, Harrington FH et al (2001) Fuzzy structure
and spatial dynamics of a declining woodland caribou popula-
tion. Oecologia 126:507–514
Seldin MF, Tian C, Shigeta R et al (2007) Argentine population
genetic structure: large variance in Amerindian contribution. Am
J Phys Anthropol 132:455–462
Thomas DC, Gray DR (2002) Update COSEWIC status report on the
woodland caribou Rangifer tarandus caribou in Canada, in
COSEWIC assessment and update status report on the Woodland
Caribou Rangifer tarandus caribou in Canada. In: Committee on
the Status of Endangered Wildlife in Canada, pp 1–98
Watkinson AR, Sutherland WJ (1995) Sources, sinks and pseudo-
sinks. J Anim Ecol 64:126–130
Wilberg MJ, Dreher BP (2004) GENECAP: a program for analysis of
multilocus genotype data for non-invasive sampling and capture-
recapture population estimation. Mol Ecol Notes 4:783–785
Wilson GA, Strobeck C, Wu L, Coffin JW (1997) Characterization of
microsatellite loci in caribou Rangifer tarandus, and their use in
other artiodactyls. Mol Ecol 6:697–699
Zamudio KR, Wieczorek AM (2007) Fine-scale spatial genetic
structure and dispersal among spotted salamander (Ambystomamaculatum) breeding populations. Mol Ecol 16:257–274
Conserv Genet (2010) 11:2131–2143 2143
123