A common set of distinct features that characterize noncoding RNAs across multiple species
11
104–114 Nucleic Acids Research, 2015, Vol. 43, No. 1 Published online 12 December 2014 doi: 10.1093/nar/gku1316 A common set of distinct features that characterize noncoding RNAs across multiple species Long Hu 1,2 , Chao Di 2 , Mingxuan Kai 2 , Yu-Cheng T. Yang 2 , Yang Li 2 , Yunjiang Qiu 2 , Xihao Hu 3 , Kevin Y. Yip 3 , Michael Q. Zhang 4,5 and Zhi John Lu 2,* 1 PKU-Tsinghua-NIBS Graduate Program, School of Life Sciences, Peking University, Beijing 100871, China, 2 MOE Key Laboratory of Bioinformatics, Center for Synthetic and Systems Biology and Center for Plant Biology, School of Life Sciences, Tsinghua University, Beijing 100084, China, 3 Department of Computer Science and Engineering, The Chinese University of Hong Kong, Hong Kong, 4 Department of Molecular and Cell Biology, Center for Systems Biology, The University of Texas, Dallas 800 West Campbell Road, RL11 Richardson, TX75080-3021, USA and 5 MOE Key Laboratory of Bioinformatics and Bioinformatics Division, Center for Synthetic and Systems Biology, TNLIST and School of Medicine, Tsinghua University, Beijing 100084, China Received October 16, 2014; Revised December 03, 2014; Accepted December 05, 2014 ABSTRACT To find signature features shared by various ncRNA sub-types and characterize novel ncRNAs, we have developed a method, RNAfeature, to investigate >600 sets of genomic and epigenomic data with various evolutionary and biophysical scores. RNAfeature uti- lizes a fine-tuned intra-species wrapper algorithm that is followed by a novel feature selection strat- egy across species. It considers long distance effect of certain features (e.g. histone modification at the promoter region). We finally narrow down on 10 in- formative features (including sequences, structures, expression profiles and epigenetic signals). These features are complementary to each other and as a whole can accurately distinguish canonical ncRNAs from CDSs and UTRs (accuracies: >92% in human, mouse, worm and fly). Moreover, the feature pattern is conserved across multiple species. For instance, the supervised 10-feature model derived from animal species can predict ncRNAs in Arabidopsis (accu- racy: 82%). Subsequently, we integrate the 10 fea- tures to define a set of noncoding potential scores, which can identify, evaluate and characterize novel noncoding RNAs. The score covers all transcribed regions (including unconserved ncRNAs), without requiring assembly of the full-length transcripts. Im- portantly, the noncoding potential allows us to iden- tify and characterize potential functional domains with feature patterns similar to canonical ncRNAs (e.g. tRNA, snRNA, miRNA, etc) on ∼70% of human long ncRNAs (lncRNAs). INTRODUCTION The advent of high-throughput sequencing technologies has facilitated the identification of a large number of previ- ously unannotated transcripts, many of which correspond to novel noncoding RNAs (ncRNAs). But only ∼1% of the human genome have been annotated as canonical ncRNAs (e.g. rRNA, tRNA, miRNA, snoRNA, etc.) and long ncR- NAs (lncRNAs) by ENCODE (1). It has been difficult to comprehensively identify all noncoding transcripts from a species since there are many ncRNA sub-types, some ncR- NAs are expressed only in particular cell types or condi- tions, and some have properties similar to messenger RNAs (mRNAs). Among the novel ncRNAs, lncRNAs with >200 nucleotides each represent a large class of ncRNAs that have attracted a lot of attention due to their diverse functional roles recently discovered (2,3). However, only a small por- tion of the lncRNAs has been well validated and charac- terized. Many transcripts detected by RNA-seq and array data were directly annotated as lncRNAs based on coding potential filters (4–6). To evaluate and characterize novel ncRNAs, it is cru- cial to comprehensively understand the signature features shared by various known ncRNA types. Unlike coding genes with clear organizational structures utilized by the transcriptional and translational machineries, ncRNAs in general have less obvious sequence characteristics. Some ncRNAs, lncRNAs in particular, are not strongly conserved evolutionarily, and do not have clear secondary structures. Many ncRNAs express only in certain cell types or condi- tions, and would thus be missed if expression data of these cell types or conditions are not available. Some lncRNAs also share common properties with mRNAs, containing in- trons and poly-A tails. Due to all these reasons, it is dif- ficult to identify and characterize novel ncRNAs compre- * To whom correspondence should be addressed. Tel: +86 10 62789217; Fax: +86 10 62789217; Email: [email protected] C The Author(s) 2014. Published by Oxford University Press on behalf of Nucleic Acids Research. This is an Open Access article distributed under the terms of the Creative Commons Attribution License (http://creativecommons.org/licenses/by-nc/4.0/), which permits non-commercial re-use, distribution, and reproduction in any medium, provided the original work is properly cited. For commercial re-use, please contact [email protected] by guest on February 5, 2015 http://nar.oxfordjournals.org/ Downloaded from
-
Upload
independent -
Category
Documents
-
view
1 -
download
0
Transcript of A common set of distinct features that characterize noncoding RNAs across multiple species

104–114 Nucleic Acids Research, 2015, Vol. 43, No. 1 Published online 12 December 2014doi: 10.1093/nar/gku1316
A common set of distinct features that characterizenoncoding RNAs across multiple speciesLong Hu1,2, Chao Di2, Mingxuan Kai2, Yu-Cheng T. Yang2, Yang Li2, Yunjiang Qiu2,Xihao Hu3, Kevin Y. Yip3, Michael Q. Zhang4,5 and Zhi John Lu2,*
1PKU-Tsinghua-NIBS Graduate Program, School of Life Sciences, Peking University, Beijing 100871, China, 2MOEKey Laboratory of Bioinformatics, Center for Synthetic and Systems Biology and Center for Plant Biology, School ofLife Sciences, Tsinghua University, Beijing 100084, China, 3Department of Computer Science and Engineering, TheChinese University of Hong Kong, Hong Kong, 4Department of Molecular and Cell Biology, Center for SystemsBiology, The University of Texas, Dallas 800 West Campbell Road, RL11 Richardson, TX 75080-3021, USA and5MOE Key Laboratory of Bioinformatics and Bioinformatics Division, Center for Synthetic and Systems Biology,TNLIST and School of Medicine, Tsinghua University, Beijing 100084, China
Received October 16, 2014; Revised December 03, 2014; Accepted December 05, 2014
ABSTRACT
To find signature features shared by various ncRNAsub-types and characterize novel ncRNAs, we havedeveloped a method, RNAfeature, to investigate >600sets of genomic and epigenomic data with variousevolutionary and biophysical scores. RNAfeature uti-lizes a fine-tuned intra-species wrapper algorithmthat is followed by a novel feature selection strat-egy across species. It considers long distance effectof certain features (e.g. histone modification at thepromoter region). We finally narrow down on 10 in-formative features (including sequences, structures,expression profiles and epigenetic signals). Thesefeatures are complementary to each other and as awhole can accurately distinguish canonical ncRNAsfrom CDSs and UTRs (accuracies: >92% in human,mouse, worm and fly). Moreover, the feature patternis conserved across multiple species. For instance,the supervised 10-feature model derived from animalspecies can predict ncRNAs in Arabidopsis (accu-racy: 82%). Subsequently, we integrate the 10 fea-tures to define a set of noncoding potential scores,which can identify, evaluate and characterize novelnoncoding RNAs. The score covers all transcribedregions (including unconserved ncRNAs), withoutrequiring assembly of the full-length transcripts. Im-portantly, the noncoding potential allows us to iden-tify and characterize potential functional domainswith feature patterns similar to canonical ncRNAs(e.g. tRNA, snRNA, miRNA, etc) on ∼70% of humanlong ncRNAs (lncRNAs).
INTRODUCTION
The advent of high-throughput sequencing technologies hasfacilitated the identification of a large number of previ-ously unannotated transcripts, many of which correspondto novel noncoding RNAs (ncRNAs). But only ∼1% of thehuman genome have been annotated as canonical ncRNAs(e.g. rRNA, tRNA, miRNA, snoRNA, etc.) and long ncR-NAs (lncRNAs) by ENCODE (1). It has been difficult tocomprehensively identify all noncoding transcripts from aspecies since there are many ncRNA sub-types, some ncR-NAs are expressed only in particular cell types or condi-tions, and some have properties similar to messenger RNAs(mRNAs). Among the novel ncRNAs, lncRNAs with >200nucleotides each represent a large class of ncRNAs that haveattracted a lot of attention due to their diverse functionalroles recently discovered (2,3). However, only a small por-tion of the lncRNAs has been well validated and charac-terized. Many transcripts detected by RNA-seq and arraydata were directly annotated as lncRNAs based on codingpotential filters (4–6).
To evaluate and characterize novel ncRNAs, it is cru-cial to comprehensively understand the signature featuresshared by various known ncRNA types. Unlike codinggenes with clear organizational structures utilized by thetranscriptional and translational machineries, ncRNAs ingeneral have less obvious sequence characteristics. SomencRNAs, lncRNAs in particular, are not strongly conservedevolutionarily, and do not have clear secondary structures.Many ncRNAs express only in certain cell types or condi-tions, and would thus be missed if expression data of thesecell types or conditions are not available. Some lncRNAsalso share common properties with mRNAs, containing in-trons and poly-A tails. Due to all these reasons, it is dif-ficult to identify and characterize novel ncRNAs compre-
*To whom correspondence should be addressed. Tel: +86 10 62789217; Fax: +86 10 62789217; Email: [email protected]
C© The Author(s) 2014. Published by Oxford University Press on behalf of Nucleic Acids Research.This is an Open Access article distributed under the terms of the Creative Commons Attribution License (http://creativecommons.org/licenses/by-nc/4.0/), whichpermits non-commercial re-use, distribution, and reproduction in any medium, provided the original work is properly cited. For commercial re-use, please [email protected]
by guest on February 5, 2015http://nar.oxfordjournals.org/
Dow
nloaded from
Nucleic Acids Research, 2015, Vol. 43, No. 1 105
hensively using any single type of information alone (7,8).Consequently, the idea of combining multiple lines of evi-dence for novel ncRNA identification has been proposed.By combining features derived from sequences, structures,evolutionary conservation and expression profiles, the mod-els produced by these integrative methods were shown tohave much higher sensitivity and specificity than methodsbased on single features (1,9–12).
Having high accuracy notwithstanding, these models arein general hard to interpret due to the large number (tensor even hundreds) of features involved. In addition, most ofthese previous studies focused on ncRNAs from one partic-ular species. It is not clear whether the features useful foridentifying ncRNAs from these species are generally usefulin identifying ncRNAs from other species. These complexmodels also suffer from the drawback that they cannot beapplied to a certain species if some of the involved featuresare not available in this species.
Here, we propose a new strategy called RNAfeature fordetermining a succinct set of essential and informative fea-tures that can accurately identify various ncRNA typesfrom multiple species. It involves an intra-species part foridentifying characteristic ncRNA features from each speciesby combining existing biophysical knowledge of ncRNAswith high-throughput experimental data, and an inter-species part for forming a common set of general ncRNAfeatures across different species. The method used in theintra-species part of RNAfeature is improved upon our pre-vious supervised model (incRNA) for identifying ncRNAsfrom a single species (1,9), with new feature types and sub-stantially more data supplied as inputs. The inter-speciespart of RNAfeature is a novel component newly introducedin this work. In addition, we also introduce a context in-fluence score (CIS) to consider the long distance effect ofcertain features (e.g. some histone modification signals areenriched at the promoter region).
RNAfeature investigated >600 sets of genomic and epige-nomic data with various evolutionary and biophysicalscores to look for conserved signature features of ncRNAsin multiple species. It narrowed down on 10 essential fea-tures (including sequences, structures, expression profilesand histone modification signals) that are sufficient for iden-tifying all known types of canonical ncRNAs (miRNA,rRNA, snRNA, Y RNA, etc.) and accurately distinguishthem from other genomic elements such as CDSs and UTRsin human, mouse, fly and worm (accuracies: >92%). Fur-thermore, the 10-feature model derived from animal speciesis conserved and predicts ncRNAs in Arabidopsis (accu-racy: 82%). We also show that this feature set is robust inthat even when we omit some canonical ncRNA types fromthe input of RNAfeature, the resulting model can still accu-rately identify ncRNAs of the omitted types. This indicatesthe generality of the identified features and the ability ofRNAfeature in finding novel ncRNA types.
Finally, we used the 10 features to define a set of noncod-ing potential scores, which can identify, evaluate and char-acterize novel noncoding RNAs. The potential score cov-ers all transcribed regions (including unconserved ncRNAs)without the full-length transcripts being assembled, becauseit is derived from complementary features at bin level (100nt). The noncoding potential has identified the potential
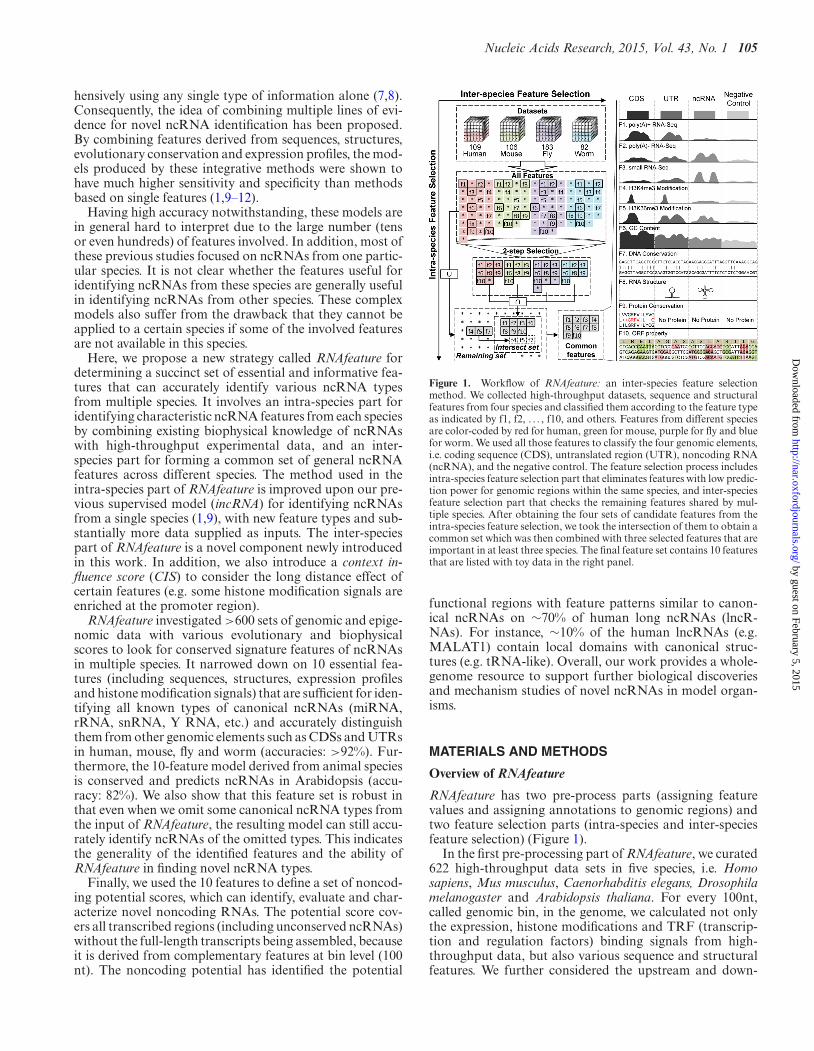
Figure 1. Workflow of RNAfeature: an inter-species feature selectionmethod. We collected high-throughput datasets, sequence and structuralfeatures from four species and classified them according to the feature typeas indicated by f1, f2, . . . , f10, and others. Features from different speciesare color-coded by red for human, green for mouse, purple for fly and bluefor worm. We used all those features to classify the four genomic elements,i.e. coding sequence (CDS), untranslated region (UTR), noncoding RNA(ncRNA), and the negative control. The feature selection process includesintra-species feature selection part that eliminates features with low predic-tion power for genomic regions within the same species, and inter-speciesfeature selection part that checks the remaining features shared by mul-tiple species. After obtaining the four sets of candidate features from theintra-species feature selection, we took the intersection of them to obtain acommon set which was then combined with three selected features that areimportant in at least three species. The final feature set contains 10 featuresthat are listed with toy data in the right panel.
functional regions with feature patterns similar to canon-ical ncRNAs on ∼70% of human long ncRNAs (lncR-NAs). For instance, ∼10% of the human lncRNAs (e.g.MALAT1) contain local domains with canonical struc-tures (e.g. tRNA-like). Overall, our work provides a whole-genome resource to support further biological discoveriesand mechanism studies of novel ncRNAs in model organ-isms.
MATERIALS AND METHODS
Overview of RNAfeature
RNAfeature has two pre-process parts (assigning featurevalues and assigning annotations to genomic regions) andtwo feature selection parts (intra-species and inter-speciesfeature selection) (Figure 1).
In the first pre-processing part of RNAfeature, we curated622 high-throughput data sets in five species, i.e. Homosapiens, Mus musculus, Caenorhabditis elegans, Drosophilamelanogaster and Arabidopsis thaliana. For every 100nt,called genomic bin, in the genome, we calculated not onlythe expression, histone modifications and TRF (transcrip-tion and regulation factors) binding signals from high-throughput data, but also various sequence and structuralfeatures. We further considered the upstream and down-
by guest on February 5, 2015http://nar.oxfordjournals.org/
Dow
nloaded from

106 Nucleic Acids Research, 2015, Vol. 43, No. 1
stream signals of genomic bins for each features, especiallythe histone modifications and TRF binding.
The second pre-processing part is to label genomic binsby their genomic elements (i.e. CDS, UTR, rRNA, miRNA,lncRNA, etc.) based on the gold standard annotations. Ineach species, we carefully prepared a gold-standard set ofannotations for four types of genomic locations: canonicalncRNAs, confirmed coding sequences (CDSs), 5′ and 3′ un-translated regions (UTRs) and negative controls (defined asintergenic regions with weak expression signals). The binsoverlapped with these annotations were selected as the gold-standard bins for training and testing.
The accuracies of classifying these four types of genomicregions were used for feature selection. We utilized a super-vised machine-learning framework with cross-validations.When constructing the training and test sets, we optimizedthe sampling method. Different machine learning classifierswere also compared and optimized for the feature selection.
The intra-species feature selection had a pre-filter stepand a rigorous search step. In the pre-filter step, we useda recursive feature elimination (RFE) algorithm (13) to fil-ter inessential features. Then, we used a greedy hill climbingmethod, called greedy backward algorithm (GBA) (14), torigorously eliminate features.
Subsequently, the inter-species feature selection had twosteps to optimize the feature set shared by multiple species.We first intersected the feature sets from different speciesand retained other features in the union set as remainingfeatures. To save essential features incorrectly filtered at pre-vious steps, we added an optimized subset of the remainingfeatures into the intersected set to obtain the final set.
The common features were selected from four animalspecies (i.e. human, mouse, fly and worm) and validated ina plant species, Arabidopsis.
Feature scores from high-throughput data
In total, we curated and processed 622 high-throughputdatasets in five species: H. sapiens, M. musculus, C. ele-gans, D. melanogaster and A. thaliana (Supplemental TableS1 and Supplemental Dataset 1). The data sets belong tothree types that are expression levels (16 billion RNA-seqreads and 400 million array probes), histone modifications(18 types of histone modifications) and TRF binding (twoTRFs). The reference genome sequence of each species wassplit into 100nt bins, with a step size of 50nt. The featurevalues were calculated at bin level.
Expression data. Various expression values were ob-tained from raw data, including 98 poly(A)+ RNA, 41poly(A)− RNA, 48 total RNA, 70 small RNA sequenc-ing data sets, and 101 poly(A)+ or total RNA tiling ar-ray data sets (see details in Supplemental Notes, Sup-plemental Table S1 and Supplemental Dataset 1). Weanalyzed approximately 16 billion mapped reads fromRNA-seq data and 400 million probes from tiling ar-ray data. For RNA-seq, we calculated the reads per kilo-base per million (RPKM) of each bin using the DEGseqsoftware package (http://www.bioconductor.org/packages/release/bioc/html/DEGseq.html). For tiling array data, theexpression values were calculated using an R package
AffyTiling (http://www.bioconductor.org/packages/release/bioc/html/AffyTiling.html), and the maximum intensity ofoverlapped probes was assigned to each bin. The signalsfrom different replicates were averaged. Recent studies haveshown that many novel ncRNAs tend to be specifically ex-pressed in certain conditions or tissues (sometimes onlyup-regulated in one specific condition) (15,16). In orderto make our model more sensitive to novel ncRNA detec-tion, we used the maximum expression values (of RPKM orthe probe intensity) among different conditions (i.e. tissues,cell lines, etc.) for each type of expression feature such aspoly(A)+, poly(A)− and small RNA.
Histone modification and transcriptional regulatory factorbinding data. We curated ChIP-seq data from 18 types ofhistone modifications and two TRFs (see details in Sup-plemental Note and Supplemental Table S1). The peaksfrom the human ChIP-seq data were downloaded from En-code (Supplemental Dataset 1). For other ChIP-seq data,we used MACS14 (17) to convert raw reads. The values ofeach sample were transformed into Z-score by smoothing0.01% of the outlier values. The Z-scores from different con-ditions (i.e. tissues, developing time, cell lines, etc.) were av-eraged to produce a single value for each type of data.
Sequence and structural scores
We curated and calculated various computational scores foreach bin of 100nt in genomes of five species (SupplementalTable S2).
GC content was calculated by counting the proportion ofG and C bases in the sequence.
DNA sequence conservation was measured using BLASTnwith default parameters for worm, fly and Arabidopsis. Thelibrary databases for worm, fly and Arabidopsis were down-loaded from Wormbase (with 19 other nematode species),Flybase (with 11 other Drosophila species) and Ensem-blePlants (with 31 other plant species), respectively. ThePhastCons scores for humans are phastCons46way, and thescores for mice are phastCons30way as provided by theUCSC genome browser.
Protein conservation was measured by BLAST based onthe same library sources as the DNA sequence conserva-tion, except that we extracted all the vertebrate protein se-quences from NCBI nr database to build the BLAST li-brary for human and mouse. We used tBLASTx for worm,and BLASTx for other species to calculate the conservationscores.
RNA secondary structure stability was represented by thep-value of the free energy calculated by the Randfold pro-gram (18). The dinucleotide frequency was retained and1000 shuffles were used to generate a random backgroundof RNA structures.
RNA secondary structure homologs were searched by theINFERNAL program with default parameters (19).
RNA secondary structure conservation was denoted bystructure conservation index (SCI) scores calculated usingRNAz (20) based on multiple sequence alignments with de-fault parameters.
by guest on February 5, 2015http://nar.oxfordjournals.org/
Dow
nloaded from

Nucleic Acids Research, 2015, Vol. 43, No. 1 107
Figure 2. Details of intra-species feature selection and context influencescore. The whole genome is split into 100-nt bins. Then, the bins are classi-fied by genomic annotations (i.e. CDS, UTR, negative control and canoni-cal ncRNA). Multiple feature values are calculated for each bin, consider-ing both local score and a CIS. Subsequently, the features are pre-filteredusing RFE algorithm and rigorously searched with a GBA. They are evalu-ated by a 5-fold cross validation inside the training set. Finally, the selectedfeatures are further validated with an independent test set. The accuracy ofclassifying the four genomic elements (CDS, canonical ncRNA, UTR andnegative control) is the criteria of evaluating the selection performance.
ORF property was measured by RNAcode using the samemultiple sequence alignments. It was also called coding po-tential in RNAcode paper (6).
Multiple species alignments. We downloaded 46-wayalignments for human, 30-way alignments for mouse, 7-way alignments for worm and 15-way alignments for flyfrom the UCSC Genome Browser (http://hgdownload.soe.ucsc.edu/goldenPath). The 5-way alignments for Arabidop-sis were downloaded from VISTA (http://pipeline.lbl.gov/downloads.shtml).
Definition of context influence score––downstream and up-stream influence
Because of the long distance effects of features (e.g. somehistone modification signals enriched at the promoter re-gion), we considered the upstream and downstream valuesfor each local bin (upper panel in Figure 2). Consideringthat the influence of context declines with distance, we cal-culated a CIS of a feature in a bin using an exponentialweight function (21):
CI S = ∑
khke
−dkd0
hk = feature scoredk = distance to the current bin
d0 = context range(assigned by species and feature type)
The up-stream CIS, local value, and down-stream CISwere always considered as a group when providing the fea-
ture for each bin. The distance parameter d0 was optimizedin each species (Supplemental Note). For histone modifica-tion and TRF features, we used aggregating plots of the sig-nals around TSS (transcription start site) regions to deter-mine the d0 (Supplemental Figures S1 and S2). It is 2000ntfor fly, worm and Arabidopsis genomes, and 5000nt for hu-man and mouse genomes. For expression, sequence, andstructural features, d0 was determined by the exon size (Sup-plemental Figure S3), as these features might be highly cor-related for bins within the same exon. It is 1500nt for fly,worm and Arabidopsis genomes, and 3000nt for human andmouse genomes. For each species, we compared model per-formances with and without CIS. Overall, considering thelong distance effect has improved our model (SupplementalFigure S4).
Feature score normalization
Initially, the feature values have very diverse range sincethey were derived from genomic loci of multiple species. Toreduce the data heterogeneity, we first smoothed the top andbottom 0.005% values of each feature. Then, the featureswith large range (>1000) in value were log-transformed byy = log10(x − minimum + 1). Subsequently, all the featurevalues were scaled between 0 and 1 with the linear transfor-mation:
y = x − minimummaximum − minimum
.
Gold standard annotations
We used the genome annotations downloaded from Gen-code (version 10), MGI (version GRCm38), Wormbase(version ws220), Flybase (version r5.45), and TAIR (ver-sion 10) to annotate each genomic bin. The summary ofthe annotations is shown in Supplemental Table S3. In allfive species, four basic genomic elements were used as goldstandard annotations for the feature selection calculations:CDSs, untranslated regions (5′ and 3′ UTRs), canonicalncRNA and negative controls. The canonical ncRNAs arewell-classified ncRNAs, including rRNA, tRNA, snoRNA,snRNA, miRNA, Y RNA and 7SK RNA. The negativecontrols were obtained using three criteria: (1) bins locatedin the intergenic regions (Supplemental Figure S5), (2) withexpression levels lower than the average values of all inter-genic bins across all expression data, (3) containing no am-biguous nucleotides (i.e. N). The intergenic regions were de-fined as regions located at least N-nt away from any anno-tated elements (i.e. coding genes, ncRNAs, TEs and pseudo-genes). N is 2000 for human and mouse, and 500 for worm,fly and Arabidopsis.
Each genomic bin (100nt) is annotated by the followingorder (Supplemental Figure S6): (1) if 50% of a bin over-laps with a known ncRNA region (such as canonical ncR-NAs and long ncRNAs), it is labeled as the correspond-ing ncRNA type; (2) if 90% of a bin overlaps with a CDS,UTR, ancestral repeat or intergenic region, it is labeled cor-respondingly; (3) if 50% of a bin overlaps with a pseudo-gene, intronic, TE or ambiguous region, it is labeled corre-spondingly. The summary of the annotated bins is shown inSupplemental Table S4.
by guest on February 5, 2015http://nar.oxfordjournals.org/
Dow
nloaded from

108 Nucleic Acids Research, 2015, Vol. 43, No. 1
Construction of training and test sets
We tested various methods and strategies to determine theappropriate training and test sets. When optimizing the clas-sifier and feature selection algorithm, we adapted the train-ing strategy from our previous study (9), used 5-fold cross-validation in the training set (2/3 of the entire data), fol-lowed by further validation in an independent test set (1/3of the data) (Figure 2).
Genomic distance. Because the feature values (e.g. expres-sion level) of close bins are highly correlated, we need to en-sure that bins sampled in the test set are distant from thoseused in the training set. Thus, nearby bins were packed intoone block, and the bins from the same block were put in thesame set. The minimum genomic distance between adjacentblocks was chosen for each genome (Supplemental FiguresS7 and S8). To avoid exons from the same gene being packedinto two blocks, we used a distance that was longer than90% of introns, which was 15 000nt for human and mouse,and 5000nt for worm, fly and Arabidopsis (SupplementalTable S5).
Balanced classes. In most genomes, the CDS bins out-number the ncRNA bins. To prevent the prediction bias(Supplemental Figure S9), we sampled same numbers ofbins from each genomic class (Supplemental Figures S10and S11) for the following feature selection steps.
Classifier optimization
We tested various machine-learning classifiers to optimizethe classification performance, including the Naı̈ve Bayes,Logistic Regression, Support Vector Machine (SVM) andRandom Forest (Supplemental Note). We compared theirperformances for the 4-class prediction (CDS, UTR, canon-ical ncRNA and negative control) in human. The RandomForest method was finally chosen for the downstream anal-ysis because it had the best performance (Supplemental Fig-ure S12).
Construction of the initial feature set
We curated 25 types of expression, histone and TRF fea-tures (Supplemental Table S1). We selected 15 features thatwere available in at least three species as the initial set forfeature selection. Previously studies have shown that gene-rich regions tend to be more conserved and have higherGC content (22,23). It was also suggested that many ncR-NAs have conserved and stable secondary structures (9,24).Therefore, we also added seven sequence and structurescores (GC content, DNA sequence conservation, proteinconservation, RNA secondary structure stability, RNA sec-ondary structure homologs, RNA secondary structure con-servation and ORF property).
Intra-species feature selection
The accuracy (ACC) of classifying four genomic elements(CDS, canonical ncRNA, UTR and negative control) wasused as the criteria to select the best feature set within eachspecies (Figure 2). The accuracy, called ACC in statistics, is
the ratio of correctly predicted instances over all instancesbelonging to the four genomic elements. Here, the correctlypredicted instances are calculated from four classes: cor-rectly predicted CDS bins + correctly predicted UTR bins +correctly predicted ncRNA bins + correctly predicted nega-tive control bins. We started from the feature set mentionedabove, followed by a two-step wrapper method to removethe worst features. One was a pre-filtering step that used theRFE method (13). The other was a rigorous search step us-ing the GBA (14).
Performance variance. We first estimated the performancevariance of a classifier (i.e. Random Forest) when the sametraining set was used repeatedly (Supplemental Figure S13).The distribution of classifier accuracies for 100 repeats wasapproximately a normal distribution (Supplemental FigureS13A). And, the randomness was quantified as 4-fold of thestandard deviation of the accuracy. Thus, during the pre-filtering step, a smaller set was selected by sacrificing theaccuracy within the randomness allowance, instead of a fea-ture set with the highest accuracy value (Supplemental Fig-ure S13B and C).
Pre-filtering step used the RFE method. RFE irreversiblyeliminated the feature with the lowest rank one by one, untilfinding the smallest feature set (Supplemental Figure S14).We tested two ranking criteria for RFE: Spearman’s cor-relation coefficient and Random Forest Importance Score.We then chose the latter one because fewer features wereselected with a higher accuracy (Supplemental Table S6A).
Rigorous search step used the GBA. It iteratively evalu-ated a subset of features and removes useless ones (Supple-mental Figure S15).
Other selection strategies such as embedded method werealso tested and compared (Supplemental Note and Supple-mental Table S6B).
We summarized the features used and selected by intra-species feature selection in Supplemental Figure S16.
Inter-species feature selection. Inter-species feature selec-tion chose features with balanced performances amongmultiple species. After the intra-species feature selection,seven features shared by all four species were retained andcalled the intersecting feature set: I = (I1, ..., I7). The re-maining 15 features were called the remaining feature set:L = (L1, ..., L15) (Supplemental Figure S17).
Because some essential features shared by multiplespecies could be filtered out during the intra-species fea-ture selection, we tried to add some features from the re-maining set L back to the intersecting set I. Picking n fea-tures from the remaining feature set has m(m = Cn
15) dif-ferent possibilities. G represents a subset of L. It can bedenoted as Gn, j , where j = 1, ..., m (Supplemental FigureS18). We ranked the classifier accuracies for different com-bination set (Cn, j = Gn, j + I) within every species, s(s =human, mouse, worm or fly) (Supplemental Figure S19A).We found that DNA sequence conservation, H3K36me3,and H3K4me3 were frequently selected in highly rankedcombinations in at least three species.
To test the robustness of the selection method, we trieddifferent combination sizes, n, from 2 to 4, and it always out-putted the three features from the remaining set, L (Supple-
by guest on February 5, 2015http://nar.oxfordjournals.org/
Dow
nloaded from

Nucleic Acids Research, 2015, Vol. 43, No. 1 109
mental Figure S19B). Therefore, ten features (I1−7 + L1−3)were selected as the final feature set (Supplemental FigureS20).
Feature weights in multiple species
To compare models across species, we did quantile normal-ization for the feature values.
Feature weights using Softmax. The Softmax algorithm(http://cs229.stanford.edu), a multinomial logistic regres-sion algorithm, was used to evaluate the weights of the 10selected features for CDS, ncRNA, UTR, and negative con-trol.
ncRNA types used for cross-type validations
The performance of ten-feature model for the 4-class (CDS,UTR, negative control and canonical ncRNA) predictionwas validated on different types of canonical ncRNAs(i.e. transfer RNA, tRNA; ribosomal RNA, rRNA, mi-croRNA, miRNA; small nuclear RNA, snRNA; small nu-cleolar RNA, snoRNA; Y RNA; 7SK RNA). For instance,when predicting a specific type of ncRNA (e.g. rRNA in hu-man), we used 1202 CDS bins, 1202 UTR bins, 1202 nega-tive control bins and 1202 rRNA bins in the test set. In thetraining set, we used 10 000 CDS bins, 10 000 UTR bins, 10000 negative control bins and 10 000 all other six types ofncRNAs bins.
In addition, we also treated different ncRNA subtypesas different classes and trained multi-class models using theselected 10 features (Supplemental Figure S21). Some sub-types (e.g. rRNA and miRNA) could be better separatedfrom other ncRNAs. In general, different subtypes of ncR-NAs share similar feature patterns for the selected com-mon features, which make it hard to separate them fromeach other. The common properties and feature patternswould enable the model to have the potential of findingnovel ncRNA types.
Noncoding potential calculation
We calculated noncoding potential as the probability ofbeing canonical ncRNAs for every bin (100nt) of humangenome. We built models based on the selected 10 featuresand four classes (canonical ncRNA, CDS, UTR and nega-tive control). The training set contains all bins in the goldstandard set, i.e. 349 390 CDS bins, 617 150 UTR bins,15 784 canonical ncRNA bins and 260 054 negative con-trol bins. We used the following bagging method to buildthe models. Every time, 10 000 CDS bins, 10 000 canonicalncRNA bins, 10 000 UTR bins and 10 000 negative con-trol bins were randomly sampled from the training set tobuild a model. Then the sampling method was repeated 100times and 100 models were built. On average, every bin inthe training set was used for approximately two times. Thepredicted values to be ncRNA of the 100 models were aver-aged as the noncoding potential score for each bin.
We calculate the noncoding potential scores for the otherspecies (mouse, worm and fly) as well, using the same strat-egy.
RESULTS
Identifying common features of canonical ncRNAs acrossmultiple species using RNAfeature
We developed an integrated feature selection method,RNAfeature (Figure 1, see ‘Materials and Methods’ sec-tion), to identify the essential features of various ncRNAtypes across multiple species, from >600 sets of high-throughput experimental data and various computationalscores (Supplemental Table S1 and Supplemental Dataset1). These datasets and computational scores constitute theraw features, and they were chosen based on their poten-tial capability of distinguishing ncRNAs from three othertypes of genomic elements, namely CDSs, UTRs and in-active intergenic regions (negative control). Because mostof the novel long ncRNAs are not well confirmed, we onlyused the well-classified ncRNAs (called canonical ncRNAs,including rRNA, tRNA, snRNA, miRNA, Y RNA, etc;see ‘Materials and Methods’ section) in the training set forthe feature selection calculations. We supplied as inputs ofRNAfeature the annotated sequence elements at each ge-nomic locus, and the values of the raw features at each locusand its flanking upstream and downstream regions, whichare useful in defining the genomic context of the locus (up-per panel in Figure 2). RNAfeature then performed an intra-species round of feature selection to identify key featuresthat distinguish ncRNAs from other sequence elements ineach species (Figure 2), followed by an inter-species roundto determine features generally useful in identifying ncR-NAs in human, mouse, worm and fly.
Based on the accuracy of classifying the four types of ge-nomic elements, 10 common features were finally selectedfor the four animal species, namely GC content, DNA se-quence conservation, protein sequence conservation, RNAsecondary structure homologs, reading frame property,small RNA-seq, poly(A)+ RNA-seq and poly(A)− RNA-seq signals, and the histone modification signals H3K36me3and H3K4me3 (Figure 1, Supplemental Figure S20).
Canonical ncRNAs exhibit conserved patterns of the selectedfeatures across different species
To understand the significance of the 10 common features inidentifying the different types of sequence elements, we usedthe multinomial logistic regression algorithm Softmax to il-lustrate their feature weights for the four genomic classesin each species (Figure 3A). The averaged feature valuesfor the four classes are also shown in Supplemental FiguresS22 and S23. In all four species, CDSs were generally moreconserved and highly expressed, and the canonical ncR-NAs tended to be more structured and had the strongestsignals in the small RNA-seq data. H3K4me3 was morehighly weighted in the UTRs, which could be caused bytheir enrichment in promoter regions (25). The inclusion ofupstream and downstream features of each locus might helpseparate ncRNAs from UTRs, in that if a locus was close toa CDS, it would be more likely to be a UTR. We then mixedthe data from all four species to build a single cross-speciesmodel. This model displays similar feature patterns as thefour species-specific models (Figure 3A), further confirm-
by guest on February 5, 2015http://nar.oxfordjournals.org/
Dow
nloaded from
110 Nucleic Acids Research, 2015, Vol. 43, No. 1
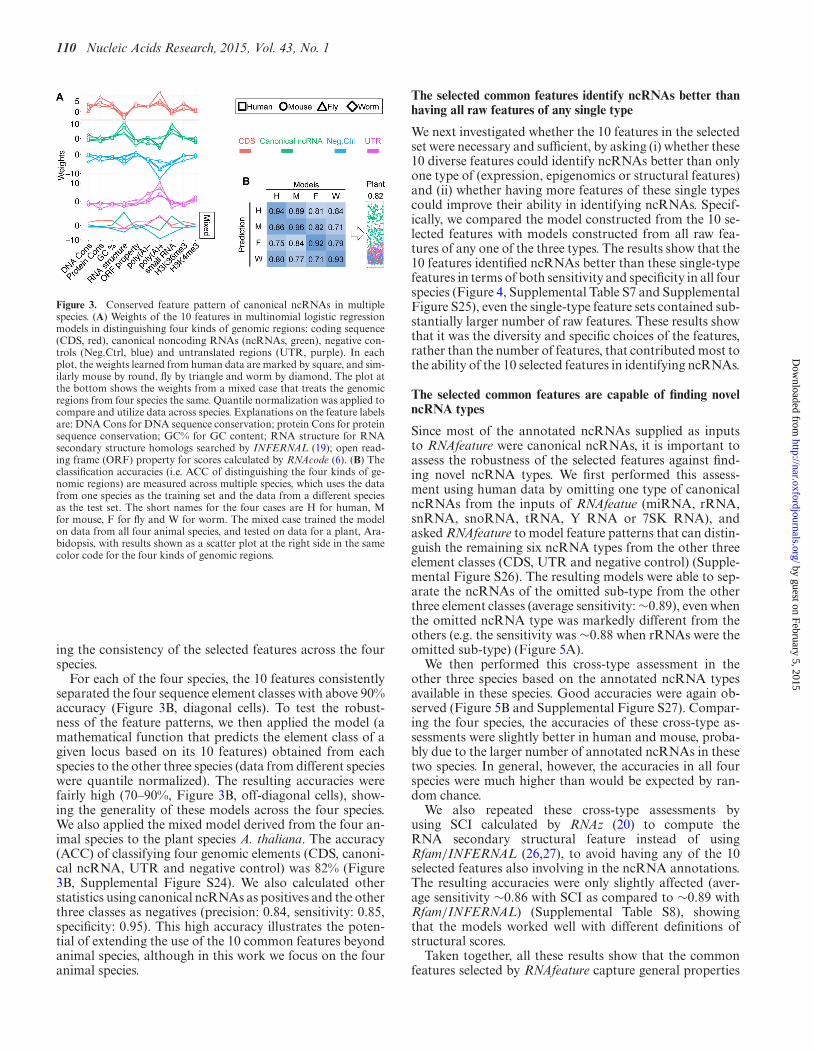
Figure 3. Conserved feature pattern of canonical ncRNAs in multiplespecies. (A) Weights of the 10 features in multinomial logistic regressionmodels in distinguishing four kinds of genomic regions: coding sequence(CDS, red), canonical noncoding RNAs (ncRNAs, green), negative con-trols (Neg.Ctrl, blue) and untranslated regions (UTR, purple). In eachplot, the weights learned from human data are marked by square, and sim-ilarly mouse by round, fly by triangle and worm by diamond. The plot atthe bottom shows the weights from a mixed case that treats the genomicregions from four species the same. Quantile normalization was applied tocompare and utilize data across species. Explanations on the feature labelsare: DNA Cons for DNA sequence conservation; protein Cons for proteinsequence conservation; GC% for GC content; RNA structure for RNAsecondary structure homologs searched by INFERNAL (19); open read-ing frame (ORF) property for scores calculated by RNAcode (6). (B) Theclassification accuracies (i.e. ACC of distinguishing the four kinds of ge-nomic regions) are measured across multiple species, which uses the datafrom one species as the training set and the data from a different speciesas the test set. The short names for the four cases are H for human, Mfor mouse, F for fly and W for worm. The mixed case trained the modelon data from all four animal species, and tested on data for a plant, Ara-bidopsis, with results shown as a scatter plot at the right side in the samecolor code for the four kinds of genomic regions.
ing the consistency of the selected features across the fourspecies.
For each of the four species, the 10 features consistentlyseparated the four sequence element classes with above 90%accuracy (Figure 3B, diagonal cells). To test the robust-ness of the feature patterns, we then applied the model (amathematical function that predicts the element class of agiven locus based on its 10 features) obtained from eachspecies to the other three species (data from different specieswere quantile normalized). The resulting accuracies werefairly high (70–90%, Figure 3B, off-diagonal cells), show-ing the generality of these models across the four species.We also applied the mixed model derived from the four an-imal species to the plant species A. thaliana. The accuracy(ACC) of classifying four genomic elements (CDS, canoni-cal ncRNA, UTR and negative control) was 82% (Figure3B, Supplemental Figure S24). We also calculated otherstatistics using canonical ncRNAs as positives and the otherthree classes as negatives (precision: 0.84, sensitivity: 0.85,specificity: 0.95). This high accuracy illustrates the poten-tial of extending the use of the 10 common features beyondanimal species, although in this work we focus on the fouranimal species.
The selected common features identify ncRNAs better thanhaving all raw features of any single type
We next investigated whether the 10 features in the selectedset were necessary and sufficient, by asking (i) whether these10 diverse features could identify ncRNAs better than onlyone type of (expression, epigenomics or structural features)and (ii) whether having more features of these single typescould improve their ability in identifying ncRNAs. Specif-ically, we compared the model constructed from the 10 se-lected features with models constructed from all raw fea-tures of any one of the three types. The results show that the10 features identified ncRNAs better than these single-typefeatures in terms of both sensitivity and specificity in all fourspecies (Figure 4, Supplemental Table S7 and SupplementalFigure S25), even the single-type feature sets contained sub-stantially larger number of raw features. These results showthat it was the diversity and specific choices of the features,rather than the number of features, that contributed most tothe ability of the 10 selected features in identifying ncRNAs.
The selected common features are capable of finding novelncRNA types
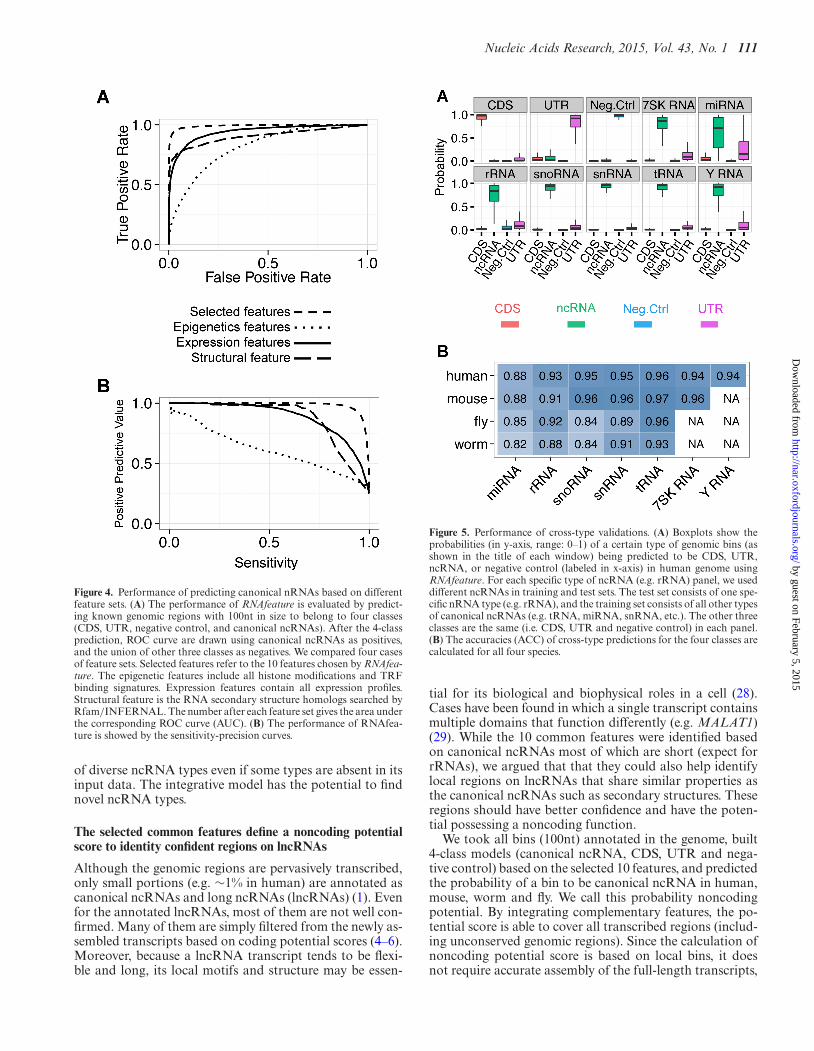
Since most of the annotated ncRNAs supplied as inputsto RNAfeature were canonical ncRNAs, it is important toassess the robustness of the selected features against find-ing novel ncRNA types. We first performed this assess-ment using human data by omitting one type of canonicalncRNAs from the inputs of RNAfeatue (miRNA, rRNA,snRNA, snoRNA, tRNA, Y RNA or 7SK RNA), andasked RNAfeature to model feature patterns that can distin-guish the remaining six ncRNA types from the other threeelement classes (CDS, UTR and negative control) (Supple-mental Figure S26). The resulting models were able to sep-arate the ncRNAs of the omitted sub-type from the otherthree element classes (average sensitivity: ∼0.89), even whenthe omitted ncRNA type was markedly different from theothers (e.g. the sensitivity was ∼0.88 when rRNAs were theomitted sub-type) (Figure 5A).
We then performed this cross-type assessment in theother three species based on the annotated ncRNA typesavailable in these species. Good accuracies were again ob-served (Figure 5B and Supplemental Figure S27). Compar-ing the four species, the accuracies of these cross-type as-sessments were slightly better in human and mouse, proba-bly due to the larger number of annotated ncRNAs in thesetwo species. In general, however, the accuracies in all fourspecies were much higher than would be expected by ran-dom chance.
We also repeated these cross-type assessments byusing SCI calculated by RNAz (20) to compute theRNA secondary structural feature instead of usingRfam/INFERNAL (26,27), to avoid having any of the 10selected features also involving in the ncRNA annotations.The resulting accuracies were only slightly affected (aver-age sensitivity ∼0.86 with SCI as compared to ∼0.89 withRfam/INFERNAL) (Supplemental Table S8), showingthat the models worked well with different definitions ofstructural scores.
Taken together, all these results show that the commonfeatures selected by RNAfeature capture general properties
by guest on February 5, 2015http://nar.oxfordjournals.org/
Dow
nloaded from
Nucleic Acids Research, 2015, Vol. 43, No. 1 111
Figure 4. Performance of predicting canonical nRNAs based on differentfeature sets. (A) The performance of RNAfeature is evaluated by predict-ing known genomic regions with 100nt in size to belong to four classes(CDS, UTR, negative control, and canonical ncRNAs). After the 4-classprediction, ROC curve are drawn using canonical ncRNAs as positives,and the union of other three classes as negatives. We compared four casesof feature sets. Selected features refer to the 10 features chosen by RNAfea-ture. The epigenetic features include all histone modifications and TRFbinding signatures. Expression features contain all expression profiles.Structural feature is the RNA secondary structure homologs searched byRfam/INFERNAL. The number after each feature set gives the area underthe corresponding ROC curve (AUC). (B) The performance of RNAfea-ture is showed by the sensitivity-precision curves.
of diverse ncRNA types even if some types are absent in itsinput data. The integrative model has the potential to findnovel ncRNA types.
The selected common features define a noncoding potentialscore to identity confident regions on lncRNAs
Although the genomic regions are pervasively transcribed,only small portions (e.g. ∼1% in human) are annotated ascanonical ncRNAs and long ncRNAs (lncRNAs) (1). Evenfor the annotated lncRNAs, most of them are not well con-firmed. Many of them are simply filtered from the newly as-sembled transcripts based on coding potential scores (4–6).Moreover, because a lncRNA transcript tends to be flexi-ble and long, its local motifs and structure may be essen-
Figure 5. Performance of cross-type validations. (A) Boxplots show theprobabilities (in y-axis, range: 0–1) of a certain type of genomic bins (asshown in the title of each window) being predicted to be CDS, UTR,ncRNA, or negative control (labeled in x-axis) in human genome usingRNAfeature. For each specific type of ncRNA (e.g. rRNA) panel, we useddifferent ncRNAs in training and test sets. The test set consists of one spe-cific nRNA type (e.g. rRNA), and the training set consists of all other typesof canonical ncRNAs (e.g. tRNA, miRNA, snRNA, etc.). The other threeclasses are the same (i.e. CDS, UTR and negative control) in each panel.(B) The accuracies (ACC) of cross-type predictions for the four classes arecalculated for all four species.
tial for its biological and biophysical roles in a cell (28).Cases have been found in which a single transcript containsmultiple domains that function differently (e.g. MALAT1)(29). While the 10 common features were identified basedon canonical ncRNAs most of which are short (expect forrRNAs), we argued that that they could also help identifylocal regions on lncRNAs that share similar properties asthe canonical ncRNAs such as secondary structures. Theseregions should have better confidence and have the poten-tial possessing a noncoding function.
We took all bins (100nt) annotated in the genome, built4-class models (canonical ncRNA, CDS, UTR and nega-tive control) based on the selected 10 features, and predictedthe probability of a bin to be canonical ncRNA in human,mouse, worm and fly. We call this probability noncodingpotential. By integrating complementary features, the po-tential score is able to cover all transcribed regions (includ-ing unconserved genomic regions). Since the calculation ofnoncoding potential score is based on local bins, it doesnot require accurate assembly of the full-length transcripts,
by guest on February 5, 2015http://nar.oxfordjournals.org/
Dow
nloaded from
112 Nucleic Acids Research, 2015, Vol. 43, No. 1
Figure 6. Noncoding potential defines confident regions in human lncR-NAs. (A) Noncoding potential scores are calculated for each type of ge-nomic element at bin level (100nt), their densities are plotted. For eachlncRNA bin, we predict its probabilities to be canonical ncRNA, CDS,UTR or negative control. If a bin has higher probability to be canonicalncRNA than other three classes, it is defined as positive (confident bin).(B) The feature values are averaged from all the lncRNA bins with dif-ferent noncoding potential scores. Each expression score is the maximumRPKM across five cell-lines (GM12878, K562, H1-hESC, HeLa-S3 andHepG2). The other feature values are normalized from 0 to 1. We use theupstream CIS for H3K4me3 because it known as a promoter marker.
thereby avoiding the need for very deep RNA-seq, CAGE(30) or TIF-seq (31).
We then applied the noncoding potential on the anno-tated human lncRNAs (Gencode V10). A local region (100-nt bin) will be called confident region (positive) if its canon-ical ncRNA probability is higher than the probabilities ofthe other three classes. We found ∼70% of the lncRNAscontains at least one confident bin having properties sim-ilar to canonical ncRNAs (Supplemental Table S9). Thenoncoding potential scores of confident lncRNA bins (pos-itives) are usually between those of CDSs and canonicalncRNAs (Figure 6A), suggesting that these novel lncRNAregions have unique feature patterns that are different fromany known genomic elements (e.g. CDS, UTR and canoni-cal ncRNAs).
We further investigated the feature patterns of all the hu-man lncRNA bins with different levels of noncoding po-tential (Figure 6B, Supplemental Figure S28). As expected,the lncRNA bins have lower conservation scores than CDSs(Supplemental Figures S22–S23). The high noncoding po-tential is mainly contributed by structural feature and/orsmall RNA signals. For instance, two lncRNAs with highnoncoding potential scores (MALAT1 and NEAT1/Men β)contain nonpoly(A) rich tract at their 3′-ends (29,32). Theywere processed into structured RNAs that generate smallRNAs. This is also consistent with previous studies show-
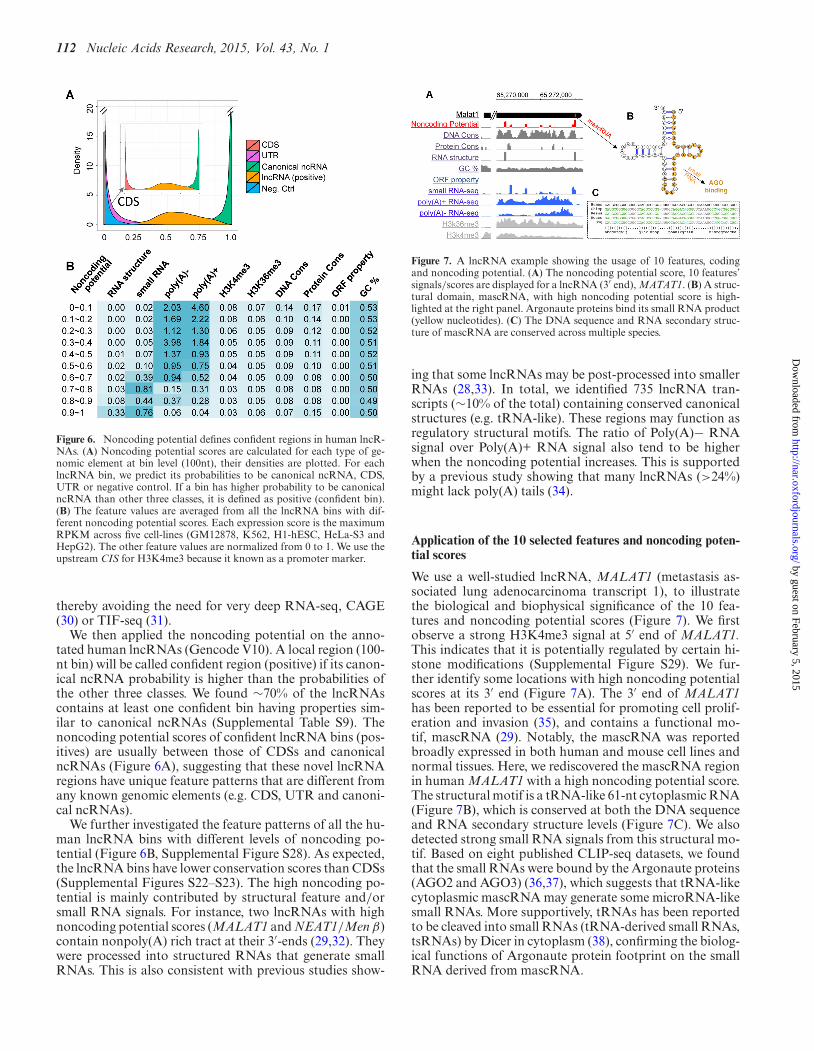
Figure 7. A lncRNA example showing the usage of 10 features, codingand noncoding potential. (A) The noncoding potential score, 10 features’signals/scores are displayed for a lncRNA (3′ end), MATAT1. (B) A struc-tural domain, mascRNA, with high noncoding potential score is high-lighted at the right panel. Argonaute proteins bind its small RNA product(yellow nucleotides). (C) The DNA sequence and RNA secondary struc-ture of mascRNA are conserved across multiple species.
ing that some lncRNAs may be post-processed into smallerRNAs (28,33). In total, we identified 735 lncRNA tran-scripts (∼10% of the total) containing conserved canonicalstructures (e.g. tRNA-like). These regions may function asregulatory structural motifs. The ratio of Poly(A)− RNAsignal over Poly(A)+ RNA signal also tend to be higherwhen the noncoding potential increases. This is supportedby a previous study showing that many lncRNAs (>24%)might lack poly(A) tails (34).
Application of the 10 selected features and noncoding poten-tial scores
We use a well-studied lncRNA, MALAT1 (metastasis as-sociated lung adenocarcinoma transcript 1), to illustratethe biological and biophysical significance of the 10 fea-tures and noncoding potential scores (Figure 7). We firstobserve a strong H3K4me3 signal at 5′ end of MALAT1.This indicates that it is potentially regulated by certain hi-stone modifications (Supplemental Figure S29). We fur-ther identify some locations with high noncoding potentialscores at its 3′ end (Figure 7A). The 3′ end of MALAT1has been reported to be essential for promoting cell prolif-eration and invasion (35), and contains a functional mo-tif, mascRNA (29). Notably, the mascRNA was reportedbroadly expressed in both human and mouse cell lines andnormal tissues. Here, we rediscovered the mascRNA regionin human MALAT1 with a high noncoding potential score.The structural motif is a tRNA-like 61-nt cytoplasmic RNA(Figure 7B), which is conserved at both the DNA sequenceand RNA secondary structure levels (Figure 7C). We alsodetected strong small RNA signals from this structural mo-tif. Based on eight published CLIP-seq datasets, we foundthat the small RNAs were bound by the Argonaute proteins(AGO2 and AGO3) (36,37), which suggests that tRNA-likecytoplasmic mascRNA may generate some microRNA-likesmall RNAs. More supportively, tRNAs has been reportedto be cleaved into small RNAs (tRNA-derived small RNAs,tsRNAs) by Dicer in cytoplasm (38), confirming the biolog-ical functions of Argonaute protein footprint on the smallRNA derived from mascRNA.
by guest on February 5, 2015http://nar.oxfordjournals.org/
Dow
nloaded from

Nucleic Acids Research, 2015, Vol. 43, No. 1 113
This example illustrates that the classical structural con-formation of canonical ncRNAs could be adopted by thenovel long ncRNAs (e.g. MALAT1) to define novel func-tional domains. It is consistent with our RNAfeature modelincluding RNA secondary structure conservation and ho-mologous score.
DISCUSSION
We have developed a comprehensive computationalmethod, RNAfeature, to evaluate and characterize novelncRNAs with high resolution at the whole genome level.It revealed a set of distinct features commonly shared bydifferent types of canonical ncRNAs in multiple species.This set includes 10 features from the sequence, structure,genome and epigenome merged from data obtained invarious tissues, cell lines and development stages.
RNAfeature is an integrative method that is capable ofdistinguishing diverse ncRNA types from protein coding se-quences and UTRs. The rigorous feature selection strategyof RNAfeature enabled us to select from >600 datasets asuccinct set of informative features with clear evolutionary,biophysical and biological meanings. By integrating com-plementary features together and considering context in-fluence (CIS), RNAfeature showed better sensitivity thanncRNA prediction methods based on single feature types(e.g. expression level and structure conservation; Figure 3and Supplemental Figure S25). The patterns of these fea-tures are conserved in multiple species. We could use amodel derived from animal species to predict plant ncR-NAs. And the resulting ncRNA models are robust againstmissing ncRNA sub-types in the input data.
We further provided a set of noncoding potential scores,which can be used to identify, evaluate and characterizenovel ncRNAs. By integrating complementary features, ourmethod is able to cover all transcribed regions (includingunconserved genomic regions). It also does not require thefull-length transcripts being assembled, because the scorecalculation is based on bin level (100nt) (Supplemental Fig-ure S30 and Supplemental Table S10). We used only thewell-classified ncRNAs (canonical ncRNAs) to define thenoncoding potential, because many annotated lncRNAsare not well validated. Ribosome was also observed onmany lncRNAs (39), which indicates that some lncRNA re-gions may have coding potential. Therefore, our noncod-ing potential score might not predict some novel types ofncRNAs, because it was trained on the feature pattern ofcertain types of ncRNAs. Still, we have demonstrated thatwe could identify local regions with certain noncoding po-tential scores on ∼70% of the annotated human lncRNAtranscripts (Figure 6, Supplemental Table S9).
One drawback of RNAfeature is that it takes a largeamount of input data, which require a fairly large amountof pre-processing work. We therefore provide the 10 selectedfeatures and their computed values along the 4 transcrip-tomes (human, mouse, worm and fly) as a resource for fu-ture studies of lncRNAs, eliminating the need for repeatingall the data processing work we have performed.
Based on our results in model organisms, we also sug-gest the 10-feature data to be curated and sequenced for thenovel ncRNA identification, evaluation and characteriza-
tion in other species. In the future, as more data that providenovel information about ncRNAs are produced, such as ri-bosome profiling (39) and whole genome structure profiling(40,41), we will keep updating the set of common featuresaccordingly and explore other potential use of them.
AVAILABILITY
All the data (i.e. noncoding potential scores) are integratedas a unified resource at http://Rnafeature.ncrnalab.org/.
SUPPLEMENTARY DATA
Supplementary Data are available at NAR Online.
ACKNOWLEDGMENTS
We thank Jiapei Yuan, Yang Wu, Boqin Hu, Yang Yang,Yuchuan Wang, Le Xu, Weiyi Li, Zhengyu Liang, PeipeiYin, Zhihang Fan, Hui Zheng, Junpei Umetsu and Xin-qiang Ding for downloading and processing the raw data.We thank Jingyi Li, Yang Yang, Yu Liu, Luyun Wu for theirhelp on editing the manuscript.
FUNDING
National Key Basic Research Program [2012CB316503];National High-tech Research and Development Pro-gram of China [2014AA021103]; National Natural Sci-ence Foundation of China [31271402, 31100601, 91019016,31361163004]; National Institutes of Health [HG001696,ES017166 to M.Q.Z.]; Hong Kong Research Grants Coun-cil Early Career Scheme [419612 to K.Y.]. Funding foropen access: National Natural Science Foundation of China[31271402].Conflict of interest statement. None declared.
REFERENCES1. Gerstein,M.B., Rozowsky,J., Yan,K.-K., Wang,D., Cheng,C.,
Brown,J.B., Davis,C.A., Hillier,L., Sisu,C., Li,J.J. et al. (2014)Comparative analysis of the transcriptome across distant species.Nature, 512, 445–448.
2. Fatica,A. and Bozzoni,I. (2014) Long non-coding RNAs: new playersin cell differentiation and development. Nat. Rev. Genet., 15, 7–21.
3. Lee,C. and Kikyo,N. (2012) Strategies to identify long noncodingRNAs involved in gene regulation. Cell Biosci., 2, 37.
4. Kong,L., Zhang,Y., Ye,Z.Q., Liu,X.Q., Zhao,S.Q., Wei,L. andGao,G. (2007) CPC: assess the protein-coding potential of transcriptsusing sequence features and support vector machine. Nucleic AcidsRes., 35, W345–349.
5. Lin,M.F., Jungreis,I. and Kellis,M. (2011) PhyloCSF: a comparativegenomics method to distinguish protein coding and non-codingregions. Bioinformatics, 27, i275–282.
6. Washietl,S., Findeiss,S., Muller,S.A., Kalkhof,S., von Bergen,M.,Hofacker,I.L., Stadler,P.F. and Goldman,N. (2011) RNAcode: robustdiscrimination of coding and noncoding regions in comparativesequence data. RNA, 17, 578–594.
7. Guttman,M., Amit,I., Garber,M., French,C., Lin,M.F., Feldser,D.,Huarte,M., Zuk,O., Carey,B.W., Cassady,J.P. et al. (2009) Chromatinsignature reveals over a thousand highly conserved large non-codingRNAs in mammals. Nature, 458, 223–227.
8. Guttman,M. and Rinn,J.L. (2012) Modular regulatory principles oflarge non-coding RNAs. Nature, 482, 339–346.
by guest on February 5, 2015http://nar.oxfordjournals.org/
Dow
nloaded from

114 Nucleic Acids Research, 2015, Vol. 43, No. 1
9. Lu,Z.J., Yip,K.Y., Wang,G., Shou,C., Hillier,L.W., Khurana,E.,Agarwal,A., Auerbach,R., Rozowsky,J., Cheng,C. et al. (2011)Prediction and characterization of noncoding RNAs in C. elegans byintegrating conservation, secondary structure, and high-throughputsequencing and array data. Genome Res., 21, 276–285.
10. Lv,J., Liu,H., Huang,Z., Su,J., He,H., Xiu,Y., Zhang,Y. and Wu,Q.(2013) Long non-coding RNA identification over mouse braindevelopment by integrative modeling of chromatin and genomicfeatures. Nucleic Acids Res., 41, 10044–10061.
11. Ramos,A.D., Diaz,A., Nellore,A., Delgado,R.N., Park,K.Y.,Gonzales-Roybal,G., Oldham,M.C., Song,J.S. and Lim,D.A. (2013)Integration of genome-wide approaches identifies lncRNAs of adultneural stem cells and their progeny in vivo. Cell Stem Cell, 12,616–628.
12. Gerstein,M.B., Lu,Z.J., Van Nostrand,E.L., Cheng,C., Arshinoff,B.I.,Liu,T., Yip,K.Y., Robilotto,R., Rechtsteiner,A., Ikegami,K. et al.(2010) Integrative analysis of the Caenorhabditis elegans genome bythe modENCODE project. Science, 330, 1775–1787.
13. Granitto,P.M., Furlanello,C., Biasioli,F. and Gasperi,F. (2006)Recursive feature elimination with random forest for PTR-MSanalysis of agroindustrial products. Chemom. Intell. Lab. Syst., 83,83–90.
14. Harikumar,G., Couvreur,C. and Bresler,Y. (1998) Acoustics, speechand signal processing. Proceedings of the 1998 IEEE InternationalConference on IEEE, Vol. 3, pp. 1877–1880.
15. Cabili,M.N., Trapnell,C., Goff,L., Koziol,M., Tazon-Vega,B.,Regev,A. and Rinn,J.L. (2011) Integrative annotation of human largeintergenic noncoding RNAs reveals global properties and specificsubclasses. Genes Dev., 25, 1915–1927.
16. Di,C., Yuan,J., Wu,Y., Li,J., Lin,H., Hu,L., Zhang,T., Qi,Y.,Gerstein,M.B., Guo,Y. et al. (2014) Characterization ofstress-responsive lncRNAs in Arabidopsis thaliana by integratingexpression, epigenetic and structural features. The PlantJ ournal, 80,848–861.
17. Zhang,Y., Liu,T., Meyer,C.A., Eeckhoute,J., Johnson,D.S.,Bernstein,B.E., Nusbaum,C., Myers,R.M., Brown,M., Li,W. et al.(2008) Model-based analysis of ChIP-Seq (MACS). Genome Biol., 9,R137.
18. Bonnet,E., Wuyts,J., Rouze,P. and Van de Peer,Y. (2004) Evidencethat microRNA precursors, unlike other non-coding RNAs, havelower folding free energies than random sequences. Bioinformatics,20, 2911–2917.
19. Nawrocki,E.P., Kolbe,D.L. and Eddy,S.R. (2009) Infernal 1.0:inference of RNA alignments. Bioinformatics, 25, 1335–1337.
20. Gruber,A.R., Findeiss,S., Washietl,S., Hofacker,I.L. and Stadler,P.F.(2010) Rnaz 2.0: improved noncoding RNA detection. Pac. Symp.Biocomput., 15, 69–79.
21. Giannopoulou,E.G. and Elemento,O. (2013) Inferringchromatin-bound protein complexes from genome-wide bindingassays. Genome Res., 23, 1295–1306.
22. Duret,L. and Galtier,N. (2009) Biased gene conversion and theevolution of mammalian genomic landscapes. Annu. Rev. GenomicsHum. Genet., 10, 285–311.
23. Wang,J., Zhuang,J., Iyer,S., Lin,X., Whitfield,T.W., Greven,M.C.,Pierce,B.G., Dong,X., Kundaje,A., Cheng,Y. et al. (2012) Sequencefeatures and chromatin structure around the genomic regions boundby 119 human transcription factors. Genome Res., 22, 1798–1812.
24. Johnsson,P., Lipovich,L., Grander,D. and Morris,K.V. (2014)Evolutionary conservation of long non-coding RNAs; sequence,structure, function. Biochim. Biophys. Acta, 1840, 1063–1071.
25. Mikkelsen,T.S., Ku,M., Jaffe,D.B., Issac,B., Lieberman,E.,Giannoukos,G., Alvarez,P., Brockman,W., Kim,T.K., Koche,R.P.et al. (2007) Genome-wide maps of chromatin state in pluripotentand lineage-committed cells. Nature, 448, 553–560.
26. Gardner,P.P., Daub,J., Tate,J.G., Nawrocki,E.P., Kolbe,D.L.,Lindgreen,S., Wilkinson,A.C., Finn,R.D., Griffiths-Jones,S.,Eddy,S.R. et al. (2009) Rfam: updates to the RNA families database.Nucleic Acids Res., 37, D136–D140.
27. Nawrocki,E.P. and Eddy,S.R. (2013) Infernal 1.1: 100-fold fasterRNA homology searches. Bioinformatics, 29, 2933–2935.
28. Derrien,T., Johnson,R., Bussotti,G., Tanzer,A., Djebali,S.,Tilgner,H., Guernec,G., Martin,D., Merkel,A., Knowles,D.G. et al.(2012) The GENCODE v7 catalog of human long noncoding RNAs:analysis of their gene structure, evolution, and expression. GenomeRes., 22, 1775–1789.
29. Wilusz,J.E., Freier,S.M. and Spector,D.L. (2008) 3′ end processing ofa long nuclear-retained noncoding RNA yields a tRNA-likecytoplasmic RNA. Cell, 135, 919–932.
30. Shiraki,T., Kondo,S., Katayama,S., Waki,K., Kasukawa,T.,Kawaji,H., Kodzius,R., Watahiki,A., Nakamura,M., Arakawa,T.et al. (2003) Cap analysis gene expression for high-throughputanalysis of transcriptional starting point and identification ofpromoter usage. Proc. Natl. Acad. Sci. U.S.A., 100, 15776–15781.
31. Pelechano,V., Wei,W. and Steinmetz,L.M. (2013) Extensivetranscriptional heterogeneity revealed by isoform profiling. Nature,497, 127–131.
32. Sunwoo,H., Dinger,M.E., Wilusz,J.E., Amaral,P.P., Mattick,J.S. andSpector,D.L. (2009) MEN epsilon/beta nuclear-retained non-codingRNAs are up-regulated upon muscle differentiation and are essentialcomponents of paraspeckles. Genome Res., 19, 347–359.
33. Nam,J.W. and Bartel,D.P. (2012) Long noncoding RNAs in C.elegans. Genome Res., 22, 2529–2540.
34. Yang,L., Duff,M.O., Graveley,B.R., Carmichael,G.G. and Chen,L.L.(2011) Genomewide characterization of non-polyadenylated RNAs.Genome Biol., 12, R16.
35. Xu,C., Yang,M., Tian,J., Wang,X. and Li,Z. (2011) MALAT-1: along non-coding RNA and its important 3′ end functional motif incolorectal cancer metastasis. Int. J. Oncol., 39, 169–175.
36. Hafner,M., Landthaler,M., Burger,L., Khorshid,M., Hausser,J.,Berninger,P., Rothballer,A., Ascano,M. Jr, Jungkamp,A.C.,Munschauer,M. et al. (2010) Transcriptome-wide identification ofRNA-binding protein and microRNA target sites by PAR-CLIP.Cell, 141, 129–141.
37. Kishore,S., Jaskiewicz,L., Burger,L., Hausser,J., Khorshid,M. andZavolan,M. (2011) A quantitative analysis of CLIP methods foridentifying binding sites of RNA-binding proteins. Nat. Methods, 8,559–564.
38. Haussecker,D., Huang,Y., Lau,A., Parameswaran,P., Fire,A.Z. andKay,M.A. (2010) Human tRNA-derived small RNAs in the globalregulation of RNA silencing. RNA, 16, 673–695.
39. Ingolia,N.T. (2014) Ribosome profiling: new views of translation,from single codons to genome scale. Nat. Rev. Genet., 15, 205–213.
40. Ding,Y., Tang,Y., Kwok,C.K., Zhang,Y., Bevilacqua,P.C. andAssmann,S.M. (2014) In vivo genome-wide profiling of RNAsecondary structure reveals novel regulatory features. Nature, 505,696–700.
41. Yang,Y., Umetsu,J. and Lu,Z.J. (2014) Global signatures of proteinbinding on structured RNAs in Saccharomyces cerevisiae. Sci. China.Life Sci., 57, 22–35.
by guest on February 5, 2015http://nar.oxfordjournals.org/
Dow
nloaded from