interfering RNAs in Flock House virus - PLOS
31
RESEARCH ARTICLE Parallel ClickSeq and Nanopore sequencing elucidates the rapid evolution of defective- interfering RNAs in Flock House virus Elizabeth Jaworski 1 , Andrew Routh 1,2 * 1 Department of Biochemistry and Molecular Biology, The University of Texas Medical Branch, Galveston, TX, United States of America, 2 Sealy Center for Structural Biology and Molecular Biophysics, University of Texas Medical Branch, Galveston, Texas, United States of America * [email protected] Abstract Defective-Interfering RNAs (DI-RNAs) have long been known to play an important role in virus replication and transmission. DI-RNAs emerge during virus passaging in both cell-cul- ture and their hosts as a result of non-homologous RNA recombination. However, the princi- ples of DI-RNA emergence and their subsequent evolution have remained elusive. Using a combination of long- and short-read Next-Generation Sequencing, we have characterized the formation of DI-RNAs during serial passaging of Flock House virus (FHV) in cell-culture over a period of 30 days in order to elucidate the pathways and potential mechanisms of DI- RNA emergence and evolution. For short-read RNAseq, we employed ‘ClickSeq’ due to its ability to sensitively and confidently detect RNA recombination events with nucleotide reso- lution. In parallel, we used the Oxford Nanopore Technologies’s (ONT) MinION to resolve full-length defective and wild-type viral genomes. Together, these accurately resolve both rare and common RNA recombination events, determine the correlation between recombi- nation events, and quantifies the relative abundance of different DI-RNAs throughout pas- saging. We observe the formation of a diverse pool of defective RNAs at each stage of viral passaging. However, many of these ‘intermediate’ species, while present in early stages of passaging, do not accumulate. After approximately 9 days of passaging we observe the rapid accumulation of DI-RNAs with a correlated reduction in specific infectivity and with the Nanopore data find that DI-RNAs are characterized by multiple RNA recombination events. This suggests that intermediate DI-RNA species are not competitive and that multiple recombination events interact epistatically to confer ‘mature’ DI-RNAs with their selective advantage allowing for their rapid accumulation. Alternatively, it is possible that mature DI- RNA species are generated in a single event involving multiple RNA rearrangements. These insights have important consequences for our understanding of the mechanisms, determinants and limitations in the emergence and evolution of DI-RNAs. PLOS Pathogens | https://doi.org/10.1371/journal.ppat.1006365 May 5, 2017 1 / 31 a1111111111 a1111111111 a1111111111 a1111111111 a1111111111 OPEN ACCESS Citation: Jaworski E, Routh A (2017) Parallel ClickSeq and Nanopore sequencing elucidates the rapid evolution of defective-interfering RNAs in Flock House virus. PLoS Pathog 13(5): e1006365. https://doi.org/10.1371/journal.ppat.1006365 Editor: Adam S. Lauring, University of Michigan, UNITED STATES Received: December 12, 2016 Accepted: April 19, 2017 Published: May 5, 2017 Copyright: © 2017 Jaworski, Routh. This is an open access article distributed under the terms of the Creative Commons Attribution License, which permits unrestricted use, distribution, and reproduction in any medium, provided the original author and source are credited. Data Availability Statement: All raw HiSeq data and demultiplexed MinION nanopore data passing quality filters (comprising 2D, template and complement strands) associated with this manuscript are available on the SRA NCBI archive with Accession number: SRP094723; and BioProject number: PRJNA352872. Funding: This work was supported by start-up funds from the University of Texas Medical Branch, Galveston to AR and a University of Texas System Rising STARs Award to AR. The funders had no role in study design, data collection and analysis,
-
Upload
khangminh22 -
Category
Documents
-
view
1 -
download
0
Transcript of interfering RNAs in Flock House virus - PLOS
RESEARCH ARTICLE
Parallel ClickSeq and Nanopore sequencing
elucidates the rapid evolution of defective-
interfering RNAs in Flock House virus
Elizabeth Jaworski1, Andrew Routh1,2*
1 Department of Biochemistry and Molecular Biology, The University of Texas Medical Branch, Galveston,
TX, United States of America, 2 Sealy Center for Structural Biology and Molecular Biophysics, University of
Texas Medical Branch, Galveston, Texas, United States of America
Abstract
Defective-Interfering RNAs (DI-RNAs) have long been known to play an important role in
virus replication and transmission. DI-RNAs emerge during virus passaging in both cell-cul-
ture and their hosts as a result of non-homologous RNA recombination. However, the princi-
ples of DI-RNA emergence and their subsequent evolution have remained elusive. Using a
combination of long- and short-read Next-Generation Sequencing, we have characterized
the formation of DI-RNAs during serial passaging of Flock House virus (FHV) in cell-culture
over a period of 30 days in order to elucidate the pathways and potential mechanisms of DI-
RNA emergence and evolution. For short-read RNAseq, we employed ‘ClickSeq’ due to its
ability to sensitively and confidently detect RNA recombination events with nucleotide reso-
lution. In parallel, we used the Oxford Nanopore Technologies’s (ONT) MinION to resolve
full-length defective and wild-type viral genomes. Together, these accurately resolve both
rare and common RNA recombination events, determine the correlation between recombi-
nation events, and quantifies the relative abundance of different DI-RNAs throughout pas-
saging. We observe the formation of a diverse pool of defective RNAs at each stage of viral
passaging. However, many of these ‘intermediate’ species, while present in early stages of
passaging, do not accumulate. After approximately 9 days of passaging we observe the
rapid accumulation of DI-RNAs with a correlated reduction in specific infectivity and with the
Nanopore data find that DI-RNAs are characterized by multiple RNA recombination events.
This suggests that intermediate DI-RNA species are not competitive and that multiple
recombination events interact epistatically to confer ‘mature’ DI-RNAs with their selective
advantage allowing for their rapid accumulation. Alternatively, it is possible that mature DI-
RNA species are generated in a single event involving multiple RNA rearrangements.
These insights have important consequences for our understanding of the mechanisms,
determinants and limitations in the emergence and evolution of DI-RNAs.
PLOS Pathogens | https://doi.org/10.1371/journal.ppat.1006365 May 5, 2017 1 / 31
a1111111111
a1111111111
a1111111111
a1111111111
a1111111111
OPENACCESS
Citation: Jaworski E, Routh A (2017) Parallel
ClickSeq and Nanopore sequencing elucidates the
rapid evolution of defective-interfering RNAs in
Flock House virus. PLoS Pathog 13(5): e1006365.
https://doi.org/10.1371/journal.ppat.1006365
Editor: Adam S. Lauring, University of Michigan,
UNITED STATES
Received: December 12, 2016
Accepted: April 19, 2017
Published: May 5, 2017
Copyright: © 2017 Jaworski, Routh. This is an
open access article distributed under the terms of
the Creative Commons Attribution License, which
permits unrestricted use, distribution, and
reproduction in any medium, provided the original
author and source are credited.
Data Availability Statement: All raw HiSeq data
and demultiplexed MinION nanopore data passing
quality filters (comprising 2D, template and
complement strands) associated with this
manuscript are available on the SRA NCBI archive
with Accession number: SRP094723; and
BioProject number: PRJNA352872.
Funding: This work was supported by start-up
funds from the University of Texas Medical Branch,
Galveston to AR and a University of Texas System
Rising STARs Award to AR. The funders had no
role in study design, data collection and analysis,

Author summary
Defective RNAs are versions of a viral genome that arise naturally during viral infections
but have been truncated or rearranged by non-homologous recombination. While not
encoding for functional viruses, they can be amplified and co-passaged with the wild-type
virus, effectively parasitizing the normal viral machinery. Some defective RNAs can repli-
cate so successfully so as to subdue the replication of the wild-type virus, forming a ‘Defec-tive-Interfering RNA’ (DI-RNA). As a result, DI-RNAs may promote the establishment of
chronic viral infections, may prolong the period during which the host is infectious, and
may even be exploited as antiviral therapies or vaccines. Therefore, understanding the rea-
sons and mechanisms of how DI-RNAs are formed and subsequently evolve is important.
Here, we sought to characterize these processes by passaging Flock House virus (a highly
tractable and well-characterized model RNA virus) in cell-culture for approximately one
month and sequencing the viral genomes every three days using a combination of ‘Click-
Seq’ (to resolve recombination events with nucleotide resolution) and the Oxford Nano-
pore Technologies MinION (to characterize full-length and defective genomes). This
provides a highly detailed characterization of the pathways of DI-RNA emergence and
their progression to dominance over the wild-type viral genome.
Introduction
RNA viruses are extremely diverse and rapidly evolving. Their RNA-dependent RNA poly-
merases (RdRps) readily generate single-nucleotide variants whilst lacking proof-reading
capabilities[1]. RdRps are also highly prone to RNA recombination[2]; either through tem-
plate-switching[3] or through non-replicative end-joining[4]. RNA recombination has been
demonstrated to be responsible for the emergence of new strains or species of viruses such
as rhinoviruses[5] and dengue virus[6], and the formation of vaccine-derived poliovirus[7].
Non-homologous RNA recombination is also responsible for the generation of defective
RNAs[8, 9]. These are versions of the parental viral genome that can arise naturally during the
course of viral passaging but have been truncated and rearranged by RNA recombination.
While not encoding for functional viruses themselves, they can be amplified and co-passaged
with the help of the wild-type ‘helper’ virus that provides the necessary machinery for replica-
tion, encapsidation and transmission. A defective RNA that accumulates to such an extent as
to compete with or otherwise attenuate the replication of the parental virus is known as a
Defective-Interfering RNA (DI-RNA)[10].
DI-RNAs can attenuate the viral infection via a variety of proposed mechanisms such as the
saturation of the viral replicative machinery, sequestration of essential cellular cofactors, and/
or induction of innate immune responses[10–14]. DI-RNAs have been well characterized for a
number of RNA viruses as they provide valuable tools to molecular virologists by revealing
conserved regions and functional domains in the RNA genome such as binding sites for viral
or host factors. Moreover, characterizing recombination loci reveal the mechanisms of recom-
bination, impacting our understanding of viral evolution [8, 15, 16].
Until recently [17], due to difficulties in capturing and characterizing DI-RNAs in vivo,
DI-RNAs were considered to be a curious epiphenomenon of cell-culturing practices. As a
result, our appreciation of the diversity of DI-RNAs and the range of situations in which they
could play a role was greatly limited. Increasingly, due to the use and sensitivity of Next-Gen-
eration Sequencing (NGS) technologies, DI-RNAs have been observed in a multitude of viral
systems under laboratory conditions (e.g. SARS coronavirus[18], HIV[19]), in clinical settings
Pathways of FHV defective RNA evolution by ClickSeq and the MinION
PLOS Pathogens | https://doi.org/10.1371/journal.ppat.1006365 May 5, 2017 2 / 31
decision to publish, or preparation of the
manuscript.
Competing interests: The authors have declared
that no competing interests exist.
(e.g. measles[20], dengue[21] and chronic hepatitis C[22]) and in metagenomic or ‘wild’ sam-
ples (e.g. West Nile virus[23], influenza virus[24]). Despite this burgeoning range of hosts for
DI-RNAs, limitations in NGS technologies including high artifactual recombination rates,
short reads and a limited range of bioinformatics tools tailored to viral RNA recombination
discovery has hindered our ability to detect and characterize DI-RNAs in complex or clinical
samples.
Flock House virus (FHV) is a positive-sense single-stranded RNA (+ssRNA) virus originally
isolated from grass grubs in New Zealand[25] and is perhaps the best-studied Alphanodavirusfrom the Nodaviridae family. FHV infects Drosophila flies and cells in culture as well as medi-
cally important genera of insects including mosquitos, (Anopheles gambiae), the tsetse fly
(Glossina morsitans morsitans Westwood), and the Chagas vector (Rhodnius prolixus Stal)[26].
Infection of these organisms by FHV has been demonstrated to have similar characteristics in
terms of viral titer, virus dissemination and mortality as has been shown for fruit fly infections.
FHV provides an excellent model system to study +ssRNA virus evolution by virtue of having
one of the smallest known eukaryotic virus genomes[27]. Moreover, the viral life-cycle and
details of the molecular biology of virus particle assembly, cell entry and particle disassembly
are highly-characterized. FHV contains two genomic RNAs. RNA1 (3107 nts) encodes the
viral RdRp and RNA2 (1400 nts) encodes the viral capsid protein. RNA1 also expresses a small
sub-genomic RNA, called RNA3, that encodes the B2 protein responsible for inhibition of the
anti-viral RNAi machinery[28]. FHV has been demonstrated to form DI-RNAs in multiple
independent studies spanning three decades both in cell-culture[8, 26, 29–32] and in Drosoph-ila melanogaster[33]. Many of these studies characterized individual DI-RNA genomes
through sub-cloning and Sanger sequencing. Intriguingly, many of these DI-RNAs are highly
similar. This indicates that either the DI-RNAs have emerged due to a common mechanism of
formation or the presence of a common selectivity filter, or both. Our recent NGS studies of
RNA recombination in FHV revealed a diverse array of RNA recombination events, suggesting
that the genomic landscape of DI-RNAs is highly dynamic and likely contributes significantly
to the diversity of viral genomes that form the viral quasi-species[34]. Despite these findings,
studies to-date present only a single snap-shot of the DI-RNA genome landscape and do not
capture the pathways of their emergence and evolution nor characterize any intermediate
DI-RNA species that might arise during these processes.
In order to resolve the potential mechanisms of DI-RNA emergence and elucidate the evo-
lutionary pathways that lead to the formation of ‘mature’ DI-RNAs, we performed high-titer
serial passaging of FHV in cell culture and characterized the encapsidated RNA using RNAseq.
We used Illumina HiSeq sequencing of ClickSeq generated libraries to provide a high-resolu-
tion and high-confidence quantification of individual recombination events. We combined
this information with long-read Oxford Nanopore Technologies’s (ONT) MinION sequencing
to resolve the topology of full-length and defective RNA genomes. By combining these data,
we aimed to determine the correlation of recombination events within single RNA virus
genomes, characterize the distribution of defective RNA genomes, and determine the exact
make-up of DI-RNAs during serial passaging of FHV in cell culture.
We recently developed the ‘ClickSeq’ method for RNAseq that uses copper-catalyzed
alkyne-azide cycloaddition (CuAAC), a click-chemistry reaction, for RNAseq library synthesis
[35]. ClickSeq provides a robust platform on which to study RNA recombination in RNA
viruses. Artifactual recombination is a common contaminant in NGS library generation and
can easily obscure rare or non-canonical recombinant species. ClickSeq does not require tem-
plate fragmentation and replaces enzymatic ligation steps commonly required in NGS library
generation with click-chemistry. ClickSeq works by introducing small amounts of azido-nucle-
otides (AzNTPs) into RT-PCR reactions to generate azido-terminated cDNA transcripts.
Pathways of FHV defective RNA evolution by ClickSeq and the MinION
PLOS Pathogens | https://doi.org/10.1371/journal.ppat.1006365 May 5, 2017 3 / 31
These cDNA fragments are subsequently mixed with alkyne-labelled DNA adaptors. The addi-
tion of a copper catalyst results in the ‘click-ligation’ of the two chemically-functionalized
DNA substrates to produce an unnatural triazole-linked single-stranded DNA molecule[36].
ClickSeq prevents template switching during RT-PCR as well as non-specific ligation of RNA
fragments. We demonstrated that ClickSeq reduces artifactual recombination to fewer than 3
events per million mapped reads[35]. As a result, ClickSeq provides a superior method for the
detection of DI-RNAs and RNA recombination events.
The Oxford Nanopore Technologies’s (ONT) MinION is a small handheld sequencing
device[37] poised to revolutionize the next-generation sequencing field by providing real-
time, high-throughput and long-range (over 882 kbp[38]) sequences of DNA samples with
minimal sample prep. ONT nanopore sequencing has been used to rapidly characterize virus
genomes from metagenomic samples[39], in the midst of Ebola virus outbreaks[40], and in
targeted studies aimed at characterizing sequence variations within influenza virus samples
[41]. Highly parallel direct RNA sequencing using Nanopore technology was also recently
reported[42]. Due to the higher error-rate[43] of the nanopore sequencing technology com-
pared to other RNAseq platforms, the exact identity of recombination events within single-
molecule genomes may be inaccurate. However, long-read nanopore reads provide the distinct
advantage of being able to sequence full-length cDNA copies of RNA virus genomes and thus
can resolve multiple recombination events within a single RNA virus genome.
This study provides a comprehensive analysis of the steps and pathways governing DI-RNA
emergence and evolution starting from a plasmid-driven inoculum through to a highly-pas-
saged sample. By combining short-read and long-read sequencing technologies, we determine
both the exact identity of RNA recombination sites and their correlation within the viral qua-
sispecies. We find little evidence for the accumulation of intermediate defective RNA species
that contain either only one, or smaller, deletions during the course of passaging. Rather, fully
formed ‘mature’ DI-RNAs that are characterized by two to three deletions between a limited
number of positions in each of the FHV genomic RNAs appear after approximately 9 days of
viral passaging and accumulate rapidly. The accumulation of DI-RNAs corresponds with a
reduction in the specific infectivity of the viral samples in each passage. This implies that par-
tially formed DI-RNA species are not competitive and cannot accumulate in the manner that
mature DI-RNA species do, perhaps due to the epistatic interaction of multiple recombination
events. Alternatively, the formation of mature DI-RNAs may occur in a single step involving
multiple simultaneous genome rearrangements.
Methods
Cell culture and virus passaging
D. melanogaster (S2) cells were grown at 28˚C in Schneider’s Drosophila Media supplemented
with 10% fetal bovine serum and 1X Penicillin-Streptomycin using standard laboratory proce-
dures. To generate the initial Flock House virus inoculum, S2 cells were plated at 50–70% con-
fluency in a six well plate and were transfected with 2.5μg of pMT plasmid containing FHV
RNA1 (NC_004146) and 2.5μg of pMT plasmid containing FHV RNA2 (NC_004144) using
Lipofectamine 3000 Transfection Reagent as per the manufacturer’s protocol. Plasmid tran-
scription was induced 24 hours post transfection with the addition of 50mM CuSO4. Virus
was then allowed to propagate for 3 days post induction. For successive passages (Passages
1–9), S2 cells were grown in T-25 flasks to 70–90% confluency (~1 x 10⁷ cells), then infected
with 1mL of viral inoculum from the previous passage. Virus was grown for 3 days, then frac-
tions were harvested for viral purification or inoculation of the next passage.
Pathways of FHV defective RNA evolution by ClickSeq and the MinION
PLOS Pathogens | https://doi.org/10.1371/journal.ppat.1006365 May 5, 2017 4 / 31

Virus isolation and purification
To purify virus from each consecutive serial passage, cells and supernatant were subjected to a
freeze-thaw cycle in the presence of 1% Triton X-100 to release viral particles from infected
cells. Virus particles were then purified on a 30% sucrose cushion by spinning the cell lysate at
40,000 RPM for 2.5 hours. The viral pellet was resuspended in 10mM Tris (pH 7.4). Virus was
further purified by applying resuspended virus atop a 10–40% sucrose gradient and spun at
40,000 RPM for 1.5 hours. The viral band was collected and subsequently treated with 1 Unit
DNase and 1 Unit RNase and incubated at room temperature for at least one hour to remove
any cellular nucleic acids not protected by the viral capsid. The virus sample was concentrated
on a 100,000 NMWL centrifugal filter column and washed with at least 2 volumes of 10mM
Tris pH 7.4. Finally, encapsidated viral RNA was extracted using a QIAGEN RNeasy Mini Kit
as per the manufacturer’s protocol.
Short-read Illumina sequencing of viral RNA
Next generation sequencing (NGS) libraries were generated using 100ng of RNA using the
‘ClickSeq’ protocol as previously described by Routh et al. [35, 44, 45]. Briefly, cDNA is synthe-
sized through RT-PCR initiated from semi-random (6N) primers containing a partial Illumina
p7 adapter (GTGACTGGAGTTCAGACGTGTGCTCTTCCGATCTNNNNNN) and stochas-
tically terminated by the addition of azido-NTPs (AzNTP) at a ratio of 1:35 AzNTP:dNTPs.
Subsequently, the p5 Click-Adapter (5’-Hexynyl-NNNNAGATCGGAAGAGCGTCGTGTA
GGGAAAGAGTGTAGATCTCGGTGGTCGCCGTATCATT, IDT) was click-ligated onto
the azido-terminated cDNA fragment using copper-catalysed azide-alkyne cycloaddition
(CuAAC) in the presence of TBTA ligand (Lumiprobe) and Vitamin C catalyst in 55% DMSO.
After purifying the click-linked cDNA with a Zymo DNA clean column, 18 cycles of OneTaq
(NEB) PCR amplification adds the remainder of the p7 adapter along with the desired TruSeq
index sequence. PCR product was cleaned again with a Zymo DNA clean column to remove
excess primers and then ran on a 1–2% precast agarose e-gel (Invitrogen, E-Gel Electrophore-
sis System). cDNA libraries between 400 to 700bp were excised corresponding to insert sizes
of 250-550bp and cleaned using the Zymo Research Gel DNA Recovery Kit. Final cDNA
libraries were quantified using a QuBit fluorimeter (Life Tech) and loaded on a HiSeq 1500
single read rapid run flowcell for 1x150 reads and 7 nucleotides of the index. FHV libraries
used for the triplicate study shown in S2 Fig were sequenced on a MiSeq platform with v3
chemistry for 600 cycles (2x300). Reads were trimmed to 150nts prior to analysis to emulate
the libraries sequenced on the HiSeq.
Illumina data analysis and processing
Raw reads were processed by first removing the Illumina TruSeq adaptor using Cutadapt [46]
with default parameters. Next, the first 6 nucleotides (corresponding to the random nucleo-
tides and triazole-linkage included in the Click-Adaptor) were trimmed and any reads that
contained nucleotides with a PHRED score <20 were removed using the FASTX toolkit(http://hannonlab.cshl.edu/fastx_toolkit/). The remaining reads were aligned end-to-end with
Bowtie (v1.0.1) [47] (command line parameters: -v 3 –-best) first to the FHV genome
(NC_004414 and NC_004146) and next to host D. melanogaster genome (fb5_22). The re-
maining unmapped reads were processed to identify recombination events using the python
script ‘ViReMa’ (Viral Recombination Mapper)[32] (command line parameters:--N 1 --X5 --Seed 25 --Host_Seed30 --Defuzz0 --MicroInDel5). The frequency of a
specific recombination event is approximated by dividing the number of reads mapping to this
Pathways of FHV defective RNA evolution by ClickSeq and the MinION
PLOS Pathogens | https://doi.org/10.1371/journal.ppat.1006365 May 5, 2017 5 / 31

recombination (N) by N plus the average of the number of reads mapping to the wild-type
genome at each of the recombination coordinates.
Long-read Oxford Nanopore technologies’s MinION sequencing
The Oxford Nanopore Technologies’s (ONT) MinION and flowcells were acquired as part of
the ONT early-access program. To prepare sequencing libraries for the MinION, 50ng of RNA
was reverse transcribed using RNA specific primers that were complimentary to the 3’ end of
the respective genome (RNA1_RP: ACCTCTGCCCTTTCGGGCTA or RNA2_RP: ACCTT
AGTCTGTTGACTTAA). cDNA was then amplified using the standard Phusion (NEB) PCR
protocol using genome specific primers (RNA1_FP: GTTTTCGAAACAAATAAAAC or
RNA2_FP: GTAAACAATTCCAAGTTCCA) for 19 cycles. Excess primers were removed
from the PCR product using AMPure XP beads (Beckman Coulter) at a ratio of 1:1 AMPure
bead:PCR product. Samples were then barcoded and prepared following the manufacture’s
protocol (R9 Native Barcoding Kit I and Nanopore Sequencing Kit) with adjustments to tailor
input cDNA quantities. A target of 1ug of fragmented DNA at approximately 8’000 nts is con-
sidered optimal for library generation using this kit. The input amounts for RNA1 (3107 bp)
and RNA2 (1400 bp) were thus adjusted to 192ng and 88ng respectively and combined in
46uL water to maintain optimal DNA end molarity. After ligation of barcodes, equal amount
of each DNA library (9 samples in total) were pooled and loaded onto a MinION MkIB device
equipped with an R9 flow cell. The MinKNOW control software was used to select a 48-hour
sequencing protocol and was allowed to proceed for at least 36 hours, until high-quality data
accumulation ceased. Raw data was uploaded automatically by Metrichor software for cloud-
based base-calling using default settings and quality filtering for 2-dimensional reads. Reads
were extracted from HDF5 format files (fast5) using poretools[48].
ONT nanopore data processing and alignment
Full-length ONT reads were mapped to the Flock House virus genome using the pacbio wrapper
from the BBMAP v36 suite (command line parameters: fastareadlen= 6000 vslow= tmaxindel= 3100 minid = 0.5 local = f ignorebadquality= t usequality=f). Alignment SAM files were visualized using the Tablet sequence viewer [49]. SAM files were
filtered to ensure that MinION reads mapped from the first 25 nts to the final 25 nts of the re-
ference genome (accounting for deletions and insertions), due to the presence of truncated
nanopore reads and mis-priming during the cDNA PCR amplification steps. Errors including
substitutions, insertions and deletions were counted using the samtools[50] mpileup command
and error rates at each position were calculated by dividing this value by the read depth at this
position (S5 Fig). Insertion and deletion events longer that 25 nts were extracted using the
CIGAR string of the SAM files using simple in-house scripts. For recombination sites containing
‘fuzz’, where nucleotides surrounding the putative recombination events are the same for both
the acceptor and donor sites, the recombination event was reported as occurring in the middle
of the ‘fuzzy’ region, or at the 5’ side of the middle two nucleotides in the orientation of the refer-
ence if the fuzzy site contained an even number of residues. This is the same methodology as
employed in the ViReMa script[32] used to map recombination event in the ClickSeq data.
Insertion events and soft-pads longer than 100 nts were extracted and their nucleotide sequence
was analyzed using an online BLASTn search to determine their identity.
Annotation of full-length defective RNAs and recombination events
To annotate the defective genomes detected by MinION nanopore sequencing or recombina-
tion events detected by ClickSeq, we use underscores ‘_’ to denote continued mapping, and
Pathways of FHV defective RNA evolution by ClickSeq and the MinION
PLOS Pathogens | https://doi.org/10.1371/journal.ppat.1006365 May 5, 2017 6 / 31

carets ‘^’ to denote a recombination events. For example, “1_317^1091_1242^2301_3107”
indicates an authentic mapping from nt 1 to 317, then a deletion event removing nts 318
through 1090, then another authentic mapping from 1091 to 1242, followed by another dele-
tion removing nts 1243 through 2300, and finally an authentic mapping from nt 2301 to 3107.
Shannon entropy index
The Shannon Entropy Index is given by: HðXÞ ¼ �PN� 1
i¼0piln pi For the ClickSeq data, each
recombination event is treated as independent with its probability determined by dividing the
number of reads mapping to the present recombination event divided by the average coverage
over the whole viral RNA. For the MinION data, each individual read mapping is treated as an
individual event with the frequency determined by dividing the number of identically mapping
reads divided by total mapped reads.
Effective MOI and specific infectivity
Tissue culture infective dose 50 (TCID50) analyses of the supernatants from each passage were
performed using standard protocols [51]. For purified particles of each passage TCID50 was
calculated with slight modifications. Specifically, 1 x 10⁵ cells (S2) per well were plated in 96
well format. Virus samples were quantified by measuring the OD260nm. An OD of 4.15 corre-
sponds to 1mg virus [52], which in turn corresponds to 6.4 x 10¹³ virus particles assuming a
virion mass of 9.4MDa [53]. Purified virus samples were diluted to a starting concentration of
47ng/μL, which corresponds to 3 x 10¹⁰ virus particles per 10μL. These quantities were chosen
as particle-to-PFU ratios for rescued FHV has previously been reported to be 300–400 particles
[26, 52]. Therefore 3 x 10¹⁰ particles per 105 cells corresponds to approximately 1000 PFUs per
cell. Eight serial 10-fold dilutions were subsequently made and added to each column of the
96-well plate (8 replicate wells per dilution), as per standard TCID50 protocols. Virus was
allowed to grow for 4 days after which the number of positive wells exhibiting cytopathic effect
(CPE) were counted. The TCID50 values and effective MOI were calculated using the Reed
and Muench Calculator [51]. We further counted the total number of cells that were present in
each well after infection using a Guava easyCyte HT (Millipore) flow cytometer to provide us
with quantifiable amount of cell death. 50μL from each well was diluted in 150μL PBS and
injected using manufactures’ protocols. The InCyt v3.1 software was used to collect data with
the following parameters: collection time: 30sec; flow rate: 0.59μL/sec; FSC: 16; SSC: 25;
threshold: 0. The region used to determine live cells was based on scattering features of the
negative controls (wells with no viral infection) (S7 Fig).
Accession numbers
All raw Illumina data and demultiplexed MinION nanopore data passing quality filters
(comprising 2D, template and complement strands) associated with this manuscript are
available on the SRA NCBI archive with study number SRP094723 and BioProject number
PRJNA352872.
Results
Serial passaging of Flock House virus
D. melanogaster (S2) cells in culture were transfected with cDNA plasmids containing each
of the Flock House virus genomic RNAs followed by a hepatitis D virus (HDV) ribozyme
sequence. After induction, the HDV ribozyme regenerates the authentic 3’ end of the positive
sense viral RNA, which is thus successfully recognized by the FHV RdRp allowing the
Pathways of FHV defective RNA evolution by ClickSeq and the MinION
PLOS Pathogens | https://doi.org/10.1371/journal.ppat.1006365 May 5, 2017 7 / 31
initiation of viral replication[54]. We choose to initiate replication with this method to ensure
that the starting viral population would be homogeneous containing only the full-length RNAs
derived from the plasmid cDNA. After transfection, the viral inoculum was allowed to amplify
for 3 days (Passage number = P0), after which most cells exhibited cytopathic effect. Subse-
quently, the supernatant from infected cells was collected and a 1mL fraction (10% of the total
volume) was used to infect 10mL of fresh S2 cells in triplicate (Replicates R1, R2, and R3).
Again, after three days, 1mL of the supernatant was harvested and used to infect fresh S2 cells
in series for a total of nine 3-day passages (Passage numbers = P1 –P9). Therefore, one single
inoculum was used to generate three distinct lineages as shown in Fig 1. For each passage and
replicate, including the original inoculum, viral particles were purified over a sucrose cushion
and non-encapsidated genetic material was degraded to ensure that the genetic material subse-
quently analyzed was packaged within the viral capsid. RNA was extracted from the purified
viral particles using standard silica-based spin columns.
Characterization of FHV genomic RNA with short-read ClickSeq
sequencing
ClickSeq libraries[35] were synthesized from the purified viral genomic RNA and sequenced
on an Illumina HiSeq 1500 for 1x150 single-end reads. The inoculum sample was sequenced
on a separate flowcell to all other samples to prevent any cross-contamination from incorrect
demultiplexing. We obtained 1.2–30.6 million reads after trimming and quality filtering for
each passaged sample, and 41.6 million reads for the original inoculum (Table 1 and S1
Table). 1 million reads corresponds to an average coverage of greater than 33’000X across the
FHV genome. Reads were aligned to the FHV genome and the host genome (D. melanogaster,fb5_22) using Bowtie end-to-end mapping [47]. As expected, the majority of the reads aligned
to FHV RNA1 (3107 nts) and FHV RNA2 (1400 nts) in a ratio reflecting the longer length of
RNA1. As we have observed previously [34, 55], 0.3–8.4% of reads correspond to host RNAs
that are encapsidated within the viral particles including mRNAs, ribosomal RNAs and retro-
transposons. Interestingly, the amount of encapsidated host RNA increases modestly through
later passages (S1 Fig).
Subsequently, we further characterized the unmapped reads with the Python script ViReMa(“Virus Recombination Mapper”) [32]. ViReMa is a computational pipeline optimized for
mapping virus recombination junctions in NGS data with nucleotide resolution by dynami-
cally generating moving read segments. ViReMa is sensitive to many types of RNA recombina-
tion events. This includes micro-insertions and deletions (InDels comprising 5 or fewer
nucleotides), duplications, deletions, inter-RNA recombination (denoting recombination
between FHV RNA1 and RNA2) and virus-to-host recombination events, and reports both
the identity and frequency of recombination events. Recombination events that cannot be
unambiguously identified due to unmapped read segments, mismatches occurring near to
putative recombination events, or reads containing fragments of sequencing adaptors are
flagged as ‘other’ (Table 1) [32]. In each genomic RNA we found hundreds of unique recombi-
nation events, reflecting a diverse and complex mutational landscape (S1 Datafile). Broadly,
we see an increase in the total number of recombination events during serial passaging of FHV
and a corresponding increase in the Shannon diversity index (Fig 2A and 2B).
Following these mapping procedures, few reads (0–1.2%, Table 1 and S1 Table) remained
uncharacterized. As in previous studies, these were found to be derived from incorrect demul-
tiplexing of neighboring samples on the HiSeq flow-cell[56] or from contaminants in the
RNAseq library generation[57]. Having accounted for almost all of the reads present in each
dataset, we can be confident that we are capturing the full range of recombination events and/
Pathways of FHV defective RNA evolution by ClickSeq and the MinION
PLOS Pathogens | https://doi.org/10.1371/journal.ppat.1006365 May 5, 2017 8 / 31

or other rearrangements present within each sample and thus are not missing important or
significant events due to computational limitations.
To demonstrate the reproducibility of the ClickSeq approach and to assess the limit in
terms of our ability to successfully detect rare recombination events, we generated three
Fig 1. Serial passaging of Flock House virus in Drosophila melanogaster. S2 cells were transfected with pMT
vectors containing either FHV RNA1 or RNA2 and induced to generate genetically homogeneous viral particles.
Virus was allowed to propagate for three days after which cells and the supernatant were collected. A fraction
(1:10) was used to further infect a new population of S2 cells in a series of passages. The remaining fraction was
collected for analysis. In total, three replicates of nine passages were collected.
https://doi.org/10.1371/journal.ppat.1006365.g001
Pathways of FHV defective RNA evolution by ClickSeq and the MinION
PLOS Pathogens | https://doi.org/10.1371/journal.ppat.1006365 May 5, 2017 9 / 31

replicate ClickSeq libraries from the RNA sample P7R2, obtained 1x150bp reads and per-
formed the same computational analyses as described above. We mapped 0.83M, 1.45M and
1.18M reads per library, giving an approximate coverage of ~42,000–139,000x coverage over
FHV RNA1 and ~18,000–67,000x over FHV RNA2 (calculated from the average coverage over
the conserved 5’ and 3’ ends). When comparing the frequency of unique recombination events
in either RNA1 or RNA2 between any pair of the three replicates, we find excellent correlation
(Pearson >0.99) even for very infrequent recombination events, as illustrated in the scatter
plots in S2 Fig. Events that were found in two replicates but not a third, never exceeded more
than 20 mapped reads for RNA1 and 8 reads for RNA2. If we take these values as a cut-offs,
below which we begin to fail to detect events, then we can conservatively estimate that we are
reproducibly sensitive to recombinant species that are present at approximately 0.048% (20/
42,000) of RNA1 population and 0.044% (8/18,000) of the total RNA2 population when
obtaining ~1M sequence reads.
Recombination profiling reveals emergence and accumulation of
DI-RNAs
In the inoculum (P0), less than 0.2% of the all the reads mapped to recombination events
(Table 1, Fig 2A). Inspection of these events reveals that they are dispersed throughout each of
the genomic RNAs. RNA1 recombination events are the least frequent, with only 22 unique
events detected represented by 2920 reads and without an apparent bias toward any specific
location. The three most common RNA1 events in the inoculum are 2325^1241, 1484^1944,
and 2199^393 with 514, 229, and 177 mapped reads respectively (S1 Datafile). Read depth for
the wild-type genome at these loci ranges from 400K to 1.9M reads, therefore these recombina-
tion events make-up at less than 0.1% of the total viral population. These are not the events
that have been previously reported as forming FHV DI-RNAs, moreover none of these events
are observed again in subsequent passages, perhaps due to approaching the sensitivity of dis-
covery limit as described above. However, due to the low-rate of artifactual recombination of
the ClickSeq approach (>3 events per millions reads [35]), we can be confident that these are
not sequencing artifacts[35]. Therefore, these events likely represent non-viable or transient
recombination events that arose due to stochastic non-homologous recombination.
For RNA2 in the inoculum, the three most frequently observed events were 738^1219,
738^1222 and 1024^1190, with 9849, 5237, and 3673 mapped reads respectively (S1 Datafile).
Table 1. Number of ClickSeq reads gathered from each passage of replicate 2.
Replicate 2 Passage 0 Passage 1 Passage 2 Passage 3 Passage 4 Passage 5 Passage 6 Passage 7 Passage 8 Passage 9
Total Reads 41,578,802 11,303,746 30,630,462 15,720,784 9,438,862 9,526,140 7,118,697 4,316,239 9,249,953 8,108,519
FHV Genome 39,595,900 11,121,111 29,693,227 15,243,341 9,229,809 8,996,228 6,293,323 3,953,100 8,162,144 7,088,432
Host (D. mel) 1,057,037 100,716 596,462 171,518 29,353 81,172 286,605 71,238 270,156 404,742
FHV Recombs 161,205 9259 46,962 192,737 126,061 377,703 409,316 246,959 679,389 437,566
RNA1-RNA1 2,902 5103 25,052 24,809 46,225 241,048 333,125 204,609 566,092 376,893
RNA2-RNA2 81,765 3845 20,919 167,464 79,550 136,141 75,424 42,076 111,895 59,650
Inter-RNA 76,538 311 991 464 286 514 767 274 1402 1023
Other 141,332 7358 33,488 16,642 8934 18,569 33,152 16,553 46,621 55,529
Unmapped 139,057 3779 9879 3026 2952 3569 4084 1631 2690 3549
Quantity of reads generated from an Illumina HiSeq run for each passage are tabulated. Reads were mapped to either FHV or the host using Bowtie.
Remaining reads were then processed using ViReMa which identifies recombination events. ‘Inter-RNA’ indicates recombination events between RNA1 to
RNA2 or vice-versa. ‘Other’ indicates reads that contain unknown/ambiguous recombination events and unmapped read segments.
https://doi.org/10.1371/journal.ppat.1006365.t001
Pathways of FHV defective RNA evolution by ClickSeq and the MinION
PLOS Pathogens | https://doi.org/10.1371/journal.ppat.1006365 May 5, 2017 10 / 31

Pathways of FHV defective RNA evolution by ClickSeq and the MinION
PLOS Pathogens | https://doi.org/10.1371/journal.ppat.1006365 May 5, 2017 11 / 31

Coverage in the wild-type RNA2 mapping in these regions ranges between 2.6M and 4.8M
mapped reads, therefore these recombinant species make-up approximately 0.2% of the viral
RNA2 population. The majority of other recombination events are found to delete a similar
region of RNA2. This region is important as it has previously been reported to be deleted in
FHV DI-RNAs. However, in the inoculum we do not observe deletions upstream in the RNA2
gene (for example 250^513), also reported to be deleted in previously characterized FHV
DI-RNAs. Therefore, this dataset suggests that intermediate DI-RNAs with only a single region
deleted between ~740–1220 are formed very early during virus passaging (within 3 days).
In passages P1-P2, less than 1.3% of the all the reads mapped to recombination events
(Table 1, Fig 2A). Again, these occur throughout each of the genomic RNAs. However, we do
begin to see events that have previously been characterized as forming DI-RNAs, such as
311^1104 and 301^1100, although these events are present at low levels (70 and 21 reads in
Replicate 1 from a total of 8.2M reads mapped to the FHV genome) (S1 Datafile). In subse-
quent passages there was a rapid increase in the total proportion of mapped recombination
events (peaking at 11.9% in P8R1) (Table 1, Fig 2A). In these later passages for each replicate,
it can be seen that the most common recombination events are deletions that span two regions
in each genomic RNA including: nts 300–940 and nts 1240–2300 of RNA1; and nts 250–510
and nts 740–1220 of RNA2, consistent with previous observations of FHV DI-RNAs[31] (S1
Datafile). However, the exact sites of the recombination events, while repeatedly observed
over time in each replicate, varied between replicates and each had distinct ‘most popular’ spe-
cies in the final passages (Table 2). In some instances we are able to find that a specific event is
predominant in one replicate while at low levels in another. Overall, these trends in the fre-
quency of recombination events throughout passaging reveal that once defective RNA species
emerge during viral passaging they rapidly accumulate.
Despite the predominance of certain recombination events in the later passages, there still
remained a large number of infrequent events scattered throughout the viral genome. Many of
these are observed only in one passage and not in subsequent passages. Again, these events
likely correspond to stochastically generated RNA recombination events that form non-viable
defective RNAs. We reasoned that analyzing these events would more accurately reveal the
nucleotide preference of the FHV RdRp for RNA recombination as they were not subject to rep-
licative selection (although they must be packaged by FHV particles), unlike the DI-RNAs.
Therefore we extracted all recombination events occurring with fewer than 10 mapped reads
throughout all FHV passages and replicates (20’723 unique events from a total of 11.6M possible
permutations [8]) and counted the frequency of nucleotides found both up and down-stream of
5’ and 3’ recombination sites in the reference genome. As shown in Fig 2C, this revealed a pref-
erence for A’s 1-3nts downstream of 5’ sites, a preference for U’s 1-3nts upstream of 5’ sites, a
weaker preference for a C 1nt up stream of 5’ sites, and an aversion to G’s 2nts both upstream
and downstream of 5’ sites. Interestingly, an almost identical trend was observed for the 3’ sites.
This trend was maintained also when analyzing only recombination events without ambiguity
Fig 2. RNA recombination is characterized using RNAseq during serial passaging of FHV in cell-culture.
(A) Frequency of recombination events and (B) Shannon Diversity Index for all passages and replicates. Percent
recombination is calculated from total number of FHV recombination events per total number of reads mapped to FHV.
(C) The frequency of each nucleotide found both upstream and downstream of the 5’ and 3’ sites of RNA recombination
events are plotted. Only recombination events with fewer than 10 reads were included in this analysis to avoid over-
sampling of highly replicated DI-RNAs. The composition (and therefore expected frequency) of nucleotides in the FHV
genome is given by the colored horizontal lines in each plot. (D) A recombination event can retain a putative open
reading frame by deleting 3n nucleotides. The frequency of conservation of the reading frame is calculated from the
ratio of the number of recombination events that delete 3n nucleotides to the total number of recombination events
mapped to that RNA.
https://doi.org/10.1371/journal.ppat.1006365.g002
Pathways of FHV defective RNA evolution by ClickSeq and the MinION
PLOS Pathogens | https://doi.org/10.1371/journal.ppat.1006365 May 5, 2017 12 / 31

in the site of recombination (i.e. sites that lacked ‘fuzziness’ as reported by the ViReMa pipeline
[32]). This result is similar to what we have previously reported[8]. However, here we provide a
much larger dataset and analyze events that we can determine are not amplified in subsequent
passages, providing greater confidence that these sites reflect the preference for RNA recombi-
nation at these sites rather than the selection of replicatively viable defective RNA species.
Open reading frames are maintained in most DI-RNAs
Since many recombination events resulted in deletions of the viral genome, we were curious to
see if the open reading frame (ORF) was conserved, as conservation of an ORF has frequently
been observed to be a property of defective and defective-interfering RNAs[58]. Moreover, it
has previously been shown that cloned DI-RNAs vectors containing eGPF in their putative
ORFs do indeed express fluorescent protein[59] although it is not clear whether a functional
ORF is essential for DI-RNA formation or propagation. In the earliest passages, only ~33% of
deletions removed a multiple of 3 nucleotides (i.e. they thus conserved the ORF), as would be
expected if deletion events occurred randomly throughout the genome. However, with contin-
ued passaging, there was a general trend toward conservation of the ORF for both RNA1 and
RNA2 (Fig 2D), although this was not the case for all replicates. Specifically, while initially
showing an increase in ORF conservation, replicate 2 of RNA2 showed a decrease in the con-
servation of the ORF after passage 4, in contrast to the other two replicates, and in fact dips
below 33%. Closer inspection of individual recombination events shows that this trend is
driven by three of the four most common recombination events in replicate 2 passages 4 to 9:
249^517, 736^1219, 250^513 and 249^519 (the latter three events in bold do not maintain
the ORF). These events are observed in the other replicates, but at a much reduced frequency
(no more than 1% of the total RNA2 recombination events for reps 1 and 3) (S1 Datafile).
Table 2. Five most common events in each genomic RNA in the final passage of each replicate.
Sample RNA1 Events Count RNA2 Events Count
Replicate 1
301^1100 181,226 249^517 4620
2643^2700 150,961 1086^1175 4228
1350^2191 132,053 247^257 2239
1243^2309 26,928 734^1233 1152
2545^2685 26,574 727^1229 1097
Replicate 2
313^941 36,749 250^513 22,164
2629^2644 36,332 736^1219 21,178
2545^2685 24,858 249^517 6342
342^1083 24,754 223^521 1167
1245^2514 18,430 734^1233 1012
Replicate 3
1241^2298 236,140 249^517 3236
317^945 67,911 242^525 1865
1241^2305 49,348 778^1219 1722
2545^2685 28,833 738^1219 1716
344^915 16,480 1086^1175 352
The most common recombination events detected for each genomic RNA in passage 9 are indicated next to the number of reads that map over them. While
similar regions are deleted, the exact recombination site varies slightly between each replicate.
https://doi.org/10.1371/journal.ppat.1006365.t002
Pathways of FHV defective RNA evolution by ClickSeq and the MinION
PLOS Pathogens | https://doi.org/10.1371/journal.ppat.1006365 May 5, 2017 13 / 31
This indicates that DI-RNAs can indeed accumulate without a strict requirement for a func-
tional ORF. However, this analysis only takes a single recombination event into consideration
and the Illumina reads are not long enough (150bp) to resolve multiple deletions at the same
time. Nevertheless, neither compensatory recombination events including small InDels that
might restore the ORF, nor single nucleotide variants at putative stop-codons, were found.
Conservation mapping illustrates emergence and accumulation of
DI-RNAs
Using ViReMa, we were able to calculate the frequency with which each nucleotide was
deleted, revealing areas of the viral genome that are conserved during serial passaging and
required for DI-RNA replication. We plotted these data to generate recombination profiling
maps for each RNA of FHV throughout passaging (Fig 3 and S2 Fig). In the first passage,
there is a relatively even distribution of nucleotide deletions along the whole length of the
genome with the exception of two frequently excised regions in the 3’ end in RNA1 due to two
common recombination events in each of the replicates: 2545^2685 and 2277^2435. By pas-
sage 3 the deletions along the genomic landscape begin to be ‘sculpted’ whereby certain regions
are deleted with a greater frequency than others. Passages 5, 7, and 9 were sculpted further
revealing three major regions that were deleted in RNA1 and two in RNA2. Interestingly, for
both RNA segments, while a range of deletions and rearrangements are generated during early
passages, only the deletions that maintain regulatory and control elements are amplified dur-
ing continued passaging, as previously observed in FHV [32]. These include the 5’/3’ UTRs
and internal response elements (intRE) of both genomes, as well as the Proximal- and Distal-
Subgenomic Control Elements (PSCE and DSCE) in RNA1 (Fig 3), which correlates to the
findings that these regions are important and required for RNA replication and encapsidation
[29, 30, 32, 60–64].
MinION nanopore long-read sequencing of Flock House virus
The short-read ClickSeq data provide in-depth and high resolution details of individual
recombination events. However, in order to determine the correlation of these events over
time, we used long-read ONT nanopore sequencing, which can characterize full-length wild-
type and defective genomes (Fig 4 and S4 Fig). We reverse transcribed and amplified both
RNA genes using primers specific to the 5’ and 3’ UTRs of RNA1 and RNA2 from all passages
of replicate 2 to obtain cDNA that could be barcoded and analyzed using protocols for 2D
sequencing on the ONT MinION. The ClickSeq data shows that these regions were highly con-
served during passaging (Fig 3), therefore we were confident using template-specific primers
to these regions would capture both the full-length wild-type virus genomes as well as any
defective RNAs. After PCR amplification, we analyzed the MinION cDNA libraries using aga-
rose gel electrophoresis to observe the distribution of cDNA fragments and ratios of full-length
to defective RNA genomes (Fig 5A). While the cDNAs from the early passages are predomi-
nantly of the expected size for full-length RNA genomes, later passages contain an array of
band sizes. This shows that in the early passages the full-length genome is the predominant
species while in later passages the truncated version becomes predominant. We also observe
species appearing to be larger than RNA2. It is possible that some of these species correspond
to RNA2 homodimers or other complex rearrangements that have previously been observed
[65] and would result in an increased molecular weight. Evidence of RNA1 homodimers
(3107^1), RNA2 homodimers (1400^1), and RNA2 to RNA3 heterodimers (1400^2720) can
also be found in the ClickSeq data (S1 Datafile).
Pathways of FHV defective RNA evolution by ClickSeq and the MinION
PLOS Pathogens | https://doi.org/10.1371/journal.ppat.1006365 May 5, 2017 14 / 31

Pathways of FHV defective RNA evolution by ClickSeq and the MinION
PLOS Pathogens | https://doi.org/10.1371/journal.ppat.1006365 May 5, 2017 15 / 31

We pooled the amplified cDNAs from each sample at equimolar ratios and loaded the
pooled, barcoded library onto a MinION MkIB device using an R9 flowcell as per the manu-
facture’s protocol. We ran the standard protocol for obtaining 2-dimensional reads using the
MinKNOW control software and collected nanopore reads for approximately 36 hours, upon
which the quality and yield of reads dropped substantially. We obtained a total of 169’814
reads, of which 46’183 passed the default ONT filter and were successfully demultiplexed. This
yielded between 2688 and 8815 full-length reads per passage and corresponds to approximately
0.1 Gigabases of sequence information. This would correspond to ~80’000 1x150bp Illumina
reads per sample, assuming even coverage. With this depth, we can build up a comprehensive
picture of the full-length genomic landscape of the viral samples, allowing us to resolve DI-
RNA species even if they were present at less than 1% of the total viral genomic population.
The long-read nanopore sequencing data were aligned to the full-length FHV genome
using the BBMAP suite (https://sourceforge.net/projects/bbmap/). This pipeline tolerates large
insertions and deletions in the long-reads, thus allowing us to characterize the overall topology
of the defective RNAs. We mapped between 94 and 97.5% of the MinION reads from each pas-
sage to the FHV reference genome (Table 3). An example of reads aligned to FHV RNA2 is
shown in S4 Fig. The error rate of aligned reads, including single nucleotide mismatches and
small InDels, was determined from alignment pileup files. Consistent with recent reports [66],
we found the overall modal and mean error rates for all mapped position was 5.0% and 6.3%
respectively, with 95% of the sites having an error rate better than 13.6% (N95 value = 0.864).
A histogram of error rates for all mapped positions across all 9 datasets is shown in S5A Fig.
Due to the large number of small InDels generated during nanopore sequencing [43], we also
Fig 3. Recombination profiling of conserved regions in the DI-RNAs. Conservation map represents the frequency with which
specific nucleotides in the FHV genome are deleted after recombination. Dashed lines indicate boundaries of functional RNA
motifs. Odd numbered passages from replicate 2 are represented here. See S3 Fig for all replicates and all passages. Cis-RE:
cis-Regulatory Element; DSCE/PSCE: Distal/Proximal Subgenomic Control Elements; intRE: internal Response Element; 3’ RE:
3’ Response Element; 5’ SL: 5’ Stem Loop
https://doi.org/10.1371/journal.ppat.1006365.g003
Fig 4. Comparison of Illumina HiSeq to Oxford Nanopore MinION read data. Example of how reads generated from the Illumina HiSeq
would map to a reference genome. The Bowtie alignment is able to map 150bp reads along the reference with a relatively even coverage
distribution. Unmapped reads are then aligned with ViReMa to accurately identify recombination events. The low error rate of high-
throughput sequencing allows us to precisely define the boundaries of the junctions. Below the reference genome is an example of how
reads generated from Oxford Nanopore Technologies’s MinION sequencing would map to a reference genome. The MinION is able to
generate full length reads at the expense of a high error rate, which is ~7%. Full length analysis allows us to determine what recombination
events a genome contains. Due to the error rate the exact boundaries of the recombination event are imprecise.
https://doi.org/10.1371/journal.ppat.1006365.g004
Pathways of FHV defective RNA evolution by ClickSeq and the MinION
PLOS Pathogens | https://doi.org/10.1371/journal.ppat.1006365 May 5, 2017 16 / 31
determined the frequency of deletions and insertions of different lengths (S5B and S5C Fig).
This shows that small InDels are frequent, but fall quickly in abundance with increasing length.
99.8% and 99.9% of all MinION deletions and insertions respectively were shorter than 25nts.
Therefore, we considered only deletions and insertions of at least 25nts to be likely to be bonafide InDels present in the original viral RNA and corresponding to recombination events com-
prising defective RNA species rather than a sequencing error.
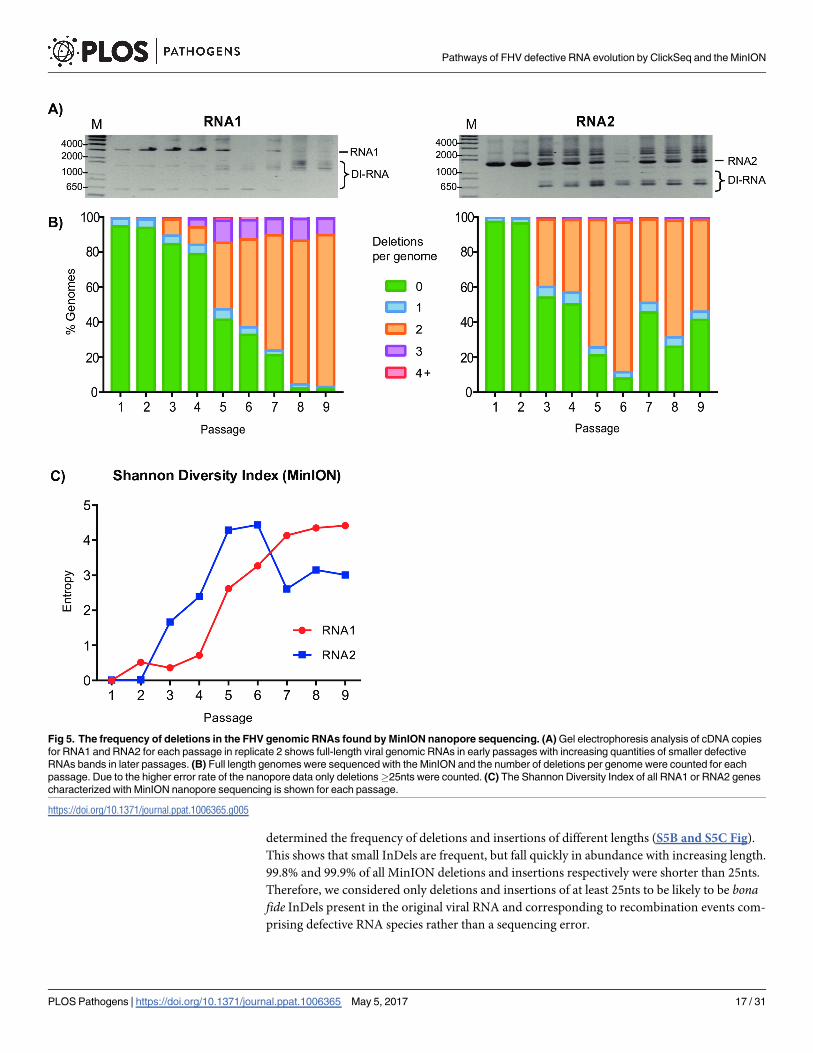
Fig 5. The frequency of deletions in the FHV genomic RNAs found by MinION nanopore sequencing. (A) Gel electrophoresis analysis of cDNA copies
for RNA1 and RNA2 for each passage in replicate 2 shows full-length viral genomic RNAs in early passages with increasing quantities of smaller defective
RNAs bands in later passages. (B) Full length genomes were sequenced with the MinION and the number of deletions per genome were counted for each
passage. Due to the higher error rate of the nanopore data only deletions�25nts were counted. (C) The Shannon Diversity Index of all RNA1 or RNA2 genes
characterized with MinION nanopore sequencing is shown for each passage.
https://doi.org/10.1371/journal.ppat.1006365.g005
Pathways of FHV defective RNA evolution by ClickSeq and the MinION
PLOS Pathogens | https://doi.org/10.1371/journal.ppat.1006365 May 5, 2017 17 / 31
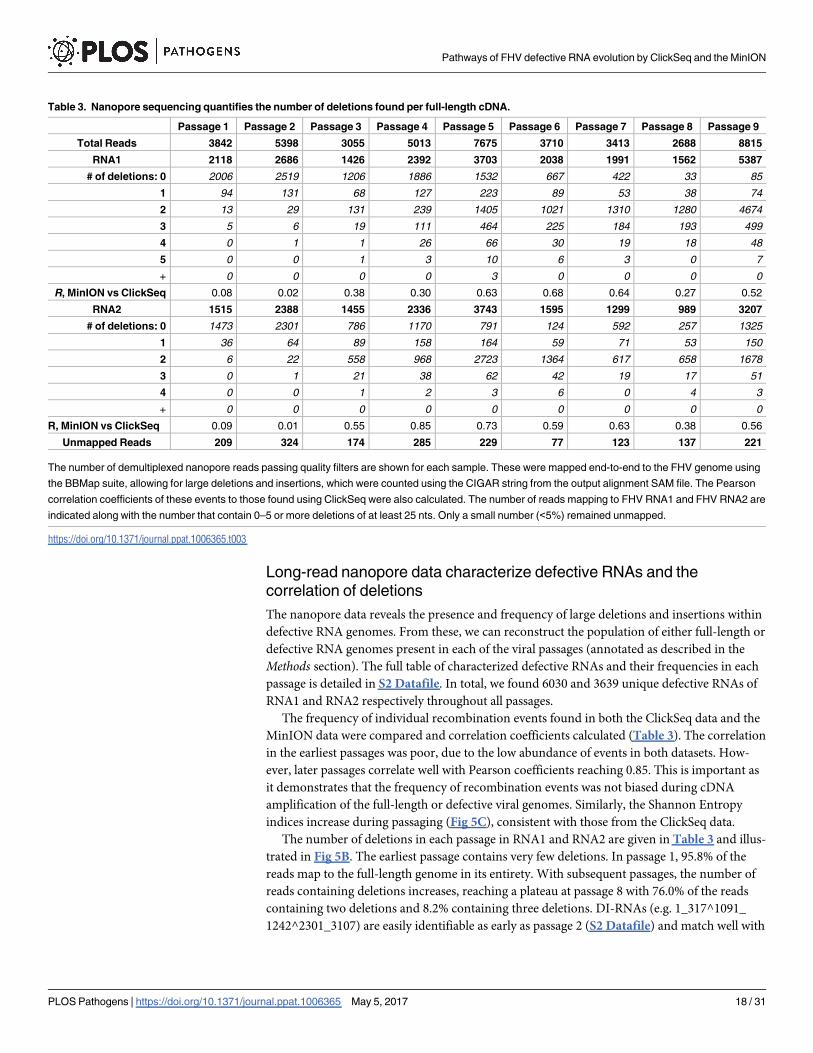
Long-read nanopore data characterize defective RNAs and the
correlation of deletions
The nanopore data reveals the presence and frequency of large deletions and insertions within
defective RNA genomes. From these, we can reconstruct the population of either full-length or
defective RNA genomes present in each of the viral passages (annotated as described in the
Methods section). The full table of characterized defective RNAs and their frequencies in each
passage is detailed in S2 Datafile. In total, we found 6030 and 3639 unique defective RNAs of
RNA1 and RNA2 respectively throughout all passages.
The frequency of individual recombination events found in both the ClickSeq data and the
MinION data were compared and correlation coefficients calculated (Table 3). The correlation
in the earliest passages was poor, due to the low abundance of events in both datasets. How-
ever, later passages correlate well with Pearson coefficients reaching 0.85. This is important as
it demonstrates that the frequency of recombination events was not biased during cDNA
amplification of the full-length or defective viral genomes. Similarly, the Shannon Entropy
indices increase during passaging (Fig 5C), consistent with those from the ClickSeq data.
The number of deletions in each passage in RNA1 and RNA2 are given in Table 3 and illus-
trated in Fig 5B. The earliest passage contains very few deletions. In passage 1, 95.8% of the
reads map to the full-length genome in its entirety. With subsequent passages, the number of
reads containing deletions increases, reaching a plateau at passage 8 with 76.0% of the reads
containing two deletions and 8.2% containing three deletions. DI-RNAs (e.g. 1_317^1091_
1242^2301_3107) are easily identifiable as early as passage 2 (S2 Datafile) and match well with
Table 3. Nanopore sequencing quantifies the number of deletions found per full-length cDNA.
Passage 1 Passage 2 Passage 3 Passage 4 Passage 5 Passage 6 Passage 7 Passage 8 Passage 9
Total Reads 3842 5398 3055 5013 7675 3710 3413 2688 8815
RNA1 2118 2686 1426 2392 3703 2038 1991 1562 5387
# of deletions: 0 2006 2519 1206 1886 1532 667 422 33 85
1 94 131 68 127 223 89 53 38 74
2 13 29 131 239 1405 1021 1310 1280 4674
3 5 6 19 111 464 225 184 193 499
4 0 1 1 26 66 30 19 18 48
5 0 0 1 3 10 6 3 0 7
+ 0 0 0 0 3 0 0 0 0
R, MinION vs ClickSeq 0.08 0.02 0.38 0.30 0.63 0.68 0.64 0.27 0.52
RNA2 1515 2388 1455 2336 3743 1595 1299 989 3207
# of deletions: 0 1473 2301 786 1170 791 124 592 257 1325
1 36 64 89 158 164 59 71 53 150
2 6 22 558 968 2723 1364 617 658 1678
3 0 1 21 38 62 42 19 17 51
4 0 0 1 2 3 6 0 4 3
+ 0 0 0 0 0 0 0 0 0
R, MinION vs ClickSeq 0.09 0.01 0.55 0.85 0.73 0.59 0.63 0.38 0.56
Unmapped Reads 209 324 174 285 229 77 123 137 221
The number of demultiplexed nanopore reads passing quality filters are shown for each sample. These were mapped end-to-end to the FHV genome using
the BBMap suite, allowing for large deletions and insertions, which were counted using the CIGAR string from the output alignment SAM file. The Pearson
correlation coefficients of these events to those found using ClickSeq were also calculated. The number of reads mapping to FHV RNA1 and FHV RNA2 are
indicated along with the number that contain 0–5 or more deletions of at least 25 nts. Only a small number (<5%) remained unmapped.
https://doi.org/10.1371/journal.ppat.1006365.t003
Pathways of FHV defective RNA evolution by ClickSeq and the MinION
PLOS Pathogens | https://doi.org/10.1371/journal.ppat.1006365 May 5, 2017 18 / 31
the expected identities based on our ClickSeq results and previous studies[8, 31]. By the final
passages these species predominate, leaving only a small percentage of full-length wild-type
viral RNAs.
While we can readily identify mature DI-RNAs containing two or more deletions, few sin-
gle-reads contain just one deletion (<6%) in all of the passages. Moreover, individual species
are rarely observed again in subsequent passages (S6 Fig and S2 Datafile). Importantly, most
of these single events do not delete the expected regions common to FHV DI-RNAs. There-
fore, they may either correspond to sequencing artifacts, or transient defective RNA species
generated due to stochastic RNA recombination, similar to the low-frequency events observed
in the ClickSeq datasets. In later passages (beginning at passage 3), we do begin to see the pre-
sumptive intermediates (e.g. 1_317^1091_3107 or 1_1242^2301_3107) of mature DI-RNAs
(e.g. 1_317^1091_1242^2301_3107). However, this is after the mature DI-RNAs were first
observed, and after the point at which DI-RNAs have begun to accumulate. Indeed, in passages
2 and 3 respectively, mature DI-RNAs make up 1% and 30% of the viral population while the
singly-deleted intermediates make up 0% (unobserved) and 3%. Together with the observation
of rare DI-RNAs in the inoculum with the ClickSeq recombination analysis, these data indicate
that single-deletion species do occur early during passaging, but remain poorly abundant and
do not accumulate. In contrast, mature DI-RNAs are observed to rapidly accumulate between
passages, indicating that they possess a replicative advantage above both wild-type viral
genomes and intermediate defective RNA species.
Complex rearrangements are observed by MinION and confirmed by
ClickSeq
In addition to deletions, a small number of defective RNAs first appearing at passage 5 con-
tained insertions. Interestingly, the majority of these comprised short insertions of ~200 nucle-
otides that were found in first 300nts of the MinION reads and were mapped between nts 19
and 20 of RNA1. In each case, these inserts corresponded to nts 2300–2513 of RNA1. This
region corresponds to an internal response element (intRE) of the Proximal Sub-genomic
RNA Control Element (PSCE) previously identified as being essential for FHV RNA replica-
tion and conserved in DI-RNAs species [60]. The most common deletion in the DI-RNAs in
this region of RNA1 for the final passages are from 1242 to 2301, which retains the intRE.
However, there are also a large number of deletions ranging from 1245 to 2514, which would
delete the essential intRE. Closer inspection of the MinION data reveals that the majority of
these reads (>90%) that contain the 200nt intRE insertion concomitantly contained deletions
from 1245–2514, indicating that these two events are correlated.
The ClickSeq data also shows a frequent recombination event, 2513^21, which appears
first in passage 4 and is among the 10 most common events in the final 5 passages (S1 Data-
file). This matches precisely the 3’ junction site of the insertion event detected in the Min-
ION data. However, the event 20^2300 corresponding to the 5’ junction site was not
detected in our initial ViReMa analysis of the ClickSeq data as this would have required a
search seed length of less than 20 nts. Repeating the ViReMa analysis using a seed length of
17 does indeed reveal the presence of the 20^2300 recombination event. This event is rarely
observed in either of the other two replicate ClickSeq data (7 and 31 total reads across all pas-
sages of replicates 1 and 3 respectively). These data indicate that in a number of defective
RNA genomes, the intRE element has been deleted and subsequently re-inserted at the 5’
end of the defective RNA genome. As the intRE element is required for regulation of RNA
replication, presumably this maintains the ability for this highly-rearranged defective RNA
to replicate.
Pathways of FHV defective RNA evolution by ClickSeq and the MinION
PLOS Pathogens | https://doi.org/10.1371/journal.ppat.1006365 May 5, 2017 19 / 31

MinION nanopore sequencing reveals the emergence, diversity and
evolution of DI-RNAs
These data provide a comprehensive overview of the different species of defective RNAs that
are present during viral passaging. Illustrating such a complex set of data is a challenge as each
sample contains a large number of genome arrangements (6030 and 3639 for RNA1 and
RNA2 respectively) and frequencies of these species vary substantially over time. We found
that illustrating these data as a stacked area plot gave the most informative summary of the
changes of the many different type of DI-RNA species over time. Due to the moderate error-
rate of the nanopore read data, the exact identification of a recombination event and thus
annotation of that genome may be incorrect. This would result in an over-estimation in the
potential number of unique structural variants. Therefore we filtered datasets by requiring
genomes to be represented by three or more reads. While removing a lot of noise, this has the
drawback that we might be losing rare defective RNAs. Stacked area plots for genomes repre-
sented by three or more reads are shown in Fig 6. The stacked area plots for the unfiltered
datasets are shown in S6 Fig. This representation reveals key components of the evolution of
the DI-RNA species.
The stacked area plot for RNA1 (Fig 6A) shows that the composition of DI-RNAs in
the viral population changes over time and new species appear at each passage. For example,
the most abundant defective RNA1 species in passage 5 is ‘1_317^1091_1242^2301_3107’ but
reduces in relative frequency in later passages. The most abundant species in the final passage 9 is
‘1_313^941_1241^2325_3107’, which appears at low levels as early as passage 2, but does not begin
to accumulate until passage 6 (S2 Datafile). Why this DI-RNA only begins to accumulate at later
passages despite being present in the early passages is not clear. The ‘complex DI-RNA’ that
deletes the PSCE in RNA1 referred to in the previous section (‘1_342^1083_1245^2514_3107’) is
also observed (annotated in Fig 6A) first appearing at passage 5.
As can be seen in the stacked area plot for RNA2 (Fig 6B), the general composition of
DI-RNA species is established at passages 4–5. Subsequently, the relative frequencies of the
DI-RNA fluctuate but the overall diversity changes little with few new species appearing after
passage 4. This is also observed when calculating the Shannon Diversity index (Fig 5B)
whereby entropy reaches a maximum at passage 5 and decreases thereafter. Interestingly, this
range of fluctuations resemble the sinusoidal patterns of DI-RNA abundance that have been
observed in other studies of RNA viruses where the ratio of the frequency of DI-RNAs to wild-
type genome has been measured through longitudinal studies[67].
Specific infectivity correlates with abundance of defective RNAs
The reduction in full-length infectious viral genomes and the accumulation of defective RNAs
during passaging is likely to correspond to a decrease in the specific infectivity of the virus
samples. To determine the effect of defective RNAs characterized by combined ClickSeq and
nanopore sequencing of replicate 2 upon specific infectivity, we performed 50% tissue culture
infectious dose (TCID50) assays for each passage 1–9 for both the original inoculum used to
infect each sample and for the particles purified from each passage [51]. The TCID50 assay is
used to determine the dose required to give a 50% chance that cells in culture will be success-
fully infected as determined by CPE and is typically used to determine viral titer and the effec-
tive MOI of the inocula transferred from passage to passage. The results from the TCID50
assay for each passage are shown in Fig 7A and 7B. We found that the TCID50 value (and
thus PFUs(Plaque Forming Units)/ml) drops considerably during passaging by over four
orders of magnitude. The corresponding effective MOI (PFUs per cell) also drops from 38.5 to
0.0003 during passaging (Fig 7B).
Pathways of FHV defective RNA evolution by ClickSeq and the MinION
PLOS Pathogens | https://doi.org/10.1371/journal.ppat.1006365 May 5, 2017 20 / 31

Fig 6. Evolutionary pathways of full-length RNA genomes are illustrated using stacked-area plots for (A) RNA1 and (B) RNA2. The passage number
is indicated on the x-axis and the stacked frequencies of each detected defective RNA is shown in the y-axis. Each non-contiguous color represents a specific
genome characterized by MinION nanopore sequencing. Wild-type genomes are colored green, genomes with one deletion are colored in shades of blue, and
genomes with two or more deletions are colored in shades of orange (using the same color scheme as in Fig 5B). Raw data and annotations are in S2
Datafile.
https://doi.org/10.1371/journal.ppat.1006365.g006
Pathways of FHV defective RNA evolution by ClickSeq and the MinION
PLOS Pathogens | https://doi.org/10.1371/journal.ppat.1006365 May 5, 2017 21 / 31
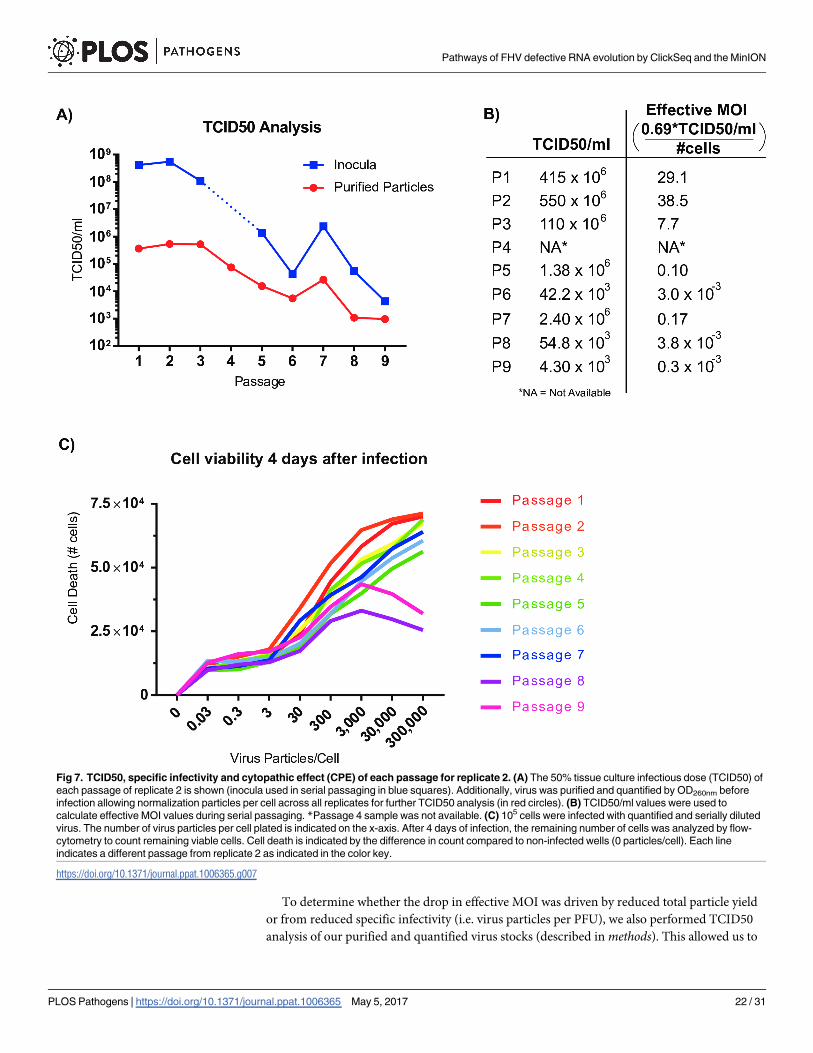
To determine whether the drop in effective MOI was driven by reduced total particle yield
or from reduced specific infectivity (i.e. virus particles per PFU), we also performed TCID50
analysis of our purified and quantified virus stocks (described in methods). This allowed us to
Fig 7. TCID50, specific infectivity and cytopathic effect (CPE) of each passage for replicate 2. (A) The 50% tissue culture infectious dose (TCID50) of
each passage of replicate 2 is shown (inocula used in serial passaging in blue squares). Additionally, virus was purified and quantified by OD260nm before
infection allowing normalization particles per cell across all replicates for further TCID50 analysis (in red circles). (B) TCID50/ml values were used to
calculate effective MOI values during serial passaging. *Passage 4 sample was not available. (C) 105 cells were infected with quantified and serially diluted
virus. The number of virus particles per cell plated is indicated on the x-axis. After 4 days of infection, the remaining number of cells was analyzed by flow-
cytometry to count remaining viable cells. Cell death is indicated by the difference in count compared to non-infected wells (0 particles/cell). Each line
indicates a different passage from replicate 2 as indicated in the color key.
https://doi.org/10.1371/journal.ppat.1006365.g007
Pathways of FHV defective RNA evolution by ClickSeq and the MinION
PLOS Pathogens | https://doi.org/10.1371/journal.ppat.1006365 May 5, 2017 22 / 31

determine and normalize the number of virus particles delivered per cell between each passage.
As the particle-per-PFU ratio has previously been estimated at 300–400 particles-per-PFU [26,
52] we setup our assay beginning with 300’000 particles per cell in 96 well format and per-
formed 8 10-fold serial dilutions. In this assay, we found that the number of viral particles
required to induce CPE decreased by over 400-fold during passaging (Fig 7A) with a trend
very similar to that for the unpurified inocula. Together, these data indicate virus specific
infectivity drops with a corresponding increase in the defective RNA population. There was an
exception at passage 7 where TCID50 actually increased ~5 fold from the previous passage.
This could be correlated to our observation of a decrease in the amount of defective RNA2 spe-
cies in the MinION analysis (Figs 5B and 6B).
We further characterized each well of the TCID50 assay of our purified particles using flow-
cytometry to give a quantitative assessment of cell survival and death in response to virus dose.
We calculated the number of live cells that remained after infection at each dilution and for
each passage (Fig 7C and S7 Fig). We observed a reduced overall CPE in later passages at the
highest virus dose as well as an increase in the number of viral particles require to induce the
same amount of CPE (Fig 7C). Together these trends reflect a reduced specific infectivity dur-
ing viral passaging, in agreement with our TCID50 assays. Interestingly however, for the high-
est particle concentrations in passages 8 and 9, we saw less cell death at the highest doses
(300,000 and 30,000 particles per cell) than for cells infected with the same inoculum (and
therefore same ratio of full-length to defective RNAs) but at a lower dose (3,000–30 particles
per cell). This observation indicates the protection of cells from infection and/or CPE when
supplied with a large dose of viral particles that contain a large proportion of DI-RNAs.
Discussion
In this manuscript, we sought to provide a thorough and comprehensive analysis of the fre-
quency and identity of recombination events present during the serial passaging of Flock
House virus in cell culture in order to elucidate the pathways and mechanism of DI-RNA
emergence and evolution. We began with a homogenous inoculum derived from plasmid
cDNAs of each of the FHV genomes. In the inoculum and in the early passages, we find a wide
range of low-frequency recombination events corresponding to deletions and duplications
that are dispersed through-out the viral genomic RNAs. We can be confident that these species
do not constitute sequencing artifacts as we made our RNAseq libraries using ‘ClickSeq’[35]
that has previously been demonstrated to reduce artifactual recombination in RNAseq data
to fewer than 3 events per million reads. Further confidence in the low rates of artifactual
recombination in our study is provided internally by inspecting the numbers of inter-RNA
recombination events (RNA1 to RNA2 and vice versa), which are always low. Furthermore, the
majority of the detected inter-RNA recombination events correspond to genomic RNA het-
ero- and homo-dimers, which have previously been characterized as replication intermediates
[65].
Within only 2–3 passages, however, deletion events similar to those previously observed in
DI-RNAs appear in all three passaging replicates. In subsequent passages, these recombination
events begin to accumulate rapidly so as to predominate over full-length viral RNAs. This
observation of the emergence of DI-RNA species, followed by their rapid accumulation is con-
sistent with existing theories on the evolution of DI-RNAs that postulate that a wide range of
potential DI-RNA species are generated by non-programmed RNA recombination and that
only a handful are successfully replicated and thus accumulate[9]. While the short-read data
provide high-resolution characterization of individual recombination events, it is through the
use of the Oxford Nanopore Technologies (ONT) MinION that we are able reconstitute the
Pathways of FHV defective RNA evolution by ClickSeq and the MinION
PLOS Pathogens | https://doi.org/10.1371/journal.ppat.1006365 May 5, 2017 23 / 31

complex full-length genomic landscape of FHV during passaging and determine the relative
abundances of the genomic RNAs in each passage. As a result, we were able to determine that
by the final passage only ~2% of the mapped reads are full-length viral RNA1, which corre-
sponded with a large reduction in specific infectivity. Additionally, the nanopore data revealed
complex rearrangements of RNA genomes, including the excision of an entire functional RNA
motif and its reinsertion in the 5’UTR of RNA1.
The variation in recombination boundaries of the DI-RNAs suggests that a range of dele-
tions can be tolerated. However, it is important to note that while each replicate is its own dis-
tinct lineage, each replicate passaging experiment was derived from the same initial inoculum.
We chose to design the experiment this way to determine if the same DI-RNAs would be gen-
erated independently or if completely different deletions would arise and be selected for even
though the environmental conditions are practically the same. Here, we observe the latter
(Table 2). Few of the RNA1 recombination events observed in the inoculum are observed
again in subsequent passages. Additionally, even though we found the event ‘738^1219’ in
RNA2 the inoculum, this was not the final predominant species in any replicate. Therefore,
the evolution of DI-RNAs was not pre-determined by the presence of rare DI-RNA species in
the common inoculum (a founder-effect), but rather by the selection of well-replicating DI-R-
NAs that arose later during serial passaging. Nonetheless, the final recombination events are
highly similar between replicates and to previous reports from different laboratories. There-
fore, this indicates that either the DI-RNAs have emerged due to a common mechanism of for-
mation, the presence of a common selectivity filter, or both.
In addition to providing a thorough analysis of the pathways of defective RNA formation
and evolution, there are two unexpected and critical observations made through this study.
First: while we observe a wide range of recombination events early on during passaging, only a
limited number of events are subsequently amplified and later define DI-RNAs. Moreover,
these limited sets of events are similar between replicates, and to previous studies. This sug-
gests that while a large pool of potential defective RNAs are generated, only a small number
are capable of accumulating. Secondly: we do not observe the amplification of DI-RNAs with
only one deletion. In contrast, ‘mature’ DI-RNAs accumulate rapidly. Nonetheless, we do find
evidence for intermediate DI-RNAs as early as the inoculum sample. This indicates that inter-
mediate defective-species are either non-competitive and do not accumulate or are not formed
as a pre-cursor to mature DI-RNAs. These two observations provide important insights into
the potential mechanisms of DI-RNA emergence and evolution.
While there is a strong selection pressure for DI-RNAs to retain essential functional geno-
mic elements, it is also postulated that a shorter defective RNA would be replicated more
quickly and thus more competitively [10]. In our analysis, while the ~250–550 deletion in
RNA2 (for example) is very common we do not observe the accumulation of deletion events
that are smaller than this (e.g. 300–450). This is despite the fact that we can detect and observe
such species in low frequencies both in early and late passages, suggesting that they are indeed
generated but are not selectively amplified. This may in part be due to selecting for DI-RNA
genomes that are as small as possible, while retaining the minimal amount of genetic material
to form functional genetic elements. However, it may also be the result of a negative selection
pressure or restrictive barrier that is released only after excising specific portions of the viral
genome. An example of this scenario has been demonstrated for tomato bushy stunt virus
(TBSV) associated DI-RNAs whereby deletion of a translation enhancer functional element
removes the competition between translation and replication, thus favoring replication of the
smaller DI-RNA[68]. Therefore, the final structure of DI-RNAs may depend both on the
retention of essential functional RNA elements, as well as the removal of restrictive barriers
that attenuate RNA replication.
Pathways of FHV defective RNA evolution by ClickSeq and the MinION
PLOS Pathogens | https://doi.org/10.1371/journal.ppat.1006365 May 5, 2017 24 / 31

One model for the evolution of DI-RNAs is through the step-wise accumulation of deletion
events through a series of individual recombination events[68]. The MinION data reveals that
the defective RNAs that accumulate (rapidly over the course 2–3 passages) contain multiple
deletion events. However, we do not see the rapid accumulation of the intermediate DI-RNAs,
despite evidence for their presence early in viral passaging. This suggests that the mature DI-R-
NAs have a competitive advantage over their presumed intermediate precursors. If this is the
case, the multiple deletions may function epistatically either through an undefined coopera-
tive/additive mechanism or through the release of multiple restriction barriers, as proposed
above. If multiple restriction barriers are required to be excised for the formation of DI-RNAs,
small or multipartite RNA viruses, such as FHV or influenza[17], may therefore generate
DI-RNAs more readily by requiring fewer intermediate steps than long, monopartite RNA
viruses. Moreover, if intermediate defective RNAs fail to accumulate, this reduces the likeli-
hood that mature DI-RNAs can subsequently be generated and may place substantial limita-
tions on the ability of some viruses to generate DI-RNAs altogether.
An alternative reason for the rarity of precursor/intermediate defective RNAs is that the
mature DI-RNAs are generated in one single event. We are yet to determine the molecular
mechanism of recombination that leads to DI-RNA formation. Both template-switching, sec-
ondary-structure jumping, and non-replicative mechanisms have been proposed, and indeed
these mechanisms need not be mutually exclusive. Our observation of nucleotide preferences
at recombination junctions (Fig 2C) may arise through any of these potential mechanisms.
Alternatively, it is possible that multiple reassembly/deletion events occur in a single step, in a
manner reminiscent of chromosome shattering (chromothripsis)[69]; or ‘virothripsis’. Within
the confined invaginations of the mitochondrial membranes that form the replication factories
of RNA viruses such as FHV[70], the fragmentation the RNA virus genome followed by incor-
rect re-stitching of these genome pieces, either through forced-copy choice template switching
or a non-replicative mechanism, could create the DI-RNAs observed here including the com-
plex rearrangements observed for RNA1.
A defective-interfering RNA is a defective RNA that has the ability to compete with or oth-
erwise attenuate the replication and proliferation of the wild-type helper virus. In our study we
demonstrate that the viral swarm, even after only a few passages, is replete with many varieties
of defective RNAs. With a single sequencing experiment, we would not be able to determine
whether these defective RNAs are accumulating, diminishing or make-up a static component
of the viral quasi-species. However, as we perform serial passaging with sequential sequencing
experiments, we can determine which defective RNAs are accumulating (for example the
‘mature’ DI-RNAs) and which are not (e.g. the putative intermediate, or ‘immature’ defective
RNAs). It would be impractical to validate each of the many hundreds of detected defective
RNA species with molecular virological experiments to determine whether they truly can
attenuate or interfere with wild-type virus replication and to therefore categorize that species
as a defective-interfering RNA. Indeed, we cannot exclude the possibility that multiple DI-R-
NAs act co-operatively within the viral quasi-species and are mutually dependent upon one
another. However, the demonstration here of an accumulation during serial passaging is
strong evidence that these species are interfering, as their accumulation essentially dilutes the
pool of wild-type functional virus. With this in mind, we believe it would be suitable to
describe the mature defective RNAs as defective-interfering RNAs (DI-RNAs), and the ‘imma-
ture’ only as defective RNAs.
It is remarkable that FHV is able to maintain a viable infection despite being burdened with
such a gross excess of DI-RNAs in the final passages presented here. By performing TCID50
assays of the original inocula used between each of the passages and of the particles purified
from each passage, we show that there is a dramatic reduction in specific infectivity during
Pathways of FHV defective RNA evolution by ClickSeq and the MinION
PLOS Pathogens | https://doi.org/10.1371/journal.ppat.1006365 May 5, 2017 25 / 31

passaging corresponding with the increase in the DI-RNA content. DI-RNAs have generally
been demonstrated to arise at high MOIs, as was the scenario with our first passages. However,
our calculated MOI drops rapidly after DI-RNAs have formed to levels that might be expected
during typical in vivo viral passaging scenarios. However, in this experiment we were actually
passaging a large number of virus particles between cells, but with a low specific infectivity. It
is also interesting to observe that for the final passages there appears to be a protective property
of the DI-RNAs as determined by flow-cytometry, but only when administered at the highest
doses corresponding to over ~30,000 particles per cell. However, the role that DI-RNAs might
play in vivo is not clear, as these very high doses may not be physiologically relevant. DI-RNAs
for FHV similar to the ones described here have been observed to arise in experimental fruit
fly infections [33] and so the mechanism of formation and/or selection is likely to be similar in
cell culture and in vivo. However, whether RNA viruses such as FHV have evolved to favor the
spontaneous formation of DI-RNAs and if so whether these DI-RNAs play an important role
in modifying the life-cycle of the virus, is yet to be determined.
Supporting information
S1 Fig. Percentage of ClickSeq reads mapping to host RNA through each passage and repli-
cate. Percent mapping is calculated by the frequency of reads that mapped to the host genome
compared to all processed reads.
(PDF)
S2 Fig. Scatter plots comparing frequency of unique recombination events found in repli-
cate ClickSeq libraries of P7R2. Three replicate ClickSeq libraries were generated from the
same RNA sample to validate the reproducibility of ClickSeq and to determine the cut-off for
sensitivity of discovery. Each point represents an individual recombination event and the x-
and y- axes is the number of reads mapping to that specific event for each data set. The size of
the point indicates the number of different events that share the same coordinates, as indicated
by the key. These data illustrate the reproducibility with which recombination events are
found when multiple libraries are generated side-by-side. Pearson correlation coefficients
exceed 0.99 when comparing RNA1 or RNA2 recombination between each pair of replicates.
(PDF)
S3 Fig. Conservation maps, similar to those illustrated in Fig 3 are shown for every passage
in every replicate including the original inoculum (P0).
(PDF)
S4 Fig. Alignment of MinION reads. A composite snapshot of the TABLET sequence viewer
alignment of RNA2 from the reads generated by the MinION (P4R2).
(PDF)
S5 Fig. Error rate of the Oxford Nanopore MinION. (A) A histogram of the frequency of error
rates over every mapped position across all Nanopore datasets is shown. Errors include substitu-
tions, insertions and deletions shorter than 25 nts. The proportion of correct base matches to mis-
matches is shown on the x-axis. The y-axis indicates the number of nucleotide coordinates with
the corresponding error rate. This reveals a mode and mean error rate of 5.0% and 6.3% respec-
tively. Frequency of (B) deletions and (C) insertions within the MinION dataset.
(PDF)
S6 Fig. Stacked-area plot of showing the pathways of FHV DI-RNA evolution for (A)
RNA1 and (B) RNA2. Similar to Fig 6, except all species are included, including genomes rep-
resented by only one MinION nanopore read. The passage number is indicated on the x-axis
Pathways of FHV defective RNA evolution by ClickSeq and the MinION
PLOS Pathogens | https://doi.org/10.1371/journal.ppat.1006365 May 5, 2017 26 / 31

and the stacked frequencies of each detected defective RNA is shown in the y-axis. Each non-
contiguous color represents a specific genome characterized by MinION nanopore sequenc-
ing. Wild-type genomes are colored green, genomes with one deletion are colored in shades of
blue, and genomes with two or more deletions are colored in shades of oranges (using the
same color scheme as in Fig 5C).
(PDF)
S7 Fig. Scatterplots showing live cell gating. Screenshots of the InCyte software (of the
Guava easyCyte HT flow cytometer) indicating gating used to count live cells. (A) Uninfected
S2 cells. (B) S2 cells four days post-infection with FHV exhibiting cytopathic effect.
(PDF)
S1 Table. Full breakdown of ClickSeq read mapping results. Each passage in each replicate
as well as the inoculum is shown, similar to Table 1.
(PDF)
S1 Datafile. Raw virus recombination events data from ViReMa analysis of ClickSeq data.
Each passage in each replicate as well as the inoculum is shown. Output format, as described in
Routh et al. [32], is given as “DonorCoord_to_AcceptorCoord_#_Counts”. This is the raw data
used to populate Table 1 and S1 Table.
(ZIP)
S2 Datafile. Genomes characterized by MinION nanopore sequencing. Table reports the
annotated genomes (wild-type or defective) and the number of mapped reads in each passage.
This the raw data used to populate the stacked-area plots in Fig 6 and S6 Fig.
(XLSX)
Acknowledgments
We thank Thomas Wood, Steve Widen and Jill Thomson from the UTMB Next-Generation
Sequencing core and Gillian Lynch from the SCSB computing facility for support. We are
indebted to Mariano Garcia-Blanco and Shelton Bradrick and the members of their lab for
sharing lab space, helpful discussions and other research support. We thank Eric Wagner, Jack
Johnson and Bruce Torbett for support and advice.
Author Contributions
Conceptualization: AR EJ.
Data curation: AR EJ.
Formal analysis: AR EJ.
Funding acquisition: AR.
Investigation: AR EJ.
Methodology: AR EJ.
Project administration: AR.
Resources: AR EJ.
Software: AR EJ.
Supervision: AR.
Pathways of FHV defective RNA evolution by ClickSeq and the MinION
PLOS Pathogens | https://doi.org/10.1371/journal.ppat.1006365 May 5, 2017 27 / 31

Validation: AR EJ.
Visualization: AR EJ.
Writing – original draft: AR EJ.
Writing – review & editing: AR EJ.
References
1. Haas BJ, Gevers D, Earl AM, Feldgarden M, Ward DV, Giannoukos G, et al. Chimeric 16S rRNA
sequence formation and detection in Sanger and 454-pyrosequenced PCR amplicons. Genome Res.
2011; 21(3):494–504. PubMed Central PMCID: PMC3044863. https://doi.org/10.1101/gr.112730.110
PMID: 21212162
2. Simon-Loriere E, Holmes EC. Why do RNA viruses recombine? Nat Rev Microbiol. 2011; 9(8):617–26.
Epub 2011/07/05. https://doi.org/10.1038/nrmicro2614 PMID: 21725337
3. Kirkegaard K, Baltimore D. The mechanism of RNA recombination in poliovirus. Cell. 1986; 47(3):433–
43. Epub 1986/11/07. PMID: 3021340
4. Gallei A, Pankraz A, Thiel HJ, Becher P. RNA recombination in vivo in the absence of viral replication. J
Virol. 2004; 78(12):6271–81. Epub 2004/05/28. PubMed Central PMCID: PMC416528. https://doi.org/
10.1128/JVI.78.12.6271-6281.2004 PMID: 15163720
5. Palmenberg AC, Spiro D, Kuzmickas R, Wang S, Djikeng A, Rathe JA, et al. Sequencing and analyses
of all known human rhinovirus genomes reveal structure and evolution. Science. 2009; 324(5923):55–
9. Epub 2009/02/14. https://doi.org/10.1126/science.1165557 PMID: 19213880
6. Worobey M, Rambaut A, Holmes EC. Widespread intra-serotype recombination in natural populations
of dengue virus. Proc Natl Acad Sci U S A. 1999; 96(13):7352–7. Epub 1999/06/23. PubMed Central
PMCID: PMC22089. PMID: 10377418
7. Cherkasova EA, Korotkova EA, Yakovenko ML, Ivanova OE, Eremeeva TP, Chumakov KM, et al.
Long-term circulation of vaccine-derived poliovirus that causes paralytic disease. J Virol. 2002; 76
(13):6791–9. PubMed Central PMCID: PMCPMC136293. https://doi.org/10.1128/JVI.76.13.6791-
6799.2002 PMID: 12050392
8. Routh A, Ordoukhanian P, Johnson JE. Nucleotide-resolution profiling of RNA recombination in the
encapsidated genome of a eukaryotic RNA virus by next-generation sequencing. J Mol Biol. 2012; 424
(5):257–69. PubMed Central PMCID: PMC3502730. https://doi.org/10.1016/j.jmb.2012.10.005 PMID:
23069247
9. Pathak KB, Nagy PD. Defective Interfering RNAs: Foes of Viruses and Friends of Virologists. Viruses.
2009; 1(3):895–919. Epub 2009/12/01. PubMed Central PMCID: PMC3185524. https://doi.org/10.
3390/v1030895 PMID: 21994575
10. Huang AS, Baltimore D. Defective viral particles and viral disease processes. Nature. 1970; 226
(5243):325–7. Epub 1970/04/25. PMID: 5439728
11. Smith CM, Scott PD, O’Callaghan C, Easton AJ, Dimmock NJ. A Defective Interfering Influenza RNA
Inhibits Infectious Influenza Virus Replication in Human Respiratory Tract Cells: A Potential New
Human Antiviral. Viruses. 2016; 8(8).
12. Sun Y, Jain D, Koziol-White CJ, Genoyer E, Gilbert M, Tapia K, et al. Immunostimulatory Defective
Viral Genomes from Respiratory Syncytial Virus Promote a Strong Innate Antiviral Response during
Infection in Mice and Humans. PLoS pathogens. 2015; 11(9):e1005122. PubMed Central PMCID:
PMCPMC4559413. https://doi.org/10.1371/journal.ppat.1005122 PMID: 26336095
13. Roux L, Simon AE, Holland JJ. Effects of defective interfering viruses on virus replication and pathogen-
esis in vitro and in vivo. Adv Virus Res. 1991; 40:181–211. PMID: 1957718
14. Tapia K, Kim WK, Sun Y, Mercado-Lopez X, Dunay E, Wise M, et al. Defective viral genomes arising in
vivo provide critical danger signals for the triggering of lung antiviral immunity. PLoS pathogens. 2013; 9
(10):e1003703. PubMed Central PMCID: PMCPMC3814336. https://doi.org/10.1371/journal.ppat.
1003703 PMID: 24204261
15. Nagy PD, Bujarski JJ. Engineering of homologous recombination hotspots with AU-rich sequences in
brome mosaic virus. J Virol. 1997; 71(5):3799–810. Epub 1997/05/01. PubMed Central PMCID:
PMC191530. PMID: 9094655
16. Runckel C, Westesson O, Andino R, Derisi JL. Identification and manipulation of the molecular determi-
nants influencing poliovirus recombination. PLoS Pathog. 2013; 9(2):e1003164. PubMed Central
PMCID: PMC3567174. https://doi.org/10.1371/journal.ppat.1003164 PMID: 23408891
Pathways of FHV defective RNA evolution by ClickSeq and the MinION
PLOS Pathogens | https://doi.org/10.1371/journal.ppat.1006365 May 5, 2017 28 / 31

17. Dimmock NJ, Easton AJ. Defective interfering influenza virus RNAs: time to reevaluate their clinical
potential as broad-spectrum antivirals? J Virol. 2014; 88(10):5217–27. PubMed Central PMCID:
PMCPMC4019098. https://doi.org/10.1128/JVI.03193-13 PMID: 24574404
18. Makino S, Yokomori K, Lai MM. Analysis of efficiently packaged defective interfering RNAs of murine
coronavirus: localization of a possible RNA-packaging signal. J Virol. 1990; 64(12):6045–53. PubMed
Central PMCID: PMCPMC248778. PMID: 2243386
19. Finzi D, Plaeger SF, Dieffenbach CW. Defective virus drives human immunodeficiency virus infection,
persistence, and pathogenesis. Clin Vaccine Immunol. 2006; 13(7):715–21. PubMed Central PMCID:
PMCPMC1489566. https://doi.org/10.1128/CVI.00052-06 PMID: 16829607
20. Cattaneo R, Schmid A, Eschle D, Baczko K, ter Meulen V, Billeter MA. Biased hypermutation and other
genetic changes in defective measles viruses in human brain infections. Cell. 1988; 55(2):255–65.
Epub 1988/10/21. PMID: 3167982
21. Li D, Lott WB, Lowry K, Jones A, Thu HM, Aaskov J. Defective interfering viral particles in acute dengue
infections. PLoS One. 2011; 6(4):e19447. Epub 2011/05/12. PubMed Central PMCID: PMC3084866.
https://doi.org/10.1371/journal.pone.0019447 PMID: 21559384
22. Sugiyama K, Suzuki K, Nakazawa T, Funami K, Hishiki T, Ogawa K, et al. Genetic analysis of hepatitis
C virus with defective genome and its infectivity in vitro. J Virol. 2009; 83(13):6922–8. Epub 2009/04/17.
PubMed Central PMCID: PMC2698526. https://doi.org/10.1128/JVI.02674-08 PMID: 19369330
23. Pesko KN, Fitzpatrick KA, Ryan EM, Shi PY, Zhang B, Lennon NJ, et al. Internally deleted WNV
genomes isolated from exotic birds in New Mexico: function in cells, mosquitoes, and mice. Virology.
2012; 427(1):10–7. Epub 2012/03/01. PubMed Central PMCID: PMC3312038. https://doi.org/10.1016/
j.virol.2012.01.028 PMID: 22365325
24. Saira K, Lin X, DePasse JV, Halpin R, Twaddle A, Stockwell T, et al. Sequence analysis of in vivo defec-
tive interfering-like RNA of influenza A H1N1 pandemic virus. J Virol. 2013; 87(14):8064–74. PubMed
Central PMCID: PMCPMC3700204. https://doi.org/10.1128/JVI.00240-13 PMID: 23678180
25. Scotti PD, Dearing S, Mossop DW. Flock House virus: a nodavirus isolated from Costelytra zealandica
(White) (Coleoptera: Scarabaeidae). Arch Virol. 1983; 75(3):181–9. PMID: 6188442
26. Dasgupta R, Free HM, Zietlow SL, Paskewitz SM, Aksoy S, Shi L, et al. Replication of flock house virus
in three genera of medically important insects. J Med Entomol. 2007; 44(1):102–10. Epub 2007/02/14.
PMID: 17294927
27. Odegard A, Banerjee M, Johnson JE. Flock house virus: a model system for understanding non-envel-
oped virus entry and membrane penetration. Curr Top Microbiol Immunol. 2010; 343:1–22. Epub 2010/
04/22. https://doi.org/10.1007/82_2010_35 PMID: 20407886
28. Li H, Li WX, Ding SW. Induction and suppression of RNA silencing by an animal virus. Science. 2002;
296(5571):1319–21. https://doi.org/10.1126/science.1070948 PMID: 12016316
29. Zhong W, Dasgupta R, Rueckert R. Evidence that the packaging signal for nodaviral RNA2 is a bulged
stem-loop. Proc Natl Acad Sci U S A. 1992; 89(23):11146–50. Epub 1992/12/01. PubMed Central
PMCID: PMC50506. PMID: 1454792
30. Ball LA, Li Y. cis-acting requirements for the replication of flock house virus RNA 2. J Virol. 1993; 67
(6):3544–51. Epub 1993/06/01. PubMed Central PMCID: PMC237701. PMID: 8497063
31. Jovel J, Schneemann A. Molecular characterization of Drosophila cells persistently infected with Flock
House virus. Virology. 2011; 419(1):43–53. Epub 2011/08/30. PubMed Central PMCID: PMC3175792.
https://doi.org/10.1016/j.virol.2011.08.002 PMID: 21872290
32. Routh A, Johnson JE. Discovery of functional genomic motifs in viruses with ViReMa-a Virus Recombi-
nation Mapper-for analysis of next-generation sequencing data. Nucleic Acids Res. 2014; 42(2):e11.
PubMed Central PMCID: PMC3902915. https://doi.org/10.1093/nar/gkt916 PMID: 24137010
33. Goic B, Vodovar N, Mondotte JA, Monot C, Frangeul L, Blanc H, et al. RNA-mediated interference and
reverse transcription control the persistence of RNA viruses in the insect model Drosophila. Nat Immu-
nol. 2013; 14(4):396–403. https://doi.org/10.1038/ni.2542 PMID: 23435119
34. Routh A, Domitrovic T, Johnson JE. Host RNAs, including transposons, are encapsidated by a eukary-
otic single-stranded RNA virus. Proc Natl Acad Sci U S A. 2012; 109(6):1907–12. Epub 2012/02/07.
PubMed Central PMCID: PMC3277583. https://doi.org/10.1073/pnas.1116168109 PMID: 22308402
35. Routh A, Head SR, Ordoukhanian P, Johnson JE. ClickSeq: Fragmentation-Free Next-Generation
Sequencing via Click Ligation of Adaptors to Stochastically Terminated 3’-Azido cDNAs. J Mol Biol.
2015; 427(16):2610–6. PubMed Central PMCID: PMCPMC4523409. https://doi.org/10.1016/j.jmb.
2015.06.011 PMID: 26116762
36. Qiu J, El-Sagheer AH, Brown T. Solid phase click ligation for the synthesis of very long oligonucleotides.
Chemical communications. 2013; 49(62):6959–61. https://doi.org/10.1039/c3cc42451k PMID:
23814786
Pathways of FHV defective RNA evolution by ClickSeq and the MinION
PLOS Pathogens | https://doi.org/10.1371/journal.ppat.1006365 May 5, 2017 29 / 31

37. Mikheyev AS, Tin MM. A first look at the Oxford Nanopore MinION sequencer. Mol Ecol Resour. 2014;
14(6):1097–102. https://doi.org/10.1111/1755-0998.12324 PMID: 25187008
38. Jain M, Koren S, Quick J, Rand AC, Sasani TA, Tyson JR, et al. Nanopore sequencing and assembly of
a human genome with ultra-long reads. bioRxiv. 2017.
39. Greninger AL, Naccache SN, Federman S, Yu G, Mbala P, Bres V, et al. Rapid metagenomic identifica-
tion of viral pathogens in clinical samples by real-time nanopore sequencing analysis. Genome Med.
2015; 7:99. PubMed Central PMCID: PMCPMC4587849. https://doi.org/10.1186/s13073-015-0220-9
PMID: 26416663
40. Quick J, Loman NJ, Duraffour S, Simpson JT, Severi E, Cowley L, et al. Real-time, portable genome
sequencing for Ebola surveillance. Nature. 2016; 530(7589):228–32. PubMed Central PMCID:
PMCPMC4817224. https://doi.org/10.1038/nature16996 PMID: 26840485
41. Wang J, Moore NE, Deng YM, Eccles DA, Hall RJ. MinION nanopore sequencing of an influenza
genome. Frontiers in microbiology. 2015; 6:766. PubMed Central PMCID: PMCPMC4540950. https://
doi.org/10.3389/fmicb.2015.00766 PMID: 26347715
42. Garalde DR, Snell EA, Jachimowicz D, Heron AJ, Bruce M, Lloyd J, et al. Highly parallel direct RNA
sequencing on an array of nanopores. bioRxiv. 2016.
43. Jain M, Fiddes IT, Miga KH, Olsen HE, Paten B, Akeson M. Improved data analysis for the MinION
nanopore sequencer. Nature methods. 2015; 12(4):351–6. PubMed Central PMCID:
PMCPMC4907500. https://doi.org/10.1038/nmeth.3290 PMID: 25686389
44. Routh A, Chang MW, Okulicz JF, Johnson JE, Torbett BE. CoVaMa: Co-Variation Mapper for disequi-
librium analysis of mutant loci in viral populations using next-generation sequence data. Methods. 2015.
45. Routh A, Ji P, Jaworski E, Xia Z, Li W, Wagner EJ. Poly(A)-ClickSeq: click-chemistry for next-genera-
tion 30-end sequencing without RNA enrichment or fragmentation. bioRxiv. 2017.
46. Martin M. Cutadapt removes adapter sequences from high-throughput sequencing reads. EMBnetjour-
nal. 2011; 17(1):10–2.
47. Langmead B, Trapnell C, Pop M, Salzberg SL. Ultrafast and memory-efficient alignment of short DNA
sequences to the human genome. Genome Biol. 2009; 10(3):R25. Epub 2009/03/06. PubMed Central
PMCID: PMC2690996. https://doi.org/10.1186/gb-2009-10-3-r25 PMID: 19261174
48. Loman NJ, Quinlan AR. Poretools: a toolkit for analyzing nanopore sequence data. Bioinformatics.
2014; 30(23):3399–401. PubMed Central PMCID: PMCPMC4296151. https://doi.org/10.1093/
bioinformatics/btu555 PMID: 25143291
49. Milne I, Bayer M, Cardle L, Shaw P, Stephen G, Wright F, et al. Tablet—next generation sequence
assembly visualization. Bioinformatics. 2010; 26(3):401–2. Epub 2009/12/08. PubMed Central PMCID:
PMC2815658. https://doi.org/10.1093/bioinformatics/btp666 PMID: 19965881
50. Li H, Handsaker B, Wysoker A, Fennell T, Ruan J, Homer N, et al. The Sequence Alignment/Map format
and SAMtools. Bioinformatics. 2009; 25(16):2078–9. Epub 2009/06/10. PubMed Central PMCID:
PMC2723002. https://doi.org/10.1093/bioinformatics/btp352 PMID: 19505943
51. Lindenbach BD. Measuring HCV infectivity produced in cell culture and in vivo. Methods Mol Biol. 2009;
510:329–36. https://doi.org/10.1007/978-1-59745-394-3_24 PMID: 19009272
52. Selling BH, Rueckert RR. Plaque assay for black beetle virus. J Virol. 1984; 51(1):251–3. PubMed Cen-
tral PMCID: PMCPMC254426. PMID: 6726892
53. van de Waterbeemd M, Fort KL, Boll D, Reinhardt-Szyba M, Routh A, Makarov A, et al. High-fidelity
mass analysis unveils heterogeneity in intact ribosomal particles. Nature methods. 2017; 14(3):283–6.
https://doi.org/10.1038/nmeth.4147 PMID: 28114288
54. Johnson KL, Ball LA. Replication of flock house virus RNAs from primary transcripts made in cells by
RNA polymerase II. J Virol. 1997; 71(4):3323–7. PubMed Central PMCID: PMCPMC191472. PMID:
9060703
55. Routh A, Domitrovic T, Johnson JE. Packaging host RNAs in small RNA viruses: An inevitable conse-
quence of an error-prone polymerase? Cell Cycle. 2012; 11(20). Epub 2012/09/18.
56. Kircher M, Sawyer S, Meyer M. Double indexing overcomes inaccuracies in multiplex sequencing on
the Illumina platform. Nucleic Acids Res. 2012; 40(1):e3. PubMed Central PMCID: PMC3245947.
https://doi.org/10.1093/nar/gkr771 PMID: 22021376
57. Laurence M, Hatzis C, Brash DE. Common contaminants in next-generation sequencing that hinder dis-
covery of low-abundance microbes. PLoS One. 2014; 9(5):e97876. PubMed Central PMCID:
PMCPMC4023998. https://doi.org/10.1371/journal.pone.0097876 PMID: 24837716
58. Kim YN, Lai MM, Makino S. Generation and selection of coronavirus defective interfering RNA with
large open reading frame by RNA recombination and possible editing. Virology. 1993; 194(1):244–53.
https://doi.org/10.1006/viro.1993.1255 PMID: 8386875
Pathways of FHV defective RNA evolution by ClickSeq and the MinION
PLOS Pathogens | https://doi.org/10.1371/journal.ppat.1006365 May 5, 2017 30 / 31

59. Dasgupta R, Cheng LL, Bartholomay LC, Christensen BM. Flock house virus replicates and expresses
green fluorescent protein in mosquitoes. J Gen Virol. 2003; 84(Pt 7):1789–97. https://doi.org/10.1099/
vir.0.18938-0 PMID: 12810873
60. Lindenbach BD, Sgro JY, Ahlquist P. Long-distance base pairing in flock house virus RNA1 regulates
subgenomic RNA3 synthesis and RNA2 replication. J Virol. 2002; 76(8):3905–19. Epub 2002/03/22.
PubMed Central PMCID: PMC136111. https://doi.org/10.1128/JVI.76.8.3905-3919.2002 PMID:
11907230
61. Ball LA. Requirements for the self-directed replication of flock house virus RNA 1. J Virol. 1995; 69
(2):720–7. Epub 1995/02/01. PubMed Central PMCID: PMC188634. PMID: 7815535
62. Eckerle LD, Ball LA. Replication of the RNA segments of a bipartite viral genome is coordinated by a
transactivating subgenomic RNA. Virology. 2002; 296(1):165–76. https://doi.org/10.1006/viro.2002.
1377 PMID: 12036328
63. Albarino CG, Eckerle LD, Ball LA. The cis-acting replication signal at the 3’ end of Flock House virus
RNA2 is RNA3-dependent. Virology. 2003; 311(1):181–91. Epub 2003/07/02. PMID: 12832215
64. Rosskopf JJ, Upton JH 3rd, Rodarte L, Romero TA, Leung MY, Taufer M, et al. A 3’ terminal stem-loop
structure in Nodamura virus RNA2 forms an essential cis-acting signal for RNA replication. Virus Res.
2010; 150(1–2):12–21. Epub 2010/02/24. PubMed Central PMCID: PMC3017585. https://doi.org/10.
1016/j.virusres.2010.02.006 PMID: 20176063
65. Albarino CG, Price BD, Eckerle LD, Ball LA. Characterization and template properties of RNA dimers
generated during flock house virus RNA replication. Virology. 2001; 289(2):269–82. https://doi.org/10.
1006/viro.2001.1125 PMID: 11689050
66. Jain M, Olsen HE, Paten B, Akeson M. The Oxford Nanopore MinION: delivery of nanopore sequencing
to the genomics community. Genome Biol. 2016; 17(1):239. PubMed Central PMCID:
PMCPMC5124260. https://doi.org/10.1186/s13059-016-1103-0 PMID: 27887629
67. Frensing T, Heldt FS, Pflugmacher A, Behrendt I, Jordan I, Flockerzi D, et al. Continuous influenza
virus production in cell culture shows a periodic accumulation of defective interfering particles. PLoS
One. 2013; 8(9):e72288. PubMed Central PMCID: PMCPMC3764112. https://doi.org/10.1371/journal.
pone.0072288 PMID: 24039749
68. White KA, Morris TJ. Nonhomologous RNA recombination in tombusviruses: generation and evolution
of defective interfering RNAs by stepwise deletions. J Virol. 1994; 68(1):14–24. Epub 1994/01/01.
PubMed Central PMCID: PMC236259. PMID: 8254723
69. Stephens PJ, Greenman CD, Fu B, Yang F, Bignell GR, Mudie LJ, et al. Massive genomic rearrange-
ment acquired in a single catastrophic event during cancer development. Cell. 2011; 144(1):27–40.
PubMed Central PMCID: PMCPMC3065307. https://doi.org/10.1016/j.cell.2010.11.055 PMID:
21215367
70. Short JR, Speir JA, Gopal R, Pankratz LM, Lanman J, Schneemann A. Role of Mitochondrial Membrane
Spherules in Flock House Virus Replication. J Virol. 2016; 90(7):3676–83. PubMed Central PMCID:
PMCPMC4794695. https://doi.org/10.1128/JVI.03080-15 PMID: 26792749
Pathways of FHV defective RNA evolution by ClickSeq and the MinION
PLOS Pathogens | https://doi.org/10.1371/journal.ppat.1006365 May 5, 2017 31 / 31