Characterization and Comparison of Escherichia coliTransfer RNAs by Graph Theory based on Secondary...
13
J . theor . Biol . (1999) 197, 193–205 Article No . jtbi.1998.0866, available online at http://www.idealibrary.com on 0022–5193/99/006193 + 13 $30.00/0 7 1999 Academic Press Characterization and Comparison of Escherichia coli Transfer RNAs by Graph Theory based on Secondary Structure C I. B´,* E E. D† E A*‡ *Grupo de Biologı´a Molecular y Teo´rica , Departamento de Biologı´a and †Grupo de Quı´mica Teo´ rica , Departamento de Quı´mica , Facultad de Ciencias , Universidad Nacional de Colombia , Santa Fe de Bogota´ , D.C., Colombia (Received on 4 February 1998, Accepted in revised form on 9 November 1998) We have developed a model to characterize the tRNA structures of Escherichia coli using graph theory. First of all, tRNAs were represented as graphs, whose vertices correspond to nucleotides and the edges to phosphodiester and hydrogen bond linkages. Vertices and edges were weighted using the results of a preliminary quantum study of the nucleotides and the possible coupling between pair bases using the semiempirical method AM1. For each vertex, we defined a nucleotide valence that measures the capability of forming hydrogen bonds. Edges were differentiated by using bond orders. We have proposed weighted structural descriptors—closely related to molecular Randic connectivity and Balaban distance indices—as a distinctive characteristic of each structure. Molecules were characterized by a set of weighted structural descriptors and classified by a clustering method and discriminant function analysis. Two main groups of tRNAs that correspond to the biosynthetic amino acid pathways, in agreement with Wong’s coevolution theory of the genetic code, were obtained. 7 1999 Academic Press Introduction Transfer RNAs (tRNAs) are essential molecules in protein biosynthesis that couple specific amino acids with corresponding codons. This process is achieved by molecular interaction between tRNA and aminoacyl-tRNA synthetases (aaRSs) that assures translation fidelity by accurate discrimination between tRNAs and cognate or non-cognate aaRSs. Structural features, required for tRNA aminoacylation by aaRSs, act as recognition motifs and they must play a major role in maintaining the tRNA amino acid specificity (Sherman & So¨ll, 1996). This work is aimed at exploring a new approach to the concept of structure, that can be applied to tRNA structure and elucidates tRNA structure–function relationships. The character- ization and modeling of tRNA are highly dependent on the concept of molecular structure. It has been commonplace to identify molecular structure with the position and arrangement of atoms in ordinary three-dimensional space. This point of view has prevailed in a variety of fields: from the very well known results of Watson & Crick (1953)—about the molecular geometry of DNA—to the successful determination of mol- ‡Author to whom correspondence should be addressed. E-mail: eandrade.ciencias.ciencias.unal.edu.co.
Transcript of Characterization and Comparison of Escherichia coliTransfer RNAs by Graph Theory based on Secondary...
J. theor. Biol. (1999) 197, 193–205Article No. jtbi.1998.0866, available online at http://www.idealibrary.com on
0022–5193/99/006193+13 $30.00/0 7 1999 Academic Press
Characterization and Comparison of Escherichia coli Transfer RNAs byGraph Theory based on Secondary Structure
C I. B,* E E. D† E A*‡
*Grupo de Biologıa Molecular y Teorica, Departamento de Biologıa and †Grupo deQuımica Teorica, Departamento de Quımica, Facultad de Ciencias, Universidad
Nacional de Colombia, Santa Fe de Bogota, D.C., Colombia
(Received on 4 February 1998, Accepted in revised form on 9 November 1998)
We have developed a model to characterize the tRNA structures of Escherichia coli usinggraph theory. First of all, tRNAs were represented as graphs, whose vertices correspond tonucleotides and the edges to phosphodiester and hydrogen bond linkages. Vertices and edgeswere weighted using the results of a preliminary quantum study of the nucleotides and thepossible coupling between pair bases using the semiempirical method AM1. For each vertex,we defined a nucleotide valence that measures the capability of forming hydrogen bonds.Edges were differentiated by using bond orders.
We have proposed weighted structural descriptors—closely related to molecular Randicconnectivity and Balaban distance indices—as a distinctive characteristic of each structure.Molecules were characterized by a set of weighted structural descriptors and classified by aclustering method and discriminant function analysis. Two main groups of tRNAs thatcorrespond to the biosynthetic amino acid pathways, in agreement with Wong’s coevolutiontheory of the genetic code, were obtained.
7 1999 Academic Press
Introduction
Transfer RNAs (tRNAs) are essential moleculesin protein biosynthesis that couple specific aminoacids with corresponding codons. This process isachieved by molecular interaction betweentRNA and aminoacyl-tRNA synthetases(aaRSs) that assures translation fidelity byaccurate discrimination between tRNAs andcognate or non-cognate aaRSs. Structuralfeatures, required for tRNA aminoacylation byaaRSs, act as recognition motifs and they must
play a major role in maintaining the tRNAamino acid specificity (Sherman & Soll, 1996).
This work is aimed at exploring a newapproach to the concept of structure, that can beapplied to tRNA structure and elucidates tRNAstructure–function relationships. The character-ization and modeling of tRNA are highlydependent on the concept of molecular structure.It has been commonplace to identify molecularstructure with the position and arrangement ofatoms in ordinary three-dimensional space. Thispoint of view has prevailed in a variety of fields:from the very well known results of Watson &Crick (1953)—about the molecular geometry ofDNA—to the successful determination of mol-
‡Author to whom correspondence should be addressed.E-mail: eandrade.ciencias.ciencias.unal.edu.co.
. . ET AL.194
ecular structures for a multitude of biologicallyimportant compounds just to mention one of themost popular cases.
Transfer RNAs are highly differentiatednucleic acids comprised of 74–95 nucleotides thatare folded into a compact three-dimensionalpattern which is believed to accommodate mostof the known tRNA sequences (Schimmel, 1989).tRNA structure has also been modeled in termsof its geometry, i.e. based upon the informationof the three-dimensional structure obtained byX-ray diffraction (Sussman & Kim, 1976; Clark,1978; Woo et al., 1980; Westhof et al., 1985).These conceptions of tRNA structure share theadvantages and disadvantages of the moregeneral molecular structure concept in use.
Molecular structures have been usually treatedas geometric models, in which molecules aredepicted as spatial arrays of nuclei according toa mechanical approach that depends upondistance and angle measurements that varyaccording to the modeling hypothesis andexperimental conditions. Therefore, the sameresults are not always expected, and specificcorrections have to be made for each particularmethod (Villaveces & Daza, 1997). We believethat the concept of molecular structure is richerthan the simple geometrical relationships ofdistances between atoms. The mechanistic viewthat proposes a one to one correlation betweenmolecular structure and molecular geometry, hasprevented the development of alternative defi-nitions of molecular structure. Hence, it wouldbe more adequate to regard geometry at most asan approximation to what the concept ofmolecular structure could be.
New theoretical approaches in mathematicalchemistry, such as graph theory and topologymight be helpful to uncover informationunderlying in a set of ‘‘structures’’ (Villaveces &Daza, 1990, 1997; Mezey, 1993; Bonchev & Seitz,1997; Rouvray, 1997). These new tools are beingexplored in order to provide a more rigorousapproach to the concept of molecular structure;so one might hope that it would be possible infuture to construct a robust theory of molecularstructure surpassing the limitations of the naıvesemiclassical theory founded on mechanicalanalogies, by aiming to free it from the strait
jacket imposed by the paradigm of a uniquegeometry.
A key idea, developed during the second halfof the nineteenth century, is that atoms have avalence, making it possible to derive a structuralformula. Thus, atomic composition is notsufficient to define a molecular structure but it isnecessary to know how the component atoms arerelated to, that is which atoms are bonded towhich. A structural formula in the classicalchemical sense is a collection of symbols withlines joining them; sometimes single, sometimesdouble or even triple; and it is the existence ofthese links between atoms that carries the maininformation about the chemical properties of acompound. A chemical bond is a particularrelationship between a pair of atoms. Thecollection of atoms and bonds constituting amolecule may be thought of as a mathematicalobject whose elements are the atoms and pairs ofbonded atoms; together they form the kind ofstructure that mathematicians call a graph(Harary, 1969). Its pictorial representation hasbeen traditionally called a chemical structuralformula.
The graphical formula, much more than thetheory of atomic arrangements, became anespecially concise method of representing a greatvariety of chemical knowledge. That is relation-ships of chemical neighborhood—understoodin the sense of which atoms are linked towhich—are more fundamental than the physicalor geometrical questions of interatomic distancesand angles. This consideration leaves us with anotion of molecular structure nearer to that ofButlerov (1861), and with a mathematical graphas a better tool to represent structures than anensemble of geometrical points.
A complete chemical graph is then a structurecomposed of a set of atoms, 4vi5, and a set ofpairs of atoms 4(vi , vj )5 denoting which atomsare bonded and denoted by G: (4vi5, 4(vi , vj )5).The elements of the set 4vi5 have been calledvertices and the elements of 4(vi , vj )5 are knownas edges. This approach posits the existence ofgraph-theoretical invariants, called the descrip-tors or indices allowing a characterization of amolecular structure (Trinajstic, 1983; Kier &Hall, 1986; Randic et al., 1988). These indices inthe first instance are based on the connectivity
195
between the vertices and some other propertiesof the graph (Randic, 1975, 1984; Balaban, 1985;Mihalic & Trinajstic, 1992). Chemical graphs canbe used to represent a variety of chemical objectssuch as molecules, reactions, crystals, polymersand clusters (Mihalic & Trinajstic, 1992); wepropose that this approach can be extended toRNA, DNA and proteins, where vertices map tomonomeric units.
Two of the more relevant indices used inmolecular characterization are those of Randic(Randic, 1975; Randic & Trinajstic, 1994) andBalaban (1985), that exhibit high discriminatingcapacity. The Randic indices x are based on aconnectivity matrix and were first proposed asthe sum of bond contributions. The index isdefined as:
x1 = sbonds
(mi × nj )−1/2,
where mi and nj are the valences or the numberof incident edges to each vertex. The index wasgeneralized later by introducing ‘‘higher’’ con-nectivities which can be viewed as subgraphsassigned to molecular fragments of differentlength. These subgraphs are called paths inwhich no vertex occurs more than once.Furthermore:
xL = spaths
(mi × nj . . .× zk )−1/2,
where L is the path length, i.e. the number ofbond occurrences between those vertices thatdefined the path.
On the other hand, Balaban index J (Balaban,1985) was constructed from the distance matrixD and is calculated as follows:
J=K
u(G)+1s
bonds
(di × dj )−1/2
and
di = sn
i=1
(D)ij ,
where di stands for the sum of distances fromevery vertex i to the others. Each element of Dis the length of the shortest path between thevertices i and j in G (Harary, 1969). Thecyclomatic number u(G) is the number ofindependent cycles in G and it is related to K(number of edges) and V (number of vertices) byEuler’s formula u(G)=K−V+1. The indexencodes both the distance among all verticesand the existence of cycles, so recuperatingin an abstract way the concept of molecularentanglement.
However, aiming to find a rigorous model ofstructure, we suggest that it is important to builda model which embraces, besides molecularconnectivity, other concepts like interactionpotentials between atoms or fragments, andsome interactions with the molecular environ-ment that can be captured by thermodynamicproperties.
One way to introduce interaction potentialsinto the model is by using quantum theory.Thence, a molecular system is represented by itswave function which can be found by solvingthe time-independent Schrodinger equation(McWeeny, 1989; Stewart, 1990; Zerner, 1991;Szabo & Ostlund, 1996). Wave functions allowus to evaluate some chemical properties in orderto characterize the system. Nonetheless, formolecules like tRNA, it is almost impossible tosolve Schrodinger equations with enough pre-cision to be able to account for biologicalbehavior. Therefore, we propose that quantumchemistry may be used to identify univocallysome fragments; in our case we have consideredthat nucleotides and some base pairs exhibitsome properties that enable us to distinguishamong them.
Finally, we consider two ways in whichthermodynamic properties can be incorporatedinto the model. Direct thermodynamic measure-ments, if available, may be used as descriptors.Otherwise, thermodynamics appear in the modelin an indirect way, as happens when we usesemiempirical quantum programs which employheat of formation as a parameter (Stewart, 1990;Zerner, 1991) or when we handle secondarystructure prediction programs that use freeenergy minimization inferred from previous
. . ET AL.196
empirical measurements (Jaeger et al., 1990;Lybrand, 1990; McCaskill, 1990).
Materials and Methods
We have used the program RNADRAW 1.01(Matzura, 1995) to predict and test alignmentsreported by the European Laboratory ofMolecular Biology, 42 sequences were used inthis analysis. However, it was assumed thatmodified nucleotides cannot make hydrogenbonds, rendering a base pairing unattainable(except for pseudouridine which is able to couplewith Guanine and Adenine). tRNA sequencenumbers are RA1660, RA1661, RA1662,RC1660, RD1660, RE1660, RE1661, RE1662,RF1660, RG1660, RG1661, RG1662, RH1660,RI1660, RI1661, RI1662, RK1660, RL1660,RL1661, RL1662, RM1660, RN1660, RQ1660,RQ1661, RR1660, RR1661, RR1662, RR1663,RR1664, RS1660, RS1661, RS1662, RS1663,RS1664, RT1660, RT1661, RV1660, RV1661,RV1662, RW1660, RY1660, RY1661.
All quantum mechanical calculations were runwith GAUSSIAN 94 (Frisch et al., 1995) toobtain AM1 semiempirical wave function.Mulliken atomic charges were calculated foreach isolated nucleotide and bond orders wereestimated from calculations for all possiblecoplanar base pairs with an intermoleculardistance of 2.92 0.04 A� (Westhof et al., 1985).
Modified Randic and Balaban indices werecalculated using NUCLEIA, a Pascal code basedon PCDM2.0 (Oliveros et al., 1995), developedby the authors. All calculations were performedwith double precision.
To quantify structural similarity we have usedclustering analysis. Groups of tRNA moleculeswere then established by UPGMA (unweightedpair group method using arithmetic average) andbased on Euclidean distance. Discriminantfunction analysis is employed to test thestatistical significance of the grouping.
Results
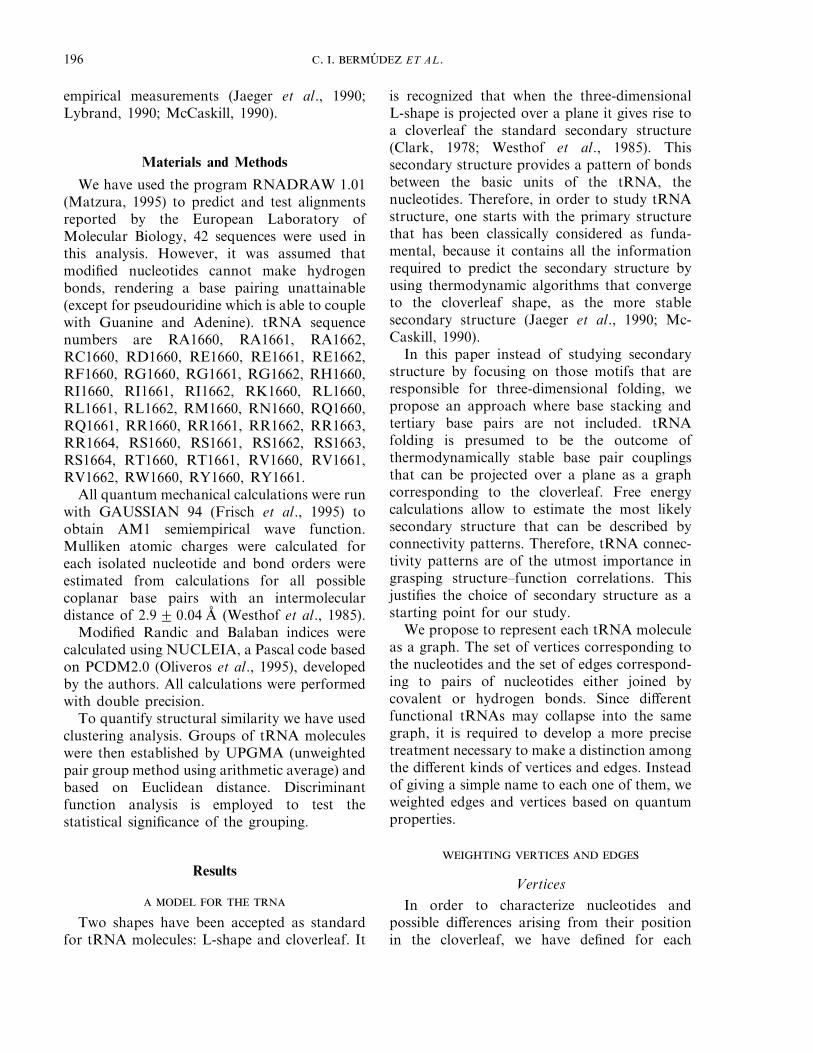
Two shapes have been accepted as standardfor tRNA molecules: L-shape and cloverleaf. It
is recognized that when the three-dimensionalL-shape is projected over a plane it gives rise toa cloverleaf the standard secondary structure(Clark, 1978; Westhof et al., 1985). Thissecondary structure provides a pattern of bondsbetween the basic units of the tRNA, thenucleotides. Therefore, in order to study tRNAstructure, one starts with the primary structurethat has been classically considered as funda-mental, because it contains all the informationrequired to predict the secondary structure byusing thermodynamic algorithms that convergeto the cloverleaf shape, as the more stablesecondary structure (Jaeger et al., 1990; Mc-Caskill, 1990).
In this paper instead of studying secondarystructure by focusing on those motifs that areresponsible for three-dimensional folding, wepropose an approach where base stacking andtertiary base pairs are not included. tRNAfolding is presumed to be the outcome ofthermodynamically stable base pair couplingsthat can be projected over a plane as a graphcorresponding to the cloverleaf. Free energycalculations allow to estimate the most likelysecondary structure that can be described byconnectivity patterns. Therefore, tRNA connec-tivity patterns are of the utmost importance ingrasping structure–function correlations. Thisjustifies the choice of secondary structure as astarting point for our study.
We propose to represent each tRNA moleculeas a graph. The set of vertices corresponding tothe nucleotides and the set of edges correspond-ing to pairs of nucleotides either joined bycovalent or hydrogen bonds. Since differentfunctional tRNAs may collapse into the samegraph, it is required to develop a more precisetreatment necessary to make a distinction amongthe different kinds of vertices and edges. Insteadof giving a simple name to each one of them, weweighted edges and vertices based on quantumproperties.
Vertices
In order to characterize nucleotides andpossible differences arising from their positionin the cloverleaf, we have defined for each
197
nucleotide a valence bi , as an analogue of atomicvalence, that discriminates among the four maintypes of nucleotides as well as the 23 modifiedstructures present in the tRNA (Table 1). Thisvalence depends on the incident edges, i.e. bonds
on the nucleotide, which are of two classes: thephosphodiester linkage and the binding byhydrogen bonds (regular and non-standardpairs). Thus:
bi = I+(1+H)=q =,
where I is the number of phosphodiester bondsover each nucleotide. H (1 or 0) indicates if thenucleotide is forming hydrogen bonds or not.Finally, q is the sum of the Mulliken atomiccharges of the atoms that would be involved inthe hydrogen bonds; this is a discriminatingfactor among all different types of nucleotides.Atomic charges were calculated from an AM1semiempirical wave function (Dewar et al.,1985).
This valence was used to calculate indicesfollowing the formula proposed by Randic fortheir connectivity indices (Randic, 1975; Randic& Trinajstic, 1994). We calculated indices fromorder one to four, using the following expression:
x1 = sbonds
(bi × bj )−1/2,
x2 = spaths
(bi × bj × bk )−1/2,
x3 = spaths
(bi × bj × bk × bl )−1/2,
x4 = spaths
(bi × bj × bk × bl × bm )−1/2,
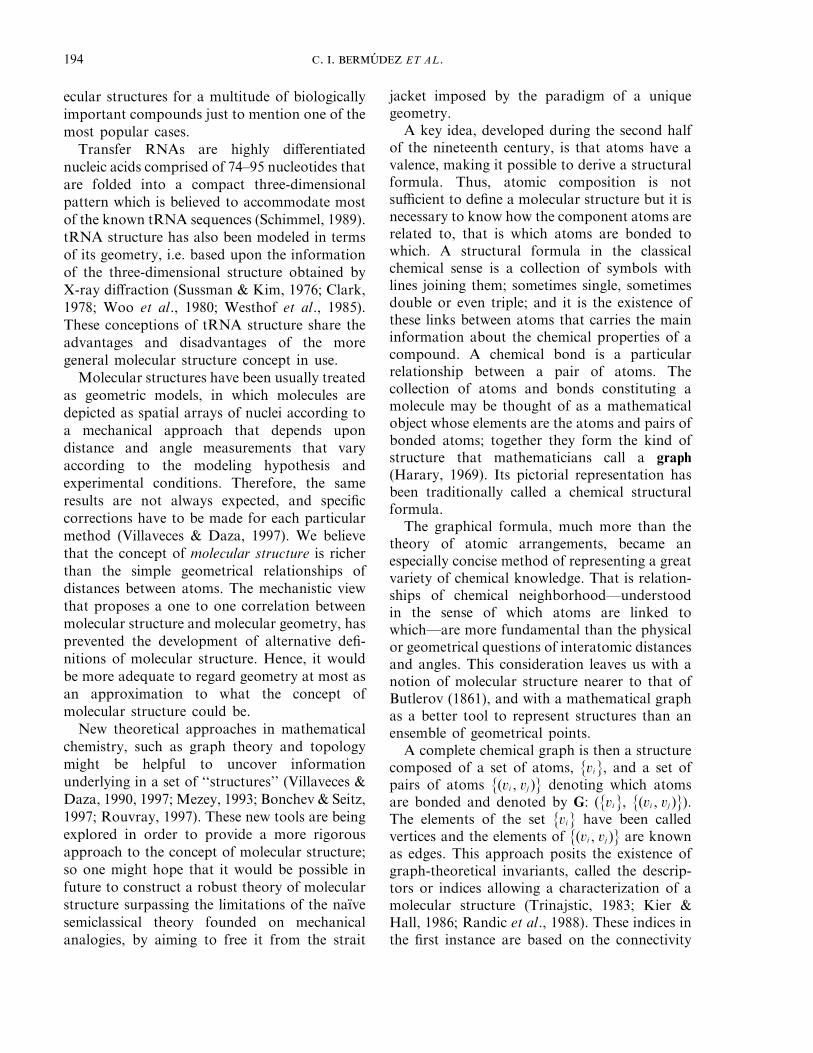
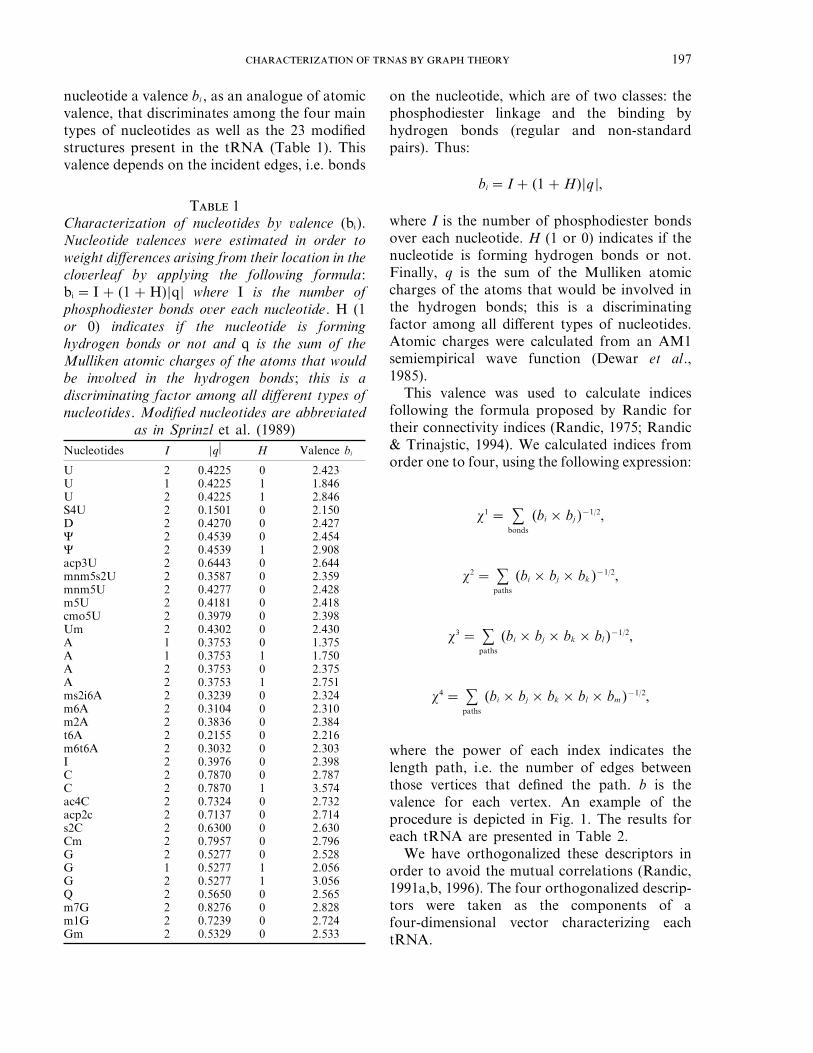
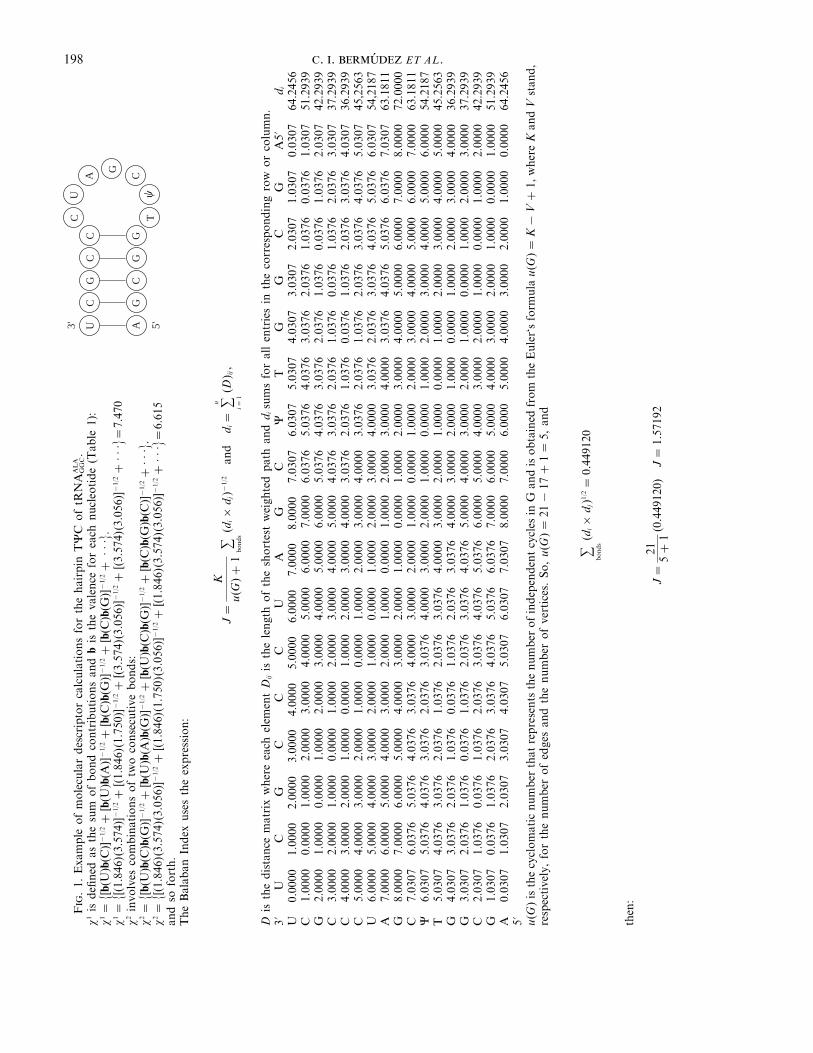
where the power of each index indicates thelength path, i.e. the number of edges betweenthose vertices that defined the path. b is thevalence for each vertex. An example of theprocedure is depicted in Fig. 1. The results foreach tRNA are presented in Table 2.
We have orthogonalized these descriptors inorder to avoid the mutual correlations (Randic,1991a,b, 1996). The four orthogonalized descrip-tors were taken as the components of afour-dimensional vector characterizing eachtRNA.
T 1Characterization of nucleotides by valence (bi).Nucleotide valences were estimated in order toweight differences arising from their location in thecloverleaf by applying the following formula:bi = I+ (1+H)=q= where I is the number ofphosphodiester bonds over each nucleotide. H (1or 0) indicates if the nucleotide is forminghydrogen bonds or not and q is the sum of theMulliken atomic charges of the atoms that wouldbe involved in the hydrogen bonds; this is adiscriminating factor among all different types ofnucleotides. Modified nucleotides are abbreviated
as in Sprinzl et al. (1989)Nucleotides I =q \ H Valence bi
U 2 0.4225 0 2.423U 1 0.4225 1 1.846U 2 0.4225 1 2.846S4U 2 0.1501 0 2.150D 2 0.4270 0 2.427C 2 0.4539 0 2.454C 2 0.4539 1 2.908acp3U 2 0.6443 0 2.644mnm5s2U 2 0.3587 0 2.359mnm5U 2 0.4277 0 2.428m5U 2 0.4181 0 2.418cmo5U 2 0.3979 0 2.398Um 2 0.4302 0 2.430A 1 0.3753 0 1.375A 1 0.3753 1 1.750A 2 0.3753 0 2.375A 2 0.3753 1 2.751ms2i6A 2 0.3239 0 2.324m6A 2 0.3104 0 2.310m2A 2 0.3836 0 2.384t6A 2 0.2155 0 2.216m6t6A 2 0.3032 0 2.303I 2 0.3976 0 2.398C 2 0.7870 0 2.787C 2 0.7870 1 3.574ac4C 2 0.7324 0 2.732acp2c 2 0.7137 0 2.714s2C 2 0.6300 0 2.630Cm 2 0.7957 0 2.796G 2 0.5277 0 2.528G 1 0.5277 1 2.056G 2 0.5277 1 3.056Q 2 0.5650 0 2.565m7G 2 0.8276 0 2.828m1G 2 0.7239 0 2.724Gm 2 0.5329 0 2.533
U A
C G
G C
C G
C
C TC
UA
G
G
3' 5'
. . ET AL.198F
.1.
Exa
mpl
eof
mol
ecul
arde
script
orca
lcul
atio
nsfo
rth
eha
irpi
nT
CC
oftR
NA
AL
AG
GC.
x1
isde
fined
asth
esu
mof
bond
cont
ribu
tion
san
db
isth
eva
lenc
efo
rea
chnu
cleo
tide
(Tab
le1)
:x
1=
4[b(
U)b
(C)]
−1/
2+
[b(U
)b(A
)]−
1/2+
[b(C
)b(G
)]−
1/2+
[b(C
)b(G
)]−
1/2+
···5
.x
1=
4[(1
.846
)(3.
574)
]−1/
2+
[(1.
846)
(1.7
50)]
−1/
2+
[(3.
574)
(3.0
56)]
−1/
2+
[(3.
574)
(3.0
56)]
−1/
2+
···5
=7.
470
x2
invo
lves
com
bina
tion
sof
two
cons
ecut
ive
bond
s:x
2=
4[b(
U)b
(C)b
(G)]
−1/
2+
[b(U
)b(A
)b(G
)]−
1/2+
[b(U
)b(C
)b(G
)]−
1/2+
[b(C
)b(G
)b(C
)]−
1/2+
···5
.x
2=
4[(1
.846
)(3.
574)
(3.0
56)]
−1/
2+
[(1.
846)
(1.7
50)(
3.05
6)]−
1/2+
[(1.
846)
(3.5
74)(
3.05
6)]−
1/2+
···5
=6.
615
and
sofo
rth.
The
Bal
aban
Inde
xus
esth
eex
pres
sion
:
J=
K
u(G
)+1
sbo
nds
(di×
d j)−
1/2
and
d i=
sn
i=1
(D) ij
,
Dis
the
dist
ance
mat
rix
whe
reea
chel
emen
tD
ijis
the
leng
thof
the
shor
test
wei
ghte
dpa
than
dd i
sum
sfo
ral
len
trie
sin
the
corr
espo
ndin
gro
wor
colu
mn.
3'U
CG
CC
CU
AG
CC
TG
GC
GA
5'd i
U0.
0000
1.00
002.
0000
3.00
004.
0000
5.00
006.
0000
7.00
008.
0000
7.03
076.
0307
5.03
074.
0307
3.03
072.
0307
1.03
070.
0307
64.2
456
C1.
0000
0.00
001.
0000
2.00
003.
0000
4.00
005.
0000
6.00
007.
0000
6.03
765.
0376
4.03
763.
0376
2.03
761.
0376
0.03
761.
0307
51.2
939
G2.
0000
1.00
000.
0000
1.00
002.
0000
3.00
004.
0000
5.00
006.
0000
5.03
764.
0376
3.03
762.
0376
1.03
760.
0376
1.03
762.
0307
42.2
939
C3.
0000
2.00
001.
0000
0.00
001.
0000
2.00
003.
0000
4.00
005.
0000
4.03
763.
0376
2.03
761.
0376
0.03
761.
0376
2.03
763.
0307
37.2
939
C4.
0000
3.00
002.
0000
1.00
000.
0000
1.00
002.
0000
3.00
004.
0000
3.03
762.
0376
1.03
760.
0376
1.03
762.
0376
3.03
764.
0307
36.2
939
C5.
0000
4.00
003.
0000
2.00
001.
0000
0.00
001.
0000
2.00
003.
0000
4.00
003.
0376
2.03
761.
0376
2.03
763.
0376
4.03
765.
0307
45,2
563
U6.
0000
5.00
004.
0000
3.00
002.
0000
1.00
000.
0000
1.00
002.
0000
3.00
004.
0000
3.03
762.
0376
3.03
764.
0376
5.03
766.
0307
54,2
187
A7.
0000
6.00
005.
0000
4.00
003.
0000
2.00
001.
0000
0.00
001.
0000
2.00
003.
0000
4.00
003.
0376
4.03
765.
0376
6.03
767.
0307
63.1
811
G8.
0000
7.00
006.
0000
5.00
004.
0000
3.00
002.
0000
1.00
000.
0000
1.00
002.
0000
3.00
004.
0000
5.00
006.
0000
7.00
008.
0000
72.0
000
C7.
0307
6.03
765.
0376
4.03
763.
0376
4.00
003.
0000
2.00
001.
0000
0.00
001.
0000
2.00
003.
0000
4.00
005.
0000
6.00
007.
0000
63.1
811
C6.
0307
5.03
764.
0376
3.03
762.
0376
3.03
764.
0000
3.00
002.
0000
1.00
000.
0000
1.00
002.
0000
3.00
004.
0000
5.00
006.
0000
54.2
187
T5.
0307
4.03
763.
0376
2.03
761.
0376
2.03
763.
0376
4.00
003.
0000
2.00
001.
0000
0.00
001.
0000
2.00
003.
0000
4.00
005.
0000
45.2
563
G4.
0307
3.03
762.
0376
1.03
760.
0376
1.03
762.
0376
3.03
764.
0000
3.00
002.
0000
1.00
000.
0000
1.00
002.
0000
3.00
004.
0000
36.2
939
G3.
0307
2.03
761.
0376
0.03
761.
0376
2.03
763.
0376
4.03
765.
0000
4.00
003.
0000
2.00
001.
0000
0.00
001.
0000
2.00
003.
0000
37.2
939
C2.
0307
1.03
760.
0376
1.03
762.
0376
3.03
764.
0376
5.03
766.
0000
5.00
004.
0000
3.00
002.
0000
1.00
000.
0000
1.00
002.
0000
42.2
939
G1.
0307
0.03
761.
0376
2.03
763.
0376
4.03
765.
0376
6.03
767.
0000
6.00
005.
0000
4.00
003.
0000
2.00
001.
0000
0.00
001.
0000
51.2
939
A0.
0307
1.03
072.
0307
3.03
074.
0307
5.03
076.
0307
7.03
078.
0000
7.00
006.
0000
5.00
004.
0000
3.00
002.
0000
1.00
000.
0000
64.2
456
5' u(G
)is
the
cycl
omat
icnu
mbe
rth
atre
pres
ents
the
num
ber
ofin
depe
nden
tcy
cles
inG
and
isob
tain
edfr
omth
eE
uler
‘sfo
rmul
au(
G)=
K−
V+
1,w
here
Kan
dV
stan
d,re
spec
tive
ly,fo
rth
enu
mbe
rof
edge
san
dth
enu
mbe
rof
vert
ices
.So
,u(
G)=
21−
17+
1=
5,an
d
sbo
nds
(di×
d j)1/
2=
0.44
9120
then
:
J=
215
+1
(0.4
4912
0)J
=1.
5719
2
199
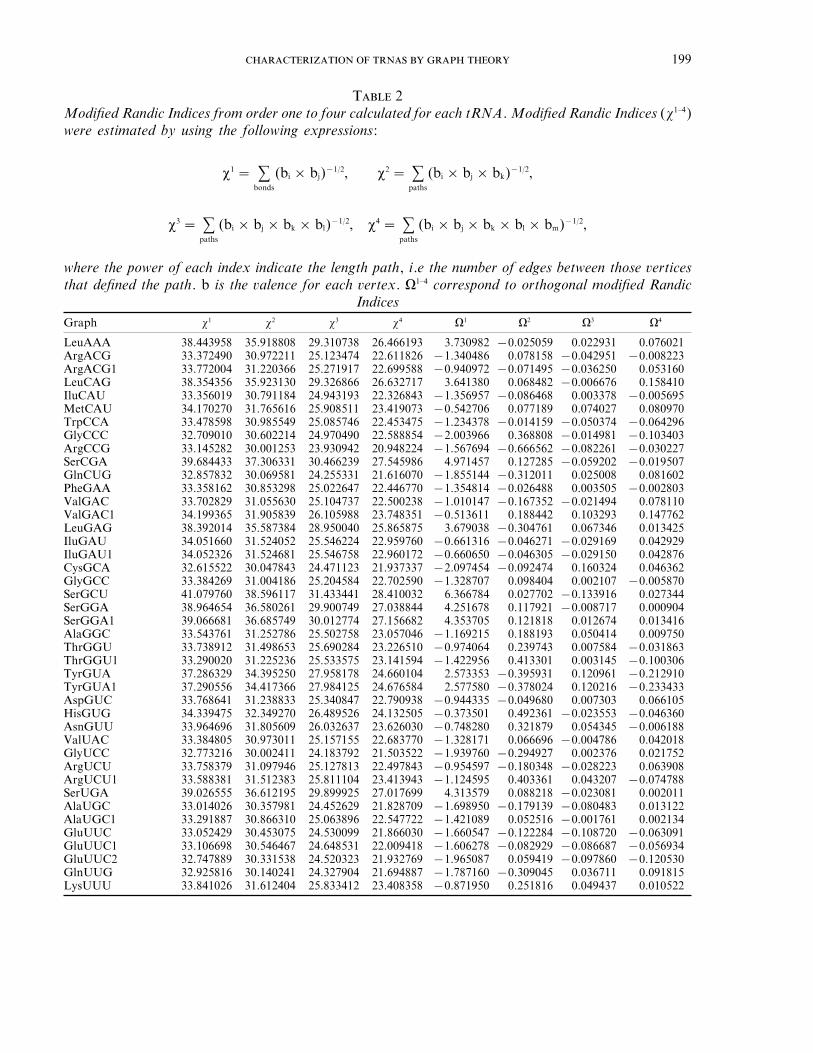
T 2Modified Randic Indices from order one to four calculated for each tRNA. Modified Randic Indices (x1–4)were estimated by using the following expressions:
x1 = sbonds
(bi ×bj)−1/2, x2 = spaths
(bi ×bj ×bk)−1/2,
x3 = spaths
(bi ×bj ×bk ×bl)−1/2, x4 = spaths
(bi ×bj ×bk ×bl ×bm)−1/2,
where the power of each index indicate the length path, i.e the number of edges between those verticesthat defined the path. b is the valence for each vertex. V1–4 correspond to orthogonal modified Randic
IndicesGraph x1 x2 x3 x4 V1 V2 V3 V4
LeuAAA 38.443958 35.918808 29.310738 26.466193 3.730982 −0.025059 0.022931 0.076021ArgACG 33.372490 30.972211 25.123474 22.611826 −1.340486 0.078158 −0.042951 −0.008223ArgACG1 33.772004 31.220366 25.271917 22.699588 −0.940972 −0.071495 −0.036250 0.053160LeuCAG 38.354356 35.923130 29.326866 26.632717 3.641380 0.068482 −0.006676 0.158410IluCAU 33.356019 30.791184 24.943193 22.326843 −1.356957 −0.086468 0.003378 −0.005695MetCAU 34.170270 31.765616 25.908511 23.419073 −0.542706 0.077189 0.074027 0.080970TrpCCA 33.478598 30.985549 25.085746 22.453475 −1.234378 −0.014159 −0.050374 −0.064296GlyCCC 32.709010 30.602214 24.970490 22.588854 −2.003966 0.368808 −0.014981 −0.103403ArgCCG 33.145282 30.001253 23.930942 20.948224 −1.567694 −0.666562 −0.082261 −0.030227SerCGA 39.684433 37.306331 30.466239 27.545986 4.971457 0.127285 −0.059202 −0.019507GlnCUG 32.857832 30.069581 24.255331 21.616070 −1.855144 −0.312011 0.025008 0.081602PheGAA 33.358162 30.853298 25.022647 22.446770 −1.354814 −0.026488 0.003505 −0.002803ValGAC 33.702829 31.055630 25.104737 22.500238 −1.010147 −0.167352 −0.021494 0.078110ValGAC1 34.199365 31.905839 26.105988 23.748351 −0.513611 0.188442 0.103293 0.147762LeuGAG 38.392014 35.587384 28.950040 25.865875 3.679038 −0.304761 0.067346 0.013425IluGAU 34.051660 31.524052 25.546224 22.959760 −0.661316 −0.046271 −0.029169 0.042929IluGAU1 34.052326 31.524681 25.546758 22.960172 −0.660650 −0.046305 −0.029150 0.042876CysGCA 32.615522 30.047843 24.471123 21.937337 −2.097454 −0.092474 0.160324 0.046362GlyGCC 33.384269 31.004186 25.204584 22.702590 −1.328707 0.098404 0.002107 −0.005870SerGCU 41.079760 38.596117 31.433441 28.410032 6.366784 0.027702 −0.133916 0.027344SerGGA 38.964654 36.580261 29.900749 27.038844 4.251678 0.117921 −0.008717 0.000904SerGGA1 39.066681 36.685749 30.012774 27.156682 4.353705 0.121818 0.012674 0.013416AlaGGC 33.543761 31.252786 25.502758 23.057046 −1.169215 0.188193 0.050414 0.009750ThrGGU 33.738912 31.498653 25.690284 23.226510 −0.974064 0.239743 0.007584 −0.031863ThrGGU1 33.290020 31.225236 25.533575 23.141594 −1.422956 0.413301 0.003145 −0.100306TyrGUA 37.286329 34.395250 27.958178 24.660104 2.573353 −0.395931 0.120961 −0.212910TyrGUA1 37.290556 34.417366 27.984125 24.676584 2.577580 −0.378024 0.120216 −0.233433AspGUC 33.768641 31.238833 25.340847 22.790938 −0.944335 −0.049680 0.007303 0.066105HisGUG 34.339475 32.349270 26.489526 24.132505 −0.373501 0.492361 −0.023553 −0.046360AsnGUU 33.964696 31.805609 26.032637 23.626030 −0.748280 0.321879 0.054345 −0.006188ValUAC 33.384805 30.973011 25.157155 22.683770 −1.328171 0.066696 −0.004786 0.042018GlyUCC 32.773216 30.002411 24.183792 21.503522 −1.939760 −0.294927 0.002376 0.021752ArgUCU 33.758379 31.097946 25.127813 22.497843 −0.954597 −0.180348 −0.028223 0.063908ArgUCU1 33.588381 31.512383 25.811104 23.413943 −1.124595 0.403361 0.043207 −0.074788SerUGA 39.026555 36.612195 29.899925 27.017699 4.313579 0.088218 −0.023081 0.002011AlaUGC 33.014026 30.357981 24.452629 21.828709 −1.698950 −0.179139 −0.080483 0.013122AlaUGC1 33.291887 30.866310 25.063896 22.547722 −1.421089 0.052516 −0.001761 0.002134GluUUC 33.052429 30.453075 24.530099 21.866030 −1.660547 −0.122284 −0.108720 −0.063091GluUUC1 33.106698 30.546467 24.648531 22.009418 −1.606278 −0.082929 −0.086687 −0.056934GluUUC2 32.747889 30.331538 24.520323 21.932769 −1.965087 0.059419 −0.097860 −0.120530GlnUUG 32.925816 30.140241 24.327904 21.694887 −1.787160 −0.309045 0.036711 0.091815LysUUU 33.841026 31.612404 25.833412 23.408358 −0.871950 0.251816 0.049437 0.010522
. . ET AL.200
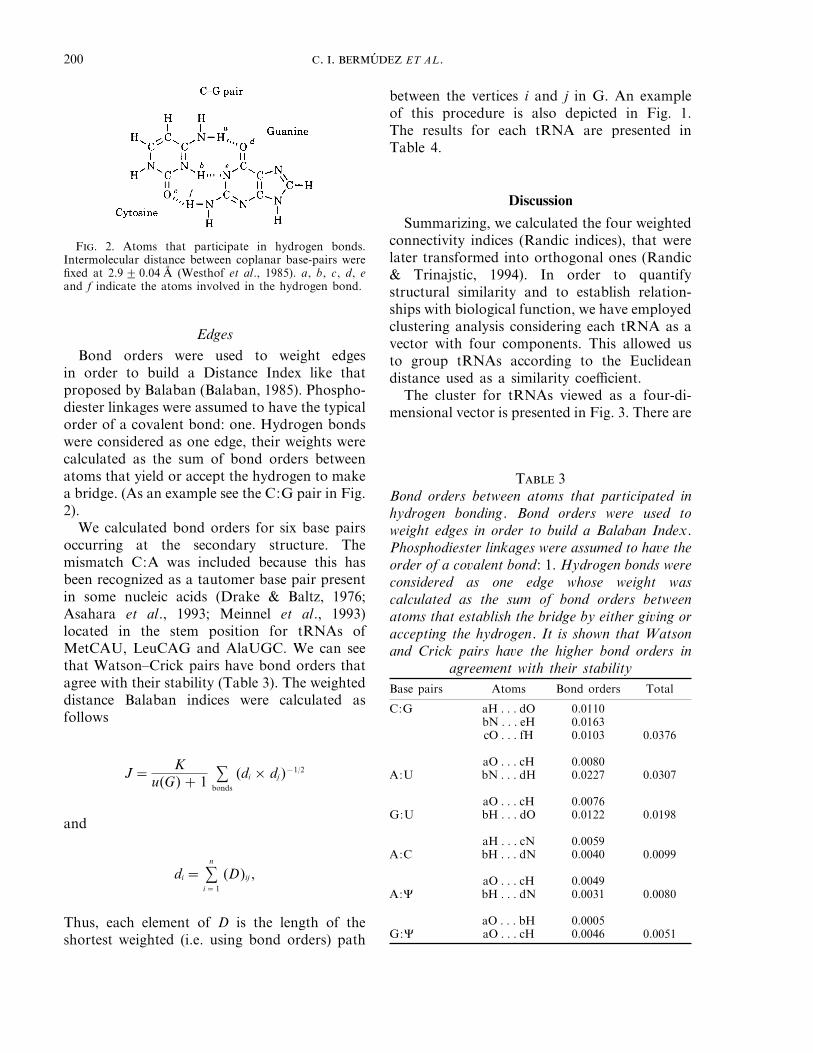
F. 2. Atoms that participate in hydrogen bonds.Intermolecular distance between coplanar base-pairs werefixed at 2.92 0.04 A� (Westhof et al., 1985). a, b, c, d, eand f indicate the atoms involved in the hydrogen bond.
between the vertices i and j in G. An exampleof this procedure is also depicted in Fig. 1.The results for each tRNA are presented inTable 4.
Discussion
Summarizing, we calculated the four weightedconnectivity indices (Randic indices), that werelater transformed into orthogonal ones (Randic& Trinajstic, 1994). In order to quantifystructural similarity and to establish relation-ships with biological function, we have employedclustering analysis considering each tRNA as avector with four components. This allowed usto group tRNAs according to the Euclideandistance used as a similarity coefficient.
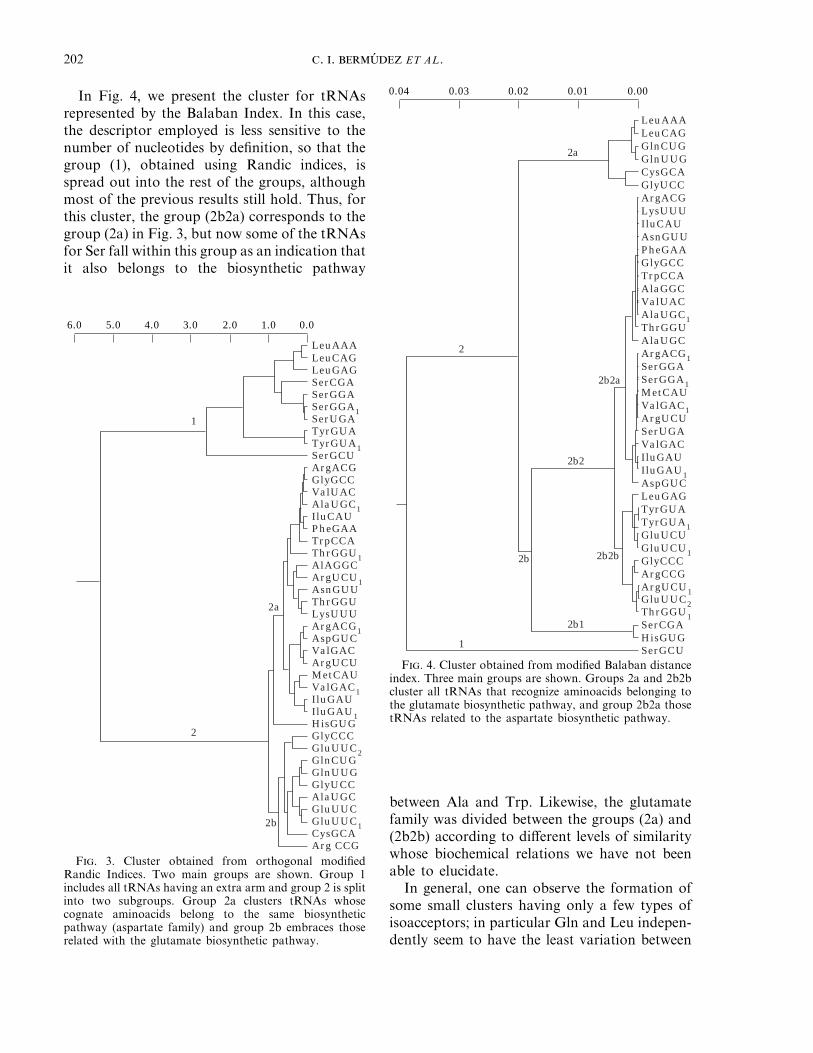
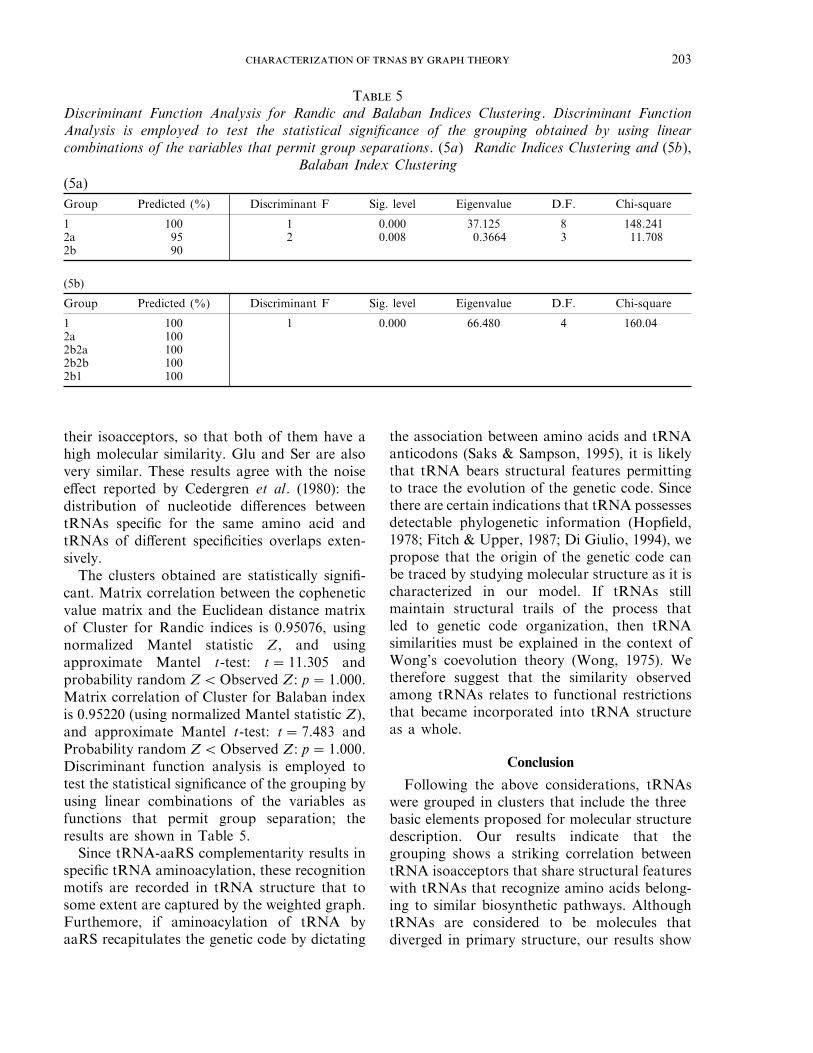
The cluster for tRNAs viewed as a four-di-mensional vector is presented in Fig. 3. There are
Edges
Bond orders were used to weight edgesin order to build a Distance Index like thatproposed by Balaban (Balaban, 1985). Phospho-diester linkages were assumed to have the typicalorder of a covalent bond: one. Hydrogen bondswere considered as one edge, their weights werecalculated as the sum of bond orders betweenatoms that yield or accept the hydrogen to makea bridge. (As an example see the C:G pair in Fig.2).
We calculated bond orders for six base pairsoccurring at the secondary structure. Themismatch C:A was included because this hasbeen recognized as a tautomer base pair presentin some nucleic acids (Drake & Baltz, 1976;Asahara et al., 1993; Meinnel et al., 1993)located in the stem position for tRNAs ofMetCAU, LeuCAG and AlaUGC. We can seethat Watson–Crick pairs have bond orders thatagree with their stability (Table 3). The weighteddistance Balaban indices were calculated asfollows
J=K
u(G)+1s
bonds
(di × dj )−1/2
and
di = sn
i=1
(D)ij ,
Thus, each element of D is the length of theshortest weighted (i.e. using bond orders) path
T 3Bond orders between atoms that participated inhydrogen bonding. Bond orders were used toweight edges in order to build a Balaban Index.Phosphodiester linkages were assumed to have theorder of a covalent bond: 1. Hydrogen bonds wereconsidered as one edge whose weight wascalculated as the sum of bond orders betweenatoms that establish the bridge by either giving oraccepting the hydrogen. It is shown that Watsonand Crick pairs have the higher bond orders in
agreement with their stabilityBase pairs Atoms Bond orders Total
C:G aH . . . dO 0.0110bN . . . eH 0.0163cO . . . fH 0.0103 0.0376
aO . . . cH 0.0080A:U bN . . . dH 0.0227 0.0307
aO . . . cH 0.0076G:U bH . . . dO 0.0122 0.0198
aH . . . cN 0.0059A:C bH . . . dN 0.0040 0.0099
aO . . . cH 0.0049A:C bH . . . dN 0.0031 0.0080
aO . . . bH 0.0005G:C aO . . . cH 0.0046 0.0051
201
T 4Modified Balaban Index for each tRNA. Theweighted Balaban index was calculated accordingto:
J=K
u(G)+1s
bonds
(di ×dj)−1/2 di = sn
i=1
(D)ij,
D is the distance matrix where each element Dij isthe length of the shortest weighted path and d sumsfor all entries in the corresponding row or column.u(G) is the cyclomatic number that represents thenumber of independent cycles in G and obtainedfrom the Euler’s formula u(G)=K−V+1,where K and V stand, respectively, for the number
of edges and the number of verticestRNAgraph V K u(G) S(di .dj )−1/2 J
LeuAAA 87 111 25 0.165236 0.705431ArgACG 76 96 21 0.157794 0.688556ArgACG1 77 97 21 0.155746 0.686698LeuCAG 87 111 25 0.165320 0.705789IluCAU 76 96 21 0.157792 0.688547MetCAU 77 97 21 0.155752 0.686725TrpCCA 76 96 21 0.157749 0.688359GlyCCC 74 94 21 0.162343 0.693647ArgCCG 77 96 20 0.151641 0.693216SerCGA 90 115 26 0.157449 0.670616GlnCUG 75 94 20 0.157786 0.706280PheGAA 76 96 21 0.157778 0.688486ValGAC 77 97 21 0.155706 0.686522ValGAC1 77 97 21 0.155736 0.686654LeuGAG 87 110 24 0.156851 0.690144IluGAU 77 97 21 0.155814 0.686998IluGAU1 77 97 21 0.155814 0.686998CysGCA 74 93 20 0.160638 0.711397GlyGCC 76 96 21 0.157781 0.688499SerGCU 93 119 27 0.153401 0.651954SerGGA 88 112 25 0.159415 0.686711SerGGA1 88 112 25 0.159415 0.686711AlaGGC 76 96 21 0.157760 0.688407ThrGGU 76 96 21 0.157720 0.688233ThrGGU1 75 95 21 0.160377 0.692537TyrGUA 85 107 23 0.155050 0.691265TyrGUA1 85 107 23 0.155050 0.691265AspGUC 77 97 21 0.155889 0.687329HisGUG 77 98 22 0.157594 0.671487AsnGUU 76 96 21 0.157791 0.688543ValUAC 76 96 21 0.157756 0.688390GlyUCC 75 94 20 0.158572 0.709798ArgUCU 77 97 21 0.155728 0.686619ArgUCU1 75 95 21 0.160427 0.692753SerUGA 88 112 25 0.159445 0.686840AlaUGC 76 96 21 0.157927 0.689136AlaUGC1 76 96 21 0.157756 0.688390GluUUC 76 96 21 0.158335 0.690916GluUUC1 76 96 21 0.158260 0.690589GluUUC2 75 95 21 0.160431 0.692770GlnUUG 75 94 20 0.157750 0.706119LysUUU 76 96 21 0.157794 0.688556
two main groups: the first one (1) corresponds totRNAs that have an extra arm (tRNAs for Ser,Leu and Tyr) and the second one (2) the tRNAswithout an extra arm. The second group isdivided into two subgroups (2a) and (2b); in thesubgroup (2a) the tRNA corresponding to Hishas a tendency to become isolated. Theremaining tRNAs in this subgroup have incommon that their cognate aminoacids belong tothe same biosynthetic pathway: aspartate family;i.e. the tRNAs corresponding to Asp, Asn, Lys,Thr, Met and Ile (Wood et al., 1981). ThetRNAs for Gly and Ala also are present in thisgroup and are related with the metabolism ofpyruvate, glycerate and glioxylate (Greenberg,1969). The tRNAs for Trp may be relatedwith Ala via Ser, so to say that Trp being abiosynthetic product of Ser, can be considered byextension as a member of the same biosyntheticpathway. In the subgroup (2a) there are sometRNAs that can be considered as exceptions: thetRNAs for Phe, Val and Arg. Phe and Val arerelated by a common biosynthetic pathway withTyr and Leu, respectively (Wong, 1975), buttRNAs for these last two amino acids are in thefirst group (1). tRNAs for Arg will be discussedafterwards.
The subgroup (2b) gathers tRNAs thatrecognize amino acids belonging to the gluta-mate family: Gln, Glu, and Arg (Wood et al.,1981). However, most of the isoacceptors for Arghave a tendency to cluster within group (2a). Thebiosynthetic pathway can be extended to includethe tRNAs for Gly and Cys. The former can berelated with the tRNAs of Ala via the mentionedmetabolic pathway and the latter with aproduct of the Ser family. Although, it mustbe remembered that Ser belongs to the firstgroup (1). Glu, Asp and Ala are known to beinterconvertible via the tricarboxylate cycle(Wong, 1975), a fact that justifies our results,since some structural ambiguity was detected forthe tRNAs isoacceptors of Ala, Gly and Argwhich showed a tendency to be either in thesubgroup (2a) or subgroup (2b). This ambiguityis justified for Ala and Gly since theirisoacceptors play the role of bridges extendingthe biosynthetic pathways of the aspartate andglutamate families.
LeuAAALeuCAGGlnCUGGlnUUGCysGCAGlyUCCArgACGLysUUUIluCAUAsnGUUPheGAAGlyGCCTrpCCAAlaGGCValUACAlaUGC1ThrGGUAlaUGCArgACG1SerGGASerGGA1MetCAUValGAC1ArgUCUSerUGAValGACIluGAUIluGAU1AspGUCLeuGAGTyrGUATyrGUA1GluUCUGluUCU1GlyCCCArgCCGArgUCU1GluUUC2ThrGGU1SerCGAHisGUGSerGCU
0.04 0.03 0.02 0.01 0.00
2b
1
2
2b2
2a
2b1
2b2b
2b2a
6.0 5.0 4.0 3.0 2.0 1.0 0.0
LeuAAALeuCAGLeuGAGSerCGASerGGASerGGA1SerUGATyrGUATyrGUA1SerGCUArgACGGlyGCCValUACAlaUGC1IluCAUPheGAATrpCCAThrGGU1AlAGGCArgUCU1AsnGUUThrGGULysUUUArgACG1AspGUCValGACArgUCUMetCAUValGAC1IluGAUIluGAU1HisGUGGlyCCCGluUUC2GlnCUGGlnUUGGlyUCCAlaUGCGluUUCGluUUC1CysGCAArg CCG
1
2
2b
2a
. . ET AL.202
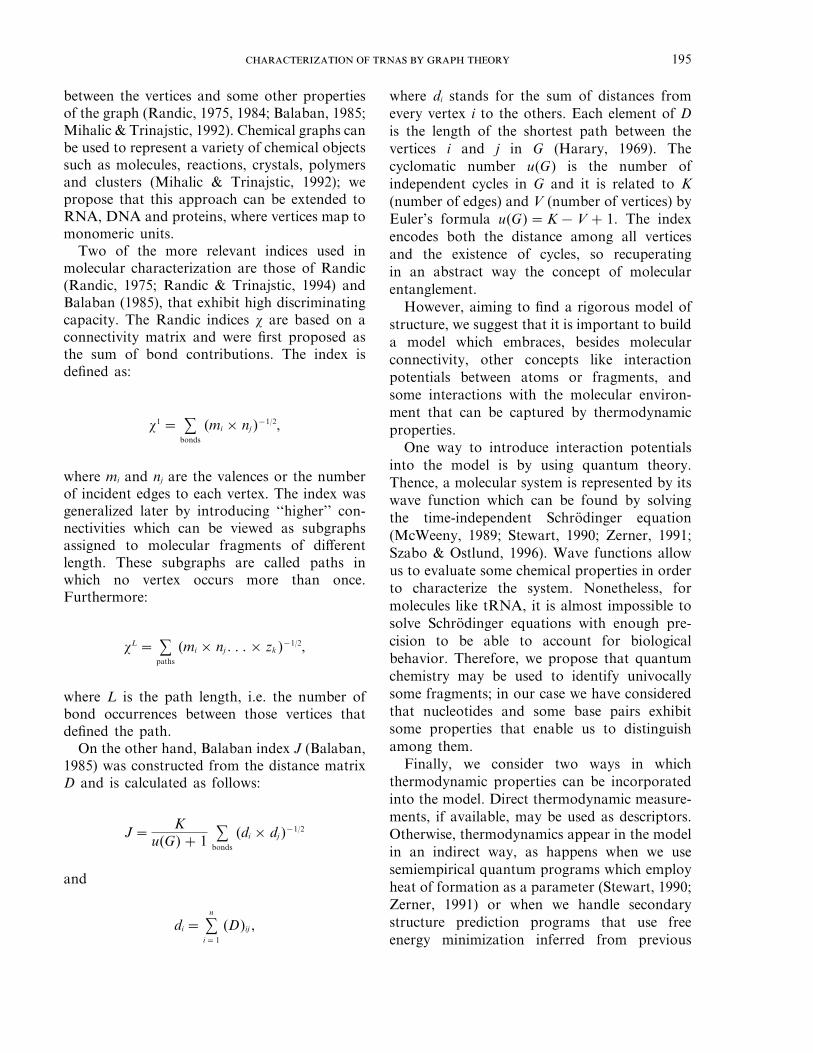
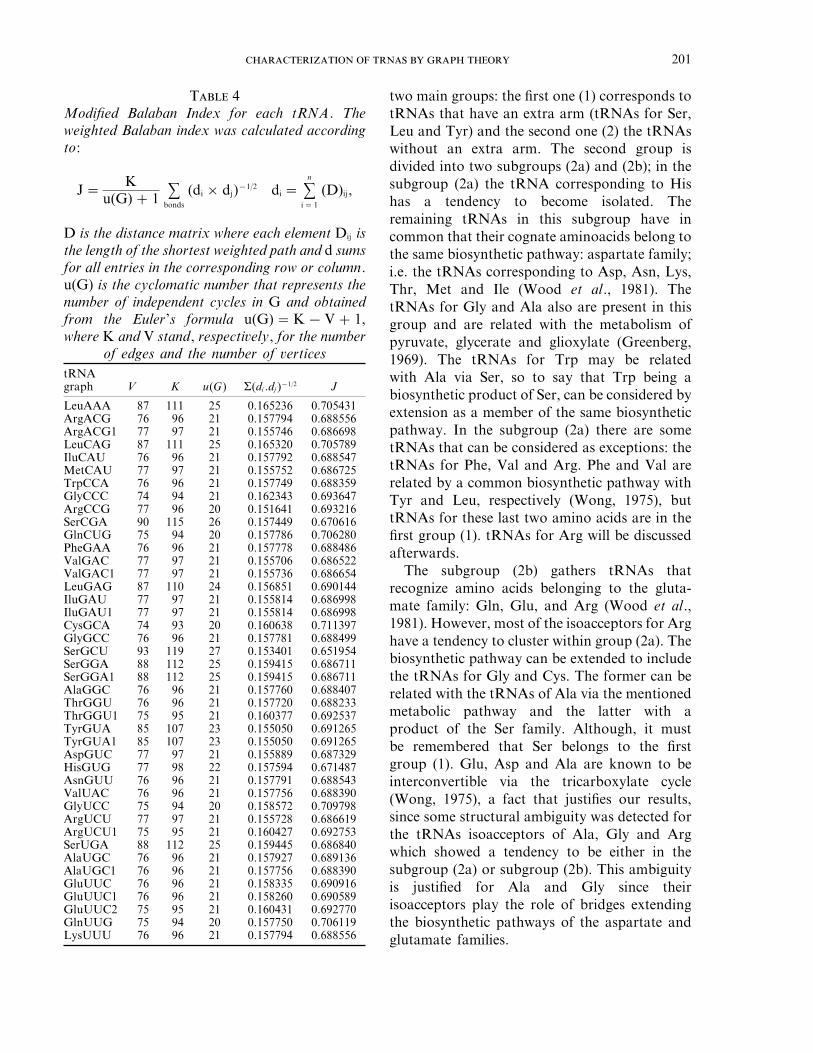
In Fig. 4, we present the cluster for tRNAsrepresented by the Balaban Index. In this case,the descriptor employed is less sensitive to thenumber of nucleotides by definition, so that thegroup (1), obtained using Randic indices, isspread out into the rest of the groups, althoughmost of the previous results still hold. Thus, forthis cluster, the group (2b2a) corresponds to thegroup (2a) in Fig. 3, but now some of the tRNAsfor Ser fall within this group as an indication thatit also belongs to the biosynthetic pathway
F. 4. Cluster obtained from modified Balaban distanceindex. Three main groups are shown. Groups 2a and 2b2bcluster all tRNAs that recognize aminoacids belonging tothe glutamate biosynthetic pathway, and group 2b2a thosetRNAs related to the aspartate biosynthetic pathway.
F. 3. Cluster obtained from orthogonal modifiedRandic Indices. Two main groups are shown. Group 1includes all tRNAs having an extra arm and group 2 is splitinto two subgroups. Group 2a clusters tRNAs whosecognate aminoacids belong to the same biosyntheticpathway (aspartate family) and group 2b embraces thoserelated with the glutamate biosynthetic pathway.
between Ala and Trp. Likewise, the glutamatefamily was divided between the groups (2a) and(2b2b) according to different levels of similaritywhose biochemical relations we have not beenable to elucidate.
In general, one can observe the formation ofsome small clusters having only a few types ofisoacceptors; in particular Gln and Leu indepen-dently seem to have the least variation between
203
T 5Discriminant Function Analysis for Randic and Balaban Indices Clustering. Discriminant FunctionAnalysis is employed to test the statistical significance of the grouping obtained by using linearcombinations of the variables that permit group separations. (5a) Randic Indices Clustering and (5b),
Balaban Index Clustering(5a)Group Predicted (%) Discriminant F Sig. level Eigenvalue D.F. Chi-square
1 100 1 0.000 37.125 8 148.2412a 95 2 0.008 0.3664 3 11.7082b 90
(5b)
Group Predicted (%) Discriminant F Sig. level Eigenvalue D.F. Chi-square
1 100 1 0.000 66.480 4 160.042a 1002b2a 1002b2b 1002b1 100
their isoacceptors, so that both of them have ahigh molecular similarity. Glu and Ser are alsovery similar. These results agree with the noiseeffect reported by Cedergren et al. (1980): thedistribution of nucleotide differences betweentRNAs specific for the same amino acid andtRNAs of different specificities overlaps exten-sively.
The clusters obtained are statistically signifi-cant. Matrix correlation between the copheneticvalue matrix and the Euclidean distance matrixof Cluster for Randic indices is 0.95076, usingnormalized Mantel statistic Z, and usingapproximate Mantel t-test: t=11.305 andprobability random ZQObserved Z: p=1.000.Matrix correlation of Cluster for Balaban indexis 0.95220 (using normalized Mantel statistic Z),and approximate Mantel t-test: t=7.483 andProbability random ZQObserved Z: p=1.000.Discriminant function analysis is employed totest the statistical significance of the grouping byusing linear combinations of the variables asfunctions that permit group separation; theresults are shown in Table 5.
Since tRNA-aaRS complementarity results inspecific tRNA aminoacylation, these recognitionmotifs are recorded in tRNA structure that tosome extent are captured by the weighted graph.Furthemore, if aminoacylation of tRNA byaaRS recapitulates the genetic code by dictating
the association between amino acids and tRNAanticodons (Saks & Sampson, 1995), it is likelythat tRNA bears structural features permittingto trace the evolution of the genetic code. Sincethere are certain indications that tRNA possessesdetectable phylogenetic information (Hopfield,1978; Fitch & Upper, 1987; Di Giulio, 1994), wepropose that the origin of the genetic code canbe traced by studying molecular structure as it ischaracterized in our model. If tRNAs stillmaintain structural trails of the process thatled to genetic code organization, then tRNAsimilarities must be explained in the context ofWong’s coevolution theory (Wong, 1975). Wetherefore suggest that the similarity observedamong tRNAs relates to functional restrictionsthat became incorporated into tRNA structureas a whole.
Conclusion
Following the above considerations, tRNAswere grouped in clusters that include the threebasic elements proposed for molecular structuredescription. Our results indicate that thegrouping shows a striking correlation betweentRNA isoacceptors that share structural featureswith tRNAs that recognize amino acids belong-ing to similar biosynthetic pathways. AlthoughtRNAs are considered to be molecules thatdiverged in primary structure, our results show
. . ET AL.204
that this evolution took place under structuralrestrictions. The highly conserved secondarystructure appears to reveal a high functionalrestriction that involves the integrity of themolecule as shown by our model. The obtainedgrouping favors the hypothesis that tRNAs bearstructural traces that would help to comprehendhow the genetic code evolved. It has been statedthat the genetic code could have been establishedby means of its versatility in codon usage, thatcodons originally assigned to precursor aminoacids were used to define derivative amino acids.Thence, tRNAs must have been modified tobridge the recognition among amino acids thatbelong to the same biosynthetic route. Alongthese lines, we propose to search for correspon-dence between this model and Wong’s coevolu-tion theory in order to achieve a betterunderstanding of the organization of the geneticcode.
REFERENCES
A, H., H, H., T, K., H, T.,W, K. & S, M. (1993). Recognitionnucleotides of Escherichia coli tRNALeu and its elementsfacilitating discrimination from tRNASer and tRNATyr. J.Mol. Biol. 231, 219–229.
B, A. T. (1985). Applications of graph theory inchemistry. J. Chem. Inf. Comput. Sci. 25, 334–343.
B, D. & S, W. A. (1997). The concept ofcomplexity in chemistry. In: Concepts in Chemistry: aContemporary Challenge (Rouvray, D. H., ed.) pp. 353–378. England: RSP Ltd.
B, A. Z. (1861). C. P. 4, 546. I: V-, J. L. & D. E. E. (1997). The concept of chemicalstructure. In: Concepts in Chemistry: a ContemporaryChallenge (Rouvray, D. H., ed.) pp. 101–131. England:RSP Ltd.
C, R. J., LR, B., S, D., L, G. &G,H. (1980). Convergence and minimal mutationcriteria for evaluating early events in tRNA evolution.Proc. Nat. Acad. Sci. U.S.A. 77(5), 2791–2795.
C, B.F.C. (1978). General features and implications ofprimary, secondary and tertiary structure. In: TransferRNA (Altman, R., ed.) pp. 14–47. Cambridge, MA: MITPress.
D, M. J. S., Z, E. G., H, E. F. & S,J. J. P. (1985). A new general purpose quantummechanical molecular model. J. Am. Chem. Soc. 107,3902–3909.
D G, M. (1994) The phylogeny of tRNA moleculesand the origin of the genetic code. Origins Life Evol.Biosphere 24, 425–434.
D, J. W. & B, R. H. (1976). The biochemistry ofmutagenesis. Ann. Rev. Biochem. 45, 11–38.
F, W. M. & U, K. (1987). The phylogeny of tRNAsequences provides evidence for ambiguity reduction in
the origin of the genetic code. Cold Spring. Harbor Symp.Quant. Biol. 52, 759–767.
F, M. J., T, G. W., S, H. B., G, W.,J, B. G., R, M. A., C, J. R.,K, T. A, P, G. A., M, J. A.,R, K., L, A., Z, A., O,J. V, F, J. B., C, J., S, B. B.,N, A., C, M., P, C. Y, A,P. Y, C, W., W, M. W., A, J. L., R,E. S., G, R., M, R. L, F, D. J, B,J. S., D. D. J, B, J., S, J. J. P., H,M., G, G, C. & P, J. A. (1995).GAUSSIAN 94. Pittsburgh, PA: Gaussian 94 Inc.
G, D. M. (1969). In: Metabolic Pathways(Greenberg, D. M., ed.), Vol III, 3rd Edn., pp. 237–315.London: Academic Press. In: W, J. T.-F. (1975). Acoevolution theory of the genetic code. Proc. Nat. Acad.Sci. U.S.A. 72(5), 1909–1912.
H, F. (1969). Graph Theory, pp. 1–42, Reading, MA:Addison-Wesley.
H, J. J. (1978). Origin of the genetic code: a testablehypothesis based on tRNA structure, sequence, andkinetic proof-reading. Proc. Nat. Acad. Sci. U.S.A. 75(9),4334–4338.
J, J. A., T, D. H. & Z, M. (1990).Predicting optimal and suboptimal secondary structurefor RNA. Methods Enzymology 183, 281–330.
K, L. M. & H, D. D. (1986). Molecular Connectivityin Structure–Activity Analysis, pp. 1–27. England: Re-search Studies Press.
L, T. P. (1990). Computer simulation of biomolecu-lar systems using molecular dynamics and free energyperturbation methods. In: Reviews in ComputationalChemistry (Lipkowitz, K. B. & Boyd, D. B., eds), Vol. I,pp. 295–315. New York: VCH Publishers.
M, O. (1995). RNADRAW 1.01. http://mango.mef.ki.se/0ole/rnadraw/rnadraw.html
MC, J. S. (1990). The equilibrium partition functionand base pair binding probabilities for RNA secondarystructure. Biopolymers 29, 1105–1119.
MW, R. (1989). Methods of Molecular QuantumMechanics. New York: Academic Press.
M, T., M, Y., L, C., B, S.& F, G. (1993). Critical role of the acceptorstem of tRNAsMet in their aminoacylation by Escherichiacoli methionyl-tRNA synthetase. J. Mol. Biol. 229,26–36.
M, P. G. (1993). Shape in Chemistry: an Introduction toMolecular Shape and Topology. New York: VCHPublisher.
M, Z. & T, N. (1992). A graph-theoreticalapproach to structure–property relationships. J. Chem.Educ. 69(9), 701–712.
O, J., P. P., D, D. & M, J. (1995)PCDM2.0 Colombia: Universidad de Cartagena.
R, M. (1975). On characterization of molecularbranching. J. Am. Chem. Soc. 97(23), 6609–6615.
R, M. (1984). Non-empirical approach to structure–activity studies. Int. J. Quantum Chem. Quantum Biol.Symp. 11, 137–153.
R, M. (1991a). Orthogonal molecular descriptor.New. J. Chem. 15, 517–525.
R, M. (1991b). Resolution of ambiguities in struc-ture–property studies by use of orthogonal descriptors.New. J. Chem. Inf. Comput. Sci. 31, 311–320.
205
R, M. (1995). Molecular profiles novel geometry-de-pendent molecular descriptors. New. J. Chem. 19,781–791.
R, M. (1996). Orthosimilarity. J. Chem. Inf. Comput.Sci. 36, 1092–1097.
R, M. & T, N. (1994). Isomeric variations inalkanes: boiling points of nonanes. New. J. Chem. 18,179–189.
R, M., S, A., N, S. & T, N.(1988). A rational selection of graph-theoretical indices inthe QSAR. Int. J. Quant. Chem: Quant. Biol. Symp. 15,267–285.
R, D. H. (1997). Are the concepts of chemistry allfuzzy?. In: Concepts in Chemistry: a ContemporaryChallenge (Rouvray, D. H., ed.) pp. 1–13. England: RSPLtd.
S, M. E. & S, J. R. (1995). Evolution of tRNArecognition systems and tRNA gene sequences. J. Mol.Evol. 40, 509–518.
S, P. (1989). Parameters for the molecularrecognition of transfer RNAs. Biochemistry 28(7),2747–2759.
S, J. M. & S, D. (1996). Aminoacyl-tRNAsynthetases optimize both cognate tRNA recognition anddiscrimination against noncognate tRNAs. Biochemistry35, 601–607.
S, M., H, T., W, J., B, J. &Z, R. (1989). Compilation of tRNA sequences andsequences of tRNA genes. Nuc. Acids Res.17(supplement).
S, J. J. P. (1990). Semiempirical molecular orbitalmethods. In: Reviews in Computational Chemistry(Lipkowitz, K. B. & Boyd, D. B., eds), Vol. I, pp. 45–81,New York: VCH Publishers.
S, J. L. & K, S. H. (1976). Three-dimensionalstructure of a transfer RNA in two crystal forms. Science192, 853–858.
S, A. & O, N. (1996). Modern QuantumChemistry. New York: Dover Publications.
T, N. (1983). Chemical Graph Theory, Vol. II,pp. 105–144. Cleveland OH: CRC Press.
V, J. L. & D. E. E. (1990). On the topologicalapproach to the concept of chemical structure. Int. J.Quant. Chem.: Quant. Chem. Symp. 24, 97–106.
V, J. L. & D. E. E. (1997). The concept ofchemical structure. In: Concepts in Chemistry: aContemporary Challenge (Rouvray, D. H., ed.) pp. 101–131.England: RSP Ltd.
W, J.D.&C, F.H.C. (1953). Molecular structureof nucleic acid. A structure for deoxirribose nucleic acid.Nature 171, 737–738.
W, E., D, P. & M, D. (1985). Crystallo-graphic refinement of yeast aspartic acid transfer RNA.J. Mol. Biol. 184, 119–145.
W, J. T.-F. (1975). A coevolution theory of thegenetic code. Proc. Nat. Acad. Sci. U.S.A. 72(5),1909–1912.
W, N. H., R, B. A. & R, A. (1980). Three-dimensional structure of Escherichia coli initiatortRNAMet. Nature (London) 286, 346–351.
W, W. B., W, J. H., B, R. M. & H, L. E.(1981). Biochemistry. A Problems Approach, pp. 290–307.Reading MA: Benjamin/Cummings.
Z, M. C. (1991). Semiempirical molecular orbitalmethods. In: Reviews in Computational Chemistry(Lipkowitz, K. B. & Boyd, D. B., eds.), Vol II,pp. 313–365. New York: VCH Publishers.
APPENDIX
Abbreviations
U: uridine 5'Ps4U: 4-thiouridine 5'PD: dihydrouridine 5'PC: pseudouridine 5'P
acp3U: 3-(3-amino-3-car-boxypropyl)uridine 5'P
mnm5s2U: 5-methylaminomethyl-2-thiouridine5'P
mnm5U: 5-methylaminomethyluridine 5'Pm5U: ribosylthymine 5'P
cmo5U: uridine 5-oxyacetic acid 5'PUm: 2'-O-methyluridine 5'PA: Adenine 5'P
ms2i6A: 2-methylthio-N6-isopenteny-ladenosine 5'P
m6A: N6-methyladenosine 5'Pm2A: 2-methyladenosine 5'Pt6A: N6-threonylcarbamoyladenosine
5'Pm6t6A: N6-methyl-N6-threonylcarbamoy-
ladenosine 5'PI: inosine 5'PC: Cytidine 5'P
Cm: 2'-O-methylcytidine 5'Pac4C: N4-acetylcytidine 5'Pacp2c: N2-(5-amino-
5carboxypentil)cytidine 5'Ps2C: 2-thiocytidine 5'PG: Guanosine 5'PQ: queuosine 5'P
m7G: 7-methylguanosine 5'Pm1G: 1-methylguanosine 5'PGm: 2'-O-methylguanosine 5'P