Integrating aquatic and terrestrial components to construct a complete carbon budget for a north...
19
Integrating aquatic and terrestrial components to construct a complete carbon budget for a north temperate lake district ISHI BUFFAM *w , MONICA G. TURNER *, ANKUR R. DESAI z, PAUL C. HANSON w , JAMES A. RUSAK§ 1 , NOAH R. LOTTIG§, EMILY H. STANLEY w and S T E P H E N R. CARPENTER w *Department of Zoology, University of Wisconsin-Madison, Madison, WI 53706, USA, wCenter for Limnology, University of Wisconsin, Madison, WI 53706, USA, zDepartment of Atmospheric and Oceanic Sciences, University of Wisconsin, Madison, WI 53706, USA, §Center for Limnology, University of Wisconsin, Madison, Boulder Junction, WI 54512, USA Abstract The development of complete regional carbon (C) budgets for different biomes is an integral step in the effort to predict global response and potential feedbacks to a changing climate regime. Wetland and lake contributions to regional C cycling remain relatively uncertain despite recent research highlighting their importance. Using a combination of field surveys and tower-based carbon dioxide (CO 2 ) flux measurements, modeling, and published literature, we constructed a complete C budget for the Northern Highlands Lake District in northern Wisconsin/ Michigan, a 6400 km 2 region rich in lakes and wetlands. This is one of the first regional C budgets to incorporate aquatic and terrestrial C cycling under the same framework. We divided the landscape into three major compartments (forests, wetlands, and surface waters) and quantified all major C fluxes into and out of those compartments, with a particular focus on atmospheric exchange but also including sedimentation in lakes and hydrologic fluxes. Landscape C storage was dominated by peat-containing wetlands and lake sediments, which make up only 20% and 13% of the landscape area, respectively, but contain 480% of the total fixed C pool (ca. 400 Tg). We estimated a current regional C accumulation of 1.1 0.1 Tg yr 1 , and the largest regional flux was forest net ecosystem exchange (NEE) into aggrading forests for a total of 1.0 0.1 Tg yr 1 . Mean wetland NEE (0.12 0.06 Tg yr 1 into wetlands), lake CO 2 emissions and riverine efflux (each ca. 0.03 0.01 Tg yr 1 ) were smaller but of consequence to the overall budget. Hydrologic transport from uplands/wetlands to surface waters within the region was an important vector of terrestrial C. Regional C fluxes and pools would be misrepresented without inclusion of surface waters and wetlands, and C budgets in heterogeneous landscapes open opportunities to examine the sensitivities of important fluxes to changes in climate and land use/land cover. Keywords: carbon budgets, carbon fluxes, carbon stocks, lake sediments, peatlands, surface–atmosphere fluxes, terrestrial– aquatic linkages Received 27 October 2009 accepted 28 June 2010 Introduction Lakes and wetlands process and store carbon (C) dif- ferently than uplands and may contribute substantially to C cycling at a range of spatial and temporal scales, yet few regional C budgets explicitly incorporate lakes and wetlands (Benoy et al., 2007). In spite of their relatively small areal coverage worldwide, lake sedi- ments and wetland peat are globally appreciable C pools because of their often very high C density and long residence times (Mulholland & Elwood, 1982; Gorham, 1991; Downing et al., 2006; Cole et al., 2007). In addition, lake and peatland ecosystems respond differently than upland or ocean ecosystems to envir- onmental perturbations including changes in climate. However, unlike ocean and upland systems they are not typically treated explicitly in global C models, and their potential response to climate change is complex and not yet well understood (Gorham, 1991; Schindler & Smol, 2006). Incorporation of surface waters and wetlands into regional and global C models would thus be a crucial next step, but as a part of building toward that goal we need to quantify the role of lakes and wetlands in C cycling for a range of biomes. Regional sensitivities are important – whether re- gions/landscapes are net C sinks or sources, the mag- nitude of C storage, and vulnerability to change are all Correspondence: Ishi Buffam, Department of Zoology, University of Wisconsin-Madison, Birge Hall, 430 Lincoln Drive, Madison, WI 53706, USA, tel. 1 1 608 265 8001, fax 1 1 608 265 6320, e-mail: [email protected] 1 Present address: J. A. Rusak, Dorset Environmental Science Centre, Ontario Ministry of the Environment, Dorset, ON, Canada. Global Change Biology (2011) 17, 1193–1211, doi: 10.1111/j.1365-2486.2010.02313.x r 2010 Blackwell Publishing Ltd 1193
-
Upload
independent -
Category
Documents
-
view
0 -
download
0
Transcript of Integrating aquatic and terrestrial components to construct a complete carbon budget for a north...
Integrating aquatic and terrestrial components toconstruct a complete carbon budget for a north temperatelake districtI S H I B U F F A M *w , M O N I C A G . T U R N E R *, A N K U R R . D E S A I z, PA U L C . H A N S O N w ,
J A M E S A . R U S A K § 1 , N O A H R . L O T T I G § , E M I LY H . S T A N L E Y w and S T E P H E N
R . C A R P E N T E R w*Department of Zoology, University of Wisconsin-Madison, Madison, WI 53706, USA, wCenter for Limnology, University of
Wisconsin, Madison, WI 53706, USA, zDepartment of Atmospheric and Oceanic Sciences, University of Wisconsin, Madison, WI
53706, USA, §Center for Limnology, University of Wisconsin, Madison, Boulder Junction, WI 54512, USA
Abstract
The development of complete regional carbon (C) budgets for different biomes is an integral step in the effort to
predict global response and potential feedbacks to a changing climate regime. Wetland and lake contributions to
regional C cycling remain relatively uncertain despite recent research highlighting their importance. Using a
combination of field surveys and tower-based carbon dioxide (CO2) flux measurements, modeling, and published
literature, we constructed a complete C budget for the Northern Highlands Lake District in northern Wisconsin/
Michigan, a �6400 km2 region rich in lakes and wetlands. This is one of the first regional C budgets to incorporate
aquatic and terrestrial C cycling under the same framework. We divided the landscape into three major compartments
(forests, wetlands, and surface waters) and quantified all major C fluxes into and out of those compartments, with a
particular focus on atmospheric exchange but also including sedimentation in lakes and hydrologic fluxes. Landscape
C storage was dominated by peat-containing wetlands and lake sediments, which make up only 20% and 13% of the
landscape area, respectively, but contain 480% of the total fixed C pool (ca. 400 Tg). We estimated a current regional C
accumulation of 1.1 � 0.1 Tg yr�1, and the largest regional flux was forest net ecosystem exchange (NEE) into
aggrading forests for a total of 1.0 � 0.1 Tg yr�1. Mean wetland NEE (0.12 � 0.06 Tg yr�1 into wetlands), lake CO2
emissions and riverine efflux (each ca. 0.03 � 0.01 Tg yr�1) were smaller but of consequence to the overall budget.
Hydrologic transport from uplands/wetlands to surface waters within the region was an important vector of
terrestrial C. Regional C fluxes and pools would be misrepresented without inclusion of surface waters and wetlands,
and C budgets in heterogeneous landscapes open opportunities to examine the sensitivities of important fluxes to
changes in climate and land use/land cover.
Keywords: carbon budgets, carbon fluxes, carbon stocks, lake sediments, peatlands, surface–atmosphere fluxes, terrestrial–
aquatic linkages
Received 27 October 2009 accepted 28 June 2010
Introduction
Lakes and wetlands process and store carbon (C) dif-
ferently than uplands and may contribute substantially
to C cycling at a range of spatial and temporal scales,
yet few regional C budgets explicitly incorporate lakes
and wetlands (Benoy et al., 2007). In spite of their
relatively small areal coverage worldwide, lake sedi-
ments and wetland peat are globally appreciable C
pools because of their often very high C density and
long residence times (Mulholland & Elwood, 1982;
Gorham, 1991; Downing et al., 2006; Cole et al., 2007).
In addition, lake and peatland ecosystems respond
differently than upland or ocean ecosystems to envir-
onmental perturbations including changes in climate.
However, unlike ocean and upland systems they are not
typically treated explicitly in global C models, and their
potential response to climate change is complex and not
yet well understood (Gorham, 1991; Schindler & Smol,
2006). Incorporation of surface waters and wetlands
into regional and global C models would thus be a
crucial next step, but as a part of building toward that
goal we need to quantify the role of lakes and wetlands
in C cycling for a range of biomes.
Regional sensitivities are important – whether re-
gions/landscapes are net C sinks or sources, the mag-
nitude of C storage, and vulnerability to change are all
Correspondence: Ishi Buffam, Department of Zoology, University
of Wisconsin-Madison, Birge Hall, 430 Lincoln Drive, Madison, WI
53706, USA, tel. 1 1 608 265 8001, fax 1 1 608 265 6320, e-mail:
1Present address: J. A. Rusak, Dorset Environmental Science
Centre, Ontario Ministry of the Environment, Dorset, ON, Canada.
Global Change Biology (2011) 17, 1193–1211, doi: 10.1111/j.1365-2486.2010.02313.x
r 2010 Blackwell Publishing Ltd 1193

valuable pieces of information that require a good
understanding of the regional C budget. To date how-
ever, most C budget studies have been undertaken at
fine spatial scales focusing on particular ecosystem
types, primarily forest stands (e.g., Chen et al., 2004;
Dunn et al., 2007; Baldocchi, 2008; Desai et al., 2008). C
flux studies have been based on eddy-flux tower-based
measurements, while forest C accumulation studies
utilize productivity measurements and survey esti-
mates of biomass (Turner et al., 1995; Kurz & Apps,
2006). Though rarer, ecosystem-specific C balances for
individual lakes (Gasith, 1974; Likens, 1985; Dillon &
Molot, 1997; Urban et al., 2005; Sobek et al., 2006) and
wetlands (Billett et al., 2004; Roulet et al., 2007; Nilsson
et al., 2008; Sulman et al., 2009) have also been under-
taken. However, much less is known about the com-
plete C balance of heterogeneous landscapes that
include surface water elements as well as forest. Inter-
actions among different landscape elements may give
rise to complex behaviors in heterogeneous landscapes.
In addition, relatively few budget studies have quanti-
fied hydrologic export of C from terrestrial watersheds,
though this can be a sizeable contributor to annual net C
balance (Christensen et al., 2007; Cole et al., 2007; Roulet
et al., 2007; Nilsson et al., 2008). Billett et al. (2004) for
example found that fluvial C losses equaled or exceeded
terrestrial carbon dioxide (CO2) uptake in a wetland-
rich watershed.
Upscaling from individual surface water ecosystem
measurements to biome (Molot & Dillon, 1996; Richey
et al., 2002) and global (Cole et al., 2007; Battin et al.,
2009; Tranvik et al., 2009) scales have suggested that
surface freshwaters are a sizeable contributor to net C
balance at these scales. At the intermediate regional
(1000–10 000 km2) scale, two recent studies have de-
tailed ground-based measurements of the major com-
ponents of the C cycle, including the freshwater
component. In a �4000 km2 subarctic Swedish catch-
ment with total lake coverage ca. 14%, Christensen et al.
(2007) found that lake surface–atmosphere exchange
altered the total regional net C exchange by 12.5%, with
an average areal efflux of C from lakes on par with net
accumulation in other parts of the catchment. Small
lakes were a particularly strong source of both CO2 and
CH4. They also calculated that C accumulation in spe-
cific terrestrial vegetation compartments would be over-
estimated by anywhere from 15% to 98% if hydrological
export of dissolved organic carbon (DOC) was not
accounted for (Christensen et al., 2007), demonstrating
the potential role of hydrological transport for land-
scape C budgets, and underlining the importance of the
interaction of different landscape elements. Of the total
terrestrial net uptake of C from the atmosphere in this
subarctic landscape, 44% was exported to surface
waters. Thus, the treatment of surface waters as C-
neutral would result in an overestimation of landscape
C sink strength by 44%.
In a study of similar spatial scale but with a smaller
total lake coverage (3.5% by area), Jonsson et al. (2007)
found in a boreal Swedish catchment that about 6% of
the landscape’s terrestrially produced C was exported
to surface waters. In this boreal landscape with a well-
developed river network, about half of that C was then
exported to the sea, while half was evaded from lake
and stream surfaces as CO2; lake sedimentation and
aquatic primary production rates were of little impor-
tance to regional C balance (Jonsson et al., 2007). These
two studies highlight the potentially important and
widely varying role that surface waters can play in
current annual C fluxes, notwithstanding the central
role they play in long-term C sequestration (Mulholland
& Elwood, 1982). Similar studies performed in other
regions and ecosystems worldwide are required to help
fill the gap in understanding of C cycling at intermedi-
ate spatial scales in heterogeneous surface-water con-
taining landscapes.
Here, we present a regional C budget for the North-
ern Highlands Lake District (NHLD), a �6400 km2
lake-rich region of the north-central Midwest, USA,
incorporating aquatic and terrestrial C cycles into a
unified framework. All major C pools and fluxes and
associated uncertainties have been estimated, with new
measurements for peat wetlands and lakes of the re-
gion. We hypothesized that the surface waters in the
NHLD would influence the regional net C balance at a
level commensurate with their areal coverage, i.e., by
about 13%. Peat in wetlands was expected to be the
largest C pool, as found in other areas with substantial
peatland coverage (e.g., Garnett et al., 2001; Beilman
et al., 2008; Weishampel et al., 2009). Our study ad-
dressed three main questions: (1) How do C fluxes
and pool sizes and vary among lakes, wetlands and
forests of a north-temperate region? (2) By how much
will an estimate of regional terrestrial C accumulation
be biased if surface waters aren’t explicitly considered?
(3) What are the major remaining uncertainties in the
regional C balance for this north-temperate region?
Study region
The NHLD of Wisconsin and Michigan (Fig. 1) is one of
the most lake-rich regions of the world (Magnuson et al.,
2006), and consists of a mosaic of lakes and wetlands
interspersed in a mixed forest landscape. The central
part of the region is a particularly lake-rich area of
�6400 km2, and is the focal area for this study. The
bulk of the landscape is made up of mixed and hard-
wood forests (about 45% total by area) and a smaller
1194 I . B U F FA M et al.
r 2010 Blackwell Publishing Ltd, Global Change Biology, 17, 1193–1211

proportion of coniferous forest (�8% by area), with
substantial coverage of wetlands (28%) and lakes (13%)
while the remainder (�5% total by area) includes roads,
small towns, agriculture and shrublands. Population
density is low, averaging about 10 people km�2 (http://
quickfacts.census.gov/qfd/). The entire region was lar-
gely deforested about 100 years ago, and consequently
most forest stands are currently aggrading. The surface
morphometry of the region was structured by the last
deglaciation 10 000–15 000 years BP (Martin, 1965; Attig,
1985), which produced a pitted sandy outwash land-
scape (Curtis, 1959). Depressions in the low-relief sandy
terrain (total range 450–580 m a.s.l.) were formed by
melting ice-blocks, and many subsequently filled with
water giving rise to numerous lakes. Currently, about
5000 open water bodies cover 13% of the surface area.
The water bodies range in size from ponds of o0.1 ha to
several lakes 410 km2, with a median are of o1 ha.
Included among the largest lakes in the region are
several man-made reservoirs, totaling 1.6% of the region
by area. Discrete peat-containing wetlands (mostly
forested) cover 20% of the surface area (NRCS, 2008),
while nonpeat-forming wetlands cover 8% of the region
by area. Many lakes and wetlands are linked together or
fed by streams, and the major drainage basins in the
NHLD are the Upper Wisconsin River, which drains
approximately 45% of the region by area, and the Flam-
beau River basin, draining an additional 27%.
Wisconsin
Michigan
Fig. 1 Location of Northern Highlands Lake District study region in north central Wisconsin and Michigan, USA (inset), and land-cover
map of the NHLD.
C A R B O N B U D G E T I N L A K E - R I C H R E G I O N 1195
r 2010 Blackwell Publishing Ltd, Global Change Biology, 17, 1193–1211

Methods
We estimated regional pool sizes and mean annual fluxes for the
major ecosystem types (surface waters, wetlands, and forests) in
the region using a combination of approaches. Where published
values already exist at the regional scale, we combined values
from the available literature. Where published data are available
for individual sites in this or very similar regions, we scaled up
with the help of a GIS and land cover/soil cover maps. Available
data from the north temperate lake (NTL–LTER) database for
lakes (http://lter.limnology.wisc.edu/), the NRCS database
for soil C pools (NRCS, 2008), and the Ameriflux network for
terrestrial fluxes (Desai et al., 2008) were also used as a starting
point for regional upscaling. Finally, gaps were filled with new
measurements, including a field study of peatland C pool sizes
(Buffam et al., 2010). Further details of all pool and flux calcula-
tions are described below, with greater detail given for calcula-
tions involving new data and upscaling techniques. Calculations
and statistical analyses were performed using R version 2.80
(R Foundation for Statistical Computing, 2008).
Terrestrial C pools
Forest vegetation, including uplands and forested wetlands.NHLD forest vegetation C was estimated by coupling US
Forest Service Forest Inventory and Analysis (FIA) data on
areal coverage of different forest stand types (http://
fiatools.fs.fed.us/fiadb-downloads/datamart.html) for a
7230 km2 rectangle approximating the NHLD region
(bounded by 90.31W, 88.91W, 45.71N, 46.31N) with FIA-based
data on mean C content of those forest stand types (http://
ncasi.uml.edu/COLE/) within the seven-county region
including the NHLD. The stand C content calculations are
based on well-established allometric equations for
aboveground biomass of live and dead trees (Jenkins et al.,
2003) and less secure estimates for tree roots (Jenkins et al.,
2003; Li et al., 2003), understory vegetation, down dead wood,
and forest floor/litter (Smith et al., 2006). Calculations were
performed separately for groups of mixed and hardwood
forest stands (42% of region by area according to FIA),
conifer stands (10.5% of area) and forested wetland stands
(24% of area). An uncertainty in the total regional forest
vegetation biomass of � 10% was assumed for each group.
Forest soils. Using the NRCS soils map of the region (NRCS,
2008), soils were divided into two main categories: histosols
and nonhistosols. Histosol C content was treated separately,
described below in the wetland peat section. Nonhistosol soils
were made up of 34 220 spatially discrete soil units for a total
of 4289 km2 or 67% of the NHLD region, the vast majority
underlying upland forest. For each of the 293 distinct
nonhistosol soil series found in the NHLD, carbon density
(CD, in kg C m�2) was calculated using the data from the
SSURGO database (NRCS, 2008) together with the following
equation:
CD ¼ 1
1000RXn
j¼1
zt � zbð Þj Djrj
h i; ð1Þ
where R is the C content (assumed to be 50 � 1%) of soil
organic matter (OM), 1/1000 is a units conversion factor, n is
the number of distinct soil layers categorized in the given soil
series, zt and zb are depth below surface (m) of the top and
bottom of soil layer j, D is the OM fraction (w/w) of soil layer j
and r is the moist bulk density (g/cm3) of soil layer j. The
NRCS soil series data for this region typically goes down to a
maximum depth of 1.52 m; we did not make any attempt to
account for C in the deeper soils, except in the wetland
histosols (peat) as described in a separate section below. The
SSURGO database reports a range (high and low values) for
both D and r for each soil layer. To obtain our mean estimate
we used the average of the high and low values. For
uncertainty estimates, we calculated an extreme high and
low value of CD for each soil series, using Eqn (1) with the
high or low values, respectively for both D and r for all soil
layers. The distribution of potential CD values for each soil
series was defined as a normal distribution with the extreme
high and low values describing the 95% CI. Then, in a Monte
Carlo simulation, each discrete soil unit in the NHLD
(N 5 34 220) was assigned a CD value at random from the
distribution for the appropriate soil series. The landscape total
soil C was then summed, and the process repeated 10 000
times to explore the sensitivity of landscape soil C totals to
uncertainty in individual soil series CD.
Wetland vegetation, open wetlands. In the absence of
comprehensive surveys of wetland ground vegetation
biomass in the region, values for shrubs and herbs were
based on a compilation of literature on bogs and poor fens
by Moore et al. (2002), and assuming that belowground
biomass was half of aboveground biomass. Sphagnum
biomass was estimated from a harvesting study in a
Minnesota bog which found a mean biomass for active layer
Sphagnum of 7.0 � 2.0 kg ha�1 (Elling & Knighton, 1984). For
upscaling Sphagnum biomass to the NHLD a regional mean
Sphagnum coverage of 60 � 8% (1 SE, n 5 21) in peatlands was
used (Buffam et al., 2010). For all vegetation, dry biomass was
assumed to be 50% C.
Wetland peat. Based on the distribution of histosols on the
NRCS soils map, there are about 8000 discrete peat-containing
wetlands covering 20% of the NHLD surface area, or 1259 km2
(NRCS, 2008). These peatlands are dominated by areally small
units (median size ca. 2 ha). Because NRCS soil survey data
from this region only report on depths to 1.52 m, and often do
not differentiate between histosol soil series containing
shallow (o1.52 m) or deep (41.52 m) peat of otherwise
similar characteristics, these data were not sufficient to
quantify the peat C pool. Instead, the size of the regional
peat C pool was estimated using field surveys of 21 discrete
peatlands which established a positive correlation between
mean peat depth and a DEM-derived basin edge slope
measurement, enabling upscaling to the region (Buffam et al.,
2010). A detailed description of the methods can be found in
Buffam et al. (2010), but in short the mean depth was calculated
from basin edge slope for each discrete peatland, and C
content was estimated from mean characteristics of peat
1196 I . B U F FA M et al.
r 2010 Blackwell Publishing Ltd, Global Change Biology, 17, 1193–1211
cores taken in the same study. Uncertainty in the regional
estimate was calculated based on error in the edge slope vs.
depth regression, as well as uncertainty in the peat C
characteristics including bulk density.
Regional and terrestrial C fluxes
Regional precipitation. Mean precipitation DOC and
dissolved inorganic carbon (DIC) concentrations were taken
as 2 � 1 and 1 mg L�1, respectively, after Cardille et al. (2007).
Mean annual flux was estimated by multiplying these
concentration values by the long-term (1989–2007) annual
average precipitation amount of 602 � 153 mm from the
nearby Woodruff airport meteorological station (http://
lter.limnology.wisc.edu).
Regional runoff. Because we lacked a detailed time series for
C fluxes in rivers draining the NHLD, we accumulated all
available published and unpublished data on DIC and DOC
concentrations for rivers draining the NHLD. This dataset
included one-time determinations of DIC and DOC
concentrations in the Wisconsin River at multiple locations
near the outlet of the NHLD region (E. Stanley, unpublished
results) and the Tomahawk River (Lottig, 2009), and seasonal
measurements of DOC in the Wolf and Flambeau Rivers that
include concentrations during high and low flow periods
(Shafer et al., 1997, 1999; Babiarz et al., 1998). These sites
have drainage areas ranging from 189 to 3193 km2, with a
similar parent geology and proportion of lakes, forests and
wetlands to that of the NHLD region as a whole.
From this exercise we estimated ranges for flow-weighted
mean concentrations of 5–15 mg L�1 for DOC, 5–10 mg L�1 for
DIC, and 1–5 mg L�1 for POC for rivers exiting the NHLD.
Summing these, the concentration estimate for flow-weighted
mean Ctotal (20.5 � 5.9 mg L�1) was multiplied by annual river
runoff (20 year mean, 1989–2008) of 260 mm for the Wisconsin
River at the USGS Tomahawk gauging station 05391000
(http://nwis.waterdata.usgs.gov/) to estimate regional hy-
drologic export of C. Here we assume that the specific (area-
normalized) discharge for the region is well-represented by the
runoff of the Wisconsin River, which at this gauging location
drains a watershed of 1961 km2 of similar landcover (58%
forest, 25% wetland, 10% lake) to the NHLD as a whole.
Gauging stations for other intermediate sized (4200 km2)
rivers of the region give similar values for annual specific
discharge for that time period, ranging from 244 mm (Iron
River, USGS gauging station 04060500) to 306 mm (Flambeau
River downstream of NHLD, USGS gauging station 05360500).
Based on this spatial variability we assigned an uncertainty of
� 40 mm to the regional mean annual water runoff.
As data on riverine exports from the NHLD were limited,
we investigated temporal patterns of DIC, DOC, and POC
loads in the Popple River at a site ca. 35 km east of the eastern
boundary of the NHLD as an indicator of possible variability
and uncertainty in C exports from the NHLD. The Popple
River site is the focus of intensive sampling for the USGS
National Water Quality Assessment program (USGS gauging
station 04063700). Detailed measurements of all forms of C
were available and were sampled both regularly (approxi-
mately monthly) and during storm flows over several years.
At 362 km2 the basin is smaller than the major NHLD drainage
(the Wisconsin River) and has a lower coverage of lakes, but is
similarly dominated by forests and wetlands and shares a
similar parent geology.
Forest and wetland surface–atmosphere fluxes. For the forest
and wetland surface–atmosphere exchange, we estimated
mean annual fluxes for the period 1989–2007 using the
Interannual Flux Tower Upscaling Experiment (IFUSE)
regional C ecosystem approach (Desai et al., 2010). Direct
observations of surface–atmosphere exchange of CO2
measured by eddy covariance flux towers in the region were
used to calibrate a simple ecosystem model (Desai, in press),
which was then applied to an upscaling model to calculate
regional sources and sinks of C in forest and wetland
ecosystems. The C flux observations come from a set of 13
eddy covariance flux towers that are part of the Chequamegon
Ecosystem–Atmosphere Study and also affiliated with the
Ameriflux and Fluxnet consortia (Baldocchi, 2008; Desai
et al., 2008). The direct observations, ecosystem model,
upscaling model and uncertainty estimates are described in
detail in Supporting Information Section S1.
Wetland CH4 emissions. Northern peat-containing wetlands
typically emit CH4, with rates varying widely in time and
space depending largely upon variation in water table depth
and other variables including temperature and vegetation type
(Moore & Roulet, 1993; Bridgham et al., 1995; Granberg et al.,
2001). A range of 1–20 g C m�2 yr�1 of CH4 emissions was cited
by Moore et al. (1998) for northern peatlands, and individual
studies (Roulet et al., 2007; Nilsson et al., 2008) as well as large-
scale estimates (Gorham, 1991) generally give values in this
range. Recent chamber-based measurements of growing-
season CH4 emissions at three wetland sites in the NHLD
region gave emissions values at the low end of this range:
0.06 gC m�2 for an Alder shrub fen, 0.3 gC m�2 for an
Ericaceous bog, and 2.6 gC m�2 for a Graminoid fen (Cook
et al., 2008). Lacking more numerous direct measurements of
wetland CH4 emissions in the region we assigned the range of
1–20 g C m�2 yr�1, which acknowledges high uncertainty, to
the peatlands of the NHLD.
Within-region terrestrial C subsidies to surface waters
Hydrologic export from forests and wetlands to surface
waters. Hydrologic C fluxes from forest and wetland areas
were estimated using a set of eight headwater streams
distributed across the NHLD, including four streams with
forested catchments (forest cover 88–95% of area) and four
streams with wetland catchments (wetland cover 34–57% of
area, forest cover 490% of the remainder). Annual stream
DOC, DIC, and CTOT (DOC 1 DIC) fluxes were estimated for
water year 2008 for each of these streams (N. R. Lottig,
unpublished results), and regressed against percent wetland
cover in catchment. This equation was used to generate
C A R B O N B U D G E T I N L A K E - R I C H R E G I O N 1197
r 2010 Blackwell Publishing Ltd, Global Change Biology, 17, 1193–1211
predictions of C export at 0% and 100% wetland, representing
pure forest and pure wetland catchments, respectively. These
estimates were then multiplied by the regional coverage of
forest and wetland to give regional flux estimates. Uncertainty
in the eight stream flux estimates, as well as the regression
equation, were propagated in the regional estimate. The
implicit assumption of this approach is that other terrestrial
sources of hydrologic C flux aside from forest and wetland are
insignificant in the measured catchments. This seems a
reasonable assumption as these areas are rare (always o10%
of catchment area) and they represent landscapes not known
for high C export (primarily scrub/shrub and developed
(open space), i.e. country roads).
Water year 2008 was a dry year in the region relative to the
long-term mean. For the smaller (o150 km2) gauged USGS
watersheds in the region, long-term (1989–2008) annual mean
runoff averaged 1.175 � 0.187 (SD, N 5 8) times the water year
2008 runoff (http://waterdata.usgs.gov/nwis/). We applied
this correction factor, with uncertainty, to the stream DOC and
DIC fluxes estimated from water year 2008, and an additional
error of � 50% acknowledging the uncertainty related to
using a single year of concentration measurements rather than
a long-term record for flux estimation.
Leaf litter and other aerial C fluxes from forests and wetlands
to surface waters. Airborne inputs of OM to lakes have been
measured infrequently, but several estimates exist for northern
temperate lakes in forested landscapes. For the 26 ha
Crampton Lake in the NHLD, direct measurements of
summer particulate C deposition were made and indicated
an average influx of 5 mg C day�1 m�2 of lake area (Preston
et al., 2008). Also within the NHLD, an estimate of particulate
organic C inputs was generated for Peter, Paul and Tuesday
lakes during an experimental addition of dissolved inorganic13C. For these three small (0.8–2.7 ha) lakes during summer,
modeled allochthonous particulate organic C inputs ranged
from 21 to 56 mg C day�1 m�2 of lake area (Carpenter et al.,
2005). Making the gross assumption that summer influx rate is
representative of the entire year and the particulate
allocthnonous C originates from the lake shore, this
translates to an annual input ranging from 143 g C per meter
of shoreline (Crampton Lake) to 466 g C per meter of shoreline
(Tuesday Lake). This is similar to the annual estimates for
Mirror Lake, New Hampshire of 354 g C per meter of shoreline
(Likens, 1985), and for Lake Wingra (southern Wisconsin) of
320 g C per meter of shoreline (Gasith & Hasler, 1976), both of
which include direct measurements of autumn leaf-fall inputs.
Based on these ranges we estimated an annual airborne
transfer of particulate organic C from forest to lakes of 150–
450 g C per meter of shoreline with upland forest. A lower
annual rate (100–300 g C per meter of shoreline) was assumed
for forested wetlands, based on lower tree densities and the
lack of deciduous trees, while open (unforested) wetlands
were assumed to contribute negligibly to aerial C flux. For
airborne particulate flux from forest to streams, we assumed
the same transfer rate per meter of stream length as per meter
of lake shoreline, multiplied by two to account for influx from
both sides of the stream. These assumed rates are on the same
order as those measured in Bear Brook, a 3 m wide
overcanopied headwater stream in New Hampshire
[�416 g C yr�1 per meter of shoreline (Fisher & Likens,
1973)], and Fort River, a 14 m wide fourth order stream in
Massachusetts [�942 g C yr�1 per meter of shoreline (Fisher,
1977)].
Surface water C Pools and fluxes
Upscaling approach. For estimation of two pools (lake water
column C pool, lake sediment C pool) and two fluxes (lake CO2
surface–atmosphere exchange, and lake net sediment
deposition rate) a similar approach was used. First, the target
variable (C pool or flux) was measured/estimated for a small
group of well-studied lakes. Second, we queried this small
group of lakes for simple limnological parameters that were
correlated with the target variable, and could be measured with
relative ease during a single summer sampling. Third, these
simple empirical models were used to predict the target
variable for a group of 168 survey lakes, which were a
random subset of NHLD lakes stratified in 20 bins by lake
area (Hanson et al., 2007), and sampled once during summer
2004 (details of modeling approach in Supporting Information
Section S2). During that survey many limnological
measurements were made, but for this study the key
measurements were Secchi depth and summer epilimnion
[DOC], [DIC], pH, and calculated pCO2. Finally, the modeled
values were used to calculate a mean and standard deviation
for each of the 20 lake area bins, and values from the respective
distributions were randomly assigned to each of the �7000
lakes in the entire NHLD to generate a regional total pool/flux
estimate. This assignment process was repeated 100 times in a
Monte Carlo simulation and the resulting distribution of
regional means was used to describe the uncertainty (95% CI)
in upscaling from the 168 lakes to the entire region.
Representativeness of the intensively studied lakes. For
estimating C pools/fluxes of the 168 lakes, we used models
developed on a smaller number of lakes in the region for which
detailed temporal and/or sediment records exist. These were
primarily seven NTL–LTER lakes (http://lter.limnology.
wisc.edu/, Magnuson et al., 2006) for which a 420-year
record of approximately monthly measurements exist for a
wide range of limnological variables, but also included several
other lakes for which dated full sediment cores have been
taken. The seven NTL–LTER lakes span a broad range of area
(0.5–1608 ha), pH (annual means 4.8–7.9; summer means
4.8–8.4), DOC (annual means 2–19 mg L�1; summer means
2–16 mg L�1), DIC (annual means 0.6–11.1 mg L�1; summer
means 0.5–10.1 mg L�1) and pCO2 (annual means 727–
2506matm; summer means 273–1576matm), all relevant factors
for lake C cycling and CO2 surface–atmosphere exchange. For
all of these parameters except pCO2, the range of values
observed in the seven LTER lakes for lake size and summer
chemistry span the major part of the range observed in a
survey of hundreds of randomly selected NHLD lakes
(Hanson et al., 2007). For pCO2, the survey included many
very small humic lakes with very high pCO2 (median
1198 I . B U F FA M et al.
r 2010 Blackwell Publishing Ltd, Global Change Biology, 17, 1193–1211

1559matm, maximum 15 940matm) not found in the LTER lakes.
This suggests very high local CO2 efflux in some lakes, likely
not well predicted by our empirical modeling approach.
However, because of their small area (o6% of lake area in
survey for lakes with summer pCO241576matm) the uncertain
estimates of CO2 evasion from these lakes do not substantially
influence the regional CO2 efflux estimates.
For the NTL–LTER lakes with extensive measurements
available, response variables used as the starting points for
upscaling were determined by the following methods (details in
Supporting Information Section S3). (1) Annual CO2 surface–
atmosphere exchange was calculated (Cole & Caraco, 1998) for
the seven NTL–LTER lakes from a 19-year (1989–2007) time
series of approximately monthly measurements of epilimnion
DIC, pH and temperature together with daily measurements of
wind speed. (2) Water column C pools were estimated for the
seven NTL–LTER lakes from annual means of long-term (1986–
2007) monthly mean epilimnion concentrations of DOC and
DIC. (3) Mean sediment accumulation rate was measured in210Pb-dated sediment cores (using the section corresponding to
5–35 years before present) from nine lakes in the region, and
used to calculate net C deposition rate. (4) Sediment C storage
was estimated, with correction for sediment focusing, from total
sediment depth at the deepest point in the cored basin of five
lakes in the NHLD for which the entire Holocene sedimentary
record was available. The center core sediment depths for these
five lakes ranged from 2.5 to 17 m.
Lake CH4 emissions. We applied simple equations relating
CH4 emissions to lake area developed with lakes from the
NHLD and other northern regions (Bastviken et al., 2004), to
the distribution of lake areas found in the NHLD. This analysis
predicts CH4 emissions from lakes in the NHLD averaging 3 g
CH4 C m�2 (of lake area) yr�1, and an uncertainty of � 50%
was assumed.
CO2 evasion from streams. As in many regions, stream CO2
evasion measurements have rarely been made in the NHLD,
but a recent random survey found NHLD streams are
consistently supersaturated with respect to CO2 with
headwaters averaging 4000–6000 matm and larger streams
averaging about 700 matm (Lottig, 2009). An estimate of
stream and river CO2 evasion was made based on this pCO2
survey and assuming a regional mean exchange coefficient
(kCO2) value of between 1 and 4 m day�1 (Raymond & Cole,
2001; Jonsson et al., 2007; Teodoru et al., 2009). This evasion rate
was multiplied by the total area in each of these stream size
categories based on the 1 : 24 000 streams and surface water
bodies maps (Wisconsin Department of Natural Resources) to
give regional estimates of flux.
Anthropogenic emissions – fossil fuel combustion
Fossil fuel emissions. We derived regional fossil-fuel CO2
emissions from the Vulcan Project gridded emissions
database (Gurney et al., 2009). Fossil fuel emissions in this
database are computed from CO2 emissions factors applied to
most fuel types in the National Emissions Inventory air
pollution data in addition to vehicle miles travelled, power
production, and aircraft emissions databases. The Vulcan data
are provided on an hourly 10� 10 km resolution grid for the
year 2002 and we extracted annual CO2 emissions for the
NHLD region from it. Uncertainty information was not
available at the time, but we conservatively estimate it at
�10%. At the national scale, emissions compare well with
independent coarse scale emission databases (Depart-
ment of Energy Energy Information Administration data).
Additionally, while interannual variability in fossil fuel
emissions are typically small, there is a steady, upward
trend. As such, the estimates for 2002 are likely an
overestimate for years prior and underestimate for year
following. To compensate, we scaled the 2002 annual NHLD
emissions against a time series of total US fossil fuel emissions
for 1989–2007 (Boden et al., 2009).
Mean C accumulation time
The mean time required to build up the pools of C in each of
the three major regional ecosystem types (forest, wetland, and
lake) was estimated [Eqn (2)]. For forests and wetland, net
accumulation rate was calculated by difference from all mea-
sured fluxes, while for lakes the estimated net sedimentation
rate was used. For this calculation, the assumption is that the
net accumulation rate has been constant over the entire period
of accumulation. This is unlikely to be the case, but the
resulting value still provides useful information in discrimi-
nating between slow and fast accumulating pools.
tacc ¼CP
AR; ð2Þ
where tacc is mean accumulation time, CP is carbon pool size,
and AR is net accumulation rate.
Results
A summary of the estimated C pools and fluxes for the
region as a whole and for each of the three major
ecosystem types can be found in Tables 1–5 and Fig. 2.
Following is a more detailed description of each pool
and flux together with uncertainty estimates. Pools are
expressed both as the total for the region (units of Tg C)
and as a density value normalized to the respective
ecosystem type (units of Kg C m�2). Fluxes are ex-
pressed likewise as regional total (Gg C yr�1) and local
flux strength (g C m�2 yr�1).
Pools
Forest vegetation C pool. Conifer and hardwood forests
gave similar mean total biomass values and the data
were pooled into a single upland forest category. Using
FIA data the NHLD upland forest biomass storage was
estimated at 32–35 Tg C giving an average of 9.1–
10.2 kg C m�2 in upland forested areas, consistent with
published estimates for northern Wisconsin (Turner
C A R B O N B U D G E T I N L A K E - R I C H R E G I O N 1199
r 2010 Blackwell Publishing Ltd, Global Change Biology, 17, 1193–1211
et al., 1995; Rhemtulla, 2007). The forest vegetation pool
is about half aboveground tree biomass (regional mean
estimate 4.9 kg C m�2), with contributions from roots,
understory vegetation, dead wood, and forest floor
litter (1.0, 0.9, 1.0, and 1.9 kg C m�2, respectively).
Wetland vegetation C pool. Using FIA data the NHLD
biomass storage in forested wetlands was estimated
at 10–12 Tg C giving an average of 6.2–7.6 kg C m�2.
The forested wetland vegetation pool is less than
half aboveground tree biomass (regional mean
2.7 kg C m�2), with contributions from roots, under-
story vegetation, dead wood, and forest floor litter
(0.5, 0.7, 0.7, and 2.3 kg C m�2, respectively). For open
(nonforested) wetlands, the total NHLD vegetation
biomass was estimated at 0.7 � 0.2 Tg C based on a
value of 2.6 � 0.9 kg C m�2 (Elling & Knighton, 1984;
Moore et al., 2002). This was comprised primarily of
Sphagnum (averaging 2.2 � 0.9 kg C m�2) with an
additional contribution from shrubs and herbs
(0.40 � 0.29 kg C m�2).
Upland forest soil C pool. Using published soil series
characteristics from NRCS soils maps (NRCS, 2008),
we estimated a regional soil organic C storage of
30 � 1.3 Tg C, corresponding to a mean soil C content
of 8.7 � 0.4 kg C m�2. This does not include OM from
very deep soil horizons ca. 1.5 m or deeper, which fall
outside the scope of NRCS surveys. Histosols (wetland
peat soils, �20% of regional area) are treated separately
below.
Wetland peat C pool. Upscaling using the DEM-based
regression described in Buffam et al. (2010) gave a mean
C density of 115 � 15 kg C m�2 in peatlands, based on a
regional mean peat depth of 2.1 � 0.2 m (95% CI). This
amounts to a total regional pool size of 144 � 21 Tg C.
Lake dissolved C pool. We estimated a mean lake
dissolved C pool of 0.05–0.06 Tg C, based on an area-
weighted regional mean lake depth of 5.2 � 0.4 m (95%
CI), and area-weighted annually averaged regional
mean DOC and DIC concentrations of 4.7 and
7.4 mg C L�1, respectively.
Lake sediment C pool. We estimated a regional mean lake
sediment depth of 7.5–9.9 m, corresponding to a C
storage of 89–301 kg C m�2, for a total regional pool of
74–250 Tg C. The uncertainty in sediment depth reflects
of the exploration of different groups of predictor
variables (Secchi depth alone or Secchi depth 1 lake
area 1 max lake depth) and three different upscaling
methods for mapping the five lakes with sediment
depth measurements onto the summer survey dataset
(see Supporting Information Section S2). The additional
uncertainty in C storage reflects uncertainty in sediment
OC concentration and bulk density. Uncertainty related
to upscaling from the summer survey to all lakes in the
region using lake area was relatively small (mean 95%
CI 5 6.3 kg C m�2).
Fluxes
Regional hydrologic fluxes. Precipitation influx of C was
calculated at 1.2–2.4 g C m�2 yr�1, and regional riverine
outflow at 4–7 g C m�2 yr�1. These correspond to
regional totals of 8–15 and 23–45 Gg C yr�1, respectively.
Forest surface–atmosphere fluxes. All forest types had a net
uptake of CO2, with mean annual net ecosystem exchange
(NEE) estimated at �116 � 50 g C m�2 yr�1 for hardwood
forests (25% of regional area), �976 � 23 g C m�2 yr�1 for
conifer forests (7% of regional area), and �247 �29 g C m�2 yr�1 for mixed forests (20% of regional area).
The mean area-weighted respiration for all forests of the
region was 648 � 18 g C m�2 yr�1, and the mean gross
primary production was 936 � 33 g C m�2 yr�1, giving
rise to a regional mean upland forest NEE of �288 �27 g C m�2 yr�1. This corresponds to a regional
total uptake of 994 � 94 Gg C yr�1. Errors represent
ecosystem model uncertainty (see Supporting Informa-
tion Section S1).
Wetland surface–atmosphere fluxes. Wetlands had a net
uptake of CO2, with mean annual NEE estimated at
�65 � 11 g C m�2 yr�1 for forested wetlands (23% of
regional area) and �89 � 37 g C m�2 yr�1 for open
wetlands (4% of regional area). The mean area-
weighted respiration for all wetlands of the region
was �421 � 42 g C m�2 yr�1, and the mean gross
primary production was 490 � 23 g C m�2 yr�1, giving
rise to a regional mean wetland NEE of
�69 � 33 g C m�2 yr�1. This corresponds to a regional
total uptake of 124 � 59 Gg C yr�1. Errors represent
ecosystem model uncertainty (see Supporting
Information Section S1).
Wetland CH4 emissions. Based on a range of 1–
20 gC m�2 yr�1 in peat-containing wetlands, a total
wetland CH4 emission of 1–25 Gg C yr�1 was
estimated for the NHLD. The range reflects
acknowledged uncertainty in the use of literature
values for northern peatlands.
Lake surface–atmosphere CO2 exchange. We estimated a
regional lake surface CO2 emission ranging from 25 to
39 g C m�2 yr�1, for a regional total of 21–32 Gg C yr�1.
This net emission resulted from an annual mean gross
1200 I . B U F FA M et al.
r 2010 Blackwell Publishing Ltd, Global Change Biology, 17, 1193–1211

efflux of 26–39 g C m�2 yr�1 during periods of
supersaturation, and mean gross influx of 0.6–
1.4 g C m�2 yr�1 during periods of undersaturation
(midlate summer in some lakes). The range reflects
results from the use of different groups of variables
and three different upscaling methods for mapping the
long-term LTER lakes dataset onto the summer survey
dataset (Supporting Information Section S2).
Uncertainty related to upscaling from the summer
survey to all lakes in the region using lake area was
relatively small (mean 95% CI 5 1.3 g C m�2 yr�1).
Stream CO2 emissions. Stream CO2 emission was
estimated to be a locally substantial efflux at 80–
330 g C m�2 (of stream area) yr�1 for headwater (first
and second order) streams, and 5–20 g C m�2 yr�1 for
larger streams and rivers. Because of the small area
(about 0.1% of the landscape for headwater streams,
and 0.4% for larger streams and rivers), the estimated
total stream CO2 evasion flux (1.4 � 1.1 Gg C yr�1) is
about an order of magnitude smaller than the other
major regional surface-water fluxes (runoff and lake
CO2 evasion).
Lake CH4 emissions. A total lake CH4 emission of 1.1–
3.3 Gg C yr�1 was estimated for the NHLD, which
translates to an average emission of 1–4 gC m�2 (of
lake area) yr�1. The range reflects uncertainty in the
relationship between lake area and CH4 emission
generated for lakes of the region (Bastviken et al., 2004).
Table 1 Estimated C storage in different pools in the NHLD
Pool Landscape
Areal coverage,
km2 (% of region)
Local pool density, best
estimate (range) (kg C m�2)
Regional pool size, best
estimate (range) (Tg C)
Forest vegetation Forest 3454 (54%) 9.7 (9.1–10.2) 33 (32–35)
Aboveground biomass Forest 3454 (54%) 4.9 (4.4–5.4) 17 (15–19)
Roots Forest 3454 (54%) 1.0 (0.9–1.1) 3.4 (3.0–3.7)
Understory vegetation Forest 3454 (54%) 0.9 (0.8–1.0) 3.1 (2.8–3.4)
Dead wood Forest 3454 (54%) 1.0 (0.9–1.1) 3.5 (3.1–3.8)
Forest floor (litter) Forest 3454 (54%) 1.9 (1.7–2.1) 6.6 (5.9–7.2)
Forest soils Forest 3454 (54%) 8.7 (8.3–9.1) 30 (29–31)
Wetland vegetation Wetlands 1791 (28%) 6.3 (5.7–6.9) 11 (10–12)
Forested wetland vegetation Forested wetlands 1535 (24%) 6.9 (6.2–7.6) 11 (10–12)
Open wetland vegetation Open wetlands 256 (4%) 2.6 (1.7–3.5) 0.7 (0.4–0.9)
Peat Peatlands 1279 (20%) 115 (100–130) 144 (123–165)
Lake water column DOC 1 DIC Lake 832 (13%) 0.06 (0.06–0.07) 0.05 (0.05–0.06)
Lake sediments Lake 832 (13%) 195 (89–301) 162 (74–250)
Whole region Region 6397 (100%) 426 (336–516)
NHLD, Northern Highlands Lake District; DOC, dissolved organic carbon; DIC, dissolved inorganic carbon.
Table 2 Estimated C fluxes into and out of the NHLD region
Regional fluxes Landscape
Areal coverage,
km2 (% of region)
Local flux, best estimate
(range) (g C m�2 yr�1)
Total flux, best estimate
(range) (Gg C yr�1)
Forest NEE (in) Forest 3454 (54%) 288 (261–315) 994 (900–1089)
Wetland NEE (in) Wetland 1791 (28%) 69 (36–102) 124 (64–183)
Precipitation inputs Region 6397 (100%) 1.8 (1.2–2.4) 12 (8–15)
Regional riverine runoff Region 6397 (100%) 5 (4–7) 34 (23–45)
Lake CO2 evasion Lake 832 (13%) 32 (25–39) 27 (21–32)
Stream CO2 evasion Streams 29 (0.5%) 47 (10–84) 1.4 (0.3–2.4)
Lake CH4 emissions Lake 832 (13%) 3 (1–4) 2.2 (1.1–3.3)
Wetland CH4 emissions Peatland 1279 (20%) 10 (1–20) 13 (1–25)
Net accumulation* Region 6397 (100%) 1053 (940–1165)
Fossil fuel emissions Region 6397 (100%) 24 (22–26) 154 (138–169)
*Calculated as the sum of all regional fluxes except fossil fuel emissions.
NHLD, Northern Highlands Lake District; NEE, net ecosystem exchange.
C A R B O N B U D G E T I N L A K E - R I C H R E G I O N 1201
r 2010 Blackwell Publishing Ltd, Global Change Biology, 17, 1193–1211

Lake sedimentation rates. We estimated a mean regional
lake sedimentation rate ranging from 14 to
39 g C m�2 yr�1, for a regional total of 12–33 Gg C yr�1.
The range reflects results from the use of different
groups of variables and three different upscaling
methods for mapping the 9 lakes with deposition rate
measurements onto the summer survey dataset
(Supporting Information Section S2), as well as large
uncertainty in sediment focusing ratio (Supporting
Information Section S3, see also Lehman, 1975; Davis
& Ford, 1982).
Hydrologic export from forests and wetlands to surface
waters. We calculated a total dissolved C stream
hydrologic export of 6.9 � 3.9 g C m�2 yr�1 (�95% CI)
for forested catchments, and 11.6 � 8.9 g C m�2 yr�1
(�95% CI) for wetland catchments. For forests, stream
DOC and DIC export are comparable with DOC making
Table 3 Estimated C fluxes into and out of the upland forest areas of the NHLD
Forest fluxes Landscape
Areal coverage,
km2 (% of region)
Local Flux, best
estimate (range)
(g C m�2 yr�1)
Total Flux, best
estimate (range)
(Gg C yr�1)
Forest NEE (in) Forest 3454 (54%) 288 (261–315) 994 (900–1089)
Forest GPP Forest 3454 (54%) 936 (903–969) 3233 (3119–3347)
Forest respiration Forest 3454 (54%) 648 (630–666) 2238 (2176–2301)
Precipitation Inputs Forest 3454 (54%) 1.8 (1.2–2.4) 6.2 (4.1–8.3)
Forest runoff Forest 3454 (54%) 7 (3–11) 24 (10–37)
Forest DOC runoff Forest 3454 (54%) 4.0 (1.5–6.6) 14 (5–23)
Forest DIC runoff Forest 3454 (54%) 3.0 (1.3–4.8) 10 (4–17)
Leaf litter forests to surface waters Forest–surface water interface 7805 km* 300 (150–450)w 2.3 (1.2–3.5)
Leaf litter forests to lakes Forest–lake interface 4583 km* 300 (150–450)w 1.4 (0.7–2.1)
Leaf litter forests to streams Forest–stream interface 3222 km* 300 (150–450)w 1.0 (0.5–1.4)
Net accumulation Forest 3454 (54%) 968 (873–1063)
*Length of shoreline.
wUnits of g C m�1 of shoreline yr�1.
NHLD, Northern Highlands Lake District; DOC, dissolved organic carbon; DIC, dissolved inorganic carbon; NEE, net ecosystem
exchange; GPP, gross primary production.
Table 4 Estimated C fluxes into and out of the wetland areas of the NHLD
Wetland fluxes Landscape
Areal coverage, km2
(% of region)
Local flux, best estimate
(range) (g C m�2 yr�1)
Total flux, best estimate
(range) (Gg C yr�1)
Wetland NEE (in) Wetland 1791 (28%) 69 (36–102) 124 (64–183)
Wetland GPP Wetland 1791 (28%) 490 (467–513) 878 (836–919)
Wetland respiration Wetland 1791 (28%) 421 (379–463) 754 (679–829)
Precipitation inputs Wetland 1791 (28%) 1.8 (1.2–2.4) 3.2 (2.1–4.3)
Wetland runoff Wetland 1791 (28%) 12 (3–20) 21 (5–37)
Wetland DOC runoff Wetland 1791 (28%) 11 (2–20) 20 (4–35)
Wetland DIC runoff Wetland 1791 (28%) 0.6 (�1.2–2.3) 1.0 (�2.2–4.2)
Leaf litter wetlands
(forested) to surface waters
Wetland–surface
water interface
3469 km* 200 (100–300)w 0.7 (0.3–1.0)
Leaf litter wetland
(forested) to lakes
Wetland–lake
interface
2037 km* 200 (100–300)w 0.4 (0.2–0.6)
Leaf litter wetland
(forested) to streams
Wetland–stream
interface
1432 km* 200 (100–300)w 0.3 (0.1–0.4)
Wetland CH4 emissions Peatland 1279 (20%) 10 (1–20) 13 (1–25)
Net accumulation Wetland 1791 (28%) 89 (27–152)
*Length of shoreline.
wUnits of g C m�1 of shoreline yr�1.
NHLD, Northern Highlands Lake District; DOC, dissolved organic carbon; DIC, dissolved inorganic carbon; NEE, net ecosystem
exchange; GPP, gross primary production.
1202 I . B U F FA M et al.
r 2010 Blackwell Publishing Ltd, Global Change Biology, 17, 1193–1211

up 57% of the total, while in wetlands DOC export
makes up 95% of the total. When scaled up to the
region, these amount to a lateral hydrologic export of
24 � 13 Gg C yr�1 from forests, and 21 � 16 Gg C yr�1
from wetlands.
Leaf litter and other aerial C fluxes from forests and wetlands
to surface waters. In the NHLD there are a total of
�5000 lakes with a total shoreline of 7383 km, giving
rise to an estimated airborne particulate transfer of 0.7–
2.1 Gg C yr�1 from upland forests to lakes, and 0.20–
0.61 Gg C yr�1 from forested wetlands to lakes. There
are a total of 2595 km of stream and river length (DNR
1 : 24 000 map) giving rise to an estimated airborne
particulate transfer of 0.5–1.5 Gg yr�1 from upland
forests to streams, and 0.15–0.47 Gg C yr�1 from
forested wetlands to streams.
Fossil fuel emissions. Measured regional fossil fuel
emissions were 26 g C m�2 yr�1 during 2002 (Gurney
et al., 2009), with an estimated average of
24 � 2.4 g C m�2 yr�1 for the 20-year period of interest.
This gives a total regional efflux of 154 � 15 Gg C yr�1.
Note that this represents local combustion of fossil fuels
and does not account for transport of fossil fuels into
the region, nor for local energy use derived from fossil
fuel combustion outside the region.
Budget summary and mean C accumulation times
Combining all of the pools and fluxes into one frame-
work (Tables 1 and 2, Fig. 2), it becomes apparent that
peat and lake sediments are far and away the largest C
pools in the NHLD, with best estimates of 144 � 21 and
162 � 88 Tg C, respectively. Upland soils (30 � 1 Tg C)
and forest biomass (33 � 2 Tg C) are a much smaller
component of the regional C storage in spite of covering
450% of the area. The total regional pool is estimated at
426 � 90 Tg C. The calculated regional flux is
1.1 � 0.1 Tg C yr�1 into the NHLD (i.e., C sink), with
the flux ordering for the three main landcover types
roughly inverse that of the pools (Fig. 2, Tables 1 and 2).
Upland forest NEE is by far the largest net flux at
994 � 94 Gg C yr�1 from the atmosphere into the forests.
Wetland NEE contributes about 10% of the regional
total exchange due to lower NEE and lower areal cover-
Table 5 Estimated C fluxes into and out of the surface waters of the NHLD
Surface water fluxes Landscape
Areal coverage,
km2 (% of region)
Local flux, best
estimate (range)
(g C m�2 yr�1)
Total flux, best
estimate (range)
(Gg C yr�1)
Precipitation inputs Lakes 1 streams 861 (13.5%) 1.8 (1.2–2.4) 1.5 (1.0–2.0)
Forest runoff (in) Lakes 1 streams 861 (13.5%) 28 (12–43) 24 (10–37)
Forest DOC runoff Lakes 1 streams 861 (13.5%) 16 (6–26) 14 (5–23)
Forest DIC runoff Lakes 1 streams 861 (13.5%) 12 (5–19) 10 (4–17)
Wetland runoff (in) Lakes 1 streams 861 (13.5%) 24 (6–43) 21 (5–37)
Wetland DOC runoff Lakes 1 streams 861 (13.5%) 23 (5–41) 20 (4–35)
Wetland DIC runoff Lakes 1 streams 861 (13.5%) 1 (�3–5) 1 (�2–4)
Leaf litter forests to surface waters Forest–surface water
interface
7805 km* 300 (150–450)w 2.3 (1.2–3.5)
Leaf litter forests to lakes Forest–lake interface 4583 km* 300 (150–450)w 1.4 (0.7–2.1)
Leaf litter forests to streams Forest–stream interface 3222 km* 300 (150–450)w 1.0 (0.5–1.4)
Leaf litter wetlands (forested) to
surface waters
Wetland–surface water
interface
3469 km* 200 (100–300)w 0.7 (0.3–1.0)
Leaf litter wetland (forested) to lakes Wetland–lake interface 2037 km* 200 (100–300)w 0.4 (0.2–0.6)
Leaf litter wetland (forested) to streams Wetland–stream interface 1432 km* 200 (100–300)w 0.3 (0.1–0.4)
Surface water CO2 evasion Lakes 1 streams 861 (13.5%) 33 (26–39) 28 (22–34)
Lake CO2 evasion Lake 832 (13%) 32 (25–39) 27 (21–32)
Stream CO2 evasion Streams 29 (0.5%) 47 (10–84) 1.4 (0.3–2.4)
Lake CH4 emissions Lake 832 (13%) 3 (1–4) 2.2 (1.1–3.3)
Regional riverine runoff (out) Region 6397 (100%) 5 (4–7) 34 (23–45)
Net accumulationz Lake 832 (13%) �15 (�40–9)
Sediment deposition Lake 832 (13%) 20 (9–31) 17 (8–26)
*Length of shoreline.
wUnits of g C m�1 of shoreline yr�1.
zCalculated as the sum of all surface water fluxes except for sediment deposition, and assumed to accumulate in lakes only.
NHLD, Northern Highlands Lake District; DOC, dissolved organic carbon; DIC, dissolved inorganic carbon.
C A R B O N B U D G E T I N L A K E - R I C H R E G I O N 1203
r 2010 Blackwell Publishing Ltd, Global Change Biology, 17, 1193–1211
age of wetlands relative to upland forests (Table 2). Lake
CO2 evasion contributes about 3% of the regional total
net exchange. Precipitation flux into and hydrologic
flux out of the NHLD are on the order of 1% and 3%,
respectively, of the regional total net exchange.
The mismatch between pool sizes and current rates
points to widely disparate mean C turnover times
among wetlands, lakes, and forests of the region.
Assuming current rates are representative of long-term
rates, the estimated average time required to build up
each major regional C pool was 65 years for forest, 1775
years for peat wetlands, and 7364 years for lake sedi-
ments.
Spatial distribution of C pools and fluxes on the landscape
Pools and fluxes of C were spatially heterogeneous at a
range of spatial scales in the NHLD landscape. The
most dense pools of C were peat in peatlands and
sediments in lakes (Fig. 3b). Patches of relatively young
coniferous forest gave by far the greatest local rates of
influx of C into the land surface, while lakes gave rise to
patches of C evasion, with smaller lakes having the
highest evasion rates (Fig. 3c).
Discussion
Implications of magnitude and spatial variability of Cpools and fluxes
By constructing a C budget we incorporated surface
freshwaters, wetlands, and upland forests into a single
framework. This framework establishes a context for C
cycling research in this and other surface-water rich
regions. An integrated view like this is needed to target
research and management strategies in a parsimonious
way.
We determined that the largest current-day annual
land–atmosphere fluxes in the NHLD region are found
in forests, which are aggrading. This rate is an order of
magnitude higher than surface–atmosphere exchange
in wetlands or surface waters (Fig. 2, Table 2). Thus the
current behavior of the NHLD in terms of annual C
Forests: 64,000
Pool sizes in Gg-C
Wetlands: 158,000 Surface Waters: 162,000
Atmosphere
Flux rates in Gg-C yr-1
Forest NEE994
GPP 3233, R 2238
CH4 emission13
Wetland NEE124
GPP 878, R 754
CO2 evasion28
Runoff34
CH4 evasion2
Fossil fuels154
Precip12
Sed 22
Wetland runoff21
Forest runoff24
Wetland litter1
Forest litter2
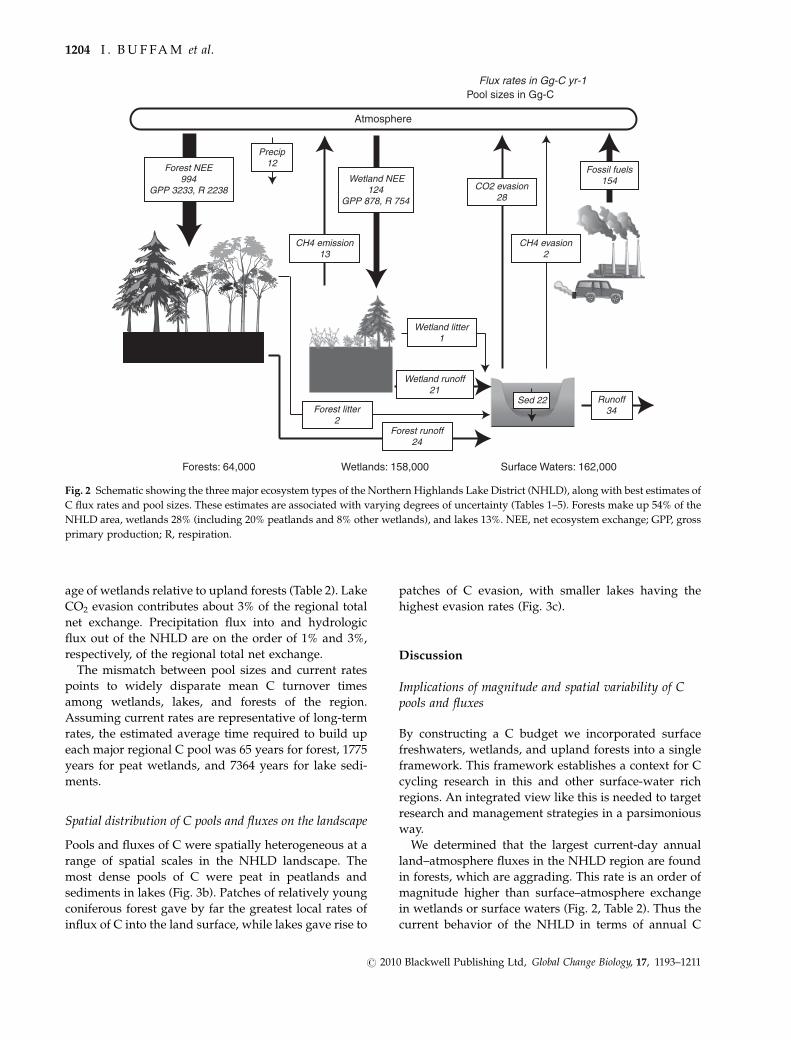
Fig. 2 Schematic showing the three major ecosystem types of the Northern Highlands Lake District (NHLD), along with best estimates of
C flux rates and pool sizes. These estimates are associated with varying degrees of uncertainty (Tables 1–5). Forests make up 54% of the
NHLD area, wetlands 28% (including 20% peatlands and 8% other wetlands), and lakes 13%. NEE, net ecosystem exchange; GPP, gross
primary production; R, respiration.
1204 I . B U F FA M et al.
r 2010 Blackwell Publishing Ltd, Global Change Biology, 17, 1193–1211

exchange can be roughly approximated by the behavior
of the forests. In the short-term, management for in-
creased forest productivity would increase the regional
C sequestration. However, the largest C pools in the
region are found in longer-term storage of peat and lake
sediments (Fig. 2, Table 1). The disconnect between
current rates and pool sizes implies very different turn-
over times in the different C pools within the region.
Lake sediments and peatlands have accumulated over
millennia, whereas most of the C in forests has accu-
mulated during the past century as secondary succes-
sion followed large-scale deforestation for timber. These
C accumulation rates will decrease as the forests ap-
proach climax, if they are allowed to do so. Otherwise,
disturbances like fire or logging may again release C
and reset the forest pool, though in the case of forest
harvest, the fate of the wood must be considered (White
et al., 2005). For long-term C sequestration, preservation
of the peat and lake sediment pools may be more critical
than encouraging forest growth.
Because peat and particularly lake sediments are
long-term pools and much more stable than forest C,
they are a critical component of the regional C picture.
In our study, peat in peatlands was a major C store as
expected (Buffam et al., 2010), but lake sediments were a
similarly large, and more uncertain pool. In other North
American regions with glacially formed lakes, mean
lake sediment organic C accumulation rates vary from
5 0 5 km2.5
0 – 5
5 – 10
10 – 20
20 – 40
40 – 80
80 – 160
> 160
Carbon pool density(kg C m–2)
–976 to – 500
–499 to – 250
–249 to – 100
–99 to – 50
– 49 to 0
1 – 50
51 – 100
101 – 250
251 – 500
Annual surface-Atm. CO2exchange (g C m–2 yr–1)
Land cover (NLCD2001)Trout Lake region
11-Open Water
21-Developed, Open
23-Developed, MedI ntens
41-Deciduous Forest
42-Coniferous Forest
43-Mixed Forest
52-Scrub/Shrub
90-Woody Wetlands
95-Open Wetlands
(a) (b) (c)
Fig. 3 Illustration of spatial variation of carbon pools and fluxes on the landscape, for an 18� 18 km region around the Trout Lake Field
Station. (a) Land cover. (b) Pool sizes were assigned by summing the soil/sediment C and vegetation C at a given location. This was
achieved by combining the NRCS soils map for mineral soils and histosols (peatlands), the lakes map with modeled sediment pools, and
the forest vegetation C pool using average values for each of three regional forest types from the USFS–FIA database. (c) Average annual
surface–atmosphere fluxes are visualized by assigning the average value to each terrestrial 30� 30 m pixel in the NLCD map according
to category, while lake fluxes were assigned at random from the distribution of values for each lake size category as described in the text.
The seven LTER lakes were assigned their measured long-term mean annual flux values. Positive values, flux into atmosphere; negative
values, flux into land surface.
C A R B O N B U D G E T I N L A K E - R I C H R E G I O N 1205
r 2010 Blackwell Publishing Ltd, Global Change Biology, 17, 1193–1211

15 to about 30 g C m�2 yr�1 (Mulholland & Elwood,
1982; Dean & Gorham, 1998; Campbell et al., 2000),
i.e., about 150–300 kg C m�2 assuming an average accu-
mulation period of 10 000 years for the Holocene. Our
estimate of 195 � 106 kg C m�2 is uncertain but falls
within this range, suggesting that the NHLD has similar
long-term sedimentation rates and total pool sizes as
other North American glacially-formed regions. Be-
cause of the high (13%) areal coverage of lakes in the
NHLD, this C pool is on the same order as that of C in
peat. Together, these two pools make up over 80% of the
regional C store.
The patchwork of surface waters emitting CO2 in the
midst of a terrestrial landscape absorbing CO2 implies
connectivity between the terrestrial and aquatic sys-
tems. Since lakes are on balance accumulating sediment
C as well, there is no internal source of C which could
maintain the observed widespread lake and stream
supersaturation in CO2 (Cole et al., 1994; Algesten
et al., 2004; Teodoru et al., 2009; Wallin et al., 2010). Thus,
an allochthonous, terrestrial source of C is implicated
for the surface waters in the NHLD and other similar
systems. This source could be either organic C, which is
subsequently mineralized in-lake, or direct inputs of
inorganic C in groundwater, and likely includes both.
The magnitude of C loading from uplands and wet-
lands to surface waters of the NHLD, and the strength
and spatial extent of that connection has still not been
well established. Connectivity may depend in large part
on stream networks, which have not been as well
studied as lakes in the region. New measurements in
a random survey of streams across the region demon-
strate a wide range of DOC and DIC concentrations up
to 63 and 24 mg L�1, respectively (Lottig, 2009), suggest-
ing that streams may provide important conduits to
lakes. Stream DOC concentration is positively corre-
lated with wetland percentage (Gergel et al., 1999;
Lottig, 2009), demonstrating the coupling between
watersheds and streams in the region.
The spatial heterogeneity in C density and surface–
atmosphere flux throughout the landscape (Fig. 3) may
be significant for some lateral fluxes of C. Although
hydrologic and aolian transport of C from upland/
wetland ecosystems into surface waters is quantita-
tively small on a regional basis relative to forest NEE,
lake and stream ecosystems depend upon this linkage
for their C cycling and metabolic activity (Fisher &
Likens, 1973; Carpenter et al., 2005). Much of the energy
flow in surface waters depends ultimately on terrestrial
C, thus changes in terrestrial systems may also alter
aquatic C cycling and ecosystems. The spatial config-
uration of local C sources may thus be important.
Spatial interactions among landscape components,
which were not addressed in our analysis, could also
create important feedbacks that could amplify or sup-
press fluxes from certain landscape components. Het-
erogeneity in forest patches, for instance, gives rise to
heterogeneity in local air temperature regime which
may feed back to influence local C accumulation rates
(Robinson et al., 2009). The importance of spatial hetero-
geneity for biogeochemical fluxes is still not well under-
stood (Strayer et al., 2003; Lovett et al., 2005) and future
research is needed to address these interactions.
While a thorough discussion of fossil fuel emissions is
beyond the scope of this paper, we included estimates of
such here for comparison and for inclusion within a
complete atmospheric budget. Unlike biosphere-atmo-
sphere fluxes, fossil fuel emissions are almost entirely
produced by subsidy of external C (fossil fuels extracted
outside the region such as automobile gasoline) that are
then combusted locally. Consequently, they mostly do
not directly impact local pools and fluxes of C. However,
from the perspective of what the atmosphere senses (i.e.,
for tracer–transport inverse models), local emissions
need to be considered. The low population density of
the NHLD region gave rise to fossil fuel emissions that
are relatively low, at least in comparison to the global
scale where net fossil fuel CO2 emissions are nearly four
times the size of the biosphere net C sink (Houghton,
2007). Consequently, from the atmospheric perspective,
the NHLD region is still a CO2 sink even when fossil fuel
emissions are considered. However, in terms of net
fluxes, fossil fuel emissions are the second largest regio-
nal surface–atmosphere flux term after forest NEE, and
unlike forest NEE, this term is likely to continue to
increase with time at least in the near future (IPCC,
2007). Consideration of combustion elsewhere used to
provide energy locally was not considered here, but is
arguably a similarly large term that is relevant at least
from a C management policy perspective.
Remaining sources of uncertainty
Substantial uncertainties and potential systematic er-
rors remain in many components of the NHLD C
budget, and these uncertainties highlight remaining
critical knowledge gaps in this and other regions.
Among the important pools, forest biomass and soil
pool estimates are known from extensive datasets,
many at a national scale. In the NHLD, the peat pool
size is well constrained only because of a recent survey
targeting regional mean peat depth (Buffam et al., 2010).
The largest uncertainty in this and many other lake-rich
regions is storage in lake sediments. The uncertainty in
lake sediment storage is related to uncertainty in max-
imum sediment depth, in mean/maximum depth ratio,
and in mean C content of the sediment. In particular,
there is a lack of generalizeable knowledge about the
1206 I . B U F FA M et al.
r 2010 Blackwell Publishing Ltd, Global Change Biology, 17, 1193–1211

mean/maximum sediment depth ratio, which is related
to the focusing of sediments in deeper areas of lakes
(Lehman, 1975; Davis & Ford, 1982). For an individual
lake, one should not expect to accurately predict mean
depth from maximum depth or any single core (Davis &
Ford, 1982), and even at a regional scale we estimate
high uncertainty in this relationship. Technological ad-
vances in surveying techniques with for example
ground-penetrating radar surveys of sediment depth
possible from boats (J. A. Rusak, unpublished results,
Buynevich & Fitzgerald, 2003) suggests hope for an
increase in information on lake-wide sediment depth
distributions. This would help greatly in reducing un-
certainty in total sediment C storage.
Among the important fluxes, all groups still have
substantial uncertainty, with the primary cause being
relatively low numbers of sites with consistent mea-
surements over multiple years. Interannual variability
can be considerable (Hanson et al., 2006; Magnuson
et al., 2006; Desai et al., 2010), thus short time periods
are not adequate to characterize current rates, much less
long-term responses to gradual environmental change.
Ideally, long-term records would be obtained from a
large random sample, but practical constraints may
limit this approach. In the case of the NHLD, excellent
long-term records are available for NTL–LTER lakes,
which cover the regional range of values in several
parameters relevant to C cycling. Nonetheless the small
number of sites with long-term flux measurements has
presented the greatest challenge to the upscaling ex-
ercise presented in this paper. This is also the most
difficult to quantify and probably the largest source of
uncertainty in upscaling to the region.
In moving forward, we recommend additional flux
measurements in wetlands and reservoirs, for which
there are currently few. These are crucial for understand-
ing of landscape scale C cycling in the long term. The
wetland fluxes in the NHLD were poorly constrained,
despite being an important contributor to regional
C exchange. They are also almost within the error range
of being in balance with the atmosphere, due to high
uncertainty in NEE, methane emissions, and hydrologic
exports to surface waters. Research detailing complete
annual hydrologic export of C, both surface and subsur-
face, from a range of wetland types is a clear need for the
near future. Reservoirs make up about 1.6% of the
regional area and for the purposes of this regional
C budget we have assumed they behave as natural lakes
of similar size. Studies of C cycling in reservoirs are rare
relative to studies of natural lakes, but a recent review
found CO2 emissions in temperate reservoirs averaging
about double those of natural lakes, and typically declin-
ing with age of the reservoir to reach a value near that of
natural lakes after some decades (St Louis et al., 2000).
Sediment C burial rates in reservoirs have been esti-
mated at about an order of magnitude higher than those
in natural lakes on a per area basis (Mulholland &
Elwood, 1982; Dean & Gorham, 1998), but the fate of
that buried C is not well known on timescales longer
than a few decades, as it depends on the fate of the dam
and reservoir (Cole et al., 2007).
One of the greatest sources of uncertainty in the
surface water budget is the limited information on
riverine C export from the region, in particular for
DIC. Further, literature values of this riverine flux are
limited and extremely variable. For example, DIC loads
have been reported to be smaller than (Clair et al., 1994),
greater than (Baker et al., 2008), or about the same (Hope
et al., 1994) as DOC among different world regions.
Limited available data for DOC adds additional uncer-
tainty to C loss estimates from the NHLD. DOC con-
centrations and fluxes have been quantified in many
streams and rivers throughout the world, and statistical
models to estimate riverine export within and among
regions are often strong (e.g., Aitkenhead & McDowell,
2000; Mulholland, 2003). However, there is also a wide
range of DOC yields within and among regions. Aitken-
head & McDowell (2000) report the following averages
based on an extensive literature review: peat/boreal
mix 6 g C m�2 yr�1, and northern mixed forest
5.2 g C m�2 yr�1. These averages are similar to our esti-
mated rate of 4–7 g C m�2 yr�1 for all C fractions, of
which half is DOC (Table 2).
The surface–atmosphere NEE fluxes estimated for
forests and wetlands from the IFUSE approach used
herein are sensitive to choice of flux towers used in
model calibration and representativeness of these flux
towers to the mean NEE for each land cover. A compar-
ison of regional fluxes computed from IFUSE against
three other independent regional flux estimates in a
nearby region (Desai et al., 2010) shows that the IFUSE
typically predicts more uptake (larger negative NEE)
than methods based on inventory approaches or tracer–
transport budgets and inversions, though often within
the uncertainty bounds of each method. Further analy-
sis has suggested that the mature hardwood forest flux
towers used in the upscaling may not be representative
of the range of variability in forest structure and C
fluxes found in these kinds of forests (Desai et al.,
2007). A more thorough investigation of C fluxes in
other kinds of mature productive forests (e.g., mature
aspen) is warranted. Forest inventory approaches for
the Northern Highlands regions suggest a mean NEE
that is smaller (less uptake) than the IFUSE, but still a
significant sink in forests. It is also likely that the three
wetland towers used to estimate wetland NEE (Sup-
porting Information Section S1) are not sufficient to
cover the range of fluxes found, given the large range
C A R B O N B U D G E T I N L A K E - R I C H R E G I O N 1207
r 2010 Blackwell Publishing Ltd, Global Change Biology, 17, 1193–1211

in wetland vegetation types and the substantial C stocks
in these systems across the region (Buffam et al., 2010).
Importance of accounting for surface waters in this andother regions
The C export from terrestrial ecosystems to surface
waters in the NHLD (�16 g C m�2 land area yr�1) is
similar to the recently estimated global mean. The
magnitude of the flux of C from terrestrial ecosystems
to surface waters is not well constrained, but recent
global estimates have ranged from 1.9 to 2.9 Pg C yr�1
(Cole et al., 2007; Battin et al., 2009; Tranvik et al., 2009),
equivalent to 13–19 g C m�2 yr�1 averaged over the land
surface of the earth. The fate of C upon reaching surface
waters in the NHLD (34% CO2 emissions, 27% sedi-
mentation, 39% hydrologic export) was also in the same
range as that estimated for the globe (44% CO2 emis-
sions, 22% sedimentation, 33% hydrologic export) (Bat-
tin et al., 2009).
In this region, the terrestrial C accumulation would
be overestimated by �7% if export to surface waters
was not included in the budget. Although this number
may seem small, it is significant because it represents a
persistent bias. Because surface waters almost invari-
ably serve to remove/receive C from their terrestrial
watersheds, any C budget that does not account for that
loss will overestimate terrestrial C accumulation. In this
study and two others of similar scale in the boreal and
sub-arctic (Table 6), C export to surface waters varied
only by a factor of two, while terrestrial NEE varied by
over an order of magnitude (Christensen et al., 2007;
Jonsson et al., 2007). The among-region variation in the
proportional contribution of surface waters to regional
C budgets is thus driven primarily by variation in
terrestrial NEE, as opposed to variation in export of C
to surface waters – and the NHLD, with growing
secondary forest, has a relatively high NEE. At the
global scale, recent estimates of C export to surface
waters are similar to the total land accumulation rate
(�2.2 Pg C yr�1), thus at that scale terrestrial C accumu-
lation would be overestimated by about 40–60% if the
calculation was made by upscaling of local land–atmo-
sphere exchange without taking into account C export
to surface waters (Table 6, Battin et al., 2009).
Although there are few studies for comparison at the
regional scale, we do not find evidence that the propor-
tion of the landscape occupied by lakes is strongly
correlated with total C export to surface waters, per
unit area of land (Table 6). However, the ultimate fate of
the exported C varies widely between systems domi-
nated by lakes vs. systems dominated by riverine net-
works. With a high proportion of lakes in the landscape,
C storage in sediment is a common pathway for C
exported to surface waters (This study, Christensen
et al., 2007) while in a stream-dominated landscape,
hydrologic export of C is more important (Jonsson
et al., 2007). In both lake-rich and lake-poor landscapes,
CO2 evasion to the atmosphere is another substantial
fate of C exported to surface waters (This study, Chris-
tensen et al., 2007; Jonsson et al., 2007). The CO2 evasion
derives both from efflux of inorganic C from ground-
water (surface waters as chimneys) and from the re-
spiration of terrestrial organic C (surface waters as
Table 6 Comparison of the role of surface waters in C cycling for three studies featuring complete regional C budgets including
surface waters, and an estimate for the globe
Biome Subarctic Sweden Boreal Sweden
North temperate
WI, USA Global land area
Study Christensen et al. (2007) Jonsson et al. (2007) This study Battin et al. (2009)
Area (km2) 3955 3025 6400 1.5� 108
% lakes by area 14 4 13 �3
Aquatic processing (gC m�2 yr�1)
CO2 efflux from lakes/streams 2.0 4.5 5.3 (4.2–6.5) 8
Hydrologic export 2.4 4.5 6.5 (4.4–8.6) 6
Sedimentation in lakes 2.3 0 4.2 (2.3–6.3) 4
Total 7 9 16 (13–19) 18
Terrestrial NEE (g C m�2 yr�1)* 15 139 213 30
Potential bias in NEE estimate (%)w 44 6 7 (6–9) 60
All fluxes are normalized to area of terrestrial watershed (i.e., not including lake area) for direct comparison with area-normalized
terrestrial NEE. For the current study, best estimate and range are included.
*Includes uplands and wetlands.
wIf surface waters are ignored in regional C budget.
NEE, net ecosystem exchange.
1208 I . B U F FA M et al.
r 2010 Blackwell Publishing Ltd, Global Change Biology, 17, 1193–1211
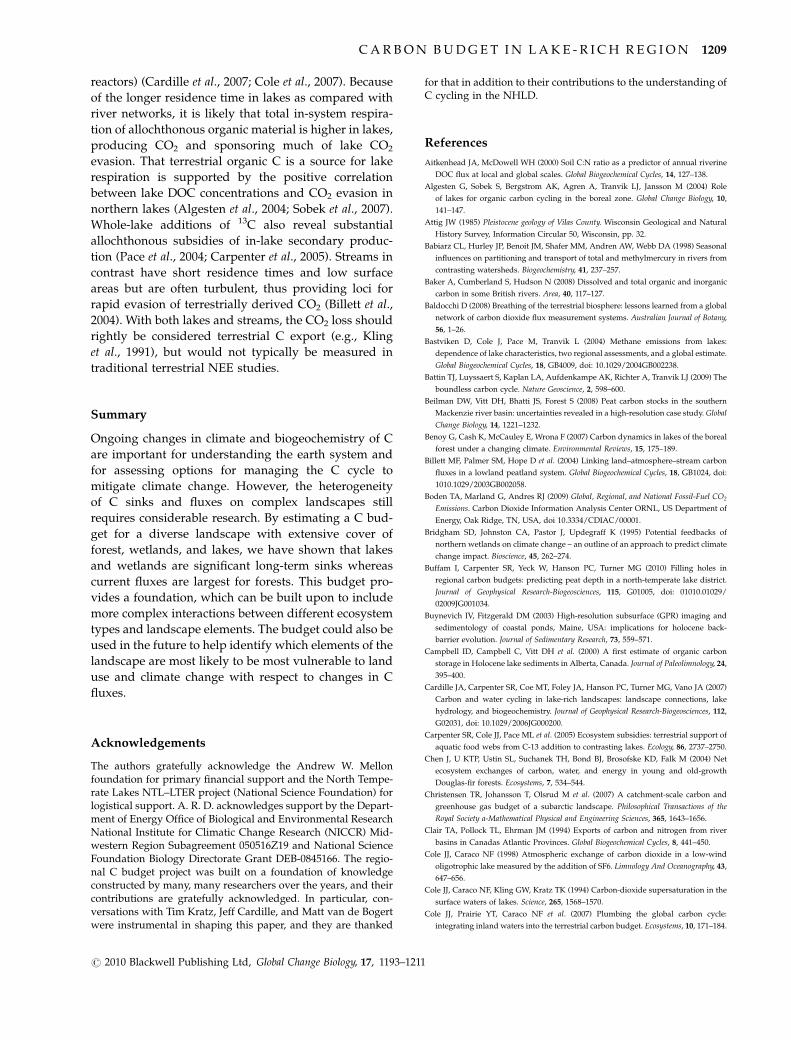
reactors) (Cardille et al., 2007; Cole et al., 2007). Because
of the longer residence time in lakes as compared with
river networks, it is likely that total in-system respira-
tion of allochthonous organic material is higher in lakes,
producing CO2 and sponsoring much of lake CO2
evasion. That terrestrial organic C is a source for lake
respiration is supported by the positive correlation
between lake DOC concentrations and CO2 evasion in
northern lakes (Algesten et al., 2004; Sobek et al., 2007).
Whole-lake additions of 13C also reveal substantial
allochthonous subsidies of in-lake secondary produc-
tion (Pace et al., 2004; Carpenter et al., 2005). Streams in
contrast have short residence times and low surface
areas but are often turbulent, thus providing loci for
rapid evasion of terrestrially derived CO2 (Billett et al.,
2004). With both lakes and streams, the CO2 loss should
rightly be considered terrestrial C export (e.g., Kling
et al., 1991), but would not typically be measured in
traditional terrestrial NEE studies.
Summary
Ongoing changes in climate and biogeochemistry of C
are important for understanding the earth system and
for assessing options for managing the C cycle to
mitigate climate change. However, the heterogeneity
of C sinks and fluxes on complex landscapes still
requires considerable research. By estimating a C bud-
get for a diverse landscape with extensive cover of
forest, wetlands, and lakes, we have shown that lakes
and wetlands are significant long-term sinks whereas
current fluxes are largest for forests. This budget pro-
vides a foundation, which can be built upon to include
more complex interactions between different ecosystem
types and landscape elements. The budget could also be
used in the future to help identify which elements of the
landscape are most likely to be most vulnerable to land
use and climate change with respect to changes in C
fluxes.
Acknowledgements
The authors gratefully acknowledge the Andrew W. Mellonfoundation for primary financial support and the North Tempe-rate Lakes NTL–LTER project (National Science Foundation) forlogistical support. A. R. D. acknowledges support by the Depart-ment of Energy Office of Biological and Environmental ResearchNational Institute for Climatic Change Research (NICCR) Mid-western Region Subagreement 050516Z19 and National ScienceFoundation Biology Directorate Grant DEB-0845166. The regio-nal C budget project was built on a foundation of knowledgeconstructed by many, many researchers over the years, and theircontributions are gratefully acknowledged. In particular, con-versations with Tim Kratz, Jeff Cardille, and Matt van de Bogertwere instrumental in shaping this paper, and they are thanked
for that in addition to their contributions to the understanding ofC cycling in the NHLD.
References
Aitkenhead JA, McDowell WH (2000) Soil C:N ratio as a predictor of annual riverine
DOC flux at local and global scales. Global Biogeochemical Cycles, 14, 127–138.
Algesten G, Sobek S, Bergstrom AK, Agren A, Tranvik LJ, Jansson M (2004) Role
of lakes for organic carbon cycling in the boreal zone. Global Change Biology, 10,
141–147.
Attig JW (1985) Pleistocene geology of Vilas County. Wisconsin Geological and Natural
History Survey, Information Circular 50, Wisconsin, pp. 32.
Babiarz CL, Hurley JP, Benoit JM, Shafer MM, Andren AW, Webb DA (1998) Seasonal
influences on partitioning and transport of total and methylmercury in rivers from
contrasting watersheds. Biogeochemistry, 41, 237–257.
Baker A, Cumberland S, Hudson N (2008) Dissolved and total organic and inorganic
carbon in some British rivers. Area, 40, 117–127.
Baldocchi D (2008) Breathing of the terrestrial biosphere: lessons learned from a global
network of carbon dioxide flux measurement systems. Australian Journal of Botany,
56, 1–26.
Bastviken D, Cole J, Pace M, Tranvik L (2004) Methane emissions from lakes:
dependence of lake characteristics, two regional assessments, and a global estimate.
Global Biogeochemical Cycles, 18, GB4009, doi: 10.1029/2004GB002238.
Battin TJ, Luyssaert S, Kaplan LA, Aufdenkampe AK, Richter A, Tranvik LJ (2009) The
boundless carbon cycle. Nature Geoscience, 2, 598–600.
Beilman DW, Vitt DH, Bhatti JS, Forest S (2008) Peat carbon stocks in the southern
Mackenzie river basin: uncertainties revealed in a high-resolution case study. Global
Change Biology, 14, 1221–1232.
Benoy G, Cash K, McCauley E, Wrona F (2007) Carbon dynamics in lakes of the boreal
forest under a changing climate. Environmental Reviews, 15, 175–189.
Billett MF, Palmer SM, Hope D et al. (2004) Linking land–atmosphere–stream carbon
fluxes in a lowland peatland system. Global Biogeochemical Cycles, 18, GB1024, doi:
1010.1029/2003GB002058.
Boden TA, Marland G, Andres RJ (2009) Global, Regional, and National Fossil-Fuel CO2
Emissions. Carbon Dioxide Information Analysis Center ORNL, US Department of
Energy, Oak Ridge, TN, USA, doi 10.3334/CDIAC/00001.
Bridgham SD, Johnston CA, Pastor J, Updegraff K (1995) Potential feedbacks of
northern wetlands on climate change – an outline of an approach to predict climate
change impact. Bioscience, 45, 262–274.
Buffam I, Carpenter SR, Yeck W, Hanson PC, Turner MG (2010) Filling holes in
regional carbon budgets: predicting peat depth in a north-temperate lake district.
Journal of Geophysical Research-Biogeosciences, 115, G01005, doi: 01010.01029/
02009JG001034.
Buynevich IV, Fitzgerald DM (2003) High-resolution subsurface (GPR) imaging and
sedimentology of coastal ponds, Maine, USA: implications for holocene back-
barrier evolution. Journal of Sedimentary Research, 73, 559–571.
Campbell ID, Campbell C, Vitt DH et al. (2000) A first estimate of organic carbon
storage in Holocene lake sediments in Alberta, Canada. Journal of Paleolimnology, 24,
395–400.
Cardille JA, Carpenter SR, Coe MT, Foley JA, Hanson PC, Turner MG, Vano JA (2007)
Carbon and water cycling in lake-rich landscapes: landscape connections, lake
hydrology, and biogeochemistry. Journal of Geophysical Research-Biogeosciences, 112,
G02031, doi: 10.1029/2006JG000200.
Carpenter SR, Cole JJ, Pace ML et al. (2005) Ecosystem subsidies: terrestrial support of
aquatic food webs from C-13 addition to contrasting lakes. Ecology, 86, 2737–2750.
Chen J, U KTP, Ustin SL, Suchanek TH, Bond BJ, Brosofske KD, Falk M (2004) Net
ecosystem exchanges of carbon, water, and energy in young and old-growth
Douglas-fir forests. Ecosystems, 7, 534–544.
Christensen TR, Johansson T, Olsrud M et al. (2007) A catchment-scale carbon and
greenhouse gas budget of a subarctic landscape. Philosophical Transactions of the
Royal Society a-Mathematical Physical and Engineering Sciences, 365, 1643–1656.
Clair TA, Pollock TL, Ehrman JM (1994) Exports of carbon and nitrogen from river
basins in Canadas Atlantic Provinces. Global Biogeochemical Cycles, 8, 441–450.
Cole JJ, Caraco NF (1998) Atmospheric exchange of carbon dioxide in a low-wind
oligotrophic lake measured by the addition of SF6. Limnology And Oceanography, 43,
647–656.
Cole JJ, Caraco NF, Kling GW, Kratz TK (1994) Carbon-dioxide supersaturation in the
surface waters of lakes. Science, 265, 1568–1570.
Cole JJ, Prairie YT, Caraco NF et al. (2007) Plumbing the global carbon cycle:
integrating inland waters into the terrestrial carbon budget. Ecosystems, 10, 171–184.
C A R B O N B U D G E T I N L A K E - R I C H R E G I O N 1209
r 2010 Blackwell Publishing Ltd, Global Change Biology, 17, 1193–1211
Cook BD, Desai AR, Weishampel P et al. (2008) American Geophysical Union Fall
Meeting, EOS Trans., AGU, Abstract B33B-0422, Vol. 89, San Francisco, CA, USA.
Curtis JT (1959) The Vegetation of Wisconsin: An Ordination of Plant Communities.
University of Wisconsin Press, Madison, WI, USA.
Davis MB, Ford MSJ (1982) Sediment focusing in Mirror Lake, New Hampshire.
Limnology And Oceanography, 27, 137–150.
Dean WE, Gorham E (1998) Magnitude and significance of carbon burial in lakes,
reservoirs, and peatlands. Geology, 26, 535–538.
Desai AR (in press) Climate and phenology drive coherent regional interannual
variability of carbon dioxide flux in a heterogeneous landscape. Journal of Geophy-
sical Research-Biogeosciences.
Desai AR, Helliker BR, Moorcroft PR, Andrews AE, Berry JA (2010) Interannual
variability in regional carbon fluxes from top-down and bottom-up perspectives.
Journal of Geophysical Research – Biogeosciences, 115, G02011, doi: 10.1029/2009J
G001122.
Desai AR, Moorcroft PR, Bolstad PV, Davis KJ (2007) Regional carbon fluxes from an
observationally constrained dynamic ecosystem model: impacts of disturbance,
CO2 fertilization, and heterogeneous land cover. Journal of Geophysical Research-
Biogeosciences, 112, G01017, doi: 01010.01029/02006JG000264.
Desai AR, Noormets A, Bolstad PV et al. (2008) Influence of vegetation and seasonal
forcing on carbon dioxide fluxes across the Upper Midwest, USA: implications for
regional scaling. Agricultural and Forest Meteorology, 148, 288–308.
Dillon PJ, Molot LA (1997) Dissolved organic and inorganic carbon mass balances in
central Ontario lakes. Biogeochemistry, 36, 29–42.
Downing JA, Prairie YT, Cole JJ et al. (2006) The global abundance and size distribution
of lakes, ponds, and impoundments. Limnology And Oceanography, 51, 2388–2397.
Dunn AL, Barford CC, Wofsy SC, Goulden ML, Daube BC (2007) A long-term record of
carbon exchange in a boreal black spruce forest: means, responses to interannual
variability, and decadal trends. Global Change Biology, 13, 577–590.
Elling AE, Knighton MD (1984) Sphagnum moss recovery after harvest in a Minnesota
bog. Journal Of Soil And Water Conservation, 39, 209–211.
Fisher SG (1977) Organic matter processing by a stream-segment ecosystem – Fort
River, Massachusetts, USA. Internationale Revue Der Gesamten Hydrobiologie, 62, 701–
727.
Fisher SG, Likens GE (1973) Energy flow in Bear Brook, New Hampshire – Integrative
approach to stream ecosystem metabolism. Ecological Monographs, 43, 421–439.
Garnett MH, Ineson P, Stevenson AC, Howard DC (2001) Terrestrial organic carbon
storage in a British moorland. Global Change Biology, 7, 375–388.
Gasith A (1974) Allochthonous organic matter and organic matter dynamics in Lake Wingra,
Wisconsin. PhD thesis, University of Wisconsin, Madison, WI, 209 pp.
Gasith A, Hasler AD (1976) Airborne litterfall as a source of organic-matter in lakes.
Limnology and Oceanography, 21, 253–258.
Gergel SE, Turner MG, Kratz TK (1999) Dissolved organic carbon as an indicator of the
scale of watershed influence on lakes and rivers. Ecological Applications, 9, 1377–1390.
Gorham E (1991) Northern peatlands – role in the carbon-cycle and probable responses
to climatic warming. Ecological Applications, 1, 182–195.
Granberg G, Ottosson-Lofvenius M, Grip H, Sundh I, Nilsson M (2001) Effect of
climatic variability from 1980 to 1997 on simulated methane emission from a boreal
mixed mire in northern Sweden. Global Biogeochemical Cycles, 15, 977–991.
Gurney KR, Mendoza DL, Zhou YY, Fischer ML, Miller CC, Geethakumar S, Du Can
SD (2009) High resolution fossil fuel combustion CO2 emission fluxes for the United
States. Environmental Science & Technology, 43, 5535–5541.
Hanson PC, Carpenter SR, Armstrong DE, Stanley EH, Kratz TK (2006) Lake dissolved
inorganic carbon and dissolved oxygen: changing drivers from days to decades.
Ecological Monographs, 76, 343–363.
Hanson PC, Carpenter SR, Cardille JA, Coe MT, Winslow LA (2007) Small lakes
dominate a random sample of regional lake characteristics. Freshwater Biology, 52,
814–822.
Hope D, Billett MF, Cresser MS (1994) A review of the export of carbon in river water –
fluxes and processes. Environmental Pollution, 84, 301–324.
Houghton RA (2007) Balancing the global carbon budget. Annual Review of Earth and
Planetary Sciences, 35, 313–347.
IPCC (2007) Climate Change 2007 – The Physical Science Basis. Contribution of Working
Group I to the Fourth Assessment Report of the Intergovernmental Panel on Climate
Change. Cambridge University Press, Cambridge, UK.
Jenkins JC, Chojnacky DC, Heath LS, Birdsey RA (2003) National-scale biomass
estimators for United States tree species. Forest Science, 49, 12–35.
Jonsson A, Algesten G, Bergstrom AK, Bishop K, Sobek S, Tranvik LJ, Jansson M (2007)
Integrating aquatic carbon fluxes in a boreal catchment carbon budget. Journal of
Hydrology, 334, 141–150.
Kling GW, Kipphut GW, Miller MC (1991) Arctic lakes and streams as gas conduits to
the atmosphere – implications for tundra carbon budgets. Science, 251, 298–301.
Kurz WA, Apps MJ (2006) Developing Canada’s National Forest Carbon Monitoring,
Accounting and Reporting System to meet the reporting requirements of the Kyoto
Protocol. Mitigation and Adaptation Strategies for Global Change, 11, 33–43.
Lehman JT (1975) Reconstructing rate of accumulation of lake sediment – effect of
sediment focusing. Quaternary Research, 5, 541–550.
Li Z, Kurz WA, Apps MJ, Beukema SJ (2003) Belowground biomass dynamics in the
carbon budget model of the Canadian forest sector: recent improvements and
implications for the estimation of NPP and NEP. Canadian Journal of Forest Research-
Revue Canadienne De Recherche Forestiere, 33, 126–136.
Likens GE, (ed) (1985) An Ecosystem Approach to Aquatic Ecology: Mirror Lake and its
Environment. Springer-Verlag, New York.
Lottig NR (2009) Regional aquatic biogeochemistry of the Northern Highlands Lake District.
PhD dissertation, University of Wisconsin-Madison, Madison, WI.
Lovett GM, Jones CG, Turner MG, Weathers KC, (eds) (2005) Ecosystem Function in
Heterogeneous Landscapes. Springer-Verlag, New York.
Magnuson JJ, Kratz TK, Benson BJ, (eds) (2006) Long-Term Dynamics of Lakes in the
Landscape: Long-Term Ecological Research on North Temperate Lakes. Oxford University
Press, New York.
Martin L (1965) The Physical Geography of Wisconsin. University of Wisconsin Press,
Madison, WI, USA.
Molot LA, Dillon PJ (1996) Storage of terrestrial carbon in boreal lake sediments and
evasion to the atmosphere. Global Biogeochemical Cycles, 10, 483–492.
Moore TR, Bubier JL, Frolking SE, Lafleur PM, Roulet NT (2002) Plant biomass and
production and CO2 exchange in an ombrotrophic bog. Journal Of Ecology, 90, 25–36.
Moore TR, Roulet NT (1993) Methane flux – water-table relations in Northern
Wetlands. Geophysical Research Letters, 20, 587–590.
Moore TR, Roulet NT, Waddington JM (1998) Uncertainty in predicting the effect of
climatic change on the carbon cycling of Canadian peatlands. Climatic Change, 40,
229–245.
Mulholland PJ (2003) Large-scale patterns in dissolved organic carbon concentration,
flux, and sources. In: Aquatic Ecosystems: Interactivity of dissolved organic matter (eds
Findlay S, Sinsabaugh R), pp. 139–159. Elsevier Science, Amsterdam.
Mulholland PJ, Elwood JW (1982) The role of lake and reservoir sediments as sinks in
the perturbed global carbon cycle. Tellus, 34, 490–499.
Nilsson M, Sagerfors J, Buffam I et al. (2008) Contemporary carbon accumulation in a
boreal oligotrophic minerogenic mire – a significant sink after accounting for all C-
fluxes. Global Change Biology, 14, 2317–2332.
NRCS (2008) Soil survey of counties in Wisconsin and Michigan: WI041, WI051, WI085,
WI099, WI125, MI053, MI071. Available at http://soildatamart.nrcs.usda.gov/
Survey.aspx?State=WI (accessed May 16, 2008).
Pace ML, Cole JJ, Carpenter SR et al. (2004) Whole-lake carbon-13 additions reveal
terrestrial support of aquatic food webs. Nature, 427, 240–243.
Preston ND, Carpenter SR, Cole JJ, Pace ML (2008) Airborne carbon deposition on a
remote forested lake. Aquatic Sciences – Research Across Boundaries, 70, 213–224.
R Foundation for Statistical Computing (2008). R Foundation for Statistical Comput-
ing, Vienna, Austria. ISBN 3-900051-07-0. Available at http://www.R-project.org.
Raymond PA, Cole JJ (2001) Gas exchange in rivers and estuaries: choosing a gas
transfer velocity. Estuaries, 24, 312–317.
Rhemtulla JM (2007) Land-use legacies in Wisconsin: Regional vegetation change and carbon
dynamics (mid-1800s to 1930s to present). PhD, University of Wisconsin, Madison, WI.
Richey JE, Melack JM, Aufdenkampe AK, Ballester VM, Hess LL (2002) Outgassing
from Amazonian rivers and wetlands as a large tropical source of atmospheric CO2.
Nature, 416, 617–620.
Robinson DT, Brown DG, Currie WS (2009) Modelling carbon storage in highly
fragmented and human-dominated landscapes: linking land-cover patterns and
ecosystem models. Ecological Modelling, 220, 1325–1338.
Roulet NT, Lafleur PM, Richard PJH, Moore TR, Humphreys ER, Bubier J (2007)
Contemporary carbon balance and late Holocene carbon accumulation in a north-
ern peatland. Global Change Biology, 13, 397–411.
Schindler DW, Smol JP (2006) Cumulative effects of climate warming and other human
activities on freshwaters of Arctic and subarctic North America. Ambio, 35, 160–168.
Shafer MM, Overdier JT, Hurley JP, Armstrong D, Webb D (1997) The influence of
dissolved organic carbon, suspended particulates, and hydrology on the concen-
tration, partitioning and variability of trace metals in two contrasting Wisconsin
watersheds (USA). Chemical Geology, 136, 71–97.
Shafer MM, Overdier JT, Phillips H, Webb D, Sullivan JR, Armstrong DE (1999) Trace
metal levels and partitioning in Wisconsin rivers. Water Air And Soil Pollution, 110,
273–311.
1210 I . B U F FA M et al.
r 2010 Blackwell Publishing Ltd, Global Change Biology, 17, 1193–1211
Smith JE, Heath LS, Skog KE, Birdsey RA (2006) Methods for calculating forest ecosystem
and harvested carbon with standard estimates for forest types of the United States. General
Technical Report NE-343, USDA-Forest Service, Northeastern Research Station,
Newtown Square, PA, 222 pp.
Sobek S, Soderback B, Karlsson S, Andersson E, Brunberg AK (2006) A carbon budget
of a small humic lake: an example of the importance of lakes for organic matter
cycling in boreal catchments. Ambio, 35, 469–475.
Sobek S, Tranvik LJ, Prairie YT, Kortelainen P, Cole JJ (2007) Patterns and regulation of
dissolved organic carbon: an analysis of 7,500 widely distributed lakes. Limnology
And Oceanography, 52, 1208–1219.
St Louis VL, Kelly CA, Duchemin E, Rudd JWM, Rosenberg DM (2000) Reservoir
surfaces as sources of greenhouse gases to the atmosphere: a global estimate.
Bioscience, 50, 766–775.
Strayer DL, Ewing HA, Bigelow S (2003) What kind of spatial and temporal details are
required in models of heterogeneous systems? Oikos, 102, 654–662.
Sulman BN, Desai AR, Cook BD, Saliendra N, Mackay DS (2009) Contrasting carbon
dioxide fluxes between a drying shrub wetland in Northern Wisconsin, USA, and
nearby forests. Biogeosciences, 6, 1115–1126.
Teodoru CR, Del Giorgio PA, Prairie YT, Camire M (2009) Patterns in pCO(2) in boreal
streams and rivers of northern Quebec, Canada. Global Biogeochemical Cycles, 23,
GB2012, doi: 10.1029/2008GB003404.
Tranvik LJ, Downing JA, Cotner JB et al. (2009) Lakes and reservoirs as regulators of
carbon cycling and climate. Limnology And Oceanography, 54, 2298–2314.
Turner DP, Koerper GJ, Harmon ME, Lee JJ (1995) A carbon budget for forests of the
conterminous United States. Ecological Applications, 5, 421–436.
Urban NR, Auer MT, Green SA, Lu X, Apul DS, Powell KD, Bub L (2005) Carbon
cycling in Lake Superior. Journal of Geophysical Research-Oceans, 110, C06S90, doi:
10.1029/2003JC002230.
Wallin M, Buffam I, Oquist M, Laudon H, Bishop K (2010) Temporal and spatial
variability of dissolved inorganic carbon in a boreal stream network: concentrations
and downstream fluxes. Journal of Geophysical Research-Biogeosciences, 115, doi:
10.1029/2009JG001100.
Weishampel P, Kolka R, King JY (2009) Carbon pools and productivity in a 1-km2
heterogeneous forest and peatland mosaic in Minnesota, USA. Forest Ecology And
Management, 257, 747–754.
White MK, Gower ST, Ahl DE (2005) Life cycle inventories of roundwood production
in northern Wisconsin: inputs into an industrial forest carbon budget. Forest Ecology
And Management, 219, 13–28.
Supporting Information
Additional Supporting Information may be found in the
online version of this article:
Section S1. Forest and wetland surface-atmosphere fluxes:
Detailed Methods.
Section S2. Modeling approach for upscaling lake C fluxes
and pools to a group of 168 survey lakes.
Section S3. Starting point for lake C pools and fluxes:
Detailed Methods.
Please note: Wiley-Blackwell are not responsible for the
content or functionality of any supporting materials supplied
by the authors. Any queries (other than missing material)
should be directed to the corresponding author for the article.
C A R B O N B U D G E T I N L A K E - R I C H R E G I O N 1211
r 2010 Blackwell Publishing Ltd, Global Change Biology, 17, 1193–1211