
Integrated Analysis of Dysregulated miRNA-gene Expression in HMGA2-silenced Retinoblastoma Cells
15
Open Access: Full open access to this and thousands of other papers at http://www.la-press.com. Bioinformatics and Biology Insights Introduction Computational tools are widely used to complement biological investigations, especially in global gene expression analysis and high throughput assays. Advanced computational analyses such as integrated analyses of mRNA and miRNA expression, provide information on several regulatory networks in cancers, 1 includ- ing retinoblastoma (RB), a peadiatric ocular tumor. e identi- fication of these molecular networks could implicate potential genes and miRNAs that may behave as biomarkers. It will also help better understand RB biology and clinical management. RB is a childhood cancer that arises from the primitive retinal layer. e current management is enucleation (removal of eye in childhood), chemotherapy and/or focal therapy. Tar- geted therapy is gaining importance in the management of RB. 2–4 Gene expression profiling of RB tumors has helped to characterize cell signalling and the molecular pathways involved in its pathogenesis. 5–7 Earlier reports on relative miRNA pro- filing between normal and RB tumor tissues, and global gene dys-regulation studies (HMGA2, Tiam 1, EpCAM) have indi- cated several aberrant miRNAs and their regulatory genes. 8–15 Integrated Analysis of Dysregulated miRNA-gene Expression in HMGA2- silenced Retinoblastoma Cells Nalini Venkatesan 1,2 , P. R. Deepa 3 , Madavan Vasudevan 4 , Vikas Khetan 5 , Ashwin M. Reddy 6 and Subramanian Krishnakumar 1 1 Larsen and Toubro Department of Ocular Pathology, Vision Research Foundation, Sankara Nethralaya, Chennai, India. 2 Birla Institute of Technology and Science (BITS), Pilani, Rajasthan, India. 3 Department of Biological Sciences, Birla Institute of Technology and Science (BITS) – Pilani, Rajasthan, India. 4 Bionivid Technology [P] Ltd, Kasturi Nagar, Bangalore, India. 5 Sri Bhagawan Mahavir Department of Vitreoretinal and Ocular Oncology, Medical Research Foundation, Sankara Nethralaya, Chennai, India. 6 Department of Ophthalmology, Barts Health NHS Trust, London, UK. ABSTRACT: Retinoblastoma (RB) is a primary childhood eye cancer. HMGA2 shows promise as a molecule for targeted therapy. e involvement of miRNAs in genome-level molecular dys-regulation in HMGA2-silenced RB cells is poorly understood. rough miRNA expression microarray profiling, and an integrated array analysis of the HMGA2-silenced RB cells, the dysregulated miRNAs and the miRNA-target relationships were modelled. Loop network analysis revealed a regulatory association between the transcription factor (SOX5) and the deregulated miRNAs (miR-29a, miR-9*, miR-9-3). Silencing of HMGA2 deregulated the vital oncomirs (miR-7, miR-331, miR-26a, miR-221, miR-17∼92 and miR-106b∼ 25) in RB cells. From this list, the role of the miR-106b∼ 25 cluster was examined further for its expression in primary RB tumor tissues (n = 20). e regulatory targets of miR-106b∼ 25 cluster namely p21 (cyclin-dependent kinase inhibitor) and BIM (pro-apoptotic gene) were elevated, and apoptotic cell death was observed, in RB tumor cells treated with the specific antagomirs of the miR-106b∼ 25 cluster. us, suppression of miR-106b∼ 25 cluster controls RB tumor growth. Taken together, HMGA2 mediated anti-tumor effect present in RB is, in part, mediated through the miR-106b∼ 25 cluster. KEYWORDS: Retinoblastoma, High mobility group proteins (HMG)A2, miR-106b-25 cluster, Integrated mRNA-miRNA analysis, Antagomirs RECEIVED: May 20, 2014. RESUBMITTED: July 20, 2014. ACCEPTED FOR PUBLICATION: July 21, 2014. ACADEMIC EDITOR: JT Efird, Associate Editor TYPE: Original Research FUNDING: We thank Childhood Eye Cancer Trust (CHECT) London, UK, and the Department of Biotechnology (DBT), New Delhi (BT/01/CEIB/11/V/16, Programme support for retino- blastoma research) for the research grants to support this study. The authors confirm that the funders had no influence over the study design, content of the article, or selection of this journal. COMPETING INTERESTS: Authors disclose no potential conflicts of interest. COPYRIGHT: © the authors, publisher and licensee Libertas Academica Limited. This is an open-access article distributed under the terms of the Creative Commons CC-BY-NC 3.0 License. CORRESPONDENCE: [email protected] This paper was subject to independent, expert peer review by a minimum of two blind peer reviewers. All editorial decisions were made by the independent academic editor. All authors have provided signed confirmation of their compliance with ethical and legal obligations including (but not limited to) use of any copyrighted material, compliance with ICMJE authorship and competing interests disclosure guidelines and, where applicable, compliance with legal and ethical guidelines on human and animal research participants. CITATION: Venkatesan et al. Integrated Analysis of Dysregulated miRNA-gene Expression in HMGA2-silenced Retinoblastoma Cells. Bioinformatics and Biology Insights 2014:8 177–191 doi: 10.4137/BBI.S16958. BIOINFORMATICS AND BIOLOGY INSIGHTS 2014:8 177
-
Upload
visionresearchfoundation -
Category
Documents
-
view
0 -
download
0
Transcript of Integrated Analysis of Dysregulated miRNA-gene Expression in HMGA2-silenced Retinoblastoma Cells
Open Access: Full open access to this and thousands of other papers at http://www.la-press.com.
Bioinformatics and Biology Insights
IntroductionComputational tools are widely used to complement biological investigations, especially in global gene expression analysis and high throughput assays. Advanced computational analyses such as integrated analyses of mRNA and miRNA expression, provide information on several regulatory networks in cancers,1 includ-ing retinoblastoma (RB), a peadiatric ocular tumor. The identi-fication of these molecular networks could implicate potential genes and miRNAs that may behave as biomarkers. It will also help better understand RB biology and clinical management.
RB is a childhood cancer that arises from the primitive retinal layer. The current management is enucleation (removal of eye in childhood), chemotherapy and/or focal therapy. Tar-geted therapy is gaining importance in the management of RB.2–4 Gene expression profiling of RB tumors has helped to characterize cell signalling and the molecular pathways involved in its pathogenesis.5–7 Earlier reports on relative miRNA pro-filing between normal and RB tumor tissues, and global gene dys-regulation studies (HMGA2, Tiam 1, EpCAM) have indi-cated several aberrant miRNAs and their regulatory genes.8–15
Integrated Analysis of Dysregulated miRNA-gene Expression in HMGA2-silenced Retinoblastoma Cells
nalini Venkatesan1,2, P. r. deepa3, madavan Vasudevan4, Vikas Khetan5, ashwin m. reddy6 and subramanian Krishnakumar1
1Larsen and Toubro Department of Ocular Pathology, Vision Research Foundation, Sankara Nethralaya, Chennai, India. 2Birla Institute of Technology and Science (BITS), Pilani, Rajasthan, India. 3Department of Biological Sciences, Birla Institute of Technology and Science (BITS) – Pilani, Rajasthan, India. 4Bionivid Technology [P] Ltd, Kasturi Nagar, Bangalore, India. 5Sri Bhagawan Mahavir Department of Vitreoretinal and Ocular Oncology, Medical Research Foundation, Sankara Nethralaya, Chennai, India. 6Department of Ophthalmology, Barts Health NHS Trust, London, UK.
AbstrAct: Retinoblastoma (RB) is a primary childhood eye cancer. HMGA2 shows promise as a molecule for targeted therapy. The involvement of miRNAs in genome-level molecular dys-regulation in HMGA2-silenced RB cells is poorly understood. Through miRNA expression microarray profiling, and an integrated array analysis of the HMGA2-silenced RB cells, the dysregulated miRNAs and the miRNA-target relationships were modelled. Loop network analysis revealed a regulatory association between the transcription factor (SOX5) and the deregulated miRNAs (miR-29a, miR-9*, miR-9-3). Silencing of HMGA2 deregulated the vital oncomirs (miR-7, miR-331, miR-26a, miR-221, miR-17∼92 and miR-106b∼25) in RB cells. From this list, the role of the miR-106b∼25 cluster was examined further for its expression in primary RB tumor tissues (n = 20). The regulatory targets of miR-106b∼25 cluster namely p21 (cyclin-dependent kinase inhibitor) and BIM (pro-apoptotic gene) were elevated, and apoptotic cell death was observed, in RB tumor cells treated with the specific antagomirs of the miR-106b∼25 cluster. Thus, suppression of miR-106b∼25 cluster controls RB tumor growth. Taken together, HMGA2 mediated anti-tumor effect present in RB is, in part, mediated through the miR-106b∼25 cluster.
Keywords: Retinoblastoma, High mobility group proteins (HMG)A2, miR-106b-25 cluster, Integrated mRNA-miRNA analysis, Antagomirs
RECEIvED: may 20, 2014. RESubmIttED: July 20, 2014. ACCEptED foR publICAtIoN: July 21, 2014.
ACADEmIC EDItoR: JT Efird, Associate Editor
tYpE: original research
fuNDINg: We thank childhood Eye cancer trust (chEct) london, UK, and the department of Biotechnology (dBt), new delhi (Bt/01/cEiB/11/V/16, Programme support for retino-blastoma research) for the research grants to support this study. The authors confirm that the funders had no influence over the study design, content of the article, or selection of this journal.
CompEtINg INtEREStS: Authors disclose no potential conflicts of interest.
CopYRIght: © the authors, publisher and licensee libertas academica limited. this is an open-access article distributed under the terms of the creative commons cc-By-nc 3.0 license.
CoRRESpoNDENCE: [email protected]
this paper was subject to independent, expert peer review by a minimum of two blind peer reviewers. all editorial decisions were made by the independent academic editor. all authors have provided signed confirmation of their compliance with ethical and legal obligations including (but not limited to) use of any copyrighted material, compliance with ICMJE authorship and competing interests disclosure guidelines and, where applicable, compliance with legal and ethical guidelines on human and animal research participants.
CItAtIoN: Venkatesan et al. integrated analysis of dysregulated mirna-gene Expression in HMGA2-silenced retinoblastoma cells. Bioinformatics and Biology Insights 2014:8 177–191 doi: 10.4137/BBi.s16958.
Bioinformatics and Biology insights 2014:8 177

Venkatesan et al
We had earlier reported that silencing of HMGA2 reduced cell proliferation in cultured RB cells.12 HMGA2, a non-histone chromosomal protein, is highly expressed during embryogenesis and in various malignant tumors including RB.16,17 This protein contains structural DNA binding AT-rich domains, and at the C-terminus these domains undergo conformational change due to their inter-action with the B form of DNA. This conformational change plays a crucial role in the transcriptional regulation of other proteins which are also involved in the epithelial mesen-chymal transition (EMT) pathways.18 Over-expression of HMGA2 protein is seen in several malignancies and may be due to the suppression of miRNAs, namely miR-15, miR-16, miR-19619,20 and let-7.21 In a study on pituitary tumors, E2F1 activation through displacement of HDAC1 by HMGA2 resulted in pRB inactivation.22
Reports from, in vivo and in vitro studies have dem-onstrated a reduction in cell proliferation in various cancers including RB by blocking the HMGA2 protein synthesis using antisense methodology.22,23 Our previous study,12 implicated changes of several abnormal gene networks including mitogen-activated protein kinase (MAP) kinase, JAK/STAT, Ras pathway, Ras induced ERK1/2 and tumor protein 53 (p53) dependent pathways in HMGA2 silenced RB cells.
In the present study, using computational and experi-mental tools, the role of dys-regulated miRNAs in HMGA2-silenced retinoblastoma (RB) cells was investigated. Their association with the gene targets have been analysed using integrated array analysis. The specific role of miR-106b-25 cluster in RB has also been examined.
Materials and MethodsPrimary rb tumor samples. Fresh frozen tumor
samples were collected from 20 enucleated eyeballs of RB patients reported at Larsen and Toubro Department of Ocular Pathology, Medical Research Foundation, Sankara Nethralaya as part of RB management (2010–2011) and uti-lised for research purpose. The Institutional Ethics Com-mittee of Vision Research Foundation, Sankara Nethralaya (Chennai, India) has reviewed and approved the study (Insti-tutional ethics clearance number: 2009–146p). Fresh adult retinae were collected from 3 cadaveric eyeballs (received at C.U Shah eye bank, Medical Research Foundation Sankara Nethralaya, http://www.sankaranethralaya.org/eye-bank.html). The collected tumor samples and the normal retinae were snap frozen in liquid nitrogen and stored at -80 °C until further use.
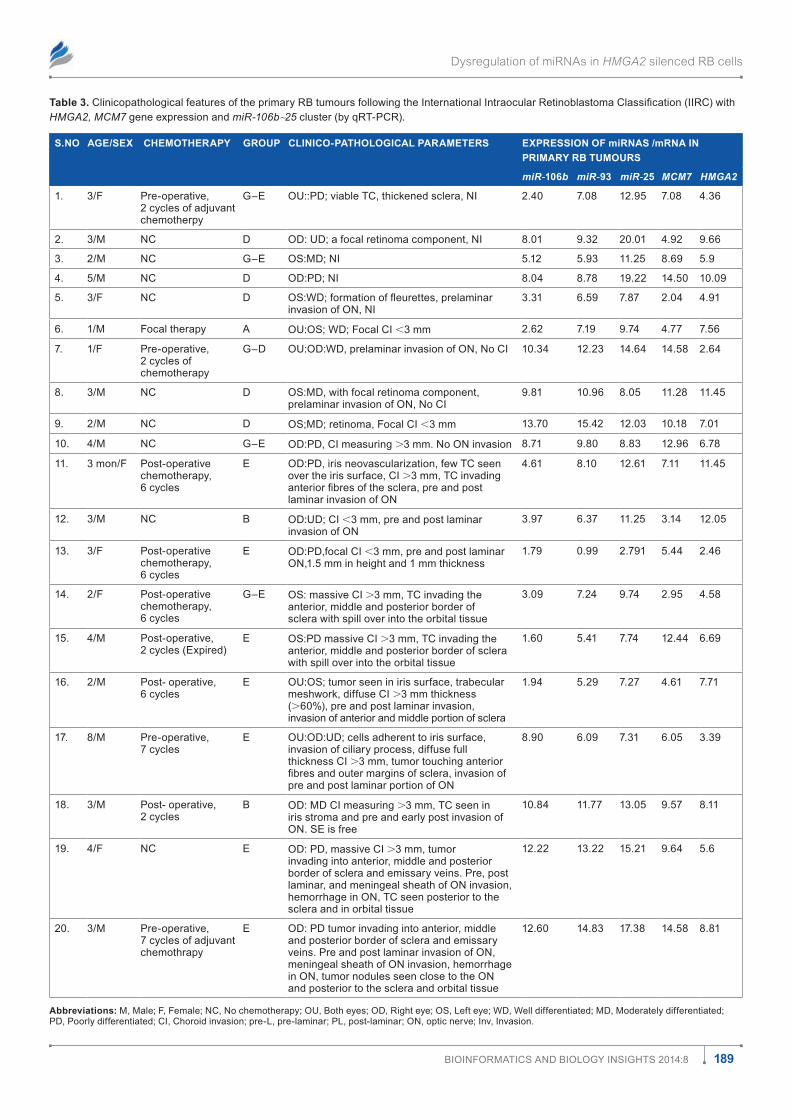
The haematoxylin and eosin stained RB sections were reviewed microscopically and graded by an ocular pathologist (S.K). The clinico-pathological features tabulated in Table 3 are based on the tumor invasion of the choroid, optic nerve or orbit. These RB tumors were recorded as per the report by Sastre X et al.24
cell culture. Human RB cell lines (Y79, Weri Rb1, Riken cell bank, Japan) were used as in vitro model to study the significance of the HMGA2, hsa-miR-106b-25 clusters in RB. The RB cell lines were cultured in RPMI 1640 medium (Gibco-BRL, Rockville, MD, USA) supplemented with 10% heat-inactivated FBS (Gibco-BRL, Rockville, MD, USA), 0.1% ciprofloxacin, 2 mM L-glutamine, 1 mM sodium pyru-vate, and 4.5% dextrose (Sigma Aldrich, St. Louis, MD, USA) and grown in suspension at 37 °C in a 5% CO2 incubator.
Transient transfection in RB cells (Y79, weri Rb1). The transfection method of silencing HMGA2 using Human HMGA2 siRNA (Hs_HMGA2_6 catalogue number SI03029929: forward strand: 5′-CGGCCAAGAGGCAGACCUATT-3′ and the reverse strand: 5′-UAGGUCUGCCUCUUGGC-CGTT-3′, Qiagen, Santa Clara, CA, USA) in RB cells (Y79, Weri Rb1) was carried out as reported earlier.12
MicrorNA profiling. The small RNAs were extracted from the HMGA2-silenced RB (Y79) cells using miRVANA kit (Ambion, Foster city, CA, USA) following manufactures protocol. The quantity of RNA was measured by Nano Drop spectrophotometer and the quality of small RNA was assessed using Agilent 2100 bioanalyzer. The extracted total RNA sam-ple was diluted to 50 ng/ul in nuclease free water. About 100 ng of total RNA was dephosphorylated along with appropriate diluted Spike-In control (Agilent Technologies, microRNA Spike-In Kit, Part Number 5190–1934) using Calf Intestinal Alkaline Phosphatase (CIP) master mix (Agilent Technologies, Part Number: 5190–0456) by incubating at 37 oC for 30 min. Following the dephosphorylation, miRNA samples were dena-tured by adding dimethylsulfoxide and heated at 100 °C for 10 min and transferred to ice-cold water bath. The miRNA labeling was performed using miRNA Complete Labeling and Hyb Kit (Agilent Technologies, Part Number: 5190–0456). The Ligation master mix containing Cyanine 3-pCp was added to the denatured miRNA samples and incubated at 16 °C for 2 hours. The Cyanine 3-pCp labeled miRNA samples were dried completely in the vacuum concentrator (Concentra-tor Plus, Eppendorf, Germany) at 45 °C to 55 °C for 2 hours. The dried sample were resuspended in nuclease free water and mixed with Hybridization Mix containing blocking solution and Hi-RPM Hybridization Buffer and incubated at 100 °C for 5 min followed by snap chill immediate cooling on ice for 5 min. The samples were hybridized on the Human_miRNA_version 3.15 × 8 array. The hybridization was carried out at 55 °C for 20 hours. After hybridization, the slides were washed using Gene Expression Wash Buffer1 (Agilent Technologies, Part Number 5188–5325) at room temperature for 5 min and Gene Expression Wash Buffer 2 (Agilent Technologies, Part Number 5188–5326) at 37 °C for 5 min. The slides were then washed with acetonitrile for 30 seconds. The microarray slides were then scanned using Agilent Scanner (Agilent Technolo-gies, Part Number G2565CA).
data analysis of microarray. The miRNA microar-ray profiling of the transiently HMGA2-silenced RB cells
178 Bioinformatics and Biology insights 2014:8
Dysregulation of miRNAs in HMGA2 silenced RB cells
using Human miRNA Microarray (V3), 8 × 15K chip was performed in two replicates to identify a spectrum of dereg-ulated cellular miRNAs. Intra-array normalization was done using 90th percentile and baseline transformation was done to the median of all the samples. Volcano plot based method was used to identify miRNAs that were 2.0 fold dif-ferentially expressed between siRNA-treated and untreated, (P-value # 0.05 was calculated by unpaired Student’s t-test and Benjamini Hocheberg based FDR correction). Unsu-pervised hierarchical clustering of differentially expressed miRNA were done using Pearson uncentered distance matrix and average linkage rule to establish gene clusters that dif-ferentiate the two groups (Fig. 1A shows the scatter plot for the top 100 dysregulated miRNAs). Predicted and validated targets of differentially expressed miRNAs was obtained using Microcosm database (www.ebi.ac.uk/microcosm/). Further, significant biological analysis of the non-redundant list of gene targeted by differentially expressed miRNA was performed using DAVID functional annotation tool. Statis-tically significant Gene Ontology and pathways that were enriched with a corrected P value of #0.05 and an FDR of $2.0 were chosen for regulatory network modelling. Signifi-cantly regulated genes, miRNA along with Gene Ontologies and pathways were provided as input to BridgeIsland Soft-ware (Bionivid Technology Pvt Ltd, Bangalore) to obtain the nodes and edges information. Further, Cytoscape V 2.8.1 was used to model the regulatory network.
transfection of hsa-miR-106b-25 cluster antagomirs in rb cells. Transient transfections of hsa-miR-106b-25 cluster antagomirs (anti-miR-106b, anti-miR-93, anti-miR-25; Thermo scientific, Dharmacon, Lafayette, CO, USA) were carried out in RB cells. The antagomirs for the mature miRNA sequences are: hsa-miR-106b, 5′-UAAAGUGCUGACAGUGCAGAU-3′ (catalogue number: IH-300649–07–0005), hsa-miR-93, 5′-CAAAGUGCUGUUCGUGCAGGUAG-3′ (catalogue number: IH-300512–08–0005), hsa-miR-25, 5′-CAUUGCAC-UUGUCUCGGUCUGA-3′ (catalogue number: IH-300498–07–0005). The scrambled miRNA sequence used in the study is 5′-GCAACGAUGGUCCAACACCUCGGCC-3′ (Thermo scientific, Dharmacon, Lafayette, CO, USA).
Quantitative real time PCR. Total RNA was isolated from HMGA2 mRNA expressing primary RB tumor tissues (n = 20) and RB cells (Y79, Weri Rb1: anti-miR treated and untreated cells, scrambled miRNA treated cells) using TRI-ZOL reagent (Life Technologies, Carlsbad, CA, USA). The extracted total RNA was treated with TURBO DNase to remove the genomic DNA (Ambion, Genetix Biotech Asia Pvt. Ltd., New Delhi, India). A RT-master mix (15 µL) containing 100 ng of total RNA (5 µL), 100 mM dNTPs (0.15 µL), 50 U/µL MultiScribe™ Reverse Transcriptase, (1.00 µL), 20 U/µL RNase Inhibitor (0.19 µL) and nuclease-free water (4.16 µL) was prepared. The prepared reaction vol-ume was incubated in a thermal cycler programmed for the an initial hold for 30 minutes at 16 °C, followed by a second hold
for 30 minutes at 42 °C, followed by a third hold for 5 minutes at 85 °C and a final hold at 4 °C.
The gene expression assays for HMGA2 (Hs00171569_m1), GAPDH (Glyceraldehyde-3-phosphate dehydrogenase; endog-enous control for gene; Hs99999905_m1), hsa-miR-106b-25 family, hsa-miR-106b (Catalogue number RT 442), hsa-miR-93 (catalogue number: RT 1090), hsa-miR-25 (Catalogue number: RT 403) and miRNA assay control RNU6B (Cata-logue number: RT 0011093) were purchased from Applied Biosystems (Lab India, Chennai, India). Normalization of the HMGA2 gene expression was performed with GAPDH, which was determined using pre-developed assay reagents (Applied Biosystems, Bangalore, India). The PCR reaction was performed in 20 µl volume containing 1 µl (100 ng) of the sample cDNA, universal PCR master mix (Taqman, ABI Applied Biosystem, Bangalore, India) and probes for gene/miRNA according to the manufacturer’s instructions. The relative expression of the gene in each sample was analysed in triplicates and the miRNA expression in transfected RB cells was analysed in duplicates. The PCR protocol using Taqman probes was performed as follows: 2 min at 50 °C, 10 min at 95 °C followed by 40 cycles of 15 sec at 95 °C and 1 min at 60 °C. Commercial software (SDS version 1.3, ABI, Bangalore, India) was used to determine relative expression of genes/miRNAs after normalisation with cadaveric retina (non-neoplastic tissue control). The relative expression values for HMGA2 gene expression were normalized to the GAPDH and miRNA (hsa-miR-106b-25) expressions were normalized to the RNU6B. Fold change in relative gene expression are expressed as log2 fold change.
Cell proliferation assay. Five thousand RB cells (Y79 and Weri Rb1) were plated in 96 wells plate at day 0. On day 1, the cells were transfected with 100 µl of serum free RPMI medium containing 50 pmol of antagomirs and 0.5 µl of LipofectamineTM transfection reagent (Invitrogen, Darstadt, Germany). The cells were incubated for 24 hours, 48 hours and 72 hours respectively. At the end of the incubation period, serum free RPMI medium containing 5 mg/ml of 3-(4,5- Dimethylthiazol-2-yl)-2, 5-diphenyltetrazolium bromide (MTT; Sigma Aldrich, St. Louis, MD, USA) was added to the wells, and the cells were incubated at 37 °C for 4 hours. Following incubation, 100 µl of MTT solubilization solution DMSO (Sigma Aldrich, St. Louis, MD, USA) was added, and the cells were incubated at 37 °C for 10 min. Absorbance mea-surements were made using a spectrophotometer (Beckman Coulter India Private Ltd, New Delhi, India) at 562 nm, and the background was subtracted at 562 nm.
Immunoblotting. The protein lysate from antagomirs– treated and untreated RB cells were prepared using RIPA buffer containing 50 mM Tris-HCl (pH 7.6), 5 mM EDTA, 150 mM sodium chloride, 0.1% PMSF and 250 µl of pro-tease inhibitor cocktail (1 mg/ml). A total protein of 50 µg was resolved by using 12% SDS-PAGE followed by elec-trophoretic transfer onto the nitrocellulose membrane at
Bioinformatics and Biology insights 2014:8 179

Venkatesan et al
100V for 1.5 hours. The membranes were incubated with primary antibodies for human BIM (1:1000; catalogue No: H-191, Santa cruz, USA), human p21 (1:1000; catalogue No: SC-6246, Santa Cruz Biotechnology, CA), ß-actin (1:5000; Sigma Aldrich, St. Louis, MD, USA) overnight at 4 °C followed by 2 hours of incubation with appropriate anti-mouse horseradish peroxidase-conjugated secondary antibodies. After three intermittent washes for 30 mins each with TBST containing 0.5% Tween-20, the membranes were subjected to chemiluminescence detection method (Super-signal West Femto Maximum Sensitivity Substrate, Pierce Technologies, Germany). To determine the fold-change in the expressions of BIM and p21 proteins in the individual samples, the intensities of the bands were calculated using Quantity One, version 4.7 software in GS 800 calibrated
Densitometer (Bio Rad, Gurgaon, Haryana, India) followed with normalization with the respective ß-actin expression.
Flow cytometry. Flow cytometric analysis was performed on RB cells following transfection. About 2 × 10⁵ cells were plated in 24 wells plate, transfected with 50 pm of antago-mirs to all the three miRNAs (hsa-miR–106b-25 cluster). Flow cytometric analyses were performed after 48 hours of transfection, using the Annexin V-fluorescein isothiocyanate (FITC) Kit for apoptosis analysis according to the manufac-turer’s protocol (BD Biosciences, Gurgaon, India).
Scratch assay. After transfection of RB cells (1 × 10⁵ cells/ 96 well plate), a single uniform scratch was made once a con-fluent monolayer was attained.25 The wells were then washed with PBS to remove the detached cells. Media was added to the culture immediately before taking the images. The area
figure 1A. The miRNA expression profile in HMGA2 sirna treated y79 cells. Notes: Hierrarchial cluster represents the expression profile of 100 differentially altered miRNAs in post HMGA2 silenced y79 cells compared with untreated rB cells. red line indicates up-regulation, while green line indicates downregulation in fold change relative to untransfected y79 cells. figure 1b. mirna and target gene regulatory network modeling. Notes: the key mirnas that targets differentially expressed genes are presented here (cytoscape v 2.8). circles and squares indicate mirna and genes respectively, red colouer indicates up-regulation and green colour indicates down-regultion, red colour indicates up-regulation while green colour indicates downregulation in fold change relative to untreated y79 cells. the colour lines represent: green line describes the positive regulation between mirna (down) and target gene (up); red line describes the positive regulation between mirna(up) and target gene (down); pink line describes the positive regulation between mirna(up) and target gene(up) and blue line describes positive regulation between mirna (down) and target gene (down).
180 Bioinformatics and Biology insights 2014:8

Dysregulation of miRNAs in HMGA2 silenced RB cells
of scratch infiltrated by migrating cells at 0 hour, 24 hours and 48 hours of incubation in the experimental groups were calculated using Image J software (Image J, NIH, USA). The difference in area of migration between these time points and their 0 hour area was noted. The average area cov-ered by the treated RB cells relative to untreated RB cells was expressed as percentage of migration at 24 hours and 48 hours of durations.
statistical analysis. ANOVA (Post Hoc, Dunnett t-test) was used to compare the controls and test variables for cell proliferation using SPSS software (version 12.0). Paired stu-dent’s t-test was used to compare the untreated and treated experiment groups for scratch assay. Values expressed for cell proliferation, apoptosis and scratch assay are mean ± SD of at least three experiments. They were considered statistically significant at P # 0.05.
resultsmirNA expression in HMGA2-silenced rb (y79)
cells. The miRNA expression analysis in Y79 cells revealed 188 differentially expressed miRNAs. These differen-tially regulated miRNAs (supplementary file 1) include 86 up-regulated and 102 downregulated miRNAs. The family cluster classification of up-regulated miRNAs using TAM tool26 (http://202.38.126.151/hmdd/tools/tam.html) revealed three main clusters: hsa-miR-let7e clusters (miR-99b, miR125a), hsa-miR-506 cluster (miR-513a, miR-513b, miR-513c), and hsa-miR-1283 cluster. Functionally, the filtered 82
up-regulated miRNAs were found to be involved in the activation of the caspase cascade (miR-150, miR-155), angio-genesis (miR-150) and activation of apoptosis, cell cycle regu-lation (miR-494, miR-150, and miR-155), cell proliferation (miR-150), and tumor suppression (miR-125a, miR-150, and miR-155). From this, it appears that miR-150 and miR-155 expressions are common to the key regulatory cellular func-tions in RB.
The downregulated 102 miRNAs were categorized into 15 families using TAM tool. Table 1 lists the various miRNA clustering in the specific families along with their function. The suppression of hsa-miR-17 cluster, its paralogs, hsa-miR-106a cluster, hsa-miR-106b cluster, hsa-miR-23b family, hsa-miR-130 family following the silencing of HMGA2 oncogene indicates a positive regulation of these miRNAs by HMGA2. The pathway analysis of these dysregulated miRNA’s using TAM tool revealed the down regulation of AKT pathway (P , 0.001). The miRNA involved in this pathway was deter-mined as miR-20a, miR-18a, miR-7, miR-17, miR-19a, miR-331, miR-19b, miR-26a, miR-92a, miR-21 and miR−221. The functional annotations of these deregulated miRNAs are found to be involved in angiogenesis, apoptosis, cell cycle regulation, cell differentiation, cell proliferation, tumor sup-pression and oncomirs. These data have been submitted to the NCBI: GEO data base (GSE51696).
The sequence alignment of the HMGA2 mRNA with the conserved miRNAs described above was carried out using the online tool: microRNA.org-Targets and expression
table 1. the list of mirnas de-regulated in the post- HMGA2 rB cells (y79) revealed in the microarray analysis and their functional annotations.
S.No fuNCtIoNAl ANNotAtIoN of DYSREgulAtED miRNA
DYSREgulAtED miRNAS
up-REgulAtED miRNA DowN-REgulAtED miRNA
1. angiogenesis mir-150 mir-15a, mir-let7b, mir-18a, mir-let7f, mir-21, mir-126, mir-16, mir-19a, mir-19b, mir-378, mir-27b, mir-130a, mir-20a, mir-92a, mir-17, mir-221
2. apoptosis mir-494, mir-150, mir-155 mir-15a, mir-15b, mir-21, mir-148a, mir-221, mir-7g, mir-19a, mir-19b, mir-182, mir-27a, mir-34b, mir-34c, mir-29b, mir-29a, mir-20a, mir-17, mir-16, mir-92a, mir-96, mir-18a, mir-7, mir-26a, mir-195
3. cell cycle mir-494, mir-150, mir-155 mir-15a, mir-24, mir-15b, mir-21, mir-19a, mir-140, mir-107, mir-221, mir-let-7b, mir-7a, mir-124, mir-7g, mir-331, mir-19b, mir-182, mir-27a, mir-27b, mir-34b, mir-185, mir-29b, mir-20a, mir-17, mir-16, mir-34c, mir-92a, mir-424, mir-96, mir-18a, mir-9, mir-195
4. cell differentiation – mir-15a, mir-424, mir-16
5. cell proliferation mir-150 mir-15a, mir-24, mir-15b, mir-124, mir-21, mir-let7d, mir-16, mir-9, mir-27b, mir-130a, mir-34b, mir-34c, mir-140, mir-29b, mir-221
6. tumour suppressors mir-125a mir-15a , mir-let7b, mir-7a, mir-7f, mir-7 g, mir-7d, mir-16, mir-7i, mir-7e, mir-26b, mir-26a, mir-101, mir-34b, -c, mir-195, mir-124, mir-125a, mir-126, mir-29a
7. oncomirs mir-150, mir-155 mir-24, mir-20a, mir-20b, mir-21, mir-17, mir-106b, mir-19a, mir-19b, mir-107, mir-27a, mir-18a, mir-92a, mir-93, mir-18b, mir-221
8. akt pathway – mir-20a, mir-18a, mir-7, mir-17, mir-19a, mir-331, mir-19b, mir-26a, mir-92a, mir-21 and mir-221
Bioinformatics and Biology insights 2014:8 181
Venkatesan et al
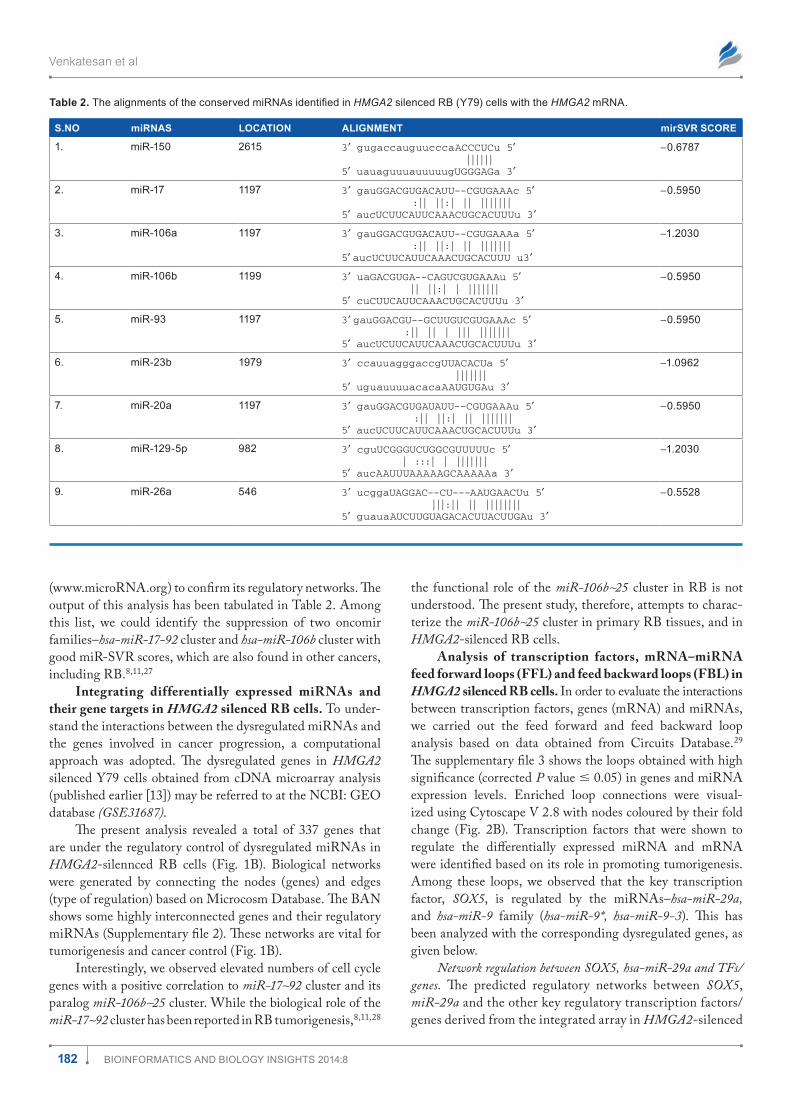
(www.microRNA.org) to confirm its regulatory networks. The output of this analysis has been tabulated in Table 2. Among this list, we could identify the suppression of two oncomir families–hsa-miR-17-92 cluster and hsa-miR-106b cluster with good miR-SVR scores, which are also found in other cancers, including RB.8,11,27
Integrating differentially expressed mirNAs and their gene targets in HMGA2 silenced rb cells. To under-stand the interactions between the dysregulated miRNAs and the genes involved in cancer progression, a computational approach was adopted. The dysregulated genes in HMGA2 silenced Y79 cells obtained from cDNA microarray analysis (published earlier [13]) may be referred to at the NCBI: GEO database (GSE31687).
The present analysis revealed a total of 337 genes that are under the regulatory control of dysregulated miRNAs in HMGA2-silennced RB cells (Fig. 1B). Biological networks were generated by connecting the nodes (genes) and edges (type of regulation) based on Microcosm Database. The BAN shows some highly interconnected genes and their regulatory miRNAs (Supplementary file 2). These networks are vital for tumorigenesis and cancer control (Fig. 1B).
Interestingly, we observed elevated numbers of cell cycle genes with a positive correlation to miR-17∼92 cluster and its paralog miR-106b∼25 cluster. While the biological role of the miR-17∼92 cluster has been reported in RB tumorigenesis,8,11,28
the functional role of the miR-106b∼25 cluster in RB is not understood. The present study, therefore, attempts to charac-terize the miR-106b∼25 cluster in primary RB tissues, and in HMGA2-silenced RB cells.
Analysis of transcription factors, mrNA–mirNA feed forward loops (FFL) and feed backward loops (FbL) in HMGA2 silenced rb cells. In order to evaluate the interactions between transcription factors, genes (mRNA) and miRNAs, we carried out the feed forward and feed backward loop analysis based on data obtained from Circuits Database.29 The supplementary file 3 shows the loops obtained with high significance (corrected P value # 0.05) in genes and miRNA expression levels. Enriched loop connections were visual-ized using Cytoscape V 2.8 with nodes coloured by their fold change (Fig. 2B). Transcription factors that were shown to regulate the differentially expressed miRNA and mRNA were identified based on its role in promoting tumorigenesis. Among these loops, we observed that the key transcription factor, SOX5, is regulated by the miRNAs–hsa-miR-29a, and hsa-miR-9 family (hsa-miR-9*, hsa-miR-9-3). This has been analyzed with the corresponding dysregulated genes, as given below.
Network regulation between SOX5, hsa-miR-29a and TFs/ genes. The predicted regulatory networks between SOX5, miR-29a and the other key regulatory transcription factors/genes derived from the integrated array in HMGA2-silenced
table 2. The alignments of the conserved miRNAs identified in HMGA2 silenced rB (y79) cells with the HMGA2 mrna.
S.No miRNAS loCAtIoN AlIgNmENt mirSvR SCoRE
1. mir-150 2615 3′ gugaccauguucccaACCCUCu 5′||||||
5′ uauaguuuauuuuugUGGGAGa 3′
-0.6787
2. mir-17 1197 3′ gauGGACGUGACAUU--CGUGAAAc 5′:|| ||:| || |||||||
5′ aucUCUUCAUUCAAACUGCACUUUu 3′
-0.5950
3. mir-106a 1197 3′ gauGGACGUGACAUU--CGUGAAAa 5′:|| ||:| || |||||||
5′ aucUCUUCAUUCAAACUGCACUUU u3′
-1.2030
4. mir-106b 1199 3′ uaGACGUGA--CAGUCGUGAAAu 5′|| ||:| | |||||||
5′ cuCUUCAUUCAAACUGCACUUUu 3′
-0.5950
5. mir-93 1197 3′ gauGGACGU--GCUUGUCGUGAAAc 5′:|| || | ||| |||||||
5′ aucUCUUCAUUCAAACUGCACUUUu 3′
-0.5950
6. mir-23b 1979 3′ ccauuagggaccgUUACACUa 5′|||||||
5′ uguauuuuacacaAAUGUGAu 3′
-1.0962
7. mir-20a 1197 3′ gauGGACGUGAUAUU--CGUGAAAu 5′:|| ||:| || |||||||
5′ aucUCUUCAUUCAAACUGCACUUUu 3′
-0.5950
8. mir-129-5p 982 3′ cguUCGGGUCUGGCGUUUUUc 5′| :::| | |||||||
5′ aucAAUUUAAAAAGCAAAAAa 3′
-1.2030
9. mir-26a 546 3′ ucggaUAGGAC--CU---AAUGAACUu 5′|||:|| || ||||||||
5′ guauaAUCUUGUAGACACUUACUUGAu 3′
-0.5528
182 Bioinformatics and Biology insights 2014:8

Dysregulation of miRNAs in HMGA2 silenced RB cells
RB cells shows the up-regulation of IRF1 (gene involved in nuclear apoptosis),30 CDX2 (tumor suppressor gene),31 SPARC (apoptosis mediator and chemo-sensitizer),32 NAV3 (navigator gene),33 CREG1 (involved in cellular senes-cence)34 and downregulation of NASP (involved in cell growth arrest).35
Network regulation between SOX5, hsa-miR-9* and RIT1 gene. In this network, the downregulation of RIT1, an onco-gene36 mediated through SOX5 and hsa-miR-9* may be a part of the molecular dys-regulation contributing to the arrest of cell proliferation in the HMGA2-silenced RB cells.
Network regulation between SOX5, hsa-miR-9-3 and TFs (AREB6/ZEB1, CDP, and ANP32B). The present analysis reveals the link between SOX5, hsa-miR-9-3, and the down-regulated genes–AREB6/ZEB1, CDP (transcription factors),37 ANP32B (negative regulator of caspase 3).38 These gene downregulations were observed with the concomitant induc-tion of the pro-apoptotic gene BNIP3L. These results explain in part the contributors to cell growth arrest in HMGA2 silenced RB cells.
The current FFL analysis has predicted the various net-works existing between the SOX5, miRNAs (hsa-miR-29a, hsa-miR-9* and hsa-miR-9-3) and the key regulatory genes (Fig. 2B). These predicted outcomes can be experimentally validated.
experimental validation to understand the role of miR-106b∼25 clusters in rb. The BAN results clearly implicated the dys-regulation of miR-106b∼25 cluster in HMGA2 silenced RB cells. In order to understand the role of miR-106b∼25 in RB tumorigenesis, the following experi-ments were performed: (a) Assessment of miR-106b∼25 cluster expressions in primary RB tissues (discussed in sec-tion 3.4.1), and (b) Implication of miR-106b∼25 in RB can-cer cell proliferation using specific antagomirs (discussed in sections 3.4.2–3.4.5).
The miR-106b∼25 cluster, its direct target MCM7 are over expressed in RB primary tumors. Initially, to under-stand the role of miR-106b∼25 cluster in RB, the expres-sion of this miRNA cluster was determined in RB primary tumors (n = 20), using qRT-PCR. The median fold change of
A
Ba bSilencing HMGA2 mRNA by RNAi
e
f
d
c
IntegratedmRNA-miRNAanalysis
ZWILCHHNRPH2
ENPP1
DCBLD2
NP_776166.1 hsa-miR-9*
SOX-5
SPARC
IRF1
CDX-2
Repression
Activation
AREB6
ANP32B
CDPBNIP3L
miRNA
TF
mRNA
−4 0
Fold change
4
CREG1
NASP
hsa-mir-29a
hsa-mir-9-3
NAV3
RIT1
NP_079178.2
Network analysis (FFL/BL)
Retinoblastoma cells(Y79)
HMGA2silencedRetinoblastoma cells (Y79)
hsa-miR-106b
hsa-miR-93
Down-regulated genes Up-regulated genes
hsa-miR-25 hsa-miR-93 hsa-miR-25Differential expression ofgene targets with thesignificant dysregulatedmiRNAs
hsa-miR-106b
6
90
0
052
24
6811
4
28739
mRNAexpressionprofiling(GSE31687)
miRNAexpressionprofiling(GSE51696)
figure 2A. schematic representation for the overall steps in the determination of de-regulated mirnas in HMGA2 silenced y79 cells: (a) silencing of HMGA2 in the rB cells (y79) using synthetic oligos using rnai method, (b) mRNA transcripts and miRNA expression levels were profiled using microarray, (c) Integration of significantly dysregulated mRNA transcripts with its regulatory miRNA was annotated, (d) hierarchical cluster of the go functions of the up/down regulated genes by the 3 mirnas of miR-106b∼25 cluster; (e) the number of up-regulated and the downregulated genes targeted by the miR-106b∼25 cluster and (f) network analysis (feed forward loop (ffl)/ feed Backward loop(fBl) was annotated. figure 2b. feed forward loop network analysis representing mirna-tf regulatory network. Notes: the network pinpoints the regulations between the transcriptions factors (tfs), mirna and their regulatory gene targets. the circle denotes genes, rhombus denotes transcription factors and triangle denotes mirna. the pink line describes the repression of genes and the green line describes the activation of genes.
Bioinformatics and Biology insights 2014:8 183

Venkatesan et al
miR-106b, miR-93, miR-25 and MCM7 were 6.56, 7.67 and 11.25 and 7.9 respectively. Relative to donor retina control, miR-106b∼25 cluster was over expressed in most of the RB tumor samples: miR-106b: 17/21 (85%), miR-93: 19/21 (95%), miR-25: 21/21 (100%), and MCM7: 21/21 (100%) of positiv-ity (Fig. 3). Among the cluster, miR-106b and miR-93 showed a significant difference (P # 0.05) between the invasive and no invasive RB tumors while no significant difference was observed based on tumor differentiation and status of che-motherapy. This reveals the presence of the oncogene MCM7 and its resident intronic miRNAs (miR-106b-25 clusters) in RB tumors.
Silencing of miR-106b∼25 cluster using antagomirs down-regulates HMGA2 and MCM7 oncogenes. The link between miR-106b∼25 clusters and its gene target (HMGA2) was further established using the short antisense oligos (antago-mirs) against the individual miRNAs of this family. A tran-sient transfection with these antagomirs was induced in the RB cell lines resulting in the downregulation of miR-106b∼25 cluster (fold change in the order miR-106b, miR-93 and miR-25): -6.68, -6.60, -10.26 versus untreated cells and a fold change: -4.96, -4.48, -8.06 versus scrambled miRNA-treated control) in Y79 cells (Fig. 4A). In Weri Rb1 cells, we observed the suppression of miR-106b∼25 family in the order miR-106b, miR-93 and miR-25: -8.27, -6.17, 7.06 compared with untreated cells and fold change of -5.88, -7.77, -6.17 (in the order miR-106b, miR-93 and miR-25) compared with scrambled miRNA-treated control (Fig. 4B). The expression of miR-106b∼25 family in the RB cells treated with the mix-ture of all the 3 antagomirs showed a down regulation of by a fold change in the order miR-106b, miR-93 and miR-25: -1.79, -7.34, -6.51 in Y79 cells and -8.15, -4.50, -6.07 in Weri Rb1 cells, respectively (Fig. 4A and 4B).
After antagomirs transfection (miR-106b, miR-93, miR-25 and mixture) in RB cells, the HMGA2 gene was down-regulated by -2.20, -1.89, -1.74, -2.24 fold change in Y79, and by a fold-change of -1.03, -0.71, -1.6, -0.33 in Weri Rb1 cells respectively (Fig. 5A). The suppression of HMGA2 transcripts confirms the regulation of these oncogenes by miR-106b∼25 clusters. The downregulation of MCM7 to a fold change -3.51, -1.04, -9.48 and -0.06 in log2 fold change was observed in anti–miRs (miR-106b, miR-93,miR-25 and mix-ture) treated Y79 cells and -1.72, -2.55, -1.25, -3.03 log2 fold change in anti–miRs (miR-106b, miR-93, miR-25 and mix-ture) treated Weri Rb1 (Fig. 5B). Further we probed the role of this miRNA family in mediating RB cell proliferation.
Role of the miR-106b∼25 cluster in RB cell proliferation and cell apoptosis. The MTT assay and Annexin V fluorescence binding assay results reflected the effects of the anti-miR-106b∼25 cluster in RB cells. The Figure 6 (A and B) shows decreased cell proliferation compared to the untransfected RB cells at the end of 24 hrs, 48 hrs, and 72 hrs. At the end of 48 hrs, the percentage of viable cells in the antagomirs treated RB cells in comparison with untreated cells in the order of miR-106b, miR-93, miR-25 and mix were (i) Y79 cells: 67.52%, 64.87%, 64.72%, 67.68%; (ii) Weri Rb1: 66.37%, 68.44%, 64.46%, 66.09% respectively. Moreover, the Annexin V flourescence staining and FACS analysis showed an increased level of apoptosis significantly in the RB cells transfected with the anti-miRs compared to the untransfected RB cells (Fig. 6C, 6D, 6E). The average percent-age of early apoptotic cells induced at the end of 48 hrs in the anti–miRs treated RB cells (in the order of untreated control, miR-106b, miR-93, miR-25 and the mix) are (i) Y79 cells: 1.2%, 33.54%, 28.00%, 38.91%, 31.02%; (ii) Weri Rb1: 0.22, 39.86%, 39.82%, 38.417%, 22.09% respectively. These results suggest that these miRNAs promote the cell proliferation and suppresses
−5
miR106b miR93 miR25 MCM7
Retinoblastoma primary tumors
0
RB1RB2
RB3RB4
RB5RB6
RB7RB8
RB9RB10
RB11RB12
RB13RB14
RB15RB16
RB17RB18
RB19RB20
5
Rel
ativ
e m
iRN
As
exp
ress
ion
(lo
g2
rati
o)
10
15
20
figure 3. Expressions of miR-106b∼25 cluster and MCM7 in primary retinoblastoma tumors (n = 20). Notes: the bar graph represents the relative mirna expressions of miR-106b∼25 cluster, MCM7 determined by qrt-Pcr. the median fold change of miR-106b is 6.56; miR-93 is 7.67, miR-25 is 11.25 and MCM7 is 7.9 in rB tumor sample, compared with donor retina.
184 Bioinformatics and Biology insights 2014:8

Dysregulation of miRNAs in HMGA2 silenced RB cells
0miR-106b miR-106b
Experimental groupsA B Experimental groups
miR-93 miR-93miR-25 miR-25
−0.5
−1
−2
−1.5
Rel
ativ
e H
MG
A2
mR
NA
exp
ress
ion
(lo
g2
rati
o)
−2.5
0
−2
−4
−8
−6
Rel
ativ
e M
CM
2 m
RN
Aex
pre
ssio
n (
log
2 ra
tio
)
−10Y79 weri Rb1
−12
Y79 weri Rb1
figure 5. differential expressions of HMGA2 and MCM7 in antagomirs treated rB cells. Notes: relative to scrambled sirna treated rB cells, the fold change in expressions of HMGA2 and MCM7 is presented. The figure A and b represent HMGA2 and MCM7 respectively. the black bar represents y79 while grey bar represents Weri rb1 respectively. the values are expressed as mean fold change (log2 fold change) ± sd of triplicates.
the apoptosis in RB cells (Y79 control: 1.2%, Weri Rb1 control: 0.22%).
Role of the miR-106b∼25 cluster in RB cell growth and cell migration. To further understand the role of the miR-106b∼25 cluster in cell growth and cell invasion, the scratch assay was carried out in the antagomirs-transfected and untransfected RB cells. The average area of scratch invaded by the Y79 cells in the order (untreated, antagomirs treated: miR-106b, miR-93, miR-25) at the end of 24 hrs: 17.91%, 10.6%, 9.4%, 9.79% and 48 hrs 25.25%, 4.5%, 4.18%, 4.81% respectively. The average area of scratch invaded by the Weri Rb1 cells in the order (untreated, antagomirs treated: miR-106b, miR-93, miR-25) at the end of 24 hrs: 34.71%, 19.96%, 15.33%, 14.31% and 48 hrs 36.16%, 19.28%, 11.15%, 9.06% respectively. These experiments showed a marked reduction in migrating cell populations in the antago-mirs transfected RB cells (Fig. 7A and 7B), suggesting that the miR-106b∼25 cluster is involved in RB tumor progression.25
[F3]
0Experimental groups Experimental groupsA B
−2
−4
Rel
ativ
e m
iRN
A e
xpre
ssio
n(l
og
2 ra
tio
)
Rel
ativ
e m
iRN
As
exp
ress
ion
(lo
g2
rati
o)
−8
−10
−12
−6
miR-106b miR-106bmiR-93 miR-93miR-25 miR-25
0
−2
−4
−8
−10
−6
Control Scrambled control Mix
Control Scrambled control Mix
figure 4. differential mirna (miR-106b∼25 cluster) levels in antagomirs–mix treated rB cells. Notes: relative to scrambled sirna treated rB cells, the fold change in expressions of miR-106b∼25 cluster is presented. The figures A and b represent y79 and Weri rb1 respectively. the values are expressed as mean fold change (log2 fold change) ± sd of triplicates.
miR-106b∼25 clusters mediates cell cycle by down- regulating the expression of p21 and BIM in RB. The expres-sion of apoptotic proteins–p21 and BIM (direct targets of miR-106b and miR-2539) was measured in the anti-miR-transfected RB cells by immunoblot analysis (Fig. 8A and 8B). This experiment revealed the increase in p21 and BIM protein levels in the antagomirs transfected RB cells compared to the untransfected RB cells. This indicated the apoptotic mechanisms, in part, regulated through the miR-106b∼25, and its relationship with the oncogene HMGA2.
discussiona. HMGA2 induced miRNA-gene regulatory pathways
in RB:We explored the global miRNA expressions in HMGA2-
silenced RB cells. Through an integrated miRNA-mRNA
Bioinformatics and Biology insights 2014:8 185

Venkatesan et al
expression analysis, we were able to correlate the dys-regulated miRNAs and corresponding mRNAs (genes) that are involved in various cellular processes (Fig. 2A). The study mainly focuses on the dysregulated miRNAs which have been reported to play a vital role in cancer development (Fig. 9) and their roles in HMGA2-silenced RB cancer cells.40–42
The HMGA2 siRNA treatment induced up-regulation of miR-125a, miR-150, miR-155, and miR-494 which may contribute to cell growth arrest in RB tumor cells through alterations in expression of cancer regulatory genes. miR-125a, known as a tumor suppressor, regulates ERBB oncogene (ERBB2 and ERBB3) via ERK1/2 and AKT phosphorylation.
120
100
80C
ell v
iab
ility
(%
)60
40
20
50
40
30
20
Ave
rag
e o
f ea
rly
apo
pto
tic
cells
(in
nu
mb
er)
10
0
0Control miR-106b miR-93 miR-25 Mix
Control miR-106b
miR-93 miR-25 Mix
: Control: Anti-miR-106b treated RB cells: Anti-miR-93 treated RB cells: Anti-miR-25 treated RB cells: Mix of above anti-miRs treated RB cells
A
C
120
80100
Cel
l via
bili
ty (
%)
6040200
0
100 101 102
Annexin103 104
2040
60C
ou
nts
8010
0
Control
* * * * * * * ** *
* *
miR-93
24 hrs 48 hrs 72 hrs
Experimental groups
Experimental groups
Y79 Weri Rb1
miR-25 Mix
B
D
0
100 101 102
Annexin103 104
2040
60C
ou
nts
8010
0
E
* ** * * * * * *
miR-106b
Experimental groups
24 hrs 48 hrs 72 hrs
****
***
**
**
*
*
figure 6. reduction in rB cell proliferation in anti-mirs (miR-106b∼25, mix) treated cells: the anti-mirs treated y79 (A) and Weri rb1 (b) cells was compared for cell viability with the untreated and scrambled treated rB cells as controls. Percentage of cell proliferation was obtained after treating the rB cells with antagomirs at 24 hrs, 48 hrs and 72 hrs of time interval. (C) the graph represents the average number of apoptotic cells in anti-mirs treated rB cells (miR-106b∼25 cluster, mix) performed in triplicate. the dotted line represents y79 cells, and the straight line represents Weri rb1 cells. figure (D) and (E) show a representative graph of annexin V Flour staining using flow cytometry. in RB cells (Y79 and Weri Rb-1). Notes: Asterisks represent the significant difference between the controls and the antagomirs transfected RB cells (*P # 0.05, **P # 0.01).
A Anti-miR-106b Anti-miR-93 Anti-miR-25 Control (UT)
0 hr
24 hrs
48 hrs
B Anti-miR-106b Anti-miR-93 Anti-miR-25 Control (UT)
0 hr
24 hrs
48 hrs
30
25
20
Mig
rati
on
(%
)
15
10
5
0UT miR-106b
Y79 24 hrs Y79 48 hrs
Experimental groupsmiR-93 miR-25
C
30
35
40
45
25
20
Mig
rati
on
(%
)
15
105
0UT miR-106b
Weri Rb1 24 hrs Weri Rb1 48 hrs
Experimental groupsmiR-93 miR-25
D
***
*
*
*
*** **
****
figure 7. Influence of miR-106b∼25 cluster antagomirs on cell migratory behaviour in rB cells: Photomicrographs show the migratory behaviour between the untreated and antagomirs treated y79 (A) and Weri rb1 (b); figure (C) represents the percentage of area migrated by y79 cells at 24 hours (black bar) and 48 hours (grey bar). figure (D) represents the percentage of area migrated by Weri rb 1 cells at 24 hours (black bar) and 48 hours (grey bar). Notes: Asterisks represent the significant difference between the controls and the antagomirs treated RB cells. (*P # 0.05, **P # 0.05).
186 Bioinformatics and Biology insights 2014:8

Dysregulation of miRNAs in HMGA2 silenced RB cells
The suppression of this oncogene, through the over-expression of miR-125a was reported to alter the cancer cell phenotype of SKBR3 cells (ERBB2-dependent human breast cancer cell line).43 miR-125a has also been suggested as a prognostic and therapeutic marker in gastric cancers.44 High expression of
ERBB3, along with the dys-regulation of AKT pathway has also been reported in RB earlier.45 These studies strongly indicate that one of the mechanisms of HMGA2-silencing mediated RB cell death could be through the over expression of miR-125a (and subsequent oncogene modifications).
A 1
p21
BIM
β-actin
2 3 4 5 B 1 2 3 4 5
18KD
23KD
42KD
figure 8. Western blot of p21 and Bim proteins in antagomirs treated cells: the western analysis of p21 and Bim proteins in y79 (A) and Weri rb1 (b) cells are presented here. the intensity of protein (p21 and Bim) bands were normalized with beta-actin expression in rB cells (control and antagomirs treated cells). [lanes 1–5: control rB cells, antagomirs to mir-106b, mir-93 and mir-25, mix respectively].
D
C
A
B
UP-REGULATED miRNAS
Transient inhibition of HMGA2protein transcription
HMGA2 siRNA HMGA2 mRNA
E2F
pRB
HDACpRB
P PExpression of G2/Sphase genes(cyclinA1/E2)
E2F
Transcription ofMCM7
miR-150,miR-155,miR-494,miR-125a miR-331,
miR-21,miR-221,miR-26amiR-15a−16,29a
DOWN-REGULATED miRNASmiR-106b~25 cluster
miR-17~92 cluster
MCM7
RBCELLS
RBCELLS
RBCELLS
INCREASED CELL DEATH/ CELLPROLIFERATION ARREST
p21 BIM
figure 9. schematic representation of the key dysregulated genes and the mirnas in the post-HMGA2 silenced rB cells contributing to apoptosis and cell proliferation arrest. (A) downregulation of the HMGA2 protein resulting in the activation of rb protein resulting in the up-regulation of cyclin a1/E2 (expressed in the g2/s phase of cell cycle). (b) suppression of the miR-106b-25 cluster through downregulation of its host gene, MCM7 via the reduced E2f family proteins. this, in turn results in the up-regulation of the p21 and Bim, which are the direct targets of miR-106b-25 cluster contributing to the rB cell death. (C) downregulation of the key oncomirs and cell cycle regulatory mirnas namely; miR-331, miR-21, miR-221, miR-26a, miR-15a, miR-16, miR-29a. (D) Up-regulation of tumor suppressor mirnas and cell cycle regulatory mirnas namely miR-150, miR-155, miR-494, miR-125a.
Bioinformatics and Biology insights 2014:8 187

Venkatesan et al
miR-150 is reported as a tumor suppressor in lymphoma46 and corticotropinomas.47 Watanabe et al.46 showed that miR-150 directly downregulated the expression of gene targets DKC1 and AKT2 while increasing that of the tumor suppressors, Bim and p53 in lymphoma. This is in line with the present finding of over-expressed miR-150, along with increased level of Bim protein (Fig. 8A and 8B), and our ear-lier finding of elevated p53 proteins12 in HMGA2-silenced RB cells. These findings strongly point to the tumor suppressor mechanisms of miR-150 induced by the silencing of HMGA2 gene in RB.47,46 The up-regulated miR-155 in the current study has been previously reported to reverse EGF-induced epithe-lial-mesenchymal transition (EMT) resulting in inhibition of proliferation, metastasis, invasion, and contributing to increase cisplatin sensitivity in cervical cancer cells.48 miR-494 is reported to induce cellular senescence by suppressing IGF2BP1 in lung cancer cells.49 Thus, the up-regulation of miR-155 (fold change = 7.421) and miR-494 (fold change = 2.421) can be linked to cell growth arrest in post-HMGA2 silenced RB cells.
The HMGA2 siRNA treatment has induced downreg-ulation of major oncomirs such as such as miR-21, miR-9, miR-221 and the 2 major families miR-17∼92 cluster and its paralogs miR-106a∼363 and miR-106b∼25 clusters.
miR-21 is known to be an oncomir with its regulatory target genes involved in tumor invasiveness and microvascular proliferations in cancers such as glioblastoma, breast cancer, pre-cell lymphoma.50–53 The gene targets RECK (a matrix metalloproteinase regulator, fold change: 0.93),54 PTEN (fold change: 0.64), PDCD4, and TM1 are modulated by this miR-21 in breast cancer.52 Thus the observed downregulation of miR-21 (fold change: -1.821) links the anti-proliferative effect of HMGA2-silencing with the suppression of the oncomir miR-21. Another oncomir, miR-9, was down–regulated (fold change:-2.878) along with increased expression of E-cadherin gene in HMGA2 silenced RB cells.55 E-cadherin (CDH1), a gene target of miR-9, is involved in tumor angiogenesis through the activation of ß-catenin that promotes cancer metastasis.55
miR-21 from an earlier report.56 and miR-9 from our current integrated data analysis (Fig. 2B) regulate SOX5, a member of (SRY-related HMG-box) family of transcription factors. The over-expression of SOX5 has resulted in regula-tion of embryonic development and cell fate,57 malignant B cell proliferation58 and reduction of glioma cell proliferation with induction of acute cell senescence.59 The up-regulation of SOX5 (fold change: 1.93), together with downregulation of miR-9 family and miR-21 contributes to HMGA2–silencing, mediated RB cell growth arrest.
In addition, miR-221, which is a suppressor of cell cycle inhibitor proteins p27/Kip1 and p57, and a promoter of RAS-RAF-MEK signalling pathway55,60 was found to be downreg-ulated (fold change: -6.838). This miRNA downregulation may result in the inhibition of cell migration as reported
earlier in MDA MB-231, breast cancer cell line61,62 and thus will contribute to the reduction of RB tumor cell proliferation, invasiveness and motility in post-HMGA2 gene silencing.
We also observed the suppression of two major oncomir clusters namely miR-17∼92 and miR-106b∼25 due to the silencing of HMGA2 in RB. The miRNA family, miR-17∼92 clusters and one of its paralogs miR-106a∼363 cluster reside on c13ORF25 genes of chromosome 13 and chromosome X, respectively. The over expression of these clusters have been reported earlier in various cancers such as leukemias,63 breast cancer64 and AIDS associated non-Hodgkin’s lymphoma.65 miR-17∼92 expression was reported in RB.11
In HMGA2 silenced cells, we observed the suppression of the other paralog miR-106b∼25 and its host gene MCM7. HMGA2 is known to be a positive regulator of MCM7, where one of the reported mediators is the E2F family. The involve-ment of E2F in tumor promotion has been implicated in RB primary tumors.12,66 Further, the HMGA2 silencing also induced suppression of E2F family.12 Thus the silencing of HMGA2 gene induces downregulation of MCM7 (via E2F family) which in turn prevents the biosynthesis of miR-106b∼25 (please see Fig. 9).In addition, the sequence complementarity between 3′UTR of HMGA2 and miR-106b∼25 may also be a direct target for regulation. The miR-106b-25 has been investi-gated in detail and is discussed in the next section.
b. Implication of miR-106b∼25 in RB pathogenesis, valida-tion of its host gene MCM7 and target genes p21, BIMThe miR-106b-25 family includes three miRNAs namely
miR-106b, miR-93 and miR-25. This family is highly con-served in vertebrates and resides in the 13th intron of MCM7 gene on chromosome 7.67,68 The MCM7 is well known for its regulation of the replication fork assembly on chromosomal DNA during G1/S phase transition.69 The suppression of this cluster using inhibitors had resulted in increased apoptosis and G0/G1 cell cycle arrest in oesophageal adenocarcinoma and laryngeal cancer.27,70 Earlier studies have correlated its over expression with poor prognosis in prostrate, endometrial and gastric cancers.71,72 We have observed over-expression of MCM7 in a cohort of 20 primary RB cases (Table 3, Fig. 3). Although miR-106b∼25 cluster, (especially miR-106b) has been reported in RB tumor and serum samples,73 their gene regulation mechanisms are not known.
In the present study, the over-expression of miR-106b∼25 cluster was identified in primary RB tumors (n = 20) relative to donor retina. Secondly, we have used a model of RB cells where the miR-106b∼25 cluster was inhibited by specific antagomirs to study its functional and regulatory mechanisms.
In a study on unrestricted somatic stem cells, the various gene targets of miR-106b such as (i) cyclinD1 (CCND1), (ii) E2F1 (iii) CDKN1A (p21), (iv) PTEN, (v) RB1, (vi) RBL1 (p107), and (vii) RBL2 have been reported indicating enhanced G1/S transitions with increased levels of E2F transcription factors using bioinformatics and experimental validation
188 Bioinformatics and Biology insights 2014:8
Dysregulation of miRNAs in HMGA2 silenced RB cells
table 3. Clinicopathological features of the primary RB tumours following the International Intraocular Retinoblastoma Classification (IIRC) with HMGA2, MCM7 gene expression and miR-106b∼25 cluster (by qrt-Pcr).
S.No AgE/SEx ChEmothERApY gRoup ClINICo-pAthologICAl pARAmEtERS ExpRESSIoN of miRNAS /mRNA IN pRImARY Rb tumouRS
miR-106b miR-93 miR-25 MCM7 HMGA2
1. 3/f Pre-operative, 2 cycles of adjuvant chemotherpy
g–E oU::Pd; viable tc, thickened sclera, ni 2.40 7.08 12.95 7.08 4.36
2. 3/m nc d od: Ud; a focal retinoma component, ni 8.01 9.32 20.01 4.92 9.66
3. 2/m nc g–E os:md; ni 5.12 5.93 11.25 8.69 5.9
4. 5/m nc d od:Pd; ni 8.04 8.78 19.22 14.50 10.09
5. 3/f nc d OS:WD; formation of fleurettes, prelaminar invasion of on, ni
3.31 6.59 7.87 2.04 4.91
6. 1/m focal therapy a oU:os; Wd; focal ci ,3 mm 2.62 7.19 9.74 4.77 7.56
7. 1/f Pre-operative, 2 cycles of chemotherapy
g–d oU:od:Wd, prelaminar invasion of on, no ci 10.34 12.23 14.64 14.58 2.64
8. 3/m nc d os:md, with focal retinoma component, prelaminar invasion of on, no ci
9.81 10.96 8.05 11.28 11.45
9. 2/m nc d os;md; retinoma, focal ci ,3 mm 13.70 15.42 12.03 10.18 7.01
10. 4/m nc g–E od:Pd, ci measuring .3 mm. no on invasion 8.71 9.80 8.83 12.96 6.78
11. 3 mon/f Post-operative chemotherapy, 6 cycles
E od:Pd, iris neovascularization, few tc seen over the iris surface, ci .3 mm, tc invading anterior fibres of the sclera, pre and post laminar invasion of on
4.61 8.10 12.61 7.11 11.45
12. 3/m nc B od:Ud; ci ,3 mm, pre and post laminar invasion of on
3.97 6.37 11.25 3.14 12.05
13. 3/f Post-operative chemotherapy, 6 cycles
E od:Pd,focal ci ,3 mm, pre and post laminar on,1.5 mm in height and 1 mm thickness
1.79 0.99 2.791 5.44 2.46
14. 2/f Post-operative chemotherapy, 6 cycles
g–E os: massive ci .3 mm, tc invading the anterior, middle and posterior border of sclera with spill over into the orbital tissue
3.09 7.24 9.74 2.95 4.58
15. 4/m Post-operative, 2 cycles (Expired)
E os:Pd massive ci .3 mm, tc invading the anterior, middle and posterior border of sclera with spill over into the orbital tissue
1.60 5.41 7.74 12.44 6.69
16. 2/m Post- operative, 6 cycles
E oU:os; tumor seen in iris surface, trabecular meshwork, diffuse ci .3 mm thickness (.60%), pre and post laminar invasion, invasion of anterior and middle portion of sclera
1.94 5.29 7.27 4.61 7.71
17. 8/m Pre-operative, 7 cycles
E oU:od:Ud; cells adherent to iris surface, invasion of ciliary process, diffuse full thickness ci .3 mm, tumor touching anterior fibres and outer margins of sclera, invasion of pre and post laminar portion of on
8.90 6.09 7.31 6.05 3.39
18. 3/m Post- operative, 2 cycles
B od: md ci measuring .3 mm, tc seen in iris stroma and pre and early post invasion of on. sE is free
10.84 11.77 13.05 9.57 8.11
19. 4/f nc E od: Pd, massive ci .3 mm, tumor invading into anterior, middle and posterior border of sclera and emissary veins. Pre, post laminar, and meningeal sheath of on invasion, hemorrhage in on, tc seen posterior to the sclera and in orbital tissue
12.22 13.22 15.21 9.64 5.6
20. 3/m Pre-operative, 7 cycles of adjuvant chemothrapy
E od: Pd tumor invading into anterior, middle and posterior border of sclera and emissary veins. Pre and post laminar invasion of on, meningeal sheath of on invasion, hemorrhage in on, tumor nodules seen close to the on and posterior to the sclera and orbital tissue
12.60 14.83 17.38 14.58 8.81
Abbreviations: m, male; f, female; nc, no chemotherapy; oU, Both eyes; od, right eye; os, left eye; Wd, Well differentiated; md, moderately differentiated; Pd, Poorly differentiated; ci, choroid invasion; pre-l, pre-laminar; Pl, post-laminar; on, optic nerve; inv, invasion.
Bioinformatics and Biology insights 2014:8 189

Venkatesan et al
protocols.74 In addition, this cluster of miRNAs have been known to repress the p21 and BIM which are downstream mediators of the TGF-ß signalling pathway.72
Our results showed the activation of p21 and BIM (Fig. 8A and 8B), along with decreased cell proliferation and invasion, and with concomitant increase in apoptosis in the antagomirs treated RB cells. The observed up-regulation of oncogene, MCM7 in primary RB tumor tissues was comple-mented by the downregulation of MCM7 gene (Fig. 3) in miR-106b∼25 specific antagomirs treated RB cells. These results strongly points to the role of miR-106b∼25 cluster in promoting RB cell proliferation.39
To summarize, the integrated analysis between the deregulated miRNAs and genes due to the reduction or sup-pression of HMGA2 mRNA in the RB cells revealed the downregulation of two main clusters of miRNAs namely miR-106b∼25 and miR-17∼92. These miRNA clusters are known to regulate various key genes such as MCM7, CDKN1A (p21), BIM and EpCAM. These oncomir clusters can be further investigated for their role in RB tumor progression and also during chemotherapeutic interventions.
conclusionsImprovement in RB management may be achieved by under-standing the regulatory gene–miRNA networks involved in RB tumorigenesis and tumor suppression along with their regulatory miRNAs. We have reported the various miRNAs deregulated in the HMGA2-silenced RB cells. The inte-grated mRNA-miRNA network analysis revealed the regu-latory associations between important genes and miRNAs following HMGA2 silencing that result in RB tumor con-trol. Particularly, HMGA2 silencing induced downregula-tion of the miR-106b∼25 cluster. The tumor promoting role of miR-106b∼25 in RB was clearly documented using specific antagomirs. Taking the results together, it is suggested that (a) miR-106b∼25 cluster itself may be a potential biomarker or target in RB management, and (b) downregulation of the miR-106b∼25 cluster is one of the key mechanisms of cell death induced by HMGA2 silencing in RB.
Author contributionsConceived and designed the experiments: SK, NV. Analyzed the data: NV, PRD, MV, SK. Wrote the first draft of the manuscript: NV, PRD, SK. Contributed to the writing of the manuscript: NV, PRD, SK, MV. Agree with manuscript results and conclusions: NV, SK, PRD, MV. Jointly devel-oped the structure and arguments for the paper: SK, NV, PRD, MV. Made critical revisions and approved final ver-sion: SK, NV, PRD, MV, VK, AMR. All authors reviewed and approved of the final manuscript.
supplementary Filessupplementary File 1. The list of up-regulated and
downregulated miRNAs identified in the post-HMGA2
silenced RB cells (Y79).The description of the listed miRNAs includes fold change, miRbase accession number, chromo-some location (start and end), and its orientation.
supplementary File 2. The list of miRNAs and the respective gene targets derived from the integrated analysis of mRNA-miRNA expressions in RB cells (Y79).
supplementary File 3. The list of miRNAs and respec-tive gene targets derived from Feed Forward Loop/Feed Backward Loop analysis. The first work sheet states the net result of FFL/FBL linking the transcription factors, genes and miRNAs de-regulated in the HMGA2 silenced RB (Y79) cells. Second worksheet provides the list of transcription fac-tors, gene targets, miRNAs, FFL/FBL type, fold change in transcription factor, expression of genes in fold change and expression of miRNAs in fold change.
reFereNce 1. Moser JJ, Fritzler MJ. The microRNA and messengerRNA profile of the RNA-
induced silencing complex in human primary astrocyte and astrocytoma cells. PLoS One. 2010;5(10):e13445.
2. Zhang J, Benavente CA, McEvoy J, et al. A novel retinoblastoma therapy from genomic and epigenetic analyses. Nature. January 19, 2012;481(7381):329–34.
3. Hanahan D, Weinberg RA. Hallmarks of cancer: the next generation. Cell. March 4, 2011;144(5):646–74.
4. Sachdeva UM, O’Brien JM. Understanding pRb: toward the necessary devel-opment of targeted treatments for retinoblastoma. J Clin Invest. February 1, 2012;122(2):425–34.
5. Enerly E, Steinfeld I, Kleivi K, et al. miRNA-mRNA integrated analysis reveals roles for miRNAs in primary breast tumors. PLoS One. 2011;6(2):e16915.
6. Nalini V, Segu R, Deepa PR, Khetan V, Vasudevan M, Krishnakumar S. Molecular Insights on Post-chemotherapy Retinoblastoma by Microarray Gene Expression Analysis. Bioinform Biol Insights. 2013;7:289–306.
7. Ganguly A, Shields CL. Differential gene expression profile of retinoblastoma compared to normal retina. Mol Vis. 2010;16:1292–303.
8. Conkrite K, Sundby M, Mukai S, et al. miR-17∼92 cooperates with RB path-way mutations to promote retinoblastoma. Genes Dev. August 15, 2011;25(16): 1734–45.
9. Xu X, Jia R, Zhou Y, et al. Microarray-based analysis: identification of hypoxia-regulated microRNAs in retinoblastoma cells. Int J Oncol. May 2011;38(5):1385–93.
10. Martin J, Bryar P, Mets M, et al. Differentially expressed miRNAs in retinoblas-toma. Gene. January 10, 2013;512(2):294–9.
11. Kandalam MM, Beta M, Maheswari UK, Swaminathan S, Krishnakumar S. Oncogenic microRNA 17–92 cluster is regulated by epithelial cell adhesion molecule and could be a potential therapeutic target in retinoblastoma. Mol Vis. 2012;18:2279–87.
12. Venkatesan N, Krishnakumar S, Deepa PR, Deepa M, Khetan V, Reddy MA. Molecular deregulation induced by silencing of the high mobility group protein A2 gene in retinoblastoma cells. Mol Vis. 2012;18:2420–37.
13. Mitra M, Kandalam M, Sundaram CS, et al. Reversal of stathmin-mediated microtubule destabilization sensitizes retinoblastoma cells to a low dose of anti-microtubule agents: a novel synergistic therapeutic intervention. Invest Ophthal-mol Vis Sci. Jul 2011;52(8):5441–8.
14. Mitra M, Kandalam M, Verma RS, UmaMaheswari K, Krishnakumar S. Genome-wide changes accompanying the knockdown of Ep-CAM in retino-blastoma. Mol Vis. 2010;16:828–42.
15. Subramanian N, Navaneethakrishnan S, Biswas J, Kanwar RK, Kanwar JR, Krishnakumar S. RNAi Mediated Tiam1 Gene Knockdown Inhibits Invasion of Retinoblastoma. PLoS One. 2013;8(8):e70422.
16. Fusco A, Fedele M. Roles of HMGA proteins in cancer. Nat Rev Cancer. Dec 2007;7(12):899–910.
17. Venkatesan N, Kandalam M, Pasricha G, et al. Expression of high mobility group A2 protein in retinoblastoma and its association with clinicopathologic features. J Pediatr Hematol Oncol. Mar 2009;31(3):209–14.
18. Wu J, Liu Z, Shao C, et al. HMGA2 overexpression-induced ovarian surface epithelial transformation is mediated through regulation of EMT genes. Cancer Res. January 15, 2011;71(2):349–59.
19. De Martino I, Visone R, Fedele M, et al. Regulation of microRNA expression by HMGA1 proteins. Oncogene. March 19, 2009;28(11):1432–42.
190 Bioinformatics and Biology insights 2014:8

Dysregulation of miRNAs in HMGA2 silenced RB cells
20. Kaddar T, Rouault JP, Chien WW, et al. Two new miR-16 targets: caprin-1 and HMGA1, proteins implicated in cell proliferation. Biol Cell. Sep 2009;101(9):511–24.
21. Lee YS, Dutta A. The tumor suppressor microRNA let-7 represses the HMGA2 oncogene. Genes Dev. May 1, 2007;21(9):1025–30.
22. Fedele M, Visone R, De Martino I, et al. HMGA2 induces pituitary tumorigen-esis by enhancing E2F1 activity. Cancer Cell. Jun 2006;9(6):459–71.
23. Chau KY, Manfioletti G, Cheung-Chau KW, et al. Derepression of HMGA2 gene expression in retinoblastoma is associated with cell proliferation. Mol Med. May–Aug 2003;9(5–8):154–65.
24. Sastre X, Chantada GL, Doz F, et al. Proceedings of the consensus meetings from the International Retinoblastoma Staging Working Group on the pathology guidelines for the examination of enucleated eyes and evaluation of prognostic risk factors in retinoblastoma. Arch Pathol Lab Med. Aug 2009;133(8):1199–202.
25. Liang CC, Park AY, Guan JL. In vitro scratch assay: a convenient and inexpen-sive method for analysis of cell migration in vitro. Nat Protoc. 2007;2(2):329–33.
26. Lu M, Shi B, Wang J, Cao Q , Cui Q. TAM: a method for enrichment and depletion analysis of a microRNA category in a list of microRNAs. BMC Bioinformatics. 2010;11:419.
27. Cai K, Wang Y, Bao X. MiR-106b promotes cell proliferation via targeting RB in laryngeal carcinoma. J Exp Clin Cancer Res. 2011;30:73.
28. Nittner D, Lambertz I, Clermont F, et al. Synthetic lethality between Rb, p53 and Dicer or miR-17–92 in retinal progenitors suppresses retinoblastoma forma-tion. Nat Cell Biol. Sep 2012;14(9):958–65.
29. Friard O, Re A, Taverna D, De Bortoli M, Cora D. CircuitsDB: a database of mixed microRNA/transcription factor feed-forward regulatory circuits in human and mouse. BMC Bioinformatics. 2010;11:435.
30. Kim PK, Armstrong M, Liu Y, et al. IRF-1 expression induces apoptosis and inhibits tumor growth in mouse mammary cancer cells in vitro and in vivo. Onco-gene. February 5, 2004;23(5):1125–35.
31. Zhang JF, Zhang JG, Kuai XL, et al. Reactivation of the homeotic tumor sup-pressor gene CDX2 by 5-aza-2’-deoxycytidine-induced demethylation inhibits cell proliferation and induces caspase-independent apoptosis in gastric cancer cells. Exp Ther Med. Mar 2013;5(3):735–41.
32. Tang MJ, Tai IT. A novel interaction between procaspase 8 and SPARC enhances apoptosis and potentiates chemotherapy sensitivity in colorectal cancers. J Biol Chem. November 23, 2007;282(47):34457–67.
33. Carlsson E, Ranki A, Sipila L, et al. Potential role of a navigator gene NAV3 in colorectal cancer. Br J Cancer. January 31, 2012;106(3):517–24.
34. Moolmuang B, Tainsky MA. CREG1 enhances p16(INK4a) -induced cellular senescence. Cell Cycle. February 1, 2011;10(3):518–30.
35. Ma W, Xie S, Ni M, et al. MicroRNA-29a inhibited epididymal epithelial cell proliferation by targeting nuclear autoantigenic sperm protein (NASP). J Biol Chem. March 23, 2012;287(13):10189–99.
36. Li JT, Liu W, Kuang ZH, et al. [Amplification of RIT1 in hepatocellular carci-noma and its clinical significance]. Ai Zheng. Jul 2003;22(7):695–9.
37. Liu Y, Yan X, Liu N, et al. Lentivirus-delivered ZEB-1 small interfering RNA inhibits lung adenocarcinoma cell growth in vitro and in vivo. J Cancer Res Clin Oncol. Aug 2012;138(8):1329–38.
38. Shen SM, Yu Y, Wu YL, Cheng JK, Wang LS, Chen GQ. Downregula-tion of ANP32B, a novel substrate of caspase-3, enhances caspase-3 activa-tion and apoptosis induction in myeloid leukemic cells. Carcinogenesis. Mar 2010;31(3):419–26.
39. Ivanovska I, Ball AS, Diaz RL, et al. MicroRNAs in the miR-106b family regulate p21/CDKN1 A and promote cell cycle progression. Mol Cell Biol. Apr 2008;28(7):2167–74.
40. He L, Thomson JM, Hemann MT, et al. A microRNA polycistron as a potential human oncogene. Nature. June 9, 2005;435(7043):828–33.
41. O’Donnell KA, Wentzel EA, Zeller KI, Dang CV, Mendell JT. c-Myc-regulated microRNAs modulate E2F1 expression. Nature. June 9, 2005;435(7043):839–43.
42. He L, He X, Lowe SW, Hannon GJ. microRNAs join the p53 network–another piece in the tumor-suppression puzzle. Nat Rev Cancer. Nov 2007;7(11):819–22.
43. Scott GK, Goga A, Bhaumik D, Berger CE, Sullivan CS, Benz CC. Coordinate suppression of ERBB2 and ERBB3 by enforced expression of micro-RNA miR-125a or miR-125b. J Biol Chem. January 12, 2007;282(2):1479–86.
44. Nishida N, Mimori K, Fabbri M, et al. MicroRNA-125a-5p is an indepen-dent prognostic factor in gastric cancer and inhibits the proliferation of human gastric cancer cells in combination with trastuzumab. Clin Cancer Res. May 1, 2011;17(9):2725–33.
45. Chakraborty S, Khare S, Dorairaj SK, Prabhakaran VC, Prakash DR, Kumar A. Identification of genes associated with tumorigenesis of retinoblastoma by microarray analysis. Genomics. Sep 2007;90(3):344–53.
46. Watanabe A, Tagawa H, Yamashita J, et al. The role of microRNA-150 as a tumor suppressor in malignant lymphoma. Leukemia. Aug 2011;25(8):1324–34.
47. Amaral FC, Torres N, Saggioro F, et al. MicroRNAs differentially expressed in ACTH-secreting pituitary tumors. J Clin Endocrinol Metab. Jan 2009;94(1):320–3.
48. Lei C, Wang Y, Huang Y, Yu H, Wu L, Huang L. Up-regulated miR155 reverses the epithelial-mesenchymal transition induced by EGF and increases chemo-sensitivity to cisplatin in human Caski cervical cancer cells. PLoS One. 2012;7(12):e52310.
49. Ohdaira H, Sekiguchi M, Miyata K, Yoshida K. MicroRNA-494 suppresses cell proliferation and induces senescence in A549 lung cancer cells. Cell Prolif. Feb 2012;45(1):32–8.
50. Chan JA, Krichevsky AM, Kosik KS. MicroRNA-21 is an antiapoptotic factor in human glioblastoma cells. Cancer Res. July 15, 2005;65(14):6029–33.
51. Yan LX, Huang XF, Shao Q , et al. MicroRNA miR-21 overexpression in human breast cancer is associated with advanced clinical stage, lymph node metastasis and patient poor prognosis. RNA. Nov 2008;14(11):2348–60.
52. Qi L, Bart J, Tan LP, et al. Expression of miR-21 and its targets (PTEN, PDCD4, TM1) in flat epithelial atypia of the breast in relation to ductal carci-noma in situ and invasive carcinoma. BMC Cancer. 2009;9:163.
53. Medina PP, Nolde M, Slack FJ. OncomiR addiction in an in vivo model of microRNA-21-induced pre-B-cell lymphoma. Nature. September 2, 2010;467(7311):86–90.
54. Reis ST, Pontes-Junior J, Antunes AA, et al. miR-21 may acts as an oncomir by targeting RECK, a matrix metalloproteinase regulator, in prostate cancer. BMC Urol. 2012;12:14.
55. Ma L, Young J, Prabhala H, et al. miR-9, a MYC/MYCN-activated microRNA, regulates E-cadherin and cancer metastasis. Nat Cell Biol. Mar 2010;12(3):247–56.
56. Chen Y, Liu W, Chao T, et al. MicroRNA-21 down-regulates the expression of tumor suppressor PDCD4 in human glioblastoma cell T98G. Cancer Lett. December 18, 2008;272(2):197–205.
57. Lefebvre V. The SoxD transcription factors–Sox5, Sox6, and Sox13–are key cell fate modulators. Int J Biochem Cell Biol. Mar 2010;42(3):429–32.
58. Edwards SK, Desai A, Liu Y, Moore CR, Xie P. Expression and function of a novel isoform of Sox5 in malignant B cells. Leuk Res. Mar 2014;38(3):393–401.
59. Tchougounova E, Jiang Y, Brasater D, et al. Sox5 can suppress platelet-derived growth factor B-induced glioma development in Ink4a-deficient mice through induction of acute cellular senescence. Oncogene. March 26, 2009;28(12):1537–48.
60. Shah MY, Calin GA. MicroRNAs miR-221 and miR-222: a new level of regula-tion in aggressive breast cancer. Genome Med. 2011;3(8):56.
61. Lambertini E, Lolli A, Vezzali F, Penolazzi L, Gambari R, Piva R. Correlation between Slug transcription factor and miR-221 in MDA-MB-231 breast cancer cells. BMC Cancer. 2012;12:445.
62. Zhang J, Han L, Ge Y, et al. miR-221/222 promote malignant progres-sion of glioma through activation of the Akt pathway. Int J Oncol. Apr 2010;36(4):913–20.
63. Mi S, Li Z, Chen P, et al. Aberrant overexpression and function of the miR-17–92 cluster in MLL-rearranged acute leukemia. Proc Natl Acad Sci U S A. February 23, 2010;107(8):3710–5.
64. Negrini M, Calin GA. Breast cancer metastasis: a microRNA story. Breast Cancer Res. 2008;10(2):203.
65. Thapa DR, Li X, Jamieson BD, Martinez-Maza O. Overexpression of microR-NAs from the miR-17–92 paralog clusters in AIDS-related non-Hodgkin’s lym-phomas. PLoS One. 2011;6(6):e20781.
66. Orlic M, Spencer CE, Wang L, Gallie BL. Expression analysis of 6p22 genomic gain in retinoblastoma. Genes Chromosomes Cancer. Jan 2006;45(1):72–82.
67. Smith AL, Iwanaga R, Drasin DJ, et al. The miR-106b-25 cluster targets Smad7, activates TGF-beta signaling, and induces EMT and tumor initiating cell char-acteristics downstream of Six1 in human breast cancer. Oncogene. December 13, 2012;31(50):5162–71.
68. Zhao ZN, Bai JX, Zhou Q , et al. TSA suppresses miR-106b-93–25 cluster expression through downregulation of MYC and inhibits proliferation and induces apoptosis in human EMC. PLoS One. 2012;7(9):e45133.
69. Blow JJ, Hodgson B. Replication licensing–defining the proliferative state? Trends Cell Biol. Feb 2002;12(2):72–8.
70. Kan T, Sato F, Ito T, et al. The miR-106b-25 polycistron, activated by genomic amplification, functions as an oncogene by suppressing p21 and Bim. Gastroen-terology. May 2009;136(5):1689–700.
71. Ren B, Yu G, Tseng GC, et al. MCM7 amplification and overexpres-sion are associated with prostate cancer progression. Oncogene. February 16, 2006;25(7):1090–8.
72. Petrocca F, Visone R, Onelli MR, et al. E2F1-regulated microRNAs impair TGFbeta-dependent cell-cycle arrest and apoptosis in gastric cancer. Cancer Cell. Mar 2008;13(3):272–86.
73. Beta M, Venkatesan N, Vasudevan M, Vetrivel U, Khetan V, Krishnakumar S. Identification and Insilico Analysis of Retinoblastoma Serum microRNA Profile and Gene Targets Towards Prediction of Novel Serum Biomarkers. Bioinform Biol Insights. 2013;7:21–34.
74. Trompeter HI, Abbad H, Iwaniuk KM, et al. MicroRNAs MiR-17, MiR-20a, and MiR-106b act in concert to modulate E2F activity on cell cycle arrest during neuronal lineage differentiation of USSC. PLoS One. 2011;6(1):e16138.
Bioinformatics and Biology insights 2014:8 191