Macrophages from lupus-prone MRL mice have a conditional signaling abnormality that leads to...
27
Macrophages from lupus-prone MRL mice have a conditional signaling abnormality that leads to dysregulated expression of numerous genes Angelika Antoni, Department of Biology, Kutztown University of Pennsylvania, Kutztown, PA 19530, USA Vimal A. Patel, Section of Nephrology, Department of Medicine, University of Illinois at Chicago, Chicago, IL 60612, USA Hanli Fan, Section of Nephrology, Department of Medicine, University of Illinois at Chicago, Chicago, IL 60612, USA Daniel J. Lee, Section of Nephrology, Department of Medicine, University of Illinois at Chicago, Chicago, IL 60612, USA Lee H. Graham, Department of Biology, Kutztown University of Pennsylvania, Kutztown, PA 19530, USA Cristen L. Rosch, Department of Biology, Kutztown University of Pennsylvania, Kutztown, PA 19530, USA Daniel S. Spiegel, Department of Computer Science, Kutztown University of Pennsylvania, Kutztown, PA 19530, USA Joyce Rauch, and Division of Rheumatology, Department of Medicine, Research Institute of the McGill University Health Centre, Montreal, QC H3G 1A4, Canada Jerrold S. Levine Section of Nephrology, Department of Medicine, University of Illinois at Chicago, Chicago, IL 60612, USA, Section of Nephrology, Department of Medicine, Jesse Brown Veterans Affairs Medical Center, Chicago, IL 60612, USA, Section of Nephrology, University of Illinois at Chicago, MC-793, Room 479/CSN, 820 South Wood Street, Chicago, IL 60612, USA Jerrold S. Levine: [email protected] Abstract Macrophages (mφ) from pre-diseased mice of the major murine inbred models of spontaneous autoimmunity (AI), including multiple lupus-prone strains and the type I diabetes-prone NOD (non-obese diabetic) strain, have identical apoptotic target-dependent abnormalities. This characteristic feature of mφ from AI-prone mice suggests that abnormal signaling events induced © Springer-Verlag 2011 Correspondence to: Jerrold S. Levine, [email protected]. Electronic supplementary material The online version of this article (doi:10.1007/s00251-010-0507-3) contains supplementary material, which is available to authorized users. PubMed Central CANADA Author Manuscript / Manuscrit d'auteur Immunogenetics. Author manuscript; available in PMC 2012 September 11. Published in final edited form as: Immunogenetics. 2011 May ; 63(5): 291–308. doi:10.1007/s00251-010-0507-3. PMC Canada Author Manuscript PMC Canada Author Manuscript PMC Canada Author Manuscript
-
Upload
independent -
Category
Documents
-
view
0 -
download
0
Transcript of Macrophages from lupus-prone MRL mice have a conditional signaling abnormality that leads to...

Macrophages from lupus-prone MRL mice have a conditionalsignaling abnormality that leads to dysregulated expression ofnumerous genes
Angelika Antoni,Department of Biology, Kutztown University of Pennsylvania, Kutztown, PA 19530, USA
Vimal A. Patel,Section of Nephrology, Department of Medicine, University of Illinois at Chicago, Chicago, IL60612, USA
Hanli Fan,Section of Nephrology, Department of Medicine, University of Illinois at Chicago, Chicago, IL60612, USA
Daniel J. Lee,Section of Nephrology, Department of Medicine, University of Illinois at Chicago, Chicago, IL60612, USA
Lee H. Graham,Department of Biology, Kutztown University of Pennsylvania, Kutztown, PA 19530, USA
Cristen L. Rosch,Department of Biology, Kutztown University of Pennsylvania, Kutztown, PA 19530, USA
Daniel S. Spiegel,Department of Computer Science, Kutztown University of Pennsylvania, Kutztown, PA 19530,USA
Joyce Rauch, andDivision of Rheumatology, Department of Medicine, Research Institute of the McGill UniversityHealth Centre, Montreal, QC H3G 1A4, Canada
Jerrold S. LevineSection of Nephrology, Department of Medicine, University of Illinois at Chicago, Chicago, IL60612, USA, Section of Nephrology, Department of Medicine, Jesse Brown Veterans AffairsMedical Center, Chicago, IL 60612, USA, Section of Nephrology, University of Illinois at Chicago,MC-793, Room 479/CSN, 820 South Wood Street, Chicago, IL 60612, USAJerrold S. Levine: [email protected]
AbstractMacrophages (mφ) from pre-diseased mice of the major murine inbred models of spontaneousautoimmunity (AI), including multiple lupus-prone strains and the type I diabetes-prone NOD(non-obese diabetic) strain, have identical apoptotic target-dependent abnormalities. Thischaracteristic feature of mφ from AI-prone mice suggests that abnormal signaling events induced
© Springer-Verlag 2011
Correspondence to: Jerrold S. Levine, [email protected].
Electronic supplementary material The online version of this article (doi:10.1007/s00251-010-0507-3) contains supplementarymaterial, which is available to authorized users.
PubMed Central CANADAAuthor Manuscript / Manuscrit d'auteurImmunogenetics. Author manuscript; available in PMC 2012 September 11.
Published in final edited form as:Immunogenetics. 2011 May ; 63(5): 291–308. doi:10.1007/s00251-010-0507-3.
PMC
Canada Author M
anuscriptPM
C C
anada Author Manuscript
PMC
Canada Author M
anuscript

within mφ following their interaction with apoptotic targets may predispose to AI. Such signalingabnormalities would affect predominantly the processing and presentation of self-antigen (i.e.,derived from apoptotic targets), while sparing the processing and presentation of foreign antigen(i.e., derived from non-apoptotic sources). Here, we used DNA microarrays to test the hypothesisthat mφ from AI-prone mice (MRL/MpJ [MRL/+] or MRL/MpJ-Tnfrsf6lpr [MRL/lpr])differentially express multiple genes in comparison to non-AI mφ (BALB/c), but do so in a largelyapoptotic cell-dependent manner. Mφ were stimulated with lipopolysaccharide, a potent innatestimulus, in the presence or absence of serum (an experimental surrogate for apoptotic targets). Inaccord with our hypothesis, the number of genes differentially expressed by MRL mφ wassignificantly increased in the presence vs. the absence of serum, the apoptotic target surrogate(n=401 vs. n=201). Notably, for genes differentially expressed by MRL mφ in the presence ofserum, serum-free culture normalized their expression to a level statistically indistinguishablefrom that by non-AI mφ. Comparisons of mφ from AI-prone NOD and non-AI C57BL/6 micecorroborated these findings. Together, these data support the hypothesis that mφ from MRL andother AI-prone mice are characterized by a conditional abnormality elicited by serum lipids orapoptotic targets.
KeywordsRodent; Autoimmunity; Lupus; Macrophage; Diabetes; Apoptosis
IntroductionThe origins of autoimmunity (AI) remain obscure. Most autoimmune diseases like systemiclupus erythematosus (SLE) are polygenic in nature (Concannon et al. 2005; Harley et al.2008), with poorly understood environmental triggers and modifiers (Edwards and Cooper2006; Sarzi-Puttini et al. 2005). Analysis of the pathogenesis of autoimmune diseases likeSLE is complicated further by the evolving roles of individual cell types during diseaseprogression, from the initiation of AI to the pathologic destruction of organs such as thekidney (Botto et al. 1998; Fairhurst et al. 2006; Liu et al. 2007; Stohl et al. 2008; Takeuchiet al. 2005; Tsubata 2004).
Abnormalities involving nearly all cells of the immune system have been described in SLE.To date, most attention has focused on the role of B and T cells. While multipleabnormalities have been described in these cells and their pivotal role is undisputed (Stohl etal. 2008; Takeuchi et al. 2005; Tsubata 2004), an alternative possibility is that antigen-presenting cells (APC), such as macrophages (mφ) and dendritic cells (DC), are inherentlydefective and contribute to the development of AI. Indeed, several lines of genetic evidencesuggest that inherent abnormalities of mφ or DC can predispose to AI (Chen et al. 2006;Ludewig et al. 1998; Nath et al. 2008; Zhu et al. 2005). While the mechanism through whichthese abnormalities predispose to AI remains unclear, APC may promote the emergence ofself-reactive lymphocytes through abnormalities either in the presentation of self-antigen(self-Ag) or in the secondary signals that accompany self-Ag presentation.
Apoptotic cells represent an ongoing and abundant source of self-Ag, and most SLE-relatedauto-Ag are found on the surface of apoptotic cells or bodies (Casciola-Rosen et al. 1994;Cline and Radic 2004; Levine et al. 2006; Neeli et al. 2007). Interactions between APC andapoptotic target cells are therefore likely to be critical in the development of AI. We proposethat AI may occur when abnormal signaling events are induced within the APC following itsinteraction with apoptotic targets. Such an APC abnormality would affect predominantly theprocessing and presentation of self-Ag (i.e., derived from apoptotic targets), while sparingthe processing and presentation of foreign Ag (i.e., derived from non-apoptotic sources).
Antoni et al. Page 2
Immunogenetics. Author manuscript; available in PMC 2012 September 11.
PMC
Canada Author M
anuscriptPM
C C
anada Author Manuscript
PMC
Canada Author M
anuscript

Indeed, it is a remarkable fact that mφ from pre-diseased mice of all the major inbred modelsof spontaneous AI, including multiple SLE-prone strains (MRL/+, MRL/lpr, NZB, NZW,NZB/W F1, BXSB, and LG), as well as the type I diabetes prone non-obese diabetic (NOD)strain, have identical apoptotic target-dependent abnormalities (Donnelly et al. 1990; Fan etal. 2004; Fan et al. 2006; Koh et al. 2000; Levine et al. 1993; Longacre et al. 2004). Theseapoptotic target-dependent abnormalities fall into two major categories: (1) abnormalactivity of the cytoplasmic G-protein Rho (a key regulator of the cytoskeleton) resulting inabnormalities of adhesion and cytoskeletal organization (Fan et al. 2006; Longacre et al.2004) and (2) abnormal expression of multiple soluble mediators of innate and adaptiveimmunity, including interleukin (IL)-1, IL-6, IL-10, IL-12, and tumor necrosis factor-α(Donnelly et al. 1990; Fan et al. 2004; Koh et al. 2000; Levine et al. 1993). These apoptotictarget-dependent abnormalities are present from birth in autoimmune-prone (AI-prone)strains but absent in all non-AI strains evaluated to date (Donnelly et al. 1990; Fan et al.2004; Fan et al. 2006; Koh et al. 2000; Levine et al. 1993; Longacre et al. 2004).
The hypothesis that AI-prone mφ possess an abnormality triggered by interaction withapoptotic targets leads to the following testable prediction about the pattern of transcribedgenes in response to an external stimulus. In the presence of apoptotic targets, geneexpression by AI-prone mφ should differ strikingly from that by non-AI mφ. In contrast, inthe absence of apoptotic targets, gene expression by AI-prone and non-AI mφ should besimilar. To test this hypothesis, we compared gene expression in mφ from pre-diseased AI-prone MRL mice and age-matched non-AI BALB/c mice using DNA microarrays. Mφ werestimulated with endotoxin (lipopolysaccharide [LPS]), a potent innate stimulus, in either thepresence or the absence of serum (an experimental surrogate for apoptotic targets). We havepreviously shown that serum and apoptotic targets are indistinguishable in their effects onmφ from AI-prone mice (Fan et al. 2004; Fan et al. 2006; Koh et al. 2000; Longacre et al.2004) and that the critical factor(s) in serum are removed by delipidation (Fan et al. 2004;Koh et al. 2000]. In accord with our prediction, the number of genes differentially expressedby MRL mφ was significantly increased in the presence vs. the absence of serum. Moreover,for genes differentially expressed in the presence of serum, serum-free culture normalizedtheir expression to a level statistically indistinguishable from that of non-AI mφ. Takentogether, these data support the hypothesis that mφ from MRL and other AI-prone mice arecharacterized by a conditional abnormality that is elicited by serum lipids or apoptotictargets.
Materials and methodsMice
MRL/MpJ (MRL/+), MRL/MpJ-Tnfrsf6lpr (MRL/lpr), and BALB/cByJ (BALB/c) micewere purchased from The Jackson Laboratory (Bar Harbor, ME). All mice used werebetween 4 and 7 weeks of age. For any individual experiment, mφ were pooled from 3 to 5mice of one strain. All comparisons involved mφ from the same or different strains culturedunder identical conditions. Replicate experiments were performed on separate days usingdistinct groups of mice.
Additional confirmatory experiments using NOD/LtJ (NOD) and C57BL/6 mice (alsopurchased from The Jackson Laboratory) were performed. These additional experimentswere identical in methodology to those using MRL and BALB/c mice. For ease ofpresentation, we describe all aspects of our methods with MRL and BALB/c mice asrepresentative AI-prone and non-AI strains, respectively.
Antoni et al. Page 3
Immunogenetics. Author manuscript; available in PMC 2012 September 11.
PMC
Canada Author M
anuscriptPM
C C
anada Author Manuscript
PMC
Canada Author M
anuscript

Macrophage culturePeritoneal exudate cells were harvested by lavage 3 days after i.p. injection of 1.5 ml of4.05% thioglycollate broth (Donnelly et al. 1990; Fan et al. 2004; Fan et al. 2006; Koh et al.2000; Levine et al. 1993; Longacre et al. 2004). Cells were washed twice in RPMI 1640 andplated in 100×15-mm tissue culture dishes at 10×106 cells per dish in R.0 culture medium(RPMI 1640 with 2 mM L-glutamine, 5 mM HEPES, 100 U/ml penicillin, and 100 μg/mlstreptomycin). After incubation for 6 h at 37°C, nonadherent cells were removed by washingtwice with RPMI 1640. The remaining adherent cells, >98% mφ as determined bymorphologic examination and nonspecific esterase staining (Donnelly et al. 1990; Levine etal. 1993), were cultured in serum-free R.0 medium or serum-containing R.10 medium (R.0plus 10% fetal bovine serum). Mφ were used after overnight culture in their respectivemedia.
Microarray experimental conditionsAfter overnight incubation in R.0 or R.10 medium, LPS (Escherichia coli-derived, serotype0111:B4; List Biological, Campbell, CA), was added to a final concentration of 100 ng/ml.RNA was harvested after 0 h (no LPS added), 8 h, or 24 h of stimulation by LPS. Weassessed the effect of two experimental variables: (1) the presence or absence of serum and(2) the duration of stimulation (8 or 24 h) with LPS (100 ng/ml). All comparisons wereperformed in duplicate on separate days. In the presence of serum, separate comparisonswere made for MRL/+ vs. BALB/c mφ and for MRL/lpr vs. BALB/c mφ, whereas, in theabsence of serum, comparison was limited to MRL/lpr vs. BALB/c mφ (because of the poorquality of cRNA and cDNA obtained in comparisons of MRL/+ and BALB/c under serum-free conditions). An independent preparation of BALB/c mφ was used for each comparison.
RNA isolation and purificationRNA was extracted from mφ using a modified TRIzol protocol (Invitrogen LifeTechnologies, Carlsbad, CA) that was optimized to obtain high-quality RNA, with little orno DNA contamination, for use in microarray hybridizations. TRIzol reagent (0.1 ml per 106
cells) was added to plates of adherent mφ that had been washed once with PBS. Solubilizedcells were mixed well, transferred to microfuge tubes, and incubated on ice for 10 min. 0.2ml of chloroform/isoamyl alcohol (50:1) was added per 1 ml of TRIzol. The mixtures werevortexed and incubated at 4°C for 20 min. After vortexing the tubes again, their contentswere transferred to 2-ml Phase-Lock-Gel-Light tubes (Eppendorf, Hamburg, Germany). ThePhase-Lock tubes were centrifuged at 14,000×g in a microcentrifuge for 10 min at 4°C.Aqueous phases were transferred to Phase-Lock-Gel-Heavy tubes (Eppendorf), and avolume of chloroform/isoamyl alcohol (50:1) equal to the initial TRIzol volume was addedto each tube. Tubes were then mixed by inversion and again centrifuged at 14,000×g for 10min at 4°C. Aqueous phases were transferred to new microfuge tubes, and an equal volumeof ice-cold iso-propanol was added to each tube. The tubes were mixed by inversion andstored at −20°C until just before use. Centrifugation, washing, and resuspension of RNAwere performed according to standard protocols (Ribaudo et al. 2002). Each sample of RNAwas resuspended in a minimal volume of RNase-free water, generally about 30 μl. RNAderived from thioglycollate-elicited peritoneal mφ is often accompanied by an unknownprecipitate that pellets with the RNA and is insoluble in water. Most of the precipitate can beremoved by centrifugation after heating the solution of RNA to 65°C for 10 min. As thisprecipitate interferes with spectrophotometric quantitation of RNA, RNA was quantitatedbased on initial cell number. RNA quality was assessed with an Agilent 2100 Bioanalyzer(Agilent Technologies, Palo Alto, CA). Only high-quality RNA was used for hybridizationto microarrays. High-quality RNA was indicated by the lack of a DNA signal and byexamination of the ratio of 28S to 18S RNA. Additional indications of high-quality RNA, as
Antoni et al. Page 4
Immunogenetics. Author manuscript; available in PMC 2012 September 11.
PMC
Canada Author M
anuscriptPM
C C
anada Author Manuscript
PMC
Canada Author M
anuscript

assessed by gel electrophoresis, included the absence of detectable RNA degradation and theability to generate long-length cDNA and cRNA.
RNase protection assaysFor all array studies, parallel plates of mφ, cultured in either R.0 or R.10, were stimulatedwith LPS (100 ng/ml) for 0, 8, 24, and 48 h. RNA derived from these plates was used inRNase protection assays to confirm that cytokine profiles were consistent with previouslypublished findings (Fan et al. 2004; Koh et al. 2000; Levine et al. 1993). RNase protectionassays were performed using a RiboQuant In Vitro Transcription Kit (Pharmingen, SanDiego, CA) according to manufacturer’s instructions. All probes were for murine cytokines.
RNA labeling, hybridization to microarrays, and scanningThe University of Chicago Functional Genomics Facility performed labeled cRNAsynthesis, hybridization, and scanning of GeneChips according to protocols in theAffymetrix GeneChip Expression Analysis Manual (Santa Clara, CA) with minormodifications. In brief, first-strand cDNA synthesis was primed from 10 μg of total RNAusing a T7-(dT)24 oligonucleotide. From 3 μg of phase-lock-gel-purified double-strandcDNA, biotin-labeled antisense cRNA was synthesized using a BioArray High-Yield RNATranscript Labeling kit (Enzo Diagnostics, Farmingdale, NY). After precipitation with 4 MLiCl, 20 μg of cRNA was fragmented by incubation in fragmentation buffer (40 mM Tris–acetate, pH 8.1, 100 mM potassium acetate, 30 mM magnesium acetate) for 35 min at 94°Cand then hybridized to Affymetrix MG_U74Av2 mouse GeneChip® arrays for 16 h at 45°Cin an Affymetrix Hybridization Oven 640. Microarrays were washed and stained withstreptavidin phycoerythrin in an Affymetrix Fluidics Station 400 using the AffymetrixGeneChip protocol. The reaction products from each step were analyzed by electrophoresis,and only high-quality, long-length products were used in subsequent steps.
Microarray data analysisMicroarray Suite Version 5.0 (Affymetrix) was used to analyze all array images. The mouseGeneChip arrays contained 12,488 probe sets, each consisting of 16–20 perfect-match/single-base-mismatch 25-mer oligo pairs. Not all probe sets represent independent genes, asseveral genes are represented on the array multiple times. Nonetheless, for simplicity, weuse the terms “genes” and “probe sets” interchangeably throughout this manuscript, with apreference for the word “genes”. The sequences for each of the 20 perfect-match probeswithin a given probe set were taken from the sequence of a known mouse gene or expressedsequence tag. The sequence of each mismatch probe is identical to its perfect-match pairexcept for one nucleotide in the center. Background correction and scaling were performedaccording to standard Affymetrix protocols. Statistical algorithms, using default parametervalues recommended by Affymetrix, were applied after these two adjustments. Specificdetails of the protocols and statistical algorithms used in Affymetrix MSV 5.0 may beobtained at http://www.affymetrix.com.
Signal log ratioFor each of the ~12,000 genes on the microarray, Affymetrix MSV 5.0 generated a signallog ratio (SLR), which represents the logarithm to base two of the relative expression of agiven gene on the first array to its expression on the second array. In all comparisons ofMRL vs. BALB/c mφ, we formulated our data so that the expression level by MRL mφ wasin the numerator and the expression level by BALB/c mφ was in the denominator.Therefore, SLR values <0 indicate relative under-expression by MRL mφ, and SLR values>0 indicate relative over-expression by MRL mφ. If the SLR equals 0, then the gene isequivalently expressed by MRL and BALB/c mφ. The fold-difference in expression between
Antoni et al. Page 5
Immunogenetics. Author manuscript; available in PMC 2012 September 11.
PMC
Canada Author M
anuscriptPM
C C
anada Author Manuscript
PMC
Canada Author M
anuscript

MRL and BALB/c mφ can be calculated by the following formula: fold-difference (MRL:BALB/c)=2SLR. Thus, for example, if the SLR=+1 for a given gene, then the fold-differencein expression is 2+1=2, and MRL mφ over-express the gene at a 2-fold greater level than doBALB/c mφ. Similarly, if the SLR=−1, then the fold-difference in expression is 2−1=1/2,and MRL mφ under-express the gene by a factor of 2. Finally, if the SLR=0, then expressionis equivalent for MRL and BALB/c mφ (fold-difference is 20=1).
Sensitivity and specificityDifferentially expressed genes were identified using a strategy of recurrence (Longacre et al.2005) and a threshold absolute value for SLR of 0.8 (1.74-fold induction). A strategy ofrecurrence requires that the SLR of a differentially expressed gene exceed a preset thresholdon all individual comparisons. We have previously shown that a strategy of recurrenceincreases the number of linearly independent comparisons that can be derived from a givennumber of experimental replicates (Longacre et al. 2005). Moreover, for any giventhreshold, a strategy of recurrence is more specific than a strategy of means (Longacre et al.2005). The theoretical basis for this method of analysis has been proven mathematically, andits practical application has been validated by both computer simulation and examination ofreal data (Longacre et al. 2005).
In the case of duplicate experiments, a strategy of recurrence yields one additional linearlyindependent comparison, or a total of three independent SLR values per experimentalcondition. To avoid the arbitrariness involved in selecting three out of the four possiblecomparisons, all four comparisons were utilized. The fourth non-linearly independentcomparison provides additional specificity, although less than that from the first threelinearly independent comparisons (Longacre et al. 2005). Hence, differentially expressedgenes were defined as those whose SLR was either ≥0.8 on all three linearly independentcomparisons (plus a fourth non-linearly independent comparison) or ≤−0.8 on all threelinearly independent comparisons (plus a fourth non-linearly independent comparison). Theexpected specificity for this strategy and threshold is >99.9%; this is equivalent to a false-positive rate of ~0.5–1 gene per 1,000 examined. The expected sensitivity depends upon thedegree of differential expression. For a gene whose level of induction is 2-fold (SLR=±1.0),the expected sensitivity is 0.33, whereas for a gene whose level of induction is 4-fold (SLR=±2.0), the expected sensitivity is >0.96. An example of the step-by-step application of ouralgorithm is given in Fig. 1 and discussed in the Results.
Thus, our method of analysis is highly specific but only moderately sensitive, especially forgenes whose differential expression is ~2-fold or less. It should be emphasized that a trade-off inevitably exists between specificity and sensitivity, in that an increase of one alwaysleads to a decrease of the other. To determine whether MRL mφ have a global defect in geneexpression triggered by serum and/or apoptotic cells, specificity is a critical issue. Wetherefore chose a strategy that minimized the inclusion of false-positive genes, even at theexpense of failing to detect a proportion of differentially expressed genes. Additional issuesof sensitivity, specificity, internal consistency, and potential sources of bias are detailedelsewhere (Longacre et al. 2005).
StatisticsData are presented as mean±SD or mean±SE. Statistical significance was determined byANOVA or a two-tailed Student’s t test.
Antoni et al. Page 6
Immunogenetics. Author manuscript; available in PMC 2012 September 11.
PMC
Canada Author M
anuscriptPM
C C
anada Author Manuscript
PMC
Canada Author M
anuscript
ResultsMRL mφ differentially express multiple genes when cultured in the presence of serum
Given the complexity of the data generated by gene arrays, we limited our analysis to asingle representative SLE-prone background (MRL/+ or MRL/lpr) and a singlerepresentative non-AI control strain (BALB/c). To minimize the contribution of disease, weused only young, pre-diseased MRL mice (<7 weeks of age) as a source of mφ.Differentially expressed genes in this case are more likely to reflect intrinsic differences,including susceptibility to AI, rather than manifestations of disease. Finally, since partiallydegraded RNA within apoptotic targets interferes with the performance of DNA microarrays(unpublished observations), we used fetal bovine serum rather than apoptotic targets to elicitabnormal behavior by MRL mφ. We have previously demonstrated that serum and apoptotictarget cells are indistinguishable in their effects on mφ from SLE-prone mice (Fan et al.2004; Fan et al. 2006; Koh et al. 2000; Longacre et al. 2004). Since the critical factor(s) inserum are removed by delipidation (Fan et al. 2004; Koh et al. 2000), we speculate thatapoptotic bodies and/or oxidized lipids and lipoproteins, which engage many of the same mφreceptors as do apoptotic cells, are the responsible components (Chang et al. 1999; deAlmeida and Linden 2005; Erwig and Henson 2008; Fukasawa et al. 1996; Krysko et al.2006). Thus, for the purposes of these studies, serum is an experimental surrogate forapoptotic cells.
MRL/+ mice are AI-prone, but develop SLE-like disease late in life. In contrast, MRL/lprmice, which are genetically identical to MRL/+ mice except for a mutation in Fas, developSLE early on and usually die by 6 to 7 months of age. We first compared gene expression bymφ from MRL/+ vs. BALB/c mice in the presence of serum following 8 or 24 h of LPSstimulation. We identified 217 and 109 genes that were differentially expressed following 8and 24 h of LPS stimulation, respectively. The union of these two sets yielded 270 genes.We also compared MRL/lpr vs. BALB/c mφ and found 131 and 151 genes that weredifferentially expressed following 8 and 24 h of LPS stimulation, respectively. The union ofthese two sets yielded 223 genes. Combination of these two sets (i.e., 270 genes and 223genes, respectively) yielded a final set of 401 genes differentially expressed by SLE-proneMRL vs. non-AI BALB/c mφ.
Of the 401 differentially expressed genes, we identified only 92 in comparisons of bothMRL/+ vs. BALB/c mφ and MRL/lpr vs. BALB/c mφ. On the surface, this limitedconcordance seems to suggest differences between congenic MRL/+ and MRL/lpr mice.However, a more likely explanation relates to the stringency of our algorithm for identifyingdifferentially expressed genes. This issue, and its relationship to the unavoidable trade-offbetween specificity and sensitivity, is discussed in depth in the Online Resource.
Figure 1 provides an example of the step-by-step application of our algorithm fordetermining differential expression, in this case for MRL/+ vs. BALB/c mφ stimulated for 8h with LPS. A summary of our analysis of differentially expressed genes for all othercomparisons is given in Table S1 (see Online Resource). Of the ~12,000 genes representedon an array, only ~5,000 were expressed by mφ (i.e., deemed “present” by Affymetrix MSV5.0) and therefore subjected to comparative analysis. Hence, in the presence of serum, SLE-prone MRL mφ differentially expressed ~8% of all transcribed genes (401 out of ~5,000).For these 401 genes, the average difference in expression was ~4-fold (SLR=±2; Table S2,Online Resource). This value is well above the inherent “noise” of measurement,corresponding to a 1.35-fold difference of expression (SLR =±0.43). These issues arediscussed in greater depth in the Online Resource.
Antoni et al. Page 7
Immunogenetics. Author manuscript; available in PMC 2012 September 11.
PMC
Canada Author M
anuscriptPM
C C
anada Author Manuscript
PMC
Canada Author M
anuscript

We set our threshold for differential expression to achieve a specificity of >99.9% (false-positive rate of ~0.5–1 in 1,000) (see Material and methods). Analysis of our data suggeststhat the actual specificity may have been slightly lower, at 99.8% (false-positive rate of ~2in 1,000; Table S1, Online Resource). This means that as many as 20 of the 401differentially expressed genes (or ~5%) may represent false-positives. Details of ourexperimental estimation of the false-positive rate, as well as a discussion of the effects ofvarying the threshold for differential expression, are provided in the Online Resource.
Serum-free culture reduces the number of differentially expressed genes in MRL mφThe number of genes differentially expressed by MRL mφ was fewer in the absence, thanthe presence, of serum. Comparison of gene expression by mφ from MRL/lpr vs. BALB/cmice in the absence of serum revealed 149 and 121 differentially expressed genes following8 and 24 h of LPS stimulation, respectively (Table S1, Online Resource). The union of thesetwo sets yielded 201 genes that were differentially expressed by MRL/lpr mφ in serum-freeculture.
Comparison of the set of 401 genes differentially expressed in the presence of serum withthe set of 201 genes differentially expressed in the absence of serum allowed us to sort genesinto three distinct categories: (1) genes differentially expressed only in the presence ofserum (“SERUM ONLY”, n=280); (2) genes differentially expressed only in the absence ofserum (“SERUM-FREE ONLY”, n=80); and (3) genes differentially expressed in both thepresence and the absence of serum (“SERUM & SERUM-FREE”, n=121). “SERUMONLY” genes, which are the most numerous, followed the pattern we have previouslyobserved for multiple soluble mediators of innate and adaptive immunity (Donnelly et al.1990; Fan et al. 2004; Koh et al. 2000; Levine et al. 1993). Differential expression by genesin this category is consistent with an inherent abnormality in MRL mφ that is triggered byserum lipids or apoptotic targets (Fan et al. 2004; Koh et al. 2000). “SERUM-FREE ONLY”genes, which are fewer in number, are not accounted for by our hypothesis. Genes in thiscategory may represent errors of assignment, an unavoidable byproduct of the stringency ofour algorithm (elaborated below and in the Online Resource). Finally, “SERUM & SERUM-FREE” genes presumably reflect fixed strain-specific differences between MRL and BALB/c mice.
To test this interpretation, we compared the degree of differential expression in the presencevs. the absence of serum for genes in each of the three categories. For each gene, wecalculated the ratio of the absolute value of its SLR in the presence of serum (SLRSERUM) tothat in the absence of serum (SLRSERUM-FREE). For genes differentially expressed only inthe presence of serum (“SERUM ONLY”), the ratio of SLRSERUM/SLRSERUM-FREE shouldbe >1. For genes differentially expressed only in the absence of serum (“SERUM-FREEONLY”), the ratio of SLR SERUM/SLRSERUM-FREE should be <1. Finally, for genesdifferentially expressed in both the presence and absence of serum (“SERUM & SERUM-FREE”), the ratio of SLRSERUM/SLRSERUM-FREE should be ~1.
The results of this analysis are shown in Fig. 2. The differences in SLRSERUM/SLRSERUM-FREE among the three categories of genes were highly significant (p<10−10 byANOVA at both 8 and 24 h). With respect to classification, genes in the “SERUM ONLY”category appear to be sorted correctly. The mean (±SE) ratio of SLRSERUM/SLRSERUM-FREE for these genes was 2.7±0.2 and 2.6±0.2 after 8 and 24 h of LPSstimulation, respectively. This is consistent with ~6-fold greater differential expression inthe presence vs. the absence of serum. Genes in the “SERUM & SERUM-FREE” categoryalso appear to be classified correctly. The mean ratio of SLRSERUM/SLRSERUM-FREE forthese genes was ~1.0 (1.1± 0.1 and 1.2±0.1 at 8 and 24 h, respectively). This is consistentwith a fixed degree of differential expression, irrespective of the presence or absence of
Antoni et al. Page 8
Immunogenetics. Author manuscript; available in PMC 2012 September 11.
PMC
Canada Author M
anuscriptPM
C C
anada Author Manuscript
PMC
Canada Author M
anuscript

serum. These differences in SLRSERUM/SLRSERUM-FREE for “SERUM ONLY” genes vs.“SERUM & SERUM-FREE” genes were highly significant (p<10−13 by two-tailed t test).
In contrast, genes in the “SERUM-FREE ONLY” category seem to be incorrectly classifiedand may belong more properly to “SERUM & SERUM-FREE” category. Thus, their meanratio of SLRSERUM/SLRSERUM-FREE was close to 1.0 (0.8±0.1 and 0.8±0.1 at 8 and 24 h,respectively), indicating that their differential expression was similar, irrespective of thepresence or absence of serum. The basis for this misclassification most likely lies in thestringency of our algorithm to identify differentially expressed genes. This issue is discussedin depth in the Online Resource.
To address this issue further, we performed individual pair-wise statistical comparisons.Notably, at both 8 and 24 h, the mean SLRSERUM/SLRSERUM-FREE for “SERUM-FREEONLY” genes did not differ from “SERUM & SERUM-FREE” genes (p>0.05 by two-tailedt test), but did differ significantly from “SERUM ONLY” genes (p<10−13 by two-tailed ttest). Together, these data suggest that errors in assignment may have affectedpredominantly genes in the “SERUM-FREE ONLY” category.
We conclude that differentially expressed genes could be classified into two predominantcategories: (1) those differentially expressed only in the presence of serum (n= 280) and (2)those differentially expressed in a more or less constitutive manner, irrespective of thepresence or the absence of serum (n=121). These results are consistent with the hypothesisthat mφ possess a signaling abnormality, affecting gene transcription only in the presence ofapoptotic cells (or their experimental surrogate, serum).
Genes differentially expressed by MRL mφ in the presence of serum are expressednormally in the absence of serum
We next looked in greater detail at the individual expression patterns for the 280 “SERUMONLY” genes by superimposing the frequency distributions of their SLR’s determined inthe presence vs. the absence of serum (Fig. 3). As shown, there is a marked separationbetween the distributions of SLR in the presence vs. absence of serum. The histograms inthe presence of serum are biphasic, representing genes that are either relatively over-expressed (SLR>0) or under-expressed (SLR<0) by MRL mφ. In marked contrast, thehistograms in the absence of serum are well centered about the origin.
To determine whether the degree of correction that occurred in the absence of serum wascomplete or only partial, we restricted our analysis to a single strain comparison (MRL/lprvs. BALB/c) and generated scatter plots in which each of the 123 “SERUM ONLY” genesdifferentially expressed by MRL/lpr mφ at 8 and/or 24 h is depicted by a single point (Fig.4). The X-axis and Y-axis represent the SLR at 8 and 24 h, respectively. Examination of thescatter plot for culture in the presence of serum reveals a preponderance of genes in the firstand third quadrants (Fig. 4a). This indicates that the sign (positive or negative) of the SLRfor most genes was the same at 8 and at 24 h, that is, genes under-expressed at 8 h were alsounder-expressed at 24 h, and vice versa. Genes that were differentially expressed to a greaterextent at 8 h lie closer to the X-axis, whereas genes that were differentially expressed to agreater extent at 24 h lie closer to the Y-axis. Points lying on or close to the diagonalrepresent genes that were differentially expressed to a similar extent at 8 and 24 h.Regression analysis reveals that there is a significant correlation between the SLR values at8 and 24 h (r2=0.59, p<10−26). Moreover, the slope of the best-fitting line, 0.78, is close to 1,indicating that the degree of differential expression at 8 h is very close to, but slightlygreater than that at 24 h.
Antoni et al. Page 9
Immunogenetics. Author manuscript; available in PMC 2012 September 11.
PMC
Canada Author M
anuscriptPM
C C
anada Author Manuscript
PMC
Canada Author M
anuscript

The scatter plot for these same 123 genes in the absence of serum reveals several strikingdifferences (Fig. 4b). First, the genes are more closely clustered about the origin. Toquantify this observation, we calculated the distance from the origin for each gene in the twoscatter plots. In the absence of serum, the mean SLR distance was 0.8±0.6, as comparedwith 1.6±0.6 in the presence of serum (p<10−30 by two-tailed paired t test). Second, thegenes were no longer exclusively clustered in the first and third quadrants but were moreevenly distributed throughout all four quadrants. This suggests a more random distributionof SLR, consistent with a greater contribution of noise. Regression analysis confirms adecreased, though still significant, correlation between the SLR values at 8 and 24 h(r2=0.35, p<10−13). Third, for comparison, we also generated the scatter plots for these same123 genes in same-vs.-same comparisons of BALB/c vs. BALB/c (Fig. 4c) and MRL vs.MRL (Fig. 4d). The mean distances from the origin for these same-vs.-same scatter plotswere 0.7±0.1 and 0.8±0.1, respectively, and, remarkably, statistically not different from thatfor serum-free culture (p>0.05 by two-tailed paired t test). Thus, serum-free culture reducesthe differential expression of “SERUM ONLY” genes to a level statisticallyindistinguishable from that found in same-vs.-same comparisons. In other words, differencesin the expression of these 123 genes were completely corrected by the removal of serum,with the average differential expression reduced to a level indistinguishable from identity.We conclude that culture in the absence of serum corrects the differential expression ofgenes in the “SERUM ONLY” category, at least to the limit of detectability for themicroarrays we used.
Genes differentially expressed in both the presence and absence of serum have featuresof strain-specific differences
We generated similar scatter plots for the 121 genes differentially expressed both in thepresence and in the absence of serum (Fig. 5). As expected, the scatter plots for genes in thiscategory look remarkably similar in the presence (Fig. 5a) and absence (Fig. 5b) of serum.For both conditions, genes are clustered tightly about the diagonal, indicating not only ahigh degree of correlation between the SLR at 8 and 24 h, but also approximately equaldegrees of differential expression at these two time points. These data suggest that genes inthis category represent fixed strain-specific differences between MRL and BALB/c mφ andthat their degree of differential expression is unaffected by serum. Regression analysis isconsistent with this interpretation (serum present, r2=0.87, p<10−30, slope=0.80; serumabsent, r2=0.89, p<10−30, slope=0.91).
As further evidence that these genes represent fixed strain-specific differences, we alsoperformed linear regression comparing their SLR in the presence of serum to their SLR inthe absence of serum at each of the two time points (Figure S1, Online Resource). At both 8and 24 h, the SLR in the presence vs. absence of serum were not only highly correlated butalso approximately equal as indicated by slopes close to 1.0 (at 8 h, r2=0.90, p<10−61,slope=1.04; at 24 h, r2=0.89, p<10−57, slope=0.91).
Relative expression of cytokines, chemokines, and their receptors by mφ from MRL vs.BALB/c mice
We have previously published data generated by RNase protection assay, in which wecompared the expression of multiple cytokine genes by mφ from MRL vs. BALB/c micecultured in the presence and absence of serum (Fan et al. 2004; Koh et al. 2000). In all caseswhere comparison could be performed, the results of microarray analysis agreed with thoseof RNase protection assays (Table S3, Online Resource).
Our microarray analysis allowed us to identify additional cytokine-related genes that aredifferentially expressed by mφ from pre-diseased MRL mice (Table S4, Online Resource).
Antoni et al. Page 10
Immunogenetics. Author manuscript; available in PMC 2012 September 11.
PMC
Canada Author M
anuscriptPM
C C
anada Author Manuscript
PMC
Canada Author M
anuscript

Combined with previous results (Fan et al. 2004; Koh et al. 2000), 19 cytokine-related genes(10 identified before and 9 from this study) showed serum-dependent dysregulation. Ofthese, 17 were under-expressed by MRL mφ in the presence of serum, and 2 were over-expressed. All 19 had normal or nearly normal expression when MRL mφ were cultured inthe absence of serum. An additional 5 genes were differentially expressed both in thepresence and in the absence of serum. All were under-expressed by MRL mφ. 34 genes (29from this study) were expressed equivalently by MRL and BALB/c mφ, irrespective of thepresence or absence of serum. Finally, the expression level for 74 genes fell below the limitsof detection by DNA microarrays for all experimental conditions.
The nature of genes differentially expressed by MRL vs. BALB/c mφ in the presence ofserum
Notably, cytokines, chemokines, and their receptors comprised a relatively small proportionof the 401 genes differentially expressed by MRL vs. BALB/c mφ in the presence of serum.A complete summary of these genes is given in Table S5 (see Online Resource) and isgrouped into categories based on the relevant biological function or system involving thegene. The differentially expressed genes affect a broad spectrum of immunologic andbiologic systems, including genes in the following categories: (1) cytoskeleton, microtubularnetwork, and regulators of adhesion/migration; (2) apoptotic regulation and apoptotic cellclearance; (3) cell cycle regulation; (4) antigen processing; (5) transcriptional regulation; (6)mediators and receptors of innate immunity; (7) signal transduction (immune and non-immune specific); and (8) metabolism. In all categories, some genes were over-expressed,while others were under-expressed, by MRL (AI-prone) vs. BALB/c (non-AI) mφ in thepresence of serum.
Serum-dependent differential expression of genes extends to mφ from NOD mice, a modelof autoimmune diabetes mellitus
To this point, our results have involved only a single strain comparison, namely, pre-diseased AI-prone MRL mice vs. age-matched control BALB/c mφ. We wished to determinewhether serum-dependent differences in the overall pattern of gene expression can also beobserved in comparisons of other AI-prone and control mφ. We chose NOD and C57BL/6mice as alternative examples of AI-prone and control mice, respectively. NOD micespontaneously develop type I diabetes mellitus. These data permitted three newcomparisons: MRL/lpr vs. C57BL/6, NOD vs. BALB/c, and NOD vs. C57BL/6.
For each of these three comparisons, genes were sorted into the same three categories:“SERUM ONLY”, “SERUM-FREE ONLY”, and “SERUM & SERUM-FREE”. Aftersorting, as in Fig. 2, we compared the degree of differential expression in the presence vs.the absence of serum for genes in each of these three categories by calculating for each genethe ratio of the absolute value of its SLR in the presence of serum (SLRSERUM) to that in theabsence of serum (SLRSERUM-FREE). The results of this analysis are shown in Fig. 6. As inthe comparison of MRL vs. BALB/c mice, the differences in SLRSERUM/SLRSERUM-FREEamong the three categories of genes were highly significant at both 8 and 24 h (MRL/lpr vs.C57BL/6: p<10−13 by ANOVA; NOD vs. BALB/c: p<10−7; and NOD vs. C57BL/6:p<10−4). Importantly, all three new comparisons replicated the essential features observed inthe comparison of MRL vs. BALB/c mφ. Thus, genes in the “SERUM ONLY” and“SERUM & SERUM-FREE” categories appeared to be sorted correctly, whereas those inthe “SERUM-FREE ONLY” category appeared to be misclassified.
Genes in the “SERUM ONLY” category were correctly classified in that they showed a highdegree of serum-dependent differential expression. The mean (±SE) ratio of SLRSERUM/SLRSERUM-FREE for these genes was: MRL/lpr vs. C57BL/6, 1.9±0.1 and 3.7±0.5 at 8 and
Antoni et al. Page 11
Immunogenetics. Author manuscript; available in PMC 2012 September 11.
PMC
Canada Author M
anuscriptPM
C C
anada Author Manuscript
PMC
Canada Author M
anuscript

24 h; NOD vs. BALB/c, 3.8±0.7 and 3.3±0.6 at 8 and 24 h; and NOD vs. C57BL/6, 2.8±0.6and 3.7±0.5 at 8 and 24 h. These differences are consistent with ~4 to 12-fold greaterdifferential expression in the presence vs. the absence of serum. Genes in the “SERUM &SERUM-FREE” category also appear to be classified correctly. The mean ratio ofSLRSERUM/SLRSERUM-FREE for these genes was ~1.0 in all three comparisons: MRL/lpr vs.C57BL/6, 1.0±0.1 and 1.0± 0.1 at 8 and 24 h; NOD vs. BALB/c, 1.1±0.1 and 1.2±0.1 at 8and 24 h; and NOD vs. C57BL/6, 1.1±0.1 and 1.3±0.1 at 8 and 24 h. These ratios areconsistent with a fixed degree of differential expression, irrespective of the presence orabsence of serum.
In contrast, just as for the MRL vs. BALB/c comparison, genes in the “SERUM-FREEONLY” category appear to be incorrectly classified, belonging more properly to the“SERUM & SERUM-FREE” category. Thus, their mean SLRSERUM/SLRSERUM-FREE ratiowas close to 1.0 (MRL/lpr vs. C57BL/6 are 0.8±0.1 and 0.8±0.1 at 8 and 24 h; NOD vs.BALB/c are 0.8±0.1 and 0.9±0.1 at 8 and 24 h; and NOD vs. C57BL/6 are 0.9±0.1 and1.2±0.4 at 8 and 24 h), indicative of a similar degree of differential expression in thepresence vs. the absence of serum. As previously discussed in reference to Fig. 2, the basisfor this misclassification most likely lies in the stringency of our algorithm to identifydifferentially expressed genes and is discussed in depth in the Online Resource.
These results are again consistent with the hypothesis that mφ possess a signalingabnormality, affecting gene transcription only in the presence of apoptotic cells (or theirexperimental surrogate, serum). Thus, differentially expressed genes in these three newcomparisons between AI-prone and control mφ could again be classified into twopredominant categories: (1) those differentially expressed only in the presence of serum and(2) those differentially expressed in a more or less constitutive manner, irrespective of thepresence or the absence of serum.
Next, as in the comparison of MRL/lpr vs. BALB/c mφ (see Fig. 4), we generated scatterplots for each of the sets of “SERUM ONLY” genes, as derived from the three newcomparisons (Fig. 7). Paired scatter plots in the presence and absence of serum for each ofthe three comparisons replicated the essential features observed in the comparison of MRLvs. BALB/c mφ. Thus, in the presence of serum, a preponderance of genes lies in the firstand third quadrants (Fig. 7a, c, e), indicating that genes under-expressed at 8 h were alsounder-expressed at 24 h, and vice versa. Regression analysis confirms that there is asignificant correlation between the SLR values at 8 and 24 h (MRL/lpr vs. C57BL/6 arer2=0.58, p<10−55; NOD vs. BALB/c are r2= 0.70, p<10−50; NOD vs. C57BL/6 are r2=0.66,p<10−30). The slopes of the best-fitting lines—0.62, 0.88, and 0.71, respectively—indicatethat the degree of differential expression at 8 h is close to, but slightly greater than that at 24h.
As in the comparison of MRL vs. BALB/c mφ, the scatter plots for these same genes in theabsence of serum revealed several striking differences (Fig. 7b, d, f). First, the genes aremore closely clustered about the origin. Thus, the mean SLR distance was significantlydecreased in the presence vs. absence of serum for all three new comparisons (MRL/lpr vs.C57BL/6 are 1.8±0.1 vs. 1.1±0.1, p<10−39 by two-tailed paired t test; NOD vs. BALB/c are1.7±0.1 vs. 1.1±0.1, p<10−23; NOD vs. C57BL/6 are 1.7±0.1 vs. 1.0±0.1, p<10−21). Second,the genes were no longer exclusively clustered in the first and third quadrants but were moreevenly distributed throughout all four quadrants, suggestive of a more random distribution ofSLR and consistent with a greater contribution of noise. Third, for comparison, wegenerated scatter plots for these same genes in same-vs.-same comparisons of C57BL/6 vs.C57BL/6 and NOD vs. NOD (not shown). The mean distances from the origin for thesesame-vs.-same scatter plots were 0.7±0.1 and 1.0±0.1, respectively, and, remarkably,
Antoni et al. Page 12
Immunogenetics. Author manuscript; available in PMC 2012 September 11.
PMC
Canada Author M
anuscriptPM
C C
anada Author Manuscript
PMC
Canada Author M
anuscript
statistically not different from that for serum-free culture (p> 0.05 by two-tailed paired ttest). Thus, serum-free culture reduced the differential expression of “SERUM ONLY”genes to a level statistically indistinguishable from that found in same-vs.-samecomparisons.
Finally, as in the comparison of MRL/lpr vs. BALB/c (see Fig. 5), we generated scatter plotsfor each of the sets of “SERUM & SERUM-FREE” genes, as derived from the three newcomparisons (Fig. 8). As expected, the scatter plots for genes in this category lookremarkably similar in the presence (Fig. 8a, c, e) vs. the absence (Fig. 8b, d, f) of serum.Irrespective of the presence or absence of serum, genes from all three new comparisons wereclustered tightly about the diagonal. This indicates a high degree of correlation between theSLR at 8 and 24 h, as well as an approximately equal degree of differential expression atthese two time points. Genes in this category therefore most likely represent fixed strain-specific differences. Regression analysis confirms that their degree of differential expressionis largely unaffected by serum: MRL/lpr vs. C57BL/6 (serum present, r2=0.86, p<10−132,slope=0.91; serum absent, r2=0.89, p<10−148, slope=0.94); NOD vs. BALB/c (serumpresent, r2=0.89, p<10−98, slope=1.02; serum absent, r2=0.88, p<10−93, slope=0.97); NODvs. C57BL/6 (serum present, r2=0.90, p<10−74, slope=0.92; serum absent, r2=0.89, p<10−70,slope=0.99).
DiscussionWe have previously shown that mφ from pre-diseased mice of all the major inbred modelsof spontaneous AI, including SLE and autoimmune diabetes, have an identical abnormalitythat leads to the dysregulated expression of multiple cytokines and chemokines [Donnelly etal. 1990; Fan et al. 2004; Koh et al. 2000; Levine et al. 1993) and the diminished activity ofRho, a key regulator of the cytoskeleton (Fan et al. 2006; Longacre et al. 2004). Thisabnormality is conditional, as it occurs only when mφ are cultured in the presence of serumlipids or apoptotic target cells. We have shown that serum lipids and apoptotic targets areindistinguishable in their effects on mφ from AI-prone mice (Fan et al. 2004; Fan et al.2006; Koh et al. 2000; Longacre et al. 2004). Thus, in the presence of serum lipids orapoptotic targets, the abnormality is fully manifest. In contrast, in the absence of serumlipids and/or apoptotic targets, the behavior of mφ from AI-prone mice is fully comparableto that of mφ from non-AI strains.
Here, we used DNA microarrays to test our hypothesis that mφ from AI-prone mice possessa signaling abnormality triggered by interaction with apoptotic targets. A strong predictionof this hypothesis is that gene expression by AI-prone mφ should differ from that by non-AImφ only when expression is assessed in the presence of apoptotic targets and/or serumlipids. In the absence of apoptotic targets and/or serum lipids, gene expression by AI-proneand non-AI mφ should be closely comparable. We focused our analysis on a singlerepresentative SLE-prone background (MRL/+ or MRL/lpr) and a single representative non-AI control strain (BALB/c). Additional comparisons with AI-prone NOD and non-AIC57BL/6 mice were made for corroboration. Since partially degraded RNA within apoptoticcells can interfere with the performance of DNA microarrays (unpublished observations),we used serum rather than apoptotic cells to elicit abnormal behavior by MRL mφ. Thus, inthis study, we did not demonstrate directly the effect of apoptotic targets and/or serum lipidson AI-prone mφ. While follow-up work will address this point, it should be noted that, inour previous studies (Fan et al. 2004; Fan et al. 2006; Koh et al. 2000; Longacre et al. 2004),we have shown clearly that serum lipids are fully comparable to apoptotic targets in terms ofeliciting all abnormalities of AI-prone mφ.
Antoni et al. Page 13
Immunogenetics. Author manuscript; available in PMC 2012 September 11.
PMC
Canada Author M
anuscriptPM
C C
anada Author Manuscript
PMC
Canada Author M
anuscript
Our analysis revealed that genes differentially expressed by MRL vs. BALB/c mφ could besorted into one of two major categories. Genes in the first category (n=121) weredifferentially expressed in a fixed manner, irrespective whether mφ were cultured in thepresence or absence of serum. The degree of differential expression was essentially the samein the presence and absence of serum, consistent with the notion that genes in this categoryrepresent fixed genetic differences between the two strains. From a functional perspective,these genes may be either incidental to disease (e.g., related to coat color) or tentativelyassociated with AI (e.g., MHC-related).
Genes in the second category (n=280) conformed to our hypothesis. Differential expressionwas seen only when mφ were cultured in the presence of serum. Remarkably, the expressionof these same genes by MRL vs. BALB/c mφ was normalized when mφ were cultured in theabsence of serum. The mean difference in expression of these genes by MRL vs. BALB/cmφ was reduced from ~4-fold in the presence of serum to a level statisticallyindistinguishable from identity in the absence of serum. Taken together, our data areconsistent with the hypothesis that mφ from AI-prone mice possess a conditionalabnormality, which affects gene expression only when mφ are cultured in the presence ofserum or apoptotic cells.
In light of these data, we propose an alternate explanation for the association betweenimpaired clearance of apoptotic cells and the development of systemic AI (Botto et al. 1998;Cohen et al. 2002; Gaipl et al. 2005). Discussions of this association often neglect the factthat impaired clearance of apoptotic targets has two important consequences, whose roles inthe development of AI have not been properly distinguished: (1) persistence of the apoptoticcorpses and (2) diminution or loss of apoptotic target-initiated signaling events (Cocco andUcker 2001). We suggest that it is the second consequence, namely, the diminution or lossof apoptotic cell-dependent proximal signaling events in professional APC, which plays thelarger role in the development of AI. According to this model, loss of self-tolerance withresultant AI may occur through multiple abnormalities, either acquired or genetic, thatinterfere with the set of signaling events induced in APC by the recognition and/orengulfment of apoptotic targets.
In this regard, we and others have shown that the recognition and/or uptake of apoptotictargets by phagocytes is associated with a number of early signaling events (Chung et al.2007; Cocco and Ucker 2001; Cvetanovic and Ucker 2004; Cvetanovic et al. 2006; Mitchellet al. 2006; Patel et al. 2006; Patel et al. 2007; Reddy et al. 2002). For example, receptor-mediated discrimination of apoptotic targets leads to profound inhibition of NFκB-dependent transcriptional activity and the signaling kinase ERK1/2, but potent activation ofJNK1/2 and p38 (Cocco and Ucker 2001; Cvetanovic and Ucker 2004; Patel et al. 2006;Reddy et al. 2002). In addition, signaling events induced by phagocytosis of apoptotictargets include the activation of Akt, a major regulator of cell survival (Patel et al. 2007;Reddy et al. 2002).
Abnormalities that interfere with apoptotic target-dependent signaling events and therebypredispose to AI can conceivably occur at multiple steps. These abnormalities may affectnot only the recognition and/or engulfment of apoptotic targets (e.g., as in the targeteddeletion of C1q and MER (Botto et al. 1998; Cohen et al. 2002; Gaipl et al. 2005)), but alsoany of the signaling events or cascades elicited by apoptotic targets (Cocco and Ucker 2001;Cvetanovic and Ucker 2004; Patel et al. 2006; Patel et al. 2007; Reddy et al. 2002). Many ofthese signaling events or cascades are likely to be activated uniquely by the specificrecognition of apoptotic targets. Once activated, these signaling events can modulate thefunction of responding cells, such as mφ, through their effects on other signaling pathwaysand gene transcription (Fig. 9). For example, the potent anti-inflammatory activity of
Antoni et al. Page 14
Immunogenetics. Author manuscript; available in PMC 2012 September 11.
PMC
Canada Author M
anuscriptPM
C C
anada Author Manuscript
PMC
Canada Author M
anuscript

apoptotic targets, their most defining characteristic, is well documented (Chung et al. 2007;Cocco and Ucker 2001; Cvetanovic et al. 2006; Cvetanovic and Ucker 2004; Fadok et al.1998; Mitchell et al. 2006; Voll et al. 1997). We refer collectively to the set of uniquesignaling events induced in mφ by interaction with apoptotic targets as the “apoptoticresponse module” and speculate that one or more of the signaling elements within thismodule functions abnormally in mφ from MRL and other AI-prone mice. In the absence ofapoptotic targets, the “apoptotic response module” remains inactive, and gene transcriptionin response to innate stimuli such as LPS occurs normally. In contrast, in the presence ofapoptotic targets (or their experimental surrogate, serum), the “apoptotic response module”is activated, and gene transcription by mφ from AI-prone mice is abnormal.
The differentially expressed genes identified in this study represent the downstream effectsof a putative abnormality within the “apoptotic response module” of MRL mφ (Tables S3,S4, and S5, Online Resource). These genes can contribute in important ways to theinitiation, maintenance, and/or manifestations of AI. For example, included among thesegenes are multiple cytokines, chemokines, and related proteins that play important roles inthe regulation of innate and adaptive immunity (Tables S3 and S4, Online Resource). Alsoincluded are genes that contribute to other vital aspects of innate and adaptive immunity,including antigen processing, adhesion and motility, recognition and clearance of dead cells,co-stimulation of lymphocytes, and the signaling response to various extracellular mediatorsof immunity (Table S5, Online Resource). The selective dysregulation of these genes,occurring only in the presence of apoptotic targets or serum lipids, has broad potential toupset the delicate balance between tolerance and AI.
Several observations suggest that the apoptotic target-dependent abnormalities, described inthis and previous publications (Donnelly et al. 1990; Fan et al. 2004; Fan et al. 2006; Koh etal. 2000; Levine et al. 1993; Longacre et al. 2004), may play an important role in the earlieststages of disease, perhaps during the initiation and/or maintenance of AI. First, theabnormality is found in all of the major inbred murine models of SLE and is absent in alltested non-AI strains (Donnelly et al. 1990; Fan et al. 2006; Koh et al. 2000; Levine et al.1993; Longacre et al. 2004). Second, the same abnormality also occurs in the NOD mouse,which develops autoimmune diabetes, a distinct model of spontaneous AI that is organ-specific rather than systemic (Fan et al. 2004; Fan et al. 2006). Third, the abnormality ispresent in MRL mice as young as 1 week of age (Levine et al. 1993) and shows unalteredexpression throughout the lifespan of MRL mice, independent of disease and inflammatorysequelae (Levine et al. 1993; Koh et al. 2000). Finally, the abnormality is present to anequivalent degree in MRL/lpr and MRL/+ mice (Donnelly et al. 1990; Fan et al. 2006; Kohet al. 2000; Levine et al. 1993; Longacre et al. 2004). The first develops an early and severeform of SLE-like disease, while the second shows a more moderate and slowly progressingform of AI. Together, these findings support an early and critical role for apoptotic cell-dependent dysregulation of gene expression in mφ from MRL and other AI-prone strains inthe initiation and development of AI.
Supplementary MaterialRefer to Web version on PubMed Central for supplementary material.
AcknowledgmentsThis work was supported by: National Institutes of Health grants DK59793 (to JSL) and HL69722 (to JSL);National Institutes of Health training grant T32DK07510 (to AA); Canadian Institute of Health Research grantsMOP-42391 (to JR) and MOP-67101 (to JR); and a Genzyme Renal Innovation Program award from Genzyme, Inc(to JSL). The authors thank the University of Chicago Functional Genomics Facility, headed by Richard Quigg, and
Antoni et al. Page 15
Immunogenetics. Author manuscript; available in PMC 2012 September 11.
PMC
Canada Author M
anuscriptPM
C C
anada Author Manuscript
PMC
Canada Author M
anuscript

especially Xinmin Li, Jaejung Kim, Jamie Zhou, Chris Dyanov, and Miglena Petkova, for cRNA labeling andhybridization.
ReferencesBotto M, Dell’Agnola C, Bygrave AE, Thompson EM, Cook HT, Petry F, Loos M, Pandolfi PP,
Walport MJ. C1q deficiency causes glomerulonephritis associated with multiple apoptotic bodies.Nat Genet. 1998; 19:56–59. [PubMed: 9590289]
Casciola-Rosen LA, Anhalt G, Rosen A. Autoantigens targeted in SLE are clustered in two populationof surface structures on apoptotic keratinocytes. J Exp Med. 1994; 179:1317–1330. [PubMed:7511686]
Chang MK, Bergmark C, Laurila A, Hörkkö S, Han KH, Friedman P, Dennis EA, Witztum JL.Monoclonal antibodies against oxidized LDL bind to apoptotic cells and inhibit their phagocytosisby elicited macrophages. Proc Natl Acad Sci U S A. 1999; 96:6353–6358. [PubMed: 10339591]
Chen M, Wang Y-H, Wang Y, Huang L, Sandoval H, Liu Y-J, Wang J. Dendritic cell apoptosis in themaintenance of immune tolerance. Science. 2006; 311:1160–1164. [PubMed: 16497935]
Chung EY, Liu J, Homma Y, Zhang Y, Brendolan A, Saggese M, Han J, Silverstein R, Selleri L, MaX. Interleukin-10 expression in macrophages during phagocytosis of apoptotic cells is mediated byhomeodomain proteins Pbx1 and Prep-1. Immunity. 2007; 27:952–964. [PubMed: 18093541]
Cline AM, Radic MZ. Murine autoantibodies identify distinct sets of apoptotic bodies. Autoimmunity.2004; 37:85–93. [PubMed: 15293878]
Cocco RE, Ucker DS. Distinct modes of macrophage recognition for apoptotic and necrotic cells arenot specified exclusively by phosphatidylserine exposure. Mol Biol Cell. 2001; 12:919–930.[PubMed: 11294896]
Cohen PL, Caricchio R, Abraham V, Camenisch TD, Jennette JC, Roubey RA, Earp HS, MatsushimaG, Reap EA. Delayed apoptotic cell clearance and lupus-like autoimmunity in mice lacking the c-mer membrane tyrosine kinase. J Exp Med. 2002; 196:135–140. [PubMed: 12093878]
Concannon P, Erlich HA, Julier C, Morahan G, Nerup J, Pociot F, Todd JA, Rich SS. Evidence forsusceptibility loci from four genome-wide linkage scans in 1, 435 multiplex families. Diabetes.2005; 54:2995–3001. [PubMed: 16186404]
Cvetanovic M, Ucker DS. Innate immune discrimination of apoptotic cells: repression ofproinflammatory macrophage transcription is coupled directly to specific recognition. J Immunol.2004; 172:880–889. [PubMed: 14707059]
Cvetanovic M, Mitchell JE, Patel V, Avner BS, Su Y, van der Saag PT, Witte PL, Fiore S, Levine JS,Ucker DS. Specific recognition of apoptotic cells reveals a ubiquitous and unconventional innateimmunity. J Biol Chem. 2006; 281:20055–20067. [PubMed: 16707494]
de Almeida CJG, Linden R. Phagocytosis of apoptotic cells: matter of balance. Cell Mol Life Sci.2005; 62:1532–1546. [PubMed: 15905967]
Donnelly RP, Levine J, Hartwell DW, Frendl G, Fenton MJ, Beller DI. Aberrant regulation ofinterleukin 1 expression in macrophages from young autoimmune-prone mice. J Immunol. 1990;145:3231–3239. [PubMed: 2230116]
Edwards CJ, Cooper C. Early environmental exposure and development of lupus. Lupus. 2006;15:814–819. [PubMed: 17153856]
Erwig L-P, Henson PM. Clearance of apoptotic cells by phagocytes. Cell Death Differ. 2008; 15:243–250. [PubMed: 17571081]
Fadok VA, Bratton DL, Konowal A, Freed PW, Westcott JY, Henson PM. Macrophages that haveingested apoptotic cells in vitro inhibit proinflammatory cytokine production through auto-crine/paracrine mechanisms involving TGF-β, PGE2, and PAF. J Clin Invest. 1998; 101:890–898.[PubMed: 9466984]
Fairhurst AM, Wandstrat AE, Wakeland EK. Systemic lupus erythematosus: multiple immunologicalphenotypes in a complex genetic disease. Adv Immunol. 2006; 92:1–69. [PubMed: 17145301]
Fan H, Longacre A, Meng F, Patel V, Hsiao K, Koh JS, Levine JS. Cytokine dysregulation induced byapoptotic cells is a shared characteristic of macrophages from NOD and SLE-prone mice. JImmunol. 2004; 172:4834–4843. [PubMed: 15067061]
Antoni et al. Page 16
Immunogenetics. Author manuscript; available in PMC 2012 September 11.
PMC
Canada Author M
anuscriptPM
C C
anada Author Manuscript
PMC
Canada Author M
anuscript
Fan H, Patel VA, Longacre A, Levine JS. Abnormal regulation of the cytoskeletal regulator Rhotypifies macrophages of the major murine models of spontaneous autoimmunity. J Leukoc Biol.2006; 79:155–165. [PubMed: 16244106]
Fukasawa M, Adachi H, Hirota K, Tsujimoto M, Arai H, Inoue K. SRB1, a class B scavenger receptor,recognizes both negatively charged liposomes and apoptotic cells. Exp Cell Res. 1996; 222:246–250. [PubMed: 8549669]
Gaipl US, Voll RE, Sheriff A, Franz S, Kalden JR, Herrmann M. Impaired clearance of dying cells insystemic lupus erythematosus. Autoimmun Rev. 2005; 4:189–194. [PubMed: 15893710]
Harley JB, Alarcón-Riquelme ME, Criswell LA, Jacob CO, Kimberly RP, Moser KL, Tsao BP, VyseTJ, Langefeld CD. for The International Consortium for Systemic Lupus Erythematosus Genetics(SLEGEN). Genome-wide association scan in women with systemic lupus erythematosusidentifies susceptibility variants in ITGAM, PXK, KIAA1542 and other loci. Nat Genet. 2008;40:204–210. [PubMed: 18204446]
Koh JS, Wang Z, Levine JS. Cytokine dysregulation induced by apoptotic cells is a sharedcharacteristic of murine lupus. J Immunol. 2000; 165:4190–4201. [PubMed: 11035051]
Krysko DV, D’Herde K, Vandenabeele P. Clearance of apoptotic and necrotic cells and itsimmunological consequences. Apoptosis. 2006; 11:1709–1726. [PubMed: 16951923]
Levine JS, Pugh BJ, Hartwell D, Fitzpatrick JM, Marshak-Rothstein A, Beller DI. IL-1 dysregulationis an intrinsic defect in macrophages from MRL autoimmune-prone mice. Eur J Immunol. 1993;23:2951–2958. [PubMed: 8223873]
Levine JS, Subang R, Nasr SH, Fournier S, Rauch J. Immunization with an apoptotic cell-bindingprotein recapitulates the nephritis and sequential autoantibody emergence of SLE. J Immunol.2006; 177:6504–6516. [PubMed: 17056583]
Liu K, Li QZ, Yu Y, Liang C, Subramanian S, Zeng Z, Wang HW, Xie C, Zhou XJ, Mohan C,Wakeland EK. Sle3 and Sle5 can independently couple with Sle1 to mediate severe lupusnephritis. Genes Immun. 2007; 8:634–645. [PubMed: 17728789]
Longacre A, Koh JS, Hsiao K-H, Gilligan H, Fan H, Patel VA, Levine JS. Macrophages from lupus-prone MRL mice are characterized by abnormalities in Rho activity, cytoskeletal organization, andadhesiveness to extracellular matrix proteins. J Leukoc Biol. 2004; 76:971–984. [PubMed:15316033]
Longacre A, Scott LR, Levine JS. Linear independence of pairwise comparisons of DNA microarraydata. J Bioinform Comput Biol. 2005; 3:1243–1262. [PubMed: 16374905]
Ludewig B, Odermatt B, Landmann S, Hengartner H, Zinkernagel RM. Dendritic cells induceautoimmune diabetes and maintain disease via de novo formation of local lymphoid tissue. J ExpMed. 1998; 188:1493–1501. [PubMed: 9782126]
Mitchell JE, Cvetanovic M, Tibrewal N, Patel V, Colamonici OR, Li MO, Flavell RA, Levine JS,Birge RB, Ucker DS. The presumptive phosphatidylserine receptor is dispensable for innateantiinflammatory recognition and clearance of apoptotic cells. J Biol Chem. 2006; 281:5718–5725.[PubMed: 16317002]
Nath SK, Han S, Kim-Howard X, Kelly JA, Viswanathan P, Gilkeson GS, Chen W, Zhu C, McEverRP, Kimberly RP, Alarcon-Riquelme ME, Vyse TJ, Li Q-Z, Wakeland EK, Merrill JR, James JA,Kaufman KM, Guthridge JM, Harley JB. A non-synonymous functional variant inintegrinalpha(M) is associated with SLE. Nat Genet. 2008; 40:131–133. [PubMed: 18227869]
Patel VA, Longacre A, Hsiao K, Fan H, Meng F, Mitchell JE, Rauch J, Ucker DS, Levine JS.Apoptotic cells, at all stages of the death process, trigger characteristic signaling events that aredivergent from and dominant over those triggered by necrotic cells: implications for the delayedclearance model of autoimmunity. J Biol Chem. 2006; 281:4663–4670. [PubMed: 16377620]
Patel VA, Longacre-Antoni A, Cvetanovic M, Lee DJ, Feng L, Fan H, Rauch J, Ucker DS, Levine JS.The affirmative response of the innate immune system to apoptotic cells. Autoimmunity. 2007;40:274–280. [PubMed: 17516209]
Reddy SM, Hsiao KH, Abernethy VE, Fan H, Longacre A, Lieberthal W, Rauch J, Koh JS, Levine JS.Phagocytosis of apoptotic cells by macrophages induces novel signaling events leading tocytokine-independent survival and inhibition of proliferation: activation of Akt and inhibition of
Antoni et al. Page 17
Immunogenetics. Author manuscript; available in PMC 2012 September 11.
PMC
Canada Author M
anuscriptPM
C C
anada Author Manuscript
PMC
Canada Author M
anuscript

extracellular signal-regulated kinases 1 and 2. J Immunol. 2002; 169:702–713. [PubMed:12097372]
Ribaudo, R.; Gilman, M.; Kingston, RE.; Chomczynski, P.; Sacchi, N. Preparation and analysis ofRNA. In: Coligan, JE.; Kruisbeek, AM.; Marguilies, DH.; Shevach, EM.; Strober, W., editors.Current protocols in immunology. Wiley; New York: 2002. p. 10.11.1-10.11.14.
Richardson NI, MMKSN, Nicolo D, Monestier M, Radic MZ. Divergent members of a singleautoreactive B cell clone retain specificity for apoptotic blebs. Mol Immunol. 2007; 44:1914–1921. [PubMed: 17084454]
Sarzi-Puttini P, Atzeni F, Iaccarino L, Doria A. Environment and SLE. Autoimmunity. 2005; 38:465–472. [PubMed: 16373251]
Stohl W, Jacob N, Quinn WJ III, Cancro MP, Gao H, Putterman C, Gao X, Pricop L, Koss MN. GlobalT cell dysregulation in non-autoimmune-prone mice promotes rapid development of BAFFindependent, SLE-like autoimmunity. J Immunol. 2008; 181:833–841. [PubMed: 18566449]
Takeuchi T, Tsuzaka K, Abe T, Yoshimoto K, Shiraishi K, Kameda H, Amano K. T cell abnormalitiesin systemic lupus erythematosus. Autoimmunity. 2005; 38:339–346. [PubMed: 16227148]
Tsubata T. B cell abnormality and autoimmune disorders. Autoimmunity. 2004; 38:331–337.[PubMed: 16240466]
Voll RE, Herrmann M, Roth EA, Stach C, Kalden JR, Girkontaite I. Immunosuppressive effects ofapoptotic cells. Nature. 1997; 390:350–351. [PubMed: 9389474]
Zhu J, Liu X, Xie C, Yan M, Yu Y, Sobel ES, Wakeland EK, Mohan C. T cell hyperactivity in lupusas a consequence of hyper-stimulatory antigen-presenting cells. J Clin Invest. 2005; 115:1869–1878. [PubMed: 15951839]
Antoni et al. Page 18
Immunogenetics. Author manuscript; available in PMC 2012 September 11.
PMC
Canada Author M
anuscriptPM
C C
anada Author Manuscript
PMC
Canada Author M
anuscript

Fig. 1.Comparison of genes differentially expressed by MRL/+ vs. BALB/c mice. A representativeexample of the results obtained using our algorithm for determining differentially expressedgenes is shown. RNA from MRL/+ and BALB/c mφ stimulated for 8 h with LPS (100 ng/ml) was compared by DNA microarray analysis. Replicate experiments were performed ontwo separate days. “Within” comparisons refer to RNA samples obtained from mφ culturedon the same day, whereas “across” comparisons refer to RNA samples obtained from mφcultured on different days as parts of replicate experiments. Differentially expressed geneswere defined as those whose SLR was ≥0.8 on both “within” as well as on both “across”comparisons, or ≤−0.8 on both “within” as well as on both “across” comparisons. Althoughthe final set of differentially expressed genes is based upon four comparisons (two “within”and two “across”), only three of these four comparisons are linearly independent (Longacreet al. 2005)
Antoni et al. Page 19
Immunogenetics. Author manuscript; available in PMC 2012 September 11.
PMC
Canada Author M
anuscriptPM
C C
anada Author Manuscript
PMC
Canada Author M
anuscript

Fig. 2.Comparison of genes differentially expressed in the presence and/or absence of serum. RNAfrom MRL/lpr and BALB/c mφ stimulated for 8 or 24 h with LPS (100 ng/ml) werecompared by DNA microarray analysis. Genes at each time point were separated into threecategories—those differentially expressed only in the presence of serum (SERUM ONLY),those differentially expressed only in the absence of serum (SERUM-FREE ONLY), andthose differentially expressed in both the presence and the absence of serum (SERUM &SERUM-FREE). We determined the ratio of the SLR magnitude in the presence of serum,SLRSERUM, to that in the absence of serum, SLRSERUM-FREE, for all genes in each of thethree categories. The figure depicts the mean (±SE) ratio of SLRSERUM/SLRSERUM-FREE foreach category at each time point. Differences among the three categories were significant atboth 8 and 24 h (p<10−10 by ANOVA). Genes in SERUM ONLY differed significantly fromthose in both SERUM-FREE ONLY and SERUM & SERUM-FREE at 8 and 24 h (p<10−13
by two-tailed t test), whereas genes in SERUM-FREE ONLY did not differ from those inSERUM & SERUM-FREE (p=NS by two-tailed t test)
Antoni et al. Page 20
Immunogenetics. Author manuscript; available in PMC 2012 September 11.
PMC
Canada Author M
anuscriptPM
C C
anada Author Manuscript
PMC
Canada Author M
anuscript

Fig. 3.Expression characteristics of genes differentially expressed only in the presence of serum(SERUM ONLY). Genes differentially expressed only in the presence of serum weredivided into four groups, according to whether they were detected in comparisons usingMRL/+ (left) or MRL/lpr (right) mφ and following 8 h (top) or 24 h (bottom) of LPSstimulation. For each group of genes, the frequency distribution of individual SLR values isplotted for culture in the presence (filled) or absence (unfilled) of serum
Antoni et al. Page 21
Immunogenetics. Author manuscript; available in PMC 2012 September 11.
PMC
Canada Author M
anuscriptPM
C C
anada Author Manuscript
PMC
Canada Author M
anuscript

Fig. 4.Individually plotted expression patterns of genes differentially expressed only in thepresence of serum (SERUM ONLY). RNA from MRL/lpr and BALB/c mφ, stimulated for 8or 24 h with LPS (100 ng/ml), were compared by DNA microarray analysis. Shown arescatter plots for genes differentially expressed in the presence, but not absence, of serum ateither 8 or 24 h (n=123). The X-axis represents the SLR at 8 h, whereas the Y-axisrepresents the SLR at 24 h. It should be noted that both axes are log2 scales. The upper plotsshow comparisons of MRL/lpr vs. BALB/c mφ for culture in the presence (a) or absence (b)of serum. The lower plots show control same-vs.-same comparisons for these same genes inthe presence of serum for mφ from BALB/c (c) or MRL/lpr (d) mice. The mean distancefrom the origin, as calculated by the Pythagorean Theorem, is shown for each scatter plot
Antoni et al. Page 22
Immunogenetics. Author manuscript; available in PMC 2012 September 11.
PMC
Canada Author M
anuscriptPM
C C
anada Author Manuscript
PMC
Canada Author M
anuscript
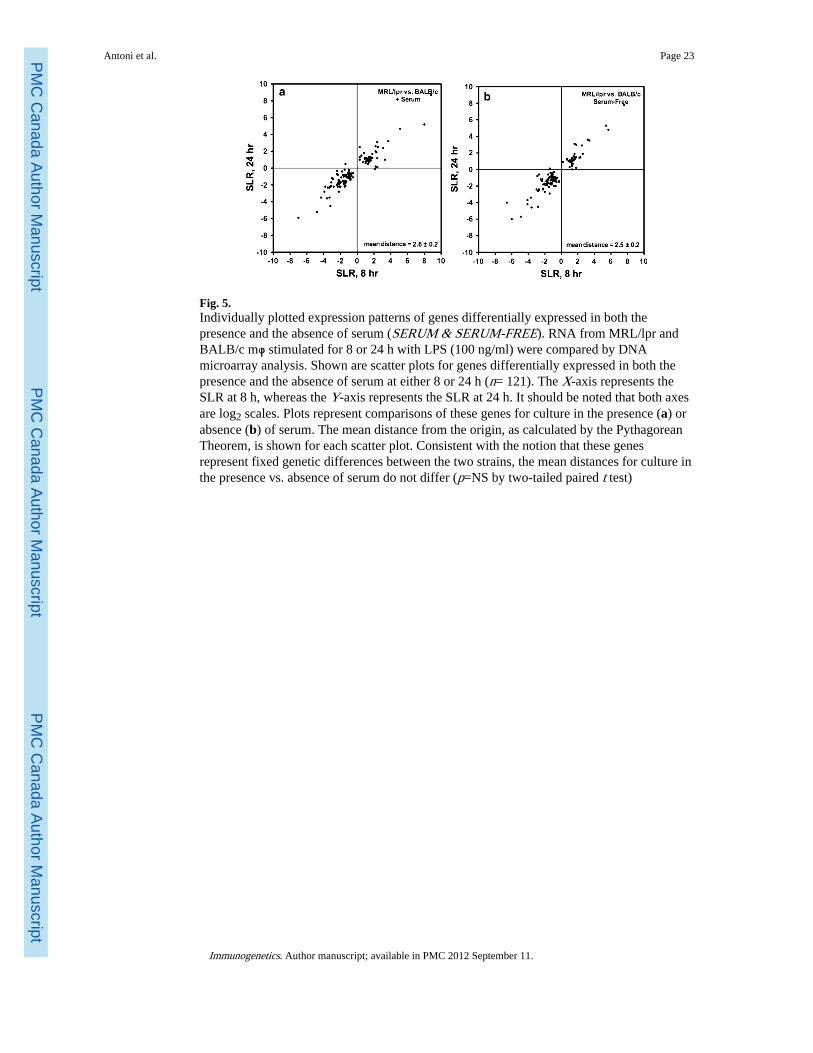
Fig. 5.Individually plotted expression patterns of genes differentially expressed in both thepresence and the absence of serum (SERUM & SERUM-FREE). RNA from MRL/lpr andBALB/c mφ stimulated for 8 or 24 h with LPS (100 ng/ml) were compared by DNAmicroarray analysis. Shown are scatter plots for genes differentially expressed in both thepresence and the absence of serum at either 8 or 24 h (n= 121). The X-axis represents theSLR at 8 h, whereas the Y-axis represents the SLR at 24 h. It should be noted that both axesare log2 scales. Plots represent comparisons of these genes for culture in the presence (a) orabsence (b) of serum. The mean distance from the origin, as calculated by the PythagoreanTheorem, is shown for each scatter plot. Consistent with the notion that these genesrepresent fixed genetic differences between the two strains, the mean distances for culture inthe presence vs. absence of serum do not differ (p=NS by two-tailed paired t test)
Antoni et al. Page 23
Immunogenetics. Author manuscript; available in PMC 2012 September 11.
PMC
Canada Author M
anuscriptPM
C C
anada Author Manuscript
PMC
Canada Author M
anuscript

Fig. 6.Comparison of genes differentially expressed in the presence and/or absence of serum. RNAfrom mφ from the indicated AI-prone (MRL/lpr and NOD) and control (BALB/c andC57BL/6) strains were stimulated for 8 or 24 h with LPS (100 ng/ml) and compared byDNA microarray analysis. Genes at each time point were separated into three categories—those differentially expressed only in the presence of serum (SERUM ONLY), thosedifferentially expressed only in the absence of serum (SERUM-FREE ONLY), and thosedifferentially expressed in both the presence and the absence of serum (SERUM ONLY).We determined the ratio of the SLR magnitude in the presence of serum, SLRSERUM, to thatin the absence of serum, SLRSERUM-FREE, for all genes in each of the three categories. Thefigure depicts the mean (±SE) ratio of SLRSERUM/SLRSERUM-FREE for each category ateach time point. Differences among the three categories were significant at both 8 and 24 hfor each of the three strain comparisons (MRL/lpr vs. C57BL/6, p<10−13 by ANOVA; NODvs. BALB/c, p<10−7; and NOD vs. C57BL/6, p<10−4). Genes in SERUM ONLY differedsignificantly from those in both SERUM-FREE ONLY and SERUM & SERUM-FREE at 8and 24 h (MRL/lpr vs. C57BL/6, p<10−7 by two-tailed t test; NOD vs. BALB/c, p<10−3; andNOD vs. C57BL/6, p<10−3), whereas genes in SERUM-FREE ONLY did not differ fromthose in SERUM & SERUM-FREE (p=NS by two-tailed t test)
Antoni et al. Page 24
Immunogenetics. Author manuscript; available in PMC 2012 September 11.
PMC
Canada Author M
anuscriptPM
C C
anada Author Manuscript
PMC
Canada Author M
anuscript
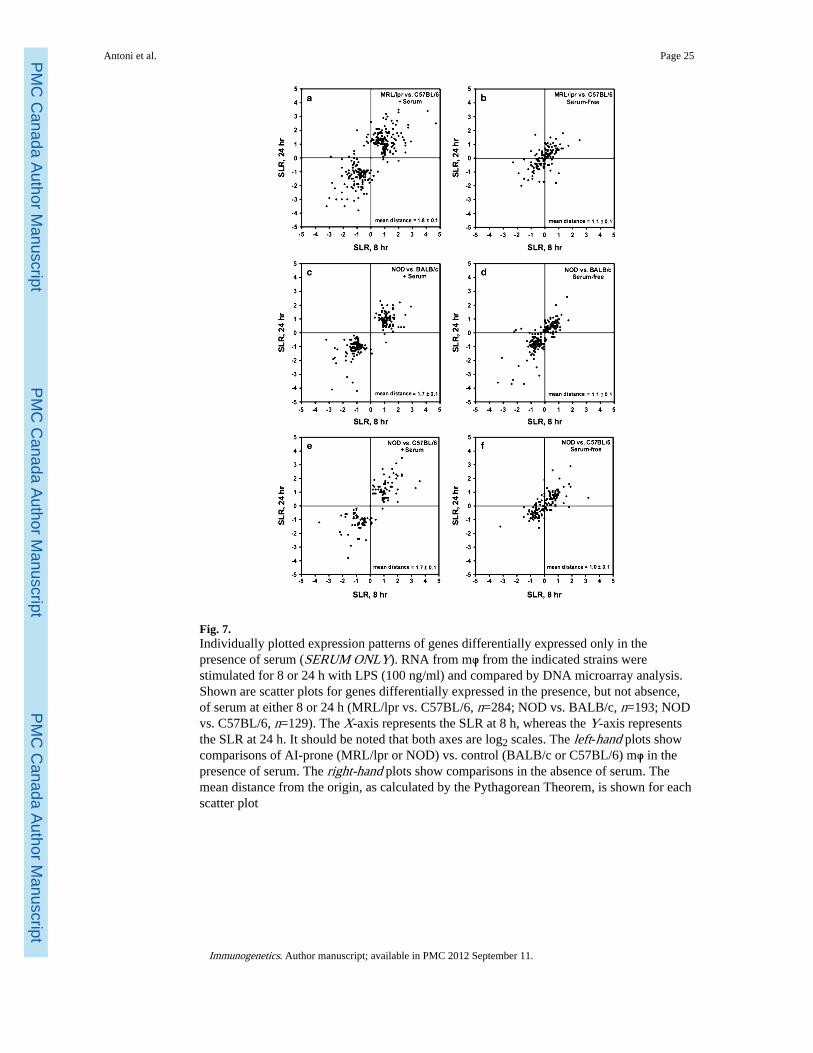
Fig. 7.Individually plotted expression patterns of genes differentially expressed only in thepresence of serum (SERUM ONLY). RNA from mφ from the indicated strains werestimulated for 8 or 24 h with LPS (100 ng/ml) and compared by DNA microarray analysis.Shown are scatter plots for genes differentially expressed in the presence, but not absence,of serum at either 8 or 24 h (MRL/lpr vs. C57BL/6, n=284; NOD vs. BALB/c, n=193; NODvs. C57BL/6, n=129). The X-axis represents the SLR at 8 h, whereas the Y-axis representsthe SLR at 24 h. It should be noted that both axes are log2 scales. The left-hand plots showcomparisons of AI-prone (MRL/lpr or NOD) vs. control (BALB/c or C57BL/6) mφ in thepresence of serum. The right-hand plots show comparisons in the absence of serum. Themean distance from the origin, as calculated by the Pythagorean Theorem, is shown for eachscatter plot
Antoni et al. Page 25
Immunogenetics. Author manuscript; available in PMC 2012 September 11.
PMC
Canada Author M
anuscriptPM
C C
anada Author Manuscript
PMC
Canada Author M
anuscript

Fig. 8.Individually plotted expression patterns of genes differentially expressed in both thepresence and the absence of serum (SERUM & SERUM-FREE). RNA from mφ from theindicated strains were stimulated for 8 or 24 h with LPS (100 ng/ml) and compared by DNAmicroarray analysis. Shown are scatter plots for genes differentially expressed in thepresence, but not absence, of serum at either 8 or 24 h (MRL/lpr vs. C57BL/6, n=308; NODvs. BALB/c, n=203; NOD vs. C57BL/6, n=146). The X-axis represents the SLR at 8 h,whereas the Y-axis represents the SLR at 24 h. It should be noted that both axes are log2scales. The left-hand plots show comparisons of AI-prone (MRL/lpr or NOD) vs. control(BALB/c or C57BL/6) mφ in the presence of serum. The right-hand plots show comparisonsin the absence of serum. The mean distance from the origin, as calculated by thePythagorean Theorem, is shown for each scatter plot. Consistent with the notion that thesegenes represent fixed genetic differences between the two strains, the mean distances forculture in the presence vs. absence of serum do not differ (p =NS by two-tailed paired t test)
Antoni et al. Page 26
Immunogenetics. Author manuscript; available in PMC 2012 September 11.
PMC
Canada Author M
anuscriptPM
C C
anada Author Manuscript
PMC
Canada Author M
anuscript

Fig. 9.Model for the conditional signaling abnormality that leads to the dysregulated expression ofmultiple genes in mφ from pre-diseased AI-prone MRL mice. The clearance of apoptoticcells by mφ is associated with a number of early signaling events, depicted collectively as anApoptotic Response Module (ARM). The ARM includes signaling elements that areactivated uniquely in response to receptor-mediated recognition of apoptotic cells. While themajor known effects of the ARM entail the modulation of signaling events and genetranscription in response to innate stimuli, the range of ARM’s effects is likely to bebroader. We speculate that one or more of the signaling elements within this modulefunctions abnormally in mφ from MRL mice. In the absence of apoptotic targets, the ARMis inactive, and gene transcription in response to innate stimuli such as LPS occurs normally.In contrast, in the presence of apoptotic targets, the ARM is activated, and gene transcriptionby mφ from MRL and other AI-prone mice is abnormal
Antoni et al. Page 27
Immunogenetics. Author manuscript; available in PMC 2012 September 11.
PMC
Canada Author M
anuscriptPM
C C
anada Author Manuscript
PMC
Canada Author M
anuscript