Palaeoclimatic studies in South Shetland Islands, Antarctica, based on numerous stratigraphic...
40
Journal of Paleolimnology 8: 233-272, 1993. 1993 Kluwer Academic Publishers. Printed in Belgium. 233 Palaeoclimatic studies in South Shetland Islands, Antarctica, based on numerous stratigraphic variables in lake sediments Svante Bj0rck 1, Hannelore Hgtkansson 1, Siv Olsson 1, Lena Barnekow 1 & jan Janssens 2 1Department of Quaternary Geology, Lund University, Tornav. 13, S-223 63 Lund, Sweden; 2Department of Ecology, Evolution and Behaviour, University of Minnesota, 109 Zoology, 318 Church Street S.E., Minneapolis, MN 55455, USA Received 5 January 1993; accepted 24 March 1993 Key words: lake sediments, diatoms, spores, tephra, mineralogy, sediment chemistry, mosses, multivariate analysis, palaeoclimate, holocene, Livingston Island, Antarctica Abstract The hitherto longest found lake sediment sequence on Byers Peninsula, Livingston Island, South Shet- land Islands, was analysed with respect to lithology, chronology, diatoms, Pediastrum, pollen and spores, mosses, mineralogy, and sediment chemistry. During the ca. 5000 year long development the sediments were influenced by frequent tephra fall-outs. This volcanic impact played a major role in the lake's history during two periods, 4700-4600 and 2800-2500 BP, but was of importance during the lake's entire history with considerable influence on many of the palaeoenvironmentally significant indicators. The large and complex data set was analysed and zonated with different types of multivariate analysis. This resulted in a subdivision of the sequence into 8 time periods and 21 variables. Redundancy analysis (RDA) of this data set, both without and with the tephra periods, and with 4-6 of the variables as explanatory environmental variables, reveal that climatic/environmental signals are detectable. The palaeoclimatic picture that emerged out of the tephra 'noise' suggests that the first 100 years were characterized by mild, humid conditions. This was followed by a less mild and humid climate until ca. 4000 BP when a gradual warming seems to have started, coupled with increased humidity. These mild and humid conditions seem to have reached an optimum slightly after 3000 BP. At ca. 2500 BP a distinct climatic deterioration occurred with colder and drier conditions and long seasons with ice cover. This arid, cold phase probably reached its optimum conditions at ca. 1500 BP, when slightly warmer conditions might have prevailed for a while. Except for the modern sample with rather mild climate, the last 1400 years seem to have been fairly arid and cold, and the effects of the frequent volcanic activity during this period is only vaguely seen in the records. Introduction Only recently have researchers begun to use stratigraphic studies of lake sediments in the Ant- arctic Peninsula region to evaluate Holocene en- vironmental and climatic changes (Tatur & del Valle, 1986; M~tusbacher etal., 1989; Zale & Karl6n, 1989; Matthies etal., 1990; Schmidt etal., 1990; Bj0rck etal., 1991a; M~usbacher 1991). Previous attempts have indicated that
-
Upload
independent -
Category
Documents
-
view
2 -
download
0
Transcript of Palaeoclimatic studies in South Shetland Islands, Antarctica, based on numerous stratigraphic...
Journal of Paleolimnology 8: 233-272, 1993. �9 1993 Kluwer Academic Publishers. Printed in Belgium. 233
Palaeoclimatic studies in South Shetland Islands, Antarctica, based on numerous stratigraphic variables in lake sediments
Svante Bj0rck 1, Hannelore Hgtkansson 1, Siv Olsson 1, Lena B a r n e k o w 1 & jan Janssens 2 1Department of Quaternary Geology, Lund University, Tornav. 13, S-223 63 Lund, Sweden; 2Department of Ecology, Evolution and Behaviour, University of Minnesota, 109 Zoology, 318 Church Street S.E., Minneapolis, MN 55455, USA
Received 5 January 1993; accepted 24 March 1993
Key words: lake sediments, diatoms, spores, tephra, mineralogy, sediment chemistry, mosses, multivariate analysis, palaeoclimate, holocene, Livingston Island, Antarctica
Abstract
The hitherto longest found lake sediment sequence on Byers Peninsula, Livingston Island, South Shet- land Islands, was analysed with respect to lithology, chronology, diatoms, Pediastrum, pollen and spores, mosses, mineralogy, and sediment chemistry. During the ca. 5000 year long development the sediments were influenced by frequent tephra fall-outs. This volcanic impact played a major role in the lake's history during two periods, 4700-4600 and 2800-2500 BP, but was of importance during the lake's entire history with considerable influence on many of the palaeoenvironmentally significant indicators. The large and complex data set was analysed and zonated with different types of multivariate analysis. This resulted in a subdivision of the sequence into 8 time periods and 21 variables. Redundancy analysis (RDA) of this data set, both without and with the tephra periods, and with 4-6 of the variables as explanatory environmental variables, reveal that climatic/environmental signals are detectable. The palaeoclimatic picture that emerged out of the tephra 'noise' suggests that the first 100 years were characterized by mild, humid conditions. This was followed by a less mild and humid climate until ca. 4000 BP when a gradual warming seems to have started, coupled with increased humidity. These mild and humid conditions seem to have reached an optimum slightly after 3000 BP. At ca. 2500 BP a distinct climatic deterioration occurred with colder and drier conditions and long seasons with ice cover. This arid, cold phase probably reached its optimum conditions at ca. 1500 BP, when slightly warmer conditions might have prevailed for a while. Except for the modern sample with rather mild climate, the last 1400 years seem to have been fairly arid and cold, and the effects of the frequent volcanic activity during this period is only vaguely seen in the records.
Introduct ion
Only recently have researchers begun to use stratigraphic studies of lake sediments in the Ant- arctic Peninsula region to evaluate Holocene en-
vironmental and climatic changes (Tatur & del Valle, 1986; M~tusbacher etal., 1989; Zale & Karl6n, 1989; Matthies etal., 1990; Schmidt etal., 1990; Bj0rck etal., 1991a; M~usbacher 1991). Previous attempts have indicated that
234
these types of studies have the greatest potential to describe and analyse the Holocene terrestrial environmental history of this part of the world.
Byers Peninsula on Livingston Island is prob- ably the area in Antarctica that has the highest concentration of lakes. The lakes have also proven to contain fairly thick sediments (BjSrck et al., 1991a) and tephra layers that can be used for correlations and datings (BjSrck et al., 1991b). These type of time-markers would be perfect for lake level studies, with transects from the shore out to the deeper parts (cf. Digerfeldt, 1988); but because the latter are mostly shallow and fiat- bottomed, such studies are not feasible.
Our first lake sediment study from this region (BjSrck et al., 1991a) was a pilot-study to evalu- ate the possibilities for performing palaeoenviron- mental investigations in the Antarctic environ- ment. Since the results were promising, we decided to carry out a wide variety of detailed stratigraphic studies of the hitherto longest found lake sediment sequence on Byers Peninsula.
Area of investigation
Geography, climate and vegetation
Within the South Shetland Islands, Livingston Island is the second largest of ca. 10 more-or-less large islands. It is situated ca. 150 km west- northwest of the northernmost tip of the Antarc- tic Peninsula (Fig. 1). Except for Byers Peninsula (Fig. 2) most of the island is covered by glaciers, of which the Rotch Ice Dome borders the penin- sula in the east. Apart from the northwestern part of the peninsula, which reaches a maximum of 268 m above sea level, few areas reach higher than 100 m. Exceptions are a few volcanic plugs of which Chester Cone in the central part of the peninsula is the highest (193 m) and most prom- inent feature. The main part of the peninsula forms a ca. 40 km 2 large undissected, 85-100 m high, inland platform with an irregularly undulat- ing topography. On the platform margins is a 30-50 m platform gently sloping seaward. Fur- ther down follow the 11-17 m and the sea level platforms.
rd~w 80~ Elephant Island
] ~ o " / Island / n O
65 ~ S
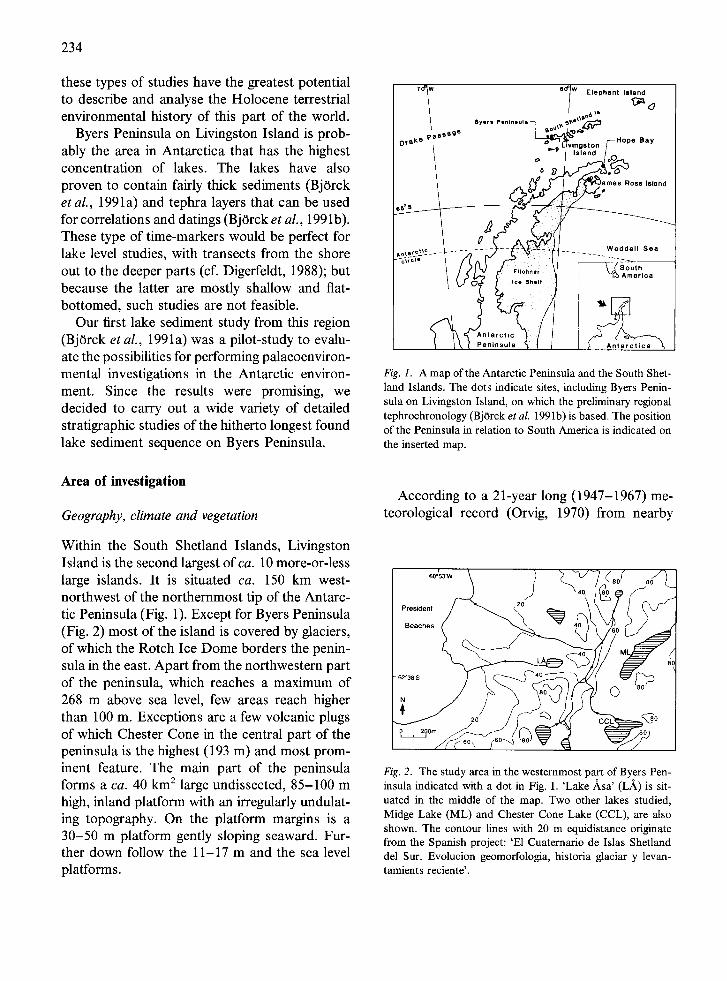
Fig. 1. A map of the Antarctic Peninsula and the South Shet- land Islands. The dots indicate sites, including Byers Penin- sula on Livingston Island, on which the preliminary regional tephrochronology (Bj6rck et aL 1991b) is based. The position of the Peninsula in relation to South America is indicated on the inserted map.
According to a 21-year long (1947-1967) me- teorological record (Orvig, 1970) from nearby
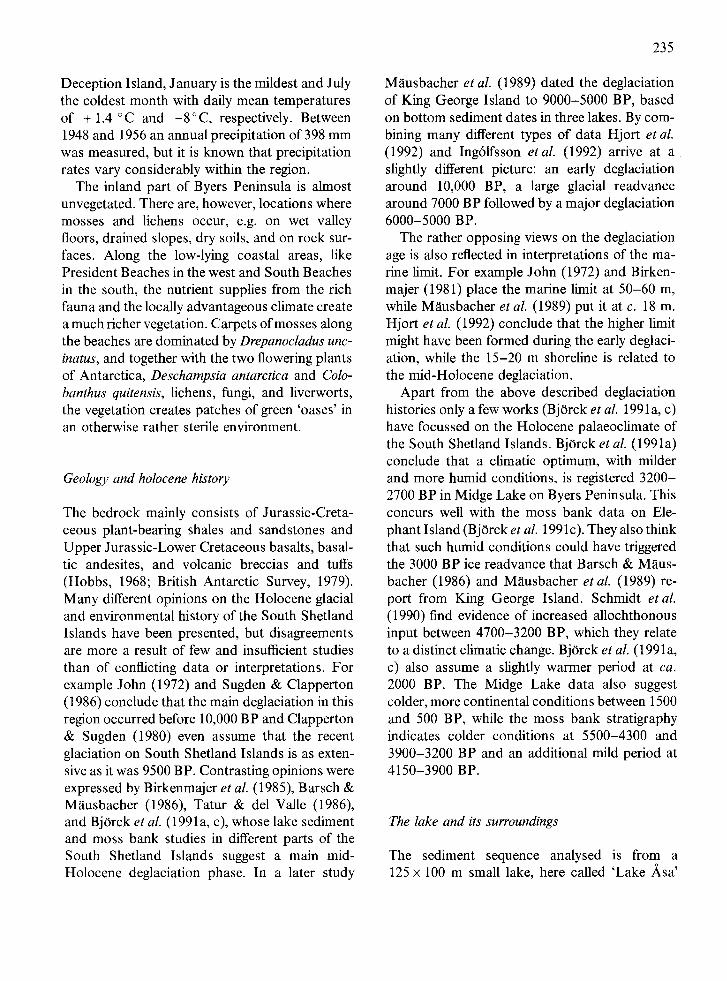
Fig. 2. The study area in the westernmost part of Byers Pen- insula indicated with a dot in Fig. 1. 'Lake Asa' (LA) is sit- uated in the middle of the map. Two other lakes studied, Midge Lake (ML) and Chester Cone Lake (CCL), are also shown. The contour lines with 20 m equidistance originate from the Spanish project: 'El Cuaternario de Islas Shetland del Sur. Evolucion geomorfologia, historia glaciar y levan- tamients reciente'.
Deception Island, January is the mildest and July the coldest month with daily mean temperatures of + 1.4 ~ and -8~ respectively. Between 1948 and 1956 an annual precipitation of 398 mm was measured, but it is known that precipitation rates vary considerably within the region.
The inland part of Byers Peninsula is almost unvegetated. There are, however, locations where mosses and lichens occur, e.g. on wet valley floors, drained slopes, dry soils, and on rock sur- faces. Along the low-lying coastal areas, like President Beaches in the west and South Beaches in the south, the nutrient supplies from the rich fauna and the locally advantageous climate create a much richer vegetation. Carpets of mosses along the beaches are dominated by Drepanocladus unc- inatus, and together with the two flowering plants of Antarctica, Deschampsia antarctica and Colo- banthus quitensis, lichens, fungi, and liverworts, the vegetation creates patches of green 'oases' in an otherwise rather sterile environment.
Geology and holocene history
The bedrock mainly consists of Jurassic-Creta- ceous plant-bearing shales and sandstones and Upper Jurassic-Lower Cretaceous basalts, basal- tic andesites, and volcanic breccias and tufts (Hobbs, 1968; British Antarctic Survey, 1979). Many different opinions on the Holocene glacial and environmental history of the South Shetland Islands have been presented, but disagreements are more a result of few and insufficient studies than of conflicting data or interpretations. For example John (1972) and Sugden & Clapperton (1986) conclude that the main deglaciation in this region occurred before 10,000 BP and Clapperton & Sugden (1980) even assume that the recent glaciation on South Shetland Islands is as exten- sive as it was 9500 BP. Contrasting opinions were expressed by Birkenmajer et al. (1985), Barsch & Mausbacher (1986), Tatur & del Valle (1986), and BjOrck et al. (1991a, c), whose lake sediment and moss bank studies in different parts of the South Shetland Islands suggest a main mid- Holocene deglaciation phase. In a later study
235
M~usbacher et al. (1989) dated the deglaciation of King George Island to 9000-5000 BP, based on bottom sediment dates in three lakes. By com- bining many different types of data Hjort et al. (1992) and Ingrlfsson etal . (1992) arrive at a slightly different picture: an early deglaciation around 10,000 BP, a large glacial readvance around 7000 BP followed by a major deglaciation 6000-5000 BP.
The rather opposing views on the deglaciation age is also reflected in interpretations of the ma- rine limit. For example John (1972) and Birken- majer (1981) place the marine limit at 50-60 m, while Mausbacher et al. (1989) put it at c. 18 m. Hjort et al. (1992) conclude that the higher limit might have been formed during the early deglaci- ation, while the 15-20 m shoreline is related to the mid-Holocene deglaciation.
Apart from the above described deglaciation histories only a few works (BjOrck et al. 1991a, c) have focussed on the Holocene palaeoclimate of the South Shetland Islands. BjOrck et al. (1991a) conclude that a climatic optimum, with milder and more humid conditions, is registered 3200- 2700 BP in Midge Lake on Byers Peninsula. This concurs well with the moss bank data on Ele- phant Island (BjOrck et al. 1991c). They also think that such humid conditions could have triggered the 3000 BP ice readvance that Barsch & Maus- bacher (1986) and Mausbacher et al. (1989) re- port from King George Island. Schmidt et al. (1990) find evidence of increased allochthonous input between 4700-3200 BP, which they relate to a distinct climatic change. BjOrck et al. (1991 a, c) also assume a slightly warmer period at ca. 2000 BP. The Midge Lake data also suggest colder, more continental conditions between 1500 and 500 BP, while the moss bank stratigraphy indicates colder conditions at 5500-4300 and 3900-3200 BP and an additional mild period at 4150-3900 BP.
The lake and its surroundings
The sediment sequence analysed is from a 125 x 100 m small lake, here called 'Lake ,~sa'
236
(62 ~ 37'43" S, 61 ~ 08'05" W), situated in the cen- tral, westernmost part of Byers Peninsula (Fig. 2). The lake is located 600-700 m inside the Presi- dent Beaches. The basin threshold was leveled to 35 m above sea level, which is well above the mid-Holocene marine limit. An outlet exists in the southwestern comer of this almost square lake, but no inlet. In summer the lake is fed by surface run-off from melting snow, precipitation and melting permafrost. The lake is bordered to the south by a c. 50 m high hill. The shore in the north and northeast mainly consists of basalt and is 10-20 m high. A rather gentle slope characterizes the area east of the lake, where probably the largest snow fields accumulate. In the west the
o
shore is not more than 5 m high. 'Lake Asa' is a shallow lake, between 0.8 and 1.0 m deep, but in spite of that the sediment sequence is more than 2 m thick. The lake is ice-covered at least 8-9 months of the year. Some data on the water chemistry was analysed with the following results (V. Jones: pers. comm.): pH = 7.6, Conductivi- ty = 105/~S/cm, Chl a = 0.6/~g/1, Phae = 0.2 #g/l, N O 3 = 7.0 ~g/1, T D N = 220.0 #g/l, CI = 17.8/~g/ 1, Si = 1223.0 ~tg/1, TP = 9.0 ~g/l, Na = 6.0 #g/l, Mg = 1.6 ~g/l, K = 0.2/~g/1, Ca = 2.0/zg/1.
Although richer than on the inland platform (where Midge Lake is situated), the vegetation around the lake is very sparse and consists only of scattered finds of mosses and lichens. The densest vegetation on the peninsula is, however, found in a near-by area, inside the President Beaches. The surface run-off from melting snow efficiently erodes soil and vegetation. Patches of aquatic mosses occur on the lake bottom.
Field work
The field work on 'Lake Asa' was carried out in March 1989. Apart from reconnaissance corings, two main sequences (with 0.5 m overlaps) were cored in the middle of the lake with chamber corers of the so-called Russian type, 1 m long with 5 and 10 cm diameter, respectively. The cor- ings were carried out from a rubber boat and in order to penetrate through the rather stiff sedi-
ments the corers had to be pounded down. The 10 cm cores were described in detail in the field. A complementary 12 cm long surface sediment core was sampled with a surface sampler for anal- ysis of recent radionuclides (especially 21~ and 137Cs), and of the microfossil content of the sur- face sediments. Soils and shore deposits were sampled around the lake.
Laboratory methods and the paleoclimatic impli- cations of some data types
Sampling, sediment descriptions and datings
Long core magnetic susceptibility was measured every 2 cm on the 5 cm cores. The sampling was also preceded by additional detailed lithologic de- scriptions of the cores. Because of the many te- phra layers, it was fairly easy to correlate between the two sequences.
41 samples for pollen analysis (incl. spores and Pediastrum), 36 samples for diatom analysis, 7 samples for tephra chemistry (Bj0rck etal., 1991b), and 11 levels for 14C datings were taken from the 10 cm cores, while 43 levels were sam- pled for analysis of sediment chemistry, grain size, organic carbon, and loss-on-ignition from the 5 cm cores. In addition, 25 levels from the 10 cm cores were sampled for moss analyses. The up- permost 6 cm of the surface sediment were sam- pied for radionuclides (especially 137Cs, 21~ and 238pu), and the 2.5 cm level for diatoms, pollen, spores, and Pediastrum. The surface sam- ples were, however, not regarded as reliable with respect to chemical analyses since they had oxi- dized in the plastic boxes.
The analyses for recent radionuclides were per- formed by radiation physicists in Lund. The sam- ples were dried and put in test-tubes and analysed with a well type Ge-detector for the determination of 21~ and 137Cs. The samples were then dis- solved, using HNO3/HF, and analysed for Pu and Am (Holm 1984). Po w~ts also analysed in order to verify the 21~ determinations made by gammaspectrometry.
The radiocarbon dating was carried out at the
Radiocarbon Dating Laboratory in Lund. All samples were pretreated with HCI and measured at least 2 • 1 day (in some cases 3 • 1 and 4 x 1 day). The datings of the NaOH-soluble fractions and the Lu-3134 dating were preceded by NaOH treatments.
The rate of sediment accumulation was esti- mated for 5 or 10 cm-thick intervals of the se- quence from the age/depth curve. Ash-layers were excluded in these calculations, since they most likely represent short episodes of exceptionally high deposition.
The sedimentation rates were used to calculate several parameters in terms of their annual accu- mulation. In this calculation the bulk density of the sediment was estimated from data on the water content by assuming the density of solids and water to be 2.65 and 1 g/cm 3, respectively. The sedimentation rate may be a good indication of what happened in, and especially around 'Lake Asa'. Periods of high sedimentation rates suggest intense soil erosion with high precipitation (humid/mild) and probably also increased thaw- ing with a thicker active layer.
Grain-size analysis
A Sedigraph 5000 ET particle analyzer (Mi- cromeritics) was used to determine the grain-size distribution of the samples. The samples were treated with H202 according to Jackson (1975) to remove organic matter and deflocculated in 0.5 7o sodium pyrophosphate by stirring and ultra- sonic treatment prior to analysis. Cumulative curves of the grain size distributions were recorded over the size range 60-2 ~tm. Particles > 63/zm, if present, were separated from the sam- ples by sieving before the sedimentation analysis. All results have been recalculated to bulk sam- ples.
The ratio between the clay and the sand/coarse silt percentages gives some information on energy conditions during transport and sedimentation. A high ratio suggests calm conditions, low precipi- tation with little inwash from the catchment, i.e. conditions likely prevailing during arid, cold pe- riods with short, ice-free summer seasons.
237
Organic matter and carbonates
The total carbon content was determined by stepped heating of the dried, homogenized sam- ple in oxygen in a Leco multiphase carbon ana- lyzer (Leco RC 412), which measures the CO2 and the H20 evolved by IR detection. Organic matter is the predominant source of carbon in the samples. However, stepped combustion of the samples up to 500 ~ to reduce the organic car- bon content, followed by recombustion, made it possible to detect that low amounts of CO2 evolved in the temperature range 600-850 ~ Combustion of acid treated samples confirmed that this carbon is derived from a carbonate phase.
Nitrogen was determined by the Kjeldahl- method.
The content of organic matter is reported as weight ~o C of the dry matter (105 ~ In addi- tion, organic carbon has also been tentatively ex- pressed in terms of its accumulation rate.
The accumulation of C may often be a good indicator of the organic production in the lake and, as such, more or less directly linked to cli- mate. Warmer conditions with longer ice-free summers increase the photosynthesis and thus the lake productivity. On the other hand, where the surrounding soils are the main source for the sediments, it may also be a direct function of the input of allochtonous organic matter into the lake. This is very likely in a lake like 'Lake Asa'.
The C/N ratio of organic matter changes dur- ing decomposition due to the preferential destruc- tion of proteins and amino acids (Berner, 1971). Sediments formed in lakes that are richly sup- plied with refractory, allochtonous organic com- pounds from the catchment tend to have higher C/N ratios than sediments formed mainly from autochtonous organic matter (Hansen, 1959). For the autochtonous organic matter, the major change in composition occurs during the resi- dence in oxygenated waters and surface sedi- ments, whereas changes are much less after burial (Berner, 1971; Pennington, 1978). Hence, low C/N ratios may indicate a predominantly autoch- tonous source of the organic matter and/or that
238
decomposition took place under more or less re- ducing conditions, possibly connected with long periods of ice-cover.
Chemical analyses
An analytical procedure of stepwise extraction was used to facilitate a separation of the allogenic and authigenic fractions of the sediment, as de- fined by Engstrom & Wright (1984). Samples were first treated with H202 to destroy organic matter, followed by extraction into 1 M hydroxylamine hydrochloride in 25 ~o acetic acid (Chester & Hughes, 1967; Engstrom et al., 1985). Each of the extracts were analysed for a suite of nine major (Si, AI, Fe, Ca, Mg, Na, K, Mn, P) and three minor elements (Zn, Sr, Cu) by plasma atomic emission spectrometry (ICP-AES ARL 3520).
'Amorphous' silica was extracted into 0.2 M NaOH at 100 ~ for exactly 20 minutes accord- ing to the procedure of Krausse et al. (1983), slightly modified. In addition to Si, Fe, A1 and P were determined in the extract by plasma atomic emission spectrometry.
With regard to the chemical parameters anal- ysed, there are good reasons to believe that (1) the amount of amorphous Si is directly related to input of tephra, (2) the Fe/Mn and the Mg/Ca ratios, determined in the HzO2-extract, are re- lated to the composition of a carbonate phase. The former ratio is connected to the redox- conditions in the sediment whereas (3)the Mg/Ca ratio of the carbonate, as well as the Si/AI ratio of the acid-soluble matter, is a result of other diagenetic processes. The palaeoenvironmental implications of the chemical variables will be dis- cussed in more detail below.
Mineralogic analysis
With chemical and other data on the sediment core available, four levels of the core were sam- pled for mineralogic analyses. The mineralogy of the < 2 #m fraction of the samples was deter- mined by X-ray diffraction analysis of 'oriented'
mounts prepared according to the filter membrane peel-off technique (Drever, 1973). In addition, randomly oriented powders were X-ray scanned over the region 58-65~ to differentiate be- tween di- and trioctahedral sub-groups of clay minerals. Diffractograms were recorded on a Philips diffractometer using the Ks-radiation of a fine-focus Cu-tube with a divergence slit of 1 ~ The X-ray generator was operated at 40 kV/20 mA and the scanning speed was 1 ~ 2|
Samples were first scanned air-dried. X-ray scanning was repeated after exposure of the mounts to ethylene glycol (EG) vapours in order to identify expandable clay minerals, such as smectites. Additional criteria for this characteri- sation have been achieved by X-ray scanning of potassium-saturated and of glycerol treated, Mg- saturated samples.
Two of the samples were also X-ray scanned before and after the extraction procedure to test the stability of the minerogenic matter towards the extractants used.
The mineralogic analyses were carried out to achieve a better understanding of the sediment chemistry.
Pollen and spore analyses
The pollen, spore and Pediastrum analyses were carried out on the 10 cm cores, and one addi- tional surface sample. 1 cm 3 samples were sam- pled and Lycopodium spores were added in order to estimate the concentration values. The sample preparations were in general the same as alterna- tive A in Berglund & Ralska-Jasiewiczowa (1987).
Very few pollen grains were found in the sam- ples (between 0 and 9 grains), and of the two pollen producing plants in the area, only grains of grasses, probably of Deschampsia antarctica, were found, while Colobanthus quitensis grains are missing, although the plant is found within 500 m from 'Lake Asa'. The other identified pollen types are Ulmaceae, Nothofagus and a group called 'Other pollen' which contains a few grains of Ephedera andiva, cf. Gentiana, Atriplex lampa
(Chenopodiaceae), cf. Mulinum, and Betulacea. We generally consider all of these 'exotic' grains as transported from long distances (cf. Kappen & Straka, 1988).
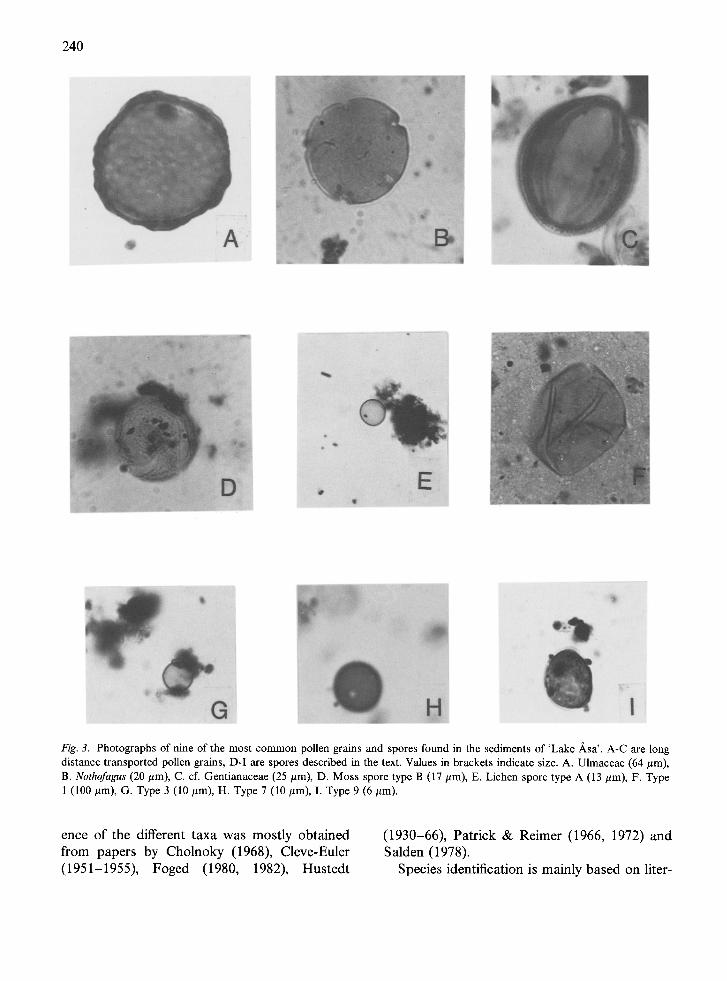
The amount of spores found varies between 24 and 1320. Most of the spores were difficult to identify. They have been photographed (Fig. 3), described and grouped as follows:
Moss spore A: Spheroidal spore, 22-32/~m in diameter. Inaperturate with microreticulate or granulate sculpturing.
Moss spore B: Spheroidal spore, 14-25/~m in diameter. Inaperturate with verrucate sculptur- ing. (Fig. 3D).
Lichen spore A (Usnea?): Spheroidal-oval spore, 10-30 /~m in diameter. Thin transparent wall without sculpturing. (Fig. 3E).
Lichen spore B (Alectoria nigricans?): Elipsoidal spore, 20-30 #rex 10-15 #m in size with one pore at both ends. The wall is thick, brown and smooth.
Type 1: Spheroidal spore, about 50/~m in di- ameter. Inaperturate, thin wall with smooth sur- face and often folded. (Fig. 3F).
Type 2: A general group of trilete spores. Type 3: Spheroidal spore, 10-15 /~m in dia-
meter. Thick and inaperturate wall with elements on the surface. (Fig. 3G).
Type 4: Clusters of small spheroidal spores with thin walls. Fungal spores?
Type 5: Fungal spore?, quadroangular, c. 15 #m x 15/~m in size. Thinner walls at two oppo- site sides.
Type 6: Elipsoidal spore, c. 13 #m x 10 /~m. Thick wall with very thin exine (< 1 #m) on the surface.
Type 7: Spheriodal spore, 10 #m in diameter. The wall is thick and brown with four porelike openings. (Fig. 3H).
Type 8: Hyalin spore with retuse angle and smooth surface.
Type 9: A small spheriodal spore, c. 6 ktm in diameter. Thin wall, slightly darker than type 6. (Fig. 3I).
Type I0: Spheriodal spore(?), c. 23 #m in di- ameter with a 5/~m wide band around. A porelike opening in the center.
239
Type 11: Other spores. The results from these analyses may be an im-
portant complement to reconstruct the develop- ment of the lake and its catchment. High influx values of lichen spores are interpreted as evidence of increased overland flow from the surroundings, probably caused by increased precipitation. In- creased influx of long distance transported pollen grains was most likely caused by an increased influence of milder and more humid air-masses. Peaks in influx of Deschampsia antarctica grains may correspond to milder periods with more fa- vorable growth conditions. High values of other spores (probably mainly from mosses, incl. aquatic mosses) possibly also indicate milder pe- riods. Such mild conditions also imply increased precipitation, erosion, and inwash of grains from the catchment. High influx values of Pediastrum kawraisky colonies indicate good light conditions (less suspended matter in the water), good nutri- ent supply, 1-2 months of ice-free conditions, and relatively mild water temperatures during the growing season (Torbj0rn Will,n; pers. comm.).
Diatom analyses
The preparation of the samples, taken at 5-10 cm intervals, was carried out according to H~,kans- son (1984). Naphrax was used as the mounting medium. 350-600 diatoms were counted in each sample (with the exception of the 0.90 m sample, where the ash-layer was dominant and only a few diatoms were found). Some diatoms are only present as single or scattered occurrence (less than 1-2~o) in various levels of the core and are therefore not used in the main diagram. Only 31 taxa are chosen as representatives in the main diagram. A complete species list is given as an Appendix, where those taxa considered aerophil- ous, eu-terrestrial or bryophytic are given with an asterisk (Beger, 1927; Bock, 1963; Brendem~hl, 1950; Foged, 1980; Hustedt, 1934, 1942; Krasske, 1932, 1938, 1939; Lund, 1945/46; Petersen, 1928, 1935; Round, 1957; Schwabe, 1970).
The pH grouping follows the system by Hu- stedt (1938-39). Information on the pH prefer-
240
Fig. 3. Photographs of nine of the most common pollen grains and spores found in the sediments of 'Lake Asa'. A-C are long distance transported pollen grains, D-I are spores described in the text. Values in brackets indicate size. A. Ulmaceae (64/~m), B. Nothofagus (20 #m), C. cf. Gentianaceae (25/~m), D. Moss spore type B (17/zm), E. Lichen spore type A (13/~m), F. Type 1 (100/~m), G. Type 3 (10 #m), H. Type 7 (10 #m), I. Type 9 (6 #m).
ence of the different taxa was mostly obtained from papers by Cholnoky (1968), Cleve-Euler (1951-1955), Foged (1980, 1982), Hustedt
(1930-66), Patrick & Reimer (1966, 1972) and Salden (1978).
Species identification is mainly based on liter-
241
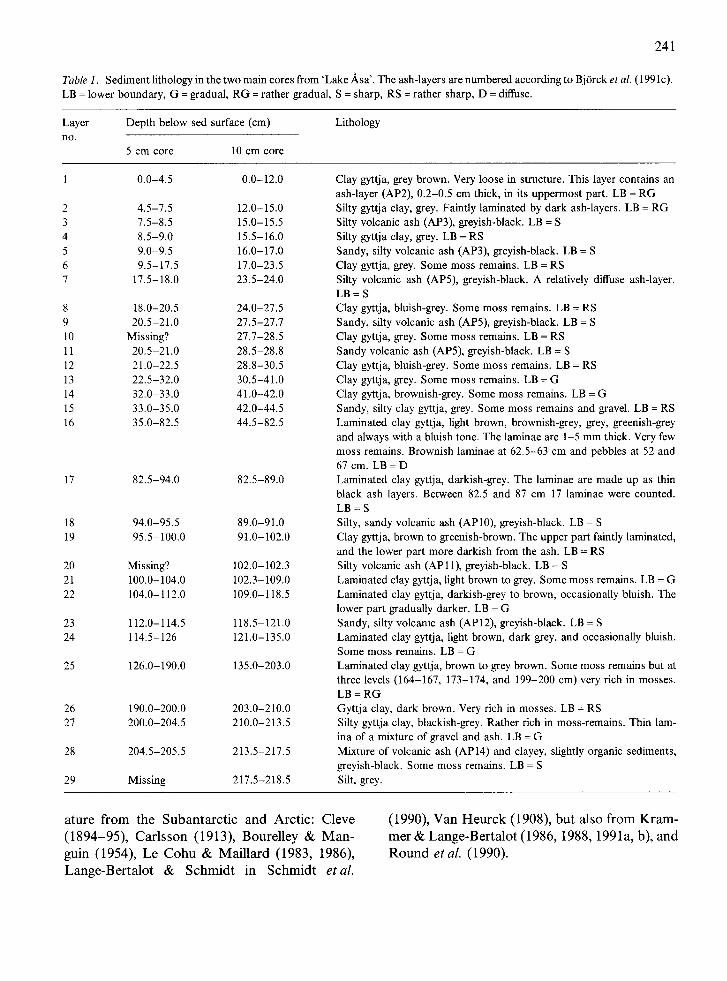
Table 1. Sediment lithology in the two main cores from 'Lake Asa'. The ash-layers are numbered according to BjOrck et aL (1991c). LB = lower boundary, G = gradual, RG = rather gradual, S = sharp, RS = rather sharp, D = diffuse.
Layer Depth below sed surface (cm) Lithology n o .
5 cm core 10 cm core
1 0.0-4.5 0.0-12.0
2 4.5-7.5 12.0-15.0 3 7.5-8.5 15.0-15.5 4 8.5-9.0 15.5-16.0 5 9.0-9.5 16.0-17.0 6 9.5-17.5 17.0-23.5 7 17.5-18.0 23.5-24.0
8 18.0-20.5 24.0-27.5 9 20.5-21.0 27.5-27.7 10 Missing? 27.7-28.5 11 20.5-21.0 28.5-28.8 12 21.0-22.5 28.8-30.5 13 22.5-32.0 30.5-41.0 14 32.0-33.0 41.0-42.0 15 33.0-35.0 42.0-44.5 16 35.0-82.5 44.5-82.5
17 82.5-94.0 82.5-89.0
18 94.0-95.5 89.0-91.0 19 95.5-100.0 91.0-102.0
20 Missing? 102.0-102.3 21 100.0-104.0 102.3-109.0 22 104.0-112.0 109.0-118.5
23 112.0-114.5 118.5-121.0 24 114.5-126 121.0-135.0
25 126.0-190.0 135.0-203.0
26 190.0-200.0 203.0-210.0 27 200.0-204.5 210.0-213.5
28 204.5-205.5 213.5-217.5
29 Missing 217.5-218.5
Clay gyttja, grey brown. Very loose in structure. This layer contains an ash-layer (AP2), 0.2-0.5 cm thick, in its uppermost part. LB = RG Silty gyttja clay, grey. Faintly laminated by dark ash-layers. LB = RG Silty volcanic ash (AP3), greyish-black. LB = S Silty gyttja clay, grey. LB = RS Sandy, silty volcanic ash (AP3), greyish-black. LB = S Clay gyttja, grey. Some moss remains. LB = RS Silty volcanic ash (AP5), greyish-black. A relatively diffuse ash-layer. LB = S
Clay gyttja, bluish-grey. Some moss remains. LB = RS Sandy, silty volcanic ash (AP5), greyish-black. LB = S Clay gyttja, grey. Some moss remains. LB = RS Sandy volcanic ash (AP5), greyish-black. LB = S Clay gyttja, bluish-grey. Some moss remains. LB = RS Clay gyttja, grey. Some moss remains. LB = G Clay gyttja, brownish-grey. Some moss remains. LB = G Sandy, silty clay gyttja, grey. Some moss remains and gravel. LB = RS Laminated clay gyttja, light brown, brownish-grey, grey, greenish-grey and always with a bluish tone. The laminae are 1-5 mm thick. Very few moss remains. Brownish laminae at 62.5-63 cm and pebbles at 52 and 67 cm. LB = D Laminated clay gyttja, darkish-grey. The laminae are made up as thin black ash layers. Between 82.5 and 87 cm 17 laminae were counted. LB = S Silty, sandy volcanic ash (AP10), greyish-black. LB = S Clay gyttja, brown to greenish-brown. The upper part faintly laminated, and the lower part more darkish from the ash. LB = RS Silty volcanic ash (AP11), greyish-black. LB = S Laminated clay gyttja, light brown to grey. Some moss remains. LB = G Laminated clay gyttja, darkish-grey to brown, occasionally bluish. The lower part gradually darker. LB = G Sandy, silty volcanic ash (AP12), greyish-black. LB = S Laminated clay gyttja, light brown, dark grey, and occasionally bluish. Some moss remains. LB = G Laminated clay gyttja, brown to grey brown. Some moss remains but at three levels (164-167, 173-174, and 199-200 cm) very rich in mosses. LB = RG Gyttja clay, dark brown. Very rich in mosses. LB = RS Silty gyttja clay, blackish-grey. Rather rich in moss-remains. Thin lam- ina of a mixture of gravel and ash. LB = G Mixture of volcanic ash (AP 14) and clayey, slightly organic sediments, greyish-black. Some moss remains. LB = S Silt, grey.
a t u r e f r o m t h e S u b a n t a r c t i c a n d A r c t i c : C l e v e
( 1 8 9 4 - 9 5 ) , C a r l s s o n ( 1 9 1 3 ) , B o u r e l l e y & M a n -
g u i n ( 1 9 5 4 ) , L e C o h u & M a i l l a r d ( 1 9 8 3 , 1986) ,
L a n g e - B e r t a l o t & S c h m i d t in S c h m i d t e t a l .
( 1 9 9 0 ) , V a n H e u r c k ( 1 9 0 8 ) , b u t a l s o f r o m K r a m -
m e r & L a n g e - B e r t a l o t ( 1 9 8 6 , 1988 , 1 9 9 1 a , b ) , a n d
R o u n d et al. ( 1 9 9 0 ) .
242
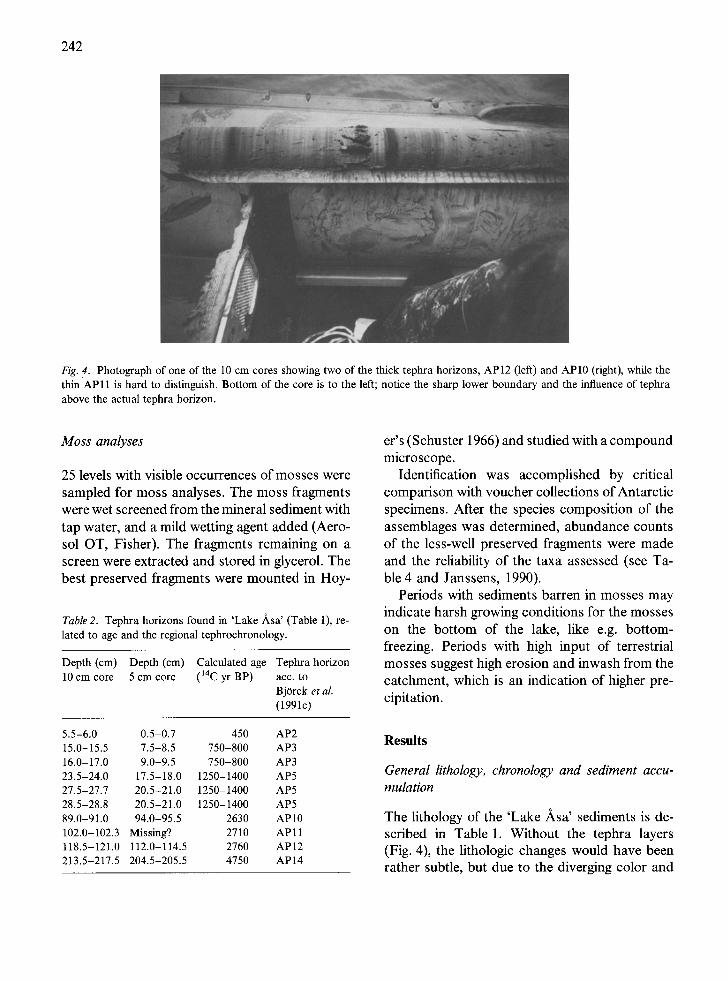
Fig. 4. Photograph of one of the 10 cm cores showing two of the thick tephra horizons, AP12 (left) and AP10 (right), while the thin AP11 is hard to distinguish. Bottom of the core is to the left; notice the sharp lower boundary and the influence of tephra above the actual tephra horizon.
Moss analyses
25 levels with visible occurrences of mosses were sampled for moss analyses. The moss fragments were wet screened from the mineral sediment with tap water, and a mild wetting agent added (Aero- sol OT, Fisher). The fragments remaining on a screen were extracted and stored in glycerol. The best preserved fragments were mounted in Hoy-
Table 2. Tephra horizons found in 'Lake/~sa ' (Table 1), re- lated to age and the regional tephrochronology.
Depth (cm) Depth (cm) Calculated age Tephra horizon 10 cm core 5 cm core (14C yr BP) acc. to
Bj0rck et al. (1991c)
5.5-6.0 0.5-0.7 450 AP2 15.0-15.5 7.5-8.5 750-800 AP3 16.0-17.0 9.0-9.5 750-800 AP3 23.5-24.0 17.5-18.0 1250-1400 AP5 27.5-27.7 20.5-21.0 1250-1400 AP5 28.5-28.8 20.5-21.0 1250-1400 AP5 89.0-91.0 94.0-95.5 2630 AP10 102.0-102.3 Missing? 2710 A P l l 118.5-121.0 112.0-114.5 2760 AP12 213.5-217.5 204.5-205.5 4750 AP14
er's (Schuster 1966) and studied with a compound microscope.
Identification was accomplished by critical comparison with voucher collections of Antarctic specimens. After the species composition of the assemblages was determined, abundance counts of the less-well preserved fragments were made and the reliability of the taxa assessed (see Ta- ble 4 and Janssens, 1990).
Periods with sediments barren in mosses may indicate harsh growing conditions for the mosses on the bottom of the lake, like e.g. bottom- freezing. Periods with high input of terrestrial mosses suggest high erosion and inwash from the catchment, which is an indication of higher pre- cipitation.
Results
General lithology, chronology and sediment accu- mulation
The lithology of the 'Lake Asa' sediments is de- scribed in Table 1. Without the tephra layers (Fig. 4), the lithologic changes would have been rather subtle, but due to the diverging color and
particle size of the tephras the volcanic ash ma- terial partly characterizes the sediments depos- ited even some time after the tephra fall-outs. Typically the lower boundary of a tephra is very distinct, while the upper boundary is gradual. In spite of the presence of mosses, the sediments are poor in organic matter. In fact the loss-on-ignition analyses give 3-4 times higher values than the or- ganic carbon analyses, which indicates a high con- tent of crystal water in the minerogenic matter.
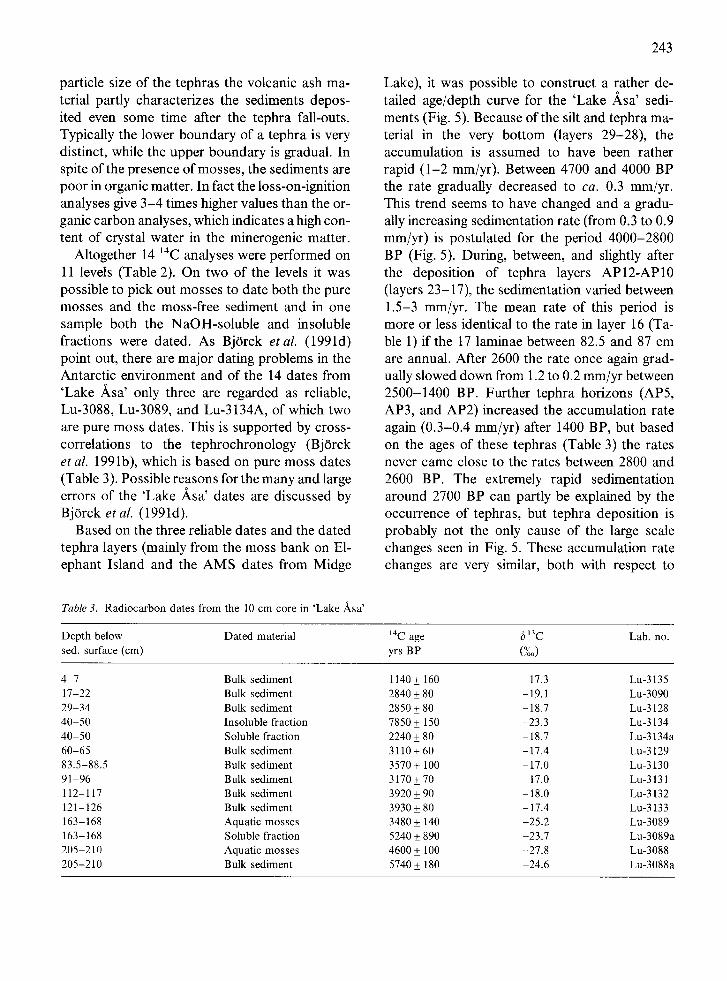
Altogether 14 14C analyses were performed on 11 levels (Table 2). On two of the levels it was possible to pick out mosses to date both the pure mosses and the moss-free sediment and in one sample both the NaOH-soluble and insoluble fractions were dated. As BjOrck e t a l . (1991d) point out, there are major dating problems in the Antarctic environment and of the 14 dates from 'Lake Asa' only three are regarded as reliable, Lu-3088, Lu-3089, and Lu-3134A, of which two are pure moss dates. This is supported by cross- correlations to the tephrochronology (BjOrck et al. 1991b), which is based on pure moss dates (Table 3). Possible reasons for the many and large errors of the 'Lake ~,sa' dates are discussed by Bj6rck et al. (1991d).
Based on the three reliable dates and the dated tephra layers (mainly from the moss bank on El- ephant Island and the AMS dates from Midge
243
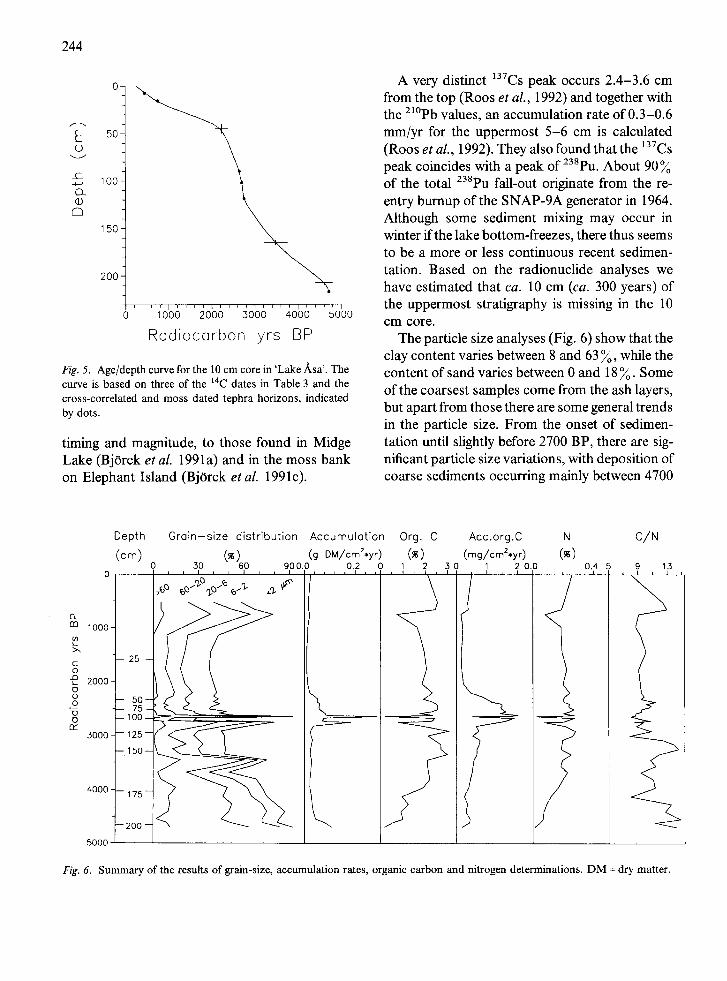
Lake), it was possible to construct a rather de- tailed age/depth curve for the 'Lake ,~sa' sedi- ments (Fig. 5). Because of the silt and tephra ma- terial in the very bottom (layers 29-28), the accumulation is assumed to have been rather rapid (1-2 mm/yr). Between 4700 and 4000 BP the rate gradually decreased to ca. 0.3 ram/yr. This trend seems to have changed and a gradu- ally increasing sedimentation rate (from 0.3 to 0.9 mm/yr) is postulated for the period 4000-2800 BP (Fig. 5). During, between, and slightly after the deposition of tephra layers AP12-AP10 (layers 23-17), the sedimentation varied between 1.5-3 mm/yr. The mean rate of this period is more or less identical to the rate in layer 16 (Ta- ble 1) if the 17 laminae between 82.5 and 87 cm are annual. After 2600 the rate once again grad- ually slowed down from 1.2 to 0.2 mm/yr between 2500-1400 BP. Further tephra horizons (AP5, AP3, and AP2) increased the accumulation rate again (0.3-0.4 mm/yr) after 1400 BP, but based on the ages of these tephras (Table 3) the rates never came close to the rates between 2800 and 2600 BP. The extremely rapid sedimentation around 2700 BP can partly be explained by the occurrence of tephras, but tephra deposition is probably not the only cause of the large scale changes seen in Fig. 5. These accumulation rate changes are very similar, both with respect to
Table 3. Radiocarbon dates from the 10 cm core in 'Lake Asa'
Depth below Dated material 14C age /~ 13C Lab. no.
sed. surface (cm) yrs BP (%0)
4-7 Bulk sediment 1140 + 160 -17.3 Lu-3135
17-22 Bulk sediment 2840 + 80 - 19.1 Lu-3090
29-34 Bulk sediment 2850 + 80 - 18.7 Lu-3128
40-50 Insoluble fraction 7850 + 150 -23.3 Lu-3134
40-50 Soluble fraction 2240 + 80 -18.7 Lu-3134a
60-65 Bulk sediment 3110 + 60 - 17.4 Lu-3129
83.5-88.5 Bulk sediment 3570 _+ 100 -17.0 Lu-3130
91-96 Bulk sediment 3170 +_ 70 -17.0 Lu-3131
112-117 Bulk sediment 3920 _+ 90 - 18.0 Lu-3132
121-126 Bulk sediment 3930 + 80 - 17.4 Lu-3133
163-168 Aquatic mosses 3480 + 140 -25.2 Lu-3089
163-168 Soluble fraction 5240 + 890 -23.7 Lu-3089a
205-210 Aquatic mosses 4600 + 100 -27.8 Lu-3088
205-210 Bulk sediment 5740 + 180 -24.6 Lu-3088a
O-
E (D
O_ �9
C]
50
100
1 50
200
' ' ' ' I , , i i I i , i , I , , i i I , , ~ , I
1000 2000 5000 4000 5000
Rodioccrbon yrs BP
244
Fig. 5. Age/depth curve for the 10 cm core in 'Lake ,~,sa ' . T h e
curve is based on three of the 14C dates in Table 3 and the cross-correlated and moss dated tephra horizons, indicated by dots.
timing and magnitude, to those found in Midge Lake (Bj0rck et al. 1991a) and in the moss bank on Elephant Island (Bjrrck et al. 1991c).
A very distinct 137Cs peak occurs 2.4-3.6 cm from the top (Roos et al., 1992) and together with the 21~ values, an accumulation rate of 0.3-0.6 mm/yr for the uppermost 5-6 cm is calculated (Roos et aL, 1992). They also found that the 137Cs peak coincides with a peak of 238pu. About 90 % of the total 238pu fall-out originate from the re- entry burnup of the SNAP-9A generator in 1964. Although some sediment mixing may occur in winter if the lake bottom-freezes, there thus seems to be a more or less continuous recent sedimen- tation. Based on the radionuclide analyses we have estimated that ca. 10 cm (ca. 300 years) of the uppermost stratigraphy is missing in the 10 cm core.
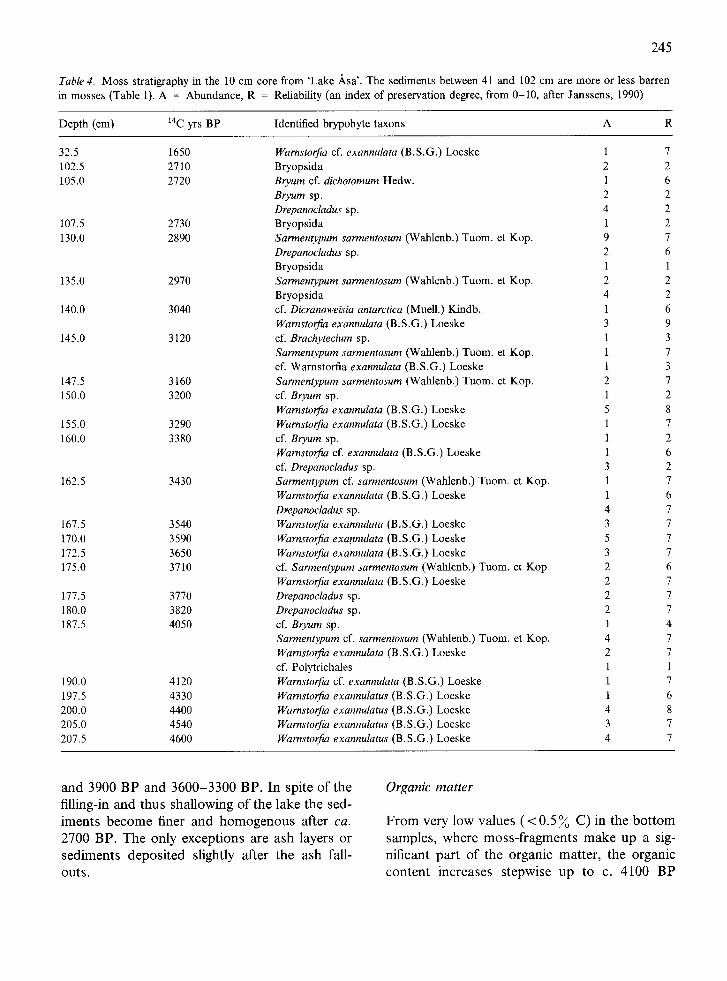
The particle size analyses (Fig. 6) show that the clay content varies between 8 and 63 %, while the content of sand varies between 0 and 18 %. Some of the coarsest samples come from the ash layers, but apart from those there are some general trends in the particle size. From the onset of sedimen- tation until slightly before 2700 BP, there are sig- nificant particle size variations, with deposition of coarse sediments occurring mainly between 4700
&
> ,
g
g 0
of
Depth
(cm)
o
1000-
2000-
Gro in -s ize distr ibut ion Accumulot ion Org. C
(~) (g DM/cm2*yr) (~) o 30 6o 9,oo.o o.? ] 2
i i I i i i i , i J , , , 1 i t ,
Acc.org.C N C/N
(mg/cm2*yr) (%) 3 0 1 2 0.0 0.4 5 9 13
3 0 0 0 -
4000-
5000
25
75 1 O0
1 2 5
150
175
200
Fig. 6. Summary of the results of grain-size, accumulation rates, organic carbon and nitrogen determinations. D M = dry matter.
245
Table 4. Moss stratigraphy in the 10 cm core from 'Lake Asa'. The sediments between 41 and 102 cm are more or less barren in mosses (Table 1). A = Abundance, R = Reliability (an index of preservation degree, from 0-10, after Janssens, 1990)
Depth (cm) 14C yrs BP Identified brypohyte taxons A R
32.5 1650 102.5 2710 105.0 2720
107.5 2730 130.0 2890
135.0 2970
140.0 3040
145.0 3120
147.5 3160 150.0 3200
155.0 3290 160.0 3380
162.5 3430
167.5 3540 170.0 3590 172.5 3650 175.0 3710
177.5 3770 180.0 3820 187.5 4050
190.0 4120 197.5 4330 200.0 4400 205.0 4540 207.5 4600
Warnstorfia cf. exannulata (B.S.G.) Loeske 1 7 Bryopsida 2 2 Bryum cf. dichotomum Hedw. 1 6 Bryum sp. 2 2 Drepanocladus sp. 4 2 Bryopsida 1 2 Sarmentypum sarmentosum (Wahlenb.) Tuom. et Kop. 9 7 Drepanocladus sp. 2 6 Bryopsida 1 1 Sarmentypum sarmentosum (Wahlenb.) Tuom. et Kop. 2 2 Bryopsida 4 2 cf. Dicranoweisia antarctica (Muell.) Kindb. 1 6 Warnstorfia exannulata (B.S.G.) Loeske 3 9 cf. Brachytecium sp. 1 3 Sarmentypum sarmentosum (Wahlenb.) Tuom. et Kop. 1 7 of. Warnstorfia exannulata (B.S.G.) Loeske 1 3 Sarmentypum sarmentosum (Wahlenb.) Tuom. et Kop. 2 7 cf. Bryum sp. 1 2 Warnstorfia exannulata (B.S.G.) Loeske 5 8 Warnstorfia exannulata (B.S.G.) Loeske 1 7 cf. Bryum sp. 1 2 Warnstorfia cf. exannulata (B.S.G.) Loeske 1 6 cf. Drepanocladus sp. 3 2 Sarmentypum cf. sarmentosum (Wahlenb.) Tuom. et Kop. 1 7 Warnstorfia exannulata (B. S.G.) Loeske 1 6 DFepanocladus sp. 4 7 Warnstorfia exannulata (B.S.G.) Loeske 3 7 Warnstorfia exannulata (B.S.G.) Loeske 5 7 Warnstorfia exannulata (B.S.G.) Loeske 3 7 cf. Sarmentypum sarmentosum (Wahlenb.) Tuom. et Kop 2 6 Warnstorfia exannulata (B.S.G.) Loeske 2 7 Drepanocladus sp. 2 7 Drepanocladus sp. 2 7 cf. Bryum sp. 1 4 Sarmentypum cf. sarmentosum (Wahlenb.) Tuom. et Kop. 4 7 Warnstorfia exannulata (B.S.G.) Loeske 2 7 cf. Polytrichales 1 1 Warnstorfia cf. exannulata (B.S.G.) Loeske 1 7 Warnstorfia exannulatus (B.S.G.) Loeske 1 6 Warnstorfia exannulatus (B.S.G.) Loeske 4 8 Warnstorfia exannulatus (B.S.G.) Loeske 3 7 Warnstorfia exannulatus (B. S.G.) Loeske 4 7
and 3900 BP and 3600-3300 BP. In spite of the filling-in and thus shallowing of the lake the sed- iments become finer and homogenous after ca.
2700 BP. The only exceptions are ash layers or sediments deposited slightly after the ash fall- outs.
Organic mat ter
From very low values (<0.5~/o C) in the bottom samples, where moss-fragments make up a sig- nificant part of the organic matter, the organic content increases stepwise up to c. 4100 BP
246
(Fig. 6). The C/N ratio of the organic matter is high in this lowermost interval of the sequence. Immediately after deglaciation, the erosional input from the catchment may have been a more important source of the organic matter than pro- duction in the lake, thus explaining the mature character of the organic matter in the bottom sediment.
Accompanying the upward fining trend, the or- ganic content rises markedly between 4100 and 3800 BP. Macroscopic remains of mosses still occur, but moss-fragments are no longer the main source of the organic matter in the sediment, which gradually alters into gyttja clay and clay gyttja. A lowering of the C/N ratio in this inter- val (Fig. 6) may reflect improved conditions for aquatic productivity and/or a lowered input by erosion, leading to changed proportions of the allochtonous/autochtonous components. It is also possible that decomposition was slowed down due to oxygen deficiency, which favored survival of juvenile and therefore highly reactive organic compounds in the sediment.
Most of the interval 3500-2800 BP consists of very fine-grained clay gyttja. The organic content reaches its maximum levels, c. 3 ~o, and the or- ganic matter is characterized by high C/N values (Fig. 6). Open water conditions would allow both improved replenishment of oxygen in the surface sediment and a high input of allochtonous mat- ter. However, the fact that the accumulation of minerogenic matter remains relatively low sug- gests that the latter factor may have been less important than the former.
The return of the C/N ratio to low values at ca.
3000 BP coincides with a drastic increase in sedi- ment accumulation, which led to rapid burial of the organic matter. Apart for minor fluctuations, the ratio remains low in the sediment formed dur- ing and shortly after the period of ash fall-outs, i.e. to ca. . 2500 BP, when the sediment accumu- lation rate was at a maximum. The tephra-layers, which probably accumulated at very high rates, are distinguished by very low organic content (Fig. 6), whereas the organic content for the rest, in spite of the ash influence, remains surprisingly high, 2-2.5 ~o C.
The time-span ca. 2500-800 BP is character- ized by low and uniform accumulation of very fine-grained matter, indicating a low erosional input to the lake. The organic content is still fairly high, c. 2~o, but the calculated input of organic matter is at a minimum during this period. The C/N ratio of the organic matter is low and rela- tively constant.
During the last 800 years, the accumulation of both organic and minerogenic matter appears to have increased slightly, but calculations of accu- mulation rates are probably uncertain for the up- permost, less compacted sediment. A higher ero- sional input for the period following the deposition of the 720 BP tephra layer is indicated by a coars- ening of the sediment grain-size, and is compat- ible also with the abrupt rise of the C/N ratio after this event.
M i n e r a l o g y
The interval 205-185 cm at the base of the sedi- ment sequence, corresponding to the time-span c. 4700-4200 BP, consists of a black sandy, clayey silt. The black colour of the sediment is due to a high, though upwards diminishing, mixture of, ap- parently redeposited, volcanic ash. Examination under a polarizing microscope of silt from this sediment showed that the majority of the grains consists of glass in various stages of alteration: from fairly angular grains of fresh, greenish-brown glass with few vesicles and with microlites of pla- gioclase over brownish, non-transparent, fairly rounded grains, with optically active or cryptoc- rystalline domains surrounding a nucleus of un- altered glass to completely altered, cryptocrystal- line grains. The different appearance of the grains might indicate that the tephra consists of more than one tephra generation.
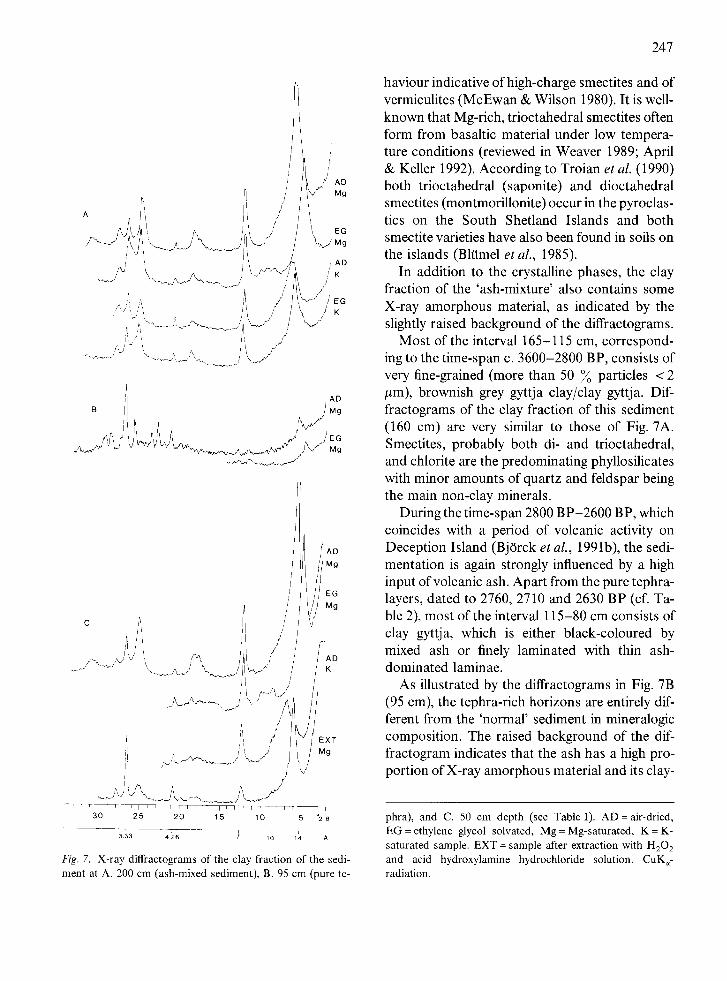
The mineralogic composition of the <2 #m fraction of this sediment is illustrated by the dif- fractograms in Fig. 7A. Smectite and chlorite are the predominating phyllosilicates with quartz and feldspar being the main non-clay minerals. A me- dium strong (060)-reflection at c. 1.54 A suggests that part of the smectite is of a trioctahedral type. Moreover, it is noteable that EG-solvation of the K-saturated clay fails to expand the phase, a be-
/ < / ~ / ' , /
/ , j ,
/ ,r
i I , A D
I M g
/ i / i ~ EG
/ 'Mg /
AD /'
/ E G /K
A D
/Mg
' E G
C / ~ /
/Ao , K
I E X T
M g
- ~ r i , i i i i i , I i I ~ T - I i i I ~ r r r i i i r i i i ~ 3 0 2 5 2 0 1 5 1 0 5 ~ e
Fig. 7. X-ray diffractograms of" the clay fraction of the sedi- ment at A. 200 cm (ash-mixed sediment), B. 95 cm (pure te-
247
haviour indicative of high-charge smectites and of vermiculites (McEwan & Wilson 1980). It is well- known that Mg-rich, trioctahedral smectites often form from basaltic material under low tempera- ture conditions (reviewed in Weaver 1989; April & Keller 1992). According to Troian et al. (1990) both trioctahedral (saponite) and dioctahedral smectites (montmorillonite) occur in the pyroclas- tics on the South Shetland Islands and both smectite varieties have also been found in soils on the islands (Blamel et al., 1985).
In addition to the crystalline phases, the clay fraction of the 'ash-mixture' also contains some X-ray amorphous material, as indicated by the slightly raised background of the diffractograms.
Most of the interval 165-115 cm, correspond- ing to the time-span c. 3600-2800 BP, consists of very fine-grained (more than 50 % particles < 2 /~m), brownish grey gyttja clay/clay gyttja. Dif- fractograms of the clay fraction of this sediment (160 cm) are very similar to those of Fig. 7A. Smectites, probably both di- and trioctahedral, and chlorite are the predominating phyllosilicates with minor amounts of quartz and feldspar being the main non-clay minerals.
During the time-span 2800 BP-2600 BP, which coincides with a period of volcanic activity on Deception Island (Bj0rck et al., 1991b), the sedi- mentation is again strongly influenced by a high input of volcanic ash. Apart from the pure tephra- layers, dated to 2760, 2710 and 2630 BP (cf. Ta- ble 2), most of the interval 115-80 cm consists of clay gyttja, which is either black-coloured by mixed ash or finely laminated with thin ash- dominated laminae.
As illustrated by the diffractograms in Fig. 7B (95 cm), the tephra-rich horizons are entirely dif- ferent from the 'normal' sediment in mineralogic composition. The raised background of the dif- fractogram indicates that the ash has a high pro- portion of X-ray amorphous material and its clay-
phra), and C. 50 cm depth (see Table 1). AD = air-dried, EG = ethylene glycol solvated, Mg = Mg-saturated, K = K- saturated sample. EXT = sample after extraction with H202 and acid hydroxylamine hydrochloride solution. CuK~- radiation.
248
mineral content is low. Interstratified minerals with a high proportion of smectitic layers are the main clay mineral and calcic plagioclase is the most abundant non-phyllosilicate. Also magne- tite has been detected, thus supporting the mag- netic measurements (Bj0rck et al., 1991b), which show that ferri-magnetic minerals occur in the ash.
The interval 75-20 cm is characterized by very fine-grained sediments, with clay-contents typi- cally exceeding 60%. Diffractograms of a sample from this interval (50 cm, Fig. 7C) is dominated by a very strong 14 A peak. An increase of the intensity ratio of the 14 (smectite + chlorite) and 7 A peaks (chlorite) by more than 50 % indicates that the proportion of smectite relative to chlorite is considerably higher than in previous samples.
Examination (XRD) of the samples collected in the catchment reveal that the source material of the soils originate not only from the local sand- stones, shales and basalts, but also to a large extent from the wind transported tephra material. It is noteable, however, that the clay mineral suite of the ash-mixed soil sample analysed is domi- nated by smectite, whereas chlorite is absent.
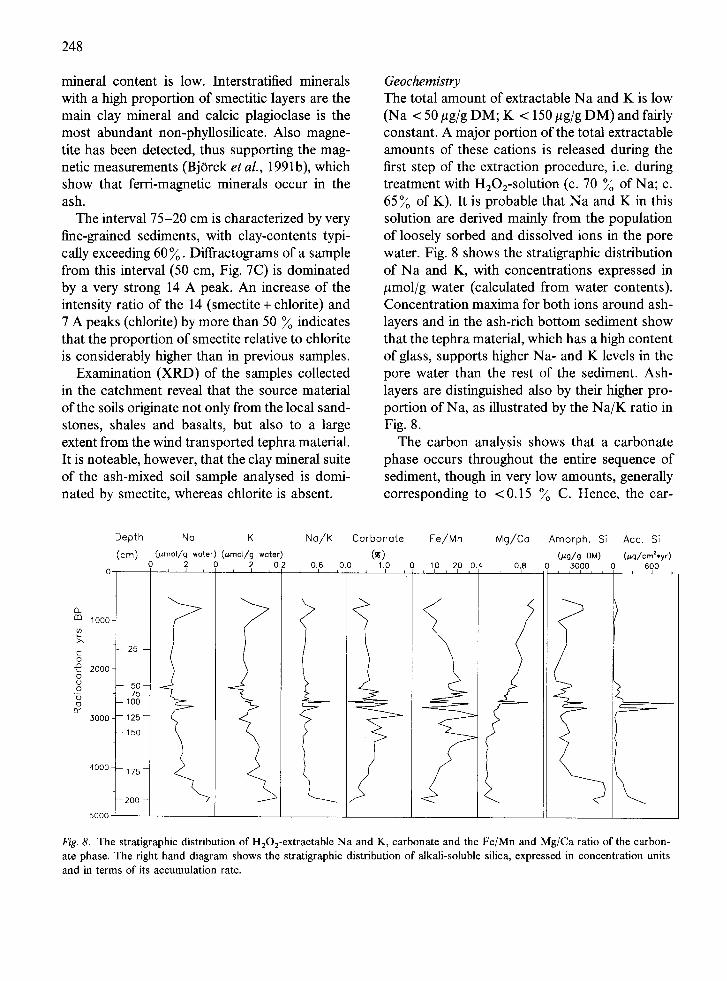
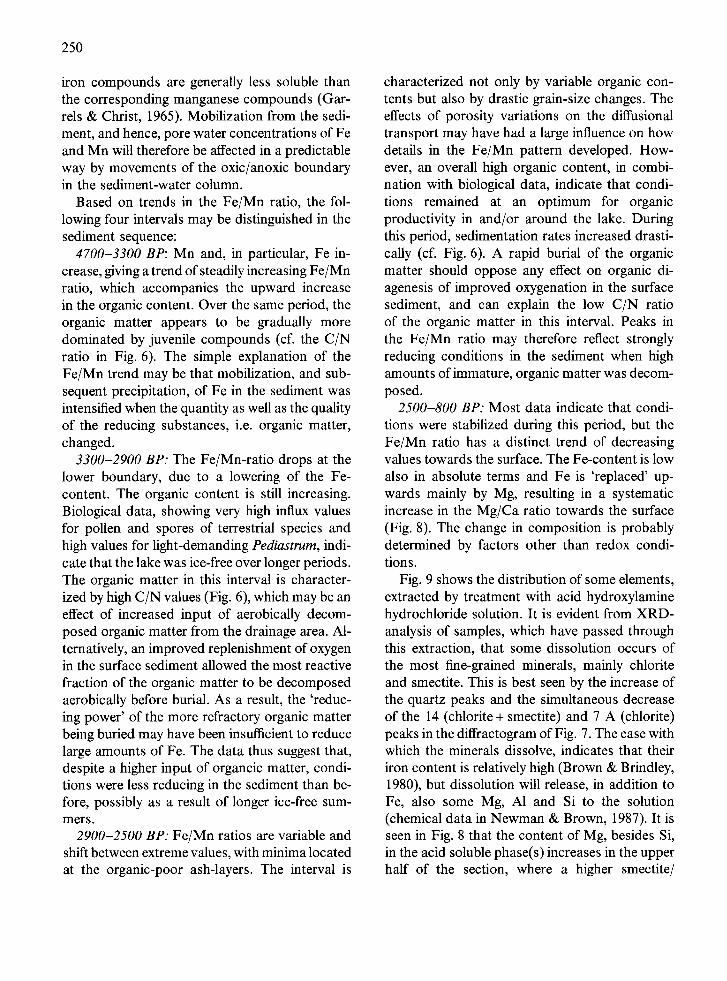
Geochemistry The total amount of extractable Na and K is low (Na < 50 #g/g DM; K < 150 #g/g DM) and fairly constant. A major portion of the total extractable amounts of these cations is released during the first step of the extraction procedure, i.e. during treatment with HaO2-solution (c. 70 % of Na; c. 65 % of K). It is probable that Na and K in this solution are derived mainly from the population of loosely sorbed and dissolved ions in the pore water. Fig. 8 shows the stratigraphic distribution of Na and K, with concentrations expressed in /~mol/g water (calculated from water contents). Concentration maxima for both ions around ash- layers and in the ash-rich bottom sediment show that the tephra material, which has a high content of glass, supports higher Na- and K levels in the pore water than the rest of the sediment. Ash- layers are distinguished also by their higher pro- portion of Na, as illustrated by the Na/K ratio in Fig. 8.
The carbon analysis shows that a carbonate phase occurs throughout the entire sequence of sediment, though in very low amounts, generally corresponding to <0.15 % C. Hence, the car-
Depth No K No/K ( c m ) (/~mol/g woter) (/~mol/g water)
, 2, , 0 , 2 , 0 . 2 , 0.,6
CL m 1000
2000
o
o C~
3000
4000
5000
Carbonate Fe/Mn Mg/Ca Amorph. Si Acc. Si (~) (,~g/g riM) (~g/cm~*yr)
?.0 , 1.0 0 ' 110 ' 210 0 .4 , 0.8 , ,501(30,, , 600
i .>
t Z==:===-----
\
Fig. 8. The stratigraphic distribution of HaO2-extractable Na and K, carbonate and the Fe/Mn and Mg/Ca ratio of the carbon- ate phase. The right hand diagram shows the stratigraphic distribution of alkali-soluble silica, expressed in concentration units and in terms of its accumulation rate.
bonate could be detected by XRD-analysis only in a fraction of the sediment, which had been enriched in heavy minerals. Solid solution is com- mon in carbonates, most frequent being those which involve replacement of Ca by Mg and/or Mn. Mn and Mg can replace Fe in ferrous car- bonates, whereas substitution by Ca is limited, and Fe- and Ca-carbonates are often reported to exist as separate phases (Suess, 1979; Curtis et al., 1986). Unit cell dimensions and d-spacings are generally linearly related to composition (Brown, 1980). For instance, mixed carbonates of Ca-Mn-Mg will give d(104)-spacings intermedi- ate between those of the end members calcite (3.03 A), magnesite (2.74 A) and rhodochrosite (2.84 A).
The carbonate in the Lake Asa sediment has a d(104)-spacing in the range 2.94-2.90 A. Upon heating of the samples, CO2 typically evolves in two steps within the temperature range 600- 850 ~ C, both possibly related to the decomposi- tion of carbonate. While being slowly dissolved in cold acid, the carbonate readily dissolves in warm hydrochloric acid and in the unbuffered, oxidiz- ing H202-solution. Allocation of Fe, Mn, Ca and Mg in this solution to the carbonate phase gives an average composition corresponding to that of an ankerite, (Cao.5o Mgo.31Feo.18Mno.01)CO3, i.e. a Ca-Mg-carbonate with a considerable substitu- tion of Mg by Fe. Most observations of ankerite are made in ancient, non-marine sediments, though it has been reported to form also in Ho- locene lake sediments (JOrstad etal . , 1982). It cannot be excluded, however, that the extracted Fe is derived from a separate Fe-carbonate, the amount of which would be too low to detect by the XRD-analysis. In addition, Sr and Zn may occur as trace constituents in the carbonate, as suggested by their strong correlations (r = 0.92- 0.95) to both Ca and Mn.
Ferrous carbonates form under reducing con- ditions in non-sulphidic sediments during an early stage of diagenesis related to the decomposition of organic matter. Once the dissolved oxygen is consumed, organic diagenesis in the absence of sulphate can proceed along a pathway, which in- volves production of methane and carbon diox-
249
ide. Other possible oxidants of organic matter are nitrate, Mn(III)-(IV) and Fe(III) minerals, which are being reduced in the sequence mentioned (Berner 1981).
Isolation of the Lake Asa basin from the at- mosphere due to ice-cover and bottom-freezing over long periods could easily explain that con- ditions developed in favor of this series of redox reactions already at shallow depth in the sedi- ment. Constricted exchange with the atmosphere led to rapid consumption of oxygen, and CO2, produced on decomposition of organic matter, could accumulate in the sediment in more than atmospheric amounts. The combined effect of all reactions is a net increase in alkalinity, which favors carbonate precipitation (e.g. BostrOm, 1967; Berner, 1971; Curtis etal . , 1986). More- over, the presence of volcanic glass in the sedi- ment is most likely a significant pH-controlling factor, maintaining pH at a high level.
Since the inorganic carbon content could not be determined for all samples, the carbonate con- tent (Fig. 8) has been estimated by allocation of Ca, Mg, Fe and Mn to a carbonate phase. The equivalence between the inorganic carbon con- tent and the molar sum of these cations is fairly good in those samples having both data sets available.
The carbonate content is positively correlated (r = 0.75) to the organic content, a fact which can be explained by the suggested model for carbon- ate precipitation. The presence of carbonate gen- erated during methanogenesis could also, in part, explain the high b13C-values of the bulk sediment (Table 2), since bicarbonate formed in connec- tion to this process tends to be enriched in heavy isotopes (Curtis et al., 1986).
Despite cation preferences and partitioning ef- fects during crystallization (Curtis etal . , 1986; Lumsden et al., 1989), the carbonate composition can be expected to have some relation to the pore water chemistry at the time of carbonate precip- itation. The relative proportions of cations of the carbonate are illustrated by the Fe/Mn and Mg/Ca ratios in Fig. 8.
Under naturally occurring pH-Eh conditions, Fe(II) is more easily oxidized than Mn(II) and
250
iron compounds are generally less soluble than the corresponding manganese compounds (Gar- rels & Christ, 1965). Mobilization from the sedi- ment, and hence, pore water concentrations of Fe and Mn will therefore be affected in a predictable way by movements of the oxic/anoxic boundary in the sediment-water column.
Based on trends in the Fe/Mn ratio, the fol- lowing four intervals may be distinguished in the sediment sequence:
4700-3300 BP: Mn and, in particular, Fe in- crease, giving a trend of steadily increasing Fe/Mn ratio, which accompanies the upward increase in the organic content. Over the same period, the organic matter appears to be gradually more dominated by juvenile compounds (cf. the C/N ratio in Fig. 6). The simple explanation of the Fe/Mn trend may be that mobilization, and sub- sequent precipitation, of Fe in the sediment was intensified when the quantity as well as the quality of the reducing substances, i.e. organic matter, changed.
3300-2900 BP: The Fe/Mn-ratio drops at the lower boundary, due to a lowering of the Fe- content. The organic content is still increasing. Biological data, showing very high influx values for pollen and spores of terrestrial species and high values for light-demanding Pediastrum, indi- cate that the lake was ice-free over longer periods. The organic matter in this interval is character- ized by high C/N values (Fig. 6), which may be an effect of increased input of aerobically decom- posed organic matter from the drainage area. Al- ternatively, an improved replenishment of oxygen in the surface sediment allowed the most reactive fraction of the organic matter to be decomposed aerobically before burial. As a result, the 'reduc- ing power' of the more refractory organic matter being buried may have been insufficient to reduce large amounts of Fe. The data thus suggest that, despite a higher input of organcic matter, condi- tions were less reducing in the sediment than be- fore, possibly as a result of longer ice-free sum- mers.
2900-2500 BP: Fe/Mn ratios are variable and shift between extreme values, with minima located at the organic-poor ash-layers. The interval is
characterized not only by variable organic con- tents but also by drastic grain-size changes. The effects of porosity variations on the diffusional transport may have had a large influence on how details in the Fe/Mn pattern developed. How- ever, an overall high organic content, in combi- nation with biological data, indicate that condi- tions remained at an optimum for organic productivity in and/or around the lake. During this period, sedimentation rates increased drasti- cally (cf. Fig. 6). A rapid burial of the organic matter should oppose any effect on organic di- agenesis of improved oxygenation in the surface sediment, and can explain the low C/N ratio of the organic matter in this interval. Peaks in the Fe/Mn ratio may therefore reflect strongly reducing conditions in the sediment when high amounts of immature, organic matter was decom- posed.
2500-800 BP: Most data indicate that condi- tions were stabilized during this period, but the Fe/Mn ratio has a distinct trend of decreasing values towards the surface. The Fe-content is low also in absolute terms and Fe is 'replaced' up- wards mainly by Mg, resulting in a systematic increase in the Mg/Ca ratio towards the surface (Fig. 8). The change in composition is probably determined by factors other than redox condi- tions.
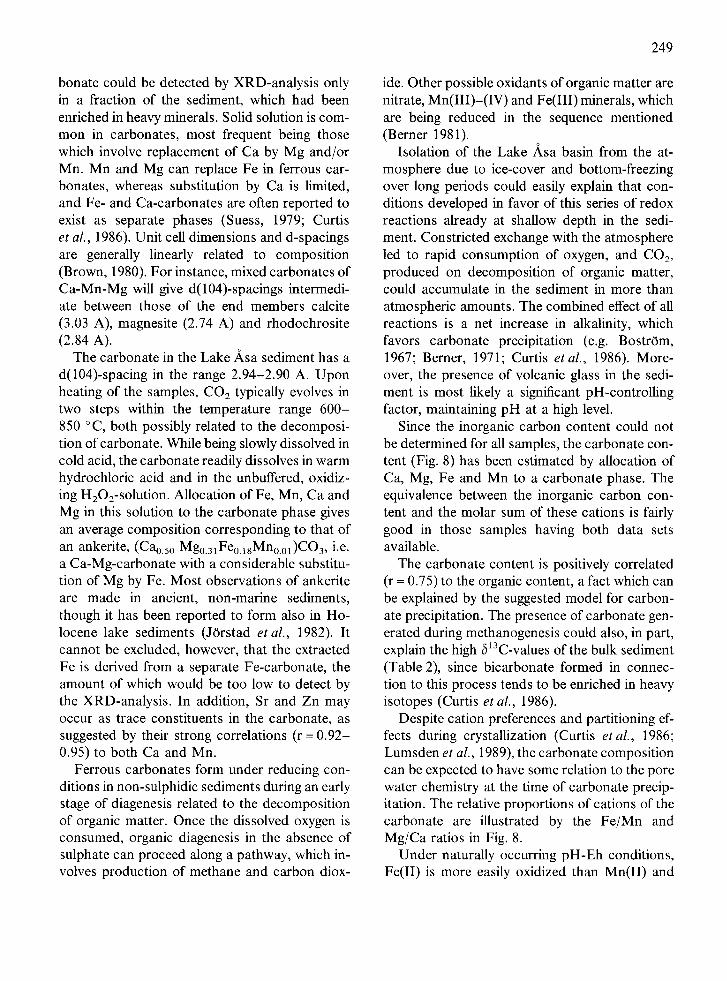
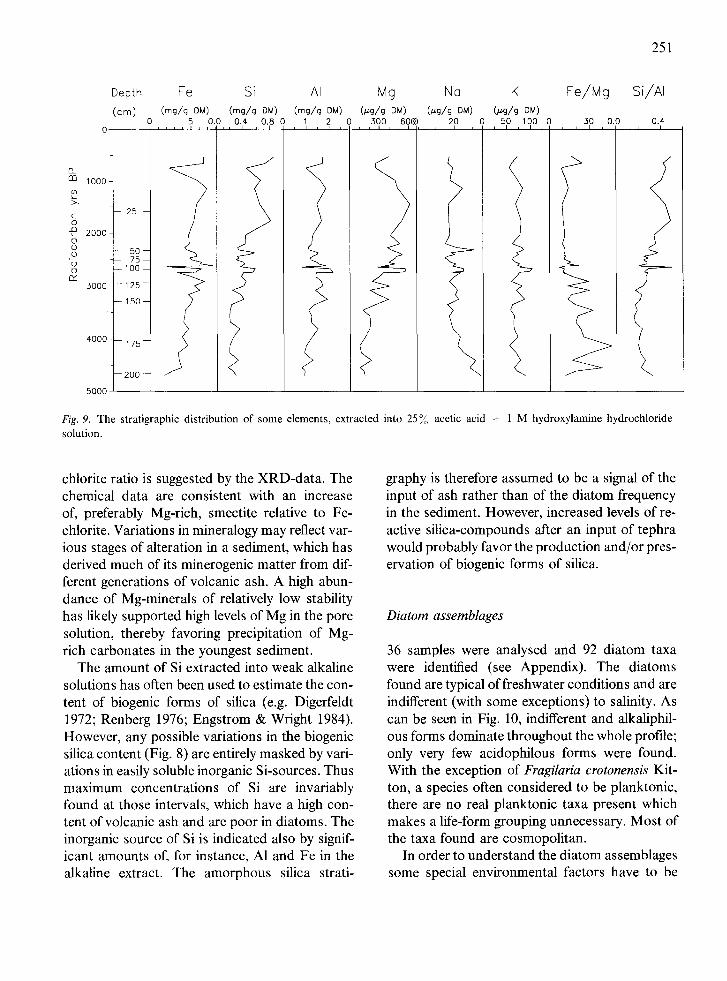
Fig. 9 shows the distribution of some elements, extracted by treatment with acid hydroxylamine hydrochloride solution. It is evident from XRD- analysis of samples, which have passed through this extraction, that some dissolution occurs of the most fine-grained minerals, mainly chlorite and smectite. This is best seen by the increase of the quartz peaks and the simultaneous decrease of the 14 (chlorite + smectite) and 7 A (chlorite) peaks in the diffractogram of Fig. 7. The ease with which the minerals dissolve, indicates that their iron content is relatively high (Brown & Brindley, 1980), but dissolution will release, in addition to Fe, also some Mg, A1 and Si to the solution (chemical data in Newman & Brown, 1987). It is seen in Fig. 8 that the content of Mg, besides Si, in the acid soluble phase(s) increases in the upper half of the section, where a higher smectite/
251
Depth
(cm)
[3_ m 1000-
g 2000-
0 o 0 )5 o
cF
5000
4000
5000
AI Mg No ( m g / g DM) ( ,u ,g /g DM) ( / , t ,g /g DM)
o 5 ,o.o,,o.,4 1 2 o poo, ,eo| 20 o i i i i i i I i i i I i I I
Fe Si ( m g / g DM) ( m g / g DM)
0.8 0
i Fig. 9. The stratigraphic distribution of some elements, extracted into 25% acetic acid solution.
K Fe/Mg S[/AI (,u,g / g DM)
i O,lOO i i OlO. I i
§ 1 M hydroxylamine hydrochloride
chlorite ratio is suggested by the XRD-data. The chemical data are consistent with an increase of, preferably Mg-rich, smectite relative to Fe- chlorite. Variations in mineralogy may reflect var- ious stages of alteration in a sediment, which has derived much of its minerogenic matter from dif- ferent generations of volcanic ash. A high abun- dance of Mg-minerals of relatively low stability has likely supported high levels of Mg in the pore solution, thereby favoring precipitation of Mg- rich carbonates in the youngest sediment.
The amount of Si extracted into weak alkaline solutions has often been used to estimate the con- tent of biogenic forms of silica (e.g. Digerfeldt 1972; Renberg 1976; Engstrom & Wright 1984). However, any possible variations in the biogenic silica content (Fig. 8) are entirely masked by vari- ations in easily soluble inorganic Si-sources. Thus maximum concentrations of Si are invariably found at those intervals, which have a high con- tent of volcanic ash and are poor in diatoms. The inorganic source of Si is indicated also by signif- icant amounts of, for instance, A1 and Fe in the alkaline extract. The amorphous silica strati-
graphy is therefore assumed to be a signal of the input of ash rather than of the diatom frequency in the sediment. However, increased levels of re- active silica-compounds after an input of tephra would probably favor the production and/or pres- ervation of biogenic forms of silica.
Diatom assemblages
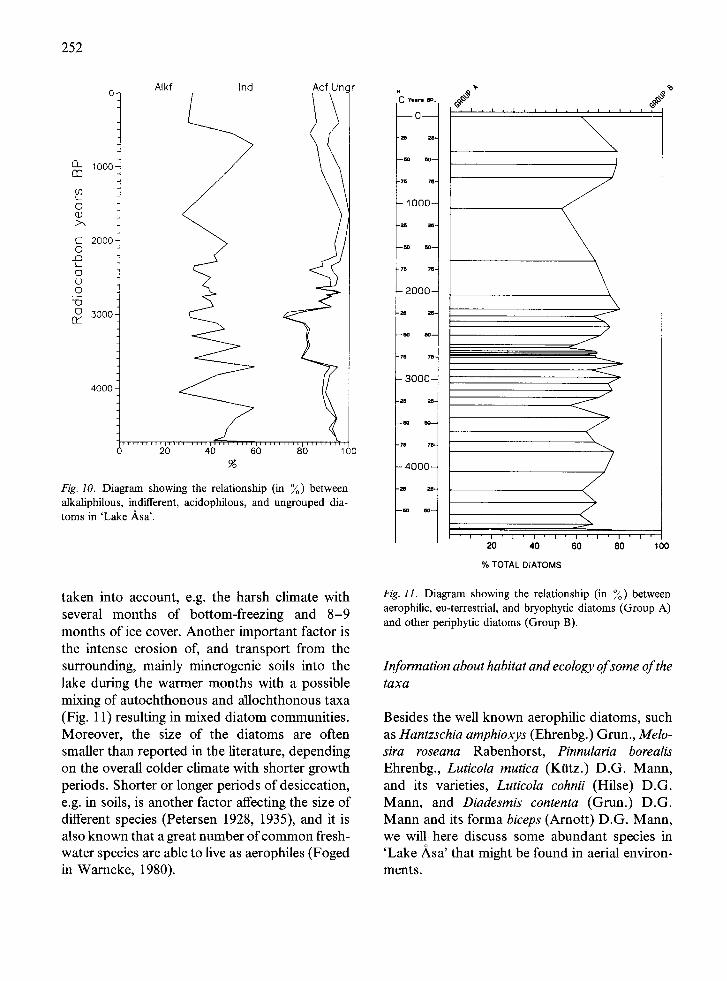
36 samples were analysed and 92 diatom taxa were identified (see Appendix). The diatoms found are typical of freshwater conditions and are indifferent (with some exceptions) to salinity. As can be seen in Fig. 10, indifferent and alkaliphil- ous forms dominate throughout the whole profile; only very few acidophilous forms were found. With the exception of Fragilaria crotonensis Kit- ton, a species often considered to be planktonic, there are no real planktonic taxa present which makes a life-form grouping unnecessary. Most of the taxa found are cosmopolitan.
In order to understand the diatom assemblages some special environmental factors have to be
252
O-
fq 1000 m
L
o |
E 2OO0 �9 cb L
.Q
50002
4000
A lk f Ind Ac f Un( r
I
/
~ i i [11 i i i i , , i r , , i , , , , 1 , , 1 , 1 1 i i , l l i , 1 , ~ i ~ 1 O 20 40 60 80 1 O0
Fig. 10. Diagram showing the relationship (in %) between alkaliphilous, indifferent, acidophilous, and ungrouped dia- toms in 'Lake Asa'.
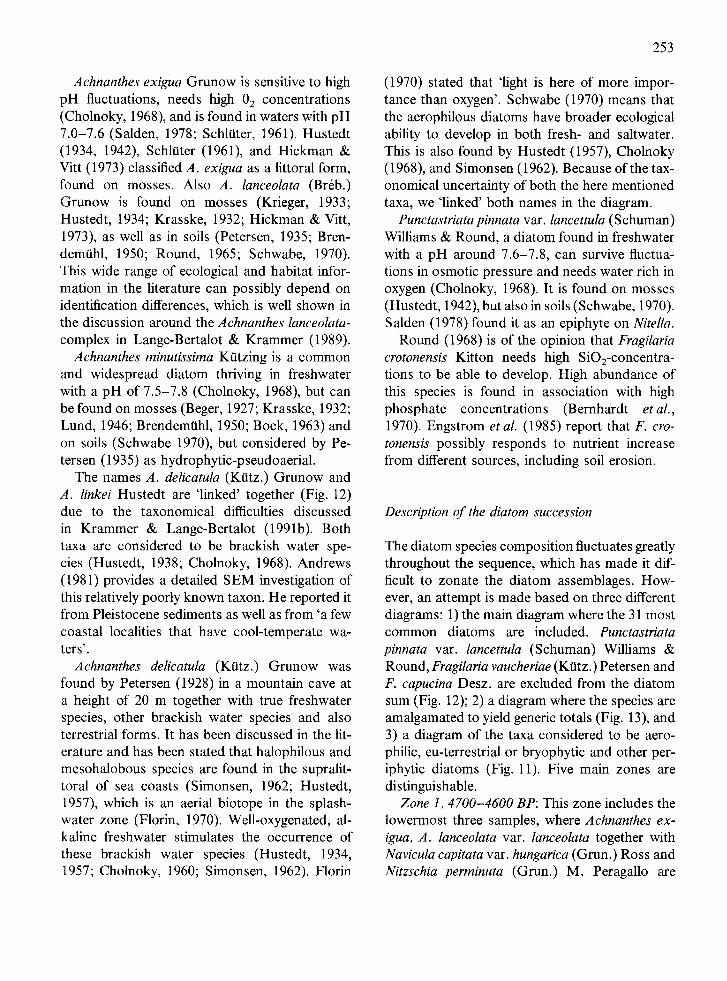
taken into account, e.g. the harsh climate with several months of bottom-freezing and 8-9 months of ice cover. Another important factor is the intense erosion of, and transport from the surrounding, mainly minerogenic soils into the lake during the warmer months with a possible mixing of autochthonous and allochthonous taxa (Fig. 11) resulting in mixed diatom communities. Moreover, the size of the diatoms are often smaller than reported in the literature, depending on the overall colder climate with shorter growth periods. Shorter or longer periods of desiccation, e.g. in soils, is another factor affecting the size of different species (Petersen 1928, 1935), and it is also known that a great number of common fresh- water species are able to live as aerophiles (Foged in Warncke, 1980).
C Ye l ro rip.
- - 0 - -
- ~ ?Js-
- 8o 60 -
-75 715-
- 1000 -
- ~ 25-
- 60 ne- -
- ~ 76-
- 2 0 0 0 -
�9 75 78~4
- 3000~
I
:oooj -ao 8o t
/ / , I l , l , l , t , l L I l [ i
\
)
/
/
I 2[0 ' l ' ' I ' ' I ' ' [ ' ,0 & 8'0 100 % TOTAL DIATOMS
Fig. 11. Diagram showing the relationship (in %) between aerophilic, eu-terrestrial, and bryophytic diatoms (Group A) and other periphytic diatoms (Group B).
Information about habitat and ecology of some of the taxa
Besides the well known aerophilic diatoms, such as Hantzschia amphioxys (Ehrenbg.) Grun., Melo- sira roseana Rabenhorst, Pinnularia borealis Ehrenbg., Luticola mutica (K~ltz.) D.G. Mann, and its varieties, Luticola cohnii (Hilse) D.G. Mann, and Diadesmis contenta (Grun.) D.G. Mann and its forma biceps (Arnott) D.G. Mann, we will here discuss some abundant species in 'Lake ,~sa' that might be found in aerial environ- ments.
Achnanthes exigua Grunow is sensitive to high pH fluctuations, needs high 0 2 concentrations (Cholnoky, 1968), and is found in waters with pH 7.0-7.6 (Salden, 1978; Schlater, 1961). Hustedt (1934, 1942), SchltRer (1961), and Hickman & Vitt (1973) classified A. exigua as a littoral form, found on mosses. Also A. lanceolata (Br6b.) Grunow is found on mosses (Krieger, 1933; Hustedt, 1934; Krasske, 1932; Hickman & Vitt, 1973), as well as in soils (Petersen, 1935; Bren- dem/ihl, 1950; Round, 1965; Schwabe, 1970). This wide range of ecological and habitat infor- mation in the literature can possibly depend on identification differences, which is well shown in the discussion around the Achnanthes lanceolata- complex in Lange-Bertalot & Krammer (1989).
Achnanthes minutissima K/itzing is a common and widespread diatom thriving in freshwater with a pH of 7.5-7.8 (Cholnoky, 1968), but can be found on mosses (Beger, 1927; Krasske, 1932; Lund, 1946; Brendemtihl, 1950; Bock, 1963) and on soils (Schwabe 1970), but considered by Pe- tersen (1935) as hydrophytic-pseudoaerial.
The names A. delieatula (KOtz.) Grunow and A. linkei Hustedt are 'linked' together (Fig. 12) due to the taxonomical difficulties discussed in Krammer & Lange-Bertalot (1991b). Both taxa are considered to be brackish water spe- cies (Hustedt, 1938; Cholnoky, 1968). Andrews (1981) provides a detailed SEM investigation of this relatively poorly known taxon. He reported it from Pleistocene sediments as well as from 'a few coastal localities that have cool-temperate wa- ters'.
Achnanthes delicatula (Katz.) Grunow was found by Petersen (1928) in a mountain cave at a height of 20 m together with true freshwater species, other brackish water species and also terrestrial forms. It has been discussed in the lit- erature and has been stated that halophilous and mesohalobous species are found in the supralit- toral of sea coasts (Simonsen, 1962; Hustedt, 1957), which is an aerial biotope in the splash- water zone (Florin, 1970). Well-oxygenated, al- kaline freshwater stimulates the occurrence of these brackish water species (Hustedt, 1934, 1957; Cholnoky, 1960; Simonsen, 1962). Florin
253
(1970) stated that 'light is here of more impor- tance than oxygen'. Schwabe (1970) means that the aerophilous diatoms have broader ecological ability to develop in both fresh- and saltwater. This is also found by Hustedt (1957), Cholnoky (1968), and Simonsen (1962). Because of the tax- onomical uncertainty of both the here mentioned taxa, we 'linked' both names in the diagram.
Punetastriata pinnata var. lancettula (Schuman) Williams & Round, a diatom found in freshwater with a pH around 7.6-7.8, can survive fluctua- tions in osmotic pressure and needs water rich in oxygen (Cholnoky, 1968). It is found on mosses (Hustedt, 1942), but also in soils (Schwabe, 1970). Salden (1978) found it as an epiphyte on Nitella.
Round (1968) is of the opinion that Fragilaria crotonensis Kitton needs high SiO2-concentra- tions to be able to develop. High abundance of this species is found in association with high phosphate concentrations (Bernhardt etal., 1970). Engstrom et al. (1985) report that F. cro- tonensis possibly responds to nutrient increase from different sources, including soil erosion.
Description of the diatom succession
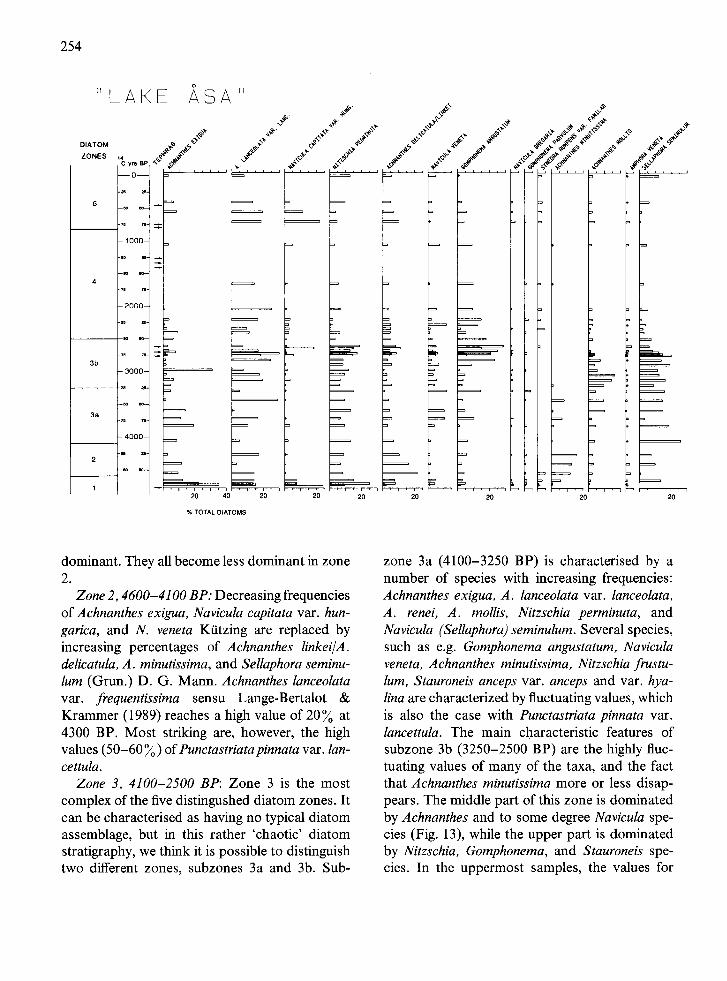
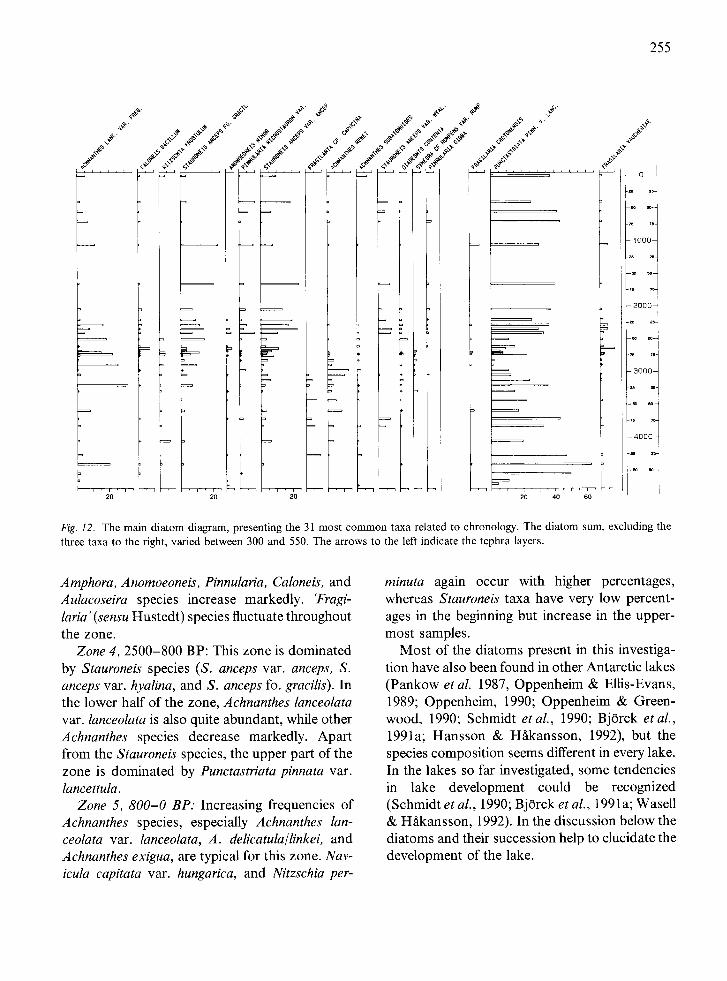
The diatom species composition fluctuates greatly throughout the sequence, which has made it dif- ficult to zonate the diatom assemblages. How- ever, an attempt is made based on three different diagrams: 1) the main diagram where the 31 most common diatoms are included. Punctastriata pinnata var. lancettula (Schuman) Williams & Round, Fragilaria vaucheriae (Ktltz.) Petersen and F. capucina Desz. are excluded from the diatom sum (Fig. 12); 2) a diagram where the species are amalgamated to yield generic totals (Fig. 13), and 3) a diagram of the taxa considered to be aero- philic, eu-terrestrial or bryophytic and other per- iphytic diatoms (Fig. 11). Five main zones are distinguishable.
Zone I, 4700-4600 BP: This zone includes the lowermost three samples, where Achnanthes ex- igua, A. lanceolata var. lanceolata together with Navicula capitata var. hungarica (Grun.) Ross and Nitzschia perminuta (Grun.) M. PeragaUo are
254
" L A K E
D I A T O M
Z O N E S ~4 C yrs BP
- - O - -
=n =~.
5
- I 0 0 0 -
4
- 2 0 0 0 -
3 b
- 3000-
3a
- 4 0 0 0 -
,SA "
--r_
?
=
2 0
= =
, =
=
4 0 2 0 2 0
e / / L , L , i , , i , , i , i , i ~ ~ ~ , i , i , i , i
= = = =
= = = = = ~ = = , = =
% T O T A L D I A T O M S
~ = ~ _ ~ . . ~ r
~ , , : , ~ = , ~ . , �9 ~ , . , , ~ ~ ~ , :
2 0 2 0 2 0 2 0
/ , i , i , i
=
i , i
2 O
dominant. They all become less dominant in zone 2.
Zone 2, 4600-4100 BP: Decreasing frequencies of Achnanthes exigua, Navicula capitata var. hun- garica, and N. veneta KOtzing are replaced by increasing percentages of Achnanthes linkei/A. delicatula, A. minutissima, and Sellaphora seminu- lure (Grun.) D. G. Mann. Achnanthes lanceolata var. frequentissima sensu Lange-Bertalot & Krammer (1989) reaches a high value of 20~o at 4300 BP. Most striking are, however, the high values (50-60 ~o) of Punctastriata pinnata var. lan- cettula.
Zone 3, 4100-2500 BP: Zone 3 is the most complex of the five distingushed diatom zones. It can be characterised as having no typical diatom assemblage, but in this rather 'chaotic' diatom stratigraphy, we think it is possible to distinguish two different zones, subzones 3a and 3b. Sub-
zone 3a (4100-3250 BP) is characterised by a number of species with increasing frequencies: Achnanthes exigua, A. lanceolata var. lanceolata, A. renei, A. mollis, Nitzschia perminuta, and Navicula (Sellaphora) seminulum. Several species, such as e.g. Gomphonema angustatum, Navicula veneta, Achnanthes minutissima, Nitzschia frustu- lum, Stauroneis anceps var. anceps and var. hya- lina are characterized by fluctuating values, which is also the case with Punctastriata pinnata var. lancettula. The main characteristic features of subzone 3b (3250-2500 BP) are the highly fluc- tuating values of many of the taxa, and the fact that Achnanthes minutissima more or less disap- pears. The middle part of this zone is dominated by Achnanthes and to some degree Navicula spe- cies (Fig. 13), while the upper part is dominated by Nitzschia, Gomphonema, and Stauroneis spe- cies. In the uppermost samples, the values for
255
/
I
' ' ' 2'o ' ' '
t
<,+,.<,~" . + ' + ~ ~>,'- .
i >, ,<~ + ,: + @ <>r
" #"<> ~ " ' + " >~ t " ! z / I
=
L , =
,
2 O
)
)
r .@-
e p*
=
I
.v
+
20 20 40 60
_i
Fig. 12. The main diatom diagram, presenting the 31 most common taxa related to chronology. The diatom sum, excluding the three taxa to the right, varied between 300 and 550. The arrows to the left indicate the tephra layers.
Amphora, Anomoeoneis, Pinnularia, Caloneis, and Aulacoseira species increase markedly. 'Fragi- laria" (sensu Hustedt) species fluctuate throughout the zone.
Zone 4, 2500-800 BP: This zone is dominated by Stauroneis species (S. anceps var. anceps, S. anceps var. hyalina, and S. anceps fo. gracilis). In the lower half of the zone, Achnanthes lanceolata var. lanceolata is also quite abundant, while other Achnanthes species decrease markedly. Apart from the Stauroneis species, the upper part of the zone is dominated by Punctastriata pinnata var. lancettula.
Zone 5, 800-0 BP: Increasing frequencies of Achnanthes species, especially Achnanthes lan- ceolata var. lanceolata, A. delicatula/linkei, and Achnanthes exigua, are typical for this zone. Nav- icula capitata var. hungarica, and Nitzschia per-
minuta again occur with higher percentages, whereas Stauroneis taxa have very low percent- ages in the beginning but increase in the upper- most samples.
Most of the diatoms present in this investiga- tion have also been found in other Antarctic lakes (Pankow et al. 1987, Oppenheim & Ellis-Evans, 1989; Oppenheim, 1990; Oppenheim & Green- wood, 1990; Schmidt et al., 1990; Bj0rck et al., 1991a; Hansson & HSkansson, 1992), but the species composition seems different in every lake. In the lakes so far investigated, some tendencies in lake development could be recognized (Schmidt et al., 1990; Bj0rck et al., 1991a; Wasell & H~kansson, 1992). In the discussion below the diatoms and their succession help to elucidate the development of the lake.
256
"LA E AsA"
C vo~J p .
- - O - -
,B , n -
- 1 0 0 0 - -
- 2 0 0 0 -
~5 75-
- 3 0 0 0 -
76 75-
- 4 0 0 0 -
/ / , , , , , , . . . . . . . . . . ~ . . . . . . r~ ~ , _ , ~ , _ , _ , ~ v ~
=
' ' ' ~ o ' , b . . . . 2 ' 0 ' 2 0 , I
2 0
% TOTAL D IATOMS
3
I
1
, =
= �9
=
20 2 0 4 0 6 0
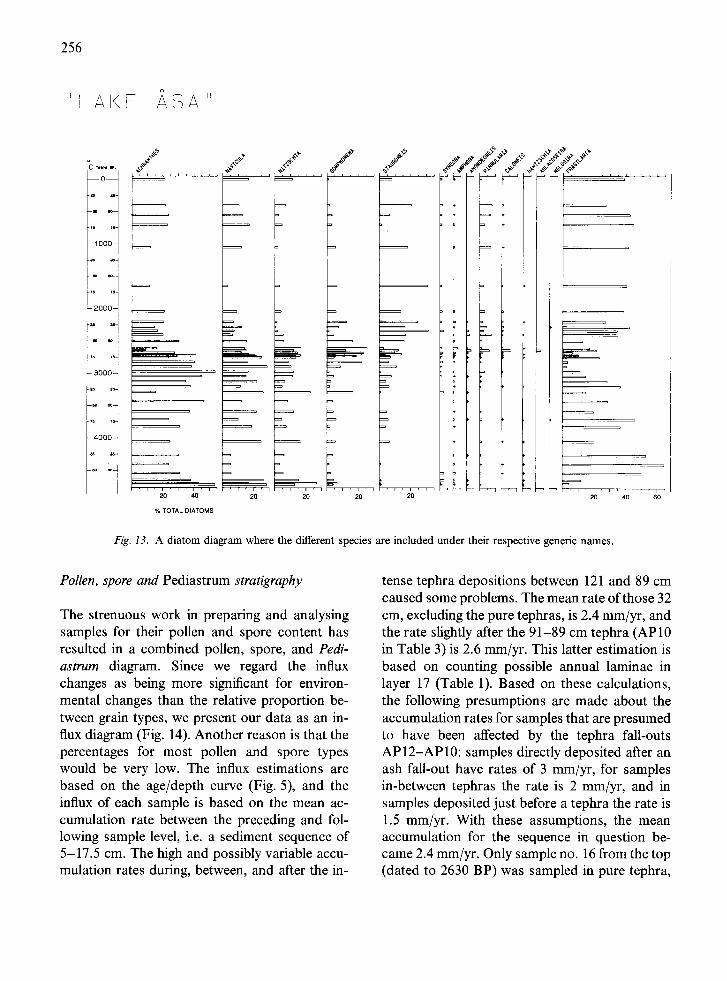
Fig. 13. A diatom diagram where the different species are included under their respective generic names.
Pollen, spore and Pediastrum stratigraphy
The strenuous work in preparing and analysing samples for their pollen and spore content has resulted in a combined pollen, spore, and Pedi- astrum diagram. Since we regard the influx changes as being more significant for environ- mental changes than the relative proportion be- tween grain types, we present our data as an in- flux diagram (Fig. 14). Another reason is that the percentages for most pollen and spore types would be very low. The influx estimations are based on the age/depth curve (Fig. 5), and the influx of each sample is based on the mean ac- cumulation rate between the preceding and fol- lowing sample level, i.e. a sediment sequence of 5-17.5 cm. The high and possibly variable accu- mulation rates during, between, and after the in-
tense tephra depositions between 121 and 89 cm caused some problems. The mean rate of those 32 cm, excluding the pure tephras, is 2.4 mm/yr, and the rate slightly after the 91-89 cm tephra (AP 10 in Table 3) is 2.6 mm/yr. This latter estimation is based on counting possible annual laminae in layer 17 (Table 1). Based on these calculations, the following presumptions are made about the accumulation rates for samples that are presumed to have been affected by the tephra fall-outs AP12-AP10: samples directly deposited after an ash fall-out have rates of 3 mm/yr, for samples in-between tephras the rate is 2 mm/yr, and in samples deposited just before a tephra the rate is 1.5 mm/yr. With these assumptions, the mean accumulation for the sequence in question be- came 2.4 mm/yr. Only sample no. 16 from the top (dated to 2630 BP) was sampled in pure tephra,
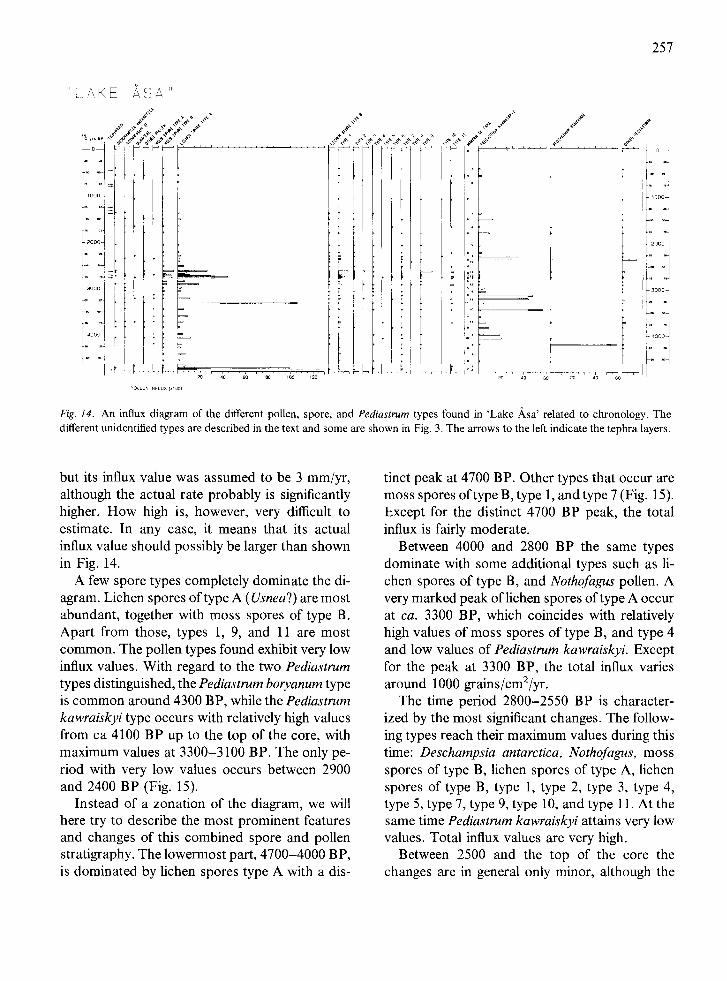
257
POLLEN INFLUX {xlO0)
60 eo ,0o ' i~o
I
L i "t
20 40 60 20 40 60
/
Y Iooo~
~oo
,oo
Fig. 14. An influx diagram of the different pollen, spore, and Pediastrum types found in 'Lake A, sa' related to chronology. The different unidentified types are described in the text and some are shown in Fig. 3. The arrows to the left indicate the tephra layers.
but its influx value was assumed to be 3 mm/yr, although the actual rate probably is significantly higher. How high is, however, very difficult to estimate. In any case, it means that its actual influx value should possibly be larger than shown in Fig. 14.
A few spore types completely dominate the di- agram. Lichen spores of type A (Usnea?) are most abundant, together with moss spores of type B. Apart from those, types 1, 9, and 11 are most common. The pollen types found exhibit very low influx values. With regard to the two Pediastrum types distinguished, the Pediastrum boryanum type is common around 4300 BP, while the Pediastrum kawraiskyi type occurs with relatively high values from ca 4100 BP up to the top of the core, with maximum values at 3300-3100 BP. The only pe- riod with very low values occurs between 2900 and 2400 BP (Fig. 15).
Instead of a zonation of the diagram, we will here try to describe the most prominent features and changes of this combined spore and pollen stratigraphy. The lowermost part, 4700-4000 BP, is dominated by lichen spores type A with a dis-
tinct peak at 4700 BP. Other types that occur are moss spores of type B, type 1, and type 7 (Fig. 15). Except for the distinct 4700 BP peak, the total influx is fairly moderate.
Between 4000 and 2800 BP the same types dominate with some additional types such as li- chen spores of type B, and Nothofagus pollen. A very marked peak of lichen spores of type A occur at ca. 3300 BP, which coincides with relatively high values of moss spores of type B, and type 4 and low values of Pediastrum kawraiskyi. Except for the peak at 3300 BP, the total influx varies around 1000 grains/cm2/yr.
The time period 2800-2550 BP is character- ized by the most significant changes. The follow- ing types reach their maximum values during this time: Deschampsia antarctica, Nothofagus, moss spores of type B, lichen spores of type A, lichen spores of type B, type 1, type 2, type 3, type 4, type 5, type 7, type 9, type 10, and type 11. At the same time Pediastrum kawraiskyi attains very low values. Total influx values are very high.
Between 2500 and the top of the core the changes are in general only minor, although the
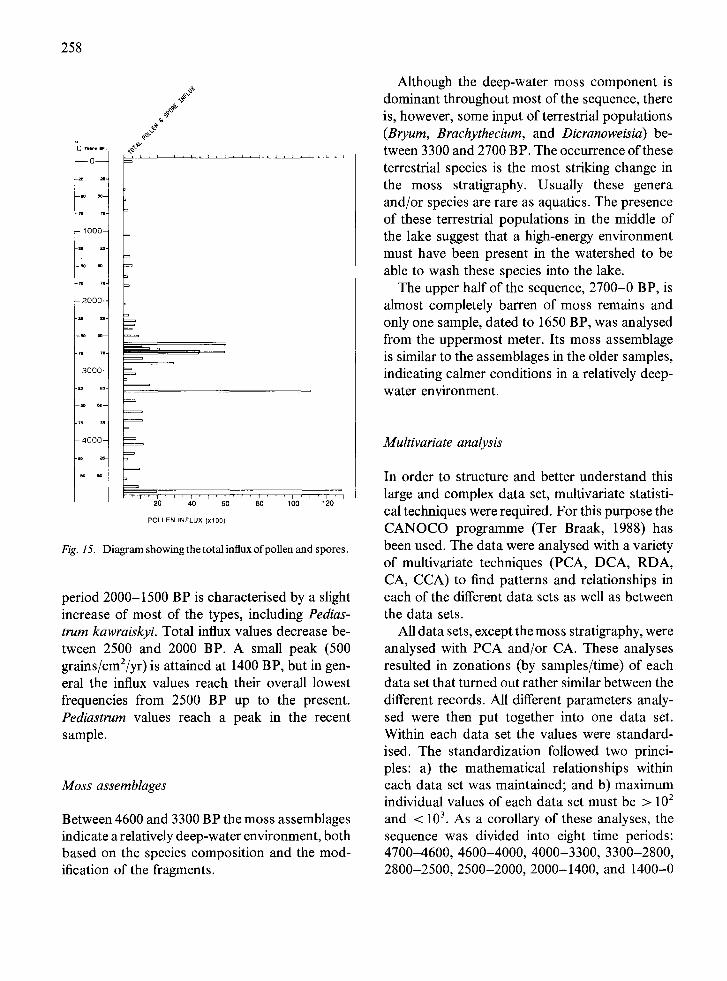
258
�9 75 7n-
- l O 0 0 -
.zs an-
.7. 76 -
- 2 0 0 0
�9 7. 7n-
- 3 0 0 0 -
2n-
75 ;8-
4 0 0 0 -
/ /
/ =
=
=
' 2'o 40 ~o 0o 40 , ) o '
P O L L E N I N F L U X ( x l 0 0 )
Fig. 15. Diagram showing the total influx of pollen and spores.
period 2000-1500 BP is characterised by a slight increase of most of the types, including Pedias- trum kawraiskyi. Total influx values decrease be- tween 2500 and 2000 BP. A small peak (500 grains/cmZ/yr) is attained at 1400 BP, but in gen- eral the influx values reach their overall lowest frequencies from 2500 BP up to the present. Pediastrum values reach a peak in the recent sample.
Moss assemblages
Between 4600 and 3300 BP the moss assemblages indicate a relatively deep-water environment, both based on the species composition and the mod- ification of the fragments.
Although the deep-water moss component is dominant throughout most of the sequence, there is, however, some input of terrestrial populations (Bryum, Brachythecium, and Dicranoweisia) be- tween 3300 and 2700 BP. The occurrence of these terrestrial species is the most striking change in the moss stratigraphy. Usually these genera and/or species are rare as aquatics. The presence of these terrestrial populations in the middle of the lake suggest that a high-energy environment must have been present in the watershed to be able to wash these species into the lake.
The upper half of the sequence, 2700-0 BP, is almost completely barren of moss remains and only one sample, dated to 1650 BP, was analysed from the uppermost meter. Its moss assemblage is similar to the assemblages in the older samples, indicating calmer conditions in a relatively deep- water environment.
Multivariate analysis
In order to structure and better understand this large and complex data set, multivariate statisti- cal techniques were required. For this purpose the CANOCO programme (Ter Braak, 1988) has been used. The data were analysed with a variety of multivariate techniques (PCA, DCA, RDA, CA, CCA) to find patterns and relationships in each of the different data sets as well as between the data sets.
All data sets, except the moss stratigraphy, were analysed with PCA and/or CA. These analyses resulted in zonations (by samples/time) of each data set that turned out rather similar between the different records. All different parameters analy- sed were then put together into one data set. Within each data set the values were standard- ised. The standardization followed two princi- ples: a) the mathematical relationships within each data set was maintained; and b) maximum individual values of each data set must be > 102 and < 103. As a corollary of these analyses, the sequence was divided into eight time periods: 4700-4600, 4600-4000, 4000-3300, 3300-2800, 2800-2500, 2500-2000, 2000-1400, and 1400-0
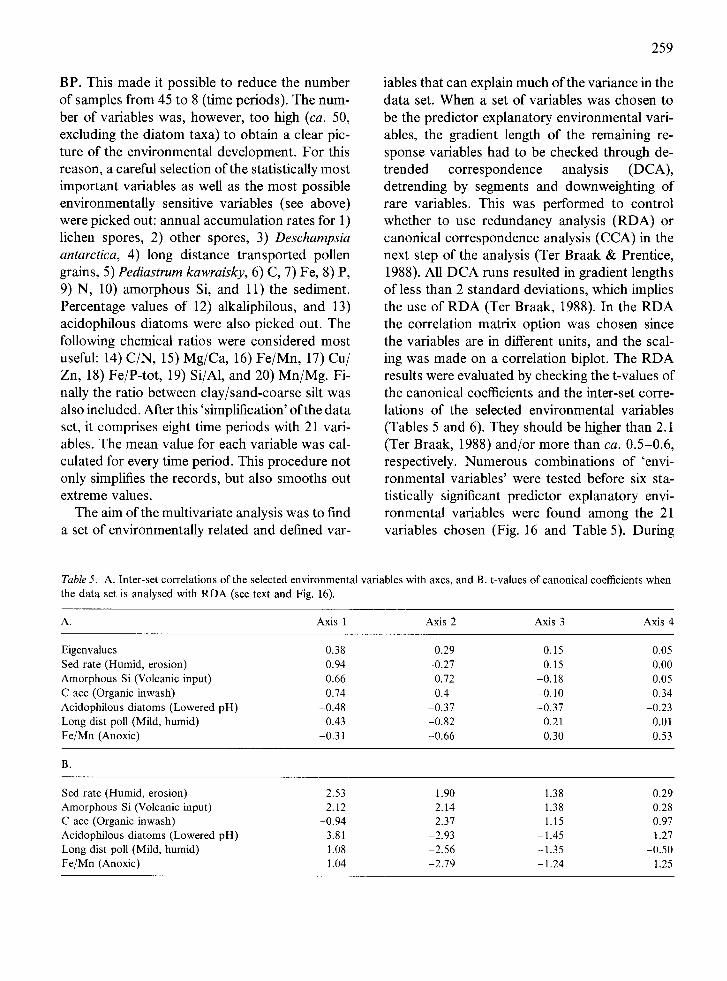
BP. This made it possible to reduce the number of samples from 45 to 8 (time periods). The num- ber of variables was, however, too high (ca. 50, excluding the diatom taxa) to obtain a clear pic- ture of the environmental development. For this reason, a careful selection of the statistically most important variables as well as the most possible environmentally sensitive variables (see above) were picked out: annual accumulation rates for 1) lichen spores, 2) other spores, 3) Deschampsia antarctica, 4) long distance transported pollen grains, 5) Pediastrum kawraisky, 6) C, 7) Fe, 8) P, 9) N, 10) amorphous Si, and 11) the sediment. Percentage values of 12) alkaliphilous, and 13) acidophilous diatoms were also picked out. The following chemical ratios were considered most useful: 14) C/N, 15) Mg/Ca, 16) Fe/Mn, 17) Cu/ Zn, 18) Fe/P-tot, 19) Si/A1, and 20) Mn/Mg. Fi- nally the ratio between clay/sand-coarse silt was also included. After this 'simplification' of the data set, it comprises eight time periods with 21 vari- ables. The mean value for each variable was cal- culated for every time period. This procedure not only simplifies the records, but also smooths out extreme values.
The aim of the multivariate analysis was to find a set of environmentally related and defined var-
259
iables that can explain much of the variance in the data set. When a set of variables was chosen to be the predictor explanatory environmental vari- ables, the gradient length of the remaining re- sponse variables had to be checked through de- trended correspondence analysis (DCA), detrending by segments and downweighting of rare variables. This was performed to control whether to use redundancy analysis (RDA) or canonical correspondence analysis (CCA) in the next step of the analysis (Ter Braak & Prentice, 1988). All DCA runs resulted in gradient lengths of less than 2 standard deviations, which implies the use of RDA (Ter Braak, 1988). In the RDA the correlation matrix option was chosen since the variables are in different units, and the scal- ing was made on a correlation biplot. The RDA results were evaluated by checking the t-values of the canonical coefficients and the inter-set corre- lations of the selected environmental variables (Tables 5 and 6). They should be higher than 2.1 (Ter Braak, 1988) and/or more than ca. 0.5-0.6, respectively. Numerous combinations of 'envi- ronmental variables' were tested before six sta- tistically significant predictor explanatory envi- ronmental variables were found among the 21 variables chosen (Fig. 16 and Table 5). During
Table 5. A. Inter-set correlations of the selected environmental variables with axes, and B. t-values of canonical coefficients when the data set is analysed with RDA (see text and Fig. 16).
A. Axis 1 Axis 2 Axis 3 Axis 4
Eigenvalues Sed rate (Humid, erosion) Amorphous Si (Volcanic input) C acc (Organic inwash) Acidophilous diatoms (Lowered pH) Long dist poll (Mild, humid) Fe/Mn (Anoxic)
0.38 0.29 0.15 0.05 0.94 -0.27 0.15 0.00 0.66 0.72 -0.18 0.05 0.74 0.4 -0.10 0.34
-0.48 -0.37 -0.37 -0.23 0.43 -0.82 0.21 0.01
-0.31 -0.66 0.30 0.53
B.
Sed rate (Humid, erosion) Amorphous Si (Volcanic input) C acc (Organic inwash) Acidophilous diatoms (Lowered pH) Long dist poll (Mild, humid) Fe/Mn (Anoxic)
2.53 1.90 1.38 0.29 2.12 -2.14 -1.38 -0.28
-0.94 2.37 1.15 0.97 3.81 -2.93 -1.45 1.27 1.08 -2.56 -1.35 -0.50 1.04 -2.79 - 1.24 1.25
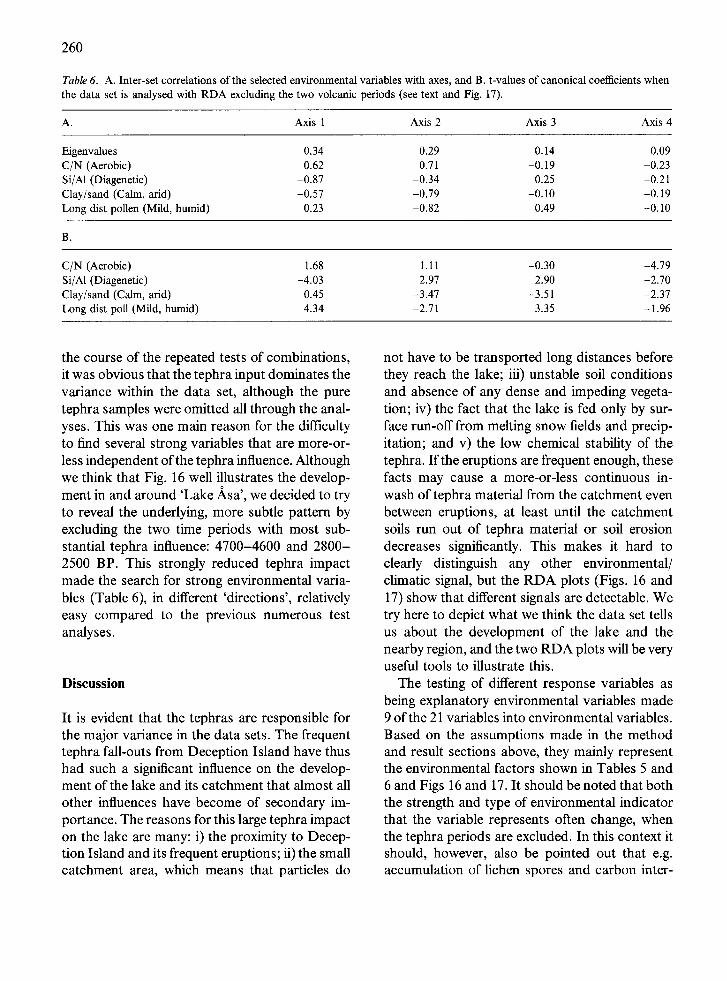
260
Table 6. A. Inter-set correlations of the selected environmental variables with axes, and B. t-values of canonical coefficients when the data set is analysed with RDA excluding the two volcanic periods (see text and Fig. 17).
A. Axis 1 Axis 2 Axis 3 Axis 4
Eigenvalues 0.34 0.29 0.14 0.09 C/N (Aerobic) 0.62 0.71 -0.19 -0.23 Si/A1 (Diagenetic) -0.87 -0.34 0.25 -0.21 Clay/sand (Calm, arid) -0.57 -0.79 -0.10 -0.19 Long dist pollen (Mild, humid) 0.23 -0.82 0.49 -0.10
B.
C/N (Aerobic) 1.68 1.11 -0.30 -4.79 Si/A1 (Diagenetic) -4.03 2.97 2.90 -2.70 Clay/sand (Calm, arid) 0.45 -3.47 -3.51 -2.37 Long dist poll (Mild, humid) 4.34 -2.71 3.35 -1.96
the course of the repeated tests of combinations, it was obvious that the tephra input dominates the variance within the data set, although the pure tephra samples were omitted all through the anal- yses. This was one main reason for the difficulty to find several strong variables that are more-or- less independent of the tephra influence. Although we think that Fig. 16 well illustrates the develop-
o
ment in and around 'Lake Asa', we decided to try to reveal the underlying, more subtle pattern by excluding the two time periods with most sub- stantial tephra influence: 4700-4600 and 2800- 2500 BP. This strongly reduced tephra impact made the search for strong environmental varia- bles (Table 6), in different 'directions', relatively easy compared to the previous numerous test analyses.
Discussion
It is evident that the tephras are responsible for the major variance in the data sets. The frequent tephra fall-outs from Deception Island have thus had such a significant influence on the develop- ment of the lake and its catchment that almost all other influences have become of secondary im- portance. The reasons for this large tephra impact on the lake are many: i) the proximity to Decep- tion Island and its frequent eruptions; ii) the small catchment area, which means that particles do
not have to be transported long distances before they reach the lake; iii) unstable soil conditions and absence of any dense and impeding vegeta- tion; iv) the fact that the lake is fed only by sur- face run-off from melting snow fields and precip- itation; and v) the low chemical stability of the tephra. If the eruptions are frequent enough, these facts may cause a more-or-less continuous in- wash of tephra material from the catchment even between eruptions, at least until the catchment soils run out of tephra material or soil erosion decreases significantly. This makes it hard to clearly distinguish any other environmental/ climatic signal, but the RDA plots (Figs. 16 and 17) show that different signals are detectable. We try here to depict what we think the data set tells us about the development of the lake and the nearby region, and the two RDA plots will be very useful tools to illustrate this.
The testing of different response variables as being explanatory environmental variables made 9 of the 21 variables into environmental variables. Based on the assumptions made in the method and result sections above, they mainly represent the environmental factors shown in Tables 5 and 6 and Figs 16 and 17. It should be noted that both the strength and type of environmental indicator that the variable represents often change, when the tephra periods are excluded. In this context it should, however, also be pointed out that e.g. accumulation of lichen spores and carbon inter-
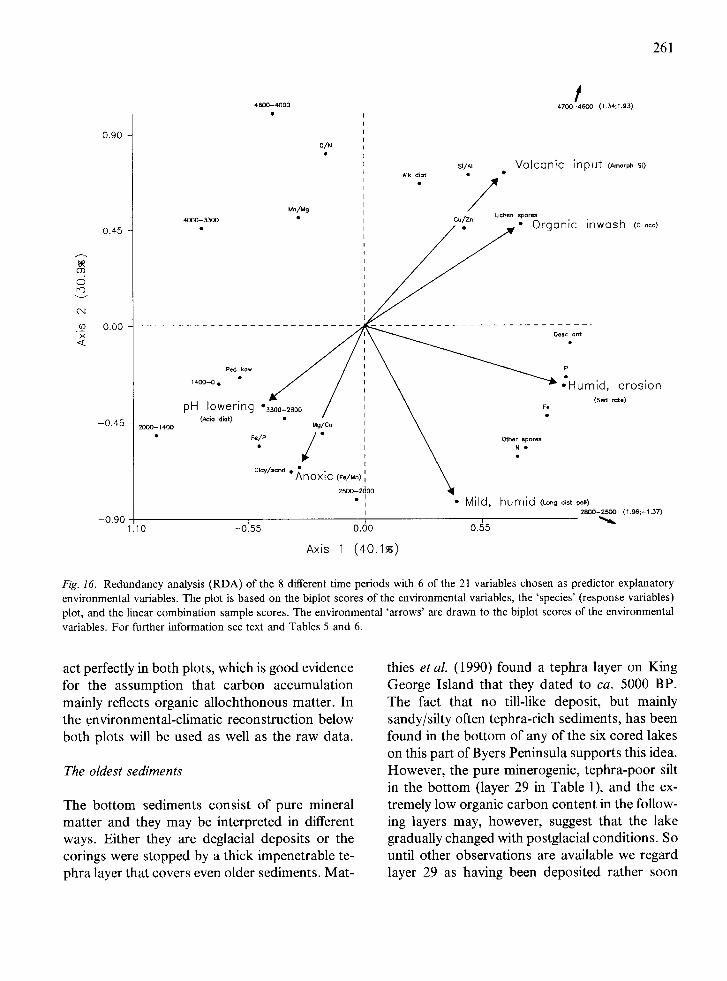
261
4600--4000
! 4 7 0 0 - 4 6 0 0 (1.34:1.93)
d v
X <
0.90
0.45
0.00
-0.45
-0.90
C/N i
SI/AI V o l c a n i c i n p u t (~o,.h Sl) AIk diat I I �9
/ Mn/Mg
�9 Lichen spores 4 0 0 0 - 3 3 0 0 Cu/Zn �9 - ,
�9 . O r g o n l c i nwosh (co~c)
. . . . . . . . . . . . . . . . . . . . . . . . . . . . . . . . . . . . . . . . . . . . . . . . . . . . . . . .
14oo-o o � 9 e r o s i o n , , , . �9 ~ / I \ (Sed rote)
pm lower ing 33oo-2a0o / ! \ re (kid ~iot> �9 .. ~._ : \
2000-1400 Mg/Co I \ �9 I
�9 f e / P / / ! 1 ~ Other sp . . . . �9 I N �9 r \ : -
o,o, /~o. �9 r I \
�9 , �9 �9 , ,
, M i l d , h u m i d (~.g d,~t po.) I 2B00 -2500 (1 .96 ; -1 .37 )
.10 -0155 0.00 0.55 " ~
A x i s 1 ( 4 0 . 1 ~ )
Fig. 16. Redundancy analysis (RDA) of the 8 different time periods with 6 of the 21 variables chosen as predictor explanatory environmental variables. The plot is based on the biplot scores of the environmental variables, the 'species' (response variables) plot, and the linear combination sample scores. The environmental 'arrows' are drawn to the biplot scores of the environmental variables. For further information see text and Tables 5 and 6.
act perfectly in both plots, which is good evidence for the assumption that carbon accumulation mainly reflects organic allochthonous matter. In the environmental-climatic reconstruction below both plots will be used as well as the raw data.
The oldest sediments
The bottom sediments consist of pure mineral matter and they may be interpreted in different ways. Either they are deglacial deposits or the corings were stopped by a thick impenetrable te- phra layer that covers even older sediments. Mat-
thies et al. (1990) found a tephra layer on King George Island that they dated to ca. 5000 BP. The fact that no till-like deposit, but mainly sandy/silty often tephra-rich sediments, has been found in the bottom of any of the six cored lakes on this part of Byers Peninsula supports this idea. However, the pure minerogenic, tephra-poor silt in the bottom (layer 29 in Table 1), and the ex- tremely low organic carbon content in the follow- ing layers may, however, suggest that the lake gradually changed with postglacial conditions. So until other observations are available we regard layer 29 as having been deposited rather soon
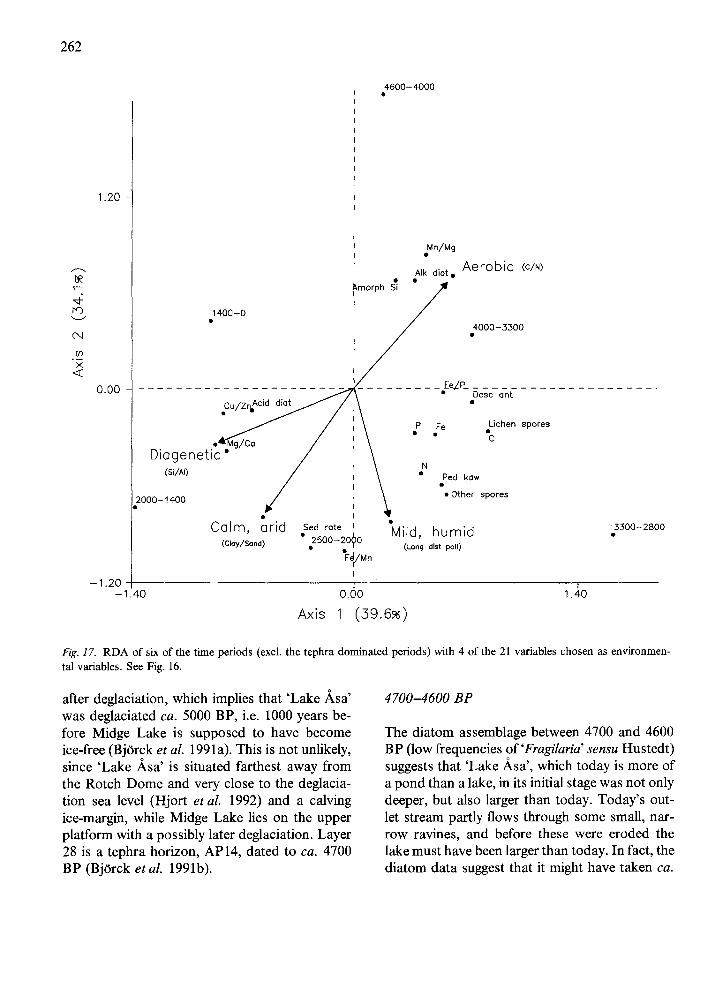
262
1.20
<: r~
o4
O3 X <
0.00
- 1 . 2 0
4600-4000
oMn/Mg
Aerobic (c/.) AIk diat �9
�9 I 400-0 I /
:ooo- oo
. . . . . . . Y_ . . . . . . ZeZE . . . . . . . . . . . . . . . . . . . . //,~ " Desc ant
/ / i \ P Fe Lichen spores . / ; \ . , - "c
Diogenetic" / \ (Si/AI) : �9 jN 2 ed kOw
7000-1400 / ~ �9 Other spores
Colin, Grid Sed rot~ 33O0-2800 �9 0500_20A 0 Mild, humid
(Clay/Sand) r u (Long dlst poll)
I
1 I .40 0.00 1.40
Axis 1 (59.6~)
Fig. 17. RDA of six of the time periods (excl. the tephra dominated periods) with 4 of the 21 variables chosen as environmen- tal variables. See Fig. 16.
after deglaciation, which implies that 'Lake Asa' was deglaciated ca. 5000 BP, i.e. 1000 years be- fore Midge Lake is supposed to have become ice-free (BjOrck et al. 1991a). This is not unlikely, since 'Lake Asa' is situated farthest away from the Rotch Dome and very close to the deglacia- tion sea level (Hjort et aL 1992) and a calving ice-margin, while Midge Lake lies on the upper platform with a possibly later deglaciation. Layer 28 is a tephra horizon, AP14, dated to ca. 4700 BP (BjOrck et al. 1991b).
4 7 0 0 - 4 6 0 0 B P
The diatom assemblage between 4700 and 4600 BP (low frequencies of'Fragilaria' sensu Hustedt) suggests that 'Lake ,~sa', which today is more of a pond than a lake, in its initial stage was not only deeper, but also larger than today. Today's out- let stream partly flows through some small, nar- row ravines, and before these were eroded the lake must have been larger than today. In fact, the diatom data suggest that it might have taken ca.
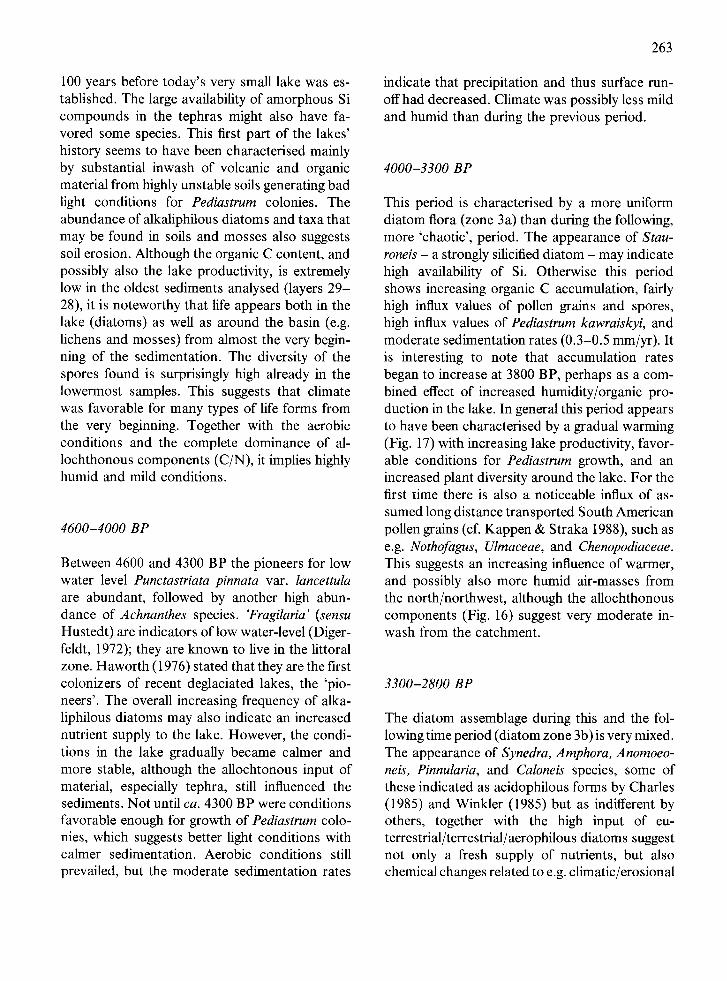
100 years before today's very small lake was es- tablished. The large availability of amorphous Si compounds in the tephras might also have fa- vored some species. This first part of the lakes' history seems to have been characterised mainly by substantial inwash of volcanic and organic material from highly unstable soils generating bad light conditions for Pediastrum colonies. The abundance of alkaliphilous diatoms and taxa that may be found in soils and mosses also suggests soil erosion. Although the organic C content, and possibly also the lake productivity, is extremely low in the oldest sediments analysed (layers 29- 28), it is noteworthy that life appears both in the lake (diatoms) as well as around the basin (e.g. lichens and mosses) from almost the very begin- ning of the sedimentation. The diversity of the spores found is surprisingly high already in the lowermost samples. This suggests that climate was favorable for many types of life forms from the very beginning. Together with the aerobic conditions and the complete dominance of al- lochthonous components (C/N), it implies highly humid and mild conditions.
4600-4000 BP
Between 4600 and 4300 BP the pioneers for low water level Punctastriata pinnata var. lancettula are abundant, followed by another high abun- dance of Achnanthes species. 'Fragilaria" (sensu Hustedt) are indicators of low water-level (Diger- feldt, 1972); they are known to live in the littoral zone. Haworth (1976) stated that they are the first colonizers of recent deglaciated lakes, the 'pio- neers'. The overall increasing frequency of alka- liphilous diatoms may also indicate an increased nutrient supply to the lake. However, the condi- tions in the lake gradually became calmer and more stable, although the allochtonous input of material, especially tephra, still influenced the sediments. Not until ca. 4300 BP were conditions favorable enough for growth of Pediastrum colo- nies, which suggests better light conditions with calmer sedimentation. Aerobic conditions still prevailed, but the moderate sedimentation rates
263
indicate that precipitation and thus surface run- offhad decreased. Climate was possibly less mild and humid than during the previous period.
4000-3300 BP
This period is characterised by a more uniform diatom flora (zone 3a) than during the following, more 'chaotic', period. The appearance of Stau- roneis - a strongly silicified diatom - may indicate high availability of Si. Otherwise this period shows increasing organic C accumulation, fairly high influx values of pollen grains and spores, high influx values of Pediastrum kawraiskyi, and moderate sedimentation rates (0.3-0.5 mm/yr). It is interesting to note that accumulation rates began to increase at 3800 BP, perhaps as a com- bined effect of increased humidity/organic pro- duction in the lake. In general this period appears to have been characterised by a gradual warming (Fig. 17) with increasing lake productivity, favor- able conditions for Pediastrum growth, and an increased plant diversity around the lake. For the first time there is also a noticeable influx of as- sumed long distance transported South American pollen grains (cf. Kappen & Straka 1988), such as e.g. Nothofagus, Ulmaceae, and Chenopodiaceae. This suggests an increasing influence of warmer, and possibly also more humid air-masses from the north/northwest, although the allochthonous components (Fig. 16) suggest very moderate in- wash from the catchment.
3300-2800 BP
The diatom assemblage during this and the fol- lowing time period (diatom zone 3b) is very mixed. The appearance of Synedra, Amphora, Anomoeo- neis, Pinnularia, and Caloneis species, some of these indicated as acidophilous forms by Charles (1985) and Winkler (1985) but as indifferent by others, together with the high input of eu- terrestrial/terrestrial/aerophilous diatoms suggest not only a fresh supply of nutrients, but also chemical changes related to e.g. climatic/erosional
264
changes. The influx values of spores and pollen (incl. long distance transported) increased and influx of Pediastrum colonies reached maximum values. Organic C attained maximum values of 2.5-3 ~o and sedimentation rates increased grad- ually from 0.5 to 0.9 mm/yr. Although the sedi- ments were quite fine grained, the rather abrupt appearance of terrestrial moss remains at ca. 3300 BP indicate significant soil erosion. We think that our data suggest that the previous warming trend was accelerated during this period (Fig. 17), al- though the allochthonous components would be- come much more dominant in the following pe- riod (Fig. 16). Therefore the C/N peak (Fig. 6) in the beginning of this period is more an implica- tion of well oxygenated conditions (long ice-free summers) than of allochthonous input. The in- creasing accumulation rates were probably the result of increased lake productivity/precipitation. The possibly high precipitation, and thus in- creased soil erosion/surface run-off, however, did not affect the light conditions in the lake water to make it unfavorable for Pediastrum until ca. 2900 BP when the influx of Pediastrum colonies de- creased from more than 1000 colonies/cm2/yr to almost zero (Fig. 14). Together with a marked C peak (Fig. 6), we think this shows that optimum mild and humid conditions were reached 2900- 2800 BP.
spores (Figs. 14 and 16). The opposite can be said about Pediastrum, which more-or-less seems to have disappeared, possibly as an effect of ex- tremely deteriorated light conditions in the water due to a high suspension load in the water dur- ing the short, mild growing season. We interpret this rather dramatic phase of the lakes' history as a period characterized by more-or-less primary tephra deposition (either falling directly into the lake water or on the lake ice) and extensive soil erosion. The basic prerequisites for this ca. 300 year long period with vast soil erosion and mark- edly increased sedimentation rates were certainly triggered by the tephra deposition in the catch- ment and a substantial surface run-off. Although one should not exclude the possibility of occas- sional eolian input, we think the data in general suggest high precipitation rates and thus also a possibly fairly mild climate. The extremely high influx values of many of the climatic variables (Figs. 14 and 16) were, however, most likely caused by intense soil erosion, redeposition, and inwash to the lake. This makes it difficult to com- pare the strength of the climatic variables with those of the previous period, but there are subtle indications in the data set that suggest that the peak of the optimum mild/humid climate might have been reached slightly before AP12 was de- posited.
2800-2500 B P 2500-2000 B P
This time period is characterised by a combina- tion of humid/mild and volcanic/aUochthonous components (Fig. 16). The latter influence seems to be very dominating, which makes it hard to distinguish the true strength of the climatic vari- ables. The reason for this strong volcanic influ- ence is obviously the impact of the three tephra horizons, AP12-10, dated to 2760-2630 BP (Ta- ble 2), of which AP 12 possibly played the largest role. The inwash of volcanic matter reached dis- tinct peak values and it is noteworthy that the same can be said about the influx of C (Fig. 6), long distance pollen grains, Deschampsia antarc- tica, lichen spores, moss spores as well as other
The diatom assemblage suggests that the condi- tions in the lake were more stable compared to the preceding zone. The more stable values of the epiphytic flora may indicate relatively lower water levels. The increase of acidophilous diatoms at 2500 BP indicate a gradually lowered pH. This period is in general characterized by calm, pos- sibly periodically anoxic conditions in the lake (Figs. 16 and 17). All allochthonous/erosional variables decreased markedly compared to all previous periods, suggesting that precipitation de- creased significantly. The greatly reduced influx of spores from the surroundings during this time may indicate both less plant cover and reduced
precipitation. The return of Pediastrum colonies also implies generally calmer conditions, although the highly variable values, in spite of decreasing sedimentation/clearer water, may suggest that the ice-cover season often was too long for green algae production. This was possibly a result of colder winters and perhaps also colder summers as well as a more arid climate in general. The anoxic influence on this period (Fig. 16) also supports such an interpretation.
2000-1400 BP
The diatom assemblage remained more or less the same with a gradual but slow increase of acido- philous taxa. According to the RDA plots this period was not only characterised by lowered pH, but also by calm, anoxic and diagenetic condi- tions in the lake, implying that the lake periodi- cally never became ice-free in summer. This sug- gests that the arid, cold climate described from the previous period might have reached its opti- mum conditions. There are, however, indications (Figs. 6 and 14) that the last ca. 100 years of this phase was characterised by a more humid/milder climate.
1400-0 BP
This is actually the period that contains the most tephra layers (Table 2), but this fact is only vaguely displayed in Figs 16 and 17. Although the very onset of this last phase in the lakes' history is characterized by tephras, nothing dramatic oc- curs comparable to the two previous tephra pe- riods. The diatom assemblage in the uppermost part (zone 5) implies an increased input of nutri- ents (possibly from the tephra), while at the same time the amount of acidophilous forms reach their highest values (Fig. 10). The volcanic influence is also evident by e.g. the increasing sedimentation rates (Fig. 5) and grain-sizes (Fig. 6), and rising accumulations of amorphous Si (Fig. 8). This re- stricted impact from the tephra fall-outs clearly implies that the tephras alone cannot create the
265
distinct signals occurring around 2700 BP with- out an efficient agent, such as e.g. soil erosion. There are, however, signs that can be interpreted as reflecting a minor climatic warming: increased aerobic conditions (C/N in Figs. 6 and 17) and increased accumulation of both N and C. The latter is usually interpreted as an organic alloch- thonous component (Fig. 16), but in contrast to the other periods the increase in C is not accom- panied by an increase in influx of lichen spores. This may suggest that parts of the C increase was caused by rising lake productivity as an effect of slightly milder summers. The diagenetic/lowered pH conditions have, however, been maintained or even increased (Figs. 7, 8, and 17), which implies long ice-cover seasons and thus cold winters. This increase may also partly be attributed to the shal- lowing and an occasional bottom-freezing of the lake. Bottom-freezing does, however, not seem to seriously disturb the sediments. This is confirmed by the 21~ and 137Cs profiles. Although no chemical analyses (except C and N) could be car- ried out on the surface sample, much of the other data (e.g. Fig. 14) implies that the modern climate is milder than during the preceding 2500 years.
Palaeoclimatic conclusions and correlations
In spite of the problems with the tephra 'noise', we think we have illustrated the possibility to trace climatic signals if a wide variety of stratigraphic variables are used. In this part of Antarctica the tephra does, however, put restrictions on how detailed the climatic reconstructions can become. It is questionable whether a more detailed recon- struction of the terrestrial/limnic development can presently be obtained in an environment so influ- enced by tephra fall-outs. The planned diatom/ water chemistry data-set for Antarctica (Viv Jones; pers. comm.) could, however, become a further useful tool in evaluating past climatic/ environmental changes.
The studies of 'Lake Asa' have thus resulted in a palaeoclimatic reconstruction of the last 5000 years. A tentative relative temperature/humidity curve has been drawn to illustrate these changes
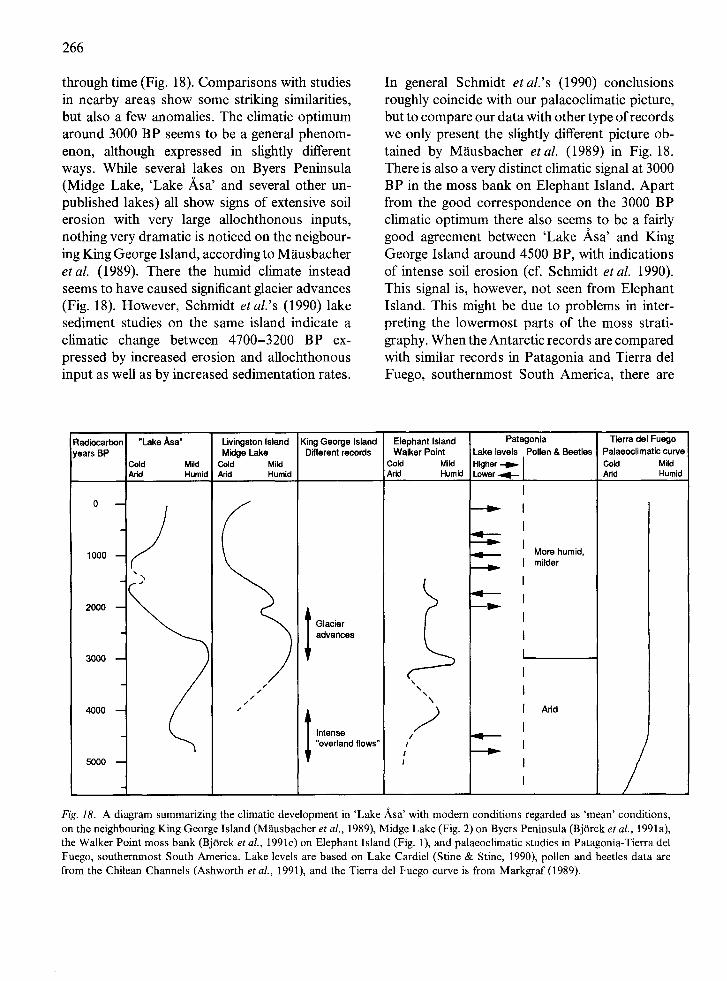
"Lake Asa"
through time (Fig. 18). Comparisons with studies in nearby areas show some striking similarities, but also a few anomalies. The climatic optimum around 3000 BP seems to be a general phenom- enon, although expressed in slightly different ways. While several lakes on Byers Peninsula (Midge Lake, 'Lake .~sa' and several other un- published lakes) all show signs of extensive soil erosion with very large allochthonous inputs, nothing very dramatic is noticed on the neigbour- ing King George Island, according to Mausbacher etal . (1989). There the humid climate instead seems to have caused significant glacier advances (Fig. 18). However, Schmidt et al.'s (1990) lake sediment studies on the same island indicate a climatic change between 4700-3200 BP ex- pressed by increased erosion and allochthonous input as well as by increased sedimentation rates.
In general Schmidt e ta l . ' s (1990) conclusions roughly coincide with our palaeoclimatic picture, but to compare our data with other type of records we only present the slightly different picture ob- tained by M~iusbacher etal . (1989) in Fig. 18. There is also a very distinct climatic signal at 3000 BP in the moss bank on Elephant Island. Apart from the good correspondence on the 3000 BP climatic optimum there also seems to be a fairly good agreement between 'Lake Asa' and King George Island around 4500 BP, with indications of intense soil erosion (cf. Schmidt et al. 1990). This signal is, however, not seen from Elephant Island. This might be due to problems in inter- preting the lowermost parts of the moss strati- graphy. When the Antarctic records are compared with similar records in Patagonia and Tierra del Fuego, southernmost South America, there are
Livingston Island Midge Lake
Cold Mild Arid Humid
Glacier advances
King George Island Different records
/ /
/ /
. /
Elephant Island Walker Point
Cold Mild Arid Humid
Patagonia Lake levels Pollen & Beetles
Radiocarbon years BP
Cold Mild Arid Humid
0
1000 - /
2000
3000 )
4000
5000 --
266
Intense "overland flows"
~t
\ \ \
/ I
I I
Higher Lower
I I
I
I . 9 - I I
' ~ I
I
I
L
I
I
I
I I I1,,.- I I
More humid, milder
Arid
Tierra del Fuego Palaeoclimatic curve Cold Mi ld Arid Humid
/ Fig. 18. A diagram summarizing the climatic development in 'Lake Asa' with modern conditions regarded as 'mean' conditions, on the neighbouring King George Island (M~iusbacher et al., 1989), Midge Lake (Fig. 2) on Byers Peninsula (Bj0rck et al., 1991a), the Walker Point moss bank (BjOrck et aL, 1991c) on Elephant Island (Fig. 1), and palaeoclimatic studies in Patagonia-Tierra del Fuego, southernmost South America. Lake levels are based on Lake Cardiel (Stine & Stine, 1990), pollen and beetles data are from the Chilean Channels (Ashworth et al., 1991), and the Tierra del Fuego curve is from Markgraf (1989).
both similarities and anomalies between the re- gions. The difficulty with the South American records is that they vary greatly altitudinally as well as along longitudinal and latitudinal gradi- ents. For instance, Markgraf (1989) states that the climate in general became more humid and warm between 6000 and 4500 BP in Tierra del Fuego, and has stayed approximately the same ever since, with a minor warming peak at 3000 BP. Further north, lake levels in Lake Cardiel (Stine & Stine, 1990) have fluctuated greatly dur- ing the Holocene, especially in the earliest part. The last larger lake level rise seem to have oc- curred at ca. 5000 BP followed by dry conditions (Stine & Stine, 1990), and Ashworth et al. (1991) depict arid conditions in the Chilean Channel up to 3000 BP. These differences may imply a lati- tudinal gradient, since the Antarctic records are more in line with the Tierra del Fuego records (Fig. 18).
The correspondence between the different South Shetland Island records is also fairly good during the last 2500-3000 years. The brief oscil- lations at 2000 BP in Midge Lake and at Walker Point (Fig. 18) may either be too short to be seen
o
in 'Lake Asa', be local, non-climatically derived events or erroneous interpretations of the Midge Lake and Walker Point data. In general, however, the last 2500 years have been characterized by more stable conditions with possibly minor oscil- lations that are difficult to detect in the records. This picture fits well with how Markgraf (1989, 1991) describes the last 3000 years in Patagonia, although the pollen and beetle records from e.g. the Chilean Channel (Ashworth et al., 1991) show that these last millenia were mild and humid.
The rather contrasting Holocene climatic his- tories of the South Shetland Islands-Tierra del Fuego and central Patagonia may demonstrate latitudinal shifts of the westerly stormtracks through time. In the South Shetland Islands these shifts may generate the continental/maritime cli- mate oscillations that seem to characterize its terrestrial/limnic records (Fig. 18).
Climatic oscillations in Antarctic Holocene records are inherently more subtle than the large glacial/interglacial fluctuations recorded in e.g.
267
Antarctic ice cores. Detailed analyses of these cores have, however, revealed apparent climatic signals during the Holocene (e.g. Jouzel et al.,
1989; Raisbeck e ta l . , 1987). The distance be- tween the Byrd site (Johnsen et al., 1972) in the center of the West Antarctic Ice Sheet and the South Shetland Islands in maritime Antarctica is not only large (2500 km), but do also represent two completely different climatic regimes. It is interesting that, in spite of this, the Byrd core as well as the 1500 km further away situated Vostok and Dome C cores (Jouzel et al., 1989) display the most distinct Holocene temperature increase between ca. 5000-3000 yr BP. Since this time scale is regarded as a calendar year chronology, it corresponds strikingly well to the temperature/ humidity increase registered in 'Lake Asa' be- tween ca. 4000 and 2700 ~4C yr BP (Fig. 18). The ~~ concentration record from Vostok (Raisbeck et al., 1987) does also imply a distinct peak in precipitation at ca. 3000 yr BP, which at least in time corresponds to the humidity peak on Livingston Island. This precipitation peak is suc- ceeded by rapidly declining precipitation (cf. 'Lake Asa'). Although these correlations between the most maritime and most continental parts of Antarctica are attractive enough, they should only be regarded as exciting speculations on continen- tal scale climatic changes in Antarctica during Late Holocene. It is, however, fascinating that the same climatic signal may be registered in the pre- cipitation of the huge Antarctic Ice Cap as well as in small ponds and lakes of the South Shetland Islands.
Acknowledgements
The field work in 'Lake Asa' was carried out by SB together with Anders Wasell during the SWE- DARP 1988/89 expedition. The pilots and crew on board M/S Stena Arctica put us ashore. GOran Skog and Kerstin Lundahl carried out the ~4C dating. Cynan Ellis-Evans provided us with aerial photographs, and Viv Jones provided the water chemical analyses. Arne Thell helped us to iden- tify the supposed lichen spores and Lars Heden~is
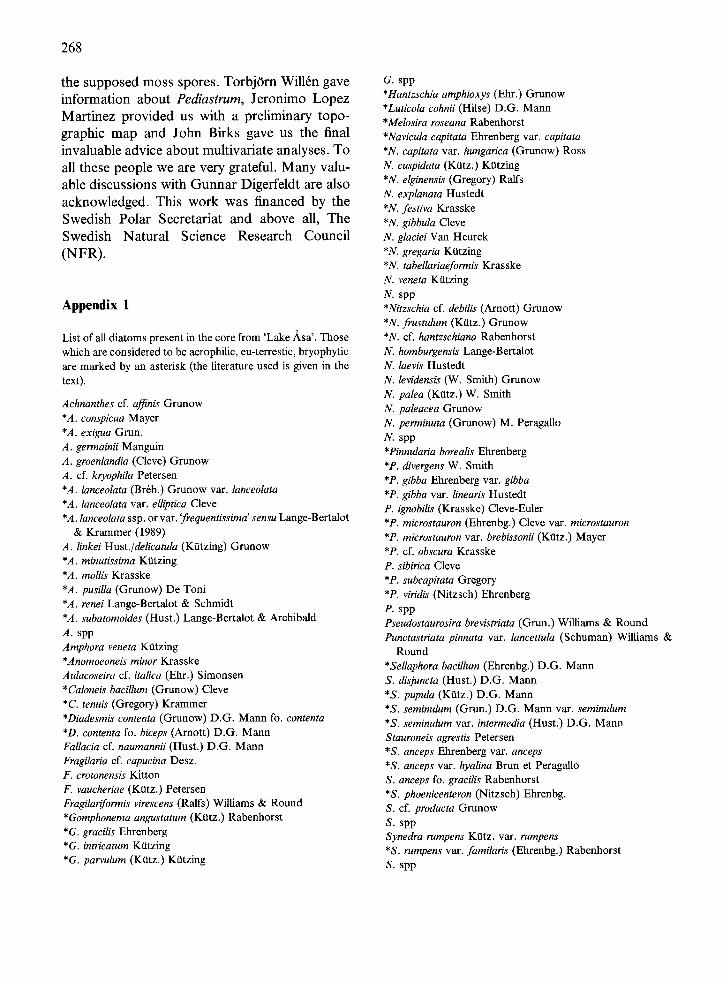
268
the supposed moss spores. TorbjOrn Will6n gave information about Pediastrum, Jeronimo Lopez Martinez provided us with a preliminary topo- graphic map and John Birks gave us the final invaluable advice about multivariate analyses. To all these people we are very grateful. Many valu- able discussions with Gunnar Digerfeldt are also acknowledged. This work was financed by the Swedish Polar Secretariat and above all, The Swedish Natural Science Research Council (NFR).
Appendix 1
List of all diatoms present in the core from 'Lake A, sa'. Those which are considered to be aerophilic, eu-terrestic, bryophytic are marked by an asterisk (the literature used is given in the text).
Achnanthes cf. affinis Grunow *A. conspicua Mayer *A. exigua Grun. A. germainii Manguin A. groenlandia (Cleve) Grunow A. cf. kryophila Petersen *A. lanceolata (Br6b.) Grunow var. lanceolata *A. lanceolata var. elliptica Cleve *A. lanceolata ssp. or var. 'frequentissima' sensu Lange-Bertalot
& Krammer (1989) A. linkei Hust./delicatula (K~itzing) Grunow *A. minutissima Kiitzing *A. mollis Krasske *A. pusilla (Grunow) De Toni *A. renei Lange-Bertalot & Schmidt *A. subatomoides (Hust.) Lange-Bertalot & Archibald A. spp Amphora veneta K~itzing *Anomoeoneis minor Krasske Aulacoseira cf. italica (Ehr.) Simonsen *Caloneis bacillum (Grunow) Cleve *C. tenuis (Gregory) Krammer *Diadesmis contenta (Grunow) D.G. Mann fo. contenta *D. contenta fo. biceps (Arnott) D.G. Mann Fallacia cf. naumannii (Hust.) D.G. Mann Fragilaria cf. capucina Desz. F. crotonensis Kitton F. vaucheriae (Ktltz.) Petersen Fragilariformis virescens (Ralfs) Williams & Round *Gomphonema angustatum (KtRz.) Rabenhorst *G. gracilis Ehrenberg *G. intricatum K(ltzing *G. parvulum (K~ltz.) KtRzing
G. spp *Hantzschia amphioxys (Ehr.) Grunow *Luticola cohnii (Hilse) D.G. Mann *Melosira roseana Rabenhorst *Navicula capitata Ehrenberg var. capitata *N. capitata var. hungarica (Grunow) Ross N. cuspidata (Ktltz.) KOtzing *N. elginensis (Gregory) Ralfs N. explanata Hustedt *N. festiva Krasske *N. gibbula Cleve N. glaciei Van Heurck *N. gregaria K~ltzing *N. tabellariaeformis Krasske N. veneta KtRzing N. spp *Nitzschia cf. debilis (Arnott) Grunow *N. frustulum (K~ltz.) Grunow *N. cf. hantzschiana Rabenhorst N. homburgensis Lange-Bertalot N. laevis Hustedt N. levidensis (W. Smith) Grunow N. palea (Ktltz.) W. Smith N. paleacea Grunow N. perminuta (Grunow) M. Peragallo N. spp *Pinnularia borealis Ehrenberg *P. divergens W. Smith *P. gibba Ehrenberg var. gibba *P. gibba var. linearis Hustedt P. ignobilis (Krasske) Cleve-Euler *P. microstauron (Ehrenbg.) Cleve var. microstauron *P. microstauron var. brebissonii (K~ltz.) Mayer *P. cf. obscura Krasske P. sibirica Cleve *P. subcapitata Gregory *P. viridis (Nitzsch) Ehrenberg P. spp Pseudostaurosira brevistriata (Grun.) Williams & Round Punctastriata pinnata var. lancettula (Schuman) Williams &
Round *Sellaphora bacillum (Ehrenbg.) D.G. Mann S. disjuncta (Hust.) D.G. Mann *S. pupula (KOtz.) D.G. Mann *S. serninulum (Grun.) D.G. Mann var. seminulum *S. seminulum var. intermedia (Hust.) D.G. Mann Stauroneis agrestis Petersen *S. anceps Ehrenberg var. anceps *S. anceps var. hyalina Brunet Peragallo S. anceps fo. gracilis Rabenhorst * S. phoenicenteron (Nitzsch) Ehrenbg. S. cf. producta Grunow S. spp Synedra rumpens Ktltz. var. rumpens *S. rumpens var. familaris (Ehrenbg.) Rabenhorst S. spp
References
Andrews, G.W., 1981. Achnanthes linkei and the origin of monoraphid diatoms. Bacillaria 4: 29-40.
April, R.H. & D.M. Keller, 1992. Saponite and vermiculite in amygdales of the Granby basaltic tuff, Connecticut Valley. Clays and Clay Minerals 40.1: 22-31.
Ashworth, A.C., V. Markgraf, & C. Villagran, 1991. Late Quaternary climatic history of the Chilean Channels based on fossil pollen and beetle analyses, with an analysis of the modern vegetation and pollen rain. J. Quat. Sci. 6: 279- 291.
Barsch, D. & R. M~tusbacher, 1986. New data on the relief development of the South Shetland Islands, Antarctica. Interdisciplinary Science Review 11 (2): 211-218.
Beger, H., 1927. Beitr/ige zur Okologie und Soziologie der luftlebigen (atmosphytischen) Kieselalgen. Ber. Deutsch. Bot. Ges. 45: 385-407.
Berglund, B.E. & M. Ralska-Jasiewiczowa, 1987. Pollen analysis and pollen diagrams. In Berglund, B.E. (ed.): Handbook of Holocene Palaeoecology and Palaeohydrol- ogy. John Wiley & Sons, Chicester: 455-484.
Berner, R.A., 1971. Principles of chemical sedimentology. McGraw-Hill, 240 pp.
Berner, R.A., 1981. Authigenic mineral formation resulting from organic matter decomposition in modern sediments. Fortsch. Min. 59: 117-135.
Bernhardt, H., J. Clasen & E.A. Nusch, 1970. Vergleichende Untersuchungen zur Ermittlung der Eutrophierungsvor- g~nge und ihrer Ursachen and Riveris- und Wahnbachtal- sperre. Abschlussbericht 1968-1970. Forschungsvorhaben Wasser 3/68.
Birkenmajer, K., 1981. Raised marine features and glacial history in the vicinity of Arctowski Station, King George Island (South Shetland Islands, West Antarctica). Bulletin of the Polish Academy of Sciences, Serie Science de la Terre 29: 109-117.
Birkenmajer, K., R. Ochyra, I.U. Olsson, & L. Stuchlik, L., 1985. Mid-Holocene Radiocarbon-dated Peat at Admiralty Bay, King George Island (South Shetland Islands, West Antarctica). Bulletin of the Polish Academy of Sciences, Earth Sciences 33: 7-12.
BjOrck, S., P. Sandgren, & R. Zale, 1991b. Late Holocene Tephrochronology of the Northern Antarctic Peninsula. Quat. Res. 36: 322-328.
BjOrck, S., C. Hjort, O. Ingrlfsson, & G. Skog, 1991d. Ra- diocarbon dates from the Antarctic Peninsula - problems and potential. In J.J. Lowe (ed.), Radiocarbon Dating: Re- cent Applications and Future Potential. Quaternary Pro- ceedings 1, Quaternary Research Association. Cambridge: 55-65.
Bj6rck, S., H. H~tkansson, R. Zale, W. Karlrn, & B. Liedberg JOnsson, 1991a: A late Holocene lake sediment sequence from Livingston Island, South Shetland Islands, with palaeoclimatic implications. Antarctic Science 3: 61-72.
BjOrck, S., N. Maimer, C. Hjort, P. Sandgren, O. Ingrlfsson,
269
B. Wallrn, R.I. Lewis Smith, & B. Liedberg JOnsson, 1991c. Stratigraphic and paleoclimatic studies of a 5500-year-old moss bank on Elephant Island, Antarctica. Arctic and Al- pine Research 23: 361-374.
Blfimel, D.W., R. Emmerman & W. Smykatz-Kloss, 1985. Vorkommen und Entstehung von trioktaedrischen Smek- titen in den Basalten und BOden der KOnig-Georg-Insel (S-Shetlands/West-Antarktis). Polarforschung 55,1: 33- 48.
Bock, W., 1963, Diatomeen extrem trockener Standorte. Nova Hedwigia 5: 199- 247.
BostrOm, K. 1967. Some pH-controlling Redox Reactions in Natural Waters. Advances in Chemistry Series 67: 286- 311.
Bourelley, P. & E. Manguin, 1954. Contribution ~t la flore algale d'eau douce des Iles Kerguelen. Mrmoires de l'Institute Scientifique de Madagascar 5: 7-56.
Brendem~lhl, J., 1950. ()ber die Verbreitung der Erddi- atomeen. Arch. Mikrobiol. 14: 407-449.
British Antarctic Survey, 1979. British Antarctic Territory, Geological Map. Series BAS 500, Sheet 2, Edition 1.
Brown, G., 1980. Associated Minerals. In Brindley, G.W. & Brown, G. (eds): Crystal Structures of Clay Minerals and their X-ray Identification. Mineralogical Society, London: 361-410.
Brown, G. & G.W. Brindley, 1980. X-ray Diffraction Proce- dures for Clay Mineral Identification. In Brindley, G.W. & Brown, G. (eds): Crystal Structures of Clay Minerals and their X-ray Identification. Mineralogical Society, London: 305-359.
Carlsson, G.W.F., 1913. Stisswasser-Algen aus der Antark- tis, St~d-Georgien und der Falkland Inseln. Wiss. Ergebn. der Schwedischen Sadpolar Exp. 1901-1903, 4/14: 1-94.
Charles, D.F., 1985. Relationship between surface sediment diatom assemblages and lakewater characteristics in Ad- irondack Lakes. Ecology 66 (3): 994-1011.
Chester, R. & M.J. Hughes, 1967. A chemical technique for the separation of ferro-manganese minerals, carbonate min- erals and adsorbed trace elements from pelagic sediments. Chem. Geol. 2: 249-262.
Clapperton, C.M. & D.E. Sugden, 1980. Geomorphology of the St. Andrews Bay-Royal Bay area, South Georgia. Brit- ish Antarctic Survey Miscellaneous Map Series, Sheet 1.
Cleve, P.T., 1894-95. Synopsis of the naviculoid diatoms. Kungl. Sv. Vet. Akad. Handl. I, 26: 1-194; II, 27: 1-219.
Cleve-Euler. A., 1951-1955. Die Diatomeen von Schweden und Finnland. Kungl. Sv. Vet.Akad. Handl. 4, 2:1 (1951): 1-163; 3:3 (1952): 1-153; 4:1 (1953): 1-255; 4:5 (1953): 1-158; 5:4 (1955): 1-232.
Cholnoky, B.J., 1968. Die Okologie der Diatomeen in Bin- nengew/issern. Lehre, 699 pp.
Curtis, C.D., M.L. Coleman & L.G. Love, 1986. Pore water evolution during sediment burial from isotopic and mineral chemistry of calcite, dolomite and siderite concretions. Geochim. Cosmochim. Acta 50: 2321-2334.
Digerfeldt, G., 1972. The Post-Glacial development of Lake
270
Trummen. Regional vegetation history, water level changes and palaeolimnology. Folia Limn. Scand. 16:96 pp.
Digerfeldt, G., 1988. Reconstruction and regional correlation of Holocene lake-level fluctuations in Lake BysjOn, South Sweden. Boreas 17: 165-182.
Drever, J.I., 1973. The preparation of oriented clay mineral specimens for X-ray diffraction analysis by a filter- membrane peel technique. Am. Miner. 58: 553-554.
Engstrom, D.R. & H.E. Wright Jr, 1984. Chemical stratyg- raphy of lake sediments as a record of environmental change. In Haworth, E.Y. & J.W.G. Lund (eds): Lake Sediments and Environmental History. Leicester Univer- sity Press: 11-68.
Engstrom, D.R., E.B. Swain & J. Kingston, 1985. A palae- olimnological record of human disturbance from Harvey's Lake, Vermont: geochemistry, pigments, and diatoms. Freshwat. Biol. 15: 261-288.
Foged, N., 1980. Diatoms on 0land, Sweden. Bibliotheca Phycologica, 49: 1-98. Foged, N., 1982. Diatoms in Born- holm, Denmark. Bibliotheca Phycologica, 59: 1-175.
Florin, M.-B., 1970. Late-glacial diatoms of Kirchner Marsh, S.E. Minnesota. Nova Hedwigia 31: 667-756.
Garrels, R.M. & Ch. L. Christ, 1965. Solutions, Minerals and Equilibria. Harper & Row, N.Y. 450 pp.
HS.kansson, H., 1984. The recent diatom succession of Lake Havgftrdssj~3n, South Sweden. In: Proceedings of the 7th Symposium in fossil and recent diatoms, Philadelphia 1982: 411-429.
Hansen, K., 1959. Sediments from Danish lakes. J. Sedim. Petrol. 29, 38-46.
Hansson, L.-A. & H. HSkansson, 1992. Diatom community response along a productivity gradient of shallow Antarc- tic lakes. Polar Biol. 12: 463-468.
Haworth, E.Y., 1976. Two Late Glacial (Late Devensian) diatom assemblage profiles from Northern Scotland. New Phyt. 77: 227-256.
Hickman, M. & D. H. Vitt., 1973. The aerial epiphytic dia- tom flora of moss species from Subantarctic Campbell Is- land. Nova Hedwigia 24: 443-458.
Hjort, C., O. Ingrlfsson & S. BjOrck, 1992. The last major deglaciation in the Antarctic Peninsula region - A review of recent Swedish Quaternary research. In Y. Yoshida (ed.), Recent progress in Antarctic Earth Science. Terra Scien- tific Publishing Company; Tokyo: 000-000.
Hobbs, G.J., 1968., The geology of the South Shetland Is- lands. IV. The geology of Livingston Island. British Ant- arctic Survey Scientific Reports 47: 1-34.
Holm, E., 1984: Review of Alpha-Particle Spectrometric Measurements of Actinides. Int. J. Appl. Rad. and Isot. 35 (4): 285-290.
Hustedt, F., 1930-66. Die Kieselalgen Deutschlands, Oster- reichs und der Schweiz. In: Rabenhorst's Kryptogamen- flora von Deutschland, Osterreich und der Schweiz, 7. Leipzig.
Hustedt, F., 1934. Die Diatomeenflora von Poggenpohls Moor bei DOtlingen in Oldenburg. Bremer Wiss. Ges. Ab-
handl, u. Vortrttge Jg 8/9: 362-403. Hustedt, F., 1938/39. Systematische und 6kologische Untersuchungen tiber die Diatomeenflora von Java, Bali und Sumatra. Systematis- cher Teil (1938), Archiv. Hydrobiol. Suppl. 15:130-506; Allgemeiner Teil (1938) Archiv Hydrobiol. Suppl. 15: 638- 790; (1939) Suppl. 16: 1-155, 274-394.
Hustedt, F., 1942. Diatomeen aus der Umgebung von Abisko in Schwedisch-Lappland. Arch. Hydrobiol. 39: 82-174.
Hustedt, F., 1957. Dia Diatomeenflora des Flussystems der Weser im Gebiet der Hansestadt Bremen. Abhandlungen, naturw. Verein Bremen 34 (3): 181-440.
Ing61fsson, O., C. Hjort, S. Bj~rck & R.I. Lewis Smith, 1992. Late Pleistocene and Holocene glacial history of James Ross Island, Antarctica. Boreas 21: 209-222.
Jackson, M.L., 1975. Soil Chemical Analysis - Advanced Course. 2nd edition, 10th Printing. Published by the author, Madison, Wisc. 991 pp.
Janssens, J.A., 1990. Ecology of Peatland Bryophytes and Palaeoenvironmental Reconstruction of Peatlands using Fossil Bryophytes. Methods Manual, Update August 1990. Available from the author.
John, B.S., 1972. Evidence from the South Shetland Islands towards a glacial history of West Antarctica. In D.E. Sug- den & R.J. Price (eds.), Polar Geomorphology, Institute of British Geographers, 75-92.
Johnsen, S.J., W. Dansgaard, H.B. Clausen & C.C. Langway, 1972. Oxygen isotope profiles through the Antarctic and Greenland ice sheets. Nature 235: 429- 434.
Jouzel, J., G. Raisbeck, J.P. Benoist, F. Yiou, C. Lorius, D. Raynaud, J.R. Petit, N.I. Barkov, Y.S. Korotkevitch & M. Kotlyakov, 1989. A comparison of deep Antarctic ice cores and their implications for climate between 65,000 and 15,000 years ago. Quat. Res. 31: 135-150.
Jarstad, K., B. Salbu & E. Roaldset, 1982. Vertical distribu- tion of trace elements in fresh water, saline water and sed- iments from Lake Rorholtfjorden, Norway. Chem. Geol. 36: 325-347.
Kappen, L. & H. Straka, 1988. Pollen and spores transport into the Antarctic. Polar Biology 8: 173-180.
Krammer, K. & H. Lange-Bertalot, 1986. S~lsswasserflora von Mitteleurope. Bacillariophyceae. 1 Teil. Naviculaeae. Stuttgart, New York. Gustav Fischer Verlag. 876 pp.
Krammer, K. & H. Lange-Bertalot, 1988. SOsswasserflora von Mitteleurope. Bacialh'iophyceae. 2 Teil. Surirellaceae. Stuttgart, New York. Gustav Fischer Verlag. 596 pp.
Krammer, K. & H. Lange-Bertalot, 1991 a. B acillariophyceae. 3. Teil: Centrales, Fragilariaceae, Eunotiaceae. In Ettl, H., Gerloff, J., Heynig, H. & Mollen hauer, D. (eds.): Stlss- wasserflora yon Mitteleuropa. 576 pp.
Krammer, K. & H. Lange-Bertalot, 1991b. Bacillariophyceae. 4. Teil: Achnantha- ceae. Kritische Erg~nzungen zu Nav- icula (Sineolata) und Gomphonema. In Ettl, H., Gerloff, J., Heynig, H. & Mollenhauer, D. (eds.): S~isswasserflora von Mitteleuropa. 576 pp.
Krasske, G., 1932. Beitrttge zur Kenntnis der Diatomeenflora der Alpen. Nova Hedwigia 72: 92-134.
Krasske, G., 1938. Beitrage zur Kenntnis der Diatomeenflora yon Island und Spitzbergen. Arch. Hydrobiol. 33: 503-533.
Krasske, G., 1939. Zur Kieselalgenflora Sadchiles. Arch. Hy- drobiol. (und Planktonkunde) 35: 349-468.
Krausse, G.L., C.L. Schelske & C.O. Davis, 1983. Compari- son of three wet-alkaline methods of digestion of biogenic silica in water. Freshwater Biology 13: 73-81.
Krieger, W., 1933. Die Algen. In Hibzheimer, M. (ed.): Das Naturschutzgebiet Schildow Teil II, Neudamm und Berlin, 55-82.
Lange-Bertalot, H. & K. Krammer, 1989: Achnanthes, eine Monographie der Gattung mit Definition der Gattung Coc- coneis und Nachtrfigen zu den Naviculaceae. Bibliotheca Diatomologica 18. 393 pp. J. Cramer, Berlin.
Le Cohu, R. & Maillard, R. 1983. Les diatom6es mono- raphid6es del lles Kerguelen. Annales Limnologie 19:143- 167.
Le Cohu, R. & Maillard, R. 1986. Diatom6es monoraphid6es del lies Kerguelen (a l'exclusion des Monoraphid6es). An- nales Limnologie 22: 99-118.
Lumsden, D.N., L.G. Shipe & R.V. Lloyd, 1989. Mineralogy and Mn geochemistry of laboratory-synthesized dolomite. Geochim. Cosmochim. Acta 53: 2325-2329.
Lund, J.W.G., 1945-1946. Observations on soil algae. I. The ecology, size and taxonomy of British soil diatoms. New Phytol. 44: 196-219, (1945); 45: 56- 110, (1946).
Markgraf, V. 1989. Palaeoclimates in Central and South America since 18,000 BP based on pollen and lake-level records. Quat. Sci. Rev. 8: 1-24.
Markgraf, V. 1991. Late Pleistocene environmental and cli- matic evolution in southern America. Bamberger Geogr. Schr. 11: 271-281.
Matthies, D., R. M~iusbacher & D. Storzer, 1990. Deception Island tephra: A stratigraphical marker for limnic and ma- rine sediments in Bransfield Strait area. Zentralblatt fur Geologie und Pal~ontologie, Teil 1: 153-165.
Mfiusbacher, R. 1991. Die jungquartare Relief- und Klimag- eschichte im Bereich der Fildeshalbinsel Sud-Shetland- lnseln, Antarktis. Heidelberger Geographische Arbeiten, Heft 89:207 pp.
Mausbacher, R., J. MUller, M. MUnnich & R. Schmidt, 1989. Evolution of postglacial sedimentation in Antarctic lakes (King George Island). Zeitschrift fur Geomorphologie N. F. 33: 219-234.
McEwan, D.M.C. & M.J. Wilson, 1980. Interlayer and In- tercalation Complexes of Clay Minerals. In Brindley, G.W. & Brown, G. (eds): Crystal Structures of Clay Minerals and their X-ray Identification. Mineralogical Society, London: 197-248.
Newman, A.C.D. & G. Brown, 1987. The chemical consti- tution of clays. In Newman, A.C.D. (ed.): Chemistry of clays and clay minerals. Mineral. Soc. Mon. No. 6. Long- man Scientific & Technical: 1-128.
Oppenheim, D.R., 1990. A preliminary study of benthic diatoms in contrasting lake environments. In Kerry, K.R. & Hempel, G. (eds). Antarctic Ecosystems. Ecological
271
Change and Conservation. Springer Verlag, Berlin: 91-99. Oppenheim, D.R. & R. Greenwood, 1990. Epiphytic diatoms
in two freshwater maritime Antarctic lakes. Freshwater Bi- ology 24: 303-314.
Oppenheim, D. & C. Ellis-Evans, 1989. Depth related changes in benthic diatom assemblages of a maritime Antarctic lake. Polar Biol. 9: 525-532.
Orvig, S., 1970. World Survey of Climatology Volume 14. Climates of the Polar Regions. Elsevier, Amsterdam- London-New York.
Pankow, H., D. Haendel, W. Richter & U. Wand., 1987. Algologische Beobachtun gen in der Schirmacher- und Un- terseeoase (Dronning-Maud-Land, East Antarctica). Arch. Protistenkunde 134: 59-82.
Patrick R. & C.W. Reimer, 1966. The diatoms of the United States. Monographs of the Acad. Nat. Sci. Philadelphia, vol. l. Fragilariaceae, Eunotiaceae, Achnanthaceae, Navic- ulaceae. 688 pp.
Patrick, R. & C.W. Reimer, 1972. The diatoms of the United States. Monograph of the Acad. Nat. Sci. Philadelphia vol. 2. Entomoneidaceae, Cymbellaceae, Gomphonemaceae, Epithemiaceae, 213 pp.
Pennington, W., 1978. Responses of some British lakes to past changes in land use on their catchments. Verh. Inter- nat. Verein. Limnol. 20: 636-641.
Petersen, J. Boye, 1928. The aerial algae of Iceland. The Bot- any of Iceland 2: 325-447.
Petersen, J. Boye, 1935. Studies on the biology and taxonomy of soil algae. Dansk Bot. Arkiv 8, 183 pp.
Ralsbeck, G.M., F. Yiou, D. Bourles, C. Lorius, J. Jouzel & N. Barkov, 1987. Evidence for two intervals of enhanced 1~ deposition in Antarctic ice during the last glacial pe- riod. Nature 326: 273-277.
Renberg, I., 1976. Paleolimnological investigations in Lake Pr~istsj~n. Early Norrland 9:113-159.
Roos, P., E. Holm & R.B.R. Persson, A. Aarkrog, & S.P. Nielsen, 1992. Flux of 21~ 137Cs, 239+ 240pu ' and 241Am
in the Antarctic Peninsula area. Science of the Total En- vironment, in press.
Round, F.E., 1957. Studies on bottom-living algae in some lakes of the English Lake district. J. Ecol. 45: 133-148.
Round, F.E., 1965. The epipsammon: a relatively unknown freshwater algal association. Br. phycol. Bull. 2(6): 456- 462.
Round, F.E., 1968. Biologie der Algen. 315 pp. Stuttgart. Round, F.E., R.M. Crawford & D.G. Mann, 1990. The di-
atoms. Biology and morphology of the genera. Cambridge Univ. Press, Cambridge. 747 pp.
Salden, N., 1978. Beitr~tge zur ()kologie der Diatomeen (Ba- cillariophyceae) des SUsswassers. Decheniana 22: 1-238.
SchlUter, M., 1961. Zur Bedeutung der litoralen Diatomeen unserer Gewasser. Z. Fischerei 10 NF, 4/5: 351-359.
Schmidt, R., R. M~iusbacher & J. MUller, 1990. Holocene diatom flora and stratigraphy from sediment cores of two Antarctic lakes (King George Island). J. Paleolimn. 3: 55- 74.
272
Schuster, R.M., 1966. The Hepatiaceae and Anthocerotae of North America, east of the hundredth meridian. Vol. 1. 812 pp. Columbia Univ. Press.
Schwabe, G.H., 1970. Auf Surtsey Island im Sommer nach- gearisene nicht marine Algen, Shriften des naturwiss. Vere- ins fttr Schleswig-Holstein, Sonderband Surtsey: 31-100.
Simonsen, R., 1962. Untersuchungen zur Systematik und ~)kologie der Boden diatomeen der westlichen Ostsee. In- ternationale Revue der gesamten Hydrobiologie. System- atische Beihefte 1, 1-144.
Stine, S. & M. Stine, 1990. A record from Lake Cardiel of climate change in southern South America. Nature 345: 705-708.
Suess, E., 1979. Mineral phases formed in anoxic sediments by microbial decomposition of organic matter. Geochim. Cosmochim. Acta 43: 339-352.
Sugden, D.E. & C.M. Clapperton, 1986. Glacial history of the Antarctic Peninsula and South Georgia. South African Journal of Science 82: 508-509.
Tatur, A. & R. del Valle, 1986. Badania paleolimnologicne i geomorfologicne na wyspie krola jerzego-Antarktyka za- chodnia (1984-1986). Preglad Geologiczny 11: 621-626.
Ter Braak, C.J.F., 1988. CANOCO - a FORTRAN pro- gramme for canonical community ordination by [partial] [detrended][canonical] correspondence analysis, principal component analysis and redundancy analysis (version 2.1). Technical Report, LWA-88-02, 95 pp. Wageningen, Ner- herlands.
Ter Braak, C.J.F. & I.C. Prentice, 1988. A theory of gradi- ent analysis. Adv. Ecol. Res. 18, 271-317.
Troian, F.L., H.C. Fensterseifer & M.A. Fontoura-Hansen, 1990. Difratometria de raios-x em rochas tufiticas das Pen- insulas Fildes (Ilha Rei George) e Stansbury (Ilha Nelson), Shetland do Sul, Antarica. Serie Cientifica Instituto Antfir- tico Chileno 40: 9-19.
Van Heurck, H., 1908. Expedition Antartique Beige. R6sul- tate du Voyage du S.Y. 'Belgia' en 1897-1899. Botanique, Diatom6es, 129 pp. J.-E. Buschmann, Anvers.
Warncke, E., 1980. Spring areas: ecology, vegetation, and comments on similarity coefficients applied to plant com- munities. Holarctic Ecology, vol. 3(4) DISS. 333 pp.
Wasell, A. & H~kansson, H. 1992. Diatom stratigraphy in a lake on Horseshoe Island, Antarctica: a marine:brackish- fresh water transition with comments on the systematics and ecology of the most common diatoms. Diatom Re- search 7: 157-194.
Weaver, Ch.E. , 1989. Clays, Muds, and Shales. Develop- ments in Sedimentology 44. Elsevier, Amsterdam: 819 pp.
Winkler, M.G., 1985. Diatom evidence of environmental changes in wetlands: Cape Cod National Seashore. Center for Climatic Research. Inst. for Env. Studies. Univ. of Madison, Madison.
Zale, R. & W. Karl6n, 1989. Lake sediment cores from the Antarctic Peninsula and surrounding islands. Geogr. Ann. 71A: 211-220.