INSTITUTE OF PHYSICS - International Nuclear Information ...
47
UPPSALA UNIVERSITY INSTITUTE OF PHYSICS
-
Upload
khangminh22 -
Category
Documents
-
view
1 -
download
0
Transcript of INSTITUTE OF PHYSICS - International Nuclear Information ...

UPPSALA UNIVERSITY
INSTITUTE OF PHYSICS

The determination of Pb-210 and
Ra-226 in lake sediments and
dating applications
by
M. Farid A.F. El-Daoushy
Institute of Physics, University of
Uppsala, Box 530, S-751 21 Uppsala,
Sweden
;/tlIP-979 April 1978
Abstra 7.
The a tural radioactive isotopes Pb-210 and Ra-226 were
me as <\ ed in two sediment cores. The Pb-210 was determined
by a-»etection of its grand-daughter product Po-210,
using the isotope dilution technique and a surface barrier
detect or. Some technical improvements in the polonium
extraction were achieved. The radon emanation technique
was used for the determination of Ra-226. The ot-activity
of Kn-222 was measured using an ionization chamber with
an improved filling system, which allows both low level
measurements and counter calibration with standard active
samples. The memory effect due to adsorption of Rn-222
on the counter walls is studied.
The accumulation rates are calculated from the unsupported
Pb-210. The results from one core, Gillfjärden, are in good
agreement with some studies of the reservoir effect using
C-14. The data from the other core, Lake Växjösjön, indicated
an irregularity in the Pb-210 profile. Results from other
studies on Lake Växjösjön showed a similar propensity.
SW ISSN 0042-0263

Introduction
General — Ra-226 which belongs to the naturally occurring
U-238 decay series gives rise to Rn-222,which escapes
from the ground surface of the land at an average rate2
of 42 atoms/min/cm (Israel, 1951) into the atmosphere.
Radon concentrations vary by a factor of a hundred or more
between the ocean bodies and land areas, (Junge, 1963).
The Rn-222 (3.8 d) remains in the atmosphere until it decays
t r.rough a series of short-lived daughters to Pb-210 which
despite its long half-life (22.26+0.22 yrs), does not fuse
uniformly with the atmosphere because of its short period
of residence. Poet et a_l. (1972) and Rangarajan et ai.. (1975)
estimated a mean atmospheric residence of about one week.
The seasonal variations in activity of the short-lived
radon daughters and Pb-210 in the surface air are mainly
due to the seasonal changes in the stability of the atmosphe-
ric surface air (Gopalakrishnan, 1970). No significant change
in the source and composition of the air mass in areas like
Moscow and Finland (Rangarajan et cd., 1975) were observed.
After this short residence, Pb-210 is first locally scavenged
either by dry fallout or precipitation, then merges into the
yeochemcial and biological cycles taking place in lakes,
oceans and soils. This part of Pb-210 which permeates the
atmosphere is called unsupported Pb-210.
Persson (1970, 1974), who studied the deposition of Pb-210
on the lichen-moors of northern Sweden in 1961-1969 and
Central Sweden in 1961-1972, estimated a value of about
1.7i0.3 nCi/m y. He stated that he found a systematic error
due to Pb-210 which is produced from the Ra-226 content in
the lichen. He claims that this error is negligible because
Pb-210 takes some 80 years to reach radioactive equilibrium
with Ra-226. Ramzaev et a_l. (1969) and Blanchard & Moore (1970)
estimated that the Ra-226/Pb-210 activity ratio in lichens

is only about 0.01-0.08. Results from northern and southern
Finland concerning Po-210 and Pb-210 in the arctic food
chain of the Lapps (Kauranen and Miettinen, 1969) are in
good agreement with those from Sweden.
Pb-210 is also derived from the Ra-226 (1620 yrs) which
either originally exists in the soils, rocks and waters
(ground water, standing water and streams) or is introduced
(as well as its daughter Rn-222) into soil and water reser-
voirs through geochemical, geophysical or biochemical processes
such as solubility, ionic exchange, chemical precipitation
or coprecipitation, leaching, oxidation/reduction, scavenging
by particulates, weathering, drainage and biological acti-
vities of organisms. This part of Pb-210 is called supported
Pb-210. Supported Pb-210 may or may not be in secular equi-
librium with Ra-226.
Studies of Pb-210 and Ra-226 in different reservoirs yield
some important results. Pb-210 is sequestered by organic
material and rapidly homogenized within organic rich layers
of soils (Lewis, 1977). Lewis estimated a mean residence
of 2000 yr for metals similar to Pb-210 in soil profiles,
and also indicated that stream sediments directly reflect
the metal content of soils. In addition, Lewis found that
iron and manganese hydroxides cause Pb-210 to be rapidly
scavenged from water river systems onto suspended particles.
Megumi and Mamuro (1977) found that the concentrations of
uranium series nuclides increase with the decrease in particle
size for a soil particle size below 0.15 mm.
Moore and Poet (1976) who found that Pb-210/Ra-226 activity
ratios in different surface soil profiles are generally
greater than unity, but decrease with depth to less than
unity, claimed that the activity ratios would undoubtedly
increase to unity at greater depths, where the Ra-226, Rn-222
and Pb-210 reach equilibrium. They refer to Eakins1 and

Morrison's calculation that the depth at which Pb-210/Ra-226
activity ratio becomes unity is 128 yrs for an undisturbed
sediment.
Lead-210 dating and applications — The Pb-210 dating method
was originally introduced by Goldberg (1962).
Picciotto et a_l. (1968) used Pb-210 for determination of
the rate of snow accumulation at the pole of relative inaccessi-
bility (eastern Antarctic plateau). In environments polluted
by Pb injection from combustion of leaded gasoline (in inter-
nal combustion engines) the Pb-210 dating method is hazardous
(Picciotto, private communication 1976). Crozaz (1967) showed
that in polar regions the névé (taken in the Antarctic, in
Greenland and on an alpine glacier) behaves as a closed system
from the moment of precipitation, and the accumulation rates
deduced from the Pb-210 method are in excellent agreement
with those of other methods.
Petit (1974) studied the stable lead content and the lead
isotopic composition in sediment cores from a small Belgian
pond and used Pb-210 to construct a time scale. He found
that the stable lead content steeply increases with decreasing
depth, whereas the lead isotopic composition becomes progres-
sively less radiogenic (the Pb-210 activities were normalized
for the decay since the time of deposition). The lead isoto-
pic composition of the top sediment was identical to that in
the atmosphere. Krishnawamy et al.. (1971) described some
successful attempts to use radiometric techniques which in"
eluded Pe-55 (2.7 yrs), Cs-137(30 yrs), S1-32(DO0 yrs) and
Pb-210 to date lake sediments. Cs-137 and Fe-55 are derived
primarily from testing of nuclear weapons, while Si-32 is
produced naturally through the interaction of cosmic rays
with atmospheric argon.

Pennington et ajl. (1976) reviewed the dating methods of
recent sediments and included results from Blelharo Tarn
which is a small lake near Windennere.
Nozaki et al. (1976) examined two sediment cores from the
Mid-Atlantic Ridge. Both cores were taken at a depth of
about 2500 m, for the top sediment layers of one core, they
obtained C-14 ages which were constant and earlier than ex-
pected. This was attributed to biogenic mixing, and the
mixing coefficient at the surface was calculated from the
Pb-210 pattern. The data for the second core indicated
physical disruption of the section.
Krishnawamy et al. (1975) also studied Pb-210/Ra-226 dis-
equilibrium in the Santa Barbara Basin, and concluded that
the fate of lead (and Pb-210) is rigidly controlled by the
settling particles.
Robbins and Edgington (1975) determined the sedimentation
rates in Lake Michigan using Pb-210 and Cs-137. They con-
cluded that Pb-210 dating is a major technique for establish-
ing the age of recently deposited sediments in the Great
Lakes, and their results are in agreement with those derived
from more laborious and less exact methods. Their Pb-210
profiles were normalized for sediment compaction. They also
found secular equilibrium between supported Pb-210 and Ra-226
in about two-thirds of the stations studied. They used Cs-137
to check the recovery of the uppermost levels of the sediment
cores as suggested by Koide et al. (1973), since they claim
that there is a possibility of losing the top portions of
the sediment in normal coring devices. Robbins et al. (1977)
correlated the post-depositional redistribution in the Great
Lakes (as indicated from Pb-210 and Cs-137 profiles) with
deposit-feeding organisms such as benthic macro-invertebrates
(oligochaetes and amphipods) which are present in the top
layers.

Oldfield et al. (1978) examined some Pb-210 (unsupported)
profiles from Lough Erne, Northern Ireland and Lake Ipea,
Papua New Guinea. These Pb-210 profiles were "kinked" and
showed that the concentration of the unsupported Pb-210
increases markedly with depth, such a character being in-
consistent with the basic dating assumption of constant ini-
tial concentration (c.i.c.) of the unsupported Pb-210 per
unit dry weight in the sediment cores at each depth. More-
over the profiles, as judged from results of other studies,
have not been significantly disturbed. Oldfield et al.
explained that a dilution of unsupported Pb-210 occurred by
accelerated sediment accumulation. They further adopted an
alternative approach for Pb-210 dating, assuming a constant
rate of supply (c.r.s.), and used the integrated Pb-210 acti-
vity for deriving dates. They tested the validity of the alter-
native approach by making use of the presence of some synchro-
nous events in the sediment cores as a scale of reference.
They concluded that both the c.i.c. and c.r.s. models will
give identical results, and possibly reliable dates, in cases
where the accumulation rates have been constant.
Koide et al. (1973) discussed Th-228/Th-232 and Pb-210 geo-
chronologies in marine and lake sediments. They found that
reducing environments can alter the distribution of lead iso-
topes and thus limit the Pb-210 geochronologies, while the
immobility of thorium isotopes in the deposits makes the
Th-228/Th-232 technique of special value. Koide et al. (1976)
further applied the Ra-226 chronology in coastal marine sedi-
ments.
Chemical treatment of samples
ofPbi-210
General — Several chemical methods were used, which are
practically based on either ^-detection of Bi-210 (the daughter
product of Pb-210) or a-detection of Po-210 (the grand-daughter
product of Pb-210). The latter technique (the isotopic dilution)

which includes an internal yield tracer, shows many advantages
over the former (Eakins and Morrison, 1976). Eakins et al.
(1976), who checked the mobility of polonium in one core,
found it to be non-existent. The Po-210 was extracted accord-
ing to a procedure which is essentially developed by Eakins
and Morrison (1976), but with further modifications. Figure 1,
gives a short description of the chemical treatment, the
details being given in Appendix I.
Technique used — A quartz extraction apparatus. Fig. 2, was
used. The quartz allows the extraction to be carried out at
a higher temperature than could be attained using glass ware.
Complete recovery of the organic material from the sediment
is achieved at such temperatures.
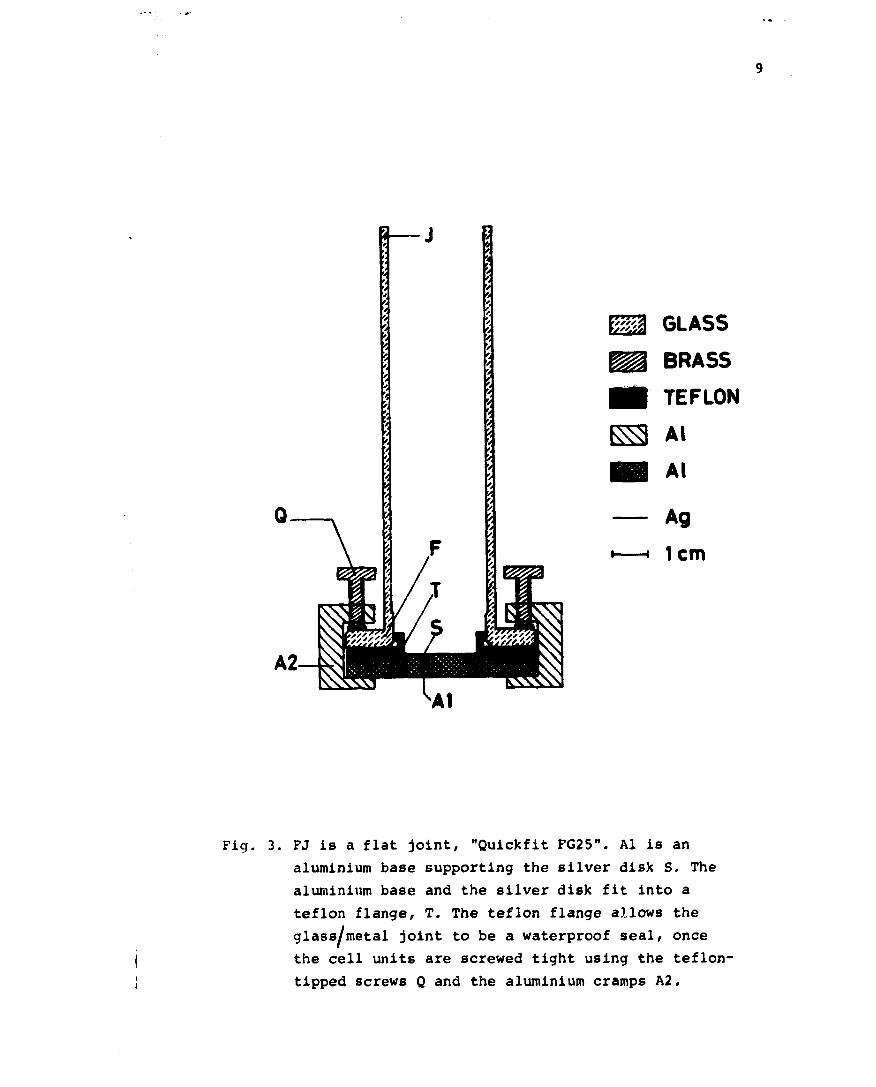
The thin polonium a-source for the spectral analysis was pre-
pared using the self-deposition cell, Fig. 3. The principles
of the process are defined by Flynn (1968).
The glass ware was invariably washed with cone. HNCU, which
effectively removed any remains from the chemical treatment
of sediment samples. All the chemicals used apart from the
nitric acid (used for washing) are of analytical grade and
the water is doubly distilled.
General — Two methods are in current use, namely isotopic
dilution (Koide and Bruland, 1975) and radon emanation
(Lucas (1957), Högberg and Gustavsson (1973), Li et al. (1977)).
Technique used — Ra-226 is separated as chloride (melts at
1000°C) from the sedimei
using a barium carrier.
1000°C) from the sediment residue after polonium distillation
The details of the chemical treatment for Ra-226 are also
given in Appendix I.

Dry grounded sediment*
Carefully add cone. HC1until no CO, or UJS is evolved.
Add 3-10 pCi Po-208 spike and10 ag Ba-carrier for each 1 g drysediment. Stir for complete blendingof the mixture.
Dry at 110°C overnight.
Distil at 550-600°C for ~20 min,use the quartz distillation apparatus.
Treat the residual sedimentwith cone. HC1 until noH-S is evolved.
Dry at 110 C overnight
Extract the radium,barium, and other metallicchlorides, using hot, double-distilled water and ultra-sonicagitation. Filter into the radonbottle.
Further extract with double-distilled water and ultra-sonicagitation. Filter into the radonbottle.
Wash any remains by shaking indouble-distilled water. Filterto the radon bottle.
Clean the conical joint andglass valves of the bottle.Grease them.
Remove any trapped Ra-gasand fill the bottle with NClose the valves and storethe bottle.
V
Condense the polonium vapourand the organic material on wet-ted glass wool in a quartz tube.
Treat the condensed materialwith cone. UNO. under reflux.Complete oxidation of the organiccondensation is recommended.
Allow the extract to cool andfilter using a glass funnel,porosity 2.
Treat the filtrate with cone HC1until complete removal of HMO..Never let the solution dry.
Allow the final solution to cool(~10°C) and filter to the assembleddeposition cell with its silver disk.
Adjust the final normality of thesolution to 1,5-2 N and the totalvolume to ~40 ml.
Plate the silver disk at85-90°C for ~3 hr.
Disassemble the depositioncell and wash the silver diskwith acetone, ethylated alcoholand double-distilled water.Dry with IR-lamp.
Fig. 1. A short description of the chemical treatment.

GT
i 10 cm
QUARTZ
GLASS WOOL
HCI-TREATED SEDIMENT, SPIKED WITH Po-208
GLASS *• TO WATER OR CLOSED HOOD
Fig. 2. The quartz extraction apparatus. Q^T? *-s a quartz tube equipped with a
conical joint, used for handling the sediment. QiT, is also a quartz tube
but both ends have conical joints. One end is fitted to QJ^J ' an<* *"ne
other to a conical joint of a glass tube GT, which is connected to some outlet
Q,T, serves as a trap for the evolved vapors which pass through the wetted
glass-wool plug, GW. During the distillation of the polonium chloride, Q2T2
and Q,F are placed in a furnace at 600 C.00
Ag1cm
Fig. 3. FJ is a flat joint, "Quickfit FG25". Al is an
aluminium base supporting the silver disk S. The
aluminium base and the silver disk fit into a
teflon flange, T. The teflon flange allows the
glass/metal joint to be a waterproof seal, once
the cell units are screwed tight using the teflon-
tipped screws Q and the aluminium cramps A2.

10
Preliminary tests showed that radium is strongly adsorbed
on glass ware unless a suitable amount of Ba-carrier is
added.
Four bottles which contained a standard Ra-226 solution
(0.01 yg Ra-226 and 0.07 rog Ba-carrier) were used, partly
for calibration of the ionization chamber (during a seven-
month period) and partly to estimate the amount of the barium
required as a carrier for the radium separation. After a
seven months in storage, the bottles were washed five times
with tap water and a further five times with distilled water
(radium chloride is soluble in both cold and hot water).
About 45+5 % of the initial Ra-226 activity still remained
in each bottle, indicating that the amount of Ba-carrier
was not sufficient. The amount of Ba-carrier was increased
to 2 mg for each 1 pCi Ra-226, this amount sufficing for com-
lete recovery of radium. The use of barium as a carrier allows
not only a complete radium extraction from the sediment residue
but also prepares the bottles for background routine work.
Up to 92±2 % of the remaining Ra-226 activity in the bottles
is removed when the recommended chemical procedure, Appendix II,
is used.
Activity measurements
The thin ot-sources are mounted externally, and then introduced
to the counting chamber, Fig. 4. The details of the electronics
used, together with the silicon surface barrier detector, are
given in Fig. 5. A resolution of 25 to 45 keV, for the Po-208
peak (5.114 MeV) which is well differentiated from the Po-210
peak (5.305 MeV), is a partial consequence of the chemical
treatment.
An ionization chamber (Högberg and Gustavsson, 1973) is used for
the measurement of the Rn-222 activity. The extracted Ra-226
sample is stored in a glass bottle (gas washing bottle, equipped
with a glass filter) for a known period, then the emanated

11
in

12
CHI
TVS
A-A
Fig. 4. The counting chamber. CHI is the chamber body. H is
a horizontally moving rod which transports the sample after
external mounting into the chamber, while Fl and F2 are used
to guide the rod into a predetermined position. The sample
can be moved vertically by means of square-threaded screw,
V2/V3, which is connected by the screw, II, with a handle, VI.
The square-threaded screw is fixed to the chamber body by a
sheath, V4 and the screws 12. HV supports the aluminium tray
with the plated silver disk. D is the surface barrier detector,
which is shielded by a pure copper shield P. The detector D
is connected to its electronic system by a vacuum feedthrough
M (BNC to Microdot, 0RTEC-C13). The copper shield, P, is
screwed to the chamber cover, CH2. The chamber is made vacuum-
tight with the help of viton O-rings Rl, R2, R3, R4, R5, R6,
R7, R8, R9 and RIO. The parts of the chamber are screwed to-
gether, with the screws 13, 14 and 15. The chamber is held in
position by insulated bakelite legs L2, T1-T2 is a copper tube
for cooling the detector.

SB
Detector
Power Supply
ORTEC-114
Preamplifier
ORTEC-125
ORTEC
BA-026-450-100
Spectroscopy
Amplifier
ORTEC-472A
Micro-
amneter
Bias Supply
ORTEC-428
System Power Supply for
Series 1100 Analyzer System ND
1024 ADC
ND-540
Memory
ND
Data Handling
ND
Power Bin
ORTEC
401B/402H
Teletype
Readout
Display
Oscilloscope
Type 503
Fig. 5. A schematic diagram of the electronics used with the silicon surface barrier detector. 11

14
Rn-222 is swept to the chamber by a nitrogen gas. The
filling system is improved to allow not only low level
counting but also calibration of the chamber by standard
Ra-226 samples, the details of the modifications being
given in Fig. 6.
Results and discussion
The
Efficiency — The efficiency of the counter, including the
filling system, was determined using a Ra-226 standard
(Amersham). A value of 1.33+0.05 was obtained, with applica-
tion of a chamber voltage of 3000 V, and a discriminator
level somewhat higher than that used by Högberg and Gustavsson
(1973). The uncertainties in all the physical measurements
are included in the final uncertainty. The Rn-222 needs about
three hours to reach secular equilibrium with the daughters
Po-214 and Po-218. No determination of the individual effi-
ciencies was made.
Slope of the plateau — Since the ionization chamber is fair-
ly sensitive to electro-negative impurities, special care is
taken during the counter filling. For a pure Rn/N- sample,
the slope of the plateau is 0.001%/100 V (Fig. 7).
Background — The background of the ionization chamber
(Högberg and Gustavsson, 1973) was studied from June 77
onwards. It was first determined as 2.2 cpm with a long
term variation of about 0.7 cpm. This variation was attri-
buted to mechanical vibrations of the ionization chamber
and its tube electronical system. However, recent experiments
show that the Rn-222 undergoes adsorption to the counter walls.
Taking this factor into consideration the value of the background
is determined as 2.35±0.15 cpm. Li et al. (1977) improved the
reproducibility of their counting chamber by using quartz
material instead of perspex. About 0.15% of the standard acti-
vity is adsorbed in the course of c. four hours. In one

15
TRAP, TRAP, Co-FURNACE,- W C -78'C 35<TC
SAMPLE BOTTLE MANOMETER
09
•
CONICAL JOINT
SPHERICAL JOINT
TO MAIN VACUUM LINE
ONE-WAV GLASS VALVE
THREE-WAV GLASS VALVE
GLASS FILTER
ALUMINA
Co
STAINLESS STEEL
PERSPEX
GLASS PIPE
Co PIPE
10 cm
Fig. 6. The gas-washing bottle (sample bottle) used for
the collection of the emanated Rn together with
the modified filling system.

io3 I30"
Q.
ill
oco
8 10-
BOTTLE 300/341, Ra-STANDARD, MEASURED ON 77-09-28.BOTTLE 300/341, Ra -STANDARD, MEASURED ON 78-03-08.BOTTLE 282/397, Ra-STANDARD, MEASURED ON 78-03-09.BOTTLE 165/279, Ra-STANDARD, MEASURED ON 78-03-11.BOTTLE 288/251, Ra-STANDARD, MEASURED ON 78-03-12.
T
1.0 2.0VOLTAGE,kV
3.0 4.0
Fig. 7. Characteristics of the used ionization chamber. The Ra-226 standard in each bottle is8.0+0.3 nCi. The discriminator level was changed slightly on October 14th, 1977. The Ca-furnacewas charged with fresh calcium on March 8th, 1978. The furnace was the baked at 350°C until thedegassing ceased.

17
experiment the adsorbed activity needed about three days for
recovery (to about 98%) from the counter surfaces, even if
the counter was refilled three times. The results from
another experiment are given in Fig. 8.
The _surface_barrier_detector
Efficiency — The efficiency of the detector is estimated
to be 1.16IT when the distance between the sample and the detec-
tor is ~4 mm. The detector has an effective surface area of
450 mm2, while that of the sample is ~40C mm2. The Po-208
sample was supplied by Eakins and, according to him, checked
against standardized material (private communication, 1977).
Background and blank runs — In the preliminary tests of the
detector and the electronics,a Po-210 source was used which
contaminated the detector. The contamination was so low as
to allow the measurement to be carried out, but corrections
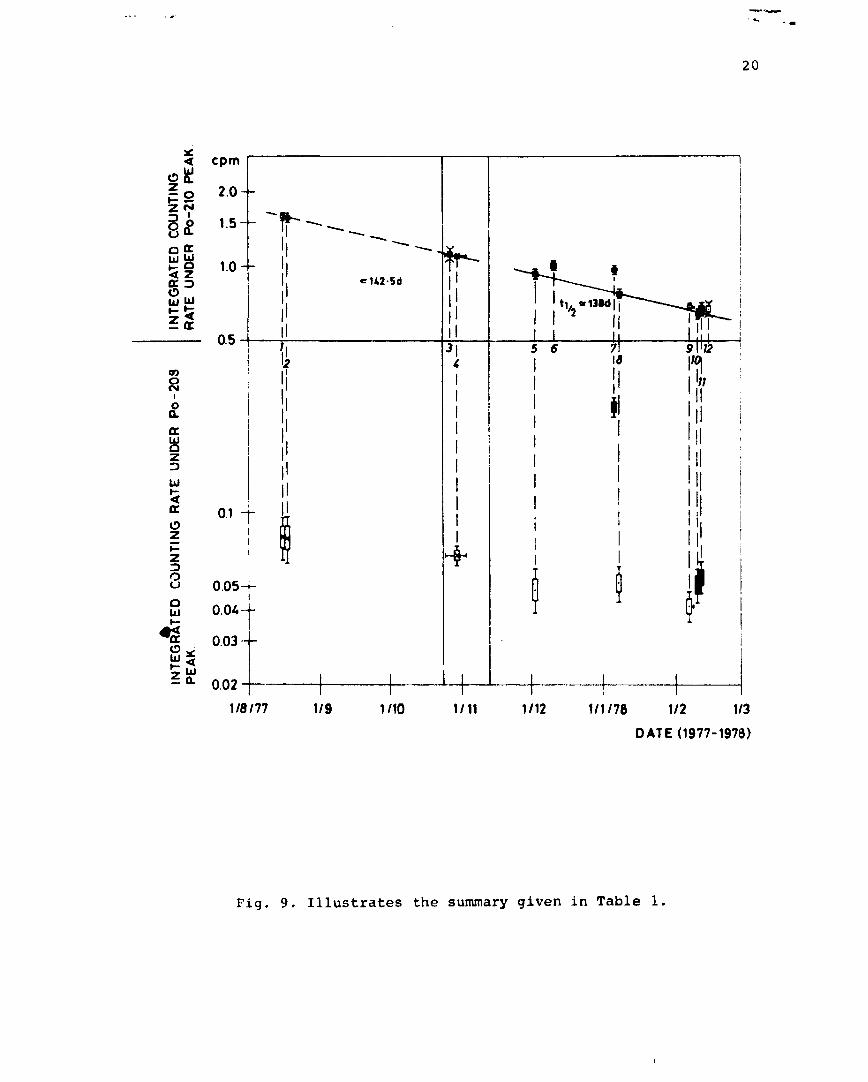
for the background are needed. Table 1 and Fig. 9 summarize
the background history of the detector, and also provide in-
formation on the blank runs and the spikes. Background runs 1
and 2 show that the background is almost exclusively due to
the active polonium diffused in the thin gold front electrode
of the detector. The level of the background is partly a
function of the radiation dose received by the detector. Poet
et al. (1972) used different detectors to measure samples
with high and low activities in order to minimize the difficul-
ty arising from the contamination of the detector from recoiled
polonium atoms and volatility of some Po-atoms. The blank
runs 10 and 11 show the suitability of the chemicals used,
and indicate the absence of memory effects on the quartz and
the glass ware when well washed. Blank 1 and blank 2 refer to
two different runs, which were carried out using two different
sets of glass ware, together with two different quartz extrac-
tion apparatus. Runs 3 and 12 show thepurity of two different
spikes, namely spike 1 (supplied by Eakins) and spike 2 (pre-
pared in Finland). Appendix III gives some information on

O 100 200 300TIME.hrs
Fig. 8. The recovery of the adsorbed Rn-222 from the counter walls, accompanied by a change
in the counting efficiency from 2TT to 4n. At time zero the standard was in secular equilibrium
(about three hours after charging the ionization chamber with the standard), one hour later
the standard was pumped out and the ionization chamber charged with pure nitrogen.
00

Table 1. A ausaury of a) The background of the used Si-detector, b) The blank runs of the glaas ware, quartzand the used chemicals, c) spike purity.
Date
77-08-16
77-08-18
77-10-27
77-10-25int i l -11-1
77-12-03
77-12-12
78-01-06
78-01-08
78-02-06Mttil-02-M
78-02-10
78-02-12
78-02-15
Run No.
1
2
3
4>2
5
6
7
8
9
10
11
12
Specification
Background*
Background
Background + 4 . 7 pCi
Po-208, spike No.2
Background
Background
Background • blank •
3.2 pCi Po-208, spikeNo. 1
Background * blank
• 20 ag Ba-carrier
Background
Background
Background • blank 1
Background • blank 2
Background + 4.7 pCi
Po-208, spike No. 1
Electronic Settings
AC
A
C
A
C
.G.
.G.
.G.
.G.
.C.
.G.
170,1024
250.
1024
250,
256
L.L.D. 2.5X
channels
L.L.D.7X
channels
L.L.D.7Z
channels
Integrated
Po-208 peak
0.078±0.009
0.079+0.009
0.067+0.003
O.O491O.OOS
O.27O1O.O12
0.05310.005
0.042±0.003
O.0SHO.004
0.05510.004
counting rate , cpm
Po-210 peak
1.595*0.035
1.5751O.O3S
1.13010.030
1.11010.015
0.93510.020
1.02010.020
0.97010.020
O.7751O.O1S
0.690*0.010
0.64010.015
0.68010.015
0.68010.020
a) Saaple holder is 50 cm away froa the detector surface. Ail other runs are carried out at a distance ofapproximately 4 as between the saaple holder and the detector surface.
b) Th« copper shielding tube of the detector is cleaned by acid.A.G. - amplifier gain, L.L.D. • low level discriminator, C.G. • conversion gain. VD
20
1/8/77 1/10 1/11 1/12 1/1/78 1/2 1/3
DATE (1977-1978)
Fig. 9. Illustrates the summary given in Table 1.

21
spike 1 and spike 2. Figure 10 shows a spectrum of spike 1.
Blank runs 6 and 7 demonstrate memory effects of inefficient
washing of the glass ware. Background runs 5 and 8 indicate
a decaying activity with the expected half-life foi. Po-210.
There seems to be a tendency to stability of the background
(value) at the beginning of February 1978, which implies that
the activity registered by the detector compensates the
decay.
The Gillfjärden sample — A sediment core from Gillfjärden
was originally collected for the study of the reservoir effect,
using C-14 as a tracer.
The Po-210 was extracted according to the chemical treatment
given in appendix I. The samples were dried at 110±2°C, and
it was difficult to grind them. No Ba-carrier was used for
the extraction of radium, but the final radium extracts were
filtered directly to the gas-washing bottles for the radon
collection. The metallic contaminants in the sediment may
have acted as carriers. Thus the received radium content may
be considered as a lower limit. Table 2 gives a summary of
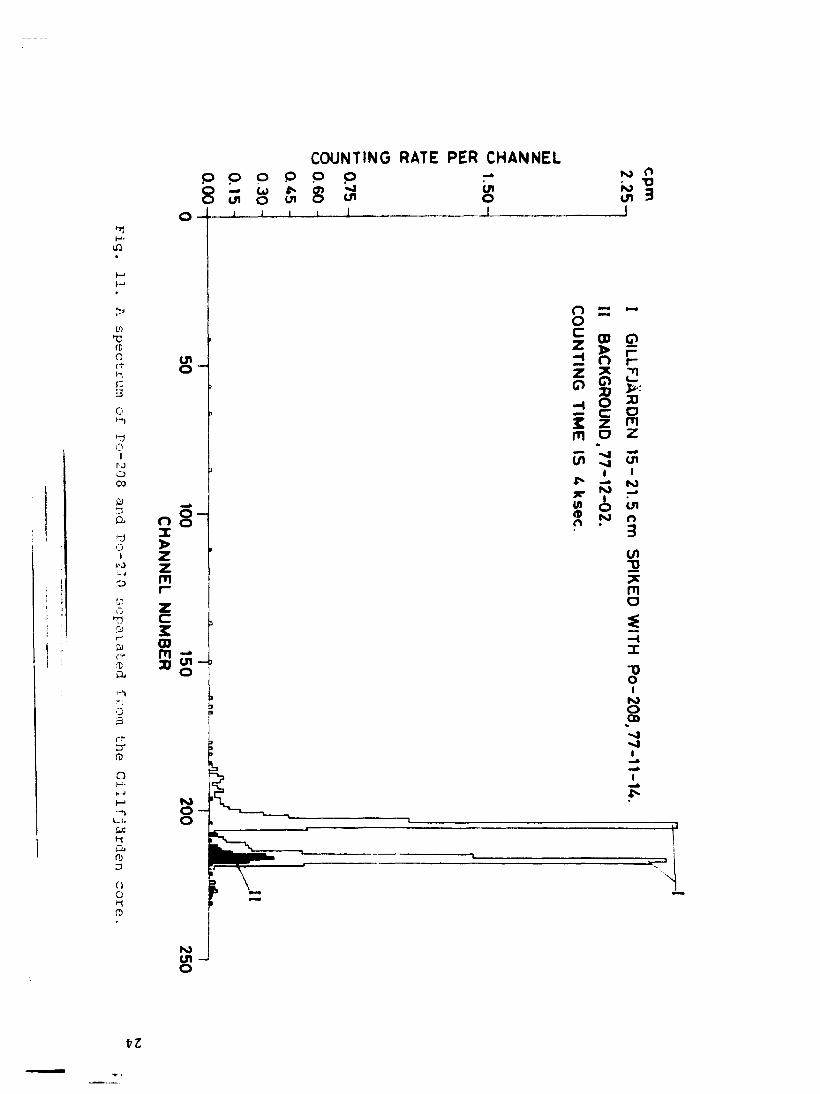
the total Pb-210 activity in the measured slices. Figure 11
shows a spectrum of the Po-210 and Po-208 separated from a
slice.
The preliminary results of the unsupported Pb-210 profile
are given in Fig. 12. The estimated accumulation rate is
£1.35 cm/yr. This value is in good agreement with the studies
made by Olsson and Ingmar (in preparation).
The Lake Växjösjön samples — This core was collected by
Digerfeldt using two different samplers. The upper part of
the core, from zero to 70 cm depth was collected with one
and the same sampler, while the lower part, deeper than 70 cm,
was collected with another one.

cpm
3i6(H
Ul
aUJa.UJ
<r
2 1.20-1
8 096
072 H
048
024aoo
I Po-208 SPIKE (10mt), 78-02-15.
II BLANK 1,78-02-10.
COUNTING TIME IS 10 ksec.
II
50 100 150CHANNEL NUMBER
200
Fig. 10. A spectruin from the spike 1 (4.7 pCi) .

23
Table 2
Total lead-210 activity, measured in Oct./Nov. 77 in a
sediment core from Gillfjärden. The core was originally
sampled (April 1971) for a determination of the carbon-14
apparent age of the top sediment. The activities are given
with la uncertainty. The uncertainty includes not only
the statistical uncertainty due to the counting rates
(trie total counting rate and the background counting rate)
but also the errors in the physical measurements such as
the sediment weight, the amount of spike used and the decay
of the spike.
No. Depth, cm Total Pb-210 activity0 , dpm/g
1
2
3
4
5
6
7
7.5-9.0b)
7.5-9.0
10.5-12.0
12.0-13.5
13.5-15.0
15.0-21.0
21.5-23.0
18.8±0.6b)
17.5+0.3
13.4+0.3
12.8+0.3
12.6+0.2
12.1+0.2
11.5+0.2
a) Preliminary measurements of radium-226 indicate that the
supported Pb-210 activity is at least 5.5+0.4 dpm/g.
Radium-226 extraction was carried out without Ba-carrier.
b) The sample is measured in July 77 at a lower discrimina-
tor level. The activity is normalized for the Pb-210
decay but not for the discriminator level.
rr
a
a:
OO
COUNTING RATE PER CHANNEL& C> o O Q O r»
8 — Co ** O? yå a!tn o 01 o f o
o-i—1—1—1—i-
CO•c(Dctr
!
3
0Hl
'?
. |i
ro0co
fti3
,Tj
01
!N j
CO
r r
1 ^ 0 ,
0X
Zzm
(9m21
8-
0-0
0
00czH
z0•H
mui
^ ksec.
CD
O
0172JO
-4-Jt12-02.
Or~
SOmzen121.5 cm
(/)T)PC
m0
NIOCD

o»
EQ.>-*
> 501
<ociiXtQ.
aui
'1SEDIMENT CORE FROM GILLFJÄROEN
SAMPLE No 1 ( table 2 ).
1O.O-
aui
inu
|z
UJ
1 0 -
PRELIMINARY ESTIMATEO ACCUMULATION
RATE < 1.35 c m / y r
10 15D E P T H , c m
20 25
Fig. 12. The accumulation rate .in the Gillfjärden core.

26
The toal Pb-210 in some slices is given in Table 3. All
the slices were treated according to the chemical procedure
given in appendix I. The time for the nitric-acid treatment
(step No. 10 in the chemcial treatment) is also given in
Table 3. Th" prolonged period of treatment with nitric acid
does not appear to affect the Po-210 yield. One hour, or even
less, is sufficient. Figures 13, 14, 15 and 16 illustrate
various Po-210 and Po-208 spectra obtained from the polonium
extracts of sane slices. The influence of some metallic conta-
minations on the final spectrum is seen in Fig. 16. The total
Pb-210 is given in Fig. 17, and the Ra-226 content in Table 4.
An irregularity is seen in the profile.
The unsupported Pb-210 in the investigated slices of the
core is given in Table 5. The calculated sedimentation rate
is given in Fig. 18, using the least square fitting. A value
of 0.82±0.03 cm/yr was obtained, based on the measured Ra-
-content at three levels, and the weighted average content
for the others, while the uncertainty increases to ±0.10 if
a common value, the weighted average, for the Ra-content is
used. The Ra-226 activity of the deepest slice is so low that
a disturbance may be suspected; consequently the accumulation
rate was calculated with and without this slice and a mean
value chosen yielding a value 0.80±0.10 cm/yr.
Conclusions — The present study shows that adsorption is
a serious problem and precautions should be considered to
avoid the risks of memory effects. The results of the Pb-210
dating method are promising, especially if the amount of the
supported Pb-210 is carefully determined in the different
parts of the investigated cores.

27
Table 3
Total lead-210 activity (dpa/g) in the sediment core A,
from Lake VäxjösjOn collected June 76, and Measured in
Dec. 77/Jan. 78. The tine for the nitric-acid treatment
(step No.10 in the chemical treatment) of each sediment
slice is also given. The activities are given with lo
uncertainty, which is only due to the uncertainty in the
counting rates (total counting rate and background counting
rate), since the incidence of other physical uncertainties
in weight, amount of spike etc. falls below 10%.
No. Depth, cm Total Pb-210 activity. Treatment time
dpm/g with HNO., hrs
1.5
5
1
5
21
21
18
18
21a)
3
5.5
4.5
12
1
a'The solution was contaminated by metallic iron during its
evaporation (step No.12 in the chemical treatment).
1
2
3
4
5
6
7
8
9a)
10
11
12
13
14
5-10
10-15
15-20
20-25
25-30
30-35
40-45
60-65
60-65a)
80-85
100-105
115-120
130-135
150-155
20.7510.30
21.15±0.20
22.60±0.40
18.7010.20
18.1010.20
15.8510.25
14.3010.20
10.4010.20
12.70l0.45a)
8.2510.15
6.3010.10
7.0010.15
5.2510.10
3.5510.10

cpm
ui
o
3.0-JUI<teo
12-
0.9-
06-
O3-
0.0
I VÄXJÖSJÖN 25 -30cm SPIKED WITH Po-208, 77-12-29.
II BACKGROUND, 77-12-03
COUNTING TIME IS 4 ks*c.
i
SO 100 150CHANNEL NUMBER
200 250
Fig. 13. A spectrum of Po-208 and Po-210 separated from the Lake VÄxjösjön core,09

cpm
1.80-1
1.20-
oUl
VLO2 060-i a*.
0 24
012 -
000
I VÄXJÖSJÖN 60 -65 cm SPIKED WITH Po-208, 7B-02-05
I! BACKGROUND • BLANK 2, 78-02-11.
COUNTING TIME IS 10 k sec.
50 100 150CHANNEL NUMBER
200
Fig. 14. A spectrum of Po-208 and Po-210 separated from the Lake Växjösjön core. Is»

COUNTING RATE PER CHANNEL
•fl
(O
•OroortH
c
oOI
toOoo0>
O J
OI
to
toIDtJ
H0>(taa
icrofc»x*
(D
ORO:(0
a
oo
p o o8 — it
ai o
gizzni
z
3
ocni
os1
pcn1
O1 "D
9 3
O CD
O
5 ~O O:
Z
mo _•3 S
rs i iy» i -
i
8cncno3(/>3
mo
?roOOB
scn

cpm
0.90-,
tu
z< 060oeruiQ.
5tr
I Q3(Hz 0.24 -
8 018 -0.12 -
ao6-aoo-
I VÄXJÖSJÖN 60-65 cm,SPIKED WITH Po-*.
II BACKGROUND -̂ BLANK 1, 78-02-10.
COUNTING TIME IS 10 k sec.
77-12-15
50 100 150CHANNEL NUMBER
200
Fig. 16, The influence of metallic contamination on the spectrum of Po-208 and Po-210 separated
from Lake Växjösjön. The metallic contaminant was introduced during the chemical treatment
(step No. 12).

20-
5-
LAKE VÄXJÖSJÖN, CORE A.
$ SAMPLE No.9(tobltJ)
gi
I>
CT
I
<owi
Q.
15-
10-
t
\V\
\ »\\
1
50DEPTH,cm
i100
i150
Fig. 17. The total Pb-210 profile in Lake Växjösjön.
33
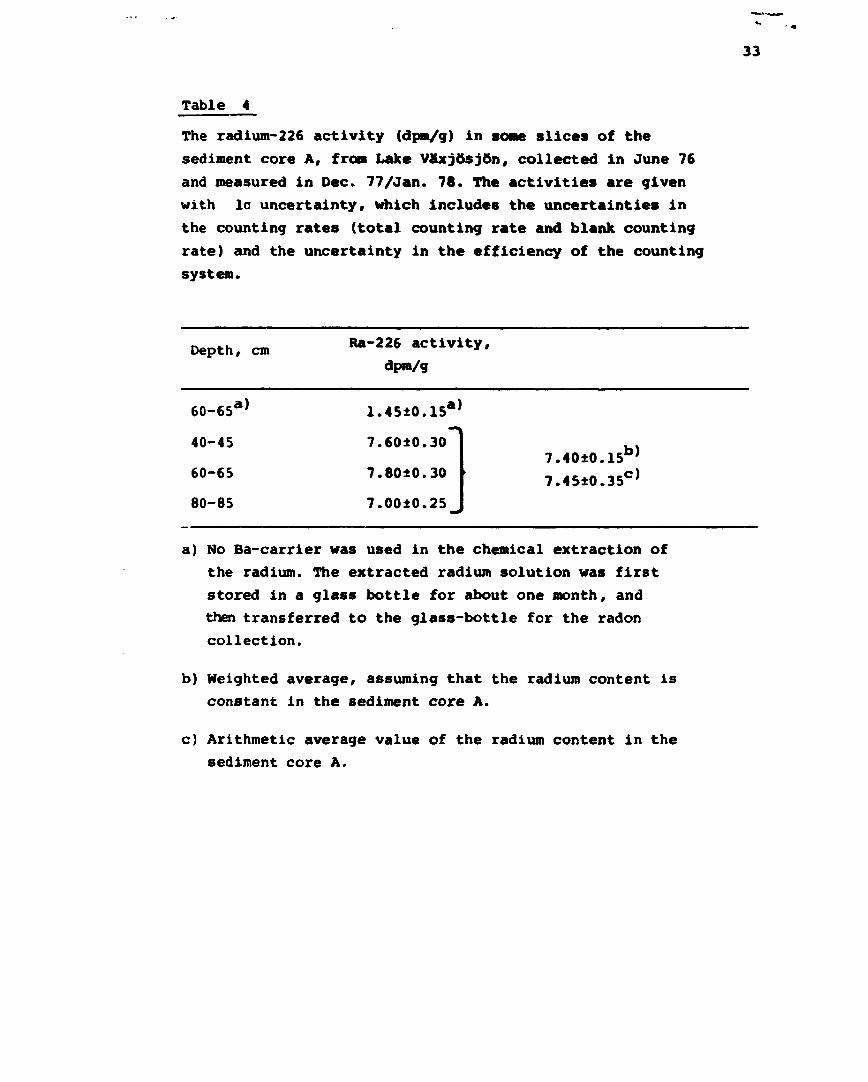
Table 4
The radium-226 activity (dpm/g) in sone slices of the
sediment core A, from Lake Växjösjön, collected in June 76
and measured in Dec. 77/Jan. 78. The activities are given
with la uncertainty, which includes the uncertainties in
the counting rates (total counting rate and blank counting
rate) and the uncertainty in the efficiency of the counting
system.
Depth, cm
60-65a)
40-45
60-65
80-85
Ra-226 ac t iv i ty ,dpin/g
1.45±0.15a)
7.6010.30
7.80±0.30
7.00i0.25_
>77
.40±0
.4510.15b>.35C>
a) No Ba-carrier was used in the chemical extraction ofthe radium. The extracted radium solution was firststored in a glass bottle for about one month, andthen transferred to the glass-bottle for the radoncollection.
b) Weighted average, assuming that the radium content isconstant in the sediment core A.
c) Arithmetic average value of the radium content in the
sediment core A.

J4
Table 5
Unsupported lead-210 activity (dpm/g) in the sediment core A,
from Lake Växjösjön collected in June 76 and measured in
Dec. 77/Jan. 78. The activities are given with la uncertainty.
No. Depth, cm Unsupported Pb-210
using the weightedaverage
activity . dpm/g
using the arithmeticaverage
1
2
3
4
5
6
7
8
10
11
12
13
14
5-10
10-15
15-20
20-25
25-30
30-35
40-45
60-65
80-85
100-105
115-120
130-135
150-155
13.35*0.35
13.75+0.25
15.2010.45
11.3010.25
10.7010.25
8.4510.30
6.9010.25
3.0010.25
0.8510.20
-1.1010.20
-0.4010.20
-2.1510.20
-3.8510.20
13.3010.45
13.7010.40
15.1510.55
11.2510.40
10.6510.40
8.4010.45
6.8510.40
2.9510.40
0.8010.40
-1.0510.35
-0.3510.40
-2.1010.35
-3.8010.35

35
LAKE VÄXJÖSJÖN, CORE A.
+ CALCULATED USING THE WEIGHTEDAVERAGE FOR Ra-226.
+ CALCULATED USING THE MEASUREDVALUE FOR Ra-226 AT THE ACTUALLEVEL.
DEPTH,cm
Fig. 18. The accumulation rate in the Lake Växjösjön

Acknowledgements
I would like to express with pleasure my sincere gratitude
to Professor Kai Siegbahn, who made it possible for me to
carry out this work at the Institute of Physics, Uppsala
University.
My sincere thanks to Professor Ingrid U. Olsson for the
successful choice of subject, kind help, skilful guidance
and all the stimulating discussions we had together.
Special thanks are due to Valter Södergren and Einar Söderberg
for their good-natured help with the technical and the glass
blowing work respectively.
I am grateful for the valuable assistance of Rolf Didriksson
and Lars Einarsson at the radiochemical laboratory.
I would also like to acknowledge the help which I have received
from Birgitta Stenström, Tomas Kronberg and Maud Söderman
during the performance of the polonium distillation.
Many thanks are also due to Docent Gunnar Digerfeldt and
Tord Ingmar for collecting the samples.
This work was supported by Swedish Natural Science Research
Council.

J7
References
Battarbee, R.W. and Digerfeldt, G., Archiv f. Hydrobiologie
77, 330, 1976.
Blanchard, R.L. and Moore, J.B., Health Physics 18, 127, 1970.
Cato, I., Doctoral dissertation. Department of Quaternary
Geology, University of Uppsala, Sweden. STRIAE 6, 158 pp., 1977.
Cohen, B.L., Physical Review 100, 206, 1955.
Crozaz, G., Symposium on Radioactive Dating and Methods of
Low-Level Counting, Monaco, March 1967. Vienna, I.A.E.A. 385,
1967.
Eakins, J.D. and Morrison, R.T., United Kingdom Atomic Energy
Authority, Harwell, AERE-R8475, Oct. 1976.
Flynn, W.W., Analytica Chimica Acta 43, 221,1968.
Goldberg, E.D., Symposium on Radioactive Dating, Athens,
Nov. 196?. Vienna, I.A.E.A. 121, 1963.
Gopalakrishnan, S., Proceedings of the National Symposium or
Radiation Physics, Bombay, India, Nov. 24*27, Bhabha At.
Res. Centre, Bombay, 1970.
Högberg, S.A.C. and Gustavsson, J.E., Nuclear Instruments
and Methods 113, 583, 1973.
Israel, H., Compendium of meteorology (Ed. Malone, T.E.)
American Meteorological Society, Boston, 1951.
Jackson, J.D.,Canadian Journal of Physics 34, 767, 1956.

Junge, C.E., Air Chemistry and Radioactivity, Academic,
New York, 1963.
Kauranen, P. and Neittinen, J.K., Health Physics 16, 287, 1969.
Koide, M., Bruland, K.W. and Goldberg, E.D., Geochimica et
Cosmochimica Acta 37, 1171, 1973.
Koide, N. and Bruland, K.W., Analytica Chimica Acta 75, 1, 1975.
Koide, M., Bruland, K. and Goldberg, E.D., Earth and Planetary
Science Letters 31, 31, 1976.
Krishnaswamy, S., Lai, D., Martin, J.M., Meybeck, M.,
Earth and Planetary Science Letters 11, 407, 1971.
Krishnaswamy, S., Somayajulu, B.L.K. and Chung, Y.,
Earth and Planetary Science letters 27, 388, 1975.
Lewis, D.M., Geochimica et Cosmochimica Acta 41, 1557, 1977.
Li, Y., Mathieu, G.,Biscaye, P. and Simpson, H.J., Earth and
Planetary Science Letters 37, 237, 1977.
Lucas, H.F., The Review of Scientific Instruments 28, 680, 1957.
Megumi, K. and Mamuro, T., Journal of Geophysical Research
82, 353, 1977.
Moore, H.E. and Poet, S.E., Journal of Geophysical Research
81, 5019, 1976.
Nozaki, Y., Cochran, J.K., Turekian, K.K. and Keller, G.,
Earth and Planetary Science Letters 34, 167, 1977.
Oldfield, F., Appleby, P.G. and Battarbee, R.W., Nature 271,
339, 1978.

39
Olsson, I.U. and Ingmar, T., in preparation.
Pennington, W., Gambray, R.S., Eakins, J.D. and Harkness, D.D.,
Freshwater Biology 6, 317, 1976.
Persson, B.R.R., Doctorial thesis. Radiation Physics Department,
University of Lund, Lund, Sweden, 1970.
Persson, B.R.R., Holm, E. and Liden, K., Oikos 25, 140,
Copenhagen 1974.
Petit, D., Earth and Planetary Science Letters 23, 199, 1974.
Picciotto, E., Cameron, R., Crozaz, G., Deutsch, S. and Wilgain,
S., Journal of Glaciology 7, 273, 1968.
Poet, S.E., Moore, H.E. and Martell, E.A., Journal of Geophysi-
cal Research 77, 6515, 1972.
Ramzaev, P.V., Nevstrueva, M.A., Dmitriev, J.M., Ibatullin, M.S.,
Lisachenko, E.P., Litver, B.Y., Moisseev, A.A., Nignikov, A.I.,
Troitskaja, M.N. and Harchenke, L.A., Fifth Symposium on Radio-
activity Investigation in Scandinavia, Helsinki, 1969.
Rangarajan, C , Gopalakrishnan, S., Chandrasekaran, V.R. and
Eapen, CD., Jornal of Geophysical Research 80, 845, 1975.
Robbins, J.A. and Edgington, D.N., Geochimica et Cosmochimica
Acta 39, 285, 1975.
Robbins, J.A., Krezoski, J.R. and Mosley, S.C., Earth and
Planetary Science Letters 36, 325, 1977.

40
Appendix I
Chemical treatment of sediment samples for polonium andradium separation:
1) Freeze-dry the sediment. Further drying at 110°C over-night .
2) Grind to a fine powder. This step is fairly difficultunless the sample is freeze dried to give a ratherfine powder. Freeze-drying is a recommended laboratoryroutine. (Cato, 1977).
3) Weigh a suitable aliquot (1 to 4 g) in quartz tube Q2T2(avoid adhesion of sediment grains to the conical joint),add 2 to 4 ml distilled water and 5 to 15 ml cone. HC1.Cease addition of HC1 when the evolution of the gasesends. CO. and H-S are likely to be evolved.
4) For each gramme of dried sediment sample, add a suitableamount 3 to 10 pCi of polonium-208 spike, then add 10 mgBa-carrier. The polonium spike is stored in 5.5 N HC1solution to avoid adsorption to the walls of the glasscontainer, since polonium is known to be strongly adsorbedon glassware. Stir with a glass rod for complete mixing.Remove any sediment from the glass rod by washing with
a little distilled water. The conical joint of the quartztube should always be washed and kept clean from possiblesediment.
5) Let the mixture dry at 110°C overnight. Carefully examinethe conical joint of the quartz tube. It should be freefrom any dried material, otherwise wash and allow to dryat 110°C. However, it is essential to prevent the finalmixture from reaching the conical joint.
6) Remove quartz tube Q^T? ^rom the oven and allow to cool.Insert a suitable plug of a wetted glass wool into themid-section of the tube QjT, (the glass wool should notbe dripping wet — if so: wring out any excess water).
7) Assemble the polonium distillation apparatus in a horizm-tal position Fig. 2. No water should drip onto the quarterQ2
T2* Tne distillation time depends on the temperature.
41
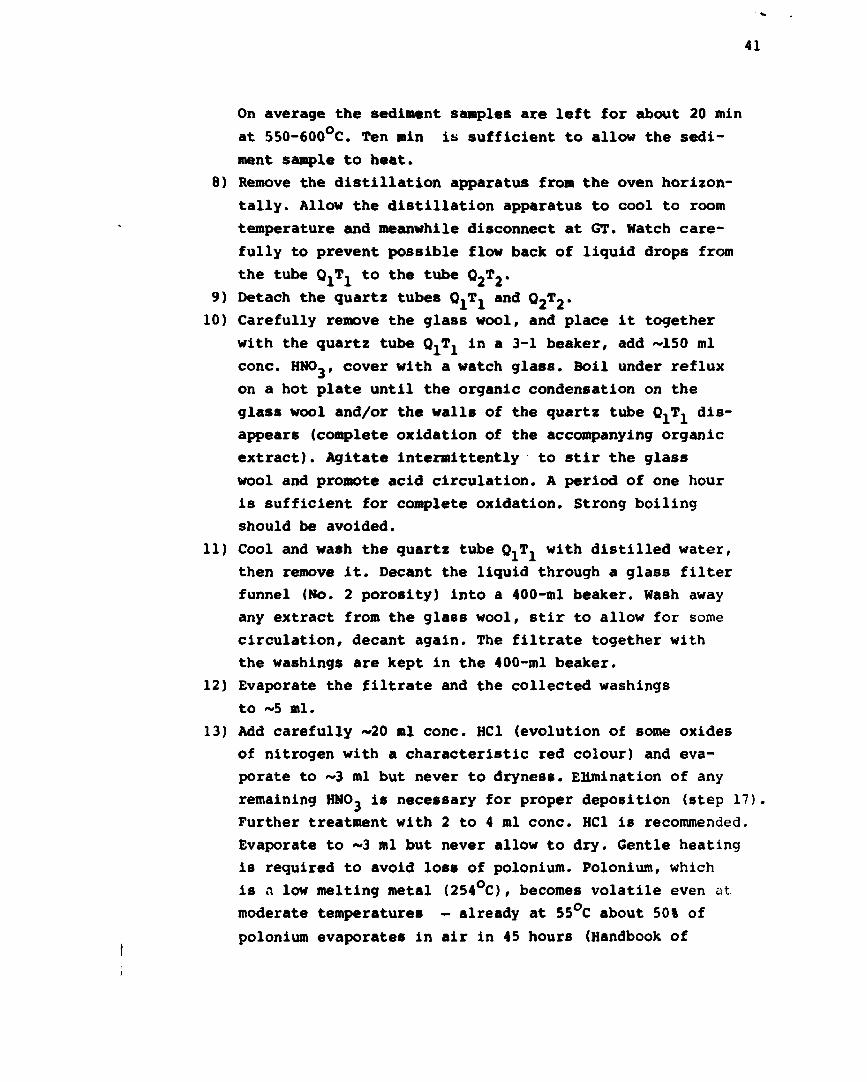
On average the sediment samples are left for about 20 minat 550-600°C. Ten min its sufficient to allow the sedi-ment sample to heat.
8) Remove the distillation apparatus from the oven horizon-tally. Allow the distillation apparatus to cool to roomtemperature and meanwhile disconnect at GT. Natch care-fully to prevent possible flow back of liquid drops fromthe tube Q^1 to the tube Q 2
T2*
9) Detach the quartz tubes O-T, and Q???*10) Carefully remove the glass wool, and place it together
with the quartz tube Q^T^ in a 3-1 beaker, add ~150 mlcone. HNO-, cover with a watch glass. Boil under refluxon a hot plate until the organic condensation on theglass wool and/or the walls of the quartz tube OiT, dis-appears (complete oxidation of the accompanying organicextract). Agitate intermittently to stir the glasswool and promote acid circulation. A period of one houris sufficient for complete oxidation. Strong boilingshould be avoided.
11) Cool and wash the quartz tube QjT. with distilled water,then remove it. Decant the liquid through a glass filterfunnel (No. 2 porosity) into a 400-ml beaker. Wash awayany extract from the glass wool, stir to allow for somecirculation, decant again. The filtrate together withthe washings are kept in the 400-ml beaker.
12) Evaporate the filtrate and the collected washingsto ~5 ml.
13) Add carefully ~20 ml cone. HC1 (evolution of some oxidesof nitrogen with a characteristic red colour) and eva-porate to ~3 ml but never to dryness. Elimination of anyremaining HMO^ is necessary for proper deposition (step 17)Further treatment with 2 to 4 ml cone. HCl is recommended.Evaporate to ~3 ml but never allow to dry. Gentle heatingis required to avoid loss of polonium. Polonium, which
is a low melting metal (254°C), becomes volatile even atmoderate temperatures — already at 55°C about 50% ofpolonium evaporates in air in 45 hours (Handbook of

!2
Chemistry and Physics, 55th edition B-25). Eakins studie 1
the volatility of polonium chloride and polonium nitrata
and found that the recovery of the chloride is quantita-
tive above 330°C, whereas about 2% of the nitrate recovers
even at 800°C. Most organic and inorganic polonium com-
pounds are either volatile or sublime at temperatures
well below 900°C, but some of them decompose
PoCl2 sublimes at 190°C while PoCl4 melts at 300°C
(in Cl atm.) and boils at 390°C.
14) Add ~5 ml HC1 (5-6 N) and cool to ~10°C.
15) Polish the silver disk with a fine grade emery paper,
wash with acetone, ethylated spirit and finally with
distilled water.
16) Assemble the deposition cell and filter the acidic
polonium solution into it. Wash the residue in the be<~ <e_
with some 2 N HC1. The final volume is about 40 ml, am
the final normality 1.5-2 N. Use distilled water to a< just
the final normality. FlyAn/reported that for most effective
deposition, the normality of the final hydrochloric acic
solution should be 1 to 2 N, while the best yield for : clf-
deposition was obtained by plating for 3 hrs in a wate
bath at 85-90°C with continuous stirring by air bubblin .
17) Plate at 85-90°C for ~3 hrs with continuous stirring V
air bubbling.
18) Disassemble the deposition cell. Wash the silver disk ' ith
acetone, ethylated spirit and distilled water. Dry car. -
fully using an infra-red lamp.
19) An aluminium tray is used to hold the plated silver di k
and introduce it into the counting chamber.
20) Add ~10 ml cone. HC1 to the residual sediment in the
quartz tube Qj^j' A H ° W to dry over night. Check compl t
reaction of the residual sediment with HC1 by the ces
tion of the evolved H-S.
21) Pre-soak the bulk sediment material with ~40 ml warn- (•>• )
double-distilled H~O, and break it up gently using a
rod. Immerse in th« ultra-sonic bath for ~2 min. at ~:
for complete dissolution of the chlorides by agitation o
the treated sediment particles. Filter using a membrar;
filter in a well cleaned gas-washing bottle for racier
collection (Rn-bottle).

43
22) Add 40 ml double distilled water and treat again for~2 min in the ultra-sonic bath (at room temperature),filter into the Rn-bottle.
23) Finally wash with 20 ml double-distilled water. Shakefor complete cleaning of the sediment grains.
24) Carefully clean the conical joint and the glass valvesof the bottle and regrease them with Apiezon grease,type L.
25) With the valves open, warm the bottle container andthen allow a slow N~ stream to bubble through theliquid for ~2 minutes.
26) Close the valves and store the bottle to collect theradon.

Appendix II
The chemical procedure used for the recovery of the
adsorbed radium-226 from the glass surfaces of the radon
collection bottle:
1) Slow and gentle etching of the glass surfaces by
rinsing with 37% HC1 for about three days, while
the bottles which were not highly contaminated were
rinsed with 5.5 N HC1.
2) Cleansing of the acidic solution with normal tap weter.
Radium chloride is known to be soluble in both cola
and hot water, and slightly soluble in HC1.
3) A second rinse with 37% HC1. The solution is boileci
gently, with suitable thermal agitation, for about
five hours.
4) Final agitation in an ultra-sonic bath (usually for 2 n
Wash with ~50 ml Ba-solution (10 mg Ba/ml sol.)-
5) A rinse with 100 nil Ba-solution, and gentle boilinc
for about one day.
6) Washing with ~50 ml Ba-solution, followed by agitatioi.
in ultra-sonic bath.
7) Immersion in 100 ml Ba-solution overnight. Removal of
the solution.

45
Appendix III
Infcrination on the Po-208 spikes.
Spike 1: prepared from natural lead which hr.s been
irradiated with He-3 ions. At the end of thu irradiation
there are -0.5% Vo-209 and ~10% Po-210 (Amtrshom, private
communication, 1977) in the Po-208 produced.
Spike 2: prepared from natural Bi-209 which in bombcrdleci
with 19 MeV protons. The Po-208 contains ~ 0 . J 2 %
Po-209 and 0.52% Po-210. These values were calculated on
the following data:
A) Bi-209 (p,2n) Po-208 with a - 0.7 barns at 19 KeV.a'
B) Bi-209 (p,n) Po-209 with a - 0.03 barr K at 19 >:oV.b)
o = O.OOM*/ rarns tit :9 KeV.c)C)
D)
B i - 2 0 9 (p ,Y)
H/2tl/2
t
(Po-210)
(Po-206)
tPo-205)
Po-2
0
2
1 0 3
LO
. 38
. 9 3
.0
with
y r .
yrs.
yrs.
a) and b) according to Jackson, 1956.
o) according Lo Cohen,
y measurements of spike 2 are in cfood atjreer.
with the given calculated values.