Input amplifier current components in the electrode interface impedancimetric bacterial growth...
22
BioMedical Engineering OnLine This Provisional PDF corresponds to the article as it appeared upon acceptance. The fully-formatted PDF version will become available shortly after the date of publication, from the URL listed below. Amplifier spurious input current components in electrode-electrolyte interface impedance measurements BioMedical Engineering OnLine 2005, 4:22 doi:10.1186/1475-925X-4-22 Carmelo J Felice ([email protected] ) Rossana E Madrid ([email protected] ) Max E Valentinuzzi ([email protected] ) ISSN 1475-925X Article type Research Submission date 31 Jan 2005 Acceptance date 29 Mar 2005 Publication date 29 Mar 2005 Article URL http://www.biomedical-engineering-online.com/content/4/1/22 This peer-reviewed article was published immediately upon acceptance. It can be downloaded, printed and distributed freely for any purposes (see copyright notice below). Articles in BioMedical Engineering OnLine are listed in PubMed and archived at PubMed Central. For information about publishing your research in BioMedical Engineering OnLine or any BioMed Central journal, go to http://www.biomedical-engineering-online.com/info/instructions/ For information about other BioMed Central publications go to http://www.biomedcentral.com/ © 2005 Felice et al. , licensee BioMed Central Ltd. This is an Open Access article distributed under the terms of the Creative Commons Attribution License (http://creativecommons.org/licenses/by/2.0), which permits unrestricted use, distribution, and reproduction in any medium, provided the original work is properly cited.
-
Upload
unt-argentina -
Category
Documents
-
view
6 -
download
0
Transcript of Input amplifier current components in the electrode interface impedancimetric bacterial growth...
BioMedical Engineering OnLine
This Provisional PDF corresponds to the article as it appeared upon acceptance. The fully-formatted PDF version will become available shortly after the date of publication, from the URL listed below.
Amplifier spurious input current components in electrode-electrolyte interface impedance measurements
BioMedical Engineering OnLine 2005, 4:22 doi:10.1186/1475-925X-4-22
Carmelo J Felice ([email protected]) Rossana E Madrid ([email protected])
Max E Valentinuzzi ([email protected])
ISSN 1475-925X
Article type Research
Submission date 31 Jan 2005
Acceptance date 29 Mar 2005
Publication date 29 Mar 2005
Article URL http://www.biomedical-engineering-online.com/content/4/1/22
This peer-reviewed article was published immediately upon acceptance. It can be downloaded, printed and distributed freely for any purposes (see copyright notice below).
Articles in BioMedical Engineering OnLine are listed in PubMed and archived at PubMed Central.
For information about publishing your research in BioMedical Engineering OnLine or any BioMed Central journal, go to
http://www.biomedical-engineering-online.com/info/instructions/
For information about other BioMed Central publications go to
http://www.biomedcentral.com/
© 2005 Felice et al., licensee BioMed Central Ltd.This is an Open Access article distributed under the terms of the Creative Commons Attribution License (http://creativecommons.org/licenses/by/2.0), which permits unrestricted use, distribution, and reproduction in any medium, provided the original work is properly cited.
1
Amplifier spurious input current components
in
electrode-electrolyte interface
impedance measurements
Carmelo J. Felice1,2, Rossana E.Madrid1,2, Max E. Valentinuzzi1,2
1Departamento de Bioingeniería (DBI)
Facultad de Ciencias Exactas y Tecnología (FACET)
Universidad Nacional de Tucumán (UNT), Argentina 2Instituto Superior de Investigaciones Biológicas (INSIBIO)
Consejo Nacional de Investigaciones Científicas y Técnicas (CONICET)
Tucumán City, Argentina
e-mails:
[email protected] (corresponding author)
ph&fx +(54)-(381)-436-4120
Postal correspondence to:
Dr. Max E. Valentinuzzi
c.c. 327, Correo Central
(4000) Tucumán
Argentina
2
Abstract
Background. In Impedance Microbiology, the time during which the measuring
equipment is connected to the bipolar cells is rather long, usually between 6 to 24 hrs
for microorganisms with duplication times in the order of less than one hour and
concentrations ranging from 101 to 10
7 [CFU/ml]. Under these conditions, the electrode-
electrolyte interface impedance may show a slow drift of about 2%/hr. By and large,
growth curves superimposed on such drift do not stabilize, are less reproducible, and
keep on distorting all over the measurement of the temporal reactive or resistive records
due to interface changes, in turn originated in bacterial activity. This problem has been
found when growth curves were obtained by means of impedance analyzers or with
impedance bridges using different types of operational amplifiers. Methods. Suspecting
that the input circuitry was the culprit of the deleterious effect, we used for that matter
(a) ultra-low bias current amplifiers, (b) isolating relays for the selection of cells, and (c)
a shorter connection time, so that the relays were maintained opened after the readings,
to bring down such spurious drift to a negligible value. Bacterial growth curves were
obtained in order to test their quality. Results. It was demonstrated that the drift
decreases ten fold when the circuit remained connected to the cell for a short time
between measurements, so that the distortion became truly negligible. Improvement due
to better-input amplifiers was not as good as by reducing the connection time.
Moreover, temperature effects were insignificant with a regulation of ±0.2 [°C].
Frequency did not influence either. Conclusions. The drift originated either at the dc
input bias offset current (Ios) of the integrated circuits, or in discrete transistors
connected directly to the electrodes immersed in the cells, depending on the particular
circuit arrangement. Reduction of the connection time was the best countermeasure.
Key words: AISI 304, amplifier drift, impedance microbiology, operational
amplifier, reactive component, resistive component
3
Background
Measurements carried out with bipolar electrodes can be modeled by a series
circuit composed of two impedances, one representing the electrolytic medium (Zm) and
another taking into account the interface (Zi) between the former and the metal itself.
From a physical point of view, the interface region extends from the larger rugosities of
the electrode surface to the deeper double molecular layer [1, 2]. Its behavior is complex
and relates to the electrode macroscopic and microscopic geometric characteristics [1,
3], to the electrolyte proper, and to the operating conditions too, as for example, the
applied current intensity or frequency [4, 5]. However, in spite of its complexity and of
the yet not fully known interface events, this region contains and can supply useful
electrochemical information [6, 7, 8]. For example, in cellular suspensions, it acts as a
highly sensitive transducer to monitor microorganism growth [7, 8, 9, 10].
In particular, in Impedance Microbiology [10, 11, 12], when interface reactance
is being recorded, growth curves typically show a maximum drift at the initial point and
thereabouts. Thereafter, the drift slowly decays. Growth curves obtained from the
medium bulk, instead, are essentially flat from the very beginning [11]. In the latter
reference, such drift effect is barely mentioned. Capacitive growth curves, for example,
are used to assess the Minimum Inhibitory Concentration (MIC) of a disinfectant, where
either appearance time or decrease to the 20% level is measured [13, 14]. Reactance
curves, instead of conductance, are more desirable because they show better sensitivity
[9]. In milk, several authors have used culture conductance during bacterial growth for
quantitative and qualitative assessment of microbial content. Interface capacitance
curves Ci have not been used even though their performance is better by far. The above-
mentioned drift has no relationship whatsoever with bacterial growth, it does not
4
stabilize with time, it lacks good reproducibility and introduces a distortion in the
temporal curves [6].
In this paper, we show that the drift is due to spurious dc input bias offset
currents (Ios) of the integrated circuits or discrete transistors directly connected to the
electrodes in the cells. Such unwanted currents slowly charge up the interface
capacitance Ci, a known phenomenon in the measurement of interface voltages, as for
example in pH-meters [15]. Nonetheless, this slow charging current (which can be
considered as a spurious dc within the measurement interval) increases the Ci value [16]
and, thus, alters the previous value. In the case of pH, the problem is solved by means of
electrometer amplifiers with sub-picoamper Ios. Commercial equipment to measure
impedance does not take care of this problem and the reactance curves often show
significant distortions.
To bring down the drift to a negligible level, we have applied three very simple
different techniques, i.e., (a) using ultra-low bias current operational amplifiers, (b)
using isolating relays instead of analog multiplexers to select the cells, and (c)
shortening the time of connection to a minimum and keeping the relays opened after
each sample. Our results show that, connecting the circuit to the measurement cell 4 s
every 5 min, produced a drift of only 0.17%/hr, turning into negligible the distortion of
the growth curves. No temperature effect is seen if its regulation is kept within ±0.2 °C
or better.
Methods
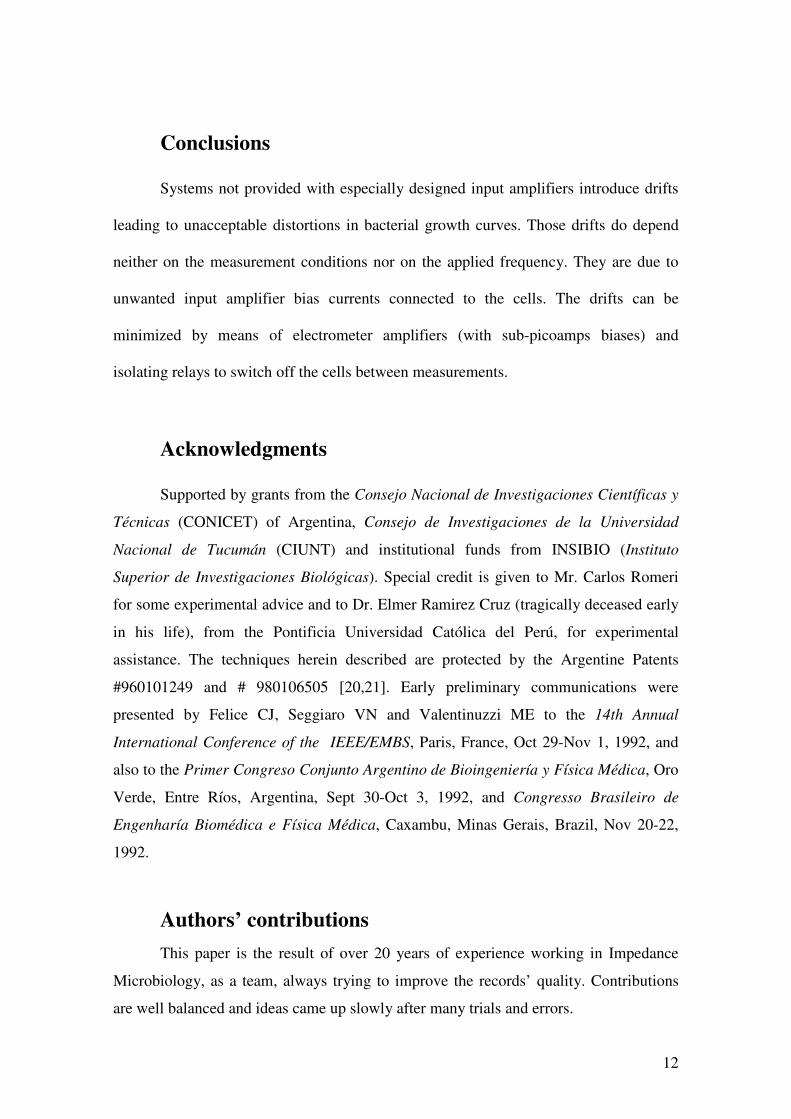
To quantify the interface reactance (Xi= 1/ωCi) drift, we used a previously
described constant current bridge circuit [6] implemented in such a way that the input
preamplifier could be easily replaced (Figure 1).
5
The cell for the assays with this bridge was a cylindrical glass tube (8 ml
volume, 15 mm diameter, 50 mm length), implemented with stainless steel
DENTAURUM wire electrodes (1 mm diameter, 10 mm length) immersed in 0.9%
NaCl solution at 37ºC. All the measurements were carried out at 120 Hz with an
electrode current density of 30 µA/cm2. Three different integrated circuits were used as
preamplifier testing units: uA741 (Ios = 20 nA, Zinput = 6 Mohms); LF356 (Ios = 3 pA,
Zinput = 1 Tohms); and AD523 (Ios = 0.25 pA, Zinput = 10 Tohms). Each was tried with
three cells other than the one described above.
Besides, to analyze the effect of the offset current with different instrument
systems, culture sterile media and electrodes, we measured Xi at 120 Hz during 200 min
using the following setups,
1) HP4192A, NB broth at (37±0.3)°C, with DENTARUM wire;
2) HP4284, BHI broth at (37±0.3)°C, with cell C1;
3) FRA-PAR, 0.9% NaCl at 26±1)°C, with cell C2;
4) BACTOMETER, 0.9% NaCl at (37±0.1)°C, with BACTOMETER cell;
where HP4192A stands for a Hewlett-Packard impedance analyzer, HP4284A is a
Hewlett-Packard precision LCR meter, FRA-PAR is a system including a 1255
SOLARTRON frequency response analyzer and a 273A PRINCETON APPLIED
RESEARCH (PAR) electrochemical interface; BACTOMETER is a patented laboratory
custom made impedance microbiology analyzer.
All these four sets measure impedance in the bipolar form. None is internally
implemented with input amplifiers in the sub-picoamp range. Current density was ≤ 64
µA/cm2. NB and BHI stand, respectively, for Nutritive Broth and Brain Heart Infusion.
The culture cells were stabilized for two hours before they were connected to the
system.

6
The cell for the first setup (including DENTAURUM® steel electrodes) was
described in a previous paper [10]. The cell named C1 is an acrylic cylindrical cell (100
mm in diameter and 10 mm in length) with two stainless steel AISI 304 electrodes
(diameter = 10 mm) polished to 0.05 µm. Cell C2 had the same electrodes but polished
to 0.3 µm.
The reasons for choosing 120 Hz can be summarized as follows,
• Low frequency is required to separate Rm from Zi [8].
• At that frequency, and also at 1,000 Hz, Xi reflects the double layer [17],
while higher frequencies do not allow discrimination between Rm and Zi , as stated
above.
• From the digital viewpoint, lower frequencies make sampling and further
processing on-line easier. Higher frequencies imply conversion frequencies
unnecessarily elevated.
As well known, the interface impedance can be characterized in its simplest
form by a series equivalent circuit Zi = Ri – j Xi; herein, we used the series reactance
because it carries the same information as the resistive component does, but it is easier
to measure [7,10].
To make the Ios effect negligible, a series of measurements were made with the
HP4284A (second setup) by actually disconnecting it after each sample was taken.
During the first hour, measurements were made every 5 min, in the second hour every
10 min and, thereafter, every 2 hours. Finally, to monitor the behavior of Xi as a
function of frequency, we used the cylindrical glass tube with DENTAURUM
electrodes immersed in saline solution at room temperature with an LF356 as
preamplifier and the constant current bridge circuit.
7
Results
The percentage drift curves obtained with each integrated circuit are shown in
Figure 2, where it is seen that, as the bias current was increased (upward shift), the
interface reactive component appeared with a larger change. The drifts at 60 minutes in
Figure 2 are, 28%, 9% and 2%, respectively, for the operational amplifiers µA741,
LF356 and AD523. In all cases, the amplifiers with lower bias current produced a lower
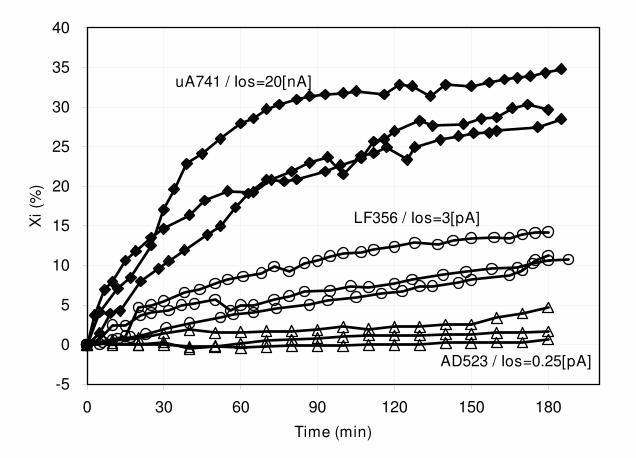
drift. Figure 3 displays the effects produced when four different equipment were used.
At 60 minutes, the drifts came out to be 16% (HP4192A), 8% (FRA/PARC), 4%
(BACTOMETER) and 2% (HP4284A). Those magnitudes distort growth curves,
especially when either the reactive component or directly the capacitance is plotted.
In Figure 2, there is a large difference in one set of data (for µA741) compared
to the other two data sets for the same device. Such difference becomes smaller for
LF356 and AD523 as the input bias offset currents further decrease in these devices.
This is very likely due to the large industrial variability of these op-amps, which may
reach 1000% in the first two types and up to 50% in the last one.
In their book, Firstenberg and Eden [11] show during the initial transient phase
an approximated drift of 1% at 60 minutes in a capacitance growth curve of Escherichia
coli growing in BHI broth. Previous experiments in our laboratory were also marred by
a similar effect of 4% at 60 minutes [10].
One possible way of solving the drift problem is to disconnect the culture cell
(its electrodes) from the measurement circuit by using a switch relay, during the period
when no sample data are collected (dead period). In such situation, the interface
capacitance does not charge up. Besides, the longer the interval between measurements,
the lower the observed drift. This proposal was evaluated recording the curve of percent
interface reactance (Xi) versus time using the HP4284A and disconnecting the
8
equipment from the cells between measurements. Each sample meant a transient
connection to the circuit shorter than 4 s. After 6 hrs, the measured total drift was still in
the order of 1%, i.e., essentially negligible.
Another possible solution is the use of a pre-amplifier input circuit of very low
bias current (in the sub-picoamp range) which, combined with the in-between OFF
periods described above, would reduce the drift even further down.
In Figure 4, we studied whether the Xi changes due to the bias current drift were
dependent on the applied frequency. The diagram was plotted at two different times,
i.e., at t=0 and at t=3 hrs. Regression analysis modeled after a power function led to,
Xi t=0 = A fB = 8,484 f
– 0.83 (SD = ± 0.5) [1]
Xi t=3 = A f B
= 11,047 f – 0.83
(SD = ± 0.5) [2]
where SD stands for Standard Deviation. The percent change of Xi between t=0 and
t=3hs was +31% within the analyzed frequency range. This behaviour indicates that the
temporal Ci changes were frequency independent.
Discussion
The slow drift due to the dc spurious bias current of the input electronic circuitry
causes the distortion observed in bacterial growth curves, either of the reactive or
resistive type, when the sampling system is connected to the electrodes.
Stainless steel electrodes are considered as polarizable, meaning that they tend to
behave as a pure capacitance. Moreover, there are operational amplifiers that behave as
constant current sources when connected to a circuit. Such current is the net difference
of the input bias currents, which is usually named offset current Ios [16]; from this
application point of view, this is to be considered a spurious unwanted current. The
highly simplified model of Figure 5 illustrates the interaction between the circuit

9
electronics and the bipolar measuring cell. Only Ci is included, because the parallel
charge transference resistance is much higher than Xi [7] at the working frequency. The
series resistance R and the oscillator represent the circuitry applying the signal to the
cell.
Connecting the preamplifier to the cell (Fig. 5) is equivalent to connecting a
constant current dc generator because the input impedance of the amplifier is very high
(see Methods Section). Furthermore, since Ci depends on the interface dc current [18],
the larger the absolute value of the current, the higher the value of Ci. After the circuit is
connected, the current through Ci takes at first a maximum value to decrease
exponentially thereafter towards its previous null level. The non-constant capacitance Ci
behaves in a similar way, that is, it is maximal at the beginning and, thereafter, it falls
off slowly. Experimentally, this fact is easily seen when stainless steel electrodes are
immersed in saline solution or in a culture broth to measure the interface capacitance.
Thus, the latter discussion would explain the interface reactance behavior observed in
Figure 2; since Xi is inversely proportional to Ci, it increases when the current goes
down. Frequency is not included here because its influence on Xi was constant with
time.
An important fact is to be underlined. Usually, the first measurement takes place
a few seconds after the cell is switched on to the circuitry [7]. Hence, the initial
measured Xi is not the true interface value. The true value is the one that existed before
connection. The deviation of the first erroneous measurement depends on the
magnitudes of the spurious continuous current applied by the associated electronics and
the maximum error occurs at the initial moment, when current is maximal. Hence,
precautions should be similar to those taken into account in pH measurements, where
electrometer amplifiers are used.

10
We believe the Ios effect is so notorious in Impedance Microbiology because the
times during which the cells and the electronic circuitry are connected are too long. A
12 hr growth curve, with a 2%/hr drift, is significantly distorted by the unwanted Ios;
thus, the latter cannot be ignored. In other electrochemical applications such a drift does
not show up because the total measurement periods are considerably shorter [19]. In
other words, it seems justifiable to use electrometer amplifiers and to decrease
connection times between cells and circuitry in order to minimize the drift due to Ios.
The shorter this time, the smaller the continuous current change traversing the interface
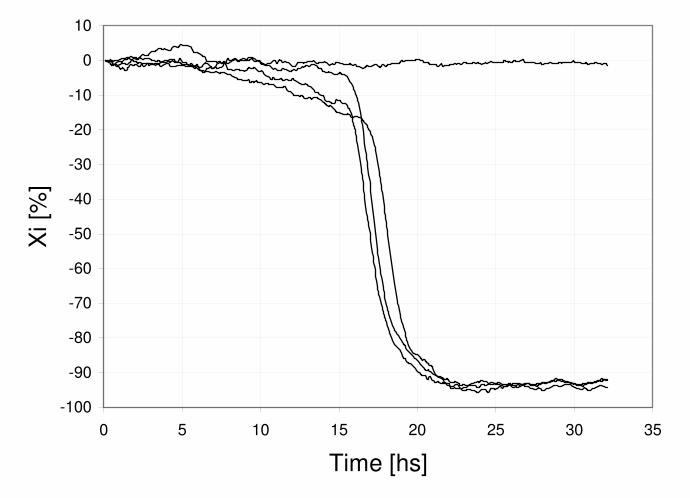
and the smaller the interface capacitance variation. Results obtained (Fig. 6) with
equipment designed having these concepts in mind showed essentially no drift and no
distortion in the growth curves [8,9,20,21].
It must be underlined that all the analysis developed herein is only valid for
bipolar impedance measurements. We did not make measurements using tripolar or
tetrapolar electrode configurations. For this kind of application, the bipolar technique is
more practical.
One of the reviewers of this paper perceptively commented that an improved
model, which includes a parallel faradic resistance (high in the low frequency range,
decreasing with an increase in current density), as well as the half-cell potential, might
give a better theoretical background of the study. It brings up an interesting point. The
interface is, no doubt and as mentioned above, a complex system produced by the
interplay between electrochemical processes and the geometry of the electrode surface.
A perfectly smooth surface can be characterized by the double layer capacitance Cdl in
parallel with the series combination of the charge transference resistance Rtc and the
diffusion Warburg impedance Zw. The whole set, in turn, in series with the medium
resistance Rm [22,23]. The model becomes rather complex when the surface geometry

11
and the current density are considered [24] and we think that entering into his kind of
intricacies exceeds the purpose and intended reach of the article.
Another aspect brought up during the refereeing process referred to the effects of
the recording site area or the metal material, even suggesting platinum black as an
alternative other than stainless steel. The fact is that the latter does not show any toxic
effect, it leads to measurable impedance values for the used geometry and available
equipment, and is economic and easy to get without imposing special care. When
massive use is the case (as in industrial applications), price becomes of concern, too,
and impedance microbiology has a clear industrial facet.
Finally, a few comments should be added regarding the connection time, as
another arbiter asked whether measuring for only 4s is really practical for most
applications or not. In neural recording, for example, this is certainly not enough time.
Our solution has meaning just in impedance microbiology, where bandwidths and
sampling frequencies are very low. Let us illustrate with some numbers: Nerve action
potentials, with a frequency range of 100 to 2,000 Hz, require a sampling frequency in
the order of 8 kHz. Conversely, microbiological growth curves, with signals between
0.00027 Hz and 0.0000016 Hz (a growth curve may take 1 hr up to 7 days to reach its
maximum, depending on the kind of bacteria and its culture broth) require sampling
frequencies of about 0.0016 Hz (1 sample every 10 minutes). Drift current curves (the
main concern of this paper) have similar numerical requirements (signal frequency
range, 0.00027 Hz to 0.000027 Hz, which covers drifts that take 1 up to 10 hrs to reach
its maximum, and sampling frequency of 0.0016 Hz). Summarizing this point: In
impedance microbiology, the signal (that is, the growth curves) and the noise (the drift)
coincide in their bandwidth. The method herein described permits a significant noise
reduction originated in drift.
12
Conclusions
Systems not provided with especially designed input amplifiers introduce drifts
leading to unacceptable distortions in bacterial growth curves. Those drifts do depend
neither on the measurement conditions nor on the applied frequency. They are due to
unwanted input amplifier bias currents connected to the cells. The drifts can be
minimized by means of electrometer amplifiers (with sub-picoamps biases) and
isolating relays to switch off the cells between measurements.
Acknowledgments
Supported by grants from the Consejo Nacional de Investigaciones Científicas y
Técnicas (CONICET) of Argentina, Consejo de Investigaciones de la Universidad
Nacional de Tucumán (CIUNT) and institutional funds from INSIBIO (Instituto
Superior de Investigaciones Biológicas). Special credit is given to Mr. Carlos Romeri
for some experimental advice and to Dr. Elmer Ramirez Cruz (tragically deceased early
in his life), from the Pontificia Universidad Católica del Perú, for experimental
assistance. The techniques herein described are protected by the Argentine Patents
#960101249 and # 980106505 [20,21]. Early preliminary communications were
presented by Felice CJ, Seggiaro VN and Valentinuzzi ME to the 14th Annual
International Conference of the IEEE/EMBS, Paris, France, Oct 29-Nov 1, 1992, and
also to the Primer Congreso Conjunto Argentino de Bioingeniería y Física Médica, Oro
Verde, Entre Ríos, Argentina, Sept 30-Oct 3, 1992, and Congresso Brasileiro de
Engenharía Biomédica e Física Médica, Caxambu, Minas Gerais, Brazil, Nov 20-22,
1992.
Authors’ contributions
This paper is the result of over 20 years of experience working in Impedance
Microbiology, as a team, always trying to improve the records’ quality. Contributions
are well balanced and ideas came up slowly after many trials and errors.

13
References
[1] De Levie R: Fractals and rough electrodes. J Electroanal Chem 1990, 281:1-21.
[2] Warburg von E: Über das verhalten sogenannter unpolarishbarer Elektroden
gegen Wechselstrom. Annalen der Physik und Chemie 1899, 67:493-499.
[3] Liu SH: Fractal model for the ac response of a rough interface. Physical Review
Letters 1985, 55:529-532.
[4] Geddes LA, da Costa CP, Wise G: The impedance of stainless-steel electrodes.
Med & Biol Eng 1971, 9:511-521.
[5] Sheider W: Theory of the frequency dispersion of electrode polarization:
Topology of networks with fractional power frequency dependence. J Phys
Chemistry 1975, 79:127-136.
[6] Felice CJ, Valentinuzzi ME, Vercellone MI, Madrid RE: Impedance
bacteriometry: Medium and interface contributions during bacterial growth. IEEE
Trans Biomed Eng 1992, 39:1310-1313.
[7] Felice CJ: Digital monitor for microorganisms: Theoretical and practical
aspects. PhD thesis. Universidad Nacional de Tucumán, Argentina, Department of
Bioengineering; 1995. In Spanish.
[8] Madrid RE, Felice CJ, Valentinuzzi ME: Automatic on-line analyzer of
microbial growth using simultaneous measurements of impedance and turbidity.
Med & Biol Eng & Comput 1999, 37:1-5. 1999.
[9] Felice CJ, Madrid RE, Olivera JM, Rotger VI, Valentinuzzi ME: Impedance
microbiology: quantification of bacterial content in milk by means of capacitance
growth curves. J Microbiol Meth 1999, 35:37-42.
[10] Felice CJ, Valentinuzzi ME: Medium and interface in impedance microbiology:
measurement method and electrochemical perspective. IEEE Trans Biomed Eng
1999, 46:1481-1484.
[11] Firstenberg-Eden R, Eden G: Impedance Microbiology. New York: John Wiley;
1984.

14
[12] Henschke PA, Thomas DS: Detection of wine-spoiling yeast by electronic
methods. J Appl Bacteriol 1988, 64:123-133.
[13] Chang HC, Chang JJ, Huang AH, Chang TC: Evaluation of a capacitance
method for direct antifungal susceptibility testing of yeasts in positive blood
cultures. J Clin Microbiol 2000, 38:971-976.
[14] Duran GM, Marshall DL: Rapid determination of sanitizer concentration using
impedance-based methods. J Food Protection 2002, 65:1422-1427.
[15] Schmukler R, Bao J, Davis C: Measurements of the electrical impedance of
biologic materials. In Proceedings of the 12th Annual International Conference
IEEE/EMBS, vol. 12, nº4, pp. 1509-1510, 1990.
[16] Coughlin RF, Driscoll, FF: Operational Amplifiers and Linear Integrated Circuits.
New York: Prentice Hall; 1998.
[17] NASA: Technical support package for electrochemical impedance
spectroscopy of metal alloys. NASA Tech Briefs 1993, 17 (Issue 1):1-64.
[18] Simpson RW, Berberian JG, Schwan H: Nonlinear AC and DC polarization of
platinum electrodes. IEEE Trans Biomed Eng 1980, 27:166-171.
[19] Milocco RH: Minimal measurement time in electrochemical impedance
identification. Electrochimica Acta 1994, 39:1433-1439, 1994.
[20] Felice CJ, Madrid RE: Equipment for analyzing bacterial growth by impedance
measurement with two frequencies. Argentine Patent #AR001348B1, 2000.
[21] Madrid RE, Felice CJ: Equipment for analysis of microbial contamination by
impedance and turbidity. Argentine Pending Patent # 980106505, 2000.
[22] Gabrielli C: Identification of electrochemical proceses by frequency response
análisis. Technical Report #004/83, Solartron-Schlumberger, 1984, 120 pp.
[23] Randles JEB: Kinetics of rapid electrode reactions. Discussions Faraday Society,
1:11-19, 1947.
[24] Ruiz G, Felice CJ, Valentinuzzi ME: Non-linear response of electrode-
electrolyte interface at high current densities. Chaos, Solitons and Fractals, 25(3):
649-654, 2005. Available on-line March 2, 2005.

15
Figure legends
Figure 1 - Constant current bridge circuit with replaceable pre-amplifier. Z:
measured cell; R: series bridge resistance; Rv: variable resistor, Cv: variable capacitor,
PRE: preamplifier, NF: 50 Hz notch filter, OSC: oscilloscope.
Figure 2 - Curves of percent interface reactance versus time using integrated
circuits with different offset currents as pre-amplifiers: µA741 (black squares); LF356
(open circles); AD523 (open triangles), from top to bottom. Three curves for each
amplifier. There is a large difference in one set of data (for µA741) compared to the
other two data sets for the same device. Such difference becomes smaller for LF356 and
AD523 as the input bias offset currents further decrease in these devices. This is very
likely due to the large industrial variability of these op-amps.
Figure 3 - Percent interface reactance versus time using commercial systems.
From top to bottom: ♦ Hewlett Packard Impedance Analyzer HP4192A; � FRA or
Frequency Response Analyzer 1255, by SOLARTRON, with an electrochemical
interface PRINCETON APPLIED RESEARCH (PAR); ο BACTOMETER, a patented
custom made prototype; � Hewlett Packard Precision LCR meter HP4284A.
Figure 4 - Interface reactance Xi versus frequency with time as parameter. ■
measurements made at t = 0; ++++ measurements made 3 hours later. The slope did not
show any change.
Figure 5 - Simplified circuit model of the measuring cell and input preamplifier.
R: series resistance; Ci: interface capacitance; RL: relay contact; Idc: unwanted
distorting current.
Figure 6 - Percent interface reactance Xi versus time for sulfate reducing
bacteria samples growing in Postgate Broth at 37ºC. No curve shows any drift,
including the reference (sterile) cell.
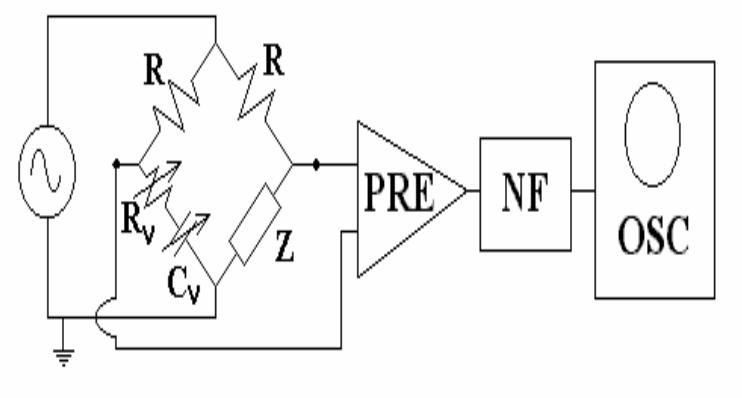
Figure 1
-5
0
5
10
15
20
25
30
35
40
0 30 60 90 120 150 180
Time (min)
Xi
(%)
uA741 / Ios=20[nA]
LF356 / Ios=3[pA]
AD523 / Ios=0.25[pA]
Figure 2
-5
0
5
10
15
20
25
30
35
40
0 30 60 90 120 150 180
Time [min]
Xi [%
]
HP4284A FRA/PARC HP4192A BACTOMETER
Figure 3

Xi = 11,047.f -0.83
Xi = 8,484.f -0.83
1
10
100
1000
10000
10 100 1000 10000 100000
f [Hz]
Xi
[Oh
ms]
Figure 4

Figure 5
-100
-90
-80
-70
-60
-50
-40
-30
-20
-10
0
10
0 5 10 15 20 25 30 35
Time [hs]
Xi [%
]
Figure 6