Inhibition of Gastric Carcinogenesis by the Hormone Gastrin Is Mediated by Suppression of TFF1...
31
Inhibition of Gastric Carcinogenesis by the Hormone Gastrin Is Mediated by Suppression of TFF1 Epigenetic Silencing HIROYUKI TOMITA,* SHIGEO TAKAISHI,* TREVELYAN R. MENHENIOTT, ‡ XIANGDONG YANG,* WATARU SHIBATA,* GUANGCHUN JIN,* KELLY S. BETZ,* KAZUYUKI KAWAKAMI, § TOSHINARI MINAMOTO, § CATHERINE TOMASETTO, MARIE–CHRISTINE RIO, NATAPORN LERKOWIT, ¶ ANDREA VARRO, ¶ ANDREW S. GIRAUD, ‡ and TIMOTHY C. WANG* *Division of Digestive and Liver Disease, Irving Cancer Research Center, Department of Medicine, Columbia University Medical Center, New York, New York; ‡ Murdoch Children’s Research Institute, Royal Children’s Hospital, Parkville, Victoria, Australia; § Division of Translational and Clinical Oncology, Cancer Research Institute, Kanazawa University, Kanazawa, Japan; Institut de Génétique et de Biologie Moléculaire et Cellulaire, CNRS/INSERM/Université Louis Pasteur/Collège de France, Strasbourg, France; and ¶ School of Biomedical Sciences, University of Liverpool, Liverpool, England BACKGROUND & AIMS: Epigenetic alterations have been correlated with field cancerization in human pa- tients, but evidence from experimental models that spe- cific epigenetic changes can initiate cancer has been lack- ing. Although hormones have been associated with cancer risk, the mechanisms have not been determined. The peptide hormone gastrin exerts a suppressive effect on antral gastric carcinogenesis. METHODS: N-methyl- N-nitrosourea (MNU)-dependent gastric cancer was in- vestigated in hypergastrinemic (INS-GAS), gastrin-defi- cient (GAS / ), Tff1-deficient (Tff1 / ), and wild-type (WT) mice. Epigenetic alterations of the trefoil factor 1 (TFF1) tumor suppressor gene were evaluated in vitro and in vivo. RESULTS: Human intestinal-type gastric cancers in the antrum exhibited progressive TFF1 repres- sion and promoter hypermethylation. Mice treated with MNU exhibited a field defect characterized by widespread Tff1 repression associated with histone H3 lysine 9 meth- ylation and H3 deacetylation at the Tff1 promoter in epithelial cells. In MNU-induced advanced cancers, DNA methylation at the Tff1 promoter was observed. Tumor induction and Tff1 repression were increased in MNU- treated mice by Helicobacter infection. Hypergastrinemia suppressed MNU-dependent tumor initiation and pro- gression in a manner that correlated with gene silencing and epigenetic alterations of Tff1. In contrast, homozy- gous gastrin-deficient and heterozygous Tff1-deficient mice showed enhanced MNU-dependent field defects and cancer initiation compared with WT mice. In gastric cancer cells, gastrin stimulation partially reversed the epigenetic silencing in the TFF1 promoter. CONCLU- SIONS: Initiation of antral gastric cancer is associ- ated with progressive epigenetic silencing of TFF1, which can be suppressed by the hormone gastrin. Keywords: Gastrin; Gastric Cancer; Epigenetics. A lthough both genetic and epigenetic alterations have been characterized in diverse cancers, the critical early steps that result in cancer initiation remain poorly understood. Epigenetic alterations are often detected very early in tumorigenesis in broad regions of histopatholog- ically normal tissue before detection of the incipient tumor, 1,2 a concept referred to as a “field cancerization (defect).” 3 Tumor suppressor genes can be silenced early through hypermethylation of CpG islands frequently found within gene promoter regions, a process that has frequently been associated with changes in histone mod- ifications. 1,2 Growing evidence supports the concept that hormones can modulate cancer risk and regulate the epigenome. 4 However, it remains uncertain whether epi- genetic alterations can mediate the relationship between hormones and carcinogenesis. Further, the critical unan- swered question is whether these alterations are sufficient to initiate cancer and are not just secondary events. Although Helicobacter pylori infection is the major risk factor for gastric cancer, it is often not sufficient on its own, and a diet of nitrate-rich foods along with tobacco use appear to be significant environmental inducers of gastric cancer. 5 With the development of atrophy and hypochlorhydria during H pylori–associated carcinogene- sis, dietary nitrates can be converted to endogenous N- nitroso compounds (NOCs) as a result of bacterial over- growth. 6 NOCs have been found to produce various tumors in animals; however, a causal association between exposure to NOCs and human cancer has not been es- tablished. 7 Epidemiologically, increased endogenous for- mation of NOCs is associated with noncardia cancer risk in H pylori–infected patients. 8 We have postulated that NOCs arising from bacterial overgrowth might be re- sponsible for the conversion of metaplasia to dysplasia in human gastric cancer development. 6 The synthetic NOC N-methyl-N-nitrosurea (MNU) has been used in experi- mental gastric carcinogenesis. 9 Although MNU is an al- kylating agent that can potentially induce formation of DNA adducts and GC ¡ TA transition mutations, only Abbreviations used in this paper: ChIP, chromatin immunoprecipi- tation; Dclk1, doublecortin-like kinase 1; H3K9, H3 lysine 9; MNU, N-methyl-N-nitrosourea; NOC, N-nitroso compound; PKC, protein ki- nase C; RT-PCR, reverse-transcription polymerase chain reaction; TFF, trefoil factor; WT, wild-type. © 2011 by the AGA Institute 0016-5085/$36.00 doi:10.1053/j.gastro.2010.11.037 BASIC– ALIMENTARY TRACT GASTROENTEROLOGY 2011;140:879 – 891
Transcript of Inhibition of Gastric Carcinogenesis by the Hormone Gastrin Is Mediated by Suppression of TFF1...

G
F
((acsMTy
eue
GASTROENTEROLOGY 2011;140:879–891
Inhibition of Gastric Carcinogenesis by the Hormone Gastrin Is Mediatedby Suppression of TFF1 Epigenetic Silencing
HIROYUKI TOMITA,* SHIGEO TAKAISHI,* TREVELYAN R. MENHENIOTT,‡ XIANGDONG YANG,* WATARU SHIBATA,*UANGCHUN JIN,* KELLY S. BETZ,* KAZUYUKI KAWAKAMI,§ TOSHINARI MINAMOTO,§ CATHERINE TOMASETTO,�
MARIE–CHRISTINE RIO,� NATAPORN LERKOWIT,¶ ANDREA VARRO,¶ ANDREW S. GIRAUD,‡ and TIMOTHY C. WANG*
*Division of Digestive and Liver Disease, Irving Cancer Research Center, Department of Medicine, Columbia University Medical Center, New York, New York;‡Murdoch Children’s Research Institute, Royal Children’s Hospital, Parkville, Victoria, Australia; §Division of Translational and Clinical Oncology, Cancer Research
�
Institute, Kanazawa University, Kanazawa, Japan; Institut de Génétique et de Biologie Moléculaire et Cellulaire, CNRS/INSERM/Université Louis Pasteur/Collège derance, Strasbourg, France; and ¶School of Biomedical Sciences, University of Liverpool, Liverpool, Englandit(
heghst
foug
sngtet
NmkD
BA
SIC–
ALI
MEN
TARY
TRA
CT
BACKGROUND & AIMS: Epigenetic alterations havebeen correlated with field cancerization in human pa-tients, but evidence from experimental models that spe-cific epigenetic changes can initiate cancer has been lack-ing. Although hormones have been associated withcancer risk, the mechanisms have not been determined.The peptide hormone gastrin exerts a suppressive effecton antral gastric carcinogenesis. METHODS: N-methyl-N-nitrosourea (MNU)-dependent gastric cancer was in-vestigated in hypergastrinemic (INS-GAS), gastrin-defi-cient (GAS�/�), Tff1-deficient (Tff1�/�), and wild-typeWT) mice. Epigenetic alterations of the trefoil factor 1TFF1) tumor suppressor gene were evaluated in vitrond in vivo. RESULTS: Human intestinal-type gastricancers in the antrum exhibited progressive TFF1 repres-ion and promoter hypermethylation. Mice treated with
NU exhibited a field defect characterized by widespreadff1 repression associated with histone H3 lysine 9 meth-lation and H3 deacetylation at the Tff1 promoter in
epithelial cells. In MNU-induced advanced cancers, DNAmethylation at the Tff1 promoter was observed. Tumorinduction and Tff1 repression were increased in MNU-treated mice by Helicobacter infection. Hypergastrinemiasuppressed MNU-dependent tumor initiation and pro-gression in a manner that correlated with gene silencingand epigenetic alterations of Tff1. In contrast, homozy-gous gastrin-deficient and heterozygous Tff1-deficientmice showed enhanced MNU-dependent field defects andcancer initiation compared with WT mice. In gastriccancer cells, gastrin stimulation partially reversed theepigenetic silencing in the TFF1 promoter. CONCLU-SIONS: Initiation of antral gastric cancer is associ-ated with progressive epigenetic silencing of TFF1,which can be suppressed by the hormone gastrin.
Keywords: Gastrin; Gastric Cancer; Epigenetics.
Although both genetic and epigenetic alterations havebeen characterized in diverse cancers, the critical
arly steps that result in cancer initiation remain poorlynderstood. Epigenetic alterations are often detected very
arly in tumorigenesis in broad regions of histopatholog-cally normal tissue before detection of the incipientumor,1,2 a concept referred to as a “field cancerizationdefect).”3 Tumor suppressor genes can be silenced early
through hypermethylation of CpG islands frequentlyfound within gene promoter regions, a process that hasfrequently been associated with changes in histone mod-ifications.1,2 Growing evidence supports the concept that
ormones can modulate cancer risk and regulate thepigenome.4 However, it remains uncertain whether epi-enetic alterations can mediate the relationship betweenormones and carcinogenesis. Further, the critical unan-wered question is whether these alterations are sufficiento initiate cancer and are not just secondary events.
Although Helicobacter pylori infection is the major riskactor for gastric cancer, it is often not sufficient on itswn, and a diet of nitrate-rich foods along with tobaccose appear to be significant environmental inducers ofastric cancer.5 With the development of atrophy and
hypochlorhydria during H pylori–associated carcinogene-is, dietary nitrates can be converted to endogenous N-itroso compounds (NOCs) as a result of bacterial over-rowth.6 NOCs have been found to produce variousumors in animals; however, a causal association betweenxposure to NOCs and human cancer has not been es-ablished.7 Epidemiologically, increased endogenous for-
mation of NOCs is associated with noncardia cancer riskin H pylori–infected patients.8 We have postulated thatNOCs arising from bacterial overgrowth might be re-sponsible for the conversion of metaplasia to dysplasia inhuman gastric cancer development.6 The synthetic NOC
-methyl-N-nitrosurea (MNU) has been used in experi-ental gastric carcinogenesis.9 Although MNU is an al-
ylating agent that can potentially induce formation ofNA adducts and GC ¡ TA transition mutations, only
Abbreviations used in this paper: ChIP, chromatin immunoprecipi-tation; Dclk1, doublecortin-like kinase 1; H3K9, H3 lysine 9; MNU,N-methyl-N-nitrosourea; NOC, N-nitroso compound; PKC, protein ki-nase C; RT-PCR, reverse-transcription polymerase chain reaction; TFF,trefoil factor; WT, wild-type.
© 2011 by the AGA Institute0016-5085/$36.00
doi:10.1053/j.gastro.2010.11.037

tm
ebcr
g
Blsccmpie
i
bs
BA
SIC–
ALIM
ENTA
RY
TRA
CT
880 TOMITA ET AL GASTROENTEROLOGY Vol. 140, No. 3
rare mutations have been observed in NOC-induced gas-tric tumors of rodents.9 MNU is also known to modifyamino acids in histone proteins, especially histone H3lysine residues,10 leading to chromatin remodeling, al-though the epigenetic effects of NOCs have not been wellstudied.
Trefoil factor 1 (TFF1), a member of the trefoil factorfamily of peptides, is an antral stomach–specific tumorsuppressor gene.11 Tff1�/� mice develop spontaneous an-ral and pyloric tumors, both adenomas and carcino-
as.12 Another genetic model of antral gastric tumori-genesis, the gp130757F/F mouse, shows reduced Tff1xpression.13 A reduction in TFF1 gene expression haseen observed in about 50% of human distal stomachancers, and promoter hypermethylation has also beeneported.14 –16 Interestingly, a well-defined positive
transcriptional regulator of TFF1 is the peptide hormonegastrin.17
Gastrin, a peptide hormone secreted from antral gas-trin-expressing cells, was first characterized by its abilityto stimulate acid secretion but has also been shown tostimulate proliferation of fundic epithelial cells.18,19 Al-though the role of hypogastrinemia as a predisposingfactor for antral gastric cancer in patients has not beenstudied, gastrin knockout (GAS�/�) mice develop spon-taneous antral tumors under conventional housing con-ditions.20 Although hypochlorhydria and bacterial over-
rowth are believed to promote cancer in these mice,21
studies by our group and others suggest that tumorigen-esis might be related to Tff1 repression in gastric an-trum.17,22
Here we show that progressive TFF1 epigenetic silenc-ing is one of the mechanisms during carcinogenesis ingastric antrum. Further, we show that the hormone gas-trin inhibits TFF1 repression and thus suppresses antralgastric carcinogenesis.
Materials and MethodsHuman Tissues and MiceHuman gastric mucosal tissues, which were col-
lected from 4 pathologic subgroups (Supplementary Ta-bles 1 and 2) in gastric antrum—normal stomach, Hpylori–positive gastritis, intestinal-type cancer, and pre-neoplastic adjacent tissue showing intestinal metaplasia—were obtained (Melbourne Health Human ResearchEthics Committee approval; Project 2004:176, KanazawaUniversity Ethics Committee for Human Genome Re-
™™™™™™™™™™™™™™™™™™™™™™™™™™™™™™™™™™™™™Figure 1. Epigenetic silencing of TFF1 during intestinal-type carcinogeand (B) TFF1 mRNA levels from 4 indicated pathologic groups. Y-axis s
ars show mean fold change. *P � .05. (C) A 500–base pair region of thtart site (TSS) is indicated. TFF1 promoter methylation levels in human
CA). *P � .05; ***P � .001. (D) Two-way hierarchical cluster analysis of mCpG units in pair 13–14 are shown as combined averages (not resolved
vertical axis. CpG methylation ratios: 0 (green) to 1.0 (red; see color key). AGsearch approval 2008:174) with informed consent. Theanimal protocol was approved by the Columbia Univer-sity Medical Center Institutional Animal Care and UseCommittee. INS-GAS male (FVB background), gastrin-deficient, Tff1-deficient (B6), and wild-type (WT; FVB and
6) mice were used in this study. Information on cellines, chemical treatments, Helicobacter felis infection, tis-ue preparation, epithelial cell isolation, immunohisto-hemistry, quantitative reverse-transcription polymerasehain reaction (RT-PCR), methylation analysis, bisulfiteodification, sequencing analysis, chromatin immuno-
recipitation (ChIP) assay, and transfection is providedn Supplementary Materials and Methods. All the prim-rs used are shown in Supplementary Table 3.
ResultsProgressive Loss of TFF1 ExpressionCorrelates With Promoter MethylationDuring Intestinal-Type Carcinogenesis inHuman Gastric AntrumGastrin messenger RNA (mRNA) expression was
significantly decreased in preneoplastic mucosa with in-testinal metaplasia and intestinal-type cancers but wasnot reduced in H pylori–positive mucosa compared withnormal mucosa (Figure 1A). TFF1 mRNA expression wassignificantly decreased in H pylori–positive mucosa, pre-neoplastic mucosa, and cancers compared with normalmucosa (Figure 1B). CpG dinucleotides in the TFF1 prox-imal promoter were more frequently methylated in Hpylori–positive gastritis, preneoplastic mucosa, and can-cers than in normal mucosa (Figure 1C). This shows thatTFF1 promoter hypermethylation is associated with TFF1repression at the earliest stages of carcinogenesis in gas-tric antrum. Therefore, although a modest suppressionof TFF1 occurs independently of gastrin levels in H pylorinfection, there is a clear relationship between TFF1 epi-
genetic silencing and loss of gastrin in both intestinalmetaplasia and intestinal-type cancers in gastric antrum.
To extend these findings, we investigated whether sam-ples from different pathologic subgroups can be distin-guished on the basis of TFF1 promoter methylation pat-terns by hierarchical clustering (Figure 1D). This analysisbroadly partitioned the cancer samples (n � 20) (Supple-mentary Table 2) across 3 major groups: 2 with TFF1hypermethylation containing the majority (50%, 10/20),and one (15%, 3/20) with TFF1 hypomethylation. A non-adenocarcinoma (choriocarcinoma) was not included in
™™™™™™™™™™™™™™™™™™™™™™™™™™™™™™™™™™™3in human gastric antrum. Quantitative RT-PCR analysis of (A) gastrinmRNA fold change relative to normal antral stomach. Black horizontal1 promoter analyzed for methylation. Position of the TFF1 transcription
tric tissues determined by EpiTYPER analysis (Sequenom, San Diego,ation at TFF1 promoter CpGs (columns) in human gastric tissues (rows).e mass spectrum). Tissue pathology classification is shown on the right
™™™nesis
howse TFFgas
ethylon th
S and MKN28, gastric cancer cell lines.

BA
SIC–
ALI
MEN
TARY
TRA
CT
March 2011 GASTRIN SUPPRESSES DISTAL GASTRIC CANCER 881

p
ssm
camtalpebttFMtmttpgiTst
(aama12mapwazaettf
ecpp
BA
SIC–
ALIM
ENTA
RY
TRA
CT
882 TOMITA ET AL GASTROENTEROLOGY Vol. 140, No. 3
either group (Figure 1D). The division by methylationstatus was predictive for pathology but not for specificpathologic subgroups. Interestingly, MKN28 gastric can-cer cells were associated with the high methylationgroup, whereas AGS cells were associated with the lowmethylation group. Collectively, our results suggest thata subset of human gastric cancers in the antrum mayarise by TFF1 epigenetic silencing under hypogastrinemicconditions.
Gastrin Suppresses MNU-Dependent AntralGastric CarcinogenesisTo investigate the role of TFF1 and gastrin in
gastric carcinogenesis of the antrum, we administratedMNU (five 1-week courses) to WT and INS-GAS malemice and followed up the mice for up to 36 weeks(Supplementary Figure 1). It is well established that INS-GAS mice spontaneously develop gastric tumors only inthe corpus.23 Antral tumors were not detected in eithercohort at 18 weeks. At 36 weeks, antral tumors wereobserved macroscopically in MNU-treated WT and INS-GAS mice, most showing a sessile and/or polypoid mor-phology (Figure 2A). In the corpus, there was no differ-ence between INS-GAS and WT mice in the response toMNU; in contrast, in the antrum, the incidence, averagetumor number, and tumor size were significantly greaterin MNU-treated WT mice compared with MNU-treatedINS-GAS mice (Figure 2B). These results indicate thathypergastrinemia suppresses the initiation and promo-tion stage of MNU-induced antral tumors.
Histopathologic evaluation showed a significant de-crease in the development of intramucosal and invasiveadenocarcinomas in MNU-treated INS-GAS mice as com-pared with MNU-treated WT mice (Figure 2C and D),consistent with a suppressive effect of gastrin on theprogression to advanced antral gastric cancer. It is note-worthy that the MNU-treated WT mice often developedmoderately and poorly differentiated adenocarcinomas,whereas MNU-treated INS-GAS mice did not. In con-trast, MNU treatment of INS-GAS mice enhanced thedevelopment of Tff2-negative dysplastic glands duringcarcinogenesis in the corpus (Supplementary Figure 2),whereas MNU treatment of WT mice showed no effect.
Hypergastrinemia Suppresses MNU-Dependent Proliferation, Apoptosis, andProgenitor Cell Expansion That CorrelatesWith Inhibition of Tff1 RepressionTo clarify some of the inhibitory mechanisms of
gastrin on gastric carcinogenesis, we assessed antral cellproliferative activity (Ki-67), apoptosis (cleaved caspase-3), and putative progenitor cell (doublecortin-like kinase1 [Dclk1]) distribution in MNU-treated mice. Dclk1 wasreported to be a transcript specifically up-regulated in gutepithelial progenitors24 and suggested to be a putative
rogenitor cell marker in the stomach.25 Although antral
proliferation, apoptosis, and Dclk1-positive cell numbers aincreased over time in both sets of mice, there was asignificantly greater increase in all 3 parameters in MNU-treated WT mice compared with MNU-treated INS-GASmice (Figure 3A and Supplementary Figure 3A). Thisuggests that suppression of antral proliferation, apopto-is, and progenitor cell expansion by gastrin is a likely
echanism for inhibition of antral carcinogenesis.We next examined Tff1 mRNA expression in epithelial
ells of gastric antrum during carcinogenesis. At 18 weeksfter MNU exposure, antral Tff1 mRNA expression in WTice was significantly lower than that of untreated con-
rols and further reduced at 36 weeks. (Figure 3B). Inddition, antral Tff1 mRNA expression was significantlyower in tumor tissues compared with adjacent nonneo-lastic tissues at 36 weeks. In contrast, corpus Tff1xpression in surface pit cells and dysplastic glandsy immunohistochemistry and quantitative reverse-ranscription PCR showed no change following MNUreatment in either WT or INS-GAS mice (Supplementaryigure 4). Although plasma gastrin levels were higher inNU-treated INS-GAS mice compared with MNU-
reated WT mice (Figure 3C), both WT and INS-GASice showed a normal gastric pH at 18 weeks after MNU
reatment, although the gastric pH increased at the timehat the mice developed antral tumors (36 weeks) (Sup-lementary Figure 3B), suggesting that the effects ofastrin were not mediated directly by alterations in acid-ty. Taken together, there is a correlation between loss offf1 and progression to cancer, suggesting that progres-
ive repression of Tff1 in the antrum represents a poten-ial mechanism for MNU-induced carcinogenesis.
One day after a 1-week course of MNU treatmentSupplementary Figure 5A), epithelial cell proliferationnd Tff1 mRNA expression were increased in both WTnd INS-GAS mice, but the proliferation normalizedore rapidly in INS-GAS mice (Supplementary Figure 5B
nd C). Tff1 mRNA expression decreased rapidly after the-week MNU treatment and was equivalent to normal atand 4 weeks, whereas Tff1 mRNA levels in INS-GASice were higher than in WT mice at 4 weeks. At 1 day
nd 4 weeks after the 1-week MNU treatment, neitherlasma gastrin level nor gastric pH was altered comparedith that in untreated mice. (Supplementary Figure 5Dnd E). Short-term treatment of WT mice with omepra-ole produced a smaller increase in plasma gastrin levelnd thus an insignificant change in antral Tff1 mRNAxpression (Supplementary Figure 5F). Nevertheless,aken together, these data are consistent with the notionhat gastrin-dependent induction of Tff1 may accountor its inhibitory effect on tumorigenesis.
Although the MNU mouse model of antral tumorigen-sis reproduces some aspects of human antral gastricancer, it lacks the infectious—and inflammatory—as-ects of Helicobacter-driven neoplasia in humans. Histo-athologic scoring confirmed that MNU alone was un-
ble to induce a significant increase in tissue infiltration
i ecm3ap
McpsiG
Hta(mp(cafs
tvMm
BA
SIC–
ALI
MEN
TARY
TRA
CT
March 2011 GASTRIN SUPPRESSES DISTAL GASTRIC CANCER 883
by neutrophils or mononuclear cells (Supplementary Fig-ure 6). No significant antral atrophy was observed ineither WT or INS-GAS mice after MNU treatment.
Thus, to explore the impact of Helicobacter infection onTff1 gene expression and antral carcinogenesis, we stud-ed the combination of H felis infection plus MNU treat-
ment in WT and INS-GAS mice. Eight- to 10-week oldmice were inoculated with H felis, followed 2 weeks laterby administration of MNU in the drinking water (Sup-plementary Figure 1). H felis infection alone resulted inlimited antral tumorigenesis (but no antral adenocarci-
Figure 2. Gastrin suppressesNU-dependent gastric car-
inogenesis. (A) Macroscopichotographs of the wholetomach (left) and antrum (right)
n MNU-treated WT and INS-AS mice at 36 weeks. Dotted
lines define the border betweenthe corpus and the antrum.Higher magnifications of boxedsections indicate the antrum.Arrows indicate macroscopic tu-mors. Bars � 2 mm. (B) Inci-dence (percentage of tumor-bearing mice/total examinedmice in each group), tumor num-ber, and tumor size of gastric tu-mors in MNU-treated WT andINS-GAS mice. **P � .01. (C)
istopathologic features of gas-ric tumors in MNU-treated WTnd INS-GAS mice at 36 weeks.Panels a–f) MNU-treated WT
ice. (Panel a) Hyperplasticolyp. (Panel b) Adenoma.
Panel c) Intramucosal adeno-arcinoma. (Panel d) Invasivedenocarcinoma. (Panels e and) Higher magnifications of boxedections in c and d. mm, muscu-
laris mucosa. (Panels g and h)MNU-treated INS-GAS mice. (g)Hyperplastic polyp. (h) Ade-noma. Bars � 100 �m. (D) His-ologic grade of the most ad-anced tumor in tumor-bearingNU-treated WT and INS-GASice. *P � .05.
noma). H felis–infected WT mice developed adenomas in g
the antrum, whereas H felis–infected INS-GAS mice onlydeveloped hyperplastic polyps (Supplementary Figure 7).In contrast, H felis infection plus MNU treatment of WTmice resulted in a significant increase in tumor number(Figure 3D). H felis infection alone decreased Tff1 mRNAxpression in the noncancerous epithelium; however, theombination of H felis infection plus MNU resulted in auch greater reduction in antral Tff1 mRNA level (Figure
E). In contrast, corpus Tff1 mRNA expression was notffected by H felis infection and/or MNU treatment (Sup-lementary Figure 4). H felis infection increased plasma
astrin levels in INS-GAS mice but not in WT mice
a
l
iIA
BA
SIC–
ALIM
ENTA
RY
TRA
CT
884 TOMITA ET AL GASTROENTEROLOGY Vol. 140, No. 3
(Figure 3F). Taken together, these results suggest that, onits own, Helicobacter is a weak antral gastric carcinogen
nd that the combined effects of H felis infection andNOC exposure are most effective for suppressing Tff1expression and inducing antral gastric carcinogenesis.
MNU Induces Epigenetic Alterations in theTff1 PromoterGastric tissue–specific expression of TFF1 is regu-
ated epigenetically by promoter methylation in mice.26 m
To determine if promoter methylation is a possiblemechanism for Tff1 repression in MNU-induced gastriccarcinogenesis, we examined isolated epithelial cells andadenocarcinomas by bisulfite sequencing (Figure 4A).Methylation at CpG sites in the Tff1 promoter increasedn advanced tumors of MNU-treated WT mice but notNS-GAS mice (Figure 4B and Supplementary Figure 8).dvanced adenocarcinomas showing increased promoter
Figure 3. Gastrin suppressesabnormal cell proliferation, pro-genitor cell expansion, and Tff1repression during MNU-inducedantral carcinogenesis, and H fe-lis infection promotes MNU-in-duced antral carcinogenesiswith Tff1 repression. (A) Percent-age of Ki-67–positive, Dclk1-positive, and cleaved caspase-3(CC-3)–positive cells in the an-trum of WT and INS-GAS mice(n � 10 for each group) at theindicated times. (B) Expressionof Tff1 mRNA in tumor-free epi-thelial cells and tumors. *P �.05, **P � .01 for WT vs INS-GAS mice at the indicated times;##P � .01 for comparisons indi-cated. (C) Plasma gastrin levelsin untreated (�MNU) and MNU-treated (�MNU) WT and INS-GAS mice at the indicated times(n � 5 for each group). *P � .05for WT vs INS-GAS mice at theindicated times. (D) Incidence(percentage of tumor-bearingmice/total examined mice ineach group) and average num-ber of gastric tumors in MNU-treated and/or H felis–infectedWT and INS-GAS mice at 36weeks. HF, H felis. **P � .01 forWT mice vs INS-GAS mice at theindicated times; #P � .05 forcomparisons indicated. (E) Ex-pression of Tff1 mRNA in thenoncancerous epithelium ofMNU-treated and/or H felis–in-fected WT and INS-GAS mice at36 weeks. *P � .05, **P � .01for WT vs INS-GAS mice at theindicated groups; ##P � .05 forcomparisons indicated. (F)Plasma gastrin levels in MNU-treated and/or H felis–infectedWT and INS-GAS mice at 36weeks. **P � .01 for WT vs INS-GAS mice at the indicatedgroups; #P � .05 for compari-sons indicated.
ethylation were negative for Tff1 immunostaining,

ttitad
s
o
cmma
i(r
BA
SIC–
ALI
MEN
TARY
TRA
CT
March 2011 GASTRIN SUPPRESSES DISTAL GASTRIC CANCER 885
whereas disease-free epithelium with unaltered promotermethylation showed abundant Tff1 staining (Figure 4C).To exclude somatic mutation of Tff1 as a mechanism forumor initiation by MNU, gastric tumors from MNU-reated WT and INS-GAS mice (n � 3 each) were exam-ned by gene sequencing. None was found in any of theumors tested. These results indicate that Tff1 silencing,ssociated with promoter methylation in MNU-depen-ent tumorigenesis, is negatively regulated by gastrin.Paradoxically, 18 weeks after MNU treatment, we ob-
Figure 4. Methylation status atthe Tff1 promoter during MNU-nduced antral carcinogenesis.A) A schematic of the promoteregion of the mouse Tff1 gene.
An arrow indicates the transcrip-tion start site (TSS). BS-1 andBS-2 (black bars) represent theexamined PCR regions for bisul-fite sequencing. Ch-1, Ch-2, andCh-3 (black bars) represent theexamined PCR regions for ChIPassays. (B) Methylation status ofCpG sites by sequencing ofbisulfite-modified DNA from tu-mor-free isolated epithelial cellsand tumors in the antrum of WTand INS-GAS mice at the indi-cated times. (C) RepresentativeTff1 immunostaining for normalmucosa (left) and MNU-inducedtumor (right) of the WT mouseindicated as WT1 in B. The dot-ted line indicates the border be-tween positive and negative le-sion in the tumor. Bars � 100�m.
erved decreased Tff1 mRNA expression (Figure 3B) with- H
ut alteration to Tff1 promoter methylation in both WTand INS-GAS mice (Figure 4B). Recently, it has beenreported that transcriptional repression associated withhistone modifications may precede changes in DNAmethylation and these modifications might be revers-ible.2 To determine if histone modifications might pre-ede DNA methylation at the Tff1 promoter at the for-ative stages of silencing, we analyzed the repressivearks H3 lysine 9 (H3K9)me2, H3K9me3, H3K27me3,
nd the activating mark H3ac by ChIP. Enrichment of
3K9me2 and H3K9me3 was detected in the antral epi-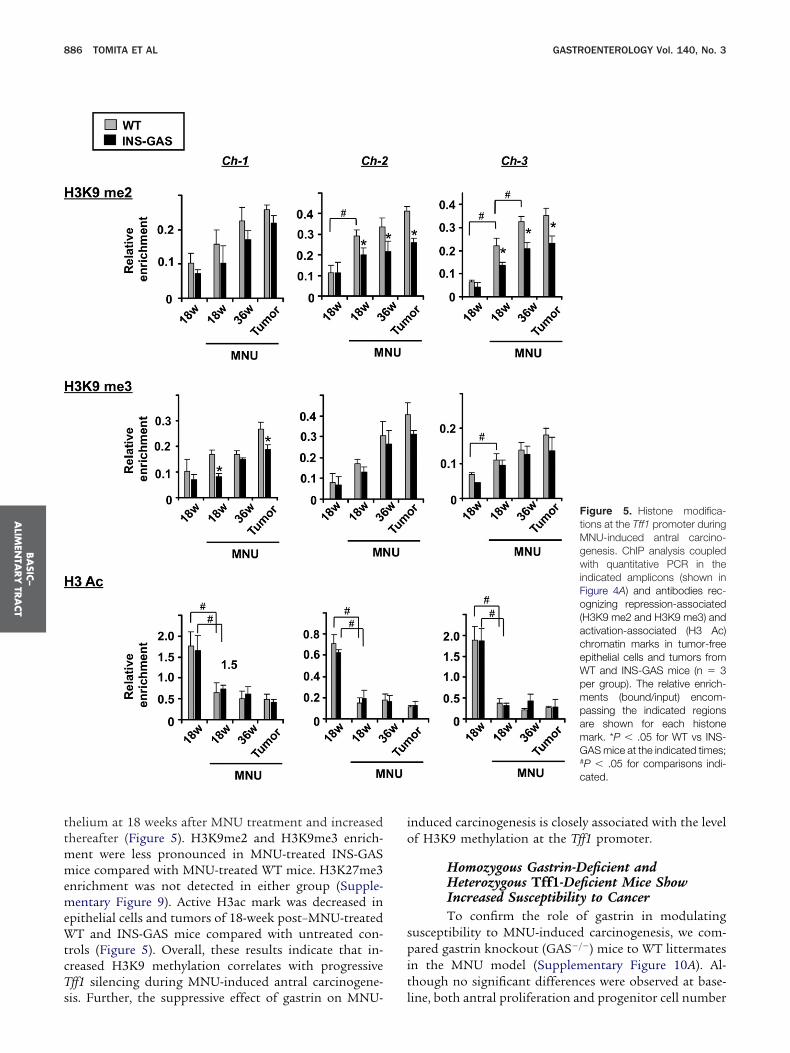
BA
SIC–
ALIM
ENTA
RY
TRA
CT
886 TOMITA ET AL GASTROENTEROLOGY Vol. 140, No. 3
thelium at 18 weeks after MNU treatment and increasedthereafter (Figure 5). H3K9me2 and H3K9me3 enrich-ment were less pronounced in MNU-treated INS-GASmice compared with MNU-treated WT mice. H3K27me3enrichment was not detected in either group (Supple-mentary Figure 9). Active H3ac mark was decreased inepithelial cells and tumors of 18-week post–MNU-treatedWT and INS-GAS mice compared with untreated con-trols (Figure 5). Overall, these results indicate that in-creased H3K9 methylation correlates with progressiveTff1 silencing during MNU-induced antral carcinogene-
sis. Further, the suppressive effect of gastrin on MNU-induced carcinogenesis is closely associated with the levelof H3K9 methylation at the Tff1 promoter.
Homozygous Gastrin-Deficient andHeterozygous Tff1-Deficient Mice ShowIncreased Susceptibility to CancerTo confirm the role of gastrin in modulating
susceptibility to MNU-induced carcinogenesis, we com-pared gastrin knockout (GAS�/�) mice to WT littermatesin the MNU model (Supplementary Figure 10A). Al-though no significant differences were observed at base-
Figure 5. Histone modifica-tions at the Tff1 promoter duringMNU-induced antral carcino-genesis. ChIP analysis coupledwith quantitative PCR in theindicated amplicons (shown inFigure 4A) and antibodies rec-ognizing repression-associated(H3K9 me2 and H3K9 me3) andactivation-associated (H3 Ac)chromatin marks in tumor-freeepithelial cells and tumors fromWT and INS-GAS mice (n � 3per group). The relative enrich-ments (bound/input) encom-passing the indicated regionsare shown for each histonemark. *P � .05 for WT vs INS-GAS mice at the indicated times;#P � .05 for comparisons indi-cated.
line, both antral proliferation and progenitor cell number

6 utMtn
n
ncM
toe
tctvM
tof�
ctvM
BA
SIC–
ALI
MEN
TARY
TRA
CT
March 2011 GASTRIN SUPPRESSES DISTAL GASTRIC CANCER 887
were significantly higher at 18 weeks after MNU treat-ment in GAS�/� mice compared with WT mice (Figure
A and Supplementary Figure 10B). Antral Tff1 mRNAexpression was considerably lower at baseline in GAS�/�
mice, decreased further at 18 weeks after MNU treat-ment, and was significantly lower than that of MNU-treated WT mice (Figure 6A). Interestingly, we found thatat 20 weeks, microadenocarcinomas developed in theantrum of MNU-treated GAS�/� mice (Supplementary
Figure 6. Proliferation, proge-itor cell expansion, and car-inogenesis in the antrum ofNU-treated GAS�/� and Tff1�/�
mice. (A) Percentage of Ki-67–positive and Dclk1-positive cellsin the antrum of untreated andMNU-treated WT and GAS�/�
mice (n � 5 for each group) athe indicated times. Expressionf Tff1 mRNA (left) in tumor-freepithelial cells. *P � .05, **P �
.01 for WT vs GAS�/� mice athe indicated times; ##P � .01 foromparisons indicated. (B) His-ologic grade of the most ad-anced tumor in tumor-bearingNU-treated WT and GAS�/�
mice. (C) Percentage of Ki-67–positive and Dclk1-positive cellsin the antrum of untreated andMNU-treated WT and Tff1�/�
mice (n � 5 for each group) athe indicated times. Expressionf Tff1 mRNA (right) in tumor-
ree epithelial cells. *P � .05, **P.01 for WT vs Tff1�/� mice at
the indicated times; ##P � .01 foromparisons indicated. (D) His-ologic grade of the most ad-anced tumor in tumor-bearingNU-treated Tff1�/� and Tff1�/�
mice.
Figure 10C), while MNU-treated WT and untreatedGAS�/� mice remained tumor free. Histopathologic eval-
ation showed an increase in progression of malignantumors in MNU-treated GAS�/� mice compared with
NU-treated WT mice (Figure 6B). These results indicatehat gastrin elicits a marked suppression of antral carci-ogenesis by positively regulating Tff1 gene expression.To address Tff1 transcriptional repression as a mecha-
ism for MNU-driven antral tumorigenesis, we analyzed

dm
lnanw
putmpdii
cMfdr5D(Ty
dntfcGm2tmdc
rrp
pCsctntToy
au
fapcsamm
ip
BA
SIC–
ALIM
ENTA
RY
TRA
CT
888 TOMITA ET AL GASTROENTEROLOGY Vol. 140, No. 3
Tff1 mutant mice. Homozygous Tff1�/� mutants, whichevelop spontaneous antral adenomas and adenocarcino-as,12 showed at baseline increased proliferation and
Dclk1-positive cell number (Supplementary Figure 11Aand B). Heterozygous Tff1�/� mutants showed a reducedevel of Tff1 mRNA compared with WT controls but didot develop tumors (Figure 6C). By MNU exposure, bothntral proliferation and progenitor cell number were sig-ificantly higher at 18 weeks in Tff1�/� mice comparedith WT mice (Figure 6C and Supplementary Figure
11C). Tff1 mRNA expression was almost lost in MNU-treated Tff1�/� mice at that time point. Interestingly, wefound that, at 18 weeks, microadenocarcinomas devel-oped in the antrum of MNU-treated Tff1�/� mice (Sup-
lementary Figure 11D), whereas MNU-treated WT andntreated Tff1�/� mice remained tumor free. Finally, his-opathologic evaluation clearly showed an increase in
alignant tumors in MNU-treated Tff1�/� mice com-ared with MNU-treated WT mice (Figure 6D). Theseata indicate that reduced Tff1 gene expression markedly
ncreases susceptibility to the initiation and progressionn MNU-induced gastric carcinogenesis.
Gastrin Stimulation Changes EpigeneticStatus at the TFF1 Promoter In VitroTo investigate whether gastrin can directly mod-
ulate TFF1 epigenetic silencing in gastric cancer cells, firstwe examined TFF1 mRNA expression and promotermethylation (Figure 7A) in 4 gastric cancer cell lines:AGS, AGS-E, MKN45, and MKN28. Significant TFF1repression and promoter methylation were observed onlyin MKN28 cells (Supplementary Figure 12A and B). Toconfirm that TFF1 silencing in the TFF1-negative MKN28ells can be indeed regulated by promoter methylation,
KN28 cells were treated with the DNA methyltrans-erase inhibitor 5-aza-2=-deoxycytidine or the histoneeacetylase inhibitor trichostatin A. TFF1 expression wasestored dose dependently after 5 days of treatment with-aza-2=-deoxycytidine (Supplementary Figure 12C and), while there was no significant effect of trichostatin A
Supplementary Figure 12E). These results indicate thatFF1 transcriptional repression requires promoter meth-lation in TFF1-silencing gastric cancer cells.
The TFF1 transactivation by gastrin is induced bothirectly and indirectly through gastrin/CCKBR betweeneighboring cells.17 To examine the effect of gastrin onhe epigenetic regulation of TFF1, MKN28 cells trans-ected transiently and stably with gastrin/CCKBR (stablelones, MKN28E) were treated with exogenous gastrin.astrin treatment of the MKN28E cells induced TFF1RNA expression in a dose-dependent manner, with a
5-fold increase observed with 100 �mol/L concentra-ion (Figure 7B). Gastrin treatment partially reversed
ethylation of the TFF1 promoter associated with TFF1erepression (Figure 7C). Transiently transfected MKN28
ells also showed similar results (data not shown). These Wesults suggest a mechanism by which gastrin-dependentestoration of TFF1 expression is mediated by changes inromoter methylation levels.Finally, we analyzed histone modifications at the TFF1
romoter in response to gastrin treatment by using ahIP assay. After gastrin treatment, the active H3ac mark
howed significant enrichment over the TFF1 promoterompared with untreated cells (Figure 7D). In addition,he repressive marks H3K9me2 and H3K9me3 were sig-ificantly decreased, albeit in regions near the transcrip-ion start site at the proximal TFF1 promoter (Figure 7D).hese results suggest that gastrin-dependent restorationf TFF1 expression may also be associated with the meth-lation level at histone lysine residues in the TFF1 prox-
imal promoter.
DiscussionWe showed that one of the earliest changes that
occur in the antral gland during gastric carcinogenesis inmice and humans is epigenetic repression of the tumorsuppressor TFF1. In mice, Tff1 promoter methylation andantral tumorigenesis were induced by NOC. Humanstudies suggest that TFF1 is frequently inactivated inhuman gastric cancer,14 and we showed for the first timethat hormonal inhibition of carcinogenesis is mediatedby repression of the epigenetic changes that initiate can-cer.
Epigenetic disruption might perturb the normal bal-ance between undifferentiated progenitor cells and dif-ferentiated committed cells within a given anatomic com-partment, either in number or in their capacity fornormal differentiation, which provides a common mech-anism for unifying neoplasia.1 Within the gastric epithe-lium, TFF1 has been suggested to regulate progenitorcells, because recombinant TFF1 inhibits G1-S transition
nd TFF1 depletion results in loss of epithelial cell mat-ration.27 WT mice treated in our study with MNU
phenocopied the untreated Tff1�/� mice in the histologiceature and tumor localization, with the development ofntral tumors that was preceded by Tff1 epigenetic re-ression and an increase in proliferation and progenitorell number. Methylation of histone H3K9 is a primaryignal that is sufficient for initiating DNA methylationnd gene silencing in vivo,28 and we showed in our MNUodel substantial alterations in Tff1-associated H3K9ethylation in association with Tff1 promoter DNA
methylation, which together generated an epigenetic fielddefect in the antrum. Thus, our results suggest thatgastric progenitor cell expansion associated with epige-netic Tff1 repression might continue a first step that leadsto the later onset of cancer development in the antrum.
In our studies of primary human tissues, we foundthat TFF1 was epigenetically repressed to a greater extentn H pylori–infected patients, more repressed in preneo-lastic tissue, and profoundly repressed in antral cancers.
e found a similar pattern in our mouse models, with
mbTmspamh
w
gt
vyiMi(pflg(atmttegtti
BA
SIC–
ALI
MEN
TARY
TRA
CT
March 2011 GASTRIN SUPPRESSES DISTAL GASTRIC CANCER 889
Tff1 repression by Helicobacter infection alone but morearked repression in the MNU model following Helico-
acter infection in the antrum. Because suppression offf1 appears to be necessary for initiation of antral tu-ors, this suggests that Helicobacter infection may not be
ufficient but instead requires the development of atro-hy, achlorhydria, and the production of NOCs to initi-te tumorigenesis. Thus, the combination of MNU treat-ent following Helicobacter infection likely mimics best
uman antral carcinogenesis.Interestingly, our MNU model of antral gastric cancer
as phenocopied not only by Tff1�/� mice but also to a
Figure 7. Effect of gastrin stim-ulation on epigenetic alterationsin TFF1-silencing gastric cancercells. (A) A schematic of the hu-man TFF1 gene promoter. An ar-row indicates the transcriptionstart site (TSS). BS-1, BS-2, andBS-3 (black bars) represent theexamined PCR regions for bisul-fite sequencing. Ch-1 to Ch-5(black bars) represents the ex-amined PCR regions for ChIPassays. (B) Expression of TFF1mRNA in MKN28E cells aftergastrin treatment for 24 hours.**P � .01 for control (0 �mol/L)s the indicated cells. (C) Meth-lation status (top) of CpG sitesn untreated and gastrin-treated
KN28E cells. Representativemages (bottom) showing TFF1red) and 4=,6-diamidino-2-henylindole (blue) immuno-uorescence in untreated andastrin-treated MKN28E cells.
D) ChIP analysis in the indicatedmplicons (shown in A) and an-ibodies recognizing histonearks in untreated and gastrin-
reated MKN28E cells. The rela-ive enrichments (bound/input)ncompassing the indicated re-ions are shown for each his-one mark. *P � .05 for un-reated vs treated cells at thendicated regions.
large extent by GAS�/� mice. GAS�/� mice have been
reported in the past to develop spontaneous antral tu-mors, particularly in a mixed genetic background in con-ventional housing,20 and we have previously shown that
astrin is able to directly and indirectly induce TFF1ranscription17 and that hypergastrinemia is able to in-
hibit the development of antral cancer in the setting of Hfelis infection.22 Here, we demonstrated that untreatedGAS�/� mice showed decreased Tff1 gene expression andconsequently are much more susceptible to MNU-depen-dent antral carcinogenesis. In contrast, hypergastrinemicINS-GAS mice showed increased antral Tff1 gene expres-sion and are extremely resistant to MNU-dependent gas-
tric cancer. Gastrin/Cck2 receptors are present in the
ppaatdi
scahwm
ttt
mdnir
tmraiteio(icmit
1
BA
SIC–
ALIM
ENTA
RY
TRA
CT
890 TOMITA ET AL GASTROENTEROLOGY Vol. 140, No. 3
pyloric gland of the antrum (Supplementary Figure 13)and thus could certainly mediate the effect. The relation-ship of hypergastrinemia to the development of humanantral gastric cancer has not been specifically examined.However, moderate hypergastrinemia is typically seen inpatients with duodenal ulcer disease,29 and interestingly
atients with duodenal ulcer have been shown to berotected against the development of gastric cancer.30 Inddition, the protective effects of hypergastrinemia onntral carcinogenesis could explain the lack of promo-ion of proton pump inhibitors on rates of gastric cancer,espite a previously reported synergy with H pylori on the
nduction of corpus atrophy.31
Although previous studies have noted a relationshipbetween epigenetic alterations and hormone-dependentcancers, such as breast and prostate cancers,4 we havehown for the first time that hormonal inhibition ofancer can be directly attributed to related epigeneticlterations of a tumor suppressor. One mode by whichormonal agents, such as estrogen and glucocorticoids,ork is by modulating epigenetic events such as histoneodifications and DNA methylation.4,32 Indeed, we have
shown that gastrin may be able to reverse the epigeneticchanges, with evidence for gastrin-dependent alterationsof methylation at DNA and histone levels in gastriccancer cells, although the signaling pathways have notbeen defined. Recently, it has been reported that parathy-roid hormone can induce active demethylation of targetgene promoters by activating a protein kinase C (PKC)-dependent pathway.32 Interestingly, we have found thathe peptide hormone gastrin can regulate TFF1 transcrip-ional activity through a PKC-dependent pathway in gas-ric cancer cells.17 In this respect, we can speculate that
gastrin might induce demethylation of the TFF1 pro-oter by activating demethylases through a PKC-depen-
ent pathway. In our study, hormonal-dependent epige-etic switching at DNA and histone levels reflects, at least
n part, well demonstrated hormonal actions on geneegulation in case of gastric cancers.
In summary, our results show that the aberrantranscriptional silencing of TFF1 preceded its promoter
ethylation, and this may be triggered by chromatinemodeling associated with histone modifications, suchs H3K9 methylation and H3 deacetylation in MNU-nduced gastric carcinogenesis. These epigenetic altera-ions may contribute to the disruption of the cell prolif-ration and progenitor cell expansion, which are involvedn the epigenetic field defect that leads to the later onsetf cancer development in the antrum exposed to MNUSupplementary Figure 14). Further, the hormone gastrins able to inhibit the initiation and progression of antralarcinogenesis through positive regulation of TFF1 anday have potential as an epigenetic modifier. The find-
ngs may have an important implication for the preven-
ion and treatment of cancers arising in gastric antrum.Supplementary Material
Note: To access the supplementary materialaccompanying this article, visit the online version ofGastroenterology at www.gastrojournal.org, and at doi:
0.1053/j.gastro.2010.11.037.
References
1. Feinberg AP, Ohlsson R, Henikoff S. The epigenetic progenitororigin of human cancer. Nat Rev Genet 2006;7:21–33.
2. Baylin SB, Ohm JE. Epigenetic gene silencing in cancer—a mech-anism for early oncogenic pathway addiction? Nat Rev Cancer2006;6:107–116.
3. Ushijima T. Epigenetic field for cancerization. J Biochem Mol Biol2007;40:142–150.
4. Chiam K, Tilley WD, Butler LM, et al. The dynamic and staticmodification of the epigenome by hormones: a role in the devel-opmental origin of hormone related cancers. Biochim BiophysActa 2009;1795:104–109.
5. Tsugane S, Sasazuki S. Diet and the risk of gastric cancer: reviewof epidemiological evidence. Gastric Cancer 2007;10:75–83.
6. Fox JG, Wang TC. Helicobacter pylori—not a good bug after all!N Engl J Med 2001;345:829–832.
7. Brambilla G, Martelli A. Genotoxic and carcinogenic risk to hu-mans of drug-nitrite interaction products. Mutat Res 2007;635:17–52.
8. Jakszyn P, Bingham S, Pera G, et al. Endogenous versus exoge-nous exposure to N-nitroso compounds and gastric cancer risk inthe European Prospective Investigation into Cancer and Nutrition(EPIC-EURGAST) study. Carcinogenesis 2006;27:1497–1501.
9. Tsukamoto T, Mizoshita T, Tatematsu M. Animal models of stom-ach carcinogenesis. Toxicol Pathol 2007;35:636–648.
10. Boffa LC, Bolognesi C. Methylating agents: their target aminoacids in nuclear proteins. Carcinogenesis 1985;6:1399–1401.
11. Taupin D, Podolsky DK. Trefoil factors: initiators of mucosalhealing. Nat Rev Mol Cell Biol 2003;4:721–732.
12. Lefebvre O, Chenard MP, Masson R, et al. Gastric mucosa ab-normalities and tumorigenesis in mice lacking the pS2 trefoilprotein. Science 1996;274:259–262.
13. Judd LM, Alderman BM, Howlett M, et al. Gastric cancer devel-opment in mice lacking the SHP2 binding site on the IL-6 familyco-receptor gp130. Gastroenterology 2004;126:196–207.
14. Beckler AD, Roche JK, Harper JC, et al. Decreased abundance oftrefoil factor 1 transcript in the majority of gastric carcinomas.Cancer 2003;98:2184–2191.
15. Fujimoto J, Yasui W, Tahara H, et al. DNA hypermethylation at thepS2 promoter region is associated with early stage of stomachcarcinogenesis. Cancer Lett 2000;149:125–134.
16. Carvalho R, Kayademir T, Soares P, et al. Loss of heterozy-gosity and promoter methylation, but not mutation, may un-derlie loss of TFF1 in gastric carcinoma. Lab Invest 2002;82:1319–1326.
17. Khan ZE, Wang TC, Cui G, et al. Transcriptional regulation of thehuman trefoil factor, TFF1, by gastrin. Gastroenterology 2003;125:510–521.
18. Johnson LR. New aspects of the trophic action of gastrointestinalhormones. Gastroenterology 1977;72:788–792.
19. Wang TC, Koh TJ, Varro A, et al. Processing and proliferativeeffects of human progastrin in transgenic mice. J Clin Invest1996;98:1918–1929.
20. Zavros Y, Eaton KA, Kang W, et al. Chronic gastritis in thehypochlorhydric gastrin-deficient mouse progresses to adenocar-cinoma. Oncogene 2005;24:2354–2366.
21. Zavros Y, Rieder G, Ferguson A, et al. Genetic or chemical
hypochlorhydria is associated with inflammation that modulates
March 2011 GASTRIN SUPPRESSES DISTAL GASTRIC CANCER 891
parietal and G-cell populations in mice. Gastroenterology 2002;122:119–133.
22. Takaishi S, Tu S, Dubeykovskaya ZA, et al. Gastrin is an essentialcofactor for Helicobacter-associated gastric corpus carcinogene-sis in C57BL/6 mice. Am J Pathol 2009;175:365–375.
23. Wang TC, Dangler CA, Chen D, et al. Synergistic interactionbetween hypergastrinemia and Helicobacter infection in a mousemodel of gastric cancer. Gastroenterology 2000;118:36–47.
24. Giannakis M, Stappenbeck TS, Mills JC, et al. Molecular proper-ties of adult mouse gastric and intestinal epithelial progenitors intheir niches. J Biol Chem 2006;281:11292–11300.
25. Kikuchi M, Nagata H, Watanabe N, et al. Altered expression of aputative progenitor cell marker DCAMKL1 in the rat gastric mu-cosa in regeneration, metaplasia and dysplasia. BMC Gastroen-terol 2010;10:65.
26. Terada T, Sakagami R, Tabuchi Y, et al. Characterization of themouse TFF1 (pS2) gene promoter region. Biol Pharm Bull 2001;24:135–139.
27. Tomasetto C, Rio MC. Pleiotropic effects of Trefoil Factor 1deficiency. Cell Mol Life Sci 2005;62:2916–2920.
28. McCabe MT, Brandes JC, Vertino PM. Cancer DNA methylation:molecular mechanisms and clinical implications. Clin Cancer Res2009;15:3927–3937.
29. Peterson WL, Barnett CC, Evans DJ Jr, et al. Acid secretion andserum gastrin in normal subjects and patients with duodenalulcer: the role of Helicobacter pylori. Am J Gastroenterol 1993;88:2038–2043.
30. Hansson LE, Nyren O, Hsing AW, et al. The risk of stomachcancer in patients with gastric or duodenal ulcer disease. N Engl
J Med 1996;335:242–249.31. Kuipers EJ, Sipponen P. Helicobacter pylori eradication for theprevention of gastric cancer. Helicobacter 2006;11(Suppl 1):52–57.
32. Kim MS, Kondo T, Takada I, et al. DNA demethylation in hormone-induced transcriptional derepression. Nature 2009;461:1007–1012.
Received May 25, 2010. Accepted November 15, 2010.
Reprint requestsAddress requests for reprints to: Timothy C. Wang, MD, Division of
Digestive and Liver Diseases, Department of Medicine, ColumbiaUniversity Medical Center, 1130 St Nicholas Avenue, ICRC 923, NewYork, New York 10032. e-mail: [email protected]; fax: (212)851-4590.
AcknowledgmentsThe authors thank Justin DeGrazia and Ashley Whelan for their
help with animal procedures.
Conflicts of interestThe authors disclose no conflicts.
FundingSupported by National Institutes of Health grants
5R01CA093405 and 5R01CA120979 (to T.C.W.). H.T. wassupported by the Uehara Memorial Foundation and the
International College of Surgeons.BA
SIC–
ALI
MEN
TARY
TRA
CT

pmtMFf
wcCpss
2
AeM
hp
(a
mit4iHsbtroTaCtbgambSnci
891.e1 TOMITA ET AL GASTROENTEROLOGY Vol. 140, No. 3
Supplementary Materials and Methods
MNU Treatment and H felis InfectionMNU (Sigma Chemical Co, St Louis, MO) was
dissolved in distilled water at a concentration of 240 ppmand freshly prepared thrice per week for administrationin drinking water in light-shielded bottles ad libitum.Mice from 6 to 10 weeks of age were given drinking watercontaining 240 ppm MNU on alternate weeks for a totalof 10 weeks (total exposure of 5 weeks) (SupplementaryFigure 1). Mice at 8 to 10 weeks of age were infected byoral gavage with H felis in 0.2 mL trypticase broth 3 times
er week on every other day for a total dose of 100illion colony-forming units per mouse treatment. In
he combination of H felis and MNU, we administeredNU 2 weeks after H felis inoculation (Supplementary
igure 1). They were thereafter maintained without anyurther treatment until they were killed.
Cell Culture, Transfection, and TreatmentMKN28 and MKN45 cells were cultured in Dul-
becco’s modified Eagle medium, AGS, and AGSE, whichstably express gastrin-CCKB subtype receptors,1 and cells
ere cultured in RPMI 1640. These human gastric cancerell lines were purchased from American Type Cultureollection (Manassas, VA) and from Riken (Ibaraki, Ja-an). All media were supplemented with 10% fetal bovineerum as well as 100 U/mL penicillin and 100 �g/mLtreptomycin. For transfection with CCKBR to MKN-28
cells, cells (5 � 106 per well) were plated into 6-well plates4 hours before transfection with 1.0 �g pcDNA3.1
CCKBR using 1 �L Surperfect (Qiagen, Alameda, CA).fter transfection, cells were used for experiments andstablishment of stable transfected cells. MKN28 and
KN28E cells (stably transfected with the CCKBR) weresplit 24 hours before treatment. MKN28 and MKN28Ecells were incubated for 5 days with 5-aza-2=-deoxycyt-idine, for 1 day with Trichostatin A (Sigma Chemical Co),or for 12 hours and 24 hours with gastrin. Media werechanged every 24 hours.
Preparation of Tissue Samples for TumorCounting and Histologic AnalysisAll mice underwent a thorough postmortem ex-
amination at the time they were killed. The stomach wasremoved and opened along the greater curvature. Thenumber and the lengths of the major and minor axes ofthe gastric tumors only in the antrum were determinedusing a dissecting microscope at 7� magnification. Tu-mors �0.5 mm in long-axis length were mapped andcounted. The sizes of the tumors were determined bymultiplying the major axis by the minor axis. To elimi-nate interobserver error, all counts were performed by asingle observer blinded to the genotype of the mice. Inaddition, all the cases were counted by a second observerto confirm the results of the first observer. After counting
the tumors, all of the excised stomachs, including the Tneoplastic nodules, were fixed for 24 hours in neutral-buffered 10% formalin and were subsequently cut into 3 or4 strips. These strips were processed by standard methods,embedded in paraffin, sectioned at 5 �m, and stained withH&E. The mucosa of the antrum was examined histologi-cally for inflammatory change. Active chronic gastritis wascharacterized by infiltration of neutrophils, mononuclearcells, and atrophy. The degree of change was graded on ascale from 0 to 3 (0, normal; 1, mild; 2, moderate; 3, marked)based on the updated Sydney System.2
Gastric pH and Plasma GastrinMeasurementsThe gastrin concentration in plasma was mea-
sured by radioimmunoassay.3 After pyloric ligation for 1our, pH was measured in the accumulated juice with aH meter.4
Omeprazole TreatmentOmeprazole was purchased from Sigma Chemical
Co and dissolved in dimethyl sulfoxide/polyethylene gly-col 300, a 1:1 mixture at a concentration of 40 mg/mL.Eight-week-old WT mice (n � 5) were treated with asingle intraperitoneal injection of omeprazole per day(350 �mol/kg) for 8 weeks.5 Eight-week-old control micen � 5) were treated in the same manner with the vehiclelone. All the mice were killed at 16 weeks of age.
ImmunohistochemistryThe avidin-biotin peroxidase complex technique
was used for immunohistochemical studies. Five-micro-eter-thick sections were cut, deparaffinized, rehydrated
n phosphate-buffered saline, placed in 10 mmol/L ci-rate buffer (pH 6.0), and heated in an 750-W microwave
times for 6 minutes. The endogenous peroxidase activ-ty was blocked by incubation for 30 minutes in 0.3%
2O2. After washing 3 times with phosphate-bufferedaline, the sections were then preincubated with normallocking serum for 20 minutes at room temperature andhen were incubated with Ki-67 (1:200; Dako, Carpinte-ia, CA), cleaved caspase-3 (1:200; Cell Signaling Technol-gy, Danvers, MA), Dclk1 (1:100, Abgent, San Diego, CA),FF1 (1:1000), E-cadherin (Invitrogen, Carlsbad, CA),nd CCK-BR (Santa Cruz Biotechnology, Santa Cruz,A) antibodies overnight at 4°C. Subsequently, the sec-
ions were incubated with biotinylated secondary anti-odies (Vectastain ABC kit; Vector Laboratories, Burlin-ame, CA) for 30 minutes, followed by incubation withvidin-coupled peroxidase (Vector Laboratories) for 30inutes. The sections were developed with 3,3=-diamino-
enzidine using Dako liquid DAB Substrate-Chromogenystem and then counterstained with hematoxylin. Theumber of Ki-67–, cleaved caspase-3–, or Dclk1-positiveells per gland was calculated as the percent ratio. Formmunofluorescence, fluorescein isothiocyanate– or
exas Red– conjugated secondary antibodies (Jackson Im-
fSfRelewe
p
#
c(
March 2011 GASTRIN SUPPRESSES DISTAL GASTRIC CANCER 891.e2
munoResearch, West Grove, PA) were used and thencounterstained with 4=,6-diamidino-2-phenylindole. Nospecific staining was observed in the negative controlslides prepared without primary antibody.
Epithelial Cell IsolationThrough all the experiments in mice, the epithelial
samples were collected from the antral portion of the stom-ach by the gland isolation technique.6 We carefully cut onlythe antral region through the border line of corpus andantrum (Figure 2A), and a whole layer of antral tissue waswashed in calcium-free Hank’s balanced salt solution (In-vitrogen Corp, Carlsbad, CA) and incubated at 37°C inHank’s solution containing 30 mmol/L EDTA for 10 min-utes. After incubation, the tissue specimen was moved intofresh Hank’s solution and strongly stirred to isolate antralglands from the stroma. Isolated crypts were carefullychecked to identify antral glands by microscopy for elimi-nating the contamination of fundic glands.
Quantitative Real-Time RT-PCRTotal RNAs were extracted from samples of iso-
lated epithelial cells and tumors from each animal withTRIzol reagent (Invitrogen), and 2 �g total RNA was usedor first-strand complementary DNA synthesis using theuperscript III cDNA Amplification System (Invitrogen)ollowing the manufacturer’s instructions. QuantitativeT-PCR was performed using quantitative RT-PCR prim-rs for each gene. Relative transcript levels were calcu-ated by the comparative threshold cycle method. Eachxperiment was performed in duplicate, and the averageas subsequently calculated. The oligonucleotide prim-
rs are listed in Supplementary Table 3.
Mutation Analysis of the Promoter of theTff1 GeneGenomic DNA was extracted by using the genomic
DNA isolation kit (Lamda, St Louis, MO) according to themanufacturer’s protocol. The mutation of the promoterregion of the mouse TFF1 gene was screened for sequencealterations by using primers listed in Supplementary Table1. PCR products were gel purified using the DNA GelExtraction Kit (Qiagen). These samples were also subclonedinto pCR 2.1 (Invitrogen) and sequenced using T7 primers.The standard cycle sequencing was performed in the pres-ence of fluorescently labeled dideoxynucleotides by an ABIautomated sequencer (Applied Biosystems, Austin, TX). Se-quencing analyses of all samples were repeated twice toexclude PCR errors.
Sodium Bisulfite Treatment and SequencingAnalysisGenomic DNAs from samples were subjected to
sodium bisulfite modification (EZ DNA Methylation-GoldKit; Zymo Research, Orange, CA). After PCR amplification
using primers listed in Supplementary Table 1, the products cwere cloned into the TOPO vector. The inserted PCR frag-ments of the individual clones obtained from each samplewere sequenced with both M13 reverse and M13 forwardprimers using an ABI automated sequencer.
ChIP AssayThe ChIP assay was performed using an EpiQuik
Tissue Chromatin Immunoprecipitation Kit (Epigentek,New York, NY) according to the manufacturer’s instruc-tions. Isolated epithelial cells and tumor cells were ho-mogenized. The nucleoprotein complexes were sonicatedto reduce the sizes of DNA fragments to 200 to 600 basepairs using a Sonic Dismembrator model 100 (Fisher,Pittsburg, PA). One microgram of normal mouse or rab-bit immunoglobulin G was used as the negative control.Anti– dimethyl histone H3K9, anti–trimethyl histoneH3K9, anti–acethyl histone H3-K9, and anti–trimethylhistone H3-K27 antibodies (Epigentik) were used foreach immunoprecipitation. Immunoprecipitated DNAwas quantitated by real-time quantitative PCR. The se-quences of the PCR primers are shown in SupplementaryTable 3. The enrichment of these histone marks at theexamined regions was quantitated relative to the inputamount (mean � SE of triplicate measurement). Immu-noglobulin G controls were extremely low (data notshown) in this study.
Gene Expression and Quantitative DNAMethylation Analysis in Human TissuesGastric mucosal tissue was obtained from H pylori–
ositive individuals and noninfected controls.7 Gastriccancers and matched preneoplastic adjacent to cancertissues were collected from patients undergoing surgicalresection.
Total RNA was isolated from tissue and cell lines usingTRIzol. For quantitative RT-PCR, oligo-dT primed com-plementary DNA was synthesized from 3 �g total RNAusing Moloney murine leukemia virus reverse transcrip-tase (Promega, Indianapolis, IN). Quantitative RT-PCRwas performed on an ABI Prism 7500 Real Time PCRSystem using SYBR green master mix (Applied Biosys-tems, Austin, TX) according to the manufacturer’s pro-tocols. Relative gene expression values were obtained bynormalization to the reference gene GAPDH using the�2��Ct method, where �2��Ct � �Ct sample � �Ctcalibrator (Applied Biosystems). Primer sequences forquantitative RT-PCR were designed using primer3(http://frodo.wi.mit.edu/primer3/): TFF1: #675-TFF1-F,5=-CCCTGGTGCTTCTATCCTAATAC-3=; #675-TFF1-R,5=-GAGCAGTCAATCTGTGTTGTGAGC-3=. GAPDH: #429-GAPDH-F, 5=-GACATCAAGAAGGTGGTGAAGC-3=;
429-GAPDH-R, 5=-GTCCAACCCTGTTGCTGTAG-3=.Genomic DNA (200 –500 ng) samples were bisulfite
onverted using the Zymo EZ DNA methylation reagentsZymo Research) according to the manufacturer’s proto-
ols. To determine TFF1 methylation, a 500 – base pair
891.e3 TOMITA ET AL GASTROENTEROLOGY Vol. 140, No. 3
region encompassing the TFF1 promoter (�475 basepairs) and part of the first exon (Figure 1B) was amplifiedfrom bisulfite-converted DNA with HotStarTaq DNApolymerase (Qiagen) using a nested PCR approach.Primer sequences for bisulfite PCR were designed usingMethPrimer (http://www.urogene.org/methprimer/index1.html) (TFF1-METH-OUT-F, TGGTTTTTTAAAGTGT-TGGGATTATAG-3=; TFF1-METH-OUT-R, 5=-TGGTT-TTTTAAAGTGTTGGGATTATAG-3=) with cycling con-ditions as follows: 95°C for 15 minutes and then 25cycles of 95°C for 30 seconds, 56°C for 1 minute, and72°C for 1 minute. Second-round PCR amplificationused 1 �L of the first-round reaction product as tem-plate, with the primer sequences (TFF1-METH-IN-F,5=-AGGAAGAGAGTTGTAAAAGAATTAGTTTAGGTTTAGA-3=; TFF1-METH-IN-R, 5=-CAGTAATACG-ACTCACTATAGGGAGAAGGCTCCATAATAACCA-TTACCTCCTCTCTACT-3=) and cycling conditions asdescribed for first-round amplification. Quantitativemethylation analysis of bisulfite PCR-amplified productswas performed by in vitro transcription (T7 promoter tagunderlined in primer sequence) and base-specific cleavageusing MassCleave reagents (Sequenom, San Diego, CA)followed by matrix-assisted laser desorption ionization/time-of-flight mass spectrometry using the EpiTYPERsystem (Sequenom) according to published protocols.8
Methylation data cleaning and hierarchical cluster anal-ysis were performed using the Rscript gplots software(available: http://www.r-project.org/).
Statistical AnalysisResults are expressed as mean � SEM unless oth-
erwise stated. Statistical analysis was performed with
Mann–Whitney U test, Fisher exact test, or Spearmanrank correlation test. Differences were considered signif-icant at P � .01 or P � .05.
Supplementary References
1. Khan ZE, Wang TC, Cui G, et al. Transcriptional regulation of thehuman trefoil factor, TFF1, by gastrin. Gastroenterology 2003;125:510–521.
2. Dixon MF, Genta RM, Yardley JH, et al. Classification and gradingof gastritis. The updated Sydney System. International Workshopon the Histopathology of Gastritis, Houston 1994. Am J SurgPathol 1996;20:1161–1181.
3. Rehfeld JF, Stadil F, Rubin B. Production and evaluation of anti-bodies for the radioimmunoassay of gastrin. Scand J Clin LabInvest 1972;30:221–232.
4. Shay H, Sun DC, Gruenstein M. A quantitative method for measur-ing spontaneous gastric secretion in the rat. Gastroenterology1954;26:906–913.
5. Zavros Y, Rieder G, Ferguson A, et al. Genetic or chemical hypo-chlorhydria is associated with inflammation that modulates pari-etal and G-cell populations in mice. Gastroenterology 2002;122:119–133.
6. Bjerknes M, Cheng H. Methods for the isolation of intact epithe-lium from the mouse intestine. Anat Rec 1981;199:565–574.
7. Jackson CB, Judd LM, Menheniott TR, et al. Augmented gp130-mediated cytokine signalling accompanies human gastric cancerprogression. J Pathol 2007;213:140–151.
8. Coolen MW, Statham AL, Gardiner-Garden M, et al. Genomic pro-filing of CpG methylation and allelic specificity using quantitativehigh-throughput mass spectrometry: critical evaluation and im-provements. Nucleic Acids Res 2007;35:e119.
9. Minamoto T, Mai M, Watanabe K, et al. Medullary carcinoma withlymphocytic infiltration of the stomach. Clinicopathologic study of27 cases and immunohistochemical analysis of the subpopula-tions of infiltrating lymphocytes in the tumor. Cancer 1990;66:945–952.

F
c
March 2011 GASTRIN SUPPRESSES DISTAL GASTRIC CANCER 891.e4
Supplementary Table 1. Clinical Findings of Patients WithChronic Gastritis in Gastric Antrum
Patient ID Age (y)/sexSite of biopsyin stomach
H pyloriinfectiona
AT4 48/M Antrum �AT7 67/M Antrum �AT9 58/M Antrum �AT13 48/M Antrum �AT19 34/F Antrum �AT20 26/M Antrum �AT25 68/F Antrum �AT28 54/M Antrum �AT33 34/M Antrum �AT34 45/M Antrum �AT38 54/M Antrum �AT43 58/M Antrum �AT45 69/M Antrum �AT47 32/F Antrum �AT55 68/M Antrum �AT69 39/F Antrum �AT71 49/F Antrum �AT75 40/F Antrum �AT80 34/F Antrum �AT84 36/F Antrum �AT86 47/M Antrum �AT88 79/M Antrum �AT97 53/M Antrum �
, female; M, male.aH pylori infection determined by Helicobacter urease test.7
Supplementary Table 2. Clinical and Histopathologic Finding
Patient ID(St-)
Age(y)/sex
Site of tumorin stomach Histology
16 73/M Antrum por18 51/M Antrum MCLIb
23 48/M Corpus-antrum por24 66/M Antrum pap25 59/F Whole stomach por31 38/M Corpus-antrum por35 67/M Whole stomach tub37 48/M Corpus-antrum tub38 59/F Antrum por39 69/M Antrum pap40 71/M Antrum por41 77/F Antrum por � pap � tub42 77/M Antrum Choriocarcinomac
44 79/M Antrum tub � pap � por47 69/M Antrum-corpus tub � pap � por48 47/M Corpus-antrum tub49 83/M Antrum tub51 44/M Whole stomach por54 74/F Antrum tub55 53/M Corpus-antrum por
F, female; M, male; pap, papillary adenocarcinoma; por, poorly differeor moderately differentiated adenocarcinoma).aNot determined due to marked intestinal metaplasia.bMedullary carcinoma (undifferentiated adenocarcinoma) with lymphoChoriocarcinoma (nonadenocarcinoma) positive for human chorionic
s of Patients With Intestinal-Type Cancer in Gastric Antrum
TMNstage
Nonneoplastic mucosa
H pyloriinfection
Intestinalmetaplasia
Chronicgastritis Dysplasia
IV � � � NDa
II � � � �IV � � � �II � � �, focal �IV � �, mild � �IIIB �, focal � � �IV �, focal � � �IIIA �, focal � � �IIIA � �, mild � �IB � � � �IIIA �, focal � � �IB �, focal � � �IV � � � �IIIA � � �, focal �IV �, focal � � �IV � � � �IV �, focal � � �IV �, focal/spotty � � �IIIA � � � NDa
II �, focal � � NDd
ntiated adenocarcinoma; tub, tubular adenocarcinoma (well-differentiated
cytic infiltration.9
gonadotropin by immunohistochemistry.
dNot determined due to poor fixation of the surgical specimen.
891.e5 TOMITA ET AL GASTROENTEROLOGY Vol. 140, No. 3
Supplementary Figure 1. Schematic overview of an MNU-induced gastric carcinogenesis model with or without H felis infection. Black areas
indicate MNU (240 ppm) administration periods, and white areas indicate MNU nonadministration periods.
H
March 2011 GASTRIN SUPPRESSES DISTAL GASTRIC CANCER 891.e6
Supplementary Figure 2. (A) Histopathologic features of the corpus in the stomach of MNU-treated and/or H felis–infected INS-GAS mice at 36weeks. The box indicates higher magnification in each upper photograph. HF, H felis. Bars � 100 �m. (B) Metaplastic glands (left) in untreatedINS-GAS mice and dysplastic glands in MNU-treated INS-GAS mice. Bars � 100 �m. (C) Tff2 immunostaining in the corpus of MNU-treated and/or
felis–infected INS-GAS mice at 36 weeks. Bars � 100 �m.

B
891.e7 TOMITA ET AL GASTROENTEROLOGY Vol. 140, No. 3
Supplementary Figure 3. Gastrin suppresses the cell proliferation, apoptosis, and progenitor cell expansion in preneoplastic epithelial cells of theantrum exposed to MNU. (A) Ki67, Dclk1, and cleaved caspase-3 immunostaining in the antrum of MNU-treated WT and INS-GAS mice at 18 weeks.Arrows indicate Dclk1-positive cells. Arrowheads indicate cleaved caspase-3–positive cells. Inner boxes indicate higher magnification. W, weeks.
ars � 100 �m. (B) Gastric pH levels in the stomach of untreated (�MNU) and MNU-treated (�MNU) WT and INS-GAS mice (n � 5 for each group)
at the indicated times.
B
March 2011 GASTRIN SUPPRESSES DISTAL GASTRIC CANCER 891.e8
Supplementary Figure 4. (A) Tff1 immunostaining in the corpus of MNU-treated and/or H felis–infected WT and INS-GAS mice at 36 weeks.ars � 100 �m. (B) Expression of Tff1 mRNA as measured by quantitative RT-PCR in the corpus of MNU-treated and/or H felis–infected WT and
INS-GAS mice at 36 weeks. Results are expressed as means � SEM. NS, not statistically different.

c*epd
891.e9 TOMITA ET AL GASTROENTEROLOGY Vol. 140, No. 3
Supplementary Figure 5. The initial response of MNU induction in antral epithelial cells. (A) Schematic overview of short-term experiment (1-weekinduction) for analyzing the effect of the initial response of MNU. (B) Percentage of Ki-67–positive cells in the antrum of WT and INS-GAS mice (n �5 for each group). Results are expressed as means � SEM. *P � .05, **P � .01 for WT mice vs INS-GAS mice at the indicated times; ##P � .01 foromparisons indicated. (C) Expression of Tff1 mRNA as measured by quantitative RT-PCR. Results are expressed as means � SEM. *P � .05,*P � .01 for WT mice vs INS-GAS mice at the indicated times; ##P � .01 for comparisons indicated. (D) Plasma gastrin levels in the short-termxperiment (n � 5 for each group). (E) Gastric pH levels in the short-term experiment (n � 5 for each group). (F) Plasma gastrin levels (left), gastricH levels (middle), and antral Tff1 mRNA levels (right) in untreated and omeprazole-treated WT mice (n � 5 for each group). NS, not statistically
ifferent.
March 2011 GASTRIN SUPPRESSES DISTAL GASTRIC CANCER 891.e10
Supplementary Figure 6. (A) Histopathologic features of the noncancerous antral mucosa in untreated (control) and MNU-treated WT andINS-GAS mice at 36 weeks. HF, H felis. Bars � 100 �m. (B) Inflammation score in the noncancerous antral mucosa in untreated (control) and
MNU-treated WT and INS-GAS mice at 36 weeks (n � 5 per each group). Results are means � SEM.
891.e11 TOMITA ET AL GASTROENTEROLOGY Vol. 140, No. 3
Supplementary Figure 7. Histopathologic features of antral tumors in the stomach of H felis–infected WT and INS-GAS mice at 36 weeks.
Bars � 100 �m.
March 2011 GASTRIN SUPPRESSES DISTAL GASTRIC CANCER 891.e12
Supplementary Figure 8. Representative results of bisulfite sequencing of normal epithelium and MNU-induced advanced tumor (moderately
differentiated adenocarcinoma) of WT mice. WT1 indicates the sample shown in Figure 4. Bars under the sequence indicate CpG sites.
agm
891.e13 TOMITA ET AL GASTROENTEROLOGY Vol. 140, No. 3
Supplementary Figure 9. ChIP analysis coupled with quantitative PCR was performed with the indicated amplicons (shown in Figure 4A) andntibodies recognizing repression-associated (H3K27me3) mark in isolated epithelial cells and tumors from WT and INS-GAS mice (n � 3 mice perroup). The relative enrichments (bound/input) (mean � SE of triplicate measurement) encompassing the indicated regions are shown for H3K27
e3.
D
March 2011 GASTRIN SUPPRESSES DISTAL GASTRIC CANCER 891.e14
Supplementary Figure 10. (A) Schematic overview of an MNU-induced gastric carcinogenesis model in homozygous gastrin-deficient andheterozygous Tff1-deficient mice studies. Black areas indicate MNU (240 ppm) administration periods, and white areas indicate MNU nonadminis-tration periods. (B) Ki67 and Dclk1 immunostaining in the antrum of untreated and MNU-treated GAS�/� mice at 18 weeks. Arrows indicate
clk1-positive cells. Bars � 100 �m. (C) Representative feature of a microadenocarcinoma in MNU-treated GAS�/� mice at 20 weeks. Arrows in the
higher-magnification view indicate a region of microadenocarcinoma (lower panel). Bars � 100 �m.
m1
891.e15 TOMITA ET AL GASTROENTEROLOGY Vol. 140, No. 3
Supplementary Figure 11. (A) Ki67 and Dclk1 immunostaining in the antrum of untreated homozygous Tff1�/� and WT mouse at 20 weeks of age.Bars � 100 �m. (B) Percentage of Ki-67–positive cells in the antrum of Tff1�/� and WT mice (n � 5 for each group). Results are expressed as
eans � SEM. **P � .01 for Tff1�/� vs WT mice. (C) Ki67 and Dclk1 immunostaining in the antrum of MNU-treated heterozygous Tff1�/� mice at8 weeks. Arrows indicate Dclk1-positive cells. Bars � 100 �m. (D) Representative feature of a microadenomatous lesion in MNU-treated Tff1�/�
mice at 18 weeks. Arrows in the higher-magnification view indicate a region of microadenocarcinoma (lower panel). Bars � 100 �m.

me
March 2011 GASTRIN SUPPRESSES DISTAL GASTRIC CANCER 891.e16
Supplementary Figure 12. (A) Expression of TFF1 mRNA (left) measured by quantitative RT-PCR in 4 gastric cancer cell lines. Results areexpressed as means � SEM. (B) Determination of methylation status (right) of CpG sites by sequencing of bisulfite-modified DNA from 4 gastriccancer cell lines. Open circles represent unmethylated CpGs, and closed circles denote methylated CpGs. (C) Expression of TFF1 mRNA as
easured by quantitative RT-PCR in MKN28 gastric cancer cells after treatment with 5-aza-2=-deoxycytidine (5-AzadC) for 5 days. Results arexpressed as means � SEM. **P � .01 for control (0 �mol/L) vs the indicated concentrations treated with 5-AzadC. (D) Methylation status (top) of
CpG sites by bisulfite sequencing in untreated and 5-AzadC–treated MKN28 cells. Open circles, unmethylated CpGs; closed circles, methylatedCpGs. Representative images (bottom) showing TFF1 (red) and 4=,6-diamidino-2-phenylindole (blue) immunostaining in untreated and 5-AzadC–treated MKN28 cells. (E) Expression of TFF1 mRNA as measured by quantitative RT-PCR in MKN28 gastric cancer cells after treatment with
trichostatin A at the indicated concentrations for 24 hours. Results are expressed as means � SEM.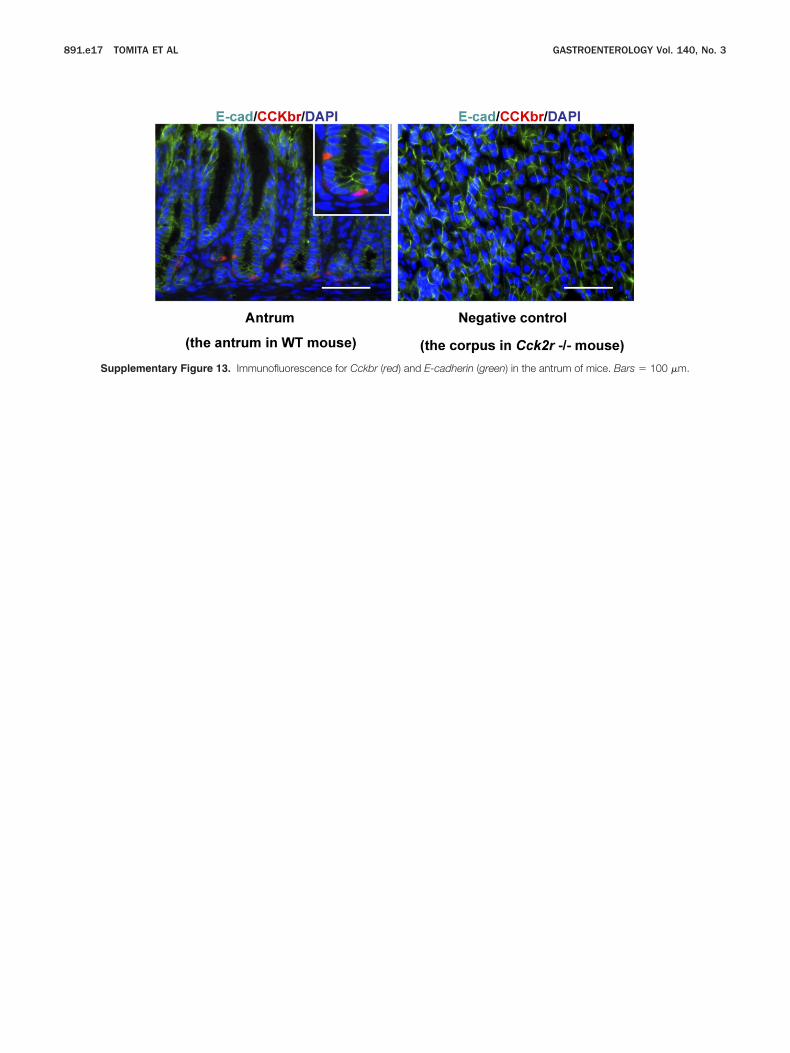
891.e17 TOMITA ET AL GASTROENTEROLOGY Vol. 140, No. 3
Supplementary Figure 13. Immunofluorescence for Cckbr (red) and E-cadherin (green) in the antrum of mice. Bars � 100 �m.

March 2011 GASTRIN SUPPRESSES DISTAL GASTRIC CANCER 891.e18
Supplementary Figure 14. A model depicting changes in chromatin modification and DNA methylation at the Tff1 promoter in MNU-induced antral
gastric carcinogenesis.