Therapeutic applications of RNAi for silencing virus replication
152
Transcript of Therapeutic applications of RNAi for silencing virus replication


METHODS IN MOLECULAR BIOLOGYTM
Series EditorJohn M. Walker
School of Life SciencesUniversity of Hertfordshire
Hatfield, Hertfordshire, AL10 9AB, UK
For other titles published in this series, go towww.springer.com/series/7651

METHODS IN MOLECULAR BIOLOGYTM
Therapeutic Applications of RNAiMethods and Protocols
Edited by
John F. Reidhaar-OlsonCristina M. Rondinone
Hoffmann-La Roche Inc., Nutley, NJ, USA

EditorsJohn F. Reidhaar-Olson Cristina M. RondinoneHoffmann-La Roche Inc. Hoffmann-La Roche Inc.340 Kingsland Street 340 Kingsland StreetNutley NJ 07110 Nutley NJ 07110USA [email protected] [email protected]
ISSN 1064-3745 e-ISSN 1940-6029ISBN 978-1-60327-294-0 e-ISBN 978-1-60327-295-7DOI 10.1007/978-1-60327-295-7Springer Dordrecht Heidelberg London New York
Library of Congress Control Number: 2009926661
c© Humana Press, a part of Springer Science+Business Media, LLC 2009All rights reserved. This work may not be translated or copied in whole or in part without the written permission ofthe publisher (Humana Press, c/o Springer Science+Business Media, LLC, 233 Spring Street, New York, NY 10013,USA), except for brief excerpts in connection with reviews or scholarly analysis. Use in connection with any form ofinformation storage and retrieval, electronic adaptation, computer software, or by similar or dissimilar methodologynow known or hereafter developed is forbidden.The use in this publication of trade names, trademarks, service marks, and similar terms, even if they are not identifiedas such, is not to be taken as an expression of opinion as to whether or not they are subject to proprietary rights.While the advice and information in this book are believed to be true and accurate at the date of going to press,neither the authors nor the editors nor the publisher can accept any legal responsibility for any errors or omissionsthat may be made. The publisher makes no warranty, express or implied, with respect to the material containedherein.
Printed on acid-free paper
Springer is part of Springer Science+Business Media (www.springer.com)

Preface
In the short time since its discovery, RNA interference (RNAi) has become a well-established tool in the drug discovery process. The ability to knock down expression ofany gene in mammalian cells using a straightforward method has revolutionized the pro-cesses of target identification and validation, and helped to usher in the era of functionalgenomics. RNAi is a process in which cytoplasmic long double-stranded RNAs (dsRNAs)produced by viral infection, transposons, or introduced transgenes are targeted for inacti-vation. These long dsRNAs are processed into 21- to 23-nucleotide RNA duplexes by anRNase called Dicer, and are further incorporated into an RNA-induced silencing complex(RISC). The RISC uses these small RNAs to identify and cleave homologous mRNAs inthe cell.
RNAi has been used to interrogate the function of candidate genes and, more recently,following the creation of random and directed siRNA libraries, has permitted phenotype-driven, reverse genetic analysis of normal physiological and disease processes. The devel-opment of stable and inducible expression vectors driving the expression of short hairpinRNAs has further expanded the application of RNAi both in tissue culture and in animalmodels.
Beyond its utility as a research tool, the use of RNAi as a therapeutic method promisesto bring about an even greater revolution in drug discovery. The key features of RNAi – itshigh degree of specificity, the ubiquity of its mechanism in all cell types, its catalytic nature,and its ability to target virtually any gene in the genome – have generated excitement thatRNAi-based drugs may soon become a reality. While the field of RNAi-based therapeuticsis still in its early stages, research is moving ahead rapidly, with several siRNAs alreadybeing tested in the clinic.
However, significant hurdles remain, with drug delivery key among them. DeliveringsiRNA molecules to the right tissue and cell type to treat disease is difficult. GettingsiRNAs across the cell membrane and into the cytoplasm where they can effectively silencetheir targets poses significant challenges. And formulating RNAi-based drugs in ways thatallow convenient administration is a difficult problem as well. Currently, many deliverymethods are being explored, and many have shown promising results in preclinical models.In some cases, local delivery of an unmodified siRNA may be possible with nothing morethan a simple excipient as formulation. But in most cases, some sort of delivery vehicle isrequired. Many classes of delivery agents are under investigation, including liposomes andlipoplexes, conjugates, polymers and nanoparticles, peptides and proteins. In all of thesecases, the challenge is to couple effective delivery with acceptable safety.
With few RNAi programs yet in the clinic, most of the focus remains at earlier stages:testing of delivery vehicles, identifying appropriate model systems, and evaluating theeffects of RNAi in vivo. The chapters in this volume address these aspects of researchtoward the therapeutic application of RNAi. They describe the therapeutic applicationsof RNAi and potential pitfalls in oncology, viral infections, and CNS disease, using avariety of delivery methods, including liposomes, peptide-based nanoparticles, polyca-tionic polymers, and viral vehicles. In all cases, detailed protocols are provided, to allow
v

vi Preface
application of these techniques in the reader’s laboratory. The collection of essays, by ateam of internationally renowned authors, includes basic science chapters dealing with thebiology and design of RNAi, essays describing novel strategies for delivery in vivo, andpapers that discuss the application of RNAi in a variety of therapeutic areas. This vol-ume will be of interest to basic and clinical researchers, biochemists, clinicians, molecularbiologists, physiologists, and pharmacologists.
John F. Reidhaar-OlsonCristina M. Rondinone

Contents
Preface . . . . . . . . . . . . . . . . . . . . . . . . . . . . . . . . . . . . . . . . . . vContributors . . . . . . . . . . . . . . . . . . . . . . . . . . . . . . . . . . . . . . . ix
1 Development and Application of a Dual-Purpose NanoparticlePlatform for Delivery and Imaging of siRNA in Tumors . . . . . . . . . 1Zdravka Medarova, Mohanraja Kumar, Shu-wing Ng,and Anna Moore
2 Targeted Gene Silencing into Solid Tumors with ElectricallyMediated siRNA Delivery . . . . . . . . . . . . . . . . . . . . . . . . . . . 15Muriel Golzio, Laurent Mazzolini, Aurelie Paganin-Gioanni,and Justin Teissie
3 Liposomal siRNA for Ovarian Cancer . . . . . . . . . . . . . . . . . . . . 29Lingegowda S. Mangala, Hee Dong Han, Gabriel Lopez-Berestein,and Anil K. Sood
4 Therapeutic Applications of RNAi for Silencing Virus Replication . . . . 43Ralph A. Tripp and Stephen Mark Tompkins
5 RNAi in the Malaria Vector, Anopheles gambiae . . . . . . . . . . . . . . . 63Flaminia Catteruccia and Elena A. Levashina
6 RNAi Using a Chitosan/siRNA Nanoparticle System: In Vitroand In Vivo Applications . . . . . . . . . . . . . . . . . . . . . . . . . . . 77Morten Østergaard Andersen, Kenneth Alan Howard, and Jørgen Kjems
7 Lentiviral and Adeno-Associated Vector-Based Therapy forMotor Neuron Disease Through RNAi . . . . . . . . . . . . . . . . . . . 87Chris Towne and Patrick Aebischer
8 Studying Autoimmunity by In Vivo RNA Interference . . . . . . . . . . 109Stephan Kissler
9 Transcriptional Gene Silencing Using Small RNAs . . . . . . . . . . . . . 119Daniel H. Kim and John J. Rossi
10 Alternative Splicing as a Therapeutic Target for Human Diseases . . . . 127Kenneth J. Dery, Veronica Gusti, Shikha Gaur, John E. Shively,Yun Yen, and Rajesh K. Gaur
Index . . . . . . . . . . . . . . . . . . . . . . . . . . . . . . . . . . . . . . . . . . 145
vii

Contributors
PATRICK AEBISCHER • Brain Mind Institute, Ecole Polytechnique Federale de Lausanne,Lausanne, Switzerland
MORTEN ØSTERGAARD ANDERSEN • Interdisciplinary Nanoscience Center (iNANO),Department of Molecular Biology, University of Aarhus, Aarhus C, Denmark
FLAMINIA CATTERUCCIA • Division of Cell and Molecular Biology, Faculty of LifeSciences, Imperial College London, London, UK
KENNETH J. DERY • Divisions of Molecular Biology and Immunology, Beckman ResearchInstitute of the City of Hope, Duarte, CA, USA
RAJESH K. GAUR • Division of Molecular Biology and Graduate School of BiologicalSciences, Beckman Research Institute of the City of Hope, Duarte, CA, USA
SHIKHA GAUR • Department of Clinical and Molecular Pharmacology, Beckman ResearchInstitute of the City of Hope, Duarte, CA, USA
MURIEL GOLZIO • IPBS Universite P Sabatier and CNRS (UMR 5089), Toulouse,France
VERONICA GUSTI • Division of Molecular Biology, Beckman Research Institute of the Cityof Hope, Duarte, CA, USA
HEE DONG HAN • Department of Gynecologic Oncology, The University of Texas M.D.Anderson Cancer Center, Houston, TX, USA
KENNETH ALAN HOWARD • Interdisciplinary Nanoscience Center (iNANO),Department of Molecular Biology, University of Aarhus, Aarhus C, Denmark
DANIEL H. KIM • Howard Hughes Medical Institute, Department of Molecular Biology,Massachusetts General Hospital and Department of Genetics, Harvard Medical School,Boston, MA, USA
STEPHAN KISSLER • Rudolf Virchow Center / DFG Center for ExperimentalBiomedicine, University of Wurzburg, Wurzburg, Germany
JØRGEN KJEMS • Interdisciplinary Nanoscience Center (iNANO), Department ofMolecular Biology, University of Aarhus, Aarhus C, Denmark
MOHANRAJA KUMAR • Molecular Imaging Program, MGH/MIT/HMS Athinoula A.Martinos Center for Biomedical Imaging, Department of Radiology, MassachusettsGeneral Hospital/Harvard Medical School, Boston, MA, USA
ELENA A. LEVASHINA • UPR9022 du CNRS, Group AVENIR Inserm, Institut deBiologie Moleculaire et Cellulaire, Strasbourg, France
GABRIEL LOPEZ-BERESTEIN • Department of Experimental Therapeutics, TheUniversity of Texas M.D. Anderson Cancer Center, Houston, TX, USA
LINGEGOWDA S. MANGALA • Department of Gynecologic Oncology, The University ofTexas M.D. Anderson Cancer Center, Houston, TX, USA
LAURENT MAZZOLINI • CRPS CNRS- Pierre Fabre (UMR 2587), Toulouse, FranceZDRAVKA MEDAROVA • Molecular Imaging Program, MGH/MIT/HMS Athinoula A.
Martinos Center for Biomedical Imaging, Department of Radiology, MassachusettsGeneral Hospital/Harvard Medical School, Boston, MA, USA
ix

x Contributors
ANNA MOORE • Molecular Imaging Program, MGH/MIT/HMS Athinoula A. MartinosCenter for Biomedical Imaging, Department of Radiology, Massachusetts GeneralHospital/Harvard Medical School, Boston, MA, USA
SHU-WING NG • Division of Gynecologic Oncology, Department of Obstetrics, Gynecologyand Reproductive Biology, Brigham and Women’s Hospital/Harvard Medical School,Boston, MA, USA
AURELIE PAGANIN-GIOANNI • IPBS Universite P Sabatier and CNRS (UMR 5089),Toulouse, France
JOHN F. REIDHAAR-OLSON • RNA Therapeutics, Hoffmann-La Roche, Inc., Nutley,NJ, USA
CRISTINA M. RONDINONE • Metabolic and Vascular Diseases, Hoffmann-La Roche,Inc., Nutley, NJ, USA
JOHN J. ROSSI • Graduate School of Biological Sciences and Division of Molecular Biology,Beckman Research Institute of the City of Hope, Duarte, CA, USA
JOHN E. SHIVELY • Division of Immunology, Beckman Research Institute of the City ofHope Duarte, CA, USA
ANIL K. SOOD • Departments of Gynecologic Oncology and Cancer Biology, The Universityof Texas M.D. Anderson Cancer Center, Houston, TX, USA
JUSTIN TEISSIE • IPBS Universite P Sabatier and CNRS (UMR 5089), Toulouse, FranceSTEPHEN MARK TOMPKINS • Department of Infectious Diseases, College of Veterinary
Medicine Center for Disease Intervention, University of Georgia, Athens, GA, USACHRIS TOWNE • Brain Mind Institute, Ecole Polytechnique Federale de Lausanne,
Lausanne, SwitzerlandRALPH A. TRIPP • Department of Infectious Diseases, College of Veterinary Medicine,
Center for Disease Intervention, University of Georgia, Athens, GA, USAYUN YEN • Department of Clinical and Molecular Pharmacology, Beckman Research
Institute of the City of Hope, Duarte, CA, USA

Chapter 1
Development and Application of a Dual-PurposeNanoparticle Platform for Delivery and Imagingof siRNA in Tumors
Zdravka Medarova, Mohanraja Kumar, Shu-wing Ng, and Anna Moore
Abstract
The vision of using a single therapeutic agent with sufficient generality to allow application to a widevariety of diseases, yet specific enough to permit intervention at single molecular stages of the pathology,is rapidly becoming a reality through the emergence of RNA interference. RNA interference can be usedto inhibit the expression of virtually any gene and, at the same time, has single-nucleotide specificity.Major challenges in applying RNA interference in vivo are adequate delivery of the siRNA moleculeto the tissue of interest and methods of monitoring this delivery in a noninvasive manner. With this inmind, we have developed an approach not only to deliver siRNA to tumors, but also to track the successof the delivery by noninvasive imaging. To accomplish this, we designed a dual-function probe, MN-NIRF-siRNA, which consists of magnetic nanoparticles (MN) for magnetic resonance imaging (MRI),labeled with Cy5.5 dye for near-infrared in vivo optical imaging (NIRF), conjugated to myristoylatedpolyarginine peptides (MPAPs) for translocation of the complex into the cytosol, and carrying siRNAtargeting tumor-specific genes. Administration of MN-NIRF-siRNA to tumor-bearing mice allowed us tomonitor the delivery of the agent to tumors by MRI and NIRF imaging and resulted in efficient silencingof the target genes. This approach can significantly advance the therapeutic potential of RNA interferenceby providing a way not only to effectively shuttle siRNA to target sites but also to noninvasively assessthe bioavailability of the siRNA molecule.
Key words: RNA interference, magnetic resonance imaging, near-infrared optical imaging,magnetic nanoparticles, myristoylated polyarginine.
1. Introduction
RNA interference is an innate cellular mechanism forpost-transcriptional regulation of gene expression in which
John F. Reidhaar-Olson and Cristina M. Rondinone (eds.), Therapeutic Applications of RNAi: Methods and Protocols, vol. 555© Humana Press, a part of Springer Science+Business Media, LLC 2009DOI 10.1007/978-1-60327-295-7 1 Springerprotocols.com
1

2 Medarova et al.
double-stranded ribonucleic acid inhibits the expression of geneswith complementary nucleotide sequences. Its potential fortumor therapy is indisputable, considering that one can usethis mechanism to silence virtually any gene, including genesimplicated in tumorigenesis, with single-nucleotide specificity(1). Major obstacles in applying RNA interference in vivo arepresented by the short circulation half-life of the siRNA molecule,its vulnerability to degradation by nucleases (elimination half-life2–6 min (2, 3)), and the need to translocate the siRNA into thecytosol, where the RNA interference process takes place. Variousapproaches have been explored to overcome these obstacles.These include, but are not limited to, chemical modification,conjugation, and/or complexing of the siRNA (2–6).
An essential element in the development and optimization ofan siRNA delivery method is the ability to measure the bioavail-ability and functionality of the siRNA molecule after adminis-tration into the body. Noninvasive imaging provides the neces-sary set of tools to accomplish this in authentic physiologic envi-ronments and across time. The recent past has witnessed severalreports describing the coupling of siRNA to contrast agents thatcan be used for noninvasive imaging (4, 6–12).
Here, we describe the methodology behind the develop-ment and testing of a dual-purpose nanoparticle platform (MN-NIRF-siRNA) for the concurrent delivery of siRNA to tumorsand assessment of the delivery by magnetic resonance imaging(MRI) and near-infrared optical imaging (NIRF). MN-NIRF-siRNA consists of a magnetic nanoparticle (MN) core, as anMRI contrast agent, labeled with Cy5.5 dye, for near-infraredin vivo optical imaging (NIRF), and conjugated to myristoy-lated polyarginine peptides (MPAPs) for cytosolic delivery. Thiscomplex is conjugated to an siRNA targeting model (e.g., gfp)or therapeutic (e.g., birc5) tumor-specific genes of interest. Thedescribed approach involves three major steps: (1) synthesis of theMN-NIRF-siRNA complex, (2) noninvasive imaging by MRI andNIRF imaging to assess the delivery of MN-NIRF-siRNA after invivo administration, and (3) assessment of the silencing efficacyof MN-NIRF-siRNA.
2. Materials
2.1. Synthesis andTesting ofMN-NIRF-siRNA
1. Dextran T10 (Pharmacosmos, Holbaek, Denmark).2. FeCl3•6H2O.3. FeCl2.4. NH4OH.5. 5 M NaOH.

Concurrent Delivery and Imaging of siRNA in Tumors 3
6. Epichlorohydrin.7. 30% NH4OH.8. Cy5.5 NHS ester, 1 mg (GE Healthcare, Piscataway, NJ).9. 0.5 M Sodium bicarbonate, pH 9.6.
10. G-25 Sephadex PD-10 columns (GE Healthcare, Piscat-away, NJ).
11. 20 mM Sodium citrate, 0.15 M NaCl, pH 7, 7.5, 8.12. N-Succinimidyl 3-(2-pyridyldithio) propionate, SPDP
(Pierce Biotechnology, Rockford, IL).13. Myristoylated polyarginine peptides (MPAPs, Myr-Ala-
(Arg)7-Cys-CONH2).14. 50 mM Sodium phosphate, 150 mM sodium chloride,
10 mM EDTA, pH 7.0.15. 15 mg/mL Dithiothreitol (DTT).16. Dimethyl sulfoxide (DMSO).17. siRNA custom-modified with a thiol moiety via a hexyl
spacer for bioconjugation (Ambion, Inc., Austin, TX).18. 3% Tris-(2-carboxyethyl)phosphine hydrochloride (TCEP)
(Sigma, St. Louis, MO).19. 3-Maleimidobenzoic acid N-hydroxysuccinimide
ester (MBS) (Sigma, St. Louis, MO).20. Quick Spin Column G-50 Sephadex column (Roche
Applied Science, Indianapolis, IN).21. QuixStand benchtop filtration system with a 0.1-�m car-
tridge and a 100-kDa cartridge (GE Healthcare, Piscat-away, NJ).
22. Bruker MQ20 Minispec NMR spectrometer (BrukerBiospin Co., Billerica, MA).
23. Sub-micron particle size analyzer (Coulter N-4, Hialeah,FL).
24. Standard tube shaker/rotator.25. Standard spectrophotometer.26. Standard benchtop centrifuge.
2.2. Imaging theDelivery ofMN-NIRF-siRNA toTumors
1. Five- to six-week-old female nu/nu mice.2. Tuberculin syringes, 1 cc (Becton Dickinson, Franklin Lakes,
NJ).3. Tumor cell line of interest.4. Animal anesthesia system Isotec 4 (Surgivet/Anesco,
Waukesha, WI).5. 9.4 T GE magnet with Bruker Biospin Avance con-
sole equipped with ParaVision 3.0.1 software and a 3 ×4 cm elliptical surface coil to transmit and receive (BrukerBioSpin, Billerica, MA).
6. Whole-body optical imaging system (Imaging StationIS2000MM, Kodak, New Haven, CT), equipped with aband-pass filter at 630 nm and a long-pass filter at 700 nm(Chroma Technology Corporation, Rockingham, VT).

4 Medarova et al.
2.3. Assessment ofTarget GeneSilencing
1. Animal anesthesia system Isotec 4 (Surgivet/Anesco,Waukesha, WI).
2. Whole-body optical imaging system (Imaging StationIS2000MM, Kodak, New Haven, CT), equipped with thefollowing filters (Chroma Technology Corporation, Rock-ingham, VT):• for imaging of GFP: excitation, 465 nm; emission,
535 nm.• for imaging of RFP: excitation, 535 nm; emission,
600 nm.3. Sodium pentobarbital injected intraperitoneally
(200 mg/kg, intraperitoneal) (Sigma, St. Louis, MO).4. Standard surgery kit (scissors, forceps) (Roboz Surgical
Instrument Co., Inc., Gaithersburg, MD).
3. Methods
The synthesis of MN-NIRF siRNA consists of four distinctsteps: synthesis of MN; conjugation of the fluorescent dyeCy5.5 to MN; conjugation of the membrane translocation pep-tide, MPAP, to MN(Cy5.5); and conjugation of siRNA toMN(Cy5.5)(MPAP). These steps are outlined in Fig. 1.1 anddescribed in Sections 3.1–3.4.
Fig. 1.1. (a) Step-by-step synthesis of the MN-NIRF-siRNA probe, by the sequential conjugation of three different entitiesonto magnetic nanoparticles. (b) The resultant probe consists of magnetic nanoparticles labeled with near-infrared Cy5.5dye (NIRF) and linked through two different linkers to membrane translocation peptides (MPAPs) and siRNA molecules.(Reproduced with minor changes from Medarova et al. (6), with permission from Nature Publishing Group).

Concurrent Delivery and Imaging of siRNA in Tumors 5
Since MN-NIRF-siRNA carries both an MRI component(MN) and a near-infrared fluorescent dye (Cy5.5), the deliv-ery of the agent is assessed by both MRI and NIRF imaging(Sections 3.5–3.8).
In proof-of-principle experiments, the target gene mayencode a fluorescent protein (GFP, RFP), in which case silenc-ing can be assessed by noninvasive optical imaging or by otherroutine fluorescence assays, e.g., flow cytometry and fluorescencemicroscopy. When the target gene does not encode a fluorescentprotein, silencing cannot be directly assessed by noninvasive opti-cal imaging. Instead, alternative assays, such as quantitative RT-PCR (qRT-PCR), Western blotting, or immunohistology, can beused. In either case, validation of the silencing effect by qRT-PCRis essential. In Sections 3.9 and 3.10, we are restricting ourselvesto a description of noninvasive optical imaging for the assessmentof target gene silencing, since the other methods can vary withapplication and their implementation is routine.
3.1. Synthesis of MN(See Note 1)
The synthesis of dextran-coated MN has been described previ-ously (13).
1. A desired amount of dextran T10 is dissolved in hot (70◦C)water and incubated for 2 h. At the end of the incubation,FeCl3•6H2O is added to the dextran solution and the resul-tant mixture is cooled down to 2–4◦C.
2. Freshly prepared FeCl2 in H2O is added to the dextran–FeCl3 solution, followed by neutralization with NH4OH.
3. The resultant suspension is heated to 80◦C over 1 h and thenincubated at this temperature for 75 min.
4. The suspension is then passed through the QuixStand fil-tration system to remove large particles, free dextran, ioniciron, NH4Cl, and NH4OH using first a 0.1-�m cartridgeand then a 100-kDa cartridge.
5. Five volumes of 5 M NaOH and two volumes of epichloro-hydrin are added with constant stirring, followed by incuba-tion for 8 h. This is done under a fume hood.
6. Eight and a half volumes of 30% NH4OH is added followedby an overnight incubation at room temperature with vigor-ous stirring.
7. Free epichlorohydrin and NH4OH are removed by ultra-filtration on QuixStand with a 100-kDa cartridge, and sixwashes with 20 mM sodium citrate, 0.15 M NaCl, pH 8(8–12 l).
8. The resulting colloid is tested for free dextran (carameliza-tion), material concentration, particle size by light scatteringusing a submicrometer particle size analyzer, and magneticproperties by using a Minispec NMR spectrometer.

6 Medarova et al.
3.2. Conjugation ofCy5.5-NHS Esterto MN
1. The pH of MN is adjusted to 9.6 with 0.5 M sodium bicar-bonate.
2. The product (∼10 mg Fe) is added to 1 mg of Cy5.5-NHSester dye, followed by incubation on a rotator overnight atroom temperature.
3. The mixture is purified from nonreacted dye on a SephadexG-25, PD-10 column equilibrated with 20 mM sodium cit-rate buffer, 0.15 M NaCl, pH 7.5.
3.3. Conjugation ofMPAP to MN-(Cy5.5)
The synthesis of the myristoylated polyarginine membranetranslocation module (MPAP) has been described previously (14).MPAP consists of a hydrophobic 14-carbon moiety of myristicacid, in combination with a hepta-arginine peptide. For conjuga-tion of MPAP to MN-(Cy5.5):
1. MN-(Cy5.5) is conjugated to a heterobifunctionalcrosslinker N-succinimidyl 3-(2-pyridyldithio) propi-onate, SPDP, via the N-hydroxy succinimide ester, byco-incubation of an excess of SPDP, dissolved in DMSO,with MN-(Cy5.5) for 15 min at room temperature.
2. The conjugation is followed by purification using a SephadexG-25, PD-10 column equilibrated with 20 mM sodium cit-rate and 0.15 M sodium chloride, pH 8.0.
3. The delivery module, MPAP (Myr-Ala-(Arg)7-Cys-CONH2), is then coupled to the linker via a sulfhydryl-reactive pyridyl disulfide residue in 20 mM sodium citrateand 0.15 M sodium chloride, pH 8.0 (see Note 2).
4. The double-labeled MN-(Cy5.5)(MPAP) is then purified bysize exclusion chromatography using a Sephadex G-25, PD-10 column using a buffer containing 20 mM sodium citrateand 0.15 M sodium chloride, pH 7.0.
3.4. Conjugation ofsiRNA toMN-(Cy5.5)(MPAP)
1. MN-(Cy5.5)(MPAP) is coupled to an excess of MBScrosslinker.
2. The intermediate is purified using a Sephadex G-25, PD-10column using a buffer containing 50 mM sodium phosphate,150 mM sodium chloride, 10 mM EDTA, pH 7.0.
3. The custom-synthesized siRNA duplex is provided by themanufacturer (Ambion, Austin, TX), modified with a thiolmoiety via a hexyl spacer for bioconjugation. Prior tolabeling, the disulfide protecting group on 5′-S-S-(CH2)6is deprotected using 3% tris-(2-carboxyethyl)phosphinehydrochloride (TCEP).
4. The free thiol-siRNA is then allowed to react with MN-(Cy5.5)(MPAP) via the MBS crosslinker in 50 mM sodiumphosphate, 150 mM sodium chloride, 10 mM EDTA, pH7.0 at 4◦C for 1 h.

Concurrent Delivery and Imaging of siRNA in Tumors 7
5. The product is then purified using a Quick Spin ColumnG-50 Sephadex column (Roche Applied Science, Indianapo-lis, IN).
6. The labeling ratio of Cy5.5 per MN crystal is deter-mined spectrophotometrically as the number of Cy5.5 dyemolecules attached to a single particle. The dye-to-particleratio is obtained from concentrations of Cy5.5 and iron.Iron concentration is determined spectrophotometrically(15). For the Cy5.5 dye, the number of dyes per particle isobtained from absorption at 678 nm and an extinction coef-ficient of 250,000 M–1 cm–1. The labeling of MPAP per crys-tal is determined based on the release of pyridine-2-thione at343 nm (e = 8.08 × 10³ M–1cm–1) after the addition of thereducing agent, TCEP (35 mM in DMSO).
7. The R1 and R2 relaxivities of the sample are determined at37◦C using a Minispec NMR spectrometer. These relaxivityvalues are measures of the longitudinal (R1) and transverse(R2) magnetization properties of a sample and are repre-sented as mmol–1 s–1 for a given temperature.
8. Nanoparticle size is measured by light scattering.
3.5. Tumor Model 1. Five- to six-week-old female nu/nu mice are injected sub-cutaneously with a tumor cell line of interest (∼3 × 10⁶
tumor cells). The cell line may be stably transformed with agene encoding a fluorescent protein (GFP, RFP), in whichcase target gene silencing can be assessed using noninvasiveoptical imaging. Animals are imaged on days 10–14 afterinoculation, when the tumors are ∼0.5 cm in diameter.
3.6. MagneticResonance Imaging
MRI is performed before as well as 24 h after injection of MN-NIRF-siRNA (10 mg Fe/kg; ∼440 nmol siRNA/kg) into the tailvein of the mouse (see Note 3).
1. For imaging, the mouse is anesthetized using isofluorane,1.25% in 33% O2, balance N2O and placed prone in themagnet (9.4 T GE magnet with a Bruker Biospin Avanceconsole equipped with ParaVision 3.0.1 software).
2. A 3 × 4 cm elliptical surface coil is used to transmit andreceive.
3. The mouse is imaged using the following protocols:a) Spin echo axial T2-weighted imaging. Parameters:
TR/TE = 6000/60.49 ms, FOV = 3.2 × 3.2 cm2,matrix size 128 × 128, resolution 250 × 250 �m2, slicethickness = 0.5 mm (see Note 4).
b) MSME axial T2-weighted imaging (T2 map). Parame-ters: 3000/8, 16, 24, 32, 40, 48, 56, 64 ms; FOV =3.2×3.2 cm2, matrix size 128×128, resolution 250×250 �m2, and slice thickness = 0.5 mm (see Note 5).

8 Medarova et al.
4. After the pre-contrast (before injection of MN-NIRF-siRNA) and post-contrast (after injection of MN-NIRF-siRNA) images have been acquired, the data are analyzedusing Marevisi 3.5 software (Institute for Biodiagnostics,National Research Council, Canada): MSME T2-weightedimages are analyzed on a voxel-by-voxel basis by fitting theT2 measurements from the eight echo times (TE) to a stan-dard exponential decay curve, defined by the formula y =A∗exp(–t/T2).Examples of MR images and T2 relaxation times are shownin Fig. 1.2a.
5. The tumors and adjacent muscle tissue are manually seg-mented out on these images. Their T2 relaxation times (ms)are computed by averaging the T2 relaxation times of thevoxels within the tumor/muscle region of interest (ROI)from all of the slices incorporating tumor/muscle tissue (seeNote 6).
3.7. In VivoNear-Infrared OpticalImaging
Near-infrared optical imaging is performed immediately after eachMRI session.
1. The mouse is anesthetized using isofluorane, 1.25% in 33%O2, balance N2O.
2. The animal is placed supine into a whole-body optical imag-ing system (Imaging Station IS2000MM, Kodak ScientificImaging System, New Haven, CT, see Note 7).
3. For in vivo imaging, the following parameters are used:exposure time, 30.05 s; F-stop, 2.8; FOV, 100 mm; reso-lution, 260 dpi.
4. Examples of NIRF images are shown in Fig. 1.2b.
3.8. Ex VivoNear-Infrared OpticalImaging
1. The animals are sacrificed with a high dose of sodium pen-tobarbital injected intraperitoneally (200 mg/kg IP).
2. The tumors and adjacent muscle tissue are excised andplaced in the optical imaging system.
3. Tumor and muscle tissue are imaged using the followingimaging parameters: exposure time, 30.05 s; F-stop, 2.8;FOV, 36.67 mm; resolution, 856 dpi.
3.9. Assessment ofTarget GeneSilencing: In VivoFluorescence OpticalImaging
1. Time-course in vivo fluorescence optical imaging is per-formed first at the same time as NIRF imaging, immedi-ately after the pre-contrast MRI session, and after that every12–24 h for a time period defined by the half-life of the tar-get protein (see Note 8).
2. The mouse is anesthetized using isofluorane, 1.25% in 33%O2, balance N2O.
3. The animal is placed supine into a whole-body optical imag-ing system (Imaging Station IS2000MM, Kodak ScientificImaging System, New Haven, CT).

Concurrent Delivery and Imaging of siRNA in Tumors 9
Fig. 1.2. (a) In vivo MRI of mice bearing bilateral 9L rat gliosarcoma tumors stably transfected with either GFP or RFPbefore and 24 h after MN-NIRF-siGFP administration. After injection of the probe, there is a significant drop in tumor T2relaxation times, whereas the T2 relaxation times of muscle tissue remain unchanged. (b) In vivo NIRF optical imaging ofthe same mice as in (a) produces a high-intensity NIRF signal associated with the tumors. (c) Ex vivo NIRF optical imagingdemonstrates a higher fluorescence in tumors than in muscle tissue. This confirms the delivery of the MN-NIRF-siGFPprobe to these tissues. (Reproduced from Medarova et al. (6), with permission from Nature Publishing Group).
4. For in vivo imaging, the following parameters are used:exposure time, 30.05 s; F-stop, 2.8; FOV, 100 mm; resolu-tion, 260 dpi. For imaging of GFP, the following filters areused: excitation, 465 nm; emission, 535 nm. For imagingof RFP, the following filters are used: excitation, 535 nm;emission, 600 nm (see Notes 9 and 10).

10 Medarova et al.
Fig. 1.3. (a) In vivo NIRF optical imaging of mice bearing bilateral 9L-GFP and 9L-RFPtumors 48 h after intravenous probe injection. There is a marked decrease in 9L-GFP-associated fluorescence and no change in 9L-RFP fluorescence. To generate GFP/RFPreconstructions, GFP and RFP images are acquired separately and then merged. (b) Cor-relative ex vivo fluorescence optical imaging shows a drop in fluorescence intensity in9L-GFP tumors. There is no evidence of silencing in saline-injected controls. (Repro-duced from Medarova et al. (6), with permission from Nature Publishing Group).

Concurrent Delivery and Imaging of siRNA in Tumors 11
5. Examples of in vivo fluorescence optical images are shown inFig. 1.3a.
3.10. Assessment ofTarget GeneSilencing: Ex VivoFluorescence OpticalImaging
1. Ex vivo fluorescence optical imaging is performed at thesame time as NIRF imaging.Tumor and muscle tissue are imaged using the followingimaging parameters: exposure time, 30.05 s; F-stop, 2.8;FOV, 36.67 mm; resolution, 856 dpi. Filters for GFP andRFP are used, as specified above.
2. Examples of ex vivo fluorescence optical images are shownin Fig. 1.3b.
4. Notes
1. Considering that the MN-NIRF-siRNA agent incorpo-rates ribonucleic acid molecules, the entire synthesis hasto be completed under RNase-free conditions. All buffersand glassware need to be autoclaved or treated withRNaseZap R© (Ambion, Austin, TX). Only sterile barrierpipette tips need to be used.
2. The advantage of this linker is the affordable chro-mophore of pyridine-2-thione, which was released afterthe sulfhydryl exchange between the cysteine side chain onMPAP and 2-pyridyl-disulfide group.
3. A dose of 10 mg Fe/kg is a standard dose of iron oxidecontrast agent used in animal MRI studies. The amount ofsiRNA delivered depends on the coupling ratio of siRNAto MN achieved during synthesis. In our experience, a ratioof five siRNA molecules per MN crystal is sufficient forimaging and delivery.
4. The spin echo sequence is used for initial visualization ofthe ROI within the context of T2 relaxation.
5. The MSME sequence allows accurate measurement of theT2 relaxation time parameters of the tissues of interest.
6. Muscle tissue is used to define a reference T2 relaxationtime to which to compare tumor relaxation time in orderto determine if there is tumor-selective accumulation of thecontrast agent.
7. The IS2000MM Kodak Scientific Imaging System isequipped with a 150-watt high-intensity halogen illumina-tor, which emits broadband white light. As recommendedby the supplier (Eastman Kodak Company, New Haven,CT) for detection of Cy5.5 fluorescence, an optical band-pass excitation filter (X625, Eastman Kodak Company,New Haven, CT) is used to supply photons at 630 nm,

12 Medarova et al.
with an attenuation of 0.5 OD at 700 nm, which isthe wavelength characterizing the long-pass emission filter(e700WA, Eastman Kodak Company, New Haven, CT).Emitted light is collected using a thermoelectrically cooledCCD camera.
8. Time-course optical imaging is necessary in order toidentify the time point associated with the maximumsilencing as well as the longevity of the silencing effect.This is determined by the balance between the half-life of the target protein and the proliferation rate ofthe target cell. For rapidly dividing tumor cells stablyexpressing the firefly luciferase protein, for instance, thesilencing effect typically persists for 7–10 days, whereasfor non-dividing cells, this time period can extend for3–4 weeks (16). For GFP/EGFP, whose half-life isabout 26 h (17, 18), efficient silencing (70–95%) hasbeen reported as early as 24–48 h after transfection(http://www.ambion.com/techlib/spec/sp 4626.pdf).
9. Native tissue is associated with high absorption of visiblelight (∼400–650 nm), reducing the sensitivity of detectionof in vivo imaging studies within this range of wavelengths.Therefore, it is essential that the transgene is expressed bytumor cells at high enough levels for in vivo detection.
10. To generate GFP/RFP reconstructions based on the invivo or ex vivo fluorescence optical images, GFP and RFPimages are acquired separately without repositioning theanimal and then merged using the Kodak 1DTM 3.6.3Network software.
Acknowledgments
The authors would like to acknowledge Pamela Pantazopoulos(Martinos Center for Biomedical Imaging, MGH) for excellenttechnical support. This work was partially supported by K99CA129070 to Z.M.
References
1. Brummelkamp, T. R., Bernards, R., andAgami, R. (2002) Stable suppression oftumorigenicity by virus-mediated RNA inter-ference. Cancer Cell 2, 243–247.
2. Soutschek, J., Akinc, A., Bramlage, B.,Charisse, K., Constien, R., Donoghue, M.,Elbashir, S., Geick, A., Hadwiger, P., Har-borth, J., John, M., Kesavan, V., Lavine,G., Pandey, R. K., Racie, T., Rajeev, K. G.,
Rohl, I., Toudjarska, I., Wang, G., Wuschko,S., Bumcrot, D., Koteliansky, V., Limmer,S., Manoharan, M., and Vornlocher, H. P.(2004) Therapeutic silencing of an endoge-nous gene by systemic administration ofmodified siRNAs. Nature 432, 173–178.
3. Morrissey, D. V., Lockridge, J. A., Shaw,L., Blanchard, K., Jensen, K., Breen, W.,Hartsough, K., Machemer, L., Radka, S.,

Concurrent Delivery and Imaging of siRNA in Tumors 13
Jadhav, V., Vaish, N., Zinnen, S., Vargeese,C., Bowman, K., Shaffer, C. S., Jeffs, L. B.,Judge, A., MacLachlan, I., and Polisky, B.(2005) Potent and persistent in vivo anti-HBV activity of chemically modified siRNAs.Nat Biotechnol 23, 1002–1007.
4. Bartlett, D. W., Su, H., Hildebrandt, I.J., Weber, W. A., and Davis, M. E.(2007) Impact of tumor-specific targetingon the biodistribution and efficacy of siRNAnanoparticles measured by multimodality invivo imaging. Proc Natl Acad Sci USA 104,15549–15554.
5. Kumar, P., Wu, H., McBride, J. L., Jung, K.E., Kim, M. H., Davidson, B. L., Lee, S.K., Shankar, P., and Manjunath, N. (2007)Transvascular delivery of small interferingRNA to the central nervous system. Nature448, 39–43.
6. Medarova, Z., Pham, W., Farrar, C., Petkova,V., and Moore, A. (2007) In vivo imaging ofsiRNA delivery and silencing in tumors. NatMed 13, 372–377.
7. Chen, A. A., Derfus, A. M., Khetani, S. R.,and Bhatia, S. N. (2005) Quantum dots tomonitor RNAi delivery and improve genesilencing. Nucleic Acids Res 33, e190.
8. Derfus, A. M., Chen, A. A., Min, D. H.,Ruoslahti, E., and Bhatia, S. N. (2007) Tar-geted quantum dot conjugates for siRNAdelivery. Bioconjug Chem 18, 1391–1396.
9. Liu, N., Ding, H., Vanderheyden, J. L., Zhu,Z., and Zhang, Y. (2007) Radiolabeling smallRNA with technetium-99m for visualizingcellular delivery and mouse biodistribution.Nucl Med Biol 34, 399–404.
10. Chang, E., Zhu, M. Q., and Drezek, R.(2007) Novel siRNA-based molecular bea-cons for dual imaging and therapy. Biotechnol
J 2, 422–425.11. Bakalova, R., Zhelev, Z., Ohba, H., and
Baba, Y. (2005) Quantum dot-conjugatedhybridization probes for preliminary screen-ing of siRNA sequences. J Am Chem Soc 127,11328–11335.
12. Viel, T., Kuhnast, B., Hinnen, F., Bois-gardi, R., Tavitian, B., and Dolle, F. (2007)Fluorine-18 labelling of small interferingRNAs (siRNAs) for PET imaging. J LabelledComp Rad 50, 1159–1168.
13. Medarova, Z., Evgenov, N. V., Dai, G.,Bonner-Weir, S., and Moore, A. (2006)In vivo multimodal imaging of transplantedpancreatic islets. Nat Protoc 1, 429–435.
14. Pham, W., Zhao, B. Q., Lo, E. H.,Medarova, Z., Rosen, B., and Moore, A.(2005) Crossing the blood–brain barrier: apotential application of myristoylated pol-yarginine for in vivo neuroimaging. Neu-roimage 28, 287–292.
15. Moore, A., Basilion, J. P., Chiocca, E. A., andWeissleder, R. (1998) Measuring transferrinreceptor gene expression by NMR imaging.Biochim Biophys Acta 1402, 239–249.
16. Bartlett, D. W., and Davis, M. E. (2006)Insights into the kinetics of siRNA-mediatedgene silencing from live-cell and live-animalbioluminescent imaging. Nucleic Acids Res34, 322–333.
17. Corish, P., and Tyler-Smith, C. (1999)Attenuation of green fluorescent protein half-life in mammalian cells. Protein Eng 12,1035–1040.
18. Ward, C. M., and Stern, P. L. (2002)The human cytomegalovirus immediate-earlypromoter is transcriptionally active in undif-ferentiated mouse embryonic stem cells. StemCells 20, 472–475.

Chapter 2
Targeted Gene Silencing into Solid Tumors with ElectricallyMediated siRNA Delivery
Muriel Golzio, Laurent Mazzolini, Aurelie Paganin-Gioanni, andJustin Teissie
Abstract
Short interfering RNAs (siRNAs) represent new potential therapeutic tools, owing to their capacity toinduce strong, sequence-specific gene silencing in cells. However, their clinical development requires new,safe, and efficient in vivo siRNA delivery methods. In this study, we report an efficient in vivo approachfor targeting gene knockdown in solid tumors by the use of external electric field pulses. We show thatgene silencing is efficiently obtained in vivo with chemically synthesized siRNA after targeted electricaldelivery in the tumor-bearing mouse. The associated gene silencing was followed on the same animal byfluorescence imaging and confirmed by qPCR. Gene silencing obtained in tumors lasted from 2 to 4 daysafter a single treatment. Therefore, this method should allow gene function analysis or organ treatmentby a localized delivery of siRNAs.
Key words: RNA interference, siRNA, tumor, GFP, fluorescence, in vivo imaging, electroporation,mice, therapy, electropulsation.
1. Introduction
In the last few years, RNAi has become a powerful experimen-tal tool for knocking down the expression of genes of interest(1). Treatment of cells with chemically synthesized small inter-fering RNAs (siRNAs) is now used as a routine technique for invitro functional analysis of cellular processes. Furthermore, RNAi-based approaches for clinical applications are currently underintensive development. Among the different limitations encoun-tered in the use of siRNAs for therapy, efficient intracellular
John F. Reidhaar-Olson and Cristina M. Rondinone (eds.), Therapeutic Applications of RNAi: Methods and Protocols, vol. 555© Humana Press, a part of Springer Science+Business Media, LLC 2009DOI 10.1007/978-1-60327-295-7 2 Springerprotocols.com
15

16 Golzio et al.
uptake and safe in vivo uptake remain critical issues. In additionto different administration modes of the siRNA molecules andchemical modification of the siRNA itself, a variety of chemicaland physical methods have been developed to improve the final invivo delivery of these molecules (2, 3). Among the physical meth-ods, electropulsation (electroporation) has proved to be successfulfor delivery of siRNAs in a large number of organs and tissues inrodents (4). Electropulsation has indeed been known for morethan 25 years to strongly increase in vitro intracellular uptake ofmolecules and drugs.
In vivo, electric pulses have been extensively used for drugand plasmid delivery in a large number of organs and tissues(5–7). A key feature is that the delivery of molecules is restrictedto the volume where the electric field is generated. A physical tar-geting of the effect is therefore possible. In order to assess thecontribution of electrical treatment to siRNA-mediated endoge-nous gene silencing in solid tumors, we used as a reference experi-mental model B16-F10 mouse melanoma cell lines stably express-ing an enhanced green fluorescent protein (EGFP). The extentof EGFP gene suppression, a model of constitutive gene silenc-ing, in subcutaneous B16-EGFP tumors was subsequently mon-itored over time in the living animal by whole-body fluorescenceimaging.
2. Materials
2.1. Cell Culture 1. B16-F10 mouse melanoma cells and their EGFP-expressingderivatives were obtained after retroviral vector and in vitrotransduction (see (8) for further details).
2. Cells were cultured in Eagle Minimum Essential Medium(EMEM) (Gibco LifeTechnologies, France) supplementedwith 10% fetal calf serum (Gibco), penicillin (100units/ml), streptomycin (100 mg/ml), and L-glutamine(0.58 mg/ml).
3. Cells were grown on Petri dishes in a 5% CO2 humidifiedincubator at 37◦C.
4. Dulbecco’s PBS buffer (Eurobio, Les Ulies, France) wasused to rinse and/or resuspend the cells.
5. Trypsin/EDTA (Eurobio) was used to detach the cells fromthe Petri dishes.
2.2. siRNAs and DNAOligonucleotides
1. siRNA Suspension Buffer: 100 mM potassium acetate,30 mM HEPES-KOH, 2 mM magnesium acetate, pH 7.4.
2. 10 mM Tris-HCl, pH 8.0 (T8.0): autoclaved and stored at4◦C.
3. RNAse inhibitor RNAsinR (Promega, Madison, WI).

siRNA Electrotransfer into Tumors 17
4. Upon receipt, lyophilized, preannealed double-stranded siR-NAs (Qiagen) are resuspended at a concentration of 100 �Min siRNA Suspension Buffer, heated to 90◦C for 1 min, andincubated at 37◦C for 60 min. Resolubilized siRNAs arestored at –80◦C.
5. The egfp22 siRNA (sense: 5′ r(GCA AGC UGA CCC UGAAGU UCA U), antisense: 5′ r(GAA CUU CAG GGU CAGCUU GCC G)) is directed against GFP mRNA, and wasdesigned according to (9) (see Note 1).
6. The P76 siRNA (sense: 5′ r(GCG GAG UGG CCU GCAGGU A)dTT, antisense: 5′ r(UAC CUG CAG GCC ACUCCG C)dTT) is directed against an unrelated human P76mRNA and shows no significant homology to mouse tran-scripts. It is used as a control for specificity of the siRNAconstruct.
7. Single-stranded DNA oligonucleotides (Sigma) used asprimers for quantitative PCR are resuspended in T8.0 bufferat a concentration of 100 �M and stored at –20◦C.
8. The primers used for EGFP amplification are EGFP214f (5′-GCA GTG CTT CAG CCG CTA C-3′) and EGFP309r(5′-AAG AAG ATG GTG CGC TCC TG-3′), which werepreviously described by (10). Primers used for amplificationof reference housekeeping genes used for GeNorm calcu-lations are: For β-glucuronidase, primers β-glucF (5′-ACTTTA TTG GCT GGG TGT GG-3′) and β-glucR (5′-AATGGG CAC TGT TGA TCC TC-3′); for YWHAZ tyro-sine 3-monooxygenase, primers mYWHAZ-481F (5′-CGTGGA GGG TCG TCT CAA GT-3′) and mYWHAZ-560R(5′-CTC TCT GTA TTC TCG AGC CAT CTG-3′); forβ actin-2, primers mActbeta2-5′ (5′-AGC CAT GTA CGTAGC CAT CCA-3′) and mActbeta2-3′ (5′-TCT CCG GAGTCC ATC ACA ATG-3′).
2.3. In VivoExperiments
1. Female C57Bl/6 mice were purchased from Rene Janvier(St ISLE, France). The C57Bl/6 mice were 9–10 weeksold at the beginning of the experiments, weighing 20–25 gand were considered as young mice. They were maintainedat constant room temperature with 12-h light cycle in aconventional animal colony. Before the experiments, theC57Bl/6 mice were subjected to an adaptation period ofat least 10 days.
2. Hair removal cream (Veet, Massy, France).3. Hamilton syringe with a 26G needle.4. Isoflurane (Forene, Abbott, Rungis, France).5. Gas anesthesia system composed of an air compressor (TEM,
Lormont, France) and an isoflurane vaporizer (Xenogene,Alameda, CA).

18 Golzio et al.
6. Electropulsator PS 10 CNRS (Jouan, St Herblain, France).All pulse parameters were monitored on-line with an oscillo-scope (Metrix, Annecy, France). An electronic switch cuttingthe pulse as soon as its intensity reached 5 amp ensured safetyagainst current surge.
7. Plate parallel electrodes (length 1 cm, width 0.6 cm) (IGEA,Carpi, Italy).
8. Conducting paste (Eko-gel, Egna, Italy).
2.4. In VivoVisualization of GeneExpression and GeneSilencing
1. A fluorescence stereomicroscope (Leica MZFL III,Germany). The fluorescence excitation was obtained witha Mercury Arc lamp (HBO, Osram, Germany) GFP2 filter(Leica).
2. Cooled CCD Camera Coolsnap fx (Roper Scientific, Evry,France).
3. MetaVue software (Universal, USA) drives the camera froma computer and allowed quantitative analysis of the GFP flu-orescence level.
2.5. mRNA Extractionand Analysis
1. RNAlaterTM RNA stabilization reagent (Qiagen).2. RNeasyR RNA isolation kit (Qiagen).3. FastPrepR oscillating grinding system and lysing matrix D
beads (MP Biomedicals, Solon, OH).4. RNAse-free water: Add diethylpyrocarbonate (DEPC,
Sigma) to deionized water to a final concentration of 0.05%(see Note 2). Incubate overnight at room temperature andthen autoclave for 30 min to eliminate residual DEPC. Storeat room temperature.
5. TAE electrophoresis buffer (1X): 40 mM Tris-acetate, pH8.0, 1 mM Na2EDTA. Prepare as a 50X stock solution, auto-clave, and store at room temperature.
6. Ethidium bromide (10 mg/ml solution, Sigma) (seeNote 3).
7. ThermoscriptTM RT-PCR system from Invitrogen.8. β-Mercaptoethanol (molecular biology grade, Sigma).
3. Methods
In this study, electrotransfer of synthetic siRNA against GFPmRNA was used to show the efficiency of in vivo electro-administration after intratumoral injection in solid tumors. Wecompared treatment groups using egfp22 siRNA, electric fieldalone, and nonrelevant p76 siRNA. It is important to use thesame amount of siRNA among groups as well as the same vol-umes for injection to obtain reliable results. The first step wasto graft the tumor expressing the GFP, and then to determine

siRNA Electrotransfer into Tumors 19
whether the injection of egfp22 siRNA affects the GFP fluores-cence expression. The expression of the fluorescent reporter genewas determined by in vivo fluorescence stereomicroscopy. SinceRNAi-mediated gene knockdown acts through RISC-mediatedmRNA degradation, validation of gene knockdown was also doneby comparing the steady-state levels of target mRNA moleculesin control and siRNA-treated samples by quantitative real-timeRT-PCR (qPCR).
3.1. Tumor CellsInjection
1. Two days before the injection, an area of at least 1 cm indiameter is shaved on the back of the mouse with the cream(see Note 4).
2. B16-F10 cells are passaged when confluent withtrypsin/EDTA to provide new culture on a 175 cm2
flask. After 2 days, they are harvested by digestion withtrypsin/EDTA and resuspended in PBS buffer at a finaldilution of 107 cells/ml.
3. A volume of 100 �l of the cell suspension is injected subcu-taneously under the shaved area (see Note 5).
4. The tumor growth is followed daily by measuring the diam-eter of the tumor by fluorescence imaging (see Note 6).
3.2. In VivoElectropulsation
1. Eight to ten days after the subcutaneous injection, the tumorreaches a mean diameter of 5–7 mm (see Note 7).
2. Anesthetize mice by isoflurane inhalation (see Note 8).3. Immediately prior to injection, dilute siRNAs to 17 �M
in 50 �l of autoclaved PBS supplemented with 40 unitsof the RNAse inhibitor RNAsinR. For all manipulations ofthe siRNAs, use DNase- and RNase-free buffers and RNase-free plasticware (microtubes and pipette tips). Always weargloves.
4. Using a Hamilton syringe with a 26-gauge needle, slowly(over about 15 s) inject the siRNA solution into the tumor.In the control “no siRNA” condition, replace the volumeof added siRNA solution with the same volume of siRNASuspension Buffer to keep the injection conditions similar.
5. Apply conducting paste to insure good contact between theskin and the electrodes (see Note 9).
6. Approximately 30 s after the injection, fit the parallel-plateelectrodes around the tumor (see Note 10) and deliver atrain of four pulses plus four additional pulses in the reversepolarity (electrical conditions: 480 V, 20 ms pulse duration,and 1 Hz pulse frequency) (Fig. 2.1). Carefully control thedelivery of the pulses on the oscilloscope.
3.3. Whole-BodyImaging
Upon electrically mediated transfer, GFP gene expression in thetumor is detected directly on the anesthetized animal by digitized

20 Golzio et al.
Fig. 2.1. Experimental set-up. A. Intratumoral injection of an anesthetized mouse. A volume of 50 �l was injected slowlyinto the tumor. Electrodes positioned on the tumor allow application of a train of four plus four inverted square wave.B. Digitized stereomicroscopy imaging set-up.
stereomicroscopy. The GFP fluorescence from the tumor is quan-titatively evaluated at different days (see Fig. 2.2).
3.3.1. FluorescenceData Acquisition
1. Anesthetize the mouse.2. Place the mouse under the stereo-fluorescence microscope,
with the tumor on the top of the animal. The whole tumoris observed as a 12-bit, 1.3-M pixel image using a cooledCCD Camera. MetaVue software drives the camera. Take alight picture (see Note 11).
3. The fluorescence excitation is obtained with a Mercury Arclamp. The exposure time is set at 1 s with no binning.Acquire by selecting the GFP2 filter (see Note 12).
3.3.2. FluorescenceData Analysis
1. The mean fluorescence in the gated area (whole tumor) isquantitatively estimated (measure/region measurement). Inour experiments, the background fluorescence is sufficiently

siRNA Electrotransfer into Tumors 21
Fig. 2.2. Representative images of EGFP fluorescence in B16-F10 tumors observed by noninvasive imaging inlive animals before (day 0) and after (day 1 to day 4) the different treatments. Tumors having a mean diameterof 5–7 mm were treated by intratumoral injection of 50-�l saline solution followed by application of electric pulses(PBS + EP); by intratumoral injection of 50 �l of saline solution containing 17 �M of p76 siRNA followed by applicationof electric pulses (p76 + EP); by intratumoral injection of 50 �l of saline solution containing 17 �M of egfp22 siRNAfollowed (antiGFP + EP) or not followed (antiGFP – EP) by application of electric pulses. B16-F10 GFP-derived tumorsare clearly detected under the animal’s skin upon fluorescence excitation and tumor margin can be easily defined. Thisenables measurement of the tumor area and fluorescence intensity over a period of 4 days after treatment.
low so that it does not interfere with quantitation when GFPemission is present.
2. To quantify the relative time-dependence of knockdowninduced by siRNA (Fig. 2.3), use the respective intensityof each tumor at day 0 as an animal-specific internal control.The relative fluorescence on day x is represented by the ratioof the fluorescence on day x to this “internal control.”
3.4. StatisticalAnalysis
Six different animals are treated for each condition. Fluorescencelevel differences between conditions are statistically compared byan unpaired t-test using Prism software (version 4.02, Graphpad).

22 Golzio et al.
Fig. 2.3. Time-lapse follow-up of fluorescence levels in B16-F10 GFP tumors aftersiRNA electrotransfer. Digital imaging is used to quantify, at different time points, thefluorescence of B16-F10 GFP tumors. On each animal, the mean fluorescence of thetumor is quantitated on a relative scale, using as a reference the fluorescence intensitymeasured just before treatment (day 0). EGFP fluorescence in tumors following injectionof PBS alone with electric field (©); unrelated p76 siRNA electrotransferred (�); egfp22siRNA without electroporation (�); and egfp22 siRNA, electrotransferred (�). Verticalbars represent standard deviation. Differences in fluorescence levels between AntiGFP –EP and AntiGFP + EP conditions were statistically compared using an unpaired two-sidedt-test using KyPlot software. ∗p < 0.05 and ∗∗p < 0.01 were plotted when observed.
3.5. Extraction ofTotal RNA fromTumors for RNAKnockdownValidation
3.5.1. Tumor Preparationand RNA Stabilization ofIsolated Tumors
1. Process the tumor immediately after recovery. Work asquickly as possible until tumor tissue reaches the RNA stabi-lization step (see Note 13).
2. Briefly dip the recovered tumor in ice-cold PBS and dry byrolling the tumor a few seconds on a sterile paper towel.
3. Quickly weigh the tumor. If required, cut the tumor tissueinto pieces of up to 50 mg each using a sterile scalpel blade.
4. Place each tumor sample in a 1.5-ml microtube prefilled withat least 10 volumes (i.e., 10 �l/mg of tissue) of RNAlaterTM
RNA stabilization reagent (making sure that the sample isfully submerged in the solution). Incubate samples overnightat 4◦C prior to RNA extraction. For long-term storage,place the tubes at –20◦C after an initial overnight incuba-tion at 4◦C.
3.5.2. Total RNAExtraction fromStabilized Tissues
1. In order to avoid possible RNA degradation, the durationtime of manipulation of the stabilized tumor should be keptto a minimum. Tumors should therefore be processed one

siRNA Electrotransfer into Tumors 23
at a time until the homogenization step in Qiagen RNeasyR
RLT lysis buffer has been completed.2. Prior to extraction, prefill commercial lysing matrix D
tubes with 800 �l of RNeasyR RLT lysis buffer and 8 �lβ-mercaptoethanol. Vortex the tubes for a few seconds.
3. Recover the stabilized tumor (stored at 4◦C or –20◦C) fromthe RNAlater solution using forceps, and briefly dry it byrolling on a sterile paper towel.
4. Add tumor to the lysing matrix D tube containing RLT lysisbuffer and immediately proceed to sample homogenizationfor 25 s at a setting of 6.0 using the FastPrepR grindingdevice.
5. Cool the lysing matrix D tube for 30 s on ice, and then storetube at room temperature.
6. When all tumors have been homogenized, centrifuge lysingmatrix D tubes for 3 min at 12,000×g at room temperature.
7. Transfer supernatants in 1.5-ml microtubes by pipetting, andrecentrifuge for another 1 min at 12,000×g.
8. Transfer supernatants to new 1.5-ml microtubes, avoidingany turbid material (if present).
9. Process to RNA purification according to Qiagen’s RNeasyR
Mini Handbook protocol without any modification (seeNote 14).
3.5.3. Determination ofRNA Yield and Control ofIntegrity
1. For handling of purified RNA, use DNase- and RNase-free buffers, RNase-free plasticware, and wear gloves (seeNote 15).
2. Determine RNA yield by measuring absorbance at 260 mm(OD260) on a 100-fold dilution of the sample in RNase-freewater using the formula OD260 × 4 = �g RNA per �l.
3. RNA integrity is routinely checked by agarose gel elec-trophoresis under native conditions (see Note 16). Pre-pare autoclaved 1X TAE for the gel and electrophoresisbuffer. Prepare a 1% agarose gel in autoclaved 1X TAE elec-trophoresis buffer containing 0.5 �g/ml ethidium bromide.
4. Load 1–2 �g purified RNA in 1X RNase-free loading buffer.Run the gel at up to 10 V/cm until the bromophenol bluedye reaches the lower third of the gel.
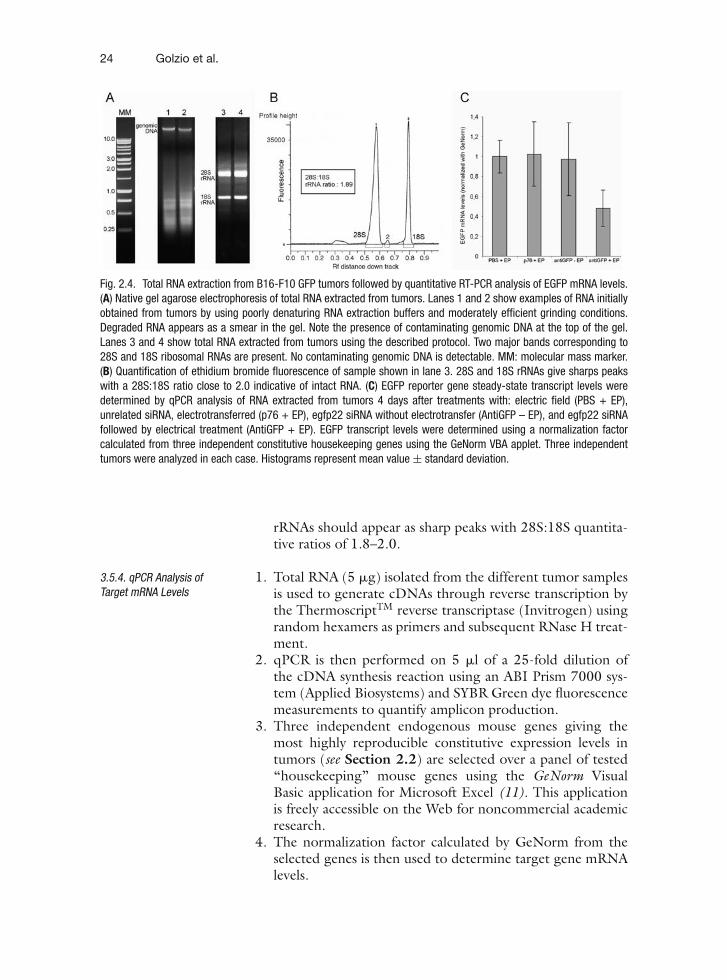
5. Photograph under UV illumination (no destaining isrequired). Under these conditions, two high-intensity,sharp, major bands corresponding to the 28S and 18S ribo-somal RNAs should be detected (Fig. 2.4). By visual inspec-tion, no significant smearing (indicating partial degradation)should be visible below the rRNA bands, and no single bandat the top of the gel (indicating DNA contamination) shouldbe present. If quantitation of RNA bands is possible withthe device used for gel image acquisition, the 28S and 18S
24 Golzio et al.
Fig. 2.4. Total RNA extraction from B16-F10 GFP tumors followed by quantitative RT-PCR analysis of EGFP mRNA levels.(A) Native gel agarose electrophoresis of total RNA extracted from tumors. Lanes 1 and 2 show examples of RNA initiallyobtained from tumors by using poorly denaturing RNA extraction buffers and moderately efficient grinding conditions.Degraded RNA appears as a smear in the gel. Note the presence of contaminating genomic DNA at the top of the gel.Lanes 3 and 4 show total RNA extracted from tumors using the described protocol. Two major bands corresponding to28S and 18S ribosomal RNAs are present. No contaminating genomic DNA is detectable. MM: molecular mass marker.(B) Quantification of ethidium bromide fluorescence of sample shown in lane 3. 28S and 18S rRNAs give sharps peakswith a 28S:18S ratio close to 2.0 indicative of intact RNA. (C) EGFP reporter gene steady-state transcript levels weredetermined by qPCR analysis of RNA extracted from tumors 4 days after treatments with: electric field (PBS + EP),unrelated siRNA, electrotransferred (p76 + EP), egfp22 siRNA without electrotransfer (AntiGFP – EP), and egfp22 siRNAfollowed by electrical treatment (AntiGFP + EP). EGFP transcript levels were determined using a normalization factorcalculated from three independent constitutive housekeeping genes using the GeNorm VBA applet. Three independenttumors were analyzed in each case. Histograms represent mean value ± standard deviation.
rRNAs should appear as sharp peaks with 28S:18S quantita-tive ratios of 1.8–2.0.
3.5.4. qPCR Analysis ofTarget mRNA Levels
1. Total RNA (5 �g) isolated from the different tumor samplesis used to generate cDNAs through reverse transcription bythe ThermoscriptTM reverse transcriptase (Invitrogen) usingrandom hexamers as primers and subsequent RNase H treat-ment.
2. qPCR is then performed on 5 �l of a 25-fold dilution ofthe cDNA synthesis reaction using an ABI Prism 7000 sys-tem (Applied Biosystems) and SYBR Green dye fluorescencemeasurements to quantify amplicon production.
3. Three independent endogenous mouse genes giving themost highly reproducible constitutive expression levels intumors (see Section 2.2) are selected over a panel of tested“housekeeping” mouse genes using the GeNorm VisualBasic application for Microsoft Excel (11). This applicationis freely accessible on the Web for noncommercial academicresearch.
4. The normalization factor calculated by GeNorm from theselected genes is then used to determine target gene mRNAlevels.

siRNA Electrotransfer into Tumors 25
4. Notes
1. Selection of the optimal siRNA sequences remains a criti-cal issue for RNAi experiments in vivo (for a general dis-cussion see (12, 13)). Literature mining may be a valuablesource for the identification of “validated” active siRNAsdirected against a gene of interest. In parallel, most compa-nies commercializing siRNAs now propose various sets of“predesigned siRNAs” against any mouse or human gene,which are designed by robust, proprietary, algorithms. Sim-ilar freely accessible algorithms can also be found on theInternet (e.g., (13–15)). A validation and selection of themost active siRNAs in cultured cells should always precedetheir in vivo use.
2. DEPC is highly toxic and volatile. It must be used only ina laboratory chemical fume hood.
3. Ethidium bromide is a potent mutagen. Always wear glovesand minimize handling. Use specific procedures (suchas charcoal filtration) for disposal of ethidium bromide-containing buffers. Use dedicated electrophoresis tanks.
4. The cream should be used 2 days before fluorescence imag-ing because some components of the cream fluoresce underblue-light excitation. This cream should be used carefullyas it may cause some irritations in the mouse skin. Rinsethe cream under a flow of water.
5. The subcutaneous injection should be performed underthe shaved area to allow direct visualization of the GFP-expressing cells under the skin.
6. GFP expression in the tumor cells is detected directlythrough the skin on the anesthetized animal by digi-tized fluorescence stereomicroscopy. This procedure allowsobservation of GFP expression in the same animal over sev-eral days.
7. Hair on the back may re-grow; re-shave the skin above thetumor if necessary.
8. Isoflurane inhalation is safe; mice recover very quickly afterthe electrical treatment and can be observed daily for invivo imaging.
9. Conducting paste is very important to insure optimal elec-trical contact with the skin. One should pay attention thatthe paste is not continuous between the two electrodes, asthe field will pass through the paste and not through thetumor.
10. One person should perform the tumor injection. As thetumor may have different nodules, pay attention wheninjecting the whole tumor.

26 Golzio et al.
11. One person should be responsible for holding the miceto avoid erratic conditions of exposure to the fluorescenceexcitation beam.
12. Make sure that no saturation of pixels occurs in the area ofinterest upon image acquisition. Then use identical settingsfor subsequent acquisitions.
13. In our experiments, extraction of nondegraded RNA fromtumors required use of tumor tissue pretreated with anRNA stabilizing agent together with highly denaturingRNA extraction buffers (containing guanidine isothio-cyanate), as well as harsh homogenization conditions. Weassume that this may be due to the presence of necroticregions in the tumors, which may release high levels ofnucleases in the tissue. Although the reagents and mate-rials used in this protocol may be substituted with others,we recommend using extraction conditions that fulfill thecriteria mentioned above.
14. Contamination of the purified RNA sample by genomicDNA sequences may be detrimental to sensitive applica-tions such as qPCR. However, in our hands, additionaltreatments performed in order to eliminate putative DNAcontamination did not modify the qPCR amplification pat-terns.
15. The electrophoresis tank should have been pretreatedwith an RNase-removal reagent (e.g., RNaseZapR RNasedecontamination solution from Ambion) to avoid any RNAdegradation during electrophoresis due to contaminatingRNases.
16. Although denaturing conditions provide the greatest reso-lution for RNA analysis, direct electrophoresis under nativeconditions was found sufficient to assess the integrity andoverall quality of purified RNA. In addition, native RNAstaining is much more sensitive than that of denaturedDNA.
Acknowledgments
The authors would like to thank laboratory members for theircomments, Bettina Couderc for providing us the GFP-expressingB16 cells, and Marie-Jeanne Pilaire for helpful discussion onqPCR. Financial support was obtained from the Ligue NationaleContre le Cancer, the CNRS CEA Imagerie du Petit Animal Pro-gram, the Region Midi-Pyrenees, the Canceropole GSO (GrandSud-Ouest), and the AFM (Association Francaise contre lesMyopathies).

siRNA Electrotransfer into Tumors 27
References
1. Rana, T.M. (2007) Illuminating the silence:understanding the structure and functionof small RNAs. Nat Rev Mol Cell Biol. 8,23–36.
2. de Fougerolles, A., et al. (2007) Interferingwith disease: a progress report on siRNA-based therapeutics. Nat Rev Drug Discov. 6,443–453.
3. Kim, D.H. and J.J. Rossi. (2007) Strategiesfor silencing human disease using RNA inter-ference. Nat Rev Genet. 8, 173–184.
4. Behlke, M.A. (2006) Progress towardsin vivo use of siRNAs. Mol Ther. 13,644–670.
5. Heller, L.C., K. Ugen, and R. Heller (2005)Electroporation for targeted gene transfer.Expert Opin Drug Deliv. 2, 255–268.
6. Li, S. (2004) Electroporation gene therapy:new developments in vivo and in vitro. CurrGene Ther. 4, 309–316.
7. Wells, D.J. (2004) Gene therapy progressand prospects: electroporation andother physical methods. Gene Ther. 11,1363–1369.
8. Golzio, M., et al. (2007) In vivo gene silenc-ing in solid tumors by targeted electrically
mediated siRNA delivery. Gene Ther. 14,752–759.
9. Caplen, N.J., et al. (2001) Specific inhibitionof gene expression by small double-strandedRNAs in invertebrate and vertebrate systems.Proc Natl Acad Sci USA. 98, 9742–9747.
10. Klein, D., et al. (2000) Accurate estimationof transduction efficiency necessitates a mul-tiplex real-time PCR. Gene Ther. 7, 458–463.
11. Vandesompele, J., et al. (2002) Accuratenormalization of real-time quantitative RT-PCR data by geometric averaging of multipleinternal control genes. Genome Biol. 3, 34.
12. Birmingham, A., et al. (2007) A protocol fordesigning siRNAs with high functionality andspecificity. Nat Protoc. 2, 2068–2078.
13. Pei, Y. and T. Tuschl (2006) On the art ofidentifying effective and specific siRNAs. NatMethods. 3, 670–676.
14. Vert, J.P., et al. (2006) An accurate and inter-pretable model for siRNA efficacy prediction.BMC Bioinformatics. 7, 520.
15. Gong, W., et al. (2006) Integrated siRNAdesign based on surveying of features asso-ciated with high RNAi effectiveness. BMCBioinformatics. 7, 516.

Chapter 3
Liposomal siRNA for Ovarian Cancer
Lingegowda S. Mangala, Hee Dong Han,Gabriel Lopez-Berestein, and Anil K. Sood
Abstract
Discovery of RNA interference (RNAi) has been one of the most important findings in the last tenyears. In recent years, small interfering RNA (siRNA)-mediated gene silencing is beginning to showsubstantial promise as a new treatment modality in preclinical studies because of its robust gene selectivesilencing. However, until recently, delivery of siRNA in vivo was a major impediment to its use as atherapeutic modality. We have used a neutral liposome, 1,2-dioleoyl-sn-glycero-3-phosphatidylcholine(DOPC), for highly efficient in vivo siRNA delivery. Using siRNA tagged with Alexa-555, incorporated inDOPC liposomes, we have demonstrated efficient intra-tumoral delivery following either intraperitonealor intravenous injection. Furthermore, EphA2-targeted siRNA in DOPC liposomes showed significanttarget modulation and anti-tumor efficacy.
Key words: RNA interference, siRNA delivery, neutral liposome, DOPC, ovarian carcinoma,EphA2.
1. Introduction
RNA interference (RNAi) is thought to have evolved as a form ofinnate immunity against viruses and has become a powerful toolfor highly specific gene silencing and drug development. RNAiis a mechanism for RNA-guided regulation of gene expressionin which double-stranded ribonucleic acid (dsRNA) inhibits theexpression of genes with complementary nucleotide sequences.Long dsRNA is cleaved by Dicer, which is an RNAse III fam-ily ribonuclease. This process yields small interfering RNAs (siR-NAs) about 21 nucleotides long. These siRNAs are incorporatedinto a multi-protein RNA-induced silencing complex (RISC) that
John F. Reidhaar-Olson and Cristina M. Rondinone (eds.), Therapeutic Applications of RNAi: Methods and Protocols, vol. 555© Humana Press, a part of Springer Science+Business Media, LLC 2009DOI 10.1007/978-1-60327-295-7 3 Springerprotocols.com
29

30 Mangala et al.
is guided to target mRNA, which is then cleaved (1–4). Inmammalian cells, the related microRNAs (miRNAs) are found,which are short, ∼22 nucleotides long, RNA fragments. ThesemiRNAs are generated after Dicer-mediated cleavage of longer(∼70 nucleotide) precursors with imperfect hairpin RNA struc-tures. The miRNA is incorporated into a miRNA–protein com-plex (miRNP), which leads to translational repression of targetmRNA.
siRNA-mediated gene silencing offers options for targetinggenes that cannot be targeted with other approaches such assmall-molecule inhibitors or monoclonal antibodies. However,for clinical development, two major barriers must be overcome,nuclease digestion and in vivo delivery. Several approaches includ-ing plasmids and viral vectors have been used (5) with some suc-cessful in vitro applications, but limited potential for in vivo use(6). Liposomes are self-assembled, closed structures composed oflipid layers formed spontaneously upon the addition of water to adried lipid film. We have shown that nano-liposomes can serve asan effective vehicle for the delivery of siRNA. Liposomal formu-lations have been used to incorporate and deliver a wide variety oftherapeutic and diagnostic agents. The circulating half-life of lipo-somes can be prolonged by the addition of neutral, hydrophilicpolymers such as poly(ethylene glycol) (PEG) to the outer sur-face (7). An extended circulation half-life allows for sustainedavailability in order to take advantage of the enhanced permeabil-ity of tumor vasculature, resulting in increased delivery to targetsites (8–11). Moreover, it offers opportunities to further enhancethe specificity and efficiency of siRNA delivery to tumor tissue,by appropriately “flagging” the liposomal surface with moleculartags, to minimize the non-specific toxic effects.
Our goal was the development of a safe, biodegradable, andbiocompatible carrier system for siRNA that will protect siRNAfrom nuclease digestion and increase delivery into tumors. Lipo-somes, in general, have been shown to be safe in a number ofclinical trials using a wide variety of anticancer and antimicro-bial drugs. The liposomes’ charge, size, and lipid compositionwill impact their safety, distribution, and uptake by cells and tis-sues. For example, negatively charged liposomes will be avidlytaken up by phagocytic cells and may not result in optimal load-ing efficiency due to the negative charge of the siRNA (12).Cationic liposomes have low delivery efficiency because of theirelectrostatic interactions with other cells and biomolecules alongthe delivery path. Therefore, we have focused on the use of aneutral liposome, 1,2-dioleoyl-sn-glycero-3-phosphatidylcholine(DOPC), for in vivo delivery of siRNA.
We have recently demonstrated that siRNA incorporated intonano-liposomes, composed of DOPC, are able to penetrate deepinto tumors in vivo while avoiding phagocytic uptake (we will use

In Vivo Neutral Liposomal siRNA Delivery 31
the term DOPC to mean liposomes composed of DOPC). Forthese initial delivery studies, we used Alexa-555-tagged siRNA.Our initial proof-of-concept studies focused on the use of DOPCfor targeting a frequently overexpressed tyrosine kinase, EphA2,in ovarian cancer (13–15). EphA2 is a tyrosine kinase receptorbelonging to the ephrin family that plays a key role in neuronaldevelopment. In adults, it is expressed to a low degree, primar-ily in epithelial cells (14). This differential expression in tumorcells makes EphA2 an attractive therapeutic target. We demon-strated that EphA2 siRNA-DOPC given either i.v. or i.p. resultedin EphA2 silencing in orthotopic experimental ovarian tumors,leading to reduced tumor growth as a single agent or in combi-nation with a taxane (14, 16).
2. Materials
2.1. Cell Culture 1. Roswell Park Memorial Institute-1640 (RPMI) Mediumsupplemented with 15% fetal bovine serum (FBS) and 0.1%gentamycin.
2. Trypsin solution (0.25%) and ethylenediamine tetraaceticacid (EDTA, 1 mM).
3. Hank’s Balanced Salt Solution (Serum free) with calciumand magnesium.
4. BCA assay kit.
2.2. Transfection ofCancer Cells withsiRNA
1. A non-silencing fluorescent siRNA sequence tagged withAlexa-555, 5′-AATTCTCCGA-ACGTGTCACGT-3′, con-trol siRNA (same sequence without Alexa-555), and EphA2-targeted sequence 5′-AATGACATGCCGATCTACATG-3′
were synthesized and purified.2. siRNA suspension buffer (100 mM potassium acetate,
30 mM HEPES-potassium hydroxide, 2 mM magnesiumacetate, pH 7.4).
3. RNAiFect transfection reagent.4. 1, 2-Dioleoyl-sn-glycero-3-phosphatidylcholine (DOPC).5. Molecular weight limit filters.
2.3. Western Blotting 1. Modified radioimmunoprecipitation assay (RIPA) lysisbuffer: 50 mM Tris, 150 mM NaCl, 1% Triton, 0.5%deoxycholate plus protease inhibitors (25 �g/mL leu-peptin, 10 �g/mL aprotinin, 2 mM EDTA, 1 mM sodiumorthovanadate).
2. Running buffer: Prepare 10X stock with 1.92 M glycine,250 mM Tris, 1% SDS. Dilute 100 mL with 900 mL dis-tilled water (1X) for use.

32 Mangala et al.
3. Transfer buffer: Prepare 10X stock of glycine and Tris assaid above. Add 20% methanol plus 0.05% (w/v) SDS to100 mL of stock and make up to 1 L with distilled water.
4. Tris-buffered saline with Tween-20 (TBST): Prepare 10Xstock with 100 mM NaCl, 50 mM Tris-base. Adjust pHto 7.5 with concentrated HCl and make up to 1 L withdistilled water. Add 0.1% Tween-20 to 100 mL stock andmake up to 1 L (1X) before use.
5. Blocking buffer: 5% (w/v) nonfat dry milk in TBST.6. Stacking gel: 0.5 M Tris-HCl buffer with pH 6.8.7. Resolving gel: 1.5 M Tris-HCl buffer with pH 8.8.8. Ready gel blotting sandwich containing 0.45 �m nitrocel-
lulose membrane with filter paper (7 × 8.5 cm).9. Primary anti-EphA2 antibody in 1% nonfat dry milk in
TBST.10. Anti-beta-actin antibody.11. Secondary horseradish peroxidase (HRP)-conjugated anti-
mouse IgG in 1% nonfat dry milk in TBST.12. Enhanced chemiluminescent (ECL) detection reagents.
2.4. Immunohisto-chemistry
2.4.1. Determination ofUptake of Alexa-555Fluorescent siRNA byTumor Tissues
1. Normal horse and goat serum.2. Hoechst 33342 trihydrochloride, trihydrate.3. Rat anti-mouse CD31 primary antibody.4. Rat anti-mouse f4/80 primary antibody.5. Goat anti-rat Alexa-488 secondary antibody.6. Fluorescent mounting medium: Glycerol-propyl galate in
PBS.7. Fluorescent Zeiss Axioplan 2 microscope.
2.4.2.ImmunohistochemicalStaining for EphA2 inTumors
1. Mouse IgG Fragment (Fc) blocker.2. Primary EphA2 antibody (Anti-EphA2 clone EA5, a kind
gift from Dr. Michael Kinch).3. Biotinylated horse anti-mouse antibody.4. Streptavidin-HRP.5. 3, 3-Diaminobenzidine substrate.6. Gill No. 3 hematoxylin.
3. Methods
3.1. Cell Culture 1. Ovarian cancer HeyA8 cells were maintained in log phaseof cell growth by culturing in RPMI-1640 medium supple-mented with 15% FBS and 0.1% gentamicin sulfate at 37◦Cin 5% CO2/95% air.

In Vivo Neutral Liposomal siRNA Delivery 33
2. All in vitro experiments were carried out in triplicates using70–80% confluent cells.
3.2. Preparation ofCells for In VitroTransient siRNATransfection
1. The purified siRNAs were dissolved in suspension buffer toa final concentration of 20 �M, heated to 90◦C for 60 s, andincubated at 37◦C for 60 min prior to use to disrupt anyhigher aggregates formed during synthesis.
2. To check the downregulation of targeted protein EphA2 invitro using a target siRNA sequence, in vitro transient trans-fection was carried out using HeyA8 cells.
3. HeyA8 cells (70–75% confluent) were washed with PBStwice and detached using trypsin-EDTA solution. Trypsinactivity was neutralized by RPMI-1640 serum containingmedia. Cells were counted using trypan blue and 3.5 × 10⁵
cells were seeded on six-well tissue culture dishes. The cellsshould be plated 24 h prior to transfection and avoid stress-ing the cells without medium during washing steps (see Note1). After 24 h, transfection was carried out using RNAiFecttransfection reagent. SiRNA (5 �g) was mixed with 65 �LRPMI-1640 media with serum and 30 �L RNAiFect trans-fection reagent (see Note 2). SiRNA and transfection reagentmixture was incubated for 15–20 min to allow for the forma-tion of RNA–lipid complex at room temperature and thenmixture was added on to cells. Cells were collected after48 h to check the downregulation of EphA2 using Westernblotting.
3.3. Preparation ofLiposomal siRNA forIn Vivo Delivery
1. For in vivo delivery studies, siRNA was incorporated intoDOPC.
2. siRNA and DOPC were mixed in the presence of excess ter-tiary butanol at a ratio of 1:10 (w/w) siRNA/DOPC. Themixture along with Tween-20 was vortexed, frozen in anacetone/dry ice bath, and lyophilized.
3. To estimate the amount of siRNA not taken up by lipo-somes (unbound siRNA), free siRNA was separated fromliposomes by centrifuging the liposomal-siRNA suspensionusing 30,000 nominal molecular weight limit filters at5,000 × g for 40 min at room temperature. Fractions werecollected and the material trapped in the filter was reconsti-tuted with 0.9% NaCl. siRNA in the collected fraction andelute was measured by spectrophotometer.
4. Before in vivo administration, to achieve the desired dosein 200 �L per injection per mouse, lyophilized liposomalsiRNA complex was suspended in 0.9% NaCl.
3.4. OrthotopicIn Vivo Model ofAdvanced OvarianCancer
1. Female athymic nude mice (NCr-nu) were purchased fromthe National Cancer Institute-Frederick Cancer Researchand Development Center (Frederick, MD).

34 Mangala et al.
2. Animals were housed in specific pathogen-free conditionsand taken care according to the guidelines of the Ameri-can Association for Accreditation of Laboratory Animal Careand the USPHS “Policy on Human Care and Use of Labo-ratory Animals”.
3. All studies were approved and supervised by the Universityof Texas M.D. Anderson Cancer Center Institutional AnimalCare and Use Committee.
3.5. Preparation ofCells for In VivoInjections
Tumors were established by i.p. injection of cells prepared asbelow. For in vivo injection, 60–80% confluent HeyA8 cellswere trypsinized and centrifuged at 1,000 rpm for 7 min at4◦C (see Note 3). Then cells were washed twice with PBS,and reconstituted in serum-free HBSS at a concentration of1.25 × 105 cells/mL to inject 200 �L i.p. injections per animal.Tumors established in the animals by using this method reflectthe i.p. growth pattern of advanced ovarian cancer (17, 18). Fortreatments, siRNA–DOPC complex was mixed gently with PBSor 0.9% NaCl with pipetting up and down before injection (seeNote 4). Do not freeze the liposomal-siRNA complex after sus-pending with PBS or normal saline (see Note 5).
3.6. Determination ofUptake andDistribution ofFluorescent siRNA inOvarian Tumors
1. A non-silencing fluorescent siRNA sequence taggedwith Alexa-555 (5′-AATTCTCCGAACGTGTCACGT-3′),which did not share any sequence homology with any knownhuman mRNA sequences, was used to determine uptakeand distribution in various tissues when given in vivo. Samesequence without an Alexa-555 tag was used as controlsiRNA for tissue background.
2. Determination of uptake of a single dose of fluorescentsiRNA in tumor and different organs was initiated once i.p.tumors reached a size of 0.5–1.0 cm3 as assessed by palpa-tion (∼17 days after tumor cells injection).
3. Non-silencing Alexa-555 siRNA–DOPC or control siRNA–DOPC (5 �g) in 100 �L of normal saline was given throughi.v. bolus into the tail vein under normal pressure.
4. Tumor and other tissues were harvested at various timepoints after injection (1 h, 6 h, 48 h, 4 days, 7 days, or10 days).
5. Tissue specimens were placed in OCT and frozen rapidly inliquid nitrogen for frozen slide preparation.
3.7. Determination ofEphA2Downregulation inOvarian Tumors
1. To characterize the efficacy of targeted delivery of siRNApackaged into neutral nano-liposomes, HeyA8 ovariancancer cells were used. A target siRNA sequence, 5′-ATGACATGCCGATCTACATG-3′, was used to downreg-ulate EphA2 in vitro and in vivo.

In Vivo Neutral Liposomal siRNA Delivery 35
2. To determine the optimal dose and frequency of dosing, asingle injection of EphA2 siRNA–DOPC was given i.v. oncetumor size reached 0.5–1.0 cm3, as assessed by palpation(∼17 days after tumor cells injection).
3. Targeted EphA2 siRNA–DOPC or control siRNA–DOPC(5 �g in 100 �L normal saline) was given through i.v. bolusinto the tail vein under normal pressure.
4. Tumors were harvested at several time points followingsiRNA injection. Tissue specimens were either snap frozenfor protein assessment, fixed in formalin for paraffin embed-ding, or frozen in OCT for immunofluorescence.
5. To assess tumor growth for long-term experiments, ther-apy was started one week after tumor cell injection. Micewere divided into five groups (n = 10 per group): (a) emptyliposomes; (b) non-targeting control siRNA-DOPC; (c)EphA2 siRNA-DOPC; (d) control siRNA-DOPC + pacli-taxel; and (e) EphA2 siRNA-DOPC + paclitaxel. Paclitaxel(100 �g/mouse) was injected i.p. once weekly and siRNAs(non-specific or EphA2-targeted, 150 �g/kg) injected i.v.twice weekly.
6. Mice were monitored for adverse effects. When mice in anygroup began to appear moribund (approximately after 3–4 weeks of therapy), all animals were sacrificed and tumorswere harvested.
7. Mouse weight, tumor weight, and distribution of tumorwere recorded. Tumor tissue specimens were collectedfor Western blotting and immunohistochemistry studies asdescribed above. Results are shown in Fig. 3.1.
3.8. Western Blotting 1. HeyA8 cells were grown to 80% confluence, washed twotimes with PBS, and then lysed in modified RIPA bufferplus protease inhibitors on ice for 20 min.
2. Cell lysates were scraped off, kept on ice for 20 min, andcentrifuged at 12,000 rpm for 20 min at 4◦C.
3. The protein content of the supernatants was measured bythe BCA assay kit.
4. The cell lysates were adjusted for equal amount of protein,mixed with 3X sample buffer, and boiled for 5 min.
5. Thirty micrograms of cell lysate protein was separated bysodium dodecyl sulfate-polyacrylamide gel electrophoresis(10% gel) and electrophoretically transferred on to a nitro-cellulose membrane.
6. The membrane was blocked overnight in 5% (w/v) nonfatdry milk in TBS containing 0.1% Tween-20.
7. The membrane was probed with an EphA2 antibody at1:1,000 dilution overnight at 4◦C and washed with TBSTfor 1 h at room temperature by changing the TBST every10 min.

36 Mangala et al.
Fig. 3.1. Therapeutic effects of siRNA-mediated EphA2 downregulation on HeyA8 ovarian tumors. A total of 2.5 ×10⁵ HeyA8 cells were injected i.p. into nude mice. Mice were randomly divided into five groups: (A) empty liposomes,(B) control siRNA–DOPC, (C) EphA2 siRNA–DOPC, (D) control siRNA–DOPC + paclitaxel, and (E) EphA2 siRNA–DOPC +paclitaxel. Therapy was started on the seventh day by injecting liposomal siRNA twice weekly (150 �g/kg) and paclitaxel(100 �g/mouse) once weekly. Animals were killed when control mice became moribund (3–5 weeks after cell injection);mouse weight, tumor weight, and tumor location were recorded. On left, mean tumor weight, and on right, individualtumor values were shown. (Reproduced from Ref. (16) with permission from American Association for Cancer Research).
8. The membrane was reprobed with secondary anti-mouseIgG HRP at 1:2,000 dilution.
9. Secondary antibody was removed and membrane waswashed for 1 h at room temperature by changing the TBSTevery 10 min.
10. The enhanced chemiluminescence system was used todetect the reaction between antigen and antibody. Afterfinal wash with PBS, remaining steps were done in a darkroom. Aliquots (1 mL) of each portion of the ECL reagentwas mixed and added onto the blot and then rotatedby hand for 1 min to ensure even coverage of the ECLreagent. The blot was removed from the ECL reagent andblotted.
11. The membrane was placed in X-ray film cassette with filmfor a suitable exposure time, typically a few minutes.
12. The membrane was stripped and reprobed with an anti-beta-actin antibody at a dilution of 1:2,000 to ensure evenloading of proteins in the different lanes (Fig. 3.2A).

In Vivo Neutral Liposomal siRNA Delivery 37
Fig. 3.2. In vivo downregulation of EphA2 using target siRNA. (A) Western blot of lysatefrom tumors collected after 48 h of single administration of control siRNA–DOPC (lanes1 and 2) or EphA2-targeting siRNA–DOPC (lanes 3–5). Lanes 1a and 1b are separatepreparations from same tumor treated with control siRNA–DOPC. Similarly 5a and 5bare from same tumor treated with EphA2-targeted siRNA–DOPC with different prepa-rations. Lanes 2–4 are from separate mice treated with either control or EphA2 siRNAwith DOPC. (B) Immunohistochemical staining for EphA2 in tumor treated with controlsiRNA–DOPC. (C) Immunohistochemistry 48 h after a single injection of EphA2-targetedsiRNA without transfection agent (naked siRNA) is shown and had no detectable effect onEphA2 expression. (D) Treatment with EphA2-targeted siRNA in DOPC showed effectivedownregulation of EphA2 48 h after single injection. B–D, original magnification ×400.(Reproduced from Ref. (16) with permission from American Association for CancerResearch).
3.9. Immunohisto-chemistry
3.9.1.ImmunohistochemicalStaining for EphA2
1. Sections of formalin-fixed, paraffin-embedded tumor sam-ples (8-�m thick) were heated to 60◦C.
2. Sections were dehydrated in xylene, 100% ethanol, 95%ethanol, and 80% ethanol.
3. Then, tissues were rehydrated with PBS.4. Antigen retrieval was done with 0.2 mol/L Tris/HCl (at pH
9.0) for 20 min in a steam cooker.5. Slides were allowed to cool for 20 min at room temperature,
followed by repeated rinsing with PBS for three times for5 min.
6. Individual slides were removed, and dried around the tissue.A circle was drawn around the tissue with a Pap pen and kepton the slide holder. A drop of PBS was added to tissue and

38 Mangala et al.
placed in a humidified chamber. This step was performed forall immunohistochemistry and confocal microscopic studies.
7. Endogenous peroxidase activity was quenched with 3%hydrogen peroxide in methanol for 5 min and washed threetimes with PBS for 5 min.
8. Slides were counterstained with hematoxylin and mounted.The negative controls were incubated with non-immunemouse IgG in place of primary antibody (Fig. 3.2B–D).
3.9.2. Determination ofUptake of Alexa-555Fluorescent siRNA byTumor Tissues
1. Tissues were collected from sacrificed mice, immediatelyplaced in OCT, and frozen rapidly in liquid nitrogen (Sec-tion 3.6).
2. Frozen sections were cut at 8-�m thickness and fixed withfresh cold acetone for 10 min.
3. Tissues were washed three times with PBS for 5 min andslides were placed on the slide holder as mentioned above inSection 3.9A. The humidified chamber was covered with analuminum foil to protect from light.
4. Samples were exposed to 1.0 �g/mL Hoechst in PBS (at1:10,000 dilution) for 10 min to stain the nucleus.
5. After three washes for 5 min with PBS, tissues werecovered with mounting medium glycerol-propyl-gallatein PBS, coverslipped, and examined with a fluores-cent Zeiss Axioplan 2 microscope, Hamamatsu ORCA-ER Digital camera, and ImagePRO Software using redand blue filters for Alexa-555 siRNA and nuclei, respec-tively (Fig. 3.3A). Since the fluorescent signal becomesweaker over time, pictures were taken within 4 days (seeNote 6).
3.9.3.ImmunofluorescenceDetection ofMacrophages
1. OCT frozen sections of 8 �m thickness were fixed with freshcold acetone for 10 min and washed three times with PBSfor 5 min.
2. Slides were placed in a humidified chamber as mentionedabove and blocked with protein block for 20 min at roomtemperature.
3. Extra protein block was drained off and tissues were incu-bated with 10 �g/mL anti-f4/80 primary macrophage anti-body at 4◦C overnight.
4. Tissues were washed with PBS three times for 5 min eachand then re-incubated with 4 �g/mL secondary goat anti-rat Alexa-488 for 1 h at room temperature.
5. Tissues were washed three times with PBS and counter-stained with Hoechst, which was diluted 1:10,000 in PBS.
6. Tissues were washed with PBS for three times, mountedusing mounting media glycerol-propyl-gallate in PBS, andthen coverslipped.
7. Samples were visualized using conventional fluorescencemicroscope using appropriate filters such as red filter for

In Vivo Neutral Liposomal siRNA Delivery 39
A B
C D
Fig. 3.3. In vivo siRNA distribution in HeyA8 tumor (i.p.) after a single siRNA dose.Tumors were harvested at different time points, frozen in OCT medium, fixed in ace-tone, and exposed to Hoechst to stain nuclei blue. (A) Fluorescent siRNA distribution intumor tissue (original magnification ×400). (B and C) To detect scavenger macrophagesand endothelial cells, tumor tissues were processed as mentioned above, addition-ally exposed to anti-f4/80 and anti-CD31 antibody and then to Alexa-488-tagged sec-ondary antibody (green). (D) Sections of 30 �m thickness were examined with confocalmicroscopy. Photographs taken every 1 �m were stacked and examined from the lat-eral view. Nuclei were labeled blue and fluorescent siRNA (red) was seen throughoutthe section. Fluorescent Alexa-488-tagged secondary antibody (green) is trapped on thesurface since it is too large to penetrate the tissue. (Reproduced from Ref. (16) withpermission from American Association for Cancer Research).
fluorescent siRNA, green for macrophage, and blue fornucleus (Fig. 3.3B).
3.9.4. Evaluation of theTumor Vasculature
1. OCT frozen sections were cut at 8 �m thickness.2. Tissues were fixed with fresh cold acetone for 10 min and
then washed with PBS three times for 5 min.3. Tissues were placed in humidity chamber on the slide holder
as mentioned above in Section 3.9A.4. Tissues were incubated with protein block (5% normal horse
serum plus 1% normal goat serum in PBS) for 20 min.

40 Mangala et al.
5. Excess of protein block was removed and tissues were incu-bated with primary rat anti-mouse CD31 antibody, whichwas diluted in protein block at dilution of 1:800 at 4◦Covernight.
6. Slides were washed three times with PBS for 5 min each andincubated with secondary goat anti-rat Alexa-488 (1:400dilution) for 1 h at room temperature. The humidity cham-ber was covered with aluminum foil to protect from light.
7. Tissues were washed three times with PBS for 5 min andcounterstained with Hoechst (1:10,000 dilution) for 10 minfor the detection of nucleus.
8. Tissues were mounted using propyl-gallate and coverslipped.9. Samples were visualized for CD31-positive blood vessels
by fluorescent Zeiss Axioplan 2 microscope, HamamatsuORCA-ER Digital camera, and ImagePRO Software usingred, blue, and green filters for Alexa-555 siRNA, nuclei, andblood vessels, respectively (Fig. 3.3C).
3.10. ConfocalMicroscopy
1. For confocal microscopy, tissues were collected from sacri-ficed mice, immediately placed in OCT, and frozen rapidlyin liquid nitrogen.
2. Frozen sections were cut at 30-�m thickness, fixed withfresh cold acetone for 10 min, and washed three times withPBS for 5 min.
3. Sections were exposed with 10 nmol/L Sytox green in PBSfor 10 min to stain the nucleus.
4. After three washes for 5 min with PBS, tissues were cov-ered with glycerol-propyl-gallate, coverslipped, and exam-ined with Zeiss LSM 510 confocal microscope and LSM 510Image Browser software (Fig. 3.3D).
4. Notes
1. Avoid stressing cells with temperature shifts and long periodswithout medium during washing steps. It is very importantthat the cell density is not too low at transfection. Ideally,the cells should be plated 24 h prior to transfection.
2. For in vitro siRNA transfection of ovarian cancer cells, weoptimized the ratio between siRNA and RNAiFect as 1:6. Ifthere is toxicity seen for other cell types with this ratio, werecommend decreasing the amount of RNAiFect reagent.
3. For in vivo injections, grow cells to 60–80% confluence. Donot use over-confluent cells and cells that have propagatedmore than 10 passages (since the last thaw), as they will havelower take rates.

In Vivo Neutral Liposomal siRNA Delivery 41
4. Mix siRNA–DOPC with PBS (without calcium or magne-sium) or normal saline before injection of the complex intomice. Do not vortex the siRNA–liposome complex (degra-dation of liposomes may occur with vortexing). Mix gentlywith pipetting up and down.
5. Once liposomal siRNA is mixed with PBS or saline, do notfreeze the solution because the freezing process could frac-ture or rupture the liposomes leading to a change in sizedistribution and loss of internal contents.
6. When Alexa-555 fluorescently labeled siRNA is used, werecommend taking pictures within 3–4 days after stainingbecause the fluorescent signal may become weaker over time.
Acknowledgments
Portions of the work in this paper were supported in part by agrant from the Department of Defense (W81XWH-04-1-0227),NIH grants (CA109298, CA110793), the U.T.M.D. AndersonCancer Center SPORE in ovarian cancer (2P50CA083639), aProgram Project Development Grant from the Ovarian Can-cer Research Fund, Inc., the Zarrow Foundation, the MarcusFoundation, and the Betty Ann Asche Murray DistinguishedProfessorship.
References
1. Elbashir, S. M., Lendeckel, W., Tuschl, T.(2001) RNA interference is mediated by 21-and 22-nucleotide RNAs. Genes Dev. 15,188–200.
2. Chendrimada, T. P., Gregory, R. I.,Kumaraswamy, E., Norman, J., Cooch, N.,Nishikura, K., et al. (2005) TRBP recruitsthe Dicer complex to Ago2 for microRNAprocessing and gene silencing. Nature 436,740–744.
3. Meister, G., Landthaler, M., Patkaniowska,A., Dorsett, Y., Teng, G., Tuschi, T. (2004)Human Argonaute2 mediates RNA cleavagetargeted by miRNAs and siRNAs. Mol. Cell.15, 185–197.
4. Okamura, K., Ishizuka, A., Siomi, H., Siomi,M. C. (2004) Distinct roles for Argonauteproteins in small RNA-directed RNA cleav-age pathways. Genes Dev. 18, 1655–1666.
5. Wadhwa, R., Kaul, S. C., Miyagishi, M.,Taira, K. (2004) Vectors for RNA interfer-ence. Curr. Opin. Mol. Ther. 6, 367–372.
6. Ryther, R. C., Flynt, A. S., Phillips, J. A., Pat-ton, J. G. (2005) SiRNA therapeutics: big
potential from small RNAs. Gene Ther. 12,5–11.
7. Yu, D., Peng, P., Dharap, S. S., Wang,Y., Mehlig, M., Chandna, P., et al. (2005)Antitumor activity of poly(ethylene glycol)-camptothecin conjugate: the inhibition oftumor growth in vivo. J. Control Rel. 110,90–102.
8. Fang, J., Sawa, T., Maeda, H. (2003) Fac-tors and mechanism of “EPR” effect and theenhanced antitumor effects of macromolecu-lar drugs including SMANCS. Adv. Exp. Med.Biol. 519, 29–49.
9. Greish, K., Fang, J., Inutsuka, T.,Nagamitsu, A., Maeda, H. (2003) Macro-molecular therapeutics: advantages andprospects with special emphasis on solidtumor targeting. Clin. Pharmacokinet. 42,1089–1105.
10. Maeda, H. (2001) The enhanced perme-ability and retention (EPR) effect in tumorvasculature: the key role of tumor-selectivemacromolecular drug targeting. Adv. EnzymeRegul. 41, 189–207.

42 Mangala et al.
11. Matsumura, Y. and Maeda, H. (1986) Anew concept for macromolecular therapeu-tics in cancer chemotherapy: mechanism oftumoritropic accumulation of proteins andthe antitumor agent smancs. Cancer Res. 46,6387–6392.
12. Miller, C. R., Bondurant, B., McLean, S.D., McGovern, K. A., O′Brien, D. F. (1998)Liposome–cell interactions in vitro: effectof liposome surface charge on the bindingand endocytosis of conventional and steri-cally stabilized liposomes. Biochemistry 37,12875–12883.
13. Thaker, P. H., Deavers, M., Celestino,J., Thornton, A., Fletcher, M. S., Lan-den, C. N., et al. (2004) EphA2 expres-sion is associated with aggressive featuresin ovarian carcinoma. Clin Cancer Res. 10,5145–5150.
14. Landen, C. N., Kinch, M. S., Sood, A.K. (2005) EphA2 as a target for ovariancancer therapy. Expert Opin. Ther. Targets 9,51179–1187.
15. Landen, C. N., Merritt, W. M., Mangala,L. S., Sanguino, A. M., Bucana, C., Lu,C., et al. (2006) Intraperitoneal deliv-ery of liposomal siRNA for therapy ofadvanced ovarian cancer. Cancer Biol. Ther. 5,1708–1713.
16. Landen, C. N., Chavez-Reyes, A., Bucana,C., Schmandt, R., Deavers, M. T., Lopez-Berestein, et al. (2005) Therapeutic EphA2gene targeting in vivo using neutral liposo-mal small interfering RNA delivery. CancerRes. 65, 6910–6918.
17. Killion, J. J., Radinsky, R., Fidler, I.J. (1998) Orthotopic models are neces-sary to predict therapy of transplantabletumors in mice.Cancer Metastasis Rev. 17,279–284.
18. Voskoglou-Nomikos, T., Pater, J. L.,Seymour, L. (2003) Clinical predictivevalue of the in vitro cell line, humanxenograft, and mouse allograft preclini-cal cancer models.Clin. Cancer Res. 9,4227–4239.

Chapter 4
Therapeutic Applications of RNAi for Silencing VirusReplication
Ralph A. Tripp and Stephen Mark Tompkins
Abstract
RNA interference (RNAi) is an evolutionarily conserved gene-silencing mechanism in which small 19–23-nucleotide double-stranded RNA molecules, or small interfering RNAs (siRNAs), target cognate RNAfor destruction with exquisite potency and selectivity. The RNAi machinery is believed to be expressedin all eukaryotic cells and has been shown to regulate host gene expression. Given this ability, RNAisilencing strategies have been developed to inhibit viral genes and replication in host cells. One area ofgrowing interest is the development of synthetic siRNA drugs to target acute viral infections in whichlong-term gene silencing is not required or desirable. To achieve synthetic siRNA drug efficacy, theseanti-viral agents need to be delivered to the appropriate host cells, as they do not readily cross thecell membrane. Varied delivery and siRNA chemical stabilization strategies are being investigated forsiRNA drug delivery; however, several studies have shown that naked, unmodified siRNA drugs canbe effective in silencing replication of some viruses in animal models of infection. These findings suggestthat RNAi-based drugs may offer breakthrough technology to protect and treat humans and animals fromviral infection. However, there are four major considerations for evaluating successful RNAi efficacy: thesiRNAs must have high efficiency, show low cytotoxicity, result in minimal off-target effects, and lead toresults that are reproducible between experiments. The methods and caveats to achieve these goals arediscussed.
Key words: RNA interference, RNAi, small interfering RNA, siRNA, transfection, drug delivery,virus, prophylactic, therapeutic.
1. Introduction
RNA interference (RNAi) has been shown to be an impor-tant mechanism to specifically silence or downregulate geneexpression. Key to the RNAi activity are small interfering RNA
John F. Reidhaar-Olson and Cristina M. Rondinone (eds.), Therapeutic Applications of RNAi: Methods and Protocols, vol. 555© Humana Press, a part of Springer Science+Business Media, LLC 2009DOI 10.1007/978-1-60327-295-7 4 Springerprotocols.com
43

44 Tripp and Tompkins
(siRNA) strands having complementary nucleotide sequences tocognate RNA targets. The highly selective and robust activ-ity of siRNAs on gene expression has made RNAi a valuabletool for investigating gene function and regulating gene activ-ity. Since synthetic siRNAs can be readily made and introducedinto cells to mediate suppression of specific genes of interest,this technology is now routinely used to study gene functionin cultured mammalian cells (1), and to identify and validatepotential drug targets in the host. However, RNAi has not beenfully exploited as an anti-viral method, particularly for in vivoapplications.
Use of RNAi in vivo has shown promise, and two basicmethods for mediating RNAi have been used: delivery of siRNA(2, 3), and delivery of plasmid and viral vectors that expressshort hairpin RNAs (shRNAs) that are processed in situ intoactive siRNAs (2, 4). The field has predominantly focused ondelivering siRNA because efficacy can be achieved by deliveryacross the cell membrane, whereas delivery across the nuclearmembrane is not required, as it is for shRNA efficacy. Also, con-struction of shRNA expression vectors can be cumbersome, andsubstantially more time is required to test the efficacy of shRNAsequences. However, the success of siRNA-mediated gene silenc-ing in vivo depends on delivery and maintenance of intact siRNAin the cells. Advances in this technology will be required toallow for highly efficient and specific siRNA delivery. Improve-ments in delivery methods will no doubt enhance the utility ofthe technique as a platform drug for disease intervention. Someprogress has been made in siRNA delivery strategies that cen-ter on three general strategies: first, the development of novelsiRNA conjugations and/or formulations to specifically targetsiRNA drugs; second, the development of siRNA carrier and/orencapsulation materials to protect siRNA drugs; and finally,optimal drug delivery methods, such as intravenous, aerosol,and topical (2, 3). Given the drug-like properties of siRNA,and recent studies showing that naked or chemically unmodi-fied siRNA duplexes may have robust virus gene-silencing activ-ity in vitro and in vivo, there is good rationale and strongpromise for therapeutic applications of RNAi for silencing virusreplication.
2. Materials
2.1. Selection ofsiRNA Sequences forTargeting of mRNAs
1. The design of siRNA duplexes for targeting a specific generequires knowledge of the target sequence. The decision totarget specific viral genes may depend on factors such as

RNAi Anti-Viral Therapeutics 45
whether those genes code for receptors or affect the anti-viral immune response; however, a conservative approachwould be to target transcripts from highly conserved genescritical in development of the virus nucleocapsid or involvedin transcription of the virus genome, e.g., polymerase. Foradditional information refer to Notes 1–13.
2.2. Annealing ofsiRNAs to ProduceDuplexes
1. Many commercial manufacturers, such as Dharmacon-ThermoFisher (Lafayette, CO), offer a range ofpre-synthesized siRNA duplexes to meet the needs ofthe investigator; however, custom RNA synthesis mayrequire an annealing step prior to testing.
2. To begin, prepare 2X annealing buffer (200 mM potassiumacetate, 4 mM magnesium acetate, 60 mM HEPES–KOH,pH 7.4).
3. Prepare a 20 �M siRNA duplex working stock by combining2X annealing buffer with sense oligonucleotide (20 �M finalconcentration) and antisense oligonucleotide (20 �M finalconcentration) in sterile water.
4. Incubate for 1 min at 90◦C followed by 1 h at 37◦C, andstore the working stock solution at −20◦C. The siRNAduplex solution can be freeze-thawed as required, but allRNA solutions should be kept on ice to reduce hydrolysis.
5. For quality control, the duplex solution should be run on alow-melt agarose gel in 0.5X TBE buffer at 80 V for 1 h,and the RNA bands subsequently visualized under UV lightafter ethidium bromide staining.
2.3. Selection ofsiRNA TransfectionTools
1. There are several approaches to RNAi but two are commonfor siRNA delivery: (a) lipid-mediated transfection of syn-thetic siRNA, and (b) viral-mediated transduction of siRNA.Determining which one of these approaches to use dependson the cell type studied and whether transient or stableknockdown is desired. For additional information refer toNotes 14–25.
2.4. Selection of CellLines for siRNAScreening
1. Various mammalian cell lines can be used for screeningsiRNA candidates, but Vero cells (ATCC No. CCL-81) orVero E6 cells (ATCC No. CRL-1586) are preferred for rea-sons discussed in Notes 26–29.
2.5. SDS-PAGEElectrophoresisReagents
1. 10X running buffer: 30 g of Tris base; 140 g of glycine; 10 gof SDS, all diluted in 1 l of distilled water.
2. Stacking gel buffer: 0.5 M Tris-HCL, pH 6.8; 0.4% SDS.3. 2X solubilization buffer: 60 mM Tris-HCl, pH 6.8; 20%
SDS; 0.0004% bromophenol blue; 10% mercaptoethanol;20% glycerol.
4. Separation gel buffer: 1.5 M Tris-HCL, pH 8.8; 0.4% SDS.

46 Tripp and Tompkins
5. 10X transfer buffer: 30.3 g Tris base; 144 g glycine, alldiluted in 1 l distilled water; adjust pH with HCl to 8.3.
6. 10X TBS-T buffer: 24.2 g Tris base; 80 g of NaCl, pH 7.5;10 ml of Tween-20, all diluted in 1 l of distilled water. Storeat 4◦C.
3. Methods
3.1. Evaluating siRNAActivity in Cells
1. Before siRNAs are applied, it may be important to estab-lish if the cells to be studied are susceptible to RNAi, as itis possible that some cell lines have lost their ability to per-form RNAi. This can be done using commercial reporterplasmids encoding firefly (Photinus pyralis) luciferase, GFP,or similar reporter molecules. Refer to Notes 30–31 foradditional cell type information.
2. To quantify siRNA concentrations that are unknown,the investigator should use Beer’s Law: (Absorbance at260 nm) = (epsilon)(concentration)(path length in cm),where epsilon is the molar extinction coefficient.
3. When solved for the unknown, the equation becomes:Concentration = (Absorbance at 260 nm)/[(epsilon)(pathlength in cm)]. When a standard 10 mm cuvette is used,the path length variable in this equation is 1 cm. If a differ-ent size of cuvette is used, e.g., a 2 mm microcuvette, thenthe path length variable is 0.2 cm.
4. Use the molecular weight of siRNA to convert betweennmol and �g. If the specific molecular weight is not known,you may use the average molecular weight of siRNA, whichis 13,300 g/mol. Therefore, 1 nmol siRNA = 13.3 �g, or1 mg siRNA = 75 nmol.
5. In determining the quantity of siRNA that should bescreened in an in vitro experiment, it is best to includea final concentration of range between 50–100 nM. Formore information regarding preliminary in vitro screeningrefer to Notes 32–37.
6. Vero cells are ideal to begin in vitro studies. Vero cellsshould be maintained at the proper CO2 in a humidifiedincubator at 37◦C and grown in the appropriate media,e.g., Dulbecco’s modified Eagle’s medium with 10% fetalbovine serum (FBS), but without antibiotics.
7. Sub-culturing is performed by passage using 0.25% (w/v)Trypsin in 0.53 mM EDTA solution using a sub-cultivationratio of 1:3 with medium renewal twice per week.
8. For propagation and maintenance, warm the DMEMmedia and Trypsin-EDTA in a 37◦C water bath

RNAi Anti-Viral Therapeutics 47
(Trypsin-EDTA made by diluting the stock 1:10 by addingPBS only).
9. Split the cells at 80–90% confluency by first decanting themedia and washing the cells with PBS.
10. Aspirate off the PBS, add Trypsin-EDTA, and incubate at37◦C for approximately 3 min – be careful not to over incu-bate with Trypsin-EDTA as it will damage the cells.
11. Remove cells from the incubator and loosen the cells bygentle aspiration with a sterile pipette.
12. Place the dissociated cells in a sterile plastic tube with mediacontaining 1% FBS to aid inactivation of the trypsin.
13. Count the cells using a hemacytometer or related device.14. Dilute the cells in DMEM containing 10% FBS to an
appropriate cell number for the vessel that will propagatethem, usually about 1:5.
15. Repeat this procedure every 3–4 days, maintaining themtwice a week so that they are not diluted too much or over-grown.
16. Refer to Notes 38 and 39 regarding Vero cell storage andrecovery.
17. For siRNA studies, 24 h prior to siRNA transfection,the cells should be trypsinized, washed in fresh DMEMmedium without antibiotics, and aliquots transferred intoeach well of a 24-well plate. The Vero cells should be platedin 500 �l of medium without antibiotics so that that theywill be approximately 50–70% confluent at the time oftransfection.
18. For each transfection, prepare optimal siRNA/lipid trans-fection reagent complex as per the manufacturer’s instruc-tions. A dose–response should be performed with siRNAcandidates and siRNA controls at concentrations rangingfrom 1 to 50 nM. Refer to Note 40 for additional infor-mation.
19. Add the complex to the cells and gently mix by rocking theplate.
20. Incubate the plate at 37◦C in a CO2 incubator for 12–24 h.Transfection times may vary depending on siRNA stability,the siRNA sequence chosen, and the growth characteristicsof the cell line being transfected.
21. If cell viability loss occurs, the transfection reagent–siRNAcomplex medium may be changed after 6–8 h.
22. Following transfection, the activity should be examinedbetween 24 and 72 h siRNA. This can be done usinga reporter-based assay (refer to Notes 18 and 29)that may be suitable for quantification by fluorescence-activated cell sorting, fluorescence, or as recommendedby the manufacturer. It is important to note thattransfection reagents change the autofluorescence of

48 Tripp and Tompkins
cells, which must be controlled for by mock transfec-tion.
23. For evaluating endpoints of siRNA activity in cells, refer toNotes 41–50.
3.2. Testing ViralEndpoints FollowingsiRNA Treatment
There are several assays to evaluate siRNA efficacy against viruses,which fall into two main strategies, prophylactic or therapeuticapplication. Refer to Note 51 for general information.
3.2.1. Virus PlaqueAssay for ProphylacticsiRNA Treatment AgainstRespiratory SyncytialVirus (RSV)
1. 24 h prior to siRNA testing, 24-well plates of the cell lineof interest (e.g., Vero E6 cells) must be seeded to obtain80–90% confluency.
2. Transfect the cells using a commercial transfection reagent,such as Mirus TransIT-TKO (TKO). Follow the manufac-turer’s transfection guidelines.
3. For example, for TKO-mediated transfection, add 2 �l ofTKO to 50 �l of DMEM cell media that does not containFBS and incubate at room temperature for 10 min.
4. Add siRNA (final optimal concentration needed is often∼100 nM) to TKO/DMEM mixture and incubate at roomtemperature for 10 min.
5. Remove tissue culture media from 24-h cultures of VeroE6 cells.
6. Wash gently with PBS and decant.7. Add the siRNA/TKO mixture to cells and gently rock for
3 min.8. Be sure to include controls: TKO only and scrambled or
mismatched siRNA/TKO complex.9. Incubate for 12 h (overnight) at 37◦C, 5% CO2.
10. At between 1–2 h post-siRNA transfection, remove platefrom incubator and remove siRNA mixture from cells.
11. Prepare RSV virus (100–200 PFU/100 �l) in DMEMwithout FBS.
12. Add 100 �l of diluted RSV to appropriate wells of 24-wellplate (test all siRNA concentrations in triplicate) and incu-bate for 1 h at 37◦C, 5% CO2.
13. At 2 h post-infection, remove plate from incubator and add1 ml of DMEM/5% FBS containing 2% methylcellulosemedia to each well and incubate plate at 37◦C, 5% CO2 for4–5 days.
14. At day 4 or 5 post-infection, remove overlay and visual-ize plaques by immunostaining with antibodies reactive toRSV F and/or G proteins, or counterstain, e.g., neutralred dye. Refer to Note 52 for a word of caution about theassay.
15. To evaluate results, determine the percent plaque reduc-tion from the controls, i.e., mismatched siRNA control andTKO control.

RNAi Anti-Viral Therapeutics 49
3.2.2. ReverseTranscriptase-Polymerase ChainReaction (RT-PCR) andQuantitative Real-TimePCR (Q-PCR)
When using these methods to evaluate siRNA silencing of a gene,it is important to consider the interdependence between the tar-geting siRNA sequence and the PCR amplification region forassessing the efficacy of the siRNA target gene knockdown. Referto Note 53 for general information.
A generalized method for RT-PCR and Q-PCR is givenbelow:
1. Total RNA is extracted from the transfected cells withRNeasy Mini Kit (QIAGEN).
2. Total RNA (2 �g) is reverse-transcribed to single-strandedcDNA using an oligo(dT) primer and ThermoScript RNaseH− reverse transcriptase (Invitrogen) according to the man-ufacturer’s instructions.
3. Specific primers for the gene of interest must be prepared.4. The RT-PCR reaction is carried out using the following mix-
ture: 0.4 �l of cDNA template, 0.2 �l each of 1 mM gene-specific primers, 1.6 �l of 10 mM dNTPs, 2 U (0.4 �l) ofEx Taq (Takara Bio Inc., Siga, Japan), and 2 �l of 10 × PCRbuffer.
5. Generally, 25 cycles of amplification are performed underthe following conditions: 96◦C for 30 s (denaturation), 30 sat 55◦C (annealing), and 30 s at 72◦C (extension). The PCRproducts are separated by electrophoresis in a 1.0% agarosegel containing 0.5 �g/ml ethidium bromide.
6. Q-PCR is carried out on a Real-Time PCR Detection Systemoften using a QuantiTect SYBR Green PCR kit (QIAGEN).The Q-PCR reaction is carried out using the following mix-ture: 0.1 �l of cDNA template, 2 �l each of 1 mM specificprimers, 25 �l of QuantiTect SYBR Green PCR Master Mix.
7. The Q-PCR amplification is performed under the followingconditions: denaturation at 95◦C for 15 min followed by 40cycles of denaturation at 94◦C for 30 s, annealing at 57◦Cfor 30 s, and extension at 72◦C for 30 s.
8. After Q-PCR, a melting curve is constructed by increasingthe temperature from 55◦C to 95◦C.
9. Each sample for three independent experiments is run inquadruplicate. The mean cycle threshold (Ct) values forthe gene are calculated and normalized to those for beta-actin. The mean value derived from each three experimentsis calculated, and the results graphed with the correspondingstandard deviation.
3.2.3. Western BlotAnalysis
This is a method to detect a specific protein in the cell lysateusing gel electrophoresis to separate native or denatured proteinsby the length of the polypeptide (denaturing conditions) or bythe 3-D structure of the protein (native/non-denaturing condi-tions). The proteins are then transferred to nitrocellulose or a

50 Tripp and Tompkins
PVDF membrane where the protein can be detected, generallyusing antibodies. A general method for Western blotting is givenbelow:
1. SDS-PAGE electrophoresis reagents are prepared as indi-cated.
2. To prepare 10% separation gel, mix 2.5 ml of 40% acry-lamide/bis (9:1) solution, 2.5 ml of separation gel buffer,5 ml of distilled water, 50 �l of ammonium persulfate, and5 �l of TEMED. Cover the polymerizing gel by the layerof distilled water as it solidifies in the rig.
3. To prepare stacking gel, mix 1 ml of 40% acrylamide/bis(9:1) solution, 2.5 ml of stacking gel buffer, 6.5 ml of dis-tilled water, 50 �l of ammonium persulfate, and 10 �l ofTEMED. Dump out the layer of distilled water and layerthe stacking gel on top of the separating gel.
4. To prepare sample, homogenize the particular material insolubilization buffer and incubate 30 min to 1 h at 40◦C.Centrifuge sample for 2 min at 12,000 g.
5. Start electrophoresis in the pre-cooled running buffer at70 V until the sample enters the separating gel, and thenincrease voltage up to 100 V.
6. To transfer the separated polypeptides onto the blottingpaper, soak the blotting paper, e.g., Immobilon P cut tothe size of the separating gel, in methanol for 2 min, andthen accurately put the paper on the surface of water for10 min. During this procedure the water replaces methanolfrom the paper pores.
7. Mix 100 ml of 10X transfer buffer with 850 ml of distilledwater, cool the solution in the cold room, and add 50 mlof methanol.
8. Cut off the stacking gel and soak the separating gel in theprepared solution for 10 min at 4◦C.
9. Soak two pieces of the Whatman 3MM paper with a size ofseparation gel in the prepared solution for 2 min.
10. Assemble sandwich, remove bubbles between gel andImmobilon P, and perform electrotransfer in the preparedsolution for 1 h at 100 V.
11. Prepare 100 ml of TBS-T buffer. Add 5 g of dry nonfatmilk. Shake vigorously.
12. Incubate the blotting paper in 15 ml of the prepared milksolution for 1 h at room temperature.
13. Wash the blotting paper two times with 15 ml of TBS-Tbuffer for 5 min.
14. Dissolve the primary antibodies in 15 ml of milk TBS-Tbuffer and add to the blotting paper. Incubate 1 h at roomtemperature.
15. Wash the paper with 15 ml of TBS-T buffer four times for5 min.

RNAi Anti-Viral Therapeutics 51
16. Dissolve the secondary antibodies, e.g., conjugated tohorseradish peroxidase, in 15 ml of milk TBS-T buffer andadd to the blotting paper.
17. Prepare 6 ml of the substrate solution for horseradish per-oxidase in accordance with manufacturer’s protocol.
18. Incubate the blotting paper with this solution for 1 min.Wrap the wet paper with the Cling Wrap, put the surface ofthe covered blotting paper on film or imager, and detect.
3.2.4. Cell Cytotoxicity Transfection-mediated cell cytotoxicity may be observed partic-ularly during long-term exposure to transfection reagents. Forgeneral information refer to Note 54. The general protocol forperforming cell cytotoxicity assays using the WST-1 method (5),a highly sensitive and easy method, is given below:
1. WST-1 reagent is added to supernatants collected fromtransfected and control untransfected cell lines, i.e.,10 �l/100 �l of cell supernatant. This should be done ina 96-well plate format suitable for an ELISA plate reader.
2. The mixture is incubated for 0.5 h, and then theabsorbance measured at wavelength 420–480 nm. Analyzethe absorbance values to determine cell cytotoxicity com-pared to control wells.
3. Refer to Note 55 for information regarding other commer-cial cytotoxicity kits.
3.3. Potential Pitfalls There are important pitfalls to consider that may be encounteredin prophylactic or therapeutic applications of RNAi. These includesituations encountered in designing siRNA candidates, the hostcell response to siRNAs, and evaluating efficacy. Refer to Notes56–64 for more information.
4. Notes
1. In considering target sites, intronic sequences shouldbe avoided. Sequence information about maturemRNAs can be located from EST databases, e.g.,www.ncbi.nlm.nih.gov.
2. It is important to compare the potential target sites tothe appropriate genome database (examples given herein)to eliminate siRNA candidates with target sequences hav-ing more than 16–17 contiguous base pairs of homol-ogy to other coding sequences. Upon deciding on thetarget, the AUG start codon of the transcript should bescanned for AA dinucleotide sequences and the 3′ adjacent19 nucleotides as potential siRNA target sites.

52 Tripp and Tompkins
3. Since regions of mRNA may be highly structured or cappedwith regulatory proteins, several different siRNA targetsites should be selected at different positions along thelength of the gene sequence to ensure efficacy. It is impor-tant to note that the siRNA specificity for the target regionis critical as a single point mutation is sufficient to abolishtarget mRNA degradation (6).
4. Target sequences can be predicted from genomicsequences using prediction programs, e.g., exon.gatech.edu/GeneMark, genes.mit.edu/GENSCAN.html, orothers.
5. In thinking about siRNA design, it is important to notethat the most predominantly naturally processed and effec-tive siRNAs have been shown to be duplexes of 21- and22-nt with symmetric 2-nt 3′ overhangs (6, 7).
6. Standard selection rules for siRNA design include the fol-lowing: (a) the targeted regions on the mRNA sequenceshould be located 50–100 nt downstream of the startcodon (ATG); (b) one should search for the sequence motifAA(N19)TT or NA(N21), or NAR(N17)YNN, where N isany nucleotide, R is purine (A, G), and Y is pyrimidine(C, U); (c) avoid sequences with >50% G+C content, andavoid stretches of four or more nucleotide repeats; (d) gen-erally avoid targeting 5′ UTR and 3′ UTR regions; and (e)avoid sequences that share a certain degree of homologywith other related or unrelated genes (7).
7. Many commercial sites exist where one can send in the tar-get gene information, and, using proprietary algorithms,the companies will develop synthetic siRNAs or siRNApools for testing.
8. The siRNAs chosen for commercial design should be19–23 nt in length and chemically synthesized usingribonucleoside phosphoramidites.
9. A typical 0.2 �mol-scale RNA synthesis generally providesabout 1 mg, sufficient for approximately 1,000 in vitrotransfection experiments using a 24-well tissue culture plateformat.
10. There are a number of siRNA synthesis options includingwater-soluble, 2′-O-protected RNA which can be depro-tected in aqueous buffers prior to use; fully deprotectedRNA; and purified siRNAs duplexes. For most applications,the third option is preferred.
11. It is critical that the siRNA-targeted region on the mRNAsequence does not share significant, if any, homology withother genes or sequences in the genome, in order to mini-mize off-target effects.
12. It is preferable to select target regions such that siRNAsequences may contain uridine residues in the 2-nt
RNAi Anti-Viral Therapeutics 53
overhangs that can be replaced by 2′-deoxythymidine with-out loss of activity. This feature reduces costs of RNA syn-thesis and appears to enhance nuclease resistance.
13. It is advisable to synthesize siRNA specificity controlsby scrambling the sequence of the effective siRNAduplex.
14. The most popular application for transient transfectionof siRNA is the use of cationic lipid-based reagentsbecause they are generally effective for delivering siRNAin many commonly used cell lines. There are many com-mercial suppliers of lipid-based transfection reagents thatinclude Lipofectamine 2000TM (Invitrogen CorporationCarlsbad, CA) and Transit-TKOTM (Mirus Bio Corpora-tion, Madison, WI).
15. Although lipid-based transfection is one of the more com-monly used methods for adherent cells, suspension cells areoften more difficult to transfect and generally have higherrates of delivery with electroporation techniques.
16. Although siRNA transfection using lipid-based reagentsis a transient event, maximal efficacy is typically achieved24–48 h after transfection, and may last for hours todays depending on the efficiency of transfection and thecell type being treated. A typical transfection protocolincludes plating the cells, creating transfection complexesby mixing transfection agent with siRNA, and addingthe transfection mixture to the growth medium with thecells.
17. shRNA can be expressed from lentivirus vectors allowingfor high-efficiency siRNA transfection of a variety of celltypes, including non-dividing cells and differentiated neu-rons of the brain (8, 9). Approaches for lentiviral hairpin-mediated RNAi are numerous, as are methodologies forderiving RNAi-transgenic cells.
18. There are a multitude of commercially availablelentivirus RNAi vectors, available at various websites,e.g., www.systembio.com, www. dharmacon. com,www.genscript.com, www. invitrogen.com, and others.Many of these vectors encode green fluorescent protein(GFP) or other markers for assessing infectivity, whileother vectors are available with antibiotic selection markerssuch as puromycin. In addition, there are conditionallentiviral RNAi vectors available, with which the user canturn silencing on or off as required during the course ofexperimentation.
19. If a lentivirus RNAi vector must be constructed, animportant first step is to design an effective RNA hair-pin construct. Rules have been developed to enrich forsuccessful hairpin constructs based on thermodynamic

54 Tripp and Tompkins
analysis of siRNA efficacy. There are several predictionalgorithms available for designing hairpin RNA, e.g., www-lbit.iro.umontreal.ca/mcfold/index.html and others, andseveral institutions have created lentiviral RNAi librariesthat are available, e.g., mcmanuslab.ucsf.edu/.
20. Creating hairpin RNAi vectors can be accomplished bydifferent methods. One approach involves annealing twolong complementary DNA oligomers that are direction-ally cloned into the lentivirus expression vector. In a moreinvolved approach, the entire hairpin sequence is includedas part of one of the oligomers where the 300-nt U6 pro-moter is to be amplified by PCR and the resulting productcontains the hairpin entity. These two approaches requirelong oligomers, thus often the final constructs are subjectto sequence errors. To overcome this, other methods havebeen developed such as the synthesis of four different DNAoligomers whereby the oligomers are annealed and directlycloned into the lentivirus vector.
21. Since off-targeting of siRNAs generated by the lentivirusvectors may occur, it is advised that at least two differ-ent hairpin vectors should be made for each targeted gene.Thus, the vectors could be tested to determine if they havethe same phenotypes.
22. To prepare a competent lentivirus from the DNA vectors,the DNA vectors are transiently transfected into a pack-aging cell line such as human 293 cells, and after 2–3days the supernatant will contain the virus. These pro-duction systems generally incorporate a spilt-system, wherethe lentiviral genome has been split into individual helperplasmid constructs which diminishes the risk of creating areplication-capable virus by adventitious recombination ofthe lentiviral genome.
23. It is important to consider if the lentiviral vectors beingprepared should have a restricted or broad host range.This feature is generally determined by the pseudotype orvirus coat used – a feature that can be easily regulated asthe lentiviral production systems are split. To generate abroadly tropic vector, one may consider using the vesicularstomatitis virus (VSV) glycoprotein, as opposed to anotherbinding surface protein which would display limited hostcell specificity.
24. After transfection of the 293 cells or other cell types hasbeen achieved, the virus in the supernatant may be sepa-rated from the cells by filtration of the supernatant througha 0.45-�m syringe-filter. It is important to determine thevirus titer in the supernatant so that experiments can bereproduced over the course of multiple experiments.

RNAi Anti-Viral Therapeutics 55
25. Different cell types differ in their ability to be infected.Polybrene (hexadimethrine bromide), a cationic polymer,may be used to increase the efficiency of infection of certaincells, as it acts by neutralizing the charge repulsion betweenthe virions and cell surface.
26. As some RNA duplexes may stimulate type I IFN expres-sion upon transfection into certain cell types, it is importantto consider if a type I IFN-defective cell line can be usedin the screening process, such as Vero or Vero E6 cells, acontinuous line of African green monkey kidney cells defec-tive in the production of interferon. This feature is particu-larly important for screening siRNA candidates that targetviruses, as induction of type I IFNs can inhibit virus repli-cation (10–12).
27. It is important to maintain healthy cells. Some cell linesare more sensitive to transfection agents than others, andthis may be dependent upon passage number. It is advis-able to use cells subjected to a similar number of passagesto ensure reproducibility in transfection results betweenexperiments.
28. It is recommended that control transfections be performedby varying cell confluency (40–90%), as low cell density ortoo much transfection reagent increases cell toxicity.
29. To estimate the transfection efficiency in a particularcell line, it is recommended that fluorophore-conjugatedsiRNA be tested prior to experimentation, e.g., Cy3-labeled siRNA or fluorescein-siRNA transfection controls.
30. For studies involving siRNAs targeting viral genes it isoften best to screen in vitro using flat-bottom 24-wellplates as this allows for enumeration of virus titers as anendpoint.
31. For these type of studies, Vero or Vero E6 cells are pre-ferred, but other cell lines have been used, including HeLa,COS, NIH/3T3, HEK 293, CHO, A549, and Drosophilacells (13–15).
32. In preliminary in vitro siRNA screenings, the cells shouldbe transfected as indicated by the manufacturer using a reli-able transfection agent, e.g., Lipofectamine 2000 (Invitro-gen).
33. The optimal ratio of siRNA-to-lipid transfection reagentand the total amount of this complex should be determinedusing the same number of Vero cells to evaluate the highesttransfection efficiency.
34. Optimal ratios should be approached by starting with aconstant amount of siRNA and varying the amount oftransfection reagent. The best place to start is followingthe manufacturer’s recommendations as each transfectionreagent is different.

56 Tripp and Tompkins
35. Reduced-serum medium is recommended for transfection;however, no antibiotics should be added to the media dur-ing transfection.
36. It is important to maintain the same cell numbers and con-ditions across experiments.
37. The serum-free media to be used in the assay should betested for compatibility with the transfection reagent. Opti-MEM R© is generally a good media to start trials with.
38. It is best not to exceed a passage number of 30 after thaw-ing the stock culture, so make a master freezing of low pas-saged cells as the number of passages may affect siRNAtransfection efficiencies.
39. Aliquots of cells of low passage number cells may be storedfrozen by centrifuging the cells in a sterile tube and resus-pending in a 9:1 ratio of FBS:DMSO. The cells should bealiquoted into appropriate freezer vials, put into Mr. Frostycontainers first for freezing at –70◦C and then moved intoliquid nitrogen.
40. To transfect the cells with the siRNA candidates, it isbest to use the conditions recommended by the man-ufacturer for the transfection reagents being used asthey operate differently. For example, INTERFERinTM,DharmaFECTTM, HiPerFectTM, Transit-TKOTM, Lipofec-tamine 2000TM, and other transfection reagents are avail-able for siRNA transfection of eukaryotic cells, especially atlow siRNA concentrations, e.g., 1–10 nM siRNA concen-trations.
41. Optimally, siRNA should be delivered to the cells 12–24 hprior to virus infection for siRNA drugs targeting viruses.Endpoints such as virus titers are generally assessed 48 hpost-transfection. It is important not to overwhelm thecells during the infection phase; multiplicities of infection(MOIs) between 0.1 and 1.0 are generally used.
42. siRNAs targeting different positions on the same gene ordifferent genes may induce different levels of gene silenc-ing. Therefore, the selection of the mRNA target sequenceis critical to siRNA efficacy. Equally important are the end-points for analysis of siRNA efficacy. For virus studies theseendpoints may include examining virus titer, qPCR of virusgene expression, plaque morphology, viral antigen levels, orloss of reporter signal such as that associated with a GFP-virus.
43. Effective siRNA knockdown of virus replication can bededuced by determining the reduction of virus titer, orat least demonstrating a reduction of the targeted viralmRNA. An immunostaining virus plaque assay using mon-oclonal antibodies specific to a viral protein will allow forquantitation of virus replication.

RNAi Anti-Viral Therapeutics 57
44. Standard plaque assays using counterstaining mayalso be effective, but for this and immunostainingplaque assays, it is recommended that a commercialplaque counting device be used to minimize investi-gator error. ELISPOT plate readers such as the AIDEliSpot Reader has a software program that countsspots according to the user’s settings (www.elispot.com/index.html?elispot reader/software.htm).
45. It may be useful to examine expression of the targeted viralprotein by Western blotting of virally infected cell lysates.
46. If no siRNA knockdown of protein is observed by West-ern blot, it may be desirable to analyze whether the targetmRNA was effectively destroyed by the transfected siRNA.This can be tested by preparing total RNA from the trans-fected and mock-treated controls between 24 and 72 hpost-transfection.
47. The total RNA can be reverse-transcribed using a target-specific primer and PCR-amplified with a primer pair cov-ering at least one exon–exon junction in order to controlfor amplification of pre-mRNAs.
48. RT-PCR of a non-targeted mRNA is also needed as con-trol. Effective depletion of the mRNA with undetectablereduction of target protein may indicate that a large reser-voir of stable protein exists in the cell. Multiple transfec-tions in sufficiently long intervals may be necessary untilthe target protein is finally depleted to a point where a phe-notype may become apparent.
49. If multiple transfection steps are required, it isrecommended that the cells be split every 2–3 daysafter transfection. The cells may be transfected immedi-ately after splitting. Note that cells diluted to a confluencyof less than 60% are generally less effectively transfected.
50. If detection of siRNA-mediated knockdown cannot beobserved, test a different siRNA duplex targeting a differ-ent gene region or gene, test for the possibility of sequenc-ing errors in deposited sequence files, or for polymorphismsthat may be a problem for a given sequence. It is rec-ommended that that the cell line used be investigated, as∼36% of cell lines are of different origin or species to thatclaimed (16).
51. Prophylactic treatment is the most common method usedto evaluate efficacy, where the siRNAs are delivered to thecells of choice prior to virus infection. Therapeutic treat-ment is done after virus infection of the cell line. In bothcases, virus plaque assays are commonly used to evaluateefficacy. A plaque assay measures the number of infec-tious virus particles. The methods for these assays varyand are dependent upon the virus being studied, as viruses
58 Tripp and Tompkins
exhibit cell tropism, cell receptor requirements, cell enzymerequirements, etc. It is important to be familiarized withthe current literature for the appropriate methods to usefor the virus to be studied.
52. A word of caution – HEp-2 cells (ATCC # CCL-23) arealso commonly used to propagate and titer RSV. It isimportant to note that this line was originally thought tobe derived from an epidermoid carcinoma of the humanlarynx, but was subsequently found based on isoenzymeanalysis, HeLa marker chromosomes, and DNA finger-printing, to have been established via HeLa cell contami-nation. Thus, these cells are not recommended for use.
53. Accurate measurement of siRNA efficacy by PCR requirescareful attention to the primer location used to amplifythe target mRNA. It is known that initial cleavage of thetarget gene mRNA by the RNA-induced silencing com-plex (RISC) endonuclease occurs near the center of thesiRNA targeting sequence (6), an effect mediated by Ago-2activity (17); however, complete degradation of the entiremRNA is not always observed (18, 19).
54. Some siRNAs have been reported to induce off-targeteffects linked to cell cytotoxicity, an effect that may obscureevaluation of siRNA efficacy. There are a number of com-mercially available kits for evaluating cell cytotoxicity. TheWST-1 method (5) is highly sensitive and easy to per-form. WST-1 is a tetrazolium salt that when in contact withmetabolically active cells gets cleaved to formazan by mito-chondrial dehydrogenases. The formazan dye is then mea-sured using a scanning spectrophotometer at wavelengths420–480 nm. The darker the formazan dye, the greater thenumber of metabolically active cells in that well. The WST-1 reagent has several advantages compared to other cellcytotoxicity reagents in the market. The WST-1 reagent iswater-soluble after cleavage so there is no need to performa solubilization step, and WST-1 is very stable so it can bestored in a ready-to-use solution.
55. There are also commercial kits that provide a direct mea-surement of cytotoxicity rather than using an indirect indi-cator such as the release of cell enzymes. An example of akit is given by the LIVE/DEAD R© Viability/CytotoxicityAssay Kit from Molecular Probes. This kit provides a two-color fluorescence cell viability assay that is based on thesimultaneous determination of live and dead cells with twoprobes that measure two recognized parameters of cell via-bility: intracellular esterase activity and plasma membraneintegrity. The kit can be used with fluorescence micro-scopes, fluorescent plate scanners, or flow cytometers. Theassay is applicable to most eukaryotic cell types, including

RNAi Anti-Viral Therapeutics 59
adherent cells. It is recommended that the user follow themanufacturer’s protocol as it varies depending upon appli-cation.
56. When designing siRNA candidates it is important to notethat if the number of allowed mismatches between siRNAand homologous gene sequences are set too stringently,some functional siRNAs will be rejected due to sequenc-ing errors that are common to EST databases.
57. Several studies have shown that the host cell interferon-response effect is enhanced by increasing the concentrationof siRNAs (11, 12).
58. siRNA duplexes >23 bp can influence cell viability andinduce a host cell IFN response that appears to be medi-ated through upregulation of the dsRNA receptor, Toll-likereceptor 3 (20). These effects may be cell type specific.
59. Several studies have shown that off-target effects may becaused by perfect matches of the seed region of the siRNAantisense strand with the 3′ untranslated region of unin-tended mRNA targets, combined with limited homologyelsewhere in the 21-base target sequence (21, 22).
60. Due to the risk of off-target effects, it is critical todesign siRNA experiments with redundancy so that spu-rious results can be detected. Redundancy experimentsshould use multiple different silencing reagents, e.g., sev-eral siRNAs targeting different areas of the same mRNA.As the probability that several siRNAs that target differ-ent sequences of the same gene would cause the samephenotype through off-target interaction is very low, thisapproach can be used to show siRNA specificity and thevalidity of the relationship between target gene knockdownand resulting phenotype.
61. In designing short siRNAs, it is important to con-sider that they may target a part of the mRNA thatis masked by secondary structure or bound proteins,thus reducing efficacy through inaccessibility of the targetsite.
62. A negative siRNA screening result may be due to inefficacythat could result from an inability to reduce translation tothe point where a phenotype is apparent.
63. With regard to the therapeutic window of siRNA efficacy,it is important to consider the level of siRNA uptake andintracellular processing by the cell type being investigated.
64. If the goal is siRNA therapeutic approaches, it is importantto consider the breadth of applicability to the clinically rel-evant target, the level of cell cytotoxicity associated withdelivery of the siRNA, and other regulatory perspectives.
Another limitation to consider is that clinical useof siRNAs would typically be transient in nature with

60 Tripp and Tompkins
intracellular siRNA concentrations and efficacy usuallydeclining within a 1–2 week period. Thus, treatment ofchronic pathologies would either require repetitive siRNAtreatment, or long-term RNAi linked to stable transfection,e.g., lentivirus vectoring.
References
1. Elbashir, S. M., Harborth, J., Lendeckel, W.,Yalcin, A., Weber, K., and Tuschl, T. (2001)Duplexes of 21-nucleotide RNAs mediateRNA interference in cultured mammaliancells Nature 411, 494.
2. Amarzguioui, M., Rossi, J. J., and Kim, D.(2005) Approaches for chemically synthe-sized siRNA and vector-mediated RNAiFEBS Lett 579, 5974–5981.
3. de Fougerolles, A., Vornlocher, H.-P.,Maraganore, J., and Lieberman, J. (2007)Interfering with disease: a progress report onsiRNA-based therapeutics Nat Rev Drug Dis-cov 6, 443–453.
4. Fewell, G. D., and Schmitt, K. (2006)Vector-based RNAi approaches for stable,inducible and genome-wide screens DrugDiscov Today 11, 975–982.
5. Hamasaki, K., Kogure, K., and Ohwada, K.(1996) A biological method for the quanti-tative measurement of tetrodotoxin (TTX):tissue culture bioassay in combination witha water-soluble tetrazolium salt. Toxicon 34,490–495.
6. Elbashir, S. M., Lendeckel, W., andTuschl, T. (2001) RNA interference is medi-ated by 21- and 22-nucleotide RNAs GenesDev. 15, 188–200.
7. Birmingham, A., Anderson, E., Sullivan, K.,Reynolds, A., Boese, Q., Leake, D.,Karpilow, J., and Khvorova, A. (2007) Aprotocol for designing siRNAs with highfunctionality and specificity Nat Protocols 2,2068–2078.
8. Gonzalez-Alegre, P., Bode, N., Davidson,B. L., and Paulson, H. L. (2005) Silencingprimary dystonia: lentiviral-mediated RNAinterference therapy for DYT1 dystonia. JNeurosci 25, 10502–10509.
9. Dann, C. (2007) New technology for an oldfavorite: lentiviral transgenesis and RNAi inrats. Transgenic Res 16, 571–580.
10. Ge, Q., McManus, M. T., Nguyen, T., Shen,C. H., Sharp, P. A., Eisen, H. N., and Chen,J. (2003) RNA interference of influenza virusproduction by directly targeting mRNA fordegradation and indirectly inhibiting all viralRNA transcription Proc Natl Acad Sci USA
100, 2718–2723.11. Sledz, C. A., Holko, M., de Veer, M. J.,
Silverman, R. H., and Williams, B. R. (2003)Activation of the interferon system by short-interfering RNAs. Nat Cell Biol 5, 834–839.
12. Sledz, C. A., and Williams, B. R. G. (2004)RNA interference and double-stranded-RNA-activated pathways Biochem Soc Trans32, 952–956.
13. Perrimon, N., Friedman, A., Mathey-Prevot,B., and Eggert, U. S. (2007) Drug–targetidentification in Drosophila cells: combininghigh-throughout RNAi and small-moleculescreens. Drug Discov Today 12, 28–33.
14. Birmingham, A., Anderson, E. M., Reynolds,A., Ilsley-Tyree, D., Leake, D., Fedorov, Y.,Baskerville, S., Maksimova, E., Robinson, K.,Karpilow, J., Marshall, W. S., and Khvorova,A. (2006) 3′ UTR seed matches, but notoverall identity, are associated with RNAi off-targets. Nat Meth 3, 199–204.
15. Cullen, L. M., and Arndt, G. M. (2005)Genome-wide screening for gene functionusing RNAi in mammalian cells. ImmunolCell Biol 83, 217–223.
16. Masters, J. R., Thomson, J. A., Daly-Burns,B., Reid, Y. A., Dirks, W. G., Packer, P., Toji,L. H., Ohno, T., Tanabe, H., Arlett, C. F.,Kelland, L. R., Harrison, M., Virmani, A.,Ward, T. H., Ayres, K. L., and Debenham,P. G. (2001) Short tandem repeat profilingprovides an international reference standardfor human cell lines Proc Natl Acad Sci USA98, 8012–8017.
17. Lingel, A., and Izaurralde, E. (2004) RNAi:finding the elusive endonuclease. RNA 10,1675–1679.
18. Koller, E., Propp, S., Murray, H., Lima, W.,Bhat, B., Prakash, T. P., Allerson, C. R.,Swayze, E. E., Marcusson, E. G., and Dean,N. M. (2006) Competition for RISC bind-ing predicts in vitro potency of siRNA. NuclAcids Res 34, 4467–4476.
19. Vickers, T. A., Lima, W. F., Nichols, J. G.,and Crooke, S. T. (2007) Reduced levels ofAgo2 expression result in increased siRNAcompetition in mammalian cells Nucl AcidsRes. 35, 6598–6610.

RNAi Anti-Viral Therapeutics 61
20. Reynolds, A., Anderson, E. M., Vermeulen,A., Fedorov, Y., Robinson, K., Leake, D.,Karpilow, J., Marshall, W. S., and Khvorova,A. (2006) Induction of the interferonresponse by siRNA is cell type- and duplexlength-dependent. RNA 12, 988–993.
21. Lin, X., Ruan, X., Anderson, M. G.,McDowell, J. A., Kroeger, P. E., Fesik, S.W., and Shen, Y. (2005) siRNA-mediated
off-target gene silencing triggered by a 7nt complementation. Nucl Acids Res 33,4527–4535.
22. Jackson, A. L., Burchard, J., Schelter, J.,Chau, B. N., Cleary, M., Lim, L., andLinsley, P. S. (2006) Widespread siRNA “off-target” transcript silencing mediated by seedregion sequence complementarity. RNA 12,1179–1187.

Chapter 5
RNAi in the Malaria Vector, Anopheles gambiae
Flaminia Catteruccia and Elena A. Levashina
Abstract
Malaria is a disease that kills more than a million people each year in tropical and subtropical countries.The disease is caused by Plasmodium parasites and is transmitted to humans exclusively by mosquitoes ofthe genus Anopheles. The lack of functional approaches has hampered study of the biological networksthat determine parasite transmission by the insect vector. The recent discovery of RNA interferenceand its adaptation to mosquitoes is now providing crucial tools for the dissection of vector–parasiteinteractions and for the analysis of aspects of mosquito biology influencing the vectorial capacity. TwoRNAi approaches have been established in mosquitoes: transient gene silencing by direct injection ofdouble-stranded RNA, and stable expression of hairpin RNAs from transgenes integrated in the genome.Here we describe these methods in detail, providing information about their use and limitations.
Key words: Malaria, mosquito, RNAi, transgenesis, immunoblotting, q-PCR.
1. Introduction
Human malaria persists today as one of the most widespread anddevastating infectious diseases in the world. Plasmodium parasitesare transmitted to humans when an infected Anopheles mosquitotakes a blood meal. The relationship between the mosquito vectorand the malaria parasite is shaped by a complex network of bio-logical interactions determining whether a given mosquito specieswill be capable of sustaining parasite development. Moreover,the vector competence to transmit disease is also governed by aseries of factors intrinsic to mosquito biology, such as host pref-erences, longevity, immunity, and reproductive rates. However,while efficient genetic methods to study gene function in Plas-modium have long been established (1), functional studies in the
John F. Reidhaar-Olson and Cristina M. Rondinone (eds.), Therapeutic Applications of RNAi: Methods and Protocols, vol. 555© Humana Press, a part of Springer Science+Business Media, LLC 2009DOI 10.1007/978-1-60327-295-7 5 Springerprotocols.com
63

64 Catteruccia and Levashina
mosquito vector are lagging behind, and until recently little wasknown about the factors influencing Plasmodium development inthe Anopheles vector.
Since the recent discovery of RNA interference, the “RNAirevolution” has reshaped the field of functional genomics, allow-ing characterization of genomes previously recalcitrant to tar-geted gene manipulation. This revolution has also hit mosquitoresearch. Combined with the availability of the genome sequenceof the major malaria vector, Anopheles gambiae, RNAi providesa new tool for malaria research, permitting study of moleculesand mechanisms of mosquito biology that are relevant to diseasetransmission. Here, we describe two approaches for RNAi-basedsilencing in Anopheles for performing functional analysis in themosquito vector. Further development of these methods mightultimately lead to new ways of controlling and perhaps even erad-icating this devastating disease.
2. Materials
2.1. dsRNA Synthesis 1. pLL10 (Fig. 5.1A): A pBluescript-based plasmid with twoT7 promoter sequences flanking the polylinker region inopposite directions (2).
2. Proteinase K stock solution: 20 mg/mL in sterile 20 mMTris (pH 8); 1.5 mM CaCl2, 50% glycerol. Aliquots canbe stored at –20◦C. Proteinase K buffer: 10 mM Tris-HCl (pH 8); 10 mM EDTA (pH 8); 5 mM NaCl; 2 mMCaCl2. Proteinase K final solution: add 1 �L of proteinaseK (20 mg/mL) to 150 �L of buffer. Store in 50 �l aliquots(one tube for two reactions) at –20◦C.
3. Linearized plasmid and RNA purification: RNase-free(DEPC-treated) water; phenol/chloroform/isoamyl alco-hol (25:24:1); chloroform; isopropanol; 70% ethanol. Allreagents should be RNase-free.
4. Synthesis and purification of single-stranded RNAs(ssRNAs): T7 MEGAscript kit (Ambion, Applied Biosys-tems, Foster City, CA, USA).
2.2. Plasmids forStable RNAi andInjection Mixture
1. Transformation vector pBac[3xP3-EGFPafm] or similar,which contains a fluorescent protein selectable markerunder control of the artificial 3xP3 promoter cloned withinthe inverted repeats of the piggyBac transposable element(Fig. 5.1B).
2. Helper plasmid phsp-pBac, which contains the piggy-Bac transposase gene driven by the hsp70 promoter fromDrosophila melanogaster (3) (Fig. 5.1B).

RNAi and Mosquito 65
Fig. 5.1. Methods for RNAi gene silencing in the mosquitoes. (A) Direct injection of dsRNA. Map of pLL10 and positionof the T7 promoters. The main steps in dsRNA synthesis are described: (1) cloning of the gene of interest in pLL10between the two T7 promoters, using polylinker enzymes; (2) linearization of the plasmid on both sides of the insert; (3)synthesis of sense (+) and antisense (–) ssRNAs independently using the MEGAscript kit; (4) annealing of ssRNAs to formdsRNA (±). In vitro synthesized dsRNA is injected into the mosquito thorax (here shown for adults). Efficiency of dsRNAsilencing can be estimated 12–24 h later by q-PCR or 2–4 days later by immunoblotting. The persistence of silencingoften depends on the targeted gene, but in general it lasts for at least 5 days. (B) Stable RNAi gene silencing in transgenicmosquitoes. Cloning of the inverted fragments of the target gene into a piggyBac transformation vector. Injection ofthe transformation mixture, comprising the transformation vector and a transposase-expressing “helper” plasmid, intomosquito embryos. Expression of the selectable marker (in this case, expression of a red fluorescent protein is drivenby the Pax3 gene promoter in the eyes and nervous system (white)). Fluorescent G1 individuals are outcrossed withwild-type mosquitoes (WT), and G2 fluorescent progeny is intercrossed to amplify numbers of transgenic mosquitoes.Homozygous lines are then established by selection and intercross of homozygous individuals. (C) The efficiency of RNAisilencing in the injected and transgenic mosquitoes can be analyzed by q-PCR (transcriptional level) and immunoblotting(translational level). To date, a number of functional tests have been established to reveal the involvement of the targetedgene in the process of interest (in this example, development of the malaria parasites in the mosquito midgut wasdramatically increased in the dsRNA-treated mosquitoes).

66 Catteruccia and Levashina
3. Injection mixture: 400 �g/mL of transformation vector and150 �g/mL of helper plasmid phsp-pBac in injection buffer(see Section 2.4, Step 2). Prepare three or more aliquots of20 �L each. Keep at –20◦C until use.
2.3. Injection ofdsRNA into AdultMosquitoes
1. Strains of A. gambiae can be obtained from the MR4 (seeNote 1). Mosquitoes are bred at 28◦C and 70% humidity,with a day/night period of 12 h/12 h.
2. Waxed paper cartons (e.g., ice-cream or drink containers);filter paper circles of a matching diameter to fit in the bot-tom of the cartons (#1, Whatman, Kent, UK); fine nylon orcotton netting; tape; small elastic bands.
3. Mosquito aspirator.4. Absorbent cotton wool; 10% sugar solution in water; small-
sized Petri dish bottoms.5. CO2 bottle, CO2 distributor, and pad (InjectMatic, Geneva,
Switzerland).6. Injector Nanoject II (Drummond, Broomall, USA); capil-
laries (FT330B); a syringe (1 mL) and needle (G24) filledwith mineral oil; a paintbrush, forceps.
7. Micropipette puller (P-97, Sutter Instrument Company,Novato, USA).
2.4. Establishment ofTransgenicMosquitoesExpressing HairpinRNAs
1. Mosquito embryos.2. Injection buffer (5 mM KCl, 0.5 mM sodium phosphate,
pH 6.8), filter paper, a fine paintbrush, glass slides.3. Isotonic buffer (150 mM NaCl, 4.9 mM KCl, 10.7 mM,
Hepes, 2.4 mM CaCl2, pH 7.2) (see Note 2).4. Stereoscope MZ6 (Leica, Wetzlar, Germany) with cold light
source CLS150, or similar.5. Reverted microscope Diaphot or similar, with 5x, 10x, and
20x objectives; NT-88NE three-dimensional micromanip-ulator (Narishige, Tokyo, Japan) or similar; microinjectorEppendorf femtojet (Eppendorf AG, Hamburg, Germany)or similar; sterile femtotip capillaries (Eppendorf AG, Ham-burg, Germany); microloaders (Eppendorf AG, Hamburg,Germany).
6. Small Petri dishes (60 mm), 3MM Whatman filter paper(Whatman, Kent, UK), blotting paper.
7. Fluorescence microscope Nikon Eclipse TE200 (Nikon,Melville, USA) or similar; fluorescence filter sets (TexasRed/Cy3.5 and Blue GFP Bandpass).
8. Incubator at 28◦C, 70% humidity with a day/night periodof 12 h/12 h.
2.5. Analysis ofEfficiency of RNAiSilencing
1. Hand-held homogenizer, TRIzol reagent (Invitrogen,Cergy Pontoise, France), DEPC-treated water, sterile

RNAi and Mosquito 67
RNase-free labware (tips, microtubes), chloroform, iso-propanol, 75% ethanol, spectrophotometer.
2. SuperScript III reverse transcriptase and reaction buffer(Invitrogen, Cergy Pontoise, France) or similar, dNTPs,random hexamer primers, RNase OUT (Ambion, AppliedBiosystems, Foster City, CA, USA), PCR machine.
3. SybrGreen reaction mix, primers specific for the target gene(see Note 3).
4. Quantitative PCR machine (see Note 4).5. Polyacrylamide gel electrophoresis, running buffer, 6x pro-
tein loading buffer (350 mM Tris-HCl (pH 6.8); 10.28%SDS; 36% Glycerol; 5% ß-Mercaptoethanol; 0.012%Bromphenol blue), PageRulerTM Prestained Protein Lad-der (Fermentas International Inc, Burlington, Canada).
6. Membrane for protein transfer (Amersham Hybond-P, GEHealthcare UK Ltd, Buckinghamshire, England), wet pro-tein transfer unit (Bio-Rad Laboratories, Hercules, USA),transfer buffer.
7. Washing solution: Phosphate-buffered saline (PBS): pre-pare a 10x stock (130 mM NaCl; 7 mM, Na2HPO4; 3 mMNaH2PO4) and autoclave. For working solution, dilute onepart with nine parts of water. Blocking solution: PBS, 5%nonfat milk powder (Nestle S.A., Vevey, Switzerland)).
8. Secondary antibody solution: Use the recommended dilu-tion of anti-rabbit, anti-mouse, or anti-rat IgG antibodiesconjugated with horseradish peroxidase (HRP).
9. Amersham ECLTM Western Blotting Detection Reagents(GE Healthcare UK Ltd, Buckinghamshire, England).
10. X-ray film (Fuji Photo Film CO., Ltd, Tokyo, Japan),cassette.
3. Methods
In Anopheles mosquitoes, RNAi-mediated silencing can beachieved by two different methods: (a) injecting double-strandedRNA (dsRNA) directly into the body cavity of adult mosquitoes(2) (Fig. 5.1A); and (b) expressing dsRNA in situ from a sta-bly integrated transgene (4, 5) (Fig. 5.1B). The method ofchoice often depends on the application. Direct injection ofdsRNA permits a fast assessment of the function of the targetgene at a selected developmental stage, allowing rapid medium-scale screens. The relatively high number of mosquitoes neededfor injections and the transient nature of silencing of somegenes are among the most common limitations of this method.

68 Catteruccia and Levashina
The generation of transgenic lines expressing stable RNAi trans-genes is more labor intensive; however, it provides an inex-haustible supply of mutant mosquitoes for in-depth phenotypicaland biochemical analyses, and allows the time and tissue-specificknockdown of the target genes through the use of appropriatepromoters.
Direct injection of dsRNA includes several steps: (a) a candi-date gene is selected; (b) the optimal target sequence is clonedinto an appropriate vector for dsRNA synthesis; (c) dsRNA isinjected into adult mosquitoes and the efficiency of gene silenc-ing is examined 1–4 days after injection. In general, the wholeprocess, from the selection of a gene of interest to elucida-tion of its function in the particular biological process, may beachieved in 1 month. Understandably, establishment of transgenicmosquitoes requires longer periods before any functional tests canbe performed. This includes the sometimes delicate cloning intothe piggyBac expression vectors; injections of a large number ofembryos; efficient crossing methods to obtain a sufficiently largeG1 progeny; screening of G1 individuals, normally at the larvalstage; identification of positive, transgenic individuals; and theestablishment of transgenic lines. Initial functional analysis can beperformed with heterozygous lines, provided a screening is car-ried out to ensure the transgenic origin of the individuals selectedfor the experiments. In all, it might take 2–3 months from theidentification of the gene of interest to the establishment of thetransgenic line(s).
3.1. dsRNA Synthesis 1. Clone a fragment of a gene of interest in pLL10(Fig. 5.1A). The optimal size of the fragment is deter-mined by the efficiency of the RNA synthesis reaction,and is between 100 and 1000 bp for the T7 MEGAscriptkit. To avoid off-target effects, it is important to designdsRNA constructs for at least two highly specific regions ofthe gene of interest. Potential gene cross-silencing can begauged using the DEQOR software (http://cluster-1.mpi-cbg.de/Deqor/deqor.html) (6).
2. Prepare DNA of the constructed plasmid (see Note 5).3. For the synthesis of sense and antisense ssRNAs, 2 ×
10 �g of plasmid are linearized separately with two dif-ferent restriction enzymes, one on each side of the insert,in 50 �L (Fig. 5.1A). Confirm that digestion is completeby loading 1 �L of the reaction on 1% agarose gel (seeNote 6).
4. Add 25 �L of proteinase K final solution and 4 �L of 10%SDS to each digest. Incubate at 50◦C for 30 min.
5. Add 80 �L of phenol/chloroform/isoamyl alcohol. Vortexand incubate 2 min at room temperature (RT). Centrifuge

RNAi and Mosquito 69
for 5 min at maximal speed and collect the aqueous phasein a fresh tube.
6. Add 80 �L of chloroform. Vortex and incubate for 2 minat RT. Centrifuge at maximal speed and collect aqueousphase in a fresh tube.
7. Add 56 �L of isopropanol, mix by inverting the tube, andincubate at 4◦C for 15 min. Centrifuge for 15 min at 4◦Cat maximal speed and discard supernatant.
8. Wash with 100 �L of 70% ethanol, centrifuge 5 min atmaximal speed, discard supernatant and allow the DNApellet to air dry on the bench.
9. Dissolve pellet in 20 �L of water. Check DNA qualityand concentration (should be around 0.5 �g/�L) on a 1%agarose gel. Linearized plasmids can be stored at –20◦C.
10. Thaw reagents of the T7 MEGAscript kit (Ambion,Applied Biosystems, Foster City, CA, USA). Keep ribonu-cleotides on ice, and transcription buffer at RT.
11. For each plasmid, add in order: (8–x) �L of water; 2 �Lof each NTP; 2 �L buffer; x �L linearized plasmid (1 �g),and 2 �L enzyme mix. If several reactions are assembledin parallel, prepare a master mix with all reagents exceptlinearized plasmids, aliquot calculated volume in each tube,then add plasmids. Incubate overnight at 37◦C (8–14 h).See Notes 7 and 8.
12. DNA template is then digested by adding 1 �L of DNaseI to each reaction. Incubate 15 min at 37◦C.
13. Purification of ssRNAs: To the incubation mix add 115 �Lof water and 15 �L of ammonium acetate stop solutionand mix thoroughly. Extract RNA with 150 �L of phe-nol/chloroform/isoamyl alcohol, followed by 150 �L ofchloroform (see Steps 5 and 6). Recover aqueous phase andtransfer it to a fresh tube.
14. Precipitate RNA by adding 150 �L of isopropanol, mixwell by inverting the tube and incubate 15 min at –20◦C.Centrifuge 15 min at 4◦C at maximal speed and discardsupernatant. Air dry pellet for a few minutes on the benchand dissolve it in 20 �L of water.
15. While samples are drying, boil water in a 1–3 L beaker cov-ered with aluminum foil.
16. Measure concentration of ssRNAs using a UV spectropho-tometer. Dilute 1 �L of each ssRNA in 9 �L of 10 mMTris buffer (pH 8). Take 1 �l of this dilution into 100 �lof the same 10 mM Tris buffer for measurement, and keepthe remaining 9 �l at –20◦C. To calculate the concentra-tion, use the following formula: Concentration of ssRNAin �g/�L = OD260 × dilution factor × 40/1000. Thedilution factor is 1000 in the example given.

70 Catteruccia and Levashina
17. Adjust concentration of sense and antisense ssRNAs to3 �g/�L each and mix equal volumes (the rest of the ssR-NAs can be stored at –20◦C or –80◦C). Close tubes tightlyand boil samples for 5 min in the beaker. Allow samples toslowly cool down to RT.
18. Check dsRNA quality on a 1.8% agarose gel. For this, dena-ture the ssRNA dilutions from Step 16 at 95◦C for 3 minand immediately cool on ice. Spin briefly. Run 1 �l of theseand 1 �l of dsRNA from Step 17 (in 5 �L of DNA load-ing buffer) on gel. A clear shift should be observed in themigration patterns of ssRNAs and dsRNA: dsRNA migratesslower than the corresponding ssRNAs.
19. dsRNA is quite resistant to multiple freezing/thawingcycles. Store dsRNA –20◦C or –80◦C.
3.2. dsRNA Injectioninto AdultMosquitoes
1. Mosquito breeding: See “Anopheles Culture” by M.Q.Benedict, CDC Atlanta, USA at the MR4 website(http://www2.ncid.cdc.gov/vector/vector.html).
2. Needles for injection: Pull glass capillaries using the needlepuller. Each capillary gives two needles in which elongatedtip is sealed.
3. Prepare mosquito pots. Cut a cross-shaped opening in theside of a pot and seal it with tape. Place a filter paper circleat the bottom of the pot; it will blot out excess of sugar ormosquito droppings. Stretch netting over the top of the potand secure with an elastic band.
4. Place around sixty 1–2-day-old female mosquitoes into thepot using an aspirator. Fill a small-sized Petri dish bottomwith a cotton pad soaked in 10% sugar solution and place iton the netting.
5. Break the tip of the glass capillary with forceps, so thatthe tip is rigid enough, but the opening not too large. Fillthe capillary with mineral oil using a syringe and a needle.Assemble the Nanoject injector and fill capillary with thedsRNA solution. Verify settings on the control block of theNanoject and set the desired injection volume and speed. Toanalyze one gene, we usually inject each mosquito with 69nL of dsRNA at the highest speed.
6. Immobilize mosquitoes in the pot by CO2 treatment andalign them with dorsal side up on the CO2 pad. Using theinjector and a brush, carefully inject dsRNA solution intothe dorsal plate of the mosquito thorax (see Notes 9 and10). During injections, limit exposure of mosquitoes to CO2using the pedal-controlled distributor (see Note 11).
7. After all mosquitoes are injected, gently place them back inpaper pots using a brush, stretch the netting, fix it with anelastic band, and place a sugar cotton pad on the top. Keep

RNAi and Mosquito 71
mosquitoes until further analyses in the humidified 28◦Cincubator (usually for 4 days). See Note 12
3.3. Design andCloning of the RNAiExpression Plasmid
1. Clone 300–800 bp sense and antisense sequences of thetarget gene in a tail-to-head fashion, under the control ofthe appropriate promoter, into an intermediate plasmid ofchoice. Insert the whole RNAi DNA cassette into the singleAsc I site of transformation vector pBac[3xP3-EGFPafm] orsimilar (Fig. 5.1B). See Note 13
3.4. Establishment ofTransgenic LinesExpressing HairpinRNAs
1. For standard techniques of mosquito breeding, see above.2. Blood feed 3–5-days-old female mosquitoes (approxi-
mately 100–150 per cage). Starve females for a few hoursprior to blood feeding by depriving them of sugar.
3. At 48–72 h post blood feeding, place an oviposition cup(60 mm Petri dish containing Whatman 3MM filter papersoaked in isotonic buffer) into the cage (see Note 14).
4. Collect embryos every 30 min, each time placing a newoviposition cup into the cage to allow females to lay moreembryos. After removing the cup containing the embryosfrom the cage, place it at RT to slow down developmentand hence hardening of the chorion.
5. Cut a piece of membrane and a piece of blotting paper witha razor blade at a 135◦ angle, as shown in Fig. 5.1B. Placethe membrane (top) and the blotting paper (bottom) ontoa glass slide, with the blotting paper slightly exposed, andmoisten them with isotonic buffer.
6. At 80–100 min after oviposition, when embryos havestarted to darken slightly, use a fine paint brush to align20–40 embryos on the glass slide against the moistenedblotting paper, with their posterior poles oriented towardsthe top of the glass slide, as shown in Fig. 5.1B. Allembryos must be oriented in the same direction. Removeexcess of liquid; however, always keep the membrane moistadding buffer from time to time to avoid embryo desicca-tion.
7. Transfer the embryos to the microscope for injection. Fillan Eppendorf femtotip glass needle with 2 �L of injectionmixture, using microloaders. Make sure the needle is openbefore injection, by checking for the presence of a littledrop at the tip of the needle after injection (see Note 15).
8. Inject the posterior part of the embryo, using an injectionpressure (pi) of 700–1000, and a counter pressure (pc) of300–500, depending on the needle. When injected suc-cessfully, a slight clearing of the embryo yolk should bevisible. Take care to remove the embryos that have notbeen injected, as these are the most likely to survive andtherefore their presence will increase the screening efforts(see Note 16).

72 Catteruccia and Levashina
9. After injection, place the slide directly onto a tray contain-ing water and larval food, placing strips of 3MM paperaround the side of the tray to avoid embryos getting dry.After 2–4 days, count the embryos that have hatched.
10. Separate females from males immediately after emergenceor by sexing them at the pupal stage in order to ensure theyare virgins (G0 generation). Cross G0 adults with wild-type(WT) individuals, placing 10–15 G0 females with 30–50WT males and 10–15 G0 males with 30–50 WT virginfemales in separate cages (Fig. 5.1B). Blood feed 4–6 daysafter the crosses have been set up to provide sufficient timefor mating, and collect G1 progeny. In order to providean estimate of fertility of the G0 individuals, females canbe forced to lay eggs individually in Petri dishes or in 50mL Falcon tubes in which the conical bottom part hasbeen cut off and replaced by a fine netting (to allow sugarfeeding through the use of cotton pads or paper soaked in5% sucrose solution), while the lid can function as a smalloviposition cup when filled with water. Repeat the feed-ings/egg collections a minimum of three times per cross,especially with the crosses involving G0 males, in order toincrease the number of progeny screened.
11. Screen G1 progeny at the larval stage with the appropri-ate fluorescence filter, separate transgenic individuals fromnegative ones and backcross them to WT individuals of theopposite sex to propagate the line (Fig. 5.1B).
12. Sequence some individuals from each transgenic line toensure the integrity of the RNAi cassette.
3.5. Analysis ofEfficiency of RNAiSilencing at theTranscriptional Level
1. Collect 10–15 mosquitoes from the control and experimen-tal groups at different time points after dsRNA injectionsor at the desired developmental stage in the case of trans-genic individuals (see Note 17), and extract total RNA usingTRIzol reagent or equivalent according to the manufac-turer’s instructions. Measure the concentration of the RNAsolution.
2. Convert 2 �g of total RNA into cDNA using SuperScriptreverse transcriptase or similar as recommended by the man-ufacturer (see Note 18).
3. Perform quantitative polymerase chain reaction (q-PCR)using primers for the gene of interest and SybrGreen PCRmaster mix. Compare levels of the target gene expressionin the control and experimental mosquitoes (Fig. 5.1C)(see Note 19).
3.6. Analysis ofEfficiency of RNAiSilencing at theProtein Level
1. Immunoblotting can be performed on hemolymph extractsor on other relevant tissues (Fig. 5.1C). For hemolymphcollection, clip the proboscis of 10 mosquitoes and collect

RNAi and Mosquito 73
clear drops of blood directly into a 6x protein-loading buffer.As an example, for total tissue extracts, grind five mosquitoesin 250 �L of protein extraction buffer, centrifuge the sam-ple at 4◦C at 3,000 rpm to clear the extract from remainingtissues, and mix 5 �L of the cleared sample with 5 �L of the6x protein loading buffer (see Note 20).
2. Run protein extracts on SDS-PAGE using an appropriatepolyacrylamide concentration until the loading buffer dyereaches the bottom of the gel.
3. Transfer proteins from the gel to a membrane accordingthe instructions provided with the protein transfer unit, andincubate the membrane with the primary antibody againstthe protein of interest.
4. Detect the primary antibody using a secondary HRP-conjugated antibody according to general protocols, anddevelop the membrane using ECLTM Western BlottingDetection Reagents according to the manufacturer’s instruc-tions.
5. Wrap the wet membrane in plastic and expose it on an X-rayfilm for 30 s. Adjust the exposure time according to thestrength of the signal.
4. Notes
1. MR4 (Malaria Research and Reference Reagent Resource)stores and provides reagents to the malaria research com-munity; see http://www.malaria.mr4.org/.
2. Solutions are stored at RT, unless otherwise stated.3. The choice of the reaction mix depends on the q-PCR
machine; in our experience, testing a number of primerconcentrations greatly improves efficiency.
4. Similar results are obtained with different brands of q-PCRmachines.
5. Sequencing of an insert cloned in pLL10 can be done usinguniversal M13 forward and reverse primers.
6. All plasmid DNA should be digested as RNA polymerasesare very processive and will generate long heterogeneoustranscripts from circular plasmids.
7. When transcription is optimal, the reaction at the end israther viscous.
8. Sense and antisense ssRNAs can be produced in a singlereaction, e.g., from a PCR fragment that was amplifiedwith primers bearing T7 promoters. However this does notensure that both strands are synthesized with the same effi-ciency. We therefore prefer to prepare sense and antisense

74 Catteruccia and Levashina
ssRNAs separately and measure their respective concentra-tions before annealing, to make sure equal quantities ofboth strands are mixed and to obtain reproducible quan-tities of dsRNA.
9. The maximum volume that can be injected at once is69 nL. To inject larger volumes, repeated injections (upto four) can be performed.
10. With one filled needle, about 60 mosquitoes can beinjected with 69 nL each.
11. Excess of CO2 treatment is toxic to mosquitoes.12. Humidity improves survival of injected mosquitoes. Make
sure to place mosquitoes into a humidified incubator orchamber immediately after injection.
13. To facilitate cloning of the sense and antisense invertedrepeats in E. coli, it may be necessary to insert a small linkerregion or an intron between them (5).
14. In the case of Anopheles stephensi mosquitoes, it is advis-able to soften their chorion before injection to facilitatethe injection procedure. To this end, embryos are laid ina 0.1 mM p-nitrophenyl p ′-guanidinobenzoate (pNpGB)(Sigma-Aldrich, St. Louis, USA) solution, dissolved in iso-tonic buffer, and kept there until injection (7).
15. Many laboratories prefer to pull their own capillaries anduse quartz needles for the injection procedure (8).
16. During a set of injections, it is likely that the needle will getclogged due to cytoplasm uptake. It may then be necessaryto use the “Clean” function on the Femtojet (reaching highpressure values) to try to unclog the needle, and in somecases the same function may be used for the actual injectionprocedure.
17. Collected samples can be kept at –80◦C for several weeksuntil further use.
18. To obtain sufficient amounts of cDNA the reaction volumecan be scaled up to 100 �L.
19. Not all genes show significant differences at the transcrip-tional level. In some instances (e.g., Cactus) reduction of20% in the transcriptional level is sufficient to trigger aprominent phenotype (9).
20. Do not store the remaining samples, as protein extracts arenot stable and rapidly degrade.
Acknowledgments
The authors first developed these methodologies while work-ing at the EMBL in the group of Professor Fotis C. Kafatos(dsRNA injections) and in the laboratory of Professor Andrea

RNAi and Mosquito 75
Crisanti at Imperial College London (transgenesis). They fur-ther acknowledge members of the London and Strasbourg labo-ratories for constructive discussions. This work was supported bygrants from CNRS, Inserm, Wellcome Trust, BBSRC, Schlum-berger Foundation For Education and Research (FSER), and bythe 6th European Commission Programme “Networks of Excel-lence” BioMalPar. F.C. is a MRC Career Development fellow.E.A.L. is an International Scholar of the Howard Hughes Medi-cal Institute.
References
1. van Dijk, M. R., Waters, A. P., andJanse, C. J. (1995) Stable transfection ofmalaria parasite blood stages Science 268,1358–1362.
2. Blandin, S., Moita, L. F., Kocher, T., Wilm,M., Kafatos, F. C., and Levashina, E. A.(2002) Reverse genetics in the mosquitoAnopheles gambiae: targeted disruption of theDefensin gene EMBO Rep 3, 852–856.
3. Handler, A. M., and Harrell, R. A.,2nd (1999) Germline transformation ofDrosophila melanogaster with the piggy-Bac transposon vector Insect Mol Biol 8,449–457.
4. Brown, A. E., Bugeon, L., Crisanti, A., andCatteruccia, F.(2003) Stable and heritablegene silencing in the malaria vector Anophelesstephensi Nucleic Acids Res 31, e85.
5. Brown, A. E., Crisanti, A., and Catteruc-cia, F.(2003) Comparative analysis of DNAvectors at mediating RNAi in Anopheles
mosquito cells and larvae J Exp Biol 206,1817–1823.
6. Henschel, A., Buchholz, F., and Habermann,B.(2004) DEQOR: a web-based tool for thedesign and quality control of siRNAs NucleicAcids Res 32, W113–W120.
7. Catteruccia, F., Nolan, T., Loukeris, T. G.,Blass, C., Savakis, C., Kafatos, F. C., andCrisanti, A.(2000) Stable germline transfor-mation of the malaria mosquito Anophelesstephensi Nature 405, 959–962.
8. Lobo, N. F., Clayton, J. R., Fraser, M. J.,Kafatos, F. C., and Collins, F. H.(2006)High efficiency germ-line transformation ofmosquitoes Nat Protoc 1, 1312–1317.
9. Frolet, C., Thoma, M., Blandin, S., Hoff-mann, J. A., and Levashina, E. A. (2006)Boosting NF-kappaB-dependent basalimmunity of Anopheles gambiae aborts devel-opment of Plasmodium berghei. Immunity25, 677–685.

Chapter 6
RNAi Using a Chitosan/siRNA Nanoparticle System: In Vitroand In Vivo Applications
Morten Østergaard Andersen, Kenneth Alan Howard,, and Jørgen Kjems
Abstract
Delivery is a key issue in development of clinically relevant RNAi therapeutics. Polymeric nanoparticlesformed by self-assembly of polycations with siRNA can be used for extracellular delivery, cellular uptakeand intracellular trafficking as a strategy to improve the therapeutic potential of siRNA. This chapterdescribes a chitosan-based nanoparticle system for in vitro and in vivo transfection of siRNA into cells.The method exploits the mucoadhesive and mucopermeable properties of this cationic polysaccharideto deliver siRNA across mucosal epithelium and provides a platform for targeting human diseases withRNAi therapeutics.
Key words: siRNA, Chitosan, Nanoparticles, Macrophages, Nasal Delivery, Intraperitoneal Deliv-ery, TNF�, Freeze Drying.
1. Introduction
RNA interference (RNAi) has proven to be an effective methodto knockdown expression of individual genes by the action ofdouble-stranded RNA (1, 2) adding to renewed optimism thatit will be possible in the foreseeable future to use gene inhibitorymedicine to treat human disease. The most prominent obstacle isdelivery of the large siRNA molecule into diseased cells of thepatient. Polycationic polymer-based nanoparticle (or polyplex)systems used for site-specific delivery, cellular uptake and intracel-lular trafficking of plasmid DNA (3, 4) can be adopted to improvethe therapeutic potential of siRNA. This chapter describes achitosan-based nanoparticle system for in vitro and in vivo
John F. Reidhaar-Olson and Cristina M. Rondinone (eds.), Therapeutic Applications of RNAi: Methods and Protocols, vol. 555© Humana Press, a part of Springer Science+Business Media, LLC 2009DOI 10.1007/978-1-60327-295-7 6 Springerprotocols.com
77

78 Andersen, Howard, and Kjems
silencing applications (5, 6). The mucoadhesive (7) and mucoper-meable (8) properties of this cationic polysaccharide are exploitedfor siRNA delivery across mucosal epithelium as an approachto target diseases of the mucosa and overcome serum-inducedbreakdown and first-pass clearance associated with intravenousadministration of nanoparticles. Furthermore, chitosan-mediatedtransfection by a mannose-like lectin receptor (9) interaction facil-itates delivery into macrophages and silencing of cytokines suchas tumour necrosis factor alpha (TNF�) that are involved ininflammatory and infectious diseases. Intraperitoneal administra-tion into a serum-free macrophage-rich environment can be usedas a strategy to utilize this property for in vivo applications(10).
2. Materials
2.1. NanoparticlePreparation, Storageand Drying
1. 60% sucrose solution.2. Filter (0.2 �m) (Sartorius, Goettingen, Germany).3. siRNA, including fluorescently labelled siRNA (Dharmacon,
Co, USA, DNA Technology, Aarhus, Denmark and Inte-grated DNA Technologies (IDT), IA, USA).
4. Solubilization buffer: 0.2 M NaAc, pH 4.3. Filter through a0.2-�m filter, make with nuclease-free water.
5. Nanoparticle Formation Buffer: 0.2 M NaAc, pH 5.5 pHadjusted with 1 M NaOH, make with nuclease-free water.
6. Chitosan Solution: <5 mg/ml Chitosan (Bioneer,Hørsholm, Denmark or Novomatrix, Sandvika, Norway)in 0.2 M NaAc, pH 5.5. Dissolve chitosan in solubilizationbuffer overnight, filter through a 0.2-�m filter and adjustpH to 5.5 with 1 M NaOH (see Notes 1 and 2).
2.2. Transfection andReverse Transfection
1. Complete media: RPMI Medium (RPMI) supple-mented with 10% fetal bovine serum and 1% peni-cillin/streptomycin. Add 0.5% G418 if cells are expressing aplasmid with a neomycin resistance gene.
2. Phosphate-buffered saline (PBS): Prepare 10X stock with1.37 M NaCl, 27 mM KCl, 100 mM Na2HPO4, 18 mMKH2PO4. Adjust to pH 7.4 with 1 M HCl and autoclavebefore storage at room temperature.
2.3. Flow Cytometry 1. PBS (prepared as described above).2. Trypsin-EDTA.3. 1% Paraformaldehyde in PBS.
2.4. Cytotoxicity 1. CellTiter 96 R© AQueous One Solution Cell ProliferationAssay (Promega, Wisconsin, USA).

Chitosan/siRNA Nanoparticles 79
2.5. Tumour NecrosisFactor Alpha (TNF�)ELISA
1. Goat anti-mouse TNF� capture antibody, recombinantmurine TNF�, goat anti-mouse TNF� detection anti-body, streptavidin-horseradish peroxidase, tetramethylbenzi-dine (R&D Systems).
2. Lipopolysaccharide (LPS) (InvivoGen, Ca, USA).3. Bovine serum albumin (BSA)4. Coating buffer: 15 mM Na2CO3, 35 mM NaHCO3, 0.02%
NaN3 (pH 9.6).5. Blocking buffer: PBS with 5% sucrose and 0.05% NaN3
(pH 7.4).
2.6. Extraction andIsolation of PrimaryMacrophages
1. MEM Media.
2.7. Pulmonary GeneSilencing by NasalAdministration
1. Isoflurane.2. Zoletilmix/Torbugesic mix: 0.5 ml zoletilmix, 1.3 ml ster-
ile water, 0.7 ml torbugesic (diluted prior 1:100 in sterilewater), dosage is ∼0.14 ml for an animal weighing 22 g.
3. DAPI (Sigma, St. Louis, MO, USA).4. VivaSpin20 centrifugal concentrators (MW cut-off 100 kDa)
(Vivascience, USA)
2.8. IntraperitonealTransfection ofPeritonealMacrophages
1. Syringes (1 ml) (Terumo, NJ, USA).2. Needles 25G, 0.5 × 25 mm (BD, NJ, USA).
3. Methods
3.1. NanoparticlePreparation
The formation of interpolyelectrolyte complexes (nanoparticles orpolyplexes) occurs between anionic siRNA duplexes and cationicchitosan polymer (5, 6).
1. Dilute chitosan solution to 0.8 mg/ml with particle forma-tion buffer.
2. Stir 1 ml in a tube (internal diameter = 13 mm, internallength = 96 mm) containing a small magnetic fly (length =7.5 mm, width/height = 1.5 mm).
3. Add 20 �l of 100 �M siRNA in distilled water slowly inone slow continual action from a pipette tip that has beeninserted into the liquid while stirring at medium speed ona bench stirrer (see Note 3). Using the aforementionedamounts of chitosan (84%DD) and siRNA will result in aN:P ratio of ∼63 (see Note 4).
4. Leave the solution to stir for an hour after which it is readyfor use.

80 Andersen, Howard, and Kjems
3.2. Storage andDrying
After nanoparticle formation it is possible to store the particle at4◦C for 1 week. But in that case, the particle solution should bemixed gently prior to use.
If an aqueous lyoprotectant such as sucrose is added to thenanoparticles at a final concentration of 5% or more (e.g. byadding 200 �l 60% sucrose to a 1 ml particle solution) the parti-cles can be frozen and thawed later without loss of activity; theycan also be vacuum dried and freeze dried (11). If a lyoprotec-tant is not added the nanoparticles cannot be dried nor frozenwithout a complete loss of activity. If freeze drying is desired theparticles are frozen to –20◦C and freeze dried at –20◦C and under200 mT (Duradry/Durastop freezer dryer system, FTS Systems,NY, USA). The nanoparticles can be vacuum dried without freez-ing but a small loss (10–20%) in transfection efficiency will thenbe observed. After drying the nanoparticle/sucrose solution itshould become transparent, flat and highly viscous. After drying,the nanoparticles are best stored dry, in the dark at 4◦C or at–20◦C for optimal storage, but the nanoparticles are still capableof 40% knockdown after 2 weeks, if stored at 25◦C.
3.3. Transfection 1. Seed the cells the day before transfection at a concentrationof 25,000–55,000 cells/cm2 in complete media (500 �l for24-well plates, 100 �l for 96-well plates).
2. On the day of transfection remove the media and add freshcomplete media. The volume of complete media addedshould be 250 �l for 24-well plates and 100 �l for 96-wellplates minus the volume of transfection agent added.
3. Add the transfection agent to give a 50 nM siRNA concen-tration in the wells (for batch of nanoparticles made with20 �l 100 �M siRNA in 1 ml 0.8 mg/ml chitosan oneshould add 6.4 �l nanoparticle solution to 244 �l media)(see Note 5).
4. Remove the transfection media from the cells after at least4 h and within 24 h (see Note 6).
5. Wash the wells with PBS (500 �l or more for 24-well plates,100 �l or more for 96-well plates).
6. Replace the PBS with fresh complete media (500 �l or morefor 24-well plates, 100 �l or more for 96-well plates).
3.4. ReverseTransfection
It is an efficient gene silencing method with potential applicationsfor high throughput gene screening tool and longer shelf-life use(11).
1. Add complete media containing 25,000–100,000 cells/cm2
to the wells. The amount of nanoparticles dried in eachwell and the volume of media added should be set sothe final concentration in each well equals 50 nM (e.g.adding 250 �l media with 100,000 cells to each well on

Chitosan/siRNA Nanoparticles 81
a freeze dried 24-well plate where in each well was added7.6 �l chitosan/siRNA/sucrose solution (composed of 1 ml0.8 mg/ml chitosan, 20 �l 100 �M siRNA and 200 �l 60%sucrose)).
2. Mix the wells gently.3. After 24 h remove the media and replace it with new growth
media (500 �l or more for 24-well plates, 100 �l or morefor 96-well plates) (see Note 7).
3.5. Flow Cytometry To determine and quantify the transfection and knockdown effi-ciency in a cell line flow cytometry can be performed; this eitherrequires that the cell line expresses a fluorescent protein (suchas enhanced green fluorescent protein (eGFP) endogenously, orthat the cell line has been transfected with a plasmid expressingsuch a protein prior to or at the same time as the knockdownstudy (known as a co-transfection, in which case a plasmid trans-fection agent is also needed). Alternatively the cells can be trans-fected with siRNAs that have been fluorescently labelled with dyessuch as Cy3 or Cy5 (Dharmacon, Co, USA). In this case flowcytometry measures the cellular binding and uptake of the siRNAmolecules.
To perform the flow cytometry the transfected cells are typi-cally harvested after 48 or 72 h, suspension cells can be harvesteddirectly (jump to Step 5), adherent cells are harvested using thefollowing protocol.
1. Remove media.2. Wash each well with 500 �l PBS (24-well plates) or 100 �l
PBS (96-well plates).3. Add 250 �l trypsin-EDTA and incubate for ∼5 min at 37◦C.4. Remove trypsin-EDTA and add of 500 �l complete media
(for 24-well plates) or 100 �l complete media (for 96-wellplates).
5. Transfer the media to 1.5-ml tubes and centrifuge for 5 minat 1500 rpm.
6. Remove media and wash the cells with 500 �l PBS.7. Centrifuge for 5 min at 1500 rpm.8. Remove PBS and add 500 �l PBS with 1% paraformaldehyde
or formaldehyde.The cells are then stored at 4◦C in the dark between 1 and
7 days before flow cytometry is performed. Flow cytometry iscarried out by first selecting the cell population in a dot plot ofside scatter vs. forward scatter and then measuring the geometricmean of the fluorescence in a histogram of this cell population.The transfection efficiency of the chitosan/siRNA nanoparticlescan then be calculated as 1 minus the geographical mean ofmatch-transfected cells divided by the geographical mean ofmismatch-transfected cells (see Note 8).

82 Andersen, Howard, and Kjems
3.6. Cytotoxicity To investigate whether the chitosan/siRNA nanoparticles inducetoxicity in a specific cell line, a cytotoxicity assay can be carriedout.
1. After 48 h of transfection, remove media and add 100 �lcomplete media (96-well plate).
2. Add 20 �l CellTiter 96 R© AQueous One Solution Cell Pro-liferation Assay to wells containing cells and a “no cells”control.
3. Incubated the cell for 1.5 h at 37ºC and 5% CO2 (seeNote 9).
4. Read absorbance at 490 nm and 600 nm (see Note 10).The absorbance490 nm – absorbance600 nm is directly correlated
to the viability of the cells, and the toxicity of the particles can beinferred by comparing this value for transfected cells and non-transfected control cells.
3.7. TNF� ELISA The determination of TNF� secretion can be used as a mea-sure of downregulation of inflammatory responses in primarymacrophages.
1. Harvest the cells after transfection is ended as if for flowcytometry.
2. Add 100 �l of the cell suspension to each well on a 96-wellplate for ELISA and another 100 �l cell suspension to a96-well plate for a cytotoxicity assay.
3. Add 10 �l of 1 mg/ml LPS to the wells and incubate theplate at 37ºC and 5% CO2 for 5 h.
4. Meanwhile coat maxisorp plates overnight at 25ºC with100 �l of goat anti-mouse TNF� capture antibody in aconcentration of 2 mg/ml in coating buffer.
5. Block the wells for 1 h with 300 �l of 1% BSA in a blockingbuffer.
6. Add 100 �l of supernatants from the cells incubated withLPS to the maxisorp.
7. Add control recombinant murine TNF� to the coated max-isorp plate wells (100 �l in each well).
8. Incubated overnight at 4ºC.9. Subsequently, incubate the wells 25ºC for 2 h with 100 �l
biotinylated goat anti-mouse TNF� detection antibody(150 ng/ml).
10. Dilute and add streptavidin-horseradish peroxidase 1:200in TBS with 0.1% BSA.
11. Incubate the mixture for 20 min.12. Add H2O2 and tetramethylbenzidine for colour develop-
ment.13. Incubate the plates in the dark for 10–20 min.14. Stop the reaction by addition of 50 �l 5% H2SO4.15. Read the absorbance at 450 and 570 nm; the latter wave-
length is used as a reference. Between each step the plates

Chitosan/siRNA Nanoparticles 83
are washed three times with PBS-0.05% Tween 20, pH7.4. As mentioned earlier the measured quantities of TNF�should be normalized to the viability of each sample.
3.8. Extraction andIsolation of PrimaryMacrophages
For evaluation of particle transfection and gene silencing in“difficult-to-silence” primary cells:
1. Kill adult mice by cervical dislocation.2. Inject 5 ml of MEM containing 20% FBS intraperitoneally
with a 25G needle.3. Agitate the abdomen gently while the peritoneum is
exposed and breached.4. Remove the medium using a syringe.5. Centrifuge the medium for 10 min at 2500 rpm.6. Resuspend the pellet resuspended in MEM containing 50%
FBS.7. Plate the suspension on a multiwell 12-well plate.8. Allow the macrophages to adhere for 2 h before medium
(containing non-adherent cells) is removed.9. Add fresh medium containing 5% penicillin/streptomycin
to the cells.10. After 40 h remove the medium: the macrophages are now
isolated and ready for transfection (same particle system20 �l 100 �m siRNA described earlier).
3.9. Pulmonary GeneSilencing by NasalAdministration
The route of administration is an important determinant for suc-cessful RNA-based silencing therapeutics. Local administrationto the mucosal surfaces lining the respiratory tract is an attrac-tive alternative to the intravenous route for the treatment of pul-monary diseases.
1. Anaesthetize the mice with isoflurane.2. Place the mice on their back and administer 30 �l particles
(made as above but with 250 �M siRNA, concentrate to1 mg/ml siRNA using VivaSpin centrifugal concentrator)intranasally (15 �l in each nostril) each day for 5 days (seeNote 11).
3. On day 6 the mice are anaesthetized with an injection of0.14 ml zoletilmix/torbugesic mix.
4. Perfusion fixate manually with 4% formaldehydephosphate-buffered solution.
5. Harvest lungs.6. Paraffin-embed the lungs.7. Cut exhaustively in 3-�m sections.8. Sample every 100th section together with the next.9. Transfer sections into DAPI solution for counterstaining.
10. Wet mount on a Super Frost slide.11. Analyse the slides in a fluorescence microscope with
a UV/GFP filter, a 20x objective, a mounted digital
84 Andersen, Howard, and Kjems
camera and a motorized stage in conjunction with CASTsoftware.
12. Count the number of EGFP-expressing epithelial bronchialcells by a physical fractionator.
3.10. IntraperitonealTransfection andTNF� knockdown inPeritonealMacrophages
Investigation of transfection and gene silencing in systemicmacrophages by the intraperitoneal injection. The intraperitonealroute facilitates uptake of particles into systemic macrophages ina serum-free environment.
1. Inject 200 �l of particles containing fluorescently labelledsiRNA (N:P ∼ 63 prepared as above) into the peritonealcavity of mice with a 25G needle.
2. Massage the abdominal area to facilitate the distribution ofthe particles within the peritoneum.
3. Peritoneal macrophages are isolated, according to theprocedure described above, 2 h post-injection and platedin 96-well plates or mounted with DAPI nuclear stain ontoglass-bottom dishes (MatTek Corp. Ma, USA) or glass cov-erslips in 12-well plates.
4. Uptake of fluorescently labelled siRNA is monitoredby a Zeiss semi-confocal epifluorescence microscope (orequivalent).
5. TNF� levels in the harvested supernatants of LPS-stimulatedmacrophages are measured 24 h post-injection according tothe above protocol.
4. Notes
1. If a higher concentration of chitosan or a buffer with ahigher pH is used when dissolving the chitosan it has atendency to dissolve incompletely.
2. We suggest using a chitosan with a molecular weight over100 kDa and with a degree of deacetylation (DD) of atleast 80%. DD refers to percentage of free amino groups(cationic charges) on the polymer chain after the process ofdeacetylation of chitin.
3. It is very important that the whole volume of the liquidis being stirred. The volume of the reagents can also bescaled down to 500 �l or 250 �l; in this case, it is, how-ever, even more important to ensure that the liquid is beingstirred during the entire process and that continual addi-tion of siRNA is not compromised by hitting the flea withthe pipette tip as this can affect particle formation.
4. The N:P ratio refers to the ratio of positive charges onthe chitosan amines to the negative charges on the phos-phates in the siRNA backbone. To calculate N:P ratios

Chitosan/siRNA Nanoparticles 85
a mass-per-charge of 325 Da was used for RNA andmass-per-charge of 168 Da was used for chitosan (at84% deacetylation). The concentration of the chitosan andsiRNA can be scaled down and the N:P ratio changedslightly to 1 ml 0.2 mg/ml chitosan and 20 �l 20 �MsiRNA; however, particles produced by the aforemen-tioned concentrations show high transfection and silencingefficiency.
5. The complete media can be mixed with the particles priorto addition to the wells rather than adding the media firstand then the particles separately to each well.
6. The transfection efficiency and toxicity of the particlesappear to vary between different cell types; we suggest lim-iting the transfection time to 4 h if toxicity is observed.
7. The 24-h transfection period is necessary as the cells needtime to attach before the media is changed.
8. If flow cytometry is to be carried out on the same day ascell harvesting, the fixation agent should not be included.Instead it is a good idea to include 2% serum in the PBS tostabilize the cells until and during the flow cytometry. Storethe fixed cells in darkness at 4◦C. It is always best to includetwo additional controls containing non-transfected fluores-cent and non-fluorescent cells. The geographical mean ofthe non-fluorescent cells should then be subtracted fromthe geographical means of the other samples before fur-ther calculations are carried out. Non-specific knockdowninduced by the particles can be inferred by comparingthe geographical mean of the mismatch-transfected cellswith that of the non-transfected control cells. If using flu-orescently labelled siRNA it is recommended to confirmthat the siRNA is taken up by the cells using fluorescentmicroscopy.
9. Increasing the incubation time will increase absorptiontime and may be necessary if few cell are present.
10. Other wavelengths can be used but will reduce the sensi-tivity.
11. Higher N:P with more excess chitosan at this concentrationcan be used to improve mucoadhesion and mucoperme-ation in vivo properties but should be tested in an epithelialcell line as the N:P ratio has been shown to affect silencingefficiency (3).
References
1. Fire, A., et al. (1998). Potent and spe-cific genetic interference by double-strandedRNA in Caenorhabditis elegans. Nature 391,806–811.
2. Elbashir, S. M., et al. (2001). Duplexes of 21-nucleotide RNAs mediate RNA interferencein cultured mammalian cells. Nature 411,494–498.

86 Andersen, Howard, and Kjems
3. Pouton, C. W. and Seymour, L. W. (2001)Key issues in non-viral gene delivery. Adv.Drug Deliv. Rev. 46, 187–203.
4. Elouahabi, A. and Ruysschaert, J. M. (2005)Formation and intracellular trafficking oflipoplexes and polyplexes. Mol. Ther. 11,336–347.
5. Howard, K. A., et al. (2006). RNA Interfer-ence in vitro and in vivo using a novel chi-tosan/siRNA nanoparticle system. Mol. Ther.14, 476–484.
6. Liu, X., et al. (2007). The influence ofpolymeric properties on chitosan/siRNAnanoparticle formulation and gene silencing.Biomaterials 28, 1280–1288.
7. Soane, R. J., et al. (1999). Evaluation of theclearance characteristics of bioadhesive sys-tems in humans. Int. J. Pharm. 178, 55–65.
8. Artursson, P., Lindmark, T., Davis, S. S.and Illum, L. (1994). Effect of chitosan onthe permeability of monolayers of intesti-nal epithelial cells (Caco-2). Pharm. Res. 11,1358–1361.
9. Feng, J., Zhao, L. and Yu, Q.(2004). Receptor-mediated stimulatoryeffect of oligochitosan in macrophages.Biochem. Biophys. Res. Commun. 317,414–420.
10. Howard, K. A., et al. (2009). Knock-down in peritoneal macrophages asan anti-inflammatory treatement in amurine arthritic model. Mol. Ther. 17,162–168.
11. Andersen, M. O., et al. (2008). Delivery ofsiRNA from lyophilized polymeric surfaces.Biomaterials 29, 506–512.

Chapter 7
Lentiviral and Adeno-Associated Vector-Based Therapy forMotor Neuron Disease Through RNAi
Chris Towne and Patrick Aebischer
Abstract
RNAi holds promise for neurodegenerative disorders caused by gain-of-function mutations. We andothers have demonstrated proof-of-principle for viral-mediated RNAi in a mouse model of motor neurondisease. Lentivirus and adeno-associated virus have been used to knockdown levels of mutated superoxidedismutase 1 (SOD1) in the G93A SOD1 mouse model of familial amyotrophic lateral sclerosis (fALS)to result in beneficial therapeutic outcomes. This chapter describes the design, production, and titrationof lentivirus and adeno-associated virus capable of mediating SOD1 knockdown in vivo. The delivery ofthe virus to the spinal cord directly, through intraspinal injection, or indirectly, through intramuscularinjection, is also described, as well as the methods pertaining to the analysis of spinal cord transduction,SOD1 silencing, and determination of motor neuron protection.
Key words: Amyotrophic lateral sclerosis, superoxide dismutase (SOD1), lentivirus, adeno-associated virus (AAV), RNA interference (RNAi), gene therapy, G93A SOD1.
1. Introduction
1.1. AmyotrophicLateral Sclerosis
Amyotrophic lateral sclerosis (ALS) is a devastating neurodegen-erative disorder that results from the progressive and irreversibledegeneration of motor neurons in the spinal cord, brain stem,and cerebral cortex. This loss of motor neurons leads to grad-ual muscle weakness and atrophy, with death often occurring2–5 years after diagnosis as a result of respiratory failure. Tenpercent of ALS cases are familial with one-fifth of those beingcaused by mutations in the gene encoding for superoxide dis-mutase 1 (SOD1). Current evidence supports that disease-linked
John F. Reidhaar-Olson and Cristina M. Rondinone (eds.), Therapeutic Applications of RNAi: Methods and Protocols, vol. 555© Humana Press, a part of Springer Science+Business Media, LLC 2009DOI 10.1007/978-1-60327-295-7 7 Springerprotocols.com
87

88 Towne and Aebischer
mutations confer SOD1 a toxic gain-of-function, independent ofits enzymatic activity, which triggers motor neuron death througha still unclear mechanism (1). In light of this direct toxic effect,reduction of mutated SOD1 protein levels via RNA interference(RNAi) is an attractive therapeutic approach as it targets the causeof the disease regardless of the specific pathogenic mechanismresponsible for motor neuron death.
1.2. Viral-MediatedRNAi Against SOD1
RNAi is an innate gene silencing mechanism that utilizes smallsingle- or double-stranded RNA (dsRNA) to promote the degra-dation of specific mRNA targets, effectively reducing the levelsof the corresponding protein (2). Saito et al. (3) have demon-strated the potential for RNAi as a therapeutic approach forfamilial amyotrophic lateral sclerosis (fALS). By crossing trans-genic mice expressing dsRNA against SOD1 with the G93ASOD1 mouse model, the development of the ALS-like pheno-type was completely prevented with the double transgenic micehaving normal spinal cord histology and behaving as wild-typecontrols.
The current challenge facing RNAi-based therapy for fALSis the delivery of the dsRNA silencing instructions in vivo. Twostrategies exist towards this goal. The first approach is to syn-thesize dsRNA in vitro prior to their in vivo delivery. An exam-ple of this is to deliver the dsRNA or antisense oligonucleotidesdirectly to the cerebrospinal fluid (CSF) through ventricular infu-sion. Indeed, osmotic pumps have been used to deliver anti-sense oligonucleotides against SOD1 into the ventricles of G93ASOD1 rats leading to silencing of SOD1 within the spinal cordand subsequent therapeutic gains (4). The limiting factor of thisintervention, however, is the continual synthesis and delivery ofoligonucleotides that would be required to maintain this thera-peutic silencing throughout the lifetime of the patient. The sec-ond approach, that overcomes this hurdle, is to provide cells withthe DNA templates that they may use to indefinitely transcribeshort hairpin RNAs (shRNAs) (5). shRNA consist of two comple-mentary RNA strands linked by a hairpin loop that are processedinto dsRNA capable of mediating RNAi. Viral vectors can be usedto deliver these transgenic cassettes directly to the genome of cellsto result in stable and long-lasting expression of shRNA followinga single intervention. Three landmark studies have used recombi-nant viral vectors to deliver shRNAs to result in SOD1 knock-down and achieve therapeutic gain in the G93A mouse modelof ALS.
1.2.1. IntramuscularDelivery of LentivirusBased on EIAV intoNewborn SOD1 Mice
Ralph et al. (6) delivered lentivirus based on the equine infectiousanemia virus (EIAV) to multiple muscle groups of newborn G93ASOD1 mice. As EIAV is capable of efficient retrograde transport

Vector-Based RNAi for Motor Neuron Disease 89
from the muscle to the motor neuron soma, this technique facil-itated transduction and SOD1 silencing within motor neurons atmultiple levels of the spinal cord and brain stem. This resulted indelaying disease onset by 115% (and subsequently increased sur-vival age by 77%) although did not slow disease progression fromtime of onset.
1.2.2. IntraspinalDelivery ofVSV-G-PseudotypedLentivirus intoPresymptomatic SOD1Mice
Lentivirus pseudotyped with vesicular stomatitis virus G (VSV-G)were injected directly to the L3 and L4 lumbar spinal cord ofpresymptomatic 42-day-old G93A SOD1 mice (7). This silencedSOD1 in the motor neurons and glial cells of the ventral hornresulting in a delay of both disease onset and progression, as mea-sured by various electromyographical and behavioral outcomes,in the hindlimb muscles innervated by this region of spinal cord.The observation that this RNAi strategy was capable of retardingdisease progression concurs with current evidences that SOD1expression within glial cells is an important determinant of dis-ease progression (8).
1.2.3. IntramuscularDelivery of AAV Serotype2 into PresymptomaticSOD1 Mice
Miller et al. (9) also capitalized on viral retrograde transportto transduce motor neurons following intramuscular injection,albeit using adeno-associated virus (AAV) serotype 2. Presymp-tomatic 45-day-old G93A SOD1 mice were injected directly intothe lower hindlimb muscles with the vector to result in transduc-tion and silencing of SOD1 in lumbar-level motor neurons. Thisconferred behavioral improvement in the injected limbs as deter-mined by preservation of grip strength.
The present chapter will detail the experimental proceduresrequired to recapitulate the studies mentioned above. We willdescribe the design, production, and titration of both VSV-G-pseudotyped lentivirus used in the study by Raoul et al. (7) andAAV serotype 6 (AAV6), a vector that we have found to becapable of particularly efficient muscle-to-motor neuron retro-grade transport. Next, the intraspinal and intramuscular deliveryof these vectors to adult mice will be described, as well as theintramuscular injection to neonates. Finally, the methods requiredto analyze in vivo transduction, SOD1 silencing, and conferredneuroprotection will be provided.
2. Materials
2.1. Virus Production 1. pSIN-W-PGK: Lentivirus genomic plasmid.2. pCMV�R8.92: Packaging plasmid encoding viral genes in
trans.3. pMD.G: Plasmid encoding the VSV-G envelope.4. pRSV-Rev: Plasmid encoding the rev protein of HIV-1.5. pAAV-CMV-MCS: AAV genomic plasmid.6. pDF6: Packaging plasmid encoding for the AAV6 capsid.

90 Towne and Aebischer
7. AAV-293 cells (#240073, Stratagene, La Jolla, CA) and293T cells.
8. Six-well MultiwellTM Tissue Culture Plate ((#166508,Becton Dickinson, Frankin, NJ).
9. 500 cm2 NunclonTM� polystyrene dish (#166508, NalgNunc International, Rochester, NY).
10. Cell culture medium: Dulbecco’s Modified Eagle’sMedium (DMEM, Gibco BRL, Bethesda, MD) supple-mented with 10% fetal bovine serum (FBS, HyClone,Odgen, UT). Episerf (Gibco BRL).
11. Trypsinization medium: Hanks’ balanced salt solution(HBSS; red phenol 0.4 g/L KCl, 0.06 g/L KH2PO4,8 g/L NaCl, 0.35 g/L NaHCO3, 0.048 g/L Na2HPO4,1 g/L D-glucose) containing 0.05% trypsin and 0.53 mMEDTA.
12. Transfection reagents: 0.5 M CaCl2 (73.5 g CaCl2·2H2O;complete to 500 mL with H2O; store in aliquots at –20◦C)and 2x HBS (28 mL of 5 M NaCl, 11.9 g of HEPES, 750�L of 1 M Na2HPO4 in 400 mL H2O; adjust the pH to7.1 with NaOH and complete to 500 mL; store in aliquotsat –20◦C).
13. Ultracentrifugation of lentivirus: ultracentrifuge, SW28rotor, SW60 rotor, and polyallomer tubes (SW28 rotor,25 × 89 mm, SW60 rotor, 11 × 60 mm, Beckman Coulter,Fullerton, CA).
14. Centricon R© Plus-20 centrifuge filters (#UFC2BHK08,Millipore, Billerica, MA).
15. PBS/1% BSA: Add 5 g of bovine serum albumin (BSA,Sigma-Aldrich, St Louis, MO) to 500 mL pH 7.4phosphate-buffered saline (PBS) and pass through a 0.22-�m filter.
16. 1.6 mL Maxymum Recovery, Clear Microtubes (AxygenScientific, Union City, CA).
17. 4% paraformaldehyde (PFA): Add 40 g of paraformalde-hyde to 900 mL of PBS and heat at 60◦C (see Note 1). Adda few drops of 5 M NaOH to dissolve the paraformalde-hyde and allow to equilibrate to room temperature. Filterthe solution, adjust pH to 7.4, and complete to 1 L.
18. 5 mL Polystyrene Round-Bottom Tube with Cell-StrainerCap (#352235, Becton Dickinson).
2.2. AnimalExperiments
1. Anesthesia: Anesthesia system, O2 cylinder, induction cham-ber, surgical table with anesthesia mask, isoflurane.
2. Intraspinal injections: Small Animal Stereotaxic Instru-ment (Model 963 Ultra Precise, David Kopf Instruments,Tujunga, CA), Mouse Spinal Adaptor (#51690, Stoelt-ing, Wood Dale, IL), Mouse Transverse Clamps (#51695,Stoelting), Scalpel Handle No. 4 (#02-036-040, allgaierinstrumente GmbH, Tuttlingen, Germany), Scalpel Blades

Vector-Based RNAi for Motor Neuron Disease 91
(#02-040-021, allgaier instrumente GmbH), Adson Tis-sue Forceps (#08-265-120, allgaier instrumente GmbH),Derf Needle Holder (#20-116-125, allgaier instrumenteGmbH), Bulldog clamps (#18050-28, Fine Science ToolsGmbH, Heidelberg, Germany), Friedman-Pearson Rongeur(#16021-14, Fine Science Tools GmbH), self-regulatingheating pad (#21061-00, Fine Science Tools GmbH), 27Gneedle (Terumo R©, Leuven, Belgium), 70 mm × 34G(0.23×0.127) needle (Phymed, Paris, France), 50 mm ×26G (0.457×0.254) needle (Phymed), Viscotears R© Oph-thalmic Gel (Novartis, Basel, Switzerland), Microinjectionpump (CMA/100, CMA Microdialysis, Solna, Sweden),Polyethylene Tubing (0.38× 1.1 mm) (A-M Systems, Carls-borg, WA), 6-0 VicrylTM Suture (Ethicon, Norderstedt, Ger-many), Betadine R© standard solution (Mundipharma GmbH,Basel, Switzerland), electric shaver and 500 mg Paracetamoleffervescent tablets.
3. Intramuscular injections of adults: Hamilton 25 �L syringe(#702, Hamilton, Reno, NV), Scalpel Handle No. 4, ScalpelBlades, 6-0 VicrylTM Suture, Derf Needle Holder, AdsonTissue Forceps, Betadine R© standard solution, and electricshaver.
4. Intramuscular injections of neonates: 30G × 1 mmInsulin Needle (Becton Dickinson), Polyethylene Tubing(0.28×0.61 mm) (A-M Systems), and a Hamilton 10 �Lsyringe (#701, Hamilton).
2.3. Histology 1. Heparin (Liquemin, Roche, Basel, Switzerland).2. Spinal cord dissection: McPherson-Vannas spring scissors
(#52130-01, Stoelting), Friedman-Pearson Rongeur, TissueForceps, and blunt-dissection probe.
3. 25% sucrose: Dissolve 25 g of sucrose in 100 mL of PBS andpass through a 0.22-�m filter.
4. Cryosections: Peel-A-Way R© Disposable Embedding Molds(#18646A, Polysciences Inc, Warrington, PA), ShandonCryomatrixTM (#6769006, Thermo Electron Corporation,Pittsburgh, PA), goal polyclonal anti-GFP Ab (ABCAM,Cambridge, UK), rabbit polyclonal anti-GFP Ab (ABCAM),monoclonal anti-SOD1 Ab (clone SD-G6, Sigma-Aldrich),monoclonal anti-SOD1 Ab (clone G215-1, BD Pharmin-gen, Franklin, NJ), polyclonal goat anti-SOD1 Ab (sc-8636,Santa Cruz, Santa Cruz, CA), rabbit polyclonal anti-VAChTAb (Sigma-Aldrich).
5. Tris-buffered saline (TBS): Dissolve 12.11 g of Tris-base(MW= 121.14) and 8.76 g NaCl in 1 L of H2O adjustingthe pH to 7.6.
6. Paraffin sections: Cresyl Violet (Sigma-Aldrich), ToluidineBlue (Sigma-Aldrich), osmium tetroxide (Sigma-Aldrich),Leica Histomold (2×15 mm, Leica Microsystems), LeicaHistoresin Embedding Kit (#702218500, Leica Microsys-

92 Towne and Aebischer
tems, Heidelburg, Germany) containing 500 mL basic resinliquid, 5 g activator powder, and 40 mL hardener.
7. Differentiation buffer for Cresyl Violet staining: Mix onevolume 2.72% sodium acetate (2.72 g/100 mL) with fourvolumes 1.2% acetic acid (1.2 g/100 mL).
8. 10 mM sodium acetate buffer pH 6.5: 13.3 g sodium acetatetrihydrate (MW=136.1) in 900 mL H2O and pH to 6.5with glacial acetic acid. Complete to 1 L.
9. Mounting media: Merkoglass R© (Merk, Darmstadt,Germany) for paraffin-prepared sections and Mowiol(Calbiochem, San Diego, CA) for cryosections.
3. Methods
3.1. Design andConstruction of ViralVectors EncodingSmall Hairpin RNA
Bipartite cassettes containing green fluorescent protein (GFP)and an shRNA sequence under control of the H1 promoter arecloned into the pSIN-W-PGK and pAAV-CMV-MCS genomicplasmids using standard molecular biology techniques to generatepSIN-PGK:GFP-H1:shRNA and pAAV-CMV:GFP-H1:shRNA,respectively (Fig. 7.1). The shRNA sequence consists of the19–23 bp stem sequence targeting SOD1, the loop sequence(TTCAAGAGA), the reverse complementary stem sequence,and the pol III transcription termination sequence (TTTTT).Examples of complementary oligos used to clone shRNAsequence (from Raoul et al. (7)) are given below. Observethe 5′ overhangs that facilitate ligation into restriction-digestedDNA.
5′ GATCCCC AAGGATGAAGAGAGGCATG TTCAAGAGA CATGCCTCTCTTC
ATCCTT TTTTTGGAAA 3’
3’ GGG TTCCTACTTCTCTCCGTAC AAGTTCTCA GTACGGAGAGAAGTAG
GAA AAAAACCTTTGATC 5’
The design of shRNA to target SOD1 (or any gene for thatmatter) is not trivial. Several algorithms have been published thatcan predict the silencing efficacy of siRNA sequences (10–15) andthese have been used to create multiple online programs capa-ble of identifying effective siRNA targets within a selected gene.Unfortunately, these algorithms for siRNA design have little orno efficacy at predicting shRNA knockdown outcome (16). How-ever, such software still offers an easy method to identify oligonu-cleotide sequences that may then be screened for silencing efficacyin vitro.
1. Use siRNA design software (see Note 2) to identify multipletarget sequences (n > 10) that are located across differentregions of the selected gene.

Vector-Based RNAi for Motor Neuron Disease 93
Fig. 7.1. Comparison of lentivirus (A) and adeno-associated virus serotype 6 (B) pro-duction and transduction.
2. Perform BLAST searches to eliminate those sequences thathave less than three mismatches with off-target genes withinthe genome of the species being examined.
3. Order the oligo pairs required to generate the shRNAsequences (n > 8) (use template described above), anneal,and clone into an H1 expression vector.
4. Transfect the vectors into a cell line expressing the targetprotein and determine knockdown efficiency by Westernblot, immunocytochemistry, or reverse transcription quan-titative PCR (RT-QPCR).
94 Towne and Aebischer
5. Select the best two shRNA sequences for subsequent invivo studies and design corresponding scrambled nucleotideshRNA sequences as negative controls.
3.2. Production andTitration ofRecombinant Virus
Recombinant lentivirus and AAV are produced through calcium-phosphate transfection of HEK293-derived cells. HEK293 cellsare human embryonic kidney cells that have been transformedby sheared adenovirus type 5 DNA (17). We use AAV-293 cellsthat are derived from HEK293 cells for AAV production althoughthey produce higher viral titers (technical data sheet, #240073,Stratagene). Our lentiviral production utilizes 293T cells, whichexpress the SV40 large T antigen allowing for episomal replicationof plasmids containing an SV40 origin of replication. Indeed, thepackaging and genomic plasmids used for lentivirus productioncontain the SV40 ori, leading to greater copies of plasmid andtherefore increased yields of virus.
Following transient transfection, AAV particles are producedand remain within the AAV-293 cell nucleus. The cells are thenlysed and the virus is purified from the lysate by high-pressure liq-uid chromatography on heparin columns. This is made possible bythe high heparin-binding affinity of AAV6. Not all AAV serotypes,however, have an affinity for heparin and may alternatively bepurified by cesium-chloride ultracentrifugation or ion-exchangechromatography (18). VSV-G-pseudotyped lentiviral vectors arepackaged at the membrane following 293T transfection and deliv-ered directly to the cell culture media. The media is collected andthe virus concentrated by ultracentrifugation. Figure 7.1 summa-rizes the production protocol for the two viruses.
3.2.1. Cell Culture andTransfection
1. Maintain 293 (AAV- or -T) cells with DMEM/FCS in a37◦C humidified incubator with 5% CO2.
2. Passage cells 1:3 twice per week towards maintaining stablehigh-quality cell line (see Note 3).
3. Trypsinize cells from confluent tissue culture flasks the after-noon prior to transfection and centrifuge at 800 g for 5 minat 4◦C to remove trypsin. Resuspend in DMEM/FCS andplate 40 × 106 cells per 500 cm2 dish. The cells should be70–80% confluent on the day of transfection.
4. Prepare the vector plasmid and packaging plasmid/s in2.5 mL 0.5 M CaCl2 per 500 cm2 plate (lentivirus,130 �g SIN-PGK:GFP-H1:shRNA, 130 �g pCMV�R8.92,37.5 �g pMD.G, and 30 �g pRSV-Rev; AAV, 100 �gpAAV-CMV:GFP-H1:shRNA, and 200 �g pDF6). Bringthe volume to 5 mL with H2O. Add 5 mL of 2x HBSSdropwise (one drop every other second) to the DNA/CaCl2solution while gently vortexing.

Vector-Based RNAi for Motor Neuron Disease 95
5. Incubate the solution for 10 min (see Note 4). The solutionshould turn opaque but no solids should be visible.
6. Add the precipitate solution gently to the cells by distribut-ing the drops uniformly across the plate. Mix the solution ina cross ‘T’ manner. Return the cells to the incubator.
3.2.2. LentivirusIsolation andConcentration
1. Remove the 293T cells from the incubator 8–15 h followingtransfection and aspirate the media. Replace with 70 mL ofserum-free Episerf and return the dish to the incubator.
2. Collect the media (containing the virus) from the dish48–72 h post-transfection and filter through a 0.45-�mbottle-top membrane.
3. Ultracentrifuge the filtrate at 50,000 g at 4◦C for 90 min.Aspirate the supernatant and resuspend the pellet in 50 �Lto 2 mL of PBS/1% BSA (depending on desired concentra-tion). Leave the suspensions on ice for 1 h.
4. Aliquot the lentivirus and store at –80◦C.
3.2.3. AAV Isolation 1. Remove the 293T cells from the incubator 6–8 h followingtransfection and replace media with 100 mL of serum-freeEpiserf. Return to incubator.
2. Collect the media from the plates 48 h following transfectionand store. Trypsinize the cells and inactivate with Episerf.
3. Combine the harvested cells and collected media and cen-trifuge for 5 min at 800 g. Discard the supernatant and resus-pend the pellet in 3 mL per 500 cm2 plate.
4. Freeze–thaw the cells three times by cycling between a dryice/ethanol and a 37◦C water-bath.
5. Add 50 U/mL Benzonase and incubate for 37◦C for30 min.
6. Centrifuge the sample at 1,500 g for 15 min. Collect thesupernatant and add 0.5% deoxycholic acid.
7. Incubate for 30 min and then centrifuge at 3,000 g for15 min. Collect the supernatant and pass through a 0.8-�mfilter.
3.2.4. AAV Purificationvia HPLC
1. Equilibrate the heparin column by washing with PBS for10 min (see Note 5).
2. Load viral lysate onto the column and monitor the 280 nmabsorbance. A large peak should arrive representing the non-heparin binding flow-through from the cell lysate. At thisstage the AAV6 should remain bound to the column.
3. Continue to wash the column with PBS for 10 min untilthe peak returns to the starting absorbance or levels out in aparabolic shape.
4. Elute the virus with 0.4 M NaCl in PBS. Collect the eluatein 5 mL aliquots using the automated function of the HPLC

96 Towne and Aebischer
system. A peak smaller than the first should appear. Allow toelute until the peak levels out.
5. Strip the column of any remaining virus or sundries by wash-ing with 1 M NaCl in PBS for 10 min.
6. Rinse the column with H2O for 10 min and sterilize over10 min with 20% EtOH. Leave the system including the col-umn in 20% EtOH.
3.2.5. AAVConcentration
1. Prepare the Centricon R© Plus-20 filter column by washingwith 19 mL H2O and then with 19 mL PBS. Centrifuge at4,000 g for 5 min.
2. Load the HPLC eluate onto the column and centrifugeat 4,000 g until approximately 1 mL of volume remains(10–15 min). Do not let the column dry out.
3. Wash the sample by adjusting the volume to 19 mL withPBS and re-centrifuging until 100–200 �L of the volumeremains.
4. Aliquot the AAV and store at –80◦C.
3.2.6. Virus TitrationUsing FACS Analysis
Several methods are available to titrate lentivirus and AAV.Lentivirus particle content is typically performed by p24 (capsidantigen) ELISA assay (see Note 6). Similarly, AAV genomic par-ticle content may be determined by quantitative PCR against theviral genome. These methods do not, however, quantify vectorparticles capable of infecting cells. When a fluorescent reporter isexpressed by the vector, flow cytometry is a simple procedure thatcan be used to accurately titrate the vector in terms of transducingunits (tu).
1. Plate 293T cells at a density of 3 × 10⁵ cells per six-welltissue culture dish.
2. Infect the following morning with serial dilutions of thevectors. The dilutions will ensure that there are wells with alow multiplicity of infection (i.e., <15% transduction rate)that are desirable for accurate titration.
3. Lentivirus only: Harvest an uninfected well and determinetotal number of cells at time of infection (C).
4. Harvest the cells after 48 h with trypsin and inactivate withDMEM/FCS. Centrifuge for 5 min at 800 g and discardthe supernatant.
5. Resuspend the pellet in 1 mL of PBS.6. AAV only: Take an aliquot and quantify the total number
of cells at time of analysis (D).7. Centrifuge again for 5 min at 800 g and discard the
supernatant. Resuspend the pellet in 1 mL of 4% PFA andincubate for 20 min (see Note 7).
8. Centrifuge for 5 min at 1,000 g and discard the super-natant. Resuspend the pellet in 1 mL of PBS and pass

Vector-Based RNAi for Motor Neuron Disease 97
through the cell-strainer cap of a 5 mL polystyrene round-bottom tube.
9. Perform flow cytometry to quantify the number of trans-duced cells.
10. As a population of transduced cells will include cells thathave been transduced more than once, the percentage oftransduced cells (A) will follow a Poisson’s distribution inrelation to transduction events per cell (B) (formula 1). Thetiter of lentivirus (TL) in tu per microliter is calculated fromtransduction events in relation to the number of cells attime of infection (C) (formula 2, where V is the volumeof virus added (�L)). The titer of AAV (TAAV) in tu permicroliter is calculated from transduction events in relationto the number of cells at time of analysis (D) (formula 3)(see Note 8).
Formula 1 : B = ln(
11 − A
)
Formula 2 : TL = B D
V
Formula 3 : TAAV = BC
V
3.3. Viral-MediatedRNAi Against SOD1 inthe G93A SOD1Mouse Model of fALS
The hindlimb muscles of G93A SOD1 mice are the first mus-cles to display motor deficits (day 90) and become paralyzed (day130) and invariably determine the age of death in this experimen-tal paradigm. The hindlimb muscles and the lumbar spinal cordare therefore ideal targets for viral-mediated therapeutic silenc-ing of SOD1. Indeed, the intraspinal and intramuscular injectionsdescribed in this section specifically target the motor neuronsat the level controlling hindlimb function (lumbar spinal cord).These protocols could, however, be modified to target motorneurons at different spinal cord levels to increase the therapeu-tic effect.
3.3.1. IntraspinalDelivery ofVSV-G-PseudotypedLentivirus into AdultMice
1. Place the 34G needle into the 26G needle and seal theoverlap with adhesive glue. Connect the needle to the10 �L 26G Hamilton syringe with polyethylene tubing(0.38×1.10). Replace the dead volume in the system withsterile H2O.
2. Place the mouse in the induction chamber and anesthetizewith 4% isoflurane. Remove the mouse and place on thesurgery platform with the nose of the rodent in the anes-thesia mask. From this point the anesthesia is maintainedwith 1.5% isoflurane (see Note 9). Make sure to apply and

98 Towne and Aebischer
reapply Viscotears R© to the eyes to prevent ocular damageto the mouse.
3. Shave the back of the animal with an electric razor. Becareful to remove excess hairs that may contaminate thesurgery. Swab the skin with Betadine R© solution and allowto dry.
4. Make a 30 mm incision with the scalpel down the middleof the back. Use the tissue forceps to separate the skin asmuch as possible from the underlying muscle.
5. Identify the third and fourth lumbar vertebrae (L3 andL4) and mark the region by making a small scratch in themuscle surface with a scalpel (see Note 10). Make approxi-mately 4 mm deep and 10 mm long incisions on either sideof the vertebral column. Be careful not to axotomize theanimal by penetrating the tissue too deep.
6. Transfer the mice to the stereotaxic frame and secure thespinal cord by placing the transverse clamps between thecranial articular process and costal process at L3 and L4(Fig. 7.2C,D). The spinal column should be perpendicularthe injection plane and firmly fixed such that it is unableto move upon applying downward pressure with the tissueforceps.
7. Place bandages under the mouse to support the weight ofits body and reduce force exerted by the clamps.
8. Expose the vertebral column by removing the overlyingmuscle. This is achieved by making tiny lateral incisionsdown the column and carefully scraping the muscle to theside. Do not tear away or transversally cut the muscle as itmay increase local inflammation.
9. Use the bone rongeurs to delicately remove the spinousprocess, caudal articular process, and cranial articular pro-cess at L3 and L4 (Fig. 7.2E) (see Note 11). The spinalcord is visible at this point.
10. Lower the needles at the desired lumbar level such that theytouch the surface of the spinal cord (see Note 12). There isa small blood vessel running down the middle of the spinalcord that can help align the bilateral injection.
11. Raise the needles 1 mm from the surface and punctureholes in the dura mater with a 27G beveled needle. Placethe needles back on the spinal cord surface and then slowlylower them 0.75 mm into the tissue.
12. Inject the desired amount of virus in a volume between 1and 2 �L at 0.2 �L/min. The amount of lentivirus nor-mally required to achieve efficient transduction is approxi-mately 1 × 10⁶ tu per site (≈ 100 ng p24).
13. Wait for 5 min after the injection has finished and thenslowly remove the needles.

Vector-Based RNAi for Motor Neuron Disease 99
A B
C
F
E
D
Fig. 7.2. Intraspinal injection of lentivirus into G93A SOD1 mice. (A) Experimental setup and required instruments. (B)Macrophotograph of 34G blunt needle intersecting with injection plane. (C, D) The vertebral column being raised withforceps to allow fixation with the transerve clamps. (E) The spinal cord being revealed following removal of the dorsalvertebral bones. (F) Macrophotograph of spinal cord being bilaterally injected with lentivirus.
14. Close the skin with 6-0 Vicryl R© suture and return the ani-mal to the housing cage (see Note 13).
3.3.2. IntramuscularDelivery of AAV6 intoAdult Mice
1. Anesthetize the mouse in the induction chamber and trans-fer to the surgery table as described above.
2. Use an electric razor to remove the hair from the back of thelower leg and apply Betadine R© solution to the surface of theskin.

100 Towne and Aebischer
3. Make an 8 mm incision with a scalpel to expose the gastroc-nemius muscle. Use the tissue forceps to separate the skinfrom the underlying muscle.
4. Secure the legs of the animal by taping the feet to the surgerytable (Fig. 7.3B).
5. Insert the 26G beveled needle of the 25 �L Hamiltonsyringe at a 45◦ angle into the belly of the gastrocnemius(Fig. 7.3C,D). Administer the desired amount of virus(diluted in 25 �L of PBS) via bolus injection (see Note 14).The amount of AAV6 required to achieve efficient transduc-tion of motor neurons via retrograde transport is approxi-mately 1 × 10⁶ tu.
6. Close the skin with 6-0 Vicryl R© suture and return the animalto the housing cage.
3.3.3. IntramuscularDelivery of AAV6 intoNeonate Mice
1. Break off the needle from a disposable 30G insulin syringewith a needle holder by bending (not twisting) it back andforth. Connect the needle to a 26G beveled 10 �L Hamil-ton syringe via 20 cm of polyethylene tubing (0.28×0.61)(see Note 15).
2. Place on a clean pair of gloves and rub them in the earth ofthe cage of the animals. Transfer the mother of the neonatesinto an empty cage and remove the pup. Return the motherto the cage immediately (see Note 16).
3. Place the newborn on a latex-covered bed of crushed ice toinduce hypothermic anesthesia.
4. Remove the pup from the ice and inject the desired amountof virus in 2 �L via bolus injection with the help of a secondoperator (Fig. 7.3F,G). The amount of AAV6 required toachieve efficient transduction of neonate motor neurons viaretrograde transport is between 105 and 106 tu.
5. Return the pup to the cage and quickly roll it in the soiledearth. Do not return the pup directly in the nest. Instead,place the pup at least 10 cm away such that the mother isforced to return it. This will ensure that the mother doesnot reject the newborn.
3.4. Analysis ofTransduction, SOD1Silencing, andNeuroprotectionWithin the SpinalCord
In order to adequately interpret any behavioral improvement orextended survival observed within the mouse model followingviral-mediated RNAi, it is necessary to determine the transductionprofile of the vector, confirm SOD1 silencing within the trans-duced cells, and determine whether the effects were as a result ofmotor neuron protection. This may be achieved via spinal cordand ventral root histology.
3.4.1. Spinal CordDissection
1. Administer an overdose of sodium pentobarbital and tran-scardially perfuse the mouse with ice-cold PBS containing5,000 U heparin for 1 min followed by 4% PFA for 5 min.

Vector-Based RNAi for Motor Neuron Disease 101
A
B
C
H
GF
ED
Fig. 7.3. Intramuscular injection of AAV6 into adult and neonate G93A SOD1 mice. (A) Experimental setup for intramus-cular injection into adult mice. (B) Anesthetized mouse in prone position. (C) AAV6 being delivered into gastrocnemiusmuscle with 26G Hamilton syringe. (D) Macrophotograph of 45
◦needle entry into gastrocnemius. (E) Experimental setup
for neonate intramuscular injections. (F) Two person coordination for ease of animal manipulation and vector injection.(G) Macrophotograph of needle entry into neonate gastrocnemius muscle. (H) 30G insulin needle connected to a 10 �LHamilton syringe through polyethylene tubing.

102 Towne and Aebischer
2. Remove the muscle overlying the vertebral column with tis-sue forceps and then use the bone rongeurs to remove thevertebrae and expose the spinal cord (see Note 17).
3. Cut the spinal cord above and below the region to be dis-sected and then carefully remove the spinal cord with a bluntdissection probe. Use small spring scissors to cut any nervesas required to free the spinal cord.
3.4.2. Evaluation ofTransduction and SOD1Silencing;Immunohistology onFrozen Sections
1. Place the freshly dissected spinal cord in 4% PFA in PBS andpostfix for 6–18 h at 4◦C.
2. Transfer the spinal cords to 25% sucrose in PBS and cryopro-tect overnight at 4◦C. The spinal cords are ready once theyhave sunk to the bottom of the tube.
3. Place the spinal cord in a Peel-A-Way R© disposable embed-ding mold containing CryomatrixTM embedding fluid.Freeze the spinal cord by placing the mold in a beaker filledwith liquid nitrogen (see Note 18).
4. Place the embedded spinal cord in a cryostat and allow toequilibrate to –20◦C. Cut 20 �m transverse sections and dryfor 30 min on glass slides. The sections may be stored at–80◦C at this point for several months.
5. Wash slides three times with PBS over 30 min to removecryoembedding solution and then block for 3–6 h. Incubatethe sections with the primary antibodies in blocking solutionovernight at 4◦C. Wash the slides three times with PBS forover 45 min and then incubate with the appropriate fluo-rescent secondary antibodies in PBS/1% BSA for 2 h. Washagain three times with PBS for over 45 min and then rinsebriefly in H2O prior to mounting in Mowiol.
6. Examine GFP expression (corresponding to virus transduc-tion and shRNA delivery) using either native GFP expressionor enhance the signal using antibodies against GFP (1:800goat polyclonal anti-GFP Ab with 5% NDS, 0.1% BSA, 0.1%Triton X-100 blocking solution). Analyze the GFP expres-sion with a confocal microscope for increased resolution(Fig. 7.4A).
7. Quantify motor neuron transduction by counting the totalnumber of GFP-positive cells that colocalize with VAChT-positive cells and express these as a percentage of totalVAChT-positive cells (Fig. 7.4B) (1:800 goat polyclonalanti-GFP Ab and 1:2500 rabbit polyclonal anti-VAChT with5% NDS, 0.1% BSA, 0.1% Triton X-100 blocking solution).
8. Examine SOD1 silencing in motor neurons/glial cells bydouble labeling sections from silencer and mismatch injectedanimals for SOD1 and GFP. SOD1 staining is achieved inTBS using either 1:1500 anti-SOD1 clone SD-G6, 1:1500anti-SOD1 clone G215-1, or 1:100 polyclonal goat anti-SOD1 Ab in combination with 1:800 rabbit polyclonal

Vector-Based RNAi for Motor Neuron Disease 103
A B
C
E
D
F
raw
GF
P fl
uore
scen
ceGFP VChAT merge
cont
rala
tera
lip
sila
tera
l
actin
GFP
SOD1
uninj
ecte
d
silen
cer
mism
atch
wild-type G93A (125 days)
Cre
syl V
iole
tto
luid
ine-
blue
wild-typeG93A SOD1
hSOD1 (G215-1) hSOD1 (SD-G6) hSOD1 (SD-G6)
GFP SOD1 merge
SD-G6
SD-G6
G215-1
sile
ncer
mis
mat
ch
Fig. 7.4. Analysis of transduction, SOD1 silencing, and neuroprotection following viral-mediated-RNAi in the G93A SOD1mouse. (A) GFP fluorescence of lumbar spinal cord following unilateral intramuscular injection of AAV6. (B) Doublelabeling demonstrating colocalization between GFP and the motor neuron marker, VAChT, in the ventral horn. Scale bar,80 �m. (C) Specificity of SOD1 staining with two different antibodies comparing G93A SOD1 and wild-type mice. Scalebar, 20 �m. (D) Immunostaining for SOD1 and GFP in the ventral horn of mice injected with lentivirus expressing eitherthe silencer or mismatch shRNA against SOD1. Scale bar, 20 �m. (E) Immunoblot evaluation of vector-mediated silencingin the lumbar spinal cord following direct intraspinal delivery. (F) Cresyl Violet and toluidine-blue sections of ventral hornspinal cord and ventral roots, respectively, from wild-type and G93A SOD1 mice at 125 days of age. Scale bar, 100 �m.(C–F reproduced fromk Ref. (7) with permission from Nature Publishing Group).

104 Towne and Aebischer
anti-GFP Ab with 4% NDS, 4% BSA, 0.1% Triton X-100blocking solution. Merge images from the GFP and SOD1channels to best illustrate SOD1 knockdown (Fig. 7.4C)(see Note 19).
3.4.3. Evaluation ofNeuroprotection; MotorNeuron Counts onParaffin-EmbeddedSections
1. Place the freshly dissected spinal cord in 4% PFA in PBSand postfix for 6–18 h at 4◦C.
2. Prepare spinal cord for paraffin inclusion by rinsingtwo times with PBS for 15 min; two times with 25%EtOH/75% PBS for 10 min; two times with 50%EtOH/50% PBS for 10 min; two times with 70% EtOHfor 20 min.
3. Perform the following cycles using an automatic embed-ding machine: 70% EtOH for 90 min; 80% EtOH for90 min; 96% EtOH for 90 min; 100% EtOH for 90 min;toluol for 90 min; paraffin for 2 h at 60◦C.
4. Embed the spinal cord in the embedding mold and solidifythe paraffin at 4◦C.
5. Cut 8 �m transverse spinal cord sections and place on a 1%gelatin solution heated at 42◦C. Mount the sections ontoglass slides and dry for 30 min.
6. Deparaffinize the slides for heating for 1 h at 60◦C andplace immediately in toluol. Leave for 10 min and transferto a fresh batch of toluol for a further 5 min.
7. Rehydrate the slides by rinsing: two times with 100% EtOHfor 2 min; one time with 96% EtOH for 2 min; one timewith 80% EtOH for 2 min; one time with 70% EtOH for2 min; one time H2O for 5 min.
8. Place slides for 1 min in 0.5% Cresyl Violet in differenti-ation buffer and then leave 30 s in differentiation bufferalone. Wash two times for 30 s in 100% EtOH and thentwo times for 30 s in toluol.
9. Mount the slides in Merkoglass R© and allow to dryovernight.
10. Count only large-sized cells (>25 �m) (motor neurons)with a visible nucleolus on every fifth section across thedesired region of spinal cord. Examples of stained sectionsare shown in Fig. 7.4F (top panel).
3.4.4. Evaluation ofNeuroprotection;Myelinated Fiber Countson Resin-EmbeddedSections
One pathological characteristic of ALS observed in the clinic andin rodent models is the demyelination of large axons (motor neu-rons) in the spinal cord ventral roots. Quantifying the numbers ofmyelinated fibers therefore provides another measure of protec-tion from motor neuron degeneration.
1. Dissect the ventral roots from the dissected spinal cord undera stereomicroscope and postfix in 4% PFA/2.5% glutaralde-hyde for 6–18 h at 4◦C.

Vector-Based RNAi for Motor Neuron Disease 105
2. Incubate ventral roots in the dark for 4 h in 2% osmiumtetroxide, 50 mM cacodylate (see Note 1).
3. Wash the ventral roots rapidly in H2O and dehydrate with80% EtOH for 1 h, 96% EtOH for 1 h, 96% EtOH for 1 h,96% EtOH/infiltration solution (1:1) for 1 h, and then infil-tration solution overnight at 4◦C.
4. Embed ventral roots in 2 × 15 mm molds by mixing theinfiltration solution with the hardener and allow to set.
5. Cut 2 �m transverse sections using an ultramicrotome andplace sections on a glass slide (see Note 20).
6. Place the slides on a heating plate at 120◦C for 10 min andlet dry.
7. Incubate the slides in 0.5% Toluidine Blue O, 10 mMsodium acetate pH 6.5 for 1 h.
8. Wash slides two times for 30 s in H2O, two times for 60 sin 100% EtOH, two times for 60 s in toluol, and mount inMerkoglass R©.
9. Count the numbers of small (<5 �m) and large (≥5 �m)myelinated motor fibers in the ventral roots. The lipid-richmyelin is stained black by the lipophilic osmium tetroxide.Examples of stained sections are shown in Fig. 7.4F (bot-tom panel).
4. Notes
1. Paraformaldehyde and osmium tetroxide are extremelyhazardous. Observe all warning and precautions listed onthe MSDS for these compounds.
2. The Whitehead Institute for Biomedical Researchoffers an excellent siRNA target designer that is free(http://jura.wi.mit.edu/bioc/siRNAext/). Registrationby email is required.
3. Viral production yield may decrease as passage numberincreases in the 293-derived cells. We recommend produc-ing a cell bank with cells at low passage to allow regularthawing of new vials. Cell may be frozen in 80% serumand 10% dimethyl sulfoxide (DMSO) and stored in liquidnitrogen.
4. Unless otherwise stated, all incubations, washes, dryingsteps, and centrifugations are performed at room tempera-ture.
5. New heparin columns should be washed with PBS for10 min, followed by 0.4 M NaCl in PBS, followed againby PBS for 10 min.
6. There are many commercially available kits to titratep24 antigen. We have previously used with success the

106 Towne and Aebischer
RETROtek HIV-1 p24 Antigen ELISA kit (#0801200,ZeptoMetrix Corporation, Buffalo, NY).
7. Gently flick the tube one or two times prior to adding thePFA to disperse the pellet. This reduces the number of cellclumps observed following addition of the fixative.
8. The reason for the difference between the calculationsresults from the fact that lentivirus integrates whereas AAVdoes not. AAV genomes remain mostly episomal within thenucleus of cells and will be diluted as the cells divide.
9. The percentage of isoflurane required to induce and main-tain anesthesia may vary between strain, age, and sex of therodents as well as the apparatus being used.
10. L3 and L4 are identified by using the index finger andthumb to localize the pelvic bone at the hip level whichcorresponds to L6. The vertebrae are then counted back-wards to localize the desired level.
11. Knowledge of the anatomy of mouse vertebrae will helpat this point. We recommend consulting a mouse anatomybook prior to performing this procedure.
12. The use of a stereomicroscope or magnifying glass will aidvisualization of the injection.
13. 1 g/L of effervescent paracetamol can be added to thewater supply of the animal in order to minimize post-operative pain and hasten recovery.
14. The muscle should expand in volume following virus deliv-ery. This is easily observed visually and indicates a successfulinjection.
15. We have found that this setup is the most practical forneonate injections. One hand can be used to hold andinsert the needle into the muscles while the other handremains free to inject the virus with the syringe. Thisincreases the dexterity of the manipulation.
16. There is always a chance that experimental neonate manip-ulations may provoke the mother to kill the newborns. Theanimal handling method described in this section is the bestin our experience to avoid this.
17. Removing the vertebrae is the most difficult procedure inspinal cord dissection. Great care must be taken to avoiddamaging the spinal cord that, despite being fixed, remainsextremely delicate. After clearing the muscle from eitherside of the vertebra, use the bone rongeurs to carefully‘crack’ the column at each vertebral level (in the same wayas one would crack open a walnut). Be careful not to applyso much force that the vertebrae collapse onto the underly-ing spinal cord. After this step, use the bone rongeurs tocarefully remove the piece of bone comprising the spinousprocess and cranial articular process at the level below theregion of spinal cord that is to be dissected. This action

Vector-Based RNAi for Motor Neuron Disease 107
will be transversal to the column. Next, remove the pieceof bone comprising the cranial articular process with thecaudal articular process. This action will be lateral to thecolumn. Repeat these actions (transversal, lateral, transver-sal, etc.) moving up the spinal column until sufficient spinalcord is revealed.
18. Follow the appropriate safety procedures for handling liq-uid nitrogen as specified by your institution.
19. SOD1 silencing can also be demonstrated via Western blot(Fig. 7.4D) or RT-QPCR (not shown).
20. Placing a drop of water on the glass slide prior to placementof the resin section will help to unwrinkle and flatten thesection.
Acknowledgments
The authors would like to thank Philippe Colin, Vivianne Padrun,Fabienne Pidoux, and Christel Sadeghi for their expert techni-cal assistance. This work was supported by the ALS Association(ALSA), the Sixth Research Framework Programs of the Euro-pean Union, Project RIGHT (LSHB-CT-2004 005276), ProjectNeuroNE (LSHM-CT-2004-512039), and the Bruno and IlseFrick Foundation.
References
1. Bruijn, L.I., Miller, T.M. and Cleve-land, D.W. (2004) Unravelling the mech-anisms involved in motor neuron degen-eration in ALS. Annu. Rev. Neurosci. 27,723–749.
2. Dykxhoorn, D.M., Novina, C.D. and Sharp,P.A. (2003) Killing the messenger: shortRNAs that silence gene expression. Nat. Rev.Mol. Cell Biol. 4, 457–467.
3. Saito, Y., Yokota, T., Mitani, T., Ito, K.,Anzai, M., Miyagishi, M., Taira, K. andMizusawa, H. (2005) Transgenic small inter-fering RNA halts amyotrophics lateral scle-rosis in a mouse model. J. Biol. Chem. 280,42826–42830.
4. Smith, R.A., Miller, T.M., Yamanaka, K.,Monia, B.P., Condon, T.P., Hung, G., Lob-siger, C.S., Ward, C.M., McAlonis-Downes,M., Wei, H., Wancewicz, E.V., Bennett,C.F. and Cleveland, D.W. (2006) Anti-sense oligonucleotide therapy for neurode-generative disease. J. Clin. Invest. 116,2290–2296.
5. Zamore, P.D., Tuschl, T., Sharp, P.A. andBartel, D.P. (2000) RNAi: double strandedRNA directs the ATP-dependent cleavage ofmRNA at 21 to 23 nucleotide intervals. Cell101, 25–33.
6. Ralph, G.S., Radcliffe, P.A., Day, D.M.,Carthy, J.M., Leroux, M.A., Lee, D.C.,Wong, L.F., Bilsland, L.G., Greensmith,L., Kingsman, S.M., Mitrophanous, K.A.,Mazarakis, N.D. and Azzouz, M. (2005)Silencing mutant SOD1 using RNAi pro-tects against neurodegeneration and extendssurvival in an ALS model. Nat. Med, 11,429–433.
7. Raoul, C., Abbas-Terki, T., Bensadoun, J.C.,Guillot, S., Haase, G., Szulc, J., Henderson,C.E. and Aebischer, P. (2005) Lentiviral-mediated silencing of SOD1 through RNAinterference retards disease onset and pro-gression in a mouse model of ALS. Nat.Med.11, 423–428.
8. Boillee, S., Vande Velde, C. and Cleve-land, D.W. (2006) ALS: a disease of motor

108 Towne and Aebischer
neurons and their nonneuronal neighbors.Neuron 52, 39–59.
9. Miller, T.M., Kaspar, B.K., Kops, G.J.,Yamanaka, K., Christian, L.J., Gage, F.H.and Cleveland, D.W. (2005) Virus-deliveredsmall RNA silencing sustains strength in amy-otrophic lateral sclerosis. Ann. Neurol. 57,773–776.
10. Reynolds, A., Leake, D., Boese, Q., Scaringe,S., Marshall, W.S. and Khvorova, A. (2004)Rational siRNA design for RNA interference.Nat. Biotechnol. 22, 326–330.
11. Saetrom, P. and Snove, O.J. (2004) Acomparison of siRNA efficacy predictors.Biochem. Biophys. Res. Commun. 321,247–253.
12. Takasaki, S., Kotani, S. and Konagaya, A.(2004) An effective method for selectingsiRNA target sequences in mammalian cells.Cell Cycle 3, 790–795.
13. Ui-Tei, K., Naito, Y., Takahashi, F.,Haraguchi, T., Ohki-Hamazaki, H., Juni,A., Ueda, R. and Saigo, K. (2004) Guide-lines for the selection of highly effectivesiRNA sequences for mammalian and chickRNA interference. Nucleic Acids Res. 32,936–948.
14. Hsieh, A.C., Bo, R., Manola, J., Vazquez, F.,Bare, O., Khvorova, A., Scaringe, S. and Sell-ers W.R. (2004) A library of siRNA duplexestargeting the phosphoinositide 3-kinase path-way: determinants of gene silencing for usein cell-based screens. Nucleic Acids Res. 32,893–901.
15. Amarzguioui, M. and Prydz, H. (2004) Analgorithm for selection of functional siRNAsequences. Biochem. Biophys. Res. Commun.316, 1050–1058.
16. Taxman, D.J., Livingstone, L.R., Zhang, J.,Conti, B.J., Iocca, H.A., Williams, K.L.,Lich, J.D., Ting, J.P. and Reed, W. (2006)Criteria for effective design, construction,and gene knockdown by shRNA vectors.BMC Biotechnol. 6, 7.
17. Graham, F.L., Smiley, J., Russell, W.C.and Nairn, R. (1977) Characteristics of ahuman cell line transformed by DNA fromhuman adenovirus type 5. J. Gen. Virol. 36,59–74.
18. Grimm, D., Kay, M.A. and Kleinschmidt,J.A. (2003) Helper virus-free, optically con-trollable, and two-plasmid-based productionof adeno-associated virus vectors of serotypes1 to 6. Mol. Ther.7, 839–850.

Chapter 8
Studying Autoimmunity by In Vivo RNA Interference
Stephan Kissler
Abstract
The occurrence of autoimmunity is strongly associated with multiple gene variants that predisposeindividuals to disease. The identification of the gene polymorphisms that modulate disease susceptibilityis key to our understanding of disease etiology and pathogenesis. While genetic studies in humans haveuncovered several associations and have provided possible candidate genes for further study, the use ofanimal models is indispensable for detailed functional studies. In order to facilitate the genetic manipu-lation of experimental models of autoimmunity, we employ lentiviral transgenesis in combination withRNA interference (RNAi). This approach bypasses the need for targeted mutagenesis of embryonic stemcells and/or backcrossing of genetically modified animals onto the relevant genetic background. Lentivi-ral RNAi offers several advantages compared to conventional transgenesis or knockout technology, andthese, as well as the technique’s weaknesses, are discussed herein.
Key words: Lentivirus, RNAi, autoimmunity, transgenesis, mouse, embryo.
1. Introduction
RNAi has found widespread use in many laboratories, and hasrapidly become a method of choice for genetic manipulationof transformed cell lines as well as whole organisms such asCaenorhabditis elegans and even Drosophila melanogaster. Its usein mammalian organisms is still limited by one main hurdle: spe-cific and long-lasting delivery of oligonucleotides to cells withina living animal. Just seven years ago, Baltimore and colleaguesdemonstrated that lentivirus could be employed to deliver a trans-gene to single-cell mouse embryos that subsequently developedinto transgenic adult animals (1). That same year, Brummelkampet al. demonstrated that small interfering RNAs (siRNAs) could
John F. Reidhaar-Olson and Cristina M. Rondinone (eds.), Therapeutic Applications of RNAi: Methods and Protocols, vol. 555© Humana Press, a part of Springer Science+Business Media, LLC 2009DOI 10.1007/978-1-60327-295-7 8 Springerprotocols.com
109

110 Kissler
be expressed from a short-hairpin motif (shRNA) incorporatedwithin a retroviral vector (2). The following year, several groupshad combined these two technologies to generate transgenic micein which a particular gene was silenced by RNAi (3, 4). Since then,lentiviral vectors have been refined and modified to accommodatethe inducible expression of shRNA sequences within transgenicanimals (5, 6).
The study of autoimmunity, and particularly of type 1 dia-betes (T1D), requires the use of very specific mouse strains. Inthe case of T1D, the best and most widely studied model isthe nonobese diabetic (NOD) mouse. This mouse model closelyresembles human T1D, and shares not only pathophysiologicalaspects, but also genetic susceptibility loci with human disease.The availability of the NOD mouse has allowed several disease-associated human genes to be confirmed and studied in moredetail in the NOD model. However, the NOD mouse is noto-riously refractory to genetic manipulation. Despite prolongedefforts, no NOD-derived embryonic stem cell line is yet availablethat would allow direct manipulation of the NOD genome bytargeted mutation. Even conventional transgenesis by pronuclearinjection is more challenging in this strain, such that the gener-ation of mutant NOD mice often requires lengthy backcrossingof mutant animals from a different strain onto the NOD back-ground. We have now used lentiviral transgenesis to silence genesdirectly in the NOD embryo (7), thereby greatly reducing thetime required to generate new experimental models and to testthe involvement of candidate genes in the disease process.
2. Materials
2.1. Cloning ofOligonucleotides intothe Lentiviral Vector
1. Synthetic oligonucleotides (ordered commercially).2. Lentiviral vector (e.g. pLB, available from Addgene).3. Restriction enzyme (for pLB: HpaI, XhoI, XbaI).4. T4 Polynucleotide kinase with T4 PNK buffer.5. T4 ligase with ligase buffer.6. Competent bacteria (e.g. Novablue (Novagen)).7. LB medium, supplemented with 50 �g/ml ampicillin.8. LB-agar plates, supplemented with 50 �g/ml ampicillin.
2.2. Generation ofLentivirus
1. DMEM supplemented with penicillin (100 Units/ml) andstreptomycin (100 �g/ml), with and without 5 or 10% fetalbovine serum (FBS).
2. HEK 293 cells.3. Transfection reagent (e.g. FuGene6 (Roche) or Polyfect
(Qiagen)).

Studying Autoimmunity by In Vivo RNA Interference 111
4. Lentiviral packaging plasmids (pMDLg/pRRE and pRSV-Rev, available from Addgene).
5. Envelope plasmid (pCMV-VSVg, available from Addgene).6. Ultracentrifuge tubes (40 ml capacity).7. Sterile PBS.
2.3. EmbryoGeneration,Manipulation andInjection
1. Embryo donor mice (females from strain of choice).2. Male stud mice (from strain of choice).3. Pregnant Mare Serum (PMS) gonadotropin (Sigma-Aldrich)
and human Chorionic Gonadotropin (hCG) (Sigma-Aldrich).
4. M16 medium, M2 medium, mineral oil, hyaluronidase (allfrom Sigma-Aldrich).
5. Microinjection set-up.
2.4. Genotyping ofTransgenic Animals
1. (Optional) Multi-LED Flashlight with blue filter (e.g. LeeFilters #47B Tricolor Blue) and goggles with yellow filter(e.g. Lee Filters #12).
2. Fluorescent microscope with appropriate filters (for GFPvisualization).
3. Flow cytometer.4. PBS supplemented with 5 mM EDTA.5. Red blood cell lysis buffer (ACK: 0.15 M NH4Cl, 1 mM
KHCO3, 0.1 mM Na2EDTA, pH 7.2–7.4).6. PBS supplemented with 1% FBS.
3. Methods
The principle of the procedure consists in designing a lentivi-ral vector that contains an shRNA-encoding construct directedagainst the gene of interest. The lentiviral vector is packaged inVSVg-pseudotyped viral particles that are microinjected into theperivitelline space of single-cell embryos. The embryos are reim-planted within 24 h of injection, and develop into fully transgenicanimals in which the gene of interest is silenced by RNAi.
3.1. Cloning ofOligonucleotides intothe Lentiviral Vector
All procedures described below apply to cloning into the pLB vec-tor. Using a different vector will require adaptation of the proce-dure to incorporate the relevant design and restriction sites.
1. Identify suitable 19-nt target sequences within the gene ofinterest, using one of the freely available algorithms.
2. The 19-nt target sequence is incorportated into an shRNAdesign (3) as follows:Forward strand: T(N+)19TTCAAGAGA(N–)19TTTTTC
112 Kissler
Reverse strand: TCGAGAAAAA(N+)19TCTCTTGAA(N–)19Awhere (N+)19 denotes the target sequence and (N–)19denotes the antisense complementary sequence to the tar-get sequence.
3. Order the forward and reverse strands as unmodified,desalted oligonucleotides at a small (10 or 25 nmol) scale.Resuspend oligonucleotides at 100 pmol/�l (see Note 1).
4. Phosphorylate 5 �l of each oligonucleotide in a total volumeof 10 �l with T4 polynucleotide kinase in the appropriatebuffer for 1 h at 37◦C.
5. Combine the two phosphorylation reactions into one PCRtube (total 20 �l) and anneal the two strands by heating to94◦C for 2 min, followed by 10 min at 70◦C, and coolingdown to 4◦C slowly (1◦C/s). Dilute the annealed dsDNA ina total of 500 �l.
6. Digest 3 �g of the lentiviral vector (pLB) using HpaI andXhoI. Dephosphorylate the vector (optional) and purifythe digested vector (using a commercially available PCR-purification kit, for example) into 30 �l.
7. Set up a ligation with 5 �l digested vector together with1 �l annealed oligonucleotide and 1 �l T4 ligase in 20 �lusing the appropriate ligase buffer. Leave at room tempera-ture for 2–3 h, and transform chemically competent bacteriawith 0.5–1 �l of the ligation reaction.
8. Colonies are screened after selection on LB-agar/ampicillinplates and growth in LB/ampicillin medium by restrictiondigest of the purified plasmid DNA using XbaI and XhoI.Visualize the digest on a 1.5% agarose gel: the empty vectorshould yield a band at approximately 330 bp, while a vec-tor with the correct insert should have a band at 385 bp.Positive colonies should then be verified by sequencing, asmutations in the shRNA-encoding sequence do occasionallyoccur during the cloning process.
3.2. Generation ofLentivirus
1. Prepare HEK 293 cells the day prior to transfection: plateout approximately 8–10 million cells in a 15-cm tissue cul-ture plate or, alternatively, in a 175 cm2 flask in 20 mlDMEM with 10% FBS.
2. The next day, prepare the transfection mixture as follows:20 �g lentiviral vector, 4 �g pMDL-g/p RRE, 3 �gpRSV-Rev, 3 �g pCMV-VSVg, together with 60 �l trans-fection reagent in serum-free DMEM. Incubate at roomtemperature for at least 20 min, and pipette onto the cells(see Note 2).
3. The day following transfection, replace the medium withDMEM 5% FBS (see Note 3).

Studying Autoimmunity by In Vivo RNA Interference 113
4. Collect culture supernatant at 48 h and store at 4◦C, replac-ing it with 20 ml fresh medium (5% FBS).
5. Collect culture supernatant at 72 h, and combine with the48 h supernatant.
6. Spin the combined supernatants at 2500 rpm for 10 min topellet cell debris. Filter the supernatant through a 0.45-�msterile filter and ultracentrifuge at 25,000 rpm for 90 min.
7. Carefully remove the supernatant by aspiration. Add 100 �lsterile PBS, taking care not to disrupt the pellet, if one isvisible (see Note 4). Cover tubes with parafilm and leaveundisturbed at 4◦C overnight.
8. The following day, hold the ultracentrifuge tube at an angleand pipette the PBS onto the opposite tube wall, so it flowsover the pellet. Repeat 10–20 times, then transfer the virussolution into 1.5-ml tubes (usually as 10–20 �l aliquots)and freeze at –80◦C (see Note 5).
9. To titer the virus, prepare HEK 293 cells (400,000/well)in a six-well plate with DMEM/10% FBS. The followingday, dilute 1 �l virus in 1 ml DMEM/10% FBS, and trans-fer 100 �l of this mixture into 1 ml of DMEM/10% FBSto generate a 1:10 dilution. Repeat the dilution to obtaina 1:100 dilution. Replace the medium in three wells of thepreviously prepared HEK 293 cells with the three virusdilutions and in one well with virus-free DMEM/10% FBS.Assuming that approximately 800,000 cells were present(doubling of the initial cell number) at the time of infec-tion, the proportion of infected cells can be measured 48 hpost-infection by flow cytometry, and the virus titer extrap-olated from the percentage infected (GFP-positive) cells(see Note 6).
10. The virus can be used to infect a variety of cells, and vali-dation of the chosen shRNA sequences can be performedby measuring mRNA or protein level in an adequate celltype after infection (see Note 7 for an alternative validationmethod).
3.3. EmbryoGeneration,Manipulation andInjection
1. Superovulate donor females of the chosen mouse strain byintraperitoneal injection of 5 I.U. PMS on day 2, and thenwith 5 I.U. hCG 47 h later, on day 0. The females are matedwith stud males of the same strain immediately after hCGinjection (see Note 8).
2. Collect embryos on day 1, shortly after fertilization: theoviduct is removed, placed into M2 medium supplementedwith hyaluronidase (300 �g/ml), and embryos are freedby tearing of the oviduct. Hyaluronidase acts to free theembryos from surrounding cumulus cells.

114 Kissler
3. Wash embryos in M2 medium, and transfer them into a dropof M16 medium to keep at 37◦C in the incubator whilepreparing the injection needle.
4. Thaw a virus aliquot on ice, and spin at 2,000 rpm for 2 minto pellet any larger debris. Backload the microinjection nee-dle with 3 �l of virus (see Note 9).
5. Transfer embryos into a drop of M2 medium overlayed withmineral oil for injection. Each embryo is injected with suffi-cient virus solution to achieve a visible expansion of the zonapellucida. Take care not to damage the actual zygote, as thevirus is injected between the zona pellucida and the zygote,in the perivitelline space.
6. Transfer injected embryos into M16 medium, place in incu-bator at 37◦C. Reimplant embryos either the same or fol-lowing day into the oviduct of pseudopregnant recipients(see Note 10).
3.4. Genotyping ofTransgenic Animals
Once potentially transgenic animals are born (after the usual20–21 days gestation), three simple methods can be used to testanimals for expression of the GFP marker gene.
1. The earliest possible genotyping can be performed using aflashlight and goggles with appropriate filters (see materi-als for filter details, and Note 11 for further informationon building your own set of flashlight and goggles). Thismethod can be applied from the first day post-partum, andis particularly effective in albino or agouti mice with lightskin. The animals are illuminated with the filtered light andobserved through the filter-goggles within their cage.
2. Alternatively, a tissue biopsy (e.g. tail-tip) can be obtainedand observed under a fluorescent microscope equipped withappropriate filters (see Note 12).
3. For quantitation of cells that express the marker gene, ablood sample can be collected for analysis by flow cytome-try. For this purpose, a small amount of blood (50–100 �l) iscollected in a microfuge tube filled with 200 �l PBS/EDTAbuffer to prevent clotting. The red blood cells are lysed withACK buffer (2–3 ml for 3 min), and then washed twice withPBS/1% FBS. Cells are analysed by flow cytometry to quan-tify the proportion of GFP-positive cells. Additionally, spe-cific cell-surface markers can be labelled with the relevantfluorescent antibodies to distinguish individual cell popula-tions, if required (see Note 13).
3.5. Summary ofAdvantages ofLentiviral RNAi inMice
1. Using lentiviral transgenesis bypasses the limitationsimposed by the availability of embryonic stem cells from asmall number of mouse strains, or even species. Lentiviraltransgenesis combined with RNAi allows the downregula-tion of genes directly in many specialized mouse models.

Studying Autoimmunity by In Vivo RNA Interference 115
2. RNAi in itself has the advantage of allowing silencing of indi-vidual splice variants by targeting unique exon boundaries,for example. This was previously not possible in many casesusing conventional knockout technology. In addition, RNAican be used to downregulate, rather than completely elimi-nate, a particular gene product to mimic physiological poly-morphisms encountered in human disease-associated genes.
3. The use of RNAi also enables simpler tissue-specific down-regulation of genes, using appropriate promoters for theexpression of shRNA constructs (8).
4. Lentiviral embryo injection is technically easier and moreefficient than the targeting of embryonic stem cells and theirinjection into blastocysts or pronuclear injection of DNA.
3.6. Summary ofDisadvantages ofLentiviral RNAi inMice
1. Expression of lentiviral transgenes is very often variegated,necessitating careful analysis of founders.
2. Lentiviral integration in the embryonic genome is random,and can result in multiple integrants spread throughout thegenome. These are segregated during breeding, sometimesleading to changes in expression between founder and off-springs.
3. Downregulation of gene expression by RNAi is seldom com-plete. Conventional knockout technology is therefore still amore reliable approach in most instances.
RNAi in vivo by lentiviral transgenesis has opened new possibil-ities and should facilitate the study of specialized disease modelssuch as the NOD model of T1D. But this method is unlikely toentirely replace conventional pronuclear transgenesis or knock-out technology, as these approaches are, in many instances, stillmore reliable and appropriate. Nevertheless, lentiviral RNAi com-plements conventional methods and should, as it becomes moreestablished, prove very useful in the genetic manipulation ofmammalian disease models.
4. Notes
1. We initially ordered HPLC-purified oligonucleotides, butfound desalted oligonucleotides to be of sufficient quality.
2. We have used both FuGene6 (Roche) and Polyfect (Qia-gen) with success. At this large scale of transfection, wefind that a twofold excess of transfection reagent over DNAamount is usually sufficient for very high transfection effi-ciency and production of high virus titers.
3. Replacing the medium with a lower percentage FBSimproves the quality of the virus concentrate by reducing
116 Kissler
debris and impurities that can be a major problem duringmicroinjection.
4. The virus pellet itself is not visible, and if a light-brownpellet is visible, it is likely due to impurities and debris. Asa general gauge of quality of the virus concentrate, the lessyou see, the cleaner the virus.
5. We usually flash-freeze virus aliquots in liquid nitrogenprior to transfer to –80◦C, but it is debatable whether this isa necessary procedure to safeguard the virus against degra-dation during freezing.
6. This titration method yields an approximate measure ofthe minimum number of infectious particles present in thevirus stock. We always aim to use virus preparations withno less than 2–3 × 10⁸ infectious particles/ml for embryoinjection. As a general guideline, good virus stock shouldinfect >50% of the HEK 293 cells in the well containing1 �l virus.
7. As an alternative to measuring endogenous gene expressionin a cell line, we routinely use a luciferase reporter assay tovalidate shRNA sequences. The relevant cDNA (e.g. fromthe OpenBiosystems collection) is cloned into the 3′ UTRof the Renilla luciferase gene in the dual-luciferase reportervector psiCheck2 (Promega), and knockdown efficiency ismeasured in a dual-luciferase assay after co-transfection ofthe lentiviral vector and reporter plasmid into HEK 293cells.
8. While some laboratories use exclusively female donors aged3–5 weeks, others use animals of 6–8 weeks. The success ofthe superovulation procedure is age-dependent as well asstrain-dependent, and adjustments to hormone quantitiesand donor age have to be made on a case-by-case basis foroptimal results.
9. The injection needles used for virus injection are consider-ably larger than needles used for pronuclear injection. Thevirus concentrate can be viscous and contain larger debristhat will clog small openings, one of the main technicalproblems encountered during this procedure. At the sametime, a larger opening inflicts more damage to the embryo,and it is a matter of experience to determine what size nee-dle works best.
10. The typical survival rate of injected embryos, as measuredby two-cell development the day following injection, isup to 90% for B6 embryos. However, survival is strain-dependent, and we found NOD embryos, for example,to be much less robust. We therefore reimplant NODembryos on the day of injection, while B6 embryos canbe reimplanted the following day.

Studying Autoimmunity by In Vivo RNA Interference 117
11. While sets of flashlights and goggles equipped withappropriate filters for GFP visualization are available com-mercially, we find that “home-made” devices are entirelyadequate and much cheaper. We use a 16-LED flashlightwith blue LEDs, supplemented with a photographic fil-ter to further narrow the excitation light wavelength range(the polyester filter is cut to size to fit the flashlight). Wesimilarly use a yellow filter cut to fit onto laboratory safetygoggles, through which we observe transgenic animals.This allows visualization of GFP in the skin of animals atambient light, or for even better results, in a dark room.
12. The second method is particularly useful when animals areheld off-site, such that tail-biopsies can be shipped betweenlaboratories. The GFP is stable for several days, if notweeks, in the tissue sample, so these can be shipped at roomtemperature. The GFP can be visualized directly throughan eppendorf tube wall, making it a very fast and easy pro-cedure.
13. Depending on the integration site of the transgene, wehave found widely variable expression levels. These canalso change after breeding; for example, if the transgeneis located in an imprinted locus or if it is present in multi-ple copies throughout the genome. Variegated expression isa very common occurrence in lentiviral transgenics, whichmakes it a less reliable method than conventional knockouttechnology or pronuclear transgenesis. However, the effi-ciency of transgenesis can be higher than 50% under opti-mal conditions, such that the number of positive founderscompensates to some extent for the wide variability intransgene expression.
References
1. Lois C., Hong E.J., Pease S., Brown E.J. andBaltimore D. (2002) Germline transmissionand tissue-specific expression of transgenesdelivered by lentiviral vectors. Science 295:868–872.
2. Brummelkamp T.R., Bernards R. and AgamiR. (2002) A system for stable expression ofshort interfering RNAs in mammalian cells.Science 296: 550–553.
3. Rubinson et al. (2003) A lentivirus-based sys-tem to functionally silence genes in primarymammalian cells, stem cells and transgenicmice by RNA interference. Nat. Genet.33:401–406.
4. Tiscornia G., Singer O., Ikawa M. andVerma I.M. (2003) A general method
for gene knockdown in mice by usinglentiviral vectors expressing small interfer-ing RNA. Proc. Natl. Acad. Sci. USA 100:1844–1848.
5. Ventura A., Meissner A., Dillon C.P.,McManus M.T., Sharp P.A., Van Parijs L.,Jaenisch R. and Jacks T. (2004) Cre-lox con-ditional RNA interference from transgenes.Proc. Natl. Acad. Sci. USA 101: 10380–10385.
6. Szulc J., Wiznerowicz M., Sauvain M.-O., Trono D., and Aebischer P. (2006) Aversatile tool for conditional gene expressionand knockdown. Nat. Methods 3: 109–116.
7. Kissler S., Stern P., Takahashi K., Hunter K.,Peterson L.B. and Wicker L.S. (2006) In vivo

118 Kissler
RNA interference demonstrates a role forNramp1 in modifying susceptibility to type1 diabetes. Nat. Genet.38: 479–483.
8. Stegmeier F., Hu G., Rickles R.J., Han-non G.J., and Elledge S.J. (2005) A lentivi-
ral microRNA-based system for single-copypolymerase II-regulated RNA interferencein mammalian cells. Proc. Natl. Acad. Sci.USA102: 13212–13217.

Chapter 9
Transcriptional Gene Silencing Using Small RNAs
Daniel H. Kim and John J. Rossi
Abstract
RNA interference is a potent gene silencing pathway initiated by short molecules of double-strandedRNA. Small interfering RNAs (siRNAs) with full sequence complementarity to mRNAs induce cleavageof their target transcripts in the cytoplasm. Recent evidence has shown, however, that siRNAs can alsofunction in the nucleus of mammalian cells to affect changes in chromatin structure. When targeted topromoter regions, siRNAs load into the effector protein Argonaute-1 (AGO1) and direct the formationof silent chromatin domains. This mechanism is known as transcriptional gene silencing (TGS), and thedevelopment of TGS as a novel therapeutic modality would be applicable to chronic diseases where long-term, heritable silencing of target genes is warranted. Here we discuss how small RNAs can be used todirect TGS in mammalian cells.
Key words: RNAi, siRNA, microRNA, TGS, chromatin, epigenetic, methylation, transcription.
1. Introduction
1.1. RNAi andTranscriptional GeneSilencing
RNA interference (RNAi) is triggered by small RNAs that silencegene expression at the post-transcriptional level (1). Over the pastfew years, it has become increasingly apparent that componentsof the RNAi machinery also function in the nucleus of mam-malian cells. Small interfering RNAs (siRNAs) and microRNAs(miRNAs) 22 nucleotides in length initiate sequence-specific genesilencing by loading into effector Argonaute (AGO) proteins (1),and when targeted to promoter regions, small RNAs induce tran-scriptional gene silencing (TGS) through Argonaute-1 (AGO1)and histone methylation (2). Marks of facultative heterochro-matin, histone H3 lysine 9 dimethylation (H3K9me2) and his-tone H3 lysine 27 trimethylation (H3K27me3), are enriched at
John F. Reidhaar-Olson and Cristina M. Rondinone (eds.), Therapeutic Applications of RNAi: Methods and Protocols, vol. 555© Humana Press, a part of Springer Science+Business Media, LLC 2009DOI 10.1007/978-1-60327-295-7 9 Springerprotocols.com
119

120 Kim and Rossi
promoter regions targeted by small RNAs (2) and can be mea-sured using chromatin immunoprecipitation (ChIP) assays. Inthis chapter, we describe how to induce TGS in mammalian cellsthrough the effective design of promoter-targeting siRNAs andhow to assess the efficacy of silencing by examining chromatinmarks at the silenced promoter, as well as using nuclear run-onassays.
1.2. PotentialTherapeuticApplications of TGS
The use of TGS as a therapeutic modality would be applicable fortargeting chronic diseases such as human immunodeficiency virus(HIV) infection and consequent acquired immune deficiency syn-drome (AIDS) (1). Targeting the long-terminal repeat (LTR) ofHIV-1 with siRNAs has been shown to induce TGS (3). Simi-lar to TGS at endogenous promoters, the HIV-1 LTR exhibitsH3K27me3 when targeted by siRNAs in the U3 region of theLTR. Moreover, the chemokine (C-C motif) receptor 5 (CCR5),which serves as a co-receptor for HIV-1, is amenable to TGSusing siRNAs (2). Knockdown of CCR5 is therapeutically rele-vant, since the loss of CCR5 would inhibit R5-tropic HIV-1 fromgaining entry into its target cells. The development of therapeu-tic applications of TGS are still preliminary, however, and requirefurther testing in primary cells before additional progress can bemade.
2. Materials
2.1. Design ofPromoter-TargetingsiRNAs
1. http://www.invitrogen.com/rnai/2. http://genome.ucsc.edu/
2.2. AssessingHistone MethylationUsing ChIP
1. Synthetic siRNAs (Invitrogen).2. Lipofectamine 2000 (Invitrogen).3. 1% formaldehyde.4. 0.125 M glycine.5. 1X PBS.6. PMSF.7. ChIP lysis buffer, 50 mM HEPES at pH 7.5, 140 mM
NaCl, 10% Triton X-100, 0.1% Sodium Deoxycholate(NaD), 1/1000 PMSF.
8. Bioruptor sonicator with refrigerated water bath and arotating 1.5 mL microtube unit (Diagenode).
9. 50% Protein G Agarose slurry (Upstate).10. Anti-AGO1 (Upstate: 07-599), Anti-H3K9me2 (Upstate:
07-441), and Anti-H3K27me3 (Upstate: 07-449).

Transcriptional Gene Silencing Using Small RNAs 121
11. ChIP lysis buffer high salt, 50 mM HEPES at pH 7.5,500 mM NaCl, 1% Triton X-100, 0.1% NaD, 1/1000PMSF.
12. ChIP wash buffer, 10 mM Tris-HCl at pH 8.0, 250 mMLiCl, 0.5% NP-40, 0.5% NaD, 1 mM EDTA.
13. Elution buffer, 50 mM Tris-HCl at pH 8.0, 1% SDS,10 mM EDTA.
14. RNase A (10 mg/mL).15. 5 M NaCl.16. 0.5 M EDTA.17. 1 M Tris-HCl at pH 6.5.18. 10 mg/mL Proteinase K.19. Phenol/chloroform.20. iQ SYBR Green Supermix (Bio-Rad).
2.3. MeasuringTranscriptionalSilencing UsingNuclear Run-On
1. Synthetic siRNAs (Invitrogen).2. Lipofectamine 2000 (Invitrogen).3. 1X PBS.4. 0.5% NP-40 lysis buffer, 10 mM Tris-HCl at pH 7.4,
10 mM NaCl, 3 mM MgCl2.5. Reaction buffer, 10 mM Tris-HCl at pH 8.0, 5 mM
MgCl2, 0.3 mM KCl.6. 2.5 mM NTP + Biotin-16-UTP mix (Roche).7. RNA STAT-60 Reagent (Tel-Test).8. Streptavidin beads (Active Motif).9. 2X SSC, 15% formamide.
10. 2X SSC.11. 10 mM EDTA at pH 8.2.
3. Methods
3.1. Design ofPromoter-TargetingsiRNAs
Use an online siRNA design program, such as Invitrogen’s RNAidesigner, to enter the promoter sequence of a given gene ofinterest. Promoter sequences for human genes can be obtainedfrom the UCSC Genome Brower. Select promoter sequences–1 to –200 bp upstream of the known gene transcription start siteand enter them into the online siRNA design program. Chooseup to four siRNAs that span the promoter region to test their effi-cacy in triggering TGS of the target gene. The efficacy of siRNA-mediated TGS may be enhanced with increasing proximity to thetranscription start site, and several TGS studies (2–6) have showntargeting of promoter sequences –1 to –200 bp upstream of tran-scription start sites (Table 9.1). Important considerations forsiRNA design include proper antisense or guide strand incorpora-tion in AGO, since recent findings have shown that the antisense

122 Kim and Rossi
Table 9. 1Designing promoter-targeting siRNAs
TGS target genes siRNA target sites
EF1A –106 to –86
CDH1 –181 to –161
PR –26 to –7
CCR5 –183 to –163
uPA –131 to –111
strand alone is sufficient to induce TGS and heterochromatinformation, whereas the sense strand has no effect (3). Further-more, low levels of sense transcription across the targeted pro-moter region may be required for TGS to occur at a given genepromoter (7).
3.2. AssessingHistone MethylationUsing ChIP
Using siRNAs to target a promoter region induces epigeneticmodifications that silence gene expression at the chromatinlevel. Histone methylation marks H3K9me2 and H3K27me3 areenriched in promoter regions targeted by siRNAs. Two studieshave demonstrated that the CDH1 (4) and CCR5 (2) promotersexhibit increased levels of H3K9me2 when targeted with siRNAs.Additionally, the siRNA-targeted EF1A promoter exhibits bothH3K9me2 and H3K27me3 during TGS (3), suggesting that siR-NAs might regulate the “histone code” through the recruitmentof histone methyltransferases such as the Polycomb group com-ponent EZH2 (2). Here we outline how to assess chromatinmarks at siRNA-targeted promoters using ChIP, as previouslydescribed (3).
1. Transfect cells with control or promoter-specific siRNAs at50 nM final concentration using Lipofectamine 2000 (seeNote 1).
2. 24–48 h following transfection, crosslink 2 × 10⁷ cellswith 1% formaldehyde for 10 min at room temperature (seeNote 2).
3. Stop crosslinking by adding glycine at a final concentrationof 0.125 M for 10 min at room temperature.
4. Wash cells twice with cold 1X PBS + 1/1000 PMSF.5. Harvest cells in 1 mL of ChIP lysis buffer.6. Incubate for 10 min on ice.7. Centrifuge samples at 2,000 × g for 5 min at 4◦C and
remove supernatant.8. Resuspend pellet in 1 mL of ChIP lysis buffer and incubate
on ice for 10 min.

Transcriptional Gene Silencing Using Small RNAs 123
9. Sonicate lysates using a Bioruptor sonicator with refriger-ated water bath and a rotating 1.5-mL microtube unit forfive cycles of 30 s ON and 30 s OFF at HIGH setting (seeNote 3).
10. Centrifuge sonicated samples at 14,000 × g for 10 min at4◦C.
11. Remove supernatant and preclear with 60 �L of 50%Protein G Agarose slurry for 1 h at 4◦C with rotation.
12. Divide samples and perform immunoprecipitations using1–5 �g of Anti-AGO1, Anti-H3K9me2, and/or Anti-H3K27me3 overnight at 4◦C with rotation, along with noantibody controls.
13. Add 60 �L of 50% Protein G Agarose slurry to each samplefor 1 h at 4◦C with rotation.
14. Centrifuge at 1,200 × g for 3 min at 4◦C.15. Save no antibody control supernatants and use as input
control.16. Perform two washes with 1 mL of ChIP lysis buffer, two
washes with 1 mL of ChIP lysis buffer high salt, followedby two washes with 1 mL of ChIP wash buffer.
17. For each wash, incubate samples for 3 min at room tem-perature on a rotating platform, followed by centrifugationat 1,200 × g for 3 min at room temperature.
18. Add 100 �L of elution buffer for 10 min at 65◦C, followedby centrifugation at 14,000 × g for 3 min at room temper-ature (repeat Step 18).
19. Reverse crosslinks in eluted samples by adding 1 �L ofRNase A and 20 �L of 5 M NaCl and incubate for 4–6 hat 65◦C.
20. Add 10 �L of 0.5 M EDTA, 20 �L of 1 M Tris-HCl atpH 6.5, and 2 �L of Proteinase K and incubate for 1 h at45◦C.
21. Recover DNA by phenol/chloroform extraction.22. Use promoter-specific primers and iQ SYBR Green Super-
mix to assess the enrichment of chromatin marks usingquantitative PCR (qPCR) (see Note 4).
3.3. MeasuringTranscriptionalSilencing UsingNuclear Run-On
Here we outline how to measure the extent of transcriptionalsilencing using nuclear run-on assays, as previously described (8).
1. Transfect cells with control or promoter-specific siRNAs at50 nM final concentration using Lipofectamine 2000.
2. 24–48 h following transfection, wash 2 × 10⁷ cells twicewith cold 1X PBS.
3. Harvest cells and lyse on ice in 0.5% NP-40 lysis buffer.4. Centrifuge at 500 × g for 10 min.5. Remove supernatants.6. Incubate nuclei in reaction buffer and 2.5 mM NTP +
Biotin-16-UTP mix for 45 min at 30◦C.

124 Kim and Rossi
7. Stop transcription reaction by adding RNA-STAT-60 andrecover RNA.
8. Isolate biotinylated nascent RNA transcripts by incubationwith streptavidin beads for 2 h at room temperature on arocking platform.
9. Centrifuge at 3,000 × g for 3 min to collect beads.10. Wash once with 2X SSC, 15% formamide for 10 min on a
rocking platform.11. Wash twice with 2X SSC for 5 min on a rocking platform.12. Elute biotinylated RNA from streptavidin beads in H2O or
10 mM EDTA at pH 8.2 by incubating at 90◦C for 10 min.13. Use mRNA-specific primers to analyze nascent RNA tran-
script levels using qRT-PCR.
4. Notes
1. Analogous to traditional RNAi experiments, it is critical tooptimize transfection conditions for a given cell type. Whilethe use of Lipofectamine 2000 has been described, certaincell types may not exhibit a high level of transfection effi-ciency using this reagent.
2. Some cell types may exhibit slower doubling times and mayrequire longer periods of time to establish TGS followingsiRNA transfection. In these instances, waiting 48–72 h aftersiRNA transfection may provide a better window to assesssilent chromatin marks using ChIP.
3. For ChIP experiments, optimization of chromatin shearingconditions is critical and must be determined separately foreach cell type.
4. Some genes may not be amenable to siRNA-mediated TGS.Low levels of sense transcription across the target promoterregion may be necessary for the siRNA antisense or guidestrand to recognize and target. Additionally, highly euchro-matic genes may not be susceptible to siRNA-directedheterochromatin formation.
Acknowledgments
This work was supported by a City of Hope Graduate SchoolInternal Fellowship to D.H.K. and National Institutes of Healthgrants R37-AI29329 and R01-AI42552 to J.J.R.

Transcriptional Gene Silencing Using Small RNAs 125
References
1. Kim, D. H. and Rossi, J. J. (2007) Strategiesfor silencing human disease using RNA inter-ference. Nat. Rev. Genet. 8, 173–184.
2. Kim, D. H., Villeneuve, L. M., Morris, K. V.,and Rossi, J. J. (2006) Argonaute-1 directssiRNA-mediated transcriptional gene silenc-ing in human cells. Nat. Struct. Mol. Biol. 13,793–797.
3. Weinberg, M. S., Villeneuve, L. M., Ehsani,A., Amarzguioui, M., Aagaard, L., Chen, Z.X., Riggs, A. D., Rossi, J. J., and Morris, K.V. (2006) The antisense strand of small inter-fering RNAs directs histone methylation andtranscriptional gene silencing in human cells.RNA 12, 256–262.
4. Ting, A. H., Schuebel, K. E., Herman, J.G., and Baylin, S. B. (2005) Short double-stranded RNA induces transcriptional genesilencing in human cancer cells in the absenceof DNA methylation. Nat. Genet. 37,906–910.
5. Janowski, B. A., Huffman, K. E., Schwartz,J. C., Ram, R., Hardy, D., Shames, D. S.,Minna, J. D., and Corey, D. R. (2005)Inhibiting gene expression at transcriptionstart sites in chromosomal DNA with anti-gene RNAs. Nat. Chem. Biol. 1, 216–222.
6. Pulukuri, S. M. and Rao, J. S. (2007)Small interfering RNA directed rever-sal of urokinase plasminogen activatordemethylation inhibits prostate tumorgrowth and metastasis. Cancer Res. 67,6637–6646.
7. Han, J., Kim, D., and Morris, K. V. (2007)Promoter-associated RNA is required forRNA-directed transcriptional gene silencingin human cells. Proc. Natl. Acad. Sci. USA104, 12422–12427.
8. Zhang, M. X., et al. (2005) Regulation ofendothelial nitric oxide synthase by smallRNA. Proc. Natl. Acad. Sci. USA 102,16967–16972.

Chapter 10
Alternative Splicing as a Therapeutic Target for HumanDiseases
Kenneth J. Dery, Veronica Gusti, Shikha Gaur, John E. Shively, Yun Yen,and Rajesh K. Gaur
Abstract
The majority of eukaryotic genes undergo alternative splicing, an evolutionarily conserved phenomenon,to generate functionally diverse protein isoforms from a single transcript. The fact that defective pre-mRNA splicing can generate non-functional and often toxic proteins with catastrophic effects, accurateremoval of introns and joining of exons is vital for cell homeostasis. Thus, molecular tools that couldeither silence a disease-causing gene or regulate its expression in trans will find many therapeutic applica-tions. Here we present two RNA-based approaches, namely RNAi and theophylline-responsive riboswitchthat can regulate gene expression by loss-of-function and modulation of splicing, respectively. Thesestrategies are likely to continue to play an integral role in studying gene function and drug discovery.
Key words: Alternative splicing, spliceosome, RNAi, theophylline-responsive riboswitch.
1. Introduction
The diversity of the human proteome is attributable in largepart to the complexity and processing of pre-mRNAs via a pro-cess known as RNA splicing. This biochemical pathway leads tothe assembly onto pre-mRNA of the mature spliceosome, whichcatalyzes the excision of non-coding sequences from precursormRNA. A pre-mRNA is defined by four cis-acting elements: the 5′
and 3′ splice sites (ss), the branchpoint sequence, and the poly(Y)-tract. These cis-acting elements direct the assembly of the basalsplicing machinery that leads to the removal of introns and join-ing of exons. In general, pre-mRNAs that undergo alternative
John F. Reidhaar-Olson and Cristina M. Rondinone (eds.), Therapeutic Applications of RNAi: Methods and Protocols, vol. 555© Humana Press, a part of Springer Science+Business Media, LLC 2009DOI 10.1007/978-1-60327-295-7 10 Springerprotocols.com
127

128 Dery et al.
splicing harbor suboptimal splicing signals and often require thehelp of auxiliary regulatory elements known as splicing enhancersand silencers for splice site pairing. These elements provide thebinding surface for splicing regulatory proteins that communi-cate with the basic splicing machinery to define splice site choice(for review see Ref. 1–3).
Alternative splicing of pre-mRNA is now considered to be themost important source of protein diversity in vertebrates. It is esti-mated that more than 60% of human genes generate transcriptsthat are alternatively spliced (4, 5) and 70–90% of alternative splic-ing events affect coding capacity of genes (6). Importantly, dereg-ulated splice variant expression has been identified as the causeof a number of genetic disorders, and certain forms of cancerhave been linked to unbalanced isoform expression from genesinvolved in cell cycle regulation or apoptosis (7, 8). Given thecritical role of alternative splicing in a variety of cellular processes(9), strategies that could influence pre-mRNA splicing decisionswill have far-reaching effects in biotechnology and medicine. Thischapter focuses on the design and construction of two RNA-based molecular approaches, namely RNA interference (RNAi)and theophylline riboswitch, with the ultimate aim of regulat-ing gene expression. Whereas RNAi exerts its effect in trans todownregulating the expression of a target gene, theophylline-responsive riboswitch controls gene expression by modulatingpre-mRNA splicing.
The use of RNAi as a gene-silencer strategy represents a pow-erful tool in the field of small-molecule nucleic acid-based thera-peutics. Described first in Caenorhabditis elegans, this biologicalphenomenon has subsequently been studied in a wide range oforganisms (for recent review, see (10)). RNAi involves double-stranded RNA molecules of approximately 20–25 nucleotidestermed short interfering RNAs (siRNAs) that are processed bythe endogenous RNAse III family member Dicer and are incor-porated into an RNA-induced silencing complex (RISC) in a pro-cess that prevents the expression of a particular gene (11). Therelative ease with which a siRNA can be designed and synthe-sized, its specificity and potency and, most importantly, the abilityto preferentially suppress the expression of mutant alleles makesthis approach highly appealing. Moreover, RNAi not only has thepotential to be an effective therapeutic tool, but also enables theidentification of genes that regulate alternative splicing (7, 12).However, RNAi is faced with limitations when compared withother approaches such as the theophylline-responsive riboswitchand antisense oligonucleotides, which unlike RNAi, can modulatemRNA isoform levels (13–16).
Riboswitches (17, 18) are natural RNA aptamers that reg-ulate gene expression by binding to small-molecule ligands. AsRNA structures (14, 19) are known to influence splice site choice,

Alternative Splicing as a Therapeutic Target 129
we hypothesized that sequestering of splicing regulatory elementswithin RNA secondary structure could influence splice site choice.By exploiting the ligand-induced conformational rearrangementproperty of theophylline riboswitch we have demonstrated thecontrol of alternative splicing both in vitro and in vivo (13, 14,20). This novel technology represents the possibility for control-ling splicing of a trans gene in a gene therapy setting where thetarget gene expression could be controlled in a ligand-dependentmanner.
2. Materials
2.1. RNA Interference 1. All buffers and solutions were made using filtered deionized,18 M� water purified by a Barnstead MP-3A Megapure sys-tem.
2. Fetal bovine serum (Irvine Scientific, CA, USA).3. MCF7 cells: This is a malignant mammary epithelial cell line
(ATCC, Manassas, VA, http://www.atcc.org/).4. Minimum essential medium (MEM): 2 mM L-glutamine
and Earle’s BSS adjusted to contain 1.5 g/l sodium bicar-bonate, 0.1 mM non-essential amino acids, and 1 mMsodium pyruvate and supplemented with 0.01 mg/mlbovine insulin; and 10% fetal bovine serum (ATCC, Man-assas, VA, http://www.atcc.org/).
5. Lipofectamine 2000 transfection reagent (Invitrogen, CA,USA).
6. Opti-MEM (Invitrogen, CA, USA).7. siRNAs: We synthesized the following RNAi oligos against
human CEA: sense 5′-CUGGCCAGUUCCGGGUAUA-3′ and antisense 5′-UAUACCCGGAACUGGCCAG-3′
(nucleotides 404–422, numbering from the initial startcodon); sense 5′-CGGGACCUAUGCCUGUUUU-3′ and antisense 5′-AAAACAGGCAUAGGUCCCG-3′
(nucleotides 1950–1968, numbering from the initial startcodon), (Qiagen, CA, USA). A scrambled control siRNAwas synthesized at the City of Hope DNA/RNA corefacility and is randomized with respect to its nucleotidedistribution. The siRNAs were diluted in water to a stockconcentration of 20 �M.
2.2. Western Blot 1. ECL plus Western Blotting detection reagents (AmershamBiosciences, Buckinghamshire, England).
2. Blocking buffer: 150 mM NaCl, 5 mM EDTA, 50 mM Tris-HCl, pH 7.5, 0.05% Triton X-100, 0.25% gelatin. Blocking

130 Dery et al.
buffer can be made as a 10x stock and stored at room tem-perature without gelatin. Store the 1x dilution at 4◦C.
3. Lysis buffer: 10 mM Tris-HCl, pH 8, 140 mM NaCl,0.025% sodium azide, 1% Triton X-100, 1 mM EDTA,1 mM PMSF, and 1 mM sodium vanadate.
4. 2x Gel loading buffer: 0.125 M Tris-HCl, pH 6.8, 4% SDS,20% glycerol, 10% 2-mercaptoethanol, 0.005% bromophe-nol blue.
5. Anti-�-actin Goat Polyclonal IgG (Santa Cruz Biotechnol-ogy, Inc, CA, USA). Dilution for immunoblots, 1:2000.
6. Donkey �-Goat IgG-HRP (Santa Cruz Biotechnology, Inc,CA, USA). Dilution for immunoblots, 1:5000.
7. Goat �-Mouse IgG-HRP (Santa Cruz Biotechnology, Inc,CA, USA). Dilution for immunoblots, 1:5000.
8. �-CEA T84.66: This is a chimeric monoclonal antibody ofhigh specificity for tumor-associated CEA (22). Dilution forimmunoblots, 1:2000.
9. Immun-blot PVDF/Filter Paper (BioRad, CA, USA).
2.3. Theophylline-ResponsiveRiboswitch
1. �-[32P] UTP: 3000 Ci/mmol, 10 �Ci/�l (Perkin Elmer,MA, USA).
2. 8% Denaturing polyacrylamide gel: From the Sequa-gelsequencing system kit (see Section 2.3, Step 17), mix6.4 ml of Sequa-gel concentrate, 11.6 ml of Sequa-gel dilu-ent, and 2 ml of Sequa-gel buffer. To this solution, add200 �l of 10% ammonium persulfate and 20 �l of TEMED.Swirl gently to mix and cast the gel.
3. BC300: 20 mM HEPES, pH 8.0, 20% glycerol, 300 mMKCl, 0.2 mM EDTA.
4. Dithiothreitol (DTT): To prepare a 0.1 M stock, add0.154 g of DTT in 10 ml RNAse-free water.
5. Dulbecco’s Modified Eagle medium supplemented with L-glutamine and 10% fetal bovine serum (Omega Scientific,CA, USA).
6. Electrophoresis sample buffer: Add 2.4 ml 1 M Tris-HCl,pH 6.8, 3 ml 20% SDS, 3 ml 100% glycerol, 1.6 ml2-mercaptoethanol, 0.006 g bromophenol blue. Store at4◦C.
7. Exon junction primers: The following primerswere used to assess theophylline-mediated modu-lation of alternative splicing in vivo: #43573, 5′-GGGCCAGCTGTTGGGGTCGA-3′ and #43754,5′-GGGCCAGCTGTTGGGCTCGC-3′ as forwardprimers and oligonucleotide #39368, 5′-TAGAGGATCCCCACTGGAAAGACCG-3′ as reverse primer.
8. 5x First-strand buffer for cDNA synthesis: 250 mM Tris-HCl, pH 8.3, 375 mM KCl, 15 mM MgCl2.

Alternative Splicing as a Therapeutic Target 131
9. Glycogen: Stock solution is 20 mg/ml (Roche Applied Sci-ence, Mannheim, Germany). Dilute to 5 mg/ml and storein small aliquots at –20◦C.
10. HeLa nuclear extract for in vitro splicing: HeLa nuclearextract was prepared from 10 l HeLa-S3 cells (NationalCell Culture Center, MN, USA) as described previously(21). HeLa nuclear extracts can also be purchased from 4CBiotech (Seneffe, Belgium).
11. Lipofectamine 2000 (Invitrogen, CA, USA).12. Molecular Dynamics PhosphorImager and the ImageJ soft-
ware (http://rsb.info.nih.gov/ij/) were used to quanti-tate the products of the in vitro RNA splicing reaction andRNAi experiments.
13. M-MLV reverse transcriptase (Invitrogen, CA, USA).14. Opti-MEM Reduced Serum Medium (Invitrogen, CA,
USA).15. Proteinase K (Roche Applied Science, Mannheim,
Germany).16. RNasin: 10 units/10 �l reaction (Promega, WI, USA).17. Sequa-gel sequencing system kit: Contains Sequa-gel con-
centrate, Sequa-gel diluent, and Sequa-gel buffer (NationalDiagnostics, Georgia USA).
18. Splicing loading buffer: Mix 2 mg of xylene cyanoland 2 mg of bromophenol blue in 10 ml of deionizedformamide.
19. 7mG(ppp)G RNA cap structure analog: Dilute the stock in131 �l RNase-free water to give a working concentrationof 10 mM. For transcription reactions, use a 5:1 ratio of7mG(ppp)G RNA cap structure analog to GTP.
20. Splicing stop buffer: To stop in vitro splicing reaction, add50 �l 2x PK buffer, 2.5 �l 10 mg/ml Proteinase K, 2 �l of5 mg/ml glycogen, and RNase-free water to a total volumeof 87.5 �l.
21. 2x PK buffer: 200 mM Tris-HCl, pH 7.5, 25 mM EDTA,pH 8.0, 300 mM NaCl, 2% SDS.
22. 10x RNA polymerase reaction buffer: 400 mM Tris-HCl,pH 7.9, 60 mM MgCl2, 20 mM spermadine, 100 mMDTT.
23. 10x transcription master mix: Combine 3.1 �l each of4 mM GTP, 20 mM ATP, 20 mM CTP, 4 mM UTP, and10 �l of 0.1 M DTT. The mixture is gently agitated andbriefly micro-centrifuged to bring the mixture to homo-geneity. Dispense 2.24 �l per transcription reaction. Storemix @ –20◦C with limited freeze–thaw cycles.
24. 25 mM Theophylline: Add 0.09 g theophylline (Sigma-Aldrich, MO, USA) to 20 ml of RNase-free water. For afinal concentration of 2 mM, add 2 �l to a 25 �l splicingreaction.

132 Dery et al.
25. T7 RNA polymerase: 10 units/10 �l reaction (New Eng-land Biolabs, MA, USA).
26. 13% denaturing polyacrylamide gel: From the Sequa-gelsequencing system kit (see Section 2.3, Step 17), mix10.4 ml of Sequa-gel concentrate, 7.6 ml of Sequa-gel dilu-ent, and 2 ml of Sequa-gel buffer. To this solution, add200 �l of 10% ammonium persulfate and 20 �l of TEMED.Swirl gently to mix and cast the gel.
3. Methods
3.1. siRNA-MediatedDegradation of CEAmRNA
The siRNA inhibits gene expression by degrading the corre-sponding endogenous mRNA. RNAi has been successfully used inestablishing the role of splicing regulatory proteins in human can-cer (22–25). In addition, siRNA-mediated downregulation of Bcl-xL isoform in TRAIL-resistant cells has been shown to inhibit cellproliferation and sensitize TRAIL-induced apoptosis in humancancer cells with both acquired and intrinsic TRAIL resistance(26). However, the design of siRNA that targets with high effi-ciency and specificity is critical to successful gene silencing. Herewe show that RNAi can be used to downregulate carcinoembry-onic antigen (CEA), a glycoprotein that is overexpressed in a vari-ety of cancers (27, 28).
3.1.1. siRNA Design Prior to finding an RNAi target on the gene of inter-est, the mRNA sequence or sequence accession numbershould be retrieved from Refseq at NCBI. The Entrezquery tool can be located at http://www.ncbi.nlm.nih.gov/entrez/query.fcgi?db=Nucleotide. On the “Limits” tab, pulldown the “Only from” menu and choose Refseq. This willrestrict the query to the RefSeq database only. Other poten-tial search routes are: (1) Search LocusLink by gene nameor symbol at http://www.ncbi.nlm.nih.gov/LocusLink/ and(2) Search Entrez Gene at http://www.ncbi.nlm.nih.gov/entrez/query.fcgi?db=gene (see (29), Table 1 for a list of otherWeb servers for siRNA design). To prevent off-target effects,check the gene of interest for significant homology to othergenes or sequences in the genome using the NCBI Blast tool –Nucleotide–nucleotide BLAST (blastn), or Blat tool on UCSCGenome Website http://genome. ucsc.edu/cgi-bin/hgBlat, orEnsembl Blast at http://www.ensembl.org/Multi/blastview.
Many different algorithms and programs that depend onsequence characteristics or target mRNA secondary structures areavailable now for the design of siRNAs for post-transcriptionalgene silencing (29–32). The whole length of an mRNA sequence

Alternative Splicing as a Therapeutic Target 133
can be targeted by RNAi though it is especially important to becognizant that not all siRNAs target the mRNA with equal effi-ciency. It is crucial to perform a homology search for candidatesiRNA targets against other mRNA sequences of the genome.In general, a siRNA should not have significant homology withunrelated sequences especially at its 3′ end. If a siRNA designprogram does not provide the function for homology sequence,a manual BLAST search is mandatory for avoiding off-targeteffects. The main challenge for developing siRNA in vivo is deliv-ering duplex RNA intact to a target tissue. Many of these phar-macokinetic obstacles also confront antisense oligonucleotides.However, a crucial difference between the two is that antisenseoligonucleotides comprise just one nucleic acid strand, whereassiRNA is made up of two strands. On a practical level, the massof a synthetic duplex RNA is twice that of a traditional anti-sense oligonucleotide and can result in increased costs. The highermolecular weight of siRNA can also make uptake by cells moredifficult. Furthermore, the presence of a second nucleic acidstrand increases the potential for off-target effects. For effectivedelivery, high duplex stability is needed because duplex RNA mustremain hybridized until it enters the RISC complex. The mosteffective siRNA is identified experimentally with rules that governeffective siRNA design dependent on the particular application.Here we present some sequence-characteristic-based guidelinesto design high-efficiency siRNAs (33, 34):
1. Regions located 50–100 nt downstream of the start codon(ATG) make good targets for RNAi.
2. Sequence motifs that have AA(N19)TT, NA(N21), orNAR(N17)YNN where N is any nucleotide, R is purine (A,G), and Y is pyrimidine (C, U) make good targets for RNAi.
3. Avoid introns. As siRNAs are processed only in the cyto-plasm and not within the nucleus, post-transcriptional pro-cessing would prevent targeting of the siRNA.
4. Sequences with high G + C content (more than 50%) shouldbe avoided. The GC content of the sense strand should bebetween 30 and 50%.
5. Stretches of polynucleotide repeats should be avoided.
3.1.2. RNAi Against CEA To investigate the relationship between overexpression of CEAand breast cancer progression, we employed two chemically syn-thesized siRNAs (siRNAs #497 and #2043) to downregulateCEA mRNA (see Note 1). To monitor the cellular uptake, ascrambled control siRNA (Sc) bearing fluorescein at the 5′ endof the antisense strand was also synthesized. MCF7 cells thatare known to overexpress CEA were transiently transfected withdifferent siRNAs (see Section 3.1.3 for details on animal celltransfection, see Note 2). After indicated time (we recommendperforming a time course), cells were harvested and protein

134 Dery et al.
lysates were resolved on a 4–20% SDS-polyacrylamide gradientgel followed by transfer to a polyvinylidene fluoride (PVDF)membrane. Transferred proteins were probed with either anti-CEA or anti-�-actin antibody. Our results demonstrate that com-pared to Sc control, siRNA #497 significantly downregulatedCEA protein (Fig. 10.1A) (see Note 3). By contrast, siRNA#2043 showed moderate downregulation of CEA protein (54%).This observed difference could be due to the accessibility of thetarget region and not unequal loading of sample as evidenced bythe levels of probes to �-actin protein (Fig. 10.1A). We note thathigh dosages of siRNA #497 are more effective at gene silencing;suggesting that nuclease digestion likely limits the efficacy at thelower concentration (Fig. 10.1A, compare lane 4 with lane 5). Atime course presented in Fig. 10.1B demonstrates that knock-down of CEA protein occurs as early as 24 h and is effectiveat least up to 72 h post-treatment. The slight increase in pro-tein levels at 72 h is apparently the effect of siRNA depletion(Fig. 10.1B, compare lane 3 with lane 4).
ASc
100 200 100 200
#2043 #497
CEA
ß-actin
200 Concentration (nM)
siRNA
0 54 62 7983
2 3 4 51
% down-regulation
Lanes
B48 24 48 72
#497
CEA
ß-actin
19690 10
ScTime (hr)
siRNA
2 3 41
% down-regulation
Lanes
Fig. 10.1. Gene silencing of CEA by RNAi. (A) Western blot of MCF7 cells treated for48 h with siRNAs #2043, #497, and a scrambled (Sc) control at a concentration of 100nM (lanes 2 and 4) or 200 nM (lanes 1, 3, and 5). (B) MCF7 cells treated after 24, 48, and72 h with 200 nM siRNAs #497 or 200 nM Sc as indicated. Upper panels in both A andB show a Western blot probed with �-CEA T84.66 while the lower panels were treatedwith anti-�-actin antibody. The percentage of downregulation is indicated below eachpanel and calculated by comparing CEA downregulation to �-Actin and normalizing tothe scrambled control.

Alternative Splicing as a Therapeutic Target 135
3.1.3. TransientTransfection of MCF7Cells
1. In 2 ml MEM supplemented with 10% fetal bovine serum,seed the following number of cells in each well of a six-wellplate 24 h prior to transfection: 6 × 10⁵ cells (70% conflu-ency for harvest time at 24 h), 5 × 10⁵ cells (60% confluencyfor harvest time at 48 h), and 4 × 10⁵ cells (50% confluencyfor harvest time at 72 h).
2. Cells should be maintained under standard incubationconditions (humidified atmosphere, 5% CO2, 37◦C) (seeNote 4).
3. Next day, prepare two mixtures in separate eppendorf tubes(A and B). Tube A contains either 100 or 200 nM siRNAdiluted with Opti-MEM (see Note 5) to a final volumeof 250 �l. Tube B contains 2 �l Lipofectamine 2000(see Note 6) diluted with Opti-MEM to a final volume of250 �l. A master mix is recommended if all the wells to betransfected contain the same siRNA.
4. After an incubation period of 5 min, both tubes A and Bare combined and incubated for 20 min to allow complexformation between siRNA and the Lipofectamine 2000.
5. Prior to the completion of the 20-min incubation period,aspirate the media from cells and replace with 2 ml freshmedia to each well.
6. Add RNAi–Lipofectamine 2000 complex (500 �l per well)dropwise. Distribute around the well and gently swirl theplate.
7. Cells should be maintained under standard incubation con-ditions (humidified atmosphere, 5% CO2, 37◦C) for an addi-tional 24–72 h depending on the harvest time.
8. Assay the cells using the appropriate post-treatment protocol(see Section 3.1.4 for Western Blot Protocol and Section3.2.7 for RT-PCR analysis; see Note 7).
3.1.4. Western BlotAnalysis
1. After the indicated time, cells are harvested and the lysate isprepared by adding 150–200 �l of lysis buffer.
2. The cells are homogenized by the passage (approximately 10times) through a 1-ml syringe with a 22-gauge needle.
3. Next, spin the homogenized cell lysate @ 10,000 × g for20 min at 4◦C. Remove the supernatant and to the cell pelletadd 2x Gel loading buffer.
4. The protein lysates were resolved on a 4–20% SDS-polyacrylamide gradient gel essentially as described earlier(35). Next, the proteins were transferred to an Immun-Blot PVDF membrane and incubated in blocking buffer for60 min at room temperature on a shaking platform (with achange of buffer after 30 min).
5. The primary antibodies, either �-CEA T84.66 or anti-�-actin Goat Polyclonal IgG, are next added to the blocking

136 Dery et al.
buffer and incubated in the presence of the membraneovernight at room temperature on a shaking platform (seeNote 8).
6. Next day, the membrane is washed three times (20 min eachrinse) in blocking buffer followed by an additional incu-bation with the secondary antibody (either Goat �-MouseIgG-HRP or Donkey �-Goat IgG-HRP) for 1 h in blockingbuffer.
7. After washing, develop the membrane using Amersham ECLPlus Western Blotting detection reagents, following themanufacturer’s recommendation (see Note 9).
3.2. Theophylline-ResponsiveRiboswitch
It is widely accepted that deregulated alternative splicing is thecause of a number of human diseases. It has been estimated thatapproximately 15% of all mutations that cause genetic diseasesresult in defective splicing of pre-mRNA: defects in splicing hasbeen shown to be associated with genetic disorders such as �-thalassemia, cystic fibrosis, Duchenne muscular dystrophy, etc. Inaddition, certain forms of cancer have been linked to unbalancedisoform expression from genes involved in cell cycle regulation orangiogenesis (reviewed in Refs. (12, 36)). Given the significanceof alternative splicing in generating protein diversity and its link tohuman diseases, mRNA splicing has become an important targetof therapeutic intervention (37).
We have recently demonstrated that a theophylline-responsiveriboswitch, an RNA aptamer that binds to theophylline with highaffinity and specificity, can modulate alternative splicing both invitro and in cultured cells (13, 14, 20). This approach can be mod-ified to regulate the expression of virtually any trans-gene by con-trolling its splicing. Here we describe the experimental details forcontrolling pre-mRNA splicing with the theophylline-responsiveriboswitch.
3.2.1. Design ofTheophylline-ResponsiveRiboswitch
Theophylline riboswitch is an RNA aptamer consisting of a 15-ntcore sequence, which provides affinity and specificity for RNA–theophylline interaction (Fig. 10.2A). Remarkably, caffeine thatdiffers from theophylline by only a methyl group at the N-7 posi-tion in the imidazole ring binds to theophylline aptamer with10,000-fold less affinity (38). Theophylline aptamer is unstruc-tured; however, ligand-induced conformational rearrangement ofRNA allows theophylline binding by formation of thermodynam-ically stable RNA–theophylline complex. Although theophyllineriboswitch can be adapted to control pre-mRNA splicing by tar-geting a variety of cis-acting regulatory elements, here in thissection we focus our attention at the branchpoint sequence. Weconstructed a model pre-mRNA comprising of three exons inter-rupted by two introns (ABT4M, Fig. 10.2B). Our data indi-cate that sequestering of intron 1 branchpoint by theophylline

Alternative Splicing as a Therapeutic Target 137
0 2 Theophylline (mM)
ABT4M
200
300400500750
100
321
1
2 3
3
2 31
1 3
2 31
2 31
2
*
Lanes
Exon 2 exclusion/inclusion ratio
0.9 2.7
M
Fold activation 3.0
1000
C
CCU
U
A
G
CG
G
G
C
C
GC
C
GG C
C G
U ACA
AA A
A G
C GC G
Theophylline
N1
N9
N7
O
H
H3C
N
O
CH3
H
N3
A
5’ 3’
B
ABT4M
A
Exon 1 Exon 2 Exon 3
50 50 51153 126
AG AGA
Fig. 10.2. Ligand-dependent modulation of alternative splicing using theophylline-binding aptamer in vitro. (A)Diagram of the theophylline RNA aptamer sequence (left panel) and the chemical structure of theophylline (right panel ).The residues that are conserved for theophylline binding are enclosed in the rectangular box. (B) Schematic represen-tation of a theophylline-binding aptamer sequestering the branchpoint of a model pre-mRNA. The encircled adenosineresidue represents branch nucleotide. Open boxes represent exon sequences and horizontal lines between exons indi-cate introns. The numbers indicate size of the exon or intron. (C) In vitro splicing of ABT4M pre-mRNA. 32P-labeledABT4M pre-mRNA was subjected to in vitro splicing in the absence (lane 1) or presence of 2 mM theophylline (lane2). The extracted RNAs were fractionated on a 13% polyacrylamide denaturing gel. Schematic representations of thevarious RNA species are indicated on the left. Molecular Dynamics PhosphorImager and the ImageJ software were usedto quantitate the products of the in vitro and in vivo RNA splicing reactions (see Fig. 10.3).
allows intron 2 branchpoint to choose between the 5′ ss of exon1 and 2 for the first step of splicing. Thus, depending upon whichof the two 5′ ss is utilized determines the amount of exon 2included/excluded mRNA (see Sections 3.2.2 and 3.2.5). Sincetheophylline aptamer’s lower stem affects thermodynamic stabil-ity of RNA–theophylline complex, splicing can be fine-tuned bysimply altering the size of the stem (14, 19) (see Notes 10, 11).
3.2.2. Theophylline-Responsive Riboswitchfor the Modulation ofPre-mRNA Splicing InVitro
32P-labeled ABT4M pre-mRNA was transcribed (see Section3.2.3) and incubated in HeLa nuclear extract in the absence orpresence of theophylline (Fig. 10.2C). Splicing of ABT4M sub-strate gave rise to two spliced products, a slower migrating bandthat represents full-length mRNA and a faster moving band whichrepresents exon 2-skipped mRNA generated as a result of alterna-tive splicing. Notably, theophylline shifted the splicing of ABT4Mpre-mRNA in favor of exon 2-excluded isoform by repressing theactivation of intron 1 branchpoint.

138 Dery et al.
3.2.3. In VitroTranscription
T7 RNA polymerase transcription reactions were prepared in12.5 �l volumes containing 1x RNA polymerase reaction buffer:0.5 mM (ATP, CTP, GTP), 0.1 mM UTP, 10 mM DTT,500 ng of linearized DNA template, 20 �Ci �-[32P] UTP(3000 Ci/mmol), 0.5 unit RNasin, and 0.5 units of T7 RNApolymerase. Assemble this reaction by preparing a 10x Transcrip-tion master mix (see Materials Section 2.3). To each pre-chilledsample eppendorf tube, the following is added in order:
1. 2.5 �l of RNase-free water2. 2.2 �l of 10x Transcription master mix3. 2.5 �l 7mG(ppp)G RNA cap structure analog4. 1.3 �l RNA polymerase reaction buffer5. 1 �l of DNA template6. 0.5 �l of T7 RNA polymerase7. 0.5 �l of RNasin8. 2 �l �-[32P] UTP9. Incubate at 37◦C for 120 min.
Reactions are terminated by adding an equal volume of splic-ing loading buffer and heated at 65◦C for 5 min. Briefly incubatethe tube on ice and resolve by 8% denaturing PAGE gel elec-trophoresis.
3.2.4. In Vitro SplicingAssay
The extract preparation and in vitro splicing assay has beendescribed previously (21, 39). Assemble the splicing reaction inthe following order:
1. 1 �l BC3002. 0.5 �l 160 mM MgCl23. 1 �l of 10,000 c.p.m labeled RNA substrate4. 1 �l 0.5 M Creatine phosphate5. 0.5 �l 25 mM ATP6. 0.25 �l 0.1 M DTT7. 0.25 �l RNasin8. 2 �l 25 mM Theophylline or RNase-free water in control
splicing reaction9. RNase-free water to a volume of 12.5 �l
10. 12.5 �l HeLa nuclear extract11. Incubate at 30◦C for 2 h and terminate by the addition of
87.5 �l splicing stop buffer.12. Extract the RNA from the reaction mixtures by phenol-
chloroform treatment followed by ethanol precipitation.13. The RNA pellet is washed with 70% aqueous ethanol,
dried, and dissolved in 10 �l loading buffer.14. Splicing intermediates and products are analyzed by elec-
trophoresis on a 13% denaturing polyacrylamide gel run at50 W for 6 h.

Alternative Splicing as a Therapeutic Target 139
3.2.5.Theophylline-DependentControl of AlternativeSplicing In Vivo
To determine whether theophylline-induced sequestering ofbranchpoint can control splicing in living cells, we insertedthe DNA that encodes ABT4M pre-mRNA into the mam-malian expression vector pcDNA Myc/His yielding pcABT4M.A mutant (pcABT4Mmu) that does not bind to theophylline wasalso constructed. Next, HeLa cells were transfected transiently(see Section 3.2.6) with pcABT4M, pcABT4Mmu, or emptyvector and treated with theophylline or buffer. After 24 h, cellswere harvested, and total RNA was isolated. Reverse transcrip-tion followed by PCR shown in Fig. 10.3A demonstrates thattheophylline can regulate the alternative splicing of ABT4M pre-mRNA (compare lane 4 with 5). In contrast, theophylline had
B
0
1
2
3
4
5
ABT4M ABT4Mmu
Control
Theophylline
A
Theophylline (mM)No
tran
sfec
tion
Em
pty
vect
orABT4M ABT4Mmu
100
200
(bp) M
31 2
1 3
0 1 0 1
7651 3 42Lanes
Exo
n 2
excl
usio
n:in
clus
ion
ratio
Fig. 10.3. Theophylline-mediated modulation of alternative splicing in vivo.(A) HeLa cells were transiently transfected with empty vector, pcABT4M or pcABT4Mmu(containing mutations within core theophylline-binding aptamer). Cells were treated withbuffer (lanes 4 and 6) or with 1 mM theophylline (lanes 5 and 7). The product of RT-PCRassays of total RNA isolated from each well was analyzed on a 2.5% agarose gel toestimate the effect of theophylline on the efficiency of exon 2 alternative splicing. ThePCR-amplified bands corresponding to exon 2-included or -excluded mRNA is indicated.(B) The internal exon 2 exclusion: inclusion ratio for ABT4M or ABT4Mmu in the absence(open box) or presence of theophylline (shaded box) is shown. The data represent mean± SEM. P < 0.04 versus mutant is significant.

140 Dery et al.
a less significant effect on the splicing of ABT4Mmu pre-mRNA(Fig. 10.3A, compare lane 6 with 7; also see Fig. 10.3B), sug-gesting that binding of theophylline to its cognate RNA is neces-sary for controlling alternative splicing.
3.2.6. TransientTransfection of HeLaCells
1. HeLa cells were grown in Dulbecco’s modified Eaglemedium.
2. Cells should be maintained under standard incubation con-ditions (humidified atmosphere, 5% CO2, 37◦C).
3. Seed 4.5 × 10⁵ cells in a six-well plate a day prior to trans-fection.
4. Cells were grown to approximately 60–70% confluency andtransfected with 1 �g of DNA by using Lipofectamine 2000according to the manufacturer’s protocol except that priorto the addition of DNA–Lipofectamine 2000 complex, themedia was replaced by fresh media containing the indicatedconcentration of theophylline.
5. A freshly prepared solution of theophylline was used. In con-trol samples, theophylline was replaced by buffer medium(see Note 12).
3.2.7. First-Strand cDNASynthesis (RT-PCR)
1. In a sterile eppendorf tube we add 5 �g (total RNA), 500 ngoligo (dT)12-18, 10 mM dNTP, and nuclease-free H2O tofinal volume of 12 �l.
2. The mixture is heated for 5 min at 65◦C. Spin briefly andplace promptly on ice.
3. Add in the following order:1. 4 �l 5x First-Strand Buffer2. 2 �l 0.1 M DTT3. 1 �l RNasin
4. We then gently mix the contents of the tube and incubatefor 2 min at 37◦C.
5. Add 1 �l M-MLV Reverse Transcriptase (see Note 13).6. Incubate at 37◦C for 50 min.7. Inactivate enzyme at 70◦C for 15 min.8. Store products at –20◦C or proceed to amplification step
using PCR.
4. Notes
1. Custom siRNA synthesis should be designed with highpurity for animal studies and preclinical applications. OursiRNAs are obtained from Qiagen (Valencia, CA). We notethat some companies (Santa Cruz Biotechnology) are nowoffering siRNA gene silencers targeted to all human genes.The RNAi molecules are provided as pools of three targets

Alternative Splicing as a Therapeutic Target 141
specific to downregulate the expression of the gene ofinterest.
2. Always keep RNA solutions on ice to prevent degradation.Store unused siRNA duplex solution frozen at –20◦C. ThesiRNA duplex solution can be frozen and thawed manytimes.
3. Although 200 nM of siRNA #497 was required to knock-down CEA, we recommend titration of siRNA to identifythe optimum dose.
4. Healthy and sub-confluent cells are required for successfultransfection experiments. Adjust cell and reagent amountsproportionately for wells or amount of DNA transfected.The objective is to have 90–100% confluency of cells at thetime of harvest. The number of cells seeded varies depend-ing on cell line.
5. Opti-MEM is a versatile, chemically defined medium,formulated to significantly reduce the amount of serumrequired for cultivating mammalian cells in vitro.
6. Lipofectamine 2000 Transfection Reagent forms stablecomplexes with nucleic acid molecules, permitting efficienttransfection into eukaryotic cells. Lipofectamine 2000 canbe used for nuclear and cytoplasmic targets and transfects awide variety of cell lines including CHO, HEK-293, NIH3T3, and HeLa. Store at 4◦C. See manufacturer’s protocolwhen necessary.
7. Low efficiency of siRNA delivery with standard techniquescould be related to material toxicity. The transfection effi-ciency of siRNAs can be improved by using transfectionreagents developed for antisense oligonucleotides. Thesereagents can be less toxic than plasmid delivery reagentsand also result in higher transfection efficiencies than con-ventional reagents.
8. Working rabbit sera stocks should be kept at 4◦C supple-mented with 0.02% sodium azide. For monoclonal anti-bodies such as purified IgG, diluted antibody solutionsshould not be stored unless detergent or carrier proteinssuch as goat serum or BSA are added. Diluted IgG solu-tions (less than 0.1 mg/ml protein) quickly adsorb, dena-ture, and lose activity. Avoid repetitive freeze–thawing ofdilute purified IgG.
9. Multiple bands on a Western blot could be indicative of apoor-quality antibody (e.g., not specific for protein of inter-est). It also indicates proteolytic breakdown of the antigen,excessive protein loaded per lane, a highly sensitive detec-tion system, inefficient blocking, or the concentration ofantigen is too low.
10. We have observed lower aptamer stem size between 4 and10 bp to be optimum. The stem size >10 bp inhibits

142 Dery et al.
splicing even without addition of theophylline. The upperaptamer stem size can vary between 2 and 6 bp. The pre-mRNA in which the branchpoint sequence is embedded inthe upper stem displayed a strong response to theophylline-dependent control of alternative splicing.
11. We constructed pre-mRNA substrates containing thetheophylline-responsive element using overlap extensionPCR (40). This strategy removes the limitation placed bylack of restriction sites or the potential secondary effect ofadding nucleotides to the pre-mRNA. In theory, two half-amplicons are generated in the first PCR reaction contain-ing an overlap region of 20–30 nucleotides. In the secondPCR, we generate the full-length product. Gel-purify eachPCR product as parental DNA template can interfere withgeneration of the chimeric sequence. We note that successin creating the overlap extension increases when the twohalf-amplicons are equal in length and the same numbersof moles are used in the second PCR reaction.
12. Theophylline has clinical applications that are well docu-mented (e.g., in the treatment of respiratory diseases withbronchospasm) but it can be toxic in high dosages (41).HeLa cells can tolerate dosages of theophylline from arange of 0.05 –1 mM without a significant growth defect.Our in vitro pre-mRNA splicing assays show good resultswith theophylline from a range of 1–2 mM.
13. Thoroughly mix reaction by repeated but gentle pipetting.We have observed inconsistent results occur from impropermixing of reverse transcriptase at this step.
Acknowledgments
We thank members of the Gaur laboratory for helpful discus-sions; Marieta Gencheva for valuable suggestions; and Faith Osepfor administrative assistance. This work was supported in partby a Department of Defense (DOD; CDMRP) grant to RKG(BC023235), Beckman Research Institute excellence award toRKG, and NIH grant (CA 84202) to JES.
References
1. Black, D. L. (2003) Mechanisms of alterna-tive pre-messenger RNA splicing. Annu. Rev.Biochem. 72, 291–336.
2. House, A. E. and Lynch, K. W. (2008) Reg-ulation of alternative splicing: more than justthe ABCs. J. Biol. Chem. 283, 1217–1221.
3. Wang, Z. and Burge, C. B. (2008) Splicingregulation: from a parts list of regulatory ele-ments to an integrated splicing code. RNA14, 802–813.
4. Mironov, A. A., Fickett, J. W. andGelfand, M. S. (1999) Frequent alternative

Alternative Splicing as a Therapeutic Target 143
splicing of human genes. Genome Res. 9,1288–1293.
5. Johnson, J. M., et al. (2003) Genome-widesurvey of human alternative pre-mRNA splic-ing with exon junction microarrays. Science302, 2141–2144.
6. Kan, Z., et al. (2001) Gene structure pre-diction and alternative splicing analysis usinggenomically aligned ESTs. Genome Res. 11,889–900.
7. Garcia-Blanco, M. A. (2006) Alternativesplicing: therapeutic target and tool. Prog.Mol. Subcell. Biol. 44, 47–64.
8. Faustino, N. A. and Cooper, T. A. (2003)Pre-mRNA splicing and human disease.Genes Dev. 17, 419–437.
9. Benz, E. J., Jr. and Huang, S. C. (1997) Roleof tissue specific alternative pre-mRNA splic-ing in the differentiation of the erythrocytemembrane. Trans. Am. Clin. Climatol. Assoc.108, 78–95.
10. Kurreck, J. (2006) siRNA Efficiency: Struc-ture or sequence – that is the question. J.Biomed. Biotechnol. 2006, 83757.
11. Leuschner, P. J., et al. (2006) Cleavage of thesiRNA passenger strand during RISC assem-bly in human cells. EMBO Rep. 7, 314–320.
12. Gaur, R. K. (2006) RNA interference: apotential therapeutic tool for silencing spliceisoforms linked to human diseases. Biotech-niques Suppl, 15–22.
13. Kim, D. S., et al. (2008) Ligand-inducedsequestering of branchpoint sequence allowsconditional control of splicing. BMC Mol.Biol. 9, 23.
14. Kim, D. S., et al. (2005) An artificialriboswitch for controlling pre-mRNA splic-ing. RNA 11, 1667–1677.
15. Kole, R., Vacek, M. and Williams, T.(2004) Modification of alternative splicing byantisense therapeutics. Oligonucleotides 14,65–74.
16. Dominski, Z. and Kole, R. (1993) Restora-tion of correct splicing in thalassemic pre-mRNA by antisense oligonucleotides. Proc.Natl. Acad. Sci. USA 90, 8673–8677.
17. Tucker, B. J. and Breaker, R. R. (2005)Riboswitches as versatile gene control ele-ments. Curr. Opin. Struct. Bio. 15, 342–348.
18. Nudler, E. and Mironov, A. S. (2004) Theriboswitch control of bacterial metabolism.Trends Biochem. Sci. 29, 11–17.
19. Goguel, V., Wang, Y. and Rosbash, M.(1993) Short artificial hairpins sequestersplicing signals and inhibit yeast pre-mRNAsplicing. Mol. Cell. Biol. 13, 6841–6848.
20. Gusti, V., Kim, D. S. and Gaur, R. K.(2008) Sequestering of the 3′ splice site ina theophylline-responsive riboswitch allows
ligand-dependent control of alternative splic-ing. Oligonucleotides 18, 93–99.
21. Dignam, J. D., Lebovitz, R. M. and Roeder,R. G. (1983) Accurate transcription initi-ation by RNA polymerase II in a solu-ble extract from isolated mammalian nuclei.Nucleic Acids Res. 11, 1475–1489.
22. Fischer, D. C., et al. (2004) Expression ofsplicing factors in human ovarian cancer.Oncol. Rep. 11, 1085–1090.
23. Ghigna, C., et al. (2005) Cell motility is con-trolled by SF2/ASF through alternative splic-ing of the Ron protooncogene. Mol. Cell 20,881–890.
24. He, X., et al. (2004) Alternative splicingof the multidrug resistance protein 1/ATPbinding cassette transporter subfamily genein ovarian cancer creates functional splicevariants and is associated with increasedexpression of the splicing factors PTB andSRp20. Clin. Cancer Res. 10, 4652–4660.
25. Karni, R., et al. (2007) The gene encod-ing the splicing factor SF2/ASF is aproto-oncogene. Nat. Struct. Mol. Biol. 14,185–193.
26. Zhu, H., et al. (2005) Enhancing TRAIL-induced apoptosis by Bcl-X(L) siRNA. Can-cer Biol. Ther. 4, 393–397.
27. Chevinsky, A. H. (1991) CEA in tumorsof other than colorectal origin. Semin. Surg.Oncol. 7, 162–166.
28. Hammarstrom, S. (1999) The carcinoembry-onic antigen (CEA) family: structures, sug-gested functions and expression in normaland malignant tissues. Semin. Cancer Biol. 9,67–81.
29. Li, W. and Cha, L. (2007) Predicting siRNAefficiency. Cell. Mol. Life Sci. 64, 1785–1792.
30. Yiu, S.M., et al. (2005) Filtering of inef-fective siRNAs and improved siRNA designtool. Bioinformatics 21, 144–151.
31. Patzel, V., et al. (2005) Design of siRNAsproducing unstructured guide-RNAs resultsin improved RNA interference efficiency.Nat. Biotechnol. 23, 1440–1444.
32. Huesken, D., et al. (2005) Design of agenome-wide siRNA library using an arti-ficial neural network. Nat. Biotechnol. 23,995–1001.
33. Tuschl, T. (2004) Targeting genes expressedin mammalian cells using siRNAs. Nat. Meth-ods X, 13–17.
34. Reynolds, A., et al. (2004) Rational siRNAdesign for RNA interference. Nat. Biotechnol.22, 326–330.
35. Daoud, R., et al. (1999) Activity-dependentregulation of alternative splicing patternsin the rat brain. Eur. J. Neurosci. 11,788–802.

144 Dery et al.
36. Venables, J. P. (2004) Aberrant and alter-native splicing in cancer. Cancer Res. 64,7647–7654.
37. Tazi, J., Durand, S. and Jeanteur, P. (2005)The spliceosome: a novel multi-faceted tar-get for therapy. Trends Biochem. Sci. 30,469–478.
38. Jenison, R. D., et al. (1994) High-resolutionmolecular discrimination by RNA. Science263, 1425–1429.
39. Mayeda, A. and Krainer, A. R. (1999) Mam-malian in vitro splicing assays. Methods Mol.Biol. 118, 315–321.
40. Ge, L. and Rudolph, P. (1997) Simultane-ous introduction of multiple mutations usingoverlap extension PCR. Biotechniques 22,28–30.
41. Visitsunthorn, N., Udomittipong, K. andPunnakan, L. (2001) Theophylline toxicity inThai children. Asian Pac. J. Allergy Immunol.19, 177–182.

INDEX
A
AAV serotype 2, intramuscular delivery of . . . . . . . . . . . . .89AAV serotype 6
concentration . . . . . . . . . . . . . . . . . . . . . . . . . . . . . . . . . . . 96GFP fluorescence and . . . . . . . . . . . . . . . . . . . . . . . . . . 103histology of . . . . . . . . . . . . . . . . . . . . . . . . . . . . . . . . . 91–92intramuscular delivery
into adult mice . . . . . . . . . . . . . . . . . . . . . . . . . . 99–100into neonate mice . . . . . . . . . . . . . . . . . . . . . . . . . . . 100
isolation of . . . . . . . . . . . . . . . . . . . . . . . . . . . . . . . . . . . . . 95production of . . . . . . . . . . . . . . . . . . . . . . . . . . . . . . . . 89–90purification via HPLC . . . . . . . . . . . . . . . . . . . . . . . 95–96titration using FACS analysis . . . . . . . . . . . . . . . . . 96–97
Amyotrophic lateral sclerosis (ALS)demyelination of large axons . . . . . . . . . . . . . . . . 104–105SOD1, mutations in . . . . . . . . . . . . . . . . . . . . . . . . . 87–88
Anesthetized mouseintramuscular injection of AAV6 into . . . . . . . . . . . . 101intratumoral injection of, set-up for . . . . . . . . . . . . . . . 20
Anopheles mosquitoesmalaria and . . . . . . . . . . . . . . . . . . . . . . . . . . . . . . . . . . . . . 63RNAi-mediated silencing in
efficiency of . . . . . . . . . . . . . . . . . . . . . . . . . . 65, 66–67injection of dsRNA . . . . . . . . . . . . . . . . . . . . . . . 64, 66stable . . . . . . . . . . . . . . . . . . . . . . . . . . . . . . . . . . . .64–65
B
B16-F10 GFP tumorsGFP gene expression in
fluorescence analysis . . . . . . . . . . . . . . . . . . . . . . 20–21statistical analysis . . . . . . . . . . . . . . . . . . . . . . . . . 21–22
injection of . . . . . . . . . . . . . . . . . . . . . . . . . . . . . . . . . . . . . 19RNA extraction for RNA knockdown validation
RNA yield . . . . . . . . . . . . . . . . . . . . . . . . . . . . . . . 23–24from stablized tissues . . . . . . . . . . . . . . . . . . . . . 22–23target gene mRNA levels . . . . . . . . . . . . . . . . . . . . . 24
in vivo electropulsation . . . . . . . . . . . . . . . . . . . . . . . . . . 19Blocking buffer . . . . . . . . . . . . . . . . . . . . . . . . . . . . . . . 129–130
C
Caenorhabditis elegans . . . . . . . . . . . . . . . . . . . . . . . . . . 109, 128Carcinoembryonic antigen (CEA) . . . . . . . . . . . . . . . . . . 132
RNAi against . . . . . . . . . . . . . . . . . . . . . . . . . . . . . 133–134C57Bl/6 mice . . . . . . . . . . . . . . . . . . . . . . . . . . . . . . . . . . . . . . 17cDNA synthesis 5x first-strand buffer for . . . . . . . . . . . . 130CEA, see Carcinoembryonic antigen (CEA)CEA mRNA, siRNA-mediated degradation of . . 132–136
RNAi against CEA . . . . . . . . . . . . . . . . . . . . . . . . 133–134siRNA design . . . . . . . . . . . . . . . . . . . . . . . . . . . . . 132–133transient transfection of MCF7 cells . . . . . . . . . . . . . 135Western blot analysis . . . . . . . . . . . . . . . . . . . . . . 135–136
Chitosan-based nanoparticle system . . . . . . . . . . . . . . . . . . 77
cytotoxicity of . . . . . . . . . . . . . . . . . . . . . . . . . . . . . . . 78, 82flow cytometry of . . . . . . . . . . . . . . . . . . . . . 78, 81–82, 85formation of
interpolyelectrolyte complexes . . . . . . . . . . . . . . . . .79materials for . . . . . . . . . . . . . . . . . . . . . . . . . . . . . . . . . 78
intraperitoneal injection of . . . . . . . . . . . . . . . . . . . . . . . 84reverse transfection . . . . . . . . . . . . . . . . . . . . . . . 78, 80–81storage and drying of
materials for . . . . . . . . . . . . . . . . . . . . . . . . . . . . . . . . . 79TNFα secretion determination . . . . . . . . . . . . .79, 82–83transfection of
evaluation of . . . . . . . . . . . . . . . . . . . . . . . . . . . . . . . . 83macrophages . . . . . . . . . . . . . . . . . . . . . . . . . . . . . . . . 83materials for . . . . . . . . . . . . . . . . . . . . . . . . . . . . . . . . . 78procedure for . . . . . . . . . . . . . . . . . . . . . . . . . . . . . . . . 80
Cloning of oligonucleotides, into lentiviral vector . . . . . 110materials for . . . . . . . . . . . . . . . . . . . . . . . . . . . . . . . . . . . 110methods for . . . . . . . . . . . . . . . . . . . . . . . . . . . . . . . 111–112
Cy5.5-NHS ester dye, MN conjugation to . . . . . . . . . . . . . 6
D
Dephosphorylate . . . . . . . . . . . . . . . . . . . . . . . . . . . . . . . . . . 112Dithiothreitol (DTT) . . . . . . . . . . . . . . . . . . . . . . . . . . . . . . 130Drosophila melanogaster . . . . . . . . . . . . . . . . . . . . . . . . . . . . . 109dsRNA
direct injection of . . . . . . . . . . . . . . . . . . . . . . . . . . . . . . . 68injection into adult mosquitoes . . . . . . . . . . . . 66, 70–71synthesis of
piggyBac expression vectors . . . . . . . . . . . . . . . . . . . 68steps in . . . . . . . . . . . . . . . . . . . . . . . . . . . 64, 65, 69–70
DTT, see Dithiothreitol (DTT)Dual-purpose nanoparticle platform for siRNA delivery, see
MN-NIRF-siRNA
E
EGFP amplification, primers used for . . . . . . . . . . . . . . . . 17egfp22 siRNA . . . . . . . . . . . . . . . . . . . . . . . . . . . . . . . . . . . . . . 17Electrophoresis sample buffer . . . . . . . . . . . . . . . . . . . . . . . 130Electropulsation . . . . . . . . . . . . . . . . . . . . . . . . . . . . . . . . . . . . 16Embryo generation/manipulation/injection
materials for . . . . . . . . . . . . . . . . . . . . . . . . . . . . . . . . . . . 111methods for . . . . . . . . . . . . . . . . . . . . . . . . . . . . . . . 113–114
EphA2downregulation in ovarian tumors . . . . . . . . . . . . . 34–37expression in tumor cells . . . . . . . . . . . . . . . . . . . . . . . . . 31staining for . . . . . . . . . . . . . . . . . . . . . . . . . . . . . . . . . . . . . 32
EphA2 siRNA-DOPC, downregulation in ovariantumors . . . . . . . . . . . . . . . . . . . . . . . . . . . . . . . 35–36
Ethidium bromide . . . . . . . . . . . . . . . . . . . . . . . . . . . . . . . . . . 25Exon junction primers . . . . . . . . . . . . . . . . . . . . . . . . . . . . . 130Ex vivo fluorescence optical imaging, of mice bearing
bilateral 9L-GFP and 9L-RFP tumors . . . . . 11
145

146THERAPEUTIC APPLICATIONS OFRNAI
Index
F
fALS, see familial amyotrophic lateral sclerosis (fALS)familial amyotrophic lateral sclerosis (fALS)
RNAi-based therapy for . . . . . . . . . . . . . . . . . . . . . . . . . 88FBS, see Fetal bovine serum (FBS)Fetal bovine serum (FBS) . . . . . . . . . . . . . . . . . . . . . . . . . . . .31First-strand cDNA synthesis (RT-PCR), of
theophylline-responsive riboswitch . . . . . . . . 140
G
G93A SOD1 mice, viral-mediated RNAi againstSOD1 in
AAV6 . . . . . . . . . . . . . . . . . . . . . . . . . . . . . . . . . . . . . 99–100neuroprotection analysis following
motor neuron counts . . . . . . . . . . . . . . . . . . . . . . . . 104myelinated fiber counts . . . . . . . . . . . . . . . . . 104–105
transduction and SOD1 silencing analysisfollowing . . . . . . . . . . . . . . . . . . . . . . . . . . 102–104
VSV-G-pseudotyped lentivirus . . . . . . . . . . . . . . . . 97–99Gene silencing, of CEA by RNAi . . . . . . . . . . . . . . . . . . . 134Genotyping, of transgenic animals
materials for . . . . . . . . . . . . . . . . . . . . . . . . . . . . . . . . . . . 111methods for . . . . . . . . . . . . . . . . . . . . . . . . . . . . . . . . . . . 114
GFP gene expression in tumorsfluorescence analysis . . . . . . . . . . . . . . . . . . . . . . 20–21, 25statistical analysis . . . . . . . . . . . . . . . . . . . . . . . . . . . . 21–22
GFP marker gene . . . . . . . . . . . . . . . . . . . . . . . . . . . . . . . . . 115Glycogen . . . . . . . . . . . . . . . . . . . . . . . . . . . . . . . . . . . . . . . . . 131
H
Hairpin RNAiestablishment of transgenic lines expressing . . . . . . . . 71vectors . . . . . . . . . . . . . . . . . . . . . . . . . . . . . . . . . . . . . . . . . 54
hCG, see human Chorionic Gonadotropin (hCG)HEK 293 cells . . . . . . . . . . . . . . . . . . . . . . . . . . . . . . . . . . . . 116
prepration . . . . . . . . . . . . . . . . . . . . . . . . . . . . . . . . . . . . . 112HeLa cells, transient transfection of . . . . . . . . . . . . . . . . . 140HeLa nuclear extract, for in vitro splicing . . . . . . . . . . . . 131HeyA8 cells
EphA2 downregulation in . . . . . . . . . . . . . . . . . . . . 34–37fluorescent siRNA in . . . . . . . . . . . . . . . . . . . . . . . . . . . . 34in vivo siRNA distribution in . . . . . . . . . . . . . . . . . . . . . 39
Histone methylation using ChIP . . . . . . 120–121, 122–123HIV-1 LTR . . . . . . . . . . . . . . . . . . . . . . . . . . . . . . . . . . . . . . .120human Chorionic Gonadotropin (hCG) . . . . . . . . . . . . . 111
I
ImageJ software . . . . . . . . . . . . . . . . . . . . . . . . . . . . . . . . . . . 131Intramuscular injections . . . . . . . . . . . . . . . . . . . . . . . . . . . . . 91Intraperitoneal injection . . . . . . . . . . . . . . . . . . . . . . . . . . . . . 84Intraspinal injections . . . . . . . . . . . . . . . . . . . . . . . . . . . . 90–91In vitro splicing assay, of theophylline-responsive
riboswitch . . . . . . . . . . . . . . . . . . . . . . . . . . . . . . 138In vitro transcription, of theophylline-responsive
riboswitch . . . . . . . . . . . . . . . . . . . . . . . . . . . . . . 138In vivo fluorescence optical imaging
of mice bearing bilateral 9L-GFP and 9L-RFPtumors . . . . . . . . . . . . . . . . . . . . . . . . . . . . . . . . 8, 10
parameters used for . . . . . . . . . . . . . . . . . . . . . . . . . . . . . . 9
K
Kodak Scientific Imaging System . . . . . . . . . . . . . . . . . 11–12
L
Lentiviral embryo injection . . . . . . . . . . . . . . . . . . . . . . . . . 115Lentiviral packaging plasmids . . . . . . . . . . . . . . . . . . . . . . 111Lentiviral RNAi in mice
advantages of . . . . . . . . . . . . . . . . . . . . . . . . . . . . . .114–115disadvantages of . . . . . . . . . . . . . . . . . . . . . . . . . . . . . . . .115
Lentiviral transgenesis . . . . . . . . . . . . . . . . . . . . . . . . . 114–115RNAi in vivo by . . . . . . . . . . . . . . . . . . . . . . . . . . . . . . . 115
Lentiviral vector, cloning of oligonucleotides intomaterials for . . . . . . . . . . . . . . . . . . . . . . . . . . . . . . . . . . . 110methods for . . . . . . . . . . . . . . . . . . . . . . . . . . . . . . . 111–112
Lentivirusand adeno-associated virus serotype 6,
comparison of . . . . . . . . . . . . . . . . . . . . . . . . . . . . 93based on EIAV . . . . . . . . . . . . . . . . . . . . . . . . . . . . . . 88–89generation of
material . . . . . . . . . . . . . . . . . . . . . . . . . . . . . . . 110–111methods for . . . . . . . . . . . . . . . . . . . . . . . . . . . 112–113
pseudotyped with vesicular stomatitis virus G . . . . . . 89recombinant
cell culture and transfection of . . . . . . . . . . . . . 94–95isolation and concentration . . . . . . . . . . . . . . . . . . . 95
Lentivirus RNAi vectors . . . . . . . . . . . . . . . . . . . . . . . . . 53–54Lipofectamine 2000 Transfection Reagent . . . . . . . . . . . 141Liposomal siRNA
DOPC . . . . . . . . . . . . . . . . . . . . . . . . . . . . . . . . . . . . . 30–31preparation for in vivo delivery . . . . . . . . . . . . . . . . . . . 33
Lysis buffer . . . . . . . . . . . . . . . . . . . . . . . . . . . . . . . . . . . . . . . 130
M
Malaria, mosquito vector and . . . . . . . . . . . . . . . . . . . . . . . . 63MCF7 cells, transient transfection of . . . . . . . . . . . . . . . . 1357mG(ppp)G RNA cap structure analog . . . . . . . . . . . . . . 131microRNA (miRNA) . . . . . . . . . . . . . . . . . . . . . . . . . . . . . . . 3025 mM Theophylline . . . . . . . . . . . . . . . . . . . . . . . . . . . . . . 131MN
conjugation to Cy5.5-NHS ester dye . . . . . . . . . . . . . . . 6synthesis of, dextran-coated . . . . . . . . . . . . . . . . . . . . . . . 4
MN-(Cy5.5)(MPAP), conjugation of siRNA to . . . . . . 6–7MN-NIRF-siRNA
delivery to tumors, imaging ofmaterials for . . . . . . . . . . . . . . . . . . . . . . . . . . . . . . . . . . 3MRI . . . . . . . . . . . . . . . . . . . . . . . . . . . . . . . . . . . . . . 7–8near-infrared optical imaging . . . . . . . . . . . . . . . . . . .8
synthesisconjugation . . . . . . . . . . . . . . . . . . . . . . . . . . . . . . . . 6–7dextran-coated MN . . . . . . . . . . . . . . . . . . . . . . . . . . . 5materials for . . . . . . . . . . . . . . . . . . . . . . . . . . . . 2–3, 11steps . . . . . . . . . . . . . . . . . . . . . . . . . . . . . . . . . . . . . . . . . 4
target gene silencing assessmentex vivo fluorescence optical imaging . . . . . . . . . . . 11in vivo fluorescence optical imaging . . . . . . . . . 8–11
Molecular Dynamics PhosphorImager . . . . . . . . . . . . . . . 131Mosquito biology . . . . . . . . . . . . . . . . . . . . . . . . . . . . . . . . . . . 63Myristoylated polyarginine membrane translocation
module (MPAP), conjugation to MN . . . . . . . .6
N
NOD mouse, see Nonobese diabetic (NOD) mouseNonobese diabetic (NOD) mouse . . . . . . . . . . . . . . . . . . . 110Nuclear run-on assays . . . . . . . . . . . . . . . . . . . . . . . . . 123–124
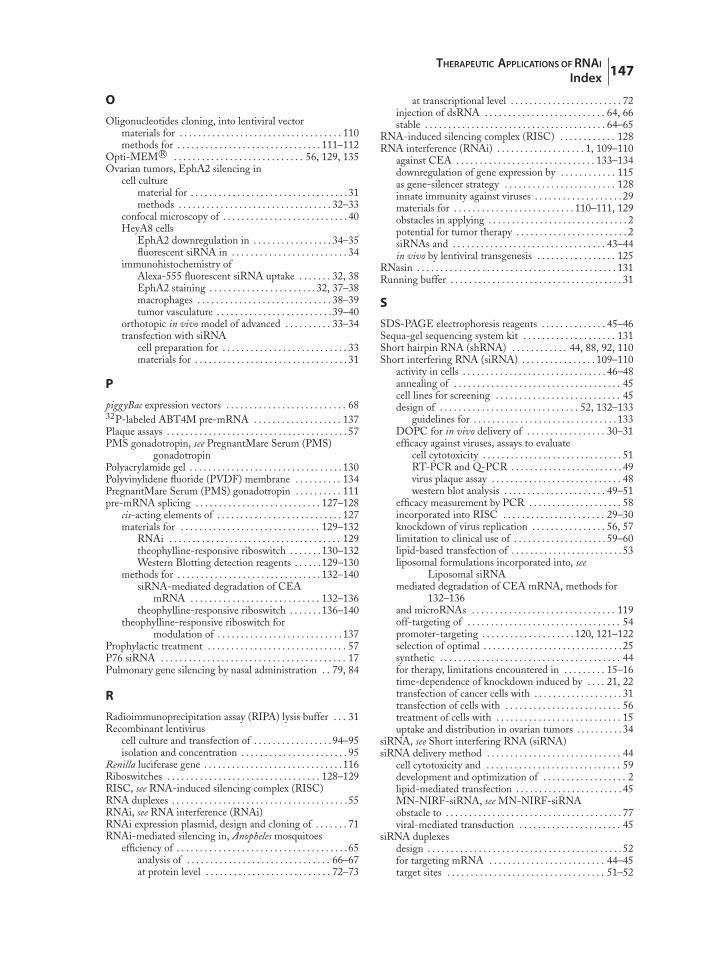
THERAPEUTIC APPLICATIONS OFRNAI
Index 147
O
Oligonucleotides cloning, into lentiviral vectormaterials for . . . . . . . . . . . . . . . . . . . . . . . . . . . . . . . . . . . 110methods for . . . . . . . . . . . . . . . . . . . . . . . . . . . . . . . 111–112
Opti-MEM R© . . . . . . . . . . . . . . . . . . . . . . . . . . . . 56, 129, 135Ovarian tumors, EphA2 silencing in
cell culturematerial for . . . . . . . . . . . . . . . . . . . . . . . . . . . . . . . . . .31methods . . . . . . . . . . . . . . . . . . . . . . . . . . . . . . . . . 32–33
confocal microscopy of . . . . . . . . . . . . . . . . . . . . . . . . . . . 40HeyA8 cells
EphA2 downregulation in . . . . . . . . . . . . . . . . . 34–35fluorescent siRNA in . . . . . . . . . . . . . . . . . . . . . . . . . 34
immunohistochemistry ofAlexa-555 fluorescent siRNA uptake . . . . . . . 32, 38EphA2 staining . . . . . . . . . . . . . . . . . . . . . . . 32, 37–38macrophages . . . . . . . . . . . . . . . . . . . . . . . . . . . . . 38–39tumor vasculature . . . . . . . . . . . . . . . . . . . . . . . . .39–40
orthotopic in vivo model of advanced . . . . . . . . . . 33–34transfection with siRNA
cell preparation for . . . . . . . . . . . . . . . . . . . . . . . . . . . 33materials for . . . . . . . . . . . . . . . . . . . . . . . . . . . . . . . . . 31
P
piggyBac expression vectors . . . . . . . . . . . . . . . . . . . . . . . . . . 6832P-labeled ABT4M pre-mRNA . . . . . . . . . . . . . . . . . . . 137Plaque assays . . . . . . . . . . . . . . . . . . . . . . . . . . . . . . . . . . . . . . . 57PMS gonadotropin, see PregnantMare Serum (PMS)
gonadotropinPolyacrylamide gel . . . . . . . . . . . . . . . . . . . . . . . . . . . . . . . . . 130Polyvinylidene fluoride (PVDF) membrane . . . . . . . . . . 134PregnantMare Serum (PMS) gonadotropin . . . . . . . . . . 111pre-mRNA splicing . . . . . . . . . . . . . . . . . . . . . . . . . . . 127–128
cis-acting elements of . . . . . . . . . . . . . . . . . . . . . . . . . . . 127materials for . . . . . . . . . . . . . . . . . . . . . . . . . . . . . . 129–132
RNAi . . . . . . . . . . . . . . . . . . . . . . . . . . . . . . . . . . . . . 129theophylline-responsive riboswitch . . . . . . . 130–132Western Blotting detection reagents . . . . . .129–130
methods for . . . . . . . . . . . . . . . . . . . . . . . . . . . . . . . 132–140siRNA-mediated degradation of CEA
mRNA . . . . . . . . . . . . . . . . . . . . . . . . . . . . 132–136theophylline-responsive riboswitch . . . . . . . 136–140
theophylline-responsive riboswitch formodulation of . . . . . . . . . . . . . . . . . . . . . . . . . . . 137
Prophylactic treatment . . . . . . . . . . . . . . . . . . . . . . . . . . . . . . 57P76 siRNA . . . . . . . . . . . . . . . . . . . . . . . . . . . . . . . . . . . . . . . . 17Pulmonary gene silencing by nasal administration . . 79, 84
R
Radioimmunoprecipitation assay (RIPA) lysis buffer . . . 31Recombinant lentivirus
cell culture and transfection of . . . . . . . . . . . . . . . . .94–95isolation and concentration . . . . . . . . . . . . . . . . . . . . . . . 95
Renilla luciferase gene . . . . . . . . . . . . . . . . . . . . . . . . . . . . . .116Riboswitches . . . . . . . . . . . . . . . . . . . . . . . . . . . . . . . . . 128–129RISC, see RNA-induced silencing complex (RISC)RNA duplexes . . . . . . . . . . . . . . . . . . . . . . . . . . . . . . . . . . . . . .55RNAi, see RNA interference (RNAi)RNAi expression plasmid, design and cloning of . . . . . . . 71RNAi-mediated silencing in, Anopheles mosquitoes
efficiency of . . . . . . . . . . . . . . . . . . . . . . . . . . . . . . . . . . . . .65analysis of . . . . . . . . . . . . . . . . . . . . . . . . . . . . . . . 66–67at protein level . . . . . . . . . . . . . . . . . . . . . . . . . . . 72–73
at transcriptional level . . . . . . . . . . . . . . . . . . . . . . . . 72injection of dsRNA . . . . . . . . . . . . . . . . . . . . . . . . . . 64, 66stable . . . . . . . . . . . . . . . . . . . . . . . . . . . . . . . . . . . . . . . 64–65
RNA-induced silencing complex (RISC) . . . . . . . . . . . . 128RNA interference (RNAi) . . . . . . . . . . . . . . . . . . . 1, 109–110
against CEA . . . . . . . . . . . . . . . . . . . . . . . . . . . . . . 133–134downregulation of gene expression by . . . . . . . . . . . . 115as gene-silencer strategy . . . . . . . . . . . . . . . . . . . . . . . . 128innate immunity against viruses . . . . . . . . . . . . . . . . . . . 29materials for . . . . . . . . . . . . . . . . . . . . . . . . . . 110–111, 129obstacles in applying . . . . . . . . . . . . . . . . . . . . . . . . . . . . . . 2potential for tumor therapy . . . . . . . . . . . . . . . . . . . . . . . . 2siRNAs and . . . . . . . . . . . . . . . . . . . . . . . . . . . . . . . . . 43–44in vivo by lentiviral transgenesis . . . . . . . . . . . . . . . . . 125
RNasin . . . . . . . . . . . . . . . . . . . . . . . . . . . . . . . . . . . . . . . . . . . 131Running buffer . . . . . . . . . . . . . . . . . . . . . . . . . . . . . . . . . . . . . 31
S
SDS-PAGE electrophoresis reagents . . . . . . . . . . . . . . 45–46Sequa-gel sequencing system kit . . . . . . . . . . . . . . . . . . . . 131Short hairpin RNA (shRNA) . . . . . . . . . . . . 44, 88, 92, 110Short interfering RNA (siRNA) . . . . . . . . . . . . . . . . 109–110
activity in cells . . . . . . . . . . . . . . . . . . . . . . . . . . . . . . . 46–48annealing of . . . . . . . . . . . . . . . . . . . . . . . . . . . . . . . . . . . . 45cell lines for screening . . . . . . . . . . . . . . . . . . . . . . . . . . . 45design of . . . . . . . . . . . . . . . . . . . . . . . . . . . . . . 52, 132–133
guidelines for . . . . . . . . . . . . . . . . . . . . . . . . . . . . . . . 133DOPC for in vivo delivery of . . . . . . . . . . . . . . . . . 30–31efficacy against viruses, assays to evaluate
cell cytotoxicity . . . . . . . . . . . . . . . . . . . . . . . . . . . . . . 51RT-PCR and Q-PCR . . . . . . . . . . . . . . . . . . . . . . . . 49virus plaque assay . . . . . . . . . . . . . . . . . . . . . . . . . . . . 48western blot analysis . . . . . . . . . . . . . . . . . . . . . . 49–51
efficacy measurement by PCR . . . . . . . . . . . . . . . . . . . . 58incorporated into RISC . . . . . . . . . . . . . . . . . . . . . . 29–30knockdown of virus replication . . . . . . . . . . . . . . . . 56, 57limitation to clinical use of . . . . . . . . . . . . . . . . . . . . 59–60lipid-based transfection of . . . . . . . . . . . . . . . . . . . . . . . . 53liposomal formulations incorporated into, see
Liposomal siRNAmediated degradation of CEA mRNA, methods for
132–136and microRNAs . . . . . . . . . . . . . . . . . . . . . . . . . . . . . . . 119off-targeting of . . . . . . . . . . . . . . . . . . . . . . . . . . . . . . . . . 54promoter-targeting . . . . . . . . . . . . . . . . . . . . 120, 121–122selection of optimal . . . . . . . . . . . . . . . . . . . . . . . . . . . . . . 25synthetic . . . . . . . . . . . . . . . . . . . . . . . . . . . . . . . . . . . . . . . 44for therapy, limitations encountered in . . . . . . . . . 15–16time-dependence of knockdown induced by . . . . 21, 22transfection of cancer cells with . . . . . . . . . . . . . . . . . . . 31transfection of cells with . . . . . . . . . . . . . . . . . . . . . . . . . 56treatment of cells with . . . . . . . . . . . . . . . . . . . . . . . . . . . 15uptake and distribution in ovarian tumors . . . . . . . . . . 34
siRNA, see Short interfering RNA (siRNA)siRNA delivery method . . . . . . . . . . . . . . . . . . . . . . . . . . . . . 44
cell cytotoxicity and . . . . . . . . . . . . . . . . . . . . . . . . . . . . . 59development and optimization of . . . . . . . . . . . . . . . . . . 2lipid-mediated transfection . . . . . . . . . . . . . . . . . . . . . . . 45MN-NIRF-siRNA, see MN-NIRF-siRNAobstacle to . . . . . . . . . . . . . . . . . . . . . . . . . . . . . . . . . . . . . . 77viral-mediated transduction . . . . . . . . . . . . . . . . . . . . . . 45
siRNA duplexesdesign . . . . . . . . . . . . . . . . . . . . . . . . . . . . . . . . . . . . . . . . . . 52for targeting mRNA . . . . . . . . . . . . . . . . . . . . . . . . . 44–45target sites . . . . . . . . . . . . . . . . . . . . . . . . . . . . . . . . . . 51–52

148THERAPEUTIC APPLICATIONS OFRNAI
Index
siRNA-mediated endogenous gene silencing, electricaltreatment for
in B16-F10 GFP tumors, see B16-F10 GFP tumorsGFP fluorescence expression . . . . . . . . . . . . . . . . . . . . . 19
quantitative evaluation of . . . . . . . . . . . . . . . . . . 20–21statistical analysis . . . . . . . . . . . . . . . . . . . . . . . . . 21–22
materials forC57Bl/6 mice . . . . . . . . . . . . . . . . . . . . . . . . . . . . . . . 17cell culture . . . . . . . . . . . . . . . . . . . . . . . . . . . . . . . . . . 16DNA oligonucleotides . . . . . . . . . . . . . . . . . . . . . . . 17mRNA extraction and analysis . . . . . . . . . . . . . . . . 18siRNAs . . . . . . . . . . . . . . . . . . . . . . . . . . . . . . . . . 16–17
in vivo visualization of . . . . . . . . . . . . . . . . . . . . . . . . . . . 18siRNA-mediated gene silencing . . . . . . . . . . . . . . . . . . . . . . 30Splicing loading buffer . . . . . . . . . . . . . . . . . . . . . . . . . . . . . 131Splicing stop buffer . . . . . . . . . . . . . . . . . . . . . . . . . . . . . . . . 131Superovulate donor females . . . . . . . . . . . . . . . . . . . . . . . . .113Superoxide dismutase 1 (SOD1)
mutations in gene encoding for . . . . . . . . . . . . . . . . 87–88viral-mediated RNAi against
AAV6 delivery . . . . . . . . . . . . . . . . . . . . . . . . . . 99–100analysis of transduction and SOD1 silencing
following . . . . . . . . . . . . . . . . . . . . . . . . . . 102–104lentivirus based on EIAV . . . . . . . . . . . . . . . . . . 88–89neuroprotection analysis following . . . . . . . 104–105VSV-G-pseudotyped lentivirus . . . . . . . . . . . . . . . . 89VSV-G-pseudotyped lentivirus delivery . . . . 97–99
Systemic macrophages, transfection and genesilencing in . . . . . . . . . . . . . . . . . . . . . . . . . . . . . . 84
T
Target mRNA levels, qPCR Analysis of . . . . . . . . . . . . . . 24T1D, see Type 1 diabetes (T1D)TGS, see Transcriptional gene silencing (TGS)Theophylline-mediated modulation, of alternative splicing
in vivo . . . . . . . . . . . . . . . . . . . . . . . . . . . . . 139–140Theophylline-responsive riboswitch
design of . . . . . . . . . . . . . . . . . . . . . . . . . . . . . . . . . .136–137materials for . . . . . . . . . . . . . . . . . . . . . . . . . . . . . . 130–132methods for . . . . . . . . . . . . . . . . . . . . . . . . . . . . . . . 136–140
control of alternative splicing in vivo . . . . . 139–140first-strand cDNA synthesis (RT-PCR) . . . . . . . 140for modulation of pre-mRNA splicing
in vitro . . . . . . . . . . . . . . . . . . . . . . . . . . . . . . . . . 137transient transfection of HeLa cells . . . . . . . . . . . 140in vitro splicing assay . . . . . . . . . . . . . . . . . . . . . . . . 138in vitro transcription . . . . . . . . . . . . . . . . . . . . . . . . 138
Time-course optical imagingex vivo fluorescence optical imaging, see Ex vivo
fluorescence optical imagingsilencing effect identification using . . . . . . . . . . . . . . . . 12in vivo fluorescence optical imaging, see In vivo
fluorescence optical imaging
Transcriptional gene silencing (TGS) . . . . . . . . . . . . . . . . 119histone methylation assessment
chromatin marks . . . . . . . . . . . . . . . . . . . . . . . 122–123materials for . . . . . . . . . . . . . . . . . . . . . . . . . . . 120–121
measurement using nuclear run-onmaterials for . . . . . . . . . . . . . . . . . . . . . . . . . . . . . . . .121methods for . . . . . . . . . . . . . . . . . . . . . . . . . . . 123–124
potential therapeutic applications of . . . . . . . . . . . . . . 120promoter-targeting siRNA, design of . . . . . . . . 120–122siRNA-mediated, efficacy of . . . . . . . . . . . . . . . . . . . . 121
Transfection-mediated cell cytotoxicity . . . . . . . . . . . . . . . 51Transfer buffer . . . . . . . . . . . . . . . . . . . . . . . . . . . . . . . . . . . . . 32Transgenic animals, genotyping of
material for . . . . . . . . . . . . . . . . . . . . . . . . . . . . . . . . . . . . 114materials for . . . . . . . . . . . . . . . . . . . . . . . . . . . . . . . . . . . 111
Transgenic mosquitoesexpressing hairpin RNAs, establishment of . . . . . . . . 66stable RNAi gene silencing in . . . . . . . . . . . . . . . . . 64–65
Transient transfectionof HeLa cells . . . . . . . . . . . . . . . . . . . . . . . . . . . . . . . . . . 140of MCF7 cells . . . . . . . . . . . . . . . . . . . . . . . . . . . . . . . . . 135
Tris-buffered saline with Tween-20 (TBST) . . . . . . . . . . .32T7 RNA polymerase . . . . . . . . . . . . . . . . . . . . . . . . . . . . . . . 132Tumor model, mouse
MRI of . . . . . . . . . . . . . . . . . . . . . . . . . . . . . . . . . . . . . . . 7–8near-infrared optical imaging of . . . . . . . . . . . . . . . . . . . .8target gene silencing assessment
ex vivo fluorescence optical imaging . . . . . . . . . . . 11in vivo fluorescence optical imaging . . . . . . . . . 8–11
Type 1 diabetes (T1D) . . . . . . . . . . . . . . . . . . . . . . . . . . . . . 110
V
VSV-G-pseudotyped lentivirushistology of . . . . . . . . . . . . . . . . . . . . . . . . . . . . . . . . . 91–92intraspinal delivery
into adult Mice . . . . . . . . . . . . . . . . . . . . . . . . . . .97–99into presymptomatic SOD1 Mice . . . . . . . . . . . . . 89
production of . . . . . . . . . . . . . . . . . . . . . . . . . . . . . . . . 89–90
W
Western blot analysis, for siRNA-mediated degradation ofCEA mRNA . . . . . . . . . . . . . . . . . . . . . . . 135–136
Western blotting . . . . . . . . . . . . . . . . . . . . . . . . . 31–32, 35–37Western Blotting detection reagents . . . . . . . . . . . . 129–130Whole-body optical imaging system . . . . . . . . . . . 3, 4, 8, 11
X
α–XEA T84.66 . . . . . . . . . . . . . . . . . . . . . . . . . . . . . . . . . . . 1305x first-strand buffer for cDNA synthesis . . . . . . . . . . . . 1302x gel loading buffer . . . . . . . . . . . . . . . . . . . . . . . . . . . . . . . 1302x PK buffer . . . . . . . . . . . . . . . . . . . . . . . . . . . . . . . . . . . . . . 13110x transcription master mix . . . . . . . . . . . . . . . . . . . . . . . . 131