Inhibition of Copper Corrosion by Flavonoids in Nitric Acid
8
ISSN: 0973-4945; CODEN ECJHAO E-Journal of Chemistry http://www.e-journals.net 2011, 8(1), 326-332 Inhibition of Copper Corrosion by Flavonoids in Nitric Acid MAHMOUD A. AL-QUDAH Department of Chemistry, Faculty of Science Yarmouk University, Irbid 21163, Jordan [email protected] Received 4 May 2010; Accepted 18 July 2010 Abstract: A study has been made to investigate the effect of some substituted flavonoids on copper dissolution in 2.0 M HNO 3 for 4.0 hours at different temperatures by the weight loss method. Percentage of inhibition increases as concentration of the flavonoids increases and reaches a maximum value, due to the formation of a monolayer film on the surface of the metal. 92% Inhibition was observed in some of these flavonoids. As temperature increases, percentage of inhibition decreases. Energy of activations were deduced and discussed. Keyword: Copper; Corrosion, Flavonoids, Inhibition, Quercetin-3,3′ -dimethylether. Introduction Copper and its alloys are widely used materials for their excellent electrical and thermal conductivities in many applications such as electronics 1 and recently in the manufacture of integrated circuits 2–4 . Copper is relatively noble metal, requiring strong oxidants for its corrosion or dissolution. The chemical dissolution and electrolytic plating are the main processes used in the fabrication of electronic devices. The most widely used corrosive solution contains nitric acid, so this medium has induced a great deal of research on copper corrosion 5–10 . In order to study the corrosion of metals, several techniques have been applied. The use of chemical inhibitors is one of the most practical methods for the protection against corrosion in acidic media. Most of the excellent acid inhibitors are organic compounds containing nitrogen 11–13 , oxygen 14–17 , phosphorus 18 and sulphur 19–22 . Studies of the relation between adsorption and corrosion inhibition are of considerable importance. Flavonoids are water soluble polyphenolic molecules containing 15 carbon atoms (Scheme 1). Flavonoids are widely disbursed throughout plants and give the flowers and fruits of many plants their vibrant colors. Flavonoids have antioxidant activity, anti-allergic, anti-cancer, anti-inflammatory and anti-viral 23 .
Transcript of Inhibition of Copper Corrosion by Flavonoids in Nitric Acid
ISSN: 0973-4945; CODEN ECJHAO
E-Journal of Chemistry
http://www.e-journals.net 2011, 8(1), 326-332
Inhibition of Copper Corrosion by
Flavonoids in Nitric Acid
MAHMOUD A. AL-QUDAH
Department of Chemistry, Faculty of Science
Yarmouk University, Irbid 21163, Jordan
Received 4 May 2010; Accepted 18 July 2010
Abstract: A study has been made to investigate the effect of some substituted
flavonoids on copper dissolution in 2.0 M HNO3 for 4.0 hours at different
temperatures by the weight loss method. Percentage of inhibition increases as
concentration of the flavonoids increases and reaches a maximum value, due to
the formation of a monolayer film on the surface of the metal. 92% Inhibition
was observed in some of these flavonoids. As temperature increases,
percentage of inhibition decreases. Energy of activations were deduced and
discussed.
Keyword: Copper; Corrosion, Flavonoids, Inhibition, Quercetin-3,3′-dimethylether.
Introduction
Copper and its alloys are widely used materials for their excellent electrical and thermal
conductivities in many applications such as electronics1 and recently in the manufacture of
integrated circuits2–4
. Copper is relatively noble metal, requiring strong oxidants for its
corrosion or dissolution. The chemical dissolution and electrolytic plating are the main
processes used in the fabrication of electronic devices. The most widely used corrosive
solution contains nitric acid, so this medium has induced a great deal of research on copper
corrosion5–10
. In order to study the corrosion of metals, several techniques have been
applied. The use of chemical inhibitors is one of the most practical methods for the
protection against corrosion in acidic media. Most of the excellent acid inhibitors are organic
compounds containing nitrogen11–13
, oxygen14–17
, phosphorus18
and sulphur19–22
. Studies of
the relation between adsorption and corrosion inhibition are of considerable importance.
Flavonoids are water soluble polyphenolic molecules containing 15 carbon atoms
(Scheme 1). Flavonoids are widely disbursed throughout plants and give the flowers and
fruits of many plants their vibrant colors. Flavonoids have antioxidant activity, anti-allergic,
anti-cancer, anti-inflammatory and anti-viral23
.
Inhibition of Copper Corrosion by Flavonoids in Nitric Acid 327
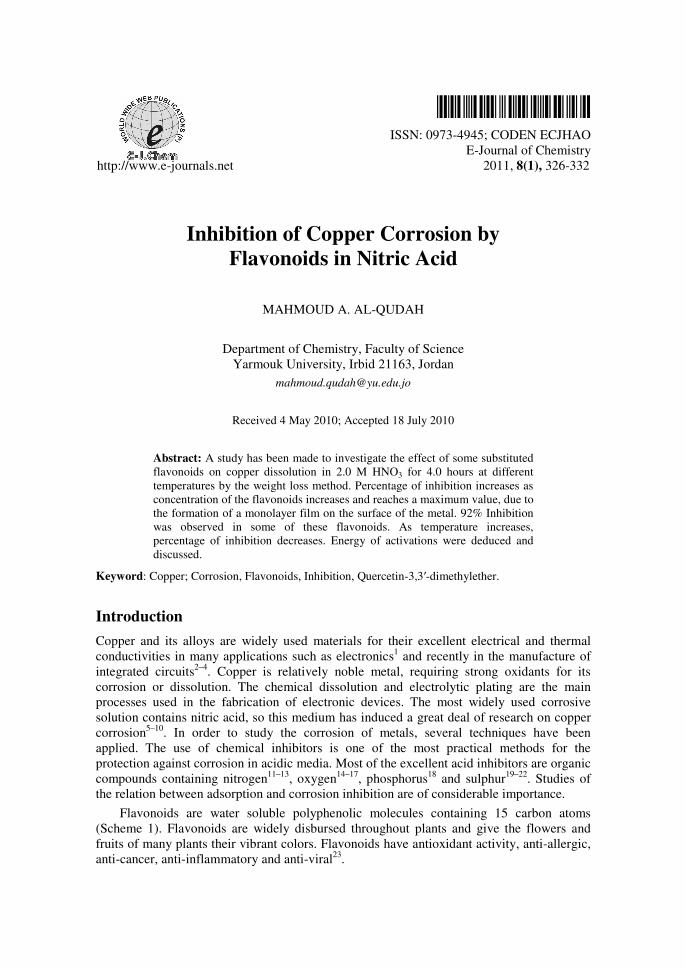
In this study, some flavonoids compounds such as apigenin (1), luteolin-3′-methyl ether
(2), quercetin-3,3′-dimethylether (3) and jeceidine (4) (Scheme 1) were used to study the
corrosion behaviour of copper in 2.0 M HNO3 using the weight loss method.
O
OH
HO
OH
O
OCH3H3CO
OCH3
O
OH
HO
OH
O
OCH3
OCH3
O
OH
HO
OH
O
OCH3
1
2
3
O
O
1
2
3
45
6
78
9
10
1′
2′
3′
4′
5′
6′OH
OH
HO
Scheme 1. Chemical structures of the tested flavonoids used for inhibition of copper
corrosion in nitric acid.
Chemicals
Nitric acid solutions were prepared from the RP Normapur grade HNO3 (65% Merck) in
distilled water. Copper sheet (99.9% Prolabo Chemicals or 99.98% Aldrich Chemicals) was
cut as coupons of total surface area of 2.21 cm2. Compounds 1-4 were isolated from
Varthemia iphionoides. The compounds exhibited the following characteristics.
Apigenin (1)
IR (KBr) cm-1
: 3295, 2910, 1650, 1603, 1585, 1493, 1350, 1242, 1180, EIMS m/z (%):270 [M+]
(C15H10O5) (100), 242 (9), 153 (28), 121 (23), 69 (31), 55 (18). UV λmax (MeOH) nm = 337
(band I), 270 (band II), +NaOMe = 401 (band I), 285 (band II), 325 (OH – 7). +AlCl3, 345
(Band Ib), 380 (Band Ia), 275 (band IIb), 301 (Band IIa); +HCl, 338 (Band Ib), 380 (Band Ia),
278 (band IIb), 300 (Band IIa). 1H NMR (DMSO – d6) δ ppm = 6.15 (1H, d, J= 1.7 Hz, H-6),
6.43 (1H, d, J= 1.7 Hz, H-8), 6.70 (1H, s, H-3), 6.75 (2H, d, J = 8.7 Hz, H - 3', 5'), 7.85 (2H, d, J
= 8.7 Hz, H - 2',6'), 10.55 (2H, broad, OH-7,4'), 12.90 (1H, s, OH – 5). 13
C NMR (DMSO – d6)
δ ppm = 94.3 (C-8), 99.3 (C-6), 103.3 (C-3), 104.2 (C-10), 116.4 (C - 3', 5'), 121.7 (C - 1'),
129.0 (C - 2', 6'), 157.8 (C-9), 161.7 (C - 4'), 161.9 (C-5), 164.2 (C-2), 164.6 (C-7), 182.2 (C-4).
Luteolin-3'-methyl ether (2)
IR (KBr) νmax (cm-1
): 3360, 3100, 1652, 1625, 1564, 1515, 1442, 1355, 1301, 1215, 1166,
1033. EIMS m/z (%): 300 [M+] (C16H12O6) (25), 257(5), 229(5), 153(10), 133(8) 105 (5),
69(8). UV λmax (MeOH) nm: 347 (band I), 270 (band II); + NaOMe, 405 (band I), 325, 270
(band II); + AlCl3, 360 (band I), 260 (band II); + HCl, 350 (band I) 260 (band II). 1H NMR
(DMSO –d6) δ ppm: 3.85 (3H, s, 3'-OMe), 6.15 (1H, br s, H-6), 6.45(1H, br s, H-8), 6.83 (1H,
s, H-3), 6.89 (1H,d, J = 8.7Hz, H-5'), 7.50 (2H, br s, H-2',6'), 10.03 (1H, broad, OH), 10.68
(1H, broad, OH), 12.94 (1H.s, 5-OH). 13
C NMR (DMSO –d6) δ ppm: 56.4 (3'-OMe), 94.5 (C-
8), 99.3 (C-6), 103.7 (C-3), 104.2 (C-10), 110.6 (C-2'), 116.2 (C-5'), 120.6 (C-6'), 122.0 (C-
1'), 148.5 (C-3'), 151.2 (C-4'), 157.8 (C-9), 161.9 (C-5), 164.1 (C-2), 164.6 (C-7), 182.3 (C-4).
4
1
2
3
328 M. A. AL-QUDAH
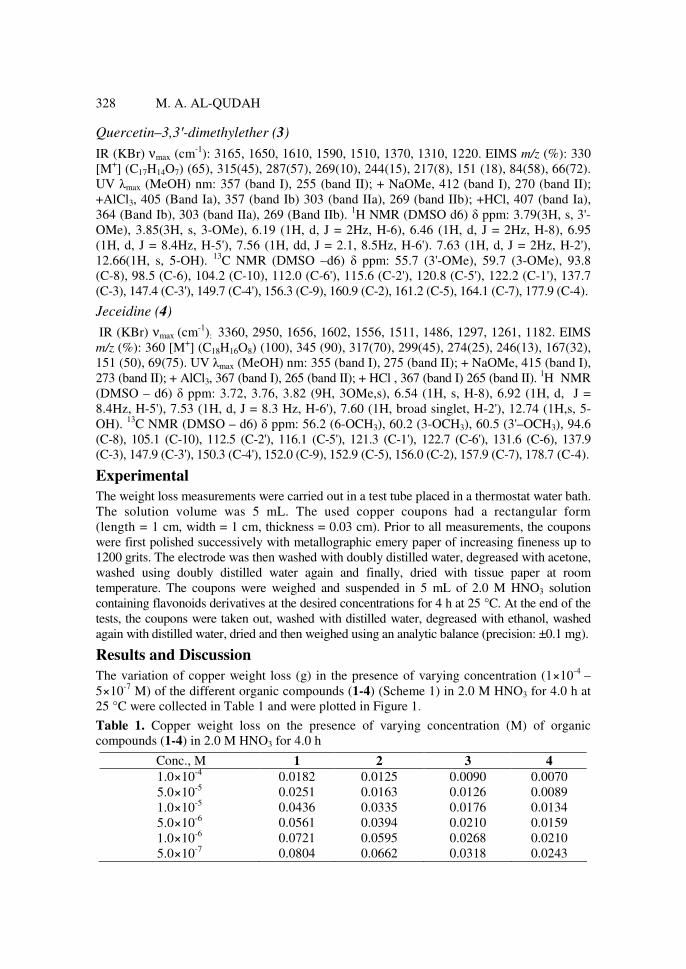
Quercetin–3,3′-dimethylether (3)
IR (KBr) νmax (cm-1
): 3165, 1650, 1610, 1590, 1510, 1370, 1310, 1220. EIMS m/z (%): 330
[M+] (C17H14O7) (65), 315(45), 287(57), 269(10), 244(15), 217(8), 151 (18), 84(58), 66(72).
UV λmax (MeOH) nm: 357 (band I), 255 (band II); + NaOMe, 412 (band I), 270 (band II);
+AlCl3, 405 (Band Ia), 357 (band Ib) 303 (band IIa), 269 (band IIb); +HCl, 407 (band Ia),
364 (Band Ib), 303 (band IIa), 269 (Band IIb). 1H NMR (DMSO d6) δ ppm: 3.79(3H, s, 3'-
OMe), 3.85(3H, s, 3-OMe), 6.19 (1H, d, J = 2Hz, H-6), 6.46 (1H, d, J = 2Hz, H-8), 6.95
(1H, d, J = 8.4Hz, H-5'), 7.56 (1H, dd, J = 2.1, 8.5Hz, H-6'). 7.63 (1H, d, J = 2Hz, H-2'),
12.66(1H, s, 5-OH). 13
C NMR (DMSO –d6) δ ppm: 55.7 (3'-OMe), 59.7 (3-OMe), 93.8
(C-8), 98.5 (C-6), 104.2 (C-10), 112.0 (C-6'), 115.6 (C-2'), 120.8 (C-5'), 122.2 (C-1'), 137.7
(C-3), 147.4 (C-3'), 149.7 (C-4'), 156.3 (C-9), 160.9 (C-2), 161.2 (C-5), 164.1 (C-7), 177.9 (C-4).
Jeceidine (4)
IR (KBr) νmax (cm-1
): 3360, 2950, 1656, 1602, 1556, 1511, 1486, 1297, 1261, 1182. EIMS
m/z (%): 360 [M+] (C18H16O8) (100), 345 (90), 317(70), 299(45), 274(25), 246(13), 167(32),
151 (50), 69(75). UV λmax (MeOH) nm: 355 (band I), 275 (band II); + NaOMe, 415 (band I),
273 (band II); + AlCl3, 367 (band I), 265 (band II); + HCl , 367 (band I) 265 (band II). 1H NMR
(DMSO – d6) δ ppm: 3.72, 3.76, 3.82 (9H, 3OMe,s), 6.54 (1H, s, H-8), 6.92 (1H, d, J =
8.4Hz, H-5'), 7.53 (1H, d, J = 8.3 Hz, H-6'), 7.60 (1H, broad singlet, H-2'), 12.74 (1H,s, 5-
OH). 13
C NMR (DMSO – d6) δ ppm: 56.2 (6-OCH3), 60.2 (3-OCH3), 60.5 (3'–OCH3), 94.6
(C-8), 105.1 (C-10), 112.5 (C-2'), 116.1 (C-5'), 121.3 (C-1'), 122.7 (C-6'), 131.6 (C-6), 137.9
(C-3), 147.9 (C-3'), 150.3 (C-4'), 152.0 (C-9), 152.9 (C-5), 156.0 (C-2), 157.9 (C-7), 178.7 (C-4).
Experimental
The weight loss measurements were carried out in a test tube placed in a thermostat water bath.
The solution volume was 5 mL. The used copper coupons had a rectangular form
(length = 1 cm, width = 1 cm, thickness = 0.03 cm). Prior to all measurements, the coupons
were first polished successively with metallographic emery paper of increasing fineness up to
1200 grits. The electrode was then washed with doubly distilled water, degreased with acetone,
washed using doubly distilled water again and finally, dried with tissue paper at room
temperature. The coupons were weighed and suspended in 5 mL of 2.0 M HNO3 solution
containing flavonoids derivatives at the desired concentrations for 4 h at 25 °C. At the end of the
tests, the coupons were taken out, washed with distilled water, degreased with ethanol, washed
again with distilled water, dried and then weighed using an analytic balance (precision: ±0.1 mg).
Results and Discussion
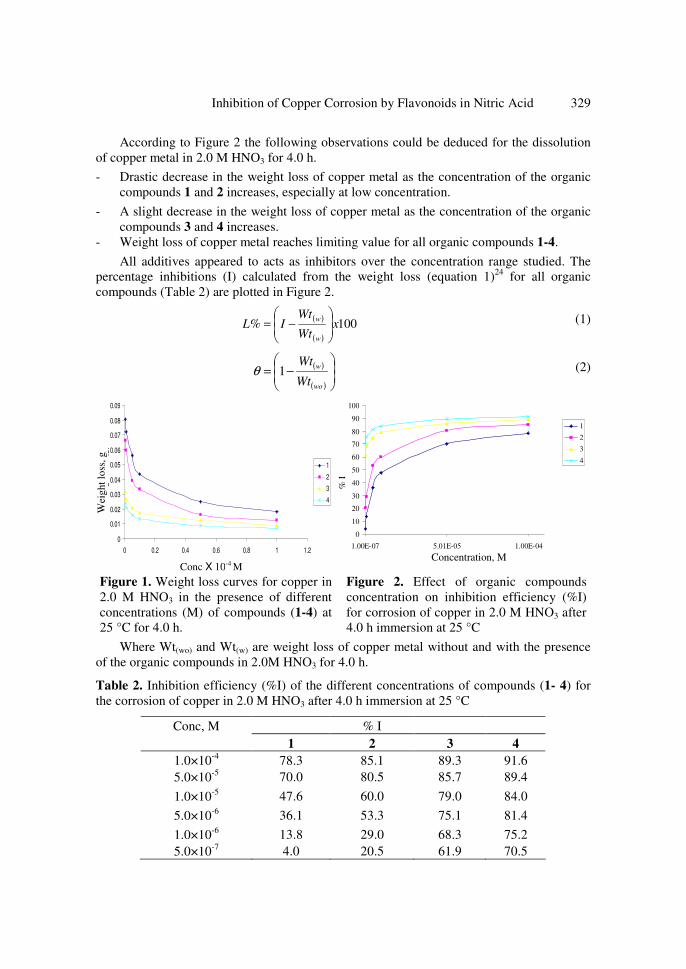
The variation of copper weight loss (g) in the presence of varying concentration (1×10⁻⁴
–
5×10⁻⁷
M) of the different organic compounds (1-4) (Scheme 1) in 2.0 M HNO3 for 4.0 h at
25 °C were collected in Table 1 and were plotted in Figure 1.
Table 1. Copper weight loss on the presence of varying concentration (M) of organic
compounds (1-4) in 2.0 M HNO3 for 4.0 h
Conc., M 1 2 3 4
1.0×10⁻⁴
0.0182 0.0125 0.0090 0.0070
5.0×10⁻⁵
0.0251 0.0163 0.0126 0.0089
1.0×10⁻⁵
0.0436 0.0335 0.0176 0.0134
5.0×10⁻⁶
0.0561 0.0394 0.0210 0.0159
1.0×10⁻⁶
0.0721 0.0595 0.0268 0.0210
5.0×10⁻⁷
0.0804 0.0662 0.0318 0.0243
Wei
gh
t lo
ss,
g
Concx10-4
Concentration, M
% I
Inhibition of Copper Corrosion by Flavonoids in Nitric Acid 329
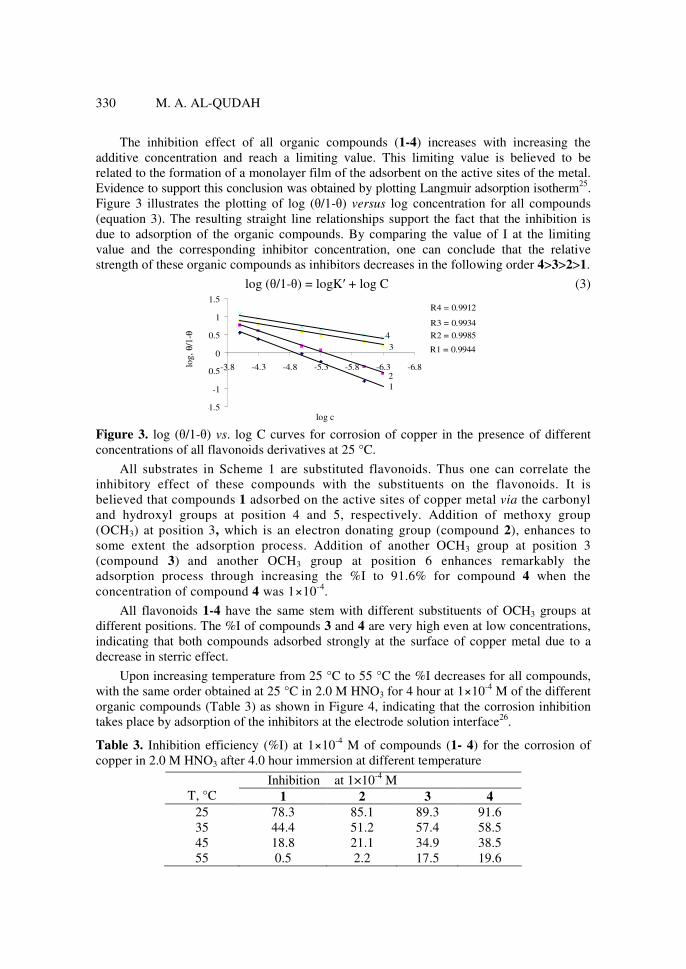
According to Figure 2 the following observations could be deduced for the dissolution
of copper metal in 2.0 M HNO3 for 4.0 h.
- Drastic decrease in the weight loss of copper metal as the concentration of the organic
compounds 1 and 2 increases, especially at low concentration.
- A slight decrease in the weight loss of copper metal as the concentration of the organic
compounds 3 and 4 increases.
- Weight loss of copper metal reaches limiting value for all organic compounds 1-4.
All additives appeared to acts as inhibitors over the concentration range studied. The
percentage inhibitions (I) calculated from the weight loss (equation 1)24
for all organic
compounds (Table 2) are plotted in Figure 2.
( )
( )
100% xWt
WtIL
w
w
−= (1)
( )
( )
−=
wo
w
Wt
Wt1θ (2)
0
0.01
0.02
0.03
0.04
0.05
0.06
0.07
0.08
0.09
0 0.2 0.4 0.6 0.8 1 1.2
we
igh
t lo
ss
(g
)
1
2
3
4
0
10
20
30
40
50
60
70
80
90
100
1.00E-07 5.01E-05 1.00E-04
1
2
3
4
Figure 1. Weight loss curves for copper in
2.0 M HNO3 in the presence of different
concentrations (M) of compounds (1-4) at
25 °C for 4.0 h.
Figure 2. Effect of organic compounds
concentration on inhibition efficiency (%I)
for corrosion of copper in 2.0 M HNO3 after
4.0 h immersion at 25 °C
Where Wt(wo) and Wt(w) are weight loss of copper metal without and with the presence
of the organic compounds in 2.0M HNO3 for 4.0 h.
Table 2. Inhibition efficiency (%I) of the different concentrations of compounds (1- 4) for
the corrosion of copper in 2.0 M HNO3 after 4.0 h immersion at 25 °C
Conc, M % I
1 2 3 4
1.0×10⁻⁴
78.3 85.1 89.3 91.6
5.0×10⁻⁵
70.0 80.5 85.7 89.4
1.0×10⁻⁵
47.6 60.0 79.0 84.0
5.0×10⁻⁶
36.1 53.3 75.1 81.4
1.0×10⁻⁶
13.8 29.0 68.3 75.2
5.0×10⁻⁷
4.0 20.5 61.9 70.5
Wei
ght
loss
, g
% I
Concentration, M Conc X 10-4 M
log c
log
, θ
/1-θ
330 M. A. AL-QUDAH
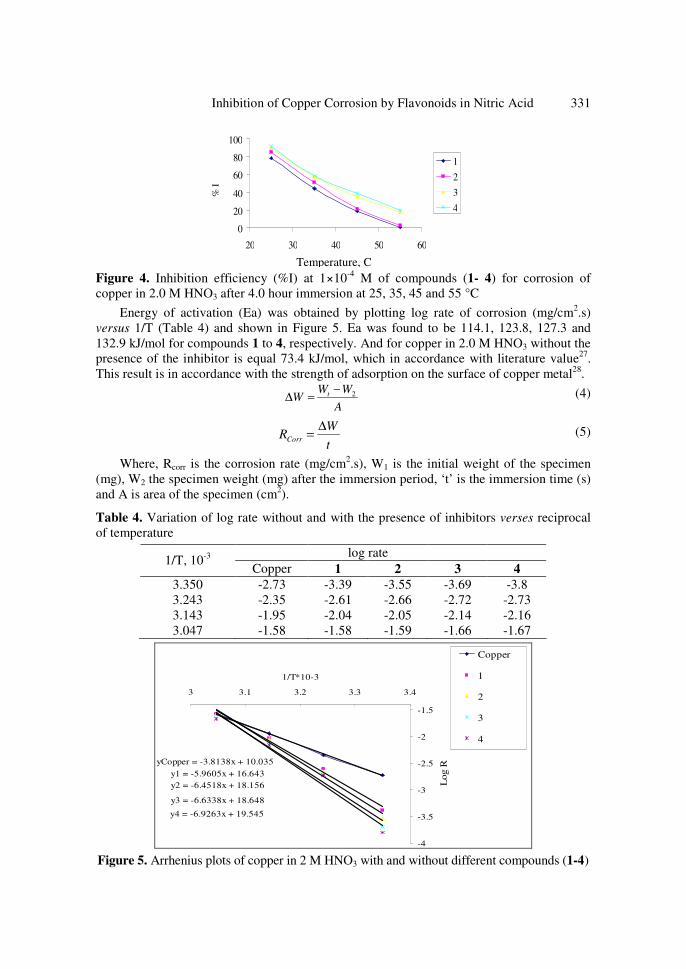
The inhibition effect of all organic compounds (1-4) increases with increasing the
additive concentration and reach a limiting value. This limiting value is believed to be
related to the formation of a monolayer film of the adsorbent on the active sites of the metal.
Evidence to support this conclusion was obtained by plotting Langmuir adsorption isotherm25
.
Figure 3 illustrates the plotting of log (θ/1-θ) versus log concentration for all compounds
(equation 3). The resulting straight line relationships support the fact that the inhibition is
due to adsorption of the organic compounds. By comparing the value of I at the limiting
value and the corresponding inhibitor concentration, one can conclude that the relative
strength of these organic compounds as inhibitors decreases in the following order 4>3>2>1.
log (θ/1-θ) = logK′ + log C (3)
R3 = 0.9934
R1 = 0.9944
-1.5
-1
-0.5
0
0.5
1
1.5
-6.8-6.3-5.8-5.3-4.8-4.3-3.8Log
(θ/1
-θ)
2
1
3
4
R4 = 0.9912
R2 = 0.9985
Figure 3. log (θ/1-θ) vs. log C curves for corrosion of copper in the presence of different
concentrations of all flavonoids derivatives at 25 °C.
All substrates in Scheme 1 are substituted flavonoids. Thus one can correlate the
inhibitory effect of these compounds with the substituents on the flavonoids. It is
believed that compounds 1 adsorbed on the active sites of copper metal via the carbonyl
and hydroxyl groups at position 4 and 5, respectively. Addition of methoxy group
(OCH3) at position 3, which is an electron donating group (compound 2), enhances to
some extent the adsorption process. Addition of another OCH3 group at position 3
(compound 3) and another OCH3 group at position 6 enhances remarkably the
adsorption process through increasing the %I to 91.6% for compound 4 when the
concentration of compound 4 was 1×10⁻⁴
.
All flavonoids 1-4 have the same stem with different substituents of OCH3 groups at
different positions. The %I of compounds 3 and 4 are very high even at low concentrations,
indicating that both compounds adsorbed strongly at the surface of copper metal due to a
decrease in sterric effect.
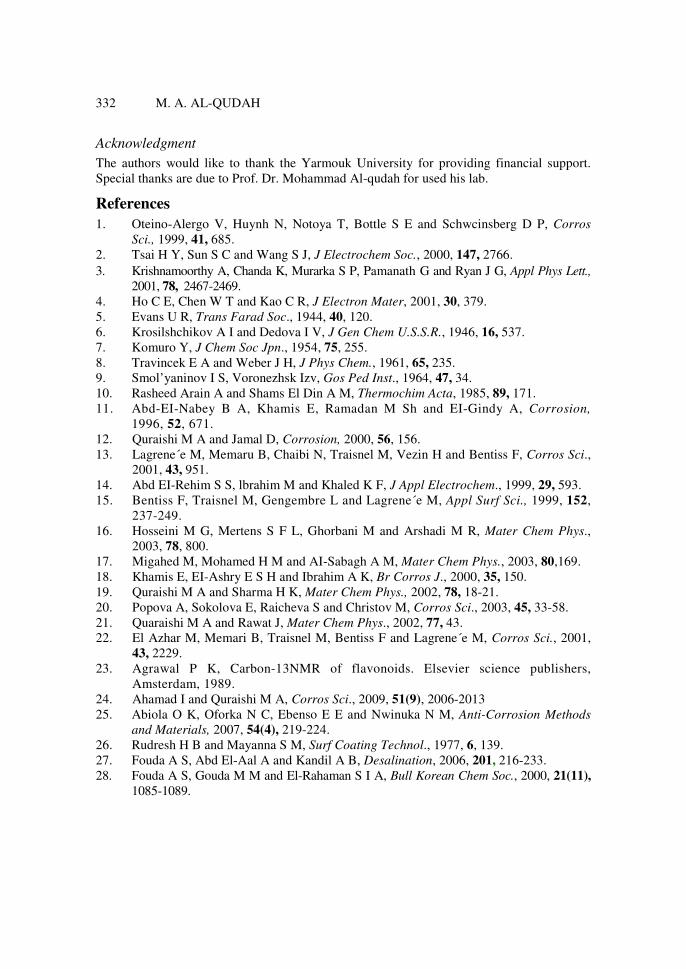
Upon increasing temperature from 25 °C to 55 °C the %I decreases for all compounds,
with the same order obtained at 25 °C in 2.0 M HNO3 for 4 hour at 1×10⁻⁴
M of the different
organic compounds (Table 3) as shown in Figure 4, indicating that the corrosion inhibition
takes place by adsorption of the inhibitors at the electrode solution interface26
.
Table 3. Inhibition efficiency (%I) at 1×10⁻⁴
M of compounds (1- 4) for the corrosion of
copper in 2.0 M HNO3 after 4.0 hour immersion at different temperature
Inhibition at 1×10⁻⁴
M
T, °C 1 2 3 4
25 78.3 85.1 89.3 91.6
35 44.4 51.2 57.4 58.5
45 18.8 21.1 34.9 38.5
55 0.5 2.2 17.5 19.6
Temperature, C
% I
Inhibition of Copper Corrosion by Flavonoids in Nitric Acid 331
0
20
40
60
80
100
20 30 40 50 60
1
2
3
4
Figure 4. Inhibition efficiency (%I) at 1×10⁻⁴
M of compounds (1- 4) for corrosion of
copper in 2.0 M HNO3 after 4.0 hour immersion at 25, 35, 45 and 55 °C
Energy of activation (Ea) was obtained by plotting log rate of corrosion (mg/cm2.s)
versus 1/T (Table 4) and shown in Figure 5. Ea was found to be 114.1, 123.8, 127.3 and
132.9 kJ/mol for compounds 1 to 4, respectively. And for copper in 2.0 M HNO3 without the
presence of the inhibitor is equal 73.4 kJ/mol, which in accordance with literature value27
.
This result is in accordance with the strength of adsorption on the surface of copper metal28
.
A
WWW t 2−
=∆ (4)
t
WRCorr
∆= (5)
Where, Rcorr is the corrosion rate (mg/cm2.s), W1 is the initial weight of the specimen
(mg), W2 the specimen weight (mg) after the immersion period, ‘t’ is the immersion time (s)
and A is area of the specimen (cm2).
Table 4. Variation of log rate without and with the presence of inhibitors verses reciprocal
of temperature
log rate 1/T, 10
-3
Copper 1 2 3 4
3.350 -2.73 -3.39 -3.55 -3.69 -3.8
3.243 -2.35 -2.61 -2.66 -2.72 -2.73
3.143 -1.95 -2.04 -2.05 -2.14 -2.16
3.047 -1.58 -1.58 -1.59 -1.66 -1.67
yCopper = -3.8138x + 10.035
y1 = -5.9605x + 16.643
y2 = -6.4518x + 18.156
y3 = -6.6338x + 18.648
y4 = -6.9263x + 19.545
-4
-3.5
-3
-2.5
-2
-1.5
3 3.1 3.2 3.3 3.4
1/T*10-3
Log R
Copper
1
2
3
4
Figure 5. Arrhenius plots of copper in 2 M HNO3 with and without different compounds (1-4)
332 M. A. AL-QUDAH
Acknowledgment
The authors would like to thank the Yarmouk University for providing financial support.
Special thanks are due to Prof. Dr. Mohammad Al-qudah for used his lab.
References
1. Oteino-Alergo V, Huynh N, Notoya T, Bottle S E and Schwcinsberg D P, Corros
Sci., 1999, 41, 685.
2. Tsai H Y, Sun S C and Wang S J, J Electrochem Soc., 2000, 147, 2766.
3. Krishnamoorthy A, Chanda K, Murarka S P, Ρamanath G and Ryan J G, Appl Phys Lett.,
2001, 78, 2467-2469.
4. Ho C E, Chen W T and Kao C R, J Electron Mater, 2001, 30, 379.
5. Evans U R, Trans Farad Soc., 1944, 40, 120.
6. Krosilshchikov A I and Dedova I V, J Gen Chem U.S.S.R., 1946, 16, 537.
7. Komuro Y, J Chem Soc Jpn., 1954, 75, 255.
8. Travincek E A and Weber J H, J Phys Chem., 1961, 65, 235.
9. Smol’yaninov I S, Voronezhsk Izv, Gos Ped Inst., 1964, 47, 34.
10. Rasheed Arain A and Shams El Din A M, Thermochim Acta, 1985, 89, 171.
11. Abd-EI-Nabey B A, Khamis E, Ramadan M Sh and EI-Gindy A, Corrosion,
1996, 52, 671.
12. Quraishi M A and Jamal D, Corrosion, 2000, 56, 156.
13. Lagrene´e M, Memaru B, Chaibi N, Traisnel M, Vezin H and Bentiss F, Corros Sci.,
2001, 43, 951.
14. Abd EI-Rehim S S, lbrahim M and Khaled K F, J Appl Electrochem., 1999, 29, 593.
15. Bentiss F, Traisnel M, Gengembre L and Lagrene´e M, Appl Surf Sci., 1999, 152,
237-249.
16. Hosseini M G, Mertens S F L, Ghorbani M and Arshadi M R, Mater Chem Phys.,
2003, 78, 800.
17. Migahed M, Mohamed H M and AI-Sabagh A M, Mater Chem Phys., 2003, 80,169.
18. Khamis E, EI-Ashry E S H and Ibrahim A K, Br Corros J., 2000, 35, 150.
19. Quraishi M A and Sharma H K, Mater Chem Phys., 2002, 78, 18-21.
20. Popova A, Sokolova E, Raicheva S and Christov M, Corros Sci., 2003, 45, 33-58.
21. Quaraishi M A and Rawat J, Mater Chem Phys., 2002, 77, 43.
22. El Azhar M, Memari B, Traisnel M, Bentiss F and Lagrene´e M, Corros Sci., 2001,
43, 2229.
23. Agrawal P K, Carbon-13NMR of flavonoids. Elsevier science publishers,
Amsterdam, 1989.
24. Ahamad I and Quraishi M A, Corros Sci., 2009, 51(9), 2006-2013
25. Abiola O K, Oforka N C, Ebenso E E and Nwinuka N M, Anti-Corrosion Methods
and Materials, 2007, 54(4), 219-224.
26. Rudresh H B and Mayanna S M, Surf Coating Technol., 1977, 6, 139.
27. Fouda A S, Abd El-Aal A and Kandil A B, Desalination, 2006, 201, 216-233.
28. Fouda A S, Gouda M M and El-Rahaman S I A, Bull Korean Chem Soc., 2000, 21(11),
1085-1089.

Submit your manuscripts athttp://www.hindawi.com
Chromatography Research International
Hindawi Publishing Corporationhttp://www.hindawi.com Volume 2013
Hindawi Publishing Corporationhttp://www.hindawi.com Volume 2013
Carbohydrate Chemistry
International Journal of
Hindawi Publishing Corporationhttp://www.hindawi.com
International Journal of
Analytical ChemistryVolume 2013
ISRN Chromatography
Hindawi Publishing Corporationhttp://www.hindawi.com Volume 2013
Hindawi Publishing Corporation http://www.hindawi.com Volume 2013Hindawi Publishing Corporation http://www.hindawi.com Volume 2013
The Scientific World Journal
Bioinorganic Chemistry and ApplicationsHindawi Publishing Corporationhttp://www.hindawi.com Volume 2013
Hindawi Publishing Corporationhttp://www.hindawi.com Volume 2013
CatalystsJournal of
ISRN Analytical Chemistry
Hindawi Publishing Corporationhttp://www.hindawi.com Volume 2013
ElectrochemistryInternational Journal of
Hindawi Publishing Corporation http://www.hindawi.com Volume 2013
Hindawi Publishing Corporationhttp://www.hindawi.com Volume 2013
Advances in
Physical Chemistry
ISRN Physical Chemistry
Hindawi Publishing Corporationhttp://www.hindawi.com Volume 2013
SpectroscopyInternational Journal of
Hindawi Publishing Corporationhttp://www.hindawi.com Volume 2013
ISRN Inorganic Chemistry
Hindawi Publishing Corporationhttp://www.hindawi.com Volume 2013
Hindawi Publishing Corporationhttp://www.hindawi.com Volume 2013
Journal of
Chemistry
Hindawi Publishing Corporationhttp://www.hindawi.com Volume 2013
Inorganic ChemistryInternational Journal of
Hindawi Publishing Corporation http://www.hindawi.com Volume 2013
International Journal ofPhotoenergy
Hindawi Publishing Corporationhttp://www.hindawi.com
Analytical Methods in Chemistry
Journal of
Volume 2013
ISRN Organic Chemistry
Hindawi Publishing Corporationhttp://www.hindawi.com Volume 2013
Hindawi Publishing Corporationhttp://www.hindawi.com Volume 2013
Journal of
Spectroscopy