Changes in Leaf Trichomes and Epicuticular Flavonoids during Leaf Development in Three Birch Taxa
Upload
independentCategory
view
0download
0
American Journal of American Journal of American Journal of American Journal of Chemistry and ApplicationChemistry and ApplicationChemistry and ApplicationChemistry and Application 2014; 1(4): 54-60 Published online September 10, 2014 (http://www.aascit.org/journal/ajca)
Keywords Aspergillus, Penicillium, Fusarium, Mycotoxigenic, Antifungal, Minimum Inhibition Concentration Received: August 21, 2014 Revised: August 28, 2014 Accepted: August 29, 2014
Antifungal activity of flavonoids isolated from Monanthotaxis littoralis against mycotoxigenic fungi from maize
Chepkirui Clara1, *, Josphat C. Matasyoh1, Isabel N. Wagara2, Jesca Nakavuma3 1Department of Chemistry, Egerton University, P. O. Box 536, Egerton-20115, Kenya 2Department of Biological Sciences, Egerton University, P. O. Box 536, Egerton-20115, Kenya 3Department of Biomolecular Resources and Biolab Sciences, Makerere University, P.O. Box 7062, Kampala, Uganda
Email address [email protected] (C. Clara)
Citation Chepkirui Clara, Josphat C. Matasyoh, Isabel N. Wagara, Jesca Nakavuma. Antifungal Activity of Flavonoids Isolated from Monanthotaxis littoralis against Mycotoxigenic Fungi from Maize. American Journal of Chemistry and Application. Vol. 1, No. 4, 2014, pp. 54-60.
Abstract This study evaluated the antifungal activity of a mixture of two closely related flavonoids namely 3, 7, 5’- trihydroxy anthocynidines and 3, 5-dihydroxy-7-methoxy anthocynidines isolated from Monanthotaxis littoralis (Annonaceae) against mycotoxigenic fungi from three genera (Aspergillus, Fusarium and Penicillium) isolated from maize samples. Dry leaves of Monanthotaxis littoralis was extracted with methanol, suspended in water and extracted with ethyl acetate. Column chromatography and Preparative Thin Layer Chromatography (PTLC) was used to purify the compounds. 1D and 2D NMR and Mass Spectroscopy were used to elucidate the structures of the compounds isolated. The extent of inhibition of fungal growth was dependent on the concentration of the flavonoids. The highest activity of the flavonoids was that against Aspergillus ochraceus with inhibition zone of 20.17 mm and MIC of 1 mg/ml. The activity of the flavonoids against the mycotoxigenic fungi had Minimum Inhibitory Concentration (MIC) values ranging from 1 mg/ml to 4 mg/ml. These results show that the two flavonoids from M. littoralis have antifungal activities against fungi that are the producers of poisonous mycotoxins found in foods. These compounds are potential antimicrobials that can be used in food preservation systems to inhibit the growth of moulds and retard subsequent mycotoxin production.
1. Introduction
Moulds are opportunistic biological agents of ubiquitous nature. They are able to colonize diverse substrates including foods. Because of their powerful arsenal of hydrolytic enzymes, these microorganisms can cause a high degree of deterioration when present in/on foods and can be responsible for considerable economic losses [1]. Furthermore, they can act as potential producer of toxic metabolites, named mycotoxins, which are potentially damaging to consumers health. According to [2] molds are known to destroy 10 to 30% of the total yield of crops and more than 30% of perishable crops by reducing their quality and quantity in developing countries. In addition moulds produce mycotoxins that can cause illness or even death to the consumers.

55 Chepkirui Clara et al.: Antifungal Activity of Flavonoids Isolated from Monanthotaxis littoralis against Mycotoxigenic Fungi from Maize
Mycotoxins are toxic secondary metabolites produced by certain fungi in agricultural products that are susceptible to mould infestations [3]. The most important mycotoxins in terms of economic importance are aflatoxins, deoxynivalenol, fumonisins, ochratoxins and zearalenones produced by A.flavus, A. parasiticus, F. moniliforme, A. ochraceus and F. graminearum, respectively [4]. These mycotoxins are produced in infected cereal seeds, most legumes especially groundnuts, cotton seed, fishmeal, nuts etc [5]. Acute liver damage, liver cirrhosis, induction of tumors and attack on central nervous system, skin disorders and hormonal effects are mostly caused by mycotoxicoses [6, 7]. Aflatoxins produced by A. flavus and A. parasiticus are the most economically important mycotoxins. Acute aflatoxicosis epidemics have been reported in several parts of Africa and Asia leading to the death of several hundreds of people [8].
Flavonoids are a large family of compounds synthesized by plants. The function of flavonoids in flowers is to provide color attractive to pollinator. Generally flavonoids in plants leaves are believed to promote physiological survival of the plant, protecting it from physiological fungal pathogens and U.V radiation [9]. Several flavonoids with antifungal activity have been isolated from different plants. Increasingly flavonoids are becoming subject of medicinal research. They have been reported to posses many useful properties including anti- inflammatory activity, enzyme inhibitors, antimicrobial activity and antitumor activity [10].
The wide and indiscriminate use of chemical preservatives has been cause of appearance of resistant microorganisms, leading to occurrence of emerging food borne diseases [11]. As a result of this, there is an increasing interest to obtain alternative antimicrobial agents from natural sources for use in food preservation. Research has shown that some plants contain compounds like flavonoids which are able to inhibit the microbial growth [12]. M. littoralis belongs to the family Annonaceae and the genus Monathotaxis. The Annonaceae family includes 130 genera and bout 2300 species distributed in tropical and subtropical areas of America, Africa and Asia [13].
2. Materials and Methods
Fresh plant materials of M. littoralis were collected from Mabira equatorial forest in Uganda. A voucher specimen was deposited at the Department of Biological Sciences, Egerton University.
2.1. Extraction of Non – Volatile
Compounds
The plant leaves materials were dried under shade to constant weight and ground to a fine powder. 1000g of the powders was extracted with methanol and after removal of the solvent by rotary evaporation; the extracts were suspended in water and extracted using 100 ml of ethyl
acetate eight times. 50g of activated charcoal was added to the extract stirred well with magnetic stirrer, filtered, evaporated by rotary evaporation and the extracts were then dried using anhydrous sodium sulphate. The ethyl acetate crude extracts were fractionated with silica gel chromatographic column using chloroform ethyl acetate mixtures in the ratio of 9:1 as eluent. The fractions obtained were monitored using thin layer chromatography (TLC), to achieve isolation of compounds. The active extracts were subjected to bioassay-guided fractionation on normal phase column chromatography, using silica gel 70-230 mesh. The compounds isolated were purified using repetitive Preparative Thin Layer Chromatography.
2.2. Isolation of the Fungi
Maize samples were collected from various households and market centers in Western Kenya. Moulds were isolated from these samples using the direct plating technique. For each sample, 20 seeds were picked randomly, surface-sterilized in 2.5% sodium hypochlorite for 30 s and rinsed in three changes of sterile distilled water. Five seeds per plate were blotted with sterile filter paper and plated on Czapek Dox and potato dextrose agar containing 7.5% sodium chloride and 133 mg streptomycin sulphate (for 1 L of media). The plates were incubated at 25°C and monitored daily for fungal growth for seven days.
2.3. Identification of the Isolated Fungi
The resulting cultures were identified based on cultural and morphological characteristics using taxonomic keys [14, 15, 16, and 17]. Morphological features of fungi were studied and the major and remarkable macroscopic features that were looked at are colony diameter, colony color on agar and reverse, exudates and colony texture. Microscopic characteristics that helped in identification are conidia heads, stipes, color and length, vesicles shape and seriation, metula covering, conidia size, shape and roughness [18]. The number of seeds showing each type of mould growth were determined and compared for each sample.
2.4. Antifungal Assays
Paper disc diffusion inhibition test was used to screen for antimicrobial activity test of the secondary metabolites as described by [1]. One hundred micro-liters of mould suspension (approximately 106 spores/ ml) were uniformly spread on sterile potato dextrose agar media in Petri dishes. One milliliter of mould suspension (approximately 106 spores) was uniformly spread on sterile potato dextrose agar media in petri dishes. Sterile sensitivity discs were soaked with 10 µl of the secondary metabolites. The soaked discs were allowed to dry before being placed in the culture plates. This was done to ensure that all the solvent was evaporated completely. The plates were refrigerated at 40C for 48 hours to allow the extracts to diffuse and then incubated for 7 days at 250C. At the end of the incubation

American Journal of Chemistry and Application 2014; 1(4): 54-60 56
period, diameters of the inhibition zones were measured to the nearest millimeter (mm). Nystatin discs (100 µg) were used as the reference standard. The Minimum Inhibitory Concentration (MIC) was determined using the paper disc diffusion method as described above. The secondary metabolites were diluted with methanol which was also used as the negative control.
2.5. Statistical Analysis
Data on inhibition zones were analyzed using Microsoft Office Excel 2007 to derive means and standard deviations.
3. Results
The secondary metabolites were active against all the Aspergillus species screened. The highest activity of the secondary metabolite was observed against A. ochraceus with inhibition zone of 20.17 mm and MIC of 1 mg/ml (Table I). The nystatin standard inhibition activity against this species was similar to that of the secondary metabolites. High activity was also observed for A. niger and A. fumigatus where MIC of 2 mg/ml was recorded though the two species had different inhibition zones. Nystatin activity against these species was slightly higher than those of the sample since inhibition zones of 19.67 mm and 16.00 mm was observed for the two species respectively. Though A. flavipes and A. flavus were showing different inhibition
zones the highest resistance to the secondary metabolites was observed against these species. This is because the highest MIC of 4 mg/ml was observed for the two species. The inhibition activity of nystatin against A. flavipes was almost double that of the sample. For A. flavus resistance to the standard was also observed.
Among the Fusarium species all the species tested were inhibited by the secondary metabolites. The highest activity of the sample was that against F. proliferatum with inhibition zones of 13.83 mm and MIC of 2.00 mg/ml. Inhibition activity of the sample greater than 10.00 mm was observed against F. avenaceum, F. culmorum and F. subglutinans. Despite the three species having different inhibition zones they all had an MIC of 4.00 mg/ml. The nystatin standard inhibition activities against the four Fusarium species differ slightly from those of the secondary metabolites except for F. subglutinans. Fusarium species showed resistance to the sample compared to the Aspergillus species as exhibited by the sizes of their inhibition zones and MIC values. P. purpurogenum and P. islandicum were inhibited by the sample with inhibition zones of 13.17 mm and 12.33 mm respectively. Though the two species had different inhibition zones they showed similar MIC of 2.00 mg/ml. Therefore the sample was more active against these two species than the Aspergillus and Fusarium species which showed an MIC of 4.00 mg/ml.
Table I. Inhibition zones of sample against various fungi species
Fungi Concentration of compound of secondary metabolites (mg/ml)
Standard Control MIC (mg/ml) 8.00 6.00 4.00 2.00 1.00
A .niger 15.00 ± 0.58 12.00 ± 1.00 8.33 ± 0.58 0.00 0.00 19.67 ± 0.47 0.00 2.00
A .ochraceus 20.17 ± 0.76 14.33 ± 0.58 10.67 ±0.58 7.00 ± 1.00 0.00 20.33 ± 0.47 0.00 1.00
A .fumigatus 14.33 ± 0.58 11.00 ± 1.00 7.50 ± 0.50 0.00 0.00 16.00 ± 0.82 0.00 2.00
A .flavipes 11.17 ± 0.29 9.67 ± 0.58 0.00 0.00 0.00 20.67 ± 0.41 0.00 4.00
A .flavus 13.50 ± 0.50 9.17 ± 0.76 0.00 0.00 0.00 13.00 ± 2.16 0.00 4.00
F. culmorum 10.17 ± 0.29 6.770 ± 0. 93 0.00 0.00 0.00 12.50 ± 0.41 0.00 4.00
F. avenaceum 13.50 ± 0.50 7.45 ± 0.50 0.00 0.00 0.00 12.33 ± 0.47 0.00 4.00
F. proliferatum 13.83 ± 1.04 9.6 ± 0.53 6.33 ± 0.57 0.00 0.00 10.63 ± 0.45 0.00 2.00
F. subglutinans 12.33 ± 0.58 7.50 ± 0.50 0.00 0.00 0.00 19.33 ± 0.47 0.00 4.00
P. purpurogenum 13.17 ± 0.76 9.00 ± 1.00 6.17 ± 0.29 0.00 0.00 16.33 ± 0.94 0.00 2.00
P. islandicum 12.33 ± 0.58 9.83 ± 0.76 6.33 ± 0.29 0.00 0.00 15.33 ± 0.47 0.00 2.00
3.1. Characterization of the Secondary
Metabolites
Analysis of the NMR spectra of secondary metabolites sample indicated that it consisted of two closely related compounds designated as (1) and (2). When the sample containing these compounds was spotted on TLC two purple spots were overlapping suggesting the presence of two closely related compounds. The 13 C NMR spectrum of the same sample showed a lot of peak splitting and
overlapping. From the 1H NMR spectrum there were 14 aromatic protons and one methoxy group. This implies that the difference between the two compounds was a methoxy group.
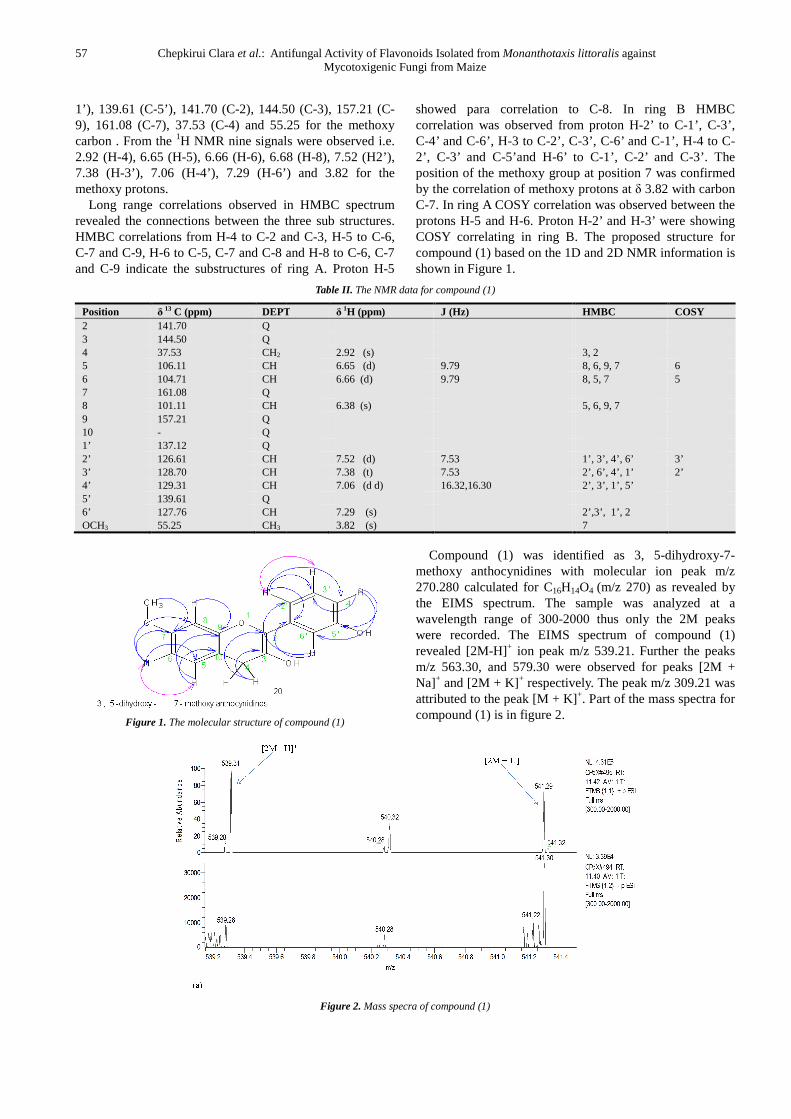
Compound (1) had 16 carbons, 14 hydrogen and 4 oxygen and therefore molecular formula C16H14O4. The NMR data for this particular compound is shown below in Table (II). The 13C NMR spectrum of (1) showed 16 signals i.e. δc 101.11 (C-8), 104.71 (C-6), 106.11 (C-5), 126.61 (C-2’), 127.76 (C-6’), 128.70 (C-3’), 129.31 (C-4’), 137.12 (C-
57 Chepkirui Clara et al.: Antifungal Activity of Flavonoids Isolated from
1’), 139.61 (C-5’), 141.70 (C-2), 144.509), 161.08 (C-7), 37.53 (C-4) and 55.25carbon . From the 1H NMR nine signals were observed2.92 (H-4), 6.65 (H-5), 6.66 (H-6), 6.68 (H7.38 (H-3’), 7.06 (H-4’), 7.29 (H-6’) amethoxy protons.
Long range correlations observed in HMBC spectrum revealed the connections between the three HMBC correlations from H-4 to C-2 and CC-7 and C-9, H-6 to C-5, C-7 and C-8 and Hand C-9 indicate the substructures of ring A.
Position δ 13 C (ppm) DEPT
2 141.70 Q 3 144.50 Q 4 37.53 CH2 5 106.11 CH 6 104.71 CH 7 161.08 Q 8 101.11 CH 9 157.21 Q 10 - Q 1’ 137.12 Q 2’ 126.61 CH 3’ 128.70 CH 4’ 129.31 CH 5’ 139.61 Q 6’ 127.76 CH OCH3 55.25 CH3
Figure 1. The molecular structure of compound (1)
: Antifungal Activity of Flavonoids Isolated from Monanthotaxis littoralisMycotoxigenic Fungi from Maize
144.50 (C-3), 157.21 (C-55.25 for the methoxy
signals were observed i.e. 6), 6.68 (H-8), 7.52 (H2’),
6’) and 3.82 for the
ong range correlations observed in HMBC spectrum led the connections between the three sub structures.
2 and C-3, H-5 to C-6, 8 and H-8 to C-6, C-7
indicate the substructures of ring A. Proton H-5
showed para correlation to Ccorrelation was observed from C-4’ and C-6’, H-3 to C-2’, C2’, C-3’ and C-5’and H-6’ toposition of the methoxy group at position 7 was confirmed by the correlation of methoxyC-7. In ring A COSY correlation was observed between the protons H-5 and H-6. Proton HCOSY correlating in ring Bcompound (1) based on the 1D and 2D NMR information is shown in Figure 1.
Table II. The NMR data for compound (1)
DEPT δ 1H (ppm) J (Hz)
2.92 (s) 6.65 (d) 9.79 6.66 (d) 9.79
6.38 (s)
7.52 (d) 7.53 7.38 (t) 7.53 7.06 (d d) 16.32,16.30
7.29 (s) 3.82 (s)
The molecular structure of compound (1)
Compound (1) was identified as 3, 5methoxy anthocynidines with molecular ion peak m/z 270.280 calculated for C16H14
the EIMS spectrum. The sample was analyzed at a wavelength range of 300-2000 thus only the 2M peaks were recorded. The EIMS spectrum of compound (revealed [2M-H]+ ion peak m/z 539.21. Further the peaks m/z 563.30, and 579.30 were observed for peaks [2M + Na]+ and [2M + K]+ respectively. The peak m/z 309.21 was attributed to the peak [M + K]compound (1) is in figure 2.
Figure 2. Mass specra of compound (1)
Monanthotaxis littoralis against
showed para correlation to C-8. In ring B HMBC from proton H-2’ to C-1’, C-3’,
2’, C-3’, C-6’ and C-1’, H-4 to C-6’ to C-1’, C-2’ and C-3’. The
position of the methoxy group at position 7 was confirmed by the correlation of methoxy protons at δ 3.82 with carbon
In ring A COSY correlation was observed between the . Proton H-2’ and H-3’ were showing
COSY correlating in ring B. The proposed structure for compound (1) based on the 1D and 2D NMR information is
HMBC COSY 3, 2 8, 6, 9, 7 6 8, 5, 7 5 5, 6, 9, 7 1’, 3’, 4’, 6’ 3’ 2’, 6’, 4’, 1’ 2’ 2’, 3’, 1’, 5’ 2’,3’, 1’, 2 7
) was identified as 3, 5-dihydroxy-7-methoxy anthocynidines with molecular ion peak m/z
14O4 (m/z 270) as revealed by the EIMS spectrum. The sample was analyzed at a
2000 thus only the 2M peaks ed. The EIMS spectrum of compound (1)
ion peak m/z 539.21. Further the peaks m/z 563.30, and 579.30 were observed for peaks [2M +
respectively. The peak m/z 309.21 was attributed to the peak [M + K]+. Part of the mass spectra for

American Journal of Chemistry and
Compound (2) had 15 carbons, 12 hydrogen and 5
oxygen and therefore molecular formula CIII) . A total of 15 peaks were observed in the i.e. δc 141.70 (C-2), 144.70 (C-3), 37.93 (C5), 108.06 (C-6), 161.06 (C-7), 99.11 (C137.13 (1’), 126.61 (C-2’), 128.78 (C139.65 (C-5’) and 127.76 (C-6’). The 1
7 aromatic protons and a singlet for the methylene groupδ 2.92 (H-4), 6.33 (H-5), 6.31 (H-6), 6.29 (H2’), 7.38 (H-3’), 7.04 (H-4’) and 7.29 (H
Position δ 13 C (ppm) DEPT
2 141.70 Q 3 144.50 Q 4 37.93 CH2 5 106.56 CH 6 108.06 CH 7 161.06 Q 8 99.11 CH 9 156.87 Q 10 - Q 1’ 137.13 Q 2, 126.61 CH 3’ 128.76 CH 4’ 128.45 CH 5’ 139.65 Q 6’ 127.76 CH
Figure 3. The molecular structure of compound (2)
Compound (2) was identified as 3, 7, 5’anthocynidines with molecular mass of 256.253 calculated
American Journal of Chemistry and Application 2014; 1(4): 54-60
Compound (2) had 15 carbons, 12 hydrogen and 5 oxygen and therefore molecular formula C15H12O5 (Table
A total of 15 peaks were observed in the 13C spectrum 3), 37.93 (C-4), 106.56 (C-
7), 99.11 (C-8), 156.87 (C-9), 2’), 128.78 (C-3’), 128.45 (C-4’),
1H spectrum showed and a singlet for the methylene group i.e.
6), 6.29 (H-8), 7.52 (H-7.29 (H-6’). The HMBC
correlation from H-4 to C-2, CC-8 and C-9, H-6 to C-5, C-7 and CC-7 and C-9 were observed in ring A. In ring B HMBC correlation from H-2’ to C-1’, CC-1’, C-2’and C-4’ , H-4 to Cand H-6’ and C-1’, C-2’, C-3’, Cand H-6 were showing COSY correlation in ring A while proton H-2’and H-3’ were showring B.
Table III. The NMR data for compound (2)
δ 1H (ppm) J (Hz) HMBC
2.92 (s) 5, 2, 3 6.33 (d) 15.06 4, 8, 6, 7, 9 6.31 (d) 14.29 8, 5, 7 6.29 (s) 5,6, 9, 7 7.52 (d) 7.53 1’, 3’, 4’, 6’ 7.38 (t) 7.53 2’, 4’, 1’, 6’ 7.04 (d d) 20.23, 15.81 6’, 2’, 3’, 1’, 5’ 7.29 (s) 2’,3’, 1’, 4’, 2
The molecular structure of compound (2)
Compound (2) was identified as 3, 7, 5’- trihydroxy with molecular mass of 256.253 calculated
for C15H12O4. The sample was analyzed at wavelength ranges of 300-2000 and therefore only the 2M peaks were recorded. The EIMS spectrum of compound [2M-H] + ion peak m/z 511.18. Further the peaks m/z 513.33, 535.17 and 551.30 for peaks [2M + H]Na]+ and [2M + K]+ respectively were observed. mass spectra for compound (2) is1 D, 2 D NMR and EIMS information described the proposed structure of compound (2above.
Figure 4. Mass spectra of compound (2)
58
2, C-3 and C-5, H-5 to C-6, C-7, 7 and C-8 and H-8 to C-5, C-6,
9 were observed in ring A. In ring B HMBC 1’, C-3’, C-4’ and C-6’, H-3’ to
4 to C-1’, C-2’, C-3’, C-5, and C-6’ 3’, C-2 and C-4’. Proton H-5
6 were showing COSY correlation in ring A while 3’ were showing COSY correlation in
COSY 6 5 3’ 2'
The sample was analyzed at wavelength 2000 and therefore only the 2M peaks were
recorded. The EIMS spectrum of compound (2) revealed ion peak m/z 511.18. Further the peaks m/z
13.33, 535.17 and 551.30 for peaks [2M + H]+, [2M + respectively were observed. Part of
mass spectra for compound (2) is in figure 4. Based on the 1 D, 2 D NMR and EIMS information described the proposed structure of compound (2) is shown in figure 3
59 Chepkirui Clara et al.: Antifungal Activity of Flavonoids Isolated from Monanthotaxis littoralis against Mycotoxigenic Fungi from Maize
4. Discussion
The flavonoids are biosynthesized through the mevalonic pathway and the isolated flavonoids pass through the (2S) – Liquiriteginin. The activity of the compound containing the mixture of the two flavonoids could be attributed to the two flavonoids. This is because different researchers have reported the ability of flavonoids to inhibit fungal growth [12, 19 and 20]. Their activity is probably due to their ability to complex with extracellular and soluble proteins [21]. Several flavonoids with antifungal activity have been isolated from different plants. Liquintigenin and isoliquintigenin isolated from Amboyna wood was found to be active against F. oxsysporum, A. niger and P. italicum [12]. It has been reported that the chalcone 2-hydroxy-4, 4’, 6’- trimethoxy chalcone could inhibit the spores germination of A. flavus [22]. Further eicatechin isolated from Azadirachta indica leaves was found to inhibit the growth of A. niger, A. fumigatus and P. citrii [20]. Anthocyanidines have also been shown to have antifungal activity. Anthocyanidine isolated from Bryophyllum pinnatum was found to be active against the plant pathogen A. niger and the clinical fungus Candida albicans [23]. Since the sample used in this study consisted of two flavonoids mixtures, the high antifungal activity of this mixture of compounds could therefore have resulted from their synergic effect. Enhanced antimicrobial activity of flavonoids as a result of their synergistic effects has been reported where the mixture of the different flavonoids had high antimicrobial activity than the activity of the individual flavonoids [24].
5. Conclusion
The results obtained show that the flavonoids mixture obtained from M. littorals is potential antimicrobial that can be used in preservation systems after toxicological tests.
Acknowledgements
The authors are grateful to the Lake Victoria Basin Research Initiative (VicRes) for the financial support.
References
[1] Souza, E. L., Lima, E. O, Freire K. R. and Sousa C. P. (2005). Inhibitory action of some essential oils and phytochemicals on the growth of various moulds isolated from foods. Brazilian archives of Biology and Technology. 48: 245-250.
[2] Agrios, G.N. (1997). Plant Pathology, 4th edition. Academic Press, New York. P 635.
[3] Wagacha, J. M. and Muthomi, J. W. (2008). Mycotoxin problem in Africa: Current Status, implications to food safety and health and possible management strategies. International Journal of Food Microbiology. 124:1-12.
[4] FAO. (1999). Preventing mycotoxin contamination. Food, Nutrition and Agriculture. FAO Food Nutrition Division. 23, Rome. Pg 9-28.
[5] Kaaya, A. N., Kyamuhangire, W. and Kyamanwa, S. (2006). Factors affecting aflatoxin contamination of harvested maize in the three agro ecological zones of Uganda. Journal of Applied sciences. 6: 2401 – 2407.
[6] Ibrahim, I. K, Shareef A. M. and Al-Joubory K. M. T. (2000). Ameliorative effects of sodium bentonite on phagocytosis and Newcastle disease antibody formation in broiler chickens during aflatoxicosis. Research Veterinary Science. 69: 119–122.
[7] Oguz, H., Hadimli H. H, Kurtoglu, V. and Erganis, O. (2003). Evaluation of humoral immunity of broilers during chronic aflatoxin (50 and 100 ppb) and clinoptilolite exposure. Journal of Vetenary Medicine. 154: 483–486.
[8] Varga, J., Frisvad, J. C. and Samson, R. A. (2009). A reappraisal of fungi producing aflatoxins. World Mycotoxin Journal. 2: 263-277.
[9] Harborne, J. B and Williams, C. A. (2000). Advances in flavonoid research since 1992. Phytochemistry. 55:481–504.
[10] Harborne, J. B and Baxter, H. (1999). The handbook of natural flavonoids. Volumes 1 and 2. John Wiley and Sons; Chichester, UK.
[11] Akinpelu, D. A. (2001). Antimicrobial activity of Anacardium occidentale Bark. Fitoterapia.72: 286-287.
[12] Irawan, W. K, Kazutaka, I. and Sanro, T. (2005). Antifungal Activities Against Plant Pathogenic fungi of Flavonoids Isolated from Amboyna Wood. Pakistan Journal of Biological Science. 8: 136-140.
[13] Chang, F. R., Wei, J. L. and Teng, C. M. (1998). Antiplatelets aggregation constituents from annona purpurea. Journal of Natural products 61: 1457-1461.
[14] Pitt, J. I. (1979). The genus Penicillium and its teleomorphic states Eupenicillium and Talaromyces. Academic Press, London
[15] Nelson, P. E., Toussoun, T. A. and Marasas, W. F. O. (1983). Fusarium species. An illustrated manual for identification. The Pennsylvania State University Press, University Park, PA, USA.
[16] Kozakiewtez, L. Z. (1989). Aspergillus species in stored products. Mycological Paper. 16: 1-188.
[17] Klich, M. (2002). Identification of common Aspergillus species. ASM Press, Washington, DC, p. 116.
[18] Diba, K. K., Mirhendi, S. H. and Mahmoude, M. R. (2007). Identification of Aspergillus species using morphological characteristics. Pakistan Journal of Medical Science 23: 867-872.
[19] Pandey, M. K., Pandey1, R., Singh1, V. P., Pandey1, V. B and Singh, U. P. (2002). Antifungal Activity of 4',7-Dimethoxyisoflavone Against Some Fungi. Mycobiology. 30: 55-56.
[20] Kanwal, Q., Ishtiaq, H., Hamid L. S. and and Arshad, J. (2011). Antimicrobial Activity Screening of Isolated flavonoids from Azadirachta indica leaves. Journal of Serbian Chemical Society. 76:375–384.

American Journal of Chemistry and Application 2014; 1(4): 54-60 60
[21] Dhiman, A., Nanda, A., Ahmad, S. and Narasimhan, B. (2011). Invitro Antimicrobial activity Methanol Leaf Extract of Psidium guajara. Journal of Pharmacy and Bioallied Sciences. 3: 226-229.
[22] Mishra, P. K, Sarma, B. K., Singhai P. K and Singh, U. P. (2007). Antifungal Activity of 2-Hydroxy 4,4',6'-Trimethoxy Chalcone. Mycobiology. 35: 72-75.
[23] Ebere, D. O. and Uchenna, F. N. (2011). Two novel
flavonoids from Bryophyllum pinnatum and their antimicrobial Activity. Journal of Chemical Pharmaceutical Research 3:1-10.
[24] Pankaj, G., Bipin, K. A. and Sonal, G. (2010). A Study on Combinatorial Effects of Various Flavonoids for Their Antibacterial Potential against Clinically Significant Bacterial Species Journal of Biological Chemistry. 38: 255-258.
Copyright © 2022 FDOKUMEN