
Information Fusion for Anomaly Detection with the Dendritic Cell Algorithm
38
Information Fusion for Anomaly Detection with the Dendritic Cell Algorithm Julie Greensmith, Uwe Aickelin and Gianni Tedesco School of Computer Science, University of Nottingham, NG8 1BB, UK. jqg, uxa, [email protected] Abstract Dendritic cells are antigen presenting cells that provide a vital link between the innate and adaptive immune system, providing the initial detection of pathogenic invaders. Research into this family of cells has revealed that they perform infor- mation fusion which directs immune responses. We have derived a Dendritic Cell Algorithm based on the functionality of these cells, by modelling the biological signals and differentiation pathways to build a control mechanism for an artificial immune system. We present algorithmic details in addition to experimental results, when the algorithm was applied to anomaly detection for the detection of port scans. The results show the Dendritic Cell Algorithm is successful at detecting port scans. Key words: Dendritic cells, data fusion, immune system, anomaly detection, port scans. 1 Introduction Dendritic Cells (DCs) are natural anomaly detectors. In this paper we present a Dendritic Cell Algorithm (DCA) approach to information fusion, combining key elements of immunological theory with the engineering principles of data fusion. In the human immune system, DCs have the power to suppress or activate the immune system by correlation of signals representing their envi- ronment, combined with locality markers in the form of antigens. Antigens are proteins in structure and are any protein to which the immune system can po- tentially respond. These cells are responsible for the detection of pathogens in the human body through the correlation of information (in the form of molecu- lar signals) within the environment. By using an abstraction of DC behaviour, similar detection properties are shown, resulting in an algorithm capable of Preprint submitted to Elsevier 21 September 2007 Manuscript
Transcript of Information Fusion for Anomaly Detection with the Dendritic Cell Algorithm

Information Fusion for Anomaly Detection
with the Dendritic Cell Algorithm
Julie Greensmith, Uwe Aickelin and Gianni Tedesco
School of Computer Science,University of Nottingham, NG8 1BB, UK.
jqg, uxa, [email protected]
Abstract
Dendritic cells are antigen presenting cells that provide a vital link between theinnate and adaptive immune system, providing the initial detection of pathogenicinvaders. Research into this family of cells has revealed that they perform infor-mation fusion which directs immune responses. We have derived a Dendritic CellAlgorithm based on the functionality of these cells, by modelling the biologicalsignals and differentiation pathways to build a control mechanism for an artificialimmune system. We present algorithmic details in addition to experimental results,when the algorithm was applied to anomaly detection for the detection of portscans. The results show the Dendritic Cell Algorithm is successful at detecting portscans.
Key words: Dendritic cells, data fusion, immune system, anomaly detection, portscans.
1 Introduction
Dendritic Cells (DCs) are natural anomaly detectors. In this paper we presenta Dendritic Cell Algorithm (DCA) approach to information fusion, combiningkey elements of immunological theory with the engineering principles of datafusion. In the human immune system, DCs have the power to suppress oractivate the immune system by correlation of signals representing their envi-ronment, combined with locality markers in the form of antigens. Antigens areproteins in structure and are any protein to which the immune system can po-tentially respond. These cells are responsible for the detection of pathogens inthe human body through the correlation of information (in the form of molecu-lar signals) within the environment. By using an abstraction of DC behaviour,similar detection properties are shown, resulting in an algorithm capable of
Preprint submitted to Elsevier 21 September 2007
Manuscript

performing anomaly detection. The resultant algorithm uses a set of weightsderived or the processing of input signals from actual immunological data,generated through an interdisciplinary collaboration with immunologists[32].
DCs in particular are suitable as inspiration for intrusion detection for tworeasons. Firstly, DCs themselves perform an intrusion detection role withinthe human immune system. Secondly, DCs perform their function with lowrates of false positives and high rates of true positives - properties essential toany anomaly detection technique. In essence, DCs are multi-sensor data fusionagents through processing environmental molecular signals. This makes themideal inspiration for the development of a data fusion algorithm.
The DCA was introduced in 2005[8] and has demonstrated potential as a clas-sifier for static machine learning data [8], as a simple port scan detector underexperimental conditions[10] and in real time[9]. Our results show that theDCA can successfully detect anomalous processes forming a port scan attack.The DCA is inspired by the human immune system and is termed an artificialimmune system (AIS). While the majority of AIS algorithms do not performdata fusion, idiotypic network models are used for the purpose of robotic con-trol [12]. Although belonging to the field of artificial immune systems, theDCA differs from other immune inspired anomaly detection algorithms in anumber of significant ways:
• The algorithm is based on cutting edge experimental immunology.• DCs combine multiple signals to assess the current context of their environ-
ment.• Asynchronously DCs sample another data stream (antigen) to be combined
with the fused signals.• The correlation between context and antigen leads to the detection of anoma-
lies.• Unlike other anomaly detection algorithms, there is no pattern matching
based on string similarity metrics.
The aims of this paper are threefold: to model artificial DCs drawing inspi-ration from the DCs of the human immune system; to present a resultantalgorithm through a formalised description; and to apply the algorithm to anexample anomaly detection problem. As this algorithm is a novel algorithm, itis not yet fully characterised. As a result, fine grained analysis of the selectionof weights and comparison to other standard techniques are not discussed inthis paper. Please refer to [11] for further experiments.
In this paper The DCA is applied to the detection of a port scan, which forms aconvenient small-scale computer security problem. Section 2 contains relevantbackground information regarding the problem of port scans and current scan-ning detection techniques. Section 3 presents the biological inspiration of the
2

DCA, a summary of relevant developments in immunology, and rudimentaryDC biology. This is followed by Sections 4 and 5, describing the abstractionprocess, a formalised description of the DCA and its implementation as ananomaly detector. This is followed by experimentation with its application asa port scan detector. Section 6 includes a sensitivity analysis of a selection ofparameters. The paper concludes with a discussion of the results of the portscan investigation and suggestions for future work.
2 Anomaly Detection and Port Scanning
One notable application area of multi-sensor data fusion is anomaly detec-tion, a technique used in Intrusion Detection, which uses behaviour basedapproaches to detect abuse and misuse of computer systems. Traditional ap-proaches to computer security have relied on signature based approachesfor the detection of intruders. Network based intrusion detection systems(IDS) such as Snort[25] cross reference patterns of network packets againsta database of known intrusions. If a packet matches any of the signaturescontained in the database an alert is generated, notifying the user of a poten-tial intrusion. One problem with signature based approaches is that slightlymodified intrusions or brand-new intrusions are not detected as they are notcontained within the database resulting in false negatives.
Anomaly detection offers an alternative approach, by using a defined databaseof ‘normal’, either in terms of machine behaviour or user behaviour. Dataat run time is compared against the normal profile and sufficient deviationcauses the generation of alert. This is demonstrated through the researchof the negative selection algorithm[13]which forms the majority of anomalydetection research within artificial immune systems. Unfortunately, definingwhat is normal is non-trivial and has a tendency to change over time, givingrise to systems with a high rate of false positives. To overcome the problems offalse positives, a whole host of methods have been employed. This frequentlyinvolves adding a dynamic profiler to account for expected changes in thenormal profile, or the use of more and disparate data sources. It is worthy ofnote that
In computer security, anomaly detection has been applied to a wide range ofproblems. This includes the detection of trojans, viruses, rootkits, networkexploits, and distributed denial of service. As an application of anomaly de-tection in computer security, we examine the problem of detecting port-scans.They are a key tool in initiating an attack, and are frequently used in ‘insiderattacks’ which are performed by authorised users.
3

2.1 General Principles of Port Scanning
Port Scanning is a technique of network cartography. It is used by systemadministrators to check specified hosts on their network for availability andto monitor services in use. However it can be subverted for more maliciouspurposes. Port scanning tools such as ‘Network Mapper’ (nmap) [23] can revealinformation about hosts responding on a given set of network addresses. Thisinformation may be used by attackers to discover a set of target hosts whichare operating services likely to be vulnerable to attack. It can also be usedfor an attacker to learn and understand the topology of a network in order tolaunch an attack such as a distributed denial of service.
A host on an IP network has one or more IP addresses. Each IP addresshas a range of 216 TCP ports and 216 UDP ports. Ports are simply a way ofmultiplexing many different types of communication through a single networkaddress. This is why it is possible to download mail and surf the web at thesame time. A program running on a network host may listen for requests onone or more (address, protocol, port) tuples. Many services typically listenfor requests on standard port numbers (such as TCP port 80 for the HTTPservice), though in reality, a service can be located on any port number. Portscanning involves probing a host to discover potential exploitable ports.
Instances of port scans differ from each other through a number of importantproperties. At a high level of abstraction there are two distinctions to be made.Firstly, modern networks are comprised of suites of various network protocolswhich offer different kinds of endpoints which can be useful to map. Thiswork restricts discussion to IP networks in which there are IP address, TCPport and UDP port endpoints. Scans which map out these different types ofendpoints use different methods. Secondly, attackers rarely wish to scan everypossible endpoint reachable from their network, so a subset of endpoints areselected for mapping. The way in which the scope of the scan is restrictedleads to a differing ‘scan footprint’.
Once a scanner has created a list of endpoints, a probe is performed on eachendpoint in order to obtain the scan results. As mentioned, various probetechniques are available depending on what kind of endpoint is being probedand for what information. The three main types of probe are:
(1) Host probe: Determining if a given network address is assigned to a host(2) Port probe: Determining if a service is listening at an (address, protocol,
port) tuple(3) Service probe: Determining what kind of service is running over an (ad-
dress, protocol, port) tuple
Host probes are typically carried out by sending ICMP echo requests to the
4

IP address being queried. For this reason host scans are usually referred to as“ping scans” after the name of the UNIX program for sending these packets. Ifa host is associated with the queried IP address it may respond with an ICMPecho reply. However many systems simply do not respond to echo requests dueto the potential for abuse. For this reason TCP probes may be sent to a portlikely to be unfiltered (such as TCP port 80) and any response at all fromthat address is considered positive. If there are intervening routers betweenthe scanner and the target host an ICMP host unreachable message may begenerated for any traffic sent to an inactive address.
In the TCP/IP protocol suite, UDP and TCP port probes are possible. TCPport scans occur with much higher frequency than other types of scan. Thesimplest type of TCP probe connects to a port on a remote address and ifthe connection succeeds immediately closes the connection. A more stealthyapproach, termed a “SYN scan” simply sends the first packet of the three-way handshake and uses the response packet to distinguish between open andclosed ports. This usually requires super-user privileges. The only availabletechnique for probing UDP ports is to send a packet containing random datato a UDP port on a remote host. If the port is open no response will begenerated and if the port is closed an ICMP port unreachable error message isgenerated. Service scans are typically carried out after a port scan and lead toknowledge of the the type and version of operating system and network servicesoftware running on a remote host. In fact, the exact behaviour elicited by ahost as a response to any of these probe types can be used in determining theoperating system type and version.
These probing techniques may be combined with lists of endpoints to performdifferent types of scan. Three classes of scan footprint suffice to describe anyparticular scan type:
(1) Horizontal Port Scan: Here the attacking host scans a range of IP ad-dresses using the same port. This can reveal a set of ‘live’ hosts on anetwork with a specific open port. This is also used in several scanningworms based attacks. According to Staniford et al [28] this is the mostcommon type of scan footprint.
(2) Vertical Port Scan: The attacking host sends several packets to the sameIP address across a range of ports. This is used to target a specific host toexamine any open ports or to uncover vulnerable running services. Thiscan also be used to retrieve detailed information on the OS of the victimhost.
(3) Block Scan: This is a hybrid method combining a range of addresses witha range of ports. This is also used to target specific hosts. It is alsoused to generate ’hit-lists’ for future attacks. Block scans can potentiallytake a very long time, hence the results of a ping scan may be used todramatically reduce the number of endpoints to be probed.
5

Port scans may seem innocuous, but they can be used for malicious purposes.It is reasonable to use a port-scan as a model of an intrusion given that theyfrequently play some role in an attack, be it a targeted exploit or a scanningworm. Staniford et al are quoted as saying “... we detect in practice thatalmost all of them [unsolicited scans] come from compromised hosts and arevery likely to be hostile”. Surprisingly, port scan detection appears to be anunder-researched area, while port scanning occurs frequently as a pre-cursorfor more serious attacks. The detection of an ICMP ping scan forms the focusof the remainder of this section.
2.2 Port Scan Detection
Previous work in this area is surprisingly somewhat sparse. A number of IDShave the capability to detect some types of port scan[27,28,24] but most haveso far relied on the assumption that X events occur within time frame Y . Forexample, Spice by Staniford et al [28]produces an alert every time a single IPconnected to more than 15 hosts within time window Y . However, these typesof technique cannot be used to detect stealthy scans which do not produceenough events within the specified time window.
The detection of scanning worms is a closely related and comparatively wellresearched area. Scanning worms frequently use port scans to generate a list ofvulnerable hosts for propagation. Schecter et al [26]use a technique called re-verse sequential hypothesis testing. This is based on connection analysis whichdetermines the probability of a connection being anomalous. These data arecombined with network flow information and the data sources correlated. De-tection of scanning using the worm detection approach resulted in the detec-tion of all but the stealthiest scans, namely those with a very slow scanningrate.
A worm detection technique pertinent to ICMP scan detection is the use ofICMP destination unreachable errors (Type 3 error) to detect the propagationof worms across a network. Bakos et al [2] used the capture and analysis ofICMP packets and packet flow to identify ‘blooms’ of ICMP traffic acrossa network. They assume that a high rate of Type 3 errors is indicative ofa worm. Early detection of scanning worms was achieved in the preliminaryresults presented. More details regarding the use of this technique in a realisticnetwork scenario under more noisy test conditions have not been reported sofar.
The idea of detecting the response to a scan as opposed to the scan itselfis similar to the danger detection mechanisms which inspires the DCA. Asopposed to examining incoming data to see if you are the recipient of a scan
6

based attack, the outgoing data can be used to detect if your host is infectedand is now scanning the local sub-net. This approach is known as extrusiondetection and has proven effective in the prevention of spam across a mediumsize network [4]. It has been shown that a high proportion of attacks, especiallywithin a corporate setting, can originate from within the organisation itself asa result of misuse out of malice or ignorance. The detection of ‘insider-attacks’is a pertinent problem, to which extrusion detection may prove useful.
2.3 Port Scanning Summary
Port scanning is both a useful tool for network administration and maliciouslyfor use in the discovery of vulnerable hosts. Different types of scan are usedfor different purposes, with the most common type of scans based on the TCPprotocol across a range of IP addresses, namely horizontal scans. ICMP pingscans are also popular as they are a very fast way of gaining network topol-ogy information, which can be used in future attacks. Detection techniquesfor port scans frequently rely on the assumption of detecting a number ofevents occurring within a time window. This is not effective in detecting moresophisticated scans. Scanning worm detection involves a number of the sameprinciples. Alternative approaches include backward scan detection where theresponse of scanned hosts is used in place of detecting the port scan packets.‘Extrusion detection’, where outgoing packets are examined, is useful for thedetection of spam and could be used for the detection of insider attacks.
3 The Immune System: A DC’s Perspective
The human immune system is a complex and robust system, viewed as a home-ostatic protection agent[5]. It seeks out harmful pathogens, clearing them fromthe body and performing maintenance and repair. Classically the immune sys-tem is sub-divided into two distinct systems: the innate and adaptive immunesystem.
The innate immune system contains a variety of cells including macrophagesand DCs amongst others, [14]. The innate immune system is the first line ofdefence against attack from invading organisms. The cells of the innate sys-tem express proteins on their surface, called receptors, and have the ability todetect and dispose of pathogens via ingestion through phagocytosis. The selec-tivity of the receptors for pathogenic material evolved within the developmentof our species and is passed down through the generations[7].
The adaptive immune system consists of two classes of cell, T-cells and B-
7

cells. They differ from innate cells as their receptors are generated over thelifetime of the individual, not through the development of the species. Thefine tuning of these receptors, performed during childhood, plays a key rolein adaptation to previously un-encountered threats. For example, T-cells areselected in their early stage of development. Antigens, made of protein andderived from self cells, are presented to the naive T-cells. Those cells with ahigh affinity or can bind strongly to self antigen are deleted, leaving a set ofdetectors with receptors specifically designed to detect antigens which do notbelong to the host. This forms the core of the self-nonself theory proposed in1959 (described in [14]).
Since the 1970s immunology has developed in a number of significant ways.It was proposed that T-cell binding to pathogenic antigens is incapable ofinitiating immune activation without the presence of a second signal[14]. In-vestigation into vaccine development highlighted the need to add stimulatorymolecules derived from pathogens (adjuvants) to inoculations in order for theprocess to be effective. Antigens in the inoculation have different structuresthan antigens belonging to self, yet an adverse response is not observed.
In addition to adjuvants, the immune system does not react to ‘friendly’ bac-teria in the intestines, despite their prevalence. In the case of autoimmunediseases such as multiple sclerosis, the immune system reacts destructivelyagainst the body’s own cells. Why should a system which has been filteredagainst self reactivity, respond actively to ‘self’ without any obvious cause?Self-nonself could not account for these important effects, so researchers turnedtheir attentions to the cells of the innate immune system for answers.
In 1989, immunologist Charles Janeway and his colleagues proposed the in-fectious nonself model[15]. This is a two signal model that states that onlyantigens presented with co-stimulatory molecules (CSMs) can activate T-cells.T-cells do not reside in tissue, but are stored in lymph nodes, where they aregiven antigen by antigen presenting cells, which include DCs. Janeway showedthat when DCs are exposed to ‘signals’, forming a class of molecules known aspathogen associated molecular patterns (PAMPs), matching T-cells becameactivated[15].
PAMPs are exogenous signals which are molecules produced exclusively bypathogens. The receipt of PAMPs is thought to enhance the binding betweenT-cell and DC. Foreign antigens are not recognised unless they are accompa-nied by PAMP signals which confirm their status as nonself. This explainedwhy stimulatory adjuvants are necessary for immunisations to be successful.Unfortunately, the infectious nonself model can not explain the phenomena ofautoimmunity.
The Danger Theory was proposed by controversial immunologist Polly Matzinger
8

in 1994[18]. She stated that the immune system is controlled by the detection ofdamage to the body, not the detection of antigen structures or bacterial prod-ucts. Matzinger proposes that signals do not come from exogenous sources,but are endogenous and produced by the cells of the tissue themselves. Theseendogenous signals are termed danger signals. The danger theory also proposesthat the cells of the innate immune system can actively suppress an immuneresponse in the absence of danger in the tissue. This is mediated through therecognition of ‘tissue context’ derived based on the balance between two typesof cell death: necrosis and apoptosis[6].
Under healthy conditions, cells still die. Apoptosis or planned cell death reg-ulates growth and development. During apoptosis the cell’s internal contentsare gracefully degraded. Genetic material is cut into orderly fragments anddestructive enzymes known as lysosomes or ‘suicide-sacs’ digest the cell fromthe inside out. This prevents any loss of membrane integrity. Eventually theapoptosing cell shrinks and produces output signals e.g. tissue necrosis factoralpha.
DCs are sensitive to an increase in the signals of apoptosis and are attractedto the dying cell. Eventually the cell is found by a DC and ingested. Verylittle debris is left in the tissue and during this process. If the cell is ingestedby an DC, the proteins contained within the cell are presented to the immunesystem as antigen in a ‘safe’ context, as the cell died of a normal process. Theimmune system is then tolerised to antigens with the same structure. Thisdynamic process is known as the mechanism of peripheral tolerance[20].
Not all cells die in this clean and controlled manner, as in the case of cell deathas a result of injury. Cell stress can occur through irradiation, shock, hypoxiaor pathogenic infection, leading to the death of the cell via necrosis. Unlikeapoptosis the internal cell contents degrade chaotically and the cell membraneloses its integrity. Irregular fragments of DNA are produced and oxidised tobecome uric acid crystals, with heat shock proteins and other hydrophobiccompounds released from the cell. These molecules were previously separatedfrom the tissue fluid by the cell membrane and form the danger signals[20].Dendritic cells are sensitive to changes in concentration of the molecules re-leased as a result of necrosis. Upon the detection of danger, the DC migratesfrom the tissue and presents any collected debris as antigen to T-cells, causingactivation.
To summarise, danger theory states that the immune system is activated byDCs upon receipt of danger signals. DCs have the ability to combine signalsfrom apoptosis, necrosis and PAMPs, and to use this information to instructthe immune system to respond appropriately. Unlike the assertions of self-nonself, this model emphasises that signals from the environment dictate thebehaviour of the immune system, not the structure of antigens. Dendritic cells
9

are the natural data fusion agents which have the ability to combine bothendogenous and exogenous signals with antigen to detect invading pathogensand to maintain tolerance[22].
3.1 Introducing Dendritic Cells
To derive an algorithm based on the danger theory it is necessary to under-stand the mechanisms used by DCs to detect pathogens. DCs belong to afamily of cells known as macrophages, whose function is to clear the tissue ofdebris. Unlike other macrophages, DCs have a specialised role as professionalantigen presenting cells and control the activation state of T-cells in the lymphnodes. The term “dendritic cell” refers to the fact that they can have long fin-ger like projections which resemble dendrites. They are a class of cell, whichexist in three distinct states: immature (iDC), semi-mature(smDC) and ma-ture (mDC), shown in Figure 1. The state of differentiation is determined bythe relative signal concentration they receive while in the tissue.
Immature DC ‘Semi-mature’ DC Mature DC
Fig. 1. Immature , ‘Semi-mature’ and Mature Dendritic Cells ESMicrograph picture(see acknowledgements)
3.2 Immature DCs (iDC)
On arrival in the tissue, DCs are found in an immature state[17]. Here, iDCscollect debris, some of which is used as antigen. Antigens are complexed withan auxiliary molecule necessary for T-cell binding and are transported to thecell membrane for presentation. In addition to antigen processing, DCs cansense the various signals that may be present in the tissue through recep-tors expressed on the cell’s surface. These receptors are sensitive to PAMPs,danger signals and ‘safe signals’. The relative proportions and potency of thedifferent signals determines the iDC’s terminal state of differentiation. Re-ceipt of signals causes changes to the function, morphology and behaviour ofthe iDC. The result of exposure to signals causes the production of moleculescalled cytokines which can either activate or suppress the immune system. Itis important to note that iDCs cannot present antigen directly to or activateT-cells directly as they do not produce the necessary cytokines.
10

3.3 Mature DCs (mDC)
DCs which have the ability to both present antigen and activate T-cells aretermed mature DCs. For an iDC to become an mDC, the iDC must be ex-posed to a greater quantity of either PAMPs or danger signals than safe sig-nals. Exposure to signals takes place during the iDCs antigen collection stage.Sufficient exposure to PAMPs and danger signals causes the DC to ceaseantigen collection and migrate from the tissue to the lymph node. The highconcentration of T-cells in the lymph nodes increases the probability of a suc-cessful antigen match between DC and T-cell. During the migration, the iDCchanges morphologically to become a mDC by developing whispy finger-likeprojections which gives them an increased surface area. This further increasesthe probability of binding with a T-cell[22]. An increase in surface area makesthe mDC more suitable for antigen presentation rather than collection.
Most importantly, mDCs produce an inflammatory cytokine called Interleukin-12, which stimulates T-cell activation. Additionally the mDC produces cos-timulatory molecules (CSMs), which are known to facilitate the antigen pre-senting process [21]. PAMPs and danger signals detected in the tissue whilein the immature phase are thought to be responsible for the production ofInterleukin-12 and CSMs.
3.4 Semi-mature DCs (smDC)
Under apoptotic conditions, exposure to safe signals diverts the iDC to aterminal state known as ‘semi-mature’. They appear morphologically verysimilar to mDCs and can present antigen, yet they do not have the abilityto activate T-cells. Instead of secreting Interleukin-12, the smDC producesInterleukin-10.
Interleukin-10 suppresses T-cells which match the presented antigen. Anti-gens collected with safe signals are presented in a tolerogenic context andlead to unresponsiveness to those antigens. Evidence suggests that safe sig-nals have a greater influence on DCs than PAMPs and danger signals, andcan actively inhibit the production of Interleukin-12 while increasing produc-tion of Interleukin-10[32]. This is a natural mechanism designed to stop theimmune system over reacting to antigens. In essence, the immune system ex-pends considerable time and energy preventing reactions to harmless antigenor self antigen.
11

Semi-mature
Mature
Immature
-collect antigen-receive signals-in tissue
-present antigen-produce costimulation-provide tolerance cytokines-in lymph node
-present antigen-produce costimulation-provide reactive cytokines-in lymph node
Safe Signals
Danger SignalsPAMPS
Fig. 2. An abstract view of DC maturation and signals required for differentiation.CKs denote cytokines.
3.5 Summary
Dendritic cells are antigen presenting cells which have the power to control theadaptive immune response. DCs initial function is to collect debris from thetissue called antigen. Instructions to the adaptive immune system are derivedbased on the relative signal concentration found in the tissue where immatureDCs reside, represented in Figure 2. Three signal categories have been dis-covered. Pathogenically derived PAMPs and danger signals from dying cellscause the DC to mature and present antigen to the effector T-cells. Conversely,signals collected as a result of apoptotic death cause the DC to mature to adifferent ‘semi-mature’ state. The smDCs cannot activate T- cells, but causepresentation of antigens in a tolerogenic context, vital to the prevention ofautoimmunity. The mechanism by which DCs process signals is intricate, andthe three signal concentrations are fused within the cell to influence the result-ing output of CSMs, Interleukin-10 and Interleukin-12. This output informsthe immune system how to respond appropriately.
4 From in vivo to in silico
Through close collaboration with immunologists [32], we have abstracted whatwe believe to be the essential features of DC biology. DCs are examined froma cellular perspective, which includes the differentiation states, interactionwith signals and antigen. Representations of signals, antigen and the differentDC states form the core of this abstraction. The following properties of DC
12

function are used, and summarised in Figure 2:
• Signals and Antigen:(1) Exposure to signals initiates maturity of an iDC not the collection of
antigen.(2) The quantity of output signals produced is determined by processing input
signals from the environment, and can be viewed as an interpretation ofthe relative input signal strength.
(3) Input signals to a DC are either PAMPs derived from pathogenic signa-tures, danger signals from damaged tissue or safe signals from normal celldeath.
(4) Overall decision of tolerance or activation is dictated by the combinedbehaviour of a population of DCs.
• Immature DCs:(1) iDCs can differentiate to become either mDCs or smDCs.(2) The path of differentiation is dictated by the complement of signals to
which an iDC is exposed.(3) Each iDC can sample multiple antigens, which are internalised and re-
presented with cytokines reflecting the context.• Semi-Mature DCs:(1) Safe signals suppress the production of the mature output signal.(2) The smDCs produce a different output signal which confirms that the
presented antigen was collected in a normal environment.• Mature DCs:(1) Both mDCs and smDCs can present antigen by producing costimulatory
molecules.(2) The mDCs produce an output signal which confirms that the presented
antigen were collected in a context of danger and damage
5 The Dendritic Cell Algorithm
The DCA is an algorithm which uses a population of agent-like, software-basedartificial DCs which combine data from disparate sources. This description ofthe DCA is based on an implemented version of the algorithm made possiblethrough the use of the libtissue framework[30].
5.1 Libtissue
The Danger Project [1] has produced a variety of research outcomes alongsidethe DCA: the development of danger theory and DC based immunology[32]; aframework for developing immune inspired algorithms called libtissue[30];
13

an investigation into the interactions between the innate and adaptive immunesystem; artificial tissue [3] and the application of a naive version of the DCA forthe security of sensor networks. Libtissue is the API used within the DangerProject for the testing of ideas and algorithms, as shown in the works ofTwycross [31] and Greensmith et al [9].
Libtissue is a library implemented in C which assists the implementationand testing of immune inspired algorithms on real-world data. It is based onprinciples of innate immunology[29] [30], through the use of compartmental-isation, and uses techniques from modelling, simulation and artificial-life. Itallows researchers to implement algorithms as a collection of cells, antigen andsignals interacting within a specified compartment. The implementation hasa client/server architecture, with communication performed via sockets usingthe SCTP protocol. This architecture separates data collection using clients,from data processing on a server, as shown in Figure 3.
Fig. 3. Architecture used to support the DCA. Input data are processes via signaland antigen clients. The algorithm utilises this data and resides on a server.
Input data are processed using libtissue clients, which transform raw datainto antigen and signals. Algorithms can be implemented within the libtissueserver, as libtissue provides a convenient programming environment. Anti-gen and signal sources can be added to libtissue servers, facilitating thetesting of the same algorithm with a number of different data sources. Inputdata from the client passed to and represented in a compartment containedon a server known as a tissue compartment. This is a space in which cells,signals and antigen interact. Each tissue compartment has a fixed-size anti-gen store where antigen provided by libtissue clients is placed. The tissuecompartment also stores levels of signals, set either by the input clients orcells.
14

5.2 Abstract View of the DCA
The DCA is implemented as a libtissue tissue server. Input signals are com-bined with a second source of data, such as a data item ID, or program IDnumber. This is achieved through using a population of artificial DCs to per-form aggregate sampling and data processing. Using multiple DCs means thatmultiple data items in the form of antigen are sampled multiple times. If asingle DC presents incorrect information, it becomes inconsequential providedthat the majority of DCs derive the correct context. The sampling of datais combined with context information received during the antigen collectionprocess.
Different combinations of input signals result in two different antigen contexts.Semi-mature antigen context implies antigen data was collected under normalconditions, whereas a mature antigen context signifies a potentially anomalousdata item. The nature of the response is determined by measuring the numberof DCs that are fully mature, represented by a value, MCAV - the maturecontext antigen value. If the DCA functions as intended, the closer this value isto 1, the greater the probability that the antigen is anomalous. The MCAV isused to assess the degree of anomaly of a given antigen. By applying thresholdsat various levels, analysis can be performed to assess the anomaly detectioncapabilities of the algorithm.
The DCA has three stages: initialisation, update and aggregation. Initialisationinvolves setting various parameters and is followed by the update stage. Theupdate stage can be decomposed into tissue update and cell cycle. Both thetissue update and cell cycle form the libtissue tissue server. Signal dataare fed from the data-source to the tissue server through the tissue client. Agraphical representation of this process can be seen in Figure 4.
The tissue update is a continuous process, whereby the values of the tissuedata structures are refreshed. This occurs on an event-driven basis, with valuesfor signals and antigen updated each time new data appears in the system.Antigen data enters tissue update in the same, event driven manner. Theupdated signals provide the input signals for the population of DCs.
The cell cycle is a discrete process occurring at a user defined rate. In thispaper, one cell cycle is performed per second. Signal and antigen from thetissue data structures are accessed by the DCs during the cell cycle. Thisincludes an update of every DC in the system with new signal values andantigen. The cell cycle and update of tissue continues until a stopping criteriais reached, usually until all antigen are processed. Finally, the aggregationstage is initiated, where all collected antigen are subsequently analysed andthe MCAV per antigen derived.
15

‘Tissue’
S1
S2
S3
Sn
......
Ag1
Ag2
Ag3
Agn
- Storage area for data
Signal Matrix
‘Mature’‘Semi-Mature’
Antigen
Maturation
Phase
Analysis
Data Sampling
Phase
Input Data
Immature Dendritic Cell Population
collected data(process IDs)
more danger signals
more safe signals
behavioural signals(network !ow)
Fig. 4. Illustration of the DCA showing data input, continuous sampling, the mat-uration process and aggregate analysis.
5.3 Parameters and Structures
The algorithm is described using the following terms.
• Indices:i = 0, ..., I input signal index;j = 0, ..., J input signal category index;k = 0, ..., K tissue antigen index;l = 0, ..., L DC cycle index;m = 0, ...,M DC index;n = 0, ..., N DC antigen index;p = 0, ..., P DC output signal index.
• Parameters:I = number of input signals per category;J = number of categories of input signal;K = number of antigen in tissue antigen vector;L = number of DC cycles;
16

M = number of DCs in population;N = DC antigen vector size ;P = number of output signals per DC;Q = number of antigens actually sampled per DC for one cycle;R = maximum number of antigen collected per DC for one cycle (DC anti-gen receptors) ;Tmax = tissue antigen vector size.
• Data Structures:DCm={s(m), a(m), op(m), t(m)}- a DC within the population;T = {S, A} - the tissue;S = tissue signal matrix;sij = a signal type i, category j in the signal matrix S;A = tissue antigen vector;ak = antigen k in the tissue antigen vector;s(m) = signal matrix of DC(m);a(m) = antigen vector of of DC(m);op(m) = output signal p of o DC(m);op(m) = cumulative output signal p of DCm;t(m) = migration threshold of DCm;wijp = transforming weight from sij op.
S SSS
DC DCDC DC... ......
j=0 j=3j=2j=1 Tissueupdate
Cell cycle0 1 2 m
Signal matrix
Antigen vector
DC population
S SSS1
a 0 a 1 a 2 aN
432DC input signal matrix
DC antigen store
Output signals
Migration threshold valueM
DC
a 0 a 1 a 2 aK
m
o o o0 1 2
Fig. 5. Tissue and Cell Update components, where Si,j is reduced to Sj .
The data structures are represented graphically in Figure 5. Each DCm trans-forms each value of s(m) to op(m) using the following equation with suggestedvalues for weightings given in Table 1 and presented in Figure 6. Both theequation and weights are derived from observing experiments [32]performedon natural DCs for the purpose of their relative derivation. In the DCA eachcomponent of the antigen vector provides the capacity for storage of individ-ual antigen. Although each DC samples the same input antigen vector, eachDC samples a different component, potentially containing an antigen. Each
17

DC samples the same input signal matrix and each ‘component of the signalmatrix.
op(m) =
∑
i
∑
j 6=3
Wijpsij(m)
∑
i
∑
j 6=3
|Wijp|∀p
Table 1Weights used for signal processing
wijp j = 0 j = 1 j = 2
p = 1 2 1 2
p = 2 0 0 3
p = 3 2 1 -3
The tissue has containers for signal and antigen values, namely S and A. Inthe current implementation of the DCA, there are three categories of signal(j = 2) and 1 signal per category (i = 0). The categories are derived fromthe three signal model of DC behaviour described in Section 2 where: s0,0 =PAMP signals, s0,1 = danger signals, and s0,2 = safe signals. An antigen storeis constructed for use within the tissue cycle where all DCs in the popula-tion collect antigen, which is also introduced to the tissue in an event drivenmanner.
Fig. 6. A representation of the three calculations performed by each DC per updatecycle, to derive the cells outputs through fusing together the signal inputs.
The cell cycle maintains all DC data structures. This includes the maintenanceof a population of DCs, which form a sampling set of size M . Each DC has aninput signal matrix, antigen vector, output signals, and migration threshold.The internal values of DCm are updated, based on current data in the tissuesignal matrix and antigen vector. The DC input signals, s(m) use the identicalmapping for signal categories as tissue s and are updated every cell cycleiteration. Each s(m) for DCm is updated via an overwrite every cell cycle.
18

These values are used to calculate output signal values, op(m), for DCm, whichare added cumulatively over a number of cell cycles to form op(m), wherep = 0 is costimulatory value, p = 1 is the mature DC output signal, and p = 2is the semi-mature DC output signal. With each cell update, DCs sample Rantigens from the tissue antigen vector A.
5.4 The DCA
The following pseudocode shows the initialisation stage, cycle stage, tissueupdate and cell cycle.
initialise parameters {I, J, K, L, M, N, O, P, Q}while (l < L)
update A and Sfor m = 0 to M
for 0 to QDCm samples Q antigen from Afor all i = 0 to I and all j = 0 to JsDC
ij = sij
for n = 0 to NDCm processes aDC
nm
for p to Pcompute op
op(m) = op(m) + op
if o0(m) > tmDCm removed from population
DCm migrate, print antigen and context
DCm reset antigen vector and all signals
l++
analyse antigen and calculate MCAV
5.5 Antigen Aggregation
Once DCm has been removed from the population, the contents of a(m) andvalues op(m) are logged to a file for the aggregation stage. Once completed,s(m), a(m) and op(m) are all reset, and DCm is returned to the samplingpopulation. The re-cycling of DCs continues until the stopping condition ismet (l = L). Once all data has been processed by the DCs, the output log ofantigen-plus-context is analysed. The same antigen is presented multiple timewith different context values. This information is recorded in a log file. The
19

total fraction of mature DCs presenting said antigen (where o1 > o2) is dividedby the total amount of times the antigen was presented namely o1/(o1 + o2) .This is used to calculate the mean mature context antigen value or MCAV.
5.6 Signals and Antigen
An integral part of DC function is the ability to combine multiple signals toinfluence the behaviour of the cells. The different input signals have differ-ent effects on cell behaviour as described in Section 3. The semantics of thedifferent category of signal are derived from the study of the influence of thedifferent signals on DCs in vitro. Definitions of the characteristics of each sig-nal category are given below, with an example of an actual signal per category.This categorisation forms the signal selection schema.
• PAMP - si0 e.g. the number of error messages generated per second by afailed network connection
(1) a signature of abnormal behaviour e.g. an error message(2) a high degree of confidence of abnormality associated with an increase in
this signal strength• Danger signal - si1 e.g. the number of transmitted network packets per second(1) measure of an attribute which significantly increases in response to ab-
normal behaviour(2) a moderate degree of confidence of abnormality with increased level of this
signal, though at a low signal strength can represent normal behaviour.• Safe signal - si2 E.g. the inverse rate of change of number of network packets
per second. A high rate of change equals a low safe signal level and viceversa.
(1) a confident indicator of normal behaviour in a predictable manner or ameasure of steady- behaviour
(2) measure of an attribute which increases signal concentration due to thelack of change in strength
Signals, though interesting, are inconsequential without antigen. To a DC,antigen is an element which is carried and presented to a T-cell, without regardfor the structure of the antigen. Antigen is the data to be classified, and workswell in the form of an identifier, be it an anomalous process ID[9] or the IDof a data item [8]. At this stage, minimal antigen processing is performed andthe antigen presented is an identical copy of the antigen collected. Detection isperformed through the correlation of antigen with fused signals. By processingof antigen, this refers to the process by which antigen is collected and presentedfor analysis by the DCs - it is noteworthy that no changes are made to theactual value of the antigen, it is sampled whole.
20

The DCA could be interpreted as a neural network if its goal was to purelyclassify based on weighed sums alone. However the algorithm is not designedfor the purpose of classification, but sorts input data, in the form of antigen,through the use of data-fused signals. The signals are aggregated through timeand across a population of cells, which is different to the processing performedby a series of neural networks.
6 PSI: Ping Scan Investigation
The purpose of this investigation is as follows:
(1) To apply the DCA to anomaly detection through bio-inspired data fusion.(2) To show how the system responds to the modification of signal mappings.(3) To understand the sensitivity of the system parameters and the sensitivity
of the weights of the signal processing function.
In this paper, port scanning is used as a model intrusion, and is described inSection 2. The DCA is applied to the detection of an outgoing port scan acrossa range of IP addresses, based on the ICMP ‘ping’ protocol. It is assumed thatit is possible for the attacker to gain access to the machine using a passwordcracking utility.
The type of scan used in this investigation is an nmap ICMP ‘ping’ scan. Thistype of scan is particularly suitable for the purpose of these experiments as itis suitable for use on a network as it uses minimal network resources and is ashort duration scan (10-30 seconds in duration). Ping scans involve a victimmachine, connected to a medium sized subnet of 100-200 machines, which hasbeen subverted by our hypothetical intruder. The premise is that the intruderhas logged into the victim machine remotely via ssh and aims to retrieve alist of hosts running within a similar IP address range. During the scan, thevictim machine sends ICMP probes to other hosts, specified at run time. Thenmap scan program reports back on the status of the scanned addresses aseither appearing to be down or up. This allows an attacker to generate a listof hosts currently running within a range of IP addresses. This scan does notrequire root privileges and is one of the fastest scans available. Ping scans alsoretrieve DNS information, resolving the IP address of available hosts.
6.1 Data Sessions
Two types of data session are used in this investigation. An attack sessionconsists of a ping scan embedded within a 70 second ssh session. Four processes
21

(running programs) of interest are identified in these sessions for the purposeof analysis including: ssh demon; bash shell; nmap scan program; and the ptssshd process which is the parent of the nmap scan. The ssh demon and thebash shell are normal process which occur in the attack session. The scan usesa range of 1020 IP addresses across a class C network. The normal session alsoinvolves a remote log in via ssh, and also contains the transfer of a file from thevictim machine to a remote server, via scp. Again, four processes of interestare identified: bash shell; sshd; x-forwarding agent; secure copy of a 2.5MBfile. Ten data-sets are generated for both the attack and normal protocols.
6.2 Signals
Three signal categories are used, with one signal per category throughout thisinvestigation. The signals used are defined in Section 3, where they are placedin context with their biological inspiration. Signals are collected from kernelstatistics using bash scripting, and are processed, normalised and combinedwith antigen to form a log file. All signals are normalised real-values within arange of 0-100 for the PAMP and danger signal and 0-10 for the safe signal.It is important to note that preliminary examinations of the input signaldata indicate that analysis of the signals individually is insufficient to indicateanomalies [10], which is further highlighted in the DCLite experiment.
The PAMP signal is generated from the rate of ICMP destination unreachableerrors received per second. When a ping scan is used, ICMP packets are sentto the machines specified. Frequently the range of machines is specified asa block, for example XX.XX.20.1-254 would scan all addresses on the ‘.20’subnet 1 . It is likely that numerous machines within that range will not acceptping probes and hence a DU error is sent back to the scanning machine, as asignature of suspicious activity.
The danger signal is derived from the number of sent network packets persecond. An increase in network traffic sent from the machine can be an indi-cator of anomalous behaviour. However, under certain circumstances, such asuploading files via a torrent client or over peer-to-peer networks, this is notas useful.
To complement this signal, the safe signal is derived using the first orderderivative of packets/s, namely the rate of change of packets/s. This is basedon the assumption that anomalous traffic produces ‘bursty’ rates of sending,whereas uploading large files will not have such a variable rate of change. Toderive the safe signal, a maximum value for rate of change is defined. Themore variable the rate of change, the greater the decrement of the maximum
1 Full IP addresses not given, adhering with our organisation’s security policy
22
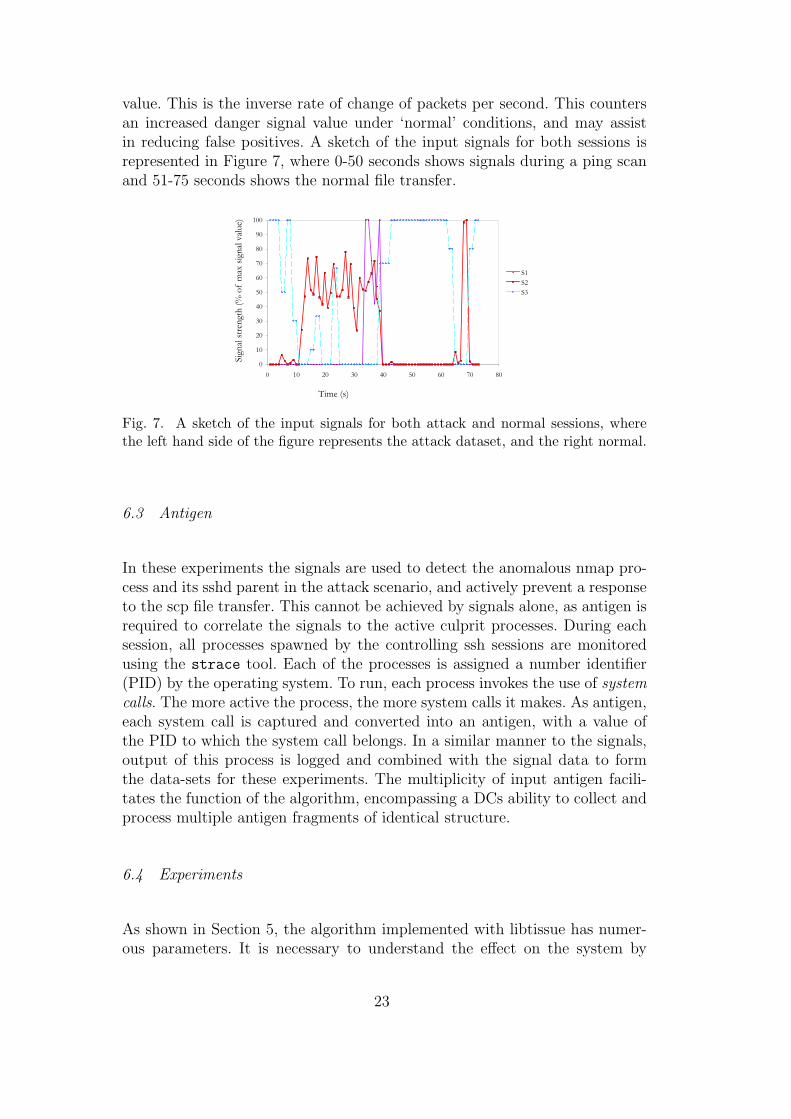
value. This is the inverse rate of change of packets per second. This countersan increased danger signal value under ‘normal’ conditions, and may assistin reducing false positives. A sketch of the input signals for both sessions isrepresented in Figure 7, where 0-50 seconds shows signals during a ping scanand 51-75 seconds shows the normal file transfer.
Sig
nal
str
engt
h (
% o
f m
ax s
ign
al v
alue)
Time (s)
0
10
20
30
40
50
60
70
80
90
100
0 10 20 30 40 50 60 70 80
S1
S2
S3
Fig. 7. A sketch of the input signals for both attack and normal sessions, wherethe left hand side of the figure represents the attack dataset, and the right normal.
6.3 Antigen
In these experiments the signals are used to detect the anomalous nmap pro-cess and its sshd parent in the attack scenario, and actively prevent a responseto the scp file transfer. This cannot be achieved by signals alone, as antigen isrequired to correlate the signals to the active culprit processes. During eachsession, all processes spawned by the controlling ssh sessions are monitoredusing the strace tool. Each of the processes is assigned a number identifier(PID) by the operating system. To run, each process invokes the use of systemcalls. The more active the process, the more system calls it makes. As antigen,each system call is captured and converted into an antigen, with a value ofthe PID to which the system call belongs. In a similar manner to the signals,output of this process is logged and combined with the signal data to formthe data-sets for these experiments. The multiplicity of input antigen facili-tates the function of the algorithm, encompassing a DCs ability to collect andprocess multiple antigen fragments of identical structure.
6.4 Experiments
As shown in Section 5, the algorithm implemented with libtissue has numer-ous parameters. It is necessary to understand the effect on the system by
23

changing these parameters in order to understand the behaviour of the DCA.The experiments performed assist in clarifying these effect, and fall into threeconvenient categories:
Series-1: Investigate signal mappings: does incorrect data mapping influencethe detection rates?
Series-2: Sensitivity of libtissue related parameters: which parameters caninfluence the system and at what value?
Series-3: Sensitivity of the weights of the signal processing equation: how tothese weights relate to each other and what effect on detection arises fromvariation in the values?
6.5 Series-1
The aim of this series is to change the input signal mappings to assess thevalidity of this implementation. The mapping of the input signal category tothe raw data attributes is controlled primarily by the weights of the signalprocessing equation. By performing experiments such as switching the PAMPand safe signal we predict that the system would respond with a very high rateof false positives. This information is used to validate the use of this algorithmon this particular problem. Three input signals are used in series-1 inclusiveof one PAMP signal (s0,0), one danger signal (s0,1,) and one safe signal (s0,2).In order to understand the principles of mapping signals to categories eachchosen input for the signals is used per category.
The permutations of this experiment are shown in Table 2. We hypothesisethat the DCA will not lose detection accuracy when the incorrect mappinginvolves the PAMP and danger signal, as these signals affect the DCs in asimilar manner. Conversely a mapping reversal between the danger and safesignal may result in a poor performance as they are treated differently in thesignal processing function. An assumption is made for the purpose of analysisthat the misclassification costs of false positives and false negatives are equallyweighted. This may not be realistic, though addressing the respective cost ofeach type of misclassification is outside the scope of this paper. All experimentsin this series are tested using all 20 attack and normal data-sets, with threerepeats of each run per dataset. Similar experiments involving combinationsof 2, 3 and 4 input signals are presented in [10], to which the interested readershould refer.
24
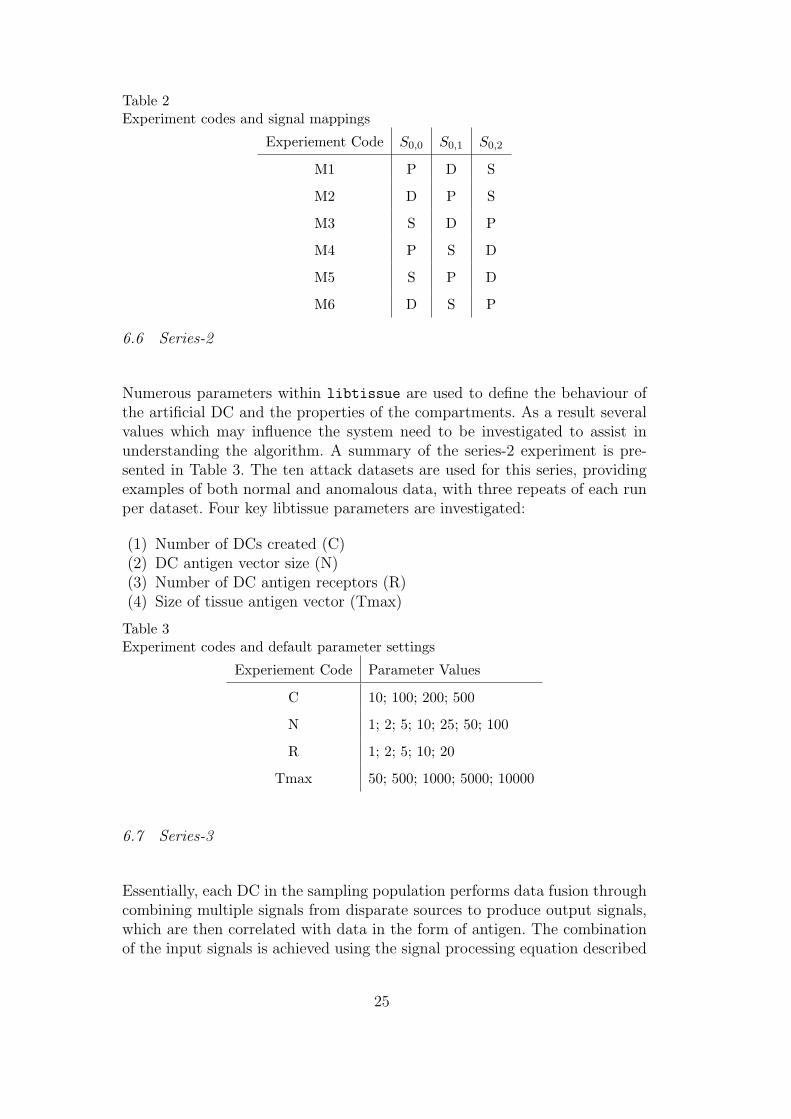
Table 2Experiment codes and signal mappings
Experiement Code S0,0 S0,1 S0,2
M1 P D S
M2 D P S
M3 S D P
M4 P S D
M5 S P D
M6 D S P
6.6 Series-2
Numerous parameters within libtissue are used to define the behaviour ofthe artificial DC and the properties of the compartments. As a result severalvalues which may influence the system need to be investigated to assist inunderstanding the algorithm. A summary of the series-2 experiment is pre-sented in Table 3. The ten attack datasets are used for this series, providingexamples of both normal and anomalous data, with three repeats of each runper dataset. Four key libtissue parameters are investigated:
(1) Number of DCs created (C)(2) DC antigen vector size (N)(3) Number of DC antigen receptors (R)(4) Size of tissue antigen vector (Tmax)
Table 3Experiment codes and default parameter settings
Experiement Code Parameter Values
C 10; 100; 200; 500
N 1; 2; 5; 10; 25; 50; 100
R 1; 2; 5; 10; 20
Tmax 50; 500; 1000; 5000; 10000
6.7 Series-3
Essentially, each DC in the sampling population performs data fusion throughcombining multiple signals from disparate sources to produce output signals,which are then correlated with data in the form of antigen. The combinationof the input signals is achieved using the signal processing equation described
25

in Section 5, where processing is performed three times on the the input sig-nals to produce three different output signals. Initially the weights chosen forthis purpose were derived from empirical biological data. Indeed, the inter-relationship between the weights (as shown in Table 4) remains inspired bythese data, with all weights deriving from the weight of the PAMP signals.Two weights are investigated, W1 and W2.
Table 4Derivation and interrelationship between weights in the signal processing equation
Output Signal Input Signal Weight
o0 s0,0 W1
s0,1 W1/2
s0,2 W1 * 1.5
o1 s0,0 0
s0,1 0
s0,2 1
o2 s0,0 W2
s0,1 W2/2
s0,2 W2 * -1.5
Preliminary tests and prior experience with the DCA indicate values for W1and W2 should lie within a range of 0 and 20 if the maturation thresholdis 60 (+/- 50%). An exhaustive search of the following values is performed:0.5; 1; 2; 4; 8; and 16. This results in a total of 36 experiments. One attackdataset is selected at random for use with three runs performed per parametercombination.
6.8 Parameters and Settings
All experiments are performed on an AMD Athlon 1GHz Debian linux ma-chine (kernel 2.4.10). The algorithm is implemented within the libtissue
framework, implemented in C (gcc 4.0.2) with interprocess communication fa-cilitated by the SCTP protocol. All signals are derived using signal collectionscripts, with values taken from the ‘proc’ filesystem. Unless stated otherwise,default parameters for all experiments are presented in Table 5.
26

Table 5Default parameter settings
Name Symbol Value
Number of signals per category I 1
Number of signals categories J 3
Max number of tissue antigen K 500
Number of cells M 100
Max number of antigen per DC N 50
Number of output signals per DC P 3
Number of DC antigen receptors Q 1
6.9 Results
In this section results for all experimental series are presented, showing thatthe DCA can be used as a ping based port scan detection system. In allexperiments the MCAV coefficient is employed to assess the behaviour andfunction of the DCA. The MCAV is the mature context antigen value and isa number between zero and one. The closer this value is to one, the higherthe probability that the monitored process is anomalous as more antigen arepresented in by the algorithm in the mature context i.e. the anomalous context.Each type of antigen is given a MCAV coefficient value which can be comparedagainst a threshold. Once a threshold is applied, it is then possible to classifyantigen as either ‘normal’ or ‘anomalous’ and therefore the relevant rates oftrue and false positives can be shown. This calculation is used throughoutthis section. The results of each series of experiments are presented with therelevant statistics shown.
6.9.1 Series-1
The graph presented in Figure 8 represents a summary of results for the attackdatasets used with the original and correct mapping (M1). MCAVs generatedby the two anomalous processes are 0.82 (with a standard deviation, stdev,of 0.11) for the nmap process and 0.67 (stdev.= 0.22) for the parent pts pro-cess. All statistical tests are performed using a paired t-test, where p = 0.05,used whenever ‘statistical significance’ is stated. These values are statisticallysignificantly higher than the MCAVs produced for the normal processes. Thebash MCAV is 0.02 (stdev=0.04) and the sshd MCAV is 0.18 (stdev=0.24).The variance (stdev divided by MCAV) values are also larger for the twonormal processes in contrast the the anomalous items.
Figure 8 shows the MCAVs generated per process for each mapping, across the
27

0
0.1
0.2
0.3
0.4
0.5
0.6
0.7
0.8
0.9
1
M1 M2 M3 M4 M5 M6
Mapping Number
Nmap
Pts
Sshd
Bash
Fig. 8. MCAV values for all processes and all mappings for the attack datasets. Tenattack datasets are used, each point representing a mean of 30 values, as number ofruns per dataset =3.
10 attack datasets. The intended mapping (M1) is used as a baseline to whichall other mappings are compared. The results for M1 and M2 are similar, withhigh MCAVs for the anomalous processes and low values for the normal items.Statistically, significant differences are shown between the MCAVs the bashprocess, as the bash MCAV in M1 is 0.02 as opposed to 0.27 for M2. Thisimplies that incorrect mapping between PAMP and danger signals would notimpair detection, save for a slight increase in the rate of false positives. M3produced significantly higher MCAV for the two normal processes than M1, yetonly minor differences in the detection of the anomalous processes. Incorrectmapping of safe signals as PAMPs leads to an increased rate of false positives.
In M4 the MCAVs for the anomalous processes are significantly smaller (p >0.05) and significantly larger for the normal processes when compared to theresults of M1. For example, the MCAV for nmap in M4 is 0.64, which issignificantly lower than the 0.82 reached using M1. This trend is also shown inM6, with a nmap MCAV of 0.61 (stdev=0.37). M5 exhibited a similar increasein the MCAV of the normal processes, yet interestingly produced the highestMCAV for the anomalous processes, with the lowest standard deviation for thedetection of the nmap process. However, normal MCAV values are significantlyhigher than observed in M1. All MCAVs for this experiment are shown withtheir standard deviations in Table 6.
For the normal datasets, similar trends are evident, as shown in Figure 9. M1shows very low MCAVs for all processes, indicating a low rate of false positives.M2 is similar, also producing low values for all processes of interest. The scpprocess produced a higher MCAV of 0.22 in M2, though this is not statisticallysignificant. M3 produced the maximum MCAV of 1 for all processes, whileM4 produced values over 0.5. Experiment M5 produced interesting results.Despite poor performance for the attack dataset, high values of MCAV arenot present in the normal dataset. The MCAV for the M5 scp is 0.13, which
28
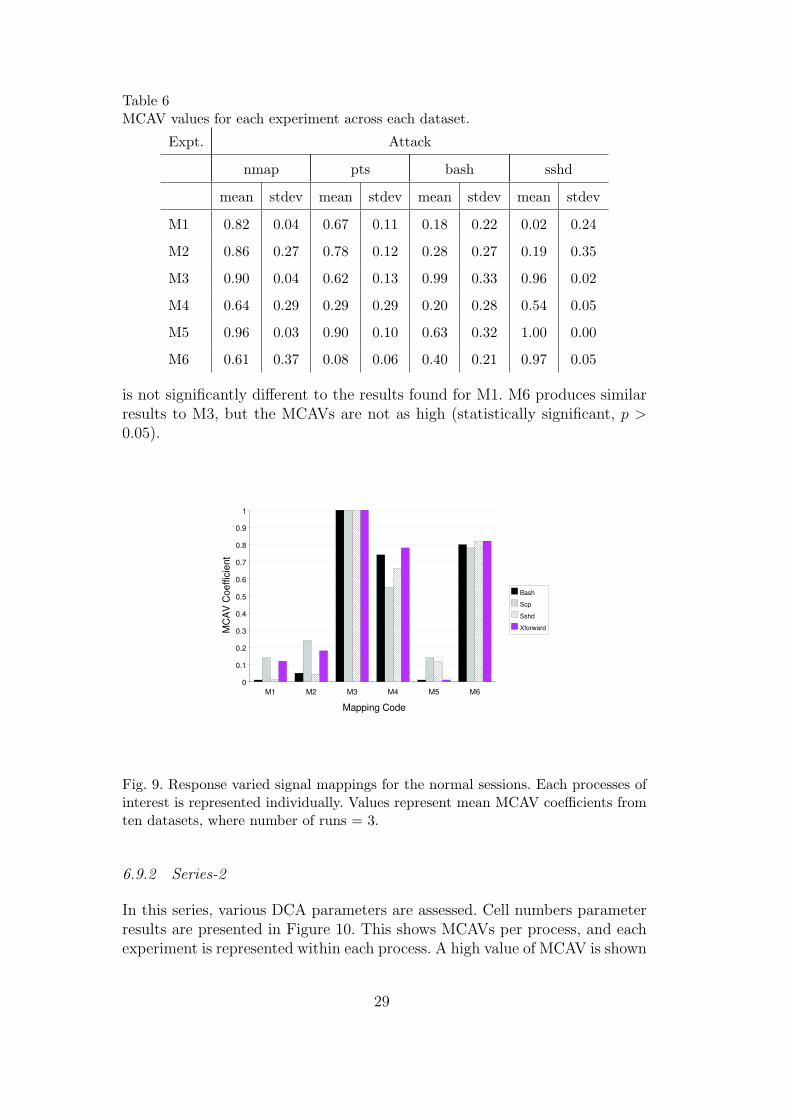
Table 6MCAV values for each experiment across each dataset.
Expt. Attack
nmap pts bash sshd
mean stdev mean stdev mean stdev mean stdev
M1 0.82 0.04 0.67 0.11 0.18 0.22 0.02 0.24
M2 0.86 0.27 0.78 0.12 0.28 0.27 0.19 0.35
M3 0.90 0.04 0.62 0.13 0.99 0.33 0.96 0.02
M4 0.64 0.29 0.29 0.29 0.20 0.28 0.54 0.05
M5 0.96 0.03 0.90 0.10 0.63 0.32 1.00 0.00
M6 0.61 0.37 0.08 0.06 0.40 0.21 0.97 0.05
is not significantly different to the results found for M1. M6 produces similarresults to M3, but the MCAVs are not as high (statistically significant, p >0.05).
M1 M2 M3 M4 M5 M6
0
0.1
0.2
0.3
0.4
0.5
0.6
0.7
0.8
0.9
1
Bash
Scp
Sshd
Xforward
Mapping Code
MC
AV
Coeffic
ient
Fig. 9. Response varied signal mappings for the normal sessions. Each processes ofinterest is represented individually. Values represent mean MCAV coefficients fromten datasets, where number of runs = 3.
6.9.2 Series-2
In this series, various DCA parameters are assessed. Cell numbers parameterresults are presented in Figure 10. This shows MCAVs per process, and eachexperiment is represented within each process. A high value of MCAV is shown
29

for the nmap process for all values of cell number above 100. Where the numberof cells is equal to 10, the MCAV is greatly reduced, from 0.9 to 0.1. Thestandard deviations of these values increases from 0.3 in C10, to 0.1 for allother cell numbers. Similarly no significant difference was found between C100,C200 and C500 for any of the processes. C10 also produced higher MCAVsfor the normal processes than for any other cell number.
0
0.1
0.2
0.3
0.4
0.5
0.6
0.7
0.8
0.9
1
Nmap Pts Bash Sshd
Process of Interest
C10
C100
C200
C500
Fig. 10. Cell number MCAV per process for the attack datasets
The DC antigen vector size parameter results are summarised in Figure 11. Nosignificant differences are found when this parameter is varied, for any of theprocesses of interest. Marginally impaired performance is shown when this sizeis set to 100, but this was shown to not be significant. One explanation for thisparameter’s insensitivity is that the number of antigen is less influential thanthe signals they are collected. Further analysis is performed using the numberof antigens processed to understand exactly the reasons for this effect.
0
0.1
0.2
0.3
0.4
0.5
0.6
0.7
0.8
0.9
1
Nmap Pts Bash Sshd
Process of Interest
N1
N2
N5
N10
N25
N50
N100
Fig. 11. DC antigen vector size MCAV per process for the attack datasets
Hence, investigations in to the number of antigen sampled by one DC per iter-ation (number of antigen receptors) is performed, and the results are presented
30

in Figure 12. This shows no significant difference in the MCAV values for thedetection of the two anomalous processes. Data regarding the MCAVs of thenormal processes suggests that an increased number of antigen receptors canlead to higher than desired MCAVs. This is supported by the actual values,where MCAV for the bash process is 0.38 in R20 as opposed to 0.22 in R2.This difference is statistically significant, demonstrated through the use of apaired t-test (p >0.05).
0
0.1
0.2
0.3
0.4
0.5
0.6
0.7
0.8
0.9
1
Nmap Pts Bash Sshd
Processes of Interest
R2
R5
R10
R20
Fig. 12. Number of antigen receptors MCAV per process for the attack datasets
The results for the tissue vector size, shown in Figure 13, are similar to thereceptor results, in that no significant differences were shown for the nmap,pts and sshd processes. Again, differences were most pronounced for the bashprocess with a MCAV of 0.28 for T50 and 0.08 for T500. The results showthat the DCA is robust to changes in controlling parameters, provided thattheir values lie within a sensible range.
0
0.1
0.2
0.3
0.4
0.5
0.6
0.7
0.8
0.9
1
Nmap Pts Bash Sshd
Process of Interest
T50
T500
T1000
T5000
Fig. 13. MCAV per process
31

6.9.3 Series-3
Figures 14 to 17 show the MCAVs generated by the weights sensitivity anal-ysis. The resultant surface maps are produced by plotting the two controllingweights, W1 and W2 on the x- and y-axes respectively, and the MCAV perprocess present on the z-axis. The two anomalous processes are shown in Fig-ure 14 and 15. The surfaces created in these figures show that MCAV valuesfor these processes lie consistently above 0.8. This indicates that the detectionof anomalous processes is insensitive to the values of the weights.
0.51
24
816
0.5
1
2
4
8
16
0.5
0.6
0.7
0.8
0.9
1
W1
W2
0.9-1
0.8-0.9
0.7-0.8
0.6-0.7
0.5-0.6
Fig. 14. 3D surface plot of varying weights W1 and W2. Nmap process represented.
0.5
1
2
4
8
16
0.5
1
2
4
8
16
0.5
0.6
0.7
0.8
0.9
1
W1
W2
0.9-1
0.8-0.9
0.7-0.8
0.6-0.7
0.5-0.6
Fig. 15. 3D surface plot of varying weights W1 and W2. Pts process represented.
Figures 16 and 17 show the results for the sshd and bash processes. Figure16 exhibits most variation within these four graphs. Peaks of high MCAV inexcess of 0.8 are shown when W1 = 1 and W2 < 8. A similar peak is evidentin Figure 17. This graph also shows that once both parameters are above 4,the MCAV for the normal processes is small. This implies an effect on thesystem, which further investigation will clarify.
32

0.5
1
2
4
8
16
0.5
1
2
4
8
160
0.1
0.2
0.3
0.4
0.5
0.6
0.7
0.8
0.9
1
W1 W2
0.9-1
0.8-0.9
0.7-0.8
0.6-0.7
0.5-0.6
0.4-0.5
0.3-0.4
0.2-0.3
0.1-0.2
0-0.1
Fig. 16. 3D surface plot of varying weights W1 and W2. Bash process represented.
0.51
24
816
0.5
1
2
4
8
16
0
0.02
0.04
0.06
0.08
0.1
0.12
0.14
W1
W2
0.12-0.14
0.1-0.12
0.08-0.1
0.06-0.08
0.04-0.06
0.02-0.04
0-0.02
Fig. 17. 3D surface plot of varying weights W1 and W2. Sshd process represented.
7 Analysis
In experiment M1 distinct differences are shown in the behaviour of the algo-rithm for the detection of normal and anomalous processes. The MCAV forthe anomalous processes is significantly larger than the MCAV of the normal.This is encouraging as it shows that the DCA can differentiate between twodifferent types of process based on environmentally derived signals. In exper-iment M2 the PAMP and danger signals were switched. In comparison withthe results presented for experiment M1, the MCAV for the anomalous processis not significantly different (paired t-test p < 0.01). However, in experimentM2, the standard deviations of the mean MCAVs are generally larger and
33
is especially notable for the nmap process. Potentially, the two signals couldbe switched (through accidental means or incorrect signal selection) withoutaltering the performance of the algorithm significantly.
Experiment M3 involved reversing the mapping of safe and PAMP signals. Thesafe signal is generated continuously when the system is inactive and whenmapped as a PAMP constantly generated full maturation in the artificial DCs,shown by the high MCAV value for all processes indiscriminately. Interestingly,in M3 the MCAV value for the anomalous processes in the attack datasets islower than the normal process’ value. For the normal dataset, all processesare classified as anomalous, all resulting in a MCAV of 1. Similar impededperformance is shown for M6, caused by the incorrect mapping of a PAMP asa safe signal. The input PAMP signal is strong, yet does not occur throughout.Therefore, not enough suppression is present when the PAMP is mapped.
M5 also produced interesting results - while it did not have such a markedeffect on the anomalous processes, it produced high MCAVs for normal itemsin the attack dataset, but not in the normal dataset. Under ‘normal’ scenariosthis mapping functions as the danger signals are counter-balanced by the safesignals, resulting in low MCAVs. As the PAMP signal is infrequent, insufficientsignal to cause full maturation is present.
The intended signal mapping produced good results, showing that the DCAis capable of performing information fusion and anomaly detection. Changingthe mapping of signal meaning with data source has shown that the correctmapping is ideal. However, if the PAMP signal is mapped as a danger signal,performance is not sacrificed. Alternatively, PAMPs mapped as safe signalsproduced the worst results, indicating that care must be taken when selectinga mechanism of suppression. These data also suggest that suppression is a keypart of the system, which supports parts of Matzinger’s danger theory[19] inreference to peripheral tolerance. The parameters investigated in series-2 havelittle influence on the output of the system. For example, varying the DC anti-gen vector size does not produce any results which are significantly differentin this respect. Similar trends are shown for the number of receptors and thenumber of cells. Exceptions to this include very low values of cells, storage andreceptors. The values originally used as default parameters have in many casesproduced the most consistent results. This is highlighted in the cell numbersexperiments, DC antigen vector size and number of receptors. This is no coin-cidence as these values, initially derived from biological information[32], andare designed to work together. This may account for some of the robustnessseen with these parameters.
Series-3 has provided valuable insight into the behaviour of the DCA. Theresults in Figures 14 and 15 show that the DCA is insensitive to changesin weights within the signal processing equation, as little variation is shown
34

across the spectrum of values. Significant variation is evident in Figures 16and 17 suggesting that incorrect weight values may lead to increased valuesof MCAV for normal processes. The relationship between the two values sug-gests that higher values for the weight produce lower MCAVs. One reason forthis may be linked to the number of update cycles a cell performs. W1 is thecontrolling weight for output signal o0, which is matched against the DCs mi-gration thresholds. The sooner this threshold is exceeded, the shorter the timea cell spends sampling signals. For this particular dataset, using a thresholdof 60 (+/- 50%), a W1 value of over 4 and W2 value of above 8 yields the bestresult in both cases. This implies that a tighter temporal coupling betweensignals and antigen produces lower MCAVs for normal processes. To confirmthis, a similar analysis will be performed using longer scans in future work.
8 Conclusions and Future Work
In this paper the DCA is described in detail and interesting facets of thealgorithm are presented. The DCA combines inspiration from the immunesystem with principles of information fusion to produce an effective anomalydetection technique. The importance of careful signal selection has been high-lighted through signal mapping experiment. The DCA is somewhat robust tomisrepresentation of the activating danger and PAMP signals, but care mustbe taken to select a suitable safe signal as an indicator of normality. Incorrectmapping of safe signals can result in impeded performance as shown with ourresults.
The algorithm has various parameters, and it is shown that the DCA is in-sensitive to changes in these parameters. Provided that the values are withina sensible range, the algorithm performs well on the task of detecting a pingbased port scan. Sensitivity analysis is also performed. The detection of theanomalous processes is robust to changes in the signal processing weights,though large variations are shown in the incorrect detection of normal pro-cesses. For the ping scan investigation, larger weights are preferable. Thisimplies that better performance is given if the time spent sampling signals bythe DC is shorter.
The DCA is a new development in artificial immune systems, and as yet hasnot been extensively tested. Its unique methods of combining multiple signalsand correlating the combined values with a separate antigen data-stream workwell for the purpose of port scan detection. However, this makes the systemdifficult to compare, as other techniques cannot use data of this type, such asstandard machine learning techniques or signature based IDS. Plus, individualsignals alone are insufficient to produce classification[9].
35

The general applicability of the algorithm to a variety of problems is unex-plored. This could be initially characterised through the DCA’s application toa range of port scans, and then by its applications to other time-dependentdatasets. This has thus far included applications within sensor networks, asshown by Kim et al [16]. They used the suggested signal mapping schema asshown in section 5.6.
Future work with the algorithm includes its application to SYN scan detection,where we hope it will produce competitive solutions with other port scandetectors. Such experiment will require the use of multiple signals per category,with a view to a full implementation as a host based port scan detector. Theintroduction of adaptive signals or variable weights may be necessary oncemultiple signals per category are used. Although the relative weighs used inthe signal processing equation are part of the abstract model, some adaptivemechanism for controlling the values of these weights may be beneficial tothe sensitivity of the system. The algorithm may also be applied to otherdetection or data correlation problems such as the analysis of radio signaldata from space, sensor networks, internet worm detection and other securityand defence applications.
9 Acknowledgements
This project is supported by the EPSRC, grant number GR/S47809/01. DCphotographs provided by Dr Julie McLeod and colleagues at UWE, UK.Graphic design by Mark Hammonds.
References
[1] U Aickelin, P Bentley, S Cayzer, J Kim, and J McLeod. Danger theory: Thelink between ais and ids. In Proc. of the Second International Conference onArtificial Immune Systems (ICARIS-03), pages 147–155, 2003.
[2] G. Bakos and V.H. Berk. Early detection of internet worm activity bymetering icmp destination unreachable messages. In Proc. of SPIE: Sensors,and Command, Control, Communications, and Intelligence (C3I) Technologiesfor Homeland Defense and Law Enforcement, volume 4708, pages 33–42, aug2002.
[3] P. Bentley, J. Greensmith, and S. Ujjin. Two ways to grow tissue for artificialimmune systems. In Proc. of the Fourth International Conference on ArtificialImmune Systems (ICARIS-05), LNCS 3627, pages 139–152, 2005.
36

[4] R. Clayton. Stopping spam by extrusion detection. In Proceedings of the FirstConference on Email and Anti Spam., 2004.
[5] I.R. Cohen. Tending Adam’s Garden : Evolving the Cognitive Immune Self.Academic Press, 2004.
[6] A.L. Edinger and C.B. Thompson. Death by design: apoptosis, necrosis andautophagy. Current Opinion in Cell Biology, 16(6):663–669, 2004.
[7] R.N. Germain. An innately interesting decade of research in immunology.Nature Medicine, 10(12):1307–1320, 2004.
[8] J. Greensmith, U. Aickelin, and S. Cayzer. Introducing dendritic cells as anovel immune-inspired algorithm for anomaly detection. In Proc. of the FourthInternational Conference on Artificial Immune Systems (ICARIS-05), LNCS3627, pages 153–167, 2005.
[9] J. Greensmith, U. Aickelin, and J. Twycross. Articulation and clarification ofthe dendritic cell algorithm. In Proc. of the Fifth International Conference onArtificial Immune Systems (ICARIS-06), LNCS 4163, pages 404–417, 2006.
[10] J. Greensmith, J. Twycross, and U. Aickelin. Dendritic cells for anomalydetection. In Proc. of the IEEE Congress on Evolutionary Computation (CEC2006), pages 664–671, 2006.
[11] J Greensmith. The Dendritic Cell Algorithm. PhD thesis, University OfNottingham, 2007.
[12] E Hart, P Ross, A Webb, and A Lawson. A role for immunology in ”nextgeneration” robot controllers. In Proc. of the Second International Conferenceon Artificial Immune Systems (ICARIS-03), LNCS 2787, volume LNCS 2787,pages 46–56, 2003.
[13] S Hofmeyr and S Forrest. Architecture for an artificial immune system.Evolutionary Computation, 8(4):443–473, 2000.
[14] C.A. Janeway, P.Travers, M.Walport, and M.J. Shlomchik. Immunobiology:theimmune system in health and disease. Garland Science Publishing, 6th editionedition, 2005.
[15] C.A. Janeway. Approaching the asymptote? Evolution and revolution inimmunology. Cold Spring Harb Symp Quant Biol, 1:1–13, 1989.
[16] J Kim, PJ. Bentley, C Wallenta, M Ahmed, and S Hailes. Danger is ubiquitous:Detecting malicious activities in sensor networks using the dendritic cellalgorithm. In Proc. of the Fifth International Conference on Artificial ImmuneSystems (ICARIS-06), LNCS 4163, pages 390–403, 2006.
[17] M.B. Lutz and G. Schuler. Immature, semi-mature and fully mature dendriticcells: which signals induce tolerance or immunity? Trends in Immunology,23(9):991–1045, 2002.
37

[18] P. Matzinger. Tolerance, danger and the extended family. Annual Reviews inImmunology, 12:991–1045, 1994.
[19] P. Matzinger. An innate sense of danger. Seminars in Immunology, 10:399–415,1998.
[20] P. Matzinger. The danger model: A renewed sense of self. Science, 296:301–304,2002.
[21] R. Medzhitov and C.A. Janeway. Decoding the patterns of self and nonself bythe innate immune system. Science, 296:298–300, 2002.
[22] T.R. Mosmann and A.M. Livingstone. Dendritic cells: the immune informationmanagement experts. Nature Immunology, 5(6):564–566, 2004.
[23] nmap. http://www.insecure.org.
[24] P. A. Porras and P. G. Neumann. Emerald: Event monitoring enabling responsesto anomalous live disturbances. In Proc. of the 20th NIST NCSC NationalInformation Systems Security Conference, pages 353–365, 1997.
[25] M. Roesch. Snort - lightweight intrusion detection for networks. In LISA ’99:Proceedings of the 13th USENIX conference on System administration, pages229–238, Berkeley, CA, USA, 1999. USENIX Association.
[26] S. Schechter, J. Jung, and A.W. Berger. Fast detection of scanning worminfections. In 7th International Symposium on Recent Advances in IntrusionDetection (RAID), September 2004.
[27] S. Staniford-Chen, S. Cheung, R. Crawford, M. Dilger, J. Frank, J. Hoagland,K. Levitt, C. Wee, R. Yip, and D. Zerkle. Grids: A graph-based intrusiondetection system for large networks. In Proc. of the 19th National InformationSystems Security Conference, 1996.
[28] S. Staniford, J. A. Hoagland, and J.M. McAlerney. Practical automateddetection of stealthy portscans. J. Computer Security, 10(1-2):105–136, 2002.
[29] J. Twycross and U. Aickelin. Towards a conceptual framework for innateimmunity. In Proc. of the Fourth International Conference on Artificial ImmuneSystems (ICARIS-05), LNCS 3627, 2005.
[30] J. Twycross and U. Aickelin. libtissue - implementing innate immunity. InProc. of the Congress on Evolutionary Computation (CEC-2006), pages 499–506, 2006.
[31] J. Twycross. Integrated Innate and Adaptive Artificial Immune Systems Appliedto Process Anomaly Detection. PhD thesis, University Of Nottingham, 2007.
[32] C.A. Williams, R.A. Harry, and J.D. McLeod. Mechanisms of apoptosis induceddc suppression. Submitted to the Journal of Immunology and under review, 2007.
38