Influence of Wood Fly Ash on Concrete Properties ... - MDPI
22
materials Article Influence of Wood Fly Ash on Concrete Properties through Filling Effect Mechanism Ivan Gabrijel * , Marija Jelˇ ci´ c Rukavina and Nina Štirmer Citation: Gabrijel, I.; Jelˇ ci´ c Rukavina, M.; Štirmer, N. Influence of Wood Fly Ash on Concrete Properties through Filling Effect Mechanism. Materials 2021, 14, 7164. https://doi.org/ 10.3390/ma14237164 Academic Editor: Francisco Agrela Received: 4 November 2021 Accepted: 22 November 2021 Published: 24 November 2021 Publisher’s Note: MDPI stays neutral with regard to jurisdictional claims in published maps and institutional affil- iations. Copyright: © 2021 by the authors. Licensee MDPI, Basel, Switzerland. This article is an open access article distributed under the terms and conditions of the Creative Commons Attribution (CC BY) license (https:// creativecommons.org/licenses/by/ 4.0/). Faculty of Civil Engineering, University of Zagreb, Fra Andrije Kaˇ ci´ ca Mioši´ ca 26, 10000 Zagreb, Croatia; [email protected] (M.J.R.); [email protected] (N.Š.) * Correspondence: [email protected]; Tel.: +385-1-4639-440 Abstract: This paper presents the results of an experimental study aimed at determining the influence of wood fly ash (WFA) from three Croatian power plants on the properties of concrete. First, the chemical and physical properties of WFA’s were determined. It was found that these properties are highly influenced by combustion technology, the type and parts of wood used as fuel, and the local operating conditions. Subsequently, workability, heat of hydration, stiffness development, 28-day compressive strength, apparent porosity, and capillary absorption were determined on concrete mixes prepared with WFA as cement replacement from 5–45% by weight. Cement replacement up to 15% with the finest WFA accelerated hydration, stiffness development, and increased compressive strength of concrete up to 18%, while replacement with coarser WFA’s led to a decrease in compressive strength of up to 5% and had more gradual heat liberation. The dominant effect that could explain these findings is attributed to the filler and filling effect mechanisms. At the same time replacement content of up to 45% had very little effect on capillary absorption and could give concrete with sufficiently high compressive strength to be suitable for construction purposes. Keywords: biomass; wood fly ash; supplementary cementitious materials; filling mechanism 1. Introduction The need to reduce greenhouse gas emissions accelerates the transition to renewable energy sources. Biomass is the largest source of renewable energy in the European Union (EU), of which 60% comes directly or indirectly from forests [1,2]. The most common way of producing energy from biomass is combustion, and this process yields on average a quantity of ash between 2.7% and 3.5% of the original weight of wood biomass [3]. From the data on the quantity of wood used for energy production, it was estimated that about 7.3 million tons of ash were produced from wood biomass in the EU-28 countries in 2015 [4]. The primary energy supply of solid biomass during 2018 reached an amount of 47,260 PJ worldwide and 5704 PJ in the EU-28 [5]. Assuming that the combustion of 1 PJ of primary biomass produces about 2000 tons of ash [6], it follows that about 95 million tons of ash were produced globally and about 11 million tons of ash were produced in the EU-28 countries, most of which is wood biomass ash (WBA). Despite the fact that different possibilities of WBA recycling have been recognized most of the ash is being landfilled [6–10]. Logistical problems, variations in the ash properties, contamination due to co-incineration with treated wood, lack of standards and legislation have been identified as obstacles in sustainable WBA management [11–13]. However, WBA disposed of in landfills can lead to air pollution with fine ash particles that can be carried by the wind, or they can contaminate soil or groundwater, so these landfills need to be properly designed and maintained [14–16]. In addition, the cost of landfilling is expected to increase, which will affect the price of heat and electrical energy [17,18]. Therefore, management of WBA in such a way that the balance is found between economic and environmental requirements is necessary. Materials 2021, 14, 7164. https://doi.org/10.3390/ma14237164 https://www.mdpi.com/journal/materials
-
Upload
khangminh22 -
Category
Documents
-
view
4 -
download
0
Transcript of Influence of Wood Fly Ash on Concrete Properties ... - MDPI
materials
Article
Influence of Wood Fly Ash on Concrete Properties throughFilling Effect Mechanism
Ivan Gabrijel * , Marija Jelcic Rukavina and Nina Štirmer
�����������������
Citation: Gabrijel, I.; Jelcic Rukavina,
M.; Štirmer, N. Influence of Wood Fly
Ash on Concrete Properties through
Filling Effect Mechanism. Materials
2021, 14, 7164. https://doi.org/
10.3390/ma14237164
Academic Editor: Francisco Agrela
Received: 4 November 2021
Accepted: 22 November 2021
Published: 24 November 2021
Publisher’s Note: MDPI stays neutral
with regard to jurisdictional claims in
published maps and institutional affil-
iations.
Copyright: © 2021 by the authors.
Licensee MDPI, Basel, Switzerland.
This article is an open access article
distributed under the terms and
conditions of the Creative Commons
Attribution (CC BY) license (https://
creativecommons.org/licenses/by/
4.0/).
Faculty of Civil Engineering, University of Zagreb, Fra Andrije Kacica Miošica 26, 10000 Zagreb, Croatia;[email protected] (M.J.R.); [email protected] (N.Š.)* Correspondence: [email protected]; Tel.: +385-1-4639-440
Abstract: This paper presents the results of an experimental study aimed at determining the influenceof wood fly ash (WFA) from three Croatian power plants on the properties of concrete. First, thechemical and physical properties of WFA’s were determined. It was found that these properties arehighly influenced by combustion technology, the type and parts of wood used as fuel, and the localoperating conditions. Subsequently, workability, heat of hydration, stiffness development, 28-daycompressive strength, apparent porosity, and capillary absorption were determined on concretemixes prepared with WFA as cement replacement from 5–45% by weight. Cement replacement up to15% with the finest WFA accelerated hydration, stiffness development, and increased compressivestrength of concrete up to 18%, while replacement with coarser WFA’s led to a decrease in compressivestrength of up to 5% and had more gradual heat liberation. The dominant effect that could explainthese findings is attributed to the filler and filling effect mechanisms. At the same time replacementcontent of up to 45% had very little effect on capillary absorption and could give concrete withsufficiently high compressive strength to be suitable for construction purposes.
Keywords: biomass; wood fly ash; supplementary cementitious materials; filling mechanism
1. Introduction
The need to reduce greenhouse gas emissions accelerates the transition to renewableenergy sources. Biomass is the largest source of renewable energy in the European Union(EU), of which 60% comes directly or indirectly from forests [1,2]. The most common wayof producing energy from biomass is combustion, and this process yields on average aquantity of ash between 2.7% and 3.5% of the original weight of wood biomass [3]. Fromthe data on the quantity of wood used for energy production, it was estimated that about7.3 million tons of ash were produced from wood biomass in the EU-28 countries in 2015 [4].The primary energy supply of solid biomass during 2018 reached an amount of 47,260 PJworldwide and 5704 PJ in the EU-28 [5]. Assuming that the combustion of 1 PJ of primarybiomass produces about 2000 tons of ash [6], it follows that about 95 million tons of ashwere produced globally and about 11 million tons of ash were produced in the EU-28countries, most of which is wood biomass ash (WBA).
Despite the fact that different possibilities of WBA recycling have been recognizedmost of the ash is being landfilled [6–10]. Logistical problems, variations in the ashproperties, contamination due to co-incineration with treated wood, lack of standardsand legislation have been identified as obstacles in sustainable WBA management [11–13].However, WBA disposed of in landfills can lead to air pollution with fine ash particles thatcan be carried by the wind, or they can contaminate soil or groundwater, so these landfillsneed to be properly designed and maintained [14–16]. In addition, the cost of landfillingis expected to increase, which will affect the price of heat and electrical energy [17,18].Therefore, management of WBA in such a way that the balance is found between economicand environmental requirements is necessary.
Materials 2021, 14, 7164. https://doi.org/10.3390/ma14237164 https://www.mdpi.com/journal/materials

Materials 2021, 14, 7164 2 of 22
Within the EU many biomass plants are burning wood residues to produce heatand/or electrical energy [17]. During combustion in a plant, two types of ash are generated:bottom ash and fly ash. Bottom ash is produced in the combustion chamber and comprisesthe coarse fraction which is formed by the total or partially burnt material, while fly ashis separated from the stream of gases outside the combustion chamber [11]. The ratio ofbottom to fly ash varies depending on the combustion technology. In grate combustors,bottom ash usually accounts for 60% to 90% [6] while in bubbling fluidized bed combustorsthe bottom ash often represents 5% to 17% by weight [11]. Ash from the combustion ofnatural woody biomass contains valuable plant nutrients such as K, P, Mg, and Ca, mostof which are contained in the bottom and coarse fly ash, while volatile heavy metals areconcentrated in the fine fly ash fraction [6]. Therefore, it has been suggested that the bottomand coarse fly ash fraction should be returned to the forest from which they originated,while the fine fly ash should be utilized in industrial processes or disposed of [6].
The cement and concrete industry has been identified as one of the main potentialsfor biomass ash utilization [7]. The use of coal or biomass fly ash in concrete reduces theconsumption of natural resources and reduces the CO2 emissions caused primarily throughthe reduction of Portland cement content in concrete [19]. Besides in the concrete industry,it has been shown that fly ash finds its application in various construction areas [20–25].Pulverized coal fly ash has gained considerable importance as a supplementary cementi-tious material due to its pozzolanic properties, but also due to the improved workabilityof concrete attributed to the spherical shape and plain surface of ash particles. Both, thechemical composition and the shape of ash particles are influenced by the temperatureof combustion [26,27]. In conventional pulverized coal-fired boilers, combustion takesplace at temperatures between 1150 ◦C and 1750 ◦C which results in the melting of themajority of the minerals contained in the coal which is crucial for the formation of sphericalparticles [26]. If the temperature of combustion is below the melting point, such as inthe case of fluidized bed combustion, coarse and irregular particles are formed [28]. Thetemperature of combustion of wood biomass usually takes place at temperatures up to1000 ◦C which is below the melting point for most species present in the biomass [29].Using a scanning electron microscope, it was found that wood fly ash (WFA) particlesrange from spherically fused to irregularly shaped, and porous particles, particles that looklike conglomerates of smaller particles and particles with regular smooth edges [4,30]. Thechemical composition of WFA is different from that of the coal fly ash. It usually containsmore alkali and less alumina than coal fly ash. Besides, the chemical compositions of WFAvary more than that of coal fly ash because it depends on the wood species, parts of woodbeing used as a fuel, and the season of biomass harvest [17,31].
The application of WFA is currently outside the scope of the standard for fly ashfor concrete (EN 450-1:2012) [32]. Extensive research has been conducted to investigatethe possibilities of using WFA as a cement replacement material [30,31,33–41]. It hasbeen reported that WFA from grate combustors and fluidized bed combustors can havehydraulic and/or pozzolanic properties [30,34,37]. The utilization of WFA as a cementreplacement modifies the workability and mechanical properties of the tested material. Asthe cement replacement level increases, water demand usually increases and the compres-sive strength decreases [30,31,33–36,38]. However, replacing cement with WFA can alsoincrease compressive strength when the cement replacement level is low [35,42]. Improvedworkability has also been found when WFA was used as a filler and partial replacementfor fine aggregate in concrete [37].
Most of the studies on the influence of WFA produced during combustion in biomassplants on the properties of cement composites have been tested on cement pastes andmortars and only a small number of experiments have been scaled up to the concretelevel. To develop guidelines for the use of WFA in structural concrete, the interdependencebetween properties of WFA and the properties of fresh and hardened concrete must beclearly established.

Materials 2021, 14, 7164 3 of 22
The aim of the experimental work presented here is to show the influence of WFA withdifferent physical and chemical properties, used as partial cement replacements, on theproperties of fresh and hardened concrete and to identify the most probable mechanismsthat govern these changes. The WFA used originates from three different power plantswith two types of incineration technologies.
2. Materials and Methods2.1. Characterisation of Fly Ash and Cement
Wood fly ash (WFA) is collected from three powerplants in Croatia. All three plantsare co-generation biomass plants producing both heat and electrical energy. Plant F4 isthe smallest plant with 1 MW of electrical capacity and 4.1 MW of heat capacity. It islocated in the mountain part of Lika-Senj County. Wood species mostly used as a fuel aregiven in Table 1 and the parts of wood used as a fuel consist of wood chips made fromroundwood and thinning residues, including twigs, tops, and branches. Plant F5 operatesin the northern part of Croatia in Varazdin County, and it has a production capacity of2.75 MW of electrical and 15 MW of heat energy. It uses wood chips made from roundwoodand thinning residues, including twigs and tops, branches, bark, needles/leaves, and woodindustry waste (including bark). Plants F4 and F5 use fixed bed combustion in which woodfuel is burned in a grate furnace [43]. During the combustion process, fly ash F4 and F5are collected by cyclones [43]. Plant F6 is the largest biomass plant with the capacity ofproduction of 8.6 MW of electrical and 16 MW of heat energy and is in the eastern partof Croatia in Vukovar-Srijem County. Wood fuel is used in the form of wood chips madefrom whole trees containing bark, twigs, and leaves. Plant F6 uses a bubbling fluidized bedcombustion system with quartz sand as s bed material [43]. The fly ash particles carriedfrom the combustor are captured by bag filters [43]. Fly ash captured by bag filters is finerthan fly ash captured by cyclones [30].
Table 1. Chemical and physical composition of cement and WFA [35].
CEM F4 F5 F6
Combustion technology Grate combustor Grate combustor Bubbling fluidized bedIncineration temperature (◦C) - 700–950 up to 800 up to 850
Additive used - - Quartz sand
Type of wood beech, oak, fir, spruce beech, oak, hornbeam beech, oak, hornbeam,poplar
P2O5 0.22 1.82 1.35 4.03Na2O 0.85 0.65 1.32 0.63K2O 1.25 6.05 4.77 6.21CaO 59.80 46.75 16.25 47.35MgO 2.01 8.26 4.30 4.71Al2O3 4.94 6.16 10.50 3.56TiO2 0.23 0.34 1.17 0.25
Fe2O3 3.15 2.85 4.23 1.69SiO2 21.88 19.80 39.95 14.45SO3 3.33 2.73 0.60 3.95
CaCO3 6.56 8.13 7.12 26.94Pozzolanic oxides
(SiO2 + Al2O3 + Fe2O3) 29.97 28.81 54.68 19.70
Alkalies(Na2O + 0.658 K2O) 1.67 4.63 4.59 4.72
LOI (at 950 ◦C) 3.60 3.80 8.30 12.70pH 12.86 13.15 12.97 13.22
d50 (µm) 9.4 71.9 120.7 17.8SSA 1 (kg/m2) 796 223 180 627
Density (g/cm3) 3.10 2.59 2.63 2.33Bulk density (g/cm3) - 0.91 0.61 0.55
1 SSA—specific surface area calculated from particle size distribution.
Materials 2021, 14, 7164 4 of 22
The information about the incineration temperature of wood biomass is given bythe technologists in the power plant. The chemical and physical properties of WFA usedin this work are presented in Table 1. The designations for wood ash used in this papercorrespond to the F4, F5, and F6 in a paper [35] where the same ash was used to studythe effect of cement replacement on the properties of cement paste and mortar. In thepaper [35] additional information is given on the chemical and physical properties of WFA.
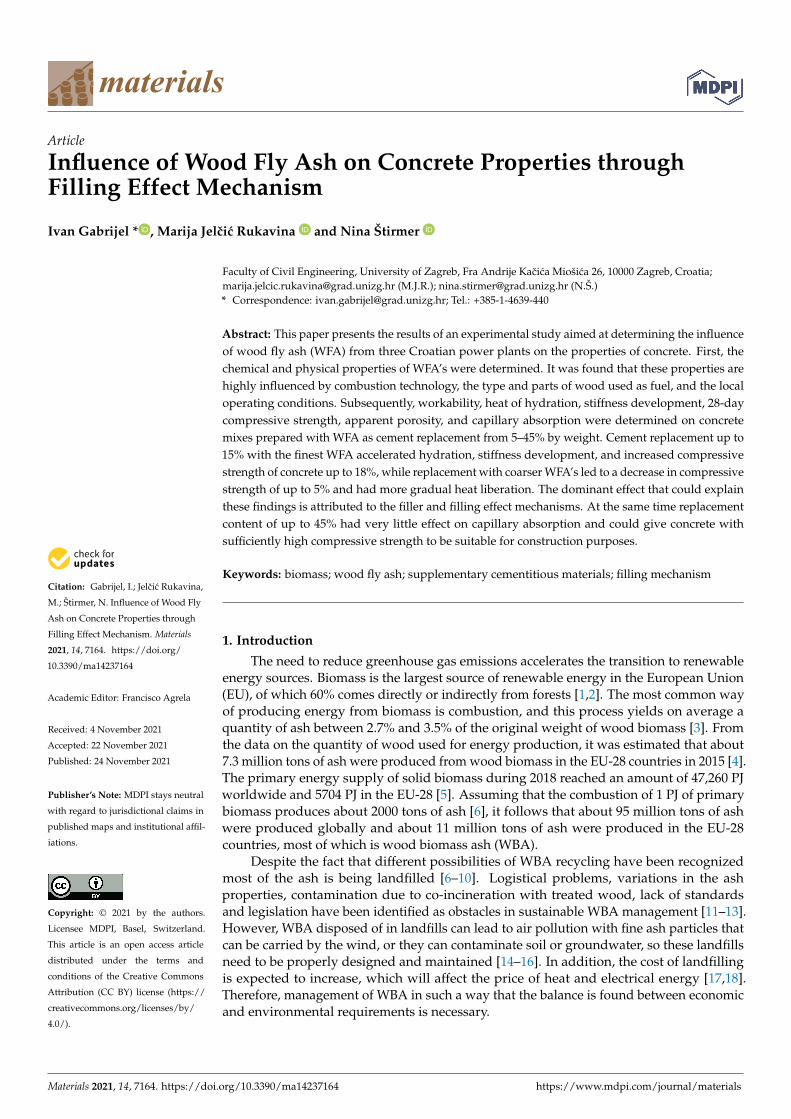
The ternary diagram in Figure 1 shows that WFAs F4 and F6 have CaO-Al2O3-SiO2ratios similar to Portland cement, while ash F5 has an oxide ratio in the area of coalfly ash [44]. WFA F5 also has the highest content of pozzolanic oxides, which is higherthan the minimum pozzolanic oxides for class C pozzolans according to ASTM C618-19standard [45].
Materials 2021, 14, x FOR PEER REVIEW 4 of 24
SiO2 21.88 19.80 39.95 14.45 SO3 3.33 2.73 0.60 3.95
CaCO3 6.56 8.13 7.12 26.94 Pozzolanic oxides (SiO2 + Al2O3 +
Fe2O3) 29.97 28.81 54.68 19.70
Alkalies (Na2O + 0.658 K2O) 1.67 4.63 4.59 4.72
LOI (at 950 °C) 3.60 3.80 8.30 12.70 pH 12.86 13.15 12.97 13.22
d50 (µm) 9.4 71.9 120.7 17.8 SSA 1 (kg/m2) 796 223 180 627
Density (g/cm3) 3.10 2.59 2.63 2.33 Bulk density (g/cm3) - 0.91 0.61 0.55
1 SSA—specific surface area calculated from particle size distribution.
The ternary diagram in Figure 1 shows that WFAs F4 and F6 have CaO-Al2O3-SiO2 ratios similar to Portland cement, while ash F5 has an oxide ratio in the area of coal fly ash [44]. WFA F5 also has the highest content of pozzolanic oxides, which is higher than the minimum pozzolanic oxides for class C pozzolans according to ASTM C618-19 standard [45].
Figure 1. Ternary plot CaO-Al2O3-SiO2 for the wood fly ash used in the experimental work. The area on the graph characteristic for Portland cement and coal fly ash is taken from [44].
The particle-size distribution (PSD) was analyzed by a laser diffraction method using a dry measurement (Shimadzu SALD 3101 Instrument, Kyoto, Japan). Elemental compo-sition is determined by X-ray fluorescence according to standard ISO/TS 16996:2015 [46]. The amount of CaCO3 is determined by thermogravimetric analysis (TGA) (for details see [4]). Loss on ignition (LOI) has been determined according to ASTM D7348-13, density according to ASTM C188-17, and pH value according to EN 12176:2005 [47–49]. The mor-phology of the WBA samples was analyzed by scanning electron microscopy (SEM) using the instrument SEM FE MIRA II LMU. Prior to imaging a suitable amount of powder is placed on a conductive adhesive tape and sputtered with gold/palladium in argon plasma. SEM micrographs were obtained in high vacuum mode under pressure of (3–5) ×10−4 Pa and 10 kV settings.
Figure 1. Ternary plot CaO-Al2O3-SiO2 for the wood fly ash used in the experimental work. The areaon the graph characteristic for Portland cement and coal fly ash is taken from [44].
The particle-size distribution (PSD) was analyzed by a laser diffraction method using adry measurement (Shimadzu SALD 3101 Instrument, Kyoto, Japan). Elemental compositionis determined by X-ray fluorescence according to standard ISO/TS 16996:2015 [46]. Theamount of CaCO3 is determined by thermogravimetric analysis (TGA) (for details see [4]).Loss on ignition (LOI) has been determined according to ASTM D7348-13, density accordingto ASTM C188-17, and pH value according to EN 12176:2005 [47–49]. The morphologyof the WBA samples was analyzed by scanning electron microscopy (SEM) using theinstrument SEM FE MIRA II LMU. Prior to imaging a suitable amount of powder is placedon a conductive adhesive tape and sputtered with gold/palladium in argon plasma. SEMmicrographs were obtained in high vacuum mode under pressure of (3–5) ×10−4 Pa and10 kV settings.
The PSD for cement and WFA is presented in Figure 2 and the median particle size(d50) is given in Table 1. Fly ashes F4 and F5 produced by grate combustion technologycontain coarser particles than ash F6 produced by fluidized bed combustion which is inagreement with literature data [30]. The specific surface area (SSA) of cement and WFA iscalculated from the PSD assuming spherical particles (Table 1). The SSA of cement particlesin Table 1 is 1.3, 3.6, and 4.4 times larger than the specific surface area of wood fly ash F6,F4, and F5, respectively.

Materials 2021, 14, 7164 5 of 22
Materials 2021, 14, x FOR PEER REVIEW 5 of 23
The PSD for cement and WFA is presented in Figure 2 and the median particle size (d50) is given in Table 1. Fly ashes F4 and F5 produced by grate combustion technology contain coarser particles than ash F6 produced by fluidized bed combustion which is in agreement with literature data [30]. The specific surface area (SSA) of cement and WFA is calculated from the PSD assuming spherical particles (Table 1). The SSA of cement particles in Table 1 is 1.3, 3.6, and 4.4 times larger than the specific surface area of wood fly ash F6, F4, and F5, respectively.
Figure 2. Particle size distribution of cement and WFA (shaded area represents standard deviation).
2.2. Concrete Mix Design WFA was stored in the laboratory for a period of approximately six months before
being used in concrete. During storage, WFA was kept sealed in plastic bags and then stored in closed plastic containers.
The cement used in this study was Portland cement type CEM I 42.5 R conforming to European standard EN 197-1:2011 [50]. The aggregate was crushed dolomite with an average bulk density of 2.8 kg/dm3 and absorption of 0.47%, 0.66%, and 0.32% for fractions 0/4, 4/8, and 8/16 mm, respectively. The particle size distribution curves are presented in Figure 3.
0
10
20
30
40
50
60
70
80
90
100
0.1 1 10 100 1000
Cum
ulat
ive a
mou
nt (%
)
Particle size (μm)
CEM
F4
F5
F6
Figure 2. Particle size distribution of cement and WFA (shaded area represents standard deviation).
2.2. Concrete Mix Design
WFA was stored in the laboratory for a period of approximately six months beforebeing used in concrete. During storage, WFA was kept sealed in plastic bags and thenstored in closed plastic containers.
The cement used in this study was Portland cement type CEM I 42.5 R conformingto European standard EN 197-1:2011 [50]. The aggregate was crushed dolomite with anaverage bulk density of 2.8 kg/dm3 and absorption of 0.47%, 0.66%, and 0.32% for fractions0/4, 4/8, and 8/16 mm, respectively. The particle size distribution curves are presented inFigure 3.
Materials 2021, 14, x FOR PEER REVIEW 6 of 24
Figure 3. Aggregate grading curves.
The compositions of the concrete mixes are given in Table 2. Each mix is designated according to the WFA used and the cement replacement percentage. All mixes had the same water/(cement + WFA) ratio of 0.5. A total of 7 concrete mixes containing WFA were prepared with cement replacement percentages of 15% and 30% for ash F4, 15%, 30% and 45% for ash F5, and 5% and 15% for ash F6. In the first stage of the experimental work, a reference concrete mix (M0) and mixes with 15% cement replacement were made. The decision to increase or decrease the cement replacement level in the further mix design process was based on the influence of WFA on the workability of the fresh concrete. Work-ability was evaluated by the slump test, and cohesiveness was determined by visual in-spection of each mix.
Table 2. Concrete mix composition (quantities per 1 m3 of concrete).
Mix Designation M0 F4-15 F4-30 F5-15 F5-30 F5-45 F6-5 F6-15 Cement (kg) 380 323 266 323 266 209 361 323
WFA cement replacement (%) 0 15 30 15 30 45 5 15 WFA content (kg) 0 57 114 57 114 171 19 57
Cement + WFA (kg) 380 w/(cem. + WFA) ratio 0.5
Water (kg) 190 Aggregate (kg) 1821 1811 1801 1811 1801 1791 1816 1805
Fine aggregate (kg) 648 645 641 645 641 638 646 643 Coarse aggregate (kg) 1173 1167 1160 1167 1160 1154 1169 1162
The mixing of the concrete was performed in a compulsory mixer with a capacity of 75 L. Before mixing, all constituents were conditioned to a temperature of 20 ± 2°C. The mixing procedure described in the standard EN 480-1:2014 [51] was used for the prepara-tion of the reference mix. Following this procedure, aggregates and approximately half of the mixing water were added to the pan and mixed for 2 min, and then mixing was stopped for 2 min. At the end of this period, cement and WFA were added to the mixer. The components were mixed for 30 s and during the next 30 s the remaining water was added. Mixing was then continued for an additional 2 min. The entire mixing process lasted 7 min.
0
20
40
60
80
100
Perc
enta
ge p
assi
ng (%
)
Sieve size (mm)
0-44-88-16Cumulative
Figure 3. Aggregate grading curves.
The compositions of the concrete mixes are given in Table 2. Each mix is designatedaccording to the WFA used and the cement replacement percentage. All mixes had thesame water/(cement + WFA) ratio of 0.5. A total of 7 concrete mixes containing WFAwere prepared with cement replacement percentages of 15% and 30% for ash F4, 15%, 30%and 45% for ash F5, and 5% and 15% for ash F6. In the first stage of the experimentalwork, a reference concrete mix (M0) and mixes with 15% cement replacement were made.

Materials 2021, 14, 7164 6 of 22
The decision to increase or decrease the cement replacement level in the further mixdesign process was based on the influence of WFA on the workability of the fresh concrete.Workability was evaluated by the slump test, and cohesiveness was determined by visualinspection of each mix.
Table 2. Concrete mix composition (quantities per 1 m3 of concrete).
Mix Designation M0 F4-15 F4-30 F5-15 F5-30 F5-45 F6-5 F6-15
Cement (kg) 380 323 266 323 266 209 361 323WFA cement replacement (%) 0 15 30 15 30 45 5 15
WFA content (kg) 0 57 114 57 114 171 19 57Cement + WFA (kg) 380
w/(cem. + WFA) ratio 0.5Water (kg) 190
Aggregate (kg) 1821 1811 1801 1811 1801 1791 1816 1805Fine aggregate (kg) 648 645 641 645 641 638 646 643
Coarse aggregate (kg) 1173 1167 1160 1167 1160 1154 1169 1162
The mixing of the concrete was performed in a compulsory mixer with a capacityof 75 L. Before mixing, all constituents were conditioned to a temperature of 20 ± 2 ◦C.The mixing procedure described in the standard EN 480-1:2014 [51] was used for thepreparation of the reference mix. Following this procedure, aggregates and approximatelyhalf of the mixing water were added to the pan and mixed for 2 min, and then mixing wasstopped for 2 min. At the end of this period, cement and WFA were added to the mixer.The components were mixed for 30 s and during the next 30 s the remaining water wasadded. Mixing was then continued for an additional 2 min. The entire mixing processlasted 7 min.
2.3. Testing Methods
The following properties of concrete were measured in the fresh state: consistency byslump test (EN 12350-2:2019), density (EN 12350-6:2019), air content (EN 12350-7:2019), andtemperature [52–54]. The concrete was compacted on a vibrating table. After compaction,the specimens were stored in a room with a temperature of 20 ± 5 ◦C and covered witha plastic sheet. After 24 h, the specimens were demoulded and moved to a curing roomwhere they were cured in the air at a temperature of 20 ± 2 ◦C and a relative humidity of>95%. All measurements were performed on concrete from the same batch.
The heat of hydration is monitored with the ToniCAL 7336 heat flow differentialcalorimeter. During the measurement, the calorimeter was placed in the room wherethe temperature was maintained at 19 ± 2 ◦C. The measuring vessel of the calorimetercontains two measuring cells, one for the concrete specimen and another for the inert(reference) specimen. The inert specimen was maintained at the preselected temperatureof 23 ◦C. All concrete components were tempered prior to mixing so that the temperatureof the fresh concrete was as close as possible to the temperature of the inert specimen.After mixing the fresh concrete, a specimen of concrete was compacted in a cylindricalsteel mould with a diameter of 150 mm and a height of 300 mm, and the mould wasthen placed in the calorimeter vessel. The heat generated by the hydration of the cementwas evaluated from the voltage difference detected by the thermoelectric conductorsplaced around the specimens. The rate of heat generation was monitored during the first5 days of hydration. During the heat generation measurement, the temperature of theconcrete specimen changes and it is measured by a Pt-100 probe approximately in thecenter of the concrete specimen. The initial temperature of the specimen was between22–23 ◦C, it increased depending on the rate of heat generation in the specimen, reached amaximum, and then decreased to the preselected temperature of 23 ◦C. The measurementof the temperature is complementary to the measurement of the heat flow and provides

Materials 2021, 14, 7164 7 of 22
important information for the interpretation of the results, because the increase of thetemperature additionally accelerates the hydration, so the heat evolution occurs at a higherrate than would be the case under isothermal conditions, but also at a slower rate than inthe semi-adiabatic calorimeter.
Concrete stiffness development was monitored by measuring ultrasonic pulse velocity(UPV) at 1, 2, 7, and 28 days of age using a portable ultrasonic instrument with 54 kHzlongitudinal wave transducers. The measurement was performed on concrete cubes with aside length of 150 mm. The same cubes were used for testing the compressive strength ofconcrete at 28 days of age according to standardized procedure (EN 12390-3:2019) [55].
The capillary absorption measurement was performed on cylinder specimens 150 mmin diameter and height 50 mm, obtained by sawing from the standard cylinder 150 mm indiameter and height 300 mm. Upper and bottom slices of the cylinder were not tested toavoid effects of different boundary conditions. The first 10 mm of side surface in contactwith water was coated with epoxy resin. Prior to testing, the specimens were oven-dried ata temperature of 105 ± 5 ◦C until the change in mass for two consecutive weighing becameless than 0.5 g (≈0.025 % of mass). After cooling to ambient temperature, the specimenswere placed in a water container on cylindrical rods, and the water level was adjusted sothat the bottom surface of the specimens was immersed in the water 2–5 mm. The mass ofthe specimens was measured at an interval of 5, 15, 30, 60, 120, 240, and 1500 min. Fromeach mix, three specimens were tested for capillary absorption.
After the capillary absorption test, the water level in a water container was graduallyincreased at the rate of approximately 1/4 of the height of the specimens per day until thespecimens were completely immersed. The specimens were kept under water until themass of the specimens changed by less than 0.5 g after two consecutive measurements. Thespecimens were then weighted in surface dry conditions in air and in water. Bulk densityin dry (ρz,dry) and saturated conditions (ρz,sat), apparent solid density (ρa), and apparentporosity (pa) were calculated according to Equations (1)–(4). The term apparent is usedhere because it is assumed that only open pores are filled with water.
ρz,dry =mdryρw
msat − msat,w, (1)
ρz,sat =msatρw
msat − msat,w, (2)
ρa =mdryρw
mdry − msat,w, (3)
pa =msat − mdry
msat − msat,w· 100, (4)
where mdry is the mass of dry material, msat is the mass of saturated material, msat,w is themass of saturated material weighted in water, and ρw is the density of water (1000 kg/m3).
3. Results and Discussion3.1. Fresh Concrete Properties
The density of the fresh concrete was determined using a measuring container of8 liter capacity. The density varied between mixes in the range of 2440–2500 kg/m3. Forashes F4 and F5, the density slightly decreased with increasing WFA content, while forash F6, the density increased with increasing ash content. This observation on the freshconcrete was confirmed by the results of the bulk density measurements on the hardenedconcrete (Table 3).

Materials 2021, 14, 7164 8 of 22
Table 3. Properties of fresh and hardened concrete.
Mix Designation M0 F4-15 F4-30 F5-15 F5-30 F5-45 F6-5 F6-15
Fresh density (kg/m3) 2470 2470 2460 2470 2450 2440 2480 2500Initial temperature (◦C) 22.2 23.6 25.1 23.2 23.3 23.3 24.4 22.2
Air content (%) 1.0 0.9 1.1 1.4 0.7 0.3 0.3 1.6Slump (mm) 90 100 40 85 90 90 110 5
Bulk dry density (kg/m3)2371 2360 2348 2363 2350 2319 2373 2390(±8) (±16) (±13) (±13) (±15) (±20) (±24) (±8)
Bulk saturated density(kg/m3)
2506 2499 2484 2500 2485 2464 2503 2514(±6) (±12) (±10) (±15) (±10) (±12) (±17) (±6)
Apparent solid density(kg/m3)
2743 2742 2718 2739 2719 2713 2726 2728(±4) (±4) (±6) (±22) (±5) (±3) (±8) (±2)
Apparent porosity (%)13.57 13.93 13.60 13.73 13.57 14.52 12.94 12.40
(±0.17) (±0.48) (±0.30) (±0.21) (±0.49) (±0.85) (±0.64) (±0.27)
Compressive strength(MPa)
45.9(±0.9)
43.2(±0.3)
31.9(±1.4)
45.3(±0.6)
37.3(±1.5)
30.1(±0.8)
48.9(±1.2)
54.5(±0.9)
Capillary absorptioncoefficient (kg/(m2h0.5))
1.28(±0.07)
1.22(±0.11)
1.24(±0.04)
1.30(±0.11)
1.35(±0.13)
1.30(±0.18)
0.99(±0.20)
1.02(±0.07)
Numbers in brackets are standard deviations.
The air content was low in all mixtures, indicating dense packing of the concrete con-stituents after compaction on the vibrating table. The highest air content in mix F6-15 may bepartially attributed to the low slump value, which made the compaction of concrete harder.
The initial temperature of the concrete varied between 22.2 and 25.1 ◦C. Only mixeswith ash F4 showed a consistent increase in temperature with the increase in ash content.This could be caused by fast initial heat liberation on contact with water but could also beattributed to temperature variations of the concrete constituents prior to mixing.
Replacing cement with WFA changed the workability of concrete. It is evident thatboth the properties of the ash and the replacement level had a large influence on cohesive-ness and fluidity. It is important to emphasize that all the mixes had adequate workabilityto be placed in moulds and compacted on a vibrating table without the loss of homogeneity.
The influence of cement replacement on workability, as determined by the slump test,is shown in Table 3. Ash F6 at 15% cement replacement had the largest influence on slumpvalues, where slump decreased from 90 mm measured on the reference concrete to 5 mm.Concrete produced with 15% cement replacement with F4 and F5 ashes showed only minordeviations from the slump value measured on the reference mix. A significant decrease inslump was also present with the F4-30 mix. The cement mix with ash F5 had almost noinfluence on the slump values. However, mix F5-45 gave a harsh concrete typical for lowcement content concrete [56]. This mix also showed increased bleeding and a tendency forthe segregation of the largest aggregate particles. It is also interesting to note that the F4-15and F6-5 mixes showed an increased slump compared to the reference mix. This increasein slump is within the reproducibility limits for the test method (EN 12350-2:2019) [52] butmay also be a reflection of the net effect caused by the cement replacement with WFA, asdiscussed hereafter.
No clear conclusion can be drawn from the previously published data on the im-pact of WFA on the water demand of concrete mixes, as both increased and decreasedwater demand have been reported. Increased water demand or decreased workability inmixes with WFA was attributed to the irregular shape and higher specific surface areadue to the porous WFA particles [31,57,58]. Berra et al. [37] tested two types of WFA atcement replacement levels of 15% and 30% and found that the workability of hardenedcement paste improved with the increasing replacement of cement by WFA for ash with

Materials 2021, 14, 7164 9 of 22
finer particles (d50 < 60 µm), while the opposite was found for ash with coarser particles(d50 ≈ 100 µm) [37]. It was suggested that the improved workability of mixes containingWFA was due to the lower ash dissolution and lower loss on ignition of the finer ash. Thesame authors also found that the addition of fine WFA instead of limestone filler improvedthe workability of concrete.
Changes in the workability of concrete caused by mineral admixtures are attributed tothe various mechanisms of interaction between solid particles. Many of these mechanismsare governed by the physical properties of the solid particles such as fineness, shape, sur-face texture, and porosity of the particles, but they also depend on grain composition, mixproportions, and the presence of other admixtures [56,59–61]. Several hypotheses have beenproposed to explain the improved workability of mixtures containing mineral admixtures:
• Reduced interparticle friction during flow caused by the spherical shape and plainsurface of admixture particles—ball-bearing effect [60].
• Fine particles fill the void space between relatively large cement grains and release en-trapped water and enhance fluidity—filling effect [60]. The circularity of the particlesgoes in favor to this mechanism [62].
• Adsorption of admixture particles on the surface of the cement particles due to electri-cal charges, which deflocculates the cement particles and increases mobility [59].
On the other hand, the reduction of workability due to the addition of mineral admix-tures is often attributed to:
• Increase in solid surface area due to the presence of very fine particles that have atendency to adsorb water [56,59].
• Replacement with a filler containing large particles (>45 µm) [60].• Open porosity of the particles which increases the specific surfaces [59,61].
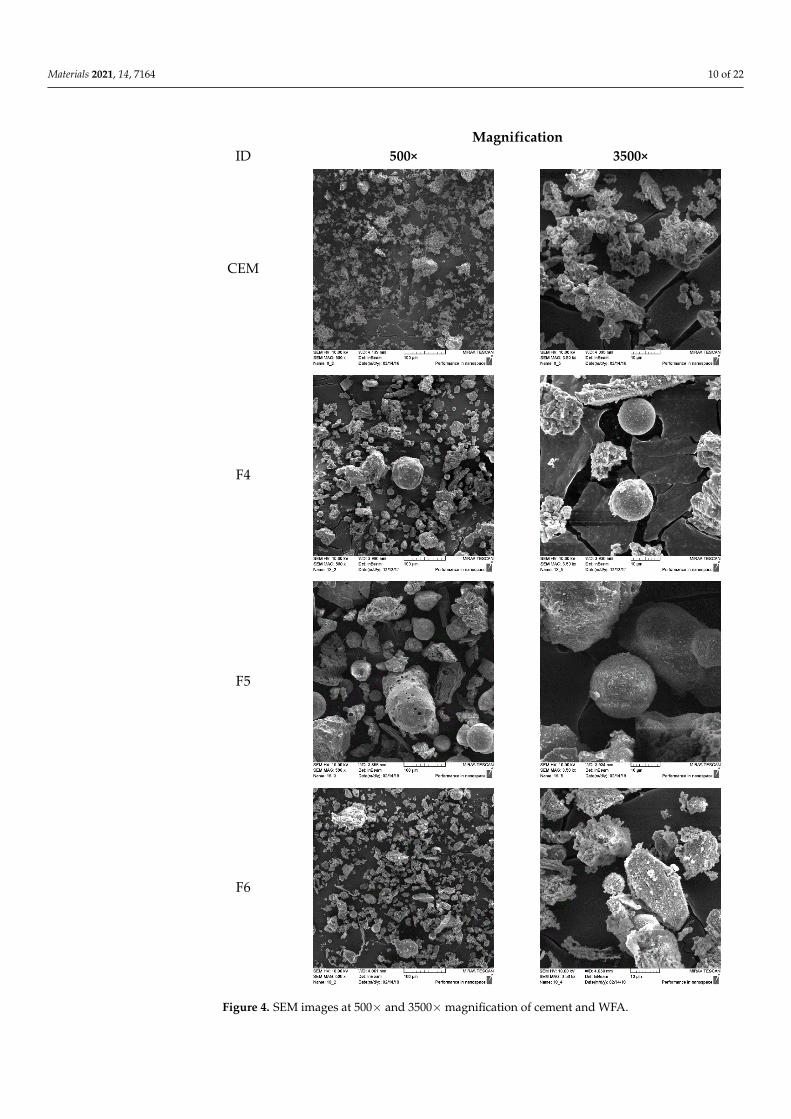
Considering the SSA from Table 1, the replacement of cement with WFA resulted in areduction in the surface area of the solid phases in the concrete. However, the assumptionof spherical particles probably underestimates the actual surface area [63]. For typicalcement powders, the SSA calculated for spherical particles should be multiplied by afactor of 1.6–1.8 [64]. The fluidized bed combustion technology in coal-burning processesproduces sub-angular particles resulting in a surface area up to 5 times larger comparedto pulverized coal fly ash with typically spherical particles, due to lower combustiontemperature [26]. This contributes to its reactivity and increases water demand [65]. SEMimages show that all the WFAs used in this work contain both irregular and sphericalparticles and the main difference is in the size of the particles (Figure 4). Compared tothe WFA particles, the cement particles seem to be more irregular, which is to be expectedsince these particles were formed by crushing larger clinker grains. Therefore, replacingcement with WFA increases the “sphericity” of the particles. Another important effect onworkability is the water absorbed by the porous particles. The main content of the LOIin fly ash is unburned carbon, which has a high porosity and a very large specific surfaceand can absorb a significant amount of water [61]. The above-mentioned effects interfereand create the overall effect on concrete workability. Ash F6 contained particle sizes in arange very similar to Portland cement. The addition of ash F6 to the concrete increases thesphericity of the particles, which, in combination with the small particle sizes improvedthe packing and enhanced the workability.
Materials 2021, 14, 7164 10 of 22Materials 2021, 14, x FOR PEER REVIEW 11 of 24
Magnification ID 500× 3500×
CEM
F4
F5
F6
Figure 4. SEM images at 500× and 3500× magnification of cement and WFA.
It is known that the addition of fine mineral admixtures enhances cohesiveness and reduces the size and volume of voids [56]. The reduction of voids, i.e., improved packing
Figure 4. SEM images at 500× and 3500× magnification of cement and WFA.

Materials 2021, 14, 7164 11 of 22
It is known that the addition of fine mineral admixtures enhances cohesiveness andreduces the size and volume of voids [56]. The reduction of voids, i.e., improved packingin specimens from mixes containing ash F6, is confirmed by the increased density, reducedporosity, and increased compressive strength (Table 3). Ash F6 also contained the highestamount of unburned carbon (LOI 12.7%), which absorbed a certain quantity of water. Theincrease in slump in mix F6-5 could be attributed to the enhanced workability due tothe filling effect, while at 15% replacement the effect of water absorption and enhancedcohesiveness become dominant. The F4 ash contained coarser particles than the Portlandcement, but it also contained 30% of particles <45 µm. This quantity of fine particlestogether with the increased circularity of the particles enhanced fluidity. At the same time,the portion of particles >45 µm loosens the particle packing, leading to increased waterdemand. The increase in slump in mix F4-15 could be attributed to the reduced waterdemand due to the filling effect, while at 30% cement replacement, the loosening of particlepacking becomes dominant. Ash F5 contains only 7% of particles <45 µm, so it does nothave capability to reduce the water demand through the filling effect. A loose particlepacking is created, which decreased the cohesiveness of the mix, while part of the waterwas probably absorbed by the unburned carbon particles (LOI 8.3%).
Oey et al. [63] characterize the influence of cement replacement by powder addition withan area multiplier AM, which evaluates the increase in solid surface induced by filler addition:
AM = 1 +rSSA f iller
(100 − r)SSAcement, (5)
where r represents the mass percentage replacement of cement by filler. A larger value ofAM indicates that the filler is finer or that it is present in a larger amount. According to theAM value, the 5% replacement with ash F6 is approximately equal to the 15% replacementwith ash F4 or F5. The 15% replacement with ash F6 gives a larger AM value than the mixwith 30% replacement of ash F4 and F5. In Figure 5 slump results are plotted against theAM value. The correlation between slump and AM in mixtures containing ash F4 and F6shows a similar trend, indicating that there is a cement replacement level where workabilityis increased by WFA addition. Mixes containing ash F5 do not show the same correlationbetween slump and AM value, as mixes made with ash F4 and F6, which is attributed tothe particle size distribution of ash F5.
Materials 2021, 14, x FOR PEER REVIEW 12 of 24
in specimens from mixes containing ash F6, is confirmed by the increased density, re-duced porosity, and increased compressive strength (Table 3). Ash F6 also contained the highest amount of unburned carbon (LOI 12.7%), which absorbed a certain quantity of water. The increase in slump in mix F6-5 could be attributed to the enhanced workability due to the filling effect, while at 15% replacement the effect of water absorption and en-hanced cohesiveness become dominant. The F4 ash contained coarser particles than the Portland cement, but it also contained 30% of particles < 45 µm. This quantity of fine par-ticles together with the increased circularity of the particles enhanced fluidity. At the same time, the portion of particles > 45 µm loosens the particle packing, leading to increased water demand. The increase in slump in mix F4-15 could be attributed to the reduced water demand due to the filling effect, while at 30% cement replacement, the loosening of particle packing becomes dominant. Ash F5 contains only 7% of particles < 45 µm, so it does not have capability to reduce the water demand through the filling effect. A loose particle packing is created, which decreased the cohesiveness of the mix, while part of the water was probably absorbed by the unburned carbon particles (LOI 8.3%).
Oey et al. [63] characterize the influence of cement replacement by powder addition with an area multiplier AM, which evaluates the increase in solid surface induced by filler addition:
1100( )
filler
cement
r SSAAM
r SSA= +
−, (5)
where r represents the mass percentage replacement of cement by filler. A larger value of AM indicates that the filler is finer or that it is present in a larger amount. According to the AM value, the 5% replacement with ash F6 is approximately equal to the 15% replace-ment with ash F4 or F5. The 15% replacement with ash F6 gives a larger AM value than the mix with 30% replacement of ash F4 and F5. In Figure 5 slump results are plotted against the AM value. The correlation between slump and AM in mixtures containing ash F4 and F6 shows a similar trend, indicating that there is a cement replacement level where workability is increased by WFA addition. Mixes containing ash F5 do not show the same correlation between slump and AM value, as mixes made with ash F4 and F6, which is attributed to the particle size distribution of ash F5.
Figure 5. Slump vs. area multiplier (AM) in concrete.
0
20
40
60
80
100
120
1 1.05 1.1 1.15 1.2
Slum
p (m
m)
AM (−)
F4
F5
F6
Figure 5. Slump vs. area multiplier (AM) in concrete.

Materials 2021, 14, 7164 12 of 22
The existence of optimum WFA content in terms of concrete workability has beenobserved by Yang et al. [57] and attributed to improved packing of particles when part of thesand was replaced by ash. Increasing the sand replacement level above the optimum valueleads to a decrease in slump compared to the mix without ash [57]. Skripkiunas et al. [66]tested the rheological properties of cement pastes made with 0, 5, 10, 20, and 30% cementreplaced with biomass fly ash. They found that only cement paste made with 10% biomassfly ash had lower yield stress and lower viscosity than a mix without fly ash. Althoughthe authors did not discuss the reasons for their findings, it is interesting to note that thePortland cement and biomass fly ash used in [66] had a median particle size of 9.94 µmand 23.97 µm, which is similar to a median particle size of the Portland cement and ash F6used in this work (Table 1).
All three ashes used in this work had a large amount of K2O content (Table 1), whichcan increase the reactivity of the C3A present in the cement and additionally increase thewater demand [67]. Increasing the cement replacement also increases the content of alkalisin the mixture. In Portland cement, the ettringite formation from C3A and its precipitationon the surface of the cement particles or in the pore solution is the main cause of the gradualloss of workability in cement pastes [68,69]. It was shown that ettringite is the main productduring self-hardening of wood fly ash from fluidized bed combustion having high Cacontent, while gypsum is formed as the main product in ashes with low Ca content [70,71].Increased reactivity of C3A caused by increased alkali content would also contribute toearly heat generation, resulting in increased temperature of fresh concrete [34,72].
3.2. Heat Generation
Measurements of heat output started 30–90 min after initial contact of cement andwater due to the time needed to perform tests on fresh concrete and, if necessary, theadditional time required to precondition the specimen so that the concrete temperatureis as close as possible to 23 ◦C. The temperatures measured in the hydrating specimensare plotted in Figure 6. The difference between initial and maximum temperatures hasbeen within 5–10 ◦C, with the lowest value found in mixture F5-45 and the highest value inmixture F6-15. The temperatures measured in the specimens are also representative of theheat flow from the specimen.
The results of heat generation measured on concrete mixtures containing WFA are pre-sented in Figure 6. The heat output is related to the mass of the whole system cement + WFA.Replacing 15% of the cement with WFA resulted in almost the same amount of heat lib-erated during the first 5 days for all 3 ash types (336 J/g, 335 J/g, and 334 J/g for F4, F5,and F6, respectively). Compared to the heat liberated from the mixture without WFA,this is a reduction of 2–3%. In the mixture containing 5% replacement of F6 ash, the totalheat liberated after five days increased by 2% compared to the mixture without WFA.Increasing the WFA content to 30% further reduced the amount of heat liberated by 10%and 17% for mixtures with F4 and F5 ash, respectively. Replacing 45% of the cement withash F5 reduced the amount of heat liberated by 26% over five days. Less emitted heatin calorimetric measurements can be explained by the fact that WFA has no binding orpozzolanic properties [42].
All the heat flow curves in Figure 6 have one significant peak separating the accelera-tion and deceleration periods of heat release. Replacement of cement with F4 and F5 ashesdecreased the peak value of heat flow. Furthermore, the higher the ash content, the largerreduction of heat generation is. At a 15% replacement level, these ashes had almost thesame effect on the heat flow. The difference in heat flow between the mixtures with F4 andF5 ashes appeared at a 30% replacement level, and it can be seen that in the mixtures madewith F5 ash, there is a larger delay in the peak heat flow and the slope of the curve decreases.Increasing the replacement level to 45% further delayed the hydration process. Effects onheat flow similar to those of ash F5 have been reported for mixtures of Portland cementand type C coal fly ash and have been attributed to the disruption of the aluminate-sulfatebalance in mixtures containing >20% fly ash [73]. Roszczynialski and Nocun-Wczelik [74]

Materials 2021, 14, 7164 13 of 22
also reported that low SO3 content relative to aluminate content produced a significantpeak after 13 h caused by aluminate hydrates. Ash F5 has a significantly higher ratio ofAl2O3 to SO3 than cement or both ash F4 and F6 (Table 1), so this could be the main causeof the changes in the course of early hydration in mixtures containing ash F5.
Materials 2021, 14, x FOR PEER REVIEW 14 of 24
(a) (b)
(c) (d)
(e) (f)
Figure 6. Temperature, heat flow, and cumulative heat measured on concrete specimens: (a,b) comparison between refer-
ence mix and mixes containing WFA F4; (c,d) comparison between reference mix and mixes containing WFA F5; (e,f)
comparison between reference mix and mixes containing WFA F6.
0
5
10
15
20
25
30
35
0
100
200
300
400
0 50 100 150
Tem
per
atu
re (
C)
Cu
mu
lati
ve
hea
t (J
/g)
Age, t (h)
CEM
F4-15
F4-30
0
2
4
6
0 8 16 24 32 40 48
Hea
t fl
ow
, q(m
W/g
)
Age, t (h)
CEM
F4-15
F4-30
10
15
20
25
30
35
0
100
200
300
400
0 50 100 150
Tem
per
atu
re (
C)
Cu
mu
lati
ve
hea
t (J
/g)
Age, t (h)
CEM
F5-15
F5-30
F5-45
0
2
4
6
0 8 16 24 32 40 48
Hea
t fl
ow
, q(m
W/g
)
Age, t (h)
CEM
F5-15
F5-30
F5-45
10
15
20
25
30
35
0
100
200
300
400
500
0 50 100 150
Tem
per
atu
re (
C)
Cu
mu
lati
ve
hea
t (J
/g)
Age, t (h)
CEM
F6-5
F6-15
0
2
4
6
0 8 16 24 32 40 48
Hea
t fl
ow
, q(m
W/g
)
Age, t (h)
CEM
F6-5
F6-15
Figure 6. Temperature, heat flow, and cumulative heat measured on concrete specimens: (a,b) comparison between referencemix and mixes containing WFA F4; (c,d) comparison between reference mix and mixes containing WFA F5; (e,f) comparisonbetween reference mix and mixes containing WFA F6.

Materials 2021, 14, 7164 14 of 22
Contrary to mixtures containing ash F4 and F5, mixtures containing ash F6 in bothreplacement levels had an increased rate of heat liberation compared to the referencemixture. It is well known that even inert mineral admixtures, when blended with cement,can accelerate hydration [44,63,75]. Two mechanisms are often used to explain this effect,which is usually referred to as the filler effect. When mineral admixture contains veryfine particles, extra surface area becomes available for nucleation of hydration products,resulting in a reduced thickness of impermeable C-S-H on C3S grains [67]. The secondmechanism is related to the increased w/c ratio caused by the replacement of the cement.Increasing the w/c ratio decreases the early kinetics, but the long-term degree of hydrationis increased as more water is available for hydration and at the same time there is morespace for hydration products [76]. Besides these two effects, additional water becomesavailable for hydration due to the filling effect already explained in the previous section.The increased cohesiveness of the fresh concrete, the reduced porosity (Table 3), and theincreased hydration rates found in mixtures with ash F6 (Figure 6e,f) can all be related tothe filler effect. The replacement of cement with ash F6 probably activates all three of theabove-mentioned mechanisms, while the effect of the filler in mixtures containing ash F4and F5 is limited to the effects of increased w/c ratio, due to their coarse particles.
Accelerated hydration which manifested through increased maximum rate of hy-dration or a shift of the hydration rate curve toward an earlier age, has been found inseveral papers dealing with biomass ash [34,42,77]. Rissanen et al. [34] tested fluidizedbed combustion of WFA milled to a PSD close to that of cement and found that at 10%cement replacement, the heat of hydration was higher than in the reference mortar mixture.Accelerated hydration of calcium hydrates in the presence of fly ash has been reported forcement paste with milled WFA, where 70% of the particles passed through 63µm sieve [42].The shift in the hydration rate curve for cement pastes with fly ash from the burning ofwheat and rice straws has been attributed to the high surface area of the specimens, thatcan act as nucleation sites [77].
3.3. Compressive Strength
Compressive strength was determined on four specimens from each mix. The average28-day compressive strength and standard deviation are given in Table 3. For both ash F4and F5, the compressive strength decreased with the increase of ash content in the concretebut for the mixtures with ash F6, the compressive strength increased with the increase ofash content. As already mentioned in Section 3.1, the replacement of cement with ash F6resulted in the densest particle packing which could be the main reason for the increase incompressive strength.
Figure 7 compares the average 28-day compressive strength of concrete with thecompressive strength of mortars made with 5%, 10%, and 15% cement replaced with ashesF4, F5, and F6 (results published in [35]). All mortar mixtures had the largest 28-daycompressive strength at 5% replacement of cement with WFA. Further increase in ashcontent resulted in a decrease in compressive strength. The compressive strength data inFigure 7 are plotted against the volume of WFA in the mixture instead of the percentageof cement replacement because mortar contains a larger volume of WFA than concretefor the same cement replacement due to the larger cement to aggregate ratio. The resultspresented in Figure 7 show that there is a good agreement between the compressive strengthdetermined on mortar and concrete. The results also indicate that the compressive strengthof concrete made with F4 and F5 ashes could be improved at a cement replacement level ofless than 15%.

Materials 2021, 14, 7164 15 of 22Materials 2021, 14, x FOR PEER REVIEW 17 of 24
(a)
(b)
(c)
Figure 7. Compressive strength and relative bulk density of concrete and mortar mixtures with different volumes of WFA: (a) ash F4, (b) ash F5; (c) ash F6 (CS—compressive strength, BD—bulk density, BDD—bulk dry density).
0.975
0.985
0.995
1.005
1.015
1.025
0
10
20
30
40
50
60
0 1 2 3 4 5 6 7
Rel
ativ
e bul
k de
nsit
y (−
)
Com
pres
sive
str
engt
h (M
Pa)
Volume of WFA (%)
Mortar-CS
Concrete-CS
Mortar-BD
Concrete-BDD
0.975
0.985
0.995
1.005
1.015
1.025
0
10
20
30
40
50
60
0 1 2 3 4 5 6 7
Rel
ativ
e bul
k de
nsit
y (−
)
Com
pres
sive
str
engt
h (M
Pa)
Volume of WFA (%)
Mortar-CSConcrete-CSMortar-BDConcrete - BDD
0.975
0.985
0.995
1.005
1.015
1.025
0
10
20
30
40
50
60
0 1 2 3 4 5 6 7
Rel
ativ
e bul
k de
nsit
y (−
)
Com
pres
sive
str
engt
h (M
Pa)
Volume of WFA (%)
Mortar-CSConcrete-CSMortar-BDConcrete-BDD
Figure 7. Compressive strength and relative bulk density of concrete and mortar mixtures withdifferent volumes of WFA: (a) ash F4, (b) ash F5; (c) ash F6 (CS—compressive strength, BD—bulkdensity, BDD—bulk dry density).

Materials 2021, 14, 7164 16 of 22
In Figure 7, the average bulk density is given along with the compressive strength dataand is expressed relative to the bulk density measured on the mixture without WFA. Thebulk density of the mortar is determined from the mass and dimensions of the specimensbefore the compressive strength test. The results show that the increase in bulk density isfollowed by an increase in compressive strength, indicating that the main contribution tothe increase in strength is related to the denser particle packing. An increase in compressivestrength in mixtures made with WFA has been achieved by additional milling of the ash,which resulted in a better particle size distribution [42,78].
The reduction in compressive strength in WFA concrete may also be related to decreasedaggregate content and the simultaneous incorporation of ash particles with lower stiffnessand strength into the cement matrix. The density of WFA is lower than the density of cement,so the same mass of WFA occupies a larger volume than cement. This results in a reductionin the volume of aggregates in mixtures containing WFA (see Table 2). Since aggregateshave greater strength and stiffness than WFA, their replacement by WFA weakens theconcrete structure. Grau et al. [79] analyzed the compressibility and shear modulus of woodash and mixtures of standardized quartz sand and wood ash. They found that wood ashhad higher compressibility than sand and consequently its incorporation into sand/ashmixtures increased the compressibility of the mixtures Yang et al. [57] attributed the decrease incompressive strength of concrete containing wood ash, to the incorporation of weak, unburnedcarbon particles into the cement matrix. Several investigations showed that an increase in theWFA content in concrete was accompanied by a decrease in strength [9,31,42,58,72,80].
The decrease in strength may also be related to the lower content of cementitiousmaterial when part of the cement is replaced by WFA, as its reactivity is lower than that ofthe cement. It has been observed that WFA from fluidized bed technology hardens whenmixed with water and reaches a 28-day compressive strength of up to 6 MPa [70,71]. Asignificant increase in compressive strength between 28 days and 1 year indicates a slowreaction [71]. Analysis of WFA-water mixtures showed that the main hydration products offluidized bed fly ash are ettringite and various Ca-Al phases [71]. By using XRD analysis of7 and 28 days aged hardened cement paste, it was found that the replacement of cement byWFA did not radically change the hydration products and that the changes were primarilyrelated to the species present in the WFA [34]. The contribution of pozzolanic reactions tostrength becomes significant after 7 or 28 days of hydration [81]. Therefore, the hydrationproducts of WFA are expected to be very limited in the period up to the 28-days.
Estimation of the potential reactivity of WFA is usually based on its chemical composition.Berra et al. [37] assumed that the hydraulic index, defined as (CaO + MgO + Al2O3)/SiO2,could serve as a good indicator of hydraulic activity when its value is >1. Rajamma et al. [72]expected that WFA that contained >25% of CaO would be able to react hydraulically.Sigvardsen et al. [82] expect that there would be little or no pozzolanic activity when theamount of primary oxides (SiO2 + Al2O3 + Fe2O3) is <25%. However, the sum of the pozzolanicoxides does not have to be directly proportional to their pozzolanic activity [31,37,42]. It waspointed out that selective dissolution is a good method for estimation of hardening propertiesof ash from fluidized bed combustion processes [71].
The hydraulic index of ashes F4, F5, and F6 from this study are 3.1, 0.8, and 3.9,respectively, which according to [37] indicates that ashes F4 and F6 can contribute tostrength mainly through hydraulic reaction. Fly ash F5 had the quantity of pozzolanicoxides >50% (Table 1) and its CaO-SiO2-Al2O3 ratio is close to that of coal fly ash (Figure 1),therefore it had the highest potential for pozzolanic reactivity. Compressive strength testson mortars up to 90 days of age containing ash F5 indicate that its pozzolanic activity is lowprobably due to its coarse particles [35]. Less emitted heat in calorimetric measurementscan be explained by the fact that WFA does not have binding or pozzolanic properties [42].The results of the calorimetric measurements (Figure 6) indicate that the F4 and F5 asheshave very low contribution to the strength development through chemical reactions duringthe first days of hydration.

Materials 2021, 14, 7164 17 of 22
3.4. Stiffness Development
The increase in UPV of longitudinal waves in early-aged concrete is related to theincrease in Youngs and shear modulus [83,84]. A comparison of UPV values measured atfour different ages is presented in Figure 8. The lowest UPV values have been measuredon specimens made from concrete containing the largest volume of WFA. Compared tothe UPV values measured on the reference mixture, the average decrease was 8% (F5-45)and 4% (mixtures with 30% cement replacement). These lower UPVs can be related to theincreased compressibility caused by the incorporation of particles with lower stiffness intothe cement matrix. In mixtures containing up to 15% WFA, the 28-day UPV value is within±2% of the value measured on the reference mixture.
Materials 2021, 14, x FOR PEER REVIEW 19 of 24
F5 ashes have very low contribution to the strength development through chemical reac-tions during the first days of hydration.
3.4. Stiffness Development The increase in UPV of longitudinal waves in early-aged concrete is related to the
increase in Youngs and shear modulus [83,84]. A comparison of UPV values measured at four different ages is presented in Figure 8. The lowest UPV values have been measured on specimens made from concrete containing the largest volume of WFA. Compared to the UPV values measured on the reference mixture, the average decrease was 8% (F5-45) and 4% (mixtures with 30% cement replacement). These lower UPVs can be related to the increased compressibility caused by the incorporation of particles with lower stiffness into the cement matrix. In mixtures containing up to 15% WFA, the 28-day UPV value is within ±2% of the value measured on the reference mixture.
After 24 h of curing, the largest UPV is measured in the concrete specimens made with ash F6. Compared to mixture M0, this increase is 3% in both mixtures F6-5 and F6-15. The accelerated stiffness development in mixture F6-15 continued in the time period from 24–48 h. Šiler et al. [85] attributed fast initial strength development and increased reactivity in mixtures of Portland cement and fluidized bed coal fly ash to the presence of free CaO. The F4 and F6 ashes had free CaO contents of 7.3% and 8.8%, respectively. The differences in the rates of heat evolution and UPV of mixtures containing ash F4 and F6 indicate that this effect had a very small impact on reactivity and stiffness development.
Figure 8. UPV measured on concrete specimens at 1, 2, 7 and 28 days of age.
During the first two days, the mixtures with 15% cement replaced by ash F4 and F5 exhibited slower stiffness development compared to the mixture M0. The results of UPV measurements during the first days of curing correspond well with the results of calorim-etry testing. Mixtures containing ash F6 showed an increased rate of heat generation so the accelerated stiffness development can be attributed to an improved hydration process. Mixtures made with ash F4 and F5 exhibited a decrease in heat generation rate so that fewer hydration products were formed within the first days of hydration and the stiffness development is slowed down accordingly.
Measurements over the 2–28-day period indicate that the addition of WFA changed the course of stiffness development. In the reference mixture, the period of 2–7 days shows the largest increase in UPV and a very low increase in UPV from 7–28 days. In mixtures with WFA, the increase in UPV is two to five times larger in the period of 7–28 days com-pared to the reference mixture. This could be due to the reactivity of ash with the species present in the pore solution.
3.5
4.0
4.5
5.0
5.5
M0 F4-15 F4-30 F5-15 F5-30 F5-45 F6-5 F6-15 F4-15 F4-30
UPV
(km
/s) 1 day
2 day
7 day
28 day
Figure 8. UPV measured on concrete specimens at 1, 2, 7 and 28 days of age.
After 24 h of curing, the largest UPV is measured in the concrete specimens madewith ash F6. Compared to mixture M0, this increase is 3% in both mixtures F6-5 and F6-15.The accelerated stiffness development in mixture F6-15 continued in the time period from24–48 h. Šiler et al. [85] attributed fast initial strength development and increased reactivityin mixtures of Portland cement and fluidized bed coal fly ash to the presence of free CaO.The F4 and F6 ashes had free CaO contents of 7.3% and 8.8%, respectively. The differencesin the rates of heat evolution and UPV of mixtures containing ash F4 and F6 indicate thatthis effect had a very small impact on reactivity and stiffness development.
During the first two days, the mixtures with 15% cement replaced by ash F4 andF5 exhibited slower stiffness development compared to the mixture M0. The results ofUPV measurements during the first days of curing correspond well with the results ofcalorimetry testing. Mixtures containing ash F6 showed an increased rate of heat generationso the accelerated stiffness development can be attributed to an improved hydration process.Mixtures made with ash F4 and F5 exhibited a decrease in heat generation rate so thatfewer hydration products were formed within the first days of hydration and the stiffnessdevelopment is slowed down accordingly.
Measurements over the 2–28-day period indicate that the addition of WFA changedthe course of stiffness development. In the reference mixture, the period of 2–7 days showsthe largest increase in UPV and a very low increase in UPV from 7–28 days. In mixtureswith WFA, the increase in UPV is two to five times larger in the period of 7–28 dayscompared to the reference mixture. This could be due to the reactivity of ash with thespecies present in the pore solution.
3.5. Apparent Porosity and Capillary Absorption
The average values of apparent porosity ranged from 12.4% to 14.5% (Table 3), whichis in agreement with the data obtained in [86] for concrete with a w/c ratio of 0.5. Specimensfrom mixtures containing ashes F4 and F5 with 15% and 30% replacement levels had only

Materials 2021, 14, 7164 18 of 22
slightly increased porosity compared to mixture M0. A significant increase in porositywas only present in specimens with 45% replacement with ash F5. An opposite effecton porosity was observed for specimens with ash F6, where porosity decreased with theincrease in cement replacement level. It was found that the incorporation of biomass fly ashincreased the pore content of C-S-H compared to the mixtures made with coal fly ash [87].The decrease in apparent porosity for mixtures with ash F6 was most likely caused by therefinement of pores in cement paste due to improved particle packing.
The average values of water intake into the specimens due to capillary absorptionare presented in Figure 9. The capillary absorption coefficient for each mixture wascalculated and presented in Table 3. The capillary absorption coefficient was calculatedusing the average slope of the water intake curve over the period 120–1500 min. The initial120 min of measurement was excluded from regression analysis to reduce the impact ofnonlinearities contained in the first period of measurement on the value of the coefficientof capillary absorption. The capillary absorption coefficient and its standard deviationshow that the replacement of cement with ash F4 and F5 had no significant influence oncapillary absorption, regardless of the amount of cement replacement. Only in mixturesmade with ash F6 the capillary absorption coefficient was significantly decreased. Like allfluid transport processes through concrete, the rate of sorption is governed by the poresystem [56,59]. Therefore, the reduction in sorption rate can be related to the reducedporosity due to the addition of ash F6.
Materials 2021, 14, x FOR PEER REVIEW 20 of 24
3.5. Apparent Porosity and Capillary Absorption The average values of apparent porosity ranged from 12.4% to 14.5% (Table 3), which
is in agreement with the data obtained in [86] for concrete with a w/c ratio of 0.5. Speci-mens from mixtures containing ashes F4 and F5 with 15% and 30% replacement levels had only slightly increased porosity compared to mixture M0. A significant increase in poros-ity was only present in specimens with 45% replacement with ash F5. An opposite effect on porosity was observed for specimens with ash F6, where porosity decreased with the increase in cement replacement level. It was found that the incorporation of biomass fly ash increased the pore content of C-S-H compared to the mixtures made with coal fly ash [87]. The decrease in apparent porosity for mixtures with ash F6 was most likely caused by the refinement of pores in cement paste due to improved particle packing.
The average values of water intake into the specimens due to capillary absorption are presented in Figure 9. The capillary absorption coefficient for each mixture was calculated and presented in Table 3. The capillary absorption coefficient was calculated using the average slope of the water intake curve over the period 120–1500 min. The initial 120 min of measurement was excluded from regression analysis to reduce the impact of nonline-arities contained in the first period of measurement on the value of the coefficient of ca-pillary absorption. The capillary absorption coefficient and its standard deviation show that the replacement of cement with ash F4 and F5 had no significant influence on capil-lary absorption, regardless of the amount of cement replacement. Only in mixtures made with ash F6 the capillary absorption coefficient was significantly decreased. Like all fluid transport processes through concrete, the rate of sorption is governed by the pore system [56,59]. Therefore, the reduction in sorption rate can be related to the reduced porosity due to the addition of ash F6.
Figure 9. Results of capillary water absorption measurement.
4. Conclusions The chemical and physical properties of WFA are largely influenced by combustion
technology, the type and parts of wood used as fuel, and local operating conditions. The incorporation of WFA in concrete as a partial cement replacement can have a large impact on the fresh and hardened concrete properties. Mixtures made with WFA F6 with a par-ticle size distribution close to that of cement exhibited increased cohesivity, which in turn reduced slump and required more energy for compaction of concrete. At the same time, this type of ash accelerated hydration and stiffness development. The increased cohesive-ness of the fresh concrete resulted in concrete with a denser structure and lower porosity,
0
1
2
3
4
5
6
7
0 1 2 3 4 5 6
Wat
er in
take
(kg/
m2 )
Square root of time (h0.5)
CEM
F4-15
F4-30
F5-15
F5-30
F5-45
F6-5
F6-15
Figure 9. Results of capillary water absorption measurement.
4. Conclusions
The chemical and physical properties of WFA are largely influenced by combustiontechnology, the type and parts of wood used as fuel, and local operating conditions. Theincorporation of WFA in concrete as a partial cement replacement can have a large impacton the fresh and hardened concrete properties. Mixtures made with WFA F6 with aparticle size distribution close to that of cement exhibited increased cohesivity, which inturn reduced slump and required more energy for compaction of concrete. At the sametime, this type of ash accelerated hydration and stiffness development. The increasedcohesiveness of the fresh concrete resulted in concrete with a denser structure and lowerporosity, which had a positive influence on the compressive strength and permeability.All these effects can be explained by the filler and filling mechanisms. Mixtures madewith WFA F4 that had a similar chemical composition to ash F6 but consisted of coarserparticles showed no evidence of the filler effect mechanisms. This suggests that governingmechanisms introduced by the cement replacement with fly ash are connected to thephysical interactions between the phases.

Materials 2021, 14, 7164 19 of 22
When WFA is used as a cement replacement, the workability of the concrete is in-fluenced by the quantity, porosity, and particle size distribution of the WFA. The waterdemand of the concrete is balanced by the amount of water adsorbed by the WFA particlesand the amount of released entrapped water due to the filling effect. The results obtainedon mixtures containing F4 and F6 ashes indicate that there may be an optimum content ofWFA at which the water demand could be reduced. Increasing the WFA content beyondthe optimum will increase the quantity of water required to achieve targeted workability.
The research presented shows that replacing up to 45% of the cement with WFAhas very little effect on capillary absorption and can give concrete with a sufficientlyhigh compressive strength to be suitable for construction purposes. Therefore, from thestandpoint of thinking of concrete as storage for large quantities of WFA produced, it seemsthat the construction industry can give a large contribution in this area by using it as a fillermaterial rather than as a cement replacement.
Author Contributions: Conceptualization, methodology, formal analysis, investigation, I.G., M.J.R.and N.Š.; writing—original draft preparation, I.G.; writing—review and editing, I.G., M.J.R. and N.Š.;visualization, I.G.; project administration, funding acquisition, N.Š. All authors have read and agreedto the published version of the manuscript.
Funding: This research was performed as a part of the research project IP-2016-06-7701 ‘Transfor-mation of Wood Biomass Ash into Resilient Construction Composites’, which was funded by theCroatian Science Foundation.
Institutional Review Board Statement: Not applicable.
Informed Consent Statement: Not applicable.
Data Availability Statement: Not applicable.
Conflicts of Interest: The authors declare no conflict of interest.
References1. Scarlat, N.; Dallemand, J.; Taylor, N.; Banja, M. Brief on Biomass for Energy in the European Union; Sanchez Lopez, J., Av-raamides, M.,
Eds.; Publications Office of the European Union: Luxembourg, 2019.2. Directorate-General for Energy (European Commission), Navigant. Technical Assistance in Realisation of the 5th Report on Progress of
Renewable Energy in the EU. Analysis of Bioenergy Supply and Demand in the EU (Task 3): Final Report; Publications Office of theEuropean Union: Luxembourg, 2020.
3. Vassilev, S.V.; Baxter, D.; Andersen, L.K.; Vassileva, C.G. An overview of the chemical composition of biomass. Fuel 2010, 89,913–933. [CrossRef]
4. Carevic, I.; Serdar, M.; Štirmer, N.; Ukrainczyk, N. Preliminary screening of wood biomass ashes for partial resources replacementsin cementitious materials. J. Clean. Prod. 2019, 229, 1045–1064. [CrossRef]
5. World Bioenergy Association. Global Bioenergy Statistics 2020; World Bioenergy Association: Stockholm, Sweden, 2020.6. Obernberger, I.; Supancic, K. Possibilities of Ash Utilisation from Biomass Combustion Plants. In Proceedings of the 17th
European Biomass Conference and Exhibition, Hamburg, Germany, 29 June–3 July 2009; pp. 2372–2384.7. Vassilev, S.V.; Baxter, D.; Andersen, L.K.; Vassileva, C.G. An overview of the composition and application of biomass ash: Part 2.
Potential utilisation, technological and ecological advantages and challenges. Fuel 2013, 105, 19–39. [CrossRef]8. Knapp, B.A.; Insam, H. Recycling of Biomass Ashes: Current Technologies and Future Research Needs. In Recycling of Biomass
Ashes; Springer: Singapore, 2011; pp. 1–16.9. Cheah, C.B.; Ramli, M. Mechanical strength, durability and drying shrinkage of structural mortar containing HCWA as partial
replacement of cement. Constr. Build. Mater. 2012, 30, 320–329. [CrossRef]10. Maresca, A.; Hyks, J.; Astrup, T. Recirculation of biomass ashes onto forest soils: Ash composition, mineralogy and leaching
properties. Waste Manag. 2017, 70, 127–138. [CrossRef] [PubMed]11. Agrela, F.; Cabrera, M.; Morales, M.M.; Zamorano, M.; Alshaaer, M. Biomass fly ash and biomass bottom ash. In New Trends in
Eco-Efficient and Recycled Concrete; Woodhead Publishing: Sawston, UK, 2018; pp. 23–58, ISBN 9780081024805.12. Pettersson, M.; Björnsson, L.; Börjesson, P. Recycling of ash from co-incineration of waste wood and forest fuels: An overlooked
challenge in a circular bioenergy system. Biomass Bioenergy 2020, 142, 105713. [CrossRef]13. Karltun, E.; Saarsalmi, A.; Ingerslev, M.; Mandre, M.; Andersson, S.; Gaitnieks, T.; Ozolincius, R.; Varnagiryte-Kabasinskiene, I.
Wood Ash Recycling—Possibilities and Risks. In Compatible Forest Management; Springer: Singapore, 2008; pp. 79–108.14. Cheah, C.B.; Ramli, M. The implementation of wood waste ash as a partial cement replacement material in the production of
structural grade concrete and mortar: An overview. Resour. Conserv. Recycl. 2011, 55, 669–685. [CrossRef]

Materials 2021, 14, 7164 20 of 22
15. Teixeira, E.; Camões, A.; Branco, F. Valorisation of wood fly ash on concrete. Resour. Conserv. Recycl. 2019, 145, 292–310. [CrossRef]16. Rozhina, E.; Ishmukhametov, I.; Nigamatzyanova, L.; Akhatova, F.; Batasheva, S.; Taskaev, S.; Montes, C.; Lvov, Y.; Fakhrullin, R.
Comparative Toxicity of Fly Ash: An In Vitro Study. Molrecules 2021, 26, 1926. [CrossRef] [PubMed]17. Milovanovic, B.; Štirmer, N.; Carevic, I.; Baricevic, A. Wood biomass ash as a raw material in concrete industry. J. Croat. Assoc. Civ.
Eng. 2019, 71, 505–514. [CrossRef]18. James, A.K.; Thring, R.W.; Helle, S.; Ghuman, H.S. Ash Management Review—Applications of Biomass Bottom Ash. Energies
2012, 5, 3856–3873. [CrossRef]19. Teixeira, E.R.; Mateus, R.; Camões, A.; Bragança, L.; Branco, F.G. Comparative environmental life-cycle analysis of concretes
using biomass and coal fly ashes as partial cement replacement material. J. Clean. Prod. 2016, 112, 2221–2230. [CrossRef]20. Gupt, C.B.; Bordoloi, S.; Sekharan, S.; Sarmah, A.K. A feasibility study of Indian fly ash-bentonite as an alternative adsorbent
composite to sand-bentonite mixes in landfill liner. Environ. Pollut. 2020, 265, 114811. [CrossRef]21. Kuznia, M.; Magiera, A.; Zygmunt-Kowalska, B.; Kaczorek-Chrobak, K.; Pielichowska, K.; Szatkowski, P.; Benko, A.; Ziabka,
M.; Jerzak, W. Fly Ash as an Eco-Friendly Filler for Rigid Polyurethane Foams Modification. Mateials 2021, 14, 6604. [CrossRef][PubMed]
22. Fusade, L.; Viles, H.; Wood, C.; Burns, C. The effect of wood ash on the properties and durability of lime mortar for repointingdamp historic buildings. Constr. Build. Mater. 2019, 212, 500–513. [CrossRef]
23. Ekinci, A.; Hanafi, M.; Aydin, E. Strength, Stiffness, and Microstructure of Wood-Ash Stabilized Marine Clay. Minerals 2020, 10, 796.[CrossRef]
24. Longo, F.; Cascardi, A.; Lassandro, P.; Aiello, M. A New Fabric Reinforced Geopolymer Mortar (FRGM) with Mechanical and EnergyBenefits. Fibers 2020, 8, 49. [CrossRef]
25. Longo, F.; Cascardi, A.; Lassandro, P.; Aiello, M.A. Energy and seismic drawbacks of masonry: A unified retrofitting solution. J.Build. Pathol. Rehabil. 2021, 6, 1–24. [CrossRef]
26. Rajabipour, F.; Zahedi, M.; Kaladharan, G. Evaluating the Performance and Feasibility of Using Recovered Fly Ash and Fluidized Bed Combustion(FBC) Fly Ash as Concrete Pozzolan; Final Project Report; The Pennsylvania State University: University Park, PA, USA, 2020.
27. Thy, P.; Jenkins, B.; Grundvig, S.; Shiraki, R.; Lesher, C. High temperature elemental losses and mineralogical changes in commonbiomass ashes. Fuel 2006, 85, 783–795. [CrossRef]
28. Li, X.-G.; Chen, Q.-B.; Huang, K.-Z.; Ma, B.-G.; Wu, B. Cementitious properties and hydration mechanism of circulating fluidizedbed combustion (CFBC) desulfurization ashes. Constr. Build. Mater. 2012, 36, 182–187. [CrossRef]
29. Vassilev, S.V.; Baxter, D.; Andersen, L.K.; Vassileva, C.G. An overview of the composition and application of biomass ash. Part 1.Phase–mineral and chemical composition and classification. Fuel 2013, 105, 40–76. [CrossRef]
30. Ukrainczyk, N.; Vrbos, N.; Koenders, E.A.B. Reuse of Woody Biomass Ash Waste in Cementitious Materials. Chem. Biochem. Eng.Q. 2016, 30, 137–148. [CrossRef]
31. Wang, S.; Miller, A.; Llamazos, E.; Fonseca, F.; Baxter, L. Biomass fly ash in concrete: Mixture proportioning and mechanicalproperties. Fuel 2008, 87, 365–371. [CrossRef]
32. EN 450-1. Fly Ash for Concrete—Part 1: Definition, Specifications and Conformity Criteria; European Committee for Standardization(CEN): Brussels, Belgium, 2012.
33. Maschio, S.; Tonello, G.; Piani, L.; Furlani, E. Fly and bottom ashes from biomass combustion as cement replacing components inmortars production: Rheological behaviour of the pastes and materials compression strength. Chemosphere 2011, 85, 666–671.[CrossRef] [PubMed]
34. Rissanen, J.; Ohenoja, K.; Kinnunen, P.; Illikainen, M. Partial Replacement of Portland-Composite Cement by Fluidized BedCombustion Fly Ash. J. Mater. Civ. Eng. 2017, 29, 04017061. [CrossRef]
35. Carevic, I.; Baricevic, A.; Štirmer, N.; Šantek Bajto, J. Correlation between physical and chemical properties of wood biomass ashand cement composites performances. Constr. Build. Mater. 2020, 256, 119450. [CrossRef]
36. Rajamma, R.; Senff, L.; Ribeiro, M.; Labrincha, J.; Ball, R.; Allen, G.; Ferreira, V. Biomass fly ash effect on fresh and hardened stateproperties of cement based materials. Compos. Part B Eng. 2015, 77, 1–9. [CrossRef]
37. Berra, M.; Mangialardi, T.; Paolini, A.E. Reuse of woody biomass fly ash in cement-based materials. Constr. Build. Mater. 2015, 76,286–296. [CrossRef]
38. Lazik, P.R.; Bošnjak, J.; Cetin, E.; Kücük, A. Application of wood ash as a substitute for fly ash and investigation of concreteproperties. Otto Graf J. 2020, 19, 103–118.
39. Tulashie, S.K.; Dapaah, S.; Mensah, D.; Appiah, N. Palm fiber ash as a supplementary cementitious material for the production ofmortar prism. Innov. Infrastruct. Solutions 2021, 7, 1–10. [CrossRef]
40. Carevic, I.; Štirmer, N.; Serdar, M.; Ukrainczyk, N. Effect of Wood Biomass Ash Storage on the Properties of Cement Composites.Materials 2021, 14, 1632. [CrossRef]
41. Šantek Bajto, J.; Štirmer, N.; Cerkovic, S.; Carevic, I.; Kostanic Juric, K. Pilot Scale Production of Precast Concrete Elements withWood Biomass Ash. Materials 2021, 14, 6578. [CrossRef]
42. Kaminskas, R.; Cesnauskas, V. Influence of activated biomass fly ash on portland cement hydration. Ceram. Silik. 2014, 58,260–268.
43. Van Loo, S.; Koppejan, J. (Eds.) The Handbook of Biomass Combustion and Co-Firing; Earthscan: London, UK, 2008.

Materials 2021, 14, 7164 21 of 22
44. Lothenbach, B.; Scrivener, K.; Hooton, R.D. Supplementary cementitious materials. Cem. Concr. Res. 2011, 41, 1244–1256.[CrossRef]
45. ASTM C618-19. Standard Specification for Coal Fly Ash and Raw or Calcined Natural Pozzolan for Use in Concrete; ASTM International:West Conshohocken, PA, USA, 2019.
46. ISO/TS 16996 Solid Biofuels—Determination of Elemental Composition by X-Ray Fluorescence; International Organization for Standard-ization (ISO): Geneva, Switzerland, 2015.
47. ASTM D7348-13. Standard Test Methods for Loss on Ignition (LOI) of Solid Combustion Residues; ASTM International: West Conshohocken,PA, USA, 2013.
48. ASTM C188-17. Standard Test Method for Density of Hydraulic Cement; ASTM International: West Conshohocken, PA, USA, 2017.49. EN 12176. Characterization of Sludge—Determination of pH-Value; European Committee for Standardization (CEN): Brussels,
Belgium, 2005.50. EN 197-1. Cement Part 1: Composition, Specifications and Conformity Criteria for Common Cements; European Committee for
Standardization (CEN): Brussels, Belgium, 2011.51. EN 480-1. Admixtures for Concrete, Mortar and Grout—Test Methods—Part 1: Reference Concrete and Reference Mortar for Testing;
European Committee for Standardization (CEN): Brussels, Belgium, 2014.52. EN 12350-2. Testing Fresh Concrete—Part 2: Slump-Test; European Committee for Standardization (CEN): Brussels, Belgium, 2019.53. EN 12350-6. Testing Fresh Concrete—Part 6: Density; European Committee for Standardization (CEN): Brussels, Belgium, 2019.54. EN 12350-7. Testing Fresh Concrete—Part 7: Air Content—Pressure Methods; European Committee for Standardization (CEN):
Brussels, Belgium, 2019.55. EN 12390-3. Testing Hardened Concrete—Part 3: Compressive Strength of Test Specimens; European Committee for Standardization
(CEN): Brussels, Belgium, 2019.56. Mehta, P.K.; Monteiro, P.J.M. Concrete Microstructure, Properties, and Materials, 3rd ed.; The McGraw-Hill Companies: New York,
NY, USA, 2006.57. Yang, Z.; Huddleston, J.; Brown, H. Effects of wood ash on properties of concrete and flowable fill. J. Mater. Sci. Chem. Eng. 2016,
4, 101–114. [CrossRef]58. Elinwa, A.U.; Mahmood, Y.A. Ash from timber waste as cement replacement material. Cem. Concr. Compos. 2002, 24, 219–222.
[CrossRef]59. Neville, A.M. Properties of Concrete, Fourth and Final Edition; Pearson Education Limited: Essex, UK, 2004.60. Ramachandran, V.S. (Ed.) Concrete Admixtures Handbook: Properties, Science and Technology, 2nd ed.; Noyes Publication: Saddle
River, NJ, USA, 1995.61. Wesche, K. (Ed.) Report of Technical Committee 67-FAB Use of Fly Ash in Building RILEM, Fly Ash in Concrete Properties and Performance;
E&FN SPON: London, UK, 1991.62. Sakai, E.; Masuda, K.; Kakinuma, Y.; Aikawa, Y. Effects of Shape and Packing Density of Powder Particles on the Fluidity of
Cement Pastes with Limestone Powder. J. Adv. Concr. Technol. 2009, 7, 347–354. [CrossRef]63. Oey, T.; Kumar, A.; Bullard, J.W.; Neithalath, N.; Sant, G. The Filler Effect: The Influence of Filler Content and Surface Area on
Cementitious Reaction Rates. J. Am. Ceram. Soc. 2013, 96, 1978–1990. [CrossRef]64. Garboczi, E.; Bullard, J. Shape analysis of a reference cement. Cem. Concr. Res. 2004, 34, 1933–1937. [CrossRef]65. Chen-Tan, N.W.; Van Riessen, A.; Ly, C.V.; Southam, D.C. Determining the Reactivity of a Fly Ash for Production of Geopolymer.
J. Am. Ceram. Soc. 2009, 92, 881–887. [CrossRef]66. Skripkiunas, G.; Macijauskas, M.; Nagrockiene, D.; Daugela, A. The Influence of Biomass Fly Ash on the Plasticizing Effects in
Cement Pastes. Procedia Eng. 2017, 172, 1015–1022. [CrossRef]67. Lea’s Chemistry of Cement and Concrete, 4th ed.; Butterworth-Heinemann: Oxford, UK, 2003.68. Jakob, C.; Jansen, D.; Ukrainczyk, N.; Koenders, E.; Pott, U.; Stephan, D.; Neubauer, J. Relating Ettringite Formation and Rheolog-
ical Changes during the Initial Cement Hydration: A Comparative Study Applying XRD Analysis, Rheological Measurementsand Modeling. Materials 2019, 12, 2957. [CrossRef] [PubMed]
69. Winnefeld, F.; Zingg, A.; Holzer, L.; Pakusch, J.; Becker, S. The Ettringite-Superplasticizer Interaction and Its Impact on theEttringite Distribution in Cement Suspensions. 2009. Available online: https://www.dora.lib4ri.ch/empa/islandora/object/empa:8767 (accessed on 10 October 2021).
70. Illikainen, M.; Tanskanen, P.; Kinnunen, P.; Körkkö, M.; Peltosaari, O.; Wigren, V.; Österbacka, J.; Talling, B.; Niinimäki, J.Reactivity and self-hardening of fly ash from the fluidized bed combustion of wood and peat. Fuel 2014, 135, 69–75. [CrossRef]
71. Ohenoja, K.; Tanskanen, P.; Wigren, V.; Kinnunen, P.; Körkkö, M.; Peltosaari, O.; Österbacka, J.; Illikainen, M. Self-hardening of flyashes from a bubbling fluidized bed combustion of peat, forest industry residuals, and wastes. Fuel 2016, 165, 440–446. [CrossRef]
72. Rajamma, R.; Ball, R.; Tarelho, L.A.D.C.; Allen, G.C.; Labrincha, J.; Ferreira, V.M. Characterisation and use of biomass fly ash incement-based materials. J. Hazard. Mater. 2009, 172, 1049–1060. [CrossRef] [PubMed]
73. Oey, T.; Timmons, J.; Stutzman, P.; Bullard, J.W.; Balonis, M.; Bauchy, M.; Sant, G. An improved basis for characterizing thesuitability of fly ash as a cement replacement agent. J. Am. Ceram. Soc. 2017, 100, 4785–4800. [CrossRef]
74. Roszczynialski, W.; Nocun-Wczelik, W. Studies of cementitious systems with new generation by-products from fluidised bedcombustion. J. Therm. Anal. Calorim. 2004, 77, 151–158. [CrossRef]
75. Moosberg-Bustnes, H.; Lagerblad, B.; Forssberg, E. The function of fillers in concrete. Mater. Struct. 2004, 37, 74–81. [CrossRef]

Materials 2021, 14, 7164 22 of 22
76. Wadsö, L.; Winnefeld, F.; Riding, K.; Sandberg, P. Calorimetry. In A Practical Guide to Microstructural Analysis of CementitiousMaterials; Scrivener, K., Snellings, R., Lothenbach, B., Eds.; CRC Press: Boca Raton, FL, USA, 2016; pp. 37–74.
77. Ataie, F.F.; Riding, K.A. Influence of agricultural residue ash on early cement hydration and chemical admixtures adsorption.Constr. Build. Mater. 2016, 106, 274–281. [CrossRef]
78. Ohenoja, K.; Tanskanen, P.; Peltosaari, O.; Wigren, V.; Österbacka, J.; Illikainen, M. Effect of particle size distribution on theself-hardening property of biomass-peat fly ash from a bubbling fluidized bed combustion. Fuel Process. Technol. 2016, 148, 60–66.[CrossRef]
79. Grau, F.; Choo, H.; Hu, J.W.; Jung, J. Engineering Behavior and Characteristics of Wood Ash and Sugarcane Bagasse Ash. Mater.2015, 8, 6962–6977. [CrossRef] [PubMed]
80. Udoeyo, F.F.; Inyang, H.; Young, D.T.; Oparadu, E.E. Potential of Wood Waste Ash as an Additive in Concrete. J. Mater. Civ. Eng.2006, 18, 605–611. [CrossRef]
81. Lawrence, P.; Cyr, M.; Ringot, E. Mineral admixtures in mortars effect of type, amount and fineness of fine constituents oncompressive strength. Cem. Concr. Res. 2005, 35, 1092–1105. [CrossRef]
82. Sigvardsen, N.M.; Kirkelund, G.M.; Jensen, P.E.; Geiker, M.R.; Ottosen, L.M. Impact of production parameters on physiochemicalcharacteristics of wood ash for possible utilisation in cement-based materials. Resour. Conserv. Recycl. 2019, 145, 230–240.[CrossRef]
83. Landau, L.D.; Lifschitz, E.M. Theory of Elasticity, Vol. 7 of Course of Theoretical Physics, 3rd ed.; Pergamon Press: Oxford, UK, 1986.84. Gabrijel, I.; Staquet, S.; Krüger, M.; Carette, J.; Grosse, C.U.; Trtnik, G. Ultrasonic Techniques for Determination and Monitoring
Various Properties of Cementitious Materials at Early Ages. In Seismic Structural Health Monitoring; Springer: Singapore, 2020;pp. 23–68.
85. Šiler, P.; Bayer, P.; Sehnal, T.; Kolárová, I.; Opravil, T.; Šoukal, F. Effects of high-temperature fly ash and fluidized bed combustionash on the hydration of Portland cement. Constr. Build. Mater. 2015, 78, 181–188. [CrossRef]
86. Safiuddin, M.; Hearn, N. Comparison of ASTM saturation techniques for measuring the permeable porosity of concrete. Cem.Concr. Res. 2005, 35, 1008–1013. [CrossRef]
87. Tkaczewska, E.; Małolepszy, J. Hydration of coal–biomass fly ash cement. Constr. Build. Mater. 2009, 23, 2694–2700. [CrossRef]