
Remediation of industrial brine using coal-combustion fly ash and Co2
9
Remediation of industrial brine using coal-combustion fly ash and Co 2 Grace N. Muriithi a, ⁎, Leslie F. Petrik b , Frédéric J. Doucet c a Maseno University, Private Bag, Maseno, Kenya b Environmental Nano Sciences Research Group, University of the Western Cape, Private Bag X17, Bellville 7535, South Africa c Council for Geoscience, 280 Pretoria Street, Silverton, Private Bag X112, Pretoria 0001, South Africa HIGHLIGHTS • Remediation of waste brine by mineral carbonation of fly ash • SO 4 , Na, NO 3 and Pb among elements reduced with treatment • Calcite and dolomite among minerals predicted to form abstract article info Article history: Received 8 July 2013 Received in revised form 28 August 2014 Accepted 30 August 2014 Available online xxxx Keywords: Brine Fly ash McNemar test Geochemical modeling Speciation A protocol is proposed whereby waste fly ash and CO 2 emissions from coal fired power plants are utilized in remediating brine waste. The solid residues generated may be used as mine backfill since they consist mainly of benign calcium carbonate. Following treatment with fly ash and CO 2 , over 99% removal of NO 3 − was achieved while B 3+ ,V 2+ , MO 2+ and Cl − concentrations increased. Major element removal from brine upon carbonation was as follows: Na + (15–29%), Mg 2+ (53–87%), K + (70–88%), Ca 2+ (40–73%) and SO 4 2− (12–36%). Speciation modeling of the major elements present in brine showed that Na + ,K + and Cl − exist mainly as free ions while Mg 2+ and Ca 2+ are associated with SO 4 2− as well as being in their free forms. SO 4 2− ions were present in its free form to a great extent as well as associated with Na + , Ca 2+ , Mg 2+ and K + respectively, in a decreasing order. Co-treatment of brine using FA and CO 2 may therefore be a potent brine remediation protocol which can be optimized for maximum removal of various elements. © 2014 Elsevier B.V. All rights reserved. 1. Introduction Saline effluents, also known as brines, are a direct consequence of the drive to recover water through desalination. Although much prog- ress into desalination techniques has been made over the past decade, concentrated saline effluents still present a major challenge in finding sustainable treatment and disposal methods [16]. Increasing volumes of polluted domestic, industrial and agricultural waste water are exerting immense pressure on water resources worldwide. Surface and underground water supplies are limited, especially in countries such as South Africa where the average annual rainfall is half that of the world average [16]. One of the obvious answers to conserving this important resource is by recycling and reusing domestic and industrial waste water. This has led to the production of water suitable for various applications ranging from irrigation and domestic use, to boiler feed for power generators. Brines generated in industrial applications such as power generation are pollutants which must be disposed of safely to avoid environmental pollution and to abide by the principles of sustainable development. Since brines contain high salt loads, the salts can leach into ground water if discharged accidentally thus leading to contamination [15]. Various studies have focussed upon investigating fly ash (FA) applica- tion for environmental remediation [5,10] specifically in mine water remediation. In this study, fly ash application in the remediation of brine is presented as brine problem is prevalent in power stations, water reclamation plants as well as other industrial outfits. This study thus seeks to investigate the feasibility of applying FA and CO 2 in the remediation of waste brine and to model the experimental system. Several ions present in brine are capable of reacting with CO 2 leading to the formation of carbonates such as calcite, magnesite, siderite and dolomite ([15]; Soong et al., [21]). These carbonates have the capac- ity to encapsulate major elements from brine, to sequester CO 2 , and to trap within their matrix trace elements present in brine leading to clean- er brine effluents. The so formed carbonates can be utilized to backfill mine voids as they are environmentally benign. Indeed, Lackner [9] alluded to the incorporation of solid carbonate disposal to mining opera- tions. This proposed route should serve a threefold purpose; clean-up of brine waste waters, waste FA utilization, and capture of CO 2 emissions from power stations as mineral carbonates. Desalination 353 (2014) 30–38 ⁎ Corresponding author. Tel.: +254 722548700. E-mail addresses: [email protected], [email protected] (G.N. Muriithi). http://dx.doi.org/10.1016/j.desal.2014.08.024 0011-9164/© 2014 Elsevier B.V. All rights reserved. Contents lists available at ScienceDirect Desalination journal homepage: www.elsevier.com/locate/desal
-
Upload
geoscience -
Category
Documents
-
view
0 -
download
0
Transcript of Remediation of industrial brine using coal-combustion fly ash and Co2
Desalination 353 (2014) 30–38
Contents lists available at ScienceDirect
Desalination
j ourna l homepage: www.e lsev ie r .com/ locate /desa l
Remediation of industrial brine using coal-combustion fly ash and Co2
Grace N. Muriithi a,⁎, Leslie F. Petrik b, Frédéric J. Doucet ca Maseno University, Private Bag, Maseno, Kenyab Environmental Nano Sciences Research Group, University of the Western Cape, Private Bag X17, Bellville 7535, South Africac Council for Geoscience, 280 Pretoria Street, Silverton, Private Bag X112, Pretoria 0001, South Africa
H I G H L I G H T S
• Remediation of waste brine by mineral carbonation of fly ash• SO4, Na, NO3 and Pb among elements reduced with treatment• Calcite and dolomite among minerals predicted to form
⁎ Corresponding author. Tel.: +254 722548700.E-mail addresses: [email protected], gmuriithi@m
http://dx.doi.org/10.1016/j.desal.2014.08.0240011-9164/© 2014 Elsevier B.V. All rights reserved.
a b s t r a c t
a r t i c l e i n f oArticle history:Received 8 July 2013Received in revised form 28 August 2014Accepted 30 August 2014Available online xxxx
Keywords:BrineFly ashMcNemar testGeochemical modelingSpeciation
A protocol is proposed whereby waste fly ash and CO2 emissions from coal fired power plants are utilized inremediating brine waste. The solid residues generated may be used as mine backfill since they consist mainlyof benign calcium carbonate. Following treatment with fly ash and CO2, over 99% removal of NO3
− was achievedwhile B3+, V2+, MO2+ and Cl− concentrations increased. Major element removal from brine upon carbonationwas as follows: Na+ (15–29%), Mg2+ (53–87%), K+ (70–88%), Ca2+ (40–73%) and SO4
2− (12–36%). Speciationmodeling of the major elements present in brine showed that Na+, K+ and Cl− exist mainly as free ions whileMg2+ and Ca2+ are associated with SO4
2− as well as being in their free forms. SO42− ions were present in its
free form to a great extent as well as associated with Na+, Ca2+, Mg2+ and K+ respectively, in a decreasingorder. Co-treatment of brine using FA and CO2 may therefore be a potent brine remediation protocol whichcan be optimized for maximum removal of various elements.
© 2014 Elsevier B.V. All rights reserved.
1. Introduction
Saline effluents, also known as brines, are a direct consequence ofthe drive to recover water through desalination. Although much prog-ress into desalination techniques has been made over the past decade,concentrated saline effluents still present a major challenge in findingsustainable treatment and disposal methods [16]. Increasing volumesof polluted domestic, industrial and agricultural waste water areexerting immense pressure on water resources worldwide. Surfaceand underground water supplies are limited, especially in countriessuch as South Africa where the average annual rainfall is half that ofthe world average [16]. One of the obvious answers to conserving thisimportant resource is by recycling and reusing domestic and industrialwaste water. This has led to the production of water suitable for variousapplications ranging from irrigation and domestic use, to boiler feed forpower generators.
Brines generated in industrial applications such as power generationare pollutants whichmust be disposed of safely to avoid environmental
aseno.ac.ke (G.N. Muriithi).
pollution and to abide by the principles of sustainable development.Since brines contain high salt loads, the salts can leach into groundwater if discharged accidentally thus leading to contamination [15].Various studies have focussed upon investigating fly ash (FA) applica-tion for environmental remediation [5,10] specifically in mine waterremediation. In this study, fly ash application in the remediation ofbrine is presented as brine problem is prevalent in power stations,water reclamation plants as well as other industrial outfits.
This study thus seeks to investigate the feasibility of applying FA andCO2 in the remediation of waste brine and to model the experimentalsystem. Several ions present in brine are capable of reacting with CO2
leading to the formation of carbonates such as calcite, magnesite, sideriteand dolomite ([15]; Soong et al., [21]). These carbonates have the capac-ity to encapsulate major elements from brine, to sequester CO2, and totrapwithin their matrix trace elements present in brine leading to clean-er brine effluents. The so formed carbonates can be utilized to backfillmine voids as they are environmentally benign. Indeed, Lackner [9]alluded to the incorporation of solid carbonate disposal tomining opera-tions. This proposed route should serve a threefold purpose; clean-up ofbrine waste waters, waste FA utilization, and capture of CO2 emissionsfrom power stations as mineral carbonates.
31G.N. Muriithi et al. / Desalination 353 (2014) 30–38
2. Experimental
2.1. Sample collection and characterization
Brine from awater reclamation plant and class F FA from a coal firedpower plant in South Africa were collected and used in the study. Tech-nical grade CO2 obtained from Afrox (South Africa) was also used. Theelemental composition of the brine was determined using IC for anionconcentration (Dionex DX-120 equippedwith an IonPac AS14A column,AG14-4 mm guard column and a conductivity detector). Major cationswere analyzed using a Varian Radial ICP-AES, while trace cations wereanalyzed using an Agilent 7500ce ICP-MS. The composition of the FAwas reported elsewhere [15].
2.2. Experimental treatments
The parameters that were investigated included the effect of tem-perature (30 °C and 90 °C), pressure (1 MPa and 4 MPa), particle size(b20 μm, 20–150 μm, N150 μm and bulk FA) and solid-to-liquid ratios(S:L 0.1, 0.5 and 1 g/ml) on the extent of removal of major and traceions from the brine sample upon addition of FA and CO2. The controlexperiment was conducted using bulk ash without addition of CO2 ortemperature/pressure adjustment at a S/L ratio of 1:1. The factorial com-bination of these variables, which was generated with a D-optimaldesign using the ‘Design of Experiments’ software (DOE version 7.1),is shown in Table 1.
20 g of FA was suspended in various volumes of brine samples toachieve the required S/L ratio. All experiments were performed in a600 mL Parr 4568 Series stainless steel high-pressure reactor fittedwith an impeller and controlled by a Parr 4857 power controller and aParr 4870 process controller (Parr Instrument Co., Illinois, USA). Alltreatment solutions were continuously stirred to maintain FA particlesand/or formed precipitated products in suspension throughout the
Table 1Experimental runs generated by the Design of Experiments software (DOE version 7.1).
Run no. Pressure(MPa)
Temperature(°C)
Particle size(μm)
S/L ratio(g/ml)
R1 1 90 b20 0.5R2 1 90 20–150 0.5R3 4 90 Bulk 0.1R4 1 30 b20 0.5R5 4 90 N150 0.5R6 1 90 20–150 1R7 1 90 N150 0.1R8 1 30 20–150 0.1R9 4 90 20–150 0.1R10 4 30 Bulk 0.5R11 4 90 20–150 0.1R12 1 30 Bulk 0.1R13 4 30 20–150 1R14 4 90 b20 1R15 4 90 N150 1R16 1 30 Bulk 1R17 1 30 b20 0.5R18 1 30 b20 0.1R19 1 30 N150 0.5R20 4 30 Bulk 1R21 4 90 b20 0.5R22 4 30 b20 1R23 1 30 Bulk 0.5R24 4 90 b20 0.1R25 4 30 N150 0.1R26 1 90 20–150 0.1R27 1 90 Bulk 0.5R28 4 30 20–150 0.5R29 1 30 N150 0.1R30 1 90 N150 1R31 4 90 Bulk 1R32 4 30 N150 1
experiment. CO2 was fed into the reactor to attain the desired pressure.At completion of the experiments (i.e. 120 min), the reactor wasdepressurized and quenched in cold water. The suspensions were fil-tered using 0.45 μm pore membrane filters. The filtrates were dividedinto two aliquots; the first aliquot was immediately acidified down topH b 2 by addition of 2 M HNO3 and was refrigerated at 4 °C untilmajor cations (Variant Radial ICP-OES) and trace elements (Agilent7500ce ICP-MS) analyses were performed; the second aliquot was re-frigerated under the same temperature condition with no acid addedand was analyzed for anion content using a Dionex DX-120 ion chro-matograph with an IonPac AS14A column and AG14-4 mm guardcolumn.
Geochemical modeling was carried out to predict the speciation ofthe brine as well as the possible mineral forms that may form upon ad-dition of FA and CO2 to the brine sample. Geochemist's Workbench(GWB) Essentials version 8.0 was used for the modeling of the brineusing the pH, electrical conductivity (EC), alkalinity and acidity of thebrine, concentration of individual ions as well as CO3
2− ions from theCO2 gas as input parameters. pH and electrical conductivity (EC) of thebrine were measured in the field using a Martini Mi150 portablemeter while alkalinity was determined by acid titration. Speciation ofthe brine solution allowed for prediction of the association of major cat-ions and anions in the brine. SpecE8 subprogram of the GWB was usedto speciate the rawbrine. Possiblemineralizationwas predicted by plot-ting stability diagrams in the Act2 subprogram of GWB. The indepen-dent variable was chosen as pH while the dependent variables werethe log activities of the major ions contained in the brine.
3. Results and discussions
3.1. Composition of the untreated brine
The elemental composition of the untreated brine is given in Table 2.The major elements identified were SO4
2−, Na+, Cl−, Mg2+ and K+.Minor elements included Sr2+, NO3
−, Si4+, Ni2+ and Pb2+, while thetrace elements comprised of V2+, B3+, Ba2+, Cu2+, As3+, Fe3+, Se4+,Mn4+, Mo6+, Ti2+, Zn2+, Cr3+, Al3+ and Co2+. The composition of
Table 2Major, minor and trace ion content of untreated brine (ppm; n = 3).
Elements Concentration (ppm)
SO4 11,704 ± 14.28Na 3355 ± 25.46Cl 1365 ± 7.78Ca 210.2 ± 10.47Mg 111.85 ± 0.07K 78.75 ± 2.05Sr 11.06 ± 0.18NO3 6.5 ± 1.44Si 2.54 ± 0.03Ni 2.5 ± 0.02Pb 1.6 ± 0.01V 0.4898 ± 0.04B 0.154 ± 0.01Ba 0.15 ± 0.01Cu 0.118As 0.076 ± 0.01Fe 0.068 ± 0.02Se 0.058 ± 0.01Mn 0.057 ± 0.01Mo 0.037Ti 0.029Zn 0.028Al 0.023Cr 0.023Co 0.020pH 8.48Alkalinity (as CaCO3) 200
Water run
Brine run
Fig. 2. Comparative quantification of the phases present in brine andwater cured samples.
32 G.N. Muriithi et al. / Desalination 353 (2014) 30–38
the brinewas typical of that of Na2SO4-richwaters, as clearly illustratedin Fig. 1.
3.2. Characteristics of the brine upon addition of FA
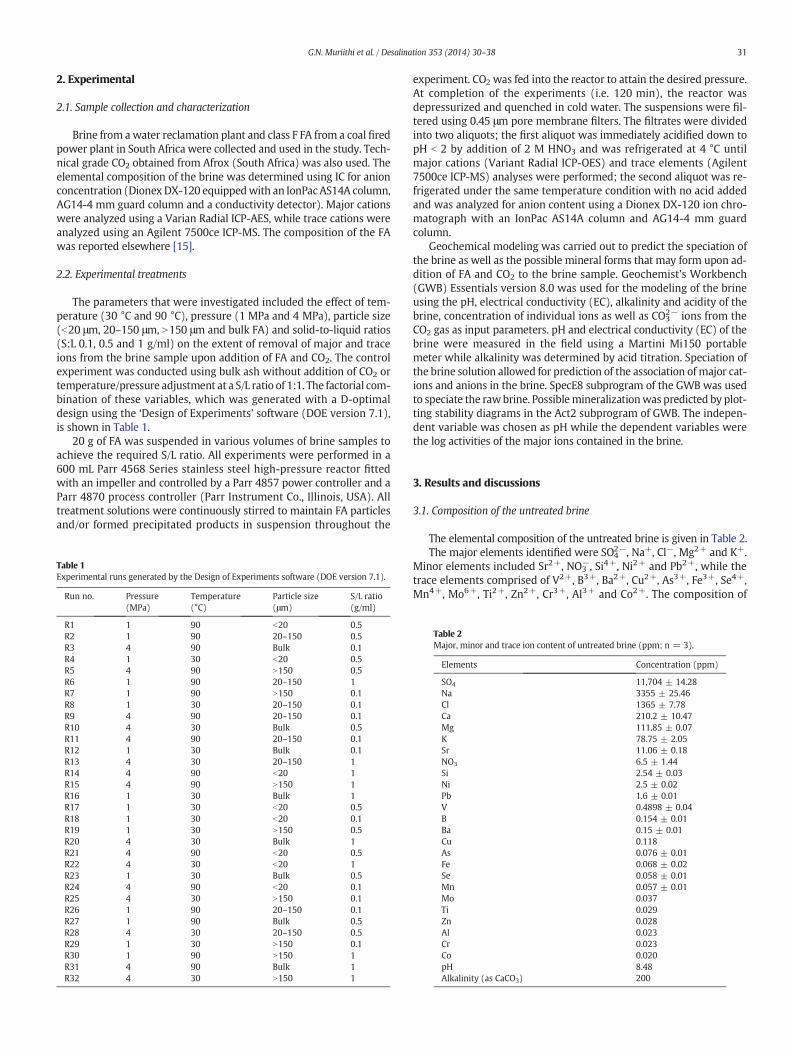
To understand the impact of FA/CO2 on brine, a FA/CO2/H2O experi-ment was conducted and the solid residues characterized by quantita-tive XRD (Fig. 2).
The calcite formation was found to be higher in brine than in H2Ocarbonated residues indicating that brine contributes additional Ca2+
for carbonation. Additionally no lime was observed in both H2O andbrine residues. Lime in brine was used to raise the brine pH for carbon-ation to occur as per Soong et al. [21] while the lime in the H2O experi-ment was hydrolyzed to the hydroxide form that later transforms toCaCO3. According to Wang et al. [20], the presence of a liquid mediumsuch as water or brine is necessary for the conversion of CaO tocarbonates.
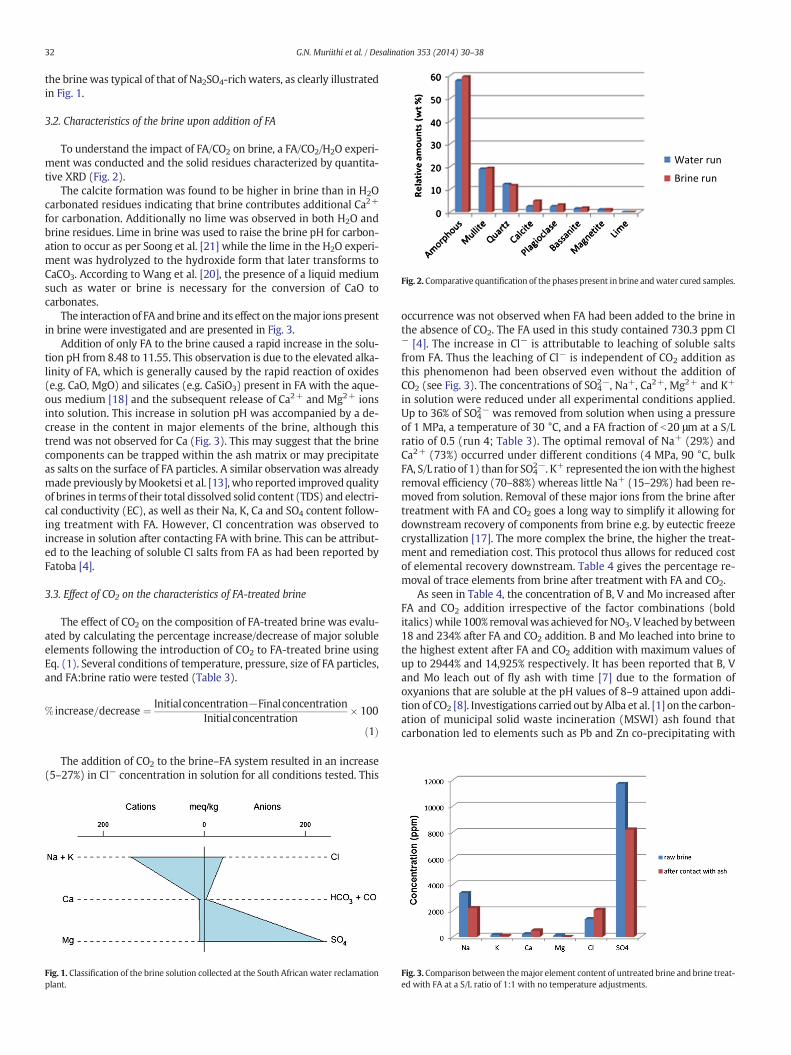
The interaction of FA andbrine and its effect on themajor ions presentin brine were investigated and are presented in Fig. 3.
Addition of only FA to the brine caused a rapid increase in the solu-tion pH from 8.48 to 11.55. This observation is due to the elevated alka-linity of FA, which is generally caused by the rapid reaction of oxides(e.g. CaO, MgO) and silicates (e.g. CaSiO3) present in FA with the aque-ous medium [18] and the subsequent release of Ca2+ and Mg2+ ionsinto solution. This increase in solution pH was accompanied by a de-crease in the content in major elements of the brine, although thistrend was not observed for Ca (Fig. 3). This may suggest that the brinecomponents can be trapped within the ash matrix or may precipitateas salts on the surface of FA particles. A similar observation was alreadymade previously byMooketsi et al. [13], who reported improved qualityof brines in terms of their total dissolved solid content (TDS) and electri-cal conductivity (EC), as well as their Na, K, Ca and SO4 content follow-ing treatment with FA. However, Cl concentration was observed toincrease in solution after contacting FA with brine. This can be attribut-ed to the leaching of soluble Cl salts from FA as had been reported byFatoba [4].
3.3. Effect of CO2 on the characteristics of FA-treated brine
The effect of CO2 on the composition of FA-treated brine was evalu-ated by calculating the percentage increase/decrease of major solubleelements following the introduction of CO2 to FA-treated brine usingEq. (1). Several conditions of temperature, pressure, size of FA particles,and FA:brine ratio were tested (Table 3).
% increase=decrease ¼ Initialconcentration−FinalconcentrationInitialconcentration
� 100
ð1Þ
The addition of CO2 to the brine–FA system resulted in an increase(5–27%) in Cl− concentration in solution for all conditions tested. This
Fig. 1. Classification of the brine solution collected at the South African water reclamationplant.
occurrence was not observed when FA had been added to the brine inthe absence of CO2. The FA used in this study contained 730.3 ppm Cl− [4]. The increase in Cl− is attributable to leaching of soluble saltsfrom FA. Thus the leaching of Cl− is independent of CO2 addition asthis phenomenon had been observed even without the addition ofCO2 (see Fig. 3). The concentrations of SO4
2−, Na+, Ca2+, Mg2+ and K+
in solution were reduced under all experimental conditions applied.Up to 36% of SO4
2− was removed from solution when using a pressureof 1 MPa, a temperature of 30 °C, and a FA fraction of b20 μm at a S/Lratio of 0.5 (run 4; Table 3). The optimal removal of Na+ (29%) andCa2+ (73%) occurred under different conditions (4 MPa, 90 °C, bulkFA, S/L ratio of 1) than for SO4
2−. K+ represented the ionwith the highestremoval efficiency (70–88%) whereas little Na+ (15–29%) had been re-moved from solution. Removal of these major ions from the brine aftertreatment with FA and CO2 goes a long way to simplify it allowing fordownstream recovery of components from brine e.g. by eutectic freezecrystallization [17]. The more complex the brine, the higher the treat-ment and remediation cost. This protocol thus allows for reduced costof elemental recovery downstream. Table 4 gives the percentage re-moval of trace elements from brine after treatment with FA and CO2.
As seen in Table 4, the concentration of B, V and Mo increased afterFA and CO2 addition irrespective of the factor combinations (bolditalics)while 100% removalwas achieved for NO3. V leached bybetween18 and 234% after FA and CO2 addition. B and Mo leached into brine tothe highest extent after FA and CO2 addition with maximum values ofup to 2944% and 14,925% respectively. It has been reported that B, Vand Mo leach out of fly ash with time [7] due to the formation ofoxyanions that are soluble at the pH values of 8–9 attained upon addi-tion of CO2 [8]. Investigations carried out by Alba et al. [1] on the carbon-ation of municipal solid waste incineration (MSWI) ash found thatcarbonation led to elements such as Pb and Zn co-precipitating with
Fig. 3. Comparison between themajor element content of untreated brine and brine treat-ed with FA at a S/L ratio of 1:1 with no temperature adjustments.

Table 3Percent increase/decrease ofmajor soluble elements contained in FA-treated brine followingCO2 addition (the positive values indicate a decrease while the negative values indicate anincrease following CO2 treatment).
Run number Conditions SO4 Na Cl Ca Mg K
1 1 MPa, 90 °C, b20 μm, S/L 0.5 25 24 −27 58 84 802 1 MPa, 90 °C, 20–150 μm, S/L 0.5 23 21 −13 45 53 823 4 MPa, 90 °C, bulk ash, S/L 0.1 15 20 −17 40 69 884 1 MPa, 30 °C, b20 μm, S/L 0.5 36 26 −5 47 77 815 4 MPa, 90 °C, N150 μm, S/L 0.5 20 21 −21 55 84 786 1 MPa, 90 °C, 20–150 μm, S/L 1 20 24 −14 72 63 807 1 MPa, 90 °C, N150 μm, S/L 0.1 18 18 −12 51 63 708 1 MPa, 30 °C, 20–150 μm, S/L 0.1 12 19 −15 43 80 869 4 MPa, 90 °C, 20–150 μm, S/L 0.1 14 26 −16 62 79 8010 4 MPa, 30 °C, bulk ash, S/L 0.5 16 24 −12 53 83 8211 4 MPa, 90 °C, 20–150 μm, S/L 0.1 14 26 −18 43 79 7512 1 MPa, 30 °C, bulk ash, S/L 0.1 14 17 −15 61 87 8013 4 MPa, 30 °C, 20–150 μm, S/L 1 24 23 −11 54 85 8514 4 MPa, 90 °C, b20 μm, S/L 1 27 24 −18 67 81 8316 1 MPa, 30 °C, bulk ash, S/L 1 25 15 −6 49 85 7817 1 MPa, 30 °C, b20 μm, S/L 0.5 32 21 −13 48 83 7918 1 MPa, 30 °C, b20 μm, S/L 0.1 15 20 −11 56 70 8619 1 MPa, 30 °C, N150 μm, S/L 0.5 16 20 −9 65 66 7620 4 MPa, 30 °C, bulk ash, S/L 1 21 23 −10 46 77 7421 4 MPa, 90 °C, b20 μm, S/L 0.5 34 28 −13 54 81 8422 4 MPa, 30 °C, b20 μm, S/L 1 13 25 −14 66 71 8123 1 MPa, 30 °C, bulk ash, S/L 0.5 28 24 −11 51 79 8524 4 MPa, 90 °C, b20 μm, S/L 0.1 13 25 −14 62 83 8225 4 MPa, 30 °C, N150 μm, S/L 0.1 22 22 −10 58 81 7926 1 MPa, 90 °C, 20–150 μm, S/L 0.1 15 23 −15 55 64 8127 1 MPa, 90 °C, bulk ash, S/L 0.5 19 21 −18 56 70 8728 4 MPa, 30 °C, 20–150 μm, S/L 0.5 24 21 −15 49 79 7729 1 MPa, 30 °C, N150 μm, S/L 0.1 14 22 −13 53 83 8431 4 MPa, 90 °C, bulk ash, S/L 1 21 29 −8 73 72 83
Table 5Dichotomous table for McNemar's test [12].
− +
− a b a + b+ c d c + d
a + c b + d Total
33G.N. Muriithi et al. / Desalination 353 (2014) 30–38
CaCO3 due to the predominance of PbCO3 at pH 6–9 and Zn(OH)2at pH 9–11. This has been reported elsewhere [2,3]. Other co-precipitating elements are Cd, Cr and Cu and their reduction in the treat-ed water can be attributed to these co-precipitation reactions.
Table 4Percent increase/decrease of trace elements in FA-treated brine following CO2 addition (the positreatment).
Run number Conditions Sr NO3 Si Ni Pb V B
1 1 MPa, 90 °C, b20 μm, S/L 0.5 91 100 90 54 92 −141 −2 1 MPa, 90 °C, 20–150 μm, S/L 0.5 97 100 99 83 55 −52 −3 4 MPa, 90 °C, bulk ash, S/L 0.1 82 100 94 75 54 −217 −4 1 MPa, 30 °C, b20 μm, S/L 0.5 95 100 99 94 42 −35 −5 4 MPa, 90 °C, N150 μm, S/L 0.5 97 100 82 63 88 −104 −6 1 MPa, 90 °C, 20–150 μm, S/L 1 98 100 87 80 92 −1907 1 MPa, 90 °C, N150 μm, S/L 0.1 97 100 92 72 69 −1918 1 MPa, 30 °C, 20–150 μm, S/L 0.1 86 100 87 71 75 −499 4 MPa, 90 °C, 20–150 μm, S/L 0.1 91 100 89 72 70 −129 −10 4 MPa, 30 °C, bulk ash, S/L 0.5 90 100 100 58 76 −105 −11 4 MPa, 90 °C, 20–150 μm, S/L 0.1 97 100 93 73 43 −137 −12 1 MPa, 30 °C, bulk ash, S/L 0.1 95 100 86 96 100 −8513 4 MPa, 30 °C, 20–150 μm, S/L 1 85 100 70 81 86 −65 −14 4 MPa, 90 °C, b20 μm, S/L 1 96 100 95 72 79 −3216 1 MPa, 30 °C, bulk ash, S/L 1 94 100 96 87 67 −6917 1 MPa, 30 °C, b20 μm, S/L 0.5 91 100 87 43 85 −137 −18 1 MPa, 30 °C, b20 μm, S/L 0.1 93 100 84 47 92 −49 −19 1 MPa, 30 °C, N150 μm, S/L 0.5 43 100 93 86 82 −41 −20 4 MPa, 30 °C, bulk ash, S/L 1 92 100 91 90 91 −18121 4 MPa, 90 °C, b20 μm, S/L 0.5 95 100 98 78 85 −30 −22 4 MPa, 30 °C, b20 μm, S/L 1 93 100 78 59 78 −149 −23 1 MPa, 30 °C, bulk ash, S/L 0.5 85 100 94 83 87 −3724 4 MPa, 90 °C, b20 μm, S/L 0.1 94 100 92 63 96 −179 −25 4 MPa, 30 °C, N150 μm, S/L 0.1 98 100 94 67 100 −85 −26 1 MPa, 90 °C, 20–150 μm, S/L 0.1 91 100 87 46 97 −2427 1 MPa, 90 °C, bulk ash, S/L 0.5 78 100 62 63 100 −23428 4 MPa, 30 °C, 20–150 μm, S/L 0.5 83 100 97 81 93 −55 −29 1 MPa, 30 °C, N150 μm, S/L 0.1 94 100 95 96 87 −3831 4 MPa, 90 °C, bulk ash, S/L 1 99 100 100 100 100 −18
3.4. Statistical testing using McNemar's test
Statistical analysis (McNemar's test) was applied to study the bestfactor combinations for the removal of different elements from thebrine on addition of CO2. McNemar's test is also called a test for the sig-nificance of change [19]. In the medical field the test is used to investi-gate the effect of a medication before and after treatment where themeasurements are of the strength of either a nominal or interval scale,for instance ‘responded’ or ‘did not respond’; ‘improved’ or ‘did not im-prove’ and ‘positive’ or ‘negative’ [14]. McNemar's test [12] was thuschosen as it takes into account paired observations where in this studythe investigation considered the effect of factor combinations used inthe FA and CO2 addition process and their effect on the concentrationof various elements in brine before and after the addition. Moreover,since there are so many factor combinations and generally only oneobservation per combination, other types of analyses were found notto be feasible. SAS statistical program (enterprise version) was used torun the test. An example of a dichotomous table applicable usingMcNemar's testing is given in Table 5.
Since it was already discussed that the trend for B, V, Mo and Clshowed an increase with carbonation or 100% removal in the case ofNO3, these elements were left out of the statistical analysis as notmuch else could be established from their behavior using statisticalanalysis. Na and SO4 were removed from brine during FA and CO2 addi-tion to a maximum of 36% in all the factor combinations applied. How-ever, for Al, Ti, Cr, Mn, Fe, Co, Ni, Cu, Zn, As, Se, Ba, Pb, Si, Sr, Mg, K and Cathe percentage removal ranged between 2% and 100% withmost values
tive values indicate a decrease while the negative values indicate an increase following CO2
Ba Cu As Fe Se Mn Mo Ti Zn Al Cr Co
1234 20 41 40 85 100 84 −10,738 100 63 13 81 972326 75 94 54 66 80 90 −5799 76 91 100 64 991125 64 99 8 68 72 62 −1539 89 85 7 78 991056 21 87 6 81 92 98 −7884 60 86 39 42 911905 42 28 40 68 86 65 −3086 65 77 6 19 89−893 15 90 81 78 100 45 −11,407 8 96 28 51 97−476 67 100 61 64 46 75 −1011 77 76 31 69 99−790 23 78 76 79 100 95 −1076 43 73 7 79 901175 70 94 90 90 100 66 −1295 85 76 100 80 982552 46 88 34 87 92 83 −4893 38 41 100 48 951268 81 96 91 67 100 69 −1478 78 49 41 44 98−896 28 96 66 77 100 91 −1241 74 63 55 81 901817 59 94 67 80 100 94 −6650 74 58 100 38 99−943 80 56 76 73 100 82 −14,925 61 2 47 77 96−540 92 95 81 72 65 100 −3553 71 77 37 83 1002944 53 32 18 45 100 84 −5680 42 80 42 57 811718 86 40 37 88 63 84 −2066 96 59 33 26 771032 21 93 85 67 80 94 −1816 53 62 36 43 95−921 55 100 74 79 52 100 −4514 93 89 48 82 1001858 73 75 87 68 60 53 −8600 23 85 19 77 972646 53 76 100 76 100 83 −13,612 59 59 14 68 91−464 91 100 91 88 100 100 −2949 94 63 100 83 1002412 54 86 55 50 100 74 −5996 77 69 42 87 941867 68 91 87 89 100 91 −2113 85 66 38 72 98−363 31 90 84 71 100 79 −740 69 36 38 100 79−886 84 100 65 87 100 41 −1880 95 86 100 95 1003049 80 100 77 81 100 84 −5306 41 53 100 17 98−465 18 90 98 91 100 80 −786 80 75 16 38 85−802 74 100 100 100 100 100 −221 100 100 100 98 97
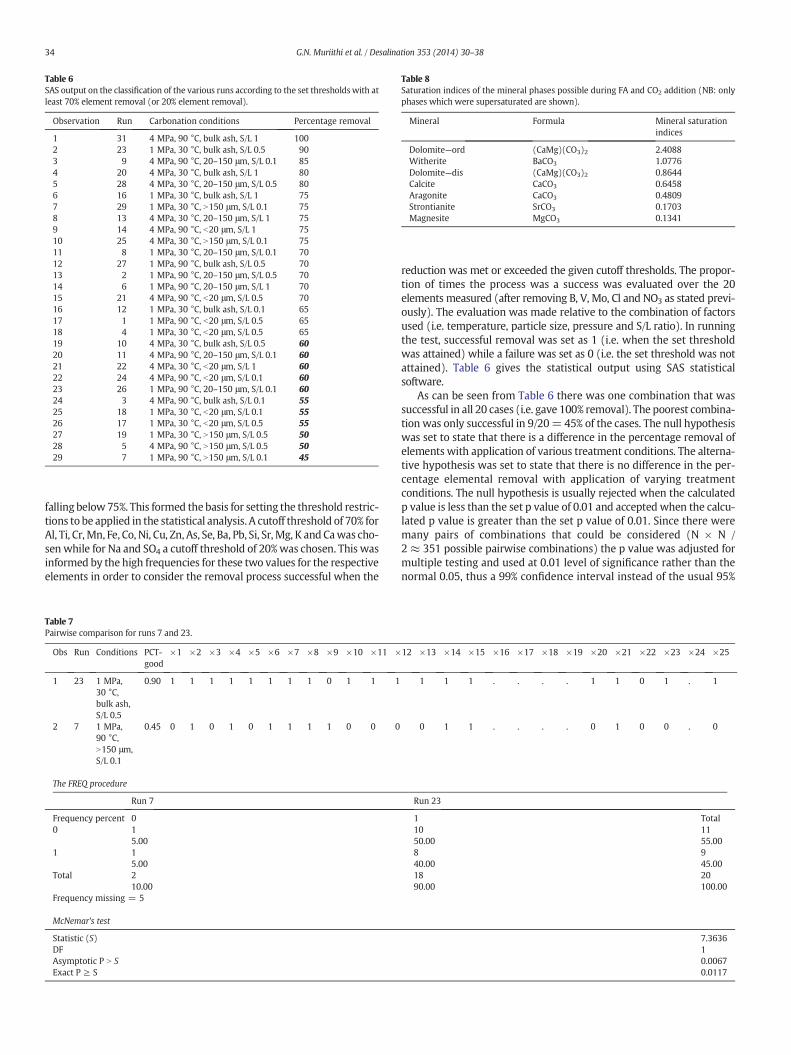
Table 6SAS output on the classification of the various runs according to the set thresholdswith atleast 70% element removal (or 20% element removal).
Observation Run Carbonation conditions Percentage removal
1 31 4 MPa, 90 °C, bulk ash, S/L 1 1002 23 1 MPa, 30 °C, bulk ash, S/L 0.5 903 9 4 MPa, 90 °C, 20–150 μm, S/L 0.1 854 20 4 MPa, 30 °C, bulk ash, S/L 1 805 28 4 MPa, 30 °C, 20–150 μm, S/L 0.5 806 16 1 MPa, 30 °C, bulk ash, S/L 1 757 29 1 MPa, 30 °C, N150 μm, S/L 0.1 758 13 4 MPa, 30 °C, 20–150 μm, S/L 1 759 14 4 MPa, 90 °C, b20 μm, S/L 1 7510 25 4 MPa, 30 °C, N150 μm, S/L 0.1 7511 8 1 MPa, 30 °C, 20–150 μm, S/L 0.1 7012 27 1 MPa, 90 °C, bulk ash, S/L 0.5 7013 2 1 MPa, 90 °C, 20–150 μm, S/L 0.5 7014 6 1 MPa, 90 °C, 20–150 μm, S/L 1 7015 21 4 MPa, 90 °C, b20 μm, S/L 0.5 7016 12 1 MPa, 30 °C, bulk ash, S/L 0.1 6517 1 1 MPa, 90 °C, b20 μm, S/L 0.5 6518 4 1 MPa, 30 °C, b20 μm, S/L 0.5 6519 10 4 MPa, 30 °C, bulk ash, S/L 0.5 6020 11 4 MPa, 90 °C, 20–150 μm, S/L 0.1 6021 22 4 MPa, 30 °C, b20 μm, S/L 1 6022 24 4 MPa, 90 °C, b20 μm, S/L 0.1 6023 26 1 MPa, 90 °C, 20–150 μm, S/L 0.1 6024 3 4 MPa, 90 °C, bulk ash, S/L 0.1 5525 18 1 MPa, 30 °C, b20 μm, S/L 0.1 5526 17 1 MPa, 30 °C, b20 μm, S/L 0.5 5527 19 1 MPa, 30 °C, N150 μm, S/L 0.5 5028 5 4 MPa, 90 °C, N150 μm, S/L 0.5 5029 7 1 MPa, 90 °C, N150 μm, S/L 0.1 45
Table 8Saturation indices of the mineral phases possible during FA and CO2 addition (NB: onlyphases which were supersaturated are shown).
Mineral Formula Mineral saturationindices
Dolomite—ord (CaMg)(CO3)2 2.4088Witherite BaCO3 1.0776Dolomite—dis (CaMg)(CO3)2 0.8644Calcite CaCO3 0.6458Aragonite CaCO3 0.4809Strontianite SrCO3 0.1703Magnesite MgCO3 0.1341
34 G.N. Muriithi et al. / Desalination 353 (2014) 30–38
falling below75%. This formed the basis for setting the threshold restric-tions to be applied in the statistical analysis. A cutoff threshold of 70% forAl, Ti, Cr,Mn, Fe, Co, Ni, Cu, Zn, As, Se, Ba, Pb, Si, Sr,Mg, K and Cawas cho-sen while for Na and SO4 a cutoff threshold of 20%was chosen. This wasinformed by the high frequencies for these two values for the respectiveelements in order to consider the removal process successful when the
Table 7Pairwise comparison for runs 7 and 23.
Obs Run Conditions PCT-good
×1 ×2 ×3 ×4 ×5 ×6 ×7 ×8 ×9 ×10 ×11 ×
1 23 1 MPa,30 °C,bulk ash,S/L 0.5
0.90 1 1 1 1 1 1 1 1 0 1 1 1
2 7 1 MPa,90 °C,N150 μm,S/L 0.1
0.45 0 1 0 1 0 1 1 1 1 0 0 0
The FREQ procedure
Run 7
Frequency percent 00 1
5.001 1
5.00Total 2
10.00Frequency missing = 5
McNemar's test
Statistic (S)DFAsymptotic P N SExact P ≥ S
reduction was met or exceeded the given cutoff thresholds. The propor-tion of times the process was a success was evaluated over the 20elements measured (after removing B, V, Mo, Cl and NO3 as stated previ-ously). The evaluation was made relative to the combination of factorsused (i.e. temperature, particle size, pressure and S/L ratio). In runningthe test, successful removal was set as 1 (i.e. when the set thresholdwas attained) while a failure was set as 0 (i.e. the set threshold was notattained). Table 6 gives the statistical output using SAS statisticalsoftware.
As can be seen from Table 6 there was one combination that wassuccessful in all 20 cases (i.e. gave 100% removal). The poorest combina-tion was only successful in 9/20= 45% of the cases. The null hypothesiswas set to state that there is a difference in the percentage removal ofelements with application of various treatment conditions. The alterna-tive hypothesis was set to state that there is no difference in the per-centage elemental removal with application of varying treatmentconditions. The null hypothesis is usually rejected when the calculatedp value is less than the set p value of 0.01 and accepted when the calcu-lated p value is greater than the set p value of 0.01. Since there weremany pairs of combinations that could be considered (N × N /2 ≈ 351 possible pairwise combinations) the p value was adjusted formultiple testing and used at 0.01 level of significance rather than thenormal 0.05, thus a 99% confidence interval instead of the usual 95%
12 ×13 ×14 ×15 ×16 ×17 ×18 ×19 ×20 ×21 ×22 ×23 ×24 ×25
1 1 1 . . . . 1 1 0 1 . 1
0 1 1 . . . . 0 1 0 0 . 0
Run 23
1 Total10 1150.00 55.008 940.00 45.0018 2090.00 100.00
7.363610.00670.0117

Fig. 4.Modeled speciation of Na+ (a) and K+ (b) in untreated brine.
Fig. 5. Modeled speciation of Ca2+ (a) and Mg2+ (b) in untreated brine.
35G.N. Muriithi et al. / Desalination 353 (2014) 30–38
confidence interval. With these more stringent conditions the condi-tions applied in run 31 (100% successful) were more successful incleaning the brine of undesirable components. Run 7 (45%) at 1 MPaand90 °Cusing the N150 μmparticle fraction at a S/L ratio of 0.1was sig-nificantly lower than run 31 (100%) and run 23 (90%) with the p-valuein the latter case being 0.0117. Comparisons of runs 4 and 17 are alsoshown as these experiments used the same levels of all factors. The dif-ferences in percentage removal of the elements of interest observed forthese runs are not statistically significant, but do indicate some variabil-ity from one run to the next (even with the same levels of factors i.e.runs 4 and 17 were at 1 MPa, 30 °C, b20 μm and S/L ratio of 0.5). Thiscould be attributed to the heterogeneity of the fly ash used in the car-bonation process where the CaO content of each carbonation experi-ment cannot be ascertained. The italicized and bold part (Table 7)shows the observations for which the outcome was significantly differ-ent from the 100% removal (run 31). At the top or bottom of the table,not much significant difference was observed, for instance, run 5 and
Fig. 6.Modeled speciation of Cl− (a
run 7 are not statistically significantly different from each other. Apairwise comparison was carried out for various runs as in Table 7.
The success rate of run 7 (45%) was compared to that (93%) of run23, to establish whether the two were significantly different. Thep-value of 0.0117 obtained shows that the two runs are significantly dif-ferent considering that the confidence interval chosen was 0.01. Fromthe frequency reported in Table 8, run 23 had a success rate of 90%with 18 observations being positive and 2 observations being negative(the set threshold of removal was achieved up to 90%) while run 7only achieved 45% success with 9 positive observations and 11 negativeobservations. The missing frequency originates from the five elementsremoved in the analysis (B, V, Mo, Cl and NO3). It can thus be concludedthat even running a set of experiments at the same conditions wouldnot automatically mean they are statistically similar to one another.This could be due to the uncertainty in the quantity of CaO present ineach experimental run, which would have an implication on the carbon-ate formation and hence brine element capture.
) SO42− (b) in untreated brine.
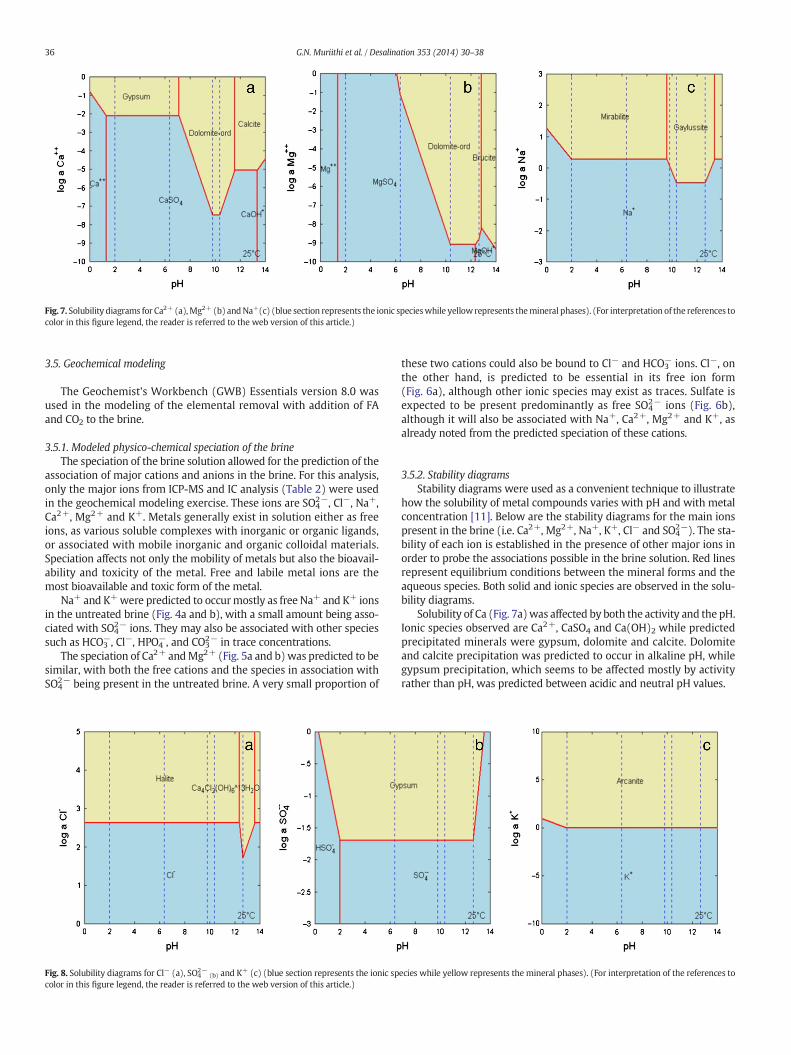
Fig. 7. Solubility diagrams for Ca2+ (a),Mg2+ (b) andNa+(c) (blue section represents the ionic specieswhile yellow represents themineral phases). (For interpretation of the references tocolor in this figure legend, the reader is referred to the web version of this article.)
36 G.N. Muriithi et al. / Desalination 353 (2014) 30–38
3.5. Geochemical modeling
The Geochemist's Workbench (GWB) Essentials version 8.0 wasused in the modeling of the elemental removal with addition of FAand CO2 to the brine.
3.5.1. Modeled physico-chemical speciation of the brineThe speciation of the brine solution allowed for the prediction of the
association of major cations and anions in the brine. For this analysis,only the major ions from ICP-MS and IC analysis (Table 2) were usedin the geochemical modeling exercise. These ions are SO4
2−, Cl−, Na+,Ca2+, Mg2+ and K+. Metals generally exist in solution either as freeions, as various soluble complexes with inorganic or organic ligands,or associated with mobile inorganic and organic colloidal materials.Speciation affects not only the mobility of metals but also the bioavail-ability and toxicity of the metal. Free and labile metal ions are themost bioavailable and toxic form of the metal.
Na+ and K+were predicted to occurmostly as free Na+ and K+ ionsin the untreated brine (Fig. 4a and b), with a small amount being asso-ciated with SO4
2− ions. They may also be associated with other speciessuch as HCO3
−, Cl−, HPO4−, and CO3
2− in trace concentrations.The speciation of Ca2+ andMg2+ (Fig. 5a and b)was predicted to be
similar, with both the free cations and the species in association withSO4
2− being present in the untreated brine. A very small proportion of
Fig. 8. Solubility diagrams for Cl− (a), SO42−
(b) and K+ (c) (blue section represents the ionic spcolor in this figure legend, the reader is referred to the web version of this article.)
these two cations could also be bound to Cl− and HCO3− ions. Cl−, on
the other hand, is predicted to be essential in its free ion form(Fig. 6a), although other ionic species may exist as traces. Sulfate isexpected to be present predominantly as free SO4
2− ions (Fig. 6b),although it will also be associated with Na+, Ca2+, Mg2+ and K+, asalready noted from the predicted speciation of these cations.
3.5.2. Stability diagramsStability diagrams were used as a convenient technique to illustrate
how the solubility of metal compounds varies with pH and with metalconcentration [11]. Below are the stability diagrams for the main ionspresent in the brine (i.e. Ca2+, Mg2+, Na+, K+, Cl− and SO4
2−). The sta-bility of each ion is established in the presence of other major ions inorder to probe the associations possible in the brine solution. Red linesrepresent equilibrium conditions between the mineral forms and theaqueous species. Both solid and ionic species are observed in the solu-bility diagrams.
Solubility of Ca (Fig. 7a)was affected by both the activity and the pH.Ionic species observed are Ca2+, CaSO4 and Ca(OH)2 while predictedprecipitated minerals were gypsum, dolomite and calcite. Dolomiteand calcite precipitation was predicted to occur in alkaline pH, whilegypsum precipitation, which seems to be affected mostly by activityrather than pH, was predicted between acidic and neutral pH values.
ecies while yellow represents the mineral phases). (For interpretation of the references to
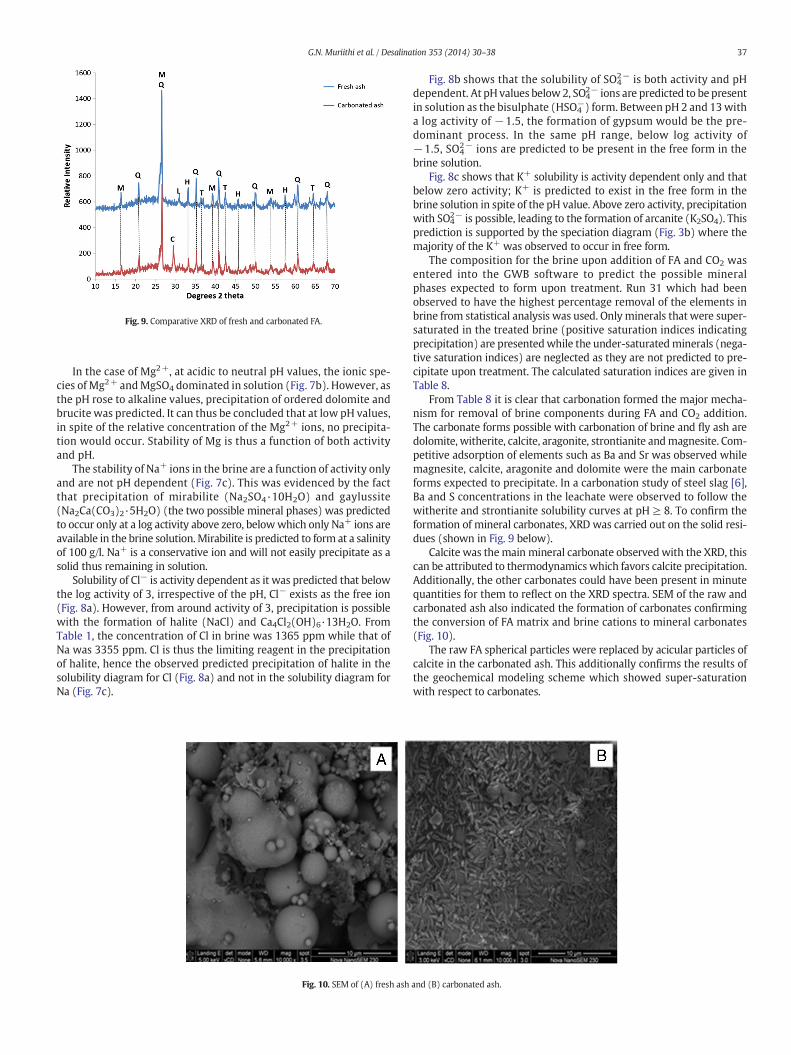
Fig. 9. Comparative XRD of fresh and carbonated FA.
37G.N. Muriithi et al. / Desalination 353 (2014) 30–38
In the case of Mg2+, at acidic to neutral pH values, the ionic spe-cies of Mg2+ andMgSO4 dominated in solution (Fig. 7b). However, asthe pH rose to alkaline values, precipitation of ordered dolomite andbrucite was predicted. It can thus be concluded that at low pH values,in spite of the relative concentration of the Mg2+ ions, no precipita-tion would occur. Stability of Mg is thus a function of both activityand pH.
The stability of Na+ ions in the brine are a function of activity onlyand are not pH dependent (Fig. 7c). This was evidenced by the factthat precipitation of mirabilite (Na2SO4·10H2O) and gaylussite(Na2Ca(CO3)2·5H2O) (the two possible mineral phases) was predictedto occur only at a log activity above zero, belowwhich only Na+ ions areavailable in the brine solution. Mirabilite is predicted to form at a salinityof 100 g/l. Na+ is a conservative ion and will not easily precipitate as asolid thus remaining in solution.
Solubility of Cl− is activity dependent as it was predicted that belowthe log activity of 3, irrespective of the pH, Cl− exists as the free ion(Fig. 8a). However, from around activity of 3, precipitation is possiblewith the formation of halite (NaCl) and Ca4Cl2(OH)6·13H2O. FromTable 1, the concentration of Cl in brine was 1365 ppm while that ofNa was 3355 ppm. Cl is thus the limiting reagent in the precipitationof halite, hence the observed predicted precipitation of halite in thesolubility diagram for Cl (Fig. 8a) and not in the solubility diagram forNa (Fig. 7c).
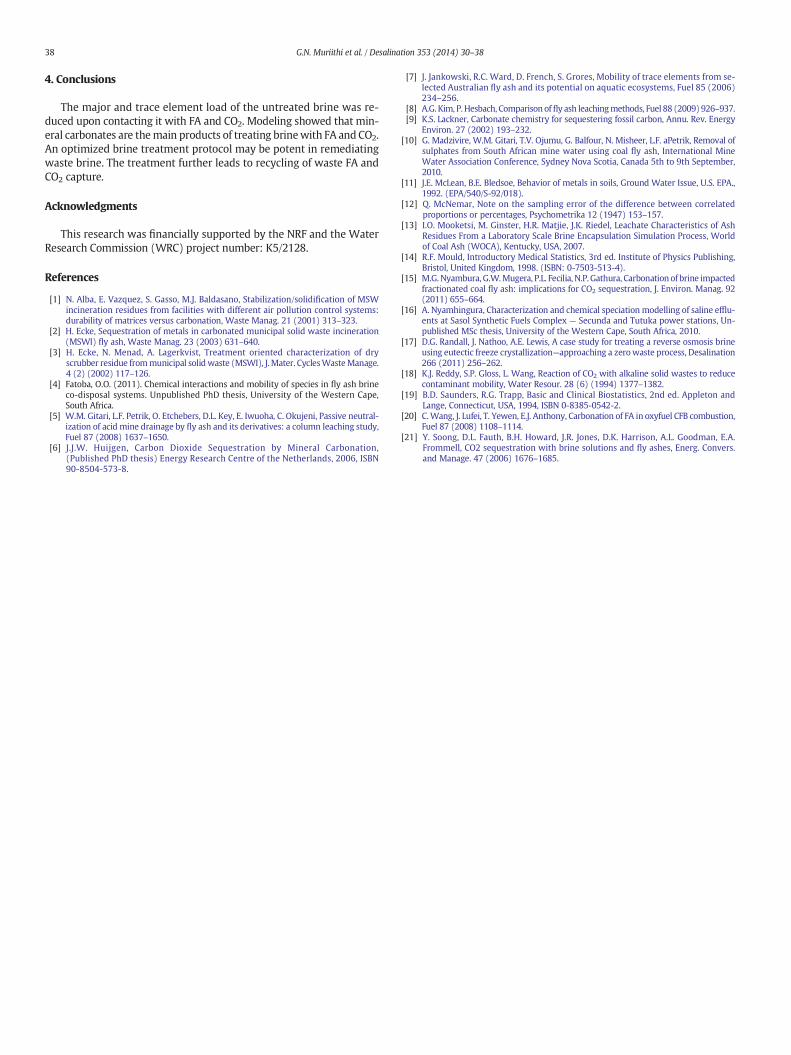
Fig. 10. SEM of (A) fresh ash
Fig. 8b shows that the solubility of SO42− is both activity and pH
dependent. At pH values below 2, SO42− ions are predicted to be present
in solution as the bisulphate (HSO4−) form. Between pH 2 and 13with
a log activity of −1.5, the formation of gypsum would be the pre-dominant process. In the same pH range, below log activity of−1.5, SO4
2− ions are predicted to be present in the free form in thebrine solution.
Fig. 8c shows that K+ solubility is activity dependent only and thatbelow zero activity; K+ is predicted to exist in the free form in thebrine solution in spite of the pH value. Above zero activity, precipitationwith SO4
2− is possible, leading to the formation of arcanite (K2SO4). Thisprediction is supported by the speciation diagram (Fig. 3b) where themajority of the K+ was observed to occur in free form.
The composition for the brine upon addition of FA and CO2 wasentered into the GWB software to predict the possible mineralphases expected to form upon treatment. Run 31 which had beenobserved to have the highest percentage removal of the elements inbrine from statistical analysis was used. Only minerals that were super-saturated in the treated brine (positive saturation indices indicatingprecipitation) are presentedwhile the under-saturatedminerals (nega-tive saturation indices) are neglected as they are not predicted to pre-cipitate upon treatment. The calculated saturation indices are given inTable 8.
From Table 8 it is clear that carbonation formed the major mecha-nism for removal of brine components during FA and CO2 addition.The carbonate forms possible with carbonation of brine and fly ash aredolomite, witherite, calcite, aragonite, strontianite andmagnesite. Com-petitive adsorption of elements such as Ba and Sr was observed whilemagnesite, calcite, aragonite and dolomite were the main carbonateforms expected to precipitate. In a carbonation study of steel slag [6],Ba and S concentrations in the leachate were observed to follow thewitherite and strontianite solubility curves at pH ≥ 8. To confirm theformation of mineral carbonates, XRD was carried out on the solid resi-dues (shown in Fig. 9 below).
Calcite was themain mineral carbonate observedwith the XRD, thiscan be attributed to thermodynamics which favors calcite precipitation.Additionally, the other carbonates could have been present in minutequantities for them to reflect on the XRD spectra. SEM of the raw andcarbonated ash also indicated the formation of carbonates confirmingthe conversion of FA matrix and brine cations to mineral carbonates(Fig. 10).
The raw FA spherical particles were replaced by acicular particles ofcalcite in the carbonated ash. This additionally confirms the results ofthe geochemical modeling scheme which showed super-saturationwith respect to carbonates.
and (B) carbonated ash.
38 G.N. Muriithi et al. / Desalination 353 (2014) 30–38
4. Conclusions
The major and trace element load of the untreated brine was re-duced upon contacting it with FA and CO2. Modeling showed that min-eral carbonates are themain products of treating brinewith FA and CO2.An optimized brine treatment protocol may be potent in remediatingwaste brine. The treatment further leads to recycling of waste FA andCO2 capture.
Acknowledgments
This research was financially supported by the NRF and the WaterResearch Commission (WRC) project number: K5/2128.
References
[1] N. Alba, E. Vazquez, S. Gasso, M.J. Baldasano, Stabilization/solidification of MSWincineration residues from facilities with different air pollution control systems:durability of matrices versus carbonation, Waste Manag. 21 (2001) 313–323.
[2] H. Ecke, Sequestration of metals in carbonated municipal solid waste incineration(MSWI) fly ash, Waste Manag. 23 (2003) 631–640.
[3] H. Ecke, N. Menad, A. Lagerkvist, Treatment oriented characterization of dryscrubber residue frommunicipal solidwaste (MSWI), J.Mater. CyclesWasteManage.4 (2) (2002) 117–126.
[4] Fatoba, O.O. (2011). Chemical interactions and mobility of species in fly ash brineco-disposal systems. Unpublished PhD thesis, University of the Western Cape,South Africa.
[5] W.M. Gitari, L.F. Petrik, O. Etchebers, D.L. Key, E. Iwuoha, C. Okujeni, Passive neutral-ization of acid mine drainage by fly ash and its derivatives: a column leaching study,Fuel 87 (2008) 1637–1650.
[6] J.J.W. Huijgen, Carbon Dioxide Sequestration by Mineral Carbonation,(Published PhD thesis) Energy Research Centre of the Netherlands, 2006, ISBN90-8504-573-8.
[7] J. Jankowski, R.C. Ward, D. French, S. Grores, Mobility of trace elements from se-lected Australian fly ash and its potential on aquatic ecosystems, Fuel 85 (2006)234–256.
[8] A.G. Kim, P. Hesbach, Comparison offly ash leachingmethods, Fuel 88 (2009) 926–937.[9] K.S. Lackner, Carbonate chemistry for sequestering fossil carbon, Annu. Rev. Energy
Environ. 27 (2002) 193–232.[10] G. Madzivire, W.M. Gitari, T.V. Ojumu, G. Balfour, N. Misheer, L.F. aPetrik, Removal of
sulphates from South African mine water using coal fly ash, International MineWater Association Conference, Sydney Nova Scotia, Canada 5th to 9th September,2010.
[11] J.E. McLean, B.E. Bledsoe, Behavior of metals in soils, Ground Water Issue, U.S. EPA.,1992. (EPA/540/S-92/018).
[12] Q. McNemar, Note on the sampling error of the difference between correlatedproportions or percentages, Psychometrika 12 (1947) 153–157.
[13] I.O. Mooketsi, M. Ginster, H.R. Matjie, J.K. Riedel, Leachate Characteristics of AshResidues From a Laboratory Scale Brine Encapsulation Simulation Process, Worldof Coal Ash (WOCA), Kentucky, USA, 2007.
[14] R.F. Mould, Introductory Medical Statistics, 3rd ed. Institute of Physics Publishing,Bristol, United Kingdom, 1998. (ISBN: 0-7503-513-4).
[15] M.G. Nyambura, G.W.Mugera, P.L. Fecilia, N.P. Gathura, Carbonation of brine impactedfractionated coal fly ash: implications for CO2 sequestration, J. Environ. Manag. 92(2011) 655–664.
[16] A. Nyamhingura, Characterization and chemical speciation modelling of saline efflu-ents at Sasol Synthetic Fuels Complex — Secunda and Tutuka power stations, Un-published MSc thesis, University of the Western Cape, South Africa, 2010.
[17] D.G. Randall, J. Nathoo, A.E. Lewis, A case study for treating a reverse osmosis brineusing eutectic freeze crystallization—approaching a zerowaste process, Desalination266 (2011) 256–262.
[18] K.J. Reddy, S.P. Gloss, L. Wang, Reaction of CO2 with alkaline solid wastes to reducecontaminant mobility, Water Resour. 28 (6) (1994) 1377–1382.
[19] B.D. Saunders, R.G. Trapp, Basic and Clinical Biostatistics, 2nd ed. Appleton andLange, Connecticut, USA, 1994, ISBN 0-8385-0542-2.
[20] C.Wang, J. Lufei, T. Yewen, E.J. Anthony, Carbonation of FA in oxyfuel CFB combustion,Fuel 87 (2008) 1108–1114.
[21] Y. Soong, D.L. Fauth, B.H. Howard, J.R. Jones, D.K. Harrison, A.L. Goodman, E.A.Frommell, CO2 sequestration with brine solutions and fly ashes, Energ. Convers.and Manage. 47 (2006) 1676–1685.