Influence of Social Values and Music Preferences on the Use of Music Distribution Channels: An...
30
Arts, Culture and the Public Sphere Venice, November 4-8, 2008 ESA RN2 Alexandros Baltzis, Antonis Gardikiotis * School of Journalism and Mass Media Studies Aristotle University of Thessaloniki (Greece) Influence of Social Values and Music Preferences on the Use of Music Distribution Channels: An Exploratory Study Abstract An audience research is presented focused on the patterns of music acquisition among students in a major urban center. The study explores the relation between the use of music distribution channels on the one hand, music preferences, social values, and several demographic factors on the other. Hierarchical regression analysis and analyses of variance revealed a complex image of the factors influencing the use of various dis- tribution channels. Music preferences, gender, and cultural background are better pre- dictors for the use of the various distribution channels compared to social values, origin, family income and socioeconomic status. These findings contradict the rhetoric of the (major) recording industry that employs a simplistic representation of the users of in- formal and free distribution channels. They also indicate that further research in this di- rection might contribute for a better understanding of everyday cultural practices and suggest a policy more efficient and fruitful than litigation and repression. Key words: music preference, sociology of taste, social values, music distribution, mu- sic industry * Address of correspondence: Dr Alexandros Baltzis, School of Journalism and Mass Media Studies, Aristotle University of Thessaloniki, 46 Egnatia St., Thessaloniki, GR-54625, Greece. Email: [email protected]. Homepage: http://users.auth.gr/baltzis/en/.
Transcript of Influence of Social Values and Music Preferences on the Use of Music Distribution Channels: An...
Arts, Culture and the Public Sphere �– Venice, November 4-8, 2008 ESA �– RN2
Alexandros Baltzis, Antonis Gardikiotis*
School of Journalism and Mass Media Studies
Aristotle University of Thessaloniki (Greece)
Influence of Social Values and Music Preferences on the Use
of Music Distribution Channels: An Exploratory Study
Abstract
An audience research is presented focused on the patterns of music acquisition
among students in a major urban center. The study explores the relation between the use
of music distribution channels on the one hand, music preferences, social values, and
several demographic factors on the other. Hierarchical regression analysis and analyses
of variance revealed a complex image of the factors influencing the use of various dis-
tribution channels. Music preferences, gender, and cultural background are better pre-
dictors for the use of the various distribution channels compared to social values, origin,
family income and socioeconomic status. These findings contradict the rhetoric of the
(major) recording industry that employs a simplistic representation of the users of in-
formal and free distribution channels. They also indicate that further research in this di-
rection might contribute for a better understanding of everyday cultural practices and
suggest a policy more efficient and fruitful than litigation and repression.
Key words: music preference, sociology of taste, social values, music distribution, mu-
sic industry
* Address of correspondence: Dr Alexandros Baltzis, School of Journalism and Mass Media Studies,
Aristotle University of Thessaloniki, 46 Egnatia St., Thessaloniki, GR-54625, Greece. Email: [email protected]. Homepage: http://users.auth.gr/baltzis/en/.
Arts, Culture and the Public Sphere �– Venice, November 4-8, 2008 ESA �– RN2
Alexandros Baltzis, Antonis Gardikiotis*
School of Journalism and Mass Media Studies
Aristotle University of Thessaloniki (Greece)
Influence of Social Values and Music Preferences on the Use
of Music Distribution Channels: An Exploratory Study
Introduction
This exploratory study focuses on the acquisition of recorded music either in a
physical (like compact discs) or in a digital format (like MP3 files). Concerts, radio and
television, although music distribution channels too, they are not nevertheless included
in this analysis, as music is not usually obtained through them. Like any industry, the
recording industry has a special interest in the distribution of its products. Unlike other
cultural or creative industries, however, the (major) recording industry demonstrates
intolerance to the proliferation of the distribution channels, a generic inflexibility to in-
novation in this field, and a purposefully ignorant attitude towards the social, cultural,
and political consequences of the pursuit to control exclusively �– if possible �– the dis-
semination of cultural goods (see also Baltzis, 2006). This attitude is well documented
in the literature (e.g. Frith, 1988; Jones & Lenhart, 2004; Langenderfer & Kopp, 2004;
Bishop, 2005). It can also be seen in the magnitude of the litigation campaigns, at least
during the past few years (20,000 individuals in 17 countries for 2005 and more than
10,000 in 18 countries for 2006; IFPI, 2006: 20, 2007: 18). During the past decade, the
music market �– like almost any market of intangible goods �– has undergone a major
shift towards a multichannel context of distribution, as the mobile phones, and mainly
the internet increased the range of choices. The control of distribution has always been
important to the recording industry, but it becomes pivotal in a multichannel context
where the circulation of cultural goods gets priority over their production. At the same
time, this pursuit conflicts with the demands of the civil society and the information
* Address of correspondence: Dr Alexandros Baltzis, School of Journalism and Mass Media Studies,
Aristotle University of Thessaloniki, 46 Egnatia St., Thessaloniki, GR-54625, Greece. Email: [email protected]. Homepage: http://users.auth.gr/baltzis/en/.
Arts, Culture and the Public Sphere
2
economy (Condry, 2004).
Although these developments are important to understand the changes in the modes
of production, dissemination, and reception of music, little attention has been given to
the factors that may influence the use of the various distribution channels. This paper
and the research it presents address this issue.
The sociology of taste emphasizes on the musical preferences and their relation with
status and lifestyles (for a review see Lizardo & Skiles, 2008) and a major part of the
sociology of music explores its functions from this perspective and in larger social and
societal contexts (see for reviews Peterson & Dowd, 2004; Chan & Goldthorpe, 2007).
However, to study the acquisition patterns of music, from a sociological point of view
means to study some of the ways in which an important part of the cultural capital is
objectified. In other words, analyzing these patterns might contribute to a better under-
standing of the everyday cultural practices within the modes of production, circulation
and reception of symbolic forms in societies where mediation and intermediaries are
dominant. From this point of view, understanding the functions of music in everyday
life and in different social environments should also include an examination of the ac-
quisition patterns, because they also provide some indication about the attitudes of the
audiences towards the cultural industries and the cultural market, i.e., towards the pro-
ducers of the symbolic forms and the mechanisms of their circulation in society. Be-
sides, the common ways through which people objectify their cultural capital, are an
integral part of their habitus and lifestyles. As such, they might as well shed some light
on several forms of cultural resistance or conformity, as well as on some subtleties of
the social interactions. Hence, there is some sociological interest in studying the music
acquisition patterns.
The recording industry might also benefit from the study of these patterns, since �–
as the brief account at the beginning of this paper suggests �– they have a serious impact
on its strategy and tactics in the struggle to gain the attention (and mainly the money) of
the audiences. But this is a matter exceeding the scope of this paper.
Theoretical background and research questions
Economic theory cannot explain levels and patterns of cultural consumption. This
can be seen in the failure to explain based on price and income only the advent and
Music distribution channels, values, preferences 3
domination of certain musical styles and not others, the emergence and the decline of
the various mainstream genres, or the marginalization of some styles and the corporate
annexation of others (see for a review Dolfsma, 1999). The theory of maximum utility
for minimum input is not applicable here either.
On the other hand, the distribution channel theory has paid little attention to the
channel choice by consumers focusing mainly on channel design and management
(Black, Lockett, Ennew, Winklhofer & McKechnie, 2002; Albesa, 2007). In cases
where the consumer choice of distribution channel is studied, researchers highlight im-
portant aspects related with consumer behaviour and motivation in multichannel envi-
ronments, but they nevertheless concentrate on the purchase process and mainly on
fields other than cultural consumption, like travel and financial services (e.g. Black et.
al., 2002; Schoenbachler & Gordon, 2002; Balasubramanian, Raghunathan & Mahajan,
2005; Albesa, 2007). Rather than exploring patterns of distribution channels use, they
examine the factors that influence the consumer choice of one retail channel over an-
other (see for a review Slack, Rowley & Coles, 2008). Besides, concentrating on formal
purchase and retail researchers do not examine the complete set of distribution channels
excluding �– for instance �– social networks and informal channels or secondary markets,
which are very important in the music business (see for an example on concerts Con-
nolly & Krueger, 2006: 688-691). Hence, for music, the distribution channel theory
cannot provide a satisfactory explanation about the patterns of objectification of cultural
capital within the modes of production, circulation and reception of symbolic forms.
This paper takes a different stance from the economic and the distribution channel
theories. It takes into account values and preferences, presuming that they are more im-
portant for the patterns of obtaining symbolic forms like music.
Values are important determinants of people�’s attitudes and behaviour (Rokeach,
1973; Schwartz, 1992; for a review, see Schwartz & Bardi, 2001). Values describe and
prescribe what people think is important to them in their lives. They are motivations,
broad goals that apply across contexts and time. In other words, values are desirable
goals, varying in importance, that serve as guiding principles in people�’s life (Schwartz
& Sagiv, 1995). Schwartz (1992) introduced a structural model of values describing
their content and internal structure. The content of ten value types is: power, achieve-
ment, hedonism, stimulation, self-direction, universalism, benevolence, conformity, tra-
Arts, Culture and the Public Sphere
4
dition and security. According to the model, the ten value types can be organized into
four higher-level value types: (a) self-transcendence (universalism and benevolence)
emphasizing acceptance of others as equals and concern for their welfare, (b) self-
enhancement (power and achievement) emphasizing pursuit of own success and domi-
nance over others, (c) openness to change (self-direction and stimulation) emphasizing
independent thought and action and favoring change, and (d) conservation (security,
conformity, and tradition) emphasizing submissive self-restriction to preserve the status
quo. The theory has been tested in more than 200 samples from more than 65 countries.
In most samples, the distinctiveness of the values and their structural relations have
been verified.
Music, on the other hand, like any cultural product has the symbolic value of a
marker. It has a highly symbolic meaning for individual and collective identity, for in-
clusion and exclusion (Bryson, 1997; Dolfsma, 1999; Bogt, 2003; North & Hargreaves,
2007). It marks social, cultural and subcultural divisions in an exceptional way (cf.
Bourdieu, 1984: 18-19). Sociological research since the 1940s (e.g. Schuessler, 1948)
has shown what Bourdieu (1984), Peterson (1992), and many other researchers keep
confirming �– more than half of a century now �– in various countries1: there is no other
marker of social distinction as clear as the musical preferences. In Bourdieu�’s words,
�“[�…] nothing more clearly affirms one�’s �‘class�’, nothing more infallibly classifies, than
tastes in music�” (1984: 18). Regardless of the shifts in the sociology of taste from the
homology to the omnivorous paradigm and subsequently to the scenes perspective (see
for a review Lizardo & Skiles, 2008), regardless of whether the distinction is perceived
from Bourdieu�’s or Peterson�’s point of view, or just as variability of the individual life-
styles (see Chan & Goldthorpe, 2007), the bottom line is that research indicates that
music preferences mark social distinctions.
It is this symbolic function that transforms through the process of reception the in-
strumental values of music (attributed through the process of production and distribu-
tion) into expressive ones. That is, while for the cultural intermediaries music as a
commodity incorporates instrumental and utilitarian values, for the members of the au-
dience it incorporates expressive values in terms of its symbolic meaning as a social
1 For Spain, see López-Sintas et al., 2008; for a comparative analysis of Italy, Israel, Germany, Sweden
and the United States, see Katz-Gerro, 2002; for France, see Bourdieu, 1984; for Great Britain, see Chan & Goldthorpe, 2007.
Music distribution channels, values, preferences 5
marker for status, for cultural capital, for the collective and individual identities. Hence,
several researchers have been interested in the relation between values and music pref-
erences. Research results indicate that there is actually such a relation. For example,
North & Hargreaves (2007) have shown that music preferences differentiated along the
dichotomy liberal-conservative are associated with behaviours, attitudes, beliefs, life-
styles and political views differentiated respectively along the same dichotomy.
Gardikiotis & Baltzis (2008) found that Schwartz�’s four higher-level value types are
strongly related with certain structures of music preferences (e.g. openness to change is
positively associated with and predicts the preference for non-mainstream dissonant
music styles; conformity to social harmony and the status quo is associated with the
preference for sentimental and sensational music styles, etc.).
Although sociological research on music preferences as a social marker has a long
pedigree, little attention has been given to the patterns of music acquisition. Addressing
this issue, an exploratory study was carried out to examine the influence of values, mu-
sic preferences, and demographic factors on the use of the music distribution channels.
Despite the exploratory character of this study, several research questions might be
formulated. For example, people holding the value of openness to change and/or prefer-
ring non mainstream dissonant music styles, are expected to use more frequently non
traditional and non mainstream distribution channels such as mobile phones or the
internet and less frequently other types of channels, like the music stores. People hold-
ing the values of conformity and security and/or preferring sentimental and sensational
music styles, are expected to obtain music more frequently from traditional and formal
distribution channels, like music stores, and less frequently from informal and non tradi-
tional distribution channels. It is also interesting to establish the extent to which demo-
graphic factors like gender, geographical origin, family income, and cultural back-
ground may influence the patterns of use of the distribution channels. We might for ex-
ample expect that in the pattern of people with higher income, social status and cultural
background, the music stores may take a more significant place compared with press
offers, free downloading, or mobile phones. However, since there is no previous re-
search close enough to these questions and this is an exploratory study, the main object
is not to test a complete set of hypotheses, but rather to explore which set of factors (so-
cial values, music preferences, and demographics) may be a better predictor for the use
Arts, Culture and the Public Sphere
6
of music distribution channels and which combination of factors might explain better
the patterns of distribution channel use. To summarize, the main object of this explora-
tory study is to examine the differences between groups of people in terms of their
�“mapping�” the various music distribution channels.
Research design and methods
Sample description and data collection
A convenience sample of 456 students from the three higher education institutes lo-
cated in Thessaloniki, Greece, participated in the study during the winter semester of the
academic year 2007-2008.
To explore the influence of socioeconomic factors, respondents were asked to indi-
cate through a set of questions their annual family income, the place of their origin, the
education and the occupation of their parents. Income level was measured on a 4-point
scale2. The place of origin was coded as an ordinal 4-point variable taking into account
the differences on the range of choices among rural, urban, and major urban centers.
The fourth point on that scale represented origin from abroad (3.7% of the sample). Par-
ticipants were also asked to indicate the highest level of education of their parents on a
5-point scale3. Finally, they were asked to indicate the occupation for both of their par-
ents. The data on the occupation of the parents were subsequently processed and coded
to construct a composite 7-point ordinal variable of socioeconomic status4. The occupa-
tions were codified following a modification of the International Standard Classification
of Occupations (ISCO-08) system, published by the International Labour Organization
(ILO, 2008), considering the classification used by the National Statistical Service of
Greece as well. Taking also into consideration several theoretical arguments and their
empirical application in research (see Bourdieu, 1984; Peterson, 1992; Katz-Gerro,
2 The scale is based on IRS regulations about the franked income of natural entities (�€12,000) as well as
on data provided by the National Statistical Service of Greece (2006) about the threshold of risk of pov-erty in Greece for 2005 (�€11,864.54 annual income per household with two adults and two children).
3 From 1 to 5 the points are: 9-year compulsory education, 3-year lyceum (post compulsory), higher edu-cation, postgraduate studies (Master�’s degree), and doctorate.
4 The points on this scale are (from 1 to 7): employees (middle & lower rank staff, clerks) and workers; technicians, retailers, small and middle businessmen, and farmers; teachers (in primary and secondary education); managers & higher administrative staff; businessmen; professionals (with a degree, like lawyers, dentists etc.); academics and judicature.
Music distribution channels, values, preferences 7
2002; Chan & Goldthorpe, 2006), position in the hierarchy of the organization of pro-
duction (administrative/managerial or subordinate) and prestige were crucial criteria for
this scale. Academic credentials required for different groups of occupations were also
considered as well as income. Members of the population under examination were con-
sulted to construct and refine the scale, since prestige was considered too. Therefore,
this variable reflects also the representations of this specific population about the social
hierarchy.
From the initial sample, nine questionnaires were excluded either because they were
incomplete (more than 20%) or because the answers were inconsistent. Age ranged
from 17 to 33 years (M=20.71, SD=2.40) and the sample included 223 female and 224
male respondents. 41.4% of the respondents come from the two largest urban centers of
the country (Athens and Thessaloniki), 42.9% from urban centers, 12% from rural cen-
ters and 3.7% are foreign citizens (either from Greek or foreign origin). Measured on a
4-point scale, 11.1% have a family annual income lower than �€13,001; 31.1% from
�€13,001 to �€24,000; 31.9% from �€24,001 to �€35,000 and 25.9% more than �€35,001.
10.5% of the students are from a family with parents graduated from compulsory 9-year
school, 26.2% from 3-year lyceum, 56.9% have parents graduated from higher educa-
tion institutes, 3.6% have parents with a postgraduate diploma, and 2.9% with a doctor-
ate degree. Finally, 20.72% of the respondents have parents working as managers and
higher administrative staff (see footnote 4); 19.28% as employees or workers; 17.59%
professionals; 14.7% technicians, retailers, small and middle businessmen or farmers;
13.49% teachers in primary and secondary education; 11.57% businessmen; 2.65% aca-
demics or judicature.
The structures of music preferences
Lack of previous relevant research on the Greek case made necessary the identi-
fication of the music genres and subgenres that are generally known to the population
under consideration. An initial pool of items was created by data drawn from the charts
for Greek and non-Greek music, published by the Association of Greek Producers of
Phonograms (affiliate of the International Federation of the Phonographic Industry) and
by taking into account different genres broadcasted by major radio stations. The initial
pool of items was checked, in a pretest, with an independent sample of students in order
to produce the final questionnaire (see Christenson & Peterson, 1988; Wells & Toki-
Arts, Culture and the Public Sphere
8
noya, 1998). The pretest was also meant to trace non-mainstream genres, since the
above mentioned sources promote generally mainstream music and it was not clear
whether there are genres known to this population, but not visible in the media. In addi-
tion, the pretest was used to determine at least one typical representative singer or group
for each genre or subgenre, in order to avoid ambiguity concerning the meaning of the
genres. The 24 items that came up from the pretest were: alternative, funk, blues, pop
(contemporary, Western-style), Greek pop, rap/hip-hop, Greek rap/hip-hop, rock, Greek
rock, hard rock/heavy metal, house, jazz, punk, reggae, rock �’n�’ roll, soul/r & b, trance,
world (ethnic) music, classical music, Greek folk (traditional), rebetika, laika, laika-
pop, and Greek art-popular music. Respondents were asked to indicate their liking or
disliking of the 24 music genres (on a 5-point scale, 1 = I don’t like it at all to 5 = I like
it very much).
For some of these genres it is necessary to make additional notes. Thus, for clas-
sical music it was established that there is no point in differentiating between pre-
classical (e.g. renaissance or baroque) and post-classical music (e.g. romantic or serial).
Therefore, for the purposes of this study, this item included Western art music, regard-
less of specific style or strand, as it is used in everyday discourse, often also by learned
audiences. The Greek folk (traditional) genre includes demotica (rural folk music from
continental Greece) and island folk music as well, both developed through oral tradi-
tion. Rebetika is a kind of urban popular music developed by the end of the 19th and es-
pecially by the beginning of the 20th century, based initially on a modal musical system
from Arab, Turkish and Byzantine origin (makami, maq m) and later influenced by the
Western tonal system. This kind of music was developed by marginal, marginalized,
and non-conformist social strata and was heavily influenced by the musical culture of
the refugees from Asia Minor (Papageorgiou, 1997; Pennanen, 1997). Laika is a genre
related in a complex way with rebetika. It is a �“lighter�” form of urban popular music,
based mainly on the Western tonal system and disseminated by the recording and film
industry, as well as by radio and television. Developed during the post-war era, this
genre �– although clearly distinct �– is influenced by a variety of popular musics: Western
European, Latin American, North American, Turkish, Egyptian and Indian (Papageor-
giou, 1997; Pennanen, 1997). Laika-pop is a hybrid genre based mainly on Western-
style pop music, and incorporating also some elements of Arabic origin, as well as ele-
Music distribution channels, values, preferences 9
ments from rebetika and laika genres. This type of music originates from an older genre
that emerged from the night-club culture during the �’70s and the �’80s (cf. Papageorgiou,
1997). The emphasis on simple rhythmic patterns, the use of naïve melodic and conven-
tional �– easily recognizable �– harmonic structures, as well as the sentimental lyrics, are
the main features of this genre. The Greek art-popular music (entechno) is a genre de-
veloped in the �’60s by composers like Mikis Theodorakis, Manos Hadjidakis, and oth-
ers that combined poetry by celebrated writers with specific musical styles (frequently
including complex harmonies, polyrhythm, and counterpoint), influenced by rebetika
music and often incorporating melodic and rhythmic elements from traditional folk and
Byzantine music. The genre has been based on concerns over social and political in-
volvement and the rejection of the distinction between �“serious�” and �“light�” music (cf.
Papageorgiou, 1997).
To reveal latent structures of the music preferences exploratory factor analysis was
employed. Following Costello and Osborne (2005) the test was carried out with 4, 5, 6
and 7 components subsequently, to determine the best solution. The purpose for running
multiple factor analyses was also to establish whether there are any persistent underly-
ing structures regardless of the number of factors retained.
Since the music preferences were not normally distributed, principal axis factoring
was employed as the method of extraction (see Costello & Osborne, 2005; Leech, Bar-
rett, & Morgan, 2005). To allow for some correlation between the extracted factors the
PROMAX method of rotation was used. The decision to use an oblique method of rota-
tion is based on the assumption that there is some relation (either negative or positive)
among various groups of preferences for certain genres, i.e. that the components re-
tained are somehow related. This assumption results from the fact that the sociological
theories of music preferences (like Peterson�’s thesis about omnivorousness or
Bourdieu�’s homology hypothesis, for example) as well as data resulted from relevant
empirical research map the relations and correlations among the different tastes in terms
of their function as symbols of inclusion or exclusion, socioeconomic status, power, cul-
tural capital, in- and out-group differentiation etc. Thus, like in a map, each like and dis-
like takes up a position relative to all other genre preferences (cf. Bryson, 1997; Bogt et
al., 2003; Savage, 2006).
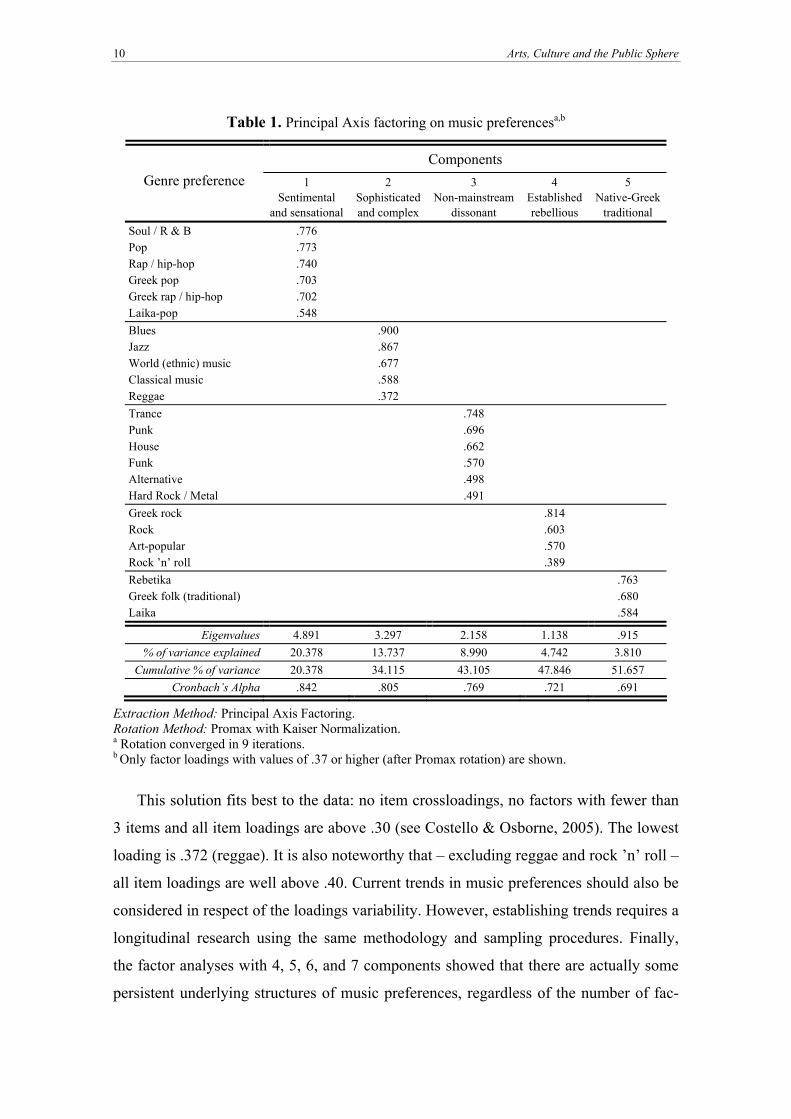
The most meaningful solution was arrived at with 5 components (Table 1).
Arts, Culture and the Public Sphere
10
Table 1. Principal Axis factoring on music preferencesa,b
Components Genre preference 1
Sentimental and sensational
2 Sophisticated and complex
3 Non-mainstream
dissonant
4 Established rebellious
5 Native-Greek
traditional Soul / R & B .776 Pop .773 Rap / hip-hop .740 Greek pop .703 Greek rap / hip-hop .702 Laika-pop .548 Blues .900 Jazz .867 World (ethnic) music .677 Classical music .588 Reggae .372 Trance .748 Punk .696 House .662 Funk .570 Alternative .498 Hard Rock / Metal .491 Greek rock .814 Rock .603 Art-popular .570 Rock �’n�’ roll .389 Rebetika .763 Greek folk (traditional) .680 Laika .584
Eigenvalues 4.891 3.297 2.158 1.138 .915 % of variance explained 20.378 13.737 8.990 4.742 3.810
Cumulative % of variance 20.378 34.115 43.105 47.846 51.657 Cronbach’s Alpha .842 .805 .769 .721 .691
Extraction Method: Principal Axis Factoring. Rotation Method: Promax with Kaiser Normalization. a Rotation converged in 9 iterations. b Only factor loadings with values of .37 or higher (after Promax rotation) are shown.
This solution fits best to the data: no item crossloadings, no factors with fewer than
3 items and all item loadings are above .30 (see Costello & Osborne, 2005). The lowest
loading is .372 (reggae). It is also noteworthy that �– excluding reggae and rock �’n�’ roll �–
all item loadings are well above .40. Current trends in music preferences should also be
considered in respect of the loadings variability. However, establishing trends requires a
longitudinal research using the same methodology and sampling procedures. Finally,
the factor analyses with 4, 5, 6, and 7 components showed that there are actually some
persistent underlying structures of music preferences, regardless of the number of fac-
Music distribution channels, values, preferences 11
tors extracted. The �“sentimental and sensational�” preference structure, as well as the
�“sophisticated and complex�” extracted from each analysis comprise the same items.
The structures of values
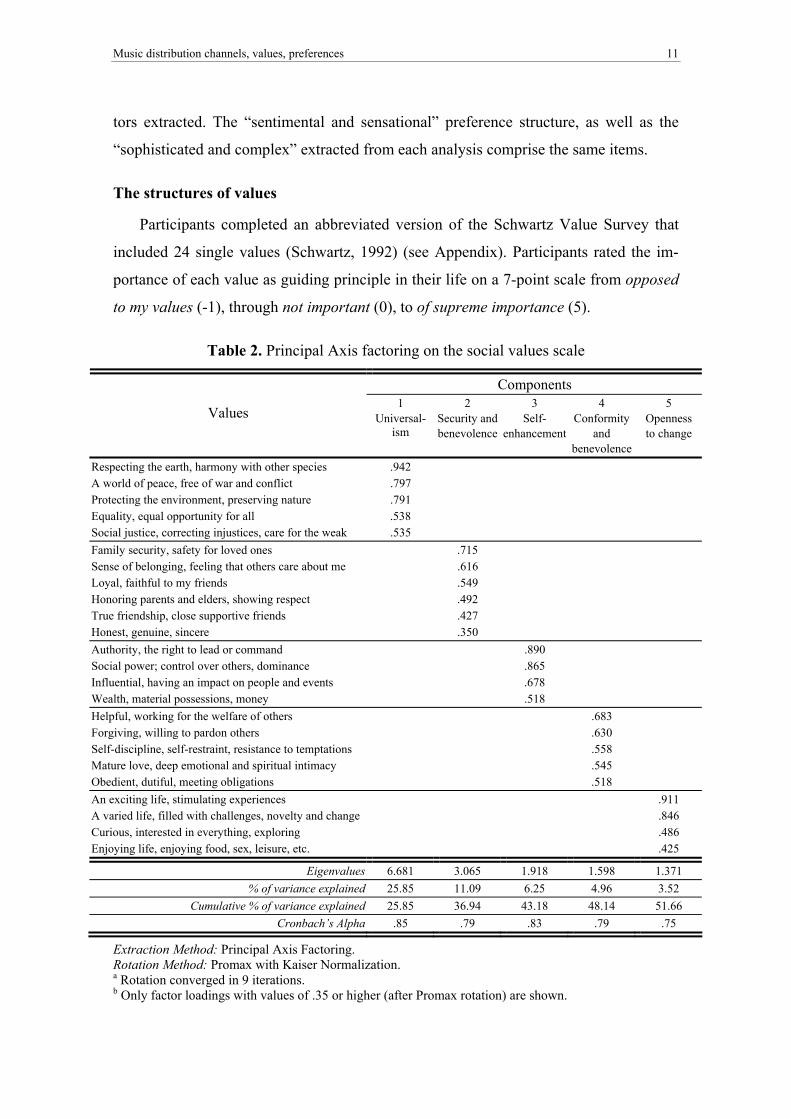
Participants completed an abbreviated version of the Schwartz Value Survey that
included 24 single values (Schwartz, 1992) (see Appendix). Participants rated the im-
portance of each value as guiding principle in their life on a 7-point scale from opposed
to my values (-1), through not important (0), to of supreme importance (5).
Table 2. Principal Axis factoring on the social values scale
Components
Values 1
Universal-ism
2 Security andbenevolence
3 Self-
enhancement
4 Conformity
and benevolence
5 Openness to change
Respecting the earth, harmony with other species .942 A world of peace, free of war and conflict .797 Protecting the environment, preserving nature .791 Equality, equal opportunity for all .538 Social justice, correcting injustices, care for the weak .535 Family security, safety for loved ones .715 Sense of belonging, feeling that others care about me .616 Loyal, faithful to my friends .549 Honoring parents and elders, showing respect .492 True friendship, close supportive friends .427 Honest, genuine, sincere .350 Authority, the right to lead or command .890 Social power; control over others, dominance .865 Influential, having an impact on people and events .678 Wealth, material possessions, money .518 Helpful, working for the welfare of others .683 Forgiving, willing to pardon others .630 Self-discipline, self-restraint, resistance to temptations .558 Mature love, deep emotional and spiritual intimacy .545 Obedient, dutiful, meeting obligations .518 An exciting life, stimulating experiences .911 A varied life, filled with challenges, novelty and change .846 Curious, interested in everything, exploring .486 Enjoying life, enjoying food, sex, leisure, etc. .425
Eigenvalues 6.681 3.065 1.918 1.598 1.371 % of variance explained 25.85 11.09 6.25 4.96 3.52
Cumulative % of variance explained 25.85 36.94 43.18 48.14 51.66 Cronbach’s Alpha .85 .79 .83 .79 .75
Extraction Method: Principal Axis Factoring. Rotation Method: Promax with Kaiser Normalization. a Rotation converged in 9 iterations. b Only factor loadings with values of .35 or higher (after Promax rotation) are shown.
Arts, Culture and the Public Sphere
12
To reveal latent structures of values a similar analytical procedure to that of music
preferences was followed. A principal axis analysis (with PROMAX rotation) revealed
five factors (see Table 2). Three of them essentially reproduced two of the higher-level
value types of Schwartz�’s model: self-enhancement (power and achievement, Cron-
bach�’s alpha=.83) and openness to change (self-direction, stimulation, and hedonism,
Cronbach�’s alpha=.75). A third factor comprised universalism items (equality, world at
peace, respecting the earth, plus the social justice item, Cronbach�’s alpha=.85). The last
two factors comprised of value types that usually load on the social-transcendence type
and conservation type: one factor with security and benevolent items (i.e., family secu-
rity, sense of belonging, loyal, true friendship plus the honouring parents and elders
item, Cronbach�’s alpha=.79); a second factor with conformity and benevolent items
(i.e., self-discipline, obedience, mature love, helpfulness, forgivingness, Cronbach�’s al-
pha=.79).
The distribution channels
Respondents were asked to indicate how often they obtain music through a variety
of ways (called from now on distribution channels): music stores, internet purchase,
free downloads, mobile phone, press offers (i.e. from papers and/or magazines), ped-
dlers, and friends. This pool of items was created by consultation with several students
and then it was checked, in a pretest, with an independent sample of students to produce
the final question. The participants indicated their answer on a 5-point scale (0=never
through 4=always) and the ratio of the use of each channel to the total use of all chan-
nels was calculated for each respondent, to obtain the patterns of use.
The distribution channels were distinguished in four groups based on two criteria:
formality of structure and type of transaction. Thus, one pair of groups includes the
formal and informal distribution channels. Friends, peddlers and free downloads are in-
formal channels, while music stores, downloads on payment, mobile phone, as well as
press offers are formal. Formal distribution channels are structured through impersonal
ways, i.e., the terms of trade and the division of marketing functions among the channel
members are legitimized, authorized and controlled by economic and state mechanisms.
There are contractual and employment regulations as well as state control through taxa-
tion and economic policy (cf. Stern & Reve, 1980; Portes & Sassen-Koob, 1987). The
informal distribution channels, on the other hand, are structured mainly by non-
Music distribution channels, values, preferences 13
economic mechanisms (social networks, processes of socialization etc.). Peddlers sell-
ing unauthorized copies are a specific case: in Greece they appeared through what M.
Castells calls �“perverse integration�” (2000: 71-73) which involves economic, social and
political processes. They are beyond any conventional regulation of contracts, transac-
tions and employment, and therefore included in the informal economy sector (see
Portes & Sassen-Koob, 1987).
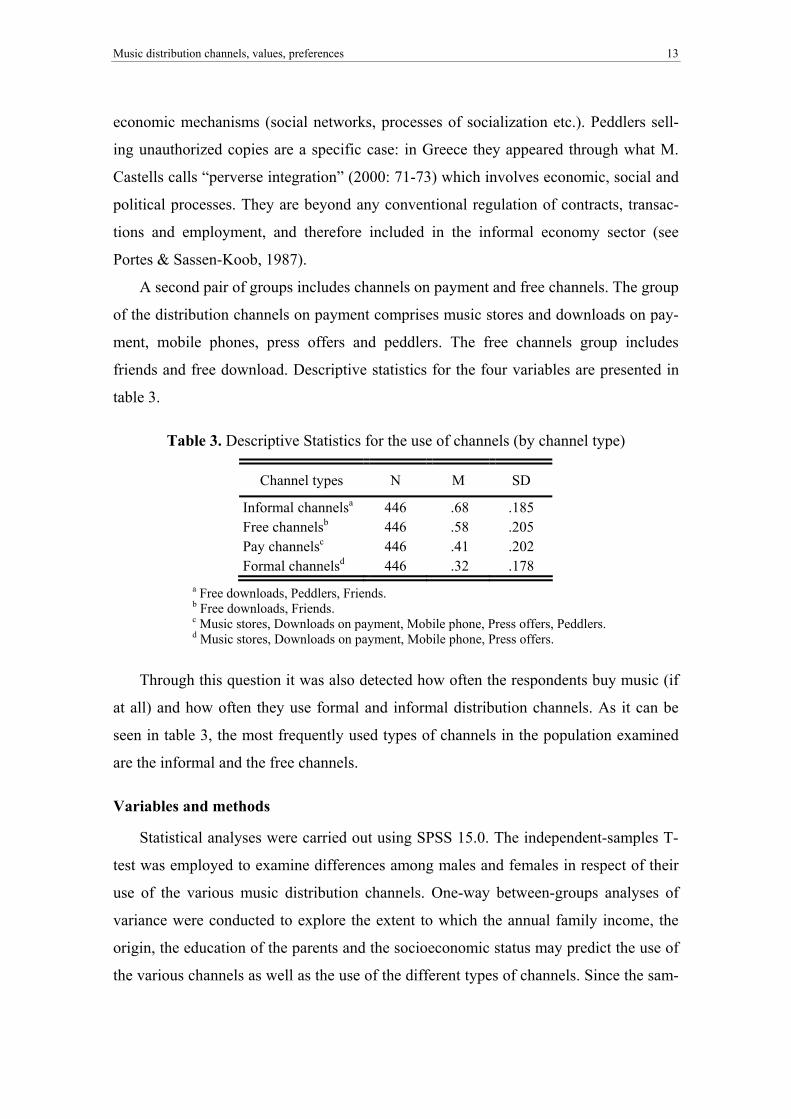
A second pair of groups includes channels on payment and free channels. The group
of the distribution channels on payment comprises music stores and downloads on pay-
ment, mobile phones, press offers and peddlers. The free channels group includes
friends and free download. Descriptive statistics for the four variables are presented in
table 3.
Table 3. Descriptive Statistics for the use of channels (by channel type)
Channel types N M SD
Informal channelsa 446 .68 .185 Free channelsb 446 .58 .205 Pay channelsc 446 .41 .202 Formal channelsd 446 .32 .178
a Free downloads, Peddlers, Friends. b Free downloads, Friends. c Music stores, Downloads on payment, Mobile phone, Press offers, Peddlers. d Music stores, Downloads on payment, Mobile phone, Press offers.
Through this question it was also detected how often the respondents buy music (if
at all) and how often they use formal and informal distribution channels. As it can be
seen in table 3, the most frequently used types of channels in the population examined
are the informal and the free channels.
Variables and methods
Statistical analyses were carried out using SPSS 15.0. The independent-samples T-
test was employed to examine differences among males and females in respect of their
use of the various music distribution channels. One-way between-groups analyses of
variance were conducted to explore the extent to which the annual family income, the
origin, the education of the parents and the socioeconomic status may predict the use of
the various channels as well as the use of the different types of channels. Since the sam-
Arts, Culture and the Public Sphere
14
ple size was large enough (30+), employing these tests is acceptable, regardless of vio-
lating the normality assumption (Pallant, 2001: 172). However, since the collection of
data occurred in group settings, the alpha was set at a more rigorous value (p<0.01, see
Pallant, 2001: 171).
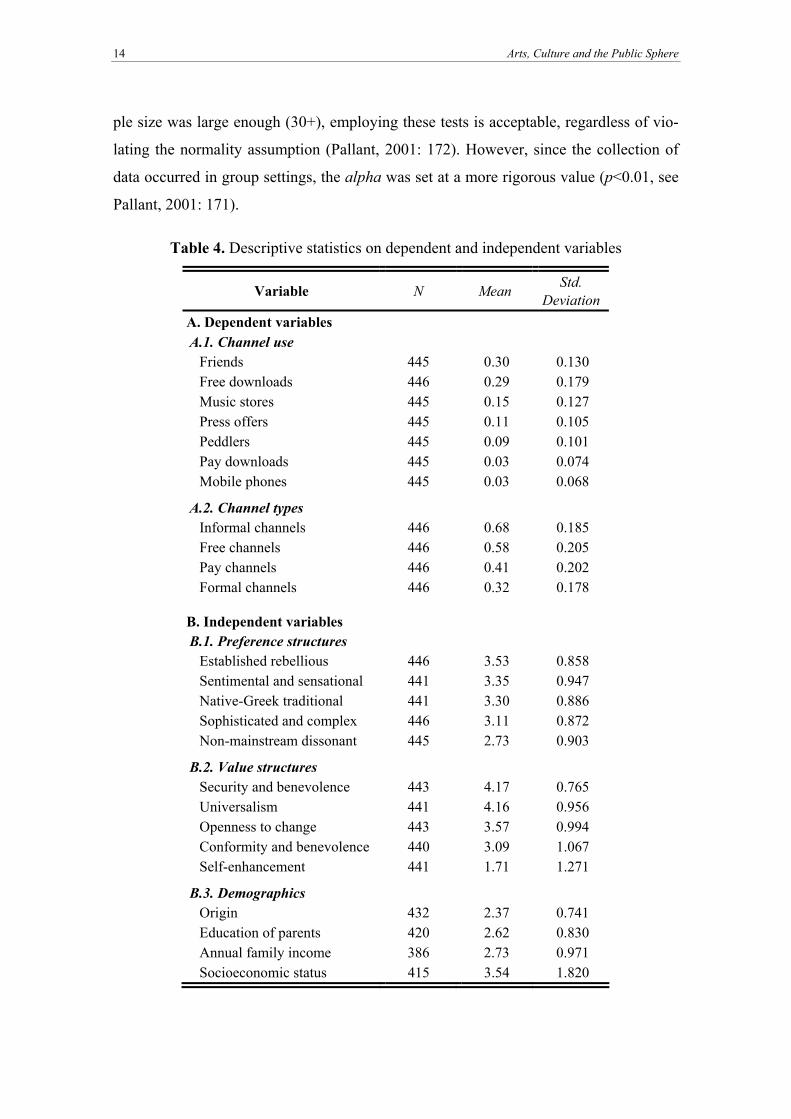
Table 4. Descriptive statistics on dependent and independent variables
Variable N Mean Std. Deviation
A. Dependent variables A.1. Channel use
Friends 445 0.30 0.130 Free downloads 446 0.29 0.179 Music stores 445 0.15 0.127 Press offers 445 0.11 0.105 Peddlers 445 0.09 0.101 Pay downloads 445 0.03 0.074 Mobile phones 445 0.03 0.068
A.2. Channel types Informal channels 446 0.68 0.185 Free channels 446 0.58 0.205 Pay channels 446 0.41 0.202 Formal channels 446 0.32 0.178
B. Independent variables B.1. Preference structures
Established rebellious 446 3.53 0.858 Sentimental and sensational 441 3.35 0.947 Native-Greek traditional 441 3.30 0.886 Sophisticated and complex 446 3.11 0.872 Non-mainstream dissonant 445 2.73 0.903
B.2. Value structures Security and benevolence 443 4.17 0.765 Universalism 441 4.16 0.956 Openness to change 443 3.57 0.994 Conformity and benevolence 440 3.09 1.067 Self-enhancement 441 1.71 1.271
B.3. Demographics Origin 432 2.37 0.741 Education of parents 420 2.62 0.830 Annual family income 386 2.73 0.971 Socioeconomic status 415 3.54 1.820

Music distribution channels, values, preferences 15
Because this is an exploratory study, the Least Significant Differences post hoc test
was employed for those analyses where the variances of the groups were equal. For the
analyses violating this assumption, the Games-Howell post hoc test was used to estab-
lish significant differences between groups. To determine the best predictors for the use
of the music distribution channels, hierarchical multiple regression analyses were con-
ducted for music preferences and social values predicting the use of music distribution
channels ungrouped and by type (grouped).
Data analyses and results
Gender
Males were found significantly different from females on obtaining music through
free downloads (p<0.001), mobile phones (p<0.005), press offers (p<0.05), and from
peddlers (p<0.005). The mean for males on obtaining music through free downloads
(0.34) is significantly higher that the mean for females (0.23) and this is the only chan-
nel on which males have higher mean than females. This indicates that free downloads
take a significantly more important place in the male pattern of obtaining music (34% of
the total use of distribution channels) in comparison with the female pattern (23%) and
this is also the only case where the magnitude of the difference is larger than typical
(d=0.62). Females obtain music more often from friends (30%), through free downloads
(23%), from music stores (16%), press offers (12%), peddlers (11%), through the mo-
bile phone (4%) and internet purchase (4%). The male pattern is slightly different.
Males obtain music more often through free downloads (34%), from friends (30%), mu-
sic stores (13%), press offers (10%), peddlers (8%), through mobile phones (2%) and
internet purchase (2%). Although statistically significant differences were found, the
effect size d on obtaining music through mobile phones (d=0.29), press offers (d=0.21),
and from peddlers (d=0.28) is smaller than typical. This indicates that there are no ma-
jor differences between males and females on the patterns of use of the various distribu-
tion channels. No statistically significant differences were found between males and fe-
males on the patterns of music acquisition concerning the music stores, the download on
payment and friends.
The independent samples T-test was also employed to explore differences in respect
Arts, Culture and the Public Sphere
16
of the formal channels and the pay channels. Males differ significantly from females on
the use of all types of distribution channels (p<0.001) and the magnitude of these differ-
ences is rather typical (d=0.43 for the formal channels, d=0.44 for the informal, d=0.53
for the channels on payment, and d=0.54 for the free channels).
The informal and the free channels take a more important place in the male pattern
of music acquisition (72% and 64%) compared with the female pattern (64% and 53%),
while females obtain music more often through formal and pay channels (36% and
46%) than males (28% and 36%). The total sample, however, uses informal and free
channels more often (68% and 58%) than the formal channels and the channels on pay-
ment (32% and 41%).
Socioeconomic factors
The one-way between-groups analysis of variance did not detect any statistically
significant differences among the four levels of annual family income, neither among
the groups that differ on the place of origin (rural, urban, large urban centers, and
abroad). However, several groups differentiated by the education level of their parents
were found to differ significantly on the frequency of obtaining music through free
downloads [F(4, 414)=2.879, p<0.05] and from peddlers5 [F(4, 48.64)=9.865, p<0.001],
as well as through free channels [F(4, 414)=2.469, p<0.05] and channels on payment
[F(4, 414)=2.520, p<0.05].
Fewer differences were detected among some groups defined by the occupation of
their parents, i.e. according to the scale of socioeconomic status constructed for the pur-
poses of this exploratory study. Differences were found on obtaining music through free
downloads [F(6, 407)=2.675, p<0.05] and from peddlers6 [F(6, 98.27)=2.827, p<0.05].
Education of parents
On the free downloads, post hoc Least Significant Differences tests indicate that
there were significant differences between the group with parents graduated from higher
education and the group with parents educated in lyceum (p<0.005, d=0.38). The first
group tends to obtain music more often through free downloads (31%) than the second
one (24%). On buying music from peddlers, the Games-Howell post hoc tests indicate
5 The assumption of homogeneity of variance was violated and therefore the Welch F-ratio is reported. 6 The assumption of homogeneity of variance was violated and therefore the Welch F-ratio is reported.
Music distribution channels, values, preferences 17
that the group with parents having a Master�’s degree differs significantly from the
groups with parents educated on the compulsory level (p<0.001, d=0.97), in lyceum
(p<0.001, d=0.96), and in higher education institutes (p<0.05, d=0.58). This group buys
music from peddlers significantly less frequently (2.4%) than the other groups (compul-
sory education, 12%; lyceum, 12%; higher education, 8.4%). The group with parents
having a doctorate differs significantly from the groups with parents graduated from
compulsory education (p<0.05, d=0.77) and lyceum (p<0.05, d=0.77). Buying music
from peddlers takes a less significant place in the pattern of this group (4.1%) compared
with the patterns of the other two groups (mentioned above). Finally, the difference be-
tween the group with parents graduated from lyceum (12%) and the group with parents
graduated from higher education (8.4%) was found also significant (p<0.05, d=0.39).
These results show that the higher the parents�’ education level, the lower the frequency
of buying music from peddlers.
On the use of free channels, the Least Significant Differences post hoc tests show
that the group with parents having a Master�’s degree differs significantly from the group
with parents that received compulsory education (p=0.05, d=0.61) and the group with
parents graduated from lyceum (p<0.05, d=0.65). The use of free channels takes a sig-
nificant place in the pattern of the group with parents having a Master�’s degree (67.6%),
while this type of distribution channels �– although also important �– takes a more modest
place in the patterns of the other two groups (compulsory education, 55.6%; lyceum
graduates, 54.6%). A significant difference was also found between the group with par-
ents graduated from lyceum and the group with parents having received higher educa-
tion (p<0.05, d=0.28). The latter group obtains music through free channels more often
than the former (60.3% and 54.6% respectively). These findings suggest that there are
significant differences between respondents coming from a family with primary and
secondary education on the one hand and respondents coming from a family with higher
and postgraduate education, on the other. In broad strokes, the higher the education
level of the parents, the higher the frequency of obtaining music through free channels
(free downloads and friends). Since the uses of the free and the pay channels were cal-
culated as mutually dependent, statistically significant differences were found between
the same groups, on the same significance level and with the same magnitude of differ-
ences.
Arts, Culture and the Public Sphere
18
Socioeconomic status
Statistically significant differences among several groups were found only on free
downloads and on buying music from peddlers. The post hoc Least Significant Differ-
ences tests indicate that students with parents working as technicians, retailers, small or
middle businessmen, and farmers differ significantly on obtaining music through free
downloads from students whose parents work as teachers in primary and secondary edu-
cation (p<0.005, d=0.55). They also differ from the groups with parents working as
managers and higher administrative staff (p<0.05, d=0.43), and as professionals with a
degree (p<0.05, d=0.44). Obtaining music through free download takes a more modest
place in the pattern of this group (24%), compared with the students whose parents are
teachers (34%), managers/higher administrative staff (30%), or professionals with a de-
gree, like lawyers and doctors (32%). The group with parents working as teachers differ
significantly from the group whose parents are businessmen (p<0.05, d=0.47), as well
as from students whose parents are academics or in judicature (p=0.05, d=0.58). Free
downloading takes a more important place in the pattern of this group (34%) compared
with the two others (25% and 22% respectively). Finally, on the use of this distribution
channel, students whose parents are professionals with a degree differ significantly from
students whose parents are businessmen (p<0.05, d=0.36). In the pattern of the former
group, free downloads are more important (32%) compared with the latter (25%).
On buying music from peddlers, the analysis of variance was statistically significant
(p<0.05), but the Games-Howell post hoc tests failed to locate significant differences
between the groups defined by the socioeconomic status. As this is an exploratory
study, further research might clarify this discrepancy.
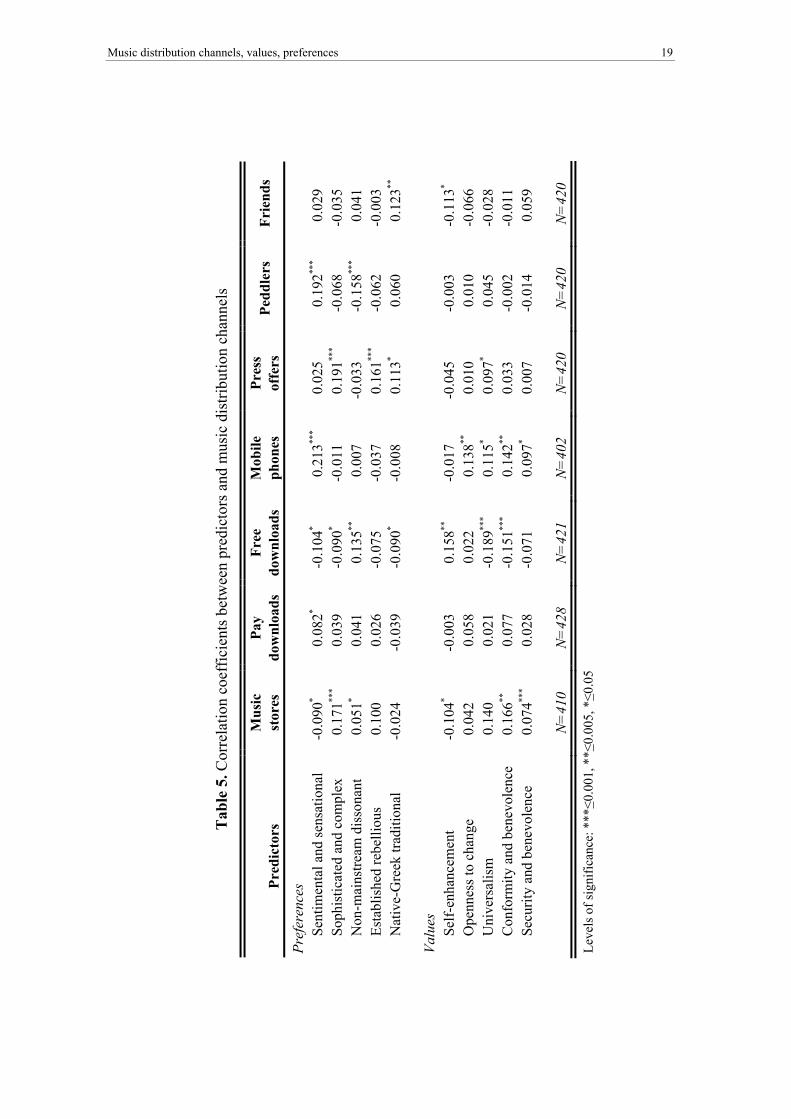
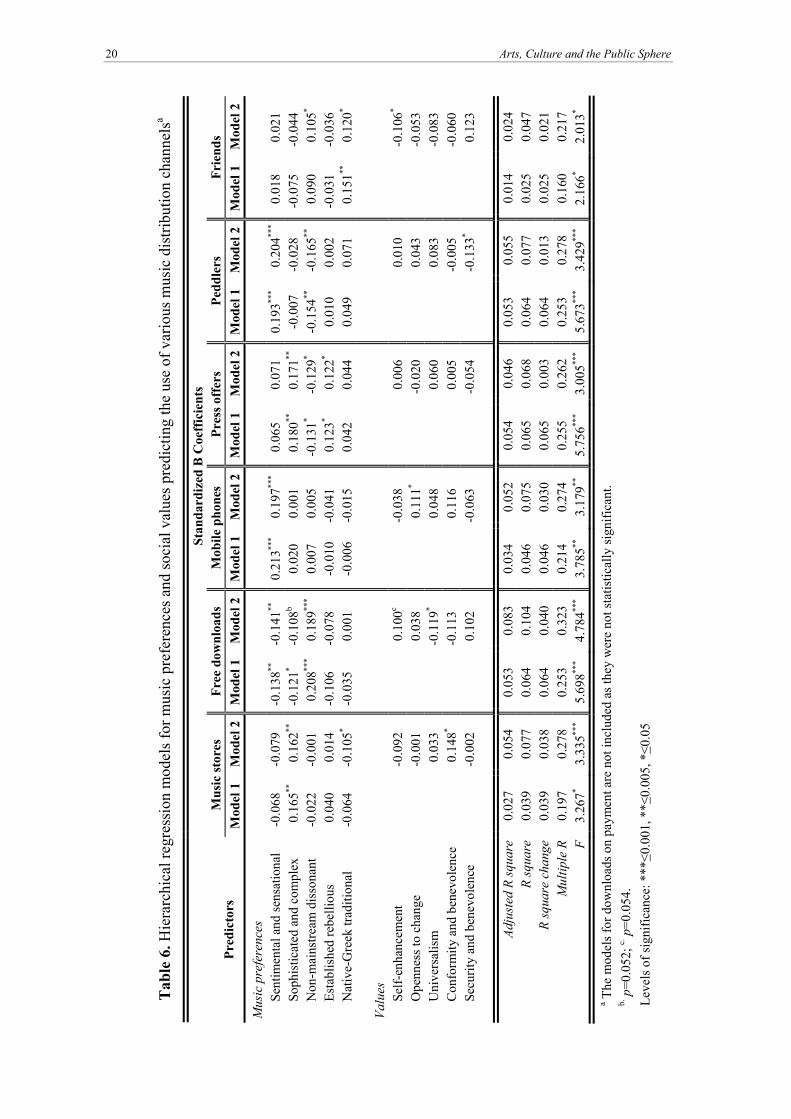
Music preferences and values
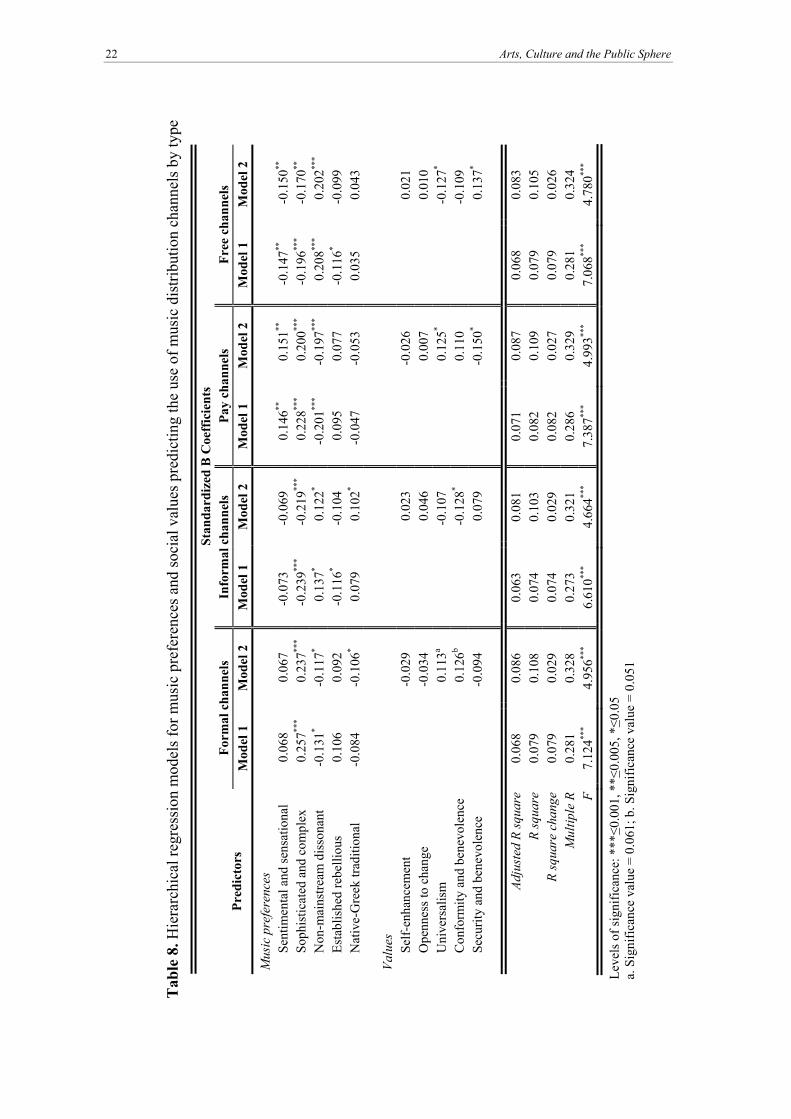
Hierarchical regression analyses were performed on all distribution channels (Table
6), as well as on the types of channels (Table 8). In both cases, music preferences were
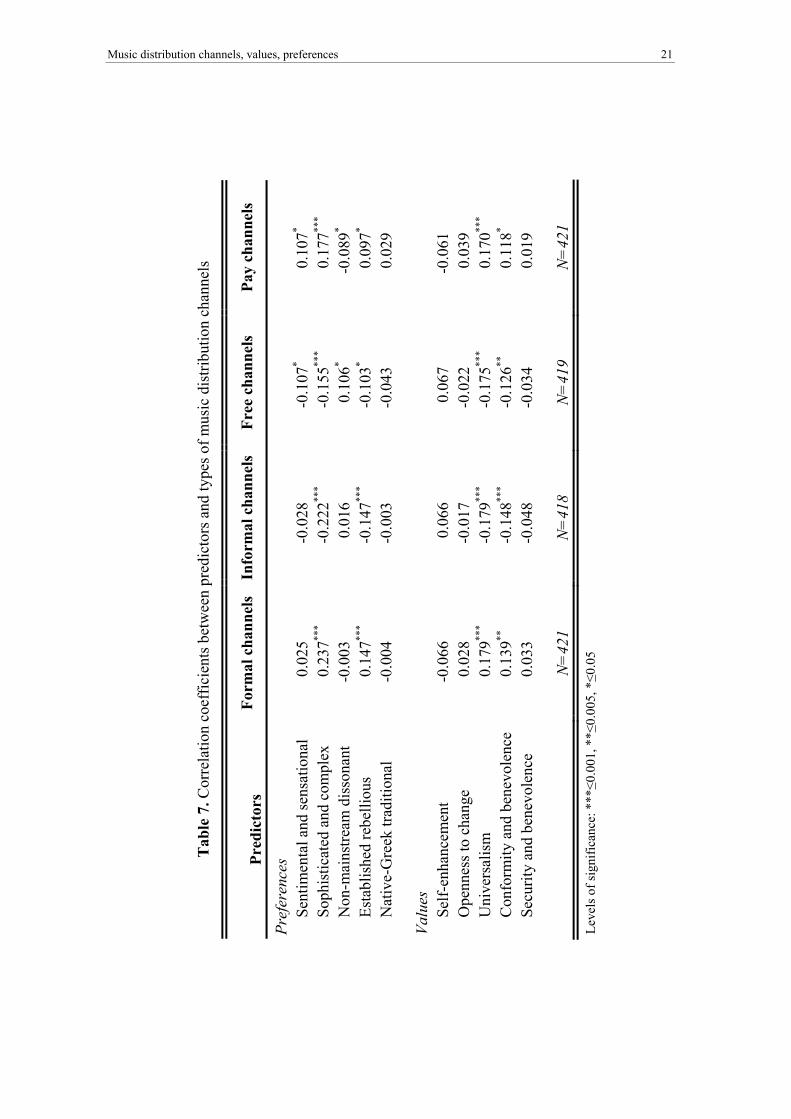
entered in the first model and value types in the second. Correlation coefficients be-
tween predictors and distribution channels, as well as between predictors and types of
channels can be seen in Tables 5 and 7 respectively.
Tab
le 5
. Cor
rela
tion
coef
ficie
nts b
etw
een
pred
icto
rs a
nd m
usic
dis
tribu
tion
chan
nels
Pred
icto
rs
Mus
ic
stor
es
Pay
dow
nloa
ds
Free
do
wnl
oads
M
obile
ph
ones
Pr
ess
offe
rs
Pedd
lers
Fr
iend
s
Pref
eren
ces
Se
ntim
enta
l and
sens
atio
nal
-0.0
90*
0.08
2* -0
.104
* 0.
213**
* 0.
025
0.19
2***
0.02
9 So
phis
ticat
ed a
nd c
ompl
ex
0.17
1***
0.03
9 -0
.090
* -0
.011
0.
191**
* -0
.068
-0
.035
N
on-m
ains
tream
dis
sona
nt
0.05
1* 0.
041
0.13
5**
0.00
7 -0
.033
-0
.158
***
0.04
1 Es
tabl
ishe
d re
belli
ous
0.10
0 0.
026
-0.0
75
-0.0
37
0.16
1***
-0.0
62
-0.0
03
Nat
ive-
Gre
ek tr
aditi
onal
-0
.024
-0
.039
-0
.090
* -0
.008
0.
113*
0.06
0 0.
123**
Valu
es
Self-
enha
ncem
ent
-0.1
04*
-0.0
03
0.15
8**
-0.0
17
-0.0
45
-0.0
03
-0.1
13*
Ope
nnes
s to
chan
ge
0.04
2 0.
058
0.02
2 0.
138**
0.
010
0.01
0 -0
.066
U
nive
rsal
ism
0.
140
0.02
1 -0
.189
***
0.11
5* 0.
097*
0.04
5 -0
.028
C
onfo
rmity
and
ben
evol
ence
0.
166**
0.
077
-0.1
51**
* 0.
142**
0.
033
-0.0
02
-0.0
11
Secu
rity
and
bene
vole
nce
0.07
4***
0.02
8 -0
.071
0.
097*
0.00
7 -0
.014
0.
059
N
=41
0 N
=42
8 N
=42
1 N
=40
2 N
=42
0 N
=42
0 N
=42
0
Leve
ls o
f sig
nific
ance
: ***
0.00
1, *
*0.
005,
*0.
05
Music distribution channels, values, preferences 19
Tab
le 6
. Hie
rarc
hica
l reg
ress
ion
mod
els f
or m
usic
pre
fere
nces
and
soci
al v
alue
s pre
dict
ing
the
use
of v
ario
us m
usic
dis
tribu
tion
chan
nels
a
Stan
dard
ized
B C
oeffi
cien
ts
Mus
ic st
ores
Fr
ee d
ownl
oads
M
obile
pho
nes
Pres
s offe
rs
Pedd
lers
Fr
iend
s Pr
edic
tors
M
odel
1
Mod
el 2
Mod
el 1
M
odel
2M
odel
1
Mod
el 2
M
odel
1
Mod
el 2
Mod
el 1
M
odel
2M
odel
1
Mod
el 2
Mus
ic p
refe
renc
es
Sent
imen
tal a
nd se
nsat
iona
l -0
.068
-0
.079
-0
.138
**
-0.1
41**
0.
213**
* 0.
197**
* 0.
065
0.07
1 0.
193**
* 0.
204**
*0.
018
0.02
1 So
phis
ticat
ed a
nd c
ompl
ex
0.16
5**
0.16
2**
-0.1
21*
-0.1
08b
0.02
0 0.
001
0.18
0**
0.17
1**
-0.0
07
-0.0
28
-0.0
75
-0.0
44
Non
-mai
nstre
am d
isso
nant
-0
.022
-0
.001
0.
208**
* 0.
189**
* 0.
007
0.00
5 -0
.131
* -0
.129
* -0
.154
**
-0.1
65**
0.
090
0.10
5*
Esta
blis
hed
rebe
lliou
s 0.
040
0.01
4 -0
.106
-0
.078
-0
.010
-0
.041
0.
123*
0.12
2* 0.
010
0.00
2 -0
.031
-0
.036
N
ativ
e-G
reek
trad
ition
al
-0.0
64
-0.1
05*
-0.0
35
0.00
1 -0
.006
-0
.015
0.
042
0.04
4 0.
049
0.07
1 0.
151**
0.
120*
Valu
es
Self-
enha
ncem
ent
-0
.092
0.10
0c
-0.0
38
0.
006
0.
010
-0
.106
*
Ope
nnes
s to
chan
ge
-0
.001
0.03
8
0.11
1*
-0.0
20
0.
043
-0
.053
U
nive
rsal
ism
0.03
3
-0.1
19*
0.
048
0.
060
0.
083
-0
.083
C
onfo
rmity
and
ben
evol
ence
0.14
8*
-0.1
13
0.
116
0.
005
-0
.005
-0.0
60
Secu
rity
and
bene
vole
nce
-0
.002
0.10
2
-0.0
63
-0
.054
-0.1
33*
0.
123
Adju
sted
R sq
uare
0.
027
0.05
4 0.
053
0.08
3 0.
034
0.05
2 0.
054
0.04
6 0.
053
0.05
5 0.
014
0.02
4 R
squa
re
0.03
9 0.
077
0.06
4 0.
104
0.04
6 0.
075
0.06
5 0.
068
0.06
4 0.
077
0.02
5 0.
047
R sq
uare
cha
nge
0.03
9 0.
038
0.06
4 0.
040
0.04
6 0.
030
0.06
5 0.
003
0.06
4 0.
013
0.02
5 0.
021
Mul
tiple
R
0.19
7 0.
278
0.25
3 0.
323
0.21
4 0.
274
0.25
5 0.
262
0.25
3 0.
278
0.16
0 0.
217
F 3.
267*
3.33
5***
5.69
8***
4.78
4***
3.78
5**
3.17
9**
5.75
6***
3.00
5***
5.67
3***
3.42
9***
2.16
6* 2.
013*
a The
mod
els f
or d
ownl
oads
on
paym
ent a
re n
ot in
clud
ed a
s the
y w
ere
not s
tatis
tical
ly si
gnifi
cant
. b. p
=0.0
52; c.
p=0
.054
. Le
vels
of s
igni
fican
ce: *
**0.
001,
**
0.00
5, *
0.05
Arts, Culture and the Public Sphere
20
Tab
le 7
. Cor
rela
tion
coef
ficie
nts b
etw
een
pred
icto
rs a
nd ty
pes o
f mus
ic d
istri
butio
n ch
anne
ls
Pred
icto
rs
Form
al c
hann
els
Info
rmal
cha
nnel
sFr
ee c
hann
els
Pay
chan
nels
Pref
eren
ces
Sent
imen
tal a
nd se
nsat
iona
l 0.
025
-0.0
28
-0.1
07*
0.10
7*
Soph
istic
ated
and
com
plex
0.
237**
* -0
.222
***
-0.1
55**
* 0.
177**
*
Non
-mai
nstre
am d
isso
nant
-0
.003
0.
016
0.10
6* -0
.089
*
Esta
blis
hed
rebe
lliou
s 0.
147**
* -0
.147
***
-0.1
03*
0.09
7*
Nat
ive-
Gre
ek tr
aditi
onal
-0
.004
-0
.003
-0
.043
0.
029
Valu
es
Self-
enha
ncem
ent
-0.0
66
0.06
6 0.
067
-0.0
61
Ope
nnes
s to
chan
ge
0.02
8 -0
.017
-0
.022
0.
039
Uni
vers
alis
m
0.17
9***
-0.1
79**
* -0
.175
***
0.17
0***
Con
form
ity a
nd b
enev
olen
ce
0.13
9**
-0.1
48**
* -0
.126
**
0.11
8*
Secu
rity
and
bene
vole
nce
0.03
3 -0
.048
-0
.034
0.
019
N
=42
1 N
=41
8 N
=41
9 N
=42
1
Leve
ls o
f sig
nific
ance
: ***
0.00
1, *
*0.
005,
*0.
05
Music distribution channels, values, preferences 21
Tab
le 8
. Hie
rarc
hica
l reg
ress
ion
mod
els f
or m
usic
pre
fere
nces
and
soci
al v
alue
s pre
dict
ing
the
use
of m
usic
dis
tribu
tion
chan
nels
by
type
Stan
dard
ized
B C
oeffi
cien
ts
Form
al c
hann
els
Info
rmal
cha
nnel
s Pa
y ch
anne
ls Fr
ee c
hann
els
Pred
icto
rs
Mod
el 1
M
odel
2
Mod
el 1
M
odel
2
Mod
el 1
M
odel
2
Mod
el 1
M
odel
2
Mus
ic p
refe
renc
es
Sent
imen
tal a
nd se
nsat
iona
l 0.
068
0.06
7 -0
.073
-0
.069
0.
146**
0.
151**
-0
.147
**
-0.1
50**
Soph
istic
ated
and
com
plex
0.
257**
* 0.
237**
* -0
.239
***
-0.2
19**
* 0.
228**
* 0.
200**
* -0
.196
***
-0.1
70**
Non
-mai
nstre
am d
isso
nant
-0
.131
* -0
.117
* 0.
137*
0.12
2* -0
.201
***
-0.1
97**
* 0.
208**
* 0.
202**
*
Esta
blis
hed
rebe
lliou
s 0.
106
0.09
2 -0
.116
* -0
.104
0.
095
0.07
7 -0
.116
* -0
.099
N
ativ
e-G
reek
trad
ition
al
-0.0
84
-0.1
06*
0.07
9 0.
102*
-0.0
47
-0.0
53
0.03
5 0.
043
Valu
es
Self-
enha
ncem
ent
-0
.029
0.02
3
-0.0
26
0.
021
Ope
nnes
s to
chan
ge
-0
.034
0.04
6
0.00
7
0.01
0 U
nive
rsal
ism
0.11
3a
-0.1
07
0.
125*
-0
.127
*
Con
form
ity a
nd b
enev
olen
ce
0.
126b
-0
.128
*
0.11
0
-0.1
09
Secu
rity
and
bene
vole
nce
-0
.094
0.07
9
-0.1
50*
0.
137*
Adju
sted
R sq
uare
0.
068
0.08
6 0.
063
0.08
1 0.
071
0.08
7 0.
068
0.08
3 R
squa
re
0.07
9 0.
108
0.07
4 0.
103
0.08
2 0.
109
0.07
9 0.
105
R sq
uare
cha
nge
0.07
9 0.
029
0.07
4 0.
029
0.08
2 0.
027
0.07
9 0.
026
Mul
tiple
R
0.28
1 0.
328
0.27
3 0.
321
0.28
6 0.
329
0.28
1 0.
324
F 7.
124**
* 4.
956**
* 6.
610**
* 4.
664**
* 7.
387**
* 4.
993**
* 7.
068**
* 4.
780**
*
Leve
ls o
f sig
nific
ance
: ***
0.00
1, *
*0.
005,
*0.
05
a. S
igni
fican
ce v
alue
= 0
.061
; b. S
igni
fican
ce v
alue
= 0
.051
Arts, Culture and the Public Sphere
22
Music distribution channels, values, preferences
23
The analyses on the distribution channels revealed a complex image. Concerning
the music stores, it was evident that the more participants like sophisticated and com-
plex and the less they like native-Greek traditional music styles the more they obtain
music from music stores. Moreover, the more participants hold the values of conformity
and benevolence the more they choose music stores. Concerning free downloads, senti-
mental and sensational and sophisticated and complex have a negative, whereas non-
mainstream dissonant has a positive relationship with the use of this distribution chan-
nel. Also the more participants hold the values of self-enhancement and the less they
hold the values of universalism, the more they choose free downloading. Concerning
mobile phones, it was only the sentimental and sensational music preference structure
and the openness to change value that predicts the use of this channel. Concerning press
offers, music preferences are strong predictors of this distribution channel: sentimental
and sensational, sophisticated and complex and established rebellious have a positive,
whereas non-mainstream dissonant has a negative relationship with press offers. Con-
cerning peddlers, sentimental and sensational has a positive and non-mainstream disso-
nant has a negative relationship with the use of this channels. Moreover, security and
benevolence has a negative relationship with peddlers. Concerning friends, non-
mainstream dissonant and native-Greek traditional positively predict this choice
whereas self-enhancement has a negative relationship with them as a choice.
The analyses on the types of channels also showed that both music preferences and
values predict their use. The more participants are fond of sophisticated and complex
and the less they like non-mainstream dissonant and native-Greek traditional music
styles, the more they choose formal channels. Moreover, the more they hold the values
of conformity and benevolence and universalism, the more they choose formal channels.
On the other hand, the more they like native-Greek traditional and the less they like so-
phisticated and complex, the more they choose the informal channels. Conformity and
benevolence have a negative relationship with informal channels. Concerning the pay
vs. free channels differentiation, sentimental and sensational and sophisticated and
complex preference structures have a positive, whereas non-mainstream dissonant has a
negative relationship with pay channels. Universalism has a positive relationship
whereas security and benevolence has a negative relationship with pay channels. On the
other hand, the less participants like sentimental and sensational and sophisticated and
Arts, Culture and the Public Sphere
24
complex and the more they like non-mainstream dissonant music styles the more they
choose free channels. Finally, participants who hold the values of security and benevo-
lence and participants who do not hold the values of universalism prefer the free chan-
nels.
Conclusions and further research
This study explored the influence of several factors on the patterns of obtaining mu-
sic through various distribution channels placing emphasis on social values and music
preferences. It also examined the influence of demographic and socioeconomic factors.
Only on one channel the analysis found a larger than typical difference between
males and females. Significant differences were found between males and females, but
generally, the male pattern of channel use was not very different from the female pat-
tern. This finding is consistent with similar findings on other cases where gender has not
a significant effect on patterns of channel use (Slack, Rowley & Coles, 2008). However,
the male pattern of use by channel type was different from the female pattern.
The results show that there are major differences associated with the cultural back-
ground on buying music from peddlers. However, one should consider also the reper-
toire available through this channel which is usually restricted to mainstream music
styles and the most popular part of the music production. Generally speaking the cul-
tural background seems to have a rather modest effect on the use of the music distribu-
tion channels, because from the group of seven distribution channels only on one case
some consistent pattern was found. The results suggest that the higher the education of
the parents, the higher the use of free channels. Nevertheless, this is a general trend and
no major differences were found among the different groups. The results show also that
there is not a clear pattern of use related with the socioeconomic status. A general, but
not very clear trend seems to be that the middle part of the socioeconomic scale uses
more frequently free downloading. In conclusion, some of the demographic factors have
a rather modest effect on the use of the music distribution channels.
The results of the hierarchical regression analyses suggest that music preferences
are better predictors than social values. The analysis show that preferences for some
music styles are related with the use of certain distribution channels (e.g. non main-
stream with free downloading). The findings suggest that people who like more �“pop�”
Music distribution channels, values, preferences
25
music styles (e.g. sentimental and sensational) tend to obtain music through formal and
pay channels. However, it should be considered that some kinds of music (like non
mainstream) are easier to find through certain channels (e.g. free and informal).
To summarize, music preferences, gender, and cultural background are better pre-
dictors of the music acquisition patterns compared to social values, origin, family in-
come and socioeconomic status. An interesting outcome of this research is that the find-
ings suggest that the patterns of music acquisition may not overlap with the values and
the socioeconomic structure that underlie the music preferences. In other words, pat-
terns of objectification of cultural capital do not necessarily correlate with the status it
signifies. Further research needs to be done to clarify several aspects of the complex
image revealed by these analyses. The patterns of music acquisition are complicated
processes that need further examination.
Further investigation needs also to be done to specify the reasons and motives for
the frequency of use of the different distribution channels. For example, does the high
use of informal and free channels to obtain music mean that these cultural goods are not
regarded worthy to pay for and therefore that the work of the composers and musicians
is not esteemed and appreciated enough by the population examined? Or does it mean
that this is a type of rebellious attitude towards �– a critique-in-practice of �– the price
policy employed by the recording industry? Does the purchase of music from peddlers
mean carelessness and/or ignorance about the economic consequences for an industry
(and its employees) or social awareness about the condition of perverse integration? We
believe that these questions deserve an in-depth analysis.
References Albesa, J. G. (2007): �“Interaction Channel Choice in a Multichannel Environment, an Empirical Study�”.
International Journal of Bank Marketing, 25(7): 490-506.
Balasubramanian, S., Raghunathan, R., Mahajan, V. (2005): �“Consumers in a Multichannel Environment:
Product Utility, Process Utility, and Channel Choice�”. Journal of Interactive Marketing, 19(2): 12-
30.
Baltzis, A. (2006): �“Freedom of Expression® and the Recorded Music: Control and Democracy in the
Internet Era�”. In The Impact of Internet on the Mass Media in Europe (edited by Nikos Leandros),
pp. 251-263. Suffolk, UK: Abramis, 2006.
Bishop, J. (2005): �“Building International Empires of Sound: Concentrations of Power and Property in
Arts, Culture and the Public Sphere
26
the �‘Global�’ Music Market�”. Popular Music and Society, 28(4): 443-471.
Black, N. J., Lockett, A., Ennew, C., Winklhofer, H. & McKechnie, S. (2002): �“Modelling Consumer
Choice of Distribution Channels: An Illustration from Financial Services�”. International Journal of
Bank Marketing, 20(4): 161-173.
Bogt, T. T., Raaijmakers, Q., Vollebergh, W., Van Wel, F., & Sikkema, P. (2003): �“Youngsters and their
Musical Taste: Musical Styles and Taste Groups�”. The Netherlands’ Journal of Social Sciences,
39(1): 35-52.
Bourdieu, P. (1984): Distinction: A Social Critique of the Judgement of Taste. London: Routledge & Ke-
gan Paul.
Bryson, B. (1997): �“What about the Univores? Musical Dislikes and Group-Based Identity Construction
among Americans with Low Levels of Education�”. Poetics, 25(2-3): 141-156.
Castells, M. (2000): End of Millennium (The Information Age – Economy, Society and Culture: Vol. 3).
Oxford, Maden: Blackwell.
Chan, T. W. & Goldthorpe, J. H. (2007): �“Social Stratification and Cultural Consumption: Music in Eng-
land�”. European Sociological Review, 23(1): 1-19.
Christenson, P. G. & Peterson, J. B. (1988): �“Genre and Gender in the Structure of Music Preferences.
Communication Research, 15(3): 282-301.
Condry, I. (2004): �“Cultures of Music Piracy. An Ethnographic Comparison of the US and Japan�”. Inter-
national Journal of Cultural Studies, 7(3): 343-363.
Connolly, M. & Krueger, A. B. (2006): �“Rockonomics: The Economics of Popular Music�”. In Handbook
of the Economics of Art and Culture, Vol. 1 (edited by Victor A. Ginsburgh & David Throsby), pp.
667-719. Elsevier B.V.
Costello, A. B. & Osborne, J. W. (2005): �“Best Practices in Exploratory Factor Analysis: Four Recom-
mendations for Getting the Most from your Analysis. Practical Assessment, Research & Evaluation,
10(7): 1-9.
Dolfsma, W. (1999): �“The Consumption of Music and the Expression of VALUES: A Social Economic
Explanation for the Advent of Pop Music�”. American Journal of Economics and Sociology, 58(4):
1019-1046.
Frith, S. (1988): �“Copyright and the Music Business�”. Popular Music, 17(1): 57-75.
Gardikiotis, A. & Baltzis, A. (2008): �‘Rock Music for Myself and Justice to the World!�’ Music Prefer-
ences, Self-Identities and Social Values (forthcoming).
IFPI (2006): 06 Digital Music Report (http://www.ifpi.org/content/library/digital-music-report-2006.pdf).
IFPI (2007): 07 Digital Music Report (http://www.ifpi.org/content/library/digital-music-report-2007.pdf).
ILO �– International Labour Organization (2008): Resolution Concerning Updating the International Stan-
dard Classification of Occupations. ILO (http://www.ilo.org/public/english/bureau/stat/isco/docs/
resol08.pdf).
Jones, S. & Lenhart, A. (2004): �“Music Downloading and Listening: Findings from the Pew Internet and
American Life Project�”. Popular Music and Society, 27(2): 185-199.
Katz-Gerro, T. (2002): �“Highbrow Cultural Consumption and Class Distinction in Italy, Israel, West
Music distribution channels, values, preferences
27
Germany, Sweden, and the United States�”. Social Forces, 81(1): 207-229.
Langenderfer, J. & Kopp, S. W. (2004): �“The Digital Technology Revolution and its Effect on the Market
for Copyrighted Works: Is History Repeating Itself?�” Journal of Macromarketing, 24(1): 17-30.
Leech, N. L., Barrett, K. C. & Morgan, G. A. (2005): SPSS for Intermediate Statistics. Use and Interpre-
tation. Mahwah, New Jersey, London: Lawrence Erlbaum Associates.
Lizardo, O. & Skiles, S. (2008): �“Cultural Consumption in the Fine and Popular Arts Realms�”. Sociology
Compass 2(2): 485-502.
López-Sintas, J., Garcia-Alvarez, M. E. & Filimon, N. (2008): �“Scale and Periodicities of Recorded Mu-
sic Consumption: Reconciling Bourdieu�’s Theory of Taste with Facts�”. The Sociological Review,
56(1): 78-101.
National Statistical Service of Greece (2006): Statistics on Income and Living Conditions. Pireus: General
Secretariat of the NSS of Greece.
North, A. C. & Hargreaves, D. J. (2007): �“Lifestyle Correlates of Musical Preference: 1. Relationships,
Living Arrangements, Beliefs, and Crime�”. Psychology of Music, 35(1): 58-87.
Pallant, J. (2001): SPSS Survival Manual: A Step-by-step Guide to Data Analysis Using SPSS for Win-
dows (Version 10). Crows Nest, N.S.W.: Allen & Unwin.
Papageorgiou, F. T. (1997): �“Popular Music and the Music Industry in Greece. In Whose Master’s Voice?
The Development of Popular Music in Thirteen Cultures (edited by Alison J. Ewbank and Fouli T.
Papageorgiou), pp. 67-98. Westport, Connecticut, London: Greenwood Press.
Pennanen, R. P. (1997): �“The Development of Chordal Harmony in Greek Rebetika and Laika Music,
1930s to 1960s�”. Ethnomusicology Forum, 6(1): 65-116.
Peterson, R. A. & Dowd T. (2004): �“Making Music Sociology: An Introduction�”. Poetics, 32(3-4): 195-
196.
Peterson, R. A. (1992): �“Understanding Audience Segmentation: From Elite and Mass to Omnivore and
Univore�”. Poetics, 21(4): 243-258.
Portes, A. & Sassen-Koob, S. (1987): �“Making it Underground: Comparative Material on the Informal
Sector in Western Market Economies�”. The American Journal of Sociology, 93(1): 30-61.
Rokeach, M. (1973): The Nature of Human Values. New York: Free Press.
Savage, M. (2006): �“The Musical Field�”. Cultural Trends, 15(2-3): 159-174.
Schoenbachler, D. D. & Gordon, G. L. (2002): �“Multi-Channel Shopping: Understanding what Drives
Channel Choice�”. The Journal of Consumer Marketing, 19(1): 42-53.
Schuessler, K. F. (1948): Musical Taste and Socio-Economic Background. Ph. D. Indiana: Indiana Uni-
versity.
Schwartz, S. H. & Bardi, A. (2001): �“Value Hierarchies across Cultures: Taking a Similarities Perspec-
tive�”. Journal of Cross Cultural Psychology, 32(3): 268-290.
Schwartz, S. H. & Sagiv, L. (1995): �“Identifying Culture-Specifics in the Content and Structure of Val-
ues�”. Journal of Cross Cultural Psychology, 26(1): 92-116.
Schwartz, S. H. (1992): �“Universals in the Content and Structure of Values: Theoretical Advances and
Empirical Tests in 20 Countries. In Advances in Experimental Social Psychology (edited by M.
Arts, Culture and the Public Sphere
28
Zanna), Vol. 25, pp. 1-65. New York: Academic Press.
Slack, F., Rowley, J. & Coles, S. (2008): �“Consumer Behaviour in Multi-Channel Contexts: The Case of
a Theatre Festival�”. Internet Research, 18(1): 46-59.
Stern, L. W. & Reve, T. (1980): �“Distribution Channels as Political Economies: A Framework for Com-
parative Analysis�”. Journal of Marketing, 44(3): 52-64.
Wells, A. & Tokinoya, H. (1998): �“The Genre Preferences of Western Popular Music by Japanese Ado-
lescents�”. Popular Music and Society, 22(1): 41-53.
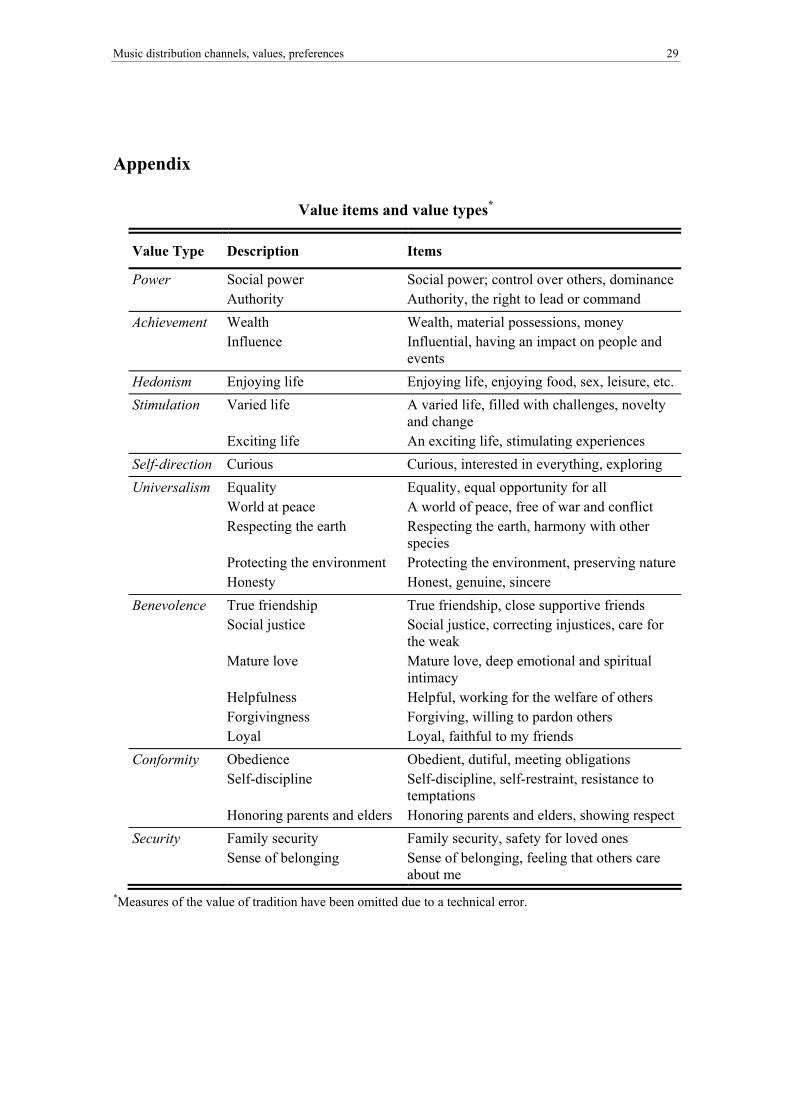
Music distribution channels, values, preferences
29
Appendix
Value items and value types*
Value Type Description Items
Power Social power Social power; control over others, dominance Authority Authority, the right to lead or command Achievement Wealth Wealth, material possessions, money Influence Influential, having an impact on people and
events Hedonism Enjoying life Enjoying life, enjoying food, sex, leisure, etc. Stimulation Varied life A varied life, filled with challenges, novelty
and change Exciting life An exciting life, stimulating experiences Self-direction Curious Curious, interested in everything, exploring Universalism Equality Equality, equal opportunity for all World at peace A world of peace, free of war and conflict Respecting the earth Respecting the earth, harmony with other
species Protecting the environment Protecting the environment, preserving nature Honesty Honest, genuine, sincere Benevolence True friendship True friendship, close supportive friends Social justice Social justice, correcting injustices, care for
the weak Mature love Mature love, deep emotional and spiritual
intimacy Helpfulness Helpful, working for the welfare of others Forgivingness Forgiving, willing to pardon others Loyal Loyal, faithful to my friends Conformity Obedience Obedient, dutiful, meeting obligations Self-discipline Self-discipline, self-restraint, resistance to
temptations Honoring parents and elders Honoring parents and elders, showing respectSecurity Family security Family security, safety for loved ones Sense of belonging Sense of belonging, feeling that others care
about me *Measures of the value of tradition have been omitted due to a technical error.