an exploratory study of a - CiteSeerX
123
AN EXPLORATORY STUDY OF A MULTIDIMENSIONAL MODEL OF RESILIENCY By JERILYN THORMAN Bachelor of Arts in English Oklahoma State University Stillwater, Oklahoma 1995 Master of Science in Applied Behavioral Studies in Education Oklahoma State University Stillwater, Oklahoma 1998 Submitted to the Faculty of the Graduate College of the Oklahoma State University in partial fulfillment of the requirements for the Degree of DOCTOR OF PHILOSOPHY
-
Upload
khangminh22 -
Category
Documents
-
view
1 -
download
0
Transcript of an exploratory study of a - CiteSeerX
AN EXPLORATORY STUDY OF A
MULTIDIMENSIONAL MODEL
OF RESILIENCY
By
JERILYN THORMAN
Bachelor of Arts in English Oklahoma State University
Stillwater, Oklahoma 1995
Master of Science in Applied Behavioral Studies in
Education Oklahoma State University
Stillwater, Oklahoma 1998
Submitted to the Faculty of the Graduate College of the
Oklahoma State University in partial fulfillment of
the requirements for the Degree of
DOCTOR OF PHILOSOPHY
ii
AN EXPLORATORY STUDY OF A
MULTIDIMENSIONAL MODEL
OF RESILIENCY
Dissertation Approved:
Diane Montgomery
Dissertation Adviser
Kay Bull
Barbara Carlozzi
Janice Miller
A. Gordon Emslie
Dean of the Graduate College
iii
ACKNOWLDGEMENTS
I would like to begin by expressing my sincere gratitude to all of the people who
made this endeavor possible. I have been blessed to have Dr. Diane Montgomery as my
mentor, chair, and advisor. I cannot thank her enough for all of her support,
encouragement, and patience. Her dedication to her students is unparalleled. I was also
fortunate to have wonderful and supportive committee. Dr. Janice Miller spent a great
deal of time working with me on the design and statistical aspects of this study. I learned
a great deal from her through this process. Drs. Barbara Carlozzi and Kay Bull provided
encouragement, support, insight and suggestions. I greatly appreciate all of the time and
effort spent by each of my committee members in helping me to achieve this goal.
I would like to further express my gratitude to the Project CREATES
administrators, researchers, staff, teachers, principals, and students. Thank you to the
staff for your help with data collection, listening to my ideas, and moral support. The
teachers helped by taking time away from their classes for data collection and the
students patiently completed the assessments. I would not have been able to complete this
dissertation without each of you.
My family has been wonderful. My mother and father provided support and
encouragement to me throughout this entire process. My mother helped score
assessments and read countless drafts. She and my father were sounding boards for my
ideas, listened to my concerns, and helped me remain centered. If it had not been for my
family, friends, and colleagues this project would not have been possible.
iv
TABLE OF CONTENTS
Chapter Page I. INTRODUCTION TO THE STUDY..................................................................... 1
A Brief History of the Study of Resilience........................................................... 4 Background to the Problem ................................................................................. 5 Statement of the Problem and Purpose................................................................. 7 Theoretical Framework ....................................................................................... 9 Research Questions ........................................................................................... 10 Significance of the Study................................................................................... 11 Definitions of Terms ......................................................................................... 12 Limitations ........................................................................................................ 13 Chapter Organization ........................................................................................ 14 II. REVIEW OF LITERATURE ............................................................................. 16 Historical Context of Contemporary Resilience Research .................................. 16 The Three Waves of Understanding Resilience.................................................. 21 The First Wave: Resilient Characteristics............................................... 22 The Second Wave: Resilience as a Process ............................................ 23 The Third Wave: Resilience as a Force .................................................. 25 Summary of the Three Waves ................................................................ 26 Resilient Force Construct .................................................................................. 26 Sense of Purpose.................................................................................... 27 Creativity............................................................................................... 30 Sense of Connectedness ......................................................................... 35 Hope...................................................................................................... 36 Summary of the Resilient Force Construct ............................................. 38 Assessment of Resilience .................................................................................. 38 Stress, Risk, and Adversity .................................................................... 39 Criteria Used to Assess Positive Adaptation.......................................... .41 Emotionality Construct…………………………………………………………...44 Summary………………………………………………………………………….45 III. METHOD………………………………………………………………………...46 Participants........................................................................................................ 47 Instrumentation ................................................................................................. 49
v
Chapter Page Beck Youth Inventories, Second Edition................................................ 50 Multidimensional Students’ Life Satisfaction Scale................................ 56 Goff-Torrance Creativity Identifier ........................................................ 58 The Children’s Hope Scale .................................................................... 59 Summary ............................................................................................... 62 Procedure .......................................................................................................... 63 Data Analysis .................................................................................................... 64 Summary………………………………………………………………………….65 IV. RESULTS......................................................................................................... 66 Descriptive Statistics ......................................................................................... 67 Summary of Descriptive Statistics.......................................................... 68 Response to Research Questions........................................................................ 69
Question One..............................................................................................69 Question Two…………………………………………..............................72 Question Three ...................................................................................... 74
Summary........................................................................................................... 78 V. SUMMARY, CONCLUSIONS, AND IMPLICATIONS................................... 80 Summary of Findings ........................................................................................ 81 Conclusions....................................................................................................... 84 Resilient Force....................................................................................... 85 Emotionality .......................................................................................... 86 Conclusions drawn from the Relationship between Resilient Force and Emotionality .......................................................................................... 88 Summary of Conclusions ....................................................................... 88 Limitations to Conclusions .................................................................... 89 Implications ...................................................................................................... 91 Implications for Theory ......................................................................... 91 Implications for Practice ........................................................................ 93 Implications for Research ...................................................................... 94 Closing Remarks ............................................................................................... 95 REFERENCES ....................................................................................................... 96 APPENDIX A – FREQUENCY DISTRIBUTIONS OF SCORES ON ASSESSMENT INSTRUMENTS..........................................................................110 APPENDIX B— INSTITUTIONAL REVIEW BOARD APPROVAL…………...114
vi
LIST OF TABLES
Table Page 1 Student Demographic Information .............................................................. 47
2 Gender, Grade, and School Affiliation of Participants................................. 48
5 Descriptive Statistics for the Variables........................................................ 67
4 Bivariate Correlations Among the Variables within the Resilient Force Construct .................................................................................................... 70
5 Bivariate Correlations Among the Variables within the Emotionality Construct .................................................................................................... 73
6 Canonical Solution for Function 1 .............................................................. 77
vii
LIST OF FIGURES
Figure Page 1 Distribution of Beck Anxiety Inventory for Youth .....................................110
2 Distribution of Beck Depression Inventory for Youth ................................110
3 Distribution of Beck Anger Inventory for Youth.........................................111
4 Distribution of Beck Disruptive Behavior Inventory for Youth ..................111 5 Distribution of Beck Self-Concept Inventory for Youth .............................112 6 Distribution of Children’s Hope Scale .......................................................112
7 Distribution of Multidimensional Students’ Life Satisfaction Scale............113
6 Distribution of Goff-Torrance Creativity Identifier ....................................113
1
CHAPTER I
INTRODUCTION TO THE STUDY
“That which does not kill us makes us stronger.”
—Friedrich Nietzsche
The emotional strength of children and their ability to flourish under even the
most hostile conditions is inspirational. Children who are exposed to poverty, abuse,
neglect, violence, and other traumatic life events are often more likely to develop
emotional problems than children from less stressful environments (Johnson, 2005).
However, in spite of tremendous life pressures, many children considered to be at high
risk to develop social or psychological problems later in life exhibit resilience (Luthar &
Zelazo, 2003). These children gain knowledge and understanding as they overcome the
emotional toll of adversity and their capacity to face stressful life events in the future is
fortified. This demonstration of humankind’s ability to self-heal provides hope and
encouragement against the backdrop of what is at times a chaotic society.
Reports of teenage violence, school violence, and adolescent gang association
have become commonplace in the media over the past several decades. The number of
children and adolescents held in juvenile detention centers has increased over 72% since
the early 1990’s and 2,000,000 juveniles were arrested in 2002 (Mazzotti & Higgins,
2006). There is a high positive correlation between behavioral problems and internalizing
disorders, such as depression (Eisenberg, Spinrad, Fabes, Reiser, Cumberland, &
2
Shepard, 2004; Wiesner & Kim, 2006). This is substantiated by evidence suggesting that
52% to 78% of juvenile offenders show symptoms of depression and 6% to 41% have
anxiety disorders (Mazzotti & Higgins).
Several societal and environmental factors are often associated with the
development of emotional and behavioral problems. Children from low-income, single-
parent households in impoverished areas are at a greater risk for developing mental health
problems than children from middle and upper income families (Jonson-Reid, 2004;
Mash & Barkley). This is supported by the overrepresentation of children from low-SES
backgrounds presenting with emotional disorders. Approximately 20% percent of
children living in low-income households have mental health problems; whereas, only
10% of children within the general population have mental health problems (Howell,
2004; Mash & Barkley, 2003). Other risk factors include experiencing traumatic events
such as maltreatment, abuse and neglect. Exposure to domestic and neighborhood
violence and serious care-giving deficits, which are often related to parental substance
abuse and parental mental illness, also increase the likelihood of individuals developing
emotional and substance-abuse related problems during their lifetime (Hurst, 2005;
Jonson-Reid; vanDeMark, Russell, O’Keefe, Finkelstein, Noether, & Gampel, 2005;
Williams-Evans & Myers, 2004).
The prevalence of exposure to one or more risk factors during childhood is high.
Over 13,000,000 children live in poverty (Luthar & Cicchetti, 2000). Poverty has been
associated with numerous risk factors including low maternal education, parental mental
illness, negative life situations, and limited family and community resources (Mash and
Barkley, 2003). An estimated 25% of children are exposed to a family member’s alcohol
3
abuse or dependence and approximately 16% of children live with parents who abuse
drugs (Grant, 2000). Approximately 9,000,000 adolescents report having witnessed at
least one violent act during their childhood and of these adolescents 3,000,000 report
being attacked with a weapon (vanDeMark et al., 2005).
Children with mental health problems continue to have difficulties as adults
(Foster & Jones, 2005). As adults, these individuals have children who are often exposed
to “high risk” environments (Foster & Jones). These problems are multigenerational and
the cycle is difficult to break. This often results in a family’s involvement with
government funded social service programs, such as child welfare, juvenile justice,
mental health services and special education. This is fiscally detrimental to society as the
resulting costs are both tremendous and enduring (Foster & Jones).
Although the statistics are grim, not all children who experience risk factors such
as poverty and single parentness develop emotional problems and maladaptive behaviors.
Some children demonstrate resilience, as they appear to personally grow and gain insight
through hardships. Personal characteristics attributed to an individual’s capacity to be
resilient develop and strengthen as well. Resilient individuals, like other individuals,
initially experience emotions such as hurt, sadness, loss, anxiety and anger, when
exposed to adverse life events and situations (Richardson, 2002). However, people who
exhibit resilience seem to go through a specific process which enables them to gain
knowledge and self-understanding while moving through the event. Little is known about
that which initiates this process. Some theorists ascribe this ability to a motivational
source within the individual (Richardson; Swarbrick, 2006). In order to know effective
4
ways in which to strengthen resilience in children, it is important to understand this
source which serves to motivate the process of resiliency.
A Brief History of the Study of Resilience
In order to understand the theoretical questions and conceptual framework of
present day resiliency research, it is important to understand its history. Historically,
social scientists conceptualized problems of children and adolescents through the
identification of an individual’s weaknesses rather than his or her strengths (Howard,
Dryden, & Johnson, 1999; Masten, 2001; Masten & Powell, 2003; Tedeschi & Kilmer,
2005). Therefore, early studies of children at risk for psychosocial and behavioral
problems due to poverty, maltreatment, lack of parental involvement, exposure to
violence or trauma, and other risk factors centered on the classification of symptoms and
negative outcomes (Bennett, Elliott, & Peters, 2005; Howard et al., 1999; Masten &
Powell; Richardson, 2002). Research participants were generally children and
adolescents identified as having maladaptive behavior. Investigators looked for individual
and environmental factors which might have caused the behavior (Cicchetti, 2003). In
this type of deficit-based model, individuals are characterized in terms of deficiencies;
consequently, their assets are overlooked (Swarbrick, 2006).
In the 1950’s a group of researchers (Garmezy et al., 1984; Rutter, 1979; Werner
& Smith, 1982) became frustrated with this deficit approach, as they recognized that not
all children labeled “at risk” develop maladaptive behaviors. In fact, some individuals
have positive outcomes in the face of adversity (Masten, 2001; Masten & Powell, 2003).
These researchers began focusing on the strengths of individuals rather than their
5
weaknesses. As a result, over the next two decades, increased interest grew in the area of
understanding how and why some people survive and ultimately thrive in spite of adverse
situations (Tedeschi & Kilmer, 2005). Children who survived risk and were well adjusted
became the focus of many research studies (Garmezy, Masten, & Tellegen, 1984;
Garmezy & Rutter, 1988; Luthar, 1991; Werner & Smith, 1982). Several of the risk and
resilience studies were longitudinal and spanned decades (Werner & Smith; 1992; 2001).
Over the next three decades the concept of resiliency would evolve in what
Richardson (2002) has coined the “three waves” (p. 308) of understanding. The first
wave identified resiliency as a set of protective personal and environmental attributes
(Joseph, 1994; Richardson; Tedeschi & Kilmer, 2005; Valentine & Feinauer, 1993). The
second wave described resiliency as a process of coping with adversity (Joseph;
Richardson; Tedeschi & Kilmer; Valentine & Feinauer). The current and third wave
characterizes resiliency as an adaptational system initiated by a motivation force which is
present within all individuals, which, if protected and nurtured, will allow adaptive
development in adverse situations and traumatic experiences (Geanellos, 2005;
Richardson).
Background to the Problem
For the purposes of this study, resilience is conceptualized and understood in
terms of the third wave. Resilience is an inherent system with a primary function much
like body systems, for example, the respiratory system. The primary function of the
respiratory system is to supply blood with oxygen. Respiration is the process through
which blood is supplied with oxygen and breathing ignites this process. Thus, to promote
6
efficient respiration, institutions can adopt policies to protect lungs and individuals can
strengthen that which is necessary to breathe. Likewise, the primary function of the
resilience system is positive adaptation and personal growth in times of stress and
adversity. The process of positive adaptation is also called resilience. However, the
source which breathes life into this process is unknown. Therefore, that which needs to be
protected and nurtured in order to promote effective resilience is also unknown.
Many children are routinely faced with parental drug and alcohol abuse, poverty,
violence, maltreatment, abuse, or neglect. Exposure to societal and familial risk factors
increases the probability of the child developing emotional and substance-abuse related
difficulties. The effect is cyclical, as children exposed to adversity are more likely to
become adults whose unstable and chaotic lives and home environments are risk factors
for their own children. However, when functioning properly, one’s innate resilience
system aids in emotional healing and results in increased insight and personal growth.
Unfortunately, sometimes the resilience process is not instigated, which is problematic as
it raises the possibility for negative outcomes. Increased understanding of the initiating
source of the resilience process might enable schools, parents, teachers, and others to
protect and strengthen that source.
The study of the concept of resilience may give insight into ways in which the
source of resilience might be preventively fostered and nurtured so that children can more
positively and adaptively cope with challenges, struggles, and adverse life situations. A
great deal of research has been conducted regarding the identification of personal and
environmental attributes associated with resilience. Many characteristics have been
identified that differentiate the profile of a person who adapts and grows in response to
7
life’s challenges and those who do not. Furthermore, researchers have recognized that
resilience is a process much like other developmental processes and is not simply a
compilation of personal and environmental attributes. However, little attention has been
given to understanding what initiates the resiliency process within an individual (Bogar &
Hulse-Killacky, 2006; Richardson, 2002).
Many researchers studying resilience define the concept by examining life skills
easily observed by others such as, pro-social behavior and academic success (Cicchetti &
Rogosch, 1997; Eisenberg, Fabes, Guthrie, & Reiser, 2000; Eisenberg et al., 2004; Hines,
Merdinger, & Wyatt, 2005; Hoyt-Meyers, Cowen, Work, Wyman, Magnus, & Fagen, et
al ., 1995; O'Donnell, Schwab-Stone, & Muyeed, 2002). Although these factors provide
valuable information regarding a child’s social functioning, they do not address the
internal emotional functioning of a child. Many children who experience emotions such
as anxiety, anger, and depression do not display behavioral or academic difficulties. The
outcome of resilience is described as increased “growth, knowledge, self-understanding,
and…strength of resilient qualities” (Richardson, 2002, p. 310) therefore, it is necessary
to examine resilience in terms of internal emotional states, as well as external behaviors.
Statement of Problem and Purpose
When exposed to adversity some children suffer from increased subjective
experiences of negative emotional states. Other children have less intense experiences of
negative emotional states when faced with psychosocial stressors. The third wave of
understanding resilience contributes growth through adversity to an internal motivational
force (Richardson, 2002). The notion of the third wave is primarily theoretical in nature.
8
Little research has been conducted to provide empirical evidence for the third wave, as
such, little is known about the motivational force and its relationship to resilient patterns
in individuals.
The primary purpose of this study was to establish a basis in the philosophy of the
third wave of resiliency, conceptualized by Richardson (2002), as a motivational force
which drives an individual to experience personal growth through adversity. In an effort
to achieve this goal it was necessary to examine the relationship between the motivational
force and the degree to which a person was demonstrating a resilient pattern, which is
characterized by “doing okay” within the context of past or current adversity (Masten &
Powell, 2003). Thus, for this study a review of resilience and related literature provided
theoretical support for the creation of two constructs, which were named Resilient Force
and Emotionality. The constructs were named to reflect the model of the third wave of
resiliency, which was tested for this study.
The Resilient Force construct represents Richardson’s conceptualization of
resilience as a motivational force. Measures of sense of purpose, sense of connectedness,
creativity, and hope operationalized the Resilient Force construct. A review of previous
research in the area of resilience, as well as, related literature provided theoretical support
for the operational definition of the Resilient Force construct (Alvord, & Grados, 2005;
Baruth & Carroll, 2002; Bernard, 1991; Brooks, 1994; Buckner, Mezzacappa, &
Beardslee, 2003; de Souza, 2006; Hart & Waddell, 2003; Luthar, 1991; Richardson,
2002; Rolf, Masten, Cicchetti, Nuechterlein, & Weintraub, 1990; Werner & Smith,
2001).
9
In order to examine the relationship between the Resilient Force construct and
resilient patterns, it was necessary to establish the criteria for determining whether an
individual was or was not demonstrating a resilient pattern. For the purposes of this
study, doing okay was defined as being relatively free from frequently occurring intense
negative feelings which was represented by the Emotionality construct. Measures of
anger, anxiety, depression, and disruptive behavior operationalized this construct. The
participants chosen for this study were considered at risk, as they were from low-income
schools and poverty has been identified as a substantial risk factor (Alvord & Grados,
2005; Bennett et al., 2005; Eisenberg et al., 2004; Kim-Cohen, Moffitt, Caspi, & Taylor,
2004). As such, the Emotionality construct served not only as a measure of doing okay,
but assessed the degree to which a participant was or was not displaying a resilient
pattern. In an attempt to provide empirical support for the philosophy of the third wave,
the relationship between the Resilient Force construct and the Emotionality construct was
examined.
Theoretical Framework
The theoretical framework which guided this study was the third wave of
resilience as postulated by Richardson (2002). According to Richardson, the first wave
focused on identifying characteristics that seemed to be associated with resilience. The
second wave examined resilience as a process of adapting to adverse situations which
resulted in the development and fortification of resilient characteristics. Resilience is
conceptualized in the third wave as a motivational force within the human spirit that
compels an individual to positively adapt and change when confronted with adversity.
10
According to Richardson this resilient force, which may be buried deep within some
people, can be nurtured and brought to the forefront. The Resilient Force drives an
individual to “live, feel safe, feel loved, and be nurtured” (p. 317).
For this study, the Resilient Force construct was conceptualized as dimensions of
spirituality or elements of the human spirit which are especially relevant to psychological
well being, as identified by Hart and Waddell (2003). Like Richardson (2002), Hart and
Waddell suggest that nurturing facets of the human spirit such as connectedness, love,
wisdom, creativity and trust may help to heal emotional wounds. Hart and Waddell
defined six dimensions of spirituality of which four were operationalized for this study to
examine the Resilient Force construct; they are 1) Meaning, Purpose, and Truth; 2)
Creativity: Finding Voice; 3) Meeting the World: Boundaries and Connections; 4) and
Hope. For the purposes of this study, these dimensions are identified as sense of purpose,
creativity, sense of connectedness, and hope. Hart and Waddell suggest that a strong
sense of purpose allows individuals to have insight into their strengths and weaknesses,
their passions, and their purpose in life. Creativity gives an individual a voice and an
outlet for self-expression. A sense of connectedness refers to establishing safe and
appropriate interpersonal relationships. Hope allows an individual to feel that he or she
has some control of his or her life and motivates an individual to pursue his or her goals.
Research Questions
The research questions driving this study include:
1. What are the relationships between the variables composing the theoretical
Resilient Force construct, which are measures of sense of purpose, sense of
connectedness, hope, and creativity?
11
2. What are the relationships between the variables composing the theoretical
Emotionality construct, which are measures of anger, anxiety, depression, and
disruptive behavior?
3. What is the multivariate relationship between the variables composing the
Resilient Force and Emotionality constructs?
Significance of the Study
This study attempts to establish a basis in the philosophy of the third wave of
resiliency as conceptualized by Richardson (2002). Providing support for the third wave
may lead to a greater acceptance of the notion that every person is capable of resilience,
as the capacity for growth through adversity lies within the unique strengths and
characteristics of the individual (Richardson). Understanding resilience in this manner
places emphasis on the importance of nurturing and supporting the gifts and talents of
children. The first and second waves of understanding resilience suggest that the capacity
to be resilient is developed within the context of risk and adversity (Masten, 2001).
However, resilience, understood in terms of the third wave, promotes the notion that the
capacity for resilience can be preventively fostered and nurtured (Richardson).
Definition of Terms
For the purposes of this study, key terms and constructs are defined as follows:
Resilient Pattern- refers to doing okay despite being faced with risk and adversity
(Masten & Powell, 2003). Specifically for this study, it is defined as being relatively free
from frequently occurring intense negative feelings in the context of risk and adversity.
12
Resilient Force- this theoretical construct represents the motivational force within
an individual, which drives one to positively adapt and experience personal growth when
faced with adversity. Four of the six dimensions of spirituality identified by (Hart &
Waddell, 2003) are operationalized to assess the Resilient Force construct. These are
sense of purpose, creativity sense of connectedness, and hope.
Sense of Purpose- represents an individual’s self-perceptions about his or her
competency, potential, and self worth. The Beck Self-Concept Inventory for Youth
(BSCI-Y; Beck, Beck, Jolly, & Steer, 2005) was used assess Sense of Purpose.
Sense of Connectedness- refers to having emotionally safe and appropriate
interpersonal relationships. Sense of connectedness was assessed using two scales of the
Multidimensional Students’ Life Satisfaction Scale (MSLSS; Huebner, 2001a).
Hope- refers to one’s perceived ability of finding pathways towards goals and the
initiative to move toward those goals (Snyder, Hoza, Pelham, Rapoff, Ware, &
Danovsky, et al, 1997). Hope was assessed using the Children’s Hope Scale (Snyder, et
al.).
Creativity- was defined by Torrance’s (1990) conception of creativity as divergent
production. Creativity enables an individual to have a voice and an outlet for self-
expression (Hart and Waddell, 2003). The Goff-Torrance Creativity Identifier (GTCI;
Goff, 2005) was used as a measure of creativity.
Emotionality- this theoretical construct represents emotional states which are not
typically associated with positive adaptation. Emotionality was assessed by examining
the concepts of anger, anxiety, depression, and disruptive behavior.
13
Anger- refers to one’s perceived feelings of maltreatment or persecution, hostile
feelings toward and about others, and related physiological symptoms (Beck et al., 2005).
Anger was assessed using the Beck Anger Inventory for Youth (BANI-Y; Beck et al.,
2005).
Anxiety- refers to excessive worrying, unrealistic fears, and related physiological
symptoms (Beck et al., 2005). The Beck Anxiety Inventory for Youth (BAI-Y; Beck et
al., 2005) was used to assess anxiety.
Depression- refers to feelings of sadness and negative thoughts about one’s self
and one’s life (Beck et al., 2005). The Beck Depression Inventory for Youth (BDI-Y;
Beck et al., 2005) was used as a measurement of depression.
Disruptive Behavior- refers to attitudes and behaviors often associated with
negative emotions. Some children may have difficulty verbally expressing feelings of
anger, anxiety, and depression and may externalize these feelings through disruptive
behavior (Mash & Barkley, 2003). The child’s perception of his or her disruptive
behavior was assessed using the Beck Disruptive Behavior Inventory for Youth (BDBI-
Y; Beck et al., 2005).
Limitations of the Study
The identified limitations are as follows:
This study assumes that all of the participants are considered at risk due to
poverty. Risk status was determined based on enrollment in one of two schools with a
high percentage of students from low socioeconomic status (SES) backgrounds. While an
overwhelming majority of the students attending the schools sampled for this study come
14
from low income families, it is possible that some participants are not from dramatically
low SES households and may not be considered at risk.
With the exception of the creativity assessment, all of the assessments were self-
report surveys. Therefore, scores may be artificially raised or lowered intentionally or by
careless completion of the assessment.
Due to the nature of some of the assessments, students were ensured only limited
confidentiality. Prior to completing the assessment, the students were informed that
scores that were concerning would be reported to the counselor because it may be helpful
to the student if the counselor knew how he or she was feeling. Although the students
were assured they would not get in trouble for their scores, the knowledge that high
scores would be reported to the counselor may have biased the scores.
Chapter Organization
Chapter one established the foundation of this study. The introduction provided
insight into the need to study resilience. The first section briefly summarized the history
of resilience research. The second and third sections provided the background to the
problem and the problem statement. This was followed by the theoretical framework,
which is the third wave of resilience inquiry as conceptualized by Richardson (2002) and
operationalized by four of the six dimensions of spirituality identified by Hart and
Waddell (2003). Following the description of the theoretical framework, the purpose of
the study, research questions, and significance of the study were addressed in sections
five, six, and seven, respectively. Lastly, key terms and constructs related to the study
were defined.
15
The following describes the organization for the remainder of this dissertation:
Chapter II – The second chapter provides an overview of each wave of resilience
inquiry. A review of the literature supporting the theoretical constructs of Resilient Force
and Emotionality is also provided.
Chapter III – The primary purpose of the third chapter is to present the design and
methodology of the study. Chapter three presents a description of the participants and a
detailed review of each assessment instrument. The data collection procedure and an
overview of the statistical methods used to analyze the data are also provided.
Chapter IV – The fourth chapter provides the results of the statistical analyses
employed to address the research questions. Chapter four begins by presenting the
descriptive statistics of the data relative to the required statistical assumptions. The
research questions provide the organization for the remainder of the chapter.
Chapter V – The fifth chapter presents a summary of the study and initial
conclusions. Theoretical implications and practical implications are addressed as are
recommendations for future research.
16
CHAPTER II
REVIEW OF LITERATURE
The way in which researchers and social scientists have conceptualized resilience
has evolved over the past several decades. Thus, this chapter begins by providing the
historical context of resilience research. The second section describes the three waves of
resilience inquiry. First wave researchers identified risk and protective factors; second
wave researchers studied the process of resilience; and the third and current wave
researchers seek to understand the source of resilience. The third section of this chapter
addresses the Resilient Force construct, which represents the motivational source of
resilience. The Resilient Force section provides theoretical and empirical support for the
inclusion of each component within the construct. The fourth section of this chapter
examines the way in which researchers have assessed risk and resilience. Finally, a
description of the Emotionality construct, which is used to assess positive adaptation for
this study, is provided.
Historical Context of Contemporary Resilience Research
The study of resilience grew out of research conducted in the late 1950’s, in
which researchers explored the relationship between being at high risk for emotionally
and socially maladaptive development and the development of socially and emotionally
17
maladaptive behaviors. Many of the studies focused on individuals with schizophrenia,
those who experienced traumatic life events, and people living in poverty. Although
members of these high risk-populations developed disorders at a higher percentage than
individuals from the general population, researchers discovered that an even greater
percentage of these individuals experienced adaptive development and positive life
outcomes (Cicchetti, 2003). The realization that not all individuals labeled “at risk”
develop emotional, social, and substance abuse related problems served as a catalyst for a
new conceptualization of human development. This enlightened view of human growth
and potential focused on the notion that an individual’s life outcome was primarily
determined by his or her strengths rather than weaknesses. As such, many studies began
focusing on the assets of individuals rather than their deficits in an effort to understand
why some people develop positively, despite adverse life situations (Masten, 2001;
Masten & Powell, 2003; Swarbrick, 2006; Tedeschi & Kilmer, 2005).
Werner and Smith’s (1982, 1992, 2001) longitudinal study of people from Kauai,
Hawaii was one of the first studies to discern the positive potential of at risk individuals.
Werner and Smith (2001) studied the lives of 698 individuals beginning with their births
in 1955. The researchers examined “the impact of biological and psychosocial risk
factors, stressful life events, and protective factors on…development” (p. 25). The
individuals from Kauai were monitored at ages 1, 2, 10, 17/18, 31/32, and 40. As
children, many the participants were exposed to numerous risk factors including
impoverished and tenuous home lives typified by uneducated, alcoholic, or mentally ill
parents. The researchers discovered that 80% of the participants who faced multiple
18
adversities demonstrated socially and emotionally adaptive behaviors at ages 10 and 18
and continued to develop into healthy adults. Werner and Smith identified four central
characteristics shared by most of the resilient children in Kauai. These characteristics are
a proactive approach to problem solving, the ability to turn problems into personal
challenges, an easy-going and good natured temperament, and a sense of autonomy and
control over one’s life (Werner & Smith, 1982, 1992, 2001).
Werner and Smith’s study inspired other researchers interested in positive
adaptation in the context of adversity. Among those encouraged by the study of the Kauai
children were Norman Garmezy and his colleagues. In the forward of Werner and
Smith’s book Vulnerable but Invincible: a Longitudinal Study of Resilient Children and
Youth, Garmezy (1982) described the excitement among he and his colleagues at the
discovery of the study of the Kauai children. He wrote, “Michael Rutter….carried a
manuscript in is hands…and said: ‘This comes closer to what we have been talking about
than anything I have yet seen!’” (p. xiii). The early researchers exploring risk and
resiliency gravitated toward one another as they sought to understand positive adaptation
in the face of adversity.
In the 1970’s, Garmezy, his students, and colleagues initiated a longitudinal
research program, Project Competence, which produced a large body of research focused
on identifying individual and family characteristics of “at risk” individuals, as well as,
understanding the relationships between risk, internal functioning, and competence
defined as “an observable track record of effective adaptation in the child’s world of
home, school, and neighborhood” (Masten & Powell, 2003, p. 6). Project Competence
19
research projects examined the competencies among children from the general population
who were exposed to many kinds and levels of adversity and children from high-risk
populations. Some of the high-risk populations studied included children whose parents
suffered from parental mental illness, children living in homeless shelters, and children
living in extreme poverty (Dean, 1973; Garmezy et al., 1984; Garmezy & Rutter, 1988;
Rolf et al., 1990; Masten, 2001; Masten & Powell, 2003). One Project Competence study
focused on understanding the risk and protective factors of four high risk groups
(Garmezy, Masten, Nordstrom, & Ferrarese, 1979). The four high risk groups from which
the participants were sampled were children of schizophrenic mothers, children of
nonpsychotic depressed mothers, antisocial children with externalizing behaviors, and
children with internalizing disorders characterized by withdrawn, inhibited or phobic
behaviors. The results of this study are as follows:
1. Children whose mothers were depressed had “lower levels of social and
academic achievements relative to normal control peers, though not to the
degree of the higher risk children’s groups” (p. 32).
2. Children of schizophrenic mothers and the children of neurotic mothers had
similar problems, but the problems of the offspring of schizophrenic mothers
tend to be more severe and they exhibited more aggression.
3. Children of schizophrenic mothers more closely resembled the group of
antisocial children, than the children of depressed mothers, the inhibited
group of children, or the control group.
20
4. Although the children of depressed mothers demonstrated some problems in
school, they more closely resembled the control group than the other groups.
5. The parental patterns of the internalizing group of children and the antisocial
group of children differed substantially. The externalizing group had greater
family dysfunction than the internalizing group. Familial problems
associated with the externalizing group included parental alcoholism,
divorce, poverty, and a parent with a prior psychological history or criminal
record. Children with internalizing behaviors tended to come from intact
families in which the parents appeared to have more interest in their child’s
well-being.
6. Children of schizophrenic mothers and the acting-out children tended to have
attentional problems.
Based on these results Garmezy et al. (1979) concluded that a maladaptive home
environment was a substantial risk factor. Additionally, the Project Competence
researchers surmised that in a nurturing environment children could develop
competencies. According to Garmezy et al. these conclusions implied that
psychopathology in adulthood could be prevented.
Michael Rutter, another early researcher of risk and resiliency, came to many of
the same conclusions as the Project Competence researchers. Rutter (1979) identified the
following family variables associated with psychiatric disorders in childhood: severe
marital problems, poverty, a large family, maternal psychiatric disorders, parental
criminality, and removal from the home. However, Rutter discovered that approximately
21
25% of children exposed to multiple risk factors appeared to develop normally, as
evidenced by their socially adaptive behaviors. By studying these adaptive children,
Rutter and his colleagues identified factors which appeared to counteract the risk factors.
These include having a good temperament, having good health, being female, having a
high self-esteem, and being cognizant of future opportunities. Like the Project
Competence researchers, Rutter and his colleagues concluded that competencies could be
fostered in children from deprived environments (Rutter).
The studies of Werner and Smith, Project Competence, Michael Rutter, and others
laid the foundation for current studies of risk and resiliency. By focusing their efforts on
understanding adaptive behavior rather than maladaptive behavior, these researchers
promoted a more positive conceptualization of human development. Their research
promoted the idea that people were capable of positive development despite multiple life
challenges and risk factors. The discoveries of these researchers served as an impetus for
a new area of research, the study of resilience (Masten, 2001).
The Three Waves of Understanding Resilience
The foundational studies of Werner and Smith, Garmezy and his colleagues,
Rutter, and others paved the way for contemporary resilience research. Over the next
three decades the study of resiliency would evolve in what Richardson (2002) has coined
the “three waves” (p. 308) of understanding: the first wave identified resiliency as a set of
protective personal and environmental attributes (Joseph, 1994; Richardson; Valentine &
Feinauer, 1993); the second wave described resiliency as a process of coping with
22
adversity (Joseph; Richardson; Tedeschi & Kilmer); and the third wave characterizes
resiliency as an adaptational system present within all individuals which, if protected and
nurtured, will allow adaptive development in adverse situations and traumatic life
experiences (Geanellos, 2005; Richardson).
The First Wave: Resilient Characteristics
First wave studies in the area of resilience focused on identifying the
characteristics that differentiated “at risk” children adapting positively from maladaptive
children at risk (Hines et al., 2005; Richardson, 2002; Small & Memmo, 2004). These
resilient qualities, which serve to buffer individuals against the negative impact of
identified risk factors, are termed “protective factors”. Protective factors are classified as
either internal, characteristics existing within the individual, or external, characteristics
existing within one’s home, school, or community environment (Yates, Egeland, &
Sroufe, 2003). Internal protective factors include having a proactive approach to problem
solving, a good temperament, a sense of humor, spirituality, talent, good communication
skills, and sociability (Bogar & Hulse-Killacky, 2006; Joseph, 1994; Ungar, 2005;
Valentine & Feinauer, 1993; Waaktaar, Christie, Borge, & Torgersen, 2004).
Additionally, Rutter (1979) and Werner and Smith (1982) identified being female as a
protective factor, as they found that females tend to cope better with adversity than males.
External protective factors include having a strong support system either within or
outside of one’s home environment, consistent quality care, guidance and discipline
without rejecting attitudes, and positive school environments (Howard et al., 1999;
23
Richardson, 2002; Valentine & Feinauer, 1993; Yates et al., 2003). First wave
researchers also discovered that individuals having many protective factors were more
likely to display resilience than individuals with only a small number of protective factors
(Howard et al.). For example, Werner (2001) found that children who had several
protective factors were more likely to demonstrate a resilient pattern than were children
with fewer protective factors. Additionally, Hoyt-Meyers et al. (1995) discovered that
children who had more than one source of support responded more positively when
confronted with adversity than children with fewer support systems.
The Second Wave: Resilience as a Process
The second wave of resiliency inquiry extended the research from isolating risks
and protective factors to identifying resiliency as a process of overcoming adversity with
new insight and personal growth (Luthar, Cicchetti, & Becker, 2000; Richardson, 2002).
According to this process approach, resilient qualities are not stationary, but “shift
with…changes in cognition, emotion, and the social environment and may also vary with
the cultural context” (Hines et al., 2005, p. 382). Thus, a fundamental objective of this
wave of resilience research was to identify the processes which underlie adaptive
development despite adverse situations.
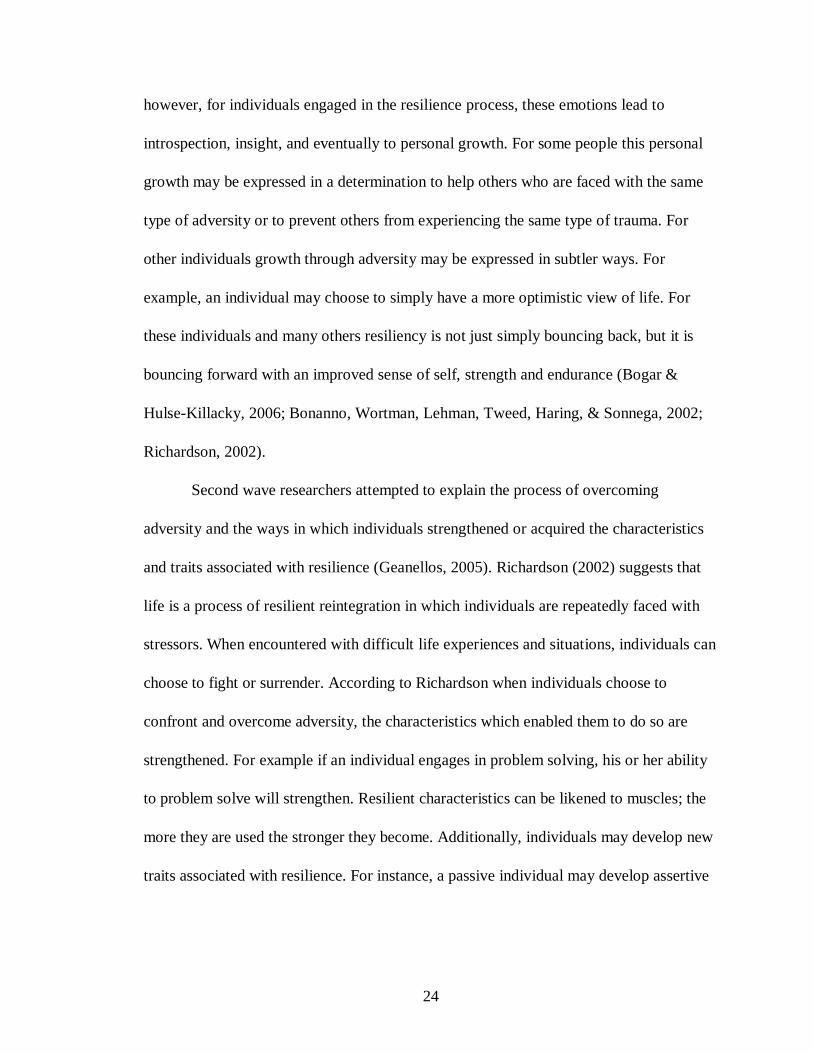
The resiliency process is one that occurs in stages. The onset of the process begins
with a traumatic event, psychosocial stressor, or a significant disruption within an
individual’s life. Anger, sadness, confusion, hurt, and anxiety often follow the disruption.
Many times people do not move beyond these emotions and indulge in self-pity;
24
however, for individuals engaged in the resilience process, these emotions lead to
introspection, insight, and eventually to personal growth. For some people this personal
growth may be expressed in a determination to help others who are faced with the same
type of adversity or to prevent others from experiencing the same type of trauma. For
other individuals growth through adversity may be expressed in subtler ways. For
example, an individual may choose to simply have a more optimistic view of life. For
these individuals and many others resiliency is not just simply bouncing back, but it is
bouncing forward with an improved sense of self, strength and endurance (Bogar &
Hulse-Killacky, 2006; Bonanno, Wortman, Lehman, Tweed, Haring, & Sonnega, 2002;
Richardson, 2002).
Second wave researchers attempted to explain the process of overcoming
adversity and the ways in which individuals strengthened or acquired the characteristics
and traits associated with resilience (Geanellos, 2005). Richardson (2002) suggests that
life is a process of resilient reintegration in which individuals are repeatedly faced with
stressors. When encountered with difficult life experiences and situations, individuals can
choose to fight or surrender. According to Richardson when individuals choose to
confront and overcome adversity, the characteristics which enabled them to do so are
strengthened. For example if an individual engages in problem solving, his or her ability
to problem solve will strengthen. Resilient characteristics can be likened to muscles; the
more they are used the stronger they become. Additionally, individuals may develop new
traits associated with resilience. For instance, a passive individual may develop assertive
25
qualities in order to proactively resolve a challenging situation, as the drive within the
individual to overcome his or her adversity is stronger than the individual’s timidity.
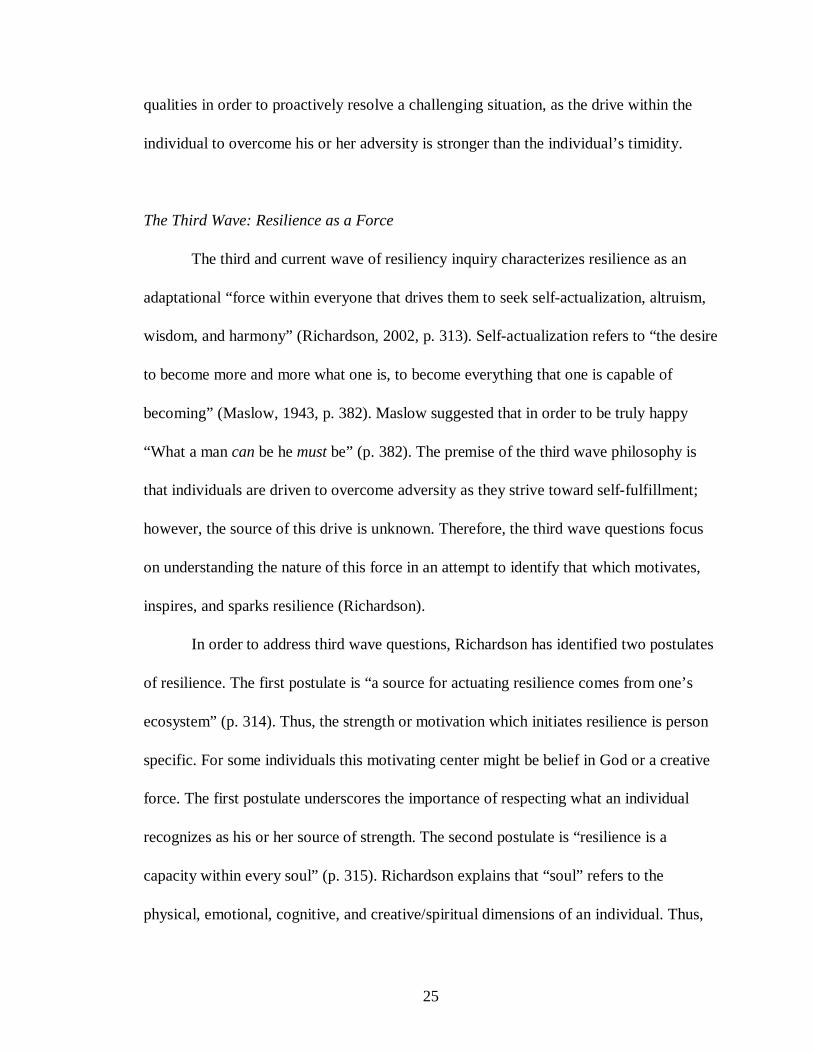
The Third Wave: Resilience as a Force
The third and current wave of resiliency inquiry characterizes resilience as an
adaptational “force within everyone that drives them to seek self-actualization, altruism,
wisdom, and harmony” (Richardson, 2002, p. 313). Self-actualization refers to “the desire
to become more and more what one is, to become everything that one is capable of
becoming” (Maslow, 1943, p. 382). Maslow suggested that in order to be truly happy
“What a man can be he must be” (p. 382). The premise of the third wave philosophy is
that individuals are driven to overcome adversity as they strive toward self-fulfillment;
however, the source of this drive is unknown. Therefore, the third wave questions focus
on understanding the nature of this force in an attempt to identify that which motivates,
inspires, and sparks resilience (Richardson).
In order to address third wave questions, Richardson has identified two postulates
of resilience. The first postulate is “a source for actuating resilience comes from one’s
ecosystem” (p. 314). Thus, the strength or motivation which initiates resilience is person
specific. For some individuals this motivating center might be belief in God or a creative
force. The first postulate underscores the importance of respecting what an individual
recognizes as his or her source of strength. The second postulate is “resilience is a
capacity within every soul” (p. 315). Richardson explains that “soul” refers to the
physical, emotional, cognitive, and creative/spiritual dimensions of an individual. Thus,
26
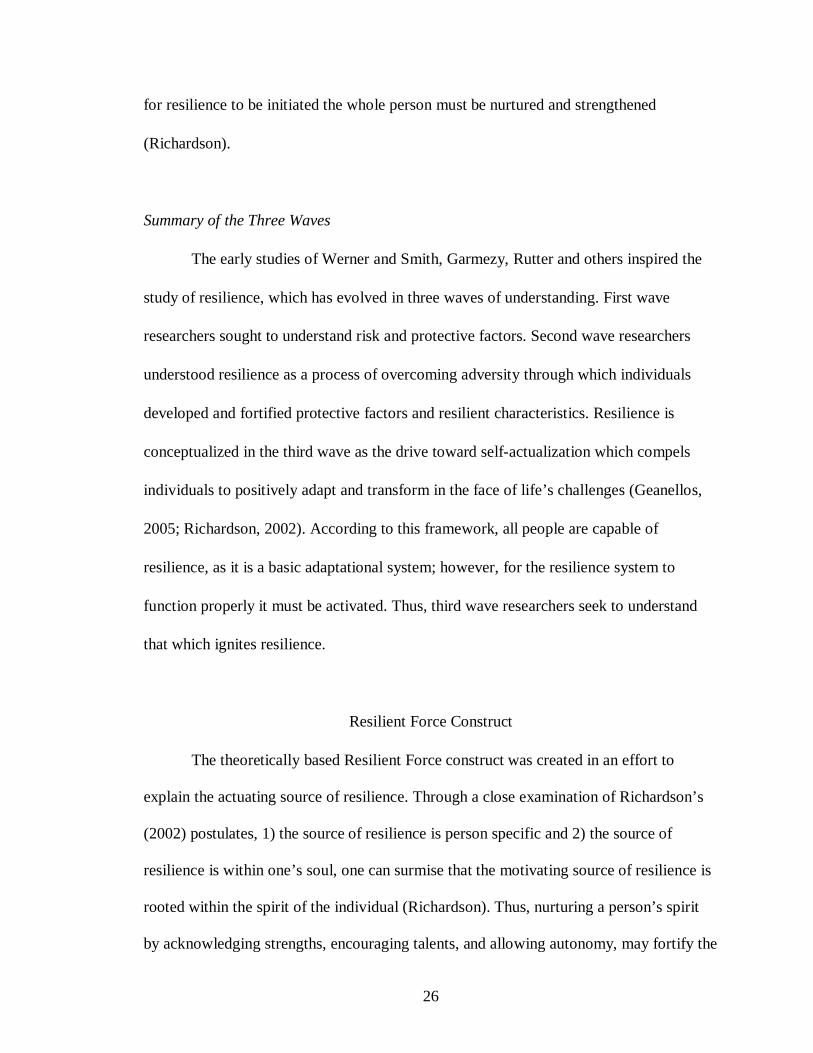
for resilience to be initiated the whole person must be nurtured and strengthened
(Richardson).
Summary of the Three Waves
The early studies of Werner and Smith, Garmezy, Rutter and others inspired the
study of resilience, which has evolved in three waves of understanding. First wave
researchers sought to understand risk and protective factors. Second wave researchers
understood resilience as a process of overcoming adversity through which individuals
developed and fortified protective factors and resilient characteristics. Resilience is
conceptualized in the third wave as the drive toward self-actualization which compels
individuals to positively adapt and transform in the face of life’s challenges (Geanellos,
2005; Richardson, 2002). According to this framework, all people are capable of
resilience, as it is a basic adaptational system; however, for the resilience system to
function properly it must be activated. Thus, third wave researchers seek to understand
that which ignites resilience.
Resilient Force Construct
The theoretically based Resilient Force construct was created in an effort to
explain the actuating source of resilience. Through a close examination of Richardson’s
(2002) postulates, 1) the source of resilience is person specific and 2) the source of
resilience is within one’s soul, one can surmise that the motivating source of resilience is
rooted within the spirit of the individual (Richardson). Thus, nurturing a person’s spirit
by acknowledging strengths, encouraging talents, and allowing autonomy, may fortify the
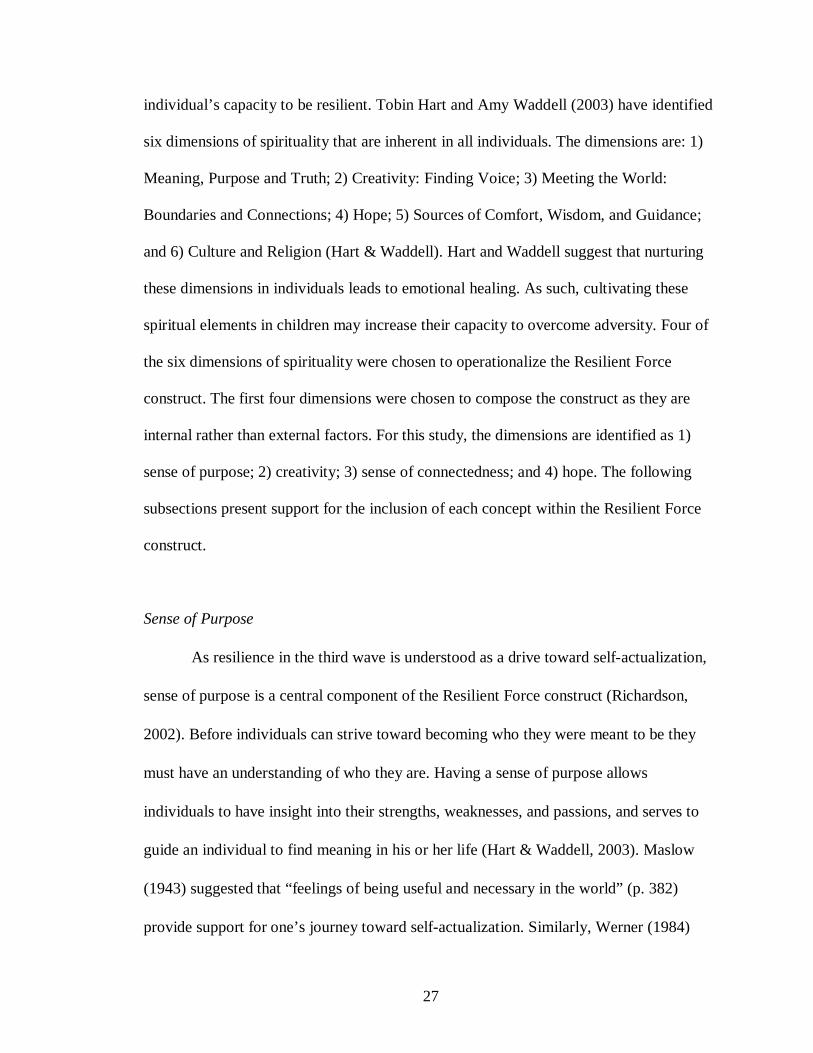
27
individual’s capacity to be resilient. Tobin Hart and Amy Waddell (2003) have identified
six dimensions of spirituality that are inherent in all individuals. The dimensions are: 1)
Meaning, Purpose and Truth; 2) Creativity: Finding Voice; 3) Meeting the World:
Boundaries and Connections; 4) Hope; 5) Sources of Comfort, Wisdom, and Guidance;
and 6) Culture and Religion (Hart & Waddell). Hart and Waddell suggest that nurturing
these dimensions in individuals leads to emotional healing. As such, cultivating these
spiritual elements in children may increase their capacity to overcome adversity. Four of
the six dimensions of spirituality were chosen to operationalize the Resilient Force
construct. The first four dimensions were chosen to compose the construct as they are
internal rather than external factors. For this study, the dimensions are identified as 1)
sense of purpose; 2) creativity; 3) sense of connectedness; and 4) hope. The following
subsections present support for the inclusion of each concept within the Resilient Force
construct.
Sense of Purpose
As resilience in the third wave is understood as a drive toward self-actualization,
sense of purpose is a central component of the Resilient Force construct (Richardson,
2002). Before individuals can strive toward becoming who they were meant to be they
must have an understanding of who they are. Having a sense of purpose allows
individuals to have insight into their strengths, weaknesses, and passions, and serves to
guide an individual to find meaning in his or her life (Hart & Waddell, 2003). Maslow
(1943) suggested that “feelings of being useful and necessary in the world” (p. 382)
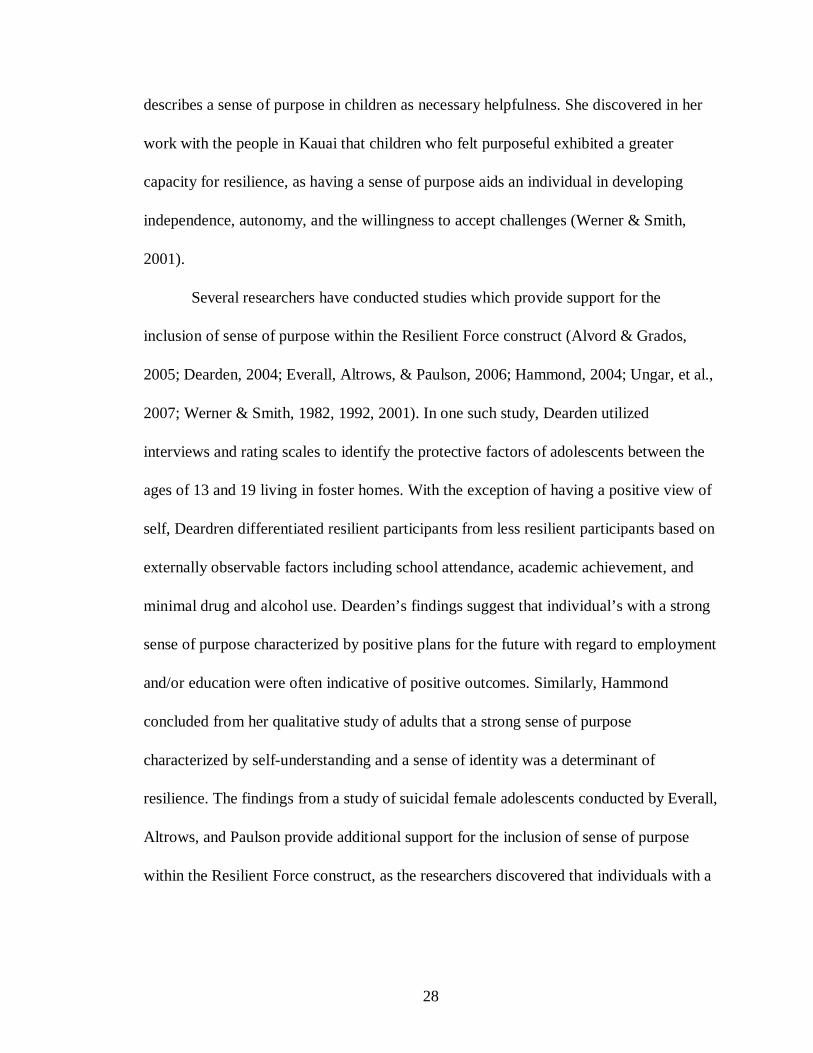
provide support for one’s journey toward self-actualization. Similarly, Werner (1984)
28
describes a sense of purpose in children as necessary helpfulness. She discovered in her
work with the people in Kauai that children who felt purposeful exhibited a greater
capacity for resilience, as having a sense of purpose aids an individual in developing
independence, autonomy, and the willingness to accept challenges (Werner & Smith,
2001).
Several researchers have conducted studies which provide support for the
inclusion of sense of purpose within the Resilient Force construct (Alvord & Grados,
2005; Dearden, 2004; Everall, Altrows, & Paulson, 2006; Hammond, 2004; Ungar, et al.,
2007; Werner & Smith, 1982, 1992, 2001). In one such study, Dearden utilized
interviews and rating scales to identify the protective factors of adolescents between the
ages of 13 and 19 living in foster homes. With the exception of having a positive view of
self, Deardren differentiated resilient participants from less resilient participants based on
externally observable factors including school attendance, academic achievement, and
minimal drug and alcohol use. Dearden’s findings suggest that individual’s with a strong
sense of purpose characterized by positive plans for the future with regard to employment
and/or education were often indicative of positive outcomes. Similarly, Hammond
concluded from her qualitative study of adults that a strong sense of purpose
characterized by self-understanding and a sense of identity was a determinant of
resilience. The findings from a study of suicidal female adolescents conducted by Everall,
Altrows, and Paulson provide additional support for the inclusion of sense of purpose
within the Resilient Force construct, as the researchers discovered that individuals with a
29
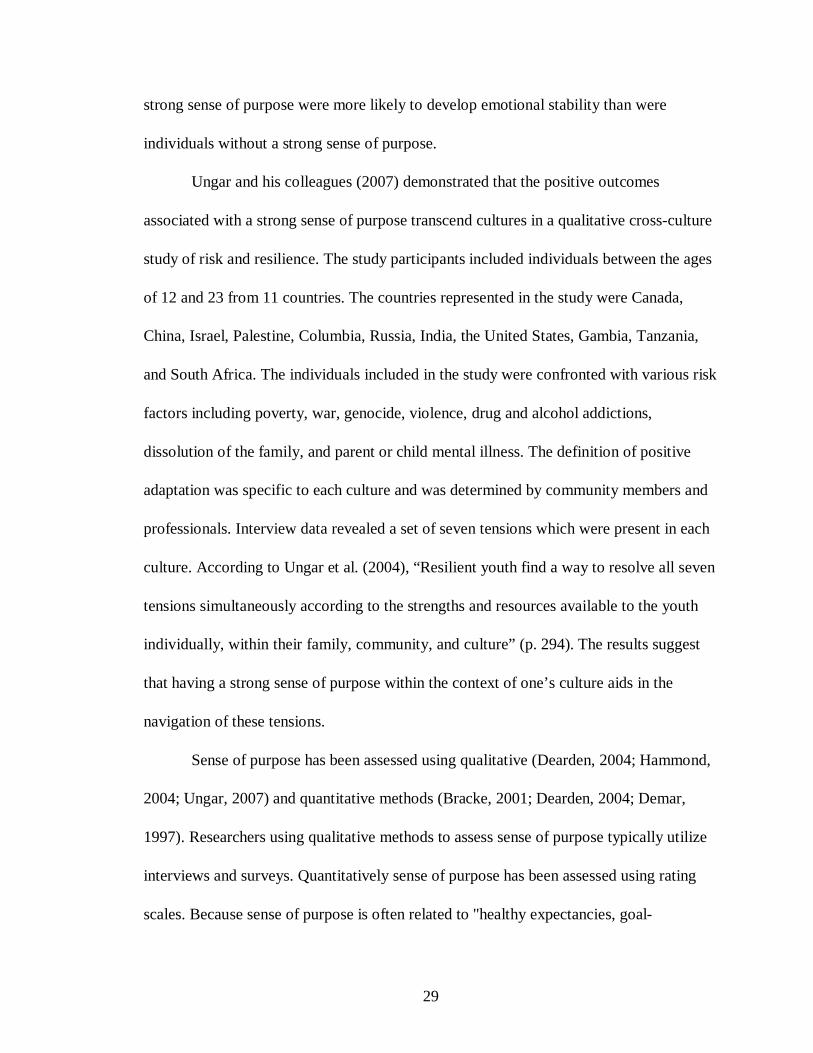
strong sense of purpose were more likely to develop emotional stability than were
individuals without a strong sense of purpose.
Ungar and his colleagues (2007) demonstrated that the positive outcomes
associated with a strong sense of purpose transcend cultures in a qualitative cross-culture
study of risk and resilience. The study participants included individuals between the ages
of 12 and 23 from 11 countries. The countries represented in the study were Canada,
China, Israel, Palestine, Columbia, Russia, India, the United States, Gambia, Tanzania,
and South Africa. The individuals included in the study were confronted with various risk
factors including poverty, war, genocide, violence, drug and alcohol addictions,
dissolution of the family, and parent or child mental illness. The definition of positive
adaptation was specific to each culture and was determined by community members and
professionals. Interview data revealed a set of seven tensions which were present in each
culture. According to Ungar et al. (2004), “Resilient youth find a way to resolve all seven
tensions simultaneously according to the strengths and resources available to the youth
individually, within their family, community, and culture” (p. 294). The results suggest
that having a strong sense of purpose within the context of one’s culture aids in the
navigation of these tensions.
Sense of purpose has been assessed using qualitative (Dearden, 2004; Hammond,
2004; Ungar, 2007) and quantitative methods (Bracke, 2001; Dearden, 2004; Demar,
1997). Researchers using qualitative methods to assess sense of purpose typically utilize
interviews and surveys. Quantitatively sense of purpose has been assessed using rating
scales. Because sense of purpose is often related to "healthy expectancies, goal-
30
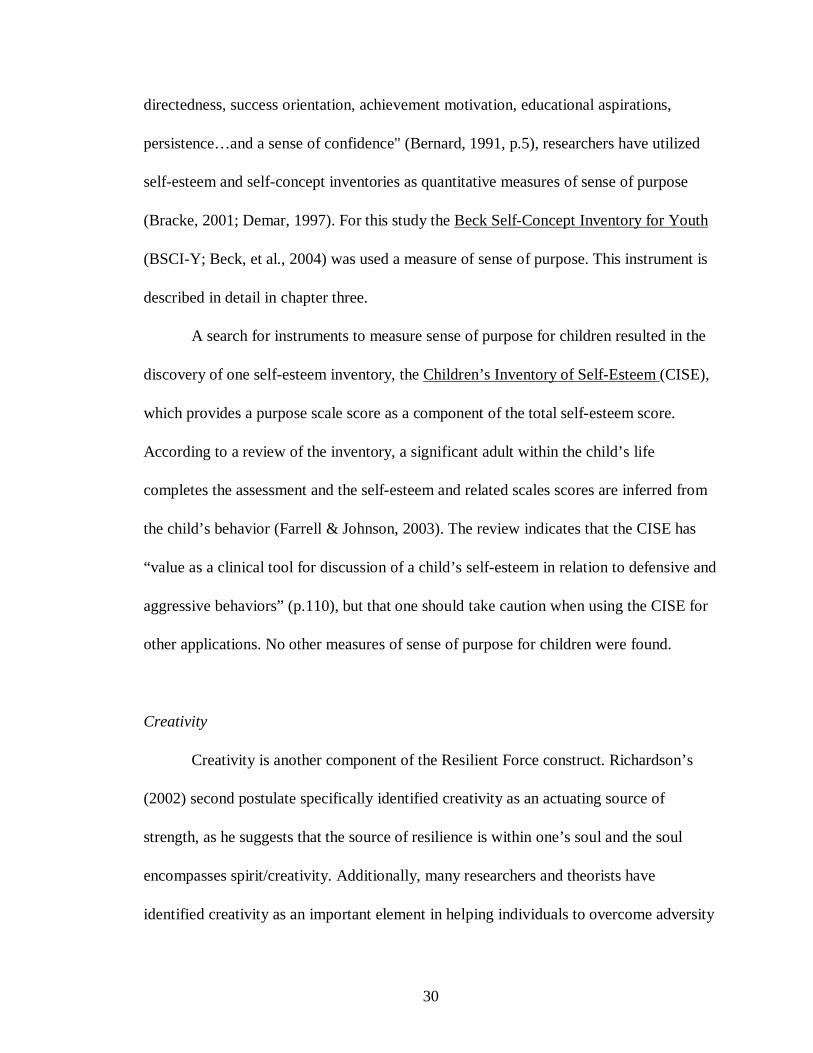
directedness, success orientation, achievement motivation, educational aspirations,
persistence…and a sense of confidence" (Bernard, 1991, p.5), researchers have utilized
self-esteem and self-concept inventories as quantitative measures of sense of purpose
(Bracke, 2001; Demar, 1997). For this study the Beck Self-Concept Inventory for Youth
(BSCI-Y; Beck, et al., 2004) was used a measure of sense of purpose. This instrument is
described in detail in chapter three.
A search for instruments to measure sense of purpose for children resulted in the
discovery of one self-esteem inventory, the Children’s Inventory of Self-Esteem (CISE),
which provides a purpose scale score as a component of the total self-esteem score.
According to a review of the inventory, a significant adult within the child’s life
completes the assessment and the self-esteem and related scales scores are inferred from
the child’s behavior (Farrell & Johnson, 2003). The review indicates that the CISE has
“value as a clinical tool for discussion of a child’s self-esteem in relation to defensive and
aggressive behaviors” (p.110), but that one should take caution when using the CISE for
other applications. No other measures of sense of purpose for children were found.
Creativity
Creativity is another component of the Resilient Force construct. Richardson’s
(2002) second postulate specifically identified creativity as an actuating source of
strength, as he suggests that the source of resilience is within one’s soul and the soul
encompasses spirit/creativity. Additionally, many researchers and theorists have
identified creativity as an important element in helping individuals to overcome adversity
31
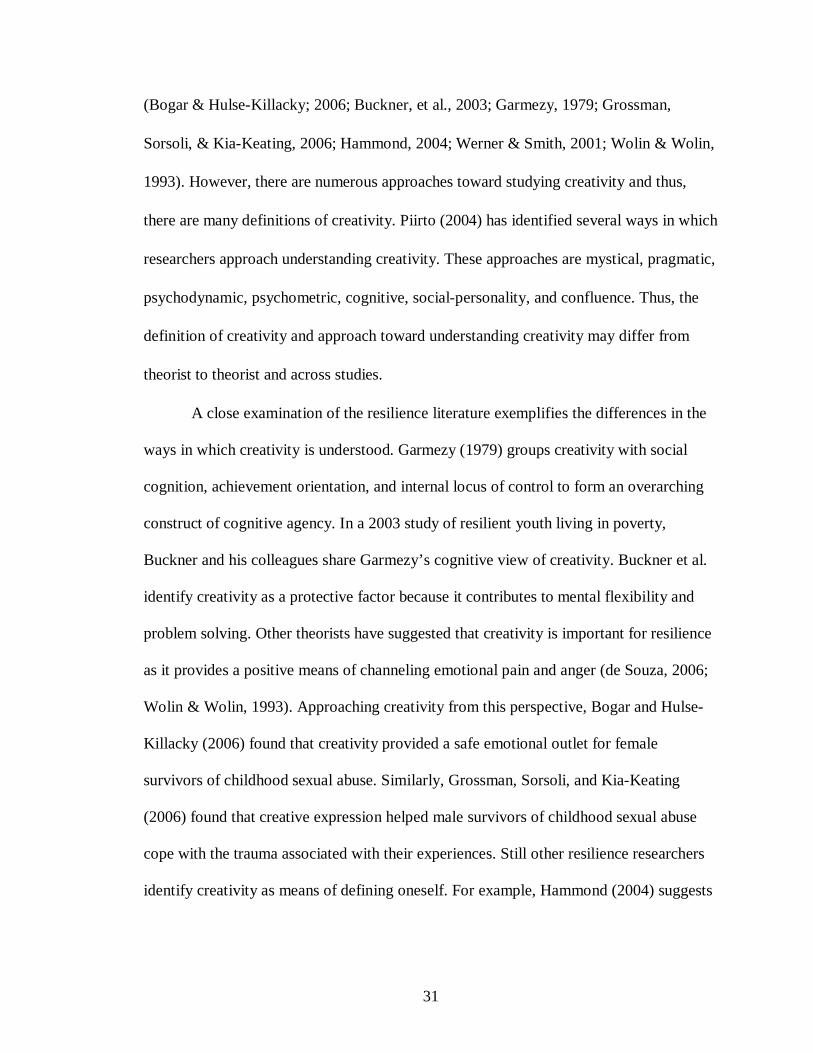
(Bogar & Hulse-Killacky; 2006; Buckner, et al., 2003; Garmezy, 1979; Grossman,
Sorsoli, & Kia-Keating, 2006; Hammond, 2004; Werner & Smith, 2001; Wolin & Wolin,
1993). However, there are numerous approaches toward studying creativity and thus,
there are many definitions of creativity. Piirto (2004) has identified several ways in which
researchers approach understanding creativity. These approaches are mystical, pragmatic,
psychodynamic, psychometric, cognitive, social-personality, and confluence. Thus, the
definition of creativity and approach toward understanding creativity may differ from
theorist to theorist and across studies.
A close examination of the resilience literature exemplifies the differences in the
ways in which creativity is understood. Garmezy (1979) groups creativity with social
cognition, achievement orientation, and internal locus of control to form an overarching
construct of cognitive agency. In a 2003 study of resilient youth living in poverty,
Buckner and his colleagues share Garmezy’s cognitive view of creativity. Buckner et al.
identify creativity as a protective factor because it contributes to mental flexibility and
problem solving. Other theorists have suggested that creativity is important for resilience
as it provides a positive means of channeling emotional pain and anger (de Souza, 2006;
Wolin & Wolin, 1993). Approaching creativity from this perspective, Bogar and Hulse-
Killacky (2006) found that creativity provided a safe emotional outlet for female
survivors of childhood sexual abuse. Similarly, Grossman, Sorsoli, and Kia-Keating
(2006) found that creative expression helped male survivors of childhood sexual abuse
cope with the trauma associated with their experiences. Still other resilience researchers
identify creativity as means of defining oneself. For example, Hammond (2004) suggests
32
that creativity is especially important for developing a sense of identity and a strong sense
of self.
Because there are numerous ways of understanding creativity, there are a several
ways in which creativity has been assessed. According to Davis (2004), there are “three
more-or-less accepted strategies for evaluating creative potential” (p. 30). These are
inventories of creative personality characteristics, inventories of creative activities, and
tests of divergent thinking. Within the framework of these three strategies there are a
variety of creativity assessments including tests of divergent production, behavior
checklists, personality questionnaires, performance assessments, and talent assessments
(Piirto, 2004).
A search of creativity assessments for elementary school aged children resulted in
tests of divergent production and behavior checklists. Behavior checklists require the
child’s teacher to complete the assessment; thus, these types of assessments are limited as
the teacher may not be aware of the child’s creative behavior outside of school (Piirto,
2004). However, various assessments have been used to assess creativity in older children
and adults. Some of these are summarized in the following subsections.
Khatena-Torrance Creative Perception Inventory; (KTCPI; Torrence & Khatena,
1998). The KTCPI was developed as a measure of creative personality and is appropriate
for individuals age 10 and older. The assessment generates 11 scale scores which are
acceptance of authority, self-confidence, inquisitiveness, awareness of others, disciplined
imagination, environmental sensitivity, initiative, self-strength, intellectuality,
33
individuality, and artistry. The KTCPI is a self-report instrument comprised of two
subtests. These are What Kind of Person are You? (WKOPAY?) and Something about
Myself (SAM). The WKOPAY? presents the examinee with a series of paired statements
which describe personality characteristics. From each pair of statements the examinee
identifies which most closely resembles him or her by placing a check next to that
statement. The SAM subtest presents the examinee with a list of statements and the
examinee places a check next to each statement that is descriptive of him or her. The
entire instrument takes approximately 20 minutes to complete.
The development of the WKOPAY? subtest is based on the notion that one’s
creativity is reflected in the way in which he or she behaves. Thus, the paired statements
reflect creative and noncreative ways of behaving. The SAM assesses creative ways of
thinking, as the statements reflect personality characteristics associated with ways of
thinking and thinking strategies. Although, the instruments were designed to assess
creativity, the KTCPI manual provides only a vague definition of the construct of
creativity (Callahan, 2005). Thus, the instrument does not discriminate different types of
creativity.
Manchester Personality Questionnaire (MPQ; CIM Test Publishers, 1996). The
MPQ is an assessment for adults which was designed as an occupational personality test.
The focus of the assessment is on traits associated with creative and innovative behavior.
The assessment provides scores for 14 dimensions. These are creativity, achievement,
agreeableness, extroversion, resilience, originality, rule consciousness, openness to
34
change, assertiveness, social confidence, empathy, communicativeness, independence,
rationality, competitiveness, conscientiousness, perfectionism, decisiveness,
apprehension, radicalness, and response style. Each dimension is assessed using 8 Likert-
type-type items which present statements associated with personality characteristics. The
examinees mark each statement according to the Likert-type-type scale to represent how
often they experience the thoughts and behaviors associated with the personality
characteristics. The assessment can be completed in approximately 20 minutes.
A review of the MPQ suggests that a strength of the MPQ is that it is more
oriented toward the measurement of creativity than many other personality assessments.
The reviewer supports the use of the MPQ as an occupational personality assessment, but
suggests that more research on validity is needed (Gebart Eaglemont, 1998). However, a
second reviewer found the manual vague and confusing and does not recommend the
MPQ (Isenhart, 1998).
Torrance Test of Creative Thinking (TTCT; Torrance, 1990). The TTCT is a test
of divergent production, which was designed to identify and evaluate creative potential.
The TTCT provides scores of verbal, figural, fluency, flexibility, originality, and
elaboration. Examinees complete a verbal test and a figural test. The verbal test contains
five activities which are ask and guess, product improvement, unusual uses, unusual
questions, and just suppose. Examinees complete the verbal portion of the assessment by
providing written responses to pictorial cues. The verbal portion of the assessment is
scored for flexibility, fluency, and originality. The figural test consists of tasks which are
35
figure completion, figure construction, and repeated circles or lines. The figure
completion task requires an individual to use incomplete figures to make a picture.
Examinees are required to make a picture from a circular shape for the picture
construction task. Examinees use the repeated circles or lines as a starting point to draw a
picture for the last task. The entire assessment takes approximately 90 minutes to
complete (Kim, 2006).
The KTCPI, MPQ, and TTCT are just of few of the many tests of creativity. A
similarity among most creativity measurements is that they assess various aspects or
dimensions of creativity. Bull and Davis (1982) suggest that “different forms of creative
activity will require different patterns of creativity traits and abilities” (p. 7). Thus, one
can infer that the characteristics of creative individuals may very greatly from person to
person.
Sense of Connectedness
Sense of purpose is another important component of the Resilient Force construct.
Sense of connectedness refers to feeling that one can establish safe and appropriate
interpersonal relationships. Interacting with one’s community and the ability to interact
with others in an appropriate and prosocial manner motivates the source of resilience by
creating a sense of attachment (Richardson, 2002). According to De Civita (2006), a
sense of connectedness can be fostered by focusing on a child’s strengths, which allows
for the development of openness and compassion (Hart & Waddell, 2003). This
36
compassion for others helps individuals look outside of themselves and develop empathy.
When individuals develop empathy, they do not feel as isolated in their adversity (Hart,
1999).
Previous studies of resilience provide support for the inclusion of sense of
connectedness within the Resilient Force construct (de Souza, 2006). For example,
Aronowitz (2005) found that among at-risk youth living in poverty having a sense of
connectedness led “to a sense of identity and the development of personal values, and the
process of considering alternatives” (p. 205). Additionally, in a study of risk and
protective factors regarding adolescent depression Denny, Clark, and Fleming (2004)
discovered that students who felt a sense of connectedness were less likely to experience
feelings of depression than their peers. Werner and Smith (1982; 1992; 2001) indicate
that resilient individuals have a sense of connectedness as they are able to develop
positive interpersonal relationships.
There are very few instruments designed to assess a sense of connectedness. A
search for a measure of sense of connectedness for children resulted in the finding of one
measure. This was a self-esteem inventory, Insight: Assessing and Developing Self-
Esteem (Morris, 2002) which included a sense of belonging scale. This assessment is
completed by an adult observer and the child. Thus, it was not an appropriate measure for
this study. Sense of connectedness was assessed for this study using two dimensions of a
multidimensional life satisfaction scale. This measurement is discussed in detail in
chapter three.
37
Hope
Richardson (2002) described hope as an essential component of the motivating
source of resilience; thus hope has been included in the Resilient Force construct. Like
meaning purpose and truth, hope provides a sense of purpose and motivates an individual
to pursue his or her goals (Bernard, 1991). Hope aids in resilience as it is linked to
survival and allows individuals to overcome stress. Hopeful individuals are able to look
toward the future. This concept of being optimistic about the future aids in crisis
resolution because there is a reason for overcoming adversity (Snyder et al., 1997;
Snyder, Ritschel, Rand, & Berg, 2006; Turner, 2005). Hope has been likened to
autonomy as it gives an individual a sense of control over his or her life (Bernard, 1991).
Many researchers have noted that having a sense of hope fortifies an individual’s
capacity to be resilient. For instance, Alvord and Grados (2005) suggest that hopeful
individuals tend to assertively respond to adversity because they feel that they have the
ability to make an impact on their environment or situation. The notion that hope leads to
action is further supported by a study conducted by Everall, Altrows, and Paulson (2006)
of resilience in suicidal female adolescents. Everall and her colleagues found that when
the study participants began to feel hopeful they also began to exhibit goal-directed
behavior. Additionally, Snyder and her colleagues (1997) found that hope was a robust
predictor of positive coping and adjustment, as hope allows individuals to actively
participate in their lives rather than to be passive observers.
38
The hope assessment utilized for this study was the only instrument this
researcher could find for assessing hope in children. The Children’s Hope Scale (Snyder,
et al., 1997) is described in detail in chapter three.
Summary of the Resilient Force Construct
The philosophy of the third wave posits that resilience is a motivational force
within all individuals and drives them toward self-actualization. The source of the
motivational force is unknown. The Resilient Force construct was created as a possible
explanation of this motivational force. A review of literature provided a theoretical basis
for the inclusion of sense of purpose, sense of connectedness, creativity, and hope within
the Resilient Force construct. Additionally, previous studies of resilience support the
notion that these concepts aid individuals in overcoming adversity. Alternative measures
of each of these concepts were also presented.
Assessment of Resilience
Researchers studying resilient qualities, the process of resilience, or resilience as a
motivational force, must first identify individuals who display a resilient pattern
characterized by positive adaptation in the context of adversity. According to Masten and
Powell (2003), classifying a person as having a resilient pattern “requires two
fundamental judgments: (1) that a person is doing okay and (2) that there is now or has
been significant risk or adversity to overcome” (p. 4). Due to the subjectivity of these
judgments, researchers have differing opinions concerning the criteria one should use to
determine the degree to which a person is doing okay or has demonstrated positive
39
adaptation. Additionally, researchers have assessed adaptation with regard to numerous
risk factors and stressors (Bogar & Hulse-Killacky, 2006; Brooks, 1994; Masten &
Powell; Mendez, Fantuzzo, & Cicchetti, 2002; O'Donnell et al., 2002; Sugland, Zaslow,
& Nord, 1993; Tedeschi & Kilmer, 2005).
Assessment of Stress, Risk, and Adversity
Risk factors are adverse circumstances or stressors which have been associated
with an increase in an individual’s risk of maladaptive development. In studies of
resilience in children, researchers generally operationalize adversity in one of two ways.
One of these ways is to identify the number of stressors the child has experienced in the
recent past (Fergus & Zimmerman, 2005). Buckner et al. (2003) illustrate this approach,
termed the “life stressors” method in their study of resilient youth living in poverty. The
resilient youth study participants received a questionnaire which listed 40 stressors.
Examples of stressors included exposure to violence, death of a friend or parent, serious
illness, and parental arrest or incarceration. Buckner et al. asked the study participants to
identify the stressors the participants had experienced within the past year and rate the
stressfulness of the identified stressors. The level of risk and adversity of each participant
was then quantified by tallying the child’s stressors.
Due to the empirical nature and pragmatic value of the life stressors method,
many researchers find it intuitively appealing; however, there has been some debate
regarding the direction of causality between life stressors and maladjustment. While it is
hypothesized that life stressors lead to maladjustment, it is quite possible that life
40
stressors are rather an expression of maladjustment (Sugland et al., 1993). For instance,
poverty rates are higher among maladjusted individuals and impoverished neighborhoods
have been associated with higher crime rates. Thus, a person said to be non-resilient
indicating recent exposure to life stressors of poverty and crime may be poorly adjusted
because of these stressors. Conversely, an individual’s exposure to poverty and crime
may be a manifestation of his or her maladjustment. In other words, a poorly adjusted
individual may place him or herself in situations that would otherwise be considered a
risk factor.
The cohort method is the second manner in which researchers have
operationalized adversity. Researchers assessing risk using the cohort method examine
groups of individuals exposed to the same stressor. Much of the research associated with
Project Competence examined adjustment among cohorts of individuals exposed to the
same type of adversity. Examples of cohort groups from the Project Competence studies
include: children whose parents suffer from mental illness, children living in homeless
shelters, and children living in extreme poverty (Dean, 1973; Garmezy et al., 1984;
Garmezy & Rutter, 1988; Rolf et al., 1990; Masten, 2001; Masten & Powell, 2003).
Because this method treats individuals faced with similar stressors as homogenous
groups, it is limited by its failure to account for previous stressors in the life of the
individual and variations in the “stressfulness” of the event to the particular individual
(Garmezy et al., 1984; Luthar & Zelazo, 2003; Sugland et al., 1993)., Luthar and Zelazo
(2003), however, suggests that these limitations do not “represent a fatal flaw for either
risk or resilience research… [as] there is still much to be learned from studies in which
41
the life adversity is treated as a global index connoting high statistical odds of
maladjustment” (p. 512). In other words, while there are limitations, the cohort method is
a valid approach to examining the relationship between risk and resiliency.
For the current study risk is operationalized using the cohort method. The cohort
chosen for this study are children in grades third through fifth from low socioeconomic
backgrounds. Researchers have identified several negative outcomes linked to low
socioeconomic status (SES) including educational underachievement and social,
emotional and behavioral problems (Owens & Shaw, 2003). Research has established
that exposure to multiple risk factors as opposed to a single specific risk factor increases
the probability of maladjustment (Ferguson & Horwood, 2003; Rutter, 1979). It has been
suggested that low-SES is a strong predictor of negative outcomes because, although
identified as a single risk factor, low-SES is associated with a cluster of related risks
including a lack of parental supervision, few community resources, low parental
education, low parental employment level, parental psychopathology, single parentness,
and exposure to negative life events such as crime and poor nutrition (Fergus &
Zimmerman, 2005; Mash & Barkley, 2003; Owens & Shaw, 2003). Low-SES has been
associated with lower levels of parental warmth and less access to cognitive stimulation
(Kim-Cohen et al., 2004).
Criteria Used to Assess Positive Adaptation
When studying resilience, once risk has been established, the second judgment
researchers make is the degree to which a person is doing okay or shows positive
42
adaptation (Masten & Powell, 2003). While some investigators define positive adaptation
in children in terms of internal emotional states, most of the research in the area of
resilience has focused on examining external behavioral characteristics (Baruth &
Carroll, 2002; Gothelf, Apter, & van Praag, 1997). Researchers typically infer resilience
when a child demonstrates social competence characterized by a consistent pattern of
meeting major societal expectations appropriate for children of his or her age and cultural
group (Masten, 2001). For example, a toddler might be considered well-adapted if he or
she demonstrates secure attachments to caregivers, school-aged children are likely to be
assessed according to success in school, and an adolescent might be regarded as socially
competent if he or she is doing well in school, and has positive relationships with his or
her parents and peers (Luthar & Zelazo, 2003). Social competence is generally assessed
through evaluations from parents and teachers, as well as documentation of the child’s
grades and behavioral records in school (Mendez, Fantuzzo, & Cicchetti, 2002).
A limitation to inferring resilience through the assessment of social competence is
the assumption that positive adaptation is comprised of only those factors observable to
others. Therefore, the social competence approach does not account for internal
indicators of maladjustment. Some children exposed to adversity may exhibit social
competence, but suffer from internalizing symptoms such as depression and anxiety.
Luthar (1991) suggests that “it is possible that ‘resilient’ children’s reactions to their
stressful experiences are primarily of an internalizing nature” (p. 602). This notion is
based on two empirically based findings: 1) at higher levels of development poor
adaptation is expressed more frequently in terms of internalizing disorders rather than
43
externalizing behavior and 2) due to nature of social competence (functioning at or above
developmentally appropriate levels), children deemed well-adjusted based on social
competence criteria are likely to be at high-developmental levels (Luthar).
Operationalizing positive adaptation using the social competence approach is an
appropriate method for assessing an individual’s general level of functioning, but it gives
little insight into the internal emotional state of the individual. Thus, it is imperative that
more research be conducted in this area.
Summary of Assessment of Resilience
An individual is classified as having a resilient pattern if he or she demonstrates
positive adaptation in the context of stress, risk, or adversity. Thus, researchers studying
resilience must define and assess risk as well as positive adaptation. Risk status is
generally assessed in one of two ways, which are the life stressors method and the cohort
method. Researchers using the life stressors method tally the participant’s number of
recent stressors to identify the participant’s level of risk. Whereas, researchers utilizing
the cohort method examine groups of individuals exposed to the same type of stressor.
Once risk has been established positive adaptation must be evaluated. While most
researchers assess positive adaptation by examining one competence relative to societal
norms and expectations, some researchers assess positive adaptation based on internal
factors such as emotional states.
44
Emotionality Construct
The Emotionality construct, comprised of perceptions of anger, anxiety, and
disruptive behavior, was created as a means of assessing positive adaptation for this
study. Feelings of depression, anger, and anxiety are interwoven (Mash & Barkley,
2003). Anger, especially in males, is often depression expressed outwardly. Likewise,
anxiety frequently coexists with depression; this is especially true for females. Disruptive
behavior was included in this construct, as it is often indicative of negative emotions not
otherwise expressed (Mash & Barley).
Garmezy et al. (1979) explored the relationship between risk factors and
depression and anger in children. He and his colleagues noted that children at risk due to
poverty, parental mental illness, and environmental instability were more likely to
experience negative emotions than were their peers who were not considered at risk.
Furthermore, Garmezy et al. discovered that children who experienced feelings of anger
and depression were less likely to demonstrate social competence than were their peers.
This finding supports the inclusion of disruptive behavior within the Resilient Force
construct, as it demonstrates the relationship between internalizing and externalizing
behaviors.
For this study, the anger, anxiety, depression, and disruptive behavior scales of
the Beck Youth Inventory, second edition (BYI-II; Beck, et al., 2005) were used as
measures of anger, anxiety, depression, and disruptive behavior. The Beck scales assess
the frequency of a child’s perceived experiences of anger, anxiety, depression and
45
disruptive behavior. While these negative emotions can serve as an impetus for personal
growth, individuals who are consumed with these emotions are not engaged in resilience.
Thus, the Beck scales are an appropriate measure of the concepts associated with the
Emotionality construct.
Summary
As the way in which resilience has evolved over the past several years this chapter
begins with an historical overview of resilience research. Research from the early
researchers such as Werner and Smith, Garmezy, and Rutter is presented. The second
section presents the three waves of resiliency. A discussion of risk and protective factors
is followed by a description of resilience as a process and the current conceptualization of
resilience as a motivational force is addressed. The third section provides theoretical and
empirical support for the Resilient Force construct. The fourth section examines the ways
in which the concepts of risk and resilience have been assessed. Finally, I provide a
discussion of the Emotionality construct, which is used to assess positive adaptation for
this study.
46
CHAPTER III
METHOD
This study examined the relationship between two theoretical constructs,
Emotionality and Resilient Force, in third, fourth, and fifth grade children. To investigate
Emotionality and Resilient Force eight variables were studied. The variables used to
measure the Emotionality construct were scores obtained on anger, anxiety, depression,
and disruptive behavior scales. Resilient Force was assessed by examining measures of
sense of purpose, sense of connectedness, creativity, and hope. This chapter describes the
research participants, the research instruments, the data collection procedure, and the
statistical analyses employed to answer the research questions.
This study was conducted in conjunction with Project CREATES, a large grant-
funded research project. Project CREATES: Community Resources Encouraging All
Teachers to Educate with Spirit (Montgomery, Otto, & Hull, 2007) conducted research
on methods designed to transform teaching and learning through the implementation of
arts-infused curriculum. Over the five-year course of the project, the research has been
conducted in four elementary schools in a midwestern city.
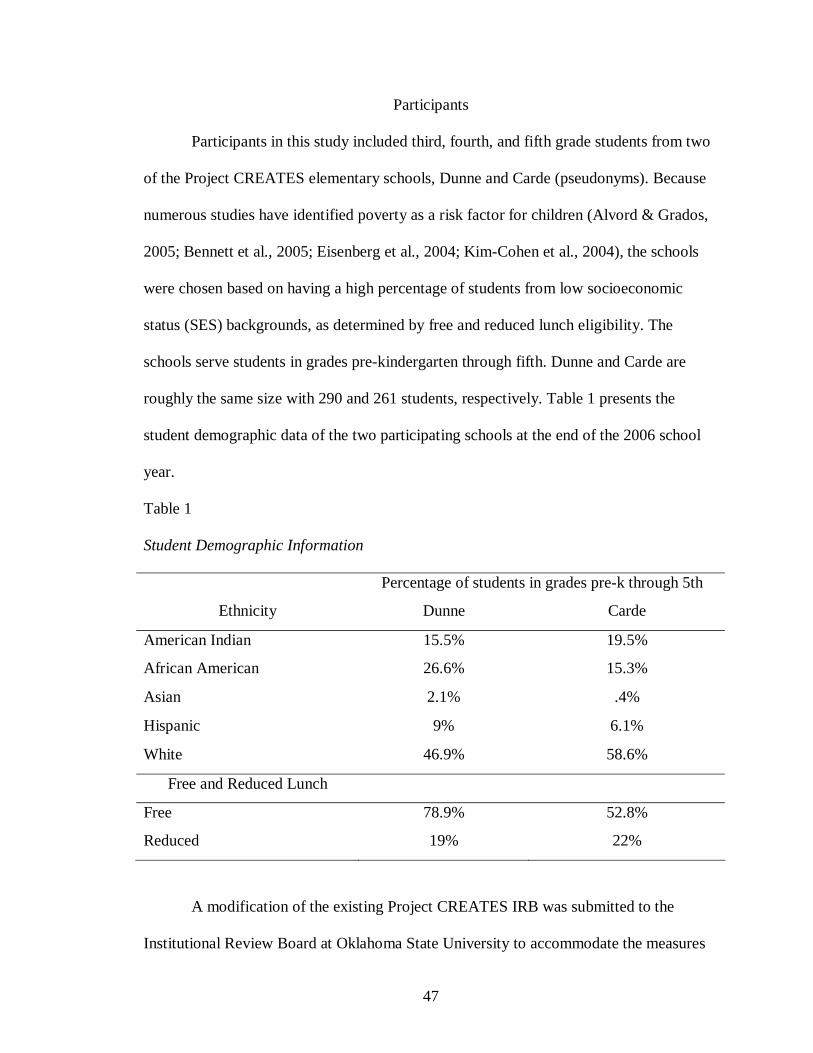
47
Participants
Participants in this study included third, fourth, and fifth grade students from two
of the Project CREATES elementary schools, Dunne and Carde (pseudonyms). Because
numerous studies have identified poverty as a risk factor for children (Alvord & Grados,
2005; Bennett et al., 2005; Eisenberg et al., 2004; Kim-Cohen et al., 2004), the schools
were chosen based on having a high percentage of students from low socioeconomic
status (SES) backgrounds, as determined by free and reduced lunch eligibility. The
schools serve students in grades pre-kindergarten through fifth. Dunne and Carde are
roughly the same size with 290 and 261 students, respectively. Table 1 presents the
student demographic data of the two participating schools at the end of the 2006 school
year.
Table 1
Student Demographic Information
Percentage of students in grades pre-k through 5th
Ethnicity Dunne Carde
American Indian 15.5% 19.5%
African American 26.6% 15.3%
Asian 2.1% .4%
Hispanic 9% 6.1%
White 46.9% 58.6%
Free and Reduced Lunch
Free 78.9% 52.8%
Reduced 19% 22%
A modification of the existing Project CREATES IRB was submitted to the
Institutional Review Board at Oklahoma State University to accommodate the measures
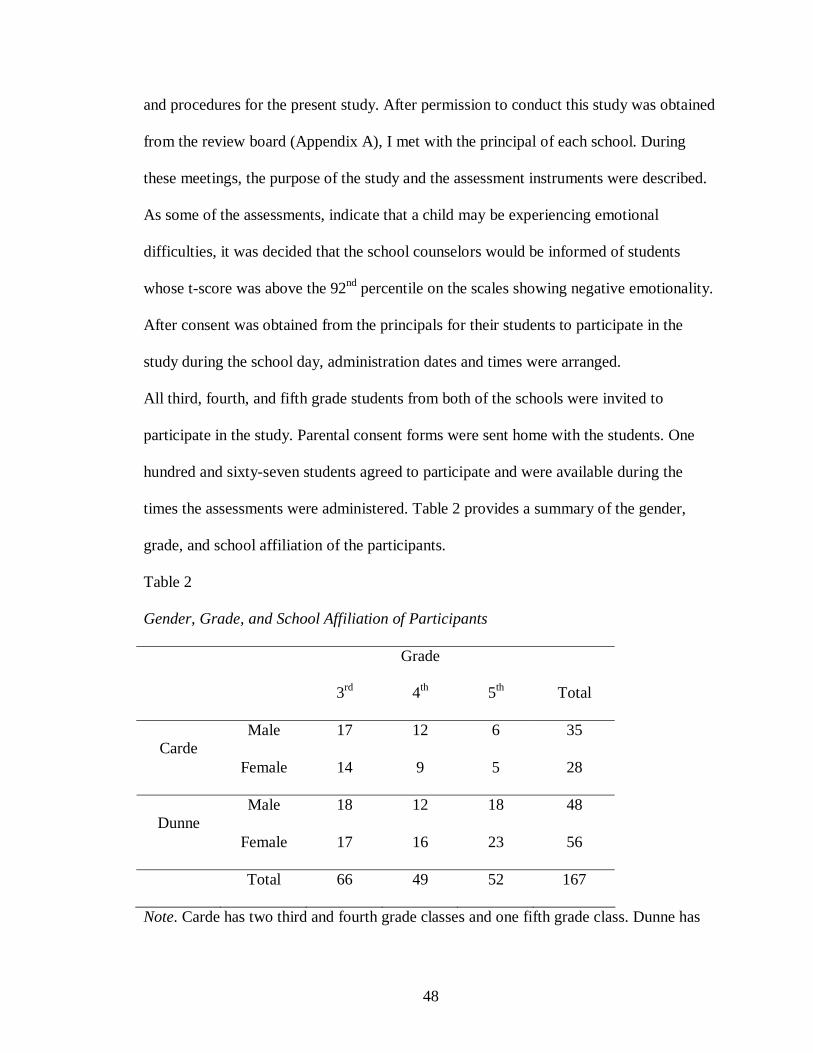
48
and procedures for the present study. After permission to conduct this study was obtained
from the review board (Appendix A), I met with the principal of each school. During
these meetings, the purpose of the study and the assessment instruments were described.
As some of the assessments, indicate that a child may be experiencing emotional
difficulties, it was decided that the school counselors would be informed of students
whose t-score was above the 92nd percentile on the scales showing negative emotionality.
After consent was obtained from the principals for their students to participate in the
study during the school day, administration dates and times were arranged.
All third, fourth, and fifth grade students from both of the schools were invited to
participate in the study. Parental consent forms were sent home with the students. One
hundred and sixty-seven students agreed to participate and were available during the
times the assessments were administered. Table 2 provides a summary of the gender,
grade, and school affiliation of the participants.
Table 2
Gender, Grade, and School Affiliation of Participants
Grade
3rd 4th 5th Total
Male 17 12 6 35 Carde
Female 14 9 5 28
Male 18 12 18 48 Dunne
Female 17 16 23 56
Total 66 49 52 167
Note. Carde has two third and fourth grade classes and one fifth grade class. Dunne has
49
two third, fourth, and fifth grade classes, as well as a gifted class of third, fourth, and fifth
graders and a gifted class including third graders.
Instrumentation
A total of four assessment instruments were used to measure the variables
identified in this study. The participants were administered the five inventories which
compose the Beck Youth Inventories, Second Edition (Beck et al., 2005); two of the five
scales associated with the Multidimensional Students’ Life Satisfaction Scale (Huebner,
2001a); the Goff-Torrance Creativity Indicator (Goff, 2005); and the Children’s Hope
Scale (Snyder et al., 1997). The following two paragraphs identify which of these
assessment instruments were used to measure each theoretical construct.
The Emotionality construct was examined using four of the five scales of The
Beck Youth Inventories, Second Edition (Beck et al., 2005; the fifth scale was used to
examine the Resilient Force construct, as discussed in the next paragraph). The Beck
scales used to examine this construct were the Beck Anger Inventory for Youth, the Beck
Anxiety Inventory for Youth, the Beck Depression Inventory for Youth, and the Beck
Disruptive Behavior Inventory for Youth. These scales were used to assess anger,
anxiety, depression, and disruptive behavior, correspondingly. The disruptive behavior
scale was included as a measurement of the Emotionality construct, as some children
have difficulty verbally expressing feelings of anger, anxiety, and depression and may
externalize these feelings through disruptive behavior (Mash & Barkley, 2003).
Therefore, including the disruptive behavior scale may provide a measure of the students’
feelings of painful emotions not otherwise expressed.
50
The Resilient Force construct was measured using four instruments. A composite
of two scales from the Multidimensional Students’ Life Satisfaction Scale (Huebner,
2001a), satisfaction with friends and satisfaction with family, was used to assess sense of
connectedness. Creativity and hope were evaluated using the Goff-Torrance Creativity
Indicator (Goff, 2005) and the Children’s Hope Scale (Snyder, et al., 1997), respectfully.
The fifth scale of The Beck Youth Inventories, Second Edition, the self-concept scale
was used as a measure of sense of purpose.
The Beck Youth Inventories, Second Edition
Beck et al. (2005) developed the Beck Youth Inventories, Second Edition (BYI-
II) inventories based on initial pilot studies, community samples, and standardization
samples drawn from the community samples. The pilot study participants were children,
ages 7-14, which were in therapy in numerous clinical settings, including partial
hospitalization facilities, outpatient settings, and private practices. Statements from these
children regarding their subjective experiences of emotional states constituted initial item
design. Items were selected based on the distribution of the children’s statements and the
ability of an item to differentiate clinical samples from non-clinical samples. The pilot
studies led to the development of an initial 25-item version of the inventories. Research
assistants and trained staff administered this initial version to a community sample
consisting of 1,100 children ages, 7-14, from four geographic regions in the United
States. Based on the responses from the community sample five items were eliminated
from each inventory resulting in the final 20-item BYI-II (Beck et al.).
51
Eight hundred children were chosen from the community sample to compose the
standardization sample. To ensure that each selected demographic variable, race and
parent education level were proportionately represented, the standardization sample was
stratified. As the purpose of the standardization sample was to generate age by sex T
score norms and descriptive cumulative percentages, it was important that the two age
groups, 7-10 and 11-14, and each sex had equal representation. Therefore, Beck et al.
selected two hundred children from each of the four groups to match the U.S. census by
race and parental education level to compose the standardization sample. Approximately
400 children were chosen from the community sample to participate in concurrent
validity studies (Beck et al).
The Inventories
The Beck Youth Inventories, Second Edition (BYI-II) consists of five self-report
inventories, which include the Beck Anger Inventory for Youth (BANI-Y), the Beck
Anxiety Inventory for Youth (BAI-Y), the Beck Depression Inventory for Youth (BDI-
Y), the Beck Disruptive Behavior Inventory for Youth (BDBI-Y), and the Beck Self-
Concept Inventory for Youth (BSCI-Y). These inventories assess anger, anxiety,
depression, disruptive behavior, and self-concept, respectively. Each scale consists of 20
statements that describe thoughts, feelings and behaviors associated with the assessment
focus of the particular inventory.
Beck Anger Inventory for Youth. The BANI-Y items assess the child’s perceptions
of mistreatment, emotional and physical feelings related to anger, and negative thoughts
52
about others. Although angry feelings may be present without corresponding aggressive
behaviors, many anger assessments designed for use with children, such as The
Children’s Hostility Inventory (Kazdin, Rodgers, Colbus, & Siegel, 1987) assess
internalizing and externalizing behaviors simultaneously (Beck, et al., 2005). The BANI-
Y differs from these in that it assesses the child’s subjective experience of thoughts and
feelings associated with anger.
Beck Disruptive Behavior Inventory for Youth. The BDBI-Y includes items that
identify externalizing behaviors associated with oppositionality and conduct problems.
While several multidimensional self-report measures including the Minnesota
Multiphasic Personality Inventory-A (MMPI-A; Butcher, et al.,1992), the Youth Self-
Report (YSR; Achenbach & Edelbrock, 2001), and the Trauma Symptom Checklist for
Children (TSCC; Briere, 1996), assess a variety of emotional and behavioral problems in
children and adolescents, they lack the brevity of the BDBI-Y (Beck, et al., 2005) The
ability of the BDBI-Y to specifically measure externalizing behaviors apart from the
feelings and cognitions associated with anger is another way in which the BDBI-Y differs
from many other assessments.
Beck Anxiety Inventory for Youth. The BAI-Y items are related to worry and fear
and the subsequent physical symptoms. Specific worries and fears about getting hurt,
going to school, and physical illness are included in this inventory. Unlike many other the
BAI-Y is able to discriminate anxiety and other emotional disturbances (Beck et al.,
2005). Many instruments also have difficulty differentiating anxious feelings from
53
feelings and behaviors associated with Attention-Deficit/Hyperactivity Disorder related
symptoms. The BAI-Y is able to isolate and assess the construct of anxiety.
Beck Depression Inventory for Youth. Designed to identify signs of depression,
the BDI-Y is composed of items which reflect negative thoughts about one’s self,
feelings of sadness, and the physical indications of depression. Many other depression
assessments for use with children, such as the Children’s Depression Inventory (CDI;
Kovacs, 1992), the Reynolds Child Depression Scale (RCDS; Reynolds, 1989), and the
Children’s Depression Scale (CDS; Lang & Tisher, 1978) include items that are
indicative of both anxiety and depression (Beck et al., 2005). Therefore, they are unable
to distinguish characteristics attributed to anxiety from characteristics attributed to
depression. However, the BDI-Y does differentiate depression from anxiety, as the
statements were carefully selected to reveal signs of depression and not anxiety.
Beck Self-Concept Inventory for Youth. The BSCI-Y explores an individual’s
perceptions regarding his or her potential, competence and self-worth. Self-concept has
been researched as a one-dimensional measure in an attempt to assess an individual’s
global self-perception. Self-concept has also been researched as a multidimensional
construct used to assess perceived competence in specific domains. The BSCI-Y is
designed to measure one’s global sense of self. It differs from other one-dimensional
measures of self-concept such as The Self-Esteem Inventory (SEI; Coopersmith, 1989)
and the Peirs-Harris Children’s Self-Concept Scale (PHCSCS; Piers, 1996; 2002) in its
54
brevity and ease of administration (Beck et al ., 2005) Sample items include: “People
think I’m good at things;” “I am a good thinker;” “People want to be with me.”
In resilience literature a sense of purpose refers to a “sense of usefulness,”
(Howard, Dryden, & Johnson, 1999, p. 312) and self-worth (Bernard, 1991). Children
with a strong sense of purpose feel competent (Bernard). For this study, the Beck Self-
Concept Inventory for Youth was used as a measure of sense of purpose, as the Beck
self-concept scale assesses a child’s perception of his or her self-worth and competence
(Beck et al, 2005).
Administration and Scoring
The BYI-II inventories may be used alone or in combination to assess a child’s
subjective experience of anger, anxiety, depression, disruptive behavior, and self-concept.
Designed for children and adolescents between the ages of 7 and 18, each scale is written
at the 2nd grade reading level and may be administered individually or in groups. The
examinee marks how often he or she thinks, feels, or behaves in the manner illustrated by
the statement on a 4 point Likert-type-type scale ranging from never to always. Each
inventory takes approximately five to ten minutes to complete. Therefore, an hour should
be allotted when administering all five inventories to a group. The inventories may be
read to the group and group members are encouraged to ask questions to ensure that
participants understand all of the items.
Each of the 20 statements on a single inventory receives a score of 0, 1, 2, or 3,
which corresponds to the test takers mark on the Likert-type-type scale. These item
scores are added to produce the total raw score for each inventory. Thus, the possible
55
range of scores per inventory is 0-60. The raw scores are converted to standardized T
scores. The manual provides these for six normative groups based on age range and
gender. The T scores specify the degree of severity of the assessed construct. For
interpretation purposes higher T scores on the BANI-Y, BAI-Y, BDI-Y, and BDBI-Y,
indicate higher levels of distress reported by the individual. However, the opposite is true
for the BSCI-Y, as higher T scores signify a more positive self-concept and lower T
scores represent a less positive self-concept.
Reliability
The five BYI-II inventories report high internal consistency for the age groups
represented in this study (Beck et al., 2005). For children ages 7-10 the internal
consistency reliability scores are as follows: depression (females, α = .91; males, .90),
anxiety (females, α =.89; males, α = .89), anger (females, α = .87; males, α = .89),
disruptive behavior (females, α =.86; males, α = .87), and self-concept (females, α = .89;
males, α = .91). For children ages 11-14 the internal consistency reliability scores are
depression (females, α = .91; males, .92), anxiety (females, α =.89; males, α = .91),
anger (females, α = .91; males, α = .92), disruptive behavior (females, α =.86; males, α =
.90), and self-concept (females, α = .91; males, α = .89). Corrected test-retest reliabilities
for the inventories range from .74 to .90 for children ages 7 to10 and from .84 to .93 for
children ages 11-14. As the reliability scores fell within a range of good to high
reliability, the items associated with a given scale appear to be measuring a similar
construct.
56
Internal consistency reliability analyses based on the scores on the BYI-II scales
for the participants sampled for the current study yielded similar results (BSCI-Y, α =
.88; BAI-Y, α = .87; BANI-Y, α = .90; BDI-Y, α = .89; BDBI-Y, α = .90). The
moderately high to high internal consistency reliability findings suggest that each of the
scores on each of the scales appeared to measure a similar construct.
Validity
The convergent validity of the BYI-II when used with students ranging from 7 to
10 years old was examined through comparison with several other instruments. The
Children’s Depression Inventory, (Kovacs, 1992) was utilized to provide evidence of
validity for the BDI-Y with a moderate resulting correlation (r =.72). Validity of the BAI-
Y was assessed with respect to the Revised Children’s Manifest Anxiety Scale (RCMAS;
Reynolds & Richmond, 1985). BANI-Y and the RCMAS are moderately correlated (r =
.70) suggesting convergent validity for the BAI-Y. The moderate correlations suggest
that the BYI-II is an adequate measure of the constructs associated with the scales.
Multidimensional Students’ Life Satisfaction Scale
The Multidimensional Students’ Life Satisfaction Scale (MSLSS; Huebner,
2001a) is a measurement designed to assess a child’s global estimate of life satisfaction,
as well as, domain specific estimates of satisfaction. The scale is comprised of 40
statements reflecting opinions about one’s life satisfaction in one of five areas (Huebner,
2001b). The domains assessed are family, friends, school, living environment, and self.
The students participating in the current study completed the satisfaction with friends
57
scale and the satisfaction with family scale. Richardson (2002) suggests that the ability to
develop connections with others and the ability to give and receive love is an essential
component of the Resilient Force. According to Hart and Waddell (2003) connections
refer to emotionally safe and appropriate interpersonal relationships. Therefore the
composite score of the friends and family scales was used to assess the sense of
connectedness component of the Resilient Force construct. Sample items from domains
assessed include: “I enjoy being at home with my family” and “My friends will help me
if I need it.”
Administration and Scoring
The MSLSS can be administered individually or in groups. It is recommended
that the statements be read aloud to children in grades third through fifth. To complete the
assessment students mark their degree of agreement or disagreement with the statement
on a 4 point Likert-type scale ranging from never to always. Students are encouraged to
ask questions and examiners should monitor students closely to ensure that they complete
the assessment appropriately.
Each of the 9 statements on the friends scale and 7 statements on the family scale
receives a score of 1, 2, 3, or 4 which corresponds to the test takers mark on the Likert-
type scale. Thus the range of possible scores on the friends scale is 9 to 36 and the range
of possible scores on the family scale is 7 to 28. Ten of the items are negatively-keyed
and must be reversed scored. Because the number of statements per domain is unequal,
raw scores for each domain are obtained by dividing the summed item scores by the
number of items within the specific domain. The composite score used in this study was
58
generated by adding the raw domain scores of the friends and family scales.
Reliability
In a 1994 study, Huebner found good internal consistency reliability for the
friends and family scales, as the Cronbach’s alpha coefficients were .82 and .85,
respectively. Internal consistency reliability analyses based on the scores on the friends
and family scales collected from the participants sampled for the current study yielded
similar results (friends, α = .86; family, α = .80). The Cronbach’s alpha coefficient for
the combined friends and family scales as a measure of the sense of connectedness
construct was .84. The fairly high internal consistency reliability findings suggest that the
statements of the combined friends and family scales of the MSLSS provide a
measurement of a similar construct.
Validity
Exploratory factor analysis has supported the five dimensions assessed by the
MSLSS. Concurrent and divergent validity have been examined through hypothesized
correlations with other self-report indices of well-being. However, Huebner (2001a) notes
that future research is needed for further validation and determination of the assessments
range of application.
Goff-Torrance Creativity Identifier
The Goff-Torrance Creativity Identifier (GTCI; Goff, 2005) is a measure of
creativity which emphasizes divergent production. The GTCI is patterned after the
59
Abbreviated Torrance Test for Adults (ATTA; Goff & Torrance, 2002), which is a
condensed version of the much longer Torrance Test of Creative Thinking (Torrance,
1990). The GTCI measures several elements of creativity including flexibility, fluency,
originality, and elaboration.
The GTCI can be administered in an individual or group setting. The total
administration time is approximately 15 minutes. Examinees complete 3 pencil and paper
tasks and are allowed three minutes to complete each task. For the first task a scenario is
identified and the students are asked to list as many potential problems associated with
the scenario as possible. The second and third tasks involve picture completion activities.
One point is given for each indicator of flexibility, fluency, originality and elaboration for
each task.
The GTCI psychometrics are based on the ATTA psychometrics. The
psychometric properties associated with the ATTA suggest that it is a reliable and valid
instrument for the assessment of divergent production. However, after an extensive
review of creativity literature and assessments for children I found no other creativity
assessments appropriate for this study. Therefore, the GTCI was deemed the only choice
for measuring the creativity element of the Resilient Force construct.
Internal consistency reliability was calculated for the participants sampled for this
study using the Cronbach’s alpha statistic. The analysis indicated that there was a
moderate degree of intercorrelation among the scores composing the total GTCI score (α
= .68). This moderate internal consistency reliability suggests that the subtests of the
GTCI provide an adequate measurement of a similar construct.
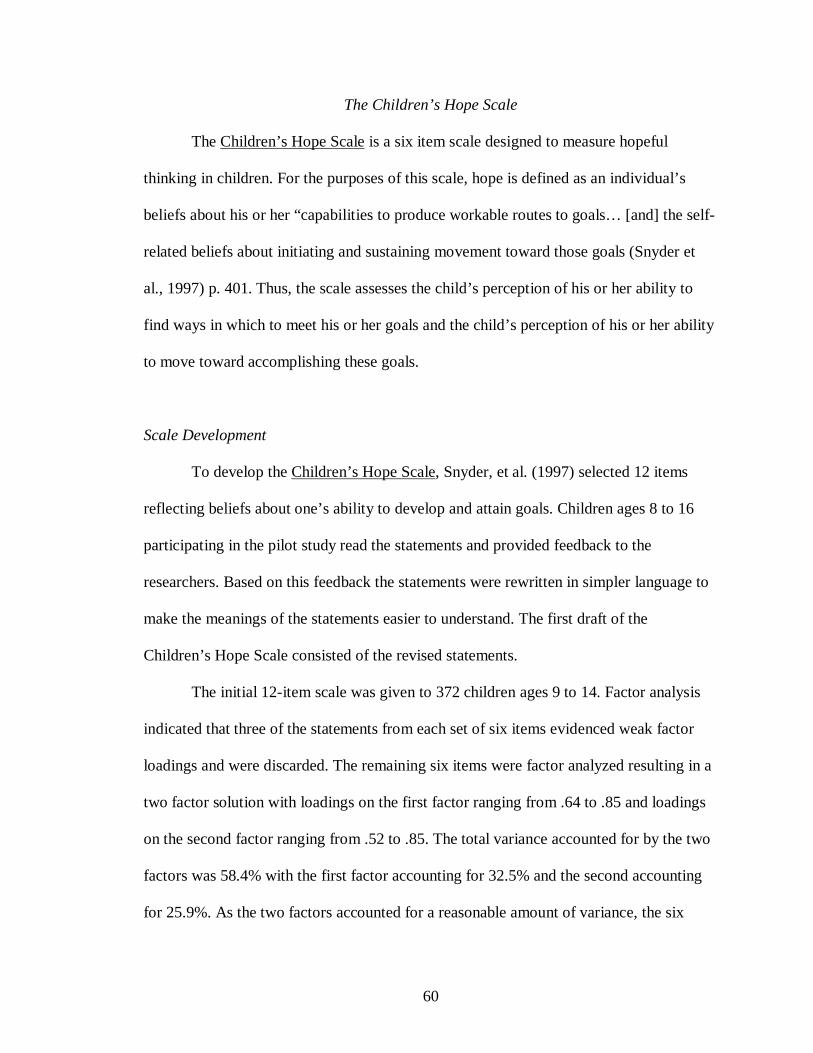
60
The Children’s Hope Scale
The Children’s Hope Scale is a six item scale designed to measure hopeful
thinking in children. For the purposes of this scale, hope is defined as an individual’s
beliefs about his or her “capabilities to produce workable routes to goals… [and] the self-
related beliefs about initiating and sustaining movement toward those goals (Snyder et
al., 1997) p. 401. Thus, the scale assesses the child’s perception of his or her ability to
find ways in which to meet his or her goals and the child’s perception of his or her ability
to move toward accomplishing these goals.
Scale Development
To develop the Children’s Hope Scale, Snyder, et al. (1997) selected 12 items
reflecting beliefs about one’s ability to develop and attain goals. Children ages 8 to 16
participating in the pilot study read the statements and provided feedback to the
researchers. Based on this feedback the statements were rewritten in simpler language to
make the meanings of the statements easier to understand. The first draft of the
Children’s Hope Scale consisted of the revised statements.
The initial 12-item scale was given to 372 children ages 9 to 14. Factor analysis
indicated that three of the statements from each set of six items evidenced weak factor
loadings and were discarded. The remaining six items were factor analyzed resulting in a
two factor solution with loadings on the first factor ranging from .64 to .85 and loadings
on the second factor ranging from .52 to .85. The total variance accounted for by the two
factors was 58.4% with the first factor accounting for 32.5% and the second accounting
for 25.9%. As the two factors accounted for a reasonable amount of variance, the six
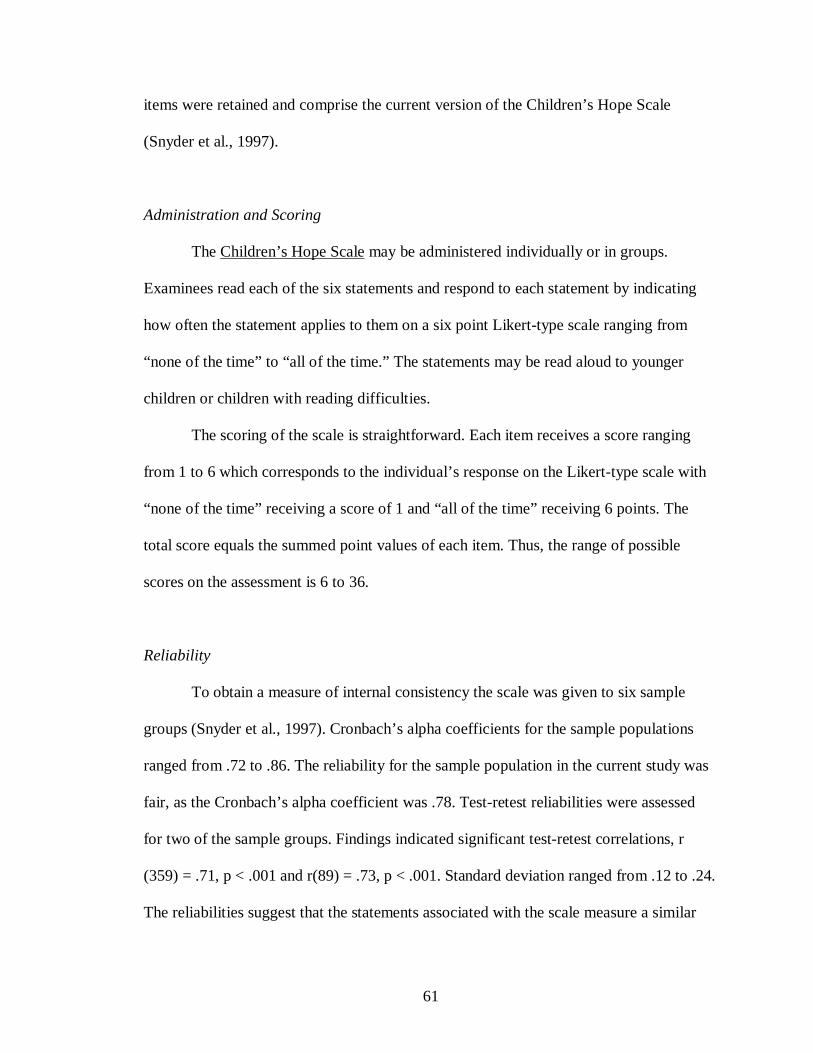
61
items were retained and comprise the current version of the Children’s Hope Scale
(Snyder et al., 1997).
Administration and Scoring
The Children’s Hope Scale may be administered individually or in groups.
Examinees read each of the six statements and respond to each statement by indicating
how often the statement applies to them on a six point Likert-type scale ranging from
“none of the time” to “all of the time.” The statements may be read aloud to younger
children or children with reading difficulties.
The scoring of the scale is straightforward. Each item receives a score ranging
from 1 to 6 which corresponds to the individual’s response on the Likert-type scale with
“none of the time” receiving a score of 1 and “all of the time” receiving 6 points. The
total score equals the summed point values of each item. Thus, the range of possible
scores on the assessment is 6 to 36.
Reliability
To obtain a measure of internal consistency the scale was given to six sample
groups (Snyder et al., 1997). Cronbach’s alpha coefficients for the sample populations
ranged from .72 to .86. The reliability for the sample population in the current study was
fair, as the Cronbach’s alpha coefficient was .78. Test-retest reliabilities were assessed
for two of the sample groups. Findings indicated significant test-retest correlations, r
(359) = .71, p < .001 and r(89) = .73, p < .001. Standard deviation ranged from .12 to .24.
The reliabilities suggest that the statements associated with the scale measure a similar
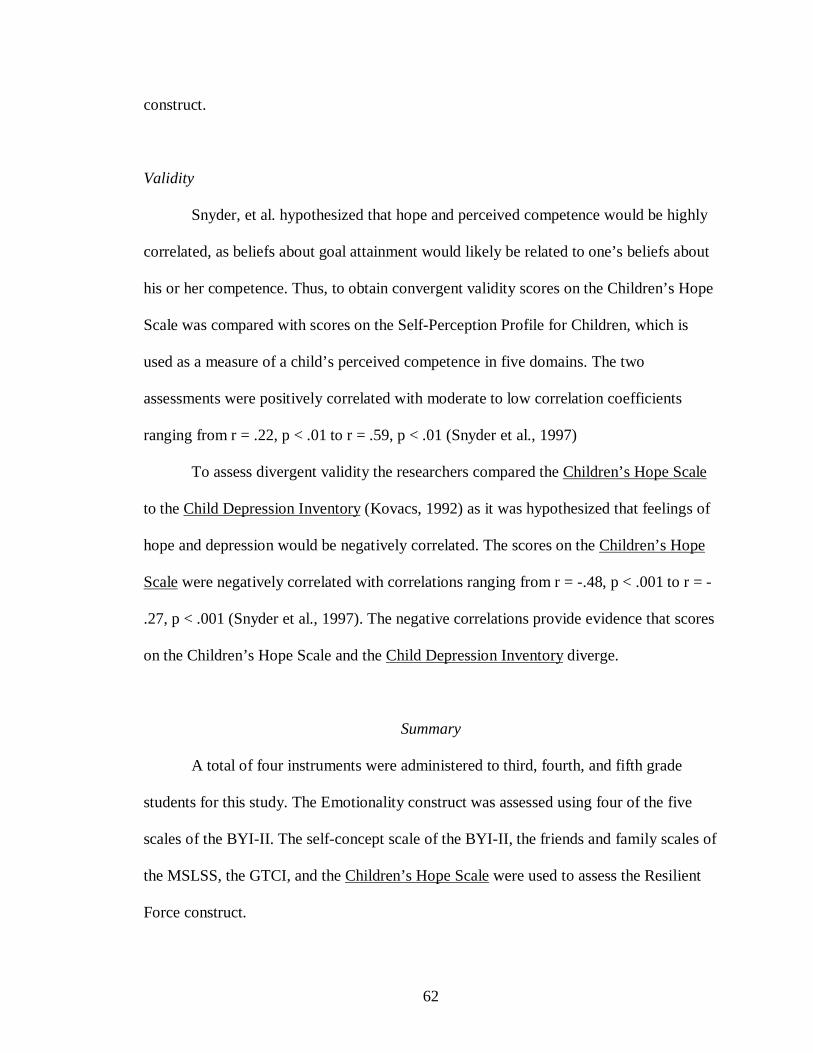
62
construct.
Validity
Snyder, et al. hypothesized that hope and perceived competence would be highly
correlated, as beliefs about goal attainment would likely be related to one’s beliefs about
his or her competence. Thus, to obtain convergent validity scores on the Children’s Hope
Scale was compared with scores on the Self-Perception Profile for Children, which is
used as a measure of a child’s perceived competence in five domains. The two
assessments were positively correlated with moderate to low correlation coefficients
ranging from r = .22, p < .01 to r = .59, p < .01 (Snyder et al., 1997)
To assess divergent validity the researchers compared the Children’s Hope Scale
to the Child Depression Inventory (Kovacs, 1992) as it was hypothesized that feelings of
hope and depression would be negatively correlated. The scores on the Children’s Hope
Scale were negatively correlated with correlations ranging from r = -.48, p < .001 to r = -
.27, p < .001 (Snyder et al., 1997). The negative correlations provide evidence that scores
on the Children’s Hope Scale and the Child Depression Inventory diverge.
Summary
A total of four instruments were administered to third, fourth, and fifth grade
students for this study. The Emotionality construct was assessed using four of the five
scales of the BYI-II. The self-concept scale of the BYI-II, the friends and family scales of
the MSLSS, the GTCI, and the Children’s Hope Scale were used to assess the Resilient
Force construct.
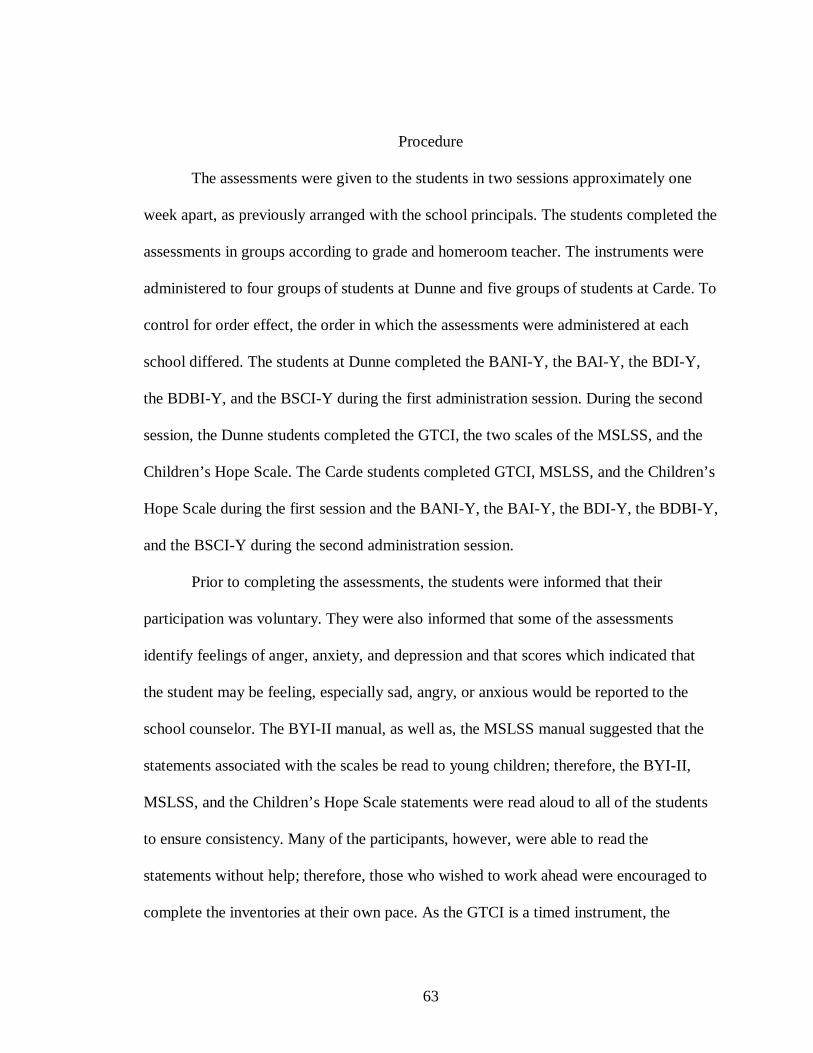
63
Procedure
The assessments were given to the students in two sessions approximately one
week apart, as previously arranged with the school principals. The students completed the
assessments in groups according to grade and homeroom teacher. The instruments were
administered to four groups of students at Dunne and five groups of students at Carde. To
control for order effect, the order in which the assessments were administered at each
school differed. The students at Dunne completed the BANI-Y, the BAI-Y, the BDI-Y,
the BDBI-Y, and the BSCI-Y during the first administration session. During the second
session, the Dunne students completed the GTCI, the two scales of the MSLSS, and the
Children’s Hope Scale. The Carde students completed GTCI, MSLSS, and the Children’s
Hope Scale during the first session and the BANI-Y, the BAI-Y, the BDI-Y, the BDBI-Y,
and the BSCI-Y during the second administration session.
Prior to completing the assessments, the students were informed that their
participation was voluntary. They were also informed that some of the assessments
identify feelings of anger, anxiety, and depression and that scores which indicated that
the student may be feeling, especially sad, angry, or anxious would be reported to the
school counselor. The BYI-II manual, as well as, the MSLSS manual suggested that the
statements associated with the scales be read to young children; therefore, the BYI-II,
MSLSS, and the Children’s Hope Scale statements were read aloud to all of the students
to ensure consistency. Many of the participants, however, were able to read the
statements without help; therefore, those who wished to work ahead were encouraged to
complete the inventories at their own pace. As the GTCI is a timed instrument, the
64
directions were read aloud to all students and the participants began and ended each task
at the same time. After the administration of the assessments, the instruments were
collected and stored in a secure location.
The students’ school ID numbers were used to code the assessments, as I reported
especially high scores on the BYI-II anger, anxiety, depression, and disruptive behavior
scales to the school counselor; this allowed the school counselor to identify the students
associated with the scores reported to her. The codes and the assessments were kept in
different locations. With the exception of the GTCI, I scored all of the assessments with
the assistance of an objective third party under my direct supervision. Project CREATES
hired Dr. Kathy Goff to score the GTCI. I maintained the data base.
In order to identify scores above the 92nd percentile, the scores on the BAI-Y,
BANI-Y, BDI-Y, and BDBI-Y were converted to t scores using charts provided in the
BYI-II manual (Beck, et al., 2005). After identifying elevated scores, I met with the
counselors and submitted a list of student ID numbers. I explained to the counselors that
the scores were not diagnostic, but rather they may indicate that a child was having
difficulties. I also provided the counselors with a list of community resources.
Data Analysis
The data were analyzed using SPSS 15.0. The raw scores associated with the
assessments were used for the analysis. Descriptive statistics were run to assess the
required statistical assumptions. The first and second research questions concern
relationship between the variables within each construct; therefore, bivariate correlations
were generated between the variables within the constructs to address the first two
65
questions. Canonical correlations analysis was employed to examine the third research
question, which concerned the multivariate relationship between the Resilient Force and
Emotionality constructs.
Summary
This chapter provided a detailed description of the research design and
methodology utilized for this study. The first section described the participants. The
participant section provided demographic information concerning the participants, the
way in which the participants were selected, and the procedures regarding informed
consent. The second section provided detailed information concerning the research
instruments. The research procedures were outlined in the third section and the fourth
section presented an overview of the statistical analysis.
66
CHAPTER IV
RESULTS
This chapter presents the results of this study. The first section provides an
overview of the descriptive statistics as they relate to the required assumptions. This is
followed by the response to the research questions.
Descriptive Statistics
The variables used in this study were scores obtained from the eight scales given
to the students which were categorized into two variable sets. The variable sets
represented two distinct theoretical constructs. A construct refers to a complex concept
which is formed from a number of simpler concepts. As such, a theoretical construct is
not directly measurable, but can be indirectly measured by examining the variables
associated with the construct’s elemental concepts (Vogt, 1999). The constructs
investigated in this study were Resilient Force and Emotionality. The Resilient Force
construct encompassed the concepts of creativity, sense of purpose, sense of
connectedness, and hope; thus, scores obtained on measures of creativity, sense of
purpose, sense of connectedness, and hope were the variables used to assess the Resilient
Force construct. The variables used to measure the construct of Emotionality were scores
obtained on the depression, anger, anxiety, and disruptive behavior scales.
As the statistical procedures employed to answer the questions posed in this study
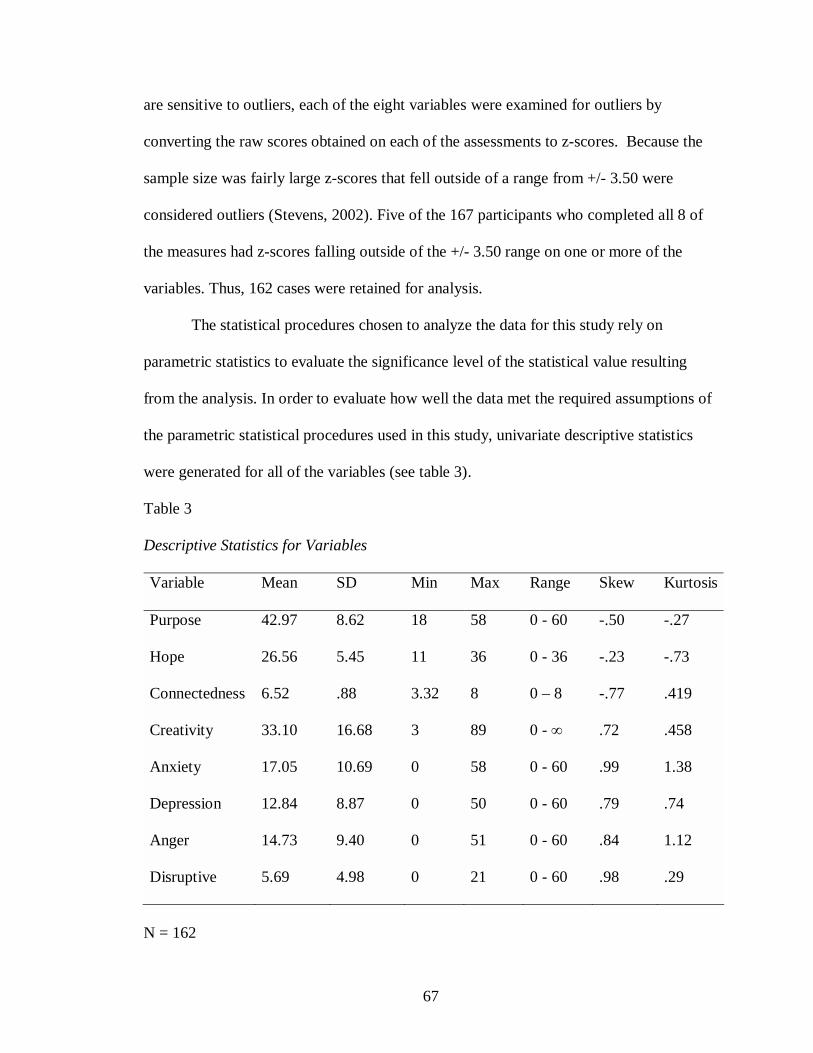
67
are sensitive to outliers, each of the eight variables were examined for outliers by
converting the raw scores obtained on each of the assessments to z-scores. Because the
sample size was fairly large z-scores that fell outside of a range from +/- 3.50 were
considered outliers (Stevens, 2002). Five of the 167 participants who completed all 8 of
the measures had z-scores falling outside of the +/- 3.50 range on one or more of the
variables. Thus, 162 cases were retained for analysis.
The statistical procedures chosen to analyze the data for this study rely on
parametric statistics to evaluate the significance level of the statistical value resulting
from the analysis. In order to evaluate how well the data met the required assumptions of
the parametric statistical procedures used in this study, univariate descriptive statistics
were generated for all of the variables (see table 3).
Table 3
Descriptive Statistics for Variables
Variable Mean SD Min Max Range Skew Kurtosis
Purpose 42.97 8.62 18 58 0 - 60 -.50 -.27
Hope 26.56 5.45 11 36 0 - 36 -.23 -.73
Connectedness 6.52 .88 3.32 8 0 – 8 -.77 .419
Creativity 33.10 16.68 3 89 0 - ∞ .72 .458
Anxiety 17.05 10.69 0 58 0 - 60 .99 1.38
Depression 12.84 8.87 0 50 0 - 60 .79 .74
Anger 14.73 9.40 0 51 0 - 60 .84 1.12
Disruptive 5.69 4.98 0 21 0 - 60 .98 .29
N = 162
68
All statistical analyses, including parametric statistics assume sound
measurement. Means and standard deviations can be assessed to determine if the data are
generally as expected and that all data entries are within the designated range. While this
does not ensure sound measurement, an examination of the descriptive statistics brings to
light certain coding errors and potential problems with the sample population. For this
study, the means of the anxiety, depression, anger, disruptive behavior, and sense of
purpose scales, fall within the 45th to 55th percentile range when compared to the
standardization sample identified by Beck et al. (2005). As the group means of the
students sampled for this study fell within the expected range, it can be surmised that the
scores obtained by the children in this study are fairly reflective of scores that would be
obtained within the general population. The minimum and maximum statistics designated
in table 3 indicate that all variables fall within the expected range.
The assumption of normal data distribution was assessed by examining the
skewness and kurtosis statistics. Although each variable is slightly skewed, the skewness
statistic for each variable is within the +/- 1.00 range indicating a symmetrical
distribution (de Vaus, 2002). According to Stevens (2002), with the exception of
platykurtic or flattened distributions which attenuate power, kurtosis has little effect on
level of significance or power. An examination of the kurtosis statistics for the variables
used in this study suggested that there were no platykurtic distributions.
Summary of Descriptive Statistics
The parametric assumptions relative to this study include sound measurement and
normality. As the descriptive statistics revealed that the means and standard deviations
69
were as expected and that the minimum and maximum statistics denoted that no variable
scores were outside of the expected range, sound measurement was assumed. An
inspection of the skewness and kurtosis statistics indicated that the data distribution was
symmetrical, thus, normality was assumed.
Response to the Research Questions
As the parametric assumptions relative to this study were met, the analyses of the
research questions proceeded. Bivariate correlations were examined to answer the first
and second questions. Canonical analysis was used to address the third question.
Question One: What are the relationships between the variables composing the
theoretical Resilient Force construct, which are measures of sense of purpose, sense of
connectedness, hope, and creativity?
To answer question one Pearson correlation coefficients (r) were generated
between the variables within construct of Resilient Force. Correlation coefficients, which
range between +1.00 and -1.00, indicate the strength and direction of the relationship
between two variables. The closer the correlation coefficient is to +/-1.00 the stronger the
relationship is between variables. According to Gay, Mills, and Airasian (2006)
correlations with an absolute value less than .35 are considered low, moderate
correlations have absolute values between .36 and .65, and correlations with absolute
values above .66 are regarded as high. The sign denotes the direction of the relationship.
A positive correlation implies that as scores increase on one variable they also increase
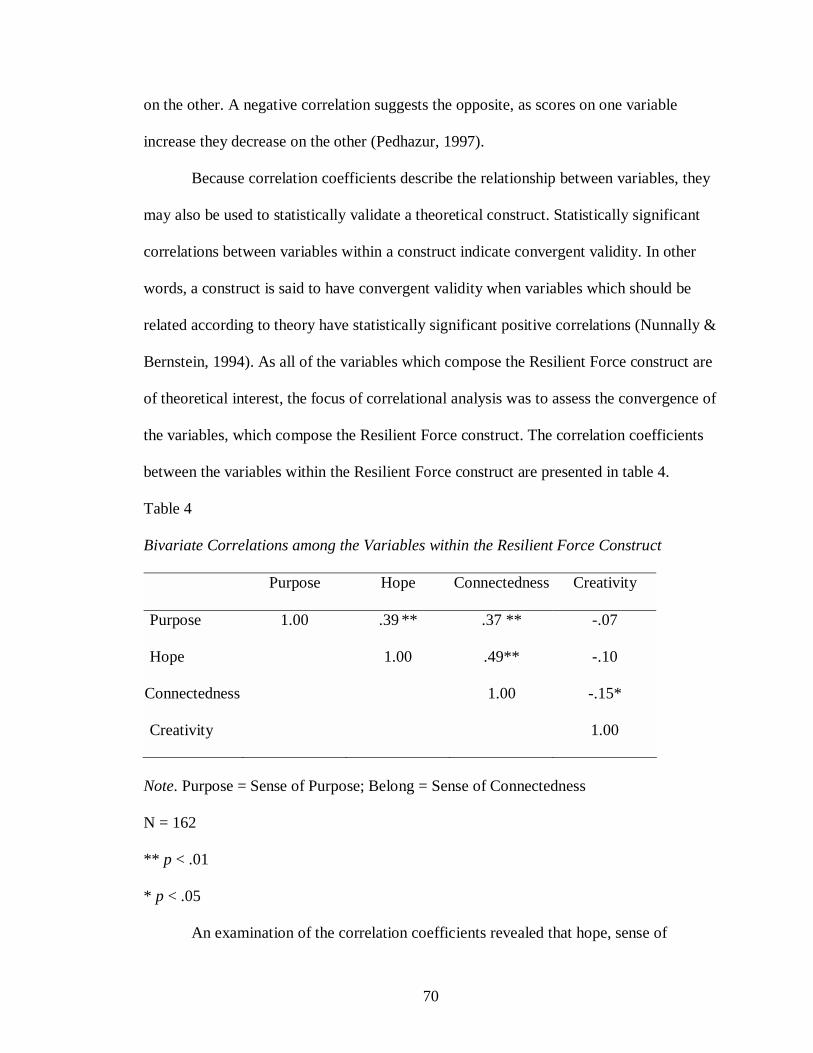
70
on the other. A negative correlation suggests the opposite, as scores on one variable
increase they decrease on the other (Pedhazur, 1997).
Because correlation coefficients describe the relationship between variables, they
may also be used to statistically validate a theoretical construct. Statistically significant
correlations between variables within a construct indicate convergent validity. In other
words, a construct is said to have convergent validity when variables which should be
related according to theory have statistically significant positive correlations (Nunnally &
Bernstein, 1994). As all of the variables which compose the Resilient Force construct are
of theoretical interest, the focus of correlational analysis was to assess the convergence of
the variables, which compose the Resilient Force construct. The correlation coefficients
between the variables within the Resilient Force construct are presented in table 4.
Table 4
Bivariate Correlations among the Variables within the Resilient Force Construct
Purpose Hope Connectedness Creativity
Purpose 1.00 .39 ** .37 ** -.07
Hope 1.00 .49** -.10
Connectedness 1.00 -.15*
Creativity 1.00
Note. Purpose = Sense of Purpose; Belong = Sense of Connectedness
N = 162
** p < .01
* p < .05
An examination of the correlation coefficients revealed that hope, sense of
71
purpose, and sense of connectedness are positively correlated to a moderate degree (Gay,
Mills, & Airasian, 2006) with hope and sense of connectedness having the strongest
relationship. In other words, students who scored high on one scale had a tendency to
score high on the others. Likewise, students who scored low on one of the indicators
tended to score low on the others. The correlations between these three variables are
statistically significant at p < .01. The squared correlation coefficient (r2) represents the
amount of variance shared between variables. In correlational research the relationship
does not imply prediction. It is simply an estimate of the amount of variance two
variables have in common (Pedhazur, 1997). The variance shared between sense of
purpose and hope, and sense of purpose and sense of connectedness was about 15%. The
variables hope and sense of connectedness shared about 24% of the variance.
Creativity was not correlated with sense of purpose or hope to a statistically
significant degree. However, there was a statistically significant low negative correlation
between creativity and sense of connectedness at p < .05. While the negative correlation
between creativity and sense of connectedness was not anticipated, the notion that
creative works are often inspired during times of solitude may help to explain this
relationship (Olszewski-Kubilius, 2002). Sense of connectedness and creativity shared a
minimal amount of variance, about 2%.
As sense of purpose, hope, and sense of connectedness shared moderate
correlations, convergent validity was established among theses variables. In other words,
the results of the correlational analyses statistically demonstrated that these three scales
were measuring a similar construct. Although convergent validity was not established for
creativity, it was theoretically essential to the Resilient Force construct and was therefore
72
retained for analysis.
Summary of Research Question 1
The relationships between the variables within the Resilient Force construct were
evaluated by examining the bivariate correlations generated between the variables. With
the exception of creativity all of the variables were positively correlated to a moderate
degree. Correlations between creativity and sense of purpose and creativity and hope
were not statistically significant. Creativity and sense of connectedness shared a low
negative correlation. All of the variables were retained as part of the theoretical construct.
Question Two: What are the relationships between the variables composing the
theoretical Emotionality construct, which are measures of anger, anxiety, depression,
and disruptive behavior?
Question one and two were answered in a similar manner, as the second question
was answered by examining correlation coefficients generated between the variables
identified within the Emotionality construct. Because anxiety, depression, anger, and
disruptive behavior were all of theoretical interest, the focus of this analysis was to assess
convergence of these scales. Table 5 summarizes the correlation coefficients and
significance statistics between the variables within this theoretical construct
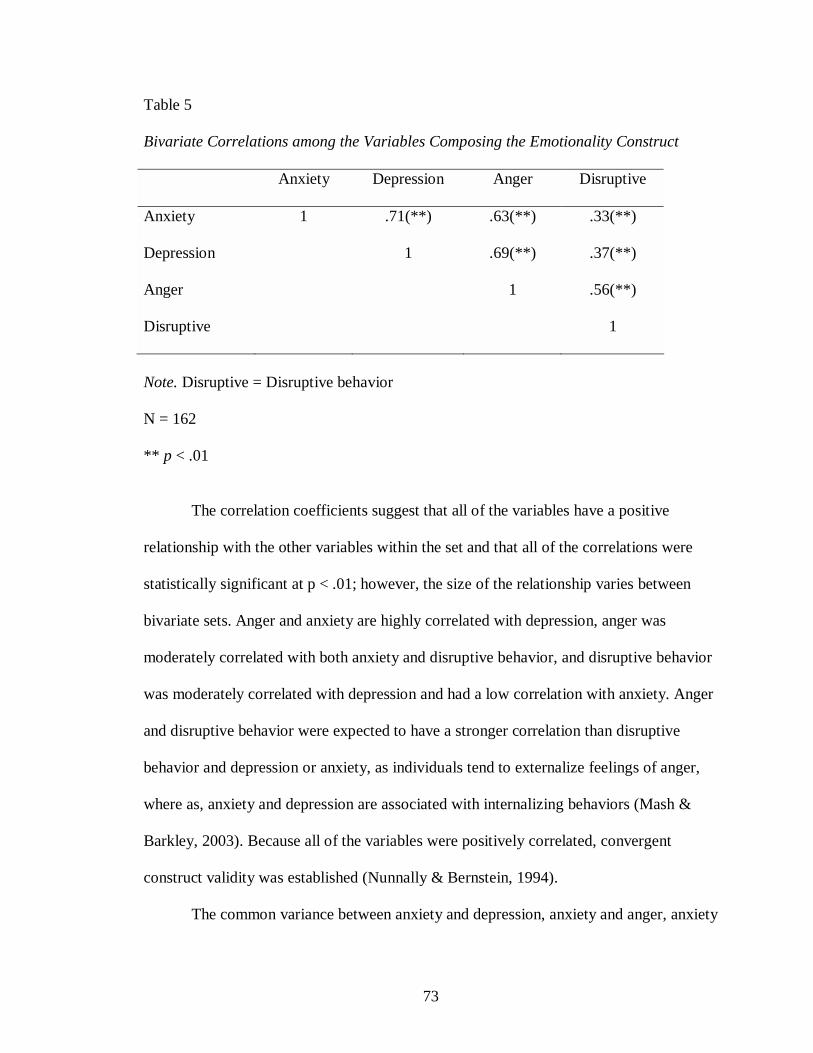
73
Table 5
Bivariate Correlations among the Variables Composing the Emotionality Construct
Anxiety Depression Anger Disruptive
Anxiety 1 .71(**) .63(**) .33(**)
Depression 1 .69(**) .37(**)
Anger 1 .56(**)
Disruptive 1
Note. Disruptive = Disruptive behavior
N = 162
** p < .01
The correlation coefficients suggest that all of the variables have a positive
relationship with the other variables within the set and that all of the correlations were
statistically significant at p < .01; however, the size of the relationship varies between
bivariate sets. Anger and anxiety are highly correlated with depression, anger was
moderately correlated with both anxiety and disruptive behavior, and disruptive behavior
was moderately correlated with depression and had a low correlation with anxiety. Anger
and disruptive behavior were expected to have a stronger correlation than disruptive
behavior and depression or anxiety, as individuals tend to externalize feelings of anger,
where as, anxiety and depression are associated with internalizing behaviors (Mash &
Barkley, 2003). Because all of the variables were positively correlated, convergent
construct validity was established (Nunnally & Bernstein, 1994).
The common variance between anxiety and depression, anxiety and anger, anxiety
74
and disruptive behavior was about 50%, 40%, 11%, respectively. The shared variance
between depression and anger, and depression and disruptive behavior, was about 48%
and 14%, accordingly. Anger and disruptive behavior had about 31% shared variance.
Summary of Research Question 2
Bivariate correlations were generated between the variables composing the
Emotionality construct in order to examine the relationships between the variables within
the construct. All of the variables shared statistically significant positive correlations.
Depression and anger, as well as, depression and anxiety were highly correlated. Anxiety
and anger, depression and disruptive behavior, and anger and disruptive behavior were
moderately correlated. There was a low correlation between anxiety and disruptive
behavior. Due to the intercorrelations among the variables within the set convergent
validity was established.
Question 3: What is the Multivariate Relationship between the Variables composing the
Resilient Force and Emotionality Constructs?
The multivariate relationship between the Resilient Force and Emotionality
constructs was evaluated using canonical correlation analysis. The variables composing
the construct of Emotionality were used as dependent variables and the variables within
the construct of Resilient Force comprised the covariates. In general, the number of
canonical functions generated through canonical analysis is equal to the number of
variables in the variable set with the fewest variables. Collectively, the functions
compose the full model (Thompson, 1984). For this study both variable sets were
75
comprised of four variables each; thus, the canonical analysis yielded four functions. The
full model across all canonical functions was statistically significant using the Wilks’ Λ
.54 criterion, F (16, 471.12) = 6.51, p < .001. Wilks’ Λ specifies the amount of variance
unaccounted for by the model, hence, 1- Λ yields the effect size for the full model
(Pedhazur, 1997; Sherry & Henson 2005). Therefore, the effect size across all four
functions generated in the current study was .46. In other words, Resilient Force
accounted for about 46% of the variance in Emotionality.
In canonical correlation analysis the statistical significance of the functions are
evaluated through dimension reduction analysis, which tests the hierarchal arrangement
of functions for statistical significance. Thus, in order to test the statistical significance of
the first function, the statistical significance of the full model is evaluated, and then each
successive function is tested for statistical significance by subtracting the preceding
function from the model and evaluating the remaining functions collectively. As such,
only the last function is tested in isolation (Sherry & Henson, 2005). Of the four
functions which composed the full model generated for the current study the squared
canonical correlation (Rc2) associated with the first function was statistically significant
(Rc2 = .41, F [16, 471.12] = 6.51, p < .001). The squared canonical correlations relating to
functions 2 through 4, 3 through 4, and 4 did not account for a statistically significant
amount of shared variance between the variable sets. The squared canonical correlations
corresponding to these functions were Rc2 = .07, F (9, 377.38) = 1.60, p = .114; Rc
2 = .02,
F (4, 312.00) = .77, p = .55; and Rc2 = .00, F (1, 157) = .06, p = .80, respectively.
Theoretically, only one function was expected to reach statistical significance. Thus, only
one statistically significant relationship between the two variable sets was anticipated.
76
The contribution of each variable to an identified canonical function can be
evaluated by examining the squared structure coefficients. A structure coefficient is
simply the bivariate correlation between an observed variable and the canonical
composite generated from the variable’s set (Sherry & Henson, 2005). For example, for
this study the structure coefficient for sense of purpose is the bivariate correlation
between sense of purpose and the composite variable created from sense of purpose,
sense of connectedness, hope, and creativity. A squared structure coefficient represents
the variance linearly shared between an original variable and its canonical composite
(Thompson, 1984; Sherry & Henson). Thus, the squared structure coefficient for sense of
purpose indicates the proportion of variance sense of purpose and its composite variable
have in common. Table 6 presents the structure coefficients and the squared structure
coefficients for function 1. The standardized canonical coefficients, which are the
weights derived to maximize the canonical correlation are presented as well (Sherry &
Henson). Because the canonical coefficients do not account for intercorrelations among
the variables within the variable set, the standardized canonical coefficients are generally
not interpreted (Thompson).
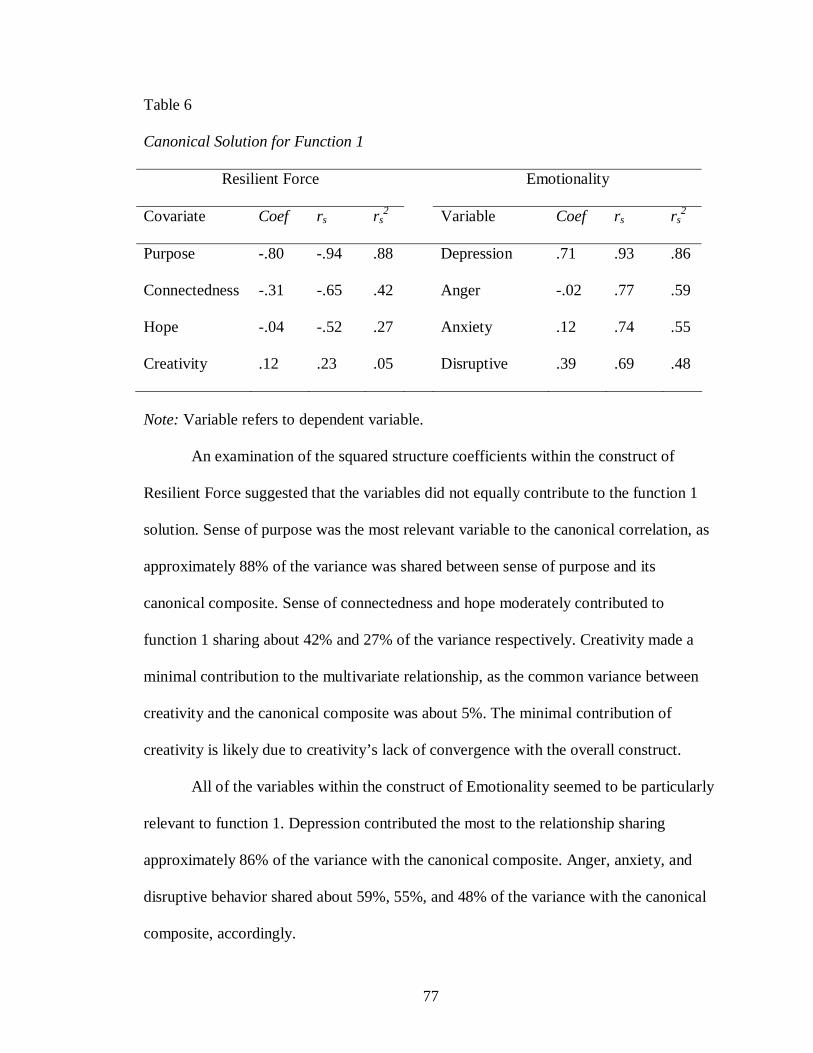
77
Table 6
Canonical Solution for Function 1
Resilient Force Emotionality
Covariate Coef rs rs2 Variable Coef rs rs
2
Purpose -.80 -.94 .88 Depression .71 .93 .86
Connectedness -.31 -.65 .42 Anger -.02 .77 .59
Hope -.04 -.52 .27 Anxiety .12 .74 .55
Creativity .12 .23 .05 Disruptive .39 .69 .48
Note: Variable refers to dependent variable.
An examination of the squared structure coefficients within the construct of
Resilient Force suggested that the variables did not equally contribute to the function 1
solution. Sense of purpose was the most relevant variable to the canonical correlation, as
approximately 88% of the variance was shared between sense of purpose and its
canonical composite. Sense of connectedness and hope moderately contributed to
function 1 sharing about 42% and 27% of the variance respectively. Creativity made a
minimal contribution to the multivariate relationship, as the common variance between
creativity and the canonical composite was about 5%. The minimal contribution of
creativity is likely due to creativity’s lack of convergence with the overall construct.
All of the variables within the construct of Emotionality seemed to be particularly
relevant to function 1. Depression contributed the most to the relationship sharing
approximately 86% of the variance with the canonical composite. Anger, anxiety, and
disruptive behavior shared about 59%, 55%, and 48% of the variance with the canonical
composite, accordingly.
78
Summary of Research Question Three
The multivariate relationship between the variables representing the Resilient
Force construct and the variables representing the theoretical construct of Emotionality
was assessed using canonical correlation analysis. The analysis yielded four functions.
The full model across all four functions accounted for a considerable proportion of the
variance shared between the variable sets, about 46%. Individually, as anticipated, only
the first function explained a statistically significant proportion of the shared variance,
about 41%.
The contributions of the individual variables to function 1 were assessed by
examining the squared structure coefficients. Within the Resilient Force construct, sense
of purpose contributed substantially to the multivariate relationship, sharing about 88% of
the variance with the Resilient Force canonical composite. Sense of connectedness and
hope made moderate contributions to function 1 and creativity contributed minimally.
Within the Emotionality construct depression contributed the most to the function,
sharing about 86% of the variance with its canonical composite. Anger, anxiety, and
disruptive behavior also made considerable contributions to function 1.
Chapter Summary
This chapter presented the results of the data analysis for the study. The chapter
began with an overview of the descriptive statistics as they related to the required
statistical assumptions relevant to this study. This section was followed by responses to
three research questions: what are the relationships between the variables measuring the
Resilient Force construct; what are the relationships between the variables connectedness
79
to the Emotionality construct; and what is the multivariate relationship between the
variables composing the Resilient Force and Emotionality constructs?
Research questions one and two were addressed by examining the bivariate
correlations. The results indicated that sense of purpose, sense of connectedness, and
hope were positively correlated and thus, established convergent validity. Although
convergent validity was not established for creativity, it was retained as part of the
Resilient Force construct for theoretical reasons. Anxiety, anger, depression, and
disruptive behavior were positively correlated and formed the Emotionality construct.
Canonical correlation analysis was performed between the variables composing
the Resilient Force construct and the variables composing the construct of Emotionality
to answer the third research question. The full model was statistically significant and
accounted for about 46% of the variance shared between variable sets. The full model
was comprised of four functions of which as expected only the first explained a
statistically significant proportion of the shared variance, about 41%. Within their
respective variable sets sense of purpose and depression contributed most to the canonical
solution of function 1 followed by sense of connectedness and anger, then hope and
anxiety, and finally creativity and disruptive behavior.
80
CHAPTER V
SUMMARY, CONCLUSIONS, AND IMPLICATIONS
The primary aim of this study was to establish a basis in the philosophy of the
third wave of resiliency as conceptualized by Richardson (2002). According to the third
wave philosophy, resilience is a motivational force which compels a person to experience
personal growth through adversity. In an effort to provide empirical support for the third
wave philosophy, it was necessary to explore the relationship between the motivational
force and a measure of how well a person seems to be doing. This required
operationalizing the motivational force, which is represented by the Resilient Force
construct, providing a definition of doing okay, and operationalizing that definition. A
review of previous research in the area of resilience as well as related literature provided
the concepts associated with the Resilient Force construct (Alvord, & Grados, 2005;
Baruth & Carroll, 2002; Bernard, 1991; Brooks, 1994; Buckner, et al. 2003; de Souza,
2006; Hart & Waddell, 2003; Luthar, 1991; Richardson, 2002; Rolf et al., 1990; Werner
& Smith, 2001). For this study, doing okay was defined as being relatively free from
frequently experiencing intense negative feelings and related behaviors, as characterized
by the Emotionality construct.
In order to explore the relationship between the components within the Resilient
Force construct, bivariate correlations were generated between the variables within the
construct. Likewise, bivariate correlational analysis was used to explore the relationship
81
between the variables composing Emotionality. Because all of the variables within each
construct were of theoretical interest, the focus of the bivariate correlational analysis was
to assess the convergence of the variables within each construct. The relationship
between the two constructs was examined through canonical correlation analysis. This
chapter provides a summary of the results of the statistical analyses, which is followed by
a description of the conclusions based upon the findings. Then implications for theory,
practice, and future research are presented. The chapter concludes with closing remarks.
Summary of Findings
This study addressed three research questions:
4. What are the relationships between the variables composing the theoretical
Resilient Force construct, which are measures of sense of purpose, sense of
connectedness, hope, and creativity?
5. What are the relationships between the variables composing the theoretical
Emotionality construct, which are measures of anger, anxiety, depression, and
disruptive behavior?
6. What is the multivariate relationship between the variables composing the
Resilient Force and Emotionality constructs?
This section provides a summary of the results for each question.
The first question explored the relationship between the four Resilient Force
theoretical variables, which were sense of purpose, sense of connectedness, hope, and
creativity. The results of a bivariate correlation indicated that sense of purpose, sense of
connectedness, and hope were positively intercorrelated to a moderate degree. Thus, the
82
sense of purpose, sense of connectedness, and hope scales converged. The analyses
indicated that creativity was not correlated with either sense of purpose or hope to a
statistically significant degree. However, there was a statistically significant low negative
correlation between creativity and sense of connectedness.
Question two explored the relationship between the theoretical variables which
composed the Emotionality construct. Bivariate correlations between anger, anxiety,
depression, and disruptive behavior were generated to address the second question. All
four of the theoretical Emotionality variables were positively intercorrelated. Depression
was highly correlated with anger and anxiety and was moderately correlated with
disruptive behavior. Anger was also moderately correlated with disruptive behavior.
Anxiety and anger shared a moderate correlation and although statistically significant, the
correlation between anxiety and disruptive behavior was low. As the correlations between
all four theoretical variables were positive, the Emotionality construct demonstrated
convergent validity.
The third question investigated the relationship between the Resilient Force and
Emotionality constructs. A canonical correlation was generated between the two
constructs with the Resilient Force variables as covariates and the Emotionality variables
as dependent variables. As both theoretical constructs are comprised of four variables, the
canonical correlation analysis yielded four canonical functions. The full model across all
canonical functions was statistically significant demonstrating an effect size of .46. Thus,
approximately 46% of variance in Emotionality can be explained by the Resilient Force
construct. Individually, as anticipated only the first function, the first correlation of
83
composite scores, was statistically significant, accounting for approximately 41% of the
variance.
A canonical correlation is the correlation between the composite score of the
variables composing the independent variable set and the composite score of the
variables composing the dependent set of variables. However, the variables within a
given set do not contribute equally to that set’s composite score. Thus, a high score
on a variable that largely contributes to the canonical composite may serve to
ameliorate lower scores on two or more of lesser contributing variables. Yet, a low
score on a variable that makes a large contribution to the composite does not
necessarily indicate a low composite score, as high scores on two or more of lesser
contributing variables will raise the composite score. Hence, the canonical composite
is dependent upon the specific combination of an individual’s scores on particular
variables (Thompson, 1984). The squared structure coefficients denote the
contribution of each variable to the canonical composite, as they represent the amount
of variance in the canonical composite that is accounted for by a specific variable.
An examination of the squared structure coefficients of the canonical correlation
revealed the contribution of each variable to the first canonical function representing the
Resilient Force construct. Sense of purpose was the most important variable in the
Resilient Force construct sharing 88% of the variance with the Resilient Force canonical
composite. Sense of connectedness, hope, and creativity shared approximately 42%,
27%, and 5% of the variance of the Resilient Force canonical composite, respectively.
For the Emotionality construct, depression was the variable most relevant to function one,
as depression and the Emotionality canonical composite shared roughly 86% of the
84
variance. Anger, anxiety, and disruptive behavior shared about 59%, 55%, and 48% of
the variance with the canonical composite, respectively.
The overall results of the analyses provided statistical support for the
Emotionality construct. Additionally, the positive bivariate correlations between the
variables associated with the Emotionality construct provided additional observational
verification for this construct. The analyses indicated that sense of purpose, sense of
connectedness, and hope converged suggesting that these variables measured a similar
construct. Furthermore, the results indicate a substantial significant relationship between
Emotionality and Resilient Force.
Conclusions
Based on the findings several conclusions can be drawn. These conclusions
concern the nature of the Resilient Force and the Emotionality multivariate
relationship. Additionally, conclusions regarding the nature of the constructs can be
extrapolated from the results of the bivariate correlations generated from the set of
variables that are attributed to each separate construct. Moreover, the findings
resulting from the examination of the squared structure coefficients associated with
the canonical correlation also provide conclusions regarding the nature of the
Resilient Force and the Emotionality constructs. This section presents a detailed
explanation of the conclusions. A description of the construct conclusions drawn from
the results of the bivariate correlations and the squared structure coefficients will be
followed by a discussion of the conclusions based upon the multivariate relationship
between the Resilient Force and the Emotionality constructs. The implications
85
associated with the conclusions will be addressed in the implications section of this
chapter.
Resilient Force
The Resilient Force construct represents resilience as it is understood in the
third wave of resilience inquiry as postulated by Richardson (2002). According to
third wave philosophy, resilience is a motivational force that drives an individual to
grow through adversity. In order to develop a better understanding of Resilient Force,
the Resilient Force construct was operationalized by identifying measurable concepts
associated with the construct. These measurable concepts can be thought of as
subscales. The four subscales which compose the Resilient Force construct, sense of
purpose, sense of connectedness, hope, and creativity were mentioned repeatedly in
resilience and related literature as being central in helping an individual to overcome
adversity (Alvord & Grados, 2005; Buckner et al, 2003; de Souza, 2006; Garmezy &
Rutter, 1988; Hart & Waddell, 2003; Richardson, 2002; Snyder et al., 1997; Turner,
2005; Werner & Smith, 1982, 2001) and thus were chosen to frame the construct.
Although all of the variables within the Resilient Force construct are of
theoretical significance, the results of the statistical analyses only support the
inclusion of sense of purpose, sense of connectedness, and hope. This is evidenced by
the convergent validity demonstrated among these three variables, which indicates
that the variables are measuring the same overall construct. Additionally, sense of
purpose, sense of connectedness, and hope make large to moderate contributions to
the multivariate relationship, which further substantiates the value of these variables
86
to the construct. Furthermore, the synchronicity between the theoretical expectations
and empirical results regarding these three variables suggests that appropriate
instruments were used to assess these concepts.
Unlike sense of purpose, sense of connectedness, and hope, creativity did not
demonstrate convergent validity and contributed very minimally to the multivariate
relationship, sharing only 5% of the variance with its canonical composite. Thus, the
results of the analyses suggest that creativity should be excluded from the Resilient
Force construct. However, the literature indicates that creativity is instrumental in
helping individuals overcome adversity as it aids in problem solving and provides
hope by helping individuals to imagine a brighter future (Buckner et al., 2003; Hart &
Waddell, 2003; Richardson, 2002; Snyder, et al., 1997; Wolin & Wolin, 1993).
Further, according to Piirto (2004), creativity can be defined in various ways beyond
the divergent production definition utilized for the current study. Given this
consideration, and because theory strongly supports the inclusion of creativity in the
Resilient Force construct, it would be imprudent to discard creativity from the
theoretical construct based on the results of this study. Rather measures of intuition
and other types of creativity might be considered.
Emotionality
Studies of resilience require a definition of positive adaptation. Many
researchers have defined positive adaptation in terms of social competence, which is
characterized by a consistent pattern of meeting societal expectations (Baruth &
Carroll, 2002; Bogar & Hulse-Killacky, 2006; Buckner, et al., 2003; Gothelf et al.,
87
1997; Werner & Johnson, 2004). However, Luthar (1991) suggests that some children
identified as resilient may internalize their stressful experiences. These children may
demonstrate positive behavioral adaptation, but may not be doing as well
emotionally. While an assessment of the social competence of a child may provide an
estimate of his or her general level of functioning, it gives little insight into his or her
level of emotional adaptation. Therefore, for the purposes of this study positive
adaptation was defined in terms of emotional states.
Emotionality was operationalized as a measure of positive adaptation and is
defined as being relatively free from experiencing frequently occurring intense
negative emotions. Three of the four subscales composing the Emotionality construct
are measures of a child’s perceived feeling of a particular emotion. The assessed
emotions are anger, anxiety and depression. The fourth subscale measures a child’s
perception of his or her disruptive behavior. Disruptive behavior was included as part
of the Emotionality construct as disruptive behavior is often indicative of elevated
levels of negative emotions which are not otherwise expressed (Mash & Barkley,
2003). Low scores on the Emotionality subscales indicate positive emotional
adaptation.
The results of the statistical analyses support the inclusion of the anger,
anxiety, depression, and disruptive behavior scales within the Emotionality construct.
All of the variables within the Emotionality construct demonstrate convergence.
Thus, the variables seem to be measuring the same construct. Furthermore, all of the
variables contribute significantly to the overall multivariate relationship, as indicated
by the squared structure coefficients. The convergence of the variables within the
88
construct, as well as, the contribution of each individual variable to the multivariate
relationship provides empirical support for the theoretical Emotionality construct.
Conclusions drawn from the Relationship between Resilient Force and Emotionality
The results of the canonical correlation analysis demonstrate that the
relationship between the Resilient Force construct and the Emotionality construct is
substantial, as approximately 46% of the variance in Resilient Force is shared with
Emotionality. In other words, 46% of the variability in the Emotionality construct
depends on the Resilient Force construct. Thus, the relationship between Resilient
Force and Emotionality demonstrates that the collective strength of elemental facets
of the human spirit within an individual influence his or her emotional adaptation.
An examination of the squared structure coefficients reveals that sense of
purpose is the most important variable within the Resilient Force construct. Sense of
connectedness is the second most important followed by hope. The influence of
creativity defined as divergent production is negligible. The most relevant variable
within the Emotionality construct is depression. Anger, anxiety, and disruptive
behavior make relatively equal contributions to the Emotionality construct. Thus, one
can conclude that child’s sense of purpose has the greatest impact on his or her
emotional adaptation, particularly in terms of depression.
Summary of Conclusions
Several conclusions can be inferred from the results of the analyses. Although
creativity defined as divergent production does not seem to fit within the Resilient
89
Force construct, the convergence of sense of purpose, sense of connectedness, and
hope provide empirical support for this construct. In other words, the theoretical
construct of Resilient Force exists in actuality. Likewise, the Emotionality construct
is observable among the children who participated in this study. Furthermore, the
relationship between Resilient Force and Emotionality indicates that an individual’s
Resilient Force, particularly in terms of sense of purpose, influences his or her
emotional adaptation especially with regard to depression.
Limitations to Conclusions
This study utilizes the cohort method of assessing risk and resiliency. The cohort
method examines the adjustment of individuals exposed to the same type adversity. Thus,
this method does not take into account previous life stressors or the stressfulness of an
event to the particular individual. Although such limitations exist, the cohort method has
been used extensively by researchers (Garmezy et al., 1984; Garmezy & Rutter, 1988;
Masten, 2001; Masten & Powell, 2003; Rolf et al., 1990) and is considered a valid
approach to examine the relationship between risk and resiliency (Luthar & Zelazo,
2003).
The children who participated in this study were considered at risk due to poverty.
Risk status was determined based on enrollment in one of two schools with a high
percentage of students on a free or reduced lunch program. Ninety-eight percent of the
children were on a free or reduced lunch program at one school and 75% of the children
at the other school received free or reduced lunches. While an overwhelming majority of
the students attending the schools sampled for this study came from low income families,
90
it is likely that some participants were not from low SES households and may not have
been considered at risk due to poverty.
With the exception of the creativity assessment all of the assessments were self-
report surveys. Prior to completing the assessments the children were informed that out of
care for them, particularly high scores on the anger, anxiety, depression, or disruptive
behavior scale would be reported to the school counselor. Thus, the participants may
have artificially raised or lowered their scores either intentionally or by careless
completion of the assessment.
There are many types of creativity and numerous measures of creativity (Piirto,
2004). However, there are very few instruments that assess creativity in children. The
creativity assessment utilized for this study measures divergent production. A measure of
another type of creativity may have been more appropriate for this study.
In order to make the number of assessments manageable for the students and
teachers, the students completed the measures in two one hour sessions approximately
one week apart. This decreased the sample size as it increased the likelihood of students
being unable to complete all eight assessments due to absences. Additionally, the
participants’ attitude toward completing the assessments may have varied from one
assessment session to the next.
The participants completed the assessments at their respective schools. Thus, the
environment in which the students completed the instruments may have differed with
regard to noise level, distractions and interruptions by school personnel.
91
Implications
The conclusions drawn from the results of this study propose numerous
implications. This study has established a basis in the conceptualization of resilience
as a motivational force. Understanding resilience as a motivational force may give
insight into ways of fostering resilience in children. Additionally, the conclusions
regarding creativity warrant further examination. This section addresses specific
implications for theory, practice, and research.
Implications for Theory
Central to the study of all waves of resilience inquiry is the notion that
something whether it be a set of a protective factors, a process, or a motivational
force leads to an individual’s resilient pattern. An individual is characterized as
having a resilient pattern when he or she demonstrates positive adaptation within the
context of adversity (Masten & Powell, 2003). The first wave of resilience inquiry
envisaged resilience as a set of characteristics which differentiated adaptive at risk
individuals from maladaptive individuals considered at-risk (Yates et al., 2003; Small
& Memmo, 2004; Hines et al., 2005). The second wave of resilience inquiry
identified resilience as a process initiated by stressful life events which served to
generate and fortify an individual’s first wave characteristics, resulting in a resilient
pattern (Geanellos, 2005; Luthar et al., 2000). Resilience as conceptualized in the
third wave differs from the first and second waves of understanding in that the
capacity to overcome adversity is not dependent upon a set of characteristics, but
instead relies upon the combination of facets of the human spirit which motivate an
individual to seek self-actualization and positively transform when confronted with
92
the challenges of life (Geanellos, 2005; Richardson, 2002). Thus, the third wave of
resilience inquiry posits that an individual’s motivational center drives him or her
toward a resilient pattern.
The children who participated in this study were considered at risk due to poverty.
Thus, the Emotionality construct served not only as a measure of positive adaptation, but
also provided an estimate of the child’s resilient pattern. The Resilient Force construct
assessed the motivational force within a child, as it considers the child’s unique
combination of elements of the human spirit. As the results of this study indicated that
there was a substantial relationship between the strength of an individual’s Resilient
Force and the degree to which he or she demonstrated a resilient pattern, the findings
provide empirical support for the conceptualization of the third wave of resilience.
Therefore, this study adds to third wave theory as it demonstrates the influence of one’s
Resilient Force on his or her resilient pattern.
This study supports an additional postulate of the third wave philosophy,
which is the notion that all people are capable of demonstrating a resilient pattern
(Richardson, 200). The results of the canonical correlation indicate that an
individual’s Resilient Force is determined by the combination of his or her internal
strengths. Thus, the motivational center of an individual differs from person to
person, as an individual’s weaknesses in one or more areas may be compensated by
his or her strengths. In other words, the capacity to be resilient does not rely upon a
universal set of factors, but instead is motivated by an individual’s unique strengths.
Therefore, all people are capable of resilience.
93
Implications for Practice
Understanding resilience as a motivational force present within all people
provides several implications for the practice of fostering resilience in children. The
first and second waves of inquiry suggest that an individual’s ability to be resilient is
developed within the context of adversity. However, the third wave of understanding
resilience implies that the ability of an individual to flourish when confronted with
life stressors can be preventively strengthened (Richardson, 2002). The
conceptualization of resilience in the third wave promotes the idea that the capacity to
be resilient is not determined by the number of protective factors an individual has
but by the strength of his or her motivational center as represented by the Resilient
Force construct. Thus, educational programs designed to strengthen an individual’s
motivational center by nurturing the spirit of the child would serve to promote
positive development and a drive towards self-actualization despite past, present, or
future adversity.
As sense of purpose is a particularly important element of the Resilient Force
construct, giving a child the freedom to define him or her self is central to nurturing
the spirit of the child. Individuals participating in the life of a child should take care
to not impose preconceived notions of who the child is or will be upon the child.
Providing support for the unique characteristics of a child within the context of an
emotionally safe and loving environment will enable him or her to make meaning of
his or her own life. This meaning encompasses the child’s sense of purpose and sense
of self. This level of understanding oneself leads to self-acceptance and allows the
child to grow, flourish, and strive toward his or her potential.
94
Implications for Research
The disconnect between the theoretically supported inclusion and the
statistically supported exclusion of creativity as part of the Resilient Force construct
warrants further examination. According to Piirto (2004), “psychology has several
threads of research into creativity” (p. 10). Thus, there are a variety of theoretical
approaches toward conceptualizing creativity. These include humanistic, positive,
psychometric, developmental, cognitive, and educational (Piirto, 2004). For this
study, creativity is defined as divergent production, which is a quantitative approach
of assessing an individual’s creative potential.
Divergent production tests of creativity attempt to measure an individual’s
ability to build new information by revising what is known and exploring new
possibilities (Piirto, 2004). Piirto suggests that while it may be easy to assess
divergent production, divergent production is not necessarily indicative of creativity.
The creativity addressed in resilience literature seems to be creativity as
conceptualized from a humanistic perspective. The humanistic understanding of
creativity emphasizes the idea that all people are creative and suggests that the nature
of creativity is spiritual (Piirto, 2004). Unfortunately, most tests of creativity for
children assess divergent production and very few if any assess creativity based on
the humanistic conceptualization. Therefore, future research should focus on
exploring measures that represent other forms of creativity, such as intuition and
insight.
95
Closing Remarks
Masten (2001) wrote “the great surprise of resilience research is the ordinariness
of the phenomena” (p. 227). Resilience once understood as a gift of superhuman
interpersonal strength possessed by those who were invulnerable and invincible now
appears to be ordinary and common. Resilience is a gift, but not just for a few. As the
study of resilience has unfolded over the past several decades many researchers and
scholars have concluded that the capacity for resilience is present in all individuals.
Humankind’s ability to not only overcome stressors, but to grow through hardships with
new insight is a basic adaptational system. If this system is nurtured and cared for in
children, they will flourish even in the face of adversity.
96
REFERENCES
Achenbach, T. M., & Edelbrock, C. S. (2001). Manual for the Youth Self-Report.
Burlington, VT: University of Vermont, Department of Psychiatry.
Alvord, M. K., & Grados, J. J. (2005). Enhancing resilience in children: A proactive
approach. Professional Psychology: Research and Practice, 36, 238-245.
Aronowitz, T. (2005). The role of “envisioning the future” in the development of
resilience among at-risk youth. Public Health Nursing, 22, 200-208.
Baruth, K. E., & Carroll, J. J. (2002). A formal assessment of resilience: The Baruth
protective factors inventory. Journal of Individual Psychology, 58(3), 235.
Beck, J. S., Beck, A. T., Jolly, J. B., & Steer, R. A. (2005). Beck Youth Inventories for
Children and Adolescents Manual (2nd ed.). San Antonio, TX: Harcourt Assessment
Bennett, P., Elliott, M., & Peters, D. (2005). Classroom and family effects on children's
social and behavioral problems. Elementary School Journal, 105, 461-480.
Bernard, B. (1991) Fostering Resiliency in Kids: Protective Factors in the Family,
School, and Community. San Francisco: Far West Laboratory for Educational
Research and Development.
Bogar, C. B., & Hulse-Killacky, D. (2006). Resiliency determinants and resiliency
processes among female adult survivors of childhood sexual abuse. Journal of
Counseling & Development, 83, 318-327.
97
Bonanno, G. A., Wortman, C. B., Lehman, D. R., Tweed, R. G., Haring, M., & Sonnega,
J., et al. (2002). Resilience to loss and chronic grief : A prospective study from
preloss to 18-months postloss. Journal of Personality and Social Psychology, 83,
1150-1164.
Bracke, P. (2001). Measuring the subjective well-being of people in a psychosocial
rehabilitation center and a residential psychiatric setting: The outline of the study and
the measurement properties of a multidimensional indicator of well-being.
Psychiatric Rehabilitation Journal, 24, 222-236.
Briere, J. N. (1996). Trauma Symptom Checklist for Children (TSCC) professional
manual. Odessa, FL: Psychological Assessment Resources, Inc.
Brooks, R. B. (1994). Children at risk: Fostering resilience and hope. American Journal
of Orthopsychiatry, 64, 545.
Bull, K. & Davis, G. (1982). Inventory for Appraising Adult Creativity. Contemporary
Educational Psychology, 7, 1-8.
Butcher, J. N., Williams, C.L., Graham, J. R., Archer, R. P., Tellegen, A. Ben-Porath,
Y.S., Kaemmer, B. (1992). Manual for administration, scoring, and interpretation:
Minnesota Multiphasic Personality Inventory- Adolescent. Minneapolis, MN:
University of Minnesota Press.
Buckner, J. C., Mezzacappa, E., & Beardslee, W. R. (2003). Characteristics of resilient
youths living in poverty: The role of self-regulatory processes. Development and
Psychopathology, 15, 139-162.
98
Callahan (2005). [Review of the Khatena-Torrance Creative Perception Inventory] In B.
S. Plake & R. A. Spies (Eds.), The Sixteenth Mental Measurements Yearbook.
Lincoln, NE: Buros Institute of Mental Measurements.
Cicchetti, D. (2003). Foreword. In S. S. Luthar (Ed.), Resilience and vulnerability :
Adaptation in the context of childhood adversities (pp. xix-xxvii). Cambridge, U.K.:
Cambridge University Press.
Cicchetti, D., & Rogosch, F. A. (1997). The role of self-organization in the promotion of
resilience in maltreated children. Development and Psychopathology, 9, 797-815.
CIM Test Publishers (1996). Manchester Personality Questionnaire. Sheffield, England:
CIM.
Coopersmith, S. (1989). Self-esteem inventories. Palo Alto, CA: Consulting
Psychologists Press.
Davis, G. (2004). Creativity is forever (5th ed.). Dubuque, IA: Kendall/Hunt.
De Civita, M. (2006). Strength-based efforts for promoting recovery from psychological
harm. Reclaiming Children & Youth, 14, 241-244.
de Souza, M. (2006). Educating for hope, compassion and meaning in a divisive and
intolerant world. International Journal of Children's Spirituality, 11, 165-175.
De Vaus, D. A. (2002). Analyzing social science data. Thousand Oaks, CA: Sage.
Dean, S. R. (1973). Schizophrenia: The first ten dean award lectures. New York: MSS
Information.
Dearden, J. (2004). Resilience: A study of risk and protective factors from the perspective
of young people with experience of local authority care. Support for Learning, 19(4),
187-193.
99
Demar, A. (1997). A school-based group intervention to strengthen personal and social
compentencies in latency-age children. Social Work in Education, 19, 219-230.
Denny, S., Clark, T.C., & Fleming, T. (2004). Emotional resilience: Risk and protective
factors for depression among alternative education students in New Zealand.
American Journal of Orthopsychiatry, 74, 137-149.
Eisenberg, N., Fabes, R. A., Guthrie, I. K., & Reiser, M. (2000). Dispositional
Emotionality and regulation: Their role in predicting quality of social functioning.
Journal of Personality & Social Psychology, 78, 136-157.
Eisenberg, N., Spinrad, T. L., Fabes, R. A., Reiser, M., Cumberland, A., & Shepard, S.
A., et al. (2004). The relations of effortful control and impulsivity to children's
resiliency and adjustment. ChildDevelopment, 75, 25-46.
Everall, R., Altrows, J., & Paulson, B. (2006). Creating a future: A study of resilience in
suicidal adolescent females. Journal of Counseling and Development, 84, 461-470.
Farrell, J., & Johnson, J. (2003). [Review of the Children’s Inventory of Self-Esteem,
Second Edition] In B. S. Plake, J. C. Impara, & R. A. Spies (Eds.), The Fifteenth
Mental Measurements Yearbook (pp. 105-110). Lincoln, NE: Buros Institute of
Mental Measurements.
Fergus, S., & Zimmerman, M. (2005). Adolescent resilience: A framework for
understanding healthy development in the face of risk. Annual Review of Public
Health, 26, 399-419.
Fergusson, D., & Horwood, J. (2003). Resilience to childhood adversity: Results of a 21-
year study. In S. S. Luthar (Ed.), Resilience and vulnerability : Adaptation in the
100
context of childhood adversities (pp. 130-155). Cambridge, U.K.; New York:
Cambridge University Press.
Foster, E. M., & Jones, D. E. (2005). The high costs of aggression: Public expenditures
resulting from conduct disorder. American Journal of Public Health, 95, 1767-1772.
Garmezy, N. (1982). Forward. In E. E. Werner & R. S. Smith. Vulnerable but invincible:
A longitudinal study of resilient children and youth (pp. xiii-xix). New York:
McGraw Hill.
Garmezy, N., Masten, A., Nordstrom, L. & Ferrarese, M. (1979). The nature of
competence in normal and deviant children. In M. W. Kent & J. E. Rolf (Eds.),
Social competence in children (pp. 22-43). Hanover, NH: The University Press of
New England.
Garmezy, N., Masten, A. S., & Tellegen, A. (1984). The study of stress and competence
in children: A building block for developmental psychopathology. Child
development, 55, 97-113.
Garmezy, N., & Rutter, M. (Eds.). (1988). Stress, coping, and development in children.
Baltimore: Johns Hopkins University Press.
Gay, L. R., Mills, G. E., & Airasian, P. W. (2006). Educational research : Competencies
for analysis and applications (8th ed.). Upper Saddle River, N.J.: Pearson Merrill
Prentice Hall.
Geanellos, R. (2005). Adversity as opportunity: Living with schizophrenia and
developing a resilient self. International Journal of Mental Health Nursing, 14(1), 7-
15.
101
Gebart Eaglemont, J. (1998). [Review of the Manchester Personality Questionnaire] In J.
Impara & B. S. Plake (Eds.), The Fourteenth Mental Measurements Yearbook.
Lincoln, NE: Buros Institute of Mental Measurements.
Goff, K. (2005). Goff-Torrance Creativity Indicator. Tulsa, Oklahoma: McGoff Creative
Enterprises.
Goff, K. & Torrance, E. P. (2002). Abbreviated Torrance Test for Adults. Bensenville,
IL: Scholastic Service Testing, Inc.
Gothelf, D., Apter, A., & van Praag, H. M. (1997). Measurement of aggression in
psychiatric patients. Psychiatry Research, 71(2), 83-95.
Grant, B. F. (2000). Estimates of US children exposed to alcohol abuse and dependence
in the family. American Journal of Public Health, 90(1), 112-115.
Grossman, F., Sorsoli, L., Kia-Keating, M. (2006). A gale force wind: Meaning making
by male survivors of childhood sexual abuse. American Journal of Orthopsychiatry,
76, 434-443.
Hammond, C. (2004). Implacts of lifelong learning upon emotional resilience,
psychological and mental health: Field work and evidence. Oxford Review of
Education, 30, 551-568.
Hart, T. (1999). The refinement of empathy. Journal of Humanistic Psychology, 39(4),
111.
Hart, T. & Waddell, A. (2003). Spiritual issues in counseling and psychotherapy: Toward
assessment and treatment. ChildSpirit Institute.
102
Hines, A. M., Merdinger, J., & Wyatt, P. (2005). Former foster youth attending college :
Resilience and the transition to young adulthood. American Journal of
Orthopsychiatry, 75, 381-394.
Howard, S., Dryden, J., & Johnson, B. (1999). Childhood resilience: Review and critique
of literature. Oxford Review of Education, 25, 307-323.
Howell, E. (2004). Access to children’s mental health services under medicaid and
SCHIP. Washington, D.C.: Urban Institute.
Hoyt-Meyers, L., Cowen, E. L., Work, W. C., Wyman, P. A., Magnus, K., & Fagen, D.
B., et al. (1995). Test correlates of resilient outcomes among highly stressed second,
and third-grade urban children. Journal of Community Psychology, 23, 326-338.
Huebner, E. S. (1994). Preliminary development and validation of a Multidimensional
Life Satisfaction Scale for Children. Psychological Assessment, 6(2), 149-158.
Huebner, S. (2001a). Manual for the Multidimensional Students’ Life Satisfaction Scale.
Retrieved November 28, 2006, from University of South Carolina, Department of
Psychology Website: http://www.psych.sc.edu/pdfdocs/huebslssmanual.pdf
Huebner, S. (2001b). Multidimensional Students’ Life Satisfaction Scale. Retrieved
November 28, 2006, from University of South Carolina, Department of Psychology
Website: http://www.psych.sc.edu/pdfdocs/huebslssitems.pdf
Hurst, M. D. (2005). Safety check. Education Week, 24(33), 31-33.
Isenhart (1998). [Review of the Manchester Personality Questionnaire] In J. Impara & B.
S. Plake (Eds.), The Fourteenth Mental Measurements Yearbook. Lincoln, NE:
Buros Institute of Mental Measurements.
103
Johnson, H. (2005). Counteracting performativity in schools: The case for laughter as a
qualitative and redemptive indicator. International Journal of Children's Spirituality,
10(1), 81-96.
Jonson-Reid, M. (2004). Child welfare services and delinquency: The need to know
more. Child Welfare, 83, 157-173.
Joseph, J. M. (1994). The resilient child: Preparing today's youth for tomorrow's world.
New York: Insight Books.
Kazdin, A., Rodgers, Colbus, & Siegel (1987). Children’s Hostility Inventory:
Measurement of aggression and hostility in psychiatric inpatient children. Journal of
Clinical Child Psychology, 16, 320-328.
Kim, H. K. (2006). Can we trust creativity tests? A review of the Torrance Tests of
Creative Thinking (TTCT). Creativity Research Journal (18), 3-14.
Kim-Cohen, J., Moffitt, T. E., Caspi, A., & Taylor, A. (2004). Genetic and environmental
processes in young children's resilience and vulnerability to socioeconomic
deprivation. Child Development, 75, 651-668.
Kovacs, M. (1992). Children’s depression inventory manual. Toronto: Multi-Health
Systems.
Lang, M. & Tisher, M. Children’s depression scale. Victoria, Australia: Australian
Council for Educational Research.
Luthar, S. S. (1991). Vulnerability and resilience: A study of high-risk adolescents. Child
Development, 62, 600-621.
Luthar, S. S., & Cicchetti, D. (2000). The construct of resilience: Implications for
interventions and social policies. Development and Psychopathology, 12, 857-885.
104
Luthar, S. S., Cicchetti, D., & Becker, B. (2000). The construct of resilience: A critical
evaluation and guidelines for future work. Child Development, 71, 543-562.
Luthar, S. S., & Zelazo, L. (2003). Research on resilience: An integrative review. In S. S.
Luthar (Ed.), Resilience and vulnerability : Adaptation in the context of childhood
adversities (pp. 510-550). Cambridge, U.K.; New York: Cambridge University
Press.
Maslow, A. H. (1943). A theory of human motivation. Psychological Review, 50, 370-
396.
Mash, E. J., & Barkley, R. A. (2003). Child psychopathology (2nd ed.). New York:
Gilford Press.
Masten, A. S. (2001). Ordinary magic: Resilience processes in development. American
Psychologist, 56(3), 227-238.
Masten, A. S., & Powell, J. L. (2003). A resilience framework for research, policy, and
practice. In S. S. Luthar (Ed.), Resilience and vulnerability : Adaptation in the
context of childhood adversities (pp. 1-25). Cambridge, U.K.: Cambridge University
Press.
Mazzotti, V. L., & Higgins, K. (2006). Public schools and the juvenile justice system:
Facilitating relationships. Intervention in School & Clinic, 41(5), 295-301.
Mendez, J. L., Fantuzzo, J., & Cicchetti, D. (2002). Profiles of social competence among
Low–Income african american preschool children. Child Development, 73(4), 1085-
1100.
105
Montgomery, D., Otto, S., & Hull, D. (2007). Project CREATES: Summative report of
research findings: Learning through the arts. Stillwater, OK: Oklahoma State
University.
Morris, E. (2002). Insight: Assessing and Developing Self-Esteem. London: NFER-Nelso.
Nunnally, J & Bernstein, I. (1994). Psychometric theory (3rd ed.). New York: McGraw-
Hill.
O'Donnell, D. A., Schwab-Stone, M. E., & Muyeed, A. Z. (2002). Multidimensional
resilience in urban children exposed to community violence. Child Development,
73(4), 1265-1282.
Olszewski-Kubilius, P. (2002). Parenting practices that promote talent development,
creativity, and optimal adjustment. In Neihart, M., Reis, S., Robinson, N., and Moon,
S. (Eds.), The Social and Emotional Development of Gifted Children: What Do We
Know? (pp. 205-212). Washington, DC: Prufrock Press, Inc.
Owens, E. B., & Shaw, D. S. (2003). Predicting growth curves of externalizing behavior
across the preschool years. Journal of Abnormal Child Psychology, 31(6), 575-590.
Pedhazur, E. J. (1997). Multiple regression in behavioral research : Explanation and
prediction (3rd ed.). Forth Worth: Harcourt Brace College Publishers.
Piers, E. (1996). Piers-Harris Children’s Self-Concept Scale: Revised manual 1984. Los
Angeles: Western Psychological Services.
Piers, E. (2002). Piers-Harris children’s Self Concept Scale (2nd ed.). Los Angeles:
Western Psychological Services.
Piirto, J. (2004). Understanding Creativity. Scottsdale, AZ: Great Potential Press, Inc.
106
Reynolds, W. (1989). Reynolds Child Depression Scale. Odessa, FL: Psychological
Assessment Resources.
Reynolds, C. & Richmond, B. (1985). Revised Children’s Manifest Anxiety Scale
(RCMAS) manual. Los Angeles: Western Psychological Services.
Richardson, G. E. (2002). The metatheory of resilience and resiliency. Journal of clinical
psychology, 58(3), 307-321.
Rolf, J., Masten, A., Cicchetti, D., Nuechterlein, K; & Weintraub, S. (Eds.). (1990). Risk
and protective factors in the development of psychopathology. Cambridge ; New
York: Cambridge University Press.
Rutter, M. (1979). Protective factors in children’s reponses to stress and disadvantage. In
M. W. Kent, & J. E. Rolf (Eds.), Social competence in children (pp. 49-74).
Hanover, NH: The University Press of New England.
Sherry, A. & Henson, R. (2005). Conducting and interpreting canonical correlation
analysis in personality research: A user friendly primer. Journal of Personality
Assessment, 84(1), 37-48.
Small, S., & Memmo, M. (2004). Contemporary models of youth development and
problem prevention: Toward an integration of terms, concepts, and models. Family
Relations, 53(1), 3-11.
Snyder, C. R., Hoza, B., Pelham, W. E., Rapoff, M., Ware, L., & Danovsky, M., et al.
(1997). The development and validation of the Children's Hope Scale. Journal of
pediatric psychology, 22, 399-421.
107
Snyder, C. R., Ritschel, L. A., Rand, K. L., & Berg, C. J. (2006). Balancing
psychological assessments: Including strengths and hope in client reports. Journal of
clinical psychology, 62(1), 33-46.
Stevens, J. (2002). Applied multivariate statistics for the social sciences (4th ed.).
Mahwah, N.J.: Lawrence Erlbaum Associates.
Sugland, B. W., Zaslow, M., & Nord, C. W. (1993). Risk, vulnerability, and resilience
among youth: In search of a conceptual framework. U.S.; District of Columbia:
Swarbrick, M. (2006). A wellness approach. Psychiatric rehabilitation journal, 29(4),
311-314.
Tedeschi, R. G., & Kilmer, R. P. (2005). Assessing strengths, resilience, and growth to
guide clinical interventions. Professional Psychology: Research and Practice, 36,
230-237.
Thompson, B. (1984). Canonical correlation analysis: uses and interpretation. Newbury
Park, CA: Sage.
Torrance, E. P. & Khatena, J. (1998). Khatena-Torrance Creative Perception Inventory.
Bensenville, IL : Scholastic Testing Service, Inc.
Torrance, E.P. (1990). Torrance Tests of Creative Thinking: Manual for scoring and
interpreting results (Verbal, Forms A and B). Bensenville, IL: Scholastic Testing
Service.
Turner, D. S. (2005). Hope seen through the eyes of 10 Australian young people. Journal
of Advanced Nursing, 52, 508-515.
Ungar, M. (2005). Handbook for working with children and youth: Pathways to
resilience across cultures and contexts. Thousand Oaks, Calif.: Sage Publications.
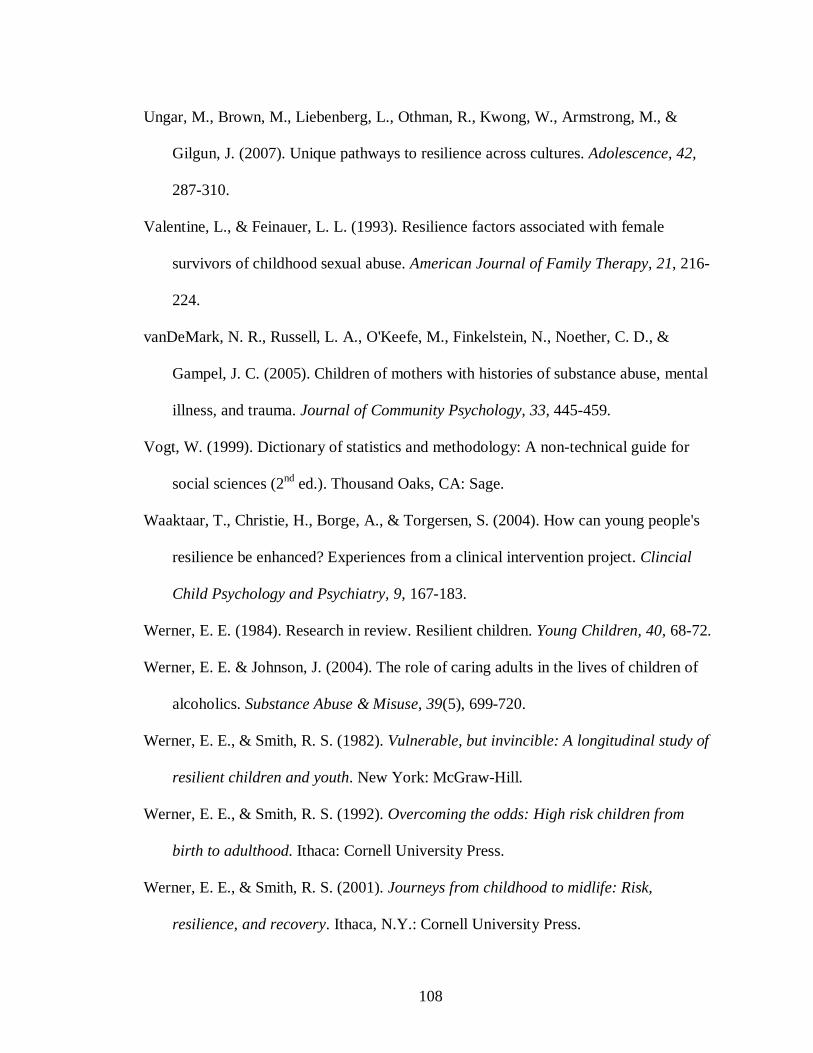
108
Ungar, M., Brown, M., Liebenberg, L., Othman, R., Kwong, W., Armstrong, M., &
Gilgun, J. (2007). Unique pathways to resilience across cultures. Adolescence, 42,
287-310.
Valentine, L., & Feinauer, L. L. (1993). Resilience factors associated with female
survivors of childhood sexual abuse. American Journal of Family Therapy, 21, 216-
224.
vanDeMark, N. R., Russell, L. A., O'Keefe, M., Finkelstein, N., Noether, C. D., &
Gampel, J. C. (2005). Children of mothers with histories of substance abuse, mental
illness, and trauma. Journal of Community Psychology, 33, 445-459.
Vogt, W. (1999). Dictionary of statistics and methodology: A non-technical guide for
social sciences (2nd ed.). Thousand Oaks, CA: Sage.
Waaktaar, T., Christie, H., Borge, A., & Torgersen, S. (2004). How can young people's
resilience be enhanced? Experiences from a clinical intervention project. Clincial
Child Psychology and Psychiatry, 9, 167-183.
Werner, E. E. (1984). Research in review. Resilient children. Young Children, 40, 68-72.
Werner, E. E. & Johnson, J. (2004). The role of caring adults in the lives of children of
alcoholics. Substance Abuse & Misuse, 39(5), 699-720.
Werner, E. E., & Smith, R. S. (1982). Vulnerable, but invincible: A longitudinal study of
resilient children and youth. New York: McGraw-Hill.
Werner, E. E., & Smith, R. S. (1992). Overcoming the odds: High risk children from
birth to adulthood. Ithaca: Cornell University Press.
Werner, E. E., & Smith, R. S. (2001). Journeys from childhood to midlife: Risk,
resilience, and recovery. Ithaca, N.Y.: Cornell University Press.
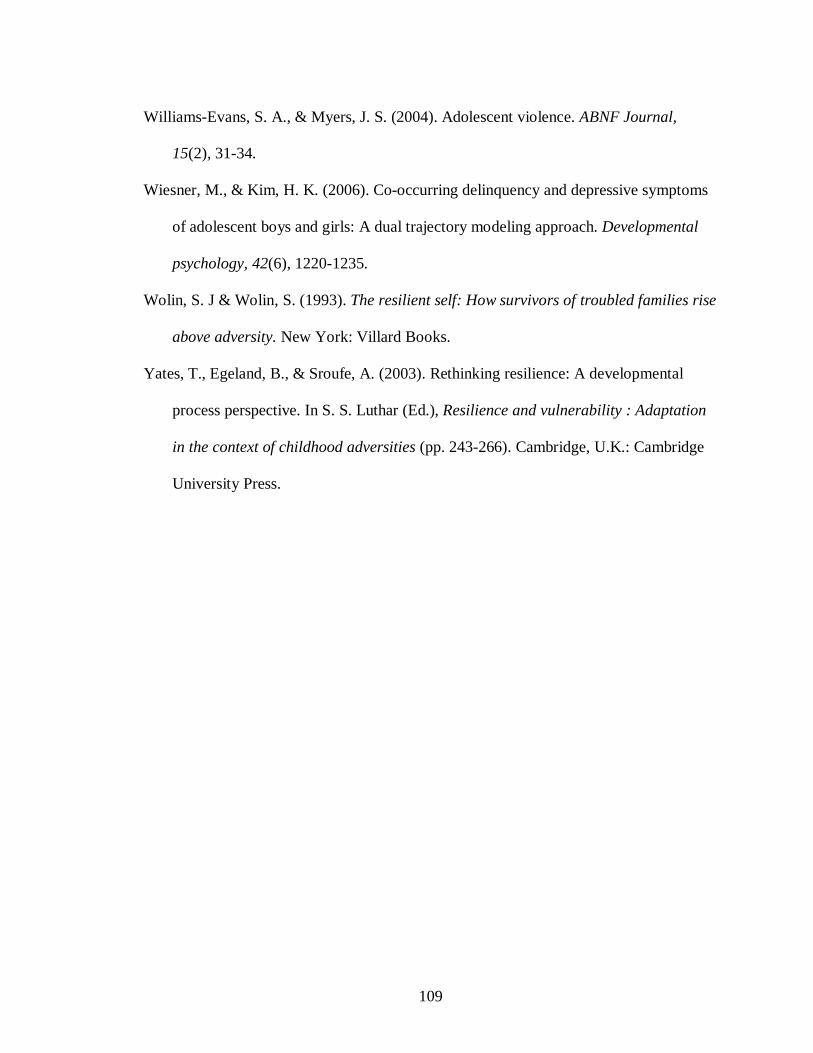
109
Williams-Evans, S. A., & Myers, J. S. (2004). Adolescent violence. ABNF Journal,
15(2), 31-34.
Wiesner, M., & Kim, H. K. (2006). Co-occurring delinquency and depressive symptoms
of adolescent boys and girls: A dual trajectory modeling approach. Developmental
psychology, 42(6), 1220-1235.
Wolin, S. J & Wolin, S. (1993). The resilient self: How survivors of troubled families rise
above adversity. New York: Villard Books.
Yates, T., Egeland, B., & Sroufe, A. (2003). Rethinking resilience: A developmental
process perspective. In S. S. Luthar (Ed.), Resilience and vulnerability : Adaptation
in the context of childhood adversities (pp. 243-266). Cambridge, U.K.: Cambridge
University Press.
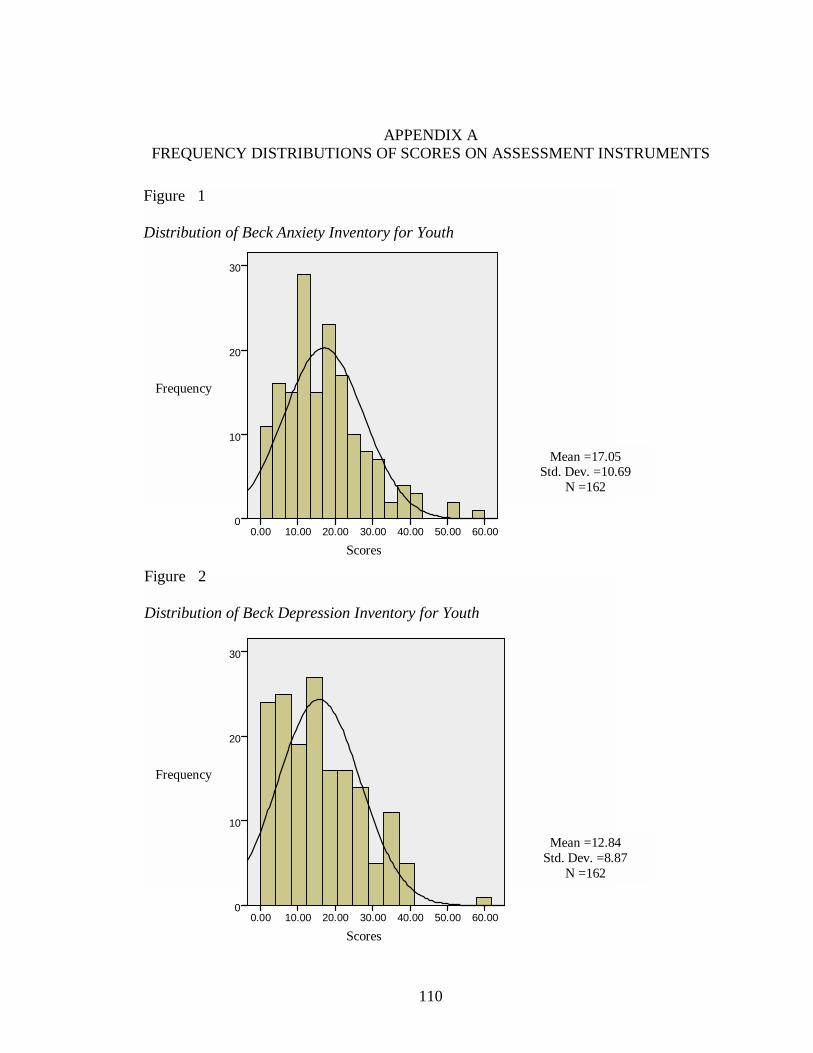
110
APPENDIX A
FREQUENCY DISTRIBUTIONS OF SCORES ON ASSESSMENT INSTRUMENTS
Scores
60.00 50.00 40.00 30.00 20.00 10.00 0.00
Frequency
30
20
10
0
Mean =12.84 Std. Dev. =8.87
N =162
Scores
60.00 50.00 40.00 30.00 20.00 10.00 0.00
Frequency
30
20
10
0
Mean =17.05 Std. Dev. =10.69
N =162
Figure 1 Distribution of Beck Anxiety Inventory for Youth
Figure 2 Distribution of Beck Depression Inventory for Youth
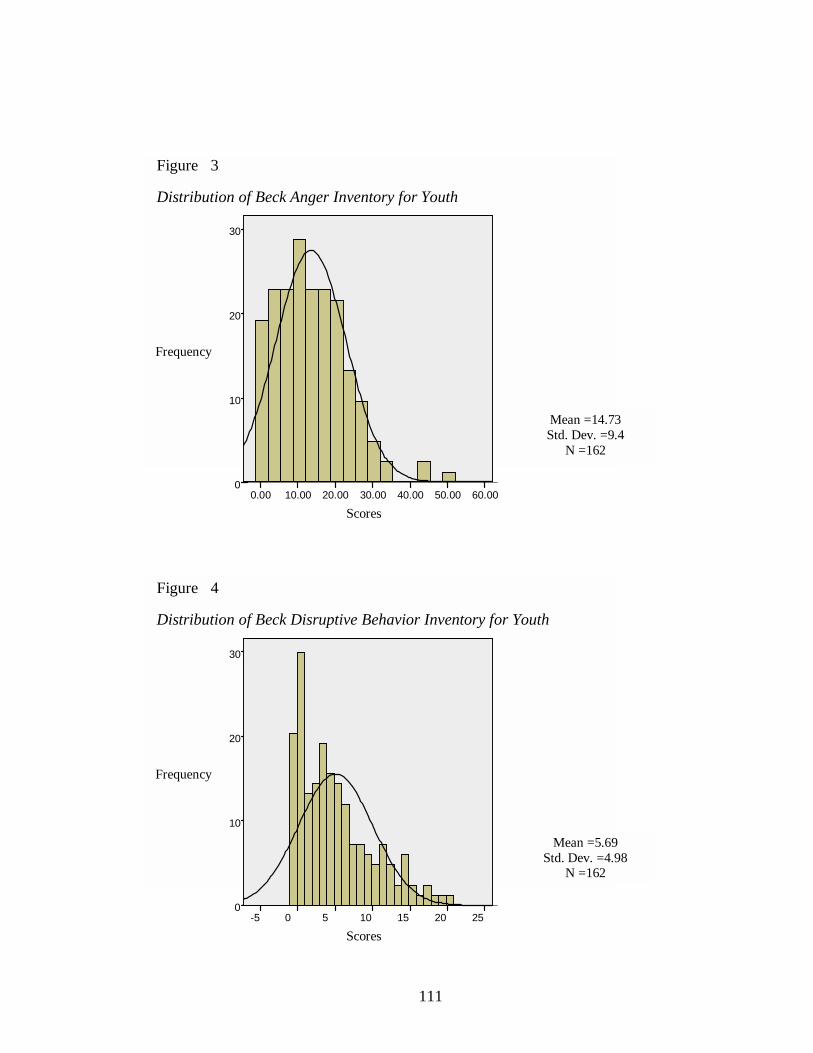
111
Scores
25 20 15 10 5 0 -5
Frequency
30
20
10
0
Mean =5.69 Std. Dev. =4.98
N =162
Figure 4 Distribution of Beck Disruptive Behavior Inventory for Youth
Scores
60.00 50.00 40.00 30.00 20.00 10.00 0.00
Frequency
30
20
10
0
Mean =14.73 Std. Dev. =9.4
N =162
Figure 3 Distribution of Beck Anger Inventory for Youth
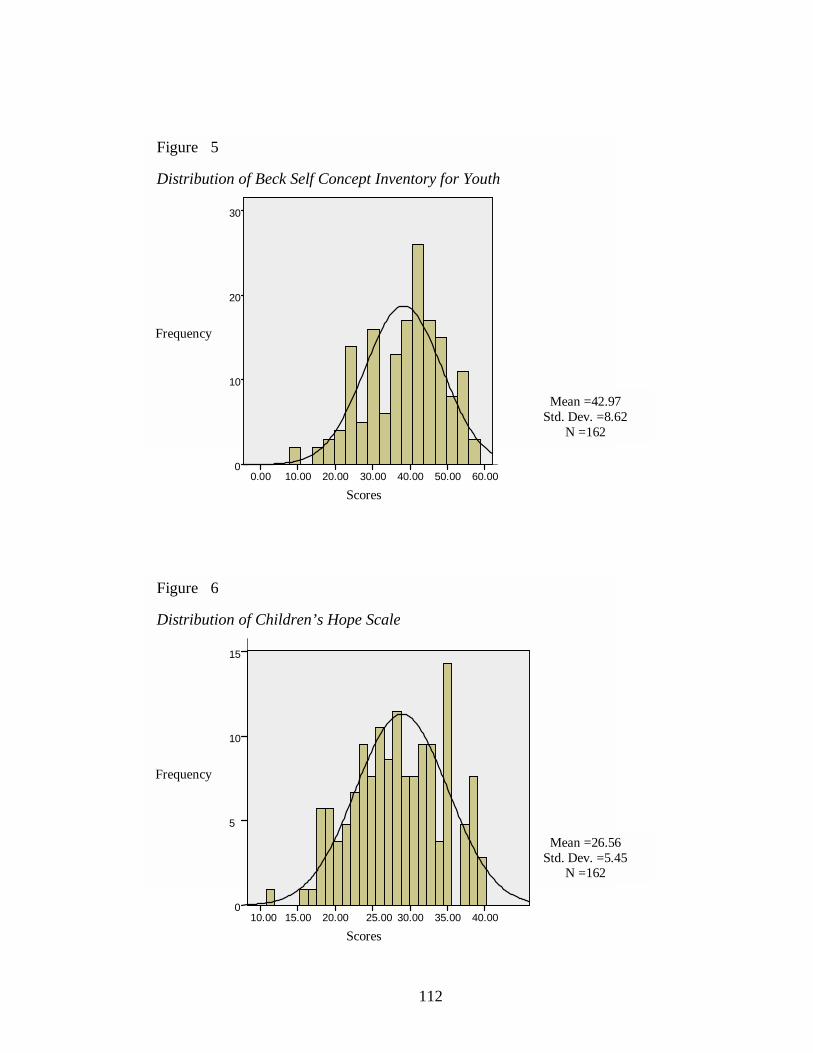
112
Scores
40.00 35.00 30.00 25.00 20.00 15.00 10.00
Frequency
15
10
5
0
Mean =26.56 Std. Dev. =5.45
N =162
Figure 6 Distribution of Children’s Hope Scale
Scores
60.00 50.00 40.00 30.00 20.00 10.00 0.00
Frequency
30
20
10
0
Mean =42.97 Std. Dev. =8.62
N =162
Figure 5 Distribution of Beck Self Concept Inventory for Youth
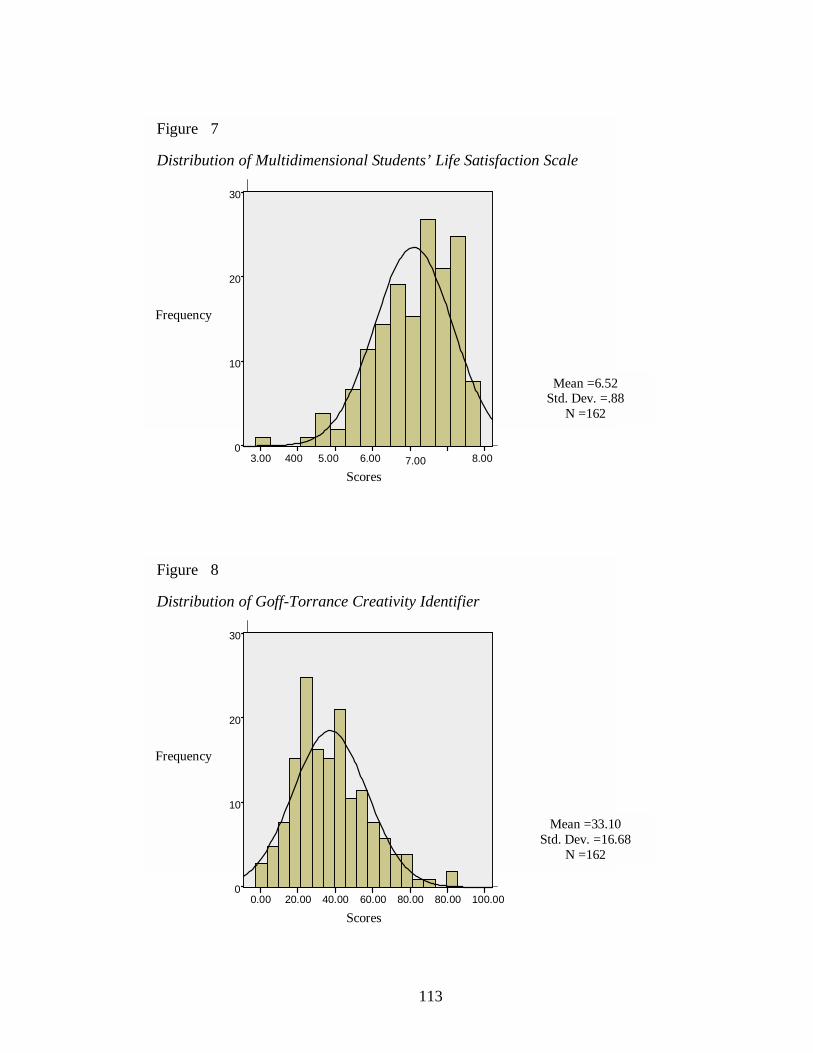
113
Scores
100.00 80.00 80.00 60.00 40.00 20.00 0.00
Frequency
30
20
10
0
Mean =33.10 Std. Dev. =16.68
N =162
Figure 8 Distribution of Goff-Torrance Creativity Identifier
Scores
8.00 7.00 6.00 5.00 400 3.00
Frequency
30
20
10
0
Mean =6.52 Std. Dev. =.88
N =162
Figure 7 Distribution of Multidimensional Students’ Life Satisfaction Scale
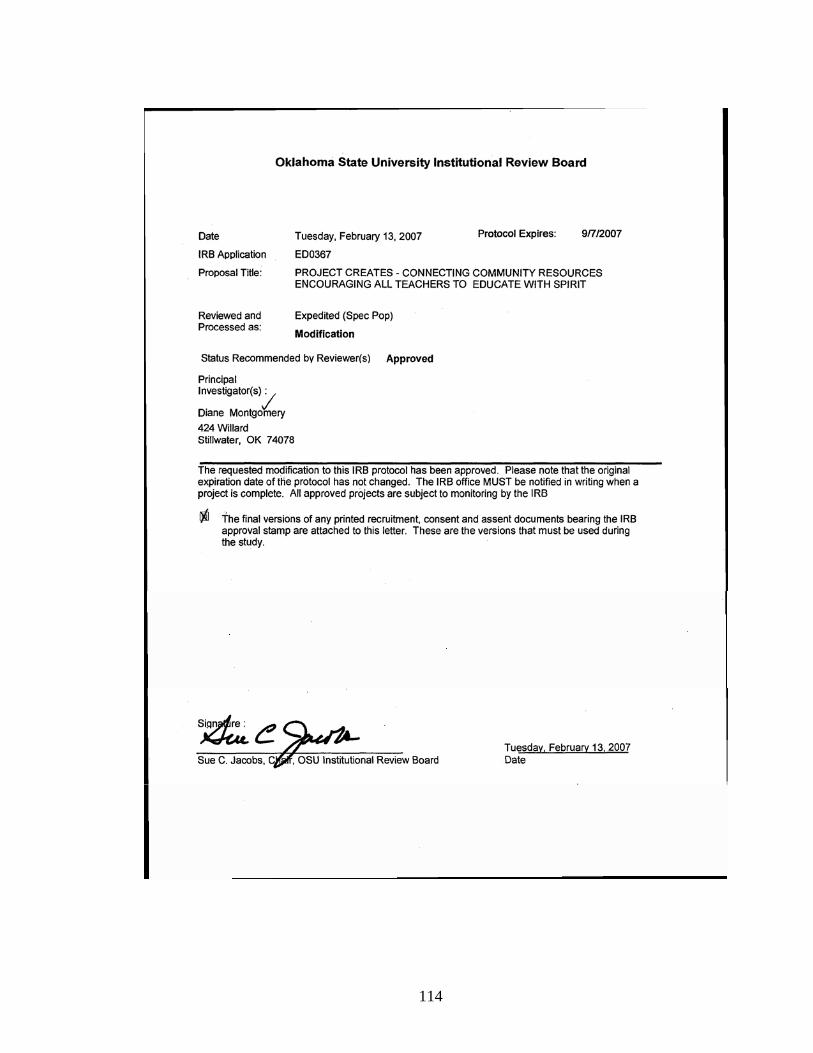
114
VITA
Jerilyn Thorman
Candidate for the Degree of
Doctor of Philosophy Thesis: AN EXPLORATORY STUDY OF A MULTIDIMENSIONAL MODEL OF
RESILIENCY Major Field: Educational Psychology Biographical:
Education: Graduated from Okmulgee, High School, Okmulgee, Oklahoma in
1990. Received a Bachelor of Art degree in English from Oklahoma State University, Stillwater, Oklahoma in May 1995. Completed the requirements for a Masters of Applied Behavioral Science in Education, May 1998. Completed the requirements for the Doctor of Philosophy in Educational Psychology at Oklahoma State University, Stillwater, Oklahoma, December 2007.
Experience: I received my Licensed Professional Counselor license in 2000. I
was a clinical therapist from 1998-2000. From 2000-2005 I was a youth and family counselor. In both positions I worked with children, adolescents, and their families. I returned to graduate school in 2004. As a graduate teaching associate, I taught teacher education courses. I was also a graduate research associate as a member of a research team studying methods designed to transform teaching and learning in elementary schools. I have served on several other research teams as well.
Professional Memberships: American Educational Research Association, American
Counseling Association
Name: Jerilyn Thorman Date of Degree: December, 2007 Institution: Oklahoma State University Location: Stillwater, Oklahoma Title of Study: AN EXPLORATORY STUDY OF A MULTIDIMENSIONAL MODEL
OF RESILIENCY Pages in Study: 121 Candidate for the Degree of Doctor of Philosophy
Major Field: Educational Psychology Scope and Method of Study: The purpose of this study was to establish a basis in the philosophy of the third wave of resiliency, conceptualized by Richardson (2002), as a motivational force which drives an individual to experience personal growth through hardship. Two theoretical constructs were created to examine the relationship between the motivational force and positive adaptation within the context of adversity. One hundred and sixty-seven third, fourth, and fifth grade students considered “at risk” participated in this study by completing measures of the variables associated with each construct. The first construct, Resilient Force, represented the motivational force and was operationalized by measures of sense of purpose, sense of belonging, hope, and creativity. The second construct, Emotionality, represented positive adaptation and was operationalized by measures of anger, anxiety, depression, and disruptive behavior. Bivariate correlational analyses were employed to assess the convergence of the variables within each construct. Canonical correlational analysis was utilized to assess the multivariate relationship between the Resilient Force Emotionality constructs. Findings and Conclusions: With the exception of creativity all of the variables within the Resilient Force construct were positively correlated to a moderate degree. Correlations between creativity and sense of purpose and creativity and hope were not statistically significant. Creativity and sense of connectedness shared a low negative correlation. The variables within the Emotionality construct demonstrated were all positively intercorrelated. The results of the canonical correlational analysis between the Resilient Force and Emotionality variable sets indicated that the two constructs shared a considerable proportion of the variance, about 46 %. Several conclusions can be inferred from the results of the analyses. Although creativity defined as divergent production did not seem to fit within the Resilient Force construct, the convergence of sense of purpose, sense of connectedness, and hope provided empirical evidence that the theoretical construct of Resilient Force exists in actuality. Likewise, the Emotionality construct was observable among the children who participated in this study. Furthermore, the findings indicate that there is a strong relationship between an individual’s Resilient Force and his or her adaptation. Implications for theory, research and practice are discussed within the paper. ADVISER’S APPROVAL: Diane Montgomery