Environmental Impact Assessment Report For Exploratory ...
198
Environmental Impact Assessment Report For Exploratory Drilling Activities In NELP Block CY-OSN-2009/2, Gulf Of Mannar, India Prepared For Prepared By September 2014 SENES Consultants India Pvt. Ltd.
-
Upload
khangminh22 -
Category
Documents
-
view
0 -
download
0
Transcript of Environmental Impact Assessment Report For Exploratory ...

Environmental Impact Assessment Report For
Exploratory Drilling Activities In NELP Block CY-OSN-2009/2, Gulf Of Mannar, India
Prepared For
Prepared By
September 2014
SENES Consultants India Pvt. Ltd.

EEIIAA RRee
Declafor
I, hereb
the abo
EIA CooName: M[CategoCatego
SignatuPeriod oContact
Functio
S. No.
FA
1 W
2 S
3 E
4 R
eeppoorrtt FFoorr EExxpp
ration by r Explorat
by, certify th
ove EIA.
ordinator: Mr. Mangesory 1(b):Offsry A]
ure & Date: of Involvemt informatio
onal Area E
unctional Areas
WP*
HW*
B*
RH*
pplloorraattoorryy DDrr
Experts coory Drillin
hat I was a
sh Dakhore shore and o
11th Septemment: May 20on: Telep
Ema
Experts:
Name of the expert/s Mangesh Dakhore
Mangesh Dakhore
Abhishek Roy Goswami
Mangesh Dakhore
rriilllliinngg AAccttiivvii
ontributinng Activitie
M
part of the
onshore oil a
mber 2014 014 to Septphone no. il
Involv
PeriodMay 2to Septe2014
May 2to Septe2014
May 2to Septe2014
May 2to Septe
iittiieess IInn NNEELLPP
TTaammiill NNaadduu
g to Envires In NELP
Mannar, Ind
e EIA team
and gas exp
tember 2014022 –mdak
vement
d Ta2014
mber
Stuwasoudraanme
2014
mber
Stusolwadis
2014
mber
Aseconeanaresecavado
2014
mber
Stuinvmi
PP BBlloocckk CCYY--OO
uu
ronmentalP Block CYdia
in the follo
ploration, de
4 –27576298khore@sene
sk udy of varioater pollutiources (bilgeainage wated mitigationeasures. udy of variolid and haza
astes and thsposal methsessment oology of thearby coastad legally preas based ocondary souailable in pu
omain. udy of key rvolved and tigation me
OOSSNN--22000099//22
SS
l Impact AY-OSN-200
owing capac
evelopment
esindia.com
S(D
ous on e fluid, er, etc.) n
ous ardous
heir hods. f e al areas otected
on the urces ublic
risks
easures
//22,, GGuullff OOff MM
P
SSeepptteemmbbeerr 2200
Assessmen09/2, Gulf
city that de
t and produ
m
Signature Date: 11/09
MMaannnnaarr,,
a g e | ii
001144 | OIL
t (EIA) f Of
eveloped
uction,
9/2014)

EEIIAA RRee
S. No.
FA
5 S
S. No.
F
1 W2 S3 E4 R5 S
Declara
I, Main
Environ
OSN-20
mis-lea
Signatu
Name: MDesignaName oNABET
eeppoorrtt FFoorr EExxpp
unctional Areas
E*
unctional A
WP HW B
RH E
ation by th
nak Hazra,
mental Imp
009/2, Gulf
ding inform
ure:
Mr. Mainak ation: Directof the EIA CCertificate N
pplloorraattoorryy DDrr
Name of the expert/s
Rajani Iyer
Area Code
e Head of t
hereby, c
pact Assess
Of Mannar
mation ment
Hazra tor onsultant ONo.
rriilllliinngg AAccttiivvii
Involv
Period2014
r May 2to Septe2014
Comple
Water PSolid WEcologyRisk AssSocio Ec
the Accred
confirm th
ment (EIA)
r, India. I al
tioned in th
Organization
iittiieess IInn NNEELLPP
TTaammiill NNaadduu
vement
d Ta
2014
mber
Stuecoco
ete name of
Pollution Preaste and Ha
y and Biodivsessment & conomics
dited Consu
at the ab
for Explora
lso confirm
is statemen
n: SENES Co
PP BBlloocckk CCYY--OO
uu
sk
udy of socioonomic proastal areas
f the Funct
evention, Coazardous Wversity
Hazard Ma
ultant Orga
bove menti
atory Drilling
that I shal
nt.
onsultants InNABET/EIA/RA016/040
OOSSNN--22000099//22
SS
S(D
o-ofile of
tional Area
ontrol & PreWaste Manag
anagement
anization
ioned expe
g Activities
l be fully a
ndia Pvt. Ltd
//22,, GGuullff OOff MM
P a
SSeepptteemmbbeerr 2200
Signature Date: 11/09
s
ediction of Igement
erts prepa
In NELP Bl
ccountable
d.
MMaannnnaarr,,
a g e | iii
001144 | OIL
9/2014)
Impacts
red the
lock CY-
for any

EEIIAA RReeppoorrtt FFoorr EExxpplloorraattoorryy DDrriilllliinngg AAccttiivviittiieess IInn NNEELLPP BBlloocckk CCYY--OOSSNN--22000099//22,, GGuullff OOff MMaannnnaarr,,
TTaammiill NNaadduu
P a g e | iv
SSeepptteemmbbeerr 22001144 | OIL
QCI Accreditation Certificate – SENES Consultants India Pvt. Ltd.

EEIIAA RReeppoorrtt FFoorr EExxpplloorraattoorryy DDrriilllliinngg AAccttiivviittiieess IInn NNEELLPP BBlloocckk CCYY--OOSSNN--22000099//22,, GGuullff OOff MMaannnnaarr,,
TTaammiill NNaadduu
P a g e | v
SSeepptteemmbbeerr 22001144 | OIL

EEIIAA RReeppoorrtt FFoorr EExxpplloorraattoorryy DDrriilllliinngg AAccttiivviittiieess IInn NNEELLPP BBlloocckk CCYY--OOSSNN--22000099//22,, GGuullff OOff MMaannnnaarr,,
TTaammiill NNaadduu
P a g e | vi
SSeepptteemmbbeerr 22001144 | OIL
CONTENTS
EXECUTIVE SUMMARY ......................................................................................................................... E-1
1 INTRODUCTION .................................................................................................................................. 1
1.1 PURPOSE .............................................................................................................................................. 1
1.2 IDENTIFICATION OF PROJECT PROPONENT & PROJECT ................................................................. 2
1.3 SCOPE OF STUDY ................................................................................................................................ 2
1.4 POINT WISE COMPLIANCE OF TOR ................................................................................................. 3
2 PROJECT DESCRIPTION .................................................................................................................... 9
2.1 TYPE OF PROJECT ................................................................................................................................ 9
2.2 LOCATION OF PROJECT ...................................................................................................................... 9
2.3 DRILLING WELL LOCATIONS ........................................................................................................... 14
2.3.1 CZR Regulation ................................................................................................................ 14
2.3.2 Proposed Sethusamudram Ship Channel Project ............................................. 17
2.3.3 Proposed Project Schedule ......................................................................................... 20
2.4 TECHNOLOGY AND PROCESS DESCRIPTION ................................................................................. 20
2.5 SOURCE OF WATER & PERMISSION FOR DRAWL OF WATER ..................................................... 28
2.6 WATER BALANCE ............................................................................................................................. 28
2.7 WASTEWATER GENERATION & DISCHARGE ................................................................................. 28
2.7.1 Bilge Fluids ........................................................................................................................ 29
2.7.2 Deck Drainage.................................................................................................................. 29
2.7.3 Grey and Black Water ................................................................................................... 30
2.8 NOISE GENERATION ........................................................................................................................ 30
2.9 CHEMICAL STORAGE AT RIG AND IN ON-SHORE FACILITY ........................................................ 30
2.10 PROJECT NEED & BENEFITS ................................................................................................ 31
3 BASELINE ENVIORMENT ............................................................................................................... 33

EEIIAA RReeppoorrtt FFoorr EExxpplloorraattoorryy DDrriilllliinngg AAccttiivviittiieess IInn NNEELLPP BBlloocckk CCYY--OOSSNN--22000099//22,, GGuullff OOff MMaannnnaarr,,
TTaammiill NNaadduu
P a g e | vii
SSeepptteemmbbeerr 22001144 | OIL
3.1 INTRODUCTION ................................................................................................................................ 33
3.2 STUDY AREA AND STUDY PERIOD ................................................................................................. 33
3.3 STUDY COMPONENTS ..................................................................................................................... 34
3.4 STUDY METHODOLOGY .................................................................................................................. 35
3.5 BASELINE ENVIRONMENT FOR ENVIRONMENTAL COMPONENTS ............................................... 36
3.5.1 Bathymetry and Seabed Morphology .................................................................... 36
3.6 GEOLOGY AND SEDIMENTOLOGY .................................................................................................. 38
3.6.1 Climate and Hydrology of Gulf of Mannar ........................................................... 38
3.6.2 Wind Patterns ................................................................................................................... 39
3.6.3 Circulation and Currents .............................................................................................. 40
3.6.4 Waves .................................................................................................................................. 42
3.7 CLIMATOLOGY & METEOROLOGY ................................................................................................. 43
3.8 MARINE WATER & SEDIMENT QUALITY ....................................................................................... 48
3.8.1 Physico-Chemical Aspects – Sea Water & Sediment ....................................... 51
3.8.2 Ecological Aspects – Sea Water & Sediment ...................................................... 54
3.9 MARINE ECOLOGY ........................................................................................................................... 58
3.9.1 Gulf of Mannar ................................................................................................................. 58
3.9.2 Marine & Coastal Ecosystems of GOM .................................................................. 61
3.9.3 Biodiversity in GOM ....................................................................................................... 66
3.10 SOCIOECONOMIC CONDITIONS .......................................................................................... 78
3.10.1 Village Profile & Livelihood in the Coastal Villages .......................................... 78
3.11 COASTAL VULNERABILITY .................................................................................................... 83
4 ANTICIPATED ENVIRONMENTAL IMPACTS & MITIGATION MEASURES ................... 86
4.1 ENVIRONMENTAL IMPACTS IDENTIFIED ......................................................................................... 86
4.1.1 Marine Water and Sediment Impacts..................................................................... 87
4.1.2 Noise Impacts .................................................................................................................. 93

EEIIAA RReeppoorrtt FFoorr EExxpplloorraattoorryy DDrriilllliinngg AAccttiivviittiieess IInn NNEELLPP BBlloocckk CCYY--OOSSNN--22000099//22,, GGuullff OOff MMaannnnaarr,,
TTaammiill NNaadduu
P a g e | viii
SSeepptteemmbbeerr 22001144 | OIL
4.1.3 Marine Ecological Impacts .......................................................................................... 95
4.1.4 Socio-Economic Impacts ............................................................................................. 97
4.2 MITIGATION MEASURES FOR SIGNIFICANT ENVIRONMENTAL IMPACTS ................................... 98
4.2.1 Mud make-up and Mud & Cuttings disposal ..................................................... 98
4.2.2 Restoration Plans and Rig Decommissioning Measures ................................ 99
4.2.3 Restoration of On-Shore Support Facilities On-Land ...................................... 99
4.2.4 Membership of Common Disposal Facilities ....................................................... 99
4.2.5 Measures to Handle Oily Waste Discharges ........................................................ 99
4.2.6 Sewage Treatment and Disposal ............................................................................ 100
4.2.7 Solid Waste Handling ................................................................................................. 101
4.2.8 Spent Oil Handling ....................................................................................................... 101
4.2.9 Oil Handling from Well Test Operations ............................................................. 101
4.2.10 Noise Abatement Measures ..................................................................................... 102
4.2.11 Measures to Minimize Disturbance Due to Light and Visual Intrusions 102
5 ENVIRONMENTAL MONITORING PROGRAM .................................................................... 104
6 ADDITIONAL STUDIES ......................................................................................................................... 108
6.1 RISK ASSESSMENT ......................................................................................................................... 108
6.1.1 Different Stages during Which Risk Assessments Are Undertaken .......... 108
6.1.2 Objective of the QRA .................................................................................................. 109
6.1.3 Risk Assessment Methodology ............................................................................... 110
6.1.4 Hazard Identification ................................................................................................... 111
6.1.5 Frequency Analysis ....................................................................................................... 112
6.1.6 Consequence Analysis ................................................................................................ 113
6.1.7 Risk Evaluation ............................................................................................................... 115
6.1.8 Key Risks involved ........................................................................................................ 116
6.1.12 Risk Mitigation Measures .......................................................................................... 123

EEIIAA RReeppoorrtt FFoorr EExxpplloorraattoorryy DDrriilllliinngg AAccttiivviittiieess IInn NNEELLPP BBlloocckk CCYY--OOSSNN--22000099//22,, GGuullff OOff MMaannnnaarr,,
TTaammiill NNaadduu
P a g e | ix
SSeepptteemmbbeerr 22001144 | OIL
6.1.18 H2S Emission Control Plans ...................................................................................... 136
6.2 OIL SPILL RISK ASSESSMENT ......................................................................................................... 138
6.2.1 Oil spill scenarios .......................................................................................................... 138
7 ENVIRONMENT MANAGEMENT PLAN ................................................................................. 144
7.1 SELECTION OF DRILLING LOCATION AND NAVIGATIONAL PATH WAYS .................................. 144
7.2 ATMOSPHERIC EMISSIONS ............................................................................................................ 145
7.3 STORAGE AND HANDLING OF CHEMICALS AND SUPPLIES ........................................................ 146
7.4 MANAGEMENT OF DRILL CUTTINGS & DRILLING MUD ............................................................ 147
7.5 OILY WATER DISCHARGES AND OTHER WASTES ...................................................................... 148
7.6 MANAGEMENT OF TRANSPORT OPERATION TO DRILLING RIG ................................................ 150
7.7 OIL’S MANAGEMENT SYSTEM ..................................................................................................... 151
7.7.1 Policy.................................................................................................................................. 152
7.7.2 Management Manual .................................................................................................. 153
7.7.3 Management System Procedures and Documentation ................................ 154
7.7.4 Implementation, Operation, Infrastructure and Work Environment ........ 154
7.7.5 Management of Occupational Health & Safety Aspects .............................. 155
7.8 ORGANIZATIONAL STRUCTURE AND IMPLEMENTATION FRAMEWORK .................................... 156
7.9 CAPITAL AND RECURRING COST FOR ENVIRONMENTAL POLLUTION CONTROL MEASURES . 157
8 DISCLOSURE OF CONSULTANTS ENGAGED ....................................................................... 159
8.1 EIA CONSULTANT ENGAGED ....................................................................................................... 159
8.2 AGENCY ENGAGED FOR MARINE SAMPLING .............................................................................. 159

EEIIAA RReeppoorrtt FFoorr EExxpplloorraattoorryy DDrriilllliinngg AAccttiivviittiieess IInn NNEELLPP BBlloocckk CCYY--OOSSNN--22000099//22,, GGuullff OOff MMaannnnaarr,,
TTaammiill NNaadduu
P a g e | x
SSeepptteemmbbeerr 22001144 | OIL
LIST OF TABLES
TABLE 1-1: COMPLIANCE WITH TOR PROVIDED BY EXPERT APPRAISAL COMMITTEE OF MOEF ............ 3
TABLE 2-1: GEOGRAPHICAL COORDINATES OF BLOCK CY-OSN-2009/2 ........................................... 12
TABLE 2-2: PROSPECT AREAS & TENTATIVE WELL LOCATIONS IN BLOCK CY-OSN-2009/2 ........... 12
TABLE 2-3: BLOCK CY-OSN-2009/2 & DISTANCE FROM COASTLINE ................................................ 14
TABLE 2-4: PROSPECT DISTANCE FROM COAST & CRZ LINE ................................................................. 15
TABLE 2-5: WATER BALANCE ...................................................................................................................... 28
TABLE 2-6: COMMON CHEMICALS LIKELY TO BE USED FOR PREPARATION OF DRILLING FLUIDS ........ 31
TABLE 3-1: DETAILS OF STUDY COMPONENTS, STUDY AREA AND STUDY PARAMETER ....................... 34
TABLE 3-2: SEA WATER & SEDIMENT SAMPLING LOCATIONS DETAILS ................................................. 49
TABLE 3-3: SEA WATER ANALYSIS DATA ................................................................................................... 51
TABLE 3-4: SEDIMENT ANALYSIS RESULT ................................................................................................... 53
TABLE 3-5: PLANKTON PROFILE OF MARINE SURFACE WATER ............................................................... 54
TABLE 3-6: BENTHIC PROFILE OF SEDIMENT SAMPLE .............................................................................. 56
TABLE 3-7: BIODIVERSITY INDEX FOR PHYTOPLANKTON & ZOOPLANKTON .......................................... 57
TABLE 3-8: PEOPLE INVOLVED IN FISHING AND RELATED ACTIVITIES ..................................................... 81
TABLE 5-1: ENVIRONMENTAL MONITORING PROGRAM ........................................................................ 105
TABLE 6-1: FREQUENCY CATEGORIES AND CRITERIA .............................................................................. 113
TABLE 6-2: SEVERITY CATEGORIES AND CRITERIA ................................................................................... 114
TABLE 6-3: RISK CATEGORIES AND SIGNIFICANCE CRITERIA .................................................................. 116
TABLE 6-4: EQUIPMENT AND APPLICABLE STANDARDS ......................................................................... 127

EEIIAA RReeppoorrtt FFoorr EExxpplloorraattoorryy DDrriilllliinngg AAccttiivviittiieess IInn NNEELLPP BBlloocckk CCYY--OOSSNN--22000099//22,, GGuullff OOff MMaannnnaarr,,
TTaammiill NNaadduu
P a g e | xi
SSeepptteemmbbeerr 22001144 | OIL
TABLE 6-5: OIL SPILL SCENARIOS ............................................................................................................. 138
ANNEXURE I: TOR ISSUED BY MOEF FOR BLOCK CY-OSN-2009/2 ................................................. 160
ANNEXURE II: PROPOSED SETHUSAMUDRAM SHIP CHANNEL ALIGNMENT ......................................... 163
ANNEXURE III: DEMOGRAPHY DETAILS OF COASTAL VILLAGES AS PER CENSUS OF INDIA, 2011 ..... 164
ANNEXURE IV: DISTRICTS WISE FISHERMEN AND KEY DETAILS ............................................................ 168
ANNEXURE V: DETAILS OF FISHERMEN POPULATION FOR COASTAL VILLAGES AS PER ..................... 170

EEIIAA RReeppoorrtt FFoorr EExxpplloorraattoorryy DDrriilllliinngg AAccttiivviittiieess IInn NNEELLPP BBlloocckk CCYY--OOSSNN--22000099//22,, GGuullff OOff MMaannnnaarr,,
TTaammiill NNaadduu
P a g e | xii
SSeepptteemmbbeerr 22001144 | OIL
LIST OF FIGURES
FIGURE E-1: LOCATION MAP OF THE BLOCK CY-OSN-2009/2 .............................................................. 1
FIGURE 2-1: LOCATION MAP OF THE BLOCK CY-OSN-2009/2 ........................................................... 11
FIGURE 2-2: MAP INDICATING PROSPECT AREAS & TENTATIVE WELL LOCATIONS IN BLOCK CY-OSN-2009/2 ALONG WITH NEARBY COASTAL AREAS ................................................................. 13
FIGURE 2-3: BLOCK BOUNDARY WITH RESPECT TO COASTAL ZONE MANAGEMENT PLAN MAP ...... 16
FIGURE 2-4: BLOCK BOUNDARY WITH RESPECT TO PROPOSED SETHUSAMUDRAM SHIP CHANNEL
PROJECT ................................................................................................................................................. 19
FIGURE 2-5: IMAGES OF DRILL SHIPS & SEMI-SUBMERSIBLE DRILLING RIG .......................................... 22
FIGURE 2-6: TYPICAL SCHEMATIC OF SUBSEA BLOWOUT PREVENTERS (BOP) SYSTEM ....................... 24
FIGURE 2-7: TYPICAL DRILLING FLUID CIRCULATION SYSTEM ................................................................. 26
FIGURE 2-8: TYPICAL DRILLING RIG MODULE ........................................................................................... 27
FIGURE 3-1: BATHYMETRIC VARIATIONS IN THE BLOCK AREA ................................................................ 37
FIGURE 3-2: WIND PATTERN OF INDIAN OCEAN ...................................................................................... 39
FIGURE 3-3: SCHEMATIC REPRESENTATION OF CURRENTS OBSERVED DURING JANUARY-FEBRUARY
AND JULY-AUGUST ............................................................................................................................... 40
FIGURE 3-4: COASTAL CURRENTS FOR TAMIL NADU COAST DURING SOUTHWEST AND NORTHEAST
MONSOON ............................................................................................................................................ 42
FIGURE 3-5: INTRA-ANNUAL VARIATION IN MAXIMUM WIND WAVE HEIGHT .................................... 42
FIGURE 3-6: MEAN RAINFALL (MM/DAY) .................................................................................................. 43
FIGURE 3-7: MEAN WIND SPEED (M/S) ..................................................................................................... 44
FIGURE 3-8: V COMPONENT OF WIND (M/S) ........................................................................................... 45
FIGURE 3-9: U COMPONENT OF WIND (M/S) ........................................................................................... 46

EEIIAA RReeppoorrtt FFoorr EExxpplloorraattoorryy DDrriilllliinngg AAccttiivviittiieess IInn NNEELLPP BBlloocckk CCYY--OOSSNN--22000099//22,, GGuullff OOff MMaannnnaarr,,
TTaammiill NNaadduu
P a g e | xiii
SSeepptteemmbbeerr 22001144 | OIL
FIGURE 3-10: MEAN AIR TEMPERATURE (ºC) ............................................................................................ 47
FIGURE 3-11: MEAN SEA SURFACE TEMPERATURE (ºC) .......................................................................... 48
FIGURE 3-12: SEA WATER & SEDIMENT SAMPLING LOCATIONS ............................................................ 50
FIGURE 3-13: GOMBR & GOMNP AND PROJECT BLOCK .................................................................... 60
FIGURE 3-14: LOCATION OF LIVE CORALS AROUND GULF OF MANNAR .............................................. 63
FIGURE 3-15: SHORELINE CHANGE DUE TO EROSION/ACCRETION/STABLE COAST IN COASTAL AREAS
NEAR BLOCK CY-OSN-2009/2 ........................................................................................................ 85
FIGURE 6-1: RISK ASSESSMENT METHODOLOGY .................................................................................... 111
FIGURE 6-2: RISK MATRIX & ACCEPTABILITY CRITERIA .......................................................................... 115

EEIIAA RReeppoorrtt FFoorr EExxpplloorraattoorryy DDrriilllliinngg AAccttiivviittiieess IInn NNEELLPP BBlloocckk CCYY--OOSSNN--22000099//22,, GGuullff OOff MMaannnnaarr,,
TTaammiill NNaadduu
P a g e | E-1
SSeepptteemmbbeerr 22001144 | OIL
EEXXEECCUUTTIIVVEE SSUUMMMMAARRYY
1 Introduction
Oil India limited (OIL) is a premier national Oil Company engaged in the business of
Exploration, Production and transportation of Crude Oil and Natural gas. OIL was awarded
the Cauvery offshore block CY-OSN-2009/2 (area: 1621 km²) under NELP VIII bidding round
in the Gulf of Mannar. As Operator with 50% participating interest (PI) with OIL (50%PI), OIL
has a program of drilling six (6) exploratory drilling wells in the above block.
As per the EIA notification 2006 and its amendments, all projects of offshore oil and gas
exploration, development & production are included in Schedule 1(b) in Category A and they
require environmental clearance from Ministry of Environment and Forest (MoEF). OIL had
applied for the Terms of Reference to MoEF in August 2013. The project was discussed in
12th Expert Reconstituted Appraisal Committee (Industry) held during 30th September to 1st
October, 2013. Terms of Reference (ToR) for the preparation of Environmental Impact
Assessment were issued by MoEF to OIL vide letter dated 29th Nov 2013. ToR copy is
attached as Annexure I.
OIL have appointed SENES Consultants India Pvt. Ltd. (SENES India) as environmental
consultant to obtain Environmental Clearance from the Ministry of Environment and Forests
(MoEF) for the proposed activities as per the EIA Notification, 2006. SENES has received QCI-
NABET accreditation (NABET/EIA/RA016/040) for carrying out EIA studies for Category A
projects of “Off shore and on shore oil and gas exploration, development & production”,
valid up to October 08, 2013.
SENES India has undertaken the Environmental Impact Assessment (EIA) study for the
proposed drilling activities based on the ToR issued by MoEF and lays down adequate
measures to ensure that the environmental impacts of the project are adequately mitigated
and risks are under control. The measures have formulated based on assessment of potential
environmental impacts and risks and has been delineated in the form of Environment
Management Plan (EMP).

EEIIAA RReeppoorrtt FFoorr EExxpplloorraattoorryy DDrriilllliinngg AAccttiivviittiieess IInn NNEELLPP BBlloocckk CCYY--OOSSNN--22000099//22,, GGuullff OOff MMaannnnaarr,,
TTaammiill NNaadduu
P a g e | E-2
SSeepptteemmbbeerr 22001144 | OIL
2 Project Details
2.1 Project Locations and Access
The offshore exploratory block lies in the Gulf of Mannar of Cauvery basin in the east coast
of India, Tamil Nadu. The offshore exploratory block lies near Ramanathapuram & Tuticorin
District.
The northeast (Point B) and northwest (Point A) points of the block are located closer to
coast with approximate aerial distance of around 13 km from Dhanushkodi coast and 18 km
from Ervadi coast, respectively. The southeast corner (Point C) is located at approximate
aerial distance of around 43 km from Dhanushkodi coast. The southwest corner (Point F) is
located at approximate aerial distance of around 51 km from Thanichiyam coast.
Nearest Railway stations are Mandapam and Rameshwaram located at approximate aerial
distance of 25 km from block boundary towards north. Tuticorin Port is located at
approximate aerial distance of 72 km from block boundary towards west. The nearest airport
is Madurai which is located at approximate aerial distance of 100 km from nearest coast to
block boundary towards northwest. The Shree Ramanathaswamy Temple in Rameshwaram
and Kothandaramaswamy Temple in Dhanushkodi are located towards north side of coastal
areas of block but these not located on Gulf of Mannar side but are located on Palk Bay side
at approximate aerial distance of 34 km and 30 km respectively from the nearest prospect
area - Prospect Area 3. The Adam's Bridge, also known as Rama's Bridge or Rama Setu is
located at approximate aerial distance of 25 km towards northeast from the nearest prospect
area - Prospect Area 3. Location map of the block is given in figure below.
2.2 Well Locations
Based on the 3D seismic survey, OIL has come up with 6 prospect areas where hydrocarbon
discovery potential is high for exploratory drilling. In each prospect area, tentative well
locations are proposed. Based on the further detailed study, the specific well locations for
exploratory drilling will be established within each of these prospect areas.
Though the nearest land area for block boundary is Dhanushkodi, which is at approximate
aerial distance of 13 km from block boundary (Point B) towards northeast, the nearest
prospect area - Prospect Area 3 to Dhanushkodi town land area is located at approximately
at an aerial distance of 28 km. Thus OIL will not have any drilling activity within 1.0 km
distance from coast line. Based on superimposition of the Coastal Zone Management Plan

EEIIAA RReeppoorrtt FFoorr EExxpplloorraattoorryy DDrriilllliinngg AAccttiivviittiieess IInn NNEELLPP BBlloocckk CCYY--OOSSNN--22000099//22,, GGuullff OOff MMaannnnaarr,,
TTaammiill NNaadduu
P a g e | E-3
SSeepptteemmbbeerr 22001144 | OIL
Maps of Tamil Nadu for Ramanathapuram on the Google Earth image, it is evident that
prospect areas within which wells are proposed to be drilled, are located much beyond 12
Nm from LTL i.e. CRZ IV area. CRZ clearance is therefore not applicable for this project.
2.3 Onshore Support Services for Project
Being an offshore block, exploratory activity will require logistic support from Tuticorin
and/or Kakinada supply base. The logistic support would involve supply of Fuel Oil and fresh
water, storage and transport of drilling related equipment (chemicals, etc), Shipping waste
disposal facilities, Oil spill response facilities and equipment (for contingency management).
2.4 Operational Details
Phases covered by exploratory drilling are 1) MODU mobilization 2) Drilling and well Testing
3) Decommissioning. Drilling activity under normal conditions would be completed in about
90-100 days for each well in the block from the day of spudding in. Drilling will be performed
using a self contained Mobile Offshore Drilling Unit (MODU), Semi-Submersible or drill
ship, capable of performing drilling at water depth in block areas [20m (approx.) to 985m].
Based on discovery of hydrocarbon bearing formations, well testing will be conducted
at such formation to establish hydrocarbon potential in terms of flow rates and reservoir
pressure. Following drilling and well testing activities, wells will be plugged and sealed as per
laid down guidelines of OISD P&NG Rules 2008. Once well has been secured and all
necessary equipment has been retrieved, MODU will be mobilized to the next drill location.

EEIIAA RReeppoorrtt FFoorr EExxpplloorraattoorryy DDrriilllliinngg AAccttiivviittiieess IInn NNEELLPP BBlloocckk CCYY--OOSSNN--22000099//22,, GGuullff OOff MMaannnnaarr,, TTaammiill NNaadduu
P a g e | E-1
SSeepptteemmbbeerr 22001144 | OIL
FIGURE E-1: LOCATION MAP OF THE BLOCK CY-OSN-2009/2

EEIIAA RReeppoorrtt FFoorr EExxpplloorraattoorryy DDrriilllliinngg AAccttiivviittiieess IInn NNEELLPP BBlloocckk CCYY--OOSSNN--22000099//22,, GGuullff OOff MMaannnnaarr,,
TTaammiill NNaadduu
P a g e | E-1
SSeepptteemmbbeerr 22001144 | OIL
3 Baseline Environment
To assess the baseline environmental status of the block, primary monitoring has been
conducted at 6 locations in prospect areas which included 6 marine surface water & 6
sediment samples in the block. Secondary information on meteorology, ecology of Gulf of
Mannar, socio-economic profile of coastal villagers, etc. have been collected from literature
reviews and information available in public domain by various government departments and
agencies.
Average rainfall: Average rainfall of the project area from January 2013 to December 2013,
for the proposed exploratory block is in the range of 4.12 mm to 4.75 mm /day
Mean Wind Speed: mean wind speed measured in m/sec for the period area of January 2013
to December 2013 for the study area lies in the range of 6.25 to 6.75 m/se
Mean Air Temperature: Maximum and minimum value of mean air temperature in the
Arabian Sea is of the order of 30.2 ºC and 24.4 ºC, respectively. Mean air temperature of the
area of exploratory block lies in the range of 26.5 ºC to 27.5 ºC
Mean Sea Surface Temperature: Mean air temperature of the area of exploratory block lies in
the range of 27.75 ºC to 28.05 ºC.
3.1 Marine Water & Sediment Quality
Based on the physico-chemical analysis of marine surface water samples, pH values were in
the range of 7.45 to 8.05. Turbidity of the water samples ranges from 0.9 to 1.5 NTU. Salinity
of sea water sample collected range from 35% to 38 %. Total Suspended Solids (TSS)
ranged from 13 to 20 mg/L. Oil & Grease was found to be within range of 12 to 17 mg/L.
Polycyclic aromatic Hydrocarbons (PAH) were found to be 0.009 to 0.05 mg/L and Total
Petroleum Hydrocarbons (TPH) ranged as 2 to 2.9 ppm. The higher Petroleum Hydrocarbon
values is likely to be a seasonal trend as the area is prone to carrying oily discharges from
ship traffic in Tuticorin as well as Colombo ports.
Based on the physico-chemical analysis of sediment samples, pH of collected sediment
sample was in the range of 7.9 to 8.11. The colour of collected sediment samples was grey
with fishy odour for all the samples. Oil & Grease ranged from 13 mg/L to 20 mg/L and Poly
Cyclic Aromatic Hydrocarbons (PAH) ranged from 0.007 ppm to 0.5 ppm. Total Petroleum
Hydrocarbons (PAH) were found to be in range of 1.95 ppm to 2.6 ppm. The observed

EEIIAA RReeppoorrtt FFoorr EExxpplloorraattoorryy DDrriilllliinngg AAccttiivviittiieess IInn NNEELLPP BBlloocckk CCYY--OOSSNN--22000099//22,, GGuullff OOff MMaannnnaarr,,
TTaammiill NNaadduu
P a g e | E-2
SSeepptteemmbbeerr 22001144 | OIL
concentration of Barium in collected sediment found in range of as 0.2 ppm to 0.35 ppm
whereas the concentration of mercury in collected sample found in below detection limit
(BDL). The petroleum hydrocarbon concentrations in sediments may be mainly from the land
based sources such as municipal waste waters, industrial discharge, urban runoff, river
discharges, ocean dumping and fishing vessels operating in the localized area.
3.2 Biological Environment – Phytoplankton & Zooplankton
Marine surface water samples were analyzed for planktons. Around 26 families of
phytoplanktons were observed with species like Zygnemataceae, Volvocaceae, Naviculaceae,
Pyrocystaceae, Stephanopyxidaceae, Volvocaceae, Naviculaceae, Rhizosoleniacea and
Stephanopvxidaceae. Zooplankton families observed were Bosminidae, Pontellidae,
Lumbriculida, Calanoida, Collothecidae and Asterigerinacea. Phytoplankton and zooplankton
count ranged between 19,000 to 21,000 cells/ml and 1800 to 2000 cells/m3.
Sediment samples were analyzed for presence of benthic species. Prominent macro bethos
species observed were Nephtyidae, Stylasteridae, Ampharetidae, Stylasteridae, Sabellidae.
Carterinidae, Centropagidae, Ammodiscacea, Carterinidae, Acartiidae, Chaetonotidae and
Misophriidae are the prominently observed in Meio bethos. Micro benthos showed presence
of Bacillariaceae, Cercomonadidae and Euglenaceae families.
3.3 Marine Ecology – Gulf of Mannar
Project block is located in Gulf of Mannar (GoM) which has diverse ecology, mainly reported
from the areas closer to Gulf of Mannar Islands. GoM has a chain of 21 islands stretching
from Mandapam to Tuticorin to a distance of 140 km along the coast with total area of 623
hectares which form Gulf of Mannar Marine National Park (GoMNP) and Gulf of Mannar
Biosphere Reserve (GoMBR). GoM shows presence of variety of marine organisms because of
its varied ecosystems of coral reefs, rocky shores, sandy beaches, mud flats, estuaries,
mangrove forests, seaweed stretches and seagrass beds. GoMNP is located away from block
boundary and none of the block area overlaps with GoMNP area. GoMBR boundary passes
through block area on north side. The nearest prospect area located to GoMBR and GoMNP
boundary is Prospect Area 3 with approximate aerial distance of 8 km and 21 km
respectively.
GoM is widely known for presence of coral reefs, which are fringing or patchy reefs thriving
in very shallow waters (20 cm- 5 m) with dominant genera as Pocillopora, Porites, Acropora,

EEIIAA RReeppoorrtt FFoorr EExxpplloorraattoorryy DDrriilllliinngg AAccttiivviittiieess IInn NNEELLPP BBlloocckk CCYY--OOSSNN--22000099//22,, GGuullff OOff MMaannnnaarr,,
TTaammiill NNaadduu
P a g e | E-3
SSeepptteemmbbeerr 22001144 | OIL
Montipora, Favia, Favites, Goniopora, Goniastrea, Platygyra, echinopora, Galaxea, Turbinaria,
Leptoria, Pavona and Pachyseries. Seagrass species like Hydrocharitaceae and
Potamogetonaceae are reported which provide food sources and nursing ground for many
epiphytic fauna and feeding grounds for the Sea Cow - Dugong dugong. Marine algae or
seaweeds species observed in GoM are Gelidiella acerosa, Gracilaria edulis, G. follifera, crassa,
Gracilaria spp.; Hvpnea spp., Acanthophora spp.. Mangroves are observed in coastal area with
dominant genera as Avicennia, Rhizophora, Bruguiera. Around 126 species of plankton and
360 species of zooplanktons are reported. 51 species of foraminiferans, 257 species of
sponges, 14 species of gorgonids, 75 species Polychaeta, 9 species Nematoda, 731 species of
mollusks are reported from GoM. Though pearl yielding species like Pinctada fucata, P.
chemnitzii, P. anomioides, P. atropurpura and Chank varieties like Xancus pyrum are reported
from GoM, their existence has reduced due to trawler operations. Various varieties of crabs,
lobster, prawns, and shrimps are present. There are about 450 species of fishes belonging to
107 families inhabiting the coasts of Gulf of Mannar and Palk Bay. Though dolphins like
Dolphinus delphis, Stenella longirostris, Sousa chinensis and Tursiops truncates are reported in
GoM, no mass landing is reported. A total of 187 species of shore birds including wadors,
terns and gulls were recorded in the Gulf of Mannar, of which 84 were of aquatic species and
the remaining terrestrial. Five species of marine turtles - Chelonia mydas (green turtle),
Hepidochelys olivacea (olive ridley), Caretta caretta (loggerheads turtle), Eretmochelys
imbricata (Hawk bill turtle), Dermochelys coriacea (leather bask turtle) are reported in the
Gulf of Mannar. All are endangered species as per Wildlife (Protection) Act, 1972. Various
studies/reports mentioned in this section indicate turtle occurrence in Gulf of Mannar marine
waters and nearby coastal areas but no specific study/report could be traced indicating turtle
occurrence specific to block area.
Marine capture fishery is the major economic activity of coastal villages located near Gulf of
Mannar. The chief fisheries are the pelagic sardines, seer fish, tunas, mackerel, caranids,
barracudas, wolf herring, full and half beaks, the demersal perches such as sweetlips,
groupers, rock-cods, snappers, goat fishes, croakers, sharks, rays, skates, coral fishes,
threadfin, breams, silverbellies, the shell fishes like chanks, squids, cuttlefish shrimps, crabs
and lobsters.
3.4 Socio-Economic Profile

EEIIAA RReeppoorrtt FFoorr EExxpplloorraattoorryy DDrriilllliinngg AAccttiivviittiieess IInn NNEELLPP BBlloocckk CCYY--OOSSNN--22000099//22,, GGuullff OOff MMaannnnaarr,,
TTaammiill NNaadduu
P a g e | E-4
SSeepptteemmbbeerr 22001144 | OIL
The major towns/villages in nearby coastal areas are Ramanathapuram, Rameshwaram,
Peripattinam, Devipattinam, Sayalgudi, Mandapam, Keelakarai, Muttayyapuram and
Srivaikutram, etc. Fishing, chank and seaweed collection are prominent source of livelihood
in coastal villages with farming practiced in other areas. Salt farming is done majorly in
villages from Tuticorin district compared to Ramanathapuram district villages. The primary
schools are located in every village with higher secondary school within 5 km distance.
Colleges are located at Ramanathapuram, Tuticorin and Mandapam. Though electrify is
supplied to all villages, power cut are very frequent. Public transport is provided to all coastal
villages with frequency of bus at 1 hour. Primary health centers are located in each village
with big hospitals in Ramanathapuram, Tuticorin and Mandapam.
4 Impact Assessment
4.1 Potential Impacts on Noise Quality
Potential impacts on noise quality may arise from air borne noise generated during drilling
operations of rotary drilling equipment as part of rig, diesel engines for power generation
and mud pumps, helicopter movements, leading to perceptible increase in noise levels in
immediate vicinities.
4.2 Potential Impact on Marine Water Quality and Ecology
Activities related to various phases of the proposed drilling like physical presence of MODU,
disposal of drill cuttings and WBM, operational discharges like sanitary waste water, food
waste and residuals, washing fluids (deck drainage, rig floor washing etc), cooling water,
non-routine discharges that may be caused by ballast water, chemical spills has the potential
to impact marine water quality and consequently marine ecology adjacent to the drilling
locations. Some marine water quality impacts will also occur along corridors that are
proposed to be used for providing logistic support to MODU. The non routine discharges
consist of ballast water discharges, flare drop out, chemical spills in sea.
4.3 Impacts on Coastal Ecology
Looking at the existence of commercial fishing activities and presence of Gulf of Mannar
National Park and Gulf of Mannar Biosphere Reserve, any chemical or oil spill may pose
threat to these ecologically important habitats.
4.4 Impact on Socioeconomics Environment

EEIIAA RReeppoorrtt FFoorr EExxpplloorraattoorryy DDrriilllliinngg AAccttiivviittiieess IInn NNEELLPP BBlloocckk CCYY--OOSSNN--22000099//22,, GGuullff OOff MMaannnnaarr,,
TTaammiill NNaadduu
P a g e | E-5
SSeepptteemmbbeerr 22001144 | OIL
The prominent commercial activities in the coastal villages near Block CY-OSN-2009/2 are
fishing and salt production. During exploratory drilling of wells, sea traffic will get marginally
increased due to supply vessels. Probably 1 or 2 vessels/week (as per the requirements) will
voyage from Tuticorin or Kakinada or both supply base to exploration area. But this being a
short term activity, effect on fishing activity in the region will be minimal. Impact on fishing
or salt framing may occur in the event of any accidental oil spill, depending upon severity of
spill.
5 Environmental Management Plan
5.1 OIL Management System
OIL is committed to protect the environment through improving the effectiveness of
management and reporting systems and ensuring the reduction of local environmental
impact from operations by improving environmental performance and implementing
initiatives for the conservation of biodiversity and the resource recovery and reuse. This is
achieved through the implementation of OIL HSE Policy and management system.
5.2 Organization Structure and Responsibility
In addition to regular operational roles & responsibilities defined for the drilling
organization, all personnel directly or indirectly have a role to play towards effective
environment management in the project, by implementing the HSE policy and the
environment management plan. The entire drilling organization will co-operate with
government agencies, regulatory authorities and other stakeholders who may have
environmental concerns associated with the project.
5.3 Management Plans for Environment
Selection of Drilling Location and Navigational Path Ways
Proper site selection and routing of navigational pathway for MODU and supply vessels can
considerably reduce impacts arising out of the proposed project. OIL’s planning team will
work in close co-operation with the HSE Department to look at preventive options early in
the project life cycle based on findings of this EIA study.
Siting of Exploratory Block and Drill Locations

EEIIAA RReeppoorrtt FFoorr EExxpplloorraattoorryy DDrriilllliinngg AAccttiivviittiieess IInn NNEELLPP BBlloocckk CCYY--OOSSNN--22000099//22,, GGuullff OOff MMaannnnaarr,,
TTaammiill NNaadduu
P a g e | E-6
SSeepptteemmbbeerr 22001144 | OIL
At present Gulf of Mannar Biosphere Reserve area is expected to overlap with project block
on north side but no exploratory drilling well is proposed in this region.
Occurrence of sensitive species in close proximity or within the block will also govern the
selection of drilling locations. If sensitive species viz. sea turtles or marine mammals are
observed/anticipated in the block area, their presence will be monitored in accordance with
the international sighting guidelines for marine mammals. Such monitoring will be
conducted before the onset of drilling activities, and will be maintained throughout the
offshore exploratory operations. In areas where significant impacts to sensitive species are
anticipated, experienced observers will be used for the monitoring exercise.
Selection of Navigational Pathway for MODU & Supply Vessels
Appropriate measures will be adopted by the project proponent to avoid migratory routes of
turtles and ecologically and culturally sensitive coastal areas during vessel movement. In
addition, consultations with relevant stakeholders (Directorate of Fisheries, Coast Guard,
government agencies related to Gulf of Mannar, Port Management Board, etc) will be carried
out to aid in the routing of supply vessels from the logistic base. The support vessels will also
have the relevant permits and certifications to comply with the requirements of the
International Maritime Organization for operation in Gulf of Mannar.
Drill Cutting Management
The Hazardous Waste Rules require OIL to analyze the drill cuttings and establish whether
toxicity of constituents is high enough for the waste to be considered as hazardous. The
disposal of the drill cuttings shall also be conforming to the guidelines pertaining to the
“Disposal of Drill Cuttings and Drilling Fluids for Offshore Installations” provided by the
Ministry of Environment & Forests (MoEF) G.S.R. 546(E) August 2005.
Food Waste
Food waste generated from the kitchen will be, at a minimum macerated to levels less than
25 mm as per the MARPOL 73/78 requirements prior to their discharge in the marine
environment. It will also be ensured that cleaning agents (detergents) used in the
accommodation block are fully biodegradable and inspection undertaken on a regular basis
to conform to operability and performance.
Bilge Fluids

EEIIAA RReeppoorrtt FFoorr EExxpplloorraattoorryy DDrriilllliinngg AAccttiivviittiieess IInn NNEELLPP BBlloocckk CCYY--OOSSNN--22000099//22,, GGuullff OOff MMaannnnaarr,,
TTaammiill NNaadduu
P a g e | E-7
SSeepptteemmbbeerr 22001144 | OIL
Bilge waters from machinery spaces in offshore facilities and support vessels will be routed
to the facility closed drainage system, or contained and treated before discharge to meet the
MARPOL 73/78 requirements.
Management of Transport Operation to MODU
Helicopter Operations Management Plan which will delineate operation procedures for
helicopter operations to the MODU helideck would be drawn up and a competent person
would be made responsible for the same. On the land side, necessary coordination would be
established with respective airport authorities from where the helicopters would fly.
Vessel Management Plan will be formulated and implemented to reduce collision risk, both
vessel–vessel and MODU–vessel and a person made responsible for all vessel operations. The
plan would establish a 500 m safety zone around platform, define operational procedures for
approach, movements during bad weather, no go areas, etc.
Management of Occupational Health & Safety Aspects
OIL places high emphasis on health and safety aspects of workers and staff on MODU and
will ensure that all activities will be conducted in a safe and skill full manner with staff
appropriately trained and equipment maintained in safe condition. Safety cases will be
developed for appropriate facilities. Potential health, safety or fire hazards will be removed or
managed, based on risk assessments, safe systems of work, HSE management system
requirements, competency and skills of staff and workers, etc. and would be in line with
requirements specified in the OISD Rules (Chapter VII : Health and Welfare Measures). In
addition OIL would ensure that a trained Medical Officer or Paramedic is available on the
MODU during the drilling activity.
Monitoring Frame Work
OIL’s Internal Management System requires continuous monitoring to be carried out for
various aspects of the project, environmental, safety and health impacts and the
performance of EMP implementation. Monitoring indicators have been developed for each
of the activity considering the mitigation measures proposed. Indicators have been
developed for ascertaining the performance of the EMP implementation through
Environmental Performance Indicators (EPIs). The change in the quality of environment will
be monitored through real time measurements of these parameters will be carried out
during drilling and data will be submitted to MoEF. As per statutory requirements of MoEF,

EEIIAA RReeppoorrtt FFoorr EExxpplloorraattoorryy DDrriilllliinngg AAccttiivviittiieess IInn NNEELLPP BBlloocckk CCYY--OOSSNN--22000099//22,, GGuullff OOff MMaannnnaarr,,
TTaammiill NNaadduu
P a g e | E-8
SSeepptteemmbbeerr 22001144 | OIL
OIL will record daily discharge of drill cuttings & drilling fluids in Sea and also to monitor the
effluent quality. Compliance reports will be submitted to Regulatory Agencies. Monitoring
results would be to be documented, analyzed and reported internally to Offshore Drilling
Supervisor, Wells Operations Manager and HSE Coordinator.

EEIIAA RReeppoorrtt FFoorr EExxpplloorraattoorryy DDrriilllliinngg AAccttiivviittiieess IInn NNEELLPP BBlloocckk CCYY--OOSSNN--22000099//22,, GGuullff OOff MMaannnnaarr,,
TTaammiill NNaadduu
P a g e | 1
SSeepptteemmbbeerr 22001144 | OIL
11 IINNTTRROODDUUCCTTIIOONN
11..11 PPUURRPPOOSSEE
Oil India limited (OIL) is a premier national Oil Company engaged in the business of
Exploration, Production and transportation of Crude Oil and Natural gas. OIL was awarded
the Cauvery offshore block CY-OSN-2009/2 (area: 1621 km²) under NELP VIII bidding round
in the Gulf of Mannar. As Operator with 50% participating interest (PI) with OIL (50%PI), OIL
has a program of drilling six (6) exploratory drilling wells in the above block.
As per the EIA notification 2006 and its amendments, all projects of offshore oil and gas
exploration, development & production are included in Schedule 1(b) in Category A and they
require environmental clearance from Ministry of Environment and Forest (MoEF). OIL had
applied for the Terms of Reference to MoEF in August 2013. The project was discussed in
12th Expert Reconstituted Appraisal Committee (Industry) held during 30th September to 1st
October, 2013. Terms of Reference (ToR) for the preparation of Environmental Impact
Assessment were issued by MoEF to OIL vide letter dated 29th Nov 2013. ToR copy is
attached as Annexure I.
OIL has appointed SENES Consultants India Pvt. Ltd. (SENES India) as environmental
consultant to obtain Environmental Clearance from the Ministry of Environment and Forests
(MoEF) for the proposed activities as per the EIA Notification, 2006. SENES has received QCI-
NABET accreditation (NABET/EIA/RA016/040) for carrying out EIA studies for Category A
projects of “Off shore and on shore oil and gas exploration, development & production”.
SENES India has undertaken the Environmental Impact Assessment (EIA) study for the
proposed drilling activities based on the ToR issued by MoEF and lays down adequate
measures to ensure that the environmental impacts of the project are adequately mitigated
and risks are under control. The measures have been formulated based on assessment of
potential environmental impacts and risks and has been delineated in the form of
Environment Management Plan (EMP).

EEIIAA RReeppoorrtt FFoorr EExxpplloorraattoorryy DDrriilllliinngg AAccttiivviittiieess IInn NNEELLPP BBlloocckk CCYY--OOSSNN--22000099//22,, GGuullff OOff MMaannnnaarr,,
TTaammiill NNaadduu
P a g e | 2
SSeepptteemmbbeerr 22001144 | OIL
11..22 IIDDEENNTTIIFFIICCAATTIIOONN OOFF PPRROOJJEECCTT PPRROOPPOONNEENNTT && PPRROOJJEECCTT
Oil India Limited (OIL) is a National Oil Company engaged in Exploration & Production of
hydrocarbons. The story of Oil India Limited (OIL) traces and symbolizes the development
and growth of the Indian petroleum industry. From the discovery of crude oil in the far east
of India at Digboi, Assam in 1889 to its present status as a fully integrated upstream
petroleum company, OIL has come far, crossing many milestones. In 1981, OIL became a
wholly-owned Government of India enterprise. In a recent CRISIL-India Today survey, OIL was
adjudged as one of the five best major PSUs and one of three best energy sector PSUs in the
country.
Now, OIL intends to carry out drilling of six (6) exploratory drilling wells in the Block CY-OSN-
2009/2 which is located in the Offshore off the coast of Thoothukudi (Tuticorin) in the Gulf of
Mannar. The Block area is around 1621 sq. km. The block has been awarded on by
Government of India under Production Sharing Contract (PSC) in NELP-VIII bidding ground
to Oil India Limited (OIL) with 50% participating interest as operator along with 50%
participating interest of Oil & Natural Gas Corporation Limited (ONGC).
Based on the 3D seismic survey, OIL has come up with 6 prospect areas where hydrocarbon
discovery potential is high and exploratory drilling will be undertaken. Based on further
detailed study, the exact drilling well locations will be finalized in these prospect areas.
Offshore rigs will be deployed for the proposed drilling. One temporary shore base set up
with ware house and office facilities will be installed either at Tuticorin or Kakinada or at
both, to facilitate supply chain for rig operations. The personnel will be transported to the rig
by helicopters and supply boats.
11..33 SSCCOOPPEE OOFF SSTTUUDDYY
This EIA study has been scoped based on ToR assigned by MoEF, OIL and SENES’
understanding of the project, marine physical environment where it will be located and
probable interactions that is expected to occur as a result.
The scope of work for this assignment includes:
• Collate and analyze primary and secondary data on environmental components like meteorology, marine water quality, levels of pollution, marine and coastal ecology, socioeconomic conditions, etc.

EEIIAA RReeppoorrtt FFoorr EExxpplloorraattoorryy DDrriilllliinngg AAccttiivviittiieess IInn NNEELLPP BBlloocckk CCYY--OOSSNN--22000099//22,, GGuullff OOff MMaannnnaarr,,
TTaammiill NNaadduu
P a g e | 3
SSeepptteemmbbeerr 22001144 | OIL
• Assess potential environmental impacts that may arise as a result of the project and evaluate them.
11..44 PPOOIINNTT WWIISSEE CCOOMMPPLLIIAANNCCEE OOFF TTOORR
OIL had applied for ToR to MoEF in August 2013. Terms of Reference (ToR) for the
preparation of Environmental Impact Assessment were issued by MoEF to OIL during the 12th
Reconstituted Expert Appraisal Committee (Industry) held during 30th September to 1st
October, 2013. The salient points of ToR given by MoEF on 29th November, 2013, have been
duly addressed in EIA Report. Summary of the same is given below:
Table 1-1: Compliance with ToR provided by Expert Appraisal Committee of MoEF
S. No.
Points Of TOR Issues Addressed In EIA-EMP and RA Report
1 Executive summary of the project Executive summary included in EIA report
2 No. of exploratory wells for which environmental clearance is accorded and No. of new wells proposed during expansion. Status and No. of the wells which are completed and closed.
No environmental clearance has been accorded so far in this block. OIL plans to drill 6 offshore exploratory wells in the NELP Block CY-OSN-2009/2. Refer Chapter 2 - Project Description
3 Project Description and Project Benefits; The offshore exploratory block CY-OSN-2009/2 covering an area of 1621 sq. km. lies in the Offshore off the coast of Tuticorin in the Gulf of Mannar. OIL plans to drill 6 exploratory wells, which in case of hydrocarbon discovery will help in meeting the energy requirements of the country. Refer Chapter 2 - Project Description and Chapter 8 - Project Benefit
4 Distance from coast line. This project is an Offshore exploratory drilling project. The nearest prospect area is located at an approximate aerial distance of 31 km from nearest coast line. Refer Chapter 2, Section 2.3 – Drilling Well Locations

EEIIAA RReeppoorrtt FFoorr EExxpplloorraattoorryy DDrriilllliinngg AAccttiivviittiieess IInn NNEELLPP BBlloocckk CCYY--OOSSNN--22000099//22,, GGuullff OOff MMaannnnaarr,,
TTaammiill NNaadduu
P a g e | 4
SSeepptteemmbbeerr 22001144 | OIL
S. No.
Points Of TOR Issues Addressed In EIA-EMP and RA Report
5 Commitment for no drilling will be carried within 1.0 Km
The nearest prospect area is located at an approximate aerial distance of 31 km from nearest coast. Thus no drilling will be carried within 1.0 Km from coast. Refer Chapter 2, Section 2.3 – Drilling Well Locations
6 Details of sensitive areas such as coral reef, marine water park, sanctuary and any other eco-sensitive area.
Gulf of Mannar National Park (GoMNP) is located away from block boundary and none of the block area overlaps with GoMNP area. Gulf of Mannar Biosphere Reserve (GoMBR) boundary passes through block area on north side. The nearest prospect area located to GoMBR and GoMNP boundary is Prospect Area 3 with approximate aerial distance of 8 km and 21 km respectively. Refer Chapter 3, section 3.7 Ecologically Sensitive Marine Areas
7 Approval for the forest land from the State/Central Govt. under Forest (Conservation) Act, 1980, if applicable
Being an offshore exploratory drilling project, forest clearance is not applicable.
8 CRZ Clearance as per CRZ notification dated 6th January 2011.
As the project will not involve any construction / operation activities in any CRZ areas and hence CRZ clearance is not applicable. Refer Chapter 2, section 2.11 CRZ Regulation
9 Climatology and meteorology including wind speed, wave and currents, rainfall etc.
Refer Chapter 3, Section 3.4 - Climatology & Meteorology
10 Base line data collection for surface water for one season leaving the monsoon season within 1 km for each exploratory wells, particularly in respect of oil content
Refer Chapter 3, Section 3.8 - Marine Water & sediment Quality
11 Actual source of water and Permission The average daily water consumption will

EEIIAA RReeppoorrtt FFoorr EExxpplloorraattoorryy DDrriilllliinngg AAccttiivviittiieess IInn NNEELLPP BBlloocckk CCYY--OOSSNN--22000099//22,, GGuullff OOff MMaannnnaarr,,
TTaammiill NNaadduu
P a g e | 5
SSeepptteemmbbeerr 22001144 | OIL
S. No.
Points Of TOR Issues Addressed In EIA-EMP and RA Report
for the drawl of water from the Competent Authority. Detailed water balance, waste water generation and discharge.
be 20-30 m3/day for drilling; will be supplied from temporary onshore supply base of OIL. Wastewater generation from the drilling well is expected to be 9 m3/day. Sewage will be treated in a sewage treatment plant (STP). The dirty oil from bilge fluid will be periodically sent to shore in drums or special containers by supply vessels deployed for the purpose. Refer Chapter 2, Section 2.5 - Source of Water & Permission for Drawl of Water, Section 2.6 - Water Balance, Section 2.7 - Wastewater Generation & Discharge
12 Noise abatement measures and measures to minimize disturbance due to light and visual intrusions in case coastally located.
Chapter 4, section 4.2.10 - Noise Abatement Measures and Section 4.2.11 - Measures to minimize disturbance due to light and visual intrusions
13 Procedure for handling oily water discharges from deck washing, drainage systems, bilges etc.
Chapter 7, Section 7.5 - Oily Water Discharges and Other Wastes
14 Procedure for preventing spills and spill contingency plans
Refer Chapter 6, Section 6.1.1.3 - Oil Spill Contingency Plan
15 Procedure for treatment and disposal of produced water
Produced Water from well testing, if carried out, will be stored in storage tanks, gas will be flared, and water will be discharged to sea after treatment. Oil will be transported to base facility. Refer Chapter 4, Section 4.2.9 - Oil Handling From Well Test Operations
16 Procedure for sewage treatment and disposal and also for kitchen waste disposal.
Chapter 4, Section 4.2.6 - Sewage Treatment and Disposal
17 Procedure for handling solid waste and any waste segregation at source for organic, inorganic and industrial waste
Chapter 4, Section 4.2.7 - Solid Waste Handling

EEIIAA RReeppoorrtt FFoorr EExxpplloorraattoorryy DDrriilllliinngg AAccttiivviittiieess IInn NNEELLPP BBlloocckk CCYY--OOSSNN--22000099//22,, GGuullff OOff MMaannnnaarr,,
TTaammiill NNaadduu
P a g e | 6
SSeepptteemmbbeerr 22001144 | OIL
S. No.
Points Of TOR Issues Addressed In EIA-EMP and RA Report
18 Storage of chemicals on site Chapter 2, Section 2.9- Chemical Storage at Rig and In On-Shore Facility
19 Commitment for the use of WBM and synthetic oil based mud in special case
OIL is committed towards using of only Water Based Mud (WBM) for the offshore exploratory drilling operations. However, Low Toxic synthetic oil based mud (LTSOBM) will be used to combat specific hole problems. Refer Chapter 2, Section 2.4 -Technology and Process Description
20 Risk assessment and mitigation measures including whether any independent reviews of well design, construction and proper cementing and casing practices have been followed
Refer Chapter 6, Section 6.1 and Section 6.1.9 - Risk Mitigation Measures
21 Handling of spent oils Chapter 4, Section 4.2.8 - Spent oil Handling
22 Handling of oil from well test operations
Chapter 4, Section 4.2.9 - Oil Handling From Well Test Operations
23 Mud make up and mud and cuttings disposal procedures
The disposal of the drill cuttings will be conforming to the guidelines pertaining to the “Disposal of Drill Cuttings and Drilling Fluids for Offshore Installations” provided by the Ministry of Environment & Forests (MoEF) G.S.R. 546(E) August 2005. Refer Chapter 7, Section 7.4 - Management of Drill Cuttings & Drilling Mud and Section 4.2.1 - Mud make-up and Mud & Cuttings disposal
24 H2S emissions control plans, if required Refer Chapter 6, Section 6.1.10 - H2S Emission Control Plans
25 Details of all environment and safety related documentation within the company in the form of guidelines, manuals, monitoring programs
Chapter 7, Section 7.7 – OIL Management System

EEIIAA RReeppoorrtt FFoorr EExxpplloorraattoorryy DDrriilllliinngg AAccttiivviittiieess IInn NNEELLPP BBlloocckk CCYY--OOSSNN--22000099//22,, GGuullff OOff MMaannnnaarr,,
TTaammiill NNaadduu
P a g e | 7
SSeepptteemmbbeerr 22001144 | OIL
S. No.
Points Of TOR Issues Addressed In EIA-EMP and RA Report
including Occupational Health Surveillance Programme etc.
26 Restoration plans and measures to be taken for decommissioning of the rig and restoration of on-shore support facilities on land
After drilling and initial testing, if the well does not contain commercial quantities of hydrocarbon, the well is plugged and abandoned as per OISD guidelines of P&NG rules 2008. Open rock formations are sealed with cement plugs to prevent upward migration of wellbore fluids. The hazardous waste from onshore support facility - Temporary supply base will be sent to authorized hazardous waste disposal facility. Refer Chapter 4, Section 4.2.2 -Restoration Plans and Rig Decommissioning Measures and Section 4.2.3 - Restoration of on-shore support facilities on-land.
27 Documentary proof for membership of common disposal facilities, if required.
The solid waste generated on the rig will be segregated and stored in colour coded bags. The solid waste will be transported back using support vessels or with the rig, to the temporary supply base of OIL. At Temporary supply base the segregated waste will be treated separately. Hazardous waste, if any, will be sent to authorized hazardous waste recyclers and disposal facility. Refer Chapter 4, Section 4.2.4 - Membership of Common Disposal Facilities
28 Any litigation pending against the project or any directions/order passed by any Court of Law against the project. If so, details thereof.
No
29 Total capital and recurring cost for environmental pollution control
Chapter 7, Section 7.9 - Capital and recurring cost for environmental pollution

EEIIAA RReeppoorrtt FFoorr EExxpplloorraattoorryy DDrriilllliinngg AAccttiivviittiieess IInn NNEELLPP BBlloocckk CCYY--OOSSNN--22000099//22,, GGuullff OOff MMaannnnaarr,,
TTaammiill NNaadduu
P a g e | 8
SSeepptteemmbbeerr 22001144 | OIL
S. No.
Points Of TOR Issues Addressed In EIA-EMP and RA Report
measures. control measures
30 A tabular chart with index for point wise compliance of above TOR.
Chapter 1, Table 1-1

EEIIAA RReeppoorrtt FFoorr EExxpplloorraattoorryy DDrriilllliinngg AAccttiivviittiieess IInn NNEELLPP BBlloocckk CCYY--OOSSNN--22000099//22,, GGuullff OOff MMaannnnaarr,,
TTaammiill NNaadduu
P a g e | 9
SSeepptteemmbbeerr 22001144 | OIL
22 PPRROOJJEECCTT DDEESSCCRRIIPPTTIIOONN
22..11 TTYYPPEE OOFF PPRROOJJEECCTT
The offshore exploration blocks CY-OSN-2009/2 lies in the Gulf of Mannar of Cauvery basin
in the east coast of India. The block has been awarded by Government of India under
Production Sharing Contract (PSC) in NELP-VIII bidding round to Oil India Limited (OIL) with
50% participating interest as operator along with 50% participating interest of Oil & Natural
Gas Corporation Limited (ONGC). The proposed project is offshore exploratory drilling in the
block CY-OSN-2009/2 in the Gulf of Mannar of Cauvery basin in the east coast of India, Tamil
Nadu state. OIL plans to drill 6 offshore exploratory wells in the block CY-OSN-2009/2. Wells
will be located within prospect areas identified based on the interpretation of 3D seismic
data collected.
22..22 LLOOCCAATTIIOONN OOFF PPRROOJJEECCTT
The offshore exploratory block covering an area of 1621 km2 lies in the Gulf of Mannar of
Cauvery basin in the east coast of India, Tamil Nadu. The offshore exploratory block lies near
Ramanathapuram & Tuticorin District.
The northeast (Point B) and northwest (Point A) points of the block are located closer to
coast with approximate aerial distance of around 13 km from Dhanushkodi coast and 18 km
from Ervadi coast, respectively. The southeast corner (Point C) is located at approximate
aerial distance of around 43 km from Dhanushkodi coast. The southwest corner (Point F) is
located at approximate aerial distance of around 51 km from Thanichiyam coast.
Nearest Railway stations are Mandapam and Rameshwaram located at approximate aerial
distance of 25 km from block boundary towards north. Tuticorin Port is located at
approximate aerial distance of 72 km from block boundary towards west. The nearest airport
is Madurai which is located at approximate aerial distance of 100 km from nearest coast to
block boundary towards northwest.

EEIIAA RReeppoorrtt FFoorr EExxpplloorraattoorryy DDrriilllliinngg AAccttiivviittiieess IInn NNEELLPP BBlloocckk CCYY--OOSSNN--22000099//22,, GGuullff OOff MMaannnnaarr,,
TTaammiill NNaadduu
P a g e | 10
SSeepptteemmbbeerr 22001144 | OIL
The Shree Ramanathaswamy Temple in Rameshwaram and Kothandaramaswamy Temple in
Dhanushkodi are located towards north side of coastal areas of block but these not located
on Gulf of Mannar side but are located on Palk Bay side at approximate aerial distance of 34
km and 30 km respectively from the nearest prospect area - Prospect Area 3. The Adam's
Bridge, also known as Rama's Bridge or Rama Setu is located at approximate aerial distance
of 25 km towards northeast from the nearest prospect area - Prospect Area 3.
Location map of the block and the nearby coastal area are given in figure below.

EEIIAA RReeppoorrtt FFoorr EExxpplloorraattoorryy DDrriilllliinngg AAccttiivviittiieess IInn NNEELLPP BBlloocckk CCYY--OOSSNN--22000099//22,, GGuullff OOff MMaannnnaarr,, TTaammiill NNaadduu
P a g e | 11
SSeepptteemmbbeerr 22001144 | OIL
FIGURE 2-1: LOCATION MAP OF THE BLOCK CY-OSN-2009/2

EEIIAA RReeppoorrtt FFoorr EExxpplloorraattoorryy DDrriilllliinngg AAccttiivviittiieess IInn NNEELLPP BBlloocckk CCYY--OOSSNN--22000099//22,, GGuullff OOff MMaannnnaarr,,
TTaammiill NNaadduu
P a g e | 12
SSeepptteemmbbeerr 22001144 | OIL
The geographical coordinates of the CY-OSN-2009/2 exploratory block are provided in the
table below.
Table 2-1: Geographical Coordinates of Block CY-OSN-2009/2
Location Longitude Latitude
Deg Min Sec Deg Min Sec
A 78 50 00 09 04 19.51
B 79 22 11.05 09 04 19.51
C 79 14 09 08 49 21
D 79 03 45 08 47 56
E 78 52 07 08 44 02
F 78 50 00 08 44 5.77
A 78 50 00 09 04 19.51
Based on the 3D seismic survey, OIL has come up with 6 prospect areas where hydrocarbon
discovery potential is high for exploratory drilling. In each prospect area, tentative well
locations are represented in the table below. Based on the further detailed study, the specific
well locations for exploratory drilling will be established within each of these prospect areas.
The geographical range of Prospect Areas is also are represented below.
Table 2-2: Prospect Areas & Tentative Well Locations in Block CY-OSN-2009/2
Prospect Area
Geographical Coordinates of
Tentative Well Locations
Geographical Range of Prospect Areas Approx. Water Depth
for Prospect Area(m) Latitude Range
Longitude Range Latitude Longitude Minimum Maximum
P-1 8° 51’5.644" 78°54’15.31" 8°52'28.39"N 8°48'24.62"N
78°51'47.17"E 78°57'51.34"E
373.16 568.27
P-2 8°55’4" 78°58’33" 8°56'55.24"N 8°53'29.35"N
78°55'6.05"E 79°0'9.76"E
254.68 531.01
P-3 8°57’26.38" 79°16’22.81" 8°59'23.21"N 8°54'40.82"N
79°14'44.83"E 79°18'8.75"E
303.45 544.68
P-4 8°56’45.02" 79°04’57.82" 8°57'13.43"N 8°54'39.77"N
79°1'31.29"E 79°7'19.94"E
370.10 626.0
P-5 8°46’34.113" 78°53’33.117"8°47'43.01"N 8°45'22.57"N
78°52'50.28"E 78°54'31.26"E
644.23 807.06
P-6 8°50’30.8" 79°04’41.9" 8°51'47.93"N 8°48'52.82"N
79°3'35.04"E 79°8'10.42"E
744.51 891.91

EEIIAA RReeppoorrtt FFoorr EExxpplloorraattoorryy DDrriilllliinngg AAccttiivviittiieess IInn NNEELLPP BBlloocckk CCYY--OOSSNN--22000099//22,, GGuullff OOff MMaannnnaarr,, TTaammiill NNaadduu
P a g e | 13
SSeepptteemmbbeerr 22001144 | OIL
FIGURE 2-2: MAP INDICATING PROSPECT AREAS & TENTATIVE WELL LOCATIONS IN BLOCK CY-OSN-2009/2 ALONG WITH NEARBY COASTAL AREAS

EEIIAA RReeppoorrtt FFoorr EExxpplloorraattoorryy DDrriilllliinngg AAccttiivviittiieess IInn NNEELLPP BBlloocckk CCYY--OOSSNN--22000099//22,, GGuullff OOff MMaannnnaarr,,
TTaammiill NNaadduu
P a g e | 14
SSeepptteemmbbeerr 22001144 | OIL
22..33 DDRRIILLLLIINNGG WWEELLLL LLOOCCAATTIIOONNSS
MoEF, through its ToR issued for EIA studies, has sought from OIL a commitment on not
undertaking drilling within 1.0 km from coastline. Though the nearest land area for block
boundary is Dhanushkodi, which is at approximate aerial distance of 13 km from block
boundary (Point B) towards northeast, the nearest prospect area - Prospect Area 3 to
Dhanushkodi town land area is located at approximately at an aerial distance of 28 km. Thus
OIL will not have any drilling activity within 1.0 km distance from coast line. The location of
identified prospect areas and their approximate distance from the nearby coast are given in
table below.
Table 2-3: Block CY-OSN-2009/2 & Distance from Coastline
Prospect Area Approximate Distance From Nearby Coast (Km)
P-1 40
P-2 34
P-3 28
P-4 34
P-5 47
P-6 44
As per provisions of Forest (Conservation) Act, 1980 and its subsequent amendments,
clearance/approval from state/central government is required for diversion of forest land for
non-forestry purposes. Since this project is for offshore exploratory drilling, there is no
diversion of forest and hence forest clearance/approval for the forest land from the
State/Central Govt. under Forest (Conservation) Act, 1980 is not applicable.
There is no litigation pending against the project or any directions/order passed by any
Court of Law against the project.
22..33..11 CCZZRR RReegguullaattiioonn
As per the CRZ Notification, 2011, any activity proposed in CRZ area which is permissible as
per this regulation, needs CRZ clearance from state/central coastal zone management
authority. The Coastal Zone Management Plan Maps of Tamil Nadu for Ramanathapuram

EEIIAA RReeppoorrtt FFoorr EExxpplloorraattoorryy DDrriilllliinngg AAccttiivviittiieess IInn NNEELLPP BBlloocckk CCYY--OOSSNN--22000099//22,, GGuullff OOff MMaannnnaarr,,
TTaammiill NNaadduu
P a g e | 15
SSeepptteemmbbeerr 22001144 | OIL
district are prepared by Department of Environment GIS Cell, Government of Tamil Nadu
which gives the CRZ demarcation with Low Tide Line (LTL).
Based on the superimposition of above mentioned Coastal Zone Management Plan Maps on
the Google Earth image, line delineating distance of 12 Nm from the low tide line (indicating
CRZ IV limit) is projected to assess the CRZ applicability. It is evident that only northwest and
northeast corners of block fall within 12 Nm zone and all 6 prospect areas are located well
beyond 12 Nm from LTL. The nearest prospect area to land i.e. Prospect Area - 3 is located 9
km further away toward sea from the 12 Nm distance line from the coast i.e. CRZ IV area.
Thus the prospect areas within which wells are proposed to be drilled, are located much
beyond 12 Nm from LTL i.e. CRZ IV area. CRZ clearance is therefore not applicable for this
project.
Table 2-4: Prospect Distance From Coast & CRZ line Prospect Location
Approximate Distance From
Nearby Coast 12 Nm Line
Km Nm Km P-1 40 21.6 19
P-2 34 18.4 13
P-3 28 14.6 9
P-4 34 18.4 14
P-5 47 25.4 26
P-6 44 23.7 23

EEIIAA RReeppoorrtt FFoorr EExxpplloorraattoorryy DDrriilllliinngg AAccttiivviittiieess IInn NNEELLPP BBlloocckk CCYY--OOSSNN--22000099//22,, GGuullff OOff MMaannnnaarr,, TTaammiill NNaadduu
P a g e | 16
SSeepptteemmbbeerr 22001144 | OIL
FIGURE 2-3: BLOCK BOUNDARY WITH RESPECT TO COASTAL ZONE MANAGEMENT PLAN MAP

EEIIAA RReeppoorrtt FFoorr EExxpplloorraattoorryy DDrriilllliinngg AAccttiivviittiieess IInn NNEELLPP BBlloocckk CCYY--OOSSNN--22000099//22,, GGuullff OOff MMaannnnaarr,,
TTaammiill NNaadduu
P a g e | 17
SSeepptteemmbbeerr 22001144 | OIL
22..33..22 PPrrooppoosseedd SSeetthhuussaammuuddrraamm SShhiipp CChhaannnneell PPrroojjeecctt
A navigation channel connecting the Gulf of Mannar and Palk Bay through north of Adam's
Bridge has been proposed by Government of India, called as Sethusamudram Ship Channel
Project. This proposed project is envisaged to reduce the steaming distances between the
East and West Coast of India and to improve the navigation within territorial waters of India.
The project was conceptualized with first route proposed in 1961. There were several
changes in alignment of channel due to eco-sensitivity, cost, feasibility, presence of religious
structure – Ram Sethu or Adam’s bridge, etc.
The proposed alignment which has received environmental clearance in 2005 by MoEF
passes through Adam’s bridge. The first phase proposes channel width as 300 m which
eventually can be expanded upto 500 m in third phase.
With proposed involvement of dredging and alignment route passing through Ram Sethu or
Adam’s bridge, various litigations started on the project, which resulted in temporary
suspension of the work. In July 2008, Prime Minister constituted panel headed by TERI
Director General which submitted report in July 2008 saying the project is ecologically and
economically not viable. In Feb 2013 Center rejected the report and decided to go ahead
with the alignment which passes through Adam’s bridge or Ram Sethu. In April 2013, Tamil
Nadu government urged Supreme Court to direct Center government on scrapping the
project. As per the latest proceedings on this, Central Government has taken the stand that
the 'Ram Sethu' or Adam’s bridge will not be broken as there are different geological and
religious theories behind the origin of the bridge. The Central government has certain
"alternatives" in mind and will inform the Supreme Court an option1. Thus there might be
revision in alignment of shipping channel.
Based on the information on present alignment of Sethusamudram Ship Channel available in
public domain and inputs received from Sethusamudram Corporation Ltd., the
Sethusamudram Ship Channel alignment is projected with reference to project block in
1 http://ibnlive.in.com/news/ram-sethu-will-not-be-broken-for-sethusamudram-project-centre/492145-
37-64.html & http://epaper.newindianexpress.com/321474/The-New-Indian-Express-Madurai/15-08-
2014#page/1/2

EEIIAA RReeppoorrtt FFoorr EExxpplloorraattoorryy DDrriilllliinngg AAccttiivviittiieess IInn NNEELLPP BBlloocckk CCYY--OOSSNN--22000099//22,, GGuullff OOff MMaannnnaarr,,
TTaammiill NNaadduu
P a g e | 18
SSeepptteemmbbeerr 22001144 | OIL
figure below. The reference map used for the proposed Sethusamudram Ship Channel
alignment is attached as Annexure II.
It indicates that the proposed Sethusamudram Ship Channel alignment is likely to pass
through the southern part of the project block area. OIL will therefore ensure that any
development with regard to this alignment is monitored and co-ordination with
Sethusamudram Corporation Ltd is also ensured specifically prior to planning any permanent
offshore installations, although no such installations are anticipated during this exploratory
drilling stage of the project.

EEIIAA RReeppoorrtt FFoorr EExxpplloorraattoorryy DDrriilllliinngg AAccttiivviittiieess IInn NNEELLPP BBlloocckk CCYY--OOSSNN--22000099//22,, GGuullff OOff MMaannnnaarr,, TTaammiill NNaadduu
P a g e | 19
SSeepptteemmbbeerr 22001144 | OIL
FIGURE 2-4: BLOCK BOUNDARY WITH RESPECT TO PROPOSED SETHUSAMUDRAM SHIP CHANNEL PROJECT

EEIIAA RReeppoorrtt FFoorr EExxpplloorraattoorryy DDrriilllliinngg AAccttiivviittiieess IInn NNEELLPP BBlloocckk CCYY--OOSSNN--22000099//22,, GGuullff OOff MMaannnnaarr,,
TTaammiill NNaadduu
P a g e | 20
SSeepptteemmbbeerr 22001144 | OIL
22..33..33 PPrrooppoosseedd PPrroojjeecctt SScchheedduullee
The project activities lifecycle for the proposed offshore drilling project has been divided into
three phases- Mobilization of drilling rig, Drilling and finally Decommissioning. Drilling
activity under normal conditions would be completed in about 90-100 days for each well in
the block from the day of spudding in.
The wells drilled will be tested by perforation in the production casing if sufficient indications
of the hydrocarbons presence are noticed. The well will be sealed off for further
development upon discovering it as a successful hydrocarbon bearing structure.
22..44 TTEECCHHNNOOLLOOGGYY AANNDD PPRROOCCEESSSS DDEESSCCRRIIPPTTIIOONN
The different phases covered for the exploratory drilling are
• Mobilization of the drilling rigs
• Drilling and testing
• Decommissioning
These phases are explained in the subsequent sections
Drilling and Testing Phase
Exploitation of hydrocarbons requires the construction of a conduit between offshore
platform and reservoir. This is achieved by the drilling process. Offshore exploration wells will
be drilled using a rig and equipped with a Top Drive System for rotating the drilling string
including the drilling bit.
There are two basic categories of offshore drilling rigs those that can be moved from place
to place, allowing for drilling in multiple locations (Mobile Offshore Drilling Unit), and those
rigs that are temporarily or permanently placed on a fixed-location platform (Platform Rigs).
In view of drilling of 6 wells, OIL will use Mobile Offshore Drilling Unit.
Mobile Offshore Drilling Unit (MODU): MODUs are drilling rigs that are used exclusively to
drill offshore and that float either while drilling or when being moved from location to
another. They fall into two general types: bottom-supported and floating drilling rigs.

EEIIAA RReeppoorrtt FFoorr EExxpplloorraattoorryy DDrriilllliinngg AAccttiivviittiieess IInn NNEELLPP BBlloocckk CCYY--OOSSNN--22000099//22,, GGuullff OOff MMaannnnaarr,,
TTaammiill NNaadduu
P a g e | 21
SSeepptteemmbbeerr 22001144 | OIL
Bottom-supported drilling rigs are barges or jack-ups. Floating drill rigs include submersible
and semi-submersible units and drill ships.
Depending on the water depth in block area [20m (approx.) to 985m] and the wells to be
drilled, Semi-Submersible or drill ships would be a suitable option.
Semi-submersible drilling rigs are the common type of offshore floating drilling rigs and can
operate in deep water and usually tugged from location to location with the help of tug-
vessel. They partially flood their pontoons for achieving the desired height above the water
and to establish stability. It can be held in place over the location by mooring lines attached
to seafloor anchors or may be held in place by adjustable thrusters (propellers) which are
rotated to hold the vessel over the desired location.
Drill ships are large ships designed for offshore drilling operations and can operate in
deepwater. They are built on traditional ship hulls and move from location to location under
their own power. It uses the dynamic positioning system or Anchor-mooring system for
maintaining their position over the drilling location. Because of their large sizes, drillships can
work for extended periods without the need for constant resupply.
Mobilization of MODU involves navigation and positioning of the drilling rig over the
selected location. The MODU will sail from a location external to the block. One of the
possible locations can be from Tuticorin which is located at approximate aerial distance of 75
km towards west from nearest Prospect Area 5. However, the actual navigational route will
be decided upon understanding of the shipping lanes and traffic volume of existing
international shipping routes in the region. Marine environmental sensitivities, will also be
taken into account prior to the finalization of the MODU navigational route. Once MODU has
reached the exploratory well location, positioning will be accomplished with dynamic
propulsion (thrusters) or Anchor mooring.

EEIIAA RReeppoorrtt FFoorr EExxpplloorraattoorryy DDrriilllliinngg AAccttiivviittiieess IInn NNEELLPP BBlloocckk CCYY--OOSSNN--22000099//22,, GGuullff OOff MMaannnnaarr,,
TTaammiill NNaadduu
P a g e | 22
SSeepptteemmbbeerr 22001144 | OIL
FIGURE 2-5: IMAGES OF DRILL SHIPS & SEMI-SUBMERSIBLE DRILLING RIG
An opening called moon pool is equipped in the centre of the drill ship from the main deck
to the water. Drilling assembly, riser joints, Blowout Preventer (BOP), wellhead equipment,
etc. are lowered through the moon pool to the sea floor to facilitate the drilling
process. The marine riser system consists of riser joints, riser tensioners and ancillary
equipment. The riser joints are connected to the top of sub- sea BOP and are pulled up by
the riser tensioning system onboard to keep a vertical configuration. The riser joints serve as
a conduit for returning drilling mud to surface from borehole and as guide for running drill
string and casing from the rig to the hole below seafloor.
Initial Well Construction
Offshore wells are drilled in sections, with the diameter of each section decreasing with
increasing depth. Lengths and diameters of each section are determined prior to drilling and
depend on geological conditions through which the well is to be drilled. The conduit or pipe
section will be set in place by jetting operations. Drilling starts with spudding a hole of
diameter 26" on the sea bed, followed by lining it with a metal casing of 20". The above
structural hole section is likely to be drilled using sea water. Next hole will be of 20”, 17-1/2",
14.3/4”, 12.1/4”, 8.1/2” & 6” diameter and casings/ Liners will be 16”, 13-3/8", 11.3/4”, 9.5/8”,
7”, & 4.1/2” respectively. There may be changes in casing policy depending on the
characteristics of each well for well integrity.
Due to the absence of the riser system acting as a conduit to return the mud to the rig
during structural hole drilling prior to installation of well-head to cemented casing, cuttings
generated will be discharged onto at seabed. The metal casing is cemented into place by

EEIIAA RReeppoorrtt FFoorr EExxpplloorraattoorryy DDrriilllliinngg AAccttiivviittiieess IInn NNEELLPP BBlloocckk CCYY--OOSSNN--22000099//22,, GGuullff OOff MMaannnnaarr,,
TTaammiill NNaadduu
P a g e | 23
SSeepptteemmbbeerr 22001144 | OIL
pumping cement down the hole through the casing or conductor using a high pressure
cementing pump. The casing helps to maintain borehole stability and reduces fluid loses
from the well bore into the surrounding formations. In addition, the uppermost section of
casing also provides a firm base for the Well-head, BOP Stack & Marine Risers.
Surface casing is cemented up to sea floor. Cementing of the casing not only helps to seal
off the weaker shallow formations and prevents hole collapse, but it also protects the hole
from formation pressures damaging the casing and retards erosion by minimizing contact
between the casing and corrosive formation fluids.
This is followed by the installation of well head equipment and marine riser including BOP
thereby connecting the well to the rig. A Blowout Preventer (BOP) is a large underwater
control valve that prevents high pressure from the water and oil from escaping the well while
drilling. The release of this pressure is called a “blowout” and can result in a violent
explosion. If there is not a BOP present, oil and gas would be released directly into the sea
causing large scale damage to the environment. If a blowout were to occur with a BOP in
place, giant valves inside it seal off the well, containing any excessive pressure and putting it
back into the ground. Maintaining the BOP and continually testing it is a very high priority
for both OIL and its drilling contractor.
The BOP is placed on top of the wellhead (the top of the well), which is why it is important to
make sure the casing is properly cemented in place. A marine riser is a type of offshore
drilling tool that is used as a temporary extension connecting the well to the rig.

EEIIAA RRee
As drill
and the
“cutting
and out
riser an
surface
potenti
As each
smaller
Mud Sy
During
to the d
eeppoorrtt FFoorr EExxpp
FIGURE 2-
pipe is low
en further d
gs” that are
t through t
nd back to
in order to
ally contam
h section is
diameter se
ystem and
drilling ope
drilling bit a
pplloorraattoorryy DDrr
-6: TYPICAL S
wered down
down into th
e being chip
the drill bit.
the surface
o be dispos
minated cutt
drilled, cas
ection. Ope
d Cuttings
erations, the
and returns
rriilllliinngg AAccttiivvii
SCHEMATIC OF
through th
he well, dril
pped away
. The mud e
e of the oi
sed of. Prop
ings will no
sing is run
erations con
e drilling flu
s at the dril
iittiieess IInn NNEELLPP
TTaammiill NNaadduu
F SUBSEA BLO
he marine r
ll fluid or m
when drille
eventually c
l rig. The m
perly dispo
ot affect the
and cemen
ntinue in thi
uid (or mud)
ll pipe – ca
PP BBlloocckk CCYY--OO
uu
OWOUT PREV
riser, throug
mud (fluid th
ed) is pump
circulates a
marine riser
sing of the
local marin
ted into pla
s way until
) is pumped
sing annulu
OOSSNN--22000099//22
SS
ENTERS (BOP
gh the BOP,
hat helps cle
ped back up
round up t
r brings the
e cuttings is
ne life.
ace ready f
target dept
d through th
us up to su
//22,, GGuullff OOff MM
P a
SSeepptteemmbbeerr 2200
P) SYSTEM
, into the w
ear the rock
p through t
through the
ese cuttings
s important
for drilling t
th is reached
he drill strin
rface back
MMaannnnaarr,,
g e | 24
001144 | OIL
wellhead,
k bits or
the pipe
e marine
s to the
t so that
the next
d.
ng down
into the

EEIIAA RReeppoorrtt FFoorr EExxpplloorraattoorryy DDrriilllliinngg AAccttiivviittiieess IInn NNEELLPP BBlloocckk CCYY--OOSSNN--22000099//22,, GGuullff OOff MMaannnnaarr,,
TTaammiill NNaadduu
P a g e | 25
SSeepptteemmbbeerr 22001144 | OIL
circulation system after separation of drill cuttings /solids through solids control equipment.
Drilling fluid is essential to drilling operations in order to:
• Control down-hole pressure
• Lift soil/rock cuttings from the bottom of the borehole and carry them to settling pit
• Allow cuttings to drop in the mud pit so that they are not re-circulated (influenced by
mud thickness, flow rate in settling pits and shape/size of pits)
• Prevent cuttings to settle rapidly.
• Particles on the borehole wall to prevent caving and to ensure that the upward flowing
stream of drilling fluid does not erode the adjacent formation.
• Seal the borehole wall to reduce fluid loss. (Formation of filter cake)
• Cool and clean the drill bit and lubricate drill bit, bearings, mud pumps and drill pipes
OIL is committed towards using only Water Based Mud (WBM) for the offshore exploratory
drilling operations. However, Low Toxic synthetic oil based mud (LTSOBM) will be used to
combat specific hole problems. Water-based mud is made up of clay (bentonite) and water;
it may include barite, a heavy mineral used as to add weight. Chemical additives are mixed in
to stabilize the drilling fluid during use, and to reduce corrosion and bacterial activity. Some
chemicals, called coagulants thicken and others, known as anticoagulants, thin the mud.
Water-based mud is increasingly used for most offshore wells and in the shallower parts of
deep wells. Chemical additives viz. glycols and salts may be used in conjunction to mitigate
potential problems related to hydrate formation.
The mud to be used will be continuously tested for its density, viscosity, yield point, water
loss, pH value etc. to ensure that drilling operations are successful and continued without
any down-hole complication. The mud will be prepared onsite (drill location) using
centrifugal pumps, hoppers and treatment tanks. In order to take care of situations like mud
losses to formations and to contain abnormal well activity due to flow of oil or gas, standard
practice will be adopted and mud amounting to 1.5 times of the hole volume will be kept
ready as “Reserve Mud”.
During drilling activity, cuttings will be generated due to crushing action of the drill bit.
These cuttings will be removed by pumping drilling fluid into the well via triplex mud pumps.
The mud used during such operation will flush out formation cuttings from the well hole.

EEIIAA RReeppoorrtt FFoorr EExxpplloorraattoorryy DDrriilllliinngg AAccttiivviittiieess IInn NNEELLPP BBlloocckk CCYY--OOSSNN--22000099//22,, GGuullff OOff MMaannnnaarr,,
TTaammiill NNaadduu
P a g e | 26
SSeepptteemmbbeerr 22001144 | OIL
Cuttings will be then separated from drilling mud using solids- control equipment. This will
comprise of a stepped system of processes consisting of linear motion vibrating screens
called shale shakers, hydro-cyclones (including de- sanders and de-silters), and centrifuges
to mechanically separate cuttings from the mud. Thoroughly washed drill cuttings, separated
from mud will be discharged off- shore into sea intermittently. An estimated average volume
of 300 m3 of drill cuttings per well and 5-10 KL/day of drilling fluid waste is likely to be
generated. Once cuttings have been separated, drilling fluid used for the drilling operations
will be processed or reused after further treatment for the maximum possible extent.
The whole process by which drilling fluid will be reused during drilling operations is
commonly known as a “closed loop mud circulating system.” This system is ideal for drilling
operations in sensitive environments as it reduces the total water consumption for
formulation of drilling mud and it saves on consumption of chemicals. The unusable portion
of mud will be discharged off shore into sea intermittently so as to have proper dilution and
dispersion without any adverse impact on marine environment.
FIGURE 2-7: TYPICAL DRILLING FLUID CIRCULATION SYSTEM
Typical drill rig module is shown in Figure below.

EEIIAA RReeppoorrtt FFoorr EExxpplloorraattoorryy DDrriilllliinngg AAccttiivviittiieess IInn NNEELLPP BBlloocckk CCYY--OOSSNN--22000099//22,, GGuullff OOff MMaannnnaarr,,
TTaammiill NNaadduu
P a g e | 27
SSeepptteemmbbeerr 22001144 | OIL
FIGURE 2-8: TYPICAL DRILLING RIG MODULE
The time taken to drill a bore hole depends on the depth of the hydrocarbon bearing
formation and the geological conditions, but it is commonly of the order of one or two
months. Where hydrocarbon formations is found, initial well tests, possibly lasting another
month, are conducted to establish flow rates and formation pressure. These tests may
generate oil, gas and formation water, each of which needs to be disposed of.
After drilling and initial testing, the rig is usually moved to the next site after ensuring that
the well has been plugged and sealed as per laid down guidelines of OISD P&NG Rules 2008.
If the exploratory drilling has discovered commercial quantities of hydrocarbons, a wellhead
valve assembly may be installed. If the well does not contain commercial quantities of
hydrocarbon, the well is plugged and abandoned as per OISD guidelines of P&NG rules
2008. Open rock formations are sealed with cement plugs to prevent upward migration of
wellbore fluids. In addition to common requirements the following apply to well suspensions.
• A corrosion cap will be run and the well head filled with hydraulic oil.

EEIIAA RReeppoorrtt FFoorr EExxpplloorraattoorryy DDrriilllliinngg AAccttiivviittiieess IInn NNEELLPP BBlloocckk CCYY--OOSSNN--22000099//22,, GGuullff OOff MMaannnnaarr,,
TTaammiill NNaadduu
P a g e | 28
SSeepptteemmbbeerr 22001144 | OIL
22..55 SSOOUURRCCEE OOFF WWAATTEERR && PPEERRMMIISSSSIIOONN FFOORR DDRRAAWWLL OOFF WWAATTEERR
Water requirement in a drilling rig is mainly meant for preparation of drilling mud apart from
washings and domestic use. While the former consumes the majority of water requirement,
the water requirement for domestic and wash use is very less. The average daily water
consumption will be 20-30 m3 /day for drilling. The potable and drill water shall be supplied
from shore base by supply vessels. The shore base will be set up apart from this; the offshore
drilling unit shall have its own water maker which can be source of water for drill fluid. For
this, the onshore base will be setup in Tuticorin or Kakinada area. Thus the water required for
project will be taken from Tuticorin or Kakinada.
22..66 WWAATTEERR BBAALLAANNCCEE
The average daily water consumption will be 20-30 m3 /day for drilling including water
requirement for mud preparation, washing and domestic activities. Wastewater generation
from the proposed drilling activity will be from domestic activity @ 80 percent of the
domestic water requirement and from washing @100 percent of the washing water
requirement. Thus, wastewater generation from the drilling well is expected to be 9 m3/day.
Table 2-5: Water Balance
Sr. No Particulars Water Requirement (m3/day)
Water Requirement
1 Mud preparation 20
2 Washing activities 5
3 Domestic purpose 5
Total water requirement 30
Wastewater generation
1 Domestic activity 4
2 Washing 5
Total Wastewater Generation 9
22..77 WWAASSTTEEWWAATTEERR GGEENNEERRAATTIIOONN && DDIISSCCHHAARRGGEE
Waste water generated at the rig will be of three types and its disposal methodologies are
explained in the subsequent sections.

EEIIAA RReeppoorrtt FFoorr EExxpplloorraattoorryy DDrriilllliinngg AAccttiivviittiieess IInn NNEELLPP BBlloocckk CCYY--OOSSNN--22000099//22,, GGuullff OOff MMaannnnaarr,,
TTaammiill NNaadduu
P a g e | 29
SSeepptteemmbbeerr 22001144 | OIL
The International Convention for the Prevention of Pollution from Ships (MARPOL) is the
main international convention covering prevention of pollution of the marine environment
by ships. The Convention includes regulations aimed at preventing and minimizing pollution
from ships - both accidental pollution and that from routine operations MARPOL has been
updated by amendments through the years and the rig to be used will always have certified
and annually endorsed by Classification society for compliance.
Procedure for disposal of Drill cutting wash-water has been furnished subsequently in the
paragraph 7.4 of Section-7 (EMP).
22..77..11 BBiillggee FFlluuiiddss
Bilge fluids are a mix of sea water, petroleum products and other brackish material that
settles to the bottom of a ship. The collection and disposal system for this fluid will be done
in compliance with the International Convention for Prevention of Pollution from Ships,
1973 as modified by the protocol of 1978 (MARPOL 73/78). Bilge fluids mainly constituting
of water, diesel and oil. The rig will be having provision to collect bilge fluids into a sludge
tank and then to a water/oil separator. Separated oil will then be diverted into "dirty oil"
tank, where also exhaust oil coming from engine lubricant change is collected.
The dirty oil will be periodically sent to shore in drums or special containers by supply vessels
deployed for the purpose. Separated water can be directly discharged overboard, provided
that oil content does not exceed 15 ppm as per MARPOL standards.
22..77..22 DDeecckk DDrraaiinnaaggee
Drainage water generated from precipitation or routine operations, such as deck, rig floor
and equipment cleaning will be routed to separate drainage systems on the rig. This includes
drainage water from process areas that could be contaminated with oil and drainage water
from non-process areas.
These waste fluids will be collected by gravity in a tank and subsequently pumped into tanks
installed below the main deck. The tank will be periodically emptied, pumping waste fluid to
the supply vessel for shipment to shore. When possible, waste water can also be recycled
to condition new mud and hence may be connected to tanks of the mud circulating
system.

EEIIAA RReeppoorrtt FFoorr EExxpplloorraattoorryy DDrriilllliinngg AAccttiivviittiieess IInn NNEELLPP BBlloocckk CCYY--OOSSNN--22000099//22,, GGuullff OOff MMaannnnaarr,,
TTaammiill NNaadduu
P a g e | 30
SSeepptteemmbbeerr 22001144 | OIL
22..77..33 GGrreeyy aanndd BBllaacckk WWaatteerr
Grey and Black Water will be generated from showers, toilets, laundry and kitchen facilities
on the rig and will primarily contain waste material, paper, soap etc. Rig operations will
typically result in the generation of sewage and wastes. Once collected through headers,
they will be passed through a sewage treatment plant (STP). The wastes will then be passed
through a screen of less than 25 mm diameter and an extended aeration system prior to
their discharge into the marine environment. In this case also, sewerage treatment on-site
will be done in compliance with MARPOL 73/78 requirements.
22..88 NNOOIISSEE GGEENNEERRAATTIIOONN
Major noise generating sources during offshore drilling and testing activities will:
• Rotary drilling equipment as part of rig;
• Diesel engines for power generation;
• Mud pumps;
• Cranes and material handling equipment;
• Supply vessels and helicopter movement
As drilling activity is continuous, part of noise associated with the functioning of rig and
ancillaries will be generated only during drilling hours.
Sound pressure levels associated with drilling are the highest with maximum broadband (10
Hz to 10 kHz) energy of about 190 dB re 1μPa @ 1 m2.
22..99 CCHHEEMMIICCAALL SSTTOORRAAGGEE AATT RRIIGG AANNDD IINN OONN--SSHHOORREE FFAACCIILLIITTYY
Chemicals are required for preparation of WBM, giving the drilling mud the desired
characteristics to facilitate drilling at different locations. A variety of drilling chemicals and
additives will be stored on the drilling rig, with storage places clearly marked with safe
operating facilities and practices. Some of the common drilling and cementing fluid
2 Sources of Anthropogenic Sound in the Marine Environment by John Hildebrand, Scripps Institution of Oceanography, University of California San Diego, La Jolla, CA 92093-0205

EEIIAA RReeppoorrtt FFoorr EExxpplloorraattoorryy DDrriilllliinngg AAccttiivviittiieess IInn NNEELLPP BBlloocckk CCYY--OOSSNN--22000099//22,, GGuullff OOff MMaannnnaarr,,
TTaammiill NNaadduu
P a g e | 31
SSeepptteemmbbeerr 22001144 | OIL
chemicals likely to be used during the drilling phase includes cement, surfactants, de-
foamers, lignin, inorganic salts, bentonite and barite.
Table 2-6: Common Chemicals Likely to be used for Preparation of Drilling Fluids
S. No. Name of Chemical S. No. Name of Chemical 1 Barytes 20 Mod. Guar Gum 2 Bentonite 21 PAC-LV 3 Biocide 22 PAC-RG 4 Cal. Carb, Coarse 23 PGS 5 Lime Stone Powder (Marble) 24 PHPA 6 Cal. Carb, micronised 25 Pot. Chloride 7 Cal.Chloride 26 Resinated Lignite 8 Caustic Soda 27 Saw Dust 9 Citric Acid 28 Sodium Bicarbonate 10 CMC 29 Soda Ash 11 Common Salt 30 Sp. Fluid (N.W.) 12 Defoamer 31 Sp. Fluid (W) 13 Drilling Detergent 32 Sul. Asphalt 14 E.P. Lube 33 Thermogel 15 HEC 34 Walnut Shell 16 Hydrated Lime 35 XC-Polymer 17 Ironite Sponge 36 Zinc Carbonate 18 Lignite 37 Glycol 19 Mica Flakes 38 SOBM
22..1100 PPRROOJJEECCTT NNEEEEDD && BBEENNEEFFIITTSS
The hydrocarbons sector plays vital role in the economic growth of the country. Oil and gas
continue to play a pre-eminent role in meeting the energy requirements of the country.
Growth of the economy would lead automatically to growth in energy consumption, as there
is a direct correlation between the GDP and energy consumption. Therefore, the
hydrocarbon sector is most crucial for determining the energy security for the country.
As per the Hydrocarbons Vision – 2025 of the Ministry of Petroleum & Natural Gas, Govt. of
India, one of the aspects is – ‘to assure energy security by achieving self-reliance through
increased indigenous production and investment in equity oil abroad.’ The medium term
objective for Exploration and Production Sector includes:

EEIIAA RReeppoorrtt FFoorr EExxpplloorraattoorryy DDrriilllliinngg AAccttiivviittiieess IInn NNEELLPP BBlloocckk CCYY--OOSSNN--22000099//22,, GGuullff OOff MMaannnnaarr,,
TTaammiill NNaadduu
P a g e | 32
SSeepptteemmbbeerr 22001144 | OIL
• Continue exploration in producing basins.
• Aggressively pursue extensive exploration in non-producing and frontier basins for knowledge building' and new discoveries, including in deep-sea offshore areas.
The rapid economic growth of the country and rising population result in the considerable
increase in demand of petroleum products. The gap between supply and availability of crude
oil, petroleum products as well as gas from indigenous sources is likely to increase over the
years. As there is huge gap between our requirement and domestic availability of
hydrocarbon, considerable amount of our financial resources are consumed to meet the
growing oil and gas requirements of our country. The growing demand and supply gap
would require increasing emphasis to be given to the exploration and production sector. At
present, India meets about 30% of petroleum requirements from all of its resources. A
considerable amount of our financial resources are consumed to meet the growing oil and
gas requirements of our country. It is, therefore, essential to expedite exploration activities to
minimize our dependence on the imports and to ensure the energy security of our country.
In view of the unfavorable demand-supply balance of hydrocarbons in the country, OIL has
been intensifying the E&P activities in Indian basins to enhance the domestic availability of
oil and gas as well as by acquiring equity in oil and gas assets overseas with a focus on oil
security.
The project block comes in Cauvery basin which is Category I basin with proven commercial
productivity and thus success of discovering hydrocarbon pools is maximum in these basins.
Thus in view of possibility of tapping valued hydrocarbon production, this offshore
exploratory project is of domestic and national importance.

EEIIAA RReeppoorrtt FFoorr EExxpplloorraattoorryy DDrriilllliinngg AAccttiivviittiieess IInn NNEELLPP BBlloocckk CCYY--OOSSNN--22000099//22,, GGuullff OOff MMaannnnaarr,,
TTaammiill NNaadduu
P a g e | 33
SSeepptteemmbbeerr 22001144 | OIL
33 BBAASSEELLIINNEE EENNVVIIOORRMMEENNTT
33..11 IINNTTRROODDUUCCTTIIOONN
This chapter describes the existing environmental settings in the block CY-OSN-2009/2 and
its immediate surroundings. This includes the various environmental components comprising
of physico-chemical aspects related to marine water & sediment, biological environment,
and socio-economic aspects of nearby villages.
Attributes of the physical environment like surface water & sediment within the blocks were
assessed primarily through collection and analysis of surface water & sediment samples
collected from the block. The surface water samples analysis was carried out by MoEF
recognized laboratory under the guidance and supervision of SENES. Records and literature
available in public domain were studied for collecting the information about physical and
ecological features of marine and coastal environment, mainly for the block area and nearby
marine and coastal areas. Additionally, socioeconomic data have been obtained from the
Census of India reports.
33..22 SSTTUUDDYY AARREEAA AANNDD SSTTUUDDYY PPEERRIIOODD
The offshore exploratory block CY-OSN-2009/2 lies in the Gulf of Mannar near Tamil Nadu
coast. As per the ToR issued by MoEF for the block CY-OSN-2009/2, base line data was
collected through primary sampling & analysis for surface water & sediment for one season
within each prospect area, particularly in respect of oil content was collected during June,
2014.
The block area, nearby marine areas - Gulf of Mannar, legally protected and regulated areas
– Gulf of Mannar National Park (GoMNP) and Gulf of Mannar Biosphere Reserve (GoMBR)
and coastal villages along the nearby coast were considered as study area for data related to
climatology, meteorology, ecological and social aspects. These details were collected from
various secondary sources such as various studies and documents which were available in
public domain. The details related to fishing and socio-economic conditions of nearby
fishermen villages were collected through discussions with relevant stakeholders.

EEIIAA RReeppoorrtt FFoorr EExxpplloorraattoorryy DDrriilllliinngg AAccttiivviittiieess IInn NNEELLPP BBlloocckk CCYY--OOSSNN--22000099//22,, GGuullff OOff MMaannnnaarr,,
TTaammiill NNaadduu
P a g e | 34
SSeepptteemmbbeerr 22001144 | OIL
33..33 SSTTUUDDYY CCOOMMPPOONNEENNTTSS
Components studied for the EIA study of the proposed exploratory block include Climate &
Meteorology, Physico-chemical parameters of sea surface water & sediment, ecologically
sensitive marine areas and socio-economic status of the nearby coastal villages. The details
of the study parameters, its study area and study components are given in table below.
Table 3-1: Details of Study Components, Study Area and Study Parameter
Sr. No.
Study Components Study Area Study Parameters
1 Climate & Meteorology CY-OSN-2009/2 block area and Gulf of Mannar
Wind Pattern, Ocean Current, Rainfall
2 Physico-chemical & Biological
Characteristics Of Marine Surface Water
For surface marine water sampling, a location in each of the six prospect areas was
selected which would be representative of that
prospect area, and also the 1 km zone around possible well locations within these
prospect areas.
Physico-chemical parameter - pH, Conductivity, Salinity, Total
Suspended Solids, Turbidity, Oil & Grease, Poly Cyclic Aromatic
Hydrocarbons (PAH), Total Petroleum
Hydrocarbons
Ecological parameter- phytoplankton & zooplankton
3 Physico-chemical & Biological
Characteristics Of Sea Sediment
For sediment sampling, a location in each of the six
prospect areas was selected which would be
representative of that prospect area, and also the 1
km zone around possible well locations within these
prospect areas.
pH, Colour, Odour, Oil & Grease, Poly Cyclic Aromatic Hydrocarbons (PAH),
Total Petroleum Hydrocarbons, Barium, Mercury
Ecological parameter – macro, meio and micro benthos
4 Ecology CY-OSN-2009/2 Block Area And Gulf Of Mannar
Marine ecology for Gulf of Mannar and areas near the block
Marine sensitive areas:
Gulf of Mannar National Park (GoMNP) and Gulf of Mannar Biosphere Reserve (GoMBR)
5 Socioeconomic Details Coastal villages near CY-OSN-2009/2 block area
Commercial activities in the coastal areas, Work profile, demographic
details , etc.

EEIIAA RReeppoorrtt FFoorr EExxpplloorraattoorryy DDrriilllliinngg AAccttiivviittiieess IInn NNEELLPP BBlloocckk CCYY--OOSSNN--22000099//22,, GGuullff OOff MMaannnnaarr,,
TTaammiill NNaadduu
P a g e | 35
SSeepptteemmbbeerr 22001144 | OIL
33..44 SSTTUUDDYY MMEETTHHOODDOOLLOOGGYY
Primary environmental data on surface marine water & sediment components of the block
has been based on monitoring carried out by SENES through marine sampling exercise.
SENES had engaged MoEF recognized laboratory for collection and analysis of surface
marine water & sediment samples from the blocks. The marine surface water sample
collection and analysis of physico-chemical parameters was done using a mechanized fishing
boat, from the period of 18th to 20th June 2014. The details about socioeconomic profile of
the area, fishing details, ecological profile of the areas were collected through field visits and
discussions with representatives from Department of Fisheries, North & South
Ramanathapuram, Department of Fisheries, Rameshwaram, Ramnad District Fishermen Co-
operative Federation Ltd., Gulf of Mannar Forest Department and villagers from coastal areas
like Periyapattinam, Chinna Erwadi and Dhanuskodi.
The details of environmental components relevant to areas near block were collected from
secondary information source. The important secondary sources of information used are
Scientific Information on Gulf of Mannar by Gulf of Mannar Marine Biosphere Reserve Trust,
August 2006, Database On Coastal Information Of Tamil Nadu by Environmental Information
System (ENVIS) Centre, January 2008, Resources Information System For Gulf of Mannar by
Integrated Marine And Coastal Area Management Project Directorate, Department of Ocean
Development, April, 2001, Census of India, etc. The block is located close to proposed
Sethusamudram Ship Channel project. Being located closer to proposed block, details
available in the Environmental Impact Assessment (EIA) reports prepared by National
Environmental Engineering Research Institute (NEERI) in August 2004 were refereed as
secondary source. Apart from this various other research papers, studies, reports were
referred which are listed in concerned sections/details.
Secondary information on meteorology, ambient air quality, coastal area and ocean
hydrography have been collected from literature reviews and information made available in
public domain by government departments/local agencies. For certain aspects, data available
from standard databases like the Indian National Ocean Information Services (INCOIS),
Physical Sciences Division, Earth System Research Laboratory, NOAA, etc. has been collated.
Though no specific study/report was found pertaining to block area, the above mentioned
studies/reports/publications which were found to be more relevant to nearby marine and
coastal areas are used in this report.

EEIIAA RReeppoorrtt FFoorr EExxpplloorraattoorryy DDrriilllliinngg AAccttiivviittiieess IInn NNEELLPP BBlloocckk CCYY--OOSSNN--22000099//22,, GGuullff OOff MMaannnnaarr,,
TTaammiill NNaadduu
P a g e | 36
SSeepptteemmbbeerr 22001144 | OIL
33..55 BBAASSEELLIINNEE EENNVVIIRROONNMMEENNTT FFOORR EENNVVIIRROONNMMEENNTTAALL CCOOMMPPOONNEENNTTSS
33..55..11 BBaatthhyymmeettrryy aanndd SSeeaabbeedd MMoorrpphhoollooggyy
The architecture of the eastern continental margin of India is likely to have been influenced
in the geological past by several episodes of rifting, and continental break-up. The eastern
continental margin is a non-volcanic passive margin. The CY-OSN-2009/2 block is located in
the continental slope of India with water depth of the block ranging as 20m (approx.) to
985m below the sea level.

EEIIAA RReeppoorrtt FFoorr EExxpplloorraattoorryy DDrriilllliinngg AAccttiivviittiieess IInn NNEELLPP BBlloocckk CCYY--OOSSNN--22000099//22,, GGuullff OOff MMaannnnaarr,, TTaammiill NNaadduu
P a g e | 37
SSeepptteemmbbeerr 22001144 | OIL
FIGURE 3-1: BATHYMETRIC VARIATIONS IN THE BLOCK AREA
Source: OIL, Seismic Survey

EEIIAA RReeppoorrtt FFoorr EExxpplloorraattoorryy DDrriilllliinngg AAccttiivviittiieess IInn NNEELLPP BBlloocckk CCYY--OOSSNN--22000099//22,, GGuullff OOff MMaannnnaarr,,
TTaammiill NNaadduu
P a g e | 38
SSeepptteemmbbeerr 22001144 | OIL
33..66 GGEEOOLLOOGGYY AANNDD SSEEDDIIMMEENNTTOOLLOOGGYY
The project block comes in Cauvery Basin. According to the Directorate General of
Hydrocarbons, the Cauvery Basin is a pericratonic rift basin situated on eastern continental
margin of India. Towards southern tip it continues into the Kerela-Konkan basin. The Cauvery
Basin contains a series of horst and graben features with the grabens filled with Mesozoic
sediments. Tertiary sedimentation followed with thick wedges accumulating along an
eastward sloping platform. The continental slope sediments are clayey silts with abundant
carbonate content. Megascopic description of deep sea cores available at the Lamont-
Doherty Earth Observatory (LDEO) Deep Sea Sample Repository for the area between
07.570N and 09.050N latitudes and 78.230E and 79.540E at average sea depth of 2795
metres suggest presence of sandy mud, 15% clay and 90% sand. It consists of abundant
foraminifera and their fragments, less abundant Radiolaria, rare quartz and plant debris,
and trace echinoid spines, volcanic glass, diatoms, sponge spicules, mica, graphite or
molybdenite, dark minerals and pyrite and 5% coarse fraction. The carbonate content of the
clay is nil.
33..66..11 CClliimmaattee aanndd HHyyddrroollooggyy ooff GGuullff ooff MMaannnnaarr
The Gulf of Mannar experiences a tropical climate. The southwest monsoon contributes only
very little towards the annual rainfall. Rainfall is moderate to heavy during October and
December under the spell of northeast monsoon. The mean annual rainfall varies from
762mm to 1270mm. The period from January to May is marked by hot climate. The coldest
climate is December having a minimum of 25°C.
The ocean currents in Gulf of Mannar are swift. The sea is rough between April and August
and calm during September. It will be stormy during June to August. The tidal amplitude is
about half a meter. The GOM is influenced by both southwest and northeast monsoons and
hence the physical, chemical and biological characteristics are different from other areas.
Light penetration also varies from season to season. Secchi-disc value of 7.5m is common in
the inshore region. During summer, calm weather conditions exist and the euphotic zone is
known to go even beyond 100m depth. During monsoon period (July- September), water
becomes turbid and the secchi-disc values can become 2m or less. Temperature oscillation is
unique in GOM, steadily increases from January to April reaching upto 32°C and declines till

EEIIAA RReeppoorrtt FFoorr EExxpplloorraattoorryy DDrriilllliinngg AAccttiivviittiieess IInn NNEELLPP BBlloocckk CCYY--OOSSNN--22000099//22,, GGuullff OOff MMaannnnaarr,,
TTaammiill NNaadduu
P a g e | 39
SSeepptteemmbbeerr 22001144 | OIL
August. The wind velocity is generally high and is north/northeasterly from June to
December and westerly during the rest of the period. The wind speed is lowest (6.9km/hr) in
November and highest (17.6km/hr) in August3.
The drainage system consists of Vaigai, Gundar, Vembar, Vaippar rivers and their tributaries.
All the rivers are non-perennial which get waters only during rainy season.
33..66..22 WWiinndd PPaatttteerrnnss
The winds over the Indian sea reverse direction twice a year. Over the north Indian Ocean,
they generally blow from the southwest during May–September (summer monsoon) and
from the northeast during November–February (winter monsoon), March–April and October
being the months of transition with weak winds. The winds are much stronger during the
summer monsoon than during the winter monsoon.
FIGURE 3-2: WIND PATTERN OF INDIAN OCEAN
3 Database On Coastal Information Of Tamilnadu, Institute For Ocean Management Anna University Chennai, 2008

EEIIAA RReeppoorrtt FFoorr EExxpplloorraattoorryy DDrriilllliinngg AAccttiivviittiieess IInn NNEELLPP BBlloocckk CCYY--OOSSNN--22000099//22,, GGuullff OOff MMaannnnaarr,,
TTaammiill NNaadduu
P a g e | 40
SSeepptteemmbbeerr 22001144 | OIL
33..66..33 CCiirrccuullaattiioonn aanndd CCuurrrreennttss
The most significant large-scale currents known in the Indian sea are the open-ocean,
seasonally reversing monsoon currents. During the summer monsoon, the monsoon current
flows eastward as a continuous current from the western Arabian Sea to the Bay of Bengal;
during the winter monsoon, it flows westward, from the eastern boundary of the bay to the
western Arabian Sea. These currents are called the Summer Monsoon Current and Winter
Monsoon Current (WMC), respectively.
The West India Coastal Current (WICC) flows northward during November-February and
southward during April-September. At the time of formation of the northward (southward)
phase of the current, a high (low) in sea level - the Lakshadweep High (Low), forms off south-
western India, and migrates westward across the Arabian Sea. The annual cycle of the WICC
and that of the Lakshadweep High/Low arise from a set of circumstances that are special to
the North India Ocean. As a result, its wind-driven near-surface circulation consists primarily
of annual and semi-annual long, equatorially-trapped Kelvin and Rossby waves, and
coastally-trapped Kelvin waves.
FIGURE 3-3: SCHEMATIC REPRESENTATION OF CURRENTS OBSERVED DURING JANUARY-FEBRUARY AND JULY-AUGUST

EEIIAA RReeppoorrtt FFoorr EExxpplloorraattoorryy DDrriilllliinngg AAccttiivviittiieess IInn NNEELLPP BBlloocckk CCYY--OOSSNN--22000099//22,, GGuullff OOff MMaannnnaarr,,
TTaammiill NNaadduu
P a g e | 41
SSeepptteemmbbeerr 22001144 | OIL
The currents identified are: South Equatorial Current (SEC); South Equatorial Counter Current
(SECC); Northeast and Southeast Madagascar Current (NEMC and SEMC); East Africa Coastal
Current (EACC); Somali Current (SC), Southern Gyre (SG), Great Whirl (GW), and associated
upwelling wedges (in blue); Socotra Eddy (SE); Ras al Hadd Jet (RHJ) and upwelling wedge off
Oman; West India Coastal Current; Lakshadweep Low (LL); East India Coastal Current (EICC);
Southwest Monsoon Current (SMC); Sri Lanka Dome (SD); and, Leeuwin Current (LC). Also
shown are transports in Sv (106 m3 s-1) across sections shown as red lines. {Source: Schott
and McCreary (2001)}.
The coastal currents that are prevalent along the Tamil Nadu coast are of two types. The
notherly drift during the months of May to October and the southerly drift during November
to March. The figures illustrated below provides a general indication of the sea currents
during the Southwest and Northeast monsoons.

EEIIAA RReeppoorrtt FFoorr EExxpplloorraattoorryy DDrriilllliinngg AAccttiivviittiieess IInn NNEELLPP BBlloocckk CCYY--OOSSNN--22000099//22,, GGuullff OOff MMaannnnaarr,,
TTaammiill NNaadduu
P a g e | 42
SSeepptteemmbbeerr 22001144 | OIL
FIGURE 3-4: COASTAL CURRENTS FOR TAMIL NADU COAST DURING SOUTHWEST AND NORTHEAST MONSOON
Source: Oil Spill Contingency Plan for the Coastal State Of Tamil Nadu
33..66..44 WWaavveess
The winds blowing over the ocean surface has the direct effect on wave generation as it is
related to wind speed, extent of fetch and wind duration. The oceanographic pattern along
the Indian coastal region is dominated by three seasons, viz. southwest monsoon (June to
September), northeast monsoon (October to January) and fair weather period (February to
May). The wind speed is lowest (6.9 km/hr) in November and highest (17.6 km/hr) in August.
Tropical storms known as cyclones frequently occur in the Bay of Bengal during October to
January. In eastern coast, the wave activity is significant both during southwest and northeast
monsoons. The measured significant wave height and the intra- annual variation in
maximum wave height are given below.
FIGURE 3-5: INTRA-ANNUAL VARIATION IN MAXIMUM WIND WAVE HEIGHT

EEIIAA RReeppoorrtt FFoorr EExxpplloorraattoorryy DDrriilllliinngg AAccttiivviittiieess IInn NNEELLPP BBlloocckk CCYY--OOSSNN--22000099//22,, GGuullff OOff MMaannnnaarr,,
TTaammiill NNaadduu
P a g e | 43
SSeepptteemmbbeerr 22001144 | OIL
33..77 CCLLIIMMAATTOOLLOOGGYY && MMEETTEEOORROOLLOOGGYY
Climate and meteorology of a place can play an important role in the implementation of any
project. Meteorology (weather and climate) plays a key role in understanding local air quality
as there is an essential relationship between meteorology and atmospheric dispersion
involving the wind speed/direction, stability class and other factors. The block falls in the Gulf
of Mannar. The Gulf of Mannar experiences a tropical climate. The northeast monsoon in
October to December contributes majorly to rainfall. The mean annual rainfall varies from
762mm to 1270mm. The period from January to May is marked by hot climate. The coldest
climate is December having a minimum of 25°C. The ocean currents in Gulf of Mannar are
swift. The sea is rough between April and August and calm during September. The tidal
amplitude is about half a meter.
Average Rainfall: Average rainfall of the project area from January 2013 to December
2013, for the proposed exploratory block is in the range of 4.12 mm to 4.75 mm /day as per
‘Physical Sciences Division, Earth System Research Laboratory, NOAA, Boulder, Colorado,
from their Web site. Figure given below reciprocates the mean rainfall of the area in mm/day.
FIGURE 3-6: MEAN RAINFALL (MM/DAY)
Project Block

EEIIAA RReeppoorrtt FFoorr EExxpplloorraattoorryy DDrriilllliinngg AAccttiivviittiieess IInn NNEELLPP BBlloocckk CCYY--OOSSNN--22000099//22,, GGuullff OOff MMaannnnaarr,,
TTaammiill NNaadduu
P a g e | 44
SSeepptteemmbbeerr 22001144 | OIL
Mean Wind Speed: As per Physical Sciences Division, Earth System Research Laboratory,
NOAA, Boulder, Colorado, from their Web site at http://www.esrl.noaa.gov/psd/, mean wind
speed measured in m/sec for the period of January 2013 to December 2013for the study
area lies in the range of 6.25 to 6.75 m/sec. Figure given below shows the mean wind speed
(m/s) of the Gulf of Mannar showing tentative location of block.
FIGURE 3-7: MEAN WIND SPEED (M/S)
“V” component of Wind: "V" component represents the north-south component. The
positive V component answer indicates a southerly component to the wind, or in other
words, a wind that blows from south to north. A negative V component would mean that the
wind is blowing from north to south. Mean value of v component of wind, averaged over
January 2013 to December 2013 in the region of proposed exploratory block lies in the range
of -0.75m/s to 0.12 m/s as per ‘Physical Sciences Division, Earth System Research Laboratory,
Project Block

EEIIAA RReeppoorrtt FFoorr EExxpplloorraattoorryy DDrriilllliinngg AAccttiivviittiieess IInn NNEELLPP BBlloocckk CCYY--OOSSNN--22000099//22,, GGuullff OOff MMaannnnaarr,,
TTaammiill NNaadduu
P a g e | 45
SSeepptteemmbbeerr 22001144 | OIL
NOAA, Boulder, Colorado. Figure below shows the V component of wind speed (m/s)
showing the tentative location of block.
FIGURE 3-8: V COMPONENT OF WIND (M/S)
“U” Component of Wind: The "U" component represents the east-west component of the
wind. The minus sign in front of the U component answer indicates an easterly component
to the wind, or in other words, a wind that blows from east to west. A positive U component
would mean that the wind is blowing from west to east. According to Physical Sciences
Division, Earth System Research Laboratory, NOAA, Boulder, Colorado. Mean value of u
component of wind, averaged over January 2013 to December 2013 in the region of
proposed exploratory block lies in the range of 0.25 m/s to 0.65 m/s. Figure given below
shows the U component of wind speed (m/s) of the Gulf of Mannar indicating the tentative
location of block.
Project Block

EEIIAA RReeppoorrtt FFoorr EExxpplloorraattoorryy DDrriilllliinngg AAccttiivviittiieess IInn NNEELLPP BBlloocckk CCYY--OOSSNN--22000099//22,, GGuullff OOff MMaannnnaarr,,
TTaammiill NNaadduu
P a g e | 46
SSeepptteemmbbeerr 22001144 | OIL
FIGURE 3-9: U COMPONENT OF WIND (M/S)
Mean Air Temperature: Mean air temperature in project area is in the range of 27.4 ºC and
27.9 ºC as per data available with Physical Sciences Division, Earth System Research
Laboratory, NOAA, Boulder, Colorado. Figure given below indicates the mean air
temperature of the Gulf of Mannar showing tentative location of block.
Project Block

EEIIAA RReeppoorrtt FFoorr EExxpplloorraattoorryy DDrriilllliinngg AAccttiivviittiieess IInn NNEELLPP BBlloocckk CCYY--OOSSNN--22000099//22,, GGuullff OOff MMaannnnaarr,,
TTaammiill NNaadduu
P a g e | 47
SSeepptteemmbbeerr 22001144 | OIL
FIGURE 3-10: MEAN AIR TEMPERATURE (ºC)
Mean Sea Surface Temperature: Mean sea surface temperature in the project area is in
the range of Mean sea surface temperature in the project area is in the range of 27.75 ºC to
28.05 ºC as per data available with Physical Sciences Division, Earth System Research
Laboratory, NOAA, Boulder, Colorado. Figure given below indicates the mean sea surface
temperature of the Gulf of Mannar showing tentative location of block.
Project Block

EEIIAA RReeppoorrtt FFoorr EExxpplloorraattoorryy DDrriilllliinngg AAccttiivviittiieess IInn NNEELLPP BBlloocckk CCYY--OOSSNN--22000099//22,, GGuullff OOff MMaannnnaarr,,
TTaammiill NNaadduu
P a g e | 48
SSeepptteemmbbeerr 22001144 | OIL
FIGURE 3-11: MEAN SEA SURFACE TEMPERATURE (ºC)
33..88 MMAARRIINNEE WWAATTEERR && SSEEDDIIMMEENNTT QQUUAALLIITTYY
The planned exploratory drilling operations in the block have the potential to affect marine
water & sediment quality and consequently the ecology that it supports. Resultantly,
sufficient importance has been given to the collection of environmental baseline data both
from primary and secondary sources to assess the prevailing quality of marine water &
sediment quality in the block and more specifically at the probable drilling locations. Primary
samples for surface water & sediments have been collected and analyzed by MoEF
recognized laboratory under the guidance and supervision of SENES during June, 2014.
Based on the 3D seismic survey, OIL has come up with 6 prospect areas where hydrocarbon
discovery potential is high for exploratory drilling. In each prospect area, tentative well
locations are proposed. Based on the further detailed study, the specific well locations for
Project Block

EEIIAA RReeppoorrtt FFoorr EExxpplloorraattoorryy DDrriilllliinngg AAccttiivviittiieess IInn NNEELLPP BBlloocckk CCYY--OOSSNN--22000099//22,, GGuullff OOff MMaannnnaarr,,
TTaammiill NNaadduu
P a g e | 49
SSeepptteemmbbeerr 22001144 | OIL
exploratory drilling will be established within each of these prospect areas. For surface
marine water and sediment sampling, a location in each of the six prospect areas was
selected which would be representative of that prospect area, and also the 1 km zone
around possible well locations within these prospect areas. The table below represents the
geographical coordinates of sampling locations.
Table 3-2: Sea Water & Sediment Sampling Locations Details
Prospect Area
Sampling Location
Latitude (N) Longitude (E)
P-1 W1 8°51'4.63" 78°54'31.13" P-2 W2 8°54'54.76" 78°58'5.41" P-3 W3 8°57'15.67" 79°16'9.45" P-4 W4 8°56'45.89" 79°4'26.43" P-5 W5 8°46'11.02" 78°53'14.42" P-6 W6 8°50'56.78" 79°4'25.75"

EEIIAA RReeppoorrtt FFoorr EExxpplloorraattoorryy DDrriilllliinngg AAccttiivviittiieess IInn NNEELLPP BBlloocckk CCYY--OOSSNN--22000099//22,, GGuullff OOff MMaannnnaarr,, TTaammiill NNaadduu
P a g e | 50
SSeepptteemmbbeerr 22001144 | OIL
FIGURE 3-12: SEA WATER & SEDIMENT SAMPLING LOCATIONS

EEIIAA RReeppoorrtt FFoorr EExxpplloorraattoorryy DDrriilllliinngg AAccttiivviittiieess IInn NNEELLPP BBlloocckk CCYY--OOSSNN--22000099//22,, GGuullff OOff MMaannnnaarr,,
TTaammiill NNaadduu
P a g e | 51
SSeepptteemmbbeerr 22001144 | OIL
33..88..11 PPhhyyssiiccoo--CChheemmiiccaall AAssppeeccttss –– SSeeaa WWaatteerr && SSeeddiimmeenntt
Sea Surface Water
In a coastal segment, marine water is subjected to several types of uses. Depending on the
types of uses and activities, water quality criteria have been specified by Ministry of
Environment and Forests (MoEF)’ Notification, to determine its suitability for particular purpose.
Among the various types of uses there is one use that demands highest level of water
quality/purity and that is termed as “designated best use” in that stretch of the coastal segment.
Since the sea water samples were collected from deep offshore locations, with least distance
from coast as 30 km, these standards cannot be applied for the marine water samples.
Pollution due to oil exploration and mining, oil refining, oil transportation, oil spills and bilge
discharge from ships and fishing trawlers, as well as from petrochemical industries, is also
present in some locations such as Tamil Nadu and Andaman and Nicobar islands4. The Bay of
Bengal has been estimated to receive around 4 x 10⁶ t/y of petroleum annually, respectively
from routine discharges from oil tankers and other ships plying the shipping lanes originating
from the Middle East. The range of concentrations of dissolved hydrocarbons in the Bay of
Bengal is 0.2 to 8.2 ppb with an average of 4.6 ppb.
Based on the physico-chemical analysis of marine surface water samples, pH values were in the
range of 7.45 to 8.05. Turbidity of the water samples ranges from 0.9 to 1.5 NTU. Salinity of sea
water sample collected range from 35% to 38 %. Total Suspended Solids (TSS) ranged from 13
to 20 mg/L. Oil & Grease was found to be within range of 12 to 17 mg/L. Conductivity of the
samples range from 63 to 63.7 mS/cm. Polycyclic aromatic Hydrocarbons (PAH) were found to
be 0.009 to 0.05 mg/L and Total Petroleum Hydrocarbons (TPH) ranged as 2 to 2.9 ppm.
Results of analysis of sea water samples are shown in Table below.
Table 3-3: Sea Water Analysis Data
S No.
Parameter Unit W1 W2 W3 W4 W5 W6
1 pH - 7.9 8.0 7.8 7.45 8.05 7.91
2 Conductivity mS/cm 63.2 63.7 63.1 63.7 63.3 63.0
3 Salinity % 37 37 35 36 38 38
4 BOBLME (2011) Country report on pollution – India. BOBLME‐2011‐Ecology‐07

EEIIAA RReeppoorrtt FFoorr EExxpplloorraattoorryy DDrriilllliinngg AAccttiivviittiieess IInn NNEELLPP BBlloocckk CCYY--OOSSNN--22000099//22,, GGuullff OOff MMaannnnaarr,,
TTaammiill NNaadduu
P a g e | 52
SSeepptteemmbbeerr 22001144 | OIL
S No.
Parameter Unit W1 W2 W3 W4 W5 W6
4 Total Suspended
Solids
mg/l 20 15 13 14 14 17
5 Turbidity NTU 1 0.9 1.0 1.3 1.1 1.5
6 Oil & Grease mg/l 15 15 12 14 17 15
7 Poly Cyclic Aromatic
Hydrocarbons (PAH)
ppm 0.03 0.05 0.01 0.02 0.04 0.009
8 Total Petroleum
Hydrocarbons
ppm 2.3 2.8 2.0 2.5 2.9 2.2
Petroleum Hydrocarbon values in the block area varied between 2 to 2.9 ppm and seem to be
much higher in comparison with other areas5 in India, as PHc values along the Tamil Nadu coast
in (Feb 2011) were observed in the range of 2.28 to 14.02 ppb, while along the Bassein-Mumbai
coast PHc values were in the range of 2.9 t0 39.2 ppb. This is likely to be a seasonal trend as the
area is prone to carrying oily discharges from ship traffic in Tuticorin as well as Colombo ports.
Attempts to source COMAPS data for PHc in coastal waters of Tuticorin and Mandapam were
also made with INCOIS which is central repository for this data, but further comparative analysis
could not be made as INCOIS did not provide the requested data during the EIA study period.
Sediment
Quality of marine sediments can be considered to be important as the drilling activities and
subsequent dumping of drill cuttings has the potential to directly impact it. Contamination of
sediments can affect the aquatic food chain in the bathypelagic (aphotic) zone where no light
penetrates resulting in adverse impacts to the deep sea ecosystem.
The sediment samples were analyzed for various parameters and the results of the same are
presented here. pH of collected sediment sample was in the range of 7.9 to 8.11. The colour of
collected sediment samples was grey with fishy odour for all the samples. Oil & Grease ranged
5 Veerasingam, S., Venkatachalapathy, R., Raja, P., Sudhakar, S., Rajeswari, V., Asanulla, R. M., . & Sutharsan, P. (2011). Petroleum hydrocarbon concentrations in ten commercial fish species along Tamilnadu coast, Bay of Bengal, India. Environmental Science and Pollution Research, 18(4), 687-693.

EEIIAA RReeppoorrtt FFoorr EExxpplloorraattoorryy DDrriilllliinngg AAccttiivviittiieess IInn NNEELLPP BBlloocckk CCYY--OOSSNN--22000099//22,, GGuullff OOff MMaannnnaarr,,
TTaammiill NNaadduu
P a g e | 53
SSeepptteemmbbeerr 22001144 | OIL
from 13 mg/L to 20 mg/L and Poly Cyclic Aromatic Hydrocarbons (PAH) ranged from 0.007 ppm
to 0.5 ppm. Total Petroleum Hydrocarbons (PAH) were found to be in range of 1.95 ppm to 2.6
ppm. The observed concentration of Barium in collected sediment found in range of as 0.2 ppm
to 0.35 ppm whereas the concentration of mercury in collected sample found in below
detection limit (BDL). Results of analysis of sediment samples are shown in Table below.
Table 3-4: Sediment Analysis Result
S No.
Parameter Unit W1 W2 W3 W4 W5 W6
1 pH - 7.9 8.2 8.4 8.21 8.25 8.11 2 Colour - Grey Grey Grey Grey Grey Grey 3 Order - Fish
odour Fish odour
Fish odour
Fish odour
Fish odour
Fish odour
4 Oil & Grease mg/l 18 20 14 17 15 13 5 Poly Cyclic
Aromatic Hydrocarbons (PAH)
ppm 0.05 0.5 0.03 0.025 0.007 0.04
6 Total Petroleum Hydrocarbons
ppm 2.1 2.6 2.2 2.3 2.15 1.95
7 Barium ppm 0.28 0.31 0.25 0.2 0.35 0.30
8 Mercury ppm BDL BDL BDL BDL BDL BDL
BDL: Below Detection Limit
Concentration of Petroleum Hydrocarbons in the study area (1.95 to 2.6 ppm) are found to be
comparable to those along the Northern Tamil Nadu coast of Bay of Bengal which in the range
of 1.48 to 4.23 ppm6. The petroleum hydrocarbon concentrations in the Arabian sea along the
Indian coast ranged between 0.6 to 5.8 ppm, while the concentrations near the Bassein-Mumbai
coast was in the range of 7 to 38.2 ppm. Similarly oil & grease content in the marine sediment
samples collected as part of this study is found to be high and in the range of 13 mg/l to 20
mg/l, which is comparable to the oil & grease content found in sediment samples taken along
the proposed Sethusamudram alignment while conducting EIA study for the project.
There is no report on natural oil seeps and accidental oil spills reported near the study area in
recent past. Therefore these petroleum hydrocarbon concentrations may be mainly from the
6 Subramanian Veerasingam, Pitchaikkaran Raja, Ramdoss Venkatachalapthy, Rajarethinam Mohan & Palanivel
Sutharsan, Distribution Of Petroleum Hydrocarbon Concentrations In Coastal Sediments Along Tamilnadu Coast, India.
Carpathian Journal of Earth and Environmental Sciences, October 2010, Vol. 5, No. 2, p. 5 - 8

EEIIAA RReeppoorrtt FFoorr EExxpplloorraattoorryy DDrriilllliinngg AAccttiivviittiieess IInn NNEELLPP BBlloocckk CCYY--OOSSNN--22000099//22,, GGuullff OOff MMaannnnaarr,,
TTaammiill NNaadduu
P a g e | 54
SSeepptteemmbbeerr 22001144 | OIL
land based sources such as municipal waste waters, industrial discharge, urban runoff, river
discharges, ocean dumping and fishing vessels operating in the localized area.
33..88..22 EEccoollooggiiccaall AAssppeeccttss –– SSeeaa WWaatteerr && SSeeddiimmeenntt
Planktons
Plankton are microscopic organisms that float freely with oceanic currents and in other bodies
of water. Plankton is made up of tiny plants (called phytoplankton) and tiny animals (called
zooplankton). The word plankton comes from the Greek word "planktos" which means
"drifting." Phytoplankton are primary producers (also called autotrophs). As the base of the
oceanic food web, phytoplankton use chlorophyll to convert energy (from sunlight), inorganic
chemicals (like nitrogen), and dissolved carbon dioxide gas into carbohydrates. Zooplankton are
microscopic animals that eat other plankton. Phytoplankton are the most important primary
producers in the ocean. Small zooplankton consume phytoplankton. Larger organisms eat the
small zooplankton. Larger predators eat these consumers.
To establish the profile of these planktons, marine surface water samples were analyzed for
presence of various species. The plankton profile observed indicates that:
• Around 26 families of phytoplanktons were observed. Of the plankton families observed,
Zygnemataceae, Volvocaceae, Naviculaceae, Pyrocystaceae, Stephanopyxidaceae,
Rhizosoleniacea and Stephanopvxidaceae were found to be present in 15% or more
composition.
• Phytoplankton count ranged between 19,000 to 21,000 cells/ml.
• Of the zooplankton families observed, Bosminidae, Pontellidae, Lumbriculida, Calanoida,
Collothecidae and Asterigerinacea were found to present in 25% or more composition.
• Fish Larvae, crustacean larvae & Eggs composition ranged between 10-20%.
• Zooplankton count ranged between 1800 to 2000 cells/m3.
Table 3-5: Plankton Profile of Marine Surface Water
Plankton Profile Family
Phytoplankton Bacillariaceae
Bellerocheaceae
Biddulphiaceae

EEIIAA RReeppoorrtt FFoorr EExxpplloorraattoorryy DDrriilllliinngg AAccttiivviittiieess IInn NNEELLPP BBlloocckk CCYY--OOSSNN--22000099//22,, GGuullff OOff MMaannnnaarr,,
TTaammiill NNaadduu
P a g e | 55
SSeepptteemmbbeerr 22001144 | OIL
Plankton Profile Family
Ceratiaceae
Chaetocerataceae
Chlorellaceae
Climacospheniaceae
Closteriaceae
Coscinodiscaceae
Cymbellacae
Euglenales
Eutreptiaceae
Hemiaulaceae
Leptocylindraceae
Microcystaceae
Naviculaceae
Pinnulariaceae
Pleurosigmataceae
Pyrocystaceae
Rhizosoleniaceae
Scenedesmaceae
Stephanopvxidaceae
Thalassiosiraceae
Ulotrichaceae
Volvocaceae
Zygnemataceae
Zooplankton Asterigerinacea
Bosminidae
Calanoida
Chitonophilidae
Collothecidae
Cypriclinidae
Lumbriculida
Misophrioida
Pontellidae
Sabellida

EEIIAA RReeppoorrtt FFoorr EExxpplloorraattoorryy DDrriilllliinngg AAccttiivviittiieess IInn NNEELLPP BBlloocckk CCYY--OOSSNN--22000099//22,, GGuullff OOff MMaannnnaarr,,
TTaammiill NNaadduu
P a g e | 56
SSeepptteemmbbeerr 22001144 | OIL
Plankton Profile Family
Serpulidae
Benthos
Benthos are living things on the ocean floor. Many benthic organisms attach themselves to
rocks and stay in one place. This protects them from crashing waves and other water
movements.
To establish the profile benthos in project area, sediment samples were analyzed for presence
of various species. The benthic profile observed indicates that:
• Macro bethons formed 54-74% of total composition of benthos. Nephtyidae, Stylasteridae,
Ampharetidae, Stylasteridae, Sabellidae are the prominently observed families.
• Meio bethos formed 17-33 % of total composition of benthos. Carterinidae,
Centropagidae, Ammodiscacea, Carterinidae, Acartiidae, Chaetonotidae and Misophriidae
are the prominently observed families.
• Micro benthos formed 7-18% of total composition of benthos. Micro benthos showed
presence of Bacillariaceae, Cercomonadidae and Euglenaceae families.
Table 3-6: Benthic Profile Of Sediment Sample
Benthic Profile Family
Macro Benthos
Ampharetidae Eucopidae Eunicidae
Magelonidae Milleporidae Nephtyidae
Nereidae Onuphidae
Prayidae Sabellariidae Sabellidae
Stylasteridae Uncispionidae
Meio Benthos
Acartiidae Ammodiscacea
Cafterinidae Centropagidae

EEIIAA RReeppoorrtt FFoorr EExxpplloorraattoorryy DDrriilllliinngg AAccttiivviittiieess IInn NNEELLPP BBlloocckk CCYY--OOSSNN--22000099//22,, GGuullff OOff MMaannnnaarr,,
TTaammiill NNaadduu
P a g e | 57
SSeepptteemmbbeerr 22001144 | OIL
Benthic Profile Family Diaptomidae Misophriidae Pontellidae
Micro Benthos Bacillariaceae
Cercomonadidae Euglenaceae
Biodiversity Index
A biodiversity diversity index is the measure of species diversity in a given community. Shannon
- Weineer (H) Diversity Index is a commonly used diversity index that takes into account both
abundance and evenness of species present in the community.
The details of Biodiversity Index and evenness for phytoplankton, zooplankton and benthos are
given in table below.
Table 3-7: Biodiversity Index for Phytoplankton & Zooplankton
Prospect Area
Phytoplankton Zooplankton Benthos
S-W Index Evenness S-W Index Evenness S-W Index Evenness
P-1 2.4419 0.953 1.694 0.946 2.79 0.95
P-2 2.2602 0.857 1.487 0.923 2.766 0.957
P-3 2.3422 0.913 1.5604 0.968 2.8712 0.993
P-4 2.3846 0.93 1.5866 0.985 2.8112 0.972
P-5 2.5404 0.917 1.748 0.976 2.807 0.971
P-6 2.6885 0.99 1.709 0.954 2.8036 0.97
S-W Index: Shannon -Weineer (H) Diversity Index
Biologists proposed a different scale of pollution in terms of phytoplankton community diversity
index, which states a negative correlation between Shannon and Wiener index and pollution: of
0.0-1.0 for heavy pollution, 1.0-2.0 for moderate pollution, 2.0-3.0 for light pollution, 3.0-4.5 for
slight pollution (Shanthala et al., 2009 Biligrami (1988)). It was established that the diversity
index value of a phytoplankton community in less polluted waters would be higher. Shannon -
Weineer Diversity Index for Phytoplankton for the project area ranged between 2.2 to 2.6,
indicating light pollution.

EEIIAA RReeppoorrtt FFoorr EExxpplloorraattoorryy DDrriilllliinngg AAccttiivviittiieess IInn NNEELLPP BBlloocckk CCYY--OOSSNN--22000099//22,, GGuullff OOff MMaannnnaarr,,
TTaammiill NNaadduu
P a g e | 58
SSeepptteemmbbeerr 22001144 | OIL
33..99 MMAARRIINNEE EECCOOLLOOGGYY
Project block is located in Gulf of Mannar which has diverse ecology, mainly reported from the
areas closer to Gulf of Mannar Islands. Various studies/publications/reports were reviewed in
order to understand ecology of the region. These literature are mainly related to marine
ecology of Gulf of Mannar Islands and nearby coastal areas. No specific literature related to
ecology of project block area could be traced in public domain during our data assessment. The
sections here represent the ecology of Gulf of Mannar and nearby areas as these are closer to
project block and hence most relevant.
33..99..11 GGuullff ooff MMaannnnaarr
The coastline of Gulf of Mannar (GoM) from Rameswaram in the north to Kanyakumari in the
south is about 170 nautical miles. Nearly one third of the 1000 km coastal length of the State of
Tamil Nadu is occupied by the Gulf of Mannar coast in a stretch of 300 km. Palk Strait is the
northern boundary of Gulf of Mannar and southern boundary is the Indian Ocean at
Kanyakumari.
Gulf of Mannar Marine National Park & Biosphere Reserve
GoM has a chain of 21 islands stretching from Mandapam to Tuticorin to a distance of 140 km
along the coast with total area of 623 hectares. Each one of the islands is located anywhere
between 2 and 10 km from the main land. The Govt. of Tamilnadu in G.O.M. S.No. 962 dated
10.9.86 notified under the intention to declare the 21 islands as Gulf of Mannar Marine National
Park (GoMNP) for the purpose of protecting marine wildlife and its environment including
depths of 3.5 fathoms on the bay side to 5 fathoms on the seaward side under the section 35(1)
of the Wildlife (Protection) Act 1972. Gulf of Mannar Biosphere Reserve (GoMBR) was set up on
18.2.89 jointly by the Government of India and Government of Tamil Nadu.
The Exclusive Economic Zone (EEZ) of GoM is about 15,000km2 out of which the GoM biosphere
reserve has an area of about 10,500km2. The Gulf of Mannar Marine National Park has the area
of about 560Km2 lying within the Gulf of Mannar Biosphere Reserve. GoM shows presence of
variety of marine organisms because of its varied ecosystems of coral reefs, rocky shores, sandy
beaches, mud flats, estuaries, mangrove forests, seaweed stretches and seagrass beds.
The 21 islands in the GoMNP are clustered in group of four, namely-

EEIIAA RReeppoorrtt FFoorr EExxpplloorraattoorryy DDrriilllliinngg AAccttiivviittiieess IInn NNEELLPP BBlloocckk CCYY--OOSSNN--22000099//22,, GGuullff OOff MMaannnnaarr,,
TTaammiill NNaadduu
P a g e | 59
SSeepptteemmbbeerr 22001144 | OIL
• Mandapam Group (7 islands): Shingle, Krusadai, Pullivasal, Poomarichan, Manoliputti,
Manoli, and Hare.
• Keezhakkarai group (7 islands): Mulli, Valai, Thalaiyari, Appa, Poovarasanpatti (submerged),
Valaimunai and Anaipar.
• Vembar Group (3 islands): Nallathanni, Pulivinichalli and Upputhanni.
• Tuticorin Group (4 islands): Kariyachalli, Vilanguchalli (submerged), Koswari and Vaan.
GoMNP is located away from block boundary and none of the block area overlaps with GoMNP
area. GoMBR boundary passes through block area on north side. The nearest prospect area
located to GoMBR and GoMNP boundary is Prospect Area 3 with approximate aerial distance of
8 km and 21 km respectively. The location of GoMNP and GoMBR and project block are shown
in figure below.

EEIIAA RReeppoorrtt FFoorr EExxpplloorraattoorryy DDrriilllliinngg AAccttiivviittiieess IInn NNEELLPP BBlloocckk CCYY--OOSSNN--22000099//22,, GGuullff OOff MMaannnnaarr,, TTaammiill NNaadduu
P a g e | 60
SSeepptteemmbbeerr 22001144 | OIL
FIGURE 3-13: GOMBR & GOMNP AND PROJECT BLOCK
Source: Bay of Bengal Large Marine Ecosystems MPA database

EEIIAA RReeppoorrtt FFoorr EExxpplloorraattoorryy DDrriilllliinngg AAccttiivviittiieess IInn NNEELLPP BBlloocckk CCYY--OOSSNN--22000099//22,, GGuullff OOff MMaannnnaarr,,
TTaammiill NNaadduu
P a g e | 61
SSeepptteemmbbeerr 22001144 | OIL
33..99..22 MMaarriinnee && CCooaassttaall EEccoossyysstteemmss ooff GGOOMM
The Coral Reef Ecosystem
Corals are invertebrate animals and live in colonies in association with certain algae called
zooxanthellae. Corals essentially make massive deposits of calcium carbonate with minor
additions of calcareous algae and other organisms which secrete calcium carbonate.
Coral reefs in India occur principally in the Lakshadweep, Andaman and Nicobar Islands, Gulf of
Mannar and Palk Bay. The major coastal coral reefs occur between southeast India and Sri Lanka
(Gulf of Mannar and Palk Bay). The reefs of GoM are fringing or patchy reefs thriving in very
shallow waters (20 cm- 5 m) and are found enriching almost all islands. Most of the framework
is made up of dead or semifossilised Proties sopp. Various literatures indicate that about 128
species of corals have been recorded (Pillai, 1986, CMFRI, 1998). and the corals reefs lying on
the southern side of the island are more dense and exhibit greater species diversity that the
reefs on northern side. The dominant genera are Pocillopora, Porites, Acropora, Montipora, Favia,
Favites, Goniopora, Goniastrea, Platygyra, echinopora, Galaxea, Turbinaria, Leptoria, Pavona and
Pachyseries. However, at present the reef seems to be in the state of deterioration due to
natural processes (sedimentation) and human intervention (coral mining).
A number of reef animals come to feed on plants and plankton. Finfishes like Acanthurids,
Nemipterids, Balistids, Labrids and Chaetodontids spawn in coral reefs. Coral reef absorbs CO2
and converts it into CaCO3, thereby, reducing the CO2 in the global environment Corals have
reported to be potential of yielding a variety of bioactive substances including drugs for curing
diseases. Corals and a number of their associated organisms like sponges, starfishes, sea
cucumbers, and gorgonians have been found to produce chemicals which have pharmaceutical
and medicinal value. Many of them produce antifouling and antimicrobial compounds which
have great economic potential. In many countries, corals are used to make jewelry. The colour
pigments of the corals can be used in making special dyes. Corals have been used as materials
for construction. Due to this, extensive coral harvesting is reported in the GoM, resulting in
degradation of coral and associated ecosystems. Towards this, the Government of Tamil Nadu
by its order Number 116 dated 20.5.1982 prohibited the removal of corals, dead or alive, from
the water.

EEIIAA RReeppoorrtt FFoorr EExxpplloorraattoorryy DDrriilllliinngg AAccttiivviittiieess IInn NNEELLPP BBlloocckk CCYY--OOSSNN--22000099//22,, GGuullff OOff MMaannnnaarr,,
TTaammiill NNaadduu
P a g e | 62
SSeepptteemmbbeerr 22001144 | OIL
Based on the study of ICMAM, Chennai for location of live corals in Gulf of Mannar, it is evident
that these are located far from project block area, with approximate aerial distance of 36 km
towards north side of block.

EEIIAA RReeppoorrtt FFoorr EExxpplloorraattoorryy DDrriilllliinngg AAccttiivviittiieess IInn NNEELLPP BBlloocckk CCYY--OOSSNN--22000099//22,, GGuullff OOff MMaannnnaarr,, TTaammiill NNaadduu
P a g e | 63
SSeepptteemmbbeerr 22001144 | OIL
FIGURE 3-14: LOCATION OF LIVE CORALS AROUND GULF OF MANNAR

EEIIAA RReeppoorrtt FFoorr EExxpplloorraattoorryy DDrriilllliinngg AAccttiivviittiieess IInn NNEELLPP BBlloocckk CCYY--OOSSNN--22000099//22,, GGuullff OOff MMaannnnaarr,,
TTaammiill NNaadduu
P a g e | 64
SSeepptteemmbbeerr 22001144 | OIL
The Seagrass & Seaweed Ecosystem
Seagrass
The Gulf of Mannar is rich in seagrasses. Seagrasses are marine plants belonging to
monocotyledonous families. GoM shows seagrass species belonging to Hydrocharitaceae
and Potamogetonaceae family. The seagrass beds provide food sources and nursing ground
for many epiphytic fauna and feeding grounds for the Sea Cow - Dugong dugong. Sea Cow
feeds upon these pastures on the Gulf shoreline and surrounding islands like Krusadai. The
Dugongs prefer pastures of Halodule uninervis for food. Seagrass also form the important
habitats for Holothurians i.e. Sea cucumbers. Seagrass roots bind sediments and prevent
erosion. The species composition of seagrasses observed in GoM is as follows:
Hydrocharitaceae Potamogetonaceae
Thalassia hemprichii Cymadocea serrulata
Enhaulus acoroides C. rotundata
Halophila ovalis Halodule uninervis
H. ovata Syringodium isoetifolium
H. beccari
H. stipulacea
Apart from being an important nursery ground for commercially important fishes, the beds
of seagrass harbour many species of crustaceans, molluscs, gastropods, worms and
echinoderms. They provide rich habitat for the macro and micro algae as epiphytes. The
GoM’s seagrass communities are valuable habitats for commercially harvested species,
particularly the green tiger prawn Penaeus semisulcatus, which is extensively harvested for
the export market. Holothurians, an endemic echinoderm found in abundance in the Gulf of
Mannar, is reported to be extensively exploited for export to Japan and other Southeast
Asian countries as a costly food item for human consumption. The seagrass beds also
provide feeding ground for all five species of marine turtles viz., the Green (Chelonia hyeas),
the Loggerhead (Caretta caretta). Olive Ridleys (Lepidochelys olivacea), Hawksbills and

EEIIAA RReeppoorrtt FFoorr EExxpplloorraattoorryy DDrriilllliinngg AAccttiivviittiieess IInn NNEELLPP BBlloocckk CCYY--OOSSNN--22000099//22,, GGuullff OOff MMaannnnaarr,,
TTaammiill NNaadduu
P a g e | 65
SSeepptteemmbbeerr 22001144 | OIL
Leather backs (Dermochelys coriacea). Many species of crustaceans, mollusks, gastropods
and fishes have been observed as inhabitants of sea grass beds.
Seaweed
Marine algae or seaweeds form one of the important marine living resources in the Gulf of
Mannar region and they occur in the intertidal and subtidal regions of the sea, and also in
the brackish backwater environment. They grow on dead coral reefs, rocks, stones, pebbles,
other substrates and also as epiphytes on sea grasses. They contain many nutrients such as
protein, carbohydrate, vitamins, iodine, bromine, mannitol, minerals, trace elements and
bioactive substances. The total biomass of seaweeds in the Gulf of Mannar region constitute
about 53% of Tamil Nadu Coast. The Gulf of Mannar region finds a total number of 147
species of marine algae such as green algae (42 species), brown algae (31 specie), red algae
(69 species) and blue-green algae (5 species). This reveals the richness and varied species
composition in the Gulf of Mannar Marine Biosphere Reserve. The economically important
marine algae or seaweeds in this region are Gelidiella acerosa, Gracilaria edulis, G. follifera,
crassa, Gracilaria spp.; Hvpnea spp., Acanthophora spp.; Turbinaria spp., Sarqassum spp.;
Cystoseira trinodis and Hormophvsa triquetra; species of Ulva, Entermorpha, Caulerpa,
Codium, Hvdroclathrus and Lauerncia. Seaweeds are exported for industrial and decorative
purposes.
During discussion with fishermen from Ervadi villagers it was reported that seaweed is
collected by fishermen. It is dried on coast and then sold through agents to chemical
companies located in Dindigul, Ramkottai & Madurai areas. It is used as colouring agent.
Mangrove Ecosystem
Mangroves are salt tolerant trees species which support coastal & marine fisheries and also
protect the coastal zones. The dominant genera observed are Avicennia, Rhizophora,
Bruguiera, Lumnitzera, Ceriops and Pemphis. The genera Avicenia and Rhizophora are found
to be dominant in Krusadai, Poomarichan, Pullivasal, Musal, Anaipar and Upputhanni islands.
Manoli and Manoliputti show a high species diversity of mangovers (Avicennia, Rhizophora,
Bruguiera, Lumnitzera and Ceriops). Pemphis acidula is found in all the islands.
Interaction between Ecosystems

EEIIAA RReeppoorrtt FFoorr EExxpplloorraattoorryy DDrriilllliinngg AAccttiivviittiieess IInn NNEELLPP BBlloocckk CCYY--OOSSNN--22000099//22,, GGuullff OOff MMaannnnaarr,,
TTaammiill NNaadduu
P a g e | 66
SSeepptteemmbbeerr 22001144 | OIL
The three most highly productive coastal ecosystems are mangroves, coral reefs and
seagrass and they are interdependent in a number of ways. A flow of dissolved nutrients
from the mangroves enhances the primary productivity of the seagrass. Mangroves and
seagrass enhance the secondary productivity of coral reefs by providing alternate feeding
grounds. Seagrass and mangroves are dependent on hydrodynamic barriers such as corals,
which dissipate wave energy and are enhanced in structure when the reefs are present.
Seagrasses are the other hand trap and stabilize the sediments and thereby help to protect
the reef from abrasion and burial during storm conditions. Mangroves are also effective
binders of sediment, they reducing the sediment load in the coastal waters. Migration of
animals occurs among these ecosystems. For instance, coral reef dwellers such as grunts and
snappers are known to actively feed on seagrass and return to coral reef for shelter.
Transportation of nutrients, dissolved organic matters and particulate matters also occurs
from one ecosystem to other.
Other important resources that are observed in GoM are seaweeds, Echinoderm and chanks.
Details of the same are given in sections below.
33..99..33 BBiiooddiivveerrssiittyy iinn GGOOMM
About 3600 species of fauna and flora have been identified in the GOMBR by the Central
Marine Fisheries Research Institutes and other organizations. The fauna is said to be one of
the richest in the whole of Indo-west pacific region.
Vegetation
The Gulf of Mannar islands possess some unique type of mangrove vegetation. A total of 10
true mangrove species were reported belonging to 6 families of 6 order7. Mangrove species
was reported in 16 islands. The island Manoli ranks high in having 9 mangrove species and is
followed by Krusadai, Pullivasal, Poomarichan and Hare Island respectively. The mangrove
vegetation in Manoli is striking for its luxuriant growth and diversity. The islands Valai,
Pullimunai, Nallathanni, Upputhanni and Van islands have only one mangrove species each.
About 24 mangrove associated species were recorded from all the islands. The species
Salvadora persica and Sesuvium portulacastrum were the dominant associate flora found in
7 A study was conducted by the Wildlife Institute of India, National Institute for Coastal and Marine Biodiversity Centre in 2006

EEIIAA RReeppoorrtt FFoorr EExxpplloorraattoorryy DDrriilllliinngg AAccttiivviittiieess IInn NNEELLPP BBlloocckk CCYY--OOSSNN--22000099//22,, GGuullff OOff MMaannnnaarr,,
TTaammiill NNaadduu
P a g e | 67
SSeepptteemmbbeerr 22001144 | OIL
about 15 islands. Similarly, the species like Thespesia populnea and Scaevola taccada have
been recorded in 13 islands. Caesalpenia, Dalbergia, Pandanus, Pongamia, Salvadora and
Thespesia were found distributed well away from the upper reaches of high tide. The grass
species like Aleuropus, Fimbristylis, Spinifex and Tamarix were recorded at or near the upper
reaches whereas halophytes Salicornia, Scaevola, Sesuvium, Suaeda occupies the gaps
between the mangroves and in exposed areas in the mudflats. Clerodendrum, Ipomoea, and
Spinifex covers the periphery of the islands.
About 61 species belong to trees, herbs, shrubs etc. (other than mangroves and mangrove
associates), were identified at all islands of the Gulf of Mannar. Three alien invasive species
(Acacia eburnean, Acacia nilotica and Prosopis juliflora) were reported from these islands
Phytoplankton
Around 126 species of plankton were reported (Kannan, 1996). The polulation density varied
from 34000 to 86000 cells/L. the major species reported were:
Diatoms: 97 species (33 genera)
Dinoflagellates: 16 species (6 genera)
Blue-green algae: 7 species (5 genera)
Green algae: 3 species (3 genera)
Zooplankton
Around 360 species of zooplanktons were reported (CMFRI, 1998). The popluation density of
zooplankton varied from 8000 to 65000 no.s/cu.m and the species belonging to the
protozoa, coelenterata, ctenophora, annelida, chaetognatha, mollusca, echinodermata,
arthropoda, chordata were reported.
Echinoderm
Echinoderms are include spiny skinned animals like starfishes, sea urchins and sea
cucumbers. They live among corals and occur from supra-littoral to the hadal zone. They
inhabit the rocky, sandy, muddy and mangrove areas. The Gulf of Mannar is a favourable and
suitable habitat for echinoderms. Most of them are living inside the crevices of coral reefs to
hide and protect themselves from predators. The crown of thorns Acanthaster planci is
known to feed on the polyps of the live corals and destroy the live corals. 264 species

EEIIAA RReeppoorrtt FFoorr EExxpplloorraattoorryy DDrriilllliinngg AAccttiivviittiieess IInn NNEELLPP BBlloocckk CCYY--OOSSNN--22000099//22,, GGuullff OOff MMaannnnaarr,,
TTaammiill NNaadduu
P a g e | 68
SSeepptteemmbbeerr 22001144 | OIL
belonging to five classes namely Crinoida, Asteroidea, Ophiuroidea Echinoidea and
Hologhuroidea have been recorded (James, 1985, CMFRI, 1998). The major genera were:
• Crinoidea: Capillaster, Comatella, Comanthus, Comaster, Heterometra, and Tropiometra.
• Asteroidea: Astropecten, Craspidiaster, Goniodiscaster, Stellaster, Culcita, Pentaseraster,
Linckia, Asterina and Echinaster.
• Ophiuroidea: Ophiacits, Macrophiothrix, Ophiogymna, Ophiothela and Ophiothrix.
• Echinoidea: Astrophyga, Salmacis, Echinometra and Echinodiscus.
• Holothuroidea : Holothuria, Stichopus, Pentacta, Hemithyone and Synaptula.
Economically only Holothuroidea are exploited on a commercial scale for export. The
processed sea cucumber (beche-de-mer) had high demand in countries like Singapore and
Hong Kong. Holothuria scabra is mostly exported followed by H. spinifera, H. atra,
Actinopyga echinites, A. miliaris and Bohadschia marorata. Tuticorin, Kelakkarai,
Periyapattinam, Vedalai, Pamban, Rameswaram, Tondi, Deviptinam and Tiruppalaikudi are
the important centres of sea cucumber. Flourishing export market for the processed sea
cucumbers has increased their exploitation. Over 90% of beche-de-mer exported from India,
is from the Palk Bay and the Gulf of Mannar of which the contribution of the former and the
latter is 60 and 30% respectively. Sea cucumbers are mostly collected by skin divers in
shallow waters from 2-10 m depth (James 1994).
Foraminifera
51 species of foraminiferans were reported and the dominant genera were Trochammina,
Robulus, Nonion, Operculina, Bolivina, Bulimina, Streblus, Poroeponides and Cancris. (CMFRI,
1998)
Sponges
257 species of sponges were reported from order Keratosida, Haplosclerida, Poecilosclerida,
Halichondrida, Hadromerida, Epipolasida, Choristida, Carnosida. Dominant genera were
Heteronema, Spongia, Dysidea, haliclona, Callyspongia, Spirastrella and Cliona. (Thomas,
1986)
Gorgonids

EEIIAA RReeppoorrtt FFoorr EExxpplloorraattoorryy DDrriilllliinngg AAccttiivviittiieess IInn NNEELLPP BBlloocckk CCYY--OOSSNN--22000099//22,, GGuullff OOff MMaannnnaarr,,
TTaammiill NNaadduu
P a g e | 69
SSeepptteemmbbeerr 22001144 | OIL
Gorgonids are observed in the Palk Bay while in the Gulf of Mannar these are recorded only
near the islands. Gorgonid community is popularly known as “Flowers of underwater
gardens”. Fourteen species of gorgonids were recorded (Tomas and George, 1987). The
dominant genera were Subergorgia, Plexauroides, Muricella, Echinomuriceae, Echinogorgia,
Thesea, Heterogorgia, Junceela and Gorgonella.
Sea fan (Coelenterata)
The Sea fan is yet another colonial form, but it branches only in one plane and the branches
may fuse with each other to form a 'fan'. White or cream-coloured polyps may grow on a
base of contrasting maroon colour, attached to stones by a broad disc-like holdfast.
Polychaeta
75 species were recorded (CMFRI, 1998). The dominant genera were Iphione, Harmothoes,
Eurythoe, Chloeia, Eulalia, Syllis, Ceratonereis, Perinereis, Eunice, Marphysa, Onuphis and
Malacoceros.
Nematoda
9 species were recorded (Ayyakkannu, 1974). The dominant genera were Anticoma,
Halalaimus, Oncholainmus and Chromadora.
Crustacea
The crustaceans rank second in the diversity of fauna in the coral reef ecosystem and many
of them are exploited for commercial purpose. They consist of crabs, lobster, prawns, and
shrimps. Planktonic and Larval forms. Group Species recorded were:
• Copedods: 223
• Cumacea: 10
• Amphipods: 52
• Ostracods: 57
• Isopoda: 18
• Decapod larva: 8
The dominant groups were Acrtia, Acrocalanus, Centropages, Canthocalanus, Eucalanus,
Microsetella, Oithona, Lucifer and penaeid larvae.
Penaeld and Non-Penaeld shrimps

EEIIAA RReeppoorrtt FFoorr EExxpplloorraattoorryy DDrriilllliinngg AAccttiivviittiieess IInn NNEELLPP BBlloocckk CCYY--OOSSNN--22000099//22,, GGuullff OOff MMaannnnaarr,,
TTaammiill NNaadduu
P a g e | 70
SSeepptteemmbbeerr 22001144 | OIL
41 species were reported and the dominant genera were Penaeus, Metapenaeus,
Parapenaeopsis and Acetes. (CMFRI, 1998).
Lobster
7 species namely Panulirus homarus, P. ornatus, P. versicolor, P. longipes, P. pllyphagus,
puerulus sewelli and Thenus orientalis were recorded (George, 1973)
Crab
210 species were observed (CMFRI, 1969 and 1998). The dominant genera were Dromia,
Crytodromia, Ranina, Dorippe, Calappa, Scylla, Portunus, Charybdis, Thalamita, Demania,
Leptodius, Atergatis, Phymodius and Doclea.
Stomatopod
25 species were observed (CMFRI, 1969 and 1998). The dominant genera were
Acanthosquilla, Anchisquilla, Choridopsis, Carinosquilla, Gonodactylus, Oratosquilla and
Lysiosquilla.
Mollusca
The Mollusca includes a variety of most conspicuous, invertebrates such as bivalves,
gastropods and cephalopods of which the class gastropoda covers the largest number of
diversified forms. The gills of molluscs act as a filter to collect microscopic food particles.
While mussels, oysters etc. come under bivalvia, cephalopods including squids, octopus etc.
are primarily pelagic forms. Bivalves, cephalopods and gastropods are delicious sea food
items locally and in Southeast Asian countries. Pearls of high value as gems are produced by
the pearl oyster of the genus Pinctada under the family Pleriidae. The sacred chank (Xancus
pyrum) are much in demand for the manufacture of bangles, ornamental and decorative
materials. Oyster shell is used to produce lime for poultry and other uses. Molluscs absorb
CO2 and convert it into CaCO3, thus reducing the level of CO2 in the global environment.
The operculum of gastropods is used for manufacturing perfumes and making incense sticks.
731 species of molluscs belonging to three classes namely Bivalvia, Gastropoda and
Cephalopoda were recorded (Satyamurthi, 1952; CMFRI, 1969)

EEIIAA RReeppoorrtt FFoorr EExxpplloorraattoorryy DDrriilllliinngg AAccttiivviittiieess IInn NNEELLPP BBlloocckk CCYY--OOSSNN--22000099//22,, GGuullff OOff MMaannnnaarr,,
TTaammiill NNaadduu
P a g e | 71
SSeepptteemmbbeerr 22001144 | OIL
• Bivalvia: Arca, Modiolus, Lithophaga, Perna, Isognomon, Malleus, Pteria, Pinctada, Pinna,
Cardium, Crassostrea, Meretrix, Donax and Tellina.
• Gastropods: Trochus, Turbo, Nerita, Littorina, Turritella, Cerithidea, Janthina, Tibia,
Strombus, Cypreaea, Bursa, Tonna, Chicoreus, Xancus, Babylonia and Hemifusus.
• Cephalopods: Sepia, Sepiella, Loligo and Octopus.
Information on the two important groups of molluscs, viz. pearl oyster and chank outlined
hereunder.
Pearl oysters
Pearl oysters are available in the Gulf of Mannar. Pinctada fucata yields gem quality pearls for
which the Gulf of Mannar is famous. The other species found are P. chemnitzii, P. anomioides,
P. atropurpura, and P. margaretifera.
During consultations with fishermen association it was reported that the pearl collection has
been reduced considerable over the time. This is mainly due to use of trawlers which disturb
the sea sediment. Some pearl collection is practiced near Tuticorin coastal areas.
Chanks
The sacred chank, Xancus pyrum is another resource of economic importance in the region.
On an average 9 x 10⁵ sacred chanks are exploited per annum from the Gulf of Mannar
(Devraj and Ravichandran 1988). Among the chanks, the variety acuta (or jathy in Tamil),
found in the Gulf of Mannar fetches higher prices than the rest available elsewhere. The
dominant variety present in the Palk Bay is obtusa. The chank habitats are within 5-25 m
(often upto 35 m) depth. Usually chanks prefer fine sandy areas with rocky beds, wherein
nereids abound. The sinistral freak is also available from this area.
During consultations with fishermen association it was reported that the chank collection has
been reduced considerable over the time of Gulf of Mannar and now fishermen go to
Tuticorin for chank collection. Because of the trawler operations, sea bed is getting
destroyed/ disturbed thus chank collections is getting reduced. This has also lead to
depletion of organisms on which chank lives. Use of a variety of nets and trawlers have lead
to disruption of all shells & chanks and overall reduction of fishing. Traditionally chanks and
fish of a particular size were caught by fishermen, the rest were released in the sea, but now

EEIIAA RReeppoorrtt FFoorr EExxpplloorraattoorryy DDrriilllliinngg AAccttiivviittiieess IInn NNEELLPP BBlloocckk CCYY--OOSSNN--22000099//22,, GGuullff OOff MMaannnnaarr,,
TTaammiill NNaadduu
P a g e | 72
SSeepptteemmbbeerr 22001144 | OIL
the trawlers use various types of nets to catch both fish and shanks of all sizes. This has
resulted in the depreciation of fish and chanks.
During the discussion with local chank dealer in Rameshwaram, it was reported that large
varieties of Chanks are sent to West Bengal for bangle making. Chanks are exported to
countries like US and are also imported from other countries such as US, Vietnam, Africa, Sri
Lanka, Philippines and Indonesia. The nearby areas from where Chanks are collected and
purchased include Tuticorin, Nagapattinam, Tondi, Devipattinam, Rameshwaram and
Aviranpattinam. The processing, treatment and polishing of the Chanks is done locally.
Ornamental items from shells are also made and sold locally.
Prochordata
All the three groups of prochordata, viz. hemichordata, cephalochordata and urochordata
comprising 1, 6 and 59 species respectively were recorded in the Gulf of Mannar. These
organisms are considered as the connecting link between invertebrates and vertebrates.
Hemichordata: The limited publications on this group has indicated the occurrence of the
only species Ptychotera fava (balanoglossus) in the Gulf of Mannar (Upreti and Shanmugaraj,
1997). Balanoglossus in the Gulf of Mannar is in a very much restricted area, viz. Kunthugal in
the Pamban island and Kurusadai island. The presence of the animal is discernibel by the
characteristic iodoform odour present in the mud. Balanoglossus are zoologically a very
interesting group from evolutionary point of view and their importance is enhanced by their
rarity.
Cephalochordata: Another group of prochorates of significance is the cephalochordates
which measure 4-5 cm in length. Though the animals belonging to this group are limited in
number but are not as rare as the balanoglossus. In the Gulf of Mannar and adjacent areas 6
species are reported to be available. Except Branchiostoma pelagicum which is pelagic, as the
name itself indicates, the rest are benthic, habitating depths ranging from 5 to 25 m. The
Gulf of Mannar and the adjacent marine areas seem to be the western most geographical
limit of their distribution.
Urochordata: The Palk Bay and the Gulf of Mannar have good resources of tunicates. These
jelly-like organisms are mostly sedentary and contain variety of bioactive compounds useful
as drugs.

EEIIAA RReeppoorrtt FFoorr EExxpplloorraattoorryy DDrriilllliinngg AAccttiivviittiieess IInn NNEELLPP BBlloocckk CCYY--OOSSNN--22000099//22,, GGuullff OOff MMaannnnaarr,,
TTaammiill NNaadduu
P a g e | 73
SSeepptteemmbbeerr 22001144 | OIL
Fin and Shell Fish
The Gulf of Mannar coast is the major food resources with fin and shell fishes. There are
about 450 species of fishes belonging to 107 families inhabiting the coasts of Gulf of Mannar
and Palk Bay. Of these, about 122 species of fishes inhabit the reef area and about 32 species
in the sea grass beds and about 40 species in the near shore as well as mangrove areas.
Turtles
Marine turtles are mainly omnivorous and often consume algae. For the purpose of
respiration they periodically surface like the marine mammals. The turtles migrate to the
shore for egg laying and prefer to come to the same site where they themselves once had
hatched out.
Tamil Nadu is located in the southern end of the east coast of India and forms the migratory
corridor for olive ridleys that mass nest in Odisha8. Some of the marine habitats such as coral
reef areas in the Gulf of Mannar, form the feeding grounds for turtles. Five species of marine
turtles are reported in the Gulf of Mannar, these are Chelonia mydas (green turtle),
Hepidochelys olivacea (olive ridley), Caretta caretta (loggerheads turtle), Eretmochelys
imbricata (Hawk bill turtle), Dermochelys coriacea (leather bask turtle). All are endangered
species as per Wildlife (Protection) Act, 1972. None of these species are endemic and may
undertake long migration to feeding and breeding grounds often across international
boundaries9.
Various studies/reports mentioned in this section indicate turtle occurrence in Gulf of
Mannar marine waters and nearby coastal areas but no specific study/report could be traced
indicating turtle occurrence specific to block area.
Another study by CMFRI, indicate that in Pamban-Rameshwaram area annually 800 to 1,000
turtles are landed from the Gulf of Mannar as well as Palk Bay. At Kilakarai, about 1,000
turtles are landed during the season April-September, peak season being May-August with
8 Marine Turtles Along The Indian Coast, WWF-India 2013
9 Marine Turtles of Gulf of Mannar, Tamil Nadu, P. Nammalwar & M. Rajagopalan Madras R. C. of CMFRI, 2000

EEIIAA RReeppoorrtt FFoorr EExxpplloorraattoorryy DDrriilllliinngg AAccttiivviittiieess IInn NNEELLPP BBlloocckk CCYY--OOSSNN--22000099//22,, GGuullff OOff MMaannnnaarr,,
TTaammiill NNaadduu
P a g e | 74
SSeepptteemmbbeerr 22001144 | OIL
some 220 turtles captured every month. It is reported that turtles are observed in the Palk
Bay area also and about 1,000 turtles are landed annually10.
Turtles are often caught for their, meat, skin, shells and eggs. It is reported that some people
believe that turtle meat and blood cured diseases such as piles, back pain & tuberculosis.
Prior to 1972, there was legal live turtle trade between India and Sri Lanka. Live turtles were
transported by sailing boats from Pamban, Tamil Nadu to Jaffna, Sri Lanka11. In 1960, it was
estimated that an average of about 3000 to 4000 turtles were landed every year in the Gulf
of Mannar area and 1000 turtles in the Palk Bay; green turtles formed 75% of the landings,
and olive ridley and loggerhead formed 20%12. The turtle trade was stopped in the early
1980s. The Indian Wildlife Protection Act (1972) lists all species of marine turtles in Schedule
I, thereby giving them the highest degree of protection. Sea turtle populations in Gulf of
Mannar have been reported to have declined due to their overexploitation for trade and
from accidental drowning in fishing gear such as gillnets and trawlers13. A study of sea turtles
off the Tamil Nadu coast revealed that fishing is one of the major causes of turtle mortality
there14. It is estimated that 17.8% of the incidental catch was by the trawlers and 76.5% by
the gill netters15.
Birds
A total of 187 species of shore birds including wadors, terns and gulls were recorded in the
Gulf of Mannar, of which 84 were of aquatic species and the remaining terrestrial. The birds
reported, mainly in winter, are knot Calidris canuta, eastern knot C. tenuirostris, Numenius
10 Proceedings Of The Symposium On Living Resources Of The Seas Around India, Present Status Of The Turtle Fishery In The Gulf of Mannar And The Palk Bay, S. Jones* and A. Bastian fernando, CMRFI, 1973
11 Agastheesapillai A. Turtle export from south east coast of India during 1945-64 periods. Marine Fisheries Information Service T & E Series 1996; 142:17.
12 Jones S, Bastian FA. Present status of turtle fishery in Gulf of Mannar and Palk Bay. In: Proceedings of the Symposium on Living resources of the seas around in India. CMFRI Special Publication, Mandapam Camp, 1973, 772-775
13 Agastheesapillai A. Turtle export from south east coast of India during 1945-64 periods. Marine Fisheries Information Service T & E Series 1996; 142:17.
14 Bhupathy S, Saravanan S. A report on the status of sea turtles on the Tamil Nadu coast. In: Proceedings of the National Workshop for the Development of a National Sea Turtle Conservation Action Plan 2002, 70-73.
15 Marine Turtles of Gulf of Mannar, Tamil Nadu, P. Nammalwar & M. Rajagopalan Madras R. C. of CMFRI, 2000

EEIIAA RReeppoorrtt FFoorr EExxpplloorraattoorryy DDrriilllliinngg AAccttiivviittiieess IInn NNEELLPP BBlloocckk CCYY--OOSSNN--22000099//22,, GGuullff OOff MMaannnnaarr,,
TTaammiill NNaadduu
P a g e | 75
SSeepptteemmbbeerr 22001144 | OIL
arquata, whimbrel N. phaeophus and bar-tailed gotuit Limosa lapponica (Balachandran,
1995).
Mammals
11 species have been recorded (Jamer and Lal Mohan, 1987, CMFRI, 1998) including 6
species of whales, 4 species of dolphins and 1 species of dugong. All are endangered species
(Wildlife Protection Act, 1972). The cetacea (whales and dolphins) and sirenia (sea cow)
represent the main groups of marine mammals in the Gulf of Mannar.
Dolphins and Whales: The dolphins found in the Gulf of Mannar are oceanic and roam
about in the area. It is most likely that only the frail and the infirm whales move towards this
area as known from standings of whales. So far no mass standing of whales has been
reported in the area. The dolphins reported in Gulf of Mannar are Dolphinus delphis, Stenella
longirostris, Sousa chinensis and Tursiops truncates. These mammals are often caught in
various nets and the ones thus caught and injured (probably) are clandestinely butchered for
food. However, capture or harming of the sea mammals is prohibited by law. Occasionally,
marine mammals and turtles have been observed to get washed ashore, and on examination
it is found that the death was often due to propeller cuts or eating of floatsam.
Sea Cow
Unlike dolphins and whales, sea cow (Dugong dugon) inhabits the Gulf of Mannar preferably
within 10 m depth limit not far from the shore (1-3 km). They are not found far from coastal
waters. They are found in calm areas and sheltered bays where the bottom consists of silt
and sand conducive to rich growth of sea-grasses16. Usually sea cows move in groups of 5-7.
They feed on sea - grasses found in the coastal waters. The sea grasses Cymodocea ciliata, C.
isoetifolia, Enhaius koengi, Haiophila ovalis, H. stipulacea, C. rotundata etc. form its main
food17. Their habitat extends from Adiramapattinam in the Palk Bay to Taliyari island in the
Gulf of Mannar. In Gulf of Mannar the dugongs are found around the chain of islands from
Rameshwaram to Pandyan Island off Tuticorin and they are more common around Manali
Island, in the shallow bays of Musal Island (off Mandapam) and around Appa Island and
Balayamuni Island (off Kilakarai). These areas are characterized by extensive growth of sea-
grasses.
16 The Dugong, CMFRI, 1975
17 The Sea Cow, Dugong Dugon Of India R.S. Lal Mohan, CMFRI, 2000

EEIIAA RReeppoorrtt FFoorr EExxpplloorraattoorryy DDrriilllliinngg AAccttiivviittiieess IInn NNEELLPP BBlloocckk CCYY--OOSSNN--22000099//22,, GGuullff OOff MMaannnnaarr,,
TTaammiill NNaadduu
P a g e | 76
SSeepptteemmbbeerr 22001144 | OIL
Accidental catches of dugong are reported from coastal village like Valinokkam,
Periapattinam, Seeniappadarha, Kalimankundu, Kilakkarai, Kundhukal, Vedalai18. Dugongs are
reported to be used for meat and oil. Many medicinal qualities are attributed to the flesh and
bones of dugong. Eating dugong meat is considered to cure piles. Dugong meat is believed
to have rejuvenating qualities.
Due to uncontrolled fishing and also due to reduction in their grazing area and sea grass,
their numbers have gone down drastically. Now they are protected by the Wildlife
(Protection) Act, and are under threatened status.
Fishing
Marine capture fishery is the major economic activity of coastal villages located near Gulf of
Mannar. The total area of Gulf of Mannar under Indian Exclusive Economic Zone is about
15000 sq. km. and commercial fishing is done in about 5500 sq. km. Both mechanized and
non-mechanized fishing units are mainly used for exploitation of sea fish resources in Gulf of
Mannar (Kasim and Hamsa, 1987). The chief fisheries are the pelagic sardines, seer fish,
tunas, mackerel, caranids, barracudas, wolf herring, full and half beaks, the demersal perches
such as sweetlips, groupers, rock-cods, snappers, goat fishes, croakers, sharks, rays, skates,
coral fishes, threadfin, breams, silverbellies, the shell fishes like chanks, squids, cuttlefish
shrimps, crabs and lobsters. Most of these resources are commercially exploited by
mechanised trawlers. Primarily, various types of gill nets and seine nets are used for pelagic
fishing, while trawlers are used for harvesting demersal fishes.
Capture Fishes: 441 species (Dorairaj, 1997) were reported in the following orders, namely
Lamniformes, Squaliformes, Torpediniformes, Elopiformes, Anguilliformes, Clupeiformes,
Aulopiformes Gadiformes Ophidiiformes, Batracoidiformes, Lophiiformes,
Cyprinodontiformes, Atheriniformes, Bercyciformes, Pegasiformes, Syngnathiformes,
Scorpaeniformes, Perciformes and Pleuronectiformes.
Ornamental Fishes: About 100 species (Murthy, 1969) have been recorded. The dominant
genera were Chaetodon, amphiprion, Abudefduf, Holocentrum, Upeneus Parupeneus,
Pomacanthodes, Acanthurus and Lactoria.
18 Report on dugong strandings along Gulf of Mannar, Marine Fisheries Information Service, 2007 and Status Of Sea Cow Along Southeast Coast Of India , Journal of BNHS society, 2004

EEIIAA RReeppoorrtt FFoorr EExxpplloorraattoorryy DDrriilllliinngg AAccttiivviittiieess IInn NNEELLPP BBlloocckk CCYY--OOSSNN--22000099//22,, GGuullff OOff MMaannnnaarr,,
TTaammiill NNaadduu
P a g e | 77
SSeepptteemmbbeerr 22001144 | OIL
Fishing Limits: Mechanised trawl fishing is being conducted usually upto 50 m (20 fathom)
depth, while during November - February the fishermen go upto 180 metres (100 fathom)
for harvesting deep sea prawns. For collection of gorgonids, trawl nets are operated beyond
50 metres. Non-mechanised units usually operate within a depth of 36 metres (20 fathom).
During discussions with Ramnad District Fishermen Co-operative Federation Ltd. and
villagers from coastal areas like Periyapattinam and Chinna Erwadi, it is reported that
fishermen with small boats fish for 1-2 days and go upto 1 km in sea from coast and large
boats & trawlers go can fish upto 8 days in continuous stretch and go beyond 100 km from
coast in sea.
Fishing in Mandapam and Rameshwaram: Fishing units in the Palk Bay and the Gulf of
Mannar operate from Rameswaram. During the south-west monsoon period (June -
September), as the Gulf of Mannar side gets rough, fishing is carried out mostly in the Palk
Bay. During north-east monsoon (October - February), the fishing shifts to the Gulf of
Mannar which becomes calmer than the Palk Bay. The trawl landings are concentrated at
Mandapam, Pamban and Rameswaram. The most important catch in the Mandapam area is
silver bellies (48%), rays, croakers, clupeids, goatfishes, perches, catfishes, lizardfishes and
carangids. At Rameswaram also, silver bellies dominate (51%), followed by rays (13%),
croakers (9.5%) and penaeid shrimps (9.4%), goatfishes, carangids, catfishes, flat fishes,
clupeids, cephalopods and crabs. Mackerel and carangids dominate the catch by the
indigenous gears. Anchovies and seerfishes also support a seasonal fishery. During the lean
inshore fishing season the fishermen of this area resort to 'Thangal fishing' i.e. fishing is done
by over one or two days period.
Fish Production: The marine fish landings in the Gulf of Mannar can broadly be classified
into four groups, viz. pelagic, demersal, crustaceans and molluscs. During 1992 - 1996, the
production has increased gradually from 55,325 tonnes in 1992 to 1,02,897 tonnes in 1996.
In general, contribution of pelagic varieties is maximum (54%) followed by demersal (35%),
crustaceans (6%) and molluscs (5%). While the harvest in the Gulf of Mannar is 20% of the
total production in Tamilnadu, it is estimated that exploitation in this area is 800 tonnes in
excess of sustainable yield, and the production rate is 14 tonnes km-2. The major varieties
contributing to fish production in this area are sardines, carangids, silver bellies, perches,
rays, penaeid prawns and cephalopods. The catch through trawlers further indicates that
certain varieties like silver bellies, rays, croakers, crabs, sardines, goat fishes and catfishes

EEIIAA RReeppoorrtt FFoorr EExxpplloorraattoorryy DDrriilllliinngg AAccttiivviittiieess IInn NNEELLPP BBlloocckk CCYY--OOSSNN--22000099//22,, GGuullff OOff MMaannnnaarr,,
TTaammiill NNaadduu
P a g e | 78
SSeepptteemmbbeerr 22001144 | OIL
prefer the northern side of the Gulf of Mannar, that is, Pamban and Rameswaram; while
thryssa, carangids, stolephorus and seer fishes are predominantly caught in the southern
side, that is, Tuticorin.
Breeding Ground: The fishes breed throughout the Palk Bay and the Gulf of Mannar and
almost throughout the year. Fish eggs have been observed in the Gulf of Mannar throughout
the year with a peak in March and minor peaks in May, September and November. The eggs
were identified as belonging to clupeoids, carangids, Cynoglossus and muraenids. There
exists a minor fishery for juvenile fishes in the Pamban island and in Theedai area during
January-March, in which mostly baby sardines are caught by torch (Choondu) fishing during
night hours. At Kunthukal Point (Pamban) very good quantities of juvenil milk fish (Chanos
chanos) are caught during April- June and September for use as seed stock for fish farming
in various parts of Tamilnadu and Kerala. Spawning takes place in areas between 20m and 60
m depth in the northern Gulf of Mannar. The spent adults migrate to the central Gulf of
Mannar coast by November – December.
33..1100 SSOOCCIIOOEECCOONNOOMMIICC CCOONNDDIITTIIOONNSS
The proposed project is an offshore project and the land area is located on northwest and
north side. The nearest prospect area – Prospect Area 3 is located at the approximate aerial
distance of 28 km from Dhanushkodi towards northeast. The coastal villages belong to
Ramanathapuram district are located towards north and northwest side of black at an
approximate aerial distance of 28-68 km from Prospect Areas. Villages from Tuticorin district
are located at more than approximate aerial distance of 70 km towards west and south west
of block.
Ramanthapuram District has an area of 4123 km². As per the Census of India, 2011,
Ramanathapuram district had a population of 1,353,445 with a sex-ratio of 983 females for
every 1,000 males. Tuticorin district has an area of 4621 km². As per the Census of India,
2011, the district had a population of 1,750,176 with a sex-ratio of 1,023 females for every
1,000 males.
33..1100..11 VViillllaaggee PPrrooffiillee && LLiivveelliihhoooodd iinn tthhee CCooaassttaall VViillllaaggeess
Being an offshore project with very little direct contact with coastline, villages from nearby
coastal areas were studied for socio-economic profile. Various publications/studies from

EEIIAA RReeppoorrtt FFoorr EExxpplloorraattoorryy DDrriilllliinngg AAccttiivviittiieess IInn NNEELLPP BBlloocckk CCYY--OOSSNN--22000099//22,, GGuullff OOff MMaannnnaarr,,
TTaammiill NNaadduu
P a g e | 79
SSeepptteemmbbeerr 22001144 | OIL
Census of India, Centre For Marine And Coastal Studies, Madurai and Tamil Nadu Marine
Fisherfolk Census, Department Of Fisheries, Tamil Nadu, 2010 were used. To understand the
socio-economic profile of the area, field visits and discussions were conducted with key
organizations/representatives like Department of Fisheries, North & South Ramanathapuram,
Department of Fisheries, Rameshwaram, Ramnad District Fishermen Co-operative Federation
Ltd. and villagers from coastal areas like Periyapattinam, Ervadi and Dhanuskodi.
The major towns/villages in nearby coastal areas are Ramanathapuram, Rameshwaram,
Peripattinam, Devipattinam, Sayalgudi, Mandapam, Keelakarai, Muttayyapuram and
Srivaikutram, etc.
In Ramanathapuram district, as per the Census 2011, there were a total of 602,977 workers,
comprising 149,959 cultivators, 103,592 main agricultural labourers, 18,546 in house hold
industries, 214,053 other workers, 116,827 marginal workers, 23,808 marginal cultivators,
50,282 marginal agricultural labourers, 6,682 marginal workers in household industries and
36,055 other marginal workers.
The total cropped area in Ramanathapuram district is 183651 hectares of which the net
irrigated area is 66865 hectares (2014). Irrigation is mainly from tanks, tube and dug wells.
The main crops grown are paddy, red gram, green gram, cowpea, maize, chillies, cotton,
millets, groundnut etc. With a 34% share, the district is the top chilli pepper producer in
Tamil Nadu.
According to Census 2011, in Tuticorin/toothukudi district there were a total of 748,095
workers, comprising 44,633 cultivators, 161,418 main agricultural labourers, 17,872 in house
hold industries, 433,524 other workers, 90,648 marginal workers, 3,882 marginal cultivators,
39,226 marginal agricultural labourers, 4,991 marginal workers in household industries and
42,549 other marginal workers.
In Toothukudi the total cultivated area 183155 hectares with net sown area is 178083 (2010).
The main crops grown are paddy, pulses, chillies, banana, cotton, gingelly, etc. With 35%
share, the district is the top producer of Cumbu (Pearl Millet) in Tamil Nadu. Thoothukudi
district is the largest exporter of bananas in Tamil Nadu.
In almost half the villages the Other Workers category was between 40% to 97% indicating
that people doing agricultural and related activities were significantly less and more people
were involved in fishing, chank and seaweed collection and other similar occupations.

EEIIAA RReeppoorrtt FFoorr EExxpplloorraattoorryy DDrriilllliinngg AAccttiivviittiieess IInn NNEELLPP BBlloocckk CCYY--OOSSNN--22000099//22,, GGuullff OOff MMaannnnaarr,,
TTaammiill NNaadduu
P a g e | 80
SSeepptteemmbbeerr 22001144 | OIL
As per the Human Development Report for Tamil Nadu, 2003 Toothukudi ranked at 4 and
Ramanathapuram at 23 place. Literature review, reports and documents available on public
domain reflect that overall the health scenario in the coastal villages for those involved in
fishing and related activities continues to be poor. The income for a significant number of
families is very low and is attributed to low productivity and improper marketing system and
lack of additional vocations. Majority of fishermen are in debt due to inadequate income
from fishing. The majority of the fishermen are found to be exploited by the middlemen.
They are required to pay exorbitant rates of interest for the loans they receive. Those who do
not own boats have to pay the boat owners with part of the catch or with fixed amount for
going for fishing on the boats. For chank divers it is a similar situation. During the off season
where fishing is halted most of the fishers do other work including wage labour. Lack of skills
and opportunities contribute to low incomes.
The primary schools are located in every village with higher secondary school within 5 km
distance. Colleges are located at Ramanathapuram, Tuticorin and Mandapam. Though
electrify is supplied to all villages, power cut are very frequent. Public transport is provided to
all coastal villages with frequency of bus at 1 hour. Primary health centers are located in each
village with big hospitals in Ramanathapuram, Tuticorin and Mandapam.
Demography details of coastal villages are represented in Annexure III. Key details about
coastal fishing villages in Ramanathapuram and Toothukudi are presented in Annexure IV &
V.
A State level survey of fishermen19 was carried out by all the Tamil Nadu Fisheries Dept.
which gives the details of fishermen populations in coastal areas. This study indicates that
largest numbers of fishermen population are in Rameshwaram, Mandapam and Pamban in
Ramanathapuram district and in Toothukudi north and South area for Tuticorin district. The
highest sex ratio is in the village Pirappanvalasai at 1080 and the least in Karan at 746. For
most villages the household size was 4. Most of the families were involved in marine fishing
for livelihood. A small proportion was involved in brackish water fishing. Based on the
income details more than 78 % in Ramnad and 91 % in Toothukudi were earning upto Rs.
24000 annually.
19 Tamil Nadu Marine Fisherfolk Census, Department Of Fisheries, Tamil Nadu, 2010

EEIIAA RReeppoorrtt FFoorr EExxpplloorraattoorryy DDrriilllliinngg AAccttiivviittiieess IInn NNEELLPP BBlloocckk CCYY--OOSSNN--22000099//22,, GGuullff OOff MMaannnnaarr,,
TTaammiill NNaadduu
P a g e | 81
SSeepptteemmbbeerr 22001144 | OIL
Fishing
As discussed in earlier section, significant population in the district and the town are
dependent on fishing and associated activities. Valinokkam, Rameshwaram and Mandapam
has the fishing Jetties. Chinnaerwadi, Tuticorin and Rameshwaram have Fish landing centre
with fish landing center proposed at Mandapam. The fishing is carried out with the help of
small boats and trawlers. The prominent fish catch includes promfret, shrimp, crab, ribbon
fish, cod fish, queen fish, king fish, Indian goat fish, pony fish, needle fish, murrel, Malabar
trevally, bluefin trevally, barracuda, etc.
Based on the discussions with stakeholders like Department of Fisheries and villagers, it is
reported that fishermen with small boats generally carry out fishing within 1 km from coast
whereas trawlers/big boats can go beyond 100 km in sea. Fishing and related activities fish
drying, salting, chank collection & processing, are the main livelihood occupation for coastal
villagers. Pearl and chank collection and trade is conducted mainly in villages located near
Tuticorin. Some of the traditional fishing methods/ activities have been discontinued or
drastically reduced due to pollution related issues in the Palk Straits and Gulf of Mannar. Due
to the proximity of the area to Sri Lanka, conflicts with regards to the use of the natural
resources have been reported. Trawling has been reported to have severely affected fishing,
impact on corals and Chank collection. The details on types of boats and no of user are given
in table below.
Table 3-8: People Involved in Fishing and Related Activities
Fisheries (2009--10) -Details Ramanathapuram (Nos.) Tuticorin (Nos.)
Mechanised Boats 2861 399
Country Boats 8403 -
Fiber Vallam - 1303
Wooden Vallam - 1964
Wooden Catamaran - 1020
Chank/Shank & Pearl Collection
Pearl and chank collection and trade is reported to have started before the Christian era in
Tuticorin and areas around. The major chank beds are reported to be observed in marine

EEIIAA RReeppoorrtt FFoorr EExxpplloorraattoorryy DDrriilllliinngg AAccttiivviittiieess IInn NNEELLPP BBlloocckk CCYY--OOSSNN--22000099//22,, GGuullff OOff MMaannnnaarr,,
TTaammiill NNaadduu
P a g e | 82
SSeepptteemmbbeerr 22001144 | OIL
water near Periapattinam, Rameshwaram, Devipattinam and Tuticorin. Pearl beds are
reported more towards Tuticorin and not much is reported in Ramanathapuram.
According to a study done in 200020, traditionally, the chank divers have been residing in
Periapattinam and Keezhakkarai fishing villages. However, the fishers of nearby villages are
also engaged as labourers during chank collection. With time chank diving is now practiced
by villagers from other areas. Nearly, 500 registered chank divers are reported in
Ramanathapuram. During offseason, they are doing seaweed and sea-cucumber collections.
The chank fishers sell their catch to Keezhakkarai and Rameswaram chank traders.
During discussion with chank traders from Ramanathapuram it was reported that due to
increased trawlers sea bed is getting disturbed and has resulted in decline in pearl and chank
catch. Large varieties of Chanks are sent to West Bengal for bangle making. Chanks are
exported to countries like US and are also imported from other countries such as US,
Vietnam, Africa, Sri Lanka, Philippines and Indonesia. The nearby areas from where Chanks
are collected and purchased include Tuticorin, Nagapattinam, Tondi, Devipattinam,
Rameshwaram and Aviranpattinam. The processing, treatment and polishing of the Chanks is
done locally. Ornamental items from shells are also made and sold locally.
Sea Weed Cultivation
The "seaweed belt" runs along the coast of Ramanathapuram District and includes the
villages of Mundel, Valinokkam, Chinna Ervadi, Kilakarãi, Kalimangundu, Periapattnam,
Pudumadam, Seeniappa Darga, Vedalai, Pamban, Chinnapalam and Rameshwaram.
Seaweeds in these locations are collected from the waters off the mainland coast and the
chain of offshore islands21. Seaweed is the secondary occupation with fishermen. Currently,
seaweed farming is practiced in Tamil Nadu at various scales of operation in. Due to
presence of Gulf of Mannar Islands, seaweed farming is promoted towards Palk Bay side of
coast at locations like Mandapam, Rameshwaram and Pudukottai.
During discussion with fishermen from Ervadi villagers it was reported that seaweed
collected by fishermen is dried on coast and then sold through agents to chemical
20 Centre For Marine And Coastal Studies. 2000. Studies On Socioeconomics Of Coral Reef Resource Users In The Gulf Of Mannar Coast, South India. Planning Commission. Reference No.O‐15012/29/98‐SER dated 7/30th March 2000 21 CMFRI Special Publication No. 104. 2010 Kochi

EEIIAA RReeppoorrtt FFoorr EExxpplloorraattoorryy DDrriilllliinngg AAccttiivviittiieess IInn NNEELLPP BBlloocckk CCYY--OOSSNN--22000099//22,, GGuullff OOff MMaannnnaarr,,
TTaammiill NNaadduu
P a g e | 83
SSeepptteemmbbeerr 22001144 | OIL
companies located in Dindigul, Ramkottai & Madurai areas. It is used as colouring agent. The
price of dried seaweed can be upto Rs. 8000-9000/Ton.
Salt Production
Tamil Nadu is the 2nd largest salt producing state in India. 14% of India's and 70% of Tamil
Nadu's Salt production is from Tuticorin. Total area under salt production both in recognized
and unrecognized units is 41,917 acres (registered units have 33,856.43 acres and
unregistered have 8,060 acres). Tuticorin salt industry is labour intensive. It engaged as some
50,000 saltpan workers on an average per day. Tuticorin coast has more salt pans compared
to Ramanathapuram. In Tuticorin district, coastal area which are located towards northwest
and west side of project block shows prominent presence of salt pans, mainly in villages like
Sivaperumkuntram, Periasmypuram, E. Velayudhapuram, Kalaignanapuram, Vaippar,
Keelavaipar, Kallurani, Veppalodai, Tharuvaikulam, Mappilaiurani and Tuticorin. In
Ramanathapuram district, coastal area which are located towards northwest of project block
shows presence of salt pans, mainly in villages as Mookaiyur, Valinokkam, Kanjirankudi,
Koraikuttam, Pallamerkkulum. Tamil Nadu Salt Corporation (TNSC) looks after the salt
production and annual average production is 1.5 Lakhs tonnes, with production of 1.77 lakh
tones salt in year 2013-13. TNSC is further developing the salt pans at Valinokkam.
33..1111 CCOOAASSTTAALL VVUULLNNEERRAABBIILLIITTYY
The block CY-OSN-2009/2 is located near coastal areas of Tuticorin & Ramanathapuram
District. The prominent coastal features include Tuticorin port, Gulf of Mannar Marine
Biosphere and associated coastal areas.
The Indian coast guard has developed National Oil Spill Disaster Contingency Plan (NOSDCP)
through which report on ‘Sensitive Coastal Marine Areas of India, Oil Spills And Their
Impacts’ was done. This report gives degree of sensitivity of key coastal areas in terms of oil
spill risks. Gulf of Mannar and Tuticorin are the two areas listed in this report which are
located closer to block. This report highlights the presence of Gulf of Mannar islands and the
ecological resources in the Gulf of Mannar like corals, seagrass, algae, chank, pearl,
mammals, amphibians, fish, etc. It is reported that even though the shipping lines are far
away from the gulf area, considering the current direction especially from June to
September, any oil spill occurring from ships/tankers moving from Indian Ocean towards
Colombo or Tuticorin, would result in movement of the oil towards the Gulf of Mannar. Since

EEIIAA RReeppoorrtt FFoorr EExxpplloorraattoorryy DDrriilllliinngg AAccttiivviittiieess IInn NNEELLPP BBlloocckk CCYY--OOSSNN--22000099//22,, GGuullff OOff MMaannnnaarr,,
TTaammiill NNaadduu
P a g e | 84
SSeepptteemmbbeerr 22001144 | OIL
the volume of traffic in that area is not significant, no major incident of oil spill has been
reported so far. However, this would not be scenario all the times especially when the
volume of traffic are proposed to increase in the ports of Tuticorin and Colombo. Also
proposed Sethusamudram Ship Channel is under consideration which can lead to increase in
vessel movement in the area. Since the area is close to the Tuticorin and Colombo ports, the
risk of oil spill is reported to be very high.
National Study on Shoreline Changes of Coast has been undertaken by the Ministry of
Environment and Forests, Government of India. The same has been done for Tamil Nadu
coast. The coast lines has been classified as high, medium and low erosion & high, medium
and low accretion. Based on the ‘Status Of Shoreline Changes Due To Erosion/Accretion
Ramanathapuram District, Tamil Nadu Coast’ report, the coastal areas on north and south
side of block are represented here. Majority of coastal areas indicate low to medium
accretion with few low erosion areas. Medium and high erosion areas are observed near
Pamban and Dhanushkodi, which are located at approximate aerial distance of 31 km
towards north and 28 km towards northeast, respectively from nearest prospect area -
Prospect Area 3. Due to the considerable distance from coast and nature of offshore drilling
activities, it is envisaged that project will have any adverse effect on these coast.

EEIIAA RReeppoorrtt FFoorr EExxpplloorraattoorryy DDrriilllliinngg AAccttiivviittiieess IInn NNEELLPP BBlloocckk CCYY--OOSSNN--22000099//22,, GGuullff OOff MMaannnnaarr,, TTaammiill NNaadduu
P a g e | 85
SSeepptteemmbbeerr 22001144 | OIL
FIGURE 3-15: SHORELINE CHANGE DUE TO EROSION/ACCRETION/STABLE COAST IN COASTAL AREAS NEAR BLOCK CY-OSN-2009/2

EEIIAA RReeppoorrtt FFoorr EExxpplloorraattoorryy DDrriilllliinngg AAccttiivviittiieess IInn NNEELLPP BBlloocckk CCYY--OOSSNN--22000099//22,, GGuullff OOff MMaannnnaarr,,
TTaammiill NNaadduu
P a g e | 86
SSeepptteemmbbeerr 22001144 | OIL
44 AANNTTIICCIIPPAATTEEDD EENNVVIIRROONNMMEENNTTAALL IIMMPPAACCTTSS && MMIITTIIGGAATTIIOONN MMEEAASSUURREESS
44..11 EENNVVIIRROONNMMEENNTTAALL IIMMPPAACCTTSS IIDDEENNTTIIFFIIEEDD
This section identifies and makes assessment of the aspects arising due to drilling activity
which may have environmental (Physical and Biological) and socio-economic impacts. The
following factors which were analyzed for the impact study primarily formed the basis for the
baseline study of the existing project environment
• Offshore air and noise quality
• Marine sediment quality
• Marine water quality & temperature
• Benthic community
• Marine micro-organisms, fish, reptiles, mammals, seabirds
• Coastal ecology & landscape
• Marine traffic
• Occupational safety of personal
• Economic opportunities
The study further prioritizes the above factors through a semi-quantitative system so that
they can be effectively addressed by Environment Management Plans. Compliance with
environmental legislation, regulations, standards and policies has been given due
importance in the impact assessment process.
Environmental aspects (based on phases of activities pre drilling, drilling, decommissioning
and potential accidental events) and impacts (both offshore and onshore) have been taken
into consideration in line with standard management system terminology. Environmental
and socioeconomic components were identified based on review of legislation and baseline
environment, consultations with stakeholders and SENES professional judgment. An

EEIIAA RReeppoorrtt FFoorr EExxpplloorraattoorryy DDrriilllliinngg AAccttiivviittiieess IInn NNEELLPP BBlloocckk CCYY--OOSSNN--22000099//22,, GGuullff OOff MMaannnnaarr,,
TTaammiill NNaadduu
P a g e | 87
SSeepptteemmbbeerr 22001144 | OIL
environmental or socio-economic impact may result from any of the identified project
aspects that are activity-component interaction.
The identified impacts are further discussed in detail in the following section with the
discussion focusing on those impacts which have been determined to be of higher
significance. This is followed by a point wise outline of the mitigation measures
recommended.
44..11..11 MMaarriinnee WWaatteerr aanndd SSeeddiimmeenntt IImmppaaccttss
Number of activities related to various phases of the proposed drilling activity has the
potential to impact marine water quality and consequently marine ecology adjacent to the
drilling locations. Some marine water quality impacts will also occur along corridors that are
proposed to be used for providing logistic support to the drilling rig. Some near shore
activities like handling of chemicals and oil may also impact marine environment. The section
below discusses important potential impacts to marine environment from the following
aspects:
• Disposal of drill cuttings and WBM
• Operational discharges like sanitary waste water, washing fluids (deck drainage, rig floor
washing etc.), cooling water, etc.
• Non-routine discharges that may be caused by ballast water, chemical spills, etc.
• Food waste and residuals
• Physical presence of the drilling rig
Impacts from Physical Presence of drilling rig are mainly related to marine organisms and are
hence dealt in separate preceding section.
Disposal of Drill Cuttings and Residual WBM
Drill cuttings, composed of rocky substrate like shale, clay, sandstone etc. are produced
during the drilling process and are separated from the mud. Typically, the solid medium used
in the drilling mud is barite (barium sulfate) as weighing agent, with bentonite clays as a
thickener. Drilling mud also contains a number of chemicals that are added depending on
downhole formation conditions.

EEIIAA RReeppoorrtt FFoorr EExxpplloorraattoorryy DDrriilllliinngg AAccttiivviittiieess IInn NNEELLPP BBlloocckk CCYY--OOSSNN--22000099//22,, GGuullff OOff MMaannnnaarr,,
TTaammiill NNaadduu
P a g e | 88
SSeepptteemmbbeerr 22001144 | OIL
Exploratory drilling program would comprise drilling six exploratory offshore wells. An
estimated average volume of 300 m3 of drill cuttings per well and 5-10 KL/day of drilling
fluid is likely to be prepared and recycled for drilling. Cuttings generated during riser less
drilling will be released directly to the seabed. Displaced cuttings released from bore hole to
the seabed would produce a mound of cuttings material close to the drilling location.
Cuttings generated during subsequent drilling phase will be returned to the offshore drilling
facility via marine riser system, where they will be separated from the mud for disposal.
These cuttings so generated will be decanted with high G force Linear motion shale shakers,
desanders, desilters, centrifuges will be discharged to the sea within the stipulated discharge
volume as per guidelines. A small portion of residual drilling mud is however likely to remain
attached to discharged cuttings.
Disposal of such cuttings into the sea from rig may lead to a number of possible adverse
impacts as listed below:
• Increase in suspended solids in the water column;
• Change in sediment particle size distribution and redox potential oxygen levels in the
sediment;
• Smothering of seabed species;
• Toxic effects due to chemical additives
• Impacts on Marine Water Quality
The main physical impacts on seawater from the discharge of cuttings and drilling fluids are
associated with a localized increase in water turbidity (due to increase in suspended solids) in
the vicinity of discharge point and minor changes in local water quality.
Impact on Benthic Fauna
The main impact on benthic fauna will be from physical smothering and restricted to areas
where cuttings are deposited. Studies suggest that biological effects of WBM contaminated
cuttings will be confined within 100 m from well location (Effects of Exploratory Drilling
Discharges on the Benthos. Gillmor R. B. Et al.,). Re-colonization of biota and recovery will be
well established within a year after disposal has stopped. Under less energetic wave and
current conditions, impacts recovery may take more time; however taking into account that
project site is located in Gulf of Mannar characterized by a high energy environment, impacts

EEIIAA RReeppoorrtt FFoorr EExxpplloorraattoorryy DDrriilllliinngg AAccttiivviittiieess IInn NNEELLPP BBlloocckk CCYY--OOSSNN--22000099//22,, GGuullff OOff MMaannnnaarr,,
TTaammiill NNaadduu
P a g e | 89
SSeepptteemmbbeerr 22001144 | OIL
on benthos due to smothering and physical disturbance are anticipated to be minimal and of
short duration. Toxic effects on marine species of this substratum are also not anticipated
due to low toxicity of mud formulation to be used for the proposed project. Data from
previous studies indicate that major biological changes in benthic communities mostly
extend to a maximum of 500 – 1000 m (GESAMP, 1993), in addition to minor detectable
changes extending to a maximum of about 3 – 5 km from the drilling location (Gray et al.,
1999).
Impacts on Marine Fauna
Fish could potentially be affected in the vicinity of the plume by large quantities of fine
grained sediments. Fine-grained particles may cause irritation by abrading protective
mucous coatings, reduce visual acuity and hence feeding behaviour and may reduce
respiration efficiency due to blocking of gills. Other species viz. sea turtles and mammals
would be expected to exhibit avoidance behaviour in response to increase in turbidity.
Therefore, on the whole, impacts on marine water quality and marine ecology resulting from
discharge of drilled cuttings and residual WBM can be considered to be of moderate
significance.
Cooling Water Discharges
Cooling water serves as coolant for various equipment including air conditioning condensers
and air compressors on rig and is prepared by deoxygenating and sterilizing seawater. After
passing through the cooling mechanism, the heated water so produced is subsequently
discharged back to sea surface and is expected to contain liberated chlorine at total free ion
concentrations <2 ppb. Potential adverse effects of the cooling water discharge would be
following:
• Entrainment of phytoplankton/zooplankton during intake resulting in sterilization of discharged water plume volume;
• Temperature differential between discharged and receiving waters; and
• Increase in toxicity due to anti-fouling chemical additives in the discharged cooling water
Drilling Rig would draw seawater for cooling nearly at a depth of about ~10 m below sea
surface and after cooling the water to be disposed off loses a significant amount of heat
through dissipation in pipe lines before getting on to the sea surface. Phytoplankton and

EEIIAA RReeppoorrtt FFoorr EExxpplloorraattoorryy DDrriilllliinngg AAccttiivviittiieess IInn NNEELLPP BBlloocckk CCYY--OOSSNN--22000099//22,, GGuullff OOff MMaannnnaarr,,
TTaammiill NNaadduu
P a g e | 90
SSeepptteemmbbeerr 22001144 | OIL
zooplankton found at this depth would be entrained in the uptake stream with a consequent
mortality due to rapid increase in ambient temperatures and highly disturbed water flow.
Since local production of plankton is sufficient to compensate for the estimated losses
resulting from seawater uptake, activity which will be done for very limited period of time,
significance of loss of plankton due to entrainment can considered to be minor.
Volume of cooling water that would be used during drilling program (in comparison to the
whole of the Gulf of Mannar) would be very small. Impacts to the fish populations through
entrainment of juveniles and embryos in cooling water uptake would therefore be unlikely to
cause any long-term or significant damage to this population.
The other primary concern associated is the potential of discharged heated water to have
direct effects on physiology of individual species within the area of the discharge plume.
Impacts resulting from thermal inputs effectively apply primarily to fish that have the
capacity to mitigate exposure by means of behavioural responses. In large water bodies such
as the Gulf of Mannar where emigration is possible in any direction from the area of elevated
temperature, fish mortalities are not likely to occur. As a result, impacts resulting from such
heated water discharges on marine fauna may be considered to be insignificant.
For proposed exploratory project, cooling water on rig is not likely to be subjected to any
antifouling chemical treatment; hence any impacts resulting from the discharge of same have
not been assessed.
Discharge of Grey and Black Water
It is estimated that Drilling rig operations will result in the generation of about 9 m3/day of
sewage and wastes from kitchen, shower and laundry area. Sewage will be subsequently
discharged into marine environment after passing it through a screen less than 25 mm
diameter prior to discharge. It is likely that such discharge can result in localized organic
enrichment in the vicinity of the discharge point that in turn can result in potential oxygen
depletion in the discharge plume resulting in some minor disturbance to the marine
ecosystem close to point of discharge. It is expected that treatment/maceration of effluents
carried out on the Drilling rig marine sanitation units would rapidly reduce the Biochemical
Oxygen Demand (BOD) at and near the sewage discharge point to levels that are
insignificant. Such treatment will be done in compliance with MARPOL 73/78 requirements.
Water currents would also assist dilution and dispersion of discharged material and would

EEIIAA RReeppoorrtt FFoorr EExxpplloorraattoorryy DDrriilllliinngg AAccttiivviittiieess IInn NNEELLPP BBlloocckk CCYY--OOSSNN--22000099//22,, GGuullff OOff MMaannnnaarr,,
TTaammiill NNaadduu
P a g e | 91
SSeepptteemmbbeerr 22001144 | OIL
eventually restore oxygen and nutrient levels to background conditions. Impacts on marine
water quality and marine organisms are therefore considered to be significantly low.
Disposal of Bilge Fluids and Drainage Water
Bilge and drainage waters generated on Drilling rig have the potential to be contaminated
with oily wastes. Drilling rig will be having designated containment and bunding zones
where oil products will be used and stored. While no wastes will be routinely discharged by
deck drains, wash down of the decks, rig floor, pipe rack etc may result in minor quantities of
chemical residues (primarily oil and grease) entering into the marine environment. Drainage
water discharges would therefore contain very low levels of oil and would be readily
dispersed after discharge resulting only in some minor localized impact on marine species.
Bilge fluids generated will be treated on-site on Drilling rig in water/oil separator. Effluents of
separated oil will be shipped to onshore periodically in special drums/containers whereas
effluent of separated water will be discharged in sea. Concentration of oil in water
discharged will be restricted to less than 15 ppm in accordance with the International
Convention for the Prevention of Pollution from Ships, 1973, as modified by the Protocol of
1978 (MARPOL 73/78). Meeting requirements for disposal of oil or oily mixtures at sea, any
impact arising from discharge of such treated effluent is therefore considered to be
negligible.
Disposal of Kitchen & Food Wastes
Kitchen & Food waste generated from drilling rig would be macerated (by passing it through
25 mm screen) and discharged directly to water column. Large-scale discharges of organic
material can result in increased biological productivity in the vicinity of the discharge point
with a resultant reduction in dissolved oxygen in receiving waters. Given the limited number
of personnel that would be onboard rig (i.e. maximum 100) combined with the anticipated
level of dispersion and mixing of wastes in water column, it is considered that impacts on
marine water ecosystem from discharge of such wastes may be incrementally positive.
Non Routine Discharges
Ballast Water Discharges
The discharge of ballast water from vessels coming into the area can be categorized as a
non-routine discharge and may lead to introduction of exotic species contained in ballast

EEIIAA RReeppoorrtt FFoorr EExxpplloorraattoorryy DDrriilllliinngg AAccttiivviittiieess IInn NNEELLPP BBlloocckk CCYY--OOSSNN--22000099//22,, GGuullff OOff MMaannnnaarr,,
TTaammiill NNaadduu
P a g e | 92
SSeepptteemmbbeerr 22001144 | OIL
water and displacement of native species. Discharge of ballast water from Drilling rig and
vessels while in the area of operations may also lead to release of low levels of oils and
chemicals into marine environment. Although the probability of ballast water being
discharged during the project is considered to be high, scope of impact will be local with
intensity of such impact varying from low to medium. However, it will be ensured that any
discharge of ballast water would be carried out following international maritime guidance
and legal requirements.
Flare Drop Out
Inefficient combustion of hydrocarbon products could result in release of unburnt or partially
burnt hydrocarbons to water column potentially resulting in formation of a small slick of oil
on sea surface resulting in localized surface oil pollution. Oil on the sea surface may result in
fouling of seabirds and/or marine mammals and introduction of a small amount of
hydrocarbon products to water column. However, hydrocarbon dropout is considered to be
of low importance based on local scope, medium persistence (considering flaring to be an
intermittent operation spanning for a period of 1-2 days), medium intensity and medium
probability (flaring may or may not be carried out depending on hydrocarbon shows) and
OIL will ensure that environmentally safe well testing is carried out with separators and
standard flare booms as per OISD and P&NG 2008 guidelines, this keeping the risk as low as
reasonably possible.
Chemical Spills on Sea
Impacts resulting from chemical spills may occur during storage and handling of drill
chemicals on Drilling rig and also during transfer operations from supply vessels. Chemical
spills will have direct toxicity effects on marine biota. The severity of such impacts will be
limited in the proposed drilling operations by the use of approved low toxicity chemicals.
Any exposure of staff directly or indirectly with spilled chemicals could also have impacts on
occupational health and safety. Moreover, probability of any such impacts is expected to be
low because of adoption of safeguards through transfer and storage procedures by OIL and
proper usage of Personnel Protective Equipment (PPE) for personnel handling chemicals and
overall the impact may be assessed to be of low importance due to the local scope and low
probability, although it might have a moderate severity.

EEIIAA RReeppoorrtt FFoorr EExxpplloorraattoorryy DDrriilllliinngg AAccttiivviittiieess IInn NNEELLPP BBlloocckk CCYY--OOSSNN--22000099//22,, GGuullff OOff MMaannnnaarr,,
TTaammiill NNaadduu
P a g e | 93
SSeepptteemmbbeerr 22001144 | OIL
44..11..22 NNooiissee IImmppaaccttss
Project related activities including offshore drilling will lead to considerable local level
emission of noise that may have significant impact on the occupational health of drilling
crew and personnel housed on the drilling rig. Potential impacts on noise quality may arise
from air borne noise generated during drilling operations of rotary drilling equipment as part
of rig, diesel engines for power generation and mud pumps, leading to perceptible increase
in noise levels in immediate vicinities. Noise is also likely to be generated during rig
mobilization and also during operation of supply vessels and helicopter movements.
However, such noise generated will be comparable in level to other drilling related activities
and would be continuous in places (drilling location and ports) and intermittent along
transportation routes. The value range of noise generated from various sources during
offshore exploratory drilling operations is as follows:
• Helicopter : 103 to 105 dB(A)
• Diesel Generators : 100 to 105 dB(A)
• Mud Pumps at the Rig : 90 to 100 dB(A)
• Miscellaneous : 80 to 85 dB(A)
• Upper Decks : 65 to 73 dB(A)
• Control Room & Quarters : 50 to 60 dB(A)
In addition, drilling would also result in generation of underwater noise which has a potential
to affect the marine ecology in and around the drill locations. The following sections discuss
the noise quality related impacts and assign significance to each of them.
Atmospheric Noise Emanated from Rig and DG Sets
Drilling rig and associated machinery, including high power DG sets, mud pumps, shakers,
etc. will emit very high noise during drilling operations. Typical noise levels emanated from
drilling rig and DG sets are in the order of 95 – 100 db (A) and 100 -105 db (A) respectively.
Moreover, as drilling is a continuous activity, such noise will be emitted during both daytime
and nighttime and may lead to significant impact on drilling crew on rig, unless proper
mitigation measures are implemented. The offshore project block is located in shallow sea
but at a considerable distance from the coastal area, so the above impacts are expected to
be localized and have potential effect only on workers at site. Continuous exposure to high
noise in workplace environment is known to cause Noise Induced Hearing Loss (NIHL) and

EEIIAA RReeppoorrtt FFoorr EExxpplloorraattoorryy DDrriilllliinngg AAccttiivviittiieess IInn NNEELLPP BBlloocckk CCYY--OOSSNN--22000099//22,, GGuullff OOff MMaannnnaarr,,
TTaammiill NNaadduu
P a g e | 94
SSeepptteemmbbeerr 22001144 | OIL
other discomforts like headaches and increase in stress levels in humans. However, the
planning for the project and OIL prevailing management system procedures stipulate that all
workers employed for the project would be wearing appropriate noise reduction PPEs and
will be shielded from such noise to a considerable extent. Also, scientific evidence suggests
that sea birds generally avoid locations with high noise and would alter their course to
circumvent the area of the drilling locations while flying by. Evidence from earlier studies also
corroborate the fact that birds are generally unperturbed by offshore installations and
operational activities. Consequently, it may be concluded that atmospheric noise related
adverse impacts due to drilling will be of medium significance.
Underwater Noise Generated by Drilling Activity
Operation of rotary drilling equipment and associated machineries during drilling operations
will result in generation of underwater noise. Underwater noise so generated has potential to
cause direct and indirect effects on fish and marine mammals. Data upon which to evaluate
significance of such underwater acoustic disturbance is however, limited primarily because
of:
• Complex behaviour of sound and pressure waves in water;
• Restricted availability of effects of noise on specific species and especially with regard to Arabian sea species; and
• Effect that environmental conditions play on behaviour of noise emissions.
Underwater noise likely to be generated during drilling operations may induce localized
behavioural changes such as avoidance in some species (marine mammals and fishes),
however there is no evidence of significant changes such as alteration of reproductive
behaviour due to underwater drilling noise that result in secondary and tertiary
environmental impacts on wider marine ecosystem. Avoidance behaviour in these species
may cause certain species to leave their feeding, nesting or breeding areas temporarily if the
disturbance is prolonged or repeated, but the area being located considerably away from the
coast, possibility of such areas existing near the drill locations is improbable. Fishes are
known to congregate around offshore installations and it is considered that they become
accustomed to predictable noise from sources such as stationary offshore sites and ships
that follow a constant course (Norris & Reeves, 1978). Considering the intermittent nature of
project, such impacts are considered to be of low significance with the species returning to
drill location once these short lived activities have been completed.

EEIIAA RReeppoorrtt FFoorr EExxpplloorraattoorryy DDrriilllliinngg AAccttiivviittiieess IInn NNEELLPP BBlloocckk CCYY--OOSSNN--22000099//22,, GGuullff OOff MMaannnnaarr,,
TTaammiill NNaadduu
P a g e | 95
SSeepptteemmbbeerr 22001144 | OIL
Noise Emanated from Supply Vessels and Helicopter Movement
Supply vessels and helicopters will be deployed for transportation of resources (water, fuel
and equipment) and personnel to the drilling rig respectively. This will result in an
incremental increase of noise levels because of additional maritime traffic along the supply
routes as well as increase in noise levels at onshore facilities for OIL’s offshore project.
However, noise levels increase will be intermittent along transportation routes having only
localized impacts along the corridor. Also, since there exists predefined shipping routes near
to Tuticorn / Kakinada base, it may be expected that marine animals in this region are
accustomed to noise generated from passing vessels. Although vessel activity along the
shipping route between shore and offshore block would increase, it is expected that if
animals initially displayed avoidance behavior, they would eventually return to the affected
area once they become accustomed to the increased noise levels or once noise source had
moved or ceased. Taking into account limited movement of such vessels and helicopters any
cumulative noise related impacts arising from vessel activities are therefore considered to be
negligible. In addition, noise impacts are measured in terms of logarithmic equivalent (LeQ)
averaged over hours, considering transient nature of project and intermittent plying of
transport vessels and helicopters (moving sources), no significant impact is envisaged.
44..11..33 MMaarriinnee EEccoollooggiiccaall IImmppaaccttss
Impacts from Physical Presence of Rig
MODU to be utilized for the proposed offshore exploratory project may be Drill ships &
Semi-Submersible drill ship, which will be stationed at each of the drilling locations for a
period of about 35-45 days. Underwater structures and apparatus like risers will be sunk
from MODU to the sea floor to enable drilling operations.
Impact on marine habitat from previous experience, physical presence of the proposed
offshore drilling unit and associated structures are not known to cause any adverse effect on
the movement and migration of fish and other marine organisms. On the contrary, physical
structures viz. the marine risers, well head provide new stable hard areas equivalent to
natural outcrops which surface living animals can colonize. Development of colonies may in
fact be beneficial for the local fish populations. In this event, the structures may attract
marine species to the area as the structures in effect form artificial reefs where fish can seek
food, shelter and protection. Such positive effects have been confirmed by research studies

EEIIAA RReeppoorrtt FFoorr EExxpplloorraattoorryy DDrriilllliinngg AAccttiivviittiieess IInn NNEELLPP BBlloocckk CCYY--OOSSNN--22000099//22,, GGuullff OOff MMaannnnaarr,,
TTaammiill NNaadduu
P a g e | 96
SSeepptteemmbbeerr 22001144 | OIL
conducted on fish population near offshore installations. Such studies have revealed that fish
growing around the manned and unmanned installations were found to grow better than
those caught at a remote site unaffected by man made structures (Mathers et al., 1992b). It
was also found that fish caught around the man-made installations were in good condition
with no evidence of lesions or other defects on their skin (Mathers et al., 1992b). This
indicates that there may be a beneficial effect accrued on fish stocks because of presence of
the offshore drilling unit. In addition, considering limited area to be occupied by underwater
structures of MODU, it is unlikely that it would cause any hindrances or pose any collision
threats to movements of mammals.
Impacts on Marine Microorganisms
The main factors that influence phytoplankton production are light and nutrient availability.
Turbidity generated as a result of discharge of cuttings and residual WBM in water column
may increase reflection and scattering of light thus reducing light penetration and
subsequently biological activity. The presence of a turbid plume that reduces light
penetration into the primary production zone (i.e. upper portion of water column) could
result in a reduction in photosynthetic activity that in turn would lead to a reduction in
nutrient uptake. Reductions in primary productivity would only persist for as long as a turbid
plume will be present and would only be observable close to cuttings discharge point. As
unused nutrients would remain in the water column and would still be available after plume
dilution, production rates would be expected to eventually return to normal.
Experimental studies on spent and discharged WBM have shown that some physical damage
in zooplankton can occur at total suspended solids (TSS) concentrations in excess of 30 g/l.
TSS concentrations in excess of 30 g/l are only expected to occur in the most turbid part of
the plume close to discharge point during calm weather periods when plume dispersion is
limited. Zooplankton is unlikely to be physically affected by increased turbidity as a result of
cuttings discharge from Drilling rig (except possibly in a very small zone surrounding the
immediate point of discharge) as plume would be expected to disperse quite rapidly to
levels well below 30 g/l TSS.
Interference to Migratory Behaviours
Operation of supply vessels from the onshore base, Tuticorin or Kakinada, may cause some
minor interference in the movements of turtles and mammals is anticipated. As per the

EEIIAA RReeppoorrtt FFoorr EExxpplloorraattoorryy DDrriilllliinngg AAccttiivviittiieess IInn NNEELLPP BBlloocckk CCYY--OOSSNN--22000099//22,, GGuullff OOff MMaannnnaarr,,
TTaammiill NNaadduu
P a g e | 97
SSeepptteemmbbeerr 22001144 | OIL
various studies on turtle occurrence in Gulf of Mannar, though April to September is the
period when turtle occur, turtles are also reported in October to January. The mammals like
dolphins are also reported to be observed in deep waters but their location is not certain.
Therefore supply vessels will be provided with expert marine mammal observer so that any
collision to these marine mammals can be avoided.
Illumination Related Impacts The physical presence of the MODU is also to be felt at night because of the illumination at
night by deck and navigational lights. Other possible sources of illumination will be flaring
conducted for a short period of time during well testing phase. Artificial lighting and well
testing flares may result in the attraction of marine species leading to their disorientation
and confusion behaviour. Lights on the rig may also result in the sea birds concentrating on
the immediate vicinity of the rig; however the operation is short term in nature and is not
likely to have a significant impact.
44..11..44 SSoocciioo--EEccoonnoommiicc IImmppaaccttss
The villagers from villages located on Gulf of Mannar coastline show fishing as one of their
occupation. Other related occupational activities include fish processing, chank collection
and processing, sea weed collection, salt works and other service areas in agriculture and
private works. Valinokkam, Rameswaram and Mandapam has the main fishing Jetties.
Chinnaerwadi, Thoothukudi and Rameshwaram have Fish landing centre with fish landing
center proposed at Mandapam.
Fishing is done by both, small boats and trawlers. The small boat owners fish up to 1 km
from coast whereas big boast and trawlers venture deep in sea and at times go beyond 100
km from coast. Fishes like crab, shrim, tuna, pomfret, needl fish, ribbion fish, Indian goat fish,
hurrel, etc. are commonly found. Thus with nearest prospect area – Prospect Area 3 being
located at distance of 28 km from coast, no impacts is envisaged on small fishermen’s fishing
areas. As the Prospect Areas are between 28 km to 45 km from the nearby coast, no impacts
is envisaged on big boats and trawlers which venture deep into sea, expect for any required
shift in route of movement of fishing areas. The coastal areas show salt producing activities
also but are limited to villages located towards west side of block in Tuticorin. Tamil Nadu is
the 2nd largest salt producing state in India. 14% of India's and 70% of Tamil Nadu's Salt
production is from Tuticorin. Apart from this Tamil Nadu Salt Corporation (TNSC) is

EEIIAA RReeppoorrtt FFoorr EExxpplloorraattoorryy DDrriilllliinngg AAccttiivviittiieess IInn NNEELLPP BBlloocckk CCYY--OOSSNN--22000099//22,, GGuullff OOff MMaannnnaarr,,
TTaammiill NNaadduu
P a g e | 98
SSeepptteemmbbeerr 22001144 | OIL
developing its unit at Valinokkam. There will not be any direct impact on salt production as
the block is located in deep offshore but oil spill may have potential to impact them. Thus
impacts due to proposed exploration activity could be on the existing fishing areas off the
coast and salt pans on coastal areas, affecting the livelihood of fishermen and salt workers,
of any accidental oil spill, depending upon severity of spill.
Sea traffic will get marginally increased due to supply vessels as probably 1 or 2 vessels/week
(as per the requirements) will voyage from Tuticorin or Kakinada supply base to exploration
area. But this being a short term activity, effect on fishing activity in the region will be
minimal.
Important religious and tourist destinations - Shree Ramanathaswamy Temple in
Rameshwaram and Kothandaramaswamy Temple in Dhanushkodi are located towards north
side of coastal areas of block but these not located on Gulf of Mannar side but are located
on Palk Bay side at approximate aerial distance of 34 km and 30 km respectively. The Adam's
Bridge, also known as Rama's Bridge or Rama Setu is located at approximate aerial distance
of 25 km towards northeast from nearest prospect area – Prospect Area 3. No impact is
envisaged on these locations because of the planned exploratory drilling operation. Any
accidental oil spill, depending upon severity of spill, can cause disturbance to these locations
if oil spill is significant and oil tars are washed to these locations, considering the religious
and historical importance of these places.
44..22 MMIITTIIGGAATTIIOONN MMEEAASSUURREESS FFOORR SSIIGGNNIIFFIICCAANNTT EENNVVIIRROONNMMEENNTTAALL IIMMPPAACCTTSS
44..22..11 MMuudd mmaakkee--uupp aanndd MMuudd && CCuuttttiinnggss ddiissppoossaall
Mitigation measures for discharge of mud & cuttings will include the following:
• Strict compliance with regulatory provisions relating selection of drilling fluid chemicals, separation of drilling fluid from cuttings and proper washing of drill cuttings;
• Design of disposal mechanism to ensure compliance of stipulated limiting parameters and sufficient dispersal of discharged cuttings, thereby causing minimal impacts on marine water productivity; and
• Monitor effective functioning of outfall equipments during operations.

EEIIAA RReeppoorrtt FFoorr EExxpplloorraattoorryy DDrriilllliinngg AAccttiivviittiieess IInn NNEELLPP BBlloocckk CCYY--OOSSNN--22000099//22,, GGuullff OOff MMaannnnaarr,,
TTaammiill NNaadduu
P a g e | 99
SSeepptteemmbbeerr 22001144 | OIL
44..22..22 RReessttoorraattiioonn PPllaannss aanndd RRiigg DDeeccoommmmiissssiioonniinngg MMeeaassuurreess
After drilling and initial testing, if the well does not contain commercial quantities of
hydrocarbon, the well is plugged and abandoned as per OISD guidelines of P&NG rules
2008. Open rock formations are sealed with cement plugs to prevent upward migration of
wellbore fluids and corrosion cap is placed and the site is decommissioned to a safe and
stable condition with adequate monitoring. The hazardous waste from onshore support
facility - Temporary supply base will be sent to authorized hazardous waste disposal facility.
44..22..33 RReessttoorraattiioonn ooff OOnn--SShhoorree SSuuppppoorrtt FFaacciilliittiieess OOnn--LLaanndd
Being primarily an offshore project, potential impacts on soil quality may be only linked to
setting up of an onshore facility at Tuticorin/ Kakinada base for storage of resources like
chemicals and drill pipes near to the port and for initiating logistic and service operations
that will continue throughout project operations till decommissioning. Potentially, the key
impact on soil may be contamination resulting from accidental spillage of chemicals, oil and
lubricants during storage and handling operations. Improper storage within the onshore
storage facility on open soil or unpaved areas may result in contamination of soil. The impact
on soil may be considered as medium. The onshore waste disposal facility will be used for
disposal of unused mud and drill cuttings, which will be hazardous in nature (shipped
onshore from the rig in the case that OBM is used) and thus its disposal on open soil or
unpaved areas may result in contamination of soil. The hazardous waste will be sent to
authorized hazardous waste disposal facility.
44..22..44 MMeemmbbeerrsshhiipp ooff CCoommmmoonn DDiissppoossaall FFaacciilliittiieess
The solid waste generated on the rig will be segregated and stored in colour coded bags.
The solid waste will be transported back using support vessels or with the rig, to the
Tuticorin/ Kakinada base supply base of OIL. At Tuticorin/ Kakinada base supply base the
segregated waste will be treated separately. Hazardous waste, if any, will be sent to
authorized hazardous waste recyclers and disposal facility.
44..22..55 MMeeaassuurreess ttoo HHaannddllee OOiillyy WWaassttee DDiisscchhaarrggeess
Bilge and drainage waters generated on the rig have the potential to be contaminated with
oily wastes. Drilling rig will be having designated containment and bunding zones where oil

EEIIAA RReeppoorrtt FFoorr EExxpplloorraattoorryy DDrriilllliinngg AAccttiivviittiieess IInn NNEELLPP BBlloocckk CCYY--OOSSNN--22000099//22,, GGuullff OOff MMaannnnaarr,,
TTaammiill NNaadduu
P a g e | 100
SSeepptteemmbbeerr 22001144 | OIL
products will be used and stored. While no wastes will be routinely discharged by deck
drains, wash down of the decks, rig floor, pipe rack etc may result in minor quantities of
chemical residues (primarily oil and grease) entering into the marine environment. Drainage
water discharges would therefore contain very low levels of oil and would be readily
dispersed after discharge resulting only in some minor localized impact on marine species.
Bilge fluids generated will be treated on-site on the rig, in water/oil separator. Effluents of
separated oil will be shipped to onshore periodically in special drums/containers with
effluent of separated water being discharged in sea. Concentration of oil in water discharged
will be restricted to less than 15 ppm in accordance with the International Convention for the
Prevention of Pollution from Ships, 1973, as modified by the Protocol of 1978 (MARPOL
73/78). Impact due to disposal of oil or oily mixtures at sea, arising from discharge of such
treated effluent is therefore considered to be negligible.
Mitigation Measures
Typical mitigation measures include:
Use of well maintained oil/water separator;
• Operational controls covering materials storage, wash-downs and drainage systems;
• Maintaining a high level of housekeeping on board and proper training of crew in adhering to the Shipboard Oil Pollution Prevention Plan (SOPEP) and usage of SOPEP kit and accessories
• Design an adequate storm water drainage system to allow oily waste and potential contaminated liquid waste to be collected and contained separately from clean storm water
44..22..66 SSeewwaaggee TTrreeaattmmeenntt aanndd DDiissppoossaall
Black Water also known as sewage will be generated from toilets on the rig and will primarily
include faecal material and urine. Rig operations will typically result in the generation of 9 m³
of sewage per day. Once collected through headers, they will be passed through a sewage
treatment plant (STP). The wastes will then be passed through a screen of less than 25 mm
diameter and an extended aeration system prior to their discharge into the marine
environment. In this case also, sewerage treatment on-site will be done in compliance with
MARPOL 73/78 requirements.

EEIIAA RReeppoorrtt FFoorr EExxpplloorraattoorryy DDrriilllliinngg AAccttiivviittiieess IInn NNEELLPP BBlloocckk CCYY--OOSSNN--22000099//22,, GGuullff OOff MMaannnnaarr,,
TTaammiill NNaadduu
P a g e | 101
SSeepptteemmbbeerr 22001144 | OIL
44..22..77 SSoolliidd WWaassttee HHaannddlliinngg
Combustible and non-combustible wastes routinely generated at offshore facilities will be
segregated at source and shipped to shore for re-use, recycling, or disposal. Efforts will be
made to eliminate, reduce, or recycle wastes at all times.
A waste stream inventory for the proposed offshore exploratory drilling project will be
compiled to identify predicted wastes for the spectrum of activities throughout the lifetime
of the project. Overall, the project waste management strategy will be adopting an effective
solid waste treatment hierarchy. However, the ultimate responsibility for effective waste
disposal lies firmly with OIL, who will ensure that the project contractor(s) have adequate
training and follow stipulated waste management procedures for minimizing, handling and
storing waste; waste disposal contractor(s) use facilities for treatment and disposal of waste
that meet acceptable standards; and audits are carried out to ensure these are achieved.
Detailed waste management procedures will be put in place and all personnel employed at
on the rig will receive formal waste management awareness training, particularly regarding
the proper waste segregation, storage and labelling procedures and potential recycling of
waste.
44..22..88 SSppeenntt OOiill HHaannddlliinngg
Spent oil collected during the various activities of the offshore drilling on drilling rig will be
collected and stored separately in the labelled containers. These containers will then be sent
to onshore Tuticorin/ Kakinada base supply base from where it will be finally sent to the
authorized hazardous treatment facility.
44..22..99 OOiill HHaannddlliinngg ffrroomm WWeellll TTeesstt OOppeerraattiioonnss
Once drilling operations are completed and if sufficient indications of hydrocarbons are
noticed while drilling, the well may be tested by perforations. It is estimated that well testing
period would be about 1-2 days per well. Well testing will be carried out in accordance with
Well Testing Program to safely meet program objectives.
Produced Water from well testing, if carried out, will be stored in storage tanks, gas will be
flared, and water will be discharged to sea after treatment. Oil will be transported to base
facility.

EEIIAA RReeppoorrtt FFoorr EExxpplloorraattoorryy DDrriilllliinngg AAccttiivviittiieess IInn NNEELLPP BBlloocckk CCYY--OOSSNN--22000099//22,, GGuullff OOff MMaannnnaarr,,
TTaammiill NNaadduu
P a g e | 102
SSeepptteemmbbeerr 22001144 | OIL
44..22..1100 NNooiissee AAbbaatteemmeenntt MMeeaassuurreess
The following mitigation measures will be adopted for noise reduction during the proposed
offshore exploratory drilling
• Install sufficient engineering control on machineries (like mufflers, enclosures, etc.) to reduce noise and vibration emission levels at source;
• Ensure that staff mobilized for the project is trained to use Personnel Protective Equipments (PPE) like ear plugs/muffs and aware of noise related safeguards at workplace;
• Identify areas sensitive for marine life such as feeding, breeding, calving, and spawning areas in close proximity to the drill locations;
• Undertake planning of navigational route for the drilling rig and supply vessels to avoid Potential Fishing Zones and sensitive habitats in Arabian Sea;
• Undertake proper preventive maintenance of supply vessels, helicopters and DG sets to reduce noise levels;
• Check if the planned exploratory activities coincide with any migratory behaviour or with spawning / hatching of marine species in the area;
• Monitor presence of any sensitive species in the study area prior to the onset of any exploratory activity;
• Maintain a 500 m exclusion zone while locating drilling location, if marine species are sighted congregating in close proximity to such operational areas;
• Maintain relatively safe speed for vessels transporting equipment and fuel to the project site in Arabian Sea
44..22..1111 MMeeaassuurreess ttoo MMiinniimmiizzee DDiissttuurrbbaannccee DDuuee ttoo LLiigghhtt aanndd VViissuuaall IInnttrruussiioonnss
The physical presence of the drilling rig is also to be felt at night because of the illumination
at night by deck and navigational lights. Other possible sources of illumination will be flaring
conducted for a short period of time during well testing phase. Artificial lighting and well
testing flares may result in the attraction of marine species leading to their disorientation
and confusion behaviour. However, such behaviour is particularly observed in hatchelling
turtles, female turtles and sea birds. Lights on the rig may also result in the sea birds
concentrating on the immediate vicinity of the rig; however the operation is short term in
nature and is not likely to have a significant impact. As physical presence at drilling location

EEIIAA RReeppoorrtt FFoorr EExxpplloorraattoorryy DDrriilllliinngg AAccttiivviittiieess IInn NNEELLPP BBlloocckk CCYY--OOSSNN--22000099//22,, GGuullff OOff MMaannnnaarr,,
TTaammiill NNaadduu
P a g e | 103
SSeepptteemmbbeerr 22001144 | OIL
is intrinsically linked with the proposed drilling activities, and the fact that the adverse
environmental impacts are minimal, no mitigation measures are proposed to further reduce
the impacts. However, a reconnaissance survey will be carried out before the finalization of
the drill locations to ensure that the area is not the point of convergence or gathering for
any sensitive marine species.

EEIIAA RReeppoorrtt FFoorr EExxpplloorraattoorryy DDrriilllliinngg AAccttiivviittiieess IInn NNEELLPP BBlloocckk CCYY--OOSSNN--22000099//22,, GGuullff OOff MMaannnnaarr,,
TTaammiill NNaadduu
P a g e | 104
SSeepptteemmbbeerr 22001144 | OIL
55 EENNVVIIRROONNMMEENNTTAALL MMOONNIITTOORRIINNGG PPRROOGGRRAAMM
Monitoring is one of the most important components of a management system. OIL’s
Internal Management System requires continuous monitoring to be carried out for various
aspects of the project, environmental, safety and health impacts and the performance of
EMP implementation. Monitoring indicators have been developed for each of the activity
considering the mitigation measures proposed. Real time measurements of these indicators
will be carried out during drilling and data will be submitted to MoEF. As per statutory
requirements of MoEF OIL is required to record daily discharge of drill cuttings & drilling
fluids in sea and also to monitor the effluent quality. Compliance report will be prepared and
it will be submitted to MoEF on 6 monthly basis or as per the conditions specified by MoEF.
Monitoring results would be to be documented, analyzed and reported internally to Offshore
Drilling Supervisor, Wells Operations Manager and HSE Coordinator. Monitoring
requirements have been described in the following table. Frequency of monitoring and
responsibility of carrying out the monitoring have also been presented in the table.

EEIIAA RReeppoorrtt FFoorr EExxpplloorraattoorryy DDrriilllliinngg AAccttiivviittiieess IInn NNEELLPP BBlloocckk CCYY--OOSSNN--22000099//22,, GGuullff OOff MMaannnnaarr,, TTaammiill NNaadduu
P a g e | 105
SSeepptteemmbbeerr 22001144 | OIL
Table 5-1: Environmental Monitoring Program
Sr. No.
Particular Criteria/Regulation Parameter to be Monitored Frequency of Monitoring
Responsibility
1 Location of drilling wells
No drilling within 1 km distance from coast as per the requirement of MoEF in ToR issued for
the block CY-OSN-2009/2
Drilling locations At drilling program planning stage
Drilling HSE team
Being a offshore block located at least 11 km away from nearby coast, OIL has planned to
drill the exploratory wells beyond 31 km from the coast, thus meeting the MoEF requirement.
2 Quality of sea water
As per the ToR issued by MoEF for the block baseline sampling need to be carried out at the
locations within distance of 1 km from each well.
Marine Surface Water: Physico-chemical parameter - pH, Conductivity, Salinity,
Total Suspended Solids, Turbidity, Oil & Grease, Poly Cyclic Aromatic
Hydrocarbons (PAH), Total Petroleum
Hydrocarbons
Ecological parameter- phytoplankton & zooplankton
One before and one after
completion of entire drilling
program
Basin HSE team through MoEF &
NABET recognized monitoring
agency OIL to ensure that samples to be collected after completion of drilling program, from the same
locations as is collected in baseline
Physico-chemical characteristics of marine surface water & sediment Sediment: Physico-chemical parameter
pH, Colour, Order, Oil & Grease, Poly Cyclic Aromatic Hydrocarbons (PAH), Total Petroleum Hydrocarbons, Barium, Mercury
Ecological parameter – macro, meio and micro benthos

EEIIAA RReeppoorrtt FFoorr EExxpplloorraattoorryy DDrriilllliinngg AAccttiivviittiieess IInn NNEELLPP BBlloocckk CCYY--OOSSNN--22000099//22,, GGuullff OOff MMaannnnaarr,, TTaammiill NNaadduu
P a g e | 106
SSeepptteemmbbeerr 22001144 | OIL
Sr. No.
Particular Criteria/Regulation Parameter to be Monitored Frequency of Monitoring
Responsibility
3 Use of mud MoEF in ToR issued for the block CY-OSN-2009/2 has asked to provide commitment for the use of Water Based Mud (WBM) and use synthetic oil based mud (SOBM) in case of
specific hole problems.
Quantity & Characteristics of mud to be used
After procurement & before use of
material
Drilling HSE team
OIL is committed towards using of only Water Based Mud (WBM) for the offshore exploratory
drilling operations. However, Low Toxic synthetic oil based mud (LTSOBM) will be used
to combat specific hole problems.
Quantity of mud used
Quality & Quantity of mud discharged
Mud discharge location
4 Water Usage Commitment to use an average of 20-30 m3/day of water during the drilling period
Monitor the quantity of water being used in vessel
Per well water usage
Drilling HSE team
5 Noise Generation
Noise levels to which drilling crew is exposed Noise monitoring at rig Daily Drilling HSE team
6 Drilling Mud and Cuttings
Drilling Mud Quantity & Characteristics Once for each well
Drilling HSE team Drill cuttings Quantity
7 Effluents Drilling Effluents Volume & Quality Drilling HSE team Deck drainage Volume & Quality
Sanitary wastes- volume & regular quality as per MARPOL
Volume & Quality

EEIIAA RReeppoorrtt FFoorr EExxpplloorraattoorryy DDrriilllliinngg AAccttiivviittiieess IInn NNEELLPP BBlloocckk CCYY--OOSSNN--22000099//22,, GGuullff OOff MMaannnnaarr,,
TTaammiill NNaadduu
P a g e | 107
SSeepptteemmbbeerr 22001144 | OIL
Detailed Budget and Procurement Schedules of Environmental Monitoring
OIL has regular procurement plans for various operations related to hiring of drilling rig
services and associated facilities. These also include related to various aspects related to
environmental management measures. Thus procurements related to EMP are inbuilt in the
procurement requirement of OIL. Various man power requirements are supplied by
Corporate HSE teams of OIL.

EEIIAA RReeppoorrtt FFoorr EExxpplloorraattoorryy DDrriilllliinngg AAccttiivviittiieess IInn NNEELLPP BBlloocckk CCYY--OOSSNN--22000099//22,, GGuullff OOff MMaannnnaarr,,
TTaammiill NNaadduu
P a g e | 108
SSeepptteemmbbeerr 22001144 | OIL
66 AAddddiittiioonnaall SSttuuddiieess
66..11 RRIISSKK AASSSSEESSSSMMEENNTT
The risk assessment encompasses identification of risks involved in the drilling process and
the associated activities in the drilling program, and assessment of probability that may
result in certain consequences.
66..11..11 DDiiffffeerreenntt SSttaaggeess dduurriinngg WWhhiicchh RRiisskk AAsssseessssmmeennttss AArree UUnnddeerrttaakkeenn
Exploration drilling activity can be broken into a series of stages during which different risk
assessments are undertaken:
• Pre-operational risk assessments and regulatory approvals
• Well design
• Selection of rig, equipment and services
• Pre-mobilisation
The current Risk Assessment has been undertaken prior to commencing a drilling operation,
and as part of the regulatory permitting requirements. Thus this assessment involves
evaluation and disclosure of major risks to the members of the Expert Appraisal Committee
of MoEF and other regulators, and demonstrates that the exploratory wells, in principle, can
be drilled in a manner not resulting in harm to individuals or damage to the environment.
This assessment relies on environmental and social sensitivities associated in the region, data
on past accidents in the oil and gas industry, information on past E&P activities undertaken
by OIL in general and specifically in this area / region, and HSE management systems of OIL.
This study however has certain limitations in absence of sufficient details of the Drilling Rig
or associated support systems to be deployed for the proposed exploratory drilling program.
This section aims to provide a systematic analysis of the major risks that may arise as a result
of offshore exploration activities of OIL in the CY-OSN-2009/2 Block. The Quantitative Risk
Assessment (QRA) processes outlines rational evaluations of the identified risks based on
their significance and provide the outline for appropriate preventive and risk mitigation

EEIIAA RReeppoorrtt FFoorr EExxpplloorraattoorryy DDrriilllliinngg AAccttiivviittiieess IInn NNEELLPP BBlloocckk CCYY--OOSSNN--22000099//22,, GGuullff OOff MMaannnnaarr,,
TTaammiill NNaadduu
P a g e | 109
SSeepptteemmbbeerr 22001144 | OIL
measures. The results of the QRA provides valuable inputs into the overall project planning,
OIL’s existing IMS and the decision making process for effectively addressing the identified
risks. This will ensure that the project risks stay below As Low As Reasonably Practicable
(ALARP) levels at all times during project implementation. In addition, the QRA will also help
in assessing risks arising from potential emergency situations like a large oil spill and develop
a structured Emergency Response Plan (ERP) to restrict damage to personnel, infrastructure
and the environment.
The risk study for the offshore project has considered all aspects of operation of the MODU
and other associated activities during the exploratory phase. Oil spills, loss of well control /
blow-out, vessel collisions, process leaks and helicopter crashes constitute the major
potential hazards that may be associated with the proposed offshore drilling for oil and gas
in the Block. External and environmental risk factors (e.g., collisions with passing merchant
vessels, severe weather and seismic events) were considered in the assessment. The study
however does not examine the risks or hazards associated with development and production
program of the exploratory wells.
The following section describes the objectives, methodology of the risk assessment study
and then presents the assessment for each of the potential risk separately. This includes
identification of major hazards, hazard screening and ranking, frequency and consequence
analysis for major hazards. The hazards have subsequently been quantitatively evaluated
through a criteria based risk evaluation matrix. Risk mitigation measures to reduce significant
risks to acceptable levels have also been recommended as a part of the risk assessment
study.
66..11..22 OObbjjeeccttiivvee ooff tthhee QQRRAA
The overall objective of this QRA is to identify the main contributors of major risks arising
from the offshore project which in turn will help in understanding the nature of hazards,
evaluate and prioritize them keeping in mind the ALARP principle and then suggest
practicable targets for risk reduction, if any.
The specific objectives of this risk assessment are to:
• Identify potential risk scenarios that may arise from the proposed drilling and other
associated activities like operation of supply ships, helicopter transport, etc.

EEIIAA RReeppoorrtt FFoorr EExxpplloorraattoorryy DDrriilllliinngg AAccttiivviittiieess IInn NNEELLPP BBlloocckk CCYY--OOSSNN--22000099//22,, GGuullff OOff MMaannnnaarr,,
TTaammiill NNaadduu
P a g e | 110
SSeepptteemmbbeerr 22001144 | OIL
• Analyze the possible likelihood and frequency of such risk scenarios by reviewing
historical accident related data for the offshore oil and gas industries.
• Predict the consequences of such potential risk scenarios and if consequences are high,
establish the same by through application of quantitative simulations.
• Recommend feasible preventive and risk mitigation measures as well as provide inputs
for drawing up of Emergency Response Plan (ERP) for the project.
The objectives of the QRA meet the criteria set for risk assessment for offshore operations in
the Petroleum and Natural Gas (Safety in Offshore Operations) Rules, 2008.
66..11..33 RRiisskk AAsssseessssmmeenntt MMeetthhooddoollooggyy
Risk associated with offshore oil and gas activities has two main elements - the risk of an
event happening - an oil spill, and the probability that that it will impact a receptor, such as
an ecologically sensitive area. For the purposes of this assessment, a risk ranking
methodology based on likelihood and consequence has been used. The risk matrix is a
widely accepted and standardized method of semi-quantitative risk assessment and is
preferred over purely quantitative methods, given its inherent limitations to define a risk
event with certainty. The application of this tool has resulted in the prioritization of the
potential risks events for the proposed drilling operations thus providing the basis for
drawing up risk mitigation measures and leading to formulation of plans for risk and
emergency management. The overall approach is summarized in the figure below.

EEIIAA RReeppoorrtt FFoorr EExxpplloorraattoorryy DDrriilllliinngg AAccttiivviittiieess IInn NNEELLPP BBlloocckk CCYY--OOSSNN--22000099//22,, GGuullff OOff MMaannnnaarr,,
TTaammiill NNaadduu
P a g e | 111
SSeepptteemmbbeerr 22001144 | OIL
FIGURE 6-1: RISK ASSESSMENT METHODOLOGY
66..11..44 HHaazzaarrdd IIddeennttiiffiiccaattiioonn
Hazard identification for the purposes of this QRA comprised of a review of the project and
associated activity related information provided by OIL. In addition, guidance provided by
knowledge platforms/portals of the upstream oil & gas industry including OGP, ITOPF and
DNV as well as historical information available with OIL were used to identify the potential
hazards that can arise out the proposed project activities.
Taking into account the applicability of different risk aspects in context of the offshore
drilling operations to be undertaken in the CY-OSN-2009/2 Block, six major categories of
hazards that can be associated with proposed project has been dealt with in detail.

EEIIAA RReeppoorrtt FFoorr EExxpplloorraattoorryy DDrriilllliinngg AAccttiivviittiieess IInn NNEELLPP BBlloocckk CCYY--OOSSNN--22000099//22,, GGuullff OOff MMaannnnaarr,,
TTaammiill NNaadduu
P a g e | 112
SSeepptteemmbbeerr 22001144 | OIL
They are as follows:
• Oil Spills
• Blowouts
• Collisions
• Helicopter crash
• Process leaks
• Process and non-process fires / explosions
Other possible hazard scenarios like chemical spills, falls, etc. has been not been considered
for detailed assessment as preliminary evaluation has indicated that the overall risk that may
arise out of them would be low. In addition, it is understood that the causative factors and
mitigation measures for such events can be adequately taken care of through exiting safety
management procedures and practices of OIL.
It must also be noted here that many of the hazards identified are sometimes interrelated
with one hazard often has the ability to trigger off another hazard through a domino effect.
For example, a large oil spill in most instances is caused by another hazardous incident like a
blowout, a process leak or a collision. This aspect has been considered while drawing up
hazard mitigation measures and such linkages (between hazards) has also been given due
importance for managing hazards and associated risks in a composite manner through OIL
safety management system and through the Emergency Response Plan, if a contingency
situation so arises.
66..11..55 FFrreeqquueennccyy AAnnaallyyssiiss
The analysis of frequencies of occurrences for the key hazards that has been listed out is
important to assess the likelihood of such hazards to actually unfold during the lifecycle of
the project. With relevance to the risk assessment study of the proposed offshore
exploratory project, major information sources viz. statistical data, historical records and
global offshore industry experience were considered during the frequency analysis of the
major identified risks22.
22 It is to be noted that the frequency of occurrences are usually obtained by a combination of component probabilities derived on basis of reliability data and /or statistical analysis of historical data.

EEIIAA RReeppoorrtt FFoorr EExxpplloorraattoorryy DDrriilllliinngg AAccttiivviittiieess IInn NNEELLPP BBlloocckk CCYY--OOSSNN--22000099//22,, GGuullff OOff MMaannnnaarr,,
TTaammiill NNaadduu
P a g e | 113
SSeepptteemmbbeerr 22001144 | OIL
The following accident databases and published oil industry databases have been consulted
for arriving at probable frequencies of identified hazards for the purpose of this QRA:
• The Worldwide Offshore Accident Databank (WOAD) – world’s most extensive database of offshore accidents and incidents maintained by DNV;
• SINTEF Offshore Blowout Database - a compilation sponsored by 6 operators and 2 consultants;
• CAA Helicopter Data – statistics published by the UK Civil Aviation Authority on offshore helicopter operations and exposure in the North Sea.
• Accident Data published by DNV Technica
• Environmental & Safety Performance of E & P Industry published by oil & gas producers OGP;
• Oil Spill Statistics published by International Tankers Owners Pollution Federation (ITOPF)
Based on the range of probabilities arrived at for different potential hazards that may be
encountered during the proposed drilling activities, the following criteria for likelihood
rankings have been drawn up:
Table 6-1: Frequency Categories and Criteria
Likelihood Ranking Criteria Definition
E Higher than 1 occurrences/year
D Between 10-1 to 1 occurrences/year
C Between 10-3 to 10-1 occurrences/year
B Between 10-4 to 10-3 occurrences/year
A Between 10-6 to 10-4 occurrences/year
0 Lower than 10-6 occurrences/year
66..11..66 CCoonnsseeqquueennccee AAnnaallyyssiiss
In parallel with the frequency analysis, hazard prediction / consequence analysis exercise
assesses the resulting effects if the accidents occur and their likely impact on project
personnel, infrastructure and environment. In relation to the proposed project, the
estimation of the consequences for each possible event has been based either on accident
experience, consequence modelling or professional judgment, as appropriate.

EEIIAA RReeppoorrtt FFoorr EExxpplloorraattoorryy DDrriilllliinngg AAccttiivviittiieess IInn NNEELLPP BBlloocckk CCYY--OOSSNN--22000099//22,, GGuullff OOff MMaannnnaarr,,
TTaammiill NNaadduu
P a g e | 114
SSeepptteemmbbeerr 22001144 | OIL
The consequences of accidental events on the marine and social environment have been
studied to evaluate the potential of the identified risks that can cause any major impact to
the aforesaid environment. Overall, the consequence analysis takes into account the
following aspects:
• Magnitude of impacts in terms of area involved
• Stakeholder concern
• Impact on ecology/biodiversity
• Time period for natural recovery and cleanup in case a risk scenario unfolds
The following criteria for consequence rankings have been drawn up in context of the
possible environmental consequences of the risk events that may unfold during the drilling
operations:
Table 6-2: Severity Categories and Criteria
Environment Severity Ranking
Criteria Definition
Major International Impact 5 International stakeholder concern
Impact on licenses / acquisitions
More than 5 years for natural recovery
More than 5 months for clean-up
Reduction of biodiversity
Impact on special conservation areas.
Involved area > 100 km2 – Spill= 5000 MT
Major National Impact 4 National stakeholder concern
Impact on licenses
2-5 years for natural recovery
Up to 5 months for clean-up
Threatening to biodiversity
Impact on interesting areas for science.
Involved area < 100 km2 – Spill= 700 MT
Local Impact 3 Regional stakeholder concern
1-2 years for natural recovery
1 week for clean-up
Threatening to some species
Impact on protected natural areas.
Involved area < 10 km2 - Spill = 100 MT

EEIIAA RReeppoorrtt FFoorr EExxpplloorraattoorryy DDrriilllliinngg AAccttiivviittiieess IInn NNEELLPP BBlloocckk CCYY--OOSSNN--22000099//22,, GGuullff OOff MMaannnnaarr,,
TTaammiill NNaadduu
P a g e | 115
SSeepptteemmbbeerr 22001144 | OIL
Environment Severity Ranking
Criteria Definition
Minor Impact 2 Some local stakeholder concern
1 year for natural recovery
Impact on small no of not compromised species.
impact on localised ground
Involved area < 1 km2
Spill = 10 MT
Slight Impact 1 No stakeholder impact
Temporary impact on the area.
Involved area < 0.1 km2
Spill < 1 MT – no sensitive impact on ground
66..11..77 RRiisskk EEvvaalluuaattiioonn
Based on ranking of likelihood and frequencies, each identified hazard has been evaluated
based on the likelihood of occurrence and the magnitude of consequences. The significance
of the risk is expressed as the product of likelihood and the consequence of the risk event,
expressed as follows: Significance = Likelihood X Consequence The figure below illustrates all
possible product results for the four likelihood and consequence categories and the table
below assigns risk significance criteria in three regions that identify the limit of risk
acceptability according to the policy and the strategic objectives of OIL. Depending on the
position of the intersection of a column with a row in the risk matrix, hazard prone activities
have been classified as low, medium and high thereby qualifying for a set of risk reduction /
mitigation strategies.
FIGURE 6-2: RISK MATRIX & ACCEPTABILITY CRITERIA
Likelihood of Occurrence
Seve
rity
of
Cons
eque
nce
O A B C D E
1
2
3
4
5
Continuous Improvement
Risk Reduction Measures
Intolerable Risk

EEIIAA RReeppoorrtt FFoorr EExxpplloorraattoorryy DDrriilllliinngg AAccttiivviittiieess IInn NNEELLPP BBlloocckk CCYY--OOSSNN--22000099//22,, GGuullff OOff MMaannnnaarr,,
TTaammiill NNaadduu
P a g e | 116
SSeepptteemmbbeerr 22001144 | OIL
Table 6-3: Risk Categories and Significance Criteria
Risk Criteria Definition
Low
(Continuous improvement)
The level of risk is broadly acceptable and no specific control measures are required.
Medium (Risk reduction measures) The level of risk can be tolerable only once a structured review of risk-reduction measures has
been carried out.
High (Intolerable risk) The level of risk is not acceptable and risk control measures are required to move the risk figure to
the previous regions.
66..11..88 KKeeyy RRiisskkss iinnvvoollvveedd
The key accidental scenarios posing safety and environmental risks due to offshore
exploratory drilling program in the current region are:
• Fire and Explosion due to Blowouts and other reasons
• Accidents during sea transport of materials and supplies for the Drilling Rig and on-board personnel
• Accidents during air transport of personnel
• Oil Spills
Risk and consequence of oil spills are included in separate section, while blowouts and other
risks relating Air & Sea side transport accidents are included in the following sub sections.
66..11..99 BBlloowwoouuttss
A blowout in a hydrocarbon exploration activity can be defined as any uncontrolled flow of
formation fluids from the reservoir to the surface, due to formation pressure exceeding the
hydrostatic pressure of the mud or fluid column and failure of secondary blowout prevention
measures. For an offshore drilling activity, blowout events may occur at the drill ship level or
subsea and may result in pool /jet fires, vapour cloud explosions or sometimes may lead to
release of toxic gases like Hydrogen Sulphide.
Blowouts during offshore operations may be initiated during both drilling and development
phase and also as a result of external causes viz. earthquakes, ship collision, and structural
collapse. In the context of the proposed project, offshore operations will be limited to
exploratory drilling and testing. Therefore any incidence of blowout during the aforesaid

EEIIAA RReeppoorrtt FFoorr EExxpplloorraattoorryy DDrriilllliinngg AAccttiivviittiieess IInn NNEELLPP BBlloocckk CCYY--OOSSNN--22000099//22,, GGuullff OOff MMaannnnaarr,,
TTaammiill NNaadduu
P a g e | 117
SSeepptteemmbbeerr 22001144 | OIL
phases may occur as a result of loss of well control due to formation fluid entry into well
bore, well head damage or loss of containment. The underlying causes of most of the
blowout incidents (excluding external causes) occurring worldwide can be interpreted as
organizational and managerial. An analysis of blowout causes into such factors attempted for
the Marintek database (NSFI 1985) revealed that the main causal factors were improper
maintenance, operational failures and inadequate supervision.
Blow Out Frequency Analysis
Blowout frequency estimates are obtained from a combination of incident experience and
associated exposure in a given area over a given time period. Due to limited offshore oil &
gas related activities in the Gulf of Mannar offshore region, blowouts that have occurred at
other offshore locations worldwide have been considered for the blowout frequency analysis.
Input data for the frequency analysis of blowout events were taken from DNV‟s database viz.
WOAD23 (World Offshore Accident Database). Review of blowout frequencies from the
database reveals a frequency 1.1 X 10⁻² per operation per year for drill ships (comparable to
the MODU to be deployed for the drilling activity) compared to Jack Up Rigs (9.8 X 10⁻³) and
Fixed Platforms (9.3 X 10⁻⁴).
Since the proposed project involves only exploratory drilling, measurement of exposure for
blowout incidents has been determined by considering blowout frequencies during well
drilling and by the platform type. The blowout frequency for the proposed 6 exploratory
wells have been obtained by multiplying the blowout frequencies per well year by the no of
wells drilled, and the time taken for drilling each well.
Estimated frequency for blowout for the proposed drilling operation in exploratory block CY-
OSN-2009/2 is: Probability for blowout from OIL drilling operations = 1.1 X 10⁻² (prob/ year /
drilling operation) X 6 (no of drills) X 0.2 (time taken for each drill in yrs) = 13.2 X 10⁻³
Blow Out Consequences and Effects
A blowout incident can take a variety of different forms, ranging from a minor leak which can
be stopped within minutes, to a major release which continues out of control for days or
23 A public domain database maintained by DNV for all offshore hazards including 312 blowouts worldwide from 1970-96.

EEIIAA RReeppoorrtt FFoorr EExxpplloorraattoorryy DDrriilllliinngg AAccttiivviittiieess IInn NNEELLPP BBlloocckk CCYY--OOSSNN--22000099//22,, GGuullff OOff MMaannnnaarr,,
TTaammiill NNaadduu
P a g e | 118
SSeepptteemmbbeerr 22001144 | OIL
even months. The consequences of a blowout event will to a large extent depend on how the
blowout scenario evolves and the following possible scenarios are likely:
• release of oil resulting in a slick or spill on the sea
• release of drilling fluids and resulting spill leading to contamination of marine environment
• release of toxic / flammable gas which may have deleterious effect on the drill ship personnel
• ignition of the flammable gas / oil released resulting in a jet fire, pool fire or an explosion
Ignition of released oil and gas can possibly result in considerable harm, with historical data
showing 40 % blowout such incidences leading to more than significant damage to the
drilling ship / platform (WOAD database) and resulting in associated fatalities amongst
drilling crew and support personnel present on the ship / platform. Also, ignition has been
recorded in about 30% of the blowout cases on an average (SINTEF offshore blowout
database). However, on positive side, with improvement of offshore drilling technology,
number of offshore blowouts occurring has significantly gone down in the last decade.
Risk Ranking for Blowouts
Preventive and Mitigation Measures
Blowouts being events which may be catastrophic to any well operation, it is essential to take
up as much a preventive measures as feasible. Following measures would be implemented:
• Necessary active barriers (eg. Certified and regularly tested Blowout Preventer system as per laid down OISD guidelines) will be installed to control or contain a potential blowout. It will be ensured that Drillers and Drilling Supervisors always have globally accepted and current and valid IWCF (International Well Control Forum)/IADC (International Association of Drilling Contractor) WellCap professional certification which is mandatory and regular testing of BOP and other well control system as per OISD well control guidelines will be adhered to during operations.
Likelihood Ranking - C Consequence Ranking - 4 Risk Ranking - 4C (High)

EEIIAA RReeppoorrtt FFoorr EExxpplloorraattoorryy DDrriilllliinngg AAccttiivviittiieess IInn NNEELLPP BBlloocckk CCYY--OOSSNN--22000099//22,, GGuullff OOff MMaannnnaarr,,
TTaammiill NNaadduu
P a g e | 119
SSeepptteemmbbeerr 22001144 | OIL
• Close monitoring of drilling activity would be done to check for signs of increasing pressure, like from shallow gas formations.
• Adequate precautionary measures to be taken in case of a natural event like earthquake or a cyclone.
66..11..1100 CCoolllliissiioonnss IInnvvoollvviinngg MMOODDUU
A collision situation is considered for the risk assessment for the impacts on MODU by other
drill ships or other marine vessels working nearby or passing by it. The following possibilities
have been taken into consideration:
• Visiting support vessels which approach the MODU under their own power and including supply vessels, standby vessels, etc.
Visiting vessel collisions may vary from minor bumps to rare but highly damaging full-speed
collisions and are relatively frequent occurrences. The frequency for such incidences is
strongly dependant on the severity of the collisions included. The types of collisions possible
in this are as follows:
• On arrival – where the visiting vessel fails to stop when it reached the platform;
• Maneuvering – where the vessel misjudges a turning or approach maneuver, and the hits the MODU at a relatively low speed
• Drifting – where the vessel looses power or suffers a failure of dynamic positioning and drifts into the platform because of winds or waves.
The visiting vessel collision frequency would be expected to vary roughly in proportion to
the number of visits, particularly for supply vessels, which are expected to follow a roughly
similar pattern of movements on each visit. The frequency for collisions will also depend on
the weather conditions prevailing in the offshore region near the Gulf of Mannar coast
during the drilling period, especially for minor collisions. As exact vessel movement data for
the OIL India operations are not available at this time, an average vessel movement
(Technica, 1987) of about 3.6 vessels / week has been assumed.
Assuming the number of visits to the MODU as 5.0 vessels per week, the typical overall
frequency of moderate to severe collision by a support vessel with the MODU can be taken
as 6.0 X 10⁻⁴ per visit. Estimated frequency for support vessel collision for the proposed
drilling operation in exploratory block CY-OSN-2009/2 is:

EEIIAA RReeppoorrtt FFoorr EExxpplloorraattoorryy DDrriilllliinngg AAccttiivviittiieess IInn NNEELLPP BBlloocckk CCYY--OOSSNN--22000099//22,, GGuullff OOff MMaannnnaarr,,
TTaammiill NNaadduu
P a g e | 120
SSeepptteemmbbeerr 22001144 | OIL
Total number of visits = 5 / 7 X 210 = 150
Frequency for collision = 6.0 X 10-4 X 150 = 9 X 10⁻²
Collisions Involving MODU and Passing Vessels
Collisions with offshore oil structures involving passing vessels are generally very rare (about
5 % of all reported collisions) but can be potentially very damaging. Probabilities for passing
vessel collisions can be estimated from historical experience. However, the frequencies are
uncertain and statistically insufficient as only few passing vessel collisions have occurred.
Historical data have limited value because they are often unable to reflect local traffic levels
with reasonable degree of accuracy and also because the sea has few formally defined
shipping lanes and ships tend to follow informal lanes voluntarily between ports.
Collisions Involving Supply and Other Vessels
There is also a small probability of supply vessels colliding with other commercial vessels on
route to the MODU while maneuvering near to the Tuticorin/Kakinada base. These collisions
may happen because of navigational difficulties or because of prevailing traffic density near
these ports. However, the traffic on local routes is highly regulated and controlled. So the
possibility of such collisions happening is considered to be minimal.
Consequences and Effects
The analysis of collision consequences is generally based on the principle of conservation of
energy. The incident kinetic energy of a vessel on a collision course can be transferred to the
MODU during the impact. The magnitude of energy transfer will depend on the mass of the
vessel and on the square of its speed at the time of impact. However, in the case the collision
is as a result of a glancing blow from a support vessel, where the vessel brushes against the
platform, the kinetic energy transfer is minimal and is expected to cause minimal damage to
the MODU. The impact of a full-on collision may however be more severe and may lead to
structural damage to the MODU. The risk to personnel manning a platform / drill ship from a
collision in terms of fatalities or injuries has been historically found to be very low, if not
resulting in a catastrophic incidence like a blowout. It should be noted that the MODU would
be connected to the drilling apparatus at the sea bottom, a collision involving high energy
transfer may lead to a rupture or leak in the riser resulting in a process leak or a blowout.

EEIIAA RReeppoorrtt FFoorr EExxpplloorraattoorryy DDrriilllliinngg AAccttiivviittiieess IInn NNEELLPP BBlloocckk CCYY--OOSSNN--22000099//22,, GGuullff OOff MMaannnnaarr,,
TTaammiill NNaadduu
P a g e | 121
SSeepptteemmbbeerr 22001144 | OIL
Risk Ranking for Vessel Collision
Preventive and Mitigation Measures
A Vessel Management Plan will be formulated and implemented to reduce collision risk, both
vessel–vessel and MODU–vessel and will address the following:
• Mandatory 500 m safety zone around platform;
• Operational restrictions on visiting vessels in bad weather;
• Defined vessel no-go areas within safety zone; and
• Agreed approach procedures to platform by supply and safety vessels.
66..11..1111 HHeelliiccoopptteerr CCrraasshheess
The journey to and from offshore installations has historically been one of the main reasons
for accidental death or injury to many offshore workers. For the OIL India drilling activities,
crew transport to and from the MODU will be by helicopter, due to its speed, convenience
and good operability under rough weather conditions.
Frequency Probability
Several approaches exist to analyze probability of helicopter crash risks. The most common
approach involves the use an overall Fatal Accident Rate (FAR) value (e.g. SINTEF 1990).
However, there are certain inherent deficiencies in adopting this approach in spite of the fact
that it provides convenient risk numbers. A more reasonable approach involves the use of
individual risk approach as a product of 3 components:
• Frequency of helicopter accidents per flight;
• Proportion of accidents which involve fatalities;
• Proportion of personnel on board in fatal accidents who become fatalities.
Taking this approach and considering historical data from the UK sector which is available,
while accounting for both the flying time and number of flying stages involved, the
Individual Risk per journey can be calculated as
Likelihood Ranking - C Consequence Ranking - 3 Risk Ranking - 3C (Medium)

EEIIAA RReeppoorrtt FFoorr EExxpplloorraattoorryy DDrriilllliinngg AAccttiivviittiieess IInn NNEELLPP BBlloocckk CCYY--OOSSNN--22000099//22,, GGuullff OOff MMaannnnaarr,,
TTaammiill NNaadduu
P a g e | 122
SSeepptteemmbbeerr 22001144 | OIL
Individual Risk (IR) per journey = 1.7 X 10⁻⁶ X flying time (hours) + 2.7 X 10⁻⁷ X No. of stages
per journey.
Consequences and Effects
Helicopter crashes involved with offshore oil & gas exploration and production have
happened routinely in the past, especially in the North Sea offshore operations in Europe,
with some resulting in fatalities or injuries to crew members. In addition to the risk posed to
the helicopter occupants, accidents involving helicopters can also cause damage to the drill
ship itself by way of crashing into the ship during take-off or landing or by an accident when
the helicopter is on the helideck. However, the consequence of such risk may be considered
to be small compared to the other risks sources on the MODU.
Risk Ranking for Helicopter Crash
Preventive and Mitigation Measures
Following preventive and mitigation measures will be adopted with respect of helicopter
operations:
• Air worthiness of helicopter to be checked by competent authority before helicopter is hired by OIL India.
• OIL India should ensure that the pilot/pilots who will be operating have got appropriate training on similar craft.
• Effective arrangements for coordination would be developed with air traffic control room at Tuticorin and/or Kakinada base, as also in the MODU;
• Helicopter operations to be restricted during night time and during bad weather conditions.
• All employees who are supposed to travel on helicopters would be receiving basic training on rescue and survival techniques in the case of a helicopter crash at sea.
Likelihood Ranking - B Consequence Ranking - 3 Risk Ranking - 3B (Medium)

EEIIAA RReeppoorrtt FFoorr EExxpplloorraattoorryy DDrriilllliinngg AAccttiivviittiieess IInn NNEELLPP BBlloocckk CCYY--OOSSNN--22000099//22,, GGuullff OOff MMaannnnaarr,,
TTaammiill NNaadduu
P a g e | 123
SSeepptteemmbbeerr 22001144 | OIL
66..11..1122 RRiisskk MMiittiiggaattiioonn MMeeaassuurreess
66..11..1133 WWeellll PPllaannnniinngg && DDeessiiggnn
Exploration wells are designed to manage the uncertainty in the true nature of the well to be
drilled. The possibility of shallow gas, uncertainty in pore-pressure and temperature, porous
and permeable intervals, weak formations etc all need to be assessed, and the well design
and drilling program developed to cater for ‘worse-case’ scenarios. Offset well data,
computation modelling and site specific survey data allow the geoscientists to provide the
drilling engineers with information on the likely range (probabilistic) and maximum values of
key design parameters. The drilling engineer designs the well (and the associated drilling
programmed) on the basis of maximum anticipated values.
Explicit risk assessment, in terms of assigning quantitative probabilities of failure to all parts
of the well design, does not feature in the design of a typical exploration well. However risk
assessment is implicit within the design process, specifically through the adoption of
operational manuals and procedures and industry recognized design approaches by OIL.
Based on the geological information collected for the block, OIL will be able to plan and
design exploratory wells in this block, with minimal uncertainties and therefore higher
probability of avoiding accidental scenarios such as Blowouts.
As per OIL’s Management Systems of Offshore Drilling and HSE, and in compliance with
Petroleum and Natural Gas (Safety in Offshore Operations) Rules 2008, OIL will ensure that:
• A Well program describing the individual activities and the equipment to be used will
be prepared prior to starting well activities
• The management system with associated processes, resources and operational
organization will be established;
• Steering documents, including technical documents for drilling and well testing
operations, will be made available, in an updated version and the operational personnel
shall be acquainted with it.
• Commissioning process prior to startup of facilities for first time or after technical
modifications will be completed.

EEIIAA RReeppoorrtt FFoorr EExxpplloorraattoorryy DDrriilllliinngg AAccttiivviittiieess IInn NNEELLPP BBlloocckk CCYY--OOSSNN--22000099//22,, GGuullff OOff MMaannnnaarr,,
TTaammiill NNaadduu
P a g e | 124
SSeepptteemmbbeerr 22001144 | OIL
• Well barriers:
- During drilling and other related well activities, there will at all times be at least two independent and tested well barriers after surface casing is in place. Well barriers will be designed in such a manner that unintentional influx, cross flow to shallow formation layers and outflow to the external environment is prevented.
- Well barriers will be designed in such a manner that their performance can be verified.
- If a barrier fails, during drilling and other related well activities, no other activities will be undertaken in the well than those to restore the barrier.
- When a well is abandoned, the barriers would be designed to provide for well integrity for the longest period of time that the well is expected to be abandoned, inter alia in such a manner that outflow from the well or leakages to the external environment do not occur.
- OIL will choose well location and well path on the basis of well parameters of importance, including occurrence of shallow gas, other hydrocarbon bearing formation layers and distances to adjacent wells and to ensure that it is possible to drill a relief well from two alternative locations. The well path will be known at all times
• OIL will ensure that the necessary actions are planned including setting of casing above
all known shallow gas hazard zones to handle situations of shallow gas or other
formation fluids occurrence.
• During all drilling and well activities, drilling and well data will be collected and
monitored to verify the well prognoses, in order that necessary actions may be taken
and the well program may be adjusted if necessary.
• Well control:
- Well control equipment will be designed, installed, maintained, tested and used so as to provide for well control.
- In the case of drilling of top hole sections with riser or conductor, equipment with capacity to conduct shallow gas and formation fluid away from the facility, until the personnel has been evacuated, will be installed.
- Floating facilities shall have an alternative activation system for handling of critical functions on the blow out preventer.

EEIIAA RReeppoorrtt FFoorr EExxpplloorraattoorryy DDrriilllliinngg AAccttiivviittiieess IInn NNEELLPP BBlloocckk CCYY--OOSSNN--22000099//22,, GGuullff OOff MMaannnnaarr,,
TTaammiill NNaadduu
P a g e | 125
SSeepptteemmbbeerr 22001144 | OIL
- Accumulator for surface and sub surface well control equipment will have minimum usable fluid capacity as per industry standards in order to perform closing and opening sequences as applicable to secure the well.
- The pressure control equipment used in well interventions will have remote control valves with locking devices.
- The well intervention equipment will have a remote control blind or shear ram as close to the christmas tree as possible
- If well control is lost, OIL will ensure that it shall be possible to regain the well control by direct intervention or by drilling a relief well.
- OIL will prepare an action plan describing how the lost well control can be regained
• OIL will set operational limitations in relation to controlled well flow
• Securing of wells before abandoning
- All wells will be secured before they are abandoned in such a manner that well integrity remains intact during the time they are abandoned.
- With regard to subsea completed wells the well integrity will be ensured if the wells are planned to be temporarily abandoned
- Radioactive sources will not be left behind in the well.
- In case it is not possible to retrieve the radioactive sources and these have to be left in the well, OIL will follow proper abandonment procedure as per guidelines of the Department of Atomic Energy, Government of India.
• Compensator and disconnection systems:
- Design of compensator systems will be based on robust technical solutions so that failures do not lead to unsafe conditions.
- Floating facilities shall be equipped with a disconnection system that secures the well and releases the riser before a critical angle occurs
• Drilling fluid system:
- The drilling fluid system will be designed in such a manner that it will mix, store, circulate and clean a sufficient volume of drilling fluid with the necessary properties to ensure the drilling fluid’s drilling and barrier functions.
- The high pressure part of the drilling fluid system with associated systems will in addition have capacity and working pressure to be able to control the well pressure at all times.

EEIIAA RReeppoorrtt FFoorr EExxpplloorraattoorryy DDrriilllliinngg AAccttiivviittiieess IInn NNEELLPP BBlloocckk CCYY--OOSSNN--22000099//22,, GGuullff OOff MMaannnnaarr,,
TTaammiill NNaadduu
P a g e | 126
SSeepptteemmbbeerr 22001144 | OIL
- Availability of sufficient quantity of drilling fluid weighting material to subdue the well at any time during the drilling operation will be ensured
• Cementing unit:
- The cementing unit will be designed in such a manner that it will mix, store and deliver as exact volume as possible of cement with the necessary properties to ensure fully satisfactory anchoring and barrier integrity
- The unit will be designed in such a manner that remains of unmixed chemicals as well as ready-mixed cement is handled in accordance with the applicable environment regulations.
- If the cementing unit with associated systems is intended to function as backup for the drilling fluid system, it shall have capacity and working pressure to be able to control the well pressure at all times.
• Casings and anchoring will be such that the well integrity is ensured and the barrier
functions are provided for throughout the life time of the well.
• Equipment for completion and controlled well flow
- Equipment for completion will provide for controlled influx, well intervention, backup well barrier elements and plug back activities.
- Completion strings will be equipped with necessary down hole equipment including safety valves
- During controlled well flow, the surface and down hole equipment will be adapted to the well parameters.
- Equipment for burning of the well stream will be designed and dimensioned in such a manner that combustion residues shall not cause pollution of the marine environment
- OIL will ensure that controlling well pressure through the work string and the well flow through the choke manifold will be possible at any time
66..11..1144 SSeelleeccttiioonn ooff EEqquuiippmmeenntt,, SSyysstteemmss aanndd PPeeooppllee
Assessing the Ability of the Drilling Rig to Perform the Required Operation
The water depth, environmental conditions, reservoir and geophysical properties will dictate
the type of rig and equipment required to perform the drilling operation. Highly technical
risk assessments will be undertaken both to demonstrate that the rig is capable of providing

EEIIAA RReeppoorrtt FFoorr EExxpplloorraattoorryy DDrriilllliinngg AAccttiivviittiieess IInn NNEELLPP BBlloocckk CCYY--OOSSNN--22000099//22,, GGuullff OOff MMaannnnaarr,,
TTaammiill NNaadduu
P a g e | 127
SSeepptteemmbbeerr 22001144 | OIL
an acceptable working environment, and to determine the limits to which certain operations
will be undertaken.
During this phase, the ability of the equipment and systems on the rig to provide a suitable
barrier(s) to well control incidents will be reviewed (eg., pressure rating and functionality of
the BOP). The ability of a drilling rig to operate at the specific location will be assessed,
usually through the application of an industry recognized site assessment practice. (eg., Site
Specific Assessment of MODU). The objective being to ensure that the risk of (for example) a
structural or mooring failure does not exceed OIL’s and the regulator’s risk acceptance
requirements.
The risk assessment process is, to an extent, embodied within the relevant design and
assessment standards applicable to the particular type of drilling rig. However, detailed, site-
specific risk assessments support the application of these standards, for example the analysis
of borehole data to establish the risk of a punch-through. Where a drilling rig is deemed to
be operating close to the limits of its operating envelope, more detailed risk assessments
may be undertaken. These may require the use of appropriate metocean criteria and
structural response models.
The requirements of the following referred applicable standards for the listed equipment
shall be met to demonstrate that drilling systems are in compliance with requirements of the
Petroleum and Natural Gas (Safety in Offshore Operations) Rules, 2008 and Drilling Rig
(MODU) is thus fit for purpose:
Table 6-4: Equipment and Applicable Standards S. No.
Equipment Verification requirements Reference Standard
1. Drilling structure, drill floor, sub structure, lifting equipment.
A. Derrick / structures i. Structures have been designed and fabricated
by manufacturers as per API Spec 4F or equivalent. This verification should include structural safety level (refer sections 6 and B.6 of API Spec 4F).
ii. Different categories’ inspection(s) of derrick, structures and drill floor have been carried out as per section 6 of API RP 4G or equivalent and OEM’s recommendations, besides Non Destructive Examination (NDE) as considered necessary. Chairmen cum managing director
iii. Repair and modification of structures (if carried out, based on inspection) have been carried out
API Spec 4F (3rd Edition 2008) API RP 4G (3rd Edition, 2004) API RP 4G(3rd Edition, 2004) API Spec 4F

EEIIAA RReeppoorrtt FFoorr EExxpplloorraattoorryy DDrriilllliinngg AAccttiivviittiieess IInn NNEELLPP BBlloocckk CCYY--OOSSNN--22000099//22,, GGuullff OOff MMaannnnaarr,,
TTaammiill NNaadduu
P a g e | 128
SSeepptteemmbbeerr 22001144 | OIL
S. No.
Equipment Verification requirements Reference Standard
as per section 7 and 8 respectively of API RP 4G or equivalent and OEM’s recommendations. Quality control of repair and modification has been ensured in line with requirements of section 11 of API SPEC 4F or equivalent.
B. Drilling equipment i. Installation, inspection and maintenance of IC
engines have been carried out as per API Spec 7C-11F or equivalent and OEM’s recommendations. For minimizing potential fires and/or explosions in the operations of IC engines requirements given in Appendix A of API Spec 7C-11F or equivalent, are being followed. Functional testing of safety devices and emergency stop function has been carried out.
ii. Design, inspection and operating limits of drill stem components is as per API RP 7G or equivalent.
iii. Design of drilling equipment (rotary equipment, slush pumps, power tongs and draw works) is as per API Spec 7K or equivalent.
iv. Inspection, maintenance and repair of rotary equipment, slush pumps, power tongs and draw works has been carried out as per API RP 7L or equivalent and OEM’s recommendations. Inspection has included NDE and/or opening of equipment as considered necessary. Functional testing of safety devices and emergency stop function has been carried out.
v. Design of drilling hoisting equipment is as per API Spec 8A and API Spec 8C or equivalent.
vi. Inspection, maintenance and repair of hoisting equipment are as per API RP 8B or equivalent and OEM’s recommendations. Inspection of hoisting equipment has focused on structural integrity and personnel protection. Category III and IV inspection has included NDE / MPI and/or opening of equipment as considered necessary. Functional testing of safety devices and emergency stop function has been carried out.
vii. Minimum requirements and terms of acceptance of steel wire ropes as per API Spec 9A / ISO 10425 or equivalent are being followed.
(3rd Edition 2008) API Spec 7C-11F (5th Edition 1994) API RP 7G API Spec 7K API RP 7L API Spec 8A and API Spec 8C API RP 8B API Spec 9A / ISO 10425

EEIIAA RReeppoorrtt FFoorr EExxpplloorraattoorryy DDrriilllliinngg AAccttiivviittiieess IInn NNEELLPP BBlloocckk CCYY--OOSSNN--22000099//22,, GGuullff OOff MMaannnnaarr,,
TTaammiill NNaadduu
P a g e | 129
SSeepptteemmbbeerr 22001144 | OIL
S. No.
Equipment Verification requirements Reference Standard
viii. Field care (inspection) and use of wire rope and evaluation of rotary drilling line has been carried out as per API RP 9B or equivalent.
ix. Inspection of piping and piping systems has been carried out as per API RP 570 and API RP 574.
x. Pressure vessels have been inspected externally and internally; thickness measurement / crack detection tests have been carried out as deemed necessary. Pressure testing at a pressure equal to maximum allowable working pressure has been carried out. Safety valves / instrumentation have been tested.
API RP 9B API RP 570 and API RP 574
2. Well Control Systems: blow out preventers, diverters, marine risers, choke and kill system, control systems for well control equipment.
A. Design of drill through equipment / blowout prevention equipment – ram and annular blowout preventers, hydraulic connectors, drilling spools, adaptors etc. is as per API Spec 16A / ISO 13533 or equivalent. Records of maintenance (including major inspection as per section 17.10.3 of API RP 53 and OEM’s recommendations) have been reviewed. Installation and testing (complete performance testing including functional and pressure tests) of blow out control equipment is being carried out in line with API RP 53 or OISD-RP-174 or equivalent.
B. Design and maintenance of diverter systems is
as per API RP 64 or equivalent. Inspection and testing of diverter systems has been carried out as per API RP 64 or OISD-RP-174 or equivalent.
C. Design of choke and kill systems is as per API
Spec 16C or equivalent. Pressure testing of choke and kill systems is being carried out in line with API RP 53 or OISD-RP-174 or equivalent. Flexible choke and kill lines and choke manifold are inspected as per section 17.10.3 of API RP-53(3rd Edition 1997) and OEM’s recommendations.
D. Design of control systems for well control
equipment and diverter equipment is as per API Spec 16D and API RP 53 or equivalent and performance requirements/ testing, inspection and maintenance is as per API RP 53 or OISD-
API Spec 16A (3rd Edition 2004) / ISO 13533 ( 2001) API RP 53 (3rd Edition 1997) or OISD-RP-174 API RP 64 or OISD-RP-174 API Spec 16C API RP 53(3rd Edition 1997) or OISD-RP-174 API Spec 16D and API RP 53 API RP 53 or OISD-RP-174

EEIIAA RReeppoorrtt FFoorr EExxpplloorraattoorryy DDrriilllliinngg AAccttiivviittiieess IInn NNEELLPP BBlloocckk CCYY--OOSSNN--22000099//22,, GGuullff OOff MMaannnnaarr,,
TTaammiill NNaadduu
P a g e | 130
SSeepptteemmbbeerr 22001144 | OIL
S. No.
Equipment Verification requirements Reference Standard
RP-174 or equivalent and OEM’s recommendations.
E. Marine drilling riser systems for floating
drilling operations have been selected, operated and maintained in line with API RP 16Q or equivalent. Design, manufacture and fabrication of marine drilling riser system and associated equipment used in conjunction with a subsea blowout preventer (BOP) stack is as per API Spec 16F or equivalent. Design and standards of performance for marine drilling riser coupling is as per API Spec 16R or equivalent. Risers and riser couplings / joints are being inspected for wear, cracks and corrosion; thickness measurement has been carried out as required.
API RP 16Q API Spec 16F / API Spec 16R
3. Man riding equipment
Selection of man riding equipment is done ensuring that equipment is suitable for man riding operations, and the equipment are inspected and maintained regularly.
4. Station keeping systems: anchoring, mooring, dynamic positioning, compensator and disconnection systems.
Verify that MODU’s station keeping and stability characteristics are suitable for the environmental (including sea bed and soil conditions) and operating conditions envelope. Inspection and maintenance of mooring hardware is as per API RP 2I or equivalent and OEM’s recommendations; and design, manufacturing and maintenance of synthetic fiber ropes for offshore mooring is as per API RP 2 SM or equivalent.
API RP 2SK (for station keeping) MODU code(for stability) API RP 2I API RP 2 SM
5. Drilling fluid handling and cementing system
Physical condition of the equipment is satisfactory and instrumentation, safety alarms and pressure safety valves are being tested regularly.
6. Electrical Systems A. Design and maintenance of electrical systems is as per IMO MODU code meeting requirements of industry standards API RP 500 or API RP 505.
B. Inspection and functional testing of
emergency power system is being carried out.
MODU code API RP 500 API RP 505
7. Safety systems (exclude items which are covered by MODU safety certificate, provided the rig has valid MODU safety
A. Inspection and testing of the following safety systems is being carried out periodically:
− Fire detection system − Gas detection system – HC and H2S − Drilling operations related alarm system − Lifesaving appliances − SCBA

EEIIAA RReeppoorrtt FFoorr EExxpplloorraattoorryy DDrriilllliinngg AAccttiivviittiieess IInn NNEELLPP BBlloocckk CCYY--OOSSNN--22000099//22,, GGuullff OOff MMaannnnaarr,,
TTaammiill NNaadduu
P a g e | 131
SSeepptteemmbbeerr 22001144 | OIL
S. No.
Equipment Verification requirements Reference Standard
certificate) − Gas measuring devices − Firefighting system − Communication systems
B. Safety systems are as per MODU code
requirements, as applicable. 8. Cranes (If classed
certificate notation does not cover cranes)
A. Design and testing of pedestal mounted offshore cranes are as per API Spec 2C or equivalent.
B. Operations and maintenance of offshore cranes
are as per API RP 2D or equivalent. Inspection has focused on structural integrity and includes: − Blocks and sheaves − Wire ropes and end attachments − Hooks − Bearings − Shackles − Securing arrangements − Support structure − Axle pin and housing
C. Inspection and function testing has included:
− Correct adjustment of brakes − Resistance measurement of electrical
systems − Leakages in hydraulic systems
D. Load charts have been verified by carrying out
load tests as per applicable requirements. Functional testing of safety devices and emergency stop function are being carried out.
API Spec 2C API RP 2D
9. Helideck (If classed certificate notation does not cover helideck)
Inspection has included: − Structural integrity of deck and
supporting structure − Surface of deck − Obstacles and marking − Safety net − Fire safety arrangements
Fire and explosion risk assessment on MODU includes hazards from the wells and well
testing operations. Following fire and explosion hazards related to wells are generally
considered:
• Subsea shallow gas blow out

EEIIAA RReeppoorrtt FFoorr EExxpplloorraattoorryy DDrriilllliinngg AAccttiivviittiieess IInn NNEELLPP BBlloocckk CCYY--OOSSNN--22000099//22,, GGuullff OOff MMaannnnaarr,,
TTaammiill NNaadduu
P a g e | 132
SSeepptteemmbbeerr 22001144 | OIL
• Shallow gas blow out in cellar deck
• Blow out from well at drill floor
• Subsea well blowout
• HC gas release / ignition in mud processing area
• Fire and explosion in well testing areas
OIL will design well programs considering the anticipated hazards out of the above
mentioned hazards. MODUs have to meet the requirements of Conventions and Codes of
International Maritime Organisation (IMO), which includes MODU code, FSS code. Fire and
explosion risk management at MODU can be ensured by meeting the requirements of these
codes. Following issues have been taken into consideration by MODU code:
• Structural fire protection layout plan for decks and bulkheads
• Protection of accommodation spaces, service spaces and control stations
• Means of escape
• Fire pumps, fire mains, hydrants and hoses
• Fire extinguishing systems in machinery spaces and in spaces containing fired processes
• Portable fire extinguishers in accommodation, service and working spaces
• Arrangements in machinery and working spaces
• Fire detection and alarm system
• Gas detection and alarm system
• Fireman’s outfit
• Provisions for helicopter facilities
• Fire control plan
• Ensuring fit for purpose status of fire extinguishing appliances (operational readiness and maintenance is detailed in MODU Code 2009)
Number and type of portable extinguishers provided on the MODU would be based on the
fire hazards for the spaces protected.

EEIIAA RReeppoorrtt FFoorr EExxpplloorraattoorryy DDrriilllliinngg AAccttiivviittiieess IInn NNEELLPP BBlloocckk CCYY--OOSSNN--22000099//22,, GGuullff OOff MMaannnnaarr,,
TTaammiill NNaadduu
P a g e | 133
SSeepptteemmbbeerr 22001144 | OIL
66..11..1155 TTeessttiinngg && MMaaiinntteennaannccee OOff CCrriittiiccaall EEqquuiippmmeenntt
Blowout preventer and other pressure control equipment is the most critical equipment to
avoid major accidents during drilling. Therefore the blow out preventer will be pressure
tested regularly in order to maintain its capability of carrying out its intended functions. The
blow out preventer with associated valves and other pressure control equipment on the
facility shall be subjected to a complete overhaul and shall be recertified at regular intervals
based on original equipment manufacturer’s recommendations and international standards
and recommended practices.
Contractor Management (Drilling Contractor)
How major incident risks are managed by the drilling contractor on the MODU is of interest
to OIL, and will therefore ensure that all major incident risks have been assessed and suitable
controls put in place to reduce the risks to as low as reasonably practicable (ALARP). Pre-
mobilisation and pre-drilling assessments will be undertaken by OIL to ensure that the risk to
an individual worker is as low as reasonably practicable. Typically this is demonstrated
through the analysis and summation of all the individual risks and how they impact different
classes of offshore personnel. The major incident risks for which some level of risk
assessment is undertaken normally include:
• Hydrocarbon releases resulting in fires, explosions or asphyxiation
• Structural failure (environmental overload, foundation failure, seismic etc)
• Mooring failure (loss of station keeping and secondary impacts)
• Ship Collision
• Helicopter operations
• Lifting operations and dropped objects (with major incident potential)
The nature of the risk assessment exercise undertaken for each of the risk types varies from
analysis of past incident data, to the detailed assessment of blast overpressure resulting from
hydrocarbon releases of varying sizes and from different locations.
66..11..1166 SSeelleeccttiioonn ooff SSuuppppoorrtt SSeerrvviicceess
The proposed drilling operations will require some level of 3rd party support which typically
includes: helicopter operations, standby and supply vessels, 3rd party services and equipment

EEIIAA RReeppoorrtt FFoorr EExxpplloorraattoorryy DDrriilllliinngg AAccttiivviittiieess IInn NNEELLPP BBlloocckk CCYY--OOSSNN--22000099//22,, GGuullff OOff MMaannnnaarr,,
TTaammiill NNaadduu
P a g e | 134
SSeepptteemmbbeerr 22001144 | OIL
on the rig, onshore supply base and so on. Associated with each of these activities some
level of risk assessment will be undertaken by OIL. These risk assessments will, for example,
drive the need to develop ‘bridging arrangements’ between the contractors that contribute
to the management of a particular activity and the risks that arise from it. However, since OIL
is an experienced E&P operator owning and/or contracting such support services – Risk
Management is built in selection, supervision, and monitoring these support services.
66..11..1177 EEnnssuurriinngg MMaarriinnee IInntteeggrriittyy
• Stability:
- OIL will ensure that floating facilities are in accordance with the requirements contained in the applicable standards concerning stability, water tightness and watertight and weather tight closing means on mobile offshore units.
- There will be weight control systems on floating facilities, which will ensure that weight, weight distribution and centre of gravity are within the design assumptions and equipment and structural parts will be secured against displacements that can affect stability.
• Anchoring, mooring and positioning:
- Floating facilities will have systems to enable them to maintain their position at all times and, if necessary, be able to move away from the position in the event of a situation of hazard and accident.
- Dynamic positioning systems will be designed in such a manner that the position can be maintained in the event of defined failures and damage to the system and in case of accidents.
- During conduct of marine operations, necessary actions will be taken in such a manner that the probability of situations of hazard and accident is avoided and those who take part in the operations, are not injured.
- Requirements will be set to maintaining position in respect of vessels and facilities during implementation of such operations, and criteria will be set for startup and suspension of activities.
• Collision risk management
- The Offshore Installation Manager will be the overall authority for safe operations within the safety zone of installation.

EEIIAA RReeppoorrtt FFoorr EExxpplloorraattoorryy DDrriilllliinngg AAccttiivviittiieess IInn NNEELLPP BBlloocckk CCYY--OOSSNN--22000099//22,, GGuullff OOff MMaannnnaarr,,
TTaammiill NNaadduu
P a g e | 135
SSeepptteemmbbeerr 22001144 | OIL
- OIL will ensure that a collision risk management system is implemented and maintained wherein following shall be inter alia included -
- suitability of attendant vessels and off take tankers and competence of their crew;
- assessment of probability of collision peculiar to the installation and its location;
- provision of necessary risk reduction and control measures;
- appropriate procedures and communications for managing operations of attendant vessels developed jointly with marine services providers;
- provision of appropriate equipment and procedures for detecting and assessing the actions of vessels intruding into the safety zone;
- provision of competent installation personnel with an appropriate level of marine knowledge;
- provision of appropriate evacuation and rescue procedures and facilities; and
- regular audit and updating of the above systems.
• Control in the safety zone
- The master of the attendant vessel or off take tanker will comply with instructions of the Offshore Installation Manager when in a safety zone.
- The master of the attendant vessel or off take tanker will be responsible for safety of his crew, the safe operation of attendant vessel or off take tanker and for avoiding collision with the installation or associated facilities.
• Operations in rough weather conditions
- The operator will ensure safe working in adverse weather and tidal conditions and identify the rough weather conditions when the operations are to be discontinued and evacuations carried out, as required.
- The operator will ensure that transfer of personnel and cargo between the vessel and installation is carried out under safe weather conditions and such transfers should be stopped during adverse or unsuitable weather conditions
• Cargo management
- The operator will ensure optimization of cargo trips, from and to the shore, and cargo handling time at installation by efficient planning of cargo supplies through containerization, pre-slinging of cargo etc.

EEIIAA RReeppoorrtt FFoorr EExxpplloorraattoorryy DDrriilllliinngg AAccttiivviittiieess IInn NNEELLPP BBlloocckk CCYY--OOSSNN--22000099//22,, GGuullff OOff MMaannnnaarr,,
TTaammiill NNaadduu
P a g e | 136
SSeepptteemmbbeerr 22001144 | OIL
66..11..1188 HH22SS EEmmiissssiioonn CCoonnttrrooll PPllaannss
66..11..1199 DDeetteeccttiioonn aanndd AAllaarrmm SSyysstteemmss
The system comprises of H2S sensors located at pre-determined points. In air conditioned or
ventilated areas, detectors will be installed at the fresh air inlets (ducts, entrance ways etc.,).
Outside, detectors are required to be installed on gas carrying equipment (well nipple, shale
shaker, mud, pits, drillers stands etc.,). These are located near potential leaks, such as the
shaft gland connection, flanges etc. It is pure alarm system with two warning stages and
cannot trigger emergency shutdown alone. The two levels of alarm are as follows:
• 10 ppm H2S level alarm triggers a light signal but does not indicate danger for all. At this stage persons are instructed to stand by to check the installation after announcement on public address system (PA) by the tool pusher, otherwise, to proceed to the upwind side
• 20 ppm H2S high level triggers a sound alarm and also red light on the control panel. Emergency alarm is sounded by two short rings of bell intermittently. At this stage breathing equipment is to be used immediately and the hazard area to be vacated unless announcement on Public Address System by the tool pusher provides other instruction.
66..11..2200 VViissuuaall WWaarrnniinngg SSiiggnnss
In case of high level H2S alarm, the following warning signs should be displayed to alert
helicopter and vessels in the vicinity of the drilling rig.
• Red flag 90cm X 60 cms on each side of the rig.

EEIIAA RReeppoorrtt FFoorr EExxpplloorraattoorryy DDrriilllliinngg AAccttiivviittiieess IInn NNEELLPP BBlloocckk CCYY--OOSSNN--22000099//22,, GGuullff OOff MMaannnnaarr,,
TTaammiill NNaadduu
P a g e | 137
SSeepptteemmbbeerr 22001144 | OIL
• Danger boards painted yellow with black lettering 30 cms high indicating "DANGER
H2S".
66..11..2211 MMuusstteerr SSttaattiioonnss aanndd EEssccaappee RRoouuttee
Since H2S is heavier than air, it is likely to settle down at lower levels particularly in still air or
in light winds and cut off the natural escape route to the boat landing; in this situation
following is practiced:
• Sufficient stair cases on the upwind side of prevailing winds for escape route up the
stairs or down to the lifeboat.
• Muster stations for operating personnel in the event of gas alarm, areas in the open on
the upper deck which can be kept free of H2S by the wind.
66..11..2222 VVeennttiillaattiioonn
Forced air ventilation to disperse any accumulation of H2S will be provided by fans (bug
blower) at the following points:
• Shale shaker
• Working platforms
• Control rooms
66..11..2233 HH22SS KKiicckk ccoonnttrrooll
The control of H2S kick may be achieved either by bulldozing gas back into formation or
circulating it out. The actual method to be adopted will depend upon the condition of the
well. When a gas kick occurs, estimate the quantity of H2S present taking adequate
precautionary measures of wearing self-contained breathing apparatus (SCBA). The
following procedure is to be adopted:
• Close BOP, monitor SIDPP, SICP & pit gain.
• If the concentration is high and cannot be circulated out due to H2S hazard in atmosphere, bulldoze the gas into formation by pumping through kill line.
• Raise mud wt. and pH as required.

EEIIAA RReeppoorrtt FFoorr EExxpplloorraattoorryy DDrriilllliinngg AAccttiivviittiieess IInn NNEELLPP BBlloocckk CCYY--OOSSNN--22000099//22,, GGuullff OOff MMaannnnaarr,,
TTaammiill NNaadduu
P a g e | 138
SSeepptteemmbbeerr 22001144 | OIL
• Load H2S scavenger like zinc carbonate and ironite sponge as may be necessary in the active mud pit.
• Circulate the gas through choke and degasser and burn off the gas.
The following factors are needed to be kept in view:-
• All persons on the drilling floor, shale shaker area, mud pump and tank should put on self-contained breathing apparatus when the kick is to be circulated out.
• Persons who are not required for the control operation are withdrawn to a safe area, where adequate ventilation is arranged.
• Frequent checks with portable H2S gas detector are to be made.
• Supply vessels will be directed to stay upwind on power and maintain continuous radio and visual watch.
66..22 OOIILL SSPPIILLLL RRIISSKK AASSSSEESSSSMMEENNTT
66..22..11 OOiill ssppiillll sscceennaarriiooss
Exploration drilling in offshore areas implies a risk for acute spills to sea. Major incidents are
blowouts during drilling into the reservoir zone. Minor incidents include small spills of crude
oil (well releases), diesel (from the rig or from supply vessels) or hydraulic oil (from the rig).
With respect to environmental risk and oil spill emergency preparedness, the dimensioning
incident is a blowout.
The oil spill scenarios have been assessed to classify into:
• Most probable spill scenario
• Maximum likely spill
• Worst case spill
Table 6-5: Oil Spill Scenarios
Spill Scenario Classification Qty of oil spilled
Spill due to Rupture of flow lines/ hose during transfer of diesel from supply vessel to the Drilling Rig
(as such these transfer hoses are likely to have auto shut off valve, but presuming a scenario where this auto shut off valve is non-functional and is manually shut off after a
reaction time of 15 min)
Most probable spill scenario
100 MT
(Instantaneous)

EEIIAA RReeppoorrtt FFoorr EExxpplloorraattoorryy DDrriilllliinngg AAccttiivviittiieess IInn NNEELLPP BBlloocckk CCYY--OOSSNN--22000099//22,, GGuullff OOff MMaannnnaarr,,
TTaammiill NNaadduu
P a g e | 139
SSeepptteemmbbeerr 22001144 | OIL
Spill Scenario Classification Qty of oil spilled
Spill of diesel due to collision between supply vessel and the drilling rig and damage to diesel storage in the supply vessel
Maximum likely spill
700 MT
(Instantaneous)
Spill of crude oil / condensate due to well blowout which takes 2 days to cap
Worst case spill 5000 MT
(over a period of 2 days)
66..22..22 MMaarriinnee && CCooaassttaall FFeeaattuurreess SSeennssiittiivvee TToo OOiill SSppiillllss
GoMNP is located away from block boundary and none of the block area overlaps with
GoMNP area. GoMBR boundary passes through block area on north side. The nearest
prospect area located to GoMBR and GoMNP boundary is Prospect Area 3 with approximate
aerial distance of 8 km and 21 km respectively.
Besides this, the coast towards the north side of the block has various coastal villages which
are also sensitive to oil spills. The nearest prospect area - Prospect Area 3 to Dhanushkodi
land area is located at approximate aerial distance of 28 km.
The existing activities that pose risk to the marine ecology of the Gulf of Mannar are the oil
tankers and marine vessels that travel to and fro to Tuticorin port situated on the western
coast. Fishing and Salt making through salt pans salt are important livelihood activities that
are sensitive to oil spills.
66..22..33 AAsssseessssmmeenntt ooff RRiisskkss DDuuee TToo OOiill SSppiillllss
In absence of sufficient metocean data and an oil spill trajectory model validated to Indian
metocean conditions, the assessment of risks due to oil spills is made on the basis of logical
analysis. Quantitative spill trajectory models have not been used as part of this assessment.
This assessment is with respect to seasonal trend of coastal currents.
A report “Oil Spill Contingency Plan For The Coastal State Of Tamil Nadu” (by Govt. of Tamil
Nadu) indicates that the coastal currents that are prevalent along the Tamil Nadu coast are
of two types. The notherly drift during the months of May to October and southerly drift
during November to March.
Considering this, accidental spills, if any, from the proposed oil and gas drilling activity in this
Block are not likely to hit the coast during the weather window generally chosen for
deploying offshore rigs and undertaking drilling activities. Moreover the nearest prospect

EEIIAA RReeppoorrtt FFoorr EExxpplloorraattoorryy DDrriilllliinngg AAccttiivviittiieess IInn NNEELLPP BBlloocckk CCYY--OOSSNN--22000099//22,, GGuullff OOff MMaannnnaarr,,
TTaammiill NNaadduu
P a g e | 140
SSeepptteemmbbeerr 22001144 | OIL
area – Prospect Area 3 (from the coast) proposed to be drilled is at a distance of around 28
km from the coast. Therefore the risk of oil spills due to the proposed exploratory drilling
activities in this block is low. The risk of oil spill is further reduced, as this is expected to be a
gas reservoir, and only oil condensate is expected – thereby reducing possibility of any major
oil spills.
However, considering the coastal sensitivities, OIL understands that preparedness to respond
to oil spills during exploratory drilling program is key for this Block.
66..22..44 OOiill SSppiillll CCoonnttiinnggeennccyy PPllaann
Since accidental spills of crude oil and oil based products pose risks to human health and
environment, OIL will make every effort to prevent accidental oil spills and to clean them up
quickly in case such accidental spill occurs.
The entire offshore facilities are designed, installed and operated in such a way, so as to
minimize possibility of any accidental oil spills. Facilities and resources supplied by
outsourced agencies also meet international pollution prevention design and operation
standards. Oil spill risks are identified and measures to prevent and contain oil spills have
been outlined in contingency plan given below:
• To establish response procedures for oil spills
• To combat, contain, recover, cleanup and dispose off the spilled oil
• To provide training and drill schedule for keeping the system in place, and
• To meet statutory requirements
Activation of plan starts with notification of “Oil Spill” and spill assessment. Immediate action
is taken to disconnect the source. Further action is taken based on Short Term and Long
Term strategies for spill containment.
Oil Spill Response
In any marine oil spill response, mobilization of resources depends on a number of factors.
One of the most critical ones is the time taken to activate this plan and mobilize equipment
& resources to the scene of the spill. To ensure efficiency in response initiation, a tiered
response approach is adopted by OIL in line with NOSDCP and Oil Industry Safety
Directorate (OISD) guidelines. This plan takes into account the response time needed to

EEIIAA RReeppoorrtt FFoorr EExxpplloorraattoorryy DDrriilllliinngg AAccttiivviittiieess IInn NNEELLPP BBlloocckk CCYY--OOSSNN--22000099//22,, GGuullff OOff MMaannnnaarr,,
TTaammiill NNaadduu
P a g e | 141
SSeepptteemmbbeerr 22001144 | OIL
mobilize, transport and deploy increasing amounts of resources to the scene of a spill,
depending upon the severity of oil spill.
The size, location and timing of an oil spill are unpredictable and different situations require
different responses. The severity of an oil spill incident is largely based on the quantity of oil
spilled and its distance from the shore. With increasing size of spill and decreasing distance
from shore the number of outside agencies involved and urgency of their notification
increases and so does the resources required and degree of organisation needed. Based on
past experience of oil spills, the strategy and guidelines for dealing with different sizes of oil
spills, Tier wise classification of resources have emerged. But these tier levels were varying
from place to place and company to company based on different interpretations. In India,
considering these differences, guidelines have been provided by Oil Industry Safety
Directorate (OISD), Ministry of Petroleum & Natural Gas to enable oil companies to plan
their respective tiered response strategy.
As per the guidelines of Oil Industry Safety Directorate, OIL follows a 3 tier approach for oil
spill response – Tier 1, 2 and 3. These are explained in following sections.
Tier I:
In line with the standard industry practice, OIL is prepared to mitigate spills of importance
from routine operations (Tier-1), while oil spill situations of higher magnitude are dealt with
industry co-operation and external intervention. Oil spill is considered as Tier 1 when it is less
than 100T and is up to 500 m around its installations. OIL will immediately respond to
combating such oil spill incidents and will continue to provide equipment, material, trained
manpower, sampling efforts, and vessels.
Tier II:
Oil spill is considered as Tier II when it is more than 100T but less than 700T. OIL will
immediately inform Coast Guard about such oil spill incidents as they are the national
agency for ensuring marine environment security in India.
Coast Guard is involved in protection and preservation of the environment and prevention
and control of pollution. Being the national coordinator in oil spill response, it has a variety
of responsibilities under the National Oil Spill Disaster Contingency Plan (NOS-DCP). It is the
coordinator for oil spill response in the entire maritime zones of India with specific allocation

EEIIAA RReeppoorrtt FFoorr EExxpplloorraattoorryy DDrriilllliinngg AAccttiivviittiieess IInn NNEELLPP BBlloocckk CCYY--OOSSNN--22000099//22,, GGuullff OOff MMaannnnaarr,,
TTaammiill NNaadduu
P a g e | 142
SSeepptteemmbbeerr 22001144 | OIL
for direct response functions in the maritime zones outside the port limits and notified areas
around offshore oil facilities.
The nearest pollution response resources for shoreline cleanup are available in at Tuticorin
port trust and Tuticorin coast guard. The details of pollution response capability at Tuticorin
port are as follows:
Source: National Oil Spill Disaster Contingency plan (short title: NOSDCP), 2006 (Updated), Ministry of Defense, Government of India, CGBR 771, (Edition 2006)
Tier III:
Oil spill is considered as Tier III when it is more than 700T. Globally there are a select few
industry cooperative, international Tier 3 Response Centers. Their location was originally
influenced by the occurrence of major oil spills from shipping, these being perceived as the
greatest risk. Since then their service remit has evolved and the membership and capability
have changed. While stockpiles of equipment remain a key feature, emphasis has grown on
the provision of expert staff for a range of preparedness and response services.
For combating oil spills of this magnitude, OIL will tie-up with Oil Spill Response
Organizations (OSRO) for Tier-III pollution response facilities.

EEIIAA RReeppoorrtt FFoorr EExxpplloorraattoorryy DDrriilllliinngg AAccttiivviittiieess IInn NNEELLPP BBlloocckk CCYY--OOSSNN--22000099//22,, GGuullff OOff MMaannnnaarr,,
TTaammiill NNaadduu
P a g e | 143
SSeepptteemmbbeerr 22001144 | OIL
Strategy during first Six Hours
Depending upon nature of emergency at sea and weather conditions booms will be laid
around source of spill for containment. Recovered oil will be stored for further disposal as
per laid down procedures.
If some quantity of oil has spread prior to deployment of booms or some oil has slipped
away during containment and recovery process, following factors will be taken into
consideration prior to taking decision on application of dispersant:
• Spilled oil shall not be more than 4 hours old
• Oil is moving towards shoreline
• Spilled crude characteristics are amenable to use of dispersants
• Prevailing weather conditions are conducive to dispersant applications.
• Prior approval from Coast Guard for use of dispersant will be obtained.
Spraying of Dispersants
During rough weather, monsoon, low visibility or in case of delayed deployment of
equipment, the spraying of dispersants is considered one of the options, because this
strategy needs very less reaction time (resource mobilization time) and can be initiated by
the boat/vessels crew operating in the area. Spray of dispersants can be done through
Helicopters also. Response equipment such as Containment Booms will be deployed for
protection of Gulf of Mannar.
Shore Cleanup
Despite best efforts to contain and recover spilled oil, there is always a likelihood of spilled
oil reaching shorelines. Shoreline cleanup technique will be practiced for the left over oil as
per topography of the coastline.

EEIIAA RReeppoorrtt FFoorr EExxpplloorraattoorryy DDrriilllliinngg AAccttiivviittiieess IInn NNEELLPP BBlloocckk CCYY--OOSSNN--22000099//22,, GGuullff OOff MMaannnnaarr,,
TTaammiill NNaadduu
P a g e | 144
SSeepptteemmbbeerr 22001144 | OIL
77 EENNVVIIRROONNMMEENNTT MMAANNAAGGEEMMEENNTT PPLLAANN
The Environmental Management Plan is a site specific document for OIL’s Offshore Drilling
Project in Gulf of Mannar developed to ensure that the project can be implemented in an
environmental sustainable manner and where all contractors and related stakeholders
understand the potential environmental impacts and risks arising from the proposed project
and take appropriate actions to properly manage them. This EMP will be considered to be an
overview document that will guide environment management of all aspects of OIL’s activities
in the CY-OSN-2009/2 Block and activities related to the operations of its onshore project
base at Tuticorin/Kakinada. This EMP may also be considered as flexible and will be backed
up by more specific Environmental Action Plans, Procedures and Bridging Documents with
the progress of the well planning and the exploratory program. The EMP describes these
actions in terms of:
• Regulations and Standards
• Best Practices and guides
• Local Environmental and Social Sensitivities
• International Conventions and National Policies
77..11 SSEELLEECCTTIIOONN OOFF DDRRIILLLLIINNGG LLOOCCAATTIIOONN AANNDD NNAAVVIIGGAATTIIOONNAALL PPAATTHH WWAAYYSS
Proper site selection and routing of navigational pathway for drilling rig and supply vessels
can result in preventive mitigation measures that may considerably reduce impacts arising
out of the proposed project. OIL’s planning team will work in close cooperation with the HSE
Department to look at preventive options early in the project life cycle based on findings of
this EIA study. This will ensure that the need for “end-of-the-pipe” solutions is minimized, to
the extent possible. Some of the proposed mitigation measures that need to be adopted are
discussed below.
Setting of Exploratory Block and Drill Locations
As established earlier in the EIA findings for the proposed offshore project in the Gulf of
Mannar, the project block has been awarded by DGH. At present Gulf of Mannar Biosphere

EEIIAA RReeppoorrtt FFoorr EExxpplloorraattoorryy DDrriilllliinngg AAccttiivviittiieess IInn NNEELLPP BBlloocckk CCYY--OOSSNN--22000099//22,, GGuullff OOff MMaannnnaarr,,
TTaammiill NNaadduu
P a g e | 145
SSeepptteemmbbeerr 22001144 | OIL
Reserve area is expected to overlap with project block on north side but no exploratory
drilling well is proposed in this region.
Occurrence of sensitive species in close proximity or within the block will also govern the
selection of drilling locations. If sensitive species viz. sea turtles or marine mammals are
observed/anticipated in the block area, their presence will be monitored in accordance with
the international sighting guidelines for marine mammals. Such monitoring will be
conducted before the onset of drilling activities, and will be maintained throughout the
offshore exploratory operations. In areas where significant impacts to sensitive species are
anticipated, experienced observers will be used for the monitoring exercise.
Selection of Navigational Pathway for Drilling Rig & Supply Vessels
OIL will be giving due weightage to the impacts that may arise as a result of the movement
of supply vessels and drilling rig, which needs to be defined prior to the exploratory
operations. Such routing will take into account MARPOL designated sensitive areas and also
marine habitats protected by India legislation.
Appropriate measures will be adopted by the project proponent to avoid migratory routes of
turtles and ecologically and culturally sensitive coastal areas during vessel movement. In
addition, consultations with relevant stakeholders (Directorate of Fisheries, Coast Guard,
government agencies related to Gulf of Mannar, Port Management Board, etc) will be carried
out to aid in the routing of supply vessels from the logistic base. The support vessels will also
have the relevant permits and certifications to comply with the requirements of the
International Maritime Organization for operation in Gulf of Mannar.
77..22 AATTMMOOSSPPHHEERRIICC EEMMIISSSSIIOONNSS
There are a number of sources of atmospheric emissions (both point sources and fugitive
emissions) from the proposed offshore project. The primary air pollutant emission source for
the proposed project is DG sets. One DG set/drilling well for meeting power requirement 20-
25 MW hour per day will be in operation during the exploratory period with estimated fuel
consumption of 20 Kl/day/rig. The following specific mitigation measures will be
implemented:
• All equipments would be operated within specified design parameters during drilling operations and fully trained personnel will be utilized to maintain and test the systems;

EEIIAA RReeppoorrtt FFoorr EExxpplloorraattoorryy DDrriilllliinngg AAccttiivviittiieess IInn NNEELLPP BBlloocckk CCYY--OOSSNN--22000099//22,, GGuullff OOff MMaannnnaarr,,
TTaammiill NNaadduu
P a g e | 146
SSeepptteemmbbeerr 22001144 | OIL
• The project will monitor and record fuel use for compressors and generator sets.
• The emissions from DG sets will be in accordance with the guidelines in MARPOL.
• Any dry, dusty materials (chemicals), mud etc. would be stored in bags or sealed containers;
• Valves, flanges, fittings, seals and packings considering safety and suitability requirements will be selected to reduce gas leaks and fugitive emissions. Additionally, leak detection and repair programs will be implemented;
• Flaring of gas during well testing will be minimized and restricted to the short duration;
• Flare combustion efficiency will be maximized by controlling and optimizing flare fuel/air/steam flow rates to ensure the correct ratio of assist stream to flare stream; and
The preventive maintenance program and appropriate operational control procedures will be
developed for all machineries and equipments which can result in air emissions. Through the
program and procedures, it will also to be ensured that engines and exhaust systems of all
supply vessels and equipments used for the project will be maintained so that exhaust
emissions are low and do not breach statutory limits set for that supply vessels/equipment
type. Routine maintenance will be of high standard to ensure that such emissions are
minimized. Method statements will be framed which would make regular maintenance of
diesel engines mandatory to ensure that emissions are minimized, for example, by cleaning
fuel injectors.
77..33 SSTTOORRAAGGEE AANNDD HHAANNDDLLIINNGG OOFF CCHHEEMMIICCAALLSS AANNDD SSUUPPPPLLIIEESS
OIL will ensure proper storage and handling of chemicals and other supplies at the onshore
facility at Tuticorin/Kakinada base, prior to their shipment on the drilling rig. A good working
inventory will help to minimize any impacts that may arise due to such handling and storage.
All loading and unloading activities will be carried out as close as possible to the storage
facilities. It will be ensured that lids of all containers containing volatile substances/chemicals
are properly fitted. All chemical storage areas will have proper bunds so that contaminated
run-off cannot escape as runoff into the nearby coastal areas. Regular inspections will be
undertaken for the storage areas to detect any indication of leakage, decomposition or other
unsafe storage conditions and corrective actions are initiated accordingly. Adequate Personal

EEIIAA RReeppoorrtt FFoorr EExxpplloorraattoorryy DDrriilllliinngg AAccttiivviittiieess IInn NNEELLPP BBlloocckk CCYY--OOSSNN--22000099//22,, GGuullff OOff MMaannnnaarr,,
TTaammiill NNaadduu
P a g e | 147
SSeepptteemmbbeerr 22001144 | OIL
Protective Equipments (PPEs) shall be provided to all workers involved in handling of such
hazardous materials.
77..44 MMAANNAAGGEEMMEENNTT OOFF DDRRIILLLL CCUUTTTTIINNGGSS && DDRRIILLLLIINNGG MMUUDD
The offshore exploratory drilling project is likely to generate average volume of 300 m3 of
drill cuttings per well and 5-10 KL/day of drilling fluid. The disposal option for such drill
cuttings generated from offshore drilling will primarily be governed by the type of drilling
mud (water or oil based) utilized for the proposed offshore exploratory drilling operations.
The disposal of the drill cuttings will be conforming to the guidelines pertaining to the
“Disposal of Drill Cuttings and Drilling Fluids for Offshore Installations” provided by the
Ministry of Environment & Forests (MoEF) G.S.R. 546(E) August 2005. Drill cuttings disposal
will be monitored to check compliance of these guidelines.
• Oil based mud will not be used, and only Water based Mud will be used
• To mitigate specific hole problems if Low Toxic synthetic oil based mud (LTSOBM) is used, OIL will ensure that it has less than 1% of aromatic content and will use with intimation to MoEF
• Chemical additives used in the mud will be biodegradable (mainly organic constituents) with a toxicity of 96 hr LC 50 Value > 30,000 mg /l as per mysid toxicity or toxicity test conducted on locally available sensitive sea species
• Hexavalent chromium compound will not be used in drilling mud. Alternative chemical in place of chrome lignosulfonate will be used.
• Except in emergency situations, bulk discharge of drilling mud in offshore will not be undertaken
• Drilling mud will be recycled to a maximum extent.
• Discharge of thoroughly washed drill cuttings separated from mud & unusable portion of mud will be discharged into sea intermittently, at an average rate of 50 bbl/hr/well to have proper dilution & dispersion without any adverse impact on marine environment.
• Drill cuttings will not be discharged in sensitive areas notified by the Ministry of Environment and Forests.
• Disposal of drill cuttings associated with high oil content from hydrocarbon bearing formation will have oil content < 10 gm/kg.

EEIIAA RReeppoorrtt FFoorr EExxpplloorraattoorryy DDrriilllliinngg AAccttiivviittiieess IInn NNEELLPP BBlloocckk CCYY--OOSSNN--22000099//22,, GGuullff OOff MMaannnnaarr,,
TTaammiill NNaadduu
P a g e | 148
SSeepptteemmbbeerr 22001144 | OIL
• The drill cuttings wash water will be treated to confirm limits notified under EPA, before disposal into Sea. The treated effluent will be monitored regularly.
• Discharge of drill cuttings from locations close to shore (< 5 km) will ensure that there is no adverse impact on marine Eco-system and on the shore
• Use of environmental friendly technology emerging due to substitution of DF or disposal technology will be brought to the notice of MoEF and regulatory agencies and a prior approval from Ministry of Environment and Forests will be taken
• Barite used in preparation of drilling mud will not contain Hg> 1 mg/kg & Cd> 3 mg/kg.
• Daily discharge of drill cuttings and drilling mud to offshore will be recorded, daily effluent quality will be monitored and compliance reports will be submitted once in every six-months to Ministry of Environment and Forests
77..55 OOIILLYY WWAATTEERR DDIISSCCHHAARRGGEESS AANNDD OOTTHHEERR WWAASSTTEESS
In addition to drill cuttings and unused drilling mud, the proposed drilling operations would
also result in the generation of other routine and non-routine waste streams. These waste
steams will primarily comprise of bilge fluids, ballast water, cooling water, deck drainage and
food and sanitary waste and needs to be disposed and managed in compliance with best
industry practices and international requirements to avoid any impacts arising from the
same. The waste streams which are routinely generated at offshore facilities are listed below
along with their recommended disposal measures and management alternatives:
Bilge Fluids
Bilge waters from machinery spaces in offshore facilities and support vessels will be routed
to the facility closed drainage system, or contained and treated before discharge to meet the
MARPOL 73/78 requirements. This will require that the equipment and machine spaces on
the drilling rig are fully contained and have dedicated drains leading to the bilge water
system for oily waste products. If treatment to this standard is not possible, oily residues
collected in this system will be containerized in transit tanks and returned to the shore for
disposal.
Ballast Water
The drilling rig will be having a Ballast Water records and OIL will formulate ballast water
management procedures to a given standard. These procedures will serve as an effective

EEIIAA RReeppoorrtt FFoorr EExxpplloorraattoorryy DDrriilllliinngg AAccttiivviittiieess IInn NNEELLPP BBlloocckk CCYY--OOSSNN--22000099//22,, GGuullff OOff MMaannnnaarr,,
TTaammiill NNaadduu
P a g e | 149
SSeepptteemmbbeerr 22001144 | OIL
management tool in reducing the risk arising from ballast-mediated invasion. This process
involved will reduce the density of coastal organisms in ballast tanks which may be able to
invade a recipient port, replacing them with oceanic organisms with a lower probability of
survival in near shore waters.
Cooling Water
In regard to the disposal of cooling water, available alternatives will be evaluated and, where
practical, the seawater intake depth will be optimized to reduce the need for use of
chemicals. Appropriate screens will be fitted to the seawater intake if safe and practical.
Deck Drainage
Drainage water generated from precipitation, sea spray, or routine operations, such as deck
and equipment cleaning, will be routed to separate drainage systems on offshore facilities of
the drilling rig. This includes drainage water from process areas that could be contaminated
with oil (closed drains) and drainage water from non-process areas (open drains). The
following management measures will be followed:
• Chemicals, oils and wastes will be stored in the designated storage areas on the drilling rig where appropriate spill cleanup materials (e.g. absorbents, containers) are maintained in accessible locations;
• In the event of a chemical or oil spill, absorbents will be used to remove spill material prior to any washing activities;
• Absorbent material, used for cleanup, will be containerized and sent to shore as hazardous waste;
• Bunding will be provided for those areas/activities where there is an increased risk of oil/chemical spill (e.g. fuel transfer);
• Material Safety Data Sheets will be made available for all chemicals used on the drilling rig (which also includes spill response requirements);
• Chemicals used will be assessed for environmental impacts prior to their purchase (e.g. fully biodegradable detergent); and
• Slops water will be discharged via an IMO approved Oil-in-water (OIW) meter as per MARPOL requirement.
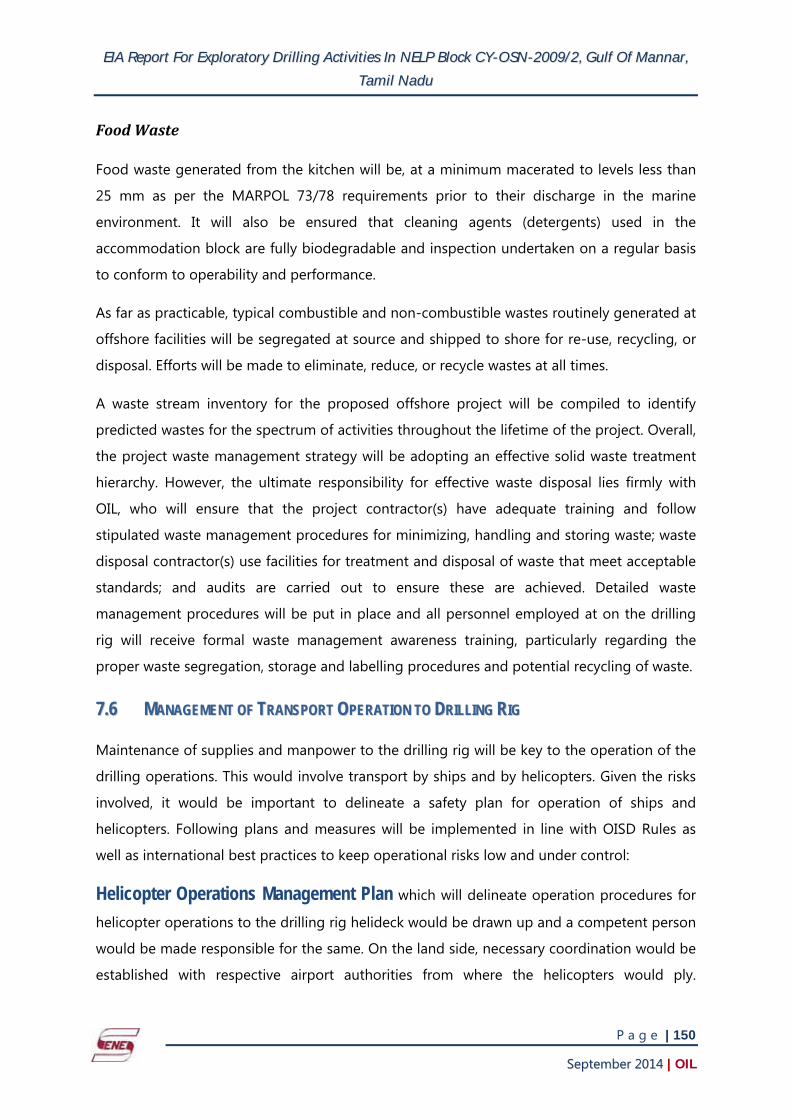
EEIIAA RReeppoorrtt FFoorr EExxpplloorraattoorryy DDrriilllliinngg AAccttiivviittiieess IInn NNEELLPP BBlloocckk CCYY--OOSSNN--22000099//22,, GGuullff OOff MMaannnnaarr,,
TTaammiill NNaadduu
P a g e | 150
SSeepptteemmbbeerr 22001144 | OIL
Food Waste
Food waste generated from the kitchen will be, at a minimum macerated to levels less than
25 mm as per the MARPOL 73/78 requirements prior to their discharge in the marine
environment. It will also be ensured that cleaning agents (detergents) used in the
accommodation block are fully biodegradable and inspection undertaken on a regular basis
to conform to operability and performance.
As far as practicable, typical combustible and non-combustible wastes routinely generated at
offshore facilities will be segregated at source and shipped to shore for re-use, recycling, or
disposal. Efforts will be made to eliminate, reduce, or recycle wastes at all times.
A waste stream inventory for the proposed offshore project will be compiled to identify
predicted wastes for the spectrum of activities throughout the lifetime of the project. Overall,
the project waste management strategy will be adopting an effective solid waste treatment
hierarchy. However, the ultimate responsibility for effective waste disposal lies firmly with
OIL, who will ensure that the project contractor(s) have adequate training and follow
stipulated waste management procedures for minimizing, handling and storing waste; waste
disposal contractor(s) use facilities for treatment and disposal of waste that meet acceptable
standards; and audits are carried out to ensure these are achieved. Detailed waste
management procedures will be put in place and all personnel employed at on the drilling
rig will receive formal waste management awareness training, particularly regarding the
proper waste segregation, storage and labelling procedures and potential recycling of waste.
77..66 MMAANNAAGGEEMMEENNTT OOFF TTRRAANNSSPPOORRTT OOPPEERRAATTIIOONN TTOO DDRRIILLLLIINNGG RRIIGG
Maintenance of supplies and manpower to the drilling rig will be key to the operation of the
drilling operations. This would involve transport by ships and by helicopters. Given the risks
involved, it would be important to delineate a safety plan for operation of ships and
helicopters. Following plans and measures will be implemented in line with OISD Rules as
well as international best practices to keep operational risks low and under control:
Helicopter Operations Management Plan which will delineate operation procedures for
helicopter operations to the drilling rig helideck would be drawn up and a competent person
would be made responsible for the same. On the land side, necessary coordination would be
established with respective airport authorities from where the helicopters would ply.

EEIIAA RReeppoorrtt FFoorr EExxpplloorraattoorryy DDrriilllliinngg AAccttiivviittiieess IInn NNEELLPP BBlloocckk CCYY--OOSSNN--22000099//22,, GGuullff OOff MMaannnnaarr,,
TTaammiill NNaadduu
P a g e | 151
SSeepptteemmbbeerr 22001144 | OIL
Appropriate communication facilities would be established in the drilling rig to be able to
communicate on radio with land based control room.
Vessel Management Plan will be formulated and implemented to reduce collision risk,
both vessel–vessel and rig–vessel and a person made responsible for all vessel operations.
The plan would establish a 500 m safety zone around MODU (Semisubmersible/drillship),
define operational procedures for approach, movements during bad weather, no go areas,
etc. and also specify mode of communication between any supply vessels approaching and
the drilling rig. All vessel operators would be trained on the operating procedures and
method of communication before they dock with the drilling rig.
77..77 OOIILL’’SS MMAANNAAGGEEMMEENNTT SSYYSSTTEEMM
OIL is committed to protecting the environment through improving the effectiveness of
management and reporting systems and ensuring the reduction of local environmental
impact from operations by improving environmental performance and implementing
initiatives for the conservation of biodiversity and the resource recovery and reuse. This is
achieved through the implementation of OIL HSE Policy. Through its environment policy, OIL
is deeply committed to the preservation of environment & ecology and sustainable
development.
The Internal Safety Organisation (ISO) will be developed for the project which will play the
role of recommending strategies for continuous improvement in Safety, Health &
Environmental performance by developing and maintaining HSE management systems,
working on the principle of management of risks & reduction of losses. These systems are
designed to follow & complete the management cycle i.e. “Plan, Do, Check, Action” for
achieving the objectives.
As stated in the OIL India Safety Policy, OIL is fully committed to safety of its employees,
contractors and resources of company. For pursuance of the same, objectives of OIL are to
ensure safe work place in all operational areas and comply with all acts, rules, regulations,
and applicable standards/codes, issued from time to time by statuary authorities besides
OIL’s own policy and manual for safety.
The EMP developed and presented in this section, to mitigate impacts from the exploratory
drilling project has been structured in a manner that at a later stage it can be fully integrated
with the Health, Safety and Environment (HSE) Management System of OIL. Mitigation

EEIIAA RReeppoorrtt FFoorr EExxpplloorraattoorryy DDrriilllliinngg AAccttiivviittiieess IInn NNEELLPP BBlloocckk CCYY--OOSSNN--22000099//22,, GGuullff OOff MMaannnnaarr,,
TTaammiill NNaadduu
P a g e | 152
SSeepptteemmbbeerr 22001144 | OIL
measures presented in the EMP section have been defined taking into consideration impacts
assessed during environmental impact assessment and are in line with OIL HSE policy
requirements.
77..77..11 PPoolliiccyy
Safety and Environment policy has been evolved through review of quality, occupational
health, safety and environment management aspects. The Safety Policy comprising of
following objectives:
• Ensure Safe work place in all our operational areas.
• Strive for “Zero Tolerance to Accidents and no harm to Man & Machine” with Pro-active
Safety measure in place.
• Demonstrate commitment to achieve Safety Excellence at workplace by adoption and
promotion of best practices and technology.
• Establish a strong Safety culture by Consulting, Listening, Responding and Decision –
making.
• Comply with all Acts, Rules, Regulations and Applicable Standards /Codes, issued from
time to time by the statutory authorities besides our own policies & manuals relating to
safety.
• Prevent Mishaps, Minimize Risk & Hazards and remain trained, equipped and ready for
effective & prompt response to emergencies including disasters & accidents.
• Continually improve Safety Performance by establishing clear and measurable
objectives through systematic implementation plan and Reorganization /Reward
system.
• Promote Safety Awareness & Encourage Knowledge up gradation amongst all the
employees & Contractor personnel.
The environment policy comprises of following objectives:
• Ensure an environment friendly work place in all our operations.
• Comply with relevant Environmental Laws and Regulations in OIL’s operations,
prescribed by the statutory bodies.

EEIIAA RReeppoorrtt FFoorr EExxpplloorraattoorryy DDrriilllliinngg AAccttiivviittiieess IInn NNEELLPP BBlloocckk CCYY--OOSSNN--22000099//22,, GGuullff OOff MMaannnnaarr,,
TTaammiill NNaadduu
P a g e | 153
SSeepptteemmbbeerr 22001144 | OIL
• Follow a systemic approach to Environmental Management plan in order to achieve
continual performance improvement.
• Adopt technologies that conserve energy, prevent pollution, maximize recycling, reduce
wastes, discharged and emissions.
• Develop green belts and plant trees in and around OIL’s operational areas in harmony
with nature.
• Protect aesthetic, cultural, social patterns and historical characteristics in and around
OIL’s operational areas.
• Promote a culture among OIL employees, contractors and all the stake holders
associated with OIL for shared responsibility towards environmental protection.
• Promote and nature a healthy, safe & productive environment in its area of operations.
77..77..22 MMaannaaggeemmeenntt MMaannuuaall
The safe operating procedures are developed which includes guidelines for the following aspects
• Defined H.S.E. Policy.
• Company’s laid down procedures.
• Organisational set up for HSE management.
• Accident reporting, investigation & analysis.
• Hazard identification & control.
• Personal Protective Equipment.
• Emergency preparedness.
• Employees participation in HSE management.
• Safety Audit.
• Training, Development & awareness program.
• Occupational Health Services.
• Environmental protection measures & continual improvement.
• Record keeping/documentation.

EEIIAA RReeppoorrtt FFoorr EExxpplloorraattoorryy DDrriilllliinngg AAccttiivviittiieess IInn NNEELLPP BBlloocckk CCYY--OOSSNN--22000099//22,, GGuullff OOff MMaannnnaarr,,
TTaammiill NNaadduu
P a g e | 154
SSeepptteemmbbeerr 22001144 | OIL
• Duties & Responsibilities as per statutory requirement (Mines Act-1952, OMR -1984
etc.)
The details of the procedures and method of operations are developed keeping conformity
to the competency of the personnel engaged and complexity of the operations. The method
of presentation of procedures aims at enhancement of understanding of operation being
done and realization of the services of drilling and testing or the working over of wells at all
stages of operation/manufacturing.
77..77..33 MMaannaaggeemmeenntt SSyysstteemm PPrroocceedduurreess aanndd DDooccuummeennttaattiioonn
The project management team documents, implements and maintains procedures for
ensuring requirements for quality, occupational health, safety, and environment in
accordance with the installation and OIL’s stated policies. The following procedure/manuals
have been documented:
• OISD incident reporting form
• Safety procedures in carrying out geophysical operations
• Safety procedures in carrying out “wireless communications”
• Safety procedures in carrying out geophysical operation - “explosives handling, storage
and transportation”
• Safety procedures in carrying out geophysical operation “training activities”
• Safety procedures in carrying out geophysical operation - “disaster management”
• SOP for drilling & workover activities
77..77..44 IImmpplleemmeennttaattiioonn,, OOppeerraattiioonn,, IInnffrraassttrruuccttuurree aanndd WWoorrkk EEnnvviirroonnmmeenntt
The Drilling Services has determined, provided and maintained the infrastructure needed to
achieve conformity to services requirements. Infrastructure includes machineries, man power,
plants, equipments (both hardware and software) for exploratory or work over drilling
operations. OIL also maintains marine and air logistics services, catering services and
communication and information systems for satisfactory performance in offshore Drilling
operation.
Resource, Roles, Responsibility & Authority

EEIIAA RReeppoorrtt FFoorr EExxpplloorraattoorryy DDrriilllliinngg AAccttiivviittiieess IInn NNEELLPP BBlloocckk CCYY--OOSSNN--22000099//22,, GGuullff OOff MMaannnnaarr,,
TTaammiill NNaadduu
P a g e | 155
SSeepptteemmbbeerr 22001144 | OIL
The roles, authorities and responsibilities will be defined, documented and communicated to
all concerned staffs to facilitate effective HSE Management. The Management will be
providing essential resources of manpower, technology and finance required for
establishment, implementation maintenance, improvement and control of QHSE
Management System.
77..77..55 MMaannaaggeemmeenntt ooff OOccccuuppaattiioonnaall HHeeaalltthh && SSaaffeettyy AAssppeeccttss
Drilling operations have been traditionally known to be an unsafe industry with higher
potential for accidents leading to occupational safety issues. However, at present, with the
improvement of drilling technologies and related management practices, the levels of safety
have improved significantly.
OIL places high emphasis on health and safety aspects of workers and staff on drilling rig
and will ensure that all activities will be conducted in a safe and skillful manner with staff
appropriately trained and equipment maintained in safe condition. Safety cases will be
developed for appropriate facilities. Potential health, safety or fire hazards will be removed or
managed, based on risk assessments, safe systems of work, HSE management system
requirements, competency and skills of staff and workers, etc. and would be in line with
requirements specified in the OISD Rules (Chapter VII : Health and Welfare Measures). In
addition OIL would ensure that a trained Medical Officer or Paramedic is available on the rig
during the drilling activity.
Specific management plans that would be implemented are as follows:
Workplace Air Quality: Protective respiratory equipment shall be used by employees who
are working at welding, solvents and other materials present in the workplace.
Work Place Noise: Feasible administrative and engineering controls, including sound-
insulated equipment and control rooms shall be taken to reduce the average noise level in
normal work areas. Plant equipment shall be well maintained to minimize noise levels. PPE
will be provided to the personnel working in the high noise area.
Work in Confined Spaces: Prior to entry and occupancy, all confined spaces (e.g., tanks,
sumps, vessels, sewers, excavations) must be tested for the presence of toxic, flammable and
explosive gases or vapors, and for the lack of oxygen. Adequate ventilation must be provided
before entry and during occupancy of these spaces. Personnel must use air-supplied

EEIIAA RReeppoorrtt FFoorr EExxpplloorraattoorryy DDrriilllliinngg AAccttiivviittiieess IInn NNEELLPP BBlloocckk CCYY--OOSSNN--22000099//22,, GGuullff OOff MMaannnnaarr,,
TTaammiill NNaadduu
P a g e | 156
SSeepptteemmbbeerr 22001144 | OIL
respirators when working in confined spaces, which may become contaminated or deficient
in oxygen during the period of occupancy. Observers/assistants will be stationed outside of
confined spaces to provide emergency assistance, if necessary, to personnel working inside
these areas.
General Health of Workers: Ventilation systems will be provided to control work area
temperatures and humidity. Personnel required to work in areas of high temperature and/or
high humidity will be allowed to take frequent breaks away from these areas. Pre-
employment and periodic medical examinations will be conducted for all personnel, and
specific surveillance programs instituted for personnel potentially exposed to toxic or
radioactive substances.
General Safety of Operations: All installations shall be designed and operated to protect
the health and safety of employees and the community. The following safety procedures and
practices will be implemented in the workplace:
• Shield guards or guard railings shall be installed at all belts, pulleys, gears and other
moving parts;
• Eye protection shall be worn by personnel when in areas where there is a risk of flying
chips or sparks, or where intense light is generated; and
• Protective clothing appropriate to conditions shall be worn in all facility areas and when
walking outside living quarters and meeting rooms on a platform.
• Elevated platforms and walkways, and stairways and ramps shall be equipped with
handrails, toeboards and non-slip surfaces;
• Electrical equipment shall be grounded, well insulated and conform with applicable
codes
Training: Training plans, programs, and practices shall be established and carried out for all
personnel. They will include training on basic safety procedures and on environmental issues,
and job specific safety procedures according to their duties and responsibilities.
77..88 OORRGGAANNIIZZAATTIIOONNAALL SSTTRRUUCCTTUURREE AANNDD IIMMPPLLEEMMEENNTTAATTIIOONN FFRRAAMMEEWWOORRKK
In addition to regular operational roles & responsibilities all personnel responsible for
environment management at the CY-OSN-2009/2 exploratory drilling project will be
responsible for implementing the HSE policy and the environment management plan for the

EEIIAA RReeppoorrtt FFoorr EExxpplloorraattoorryy DDrriilllliinngg AAccttiivviittiieess IInn NNEELLPP BBlloocckk CCYY--OOSSNN--22000099//22,, GGuullff OOff MMaannnnaarr,,
TTaammiill NNaadduu
P a g e | 157
SSeepptteemmbbeerr 22001144 | OIL
project. The entire drilling organization will co-operate with government agencies, regulatory
authorities and other stakeholders who may have environmental concerns associated with
the project. Various key personnel involved in the accident reporting in the organisation and
communication have been shown in a hierarchical manner in the following figure.
Figure 7‐1: Channel For Reporting Work Accidents
OIL would also set up a Safety Committee in the MODU headed by the Well Operations
Manager as stipulated by the OISD Rules. The Safety Committee would meet once a week
and will function with the following mandate:
• Discuss work related health, safety and environmental issues and make suggestions for improvement;
• Undertake safety and housekeeping inspections of the MODU with a view to identify deficiencies and recommend corrective measures;
• Promote development of safety attitude amongst employees.
77..99 CCAAPPIITTAALL AANNDD RREECCUURRRRIINNGG CCOOSSTT FFOORR EENNVVIIRROONNMMEENNTTAALL PPOOLLLLUUTTIIOONN CCOONNTTRROOLL MMEEAASSUURREESS

EEIIAA RReeppoorrtt FFoorr EExxpplloorraattoorryy DDrriilllliinngg AAccttiivviittiieess IInn NNEELLPP BBlloocckk CCYY--OOSSNN--22000099//22,, GGuullff OOff MMaannnnaarr,,
TTaammiill NNaadduu
P a g e | 158
SSeepptteemmbbeerr 22001144 | OIL
OIL has regular procurement plans for various operations related to hiring of drilling rig
services and associated facilities. These also include related to various aspects related to
environmental management measures. Thus procurement related to EMP are inbuilt in the
procurement requirement of OIL for hiring of drilling rig. OIL is also in the process of
procuring offshore Metocean and Site survey for minimizing the risk of harm to personnel
and equipment of drilling unit and third party and to protect the natural environment. The
objective of the site survey is to identify all possible constraints and hazards from man-made,
natural and geological features which may affect operational or environmental integrity of
the proposed drilling locations in the Block and to allow appropriate operational practices to
be put in place to mitigate risks identified.

EEIIAA RReeppoorrtt FFoorr EExxpplloorraattoorryy DDrriilllliinngg AAccttiivviittiieess IInn NNEELLPP BBlloocckk CCYY--OOSSNN--22000099//22,, GGuullff OOff MMaannnnaarr,,
TTaammiill NNaadduu
P a g e | 159
SSeepptteemmbbeerr 22001144 | OIL
88 DDIISSCCLLOOSSUURREE OOFF CCOONNSSUULLTTAANNTTSS EENNGGAAGGEEDD
For carrying out the environmental impact assessment study of the proposed oil exploration
block in Gulf of Mannar, various institutions/agencies have been working in coordination
with each other.
88..11 EEIIAA CCOONNSSUULLTTAANNTT EENNGGAAGGEEDD
SENES India has been operational in India for the last 12 years and has its head office in
Delhi with branch offices in Kolkata, Hyderabad and Mumbai and has all supporting
infrastructure for project implementation including GIS and software development centre in
Kolkata. SENES has worked on the environmental impacts of the project.
SENES has received QCI-NABET accreditation (Certificate No: NABET/EIA/RA016/040)) for
carrying out EIA studies for Category A projects of “Off shore and on shore oil and gas
exploration, development & production”, valid up to March 05, 2017.
88..22 AAGGEENNCCYY EENNGGAAGGEEDD FFOORR MMAARRIINNEE SSAAMMPPLLIINNGG
SENES Consultants, had appointed MoEF recognized laboratory Lotus Granges (India)
Limited, for the collection and the analysis of baseline physico-chemical characteristic of the
sea surface water & sediment samples, collected from the block area. Lotus Granges (India)
Limited is an independent R&D consultancy organization established in 1997 with well
equipped laboratory. Lotus Granges (India) Limited laboratory has MoEF recognition.

EEIIAA RReeppoorrtt FFoorr EExxpplloorraattoorryy DDrriilllliinngg AAccttiivviittiieess IInn NNEELLPP BBlloocckk CCYY--OOSSNN--22000099//22,, GGuullff OOff MMaannnnaarr,,
TTaammiill NNaadduu
P a g e | 160
SSeepptteemmbbeerr 22001144 | OIL
Annexure I: ToR Issued by MoEF For Block CY-OSN-2009/2

EEIIAA RReeppoorrtt FFoorr EExxpplloorraattoorryy DDrriilllliinngg AAccttiivviittiieess IInn NNEELLPP BBlloocckk CCYY--OOSSNN--22000099//22,, GGuullff OOff MMaannnnaarr,,
TTaammiill NNaadduu
P a g e | 161
SSeepptteemmbbeerr 22001144 | OIL

EEIIAA RReeppoorrtt FFoorr EExxpplloorraattoorryy DDrriilllliinngg AAccttiivviittiieess IInn NNEELLPP BBlloocckk CCYY--OOSSNN--22000099//22,, GGuullff OOff MMaannnnaarr,,
TTaammiill NNaadduu
P a g e | 162
SSeepptteemmbbeerr 22001144 | OIL

EEIIAA RReeppoorrtt FFoorr EExxpplloorraattoorryy DDrriilllliinngg AAccttiivviittiieess IInn NNEELLPP BBlloocckk CCYY--OOSSNN--22000099//22,, GGuullff OOff MMaannnnaarr,, TTaammiill NNaadduu
P a g e | 163
SSeepptteemmbbeerr 22001144 | OIL
Annexure II: Proposed Sethusamudram Ship Channel Alignment
Source: Sethusamudram Corporation Ltd.

EEIIAA RReeppoorrtt FFoorr EExxpplloorraattoorryy DDrriilllliinngg AAccttiivviittiieess IInn NNEELLPP BBlloocckk CCYY--OOSSNN--22000099//22,, GGuullff OOff MMaannnnaarr,, TTaammiill NNaadduu
P a g e | 164
SSeepptteemmbbeerr 22001144 | OIL
Annexure III: Demography Details of Coastal Villages as per Census of India, 2011 Sr. No.
Name HHs Total Population
Males Females HH Size
Sex Ratio
% SC % ST
Literacy Rate
Work Participation
Rate
% Cultivators
% Agricultural
Labour
% Household Industries
% Other Workers
Ramanathapuram District
1 Palangulam 359 1270 603 667 4 904 11.34 0.16 61.969 47.32 73.61 10.76 0.17 15.46
2 Thondi (TP) 3859 18465 9316 9149 5 1018 17.61 0 78.711 33.04 9.16 5.46 2.27 83.11
3 Ariyankottai 451 1478 671 807 3 831 13.73 0 59.54 53.25 37.52 50.07 1.38 11.03
4 Perungarai 775 3061 1572 1489 4 1056 18.52 0 66.645 39.3 36.15 28.74 2.55 32.56
5 Kottankulam 188 739 361 378 4 955 42.76 0 59.54 61.03 83.22 11.99 0 4.79
6 Vendoni 1297 5237 2694 2543 4 1059 30.15 1.26 74.623 49.13 24.68 23.22 25.21 26.88
7 Urappuli 1341 5427 2805 2622 4 1070 25.23 0 70.518 59.89 46.63 26.46 14.7 12.21
8 A. Panaiyur 205 926 489 437 5 1119 11.23 0 68.251 61.66 88.83 2.16 3.06 5.95
9 Koraikulam 162 682 341 341 4 1000 74.05 0 64.223 57.04 0 54.55 9.09 36.36
10 Siraikulam 595 2354 1187 1167 4 1017 34.03 0 63.934 48.56 25.7 48.42 1.49 24.39
11 Keelakidaram 950 3807 1873 1934 4 968 13.69 0 63.278 40.9 14.43 48.18 3.84 33.54
12 Iruveli 147 556 287 269 4 1067 0 0 65.108 61.33 63.85 26.69 7.43 2.03
13 S.Tharaikudi 1478 6274 3169 3105 4 1021 30.2 0 72.394 57.4 21.12 47.22 0.94 30.72
14 Kannirajpuram 1168 5086 2593 2493 4 1040 1.51 0 74.381 44.77 0.85 2.71 4.62 91.83
15 Narippaiyur 2130 9861 5010 4851 5 1033 6.13 0.07 74.272 38.04 3.6 3.42 13.11 79.87
16 Kuthiraimozhi 141 591 287 304 4 944 0.34 0 71.066 35.03 25 0 0 75
17 Mookkaiyur 567 2660 1396 1264 5 1104 11.09 0 67.857 46.2 2.55 17.97 1.28 78.19
18 Periakulam 1047 4869 2455 2414 5 1017 0.99 0 65.517 37.4 22.94 3.38 1.41 72.27
19 Mariyur 1253 5097 2510 2587 4 970 9.95 0 66.569 41.38 5.83 5.16 0.82 88.18
20 Thanichiyam 560 2465 1236 1229 4 1006 14.81 0 61.42 44.58 26.36 30.61 1.65 41.37
21 Valinockam 1067 6221 3177 3044 6 1044 0.16 0 66.533 33.26 0.63 1.16 0.8 97.41
22 Ervadi 2853 13366 6689 6677 5 1002 8.07 0 69.55 38.8 10.82 6.46 3.07 79.66
23 Sayalgudi (TP) 3617 14801 7609 7192 4 1058 11.8 0 69.847 39.8 9.58 10.44 3.33 76.65

EEIIAA RReeppoorrtt FFoorr EExxpplloorraattoorryy DDrriilllliinngg AAccttiivviittiieess IInn NNEELLPP BBlloocckk CCYY--OOSSNN--22000099//22,, GGuullff OOff MMaannnnaarr,, TTaammiill NNaadduu
P a g e | 165
SSeepptteemmbbeerr 22001144 | OIL
Sr. No.
Name HHs Total Population
Males Females HH Size
Sex Ratio
% SC % ST
Literacy Rate
Work Participation
Rate
% Cultivators
% Agricultural
Labour
% Household Industries
% Other Workers
24 Devipattinam (Part) 266 1091 518 573 4 904 40.42 0 61.595 61.14 0.61 64.79 1.83 32.77
25 Ekkakudi 600 2629 1360 1269 4 1072 23.2 0 64.663 72.42 3.19 91.85 1.2 3.76
26 Vannankundu 1926 7935 4028 3907 4 1031 2.31 0 63.176 47.65 20.18 35.87 12.5 31.45
27 Raghunathapuram 1895 7743 3962 3781 4 1048 2.38 0 74.545 39.36 28.23 33.96 9.99 27.82
28 Kumbaram 542 2114 1082 1032 4 1048 0 0 69.489 49.76 7.82 62.2 7.7 22.27
29 Rettaiyurani 1502 5909 2966 2943 4 1008 3.37 0 71.095 50.3 38.81 21.29 4.49 35.4
30 Nagachi 847 3678 1853 1825 4 1015 0.71 0 71.425 30.26 5.71 4.42 1.01 88.86
31 Pirappanvalasai 1071 4406 2248 2158 4 1042 0.73 0 71.993 32.32 9.18 26.76 4.84 59.22
32 Sattakkonvalasai 601 2623 1295 1328 4 975 1.94 0 72.093 41.4 2.05 8.43 12.53 76.99
33 Mandapam 1557 7551 3875 3676 5 1054 1.1 0.28 78.996 39.97 2.76 2.64 10.87 83.74
34 Nochiyurani 598 2443 1223 1220 4 1002 2.37 0 78.797 33.52 4.19 16.39 1.27 78.14
35 Pudumadam 1834 8760 4454 4306 5 1034 0.97 0 79.315 31.58 3.8 18.79 0.59 76.82
36 Karan 872 3420 1731 1689 4 1025 0.47 0.06 74.561 41.96 26.53 8.26 5.63 59.57
37 Periapattinam (Part)
357 1550 689 861 4 800 0.06 0 84.903 30.39 12.7 5.41 2.7 79.19
38 Kalimankundu 1519 5708 2834 2874 4 986 1.65 0 64.769 48.23 5.08 6.05 28.83 60.03
39 Tiruppullani 1421 5867 2921 2946 4 992 36.2 0 70.326 40.74 38.84 10.25 5.08 45.83
40 Utrakosamangai 540 2134 1123 1011 4 1111 12.23 0 74.789 53.23 26.74 39.56 0.5 33.2
41 Alangulam 376 1395 705 690 4 1022 62.15 0 64.588 59.14 78.12 17.36 0 4.52
42 Pallamerkkulam 921 3843 1889 1954 4 967 44.18 0 70.44 50.72 3.95 14.47 3.95 77.63
43 Kanjirangudi 1618 7465 3791 3674 5 1032 14.35 0.01 71.386 42.8 11.71 13.21 4.85 70.23
44 Keelakarai 843 3628 2144 1484 4 1445 30.82 0 71.582 31.62 3.42 16.99 0 79.59
45 Mayakulam 1040 5794 3292 2502 6 1316 5.33 0 82.188 30.38 0.49 0.7 5.27 93.54
46 Ramanathapuram (M)
14716 61440 30904 30536 4 1012 4.89 0.8 83.421 33.16 0.59 0.92 1.36 97.13
47 Mandapam (TP) 4296 18427 9299 9128 4 1019 6.16 0.01 76.958 32.41 0.36 0.24 0.97 98.42
48 Keelakarai (M) 7448 38355 19685 18670 5 1054 2.83 0 82.628 31.37 0.26 0.43 1.5 97.81

EEIIAA RReeppoorrtt FFoorr EExxpplloorraattoorryy DDrriilllliinngg AAccttiivviittiieess IInn NNEELLPP BBlloocckk CCYY--OOSSNN--22000099//22,, GGuullff OOff MMaannnnaarr,, TTaammiill NNaadduu
P a g e | 166
SSeepptteemmbbeerr 22001144 | OIL
Sr. No.
Name HHs Total Population
Males Females HH Size
Sex Ratio
% SC % ST
Literacy Rate
Work Participation
Rate
% Cultivators
% Agricultural
Labour
% Household Industries
% Other Workers
49 Devipattinam (CT) 2452 11599 5897 5702 5 1034 12.98 0.08 77.239 30.93 5.91 16.19 2.69 75.21
50 Periapattinam (CT) 1777 9730 5099 4631 5 1101 3.47 0 75.478 23.77 0.82 15.18 1.03 82.97
51 Pamban 8522 37819 19163 18656 4 1027 1.33 0.01 74.841 34.68 1.75 1.06 2.21 94.97
52 Rameswaram (M) 10579 44856 22783 22073 4 1032 6.8 0.03 73.364 37.11 0.45 0.13 0.96 98.46
Tuticorin/Toothukudi district
1 Subbiahpuram 136 474 228 246 3 927 0 0 69.409 67.09 0.64 94.9 0 4.46
2 Muthiahpuram 90 269 130 139 3 935 18.59 0 69.517 58.74 35.03 39.49 0 25.48
3 M.Shanmugapuram 353 1436 714 722 4 989 4.53 0 67.827 46.8 8.32 38.41 1.77 51.5
4 Vembar 1492 6307 3127 3180 4 983 5.45 0 74.187 35.66 1.24 1.96 2.72 94.08 5 Periasamypuram 366 1507 756 751 4 1007 4.98 0 79.761 45.92 0.15 0.3 2.38 97.17
6 E.Velayudhapuram 283 1067 534 533 4 1002 44.89 0 78.632 52.48 2.16 68.9 1.94 27
7 Melmandai 503 1926 976 950 4 1027 47.56 0 59.398 60.07 49.32 32.38 0.55 17.76
8 Sivagnanapuram 436 1509 749 760 3 986 8.08 0 76.408 53.28 16.32 50.09 0.38 33.21
9 Vaippar - I 599 2408 1225 1183 4 1036 35.8 0 66.819 50.75 1.73 4.33 0.5 93.44
10 Vaippar - II 773 3168 1617 1551 4 1043 17.39 0 79.072 41.16 3.1 0.24 0.56 96.11
11 T.Subbiahpuram 162 482 244 238 3 1025 1.87 0 78.216 51.66 1.69 81.78 0 16.53
12 Kulathur (South) 1287 4566 2322 2244 4 1035 12.81 0 75.58 52.72 9.13 18.46 2.44 69.97
13 Kulathur (North) 790 2981 1503 1478 4 1017 46.02 0 66.823 51.19 11.26 28.46 1.22 59.06
14 Kallurani 123 452 235 217 4 1083 36.28 0 74.336 50.44 0.56 5.03 0.56 93.85
15 Veppalodai 841 2892 1432 1460 3 981 24.38 0 67.185 49.62 4.02 29.15 0.8 66.03
16 Terku Kalmedu 350 1320 670 650 4 1031 24.24 0 70.606 52.65 20.04 28.13 5.7 46.14
17 P.Duraiswamipuram 205 703 352 351 3 1003 6.26 0 75.676 55.76 19.64 69.13 1.02 10.2
18 D.Duraiswamipuram 331 1207 623 584 4 1067 39.35 0 63.712 50.62 14.43 54.89 0.83 29.85
19 Pattanamarudur 195 805 406 399 4 1018 32.55 0 63.354 34.29 0 4.55 0.38 95.08
20 Tharuvaikulam 1743 7325 3758 3567 4 1054 20.49 0 67.645 39.52 8.42 6.67 1.9 83.01
21 Keela Arasadi 523 2186 1095 1091 4 1004 27.13 0 75.389 35.18 1.29 0.86 1.73 96.12

EEIIAA RReeppoorrtt FFoorr EExxpplloorraattoorryy DDrriilllliinngg AAccttiivviittiieess IInn NNEELLPP BBlloocckk CCYY--OOSSNN--22000099//22,, GGuullff OOff MMaannnnaarr,, TTaammiill NNaadduu
P a g e | 167
SSeepptteemmbbeerr 22001144 | OIL
Sr. No.
Name HHs Total Population
Males Females HH Size
Sex Ratio
% SC % ST
Literacy Rate
Work Participation
Rate
% Cultivators
% Agricultural
Labour
% Household Industries
% Other Workers
22 Mullakadu (Part) 550 2191 1086 1105 4 983 17.98 0 79.096 40.26 8.52 4.14 1.58 85.77
23 Thoothukkudi (M Corp.)
60714 237830 118298 119532 4 990 7.42 0.1 83.855 35.18 0.14 0.19 1.89 97.77
24 Muttayyapuram (CT)
8338 32494 16823 15671 4 1074 21.95 0.47 77.584 39.71 0.23 2.02 0.98 96.78
25 Srivaikuntam (TP) 4159 15847 7798 8049 4 969 13.9 1.32 78.728 37.13 6.07 19.85 4.94 69.14

EEIIAA RReeppoorrtt FFoorr EExxpplloorraattoorryy DDrriilllliinngg AAccttiivviittiieess IInn NNEELLPP BBlloocckk CCYY--OOSSNN--22000099//22,, GGuullff OOff MMaannnnaarr,,
TTaammiill NNaadduu
P a g e | 168
SSeepptteemmbbeerr 22001144 | OIL
Annexure IV: Districts Wise Fishermen and Key Details Items Ramanathapuram Toothukudi Coastal Region Palk Bay & Gulf of
Mannar
Coastal Length 236.80 km 163.50 km Marine Fishing Villages 180 24 Marine Fishries Co-op. Fishermen Co-op Society Nos. 119 25 Members 69010 30265 Fisherwomen Co-op Society Nos.
103 24
Members 45811 18335 Population Persons 171722 73941 Male 88531 37858 Female 83191 36083 Male to Female Ratio 1000:939 1000:953 Total Families 38744 17705 Decennial Growth Rate(200-2010)
46.57% 6.30%
Annual Average Growth Rate 4.60% 0.63% House Hold Size 4.4 4.1 Communities Forward Class/General 513 0 Backward Class 15204 3384 Most Backward Class 21128 13889 SC 1888 432 ST 2 0 Literacy Level Total Literates 140628 62745 Primary school level 60210 25913 Middle school level 34895 16132 High School Level 26406 12014 Hr. Sec. School level 12133 4938 Degree 5586 2660 Others 1428 1088 % of Literacy 88.29 93.92 Type of Houses (%) Occupying
Thatched 14421 3008 Literoofed 2423 1185 Tiled 10007 5026 Concrete 13429 8032

EEIIAA RReeppoorrtt FFoorr EExxpplloorraattoorryy DDrriilllliinngg AAccttiivviittiieess IInn NNEELLPP BBlloocckk CCYY--OOSSNN--22000099//22,, GGuullff OOff MMaannnnaarr,,
TTaammiill NNaadduu
P a g e | 169
SSeepptteemmbbeerr 22001144 | OIL
Items Ramanathapuram Toothukudi Others 113 15 Fishing gears(in Nos.) Gill net 11623 3004 Shore seine 510 142 Trawl net 1477 251 Long Liners 281 151 Trap 171 19 Cast net 27 1 others 163 824 Fishing Days Single day 20757 16806 2-5 days 1003 266 6-8 days 147 455 above 8 days 44 74 Mode of Marketing Society 63 36 Middleman 1377 942 Retail sale 5700 140 wholesale 4453 156 Street Vendors 528 63 Auction 1465 2450 Basic Amenities Houses with Electricity 34704 16166 Sanitary Facilities Individual 13370 11915 Common 25947 4736 Drinking water Facility Govt. 16825 6544 Bore 873 2004 Open well 6867 139 Common Tank 11900 3435 Others 3417 1900

EEIIAA RReeppoorrtt FFoorr EExxpplloorraattoorryy DDrriilllliinngg AAccttiivviittiieess IInn NNEELLPP BBlloocckk CCYY--OOSSNN--22000099//22,, GGuullff OOff MMaannnnaarr,, TTaammiill NNaadduu
P a g e | 170
SSeepptteemmbbeerr 22001144 | OIL
Annexure V: Details of Fishermen Population for Coastal Villages As Per Tamil Nadu Marine Fisherfolk Census, Department Of Fisheries, 2010 S.
No. Name of the
Villages Children (0-17 years) Adults (18 years &
above) Total Population Total
Families
Family size
Sex Ratio
Income Profile (No. of Individuals)
Upt
o Rs
. 24
,000
Rs.2
4,00
0 to
35
,000
Rs.3
5,00
0 to
50
,000
Rs.5
0,00
0 to
1,
00,0
00
Abo
ve
Rs.1
,00,
000
Tota
l In
divi
dual
Mal
e
Fem
ale
Tota
l
Mal
e
Fem
ale
Tota
l
Mal
e
Fem
ale
Tota
l
Ramanathapuram
1 Thondi (TP) 359 328 687 560 512 1072 919 840 1759 361 4 914 546 7 0 0 0 553
2 Kannirajpuram 354 361 715 744 621 1365 1098 982 2080 446 4 894 615 37 13 0 0 665
3 Narippaiyur (North)
116 80 196 290 250 540 406 330 736 171 4 813 175 78 13 4 0 270
4 Narippaiyur (South)
139 121 260 294 243 537 433 364 797 179 4 841 189 38 4 0 0 231
5 Mookkaiyur 79 106 185 221 189 410 300 295 595 122 4 983 165 28 3 3 0 199
6 Valinockam 715 752 1467 1513 1383 2896 2228 2135 4363 874 5 958 1311 80 16 14 0 1421
7 Ervadi (Chinna) 270 206 476 772 684 1456 1042 890 1932 432 4 854 351 92 3 175 3 624
8 Devipattinam (North)
193 194 387 393 369 762 586 563 1149 256 4 961 151 43 132 56 8 390
9 Devipattinam (South)
432 433 865 883 804 1687 1315 1237 2552 590 4 941 512 71 1 0 0 584
10 Kumbaram 19 24 43 65 52 117 84 76 160 43 3 905 63 0 0 0 0 63
11 Nagachi 40 36 76 112 84 196 152 120 272 56 4 789 82 3 6 4 4 99
12 Pirappanvalasai 153 189 342 497 513 1010 650 702 1352 321 4 1080
382 80 4 2 0 468
13 Sattakkonvalasai 40 55 95 113 109 222 153 164 317 73 4 1072
99 44 7 3 2 155
14 Mandapam 1962 1933 3895 5099 4643 9742 7061 6576 13637 3104 4 931 3574 1019
303 136 18 5050
15 Nochiyurani 140 119 259 317 323 640 457 442 899 207 4 967 166 128 36 2 4 333
16 Pudumadam 139 130 269 384 290 674 523 420 943 234 4 803 605 1 0 0 0 606
17 Karan 14 10 24 49 37 86 63 47 110 25 4 746 62 0 1 0 0 63

EEIIAA RReeppoorrtt FFoorr EExxpplloorraattoorryy DDrriilllliinngg AAccttiivviittiieess IInn NNEELLPP BBlloocckk CCYY--OOSSNN--22000099//22,, GGuullff OOff MMaannnnaarr,, TTaammiill NNaadduu
P a g e | 171
SSeepptteemmbbeerr 22001144 | OIL
S. No.
Name of the Villages
Children (0-17 years) Adults (18 years & above)
Total Population Total Families
Family size
Sex Ratio
Income Profile (No. of Individuals)
Upt
o Rs
. 24
,000
Rs.2
4,00
0 to
35
,000
Rs.3
5,00
0 to
50
,000
Rs.5
0,00
0 to
1,
00,0
00
Abo
ve
Rs.1
,00,
000
Tota
l In
divi
dual
Mal
e
Fem
ale
Tota
l
Mal
e
Fem
ale
Tota
l
Mal
e
Fem
ale
Tota
l
18 Kalimankundu 114 103 217 315 260 575 429 363 792 209 3 846 67 207 3 2 0 279
19 Mayakulam 48 35 83 289 237 526 337 272 609 158 3 807 158 0 0 0 0 158
20 Pamban 808 773 1578 1852 1782 3634 2657 2555 5212 1121 4 962 1968 44 24 26 51 2123
21 Rameswaram (M) 1384 1312 2696 3406 3297 6703 4790 4609 9399 2113 4 962 2357 628 182 50 37 3254
22 Thoppuvalasai(Uchipuli)
24 32 56 67 60 127 91 92 183 46 3 1011
78 3 2 0 0 83
23 Erumeni(Irudi) 157 156 313 413 444 857 570 600 1170 260 4 1053
345 28 7 0 0 380
24 Kalangium Nagar 229 249 478 496 447 943 725 696 1421 339 4 960 341 59 14 5 2 421
25 Thangachimadam
316 281 597 727 722 1449 1043 1003 2046 465 4 962 522 56 35 17 7 637
26 Aryangundu 342 337 679 865 818 1683 1207 1155 2362 513 4 957 513 220 323 25 5 1086
27 Erakadu 769 712 1481 1452 1509 2961 2221 2221 4442 967 4 1000
1175 52 4 0 0 1231
28 Sambai (Rameswaram Tk )
298 289 587 662 669 1331 960 958 1918 445 4 998 72 7 0 2 0 81
29 Sudukattanpatti 225 217 442 612 559 1171 837 776 1613 378 4 927 560 23 4 3 1 691
30 Natarajapuram 171 184 355 411 372 783 582 556 1138 264 4 955 726 10 0 0 0 736
31 Mugundhirayarchatram
24 33 57 44 38 82 68 71 139 28 4 1044
67 2 0 0 0 69
32 Dhanushkodi 60 81 141 142 151 293 202 232 434 97 4 1149
211 4 0 0 0 215
33 Maraikayarpattinam
134 111 245 301 260 561 435 371 806 195 4 853 207 40 13 2 0 262
34 Vedhalai 447 436 883 858 770 1628 1305 1206 2511 532 4 924 707 36 8 3 0 754
35 Salaivalasai 68 71 139 120 103 223 188 174 362 83 4 926 218 16 3 0 0 237

EEIIAA RReeppoorrtt FFoorr EExxpplloorraattoorryy DDrriilllliinngg AAccttiivviittiieess IInn NNEELLPP BBlloocckk CCYY--OOSSNN--22000099//22,, GGuullff OOff MMaannnnaarr,, TTaammiill NNaadduu
P a g e | 172
SSeepptteemmbbeerr 22001144 | OIL
S. No.
Name of the Villages
Children (0-17 years) Adults (18 years & above)
Total Population Total Families
Family size
Sex Ratio
Income Profile (No. of Individuals)
Upt
o Rs
. 24
,000
Rs.2
4,00
0 to
35
,000
Rs.3
5,00
0 to
50
,000
Rs.5
0,00
0 to
1,
00,0
00
Abo
ve
Rs.1
,00,
000
Tota
l In
divi
dual
Mal
e
Fem
ale
Tota
l
Mal
e
Fem
ale
Tota
l
Mal
e
Fem
ale
Tota
l
36 Naraiyurani 131 118 249 398 368 766 529 486 1015 271 3 919 250 85 80 25 2 450
37 Mutharaiyar Nagar
77 66 143 188 186 374 265 252 517 122 4 951 96 0 0 0 0 96
38 Indhira Nagar 34 29 63 126 122 248 160 151 311 78 4 944 166 6 0 0 0 172
39 Thinaikulam 19 16 35 49 39 88 68 55 123 28 4 809 30 1 0 0 0 31
40 Kalkadu 13 9 22 35 30 65 48 39 87 27 3 813 4 30 0 0 0 34
41 Chinna Ervadi 270 206 476 772 684 1456 1042 890 1932 432 4 854 351 92 3 175 3 624
42 Melamunthal 65 61 126 185 165 350 250 226 476 113 4 904 105 31 3 0 0 139
43 T.Mariyur 250 264 514 580 561 1141 830 825 1655 378 4 994 388 5 2 3 0 398
44 Oppilan 44 39 83 124 85 209 168 124 292 72 4 738 8 64 0 0 0 72
45 Periyanayakipuram
100 94 194 185 150 335 285 244 529 102 5 856 229 11 0 2 0 242
46 Rochmanagar 168 144 312 332 297 626 500 441 941 205 4 882 340 16 8 3 1 368
47 Keezhamunthal 337 417 754 614 703 1317 951 1120 2071 427 4 1178
265 165 48 9 2 489
Toothukudi
1 Vembar 373 383 756 687 639 1326 1060 1022 2082 467 4 964 701 10 7 2 0 720
2 Periasamypuram 194 183 377 396 344 740 590 527 1117 280 3 893 350 17 1 1 0 369
3 Pattanamarudur 173 151 324 272 248 520 445 399 844 194 4 897 205 3 1 0 0 209
4 Tharuvaikulam 1302 1152 2454 2299 1960 4259 3601 3112 6713 1646 4 864 1851 131 22 5 0 2009

EEIIAA RReeppoorrtt FFoorr EExxpplloorraattoorryy DDrriilllliinngg AAccttiivviittiieess IInn NNEELLPP BBlloocckk CCYY--OOSSNN--22000099//22,, GGuullff OOff MMaannnnaarr,, TTaammiill NNaadduu
P a g e | 173
SSeepptteemmbbeerr 22001144 | OIL
S. No.
Name of the Villages
Children (0-17 years) Adults (18 years & above)
Total Population Total Families
Family size
Sex Ratio
Income Profile (No. of Individuals)
Upt
o Rs
. 24
,000
Rs.2
4,00
0 to
35
,000
Rs.3
5,00
0 to
50
,000
Rs.5
0,00
0 to
1,
00,0
00
Abo
ve
Rs.1
,00,
000
Tota
l In
divi
dual
Mal
e
Fem
ale
Tota
l
Mal
e
Fem
ale
Tota
l
Mal
e
Fem
ale
Tota
l
5 Keezhavaipar 361 355 716 721 680 1401 1082 1035 2117 546 3 957 792 9 5 6 0 812
6 Sippikulam 104 90 194 209 208 417 313 298 611 157 3 952 204 0 0 0 1 205
7 Thoothukkudi North
3804 3870 7674 7012 8738 13750 10816 10608 21424 5121 4 981 6029 308 304 75 37 6753
8 Thoothukkudi South
1365 1314 2679 2897 2868 5765 4262 4182 8444 2177 3 981 3643 292 79 27 4 4045