Influence of lead dioxide electrodes morphology on kinetics and current efficiency of oxygen-ozone...
9
Chemical Papers 64 (6) 749–757 (2010) DOI: 10.2478/s11696-010-0062-2 ORIGINAL PAPER Influence of lead dioxide electrodes morphology on kinetics and current efficiency of oxygen–ozone evolution reactions a Élen C. G. Rufino*, a Mario H. P. Santana, a Luiz A. De Faria, b Leonardo M. Da Silva a Laboratory of Electrochemistry, Institute of Chemistry – UFU, Campus Santa Mônica, Av. Jo˜ ao Naves de Ávila 2160, 38400-902 Uberlˆ andia, MG, Brazil b Laboratory of Environmental Electrochemistry, Department of Chemistry – UFVJM, Rua da Glória 187, 39100-000 Diamantina, MG, Brazil Received 7 March 2010; Revised 23 June 2010; Accepted 29 June 2010 Influence of electrode morphology on electrochemical properties of lead dioxide electrodes (β- PbO2) for oxygen–ozone evolution reactions in acid medium was investigated using scanning elec- tronic microscopy (SEM), cyclic voltammetry (CV), polarization curves (PC), and determination of the current efficiency (Φ). Experimental findings revealed that application of high electrodeposition current densities furnishes more rough β-PbO2 films. Surface characteristics were verified by SEM images and the analysis of interfacial pseudo-capacitances and morphology factor (ϕ). Kinetic study of the overall electrode process (O2 +O3) based on the analysis of the Tafel slope revealed that the electrode morphology and electrolyte composition considerably affect the electrode kinetics. In most cases, the existence of two Tafel slopes distributed in the low and high overpotential domains was observed. Abnormal Tafel slopes (b = 120 mV) obtained for the primary water discharge step dur- ing water electrolysis were interpreted considering the apparent charge transfer coefficient (αapa). Optimum conditions for the ozone production were obtained for the less rough β-PbO2 electrode immersed in a sulfuric acid solution (1.0 mol dm −3 ) containing KPF6 (30 × 10 −3 mol dm −3 ), where the current efficiency of 15 mass % for the ozone production was obtained. c 2010 Institute of Chemistry, Slovak Academy of Sciences Keywords: lead dioxide electrode, interfacial capacitance, morphology factor, ozone production, electrode kinetics Introduction Ozone is the most powerful disinfectant avail- able capable of oxidizing several different organic pollutants (Da Silva et al., 2009). Depending on the dissolved oxygen concentration and pH, the ozone redox potential vs. SHE can be very high (1.51 V to 2.07 V) (Pourbaix, 1974). In addi- tion, the ozonation process under optimized condi- tions (e.g., [O 3(aq) ], contact time, temperature, etc.), alone or combined with hydrogen peroxide (perox- one) and/or UV-light, comprises advanced oxidation technologies for water treatment since the forma- tion of trihalomethanes is avoided (Da Silva et al., 2009). Because ozone is a highly reactive gas under or- dinary conditions, it has to be generated “in-situ” (Foller, 1982; Da Silva et al., 2003). In most cases, ozone generation is carried out by means of the dielec- tric barrier discharge (also called corona process) (Da Silva et al., 2009). However, there is another commer- cially available technology for ozone generation based on electrochemistry (water electrolysis: 3H 2 O → O 3 + 6H + + 6e − ) (Da Silva et al., 2010). Interest in the electrochemical ozone production, EOP, has increased in the last three decades as a con- *Corresponding author, e-mail: [email protected]
-
Upload
independent -
Category
Documents
-
view
0 -
download
0
Transcript of Influence of lead dioxide electrodes morphology on kinetics and current efficiency of oxygen-ozone...
Chemical Papers 64 (6) 749–757 (2010)DOI: 10.2478/s11696-010-0062-2
ORIGINAL PAPER
Influence of lead dioxide electrodes morphology on kinetics andcurrent efficiency of oxygen–ozone evolution reactions
aÉlen C. G. Rufino*, aMario H. P. Santana, aLuiz A. De Faria,bLeonardo M. Da Silva
aLaboratory of Electrochemistry, Institute of Chemistry – UFU, Campus Santa Mônica,
Av. Joao Naves de Ávila 2160, 38400-902 Uberlandia, MG, Brazil
bLaboratory of Environmental Electrochemistry, Department of Chemistry – UFVJM,
Rua da Glória 187, 39100-000 Diamantina, MG, Brazil
Received 7 March 2010; Revised 23 June 2010; Accepted 29 June 2010
Influence of electrode morphology on electrochemical properties of lead dioxide electrodes (β-PbO2) for oxygen–ozone evolution reactions in acid medium was investigated using scanning elec-tronic microscopy (SEM), cyclic voltammetry (CV), polarization curves (PC), and determination ofthe current efficiency (Φ). Experimental findings revealed that application of high electrodepositioncurrent densities furnishes more rough β-PbO2 films. Surface characteristics were verified by SEMimages and the analysis of interfacial pseudo-capacitances and morphology factor (ϕ). Kinetic studyof the overall electrode process (O2 + O3) based on the analysis of the Tafel slope revealed that theelectrode morphology and electrolyte composition considerably affect the electrode kinetics. In mostcases, the existence of two Tafel slopes distributed in the low and high overpotential domains wasobserved. Abnormal Tafel slopes (b = 120 mV) obtained for the primary water discharge step dur-ing water electrolysis were interpreted considering the apparent charge transfer coefficient (αapa).Optimum conditions for the ozone production were obtained for the less rough β-PbO2 electrodeimmersed in a sulfuric acid solution (1.0 mol dm−3) containing KPF6 (30 × 10−3 mol dm−3), wherethe current efficiency of 15 mass % for the ozone production was obtained.c© 2010 Institute of Chemistry, Slovak Academy of Sciences
Keywords: lead dioxide electrode, interfacial capacitance, morphology factor, ozone production,electrode kinetics
Introduction
Ozone is the most powerful disinfectant avail-able capable of oxidizing several different organicpollutants (Da Silva et al., 2009). Depending onthe dissolved oxygen concentration and pH, theozone redox potential vs. SHE can be very high(1.51 V to 2.07 V) (Pourbaix, 1974). In addi-tion, the ozonation process under optimized condi-tions (e.g., [O3(aq)], contact time, temperature, etc.),alone or combined with hydrogen peroxide (perox-one) and/or UV-light, comprises advanced oxidationtechnologies for water treatment since the forma-
tion of trihalomethanes is avoided (Da Silva et al.,2009).Because ozone is a highly reactive gas under or-
dinary conditions, it has to be generated “in-situ”(Foller, 1982; Da Silva et al., 2003). In most cases,ozone generation is carried out by means of the dielec-tric barrier discharge (also called corona process) (DaSilva et al., 2009). However, there is another commer-cially available technology for ozone generation basedon electrochemistry (water electrolysis: 3H2O → O3+ 6H+ + 6e−) (Da Silva et al., 2010).Interest in the electrochemical ozone production,
EOP, has increased in the last three decades as a con-
*Corresponding author, e-mail: [email protected]

750 É. C. G. Rufino et al./Chemical Papers 64 (6) 749–757 (2010)
sequence of great advances in the research fields ofnew materials science and electrochemical engineer-ing (Da Silva et al., 2009, 2010). The main advantagepresented by EOP is the high concentration achievedin the gaseous phase (O2 + O3), which can range fromapproximately 4.0 mass % up to 35 mass % (Foller &Tobias, 1982; Kotz & Stucki, 1987; Da Silva et al.,2003). On the contrary, most corona devices generateonly about 0.5–6.0 mass % of ozone (Da Silva et al.,2009).In contrast to the corona technology where a two-
step gas phase reaction generating ozone takes place,the EOP process is rather complex from the kineticpoint of view. In addition, EOP can be only conductedusing certain inert electrode materials (e.g., lead diox-ide, glassy carbon, platinum, boron doped diamond,etc.). These electrode materials are the best choice forthe ozone generation and can be classified as inert dueto their strong resistance to corrosion under stronganodic polarization conditions (Foller & Tobias, 1982;Foller & Kelsall, 1993; Arihara et al., 2007).Fundamentals of the influence of the electrolyte
composition on the EOP process were reported pre-viously by Da Silva et al. (2001c, 2003, 2004) for inertand active electrodes. Depending on the ionic conduc-tor used, EOP can be classified into two categories: (i)type-I, where an inert electrode material is immersedin specially designed liquid electrolytes, and (ii) type-II, where a membrane electrode assembly (MEA) com-prising the use of a solid polymer electrolyte (SPE)and gas diffusion or fine mesh electrodes is responsi-ble for electrolysis of the electrolyte-free water underzero-gap conditions (Da Silva et al., 2010).Despite several literature reports concerning the
EOP process using the lead dioxide electrode (β-PbO2) (Foller & Tobias, 1982; Wabner & Grambow,1985; Kotz & Stucki, 1987; Babak et al., 1994) it canbe easily verified that studies concerning the influenceof electrode morphology on the kinetics and currentefficiency are rather scarce (Da Silva et al., 2001c).The present work reports on the influence of the
surface morphology of β-PbO2 on its electrochemicalproperties for an EOP process carried out in sulfuricacid solutions in the absence and in the presence offluoride-containing additives.
Experimental
β-PbO2 electrodes were prepared by electrodepo-sition at constant current from a Pb(NO3)2 acid so-lution onto both faces of a steel micro-sphere blastedTi-support (10 mm × 5 mm × 0.12 mm) previouslyetched in boiling oxalic acid (10 mass %) for 5 minand platinized. Electrodeposition of Pt started from asolution containing 2.0 × 10⁻³ mol dm−3 H2PtCl6 +26 × 10−6 mol dm−3 Pb(CH3CO2)2 · 3H2O, at 24C,using the constant current density of 30 mA cm−2 for5 min. β-PbO2 was then electrodeposited onto both
Electrode with bothsides exposed to
solution
Sealed withsilicon glue Glass tube
Copper wireTitanium support
Fig. 1. Final configuration of the working electrode.
sides of the platinized Ti-support from a solution con-taining 0.2 mol dm−3 Pb(NO3)2 + 0.01 mol dm−3
HNO3, at 60C, applying different constant currentdensities (10 mA cm−2 and 20 mA cm−2) and usingdifferent electrodeposition times (20 min and 60 min).Four electrodes (Ti/Pt/β-PbO2) were prepared
as a function of the electrodeposition conditions:Electrode-I (10 mA cm−2 and 20 min); Electrode-II(20 mA cm−2 and 20 min); Electrode-III (10 mA cm−2
and 60 min), and Electrode-IV (20 mA cm−2 and 60min).Fig. 1 shows a scheme describing the final configu-
ration of the working electrode where the active layeris lead dioxide (β-PbO2).Experiments were carried out in triplicate for each
type of electrode to verify reproducibility of the ex-perimental data. Sigma–Aldrich (Brazil) “purum p.a.”products were used throughout the experiments.A three-compartment all-glass electrochemical cell
(0.2 dm3) was used throughout the experiments. Toavoid contact between the anodic (oxygen and ozone)and cathodic (hydrogen) gaseous products, a coarseglass frit separator was introduced separating the an-odic and the cathodic compartments. Ohmic dropwas minimized using a Luggin capillary approachingthe working electrode from below while two heavilyplatinized platinum counter electrodes ensured uni-formity of the current on the two opposite faces ofthe working electrode. Electrode potentials were readagainst the reversible hydrogen electrode (RHE). TheH2-gas required to complete RHE was generated “in-situ” before its use. RHE containing the electrolyteinvestigated was immersed in the electrolyte investi-gated and was separated from the main body of thecell using a coarse glass frit.Surface morphology of the β-PbO2 films was ex-
amined as a function of the electrodeposition condi-tions by scanning electronic microscopy (SEM) usinga model Leo 94A equipment from Carl Zeiss (Brazil).Six consecutive voltammetric curves (E vs. j) were
recorded at the scan rate, ν, of 20 mV s−1 coveringthe 1.2–2.1 V (vs. RHE) pseudo-capacitive potentialinterval. Morphology factor, ϕ, and the different inter-facial capacitances were determined following the pro-cedure described previously (Da Silva et al., 2001b),where twenty consecutive voltammetric curves were

É. C. G. Rufino et al./Chemical Papers 64 (6) 749–757 (2010) 751
recorded covering the 1.65–1.75 V (vs. RHE) potentialinterval in order to minimize the influence of pseudo-capacitance. The total (internal + external), CT, andexternal, CE, interfacial capacitances were obtainedfrom slopes of the straight lines in the jc vs. ν pro-files observed in the low and high ν-domains, respec-tively. Internal capacitance,CI, accounting for the “in-ner surface” regions of the coatings and the intensivesurface parameter denoted as the morphology factorwere calculated using relations: CI = CT − CE and ϕ= CI/CT, respectively (Da Silva et al., 2001b). Theseexperiments were carried out at the temperature of(25 ± 0.5)C.Using the potentiostatic mode, forwards and back-
wards polarization curves (E vs. j ) were recordedtwice cyclically sweeping the electrode potential un-der quasi-stationary conditions (0.1 mV s−1) and cov-ering the potential interval of 1.65 V to 2.35 V (vs.RHE), which corresponds to an apparent current den-sity interval of about 0.1 mA cm−2 to 100 mA cm−2.Experimental data extracted from the backward scanof the second consecutive polarization curve were usedin the kinetic study. These experiments were also car-ried out at the temperature of (25 ± 0.5)C.N2 stream was used to transport O3 from the
cell (anodic compartment) to the spectrophotometermodel D4800 (HACH, Sovereign, Brazil). Ozone con-centration in this stream was measured under station-ary conditions. Current efficiency for EOP, ΦEOP, wascalculated using the following equation (Da Silva etal., 2003):
ΦEOP (mass %) =AbGzF
εlIT100% (1)
where Ab denotes the absorbance at 254 nm (ε = 3024cm−1 mol−1 dm3), G the volumetric gas flow rate (N2+ O2 + O3) (dm3 s−1), z the number of electrons(= 6), l the optical path length (10 cm), IT the to-tal applied current (A), and F the Faraday’s constant(96485 C mol−1).According to Eq. (1), derived according to the
Faraday’s law, the next relation is valid: 1.66 × 10⁻⁴mass % = 1.0 ppm of O3 (Foller, 1982). EOP currentefficiencies were measured at (2.0 ± 0.5)C.Temperature of the electrolyte was controlled us-
ing a model FC55A01 FTS cooling system fromCole-Parmer (DpUNION Ltda, Brazil). A model PG-STAT20 electrochemical system (GPES) from AU-TOLAB (Eco Chemie, The Netherlands) was usedthroughout the experiments.Kinetic studies were carried out using sulfuric acid
solutions as the base electrolyte, denoted as BE1 (=1.0 mol dm−3) and BE2 (= 3.0 mol dm−3), in theabsence and in the presence of fluoride-containing ad-ditives (KPF6 or NaF: 30 × 10−3 mol dm−3). Six dif-ferent electrolyte solutions were used. All electrolytesolutions were prepared volumetrically using twice dis-
Fig. 2. SEM images obtained for β-PbO2 films as a functionof the electrodeposition conditions: (A) Electrode-I; (B)Electrode-II; (C) Electrode-III, and (D) Electrode-IV.
tilled water with a final pass through a Millipore Milli-Q apparatus. Fluka (Sigma–Aldrich, Brazil) “purum”products were used throughout the experiments.
Results and discussion
SEM analysis
Fig. 2 shows SEM images obtained for β-PbO2coatings electroformed using different electrodeposi-tion conditions. Inspection of these images revealedthat the electrode morphology depends on electrode-position conditions. Comparative analysis of these im-ages revealed that Electrodes-I and II are mainly char-
752 É. C. G. Rufino et al./Chemical Papers 64 (6) 749–757 (2010)
1.1 1.2 1.3 1.4 1.5 1.6 1.7 1.8 1.9 2.0 2.1 2.2
-60
-40
-20
0
20
40
60
Pb(IV)/Pb(II)
Eo
EOP = 1.54 V
j / (
mA
cm
-2)
E/V
OER
Eo
OER = 1.23 V
Pb(II)/Pb(IV)
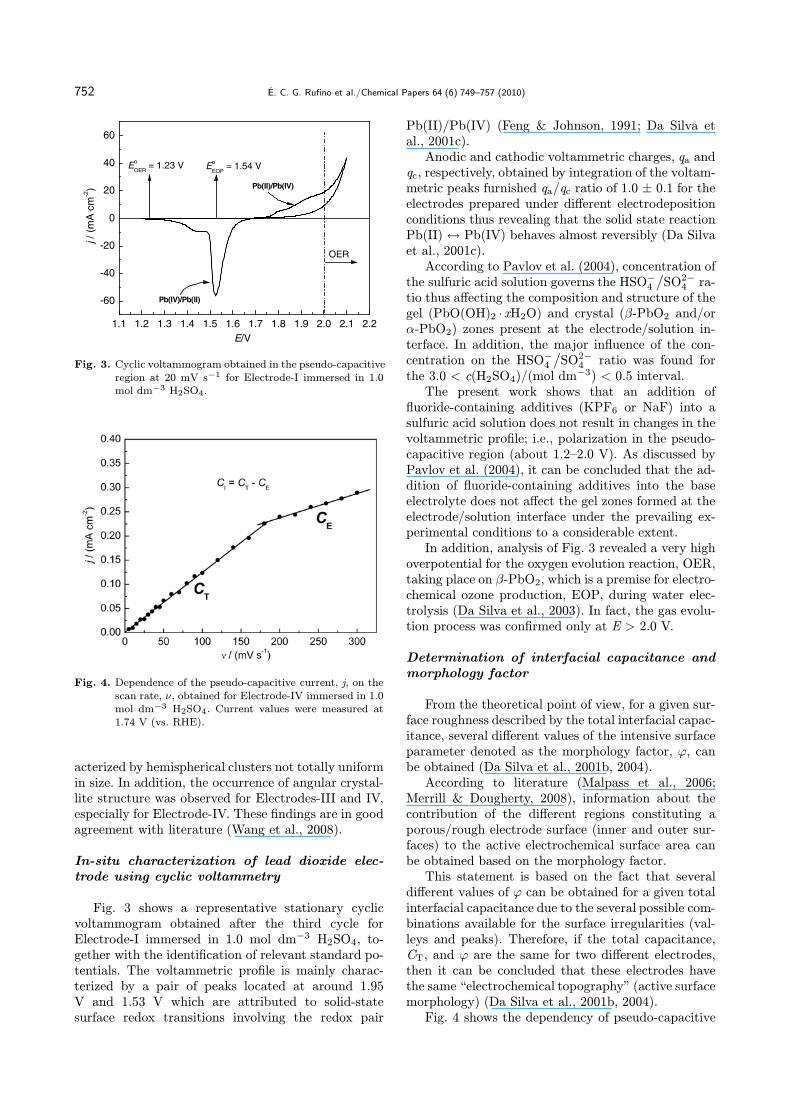
Fig. 3. Cyclic voltammogram obtained in the pseudo-capacitiveregion at 20 mV s−1 for Electrode-I immersed in 1.0mol dm−3 H2SO4.
Fig. 4. Dependence of the pseudo-capacitive current, j, on thescan rate, ν, obtained for Electrode-IV immersed in 1.0mol dm−3 H2SO4. Current values were measured at1.74 V (vs. RHE).
acterized by hemispherical clusters not totally uniformin size. In addition, the occurrence of angular crystal-lite structure was observed for Electrodes-III and IV,especially for Electrode-IV. These findings are in goodagreement with literature (Wang et al., 2008).
In-situ characterization of lead dioxide elec-trode using cyclic voltammetry
Fig. 3 shows a representative stationary cyclicvoltammogram obtained after the third cycle forElectrode-I immersed in 1.0 mol dm−3 H2SO4, to-gether with the identification of relevant standard po-tentials. The voltammetric profile is mainly charac-terized by a pair of peaks located at around 1.95V and 1.53 V which are attributed to solid-statesurface redox transitions involving the redox pair
Pb(II)/Pb(IV) (Feng & Johnson, 1991; Da Silva etal., 2001c).Anodic and cathodic voltammetric charges, qa and
qc, respectively, obtained by integration of the voltam-metric peaks furnished qa/qc ratio of 1.0 ± 0.1 for theelectrodes prepared under different electrodepositionconditions thus revealing that the solid state reactionPb(II) ↔ Pb(IV) behaves almost reversibly (Da Silvaet al., 2001c).According to Pavlov et al. (2004), concentration of
the sulfuric acid solution governs the HSO−4
/SO2−4 ra-
tio thus affecting the composition and structure of thegel (PbO(OH)2 · xH2O) and crystal (β-PbO2 and/orα-PbO2) zones present at the electrode/solution in-terface. In addition, the major influence of the con-centration on the HSO−
4
/SO2−4 ratio was found for
the 3.0 < c(H2SO4)/(mol dm−3) < 0.5 interval.The present work shows that an addition of
fluoride-containing additives (KPF6 or NaF) into asulfuric acid solution does not result in changes in thevoltammetric profile; i.e., polarization in the pseudo-capacitive region (about 1.2–2.0 V). As discussed byPavlov et al. (2004), it can be concluded that the ad-dition of fluoride-containing additives into the baseelectrolyte does not affect the gel zones formed at theelectrode/solution interface under the prevailing ex-perimental conditions to a considerable extent.In addition, analysis of Fig. 3 revealed a very high
overpotential for the oxygen evolution reaction, OER,taking place on β-PbO2, which is a premise for electro-chemical ozone production, EOP, during water elec-trolysis (Da Silva et al., 2003). In fact, the gas evolu-tion process was confirmed only at E > 2.0 V.
Determination of interfacial capacitance andmorphology factor
From the theoretical point of view, for a given sur-face roughness described by the total interfacial capac-itance, several different values of the intensive surfaceparameter denoted as the morphology factor, ϕ, canbe obtained (Da Silva et al., 2001b, 2004).According to literature (Malpass et al., 2006;
Merrill & Dougherty, 2008), information about thecontribution of the different regions constituting aporous/rough electrode surface (inner and outer sur-faces) to the active electrochemical surface area canbe obtained based on the morphology factor.This statement is based on the fact that several
different values of ϕ can be obtained for a given totalinterfacial capacitance due to the several possible com-binations available for the surface irregularities (val-leys and peaks). Therefore, if the total capacitance,CT, and ϕ are the same for two different electrodes,then it can be concluded that these electrodes havethe same “electrochemical topography” (active surfacemorphology) (Da Silva et al., 2001b, 2004).Fig. 4 shows the dependency of pseudo-capacitive
É. C. G. Rufino et al./Chemical Papers 64 (6) 749–757 (2010) 753
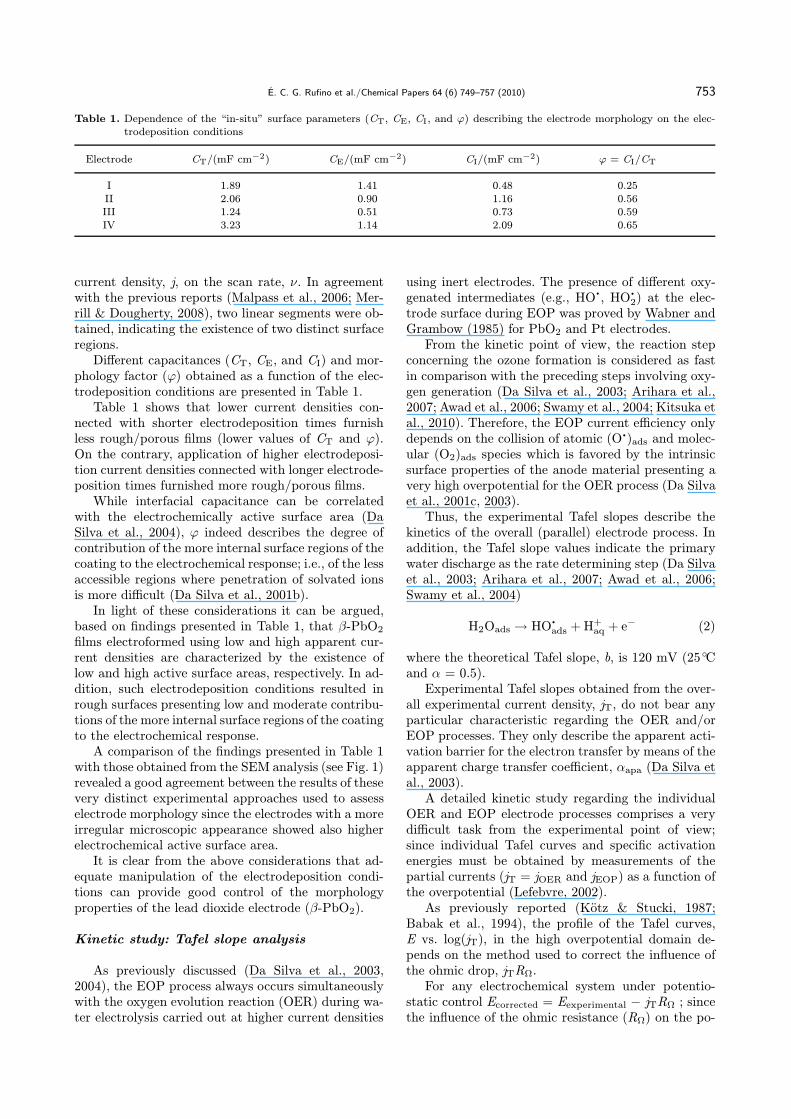
Table 1. Dependence of the “in-situ” surface parameters (CT, CE, CI, and ϕ) describing the electrode morphology on the elec-trodeposition conditions
Electrode CT/(mF cm−2) CE/(mF cm−2) CI/(mF cm−2) ϕ = CI/CT
I 1.89 1.41 0.48 0.25II 2.06 0.90 1.16 0.56III 1.24 0.51 0.73 0.59IV 3.23 1.14 2.09 0.65
current density, j, on the scan rate, ν. In agreementwith the previous reports (Malpass et al., 2006; Mer-rill & Dougherty, 2008), two linear segments were ob-tained, indicating the existence of two distinct surfaceregions.Different capacitances (CT, CE, and CI) and mor-
phology factor (ϕ) obtained as a function of the elec-trodeposition conditions are presented in Table 1.Table 1 shows that lower current densities con-
nected with shorter electrodeposition times furnishless rough/porous films (lower values of CT and ϕ).On the contrary, application of higher electrodeposi-tion current densities connected with longer electrode-position times furnished more rough/porous films.While interfacial capacitance can be correlated
with the electrochemically active surface area (DaSilva et al., 2004), ϕ indeed describes the degree ofcontribution of the more internal surface regions of thecoating to the electrochemical response; i.e., of the lessaccessible regions where penetration of solvated ionsis more difficult (Da Silva et al., 2001b).In light of these considerations it can be argued,
based on findings presented in Table 1, that β-PbO2films electroformed using low and high apparent cur-rent densities are characterized by the existence oflow and high active surface areas, respectively. In ad-dition, such electrodeposition conditions resulted inrough surfaces presenting low and moderate contribu-tions of the more internal surface regions of the coatingto the electrochemical response.A comparison of the findings presented in Table 1
with those obtained from the SEM analysis (see Fig. 1)revealed a good agreement between the results of thesevery distinct experimental approaches used to assesselectrode morphology since the electrodes with a moreirregular microscopic appearance showed also higherelectrochemical active surface area.It is clear from the above considerations that ad-
equate manipulation of the electrodeposition condi-tions can provide good control of the morphologyproperties of the lead dioxide electrode (β-PbO2).
Kinetic study: Tafel slope analysis
As previously discussed (Da Silva et al., 2003,2004), the EOP process always occurs simultaneouslywith the oxygen evolution reaction (OER) during wa-ter electrolysis carried out at higher current densities
using inert electrodes. The presence of different oxy-genated intermediates (e.g., HO., HO.2) at the elec-trode surface during EOP was proved by Wabner andGrambow (1985) for PbO2 and Pt electrodes.From the kinetic point of view, the reaction step
concerning the ozone formation is considered as fastin comparison with the preceding steps involving oxy-gen generation (Da Silva et al., 2003; Arihara et al.,2007; Awad et al., 2006; Swamy et al., 2004; Kitsuka etal., 2010). Therefore, the EOP current efficiency onlydepends on the collision of atomic (O.)ads and molec-ular (O2)ads species which is favored by the intrinsicsurface properties of the anode material presenting avery high overpotential for the OER process (Da Silvaet al., 2001c, 2003).Thus, the experimental Tafel slopes describe the
kinetics of the overall (parallel) electrode process. Inaddition, the Tafel slope values indicate the primarywater discharge as the rate determining step (Da Silvaet al., 2003; Arihara et al., 2007; Awad et al., 2006;Swamy et al., 2004)
H2Oads → HO.ads +H+aq + e− (2)
where the theoretical Tafel slope, b, is 120 mV (25Cand α = 0.5).Experimental Tafel slopes obtained from the over-
all experimental current density, jT, do not bear anyparticular characteristic regarding the OER and/orEOP processes. They only describe the apparent acti-vation barrier for the electron transfer by means of theapparent charge transfer coefficient, αapa (Da Silva etal., 2003).A detailed kinetic study regarding the individual
OER and EOP electrode processes comprises a verydifficult task from the experimental point of view;since individual Tafel curves and specific activationenergies must be obtained by measurements of thepartial currents (jT = jOER and jEOP) as a function ofthe overpotential (Lefebvre, 2002).As previously reported (Kotz & Stucki, 1987;
Babak et al., 1994), the profile of the Tafel curves,E vs. log(jT), in the high overpotential domain de-pends on the method used to correct the influence ofthe ohmic drop, jTRΩ.For any electrochemical system under potentio-
static control Ecorrected = Eexperimental − jTRΩ ; sincethe influence of the ohmic resistance (RΩ) on the po-

754 É. C. G. Rufino et al./Chemical Papers 64 (6) 749–757 (2010)
larization curve (Tafel plot) is caused by the intrinsicinfluence of the electrolyte resistance between the tipof the Luggin capillary and the surface of the workingelectrode (Da Silva et al., 2001a; Franco et al., 2006).This unavoidable resistance must be always cor-
rected using appropriate methods available in litera-ture for the calculation of the true Tafel coefficient(Shub & Reznik, 1985; Kotz & Stucki, 1987; Babak etal., 1994). In the present case, the ohmic drop correc-tion was carried out based on the graphical methodoriginally proposed by Shub and Reznik (1985). Thechoice of this method was due to its sound physicalbase concerning the conductive metallic oxides (e.g.,β-PbO2) electrodes.As previously reported (Da Silva et al., 2001a,
2003), the profile of Tafel curves corrected using thegraphical method is very similar to those obtained us-ing the current interruption technique (Kotz & Stucki,1987).Fig. 5 shows Tafel curves recorded under quasi-
stationary polarization conditions and already cor-rected for ohmic drop. In all cases, RΩ values (= RΩ+ Rfilm) were obtained in the 0.12–0.26 Ω cm2 in-terval. These experimental findings are in excellentagreement with the good conductance presented byβ-PbO2 (σ = 1.0 × 10⁴ S cm−1) immersed in strongacid solutions (Pohl & Ricket, 1981).Tafel profiles obtained after the ohmic drop correc-
tion were characterized mainly by the existence of twolinear segments distributed in the low and high over-potential domains. In addition, a considerable depen-dence of the Tafel slopes on the electrode morphologyand electrolyte composition was found.Tafel slopes obtained for the OER/EOP processes
as a function of the electrode morphology and elec-trolyte composition are presented in Tables 2 and 3.Analysis of Tables 2 and 3 revealed that Tafel slopesdepend on the concentration of sulfuric acid in BEthrough the HSO−
4
/SO2−4 relative concentration, on
the presence of fluoride-containing additives (NaF orKPF6), and on the electrode morphology. Generally,Tafel slopes obtained in the low overpotential domain,b1, tend to increase upon the increase of the surfaceroughness (see CT and ϕ values in Table 1).A profound analysis concerning the influence of the
electrolyte composition on the electrode kinetics of
Fig. 5. Tafel curves after the ohmic drop correction obtainedfor overall OER/EOP processes. (A) Electrode-I and(B) Electrode-II. Electrolyte: 1.0 mol dm−3 H2SO4.ν = 0.1 mV s−2. T = (25 ± 0.5)C.
the OER/EOP process was previously reported (DaSilva et al., 2001c, 2003). The main focus of the fol-lowing discussion is therefore the influence of the elec-trode morphology on the electrode kinetics and, con-sequently, on the ozone production process.On the contrary, Tafel slopes obtained in the high
overpotential domain, b2, do not show a correlationwith the variables discussed above. The complex be-havior presented by b2 can be attributed to the influ-ence of the anion adsorption and/or the non-uniformdistribution of the electric field on αapa mainly causedby the surface roughness. The influence of these effectson αapa is mainly significant under strong polarizationconditions (Da Silva et al., 2003; Filoche & Sapoval,2000).The non-ideal behavior exhibited by solid elec-
trodes in the charge transfer process and the ambigu-
Table 2. Tafel slopes obtained for OER/EOP in BE1 (1.0 mol dm−3 H2SO4) in the absence and in the presence of fluoride-containing additives (30 × 10−3 mol dm−3) as a function of the electrode morphology
BE1 BE1 + KPF6 BE1 + NaFElectrode
b1/mV b2/mV b1/mV b2/mV b1/mV b2/mV
I 124 – 162 86 165 80II 209 101 274 115 262 126III 183 90 199 103 197 107IV 277 125 314 111 322 102

É. C. G. Rufino et al./Chemical Papers 64 (6) 749–757 (2010) 755
Table 3. Tafel slopes obtained for OER/EOP in BE2 (3.0 mol dm−3 H2SO4) in the absence and in the presence of fluoride-containing additives (30 × 10−3 mol dm−3) as a function of the electrode morphology
BE2 BE2 + KPF6 BE2 + NaFElectrode
b1/mV b2/mV b1/mV b2/mV b1/mV b2/mV
I 115 – 150 – 148 81II 166 98 198 93 177 87III 147 88 170 88 166 85IV 167 119 254 102 213 99
ous interpretation of the charge transfer coefficientin literature were previously revised (Ruetschi, 1959;Conway et al., 1970; Brenet & Traore, 1971; Lefebvre,2002).As previously discussed (Da Silva et al., 2003,
2004; Franco et al., 2006), the apparent “abnormalvalues” obtained for the Tafel slope in the case ofrough/porous electrodes can be interpreted in basedon the apparent charge transfer coefficient, αapa.Despite the absolute values obtained for the Tafel
slope (see Tables 2 and 3), which in most cases differfrom 120 mV (25C and α = 0.5), experimental find-ings indicate the primary water discharge to be therate determining step for the overall electrode pro-cess comprising simultaneous formation of O2 and O3(Da Silva et al., 2003; Awad et al., 2006; Merrill &Dougherty, 2008).Therefore, considering the conditions of high field
approximation (η > 0.1 V) and low surface coverageby the reaction intermediates, the following expressionfor the kinetic current was obtained (Bockris et al.,2000)
jT = 4F Ak exp (αapaF η/RT ) (3)
where A is the active electrochemical surface area, η(= E − E) is the overpotential, k is the kinetic con-stant, αapa is the apparent charge transfer coefficientfor the first charge transfer (primary water discharge),R is the universal gas constant, and T the tempera-ture.According to Eq. (3), the rate of the electrode pro-
cess (OER+EOP) expressed by the overall apparentcurrent density, jT, does not depend on pH (Bockriset al., 2000). In addition, for a given absolute temper-ature, the Tafel slope, b = ∂E/∂log(jT), is an inversefunction of αapa, since b = RT/αapaFE for the primarywater discharge.From the discussion presented above it can be con-
cluded that discrepancies between the experimental(see Tables 2 and 3) and theoretical (120 mV) Tafelslopes presented by αapa = 0.5 are mainly caused bythe influence of the strong anion adsorption, fluctu-ations of the interfacial dielectric constant, and thenon-uniform distribution of the electric field inducedby surface roughness (Da Silva et al. 2003; Franco et
al., 2006; Filoche & Sapoval, 2000).The present findings clearly show that the surface
roughness considerably affects the apparent chargetransfer coefficient obtained for the OER/EOP pro-cess. A profound analysis concerning this non-classicalbehavior was presented by Filoche and Sapoval (2000).
Current efficiency for electrochemical ozoneproduction
The current efficiency for EOP, ΦEOP, dependson true current density, temperature, and electrodeand electrolyte compositions (Da Silva et al., 2003).Several literature reports show that the electrochemi-cal activities of β-PbO2 and glassy carbon electrodesfor the EOP process are considerably influenced bythe electrolyte composition and temperature (Foller &Tobias, 1982; Kotz & Stucki, 1987; Foller & Kelsall,1993).For instance, a very high current efficiency of up
to 40 mass % was obtained for the EOP process usingglassy carbon anodes, low temperatures, and concen-trated HBF4 solutions (Foller & Kelsall, 1993). The-oretical analysis concerning the influence of the elec-trolyte composition on ΦEOP for inert and active elec-trodes was presented by Da Silva et al. (2001c, 2003,2004) taking into account the stability and concentra-tion of the reaction intermediates.As a rule of thumb, the anodic overpotential must
be increased far beyond the oxygen evolution reaction(E 1.23 V) in order to permit ozone evolution (seeFig. 3). Thus it has been found that increasing currentdensity up to about 0.5–1.5 A cm−2, using moderatetemperatures (about 10–30C), is one of the most ob-vious means for ozone generation.Commonly, plots of ΦEOP vs. jT have been used to
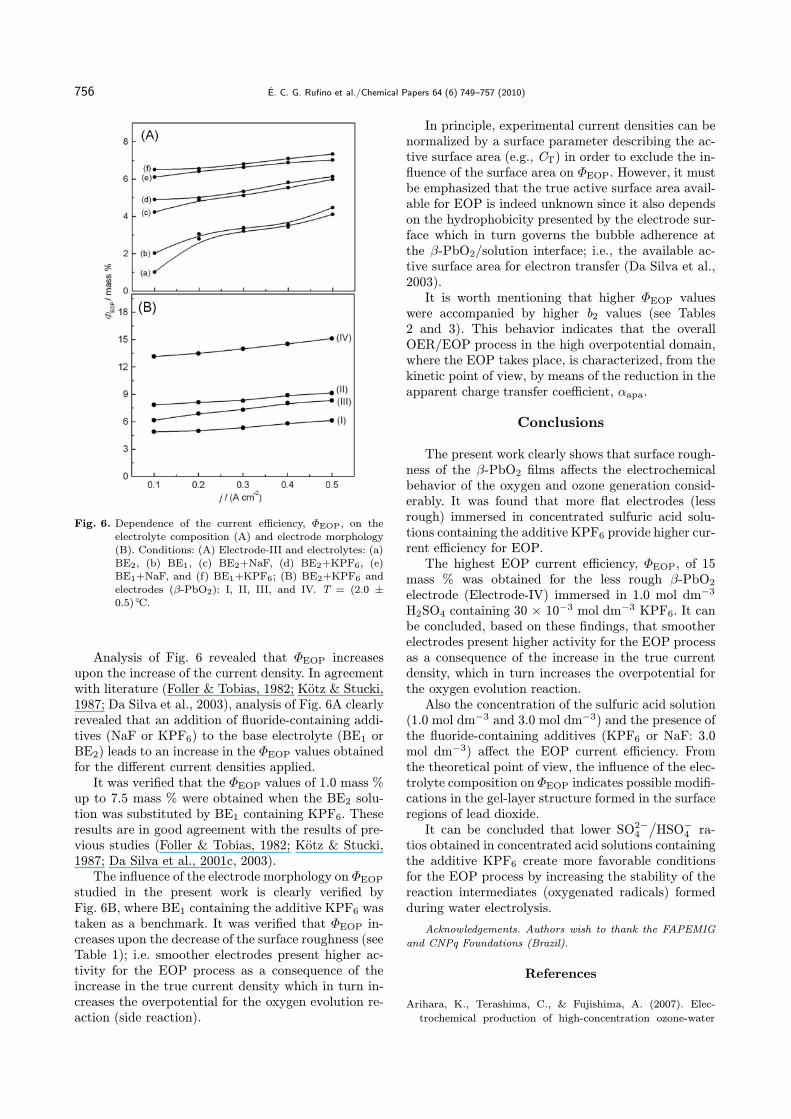
characterize the EOP process as a function of the op-erational variables. It can be seen in the present workthat different ΦEOP values ranging from 1 mass % upto 15 mass % were obtained for the different electrolytecompositions and electrode morphologies considered.Fig. 6A shows the influence of the electrolyte com-
position on ΦEOP for a given electrode morphology(Electrode-III), while the influence of the β-PbO2morphology on ΦEOP for the electrolyte BE2+KPF6is presented in Fig. 6B.
756 É. C. G. Rufino et al./Chemical Papers 64 (6) 749–757 (2010)
Fig. 6. Dependence of the current efficiency, ΦEOP, on theelectrolyte composition (A) and electrode morphology(B). Conditions: (A) Electrode-III and electrolytes: (a)BE2, (b) BE1, (c) BE2+NaF, (d) BE2+KPF6, (e)BE1+NaF, and (f) BE1+KPF6; (B) BE2+KPF6 andelectrodes (β-PbO2): I, II, III, and IV. T = (2.0 ±0.5)C.
Analysis of Fig. 6 revealed that ΦEOP increasesupon the increase of the current density. In agreementwith literature (Foller & Tobias, 1982; Kotz & Stucki,1987; Da Silva et al., 2003), analysis of Fig. 6A clearlyrevealed that an addition of fluoride-containing addi-tives (NaF or KPF6) to the base electrolyte (BE1 orBE2) leads to an increase in the ΦEOP values obtainedfor the different current densities applied.It was verified that the ΦEOP values of 1.0 mass %
up to 7.5 mass % were obtained when the BE2 solu-tion was substituted by BE1 containing KPF6. Theseresults are in good agreement with the results of pre-vious studies (Foller & Tobias, 1982; Kotz & Stucki,1987; Da Silva et al., 2001c, 2003).The influence of the electrode morphology on ΦEOP
studied in the present work is clearly verified byFig. 6B, where BE1 containing the additive KPF6 wastaken as a benchmark. It was verified that ΦEOP in-creases upon the decrease of the surface roughness (seeTable 1); i.e. smoother electrodes present higher ac-tivity for the EOP process as a consequence of theincrease in the true current density which in turn in-creases the overpotential for the oxygen evolution re-action (side reaction).
In principle, experimental current densities can benormalized by a surface parameter describing the ac-tive surface area (e.g., CT) in order to exclude the in-fluence of the surface area on ΦEOP. However, it mustbe emphasized that the true active surface area avail-able for EOP is indeed unknown since it also dependson the hydrophobicity presented by the electrode sur-face which in turn governs the bubble adherence atthe β-PbO2/solution interface; i.e., the available ac-tive surface area for electron transfer (Da Silva et al.,2003).It is worth mentioning that higher ΦEOP values
were accompanied by higher b2 values (see Tables2 and 3). This behavior indicates that the overallOER/EOP process in the high overpotential domain,where the EOP takes place, is characterized, from thekinetic point of view, by means of the reduction in theapparent charge transfer coefficient, αapa.
Conclusions
The present work clearly shows that surface rough-ness of the β-PbO2 films affects the electrochemicalbehavior of the oxygen and ozone generation consid-erably. It was found that more flat electrodes (lessrough) immersed in concentrated sulfuric acid solu-tions containing the additive KPF6 provide higher cur-rent efficiency for EOP.The highest EOP current efficiency, ΦEOP, of 15
mass % was obtained for the less rough β-PbO2electrode (Electrode-IV) immersed in 1.0 mol dm−3
H2SO4 containing 30 × 10−3 mol dm−3 KPF6. It canbe concluded, based on these findings, that smootherelectrodes present higher activity for the EOP processas a consequence of the increase in the true currentdensity, which in turn increases the overpotential forthe oxygen evolution reaction.Also the concentration of the sulfuric acid solution
(1.0 mol dm−3 and 3.0 mol dm−3) and the presence ofthe fluoride-containing additives (KPF6 or NaF: 3.0mol dm−3) affect the EOP current efficiency. Fromthe theoretical point of view, the influence of the elec-trolyte composition on ΦEOP indicates possible modifi-cations in the gel-layer structure formed in the surfaceregions of lead dioxide.It can be concluded that lower SO2−4
/HSO−
4 ra-tios obtained in concentrated acid solutions containingthe additive KPF6 create more favorable conditionsfor the EOP process by increasing the stability of thereaction intermediates (oxygenated radicals) formedduring water electrolysis.
Acknowledgements. Authors wish to thank the FAPEMIGand CNPq Foundations (Brazil).
References
Arihara, K., Terashima, C., & Fujishima, A. (2007). Elec-trochemical production of high-concentration ozone-water

É. C. G. Rufino et al./Chemical Papers 64 (6) 749–757 (2010) 757
using freestanding perforated diamond electrodes. Jour-nal of The Electrochemical Society, 154, E71–E75. DOI:10.1149/1.2509385.
Awad, M. I., Sata, S., Kaneda, K., Ikematsu, M., Okajima, T.,& Ohsaka, T. (2006). Ozone electrogeneration at a high cur-rent efficiency using a tantalum oxide–platinum compositeelectrode. Electrochemistry Communications, 8, 1263–1269.DOI: 10.1016/j.elecom.2006.06.008.
Babak, A. A., Amadelli, R., De Battisti, A., & Fateev, V.N. (1994). Influence of anions on oxygen/ozone evolutionon PbO2/spe and PbO2/Ti electrodes in neutral pH me-dia. Electrochimica Acta, 39, 1597–1602. DOI: 10.1016/0013-4686(94)85141-7.
Bockris, J. O’M., Reddy, A., & Gamboa-Aldeco, M. (2000).Modern electrochemistry (2nd ed., Vol. 2). New York, NY,USA: Plenum Publishers.
Brenet, J., & Traore, K. (1971). Transfer coefficients in elec-trochemical kinetics. London, UK: Academic Press.
Conway, B. E., MacKinnon, D. J., & Tilak, B. V. (1970). Sig-nificance of electrochemical Brønsted factors. Kinetic studiesover a wide range of temperatures. Transactions of the Fara-day Society, 66, 1203–1226. DOI: 10.1039/TF9706601203.
Da Silva, L. M., Boodts, J. F. C., & De Faria, L. A. (2001a).Oxygen evolution at RuO2(x) + Co3O4(1–x) electrodes fromacid solution. Electrochimica Acta, 46, 1369–1375. DOI:10.1016/S0013-4686(00)00716-7.
Da Silva, L. M., De Faria, L. A., & Boodts, J. F. C.(2001b). Determination of the morphology factor of oxide lay-ers. Electrochimica Acta, 47, 395–403. DOI: 10.1016/S0013-4686(01)00738-1.
Da Silva, L. M., De Faria, L. A., & Boodts, J. F. C. (2001c).Green processes for environmental application. Electrochemi-cal ozone production. Pure and Applied Chemistry, 73, 1871–1884. DOI: 10.1351/pac200173121871.
Da Silva, L. M., De Faria, L. A., & Boodts, J. F. C. (2003).Electrochemical ozone production: influence of the support-ing electrolyte on kinetics and current efficiency. Electrochim-ica Acta, 48, 699–709. DOI: 10.1016/S0013-4686(02)00739-9.
Da Silva, L. M., Franco, D. V., De Faria, L. A., & Boodts, J.F. C. (2004). Surface, kinetics and electrocatalytic propertiesof Ti/(IrO2 + Ta2O5) electrodes, prepared using controlledcooling rate, for ozone production. Electrochimica Acta, 49,3977–3988. DOI: 10.1016/j.electacta.2003.11.039.
Da Silva, L. M., Franco, D. V., Goncalves, I. C., & Sousa, L.G. (2009). Advanced technologies based on ozonation for wa-ter treatment. In N. Gertsen & L. Sønderby (Eds.), Waterpurification (pp. 1–53). New York, NY, USA: Nova SciencePublishers.
Da Silva, L. M., Franco, D. V., Sousa, L. G., & Goncalves,I. C. (2010). Characterization of an electrochemical reactorfor the ozone production in electrolyte-free water. Journal ofApplied Electrochemistry, 40, 855–864. DOI: 10.1007/s10800-009-0069-y.
Feng, J., & Johnson, D. C. (1991). Electrocatalysis of anodicoxygen-transfer reactions: Titanium substrates for pure anddoped lead dioxide films. Journal of The Electrochemical So-ciety, 138, 3328–3337. DOI: 10.1149/1.2085410.
Filoche, M., & Sapoval, B. (2000). Shape-dependency of currentthrough non-linear irregular electrodes. Electrochimica Acta,46, 213–220. DOI: 10.1016/S0013-4686(00)00575-2.
Foller, P. C. (1982). Status of research on ozone generation byelectrolysis. In R. G. Rice & A. N. Netzer (Eds.), Handbookof ozone technology and applications (Vol. 1, pp. 85–104).Ann Arbor, MI: Ann Arbor Science.
Foller, P. C. & Kelsall, G. H. (1993). Ozone generation via theelectrolysis of fluoboric acid using glassy carbon anodes andair depolarized cathodes. Journal of Applied Electrochem-istry, 23, 996–1010. DOI: 10.1007/BF00266121.
Foller, P. C., & Tobias, C. W. (1982). The anodic evolution ofozone. Journal of The Electrochemical Society, 129, 506–515.DOI: 10.1149/1.2123890.
Franco, D. V., Da Silva, L. M., Jardim, W. F., & Boodts, J.F. C. (2006). Influence of the electrolyte composition on thekinetics of the oxygen evolution reaction and ozone produc-tion processes. Journal of the Brazilian Chemical Society,17, 746–757. DOI: 10.1590/S0103-50532006000400017.
Kitsuka, K., Kaneda, K., Ikematsu, M., Iseki, M., Mushiake,K., & Ohsaka, T. (2010). n-Type TiO2 thin films for electro-chemical ozone production. Journal of The ElectrochemicalSociety, 157, F30–F34. DOI: 10.1149/1.3265469.
Kotz, E. R., & Stucki, S. (1987). Ozone and oxygen evolution onPbO2 electrodes in acid solution. Journal of ElectroanalyticalChemistry, 228, 407–415. DOI: 10.1016/0022-0728(87)80120-1.
Lefebvre, M. C. (2002). Establishing the link between multistepelectrochemical reaction mechanisms and experimental Tafelslopes. In B. E. Conway, J. O’M. Bockris, & R. E. White(Eds.), Modern aspects of electrochemistry (Vol. 32). NewYork, NY, USA: Kluwer.
Malpass, G. R. P., Neves, R. S., & Motheo, A. J. (2006).A comparative study of commercial and laboratory-madeTi/Ru0.3Ti0.7O2 DSA electrodes: “In situ” and “ex situ”surface characterisation and organic oxidation activity. Elec-trochimica Acta, 52, 936–944. DOI: 10.1016/j.electacta.2006.06.032.
Merrill, M. D., & Dougherty, R. C. (2008). Metal oxide cata-lysts for the evolution of O2 from H2O. Journal of PhysicalChemistry C, 112, 3655–3666. DOI: 10.1021/jp710675m.
Pavlov, D., Kirchev, A., Stoycheva, M., & Monahov, B. (2004).Influence of H2SO4 concentration on the mechanism ofthe processes and on the electrochemical activity of thePb/PbO2/PbSO4 electrode. Journal of Power Sources, 137,288–308. DOI: 10.1016/j.jpowsour.2004.06.006.
Pohl, J. P., & Ricket, H. (1981). Electrochemistry of lead diox-ide. In S. Trasatti (Ed.), Electrodes of conductive metallicoxides (Part A, pp. 183–220). Amsterdam, The Netherlands:Elsevier.
Pourbaix, M. (1974). Atlas of electrochemical equilibria in aque-ous solutions (p. 541). Houston, TX, USA: National Associ-ation of Corrosion Engineers.
Ruetschi, P. (1959). Overvoltage and catalysis. Journal ofThe Electrochemical Society, 106, 819–827. DOI: 10.1149/1.2427504.
Shub, D. M., & Reznik, M. F. (1985). Method for the evaluationof the ohmic errors and the correction of polarization curvesof metal-oxide anodes. Soviet Electrochemistry, 21, 795–800.
Swamy, B. E. K., Maye, J., Vannoy, C., & Schell, M. (2004).Improvements in the efficiency of the oxidation of formic acidobtained by increasing the overall anion adsorption strength.Journal of Physical Chemistry B, 108, 16488–16494. DOI:10.1021/jp048472d.
Wabner, D., & Grambow, C. (1985). Reactive intermediatesduring oxidation of water on lead dioxide and platinum elec-trodes. Journal of Electroanalytical Chemistry, 195, 95–108.DOI: 10.1016/0022-0728(85)80008-5.
Wang, J., Li, X., Guo, L., & Luo, X. (2008). Effect of surfacemorphology of lead dioxide particles on their ozone generat-ing performance. Applied Surface Science, 254, 6666–6670.DOI: 10.1016/j.apsusc.2008.04.052.