
Investigation of UV optical fibers under synchrotron irradiation
Upload
independentCategory
view
0download
0
arX
iv:c
ond-
mat
/050
9519
v1 [
cond
-mat
.mtr
l-sc
i] 2
0 Se
p 20
05
To be published in “Carbon-based magnetism: An overview of themagnetism of metal free carbon-based compounds and materials”, edited by
T. Makarova and F. Palacio (Elsevier 2005)
Induced Magnetic Order by Ion Irradiation of
Carbon-Based Structures
P. Esquinazi, R. Hohne, K.-H. Han, 1 D. Spemann, A. Setzer,M. Diaconu, H. Schmidt, and T. Butz
Institute for Experimental Physics II, University of Leipzig, Linnestrasse 5, 04103
Leipzig, Germany
Key words: Graphite, Magnetic properties, Irradiation effects, Disordered carbon,Fullerene
1 Motivation
Irradiation effects in graphite were one major research area in the past, par-tially due to its application as a moderator in thermal nuclear reactors. Graphiteis still a material of choice for nuclear applications due to its low cross-sectionfor neutron absorption. The influence of irradiation damage produced by dif-ferent kinds of ions on several properties of graphite was reviewed by Kelly(1981) in chapter 7 of his book. Recently, irradiation effects in carbon nanos-tructures were reviewed by Banhart (1999). The effect of neutron irradiation
Email address: [email protected] (P. Esquinazi).1 Present address: Department of Physics, Umea University, Umea, S-90735 Swe-den.
Preprint submitted to Elsevier Science 30 December 2013
on the magnetic properties of graphite has been studied in the past and showsthe expected results, i.e. the introduction of lattice defects by irradiation pro-duces a decrease in the diamagnetism and an increase in the spin density(Kelly, 1981). We are not aware of any study made in the past on the effectsof proton irradiation on the magnetic properties of graphite or carbon-basedstructures.
When we started this research work on irradiation effects on the magnetismof graphite we had two reasons to choose protons as energetic particle. Thefirst one is related to the analysis method called PIXE (Particle Induced X-rayEmission) that uses protons to get a map for all relevant impurity elementswithin a sample depth of 30 µm for a proton energy of ∼ 2 MeV in carbon (seeSect. 2.2 for details). A systematic and full characterization of the magneticimpurity content in each of the samples, and after each treatment or handling(it makes no sense to start with a highly pure sample and then cut it with asteel knife afterwards), is of primary importance and absolutely necessary.
The second reason was based on early reports on room-temperature ferromag-netic behavior in some carbon-based structures (see references in Makarova(2003)). From those early works our attention was focused to the magneticproperties found in amorphous-like carbon prepared from different hydrogen-rich starting materials where an increase of the saturation magnetization withthe hydrogen concentration in the starting material was found (Murata, Ushijima, Ueda, and Kawaguchi1991, 1992). The origin for the magnetic ordering has been related to the mix-ture of carbon atoms with sp2 and sp3 bonds, which was predicted to reacha magnetization higher than in pure Fe (Ovchinnikov and Shamovsky, 1991).Hydrogen, on the other hand, was assumed to have a role only in the formationof the amorphous carbon structure (Murata, Ushijima, Ueda, and Kawaguchi,1992). New theoretical predictions, however, show that hydrogenated graphitecan display spontaneous magnetization coming from different numbers of mono-and dihydrogenated carbon atoms (Kusakabe and Maruyama, 2003). Sponta-neous magnetization may also appear in the case of monohydrogenated zigzagedges (Fujita, Wakabayashi, Nakada, and Kusakabe, 1996) if the distance be-tween them is large or if they are not in parallel.
The advantage of proton irradiation is twofold: it enables us to make an impu-rity analysis simultaneously to the implantation of hydrogen. In this chapterwe will review the main effects obtained after proton irradiation in differ-ent carbon-based structures. This chapter is organized as follows. In the nextsection we provide the main characteristics of our irradiation facility. In sec-tion 2.2 we show an example of element analysis obtained in one of the graphitesamples used for the irradiation studies. The irradiation effects are reviewedin section 3. This section is divided in two main subsections that describe theeffects in oriented graphite and carbon-based thin films. In section 4 we discusssome of the effects observed after annealing the sample at high temperatures
2
in vacuum or after leaving it at room temperature for a long period of time.
In this chapter we concentrate ourselves mainly on the effects produced byproton irradiation in highly oriented pyrolitic graphite (HOPG). Effects ofirradiation with alpha particles will be discussed shortly in section 3.1.3. Ironand fluor irradiation effects on HOPG and on diamond are currently underway and the results will be published elsewhere in the future.
2 Irradiation Characteristics
All the irradiations presented in this chapter were done with the high-energynanoprobe LIPSION of the University of Leipzig. The accelerator is a singleended 3 MV SINGLETRONTM with an RF-ion source for protons and alphaparticles. The focusing system can deliver proton beams with diameters as lowas 40 nm at very low currents of the order of 0.1 fA. For the present irradiationswe worked at 2.25 MeV and currents up to 500 pA in the case of proton beamof diameter of 1 − 2 µm (microbeam). We have also irradiated samples witha broad beam of 0.8 mm diameter, energy of 2 MeV and currents between∼ 50 and ∼ 150 nA. The X-ray detector is an Ortec HPGe IGLET-X andsubtends 187 msrad solid angle. The numerical simulations discussed in thissection are based on the code SRIM2003 (Ziegler, 1977-1985). The sampleswere mostly attached to a Si substrate using a small amount of Varnish ora mixture of Varnish with ultra-pure graphite powder. In one case we fixedthe sample on a messing plate with a hole to enable the free penetration ofthe energetic particles (H+ and He+). The magnetic moment of the substrateswas always measured before attaching the sample. All the irradiations weredone at nominally room temperature; the temperature of the sample was notcontrolled during irradiation.
2.1 The interaction of MeV-protons with graphite
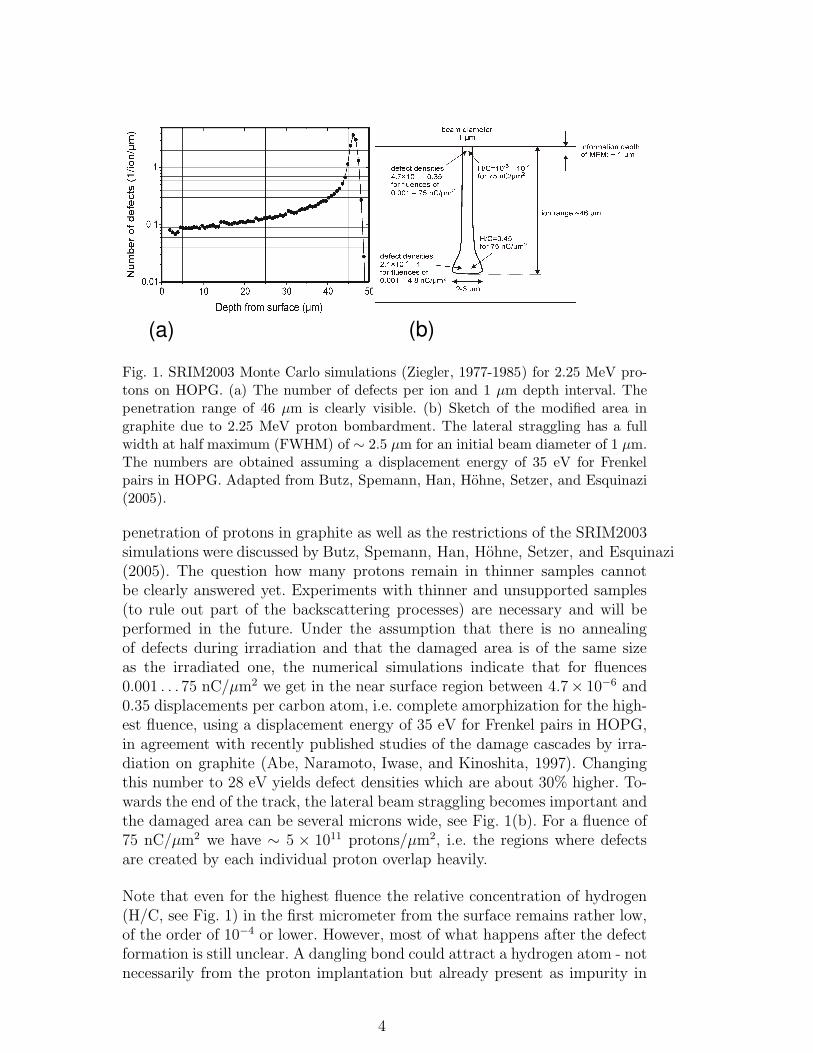
Figure 1(a) shows a typical profile for the number of defects created in a carbonmatrix per 2.25 MeV-proton and per 1 µm interval. The penetration range ofabout 46 µm is clearly visible. For samples thicker than this range one expectsthat the majority of the protons will be stopped, whereas for samples substan-tially thinner essentially all protons traverse the sample. This means that for20 µm or thinner samples the implantation of protons should be undetectable.Strikingly, enhancement of ferromagnetism has also been observed in disor-dered carbon (Hohne, Esquinazi, Han, Spemann, Setzer, Schaufuß, Riede, Butz, Streubel, and Hesse,2004) and fullerene films deposited on Si substrates after proton irradiation(see section 3.2). Further details on the different processes that influence the
3
(b)(a)
Fig. 1. SRIM2003 Monte Carlo simulations (Ziegler, 1977-1985) for 2.25 MeV pro-tons on HOPG. (a) The number of defects per ion and 1 µm depth interval. Thepenetration range of 46 µm is clearly visible. (b) Sketch of the modified area ingraphite due to 2.25 MeV proton bombardment. The lateral straggling has a fullwidth at half maximum (FWHM) of ∼ 2.5 µm for an initial beam diameter of 1 µm.The numbers are obtained assuming a displacement energy of 35 eV for Frenkelpairs in HOPG. Adapted from Butz, Spemann, Han, Hohne, Setzer, and Esquinazi(2005).
penetration of protons in graphite as well as the restrictions of the SRIM2003simulations were discussed by Butz, Spemann, Han, Hohne, Setzer, and Esquinazi(2005). The question how many protons remain in thinner samples cannotbe clearly answered yet. Experiments with thinner and unsupported samples(to rule out part of the backscattering processes) are necessary and will beperformed in the future. Under the assumption that there is no annealingof defects during irradiation and that the damaged area is of the same sizeas the irradiated one, the numerical simulations indicate that for fluences0.001 . . . 75 nC/µm2 we get in the near surface region between 4.7× 10⁻⁶ and0.35 displacements per carbon atom, i.e. complete amorphization for the high-est fluence, using a displacement energy of 35 eV for Frenkel pairs in HOPG,in agreement with recently published studies of the damage cascades by irra-diation on graphite (Abe, Naramoto, Iwase, and Kinoshita, 1997). Changingthis number to 28 eV yields defect densities which are about 30% higher. To-wards the end of the track, the lateral beam straggling becomes important andthe damaged area can be several microns wide, see Fig. 1(b). For a fluence of75 nC/µm2 we have ∼ 5 × 10¹¹ protons/µm2, i.e. the regions where defectsare created by each individual proton overlap heavily.
Note that even for the highest fluence the relative concentration of hydrogen(H/C, see Fig. 1) in the first micrometer from the surface remains rather low,of the order of 10−4 or lower. However, most of what happens after the defectformation is still unclear. A dangling bond could attract a hydrogen atom - notnecessarily from the proton implantation but already present as impurity in
4

the sample. Interestingly enough, there is little information on residual hydro-gen from pyrolysis of hydrocarbons, possibly because detection methods forhydrogen contents of the order of 100 ppm or below were not readily availableand such quantities were of little relevance for applications as moderators in re-actors. Hydrogen atoms in the van der Waals gap or within the graphite layersshould be highly mobile, contrary to hydrogen atoms trapped at defects. In-vestigations with deuterium done by Siegele, Roth, Scherzer, and Pennycook(1993) indicate that deuterium does not readily diffuse out of HOPG but israther chemically bound up to D/C ratios of about 0.45, probably at latticedefects. The maximum retention of deuterium depends on the temperatureand implantation energy. A broad range of binding energies for hydrogen ingraphite up to about 4 eV was reported by Atsumi (2002), i.e. even tempera-tures as high as 3000-3500 K may be not sufficient to eliminate all incorporatedhydrogen. On the other hand, the effective activation energies for hydrogendiffusion in our system are not necessarily the same as, for example, thoseobtained by experimental methods – usually at high temperatures – to studykinetics of diffusion of hydrogen in graphite. Irradiation effects of MeV pro-tons on diamond-like films were studied by Wang, Wang, and Chen (1992).According to the authors, below a fluence of the order of 1 nC/µm2 the hy-drogen atoms produced by ion irradiation could be recaptured by danglingbonds. For higher fluences a release of hydrogen is expected.
Irradiation at a fixed energy has a clear disadvantage. If the magnetic orderingis triggered at a specific density of protons and defects, then, it is clear thatwith fixed proton and defect distributions, such as the one shown in Fig. 1,we would have a rather narrow window to get a maximum effect. Therefore,it should not be a surprise if for some irradiation energies and fluences onemeasures negligible effects or even a reduction of the magnetic order present inthe sample before or after some irradiation steps. Carbon magnetism as wellas irradiation effects on it belong to a new field in magnetism. For graphitebulk and thin film samples there are still many questions to be clarified in thefuture concerning the hydrogen implantation by irradiation and its effects onthe magnetism.
The defect formation process by high energy protons is a non-equilibriumathermal process and it appears rather unlikely that ordered arrays of defectsare formed by migration of interstitial carbon atoms or vacancies, maybe withthe exception of the interstitial across the gallery. According to Banhart (1999)and from electron irradiation studies, the essential types of radiation damageup to intermediate temperatures are the rupture of basal planes (due to shiftof the C-atoms out of the plane) and the aggregation of interstitials intosmall dislocation loops between the graphene layers. The migration energy ofthe interstitial depends whether it is bounded. Di-interstitials were proposedto explain the irradiation-induced amorphization of graphite with a migrationenergy of 0.86 eV (Niwase, 1995). The interstitial loops are stable up to rather
5
0.1 1 100.01
0.1
1
Ram
an inte
nsity
ratio
I(1360cm
-1)
/ I(
1580cm
-1)
Fluence (nC/µm2)
290 288 286 284 282
sp3
sp3
sp2
sp2
(a)
(b)
Inte
nsity (
arb
itra
ry u
nits)
Binding Energy (eV)
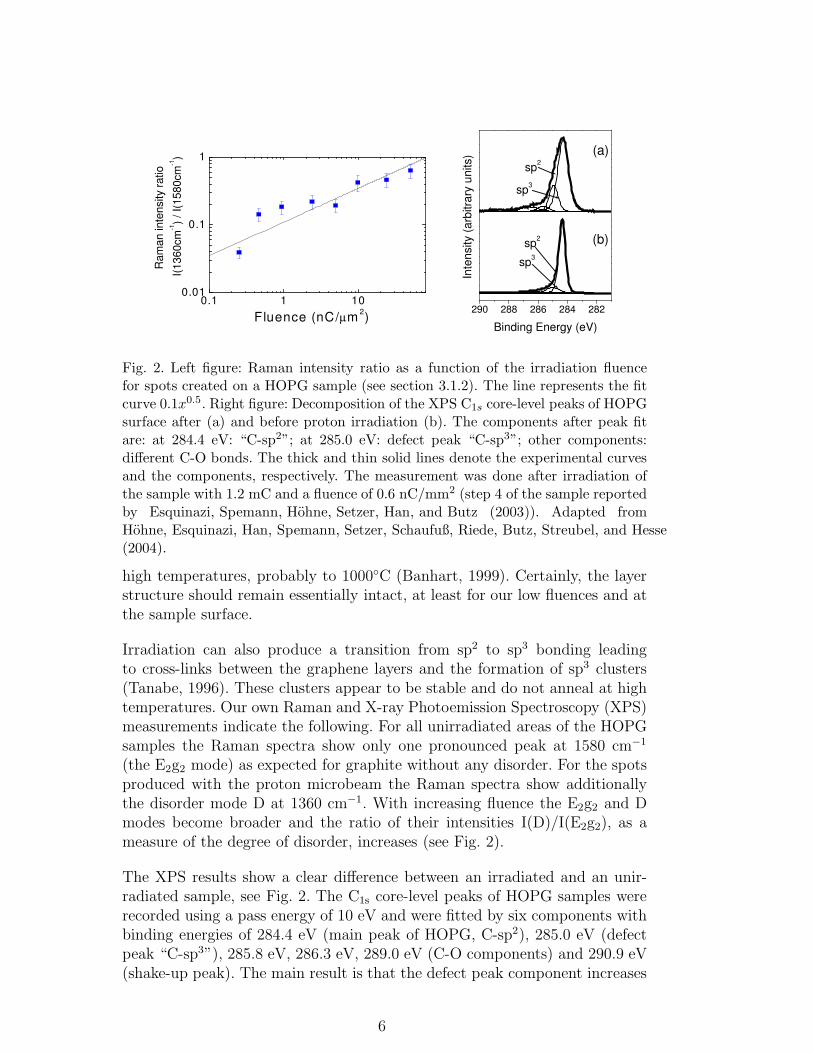
Fig. 2. Left figure: Raman intensity ratio as a function of the irradiation fluencefor spots created on a HOPG sample (see section 3.1.2). The line represents the fitcurve 0.1x0.5. Right figure: Decomposition of the XPS C1s core-level peaks of HOPGsurface after (a) and before proton irradiation (b). The components after peak fitare: at 284.4 eV: “C-sp2”; at 285.0 eV: defect peak “C-sp3”; other components:different C-O bonds. The thick and thin solid lines denote the experimental curvesand the components, respectively. The measurement was done after irradiation ofthe sample with 1.2 mC and a fluence of 0.6 nC/mm2 (step 4 of the sample reportedby Esquinazi, Spemann, Hohne, Setzer, Han, and Butz (2003)). Adapted fromHohne, Esquinazi, Han, Spemann, Setzer, Schaufuß, Riede, Butz, Streubel, and Hesse(2004).
high temperatures, probably to 1000◦C (Banhart, 1999). Certainly, the layerstructure should remain essentially intact, at least for our low fluences and atthe sample surface.
Irradiation can also produce a transition from sp2 to sp3 bonding leadingto cross-links between the graphene layers and the formation of sp3 clusters(Tanabe, 1996). These clusters appear to be stable and do not anneal at hightemperatures. Our own Raman and X-ray Photoemission Spectroscopy (XPS)measurements indicate the following. For all unirradiated areas of the HOPGsamples the Raman spectra show only one pronounced peak at 1580 cm−1
(the E2g2 mode) as expected for graphite without any disorder. For the spotsproduced with the proton microbeam the Raman spectra show additionallythe disorder mode D at 1360 cm−1. With increasing fluence the E2g2 and Dmodes become broader and the ratio of their intensities I(D)/I(E2g2), as ameasure of the degree of disorder, increases (see Fig. 2).
The XPS results show a clear difference between an irradiated and an unir-radiated sample, see Fig. 2. The C1s core-level peaks of HOPG samples wererecorded using a pass energy of 10 eV and were fitted by six components withbinding energies of 284.4 eV (main peak of HOPG, C-sp2), 285.0 eV (defectpeak “C-sp3”), 285.8 eV, 286.3 eV, 289.0 eV (C-O components) and 290.9 eV(shake-up peak). The main result is that the defect peak component increases
6
after proton irradiation. A similar behaviour was found for HOPG underplasma low-energy argon-ion bombardment (Rousseau, Estrade-Szwarckopf, Thomann, and Brault,2003). Whether this defect peak corresponds to a pure C-sp3 state or whethersome of the “defect” carbon atoms are bounded to hydrogen is unclear and it isa matter of current research (Estrade-Szwarckopf, 2004). The knowledge of theC-H sp2 and sp3 bonds is for the magnetic properties of carbon structures ofimportance. We remark that numerical simulations indicate a 100% polarizedπ-band, i.e. a ferromagnetic order stable at room temperature, for a graphenelayer with a mixture of sp2 and sp3 bondings (mono- and di-hydrogenated) atthe zigzag edges of a graphene layer (Kusakabe and Maruyama, 2003).
Other aspect of the irradiation effects on graphite that may be of importanceto trigger magnetic ordering is the formation of pentagons and heptagons inthe basal planes, which could cause a bending of the graphene layers (Banhart,1999). The influence on the electronic band structure of graphite of such topo-logical defects has been studied theoretically by Gonzalez, Guinea, and Vozmediano(2001). According to these authors, these defects may trigger ferromagnetismor even superconductivity.
For thick targets and sufficiently high fluences, the target surface actuallyswells, which can be easily measured by an atomic force microscope (AFM), seeFig. 8(a), or is even visible under an optical microscope (Spemann, Han, Esquinazi, Hohne, and Butz,2004; Esquinazi, Han, Hohne, Spemann, Setzer, and Butz, 2005). The swellingin the c−direction occurs together with the contraction in the graphene layer;the new formed interstitial planes push the existing planes apart leading toa protuberance at the sample surface. This irradiation effect was studied byKoike and Pedraza (1994); Muto and Tanabe (1997); Takeuchi, Muto, Tanabe, Arai, and Kuroyanagi(1997). This effect was not observed for thin enough targets for the usual pro-ton irradiation fluences used in this work.
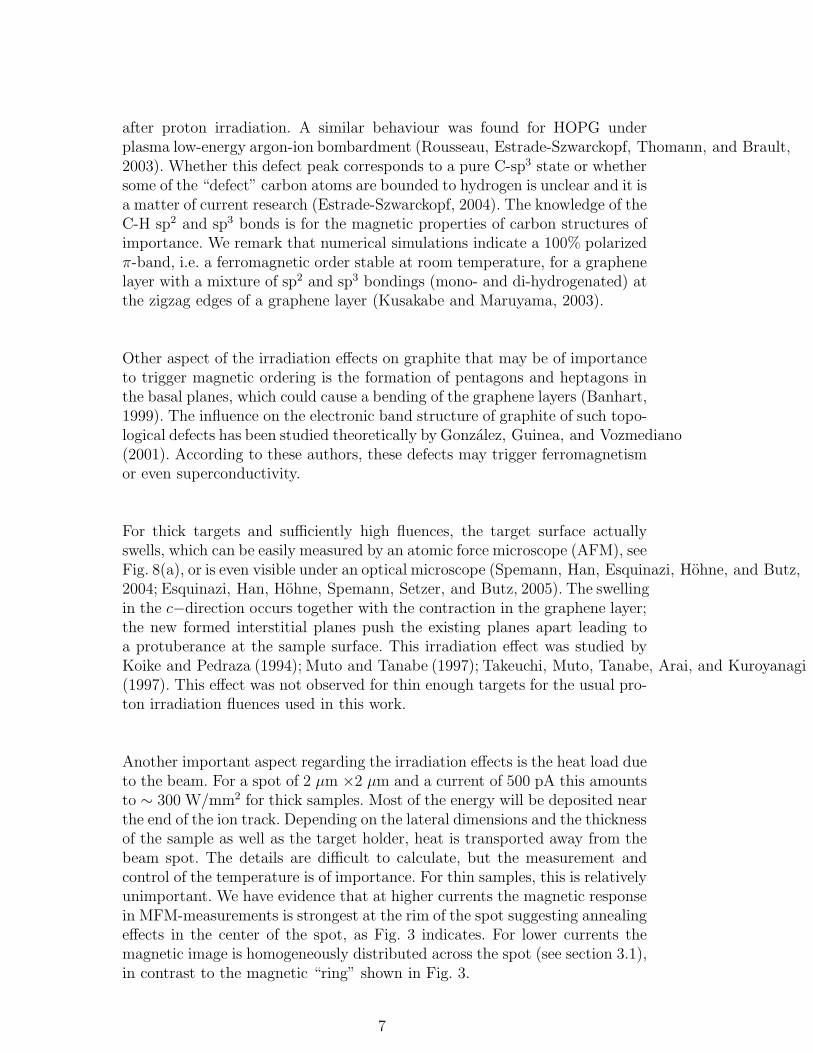
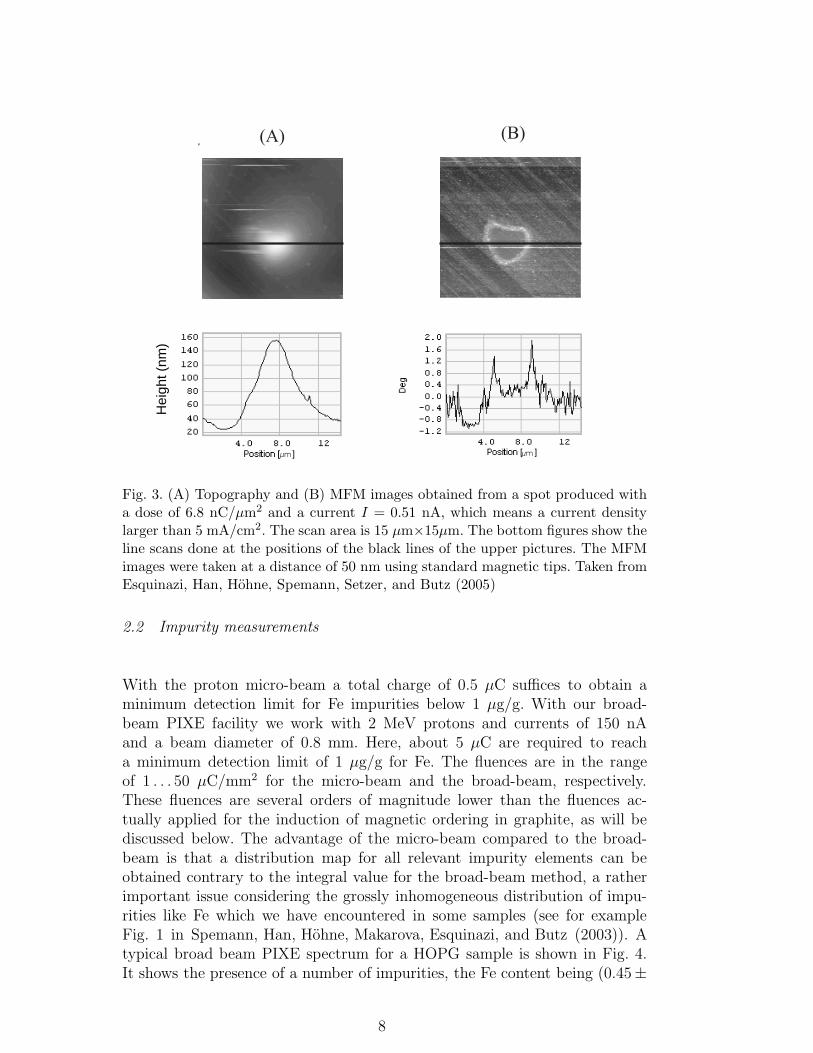
Another important aspect regarding the irradiation effects is the heat load dueto the beam. For a spot of 2 µm ×2 µm and a current of 500 pA this amountsto ∼ 300 W/mm2 for thick samples. Most of the energy will be deposited nearthe end of the ion track. Depending on the lateral dimensions and the thicknessof the sample as well as the target holder, heat is transported away from thebeam spot. The details are difficult to calculate, but the measurement andcontrol of the temperature is of importance. For thin samples, this is relativelyunimportant. We have evidence that at higher currents the magnetic responsein MFM-measurements is strongest at the rim of the spot suggesting annealingeffects in the center of the spot, as Fig. 3 indicates. For lower currents themagnetic image is homogeneously distributed across the spot (see section 3.1),in contrast to the magnetic “ring” shown in Fig. 3.
7
.
µm µm
(A) (B)
Hei
ght(
nm)
Fig. 3. (A) Topography and (B) MFM images obtained from a spot produced witha dose of 6.8 nC/µm2 and a current I = 0.51 nA, which means a current densitylarger than 5 mA/cm2. The scan area is 15 µm×15µm. The bottom figures show theline scans done at the positions of the black lines of the upper pictures. The MFMimages were taken at a distance of 50 nm using standard magnetic tips. Taken fromEsquinazi, Han, Hohne, Spemann, Setzer, and Butz (2005)
2.2 Impurity measurements
With the proton micro-beam a total charge of 0.5 µC suffices to obtain aminimum detection limit for Fe impurities below 1 µg/g. With our broad-beam PIXE facility we work with 2 MeV protons and currents of 150 nAand a beam diameter of 0.8 mm. Here, about 5 µC are required to reacha minimum detection limit of 1 µg/g for Fe. The fluences are in the rangeof 1 . . . 50 µC/mm2 for the micro-beam and the broad-beam, respectively.These fluences are several orders of magnitude lower than the fluences ac-tually applied for the induction of magnetic ordering in graphite, as will bediscussed below. The advantage of the micro-beam compared to the broad-beam is that a distribution map for all relevant impurity elements can beobtained contrary to the integral value for the broad-beam method, a ratherimportant issue considering the grossly inhomogeneous distribution of impu-rities like Fe which we have encountered in some samples (see for exampleFig. 1 in Spemann, Han, Hohne, Makarova, Esquinazi, and Butz (2003)). Atypical broad beam PIXE spectrum for a HOPG sample is shown in Fig. 4.It shows the presence of a number of impurities, the Fe content being (0.45±
8
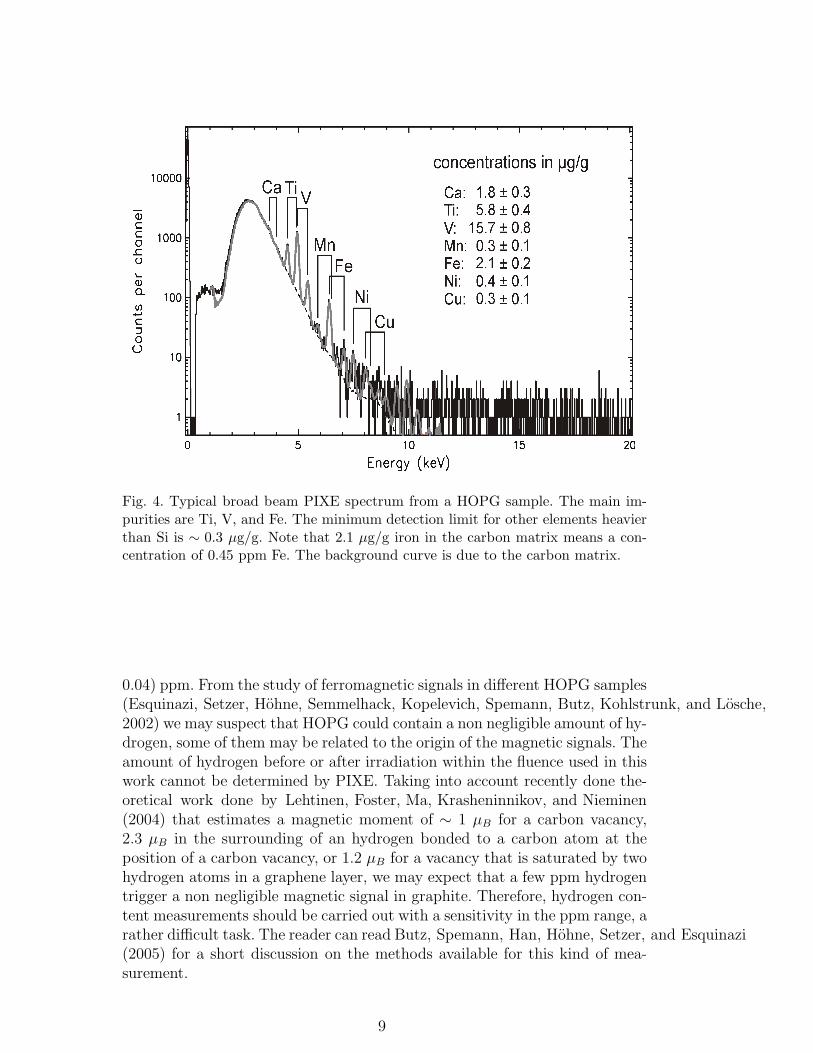
Fig. 4. Typical broad beam PIXE spectrum from a HOPG sample. The main im-purities are Ti, V, and Fe. The minimum detection limit for other elements heavierthan Si is ∼ 0.3 µg/g. Note that 2.1 µg/g iron in the carbon matrix means a con-centration of 0.45 ppm Fe. The background curve is due to the carbon matrix.
0.04) ppm. From the study of ferromagnetic signals in different HOPG samples(Esquinazi, Setzer, Hohne, Semmelhack, Kopelevich, Spemann, Butz, Kohlstrunk, and Losche,2002) we may suspect that HOPG could contain a non negligible amount of hy-drogen, some of them may be related to the origin of the magnetic signals. Theamount of hydrogen before or after irradiation within the fluence used in thiswork cannot be determined by PIXE. Taking into account recently done the-oretical work done by Lehtinen, Foster, Ma, Krasheninnikov, and Nieminen(2004) that estimates a magnetic moment of ∼ 1 µB for a carbon vacancy,2.3 µB in the surrounding of an hydrogen bonded to a carbon atom at theposition of a carbon vacancy, or 1.2 µB for a vacancy that is saturated by twohydrogen atoms in a graphene layer, we may expect that a few ppm hydrogentrigger a non negligible magnetic signal in graphite. Therefore, hydrogen con-tent measurements should be carried out with a sensitivity in the ppm range, arather difficult task. The reader can read Butz, Spemann, Han, Hohne, Setzer, and Esquinazi(2005) for a short discussion on the methods available for this kind of mea-surement.
9
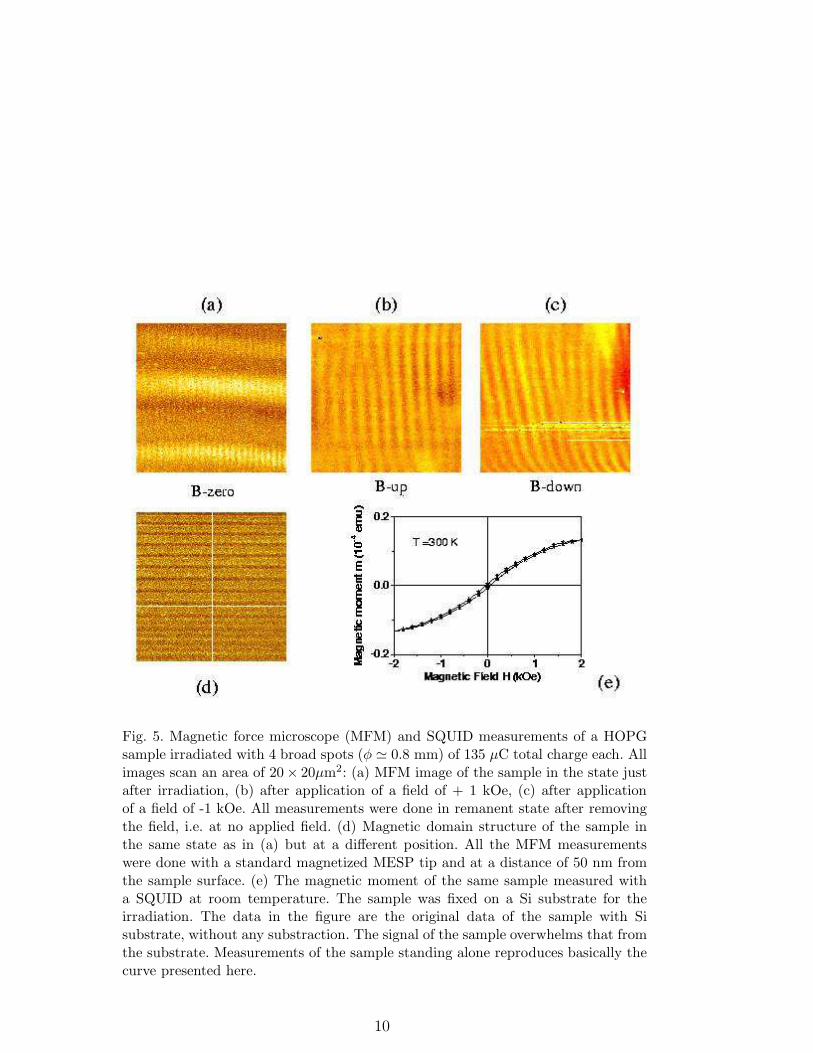
Fig. 5. Magnetic force microscope (MFM) and SQUID measurements of a HOPGsample irradiated with 4 broad spots (φ ≃ 0.8 mm) of 135 µC total charge each. Allimages scan an area of 20× 20µm2: (a) MFM image of the sample in the state justafter irradiation, (b) after application of a field of + 1 kOe, (c) after applicationof a field of -1 kOe. All measurements were done in remanent state after removingthe field, i.e. at no applied field. (d) Magnetic domain structure of the sample inthe same state as in (a) but at a different position. All the MFM measurementswere done with a standard magnetized MESP tip and at a distance of 50 nm fromthe sample surface. (e) The magnetic moment of the same sample measured witha SQUID at room temperature. The sample was fixed on a Si substrate for theirradiation. The data in the figure are the original data of the sample with Sisubstrate, without any substraction. The signal of the sample overwhelms that fromthe substrate. Measurements of the sample standing alone reproduces basically thecurve presented here.
10
3 Irradiation Effects
3.1 On highly oriented pyrolytic graphite
3.1.1 Broad proton irradiation
All the irradiated HOPG samples discussed in this review were from AdvancedCeramics Co. (ZYA grade, 0.4◦ rocking curve width at half maximum) witha content of magnetic metallic impurities below 1 ppm. The largest concen-tration of non magnetic metallic ions was found for Ti (. 6 µg/g) and V(. 16 µg/g). A typical surface area of the samples was 2 × 2 mm2 and athickness between 0.1 mm to 0.3 mm. The samples were glued with varnish(or a mixture of varnish and a high purity graphite powder to increase thethermal coupling) on a high-purity Si substrate and the magnetic momentof the whole ensemble as well as of the Si substrate alone was measured. Ingeneral and within experimental error the diamagnetic hysteresis loops for theused Si substrates are reversible; after subtracting the linear diamagnetic de-pendence there is no significant hysteresis left (for an example see Fig. 7(a)).Nevertheless, when the ferromagnetic moment of the sample is weak, it canbe a hard task to obtain the true sample magnetic moment from the SQUIDsignal of the mixture (Si plus the HOPG sample) and several checks have tobe done.
In this section we will discuss results obtained after irradiation of a large areaof the HOPG sample using the micro- and the broad-beam of protons. As wewill realize below, there are several irradiation parameters that may have animportant role in inducing the achieved magnetic signal. Namely:– (1) The total implanted charge. The total amount of protons or alpha par-ticles that were implanted in the sample or travelled through the sample.– (2) The input energy. Although with the LIPSION we have the possibility ofchanging this energy from 1 to 2.25 MeV, in order to minimize the number ofvariables, the studies presented here were done with fixed irradiation energiesof 2.0 or 2.25 MeV. This means that we have a well defined defect and im-plantation profile inside the sample, see Fig. 1. If the highest magnetic signalis determined at a given defect and proton density, it is clear that successiveirradiation at similar energies may produce contrary effects if this optimizedregion is destroyed by the next irradiation at similar conditions.– (3) The fluence, the irradiated charge per unit area.– (4) The ion current. Large currents might heat the sample and non system-atic effects are then possible.– (5) Micro- or macro-irradiation, i.e. a broad irradiation with the 0.8 mmbeam or a large number of micrometer spots distributed in the sample. Ex-perience indicates that the magnetic signals are much larger when one usesa high density of micrometer spots rather than the implantation of similaramount of charge with a broad beam. This fact appears to be related with the
11

density and/or type of defects that the beam produces.– (6) Sample temperature. All the irradiations presented in this review weredone at nominally room temperature. Future experiments should try to irra-diate at lower or higher temperatures to check for its influence.– (7) Finally, the initial state of the sample, namely the density and type ofdefects, which in part can determine its metallicity. Computer simulation re-sults of the effects of adsorbed hydrogen on the band structure of a graphenelayer indicate that metallization caused by specific defects can quench a spinpolarized state (Duplock, Scheffler, and Lindan, 2004).
The first SQUID measurements that indicate a magnetic ordering after protonirradiation were published by Esquinazi, Spemann, Hohne, Setzer, Han, and Butz(2003). In that work an increase in the hysteresis loop was observed after sev-eral irradiation steps. These irradiation steps contained successively irradia-tion of several thousands of micrometer small spots as well as four (or three)spots of 0.8 mm diameter each on the same sample. In what follows we shalldiscuss further work that has been done afterwards, where we have tried tocharacterize the effects produced by some of the irradiation parameters de-scribed above. We stress that they are the very first steps to get reproduciblemagnetic order in carbon, a task that turned to be full of difficulties, as thepublished results from literature indicate.
A broad and homogeneous proton irradiation of usual fluences (∼ 150 µCtotal charge in an area of ∼ 1 mm2) per spot on oriented graphite producesa magnetic signal that in general can be well observed with a magnetic forcemicroscope (MFM) on the irradiated surface. Figure 5 shows the MFM im-ages obtained on an irradiated area with a total charge of 540 µC distributedinto 4 spots, 135 µC each. After this broad irradiation there is no significantchange in the topography worth to note. However, the periodic magnetic do-mains are well defined. In the remanent state just after irradiation, in someof the irradiated area of the sample we observed two domain structures, onenormal to the other, see Fig. 5(a). The period of the small domain structureis ∼ 0.8 . . . 1.2 µm depending on the region (compare with (d) which wasobtained in the same state but in other irradiated area), whereas the otherdomain structure has a period of ∼ 10 µm and depends on the scan direction ofthe MFM tip. After application of a field of 1 kOe in the +z direction (perpen-dicular to the graphene layers) the “vertical” domain structure shows a periodof ∼ 1.6 . . . 2.0 µm and the width of the domains increases, see Fig. 5(b). Theother domain structure is not observed. After magnetizing the sample with afield in the other direction there is a slight change of the width of the brightrelative to the dark regions, compare (c) with (b). In non-irradiated graphiteareas we did not find any signature of domain structures within the resolutionof the microscope. This irradiation triggered a relatively large hysteresis loopthat could be very well measured with the SQUID without any backgroundsubstraction, see Fig. 5(e). The temperature dependence of this signal was
12
studied removing the sample from the Si substrate. It shows a weak decrease(∼ 5%) with temperature of the saturation magnetization and coercivity fieldsbetween 5 K and 300 K.
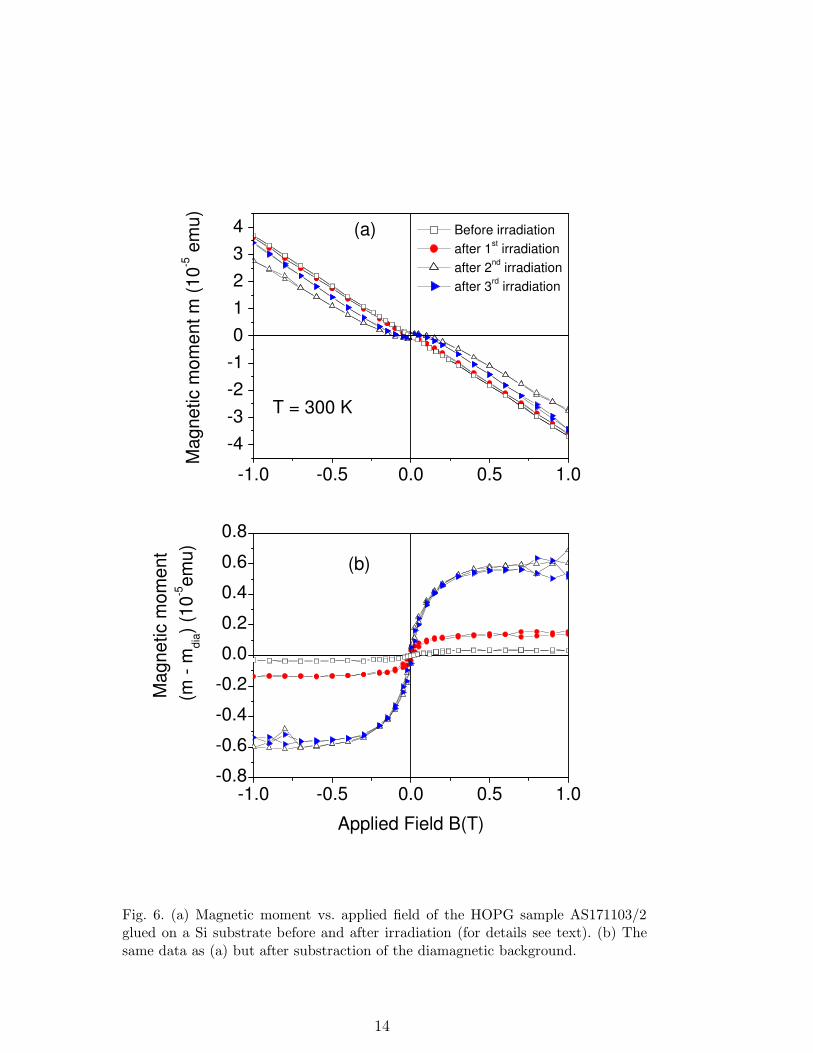
To study the influence of some of the irradiation parameters on the magneticresponse of HOPG samples, we have studied three HOPG samples from thesame batch. One sample of mass m = 1.19 mg (labelled AS171103/2) wasirradiated with the proton microbeam as follows. First irradiation consistedof 104 spots of diameter φ ≃ 1.8 µm each with a charge of 0.85 nC (totalcharge 8.5 µC), fluence = 0.34 nC/µm2, irradiated area: 0.62× 0.62 mm2 andcurrent I ≃ 1.1 nA. Second irradiation produced the same amount of spots butwith a diameter of φ ≃ 2 µm and 0.72 nC charge each (total charge 7.2 µC),fluence = 0.24 nC/µm2 and I ≃ 0.9 nA. The third and last irradiation wasidentical to the first one. The room temperature SQUID results of the samplebefore and after substraction of the diamagnetic background are shown inFig. 6. It is clearly seen that the irradiation increases the magnetic signalof the sample. The last irradiation, however, did not produce any significantchange respect to the last one. The remanent magnetization changed fromMr(B = 0) ≃ 3.3 × 10⁻⁵ emu/g to 2.7 × 10⁻⁴ emu/g and 4.5 × 10⁻⁴ emu/gfor the first, virgin state and second (or third) irradiation steps.
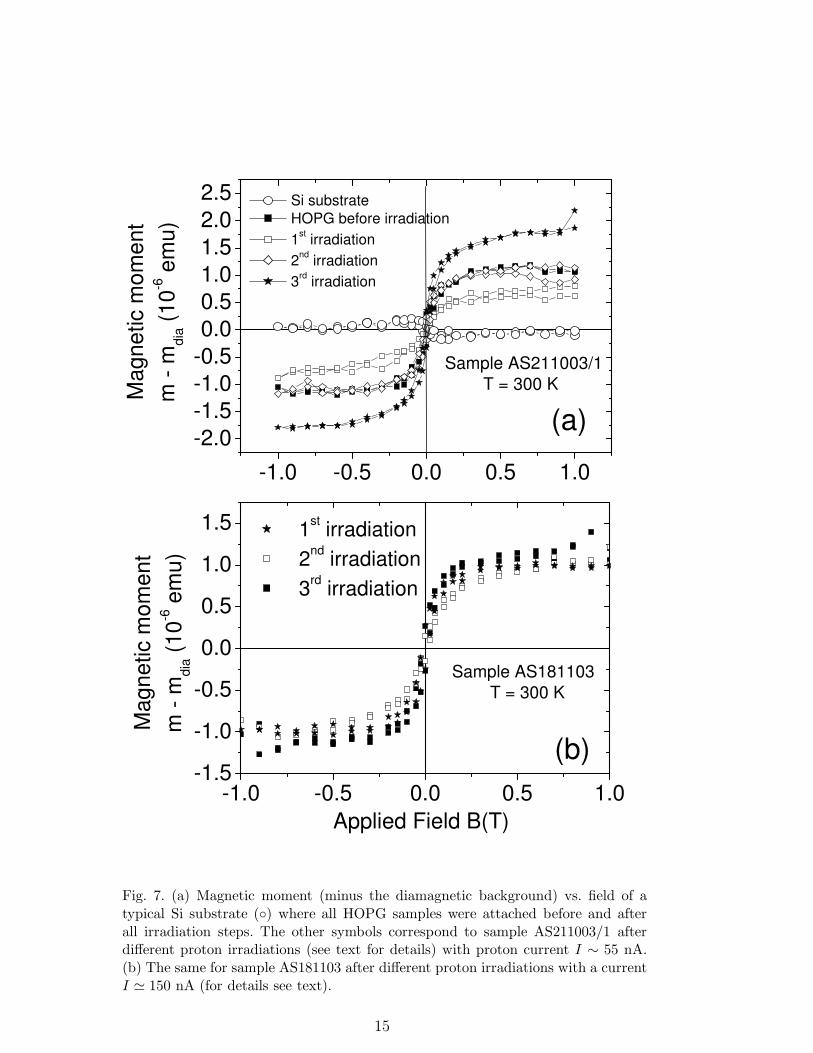
To check the influence of the irradiation current under broad irradiation condi-tions we have irradiated two samples with the following characteristics. Irradia-tion with a current I = 54±1 nA: sample AS211003/1, mass m = 1.33 mg, firstirradiation: 4 spots of φ = 0.8 mm and 53.4 µC each (total charge 214 µC); sec-ond irradiation: 4 spots of φ = 0.8 mm and 110 µC each (total charge 440 µC);third irradiation: 4 spots of φ = 0.8 mm and 54.5 µC each (total charge218 µC). The SQUID results after substraction of the diamagnetic backgroundare shown in Fig. 7(a). We see that the initial magnetic state of this sample(magnetic moment at saturation m ≃ 10−6 emu) decreased after the first irra-diation. For the subsequent irradiation steps the magnetic moment increased.The saturation magnetization showed a decrease from its initial value of Mr =(1.95±0.15)10−4 emu/g to Mr = (1.0±0.08)10−4 emu/g after the first irradi-ation. For the 2nd and 3rd irradiation we have Mr = (1.56 ± 0.15)10−4 emu/gand Mr = (2.6 ± 0.15)10−4 emu/g. The coercive field remains in the range of150 Oe.
On the sample AS181103 of mass m = 1.12 mg, the following irradiation stepsat a proton current of I = 150 nA were performed: (1) 2 spots of 0.8 mm diam-eter with 159 µC each (total charge 318 µC); (2) 2 spots of 0.8 mm diameterwith 160 µC each (total charge 320 µC); (3) 2 spots of 0.8 mm diameter with154 µC each (total charge 308 µC). Figure 7(b) shows the SQUID results forthis sample. Under those irradiation conditions the sample did not show anysignificant increase in the magnetic signal within experimental error. Com-paring this result with that of (a) we would conclude that the proton current
13
-1.0 -0.5 0.0 0.5 1.0-0.8
-0.6
-0.4
-0.2
0.0
0.2
0.4
0.6
0.8
(b)
Magnetic m
om
ent
(m
- m
dia)
(10
-5em
u)
Applied Field B(T)
-1.0 -0.5 0.0 0.5 1.0
-4
-3
-2
-1
0
1
2
3
4 (a)
T = 300 K
Before irradiation
after 1st irradiation
after 2nd
irradiation
after 3rd irradiation
Magnetic m
om
ent m
(10
-5 e
mu)
Fig. 6. (a) Magnetic moment vs. applied field of the HOPG sample AS171103/2glued on a Si substrate before and after irradiation (for details see text). (b) Thesame data as (a) but after substraction of the diamagnetic background.
14
-1.0 -0.5 0.0 0.5 1.0
-2.0
-1.5
-1.0
-0.5
0.0
0.5
1.0
1.5
2.0
2.5
(a)
Sample AS211003/1
T = 300 K
Ma
gn
etic m
om
en
t
m -
mdia (
10
-6 e
mu
)
Si substrate
HOPG before irradiation
1st irradiation
2nd
irradiation
3rd irradiation
-1.0 -0.5 0.0 0.5 1.0-1.5
-1.0
-0.5
0.0
0.5
1.0
1.5
Applied Field B(T)
(b)
Sample AS181103
T = 300 K
1st irradiation
2nd
irradiation
3rd irradiation
Ma
gne
tic m
om
en
t
m -
md
ia (
10
-6 e
mu
)
Fig. 7. (a) Magnetic moment (minus the diamagnetic background) vs. field of atypical Si substrate (◦) where all HOPG samples were attached before and afterall irradiation steps. The other symbols correspond to sample AS211003/1 afterdifferent proton irradiations (see text for details) with proton current I ∼ 55 nA.(b) The same for sample AS181103 after different proton irradiations with a currentI ≃ 150 nA (for details see text).
15
plays an important role in inducing the magnetic ordering in HOPG samples.
3.1.2 Magnetic spots and lines of micrometer size
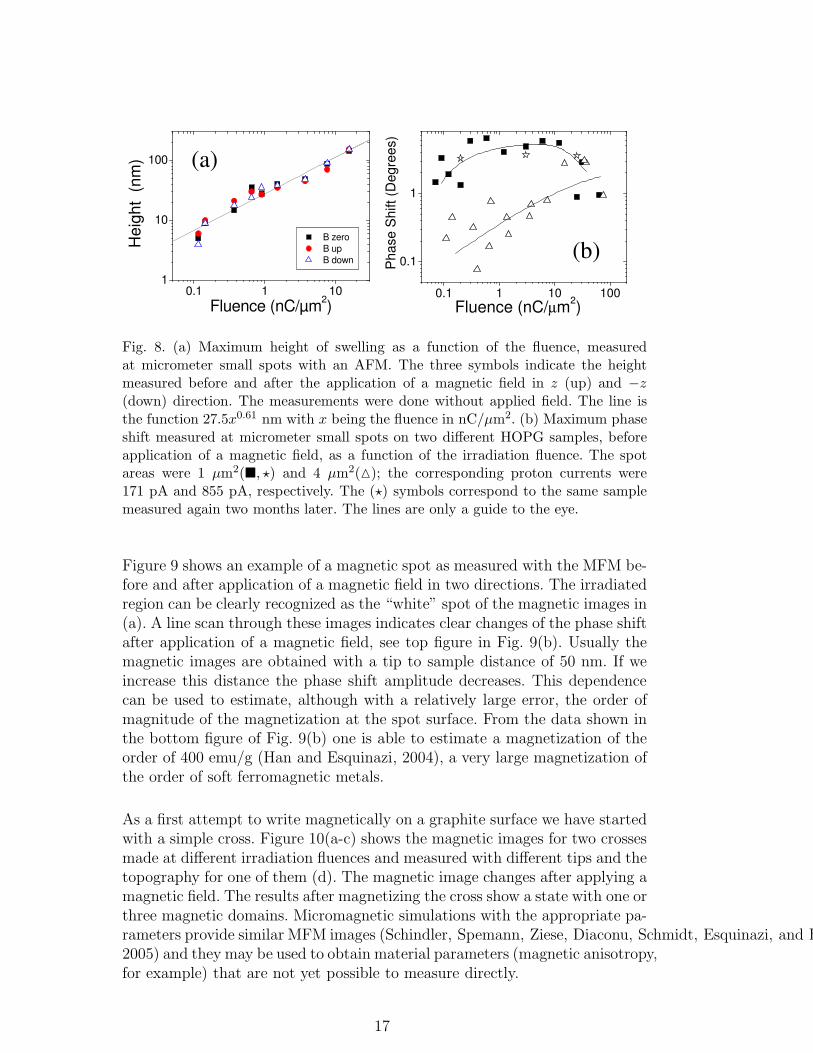
As mentioned in section 2, the LIPSION accelerator has the possibility toirradiate the samples with a proton micro- or nanobeam. We have used themicrobeam to produce magnetic spots on oriented graphite surfaces. As forthe broad beam irradiation, the microbeam was directed onto the HOPG sur-face parallel to the c−axis of the sample without beam scanning (exceptingline scans, see below) leading to the formation of micron-sized spots withenhanced defect density, as measured by micro-Raman, see Fig. 2. In gen-eral, two spots separated by a distance of 20 µm were irradiated with thesame ion fluence and several ion fluences were used. For large enough fluencesthe swelling at the spots can be directly observed with an optical microscope(Spemann, Han, Esquinazi, Hohne, and Butz, 2004; Esquinazi, Han, Hohne, Spemann, Setzer, and Butz2005). The height of this swelling depends on the irradiated fluence and on themass of the ions. The dependence of the maximum swelling height, measuredby AFM, with the fluence for proton irradiation is shown in Fig. 8(a). With aMFM one can measure the magnetic signal on the spots. The maximum am-plitude of the signal (maximum phase shift) as a function of the fluence for twodifferent proton currents is presented in Fig. 8(b). The units of the magneticsignal from the MFM are “degrees”; a relation of this phase shift of the tip vi-bration to the force gradient can be found in Lohau, Kirsch, Carl, Dumpich, and Wassermann(1999); Lohau, Kirsch, Carl, and Wassermann (2000). Examples for the mag-netic moment calculated from measurements of the phase shift in carbon sam-ples can be found in Han, Spemann, Hohne, Setzer, Makarova, Esquinazi, and Butz(2003b,c); Han and Esquinazi (2004).
We note that, whereas the swelling height increases systematically with flu-ence, the maximum phase shift of the magnetic signal does not, see Fig. 8(b).This result indicates that: (1) there is a negligible influence of the topographyonto the magnetic signal and (2) the magnetic signal depends on the implantedcharge, proton current and probably also on the carbon structure. The differ-ence between the behaviors observed for two different proton currents can beunderstood if we take into account that the higher the current the higherwould be the internal temperature of the sample at the spot. Therefore, an-nealing effects can be the origin for this difference. It is worth to note thatthe signals could be reproduced after leaving the samples in air and at roomtemperature for two months, see Fig. 8(b). This is not the case for much largertimes, see section 4. We note also that at the higher fluence range, the struc-ture of the spots is very probably that of highly disordered or even amorphouscarbon. For both proton currents the maximum magnetic signal decreases atthe highest fluences, see Fig. 8(b).
16
0.1 1 101
10
100
He
igh
t (
nm
)
Fluence (nC/µm2)
B zero
B up
B down
0.1 1 10 100
0.1
1
Pha
se
Shift (D
eg
ree
s)
Fluence (nC/µm2)
(a)
(b)
Fig. 8. (a) Maximum height of swelling as a function of the fluence, measuredat micrometer small spots with an AFM. The three symbols indicate the heightmeasured before and after the application of a magnetic field in z (up) and −z
(down) direction. The measurements were done without applied field. The line isthe function 27.5x0.61 nm with x being the fluence in nC/µm2. (b) Maximum phaseshift measured at micrometer small spots on two different HOPG samples, beforeapplication of a magnetic field, as a function of the irradiation fluence. The spotareas were 1 µm2(�, ⋆) and 4 µm2(△); the corresponding proton currents were171 pA and 855 pA, respectively. The (⋆) symbols correspond to the same samplemeasured again two months later. The lines are only a guide to the eye.
Figure 9 shows an example of a magnetic spot as measured with the MFM be-fore and after application of a magnetic field in two directions. The irradiatedregion can be clearly recognized as the “white” spot of the magnetic images in(a). A line scan through these images indicates clear changes of the phase shiftafter application of a magnetic field, see top figure in Fig. 9(b). Usually themagnetic images are obtained with a tip to sample distance of 50 nm. If weincrease this distance the phase shift amplitude decreases. This dependencecan be used to estimate, although with a relatively large error, the order ofmagnitude of the magnetization at the spot surface. From the data shown inthe bottom figure of Fig. 9(b) one is able to estimate a magnetization of theorder of 400 emu/g (Han and Esquinazi, 2004), a very large magnetization ofthe order of soft ferromagnetic metals.
As a first attempt to write magnetically on a graphite surface we have startedwith a simple cross. Figure 10(a-c) shows the magnetic images for two crossesmade at different irradiation fluences and measured with different tips and thetopography for one of them (d). The magnetic image changes after applying amagnetic field. The results after magnetizing the cross show a state with one orthree magnetic domains. Micromagnetic simulations with the appropriate pa-rameters provide similar MFM images (Schindler, Spemann, Ziese, Diaconu, Schmidt, Esquinazi, and Butz2005) and they may be used to obtain material parameters (magnetic anisotropy,for example) that are not yet possible to measure directly.
17
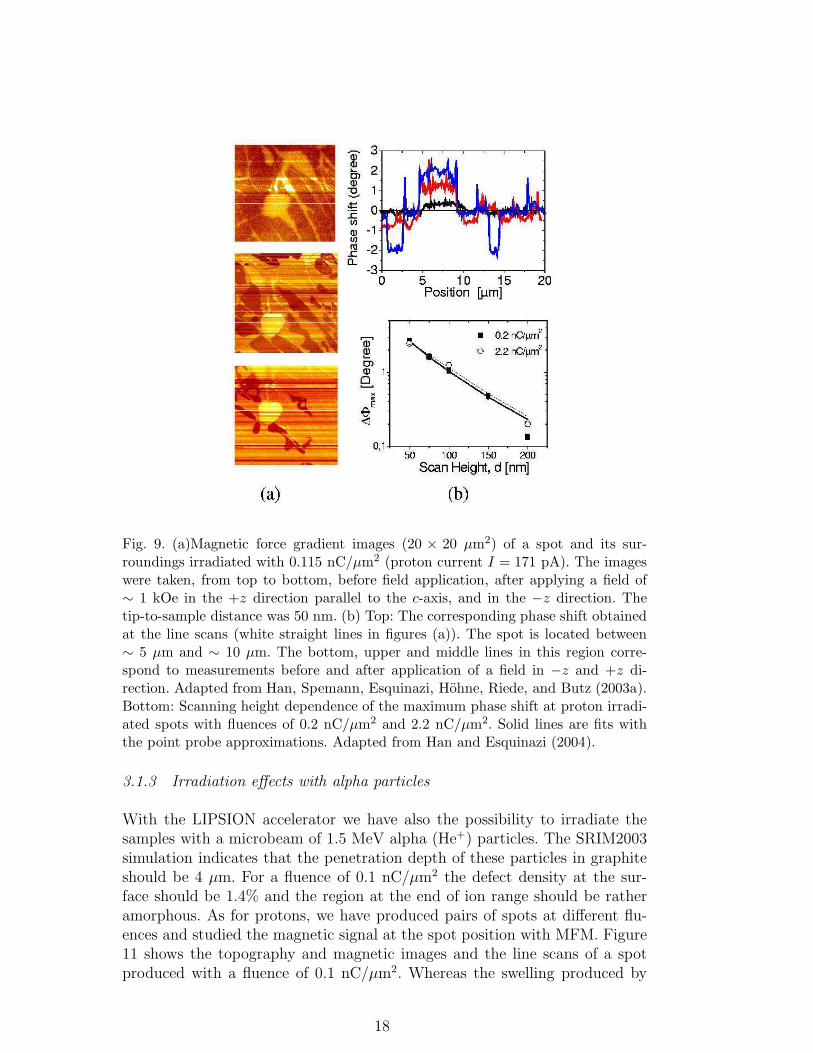
Fig. 9. (a)Magnetic force gradient images (20 × 20 µm2) of a spot and its sur-roundings irradiated with 0.115 nC/µm2 (proton current I = 171 pA). The imageswere taken, from top to bottom, before field application, after applying a field of∼ 1 kOe in the +z direction parallel to the c-axis, and in the −z direction. Thetip-to-sample distance was 50 nm. (b) Top: The corresponding phase shift obtainedat the line scans (white straight lines in figures (a)). The spot is located between∼ 5 µm and ∼ 10 µm. The bottom, upper and middle lines in this region corre-spond to measurements before and after application of a field in −z and +z di-rection. Adapted from Han, Spemann, Esquinazi, Hohne, Riede, and Butz (2003a).Bottom: Scanning height dependence of the maximum phase shift at proton irradi-ated spots with fluences of 0.2 nC/µm2 and 2.2 nC/µm2. Solid lines are fits withthe point probe approximations. Adapted from Han and Esquinazi (2004).
3.1.3 Irradiation effects with alpha particles
With the LIPSION accelerator we have also the possibility to irradiate thesamples with a microbeam of 1.5 MeV alpha (He+) particles. The SRIM2003simulation indicates that the penetration depth of these particles in graphiteshould be 4 µm. For a fluence of 0.1 nC/µm2 the defect density at the sur-face should be 1.4% and the region at the end of ion range should be ratheramorphous. As for protons, we have produced pairs of spots at different flu-ences and studied the magnetic signal at the spot position with MFM. Figure11 shows the topography and magnetic images and the line scans of a spotproduced with a fluence of 0.1 nC/µm2. Whereas the swelling produced by
18
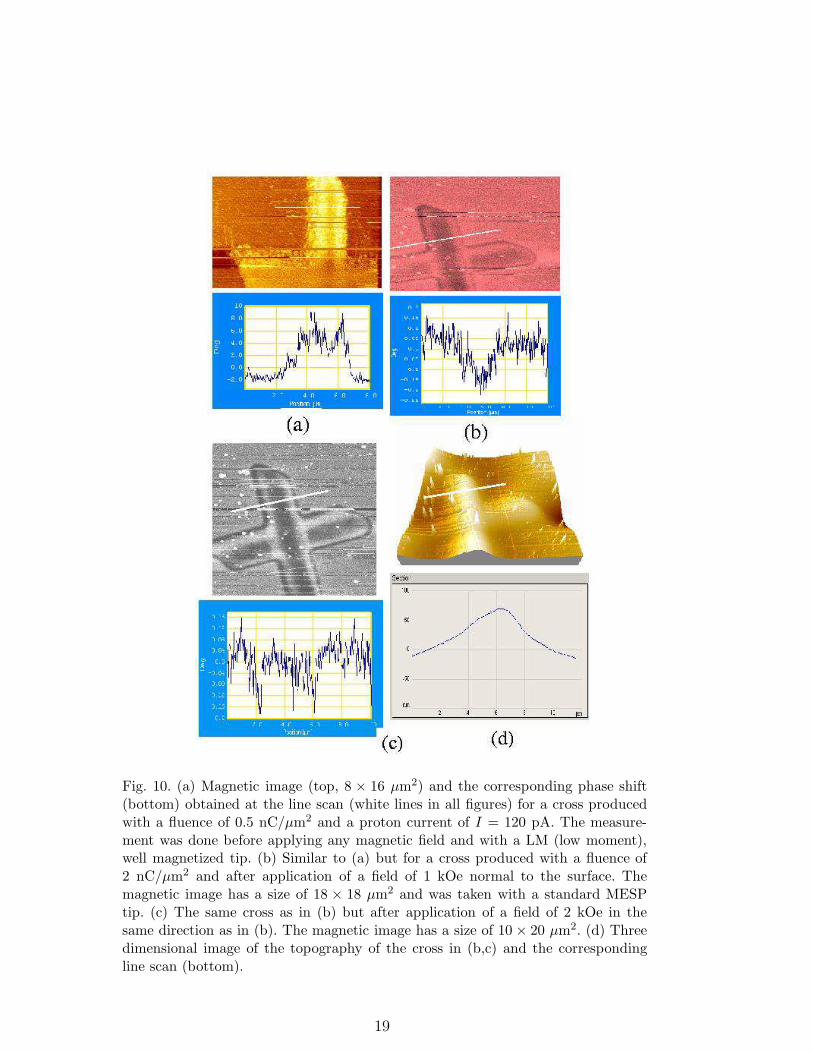
Fig. 10. (a) Magnetic image (top, 8 × 16 µm2) and the corresponding phase shift(bottom) obtained at the line scan (white lines in all figures) for a cross producedwith a fluence of 0.5 nC/µm2 and a proton current of I = 120 pA. The measure-ment was done before applying any magnetic field and with a LM (low moment),well magnetized tip. (b) Similar to (a) but for a cross produced with a fluence of2 nC/µm2 and after application of a field of 1 kOe normal to the surface. Themagnetic image has a size of 18 × 18 µm2 and was taken with a standard MESPtip. (c) The same cross as in (b) but after application of a field of 2 kOe in thesame direction as in (b). The magnetic image has a size of 10 × 20 µm2. (d) Threedimensional image of the topography of the cross in (b,c) and the correspondingline scan (bottom).
19
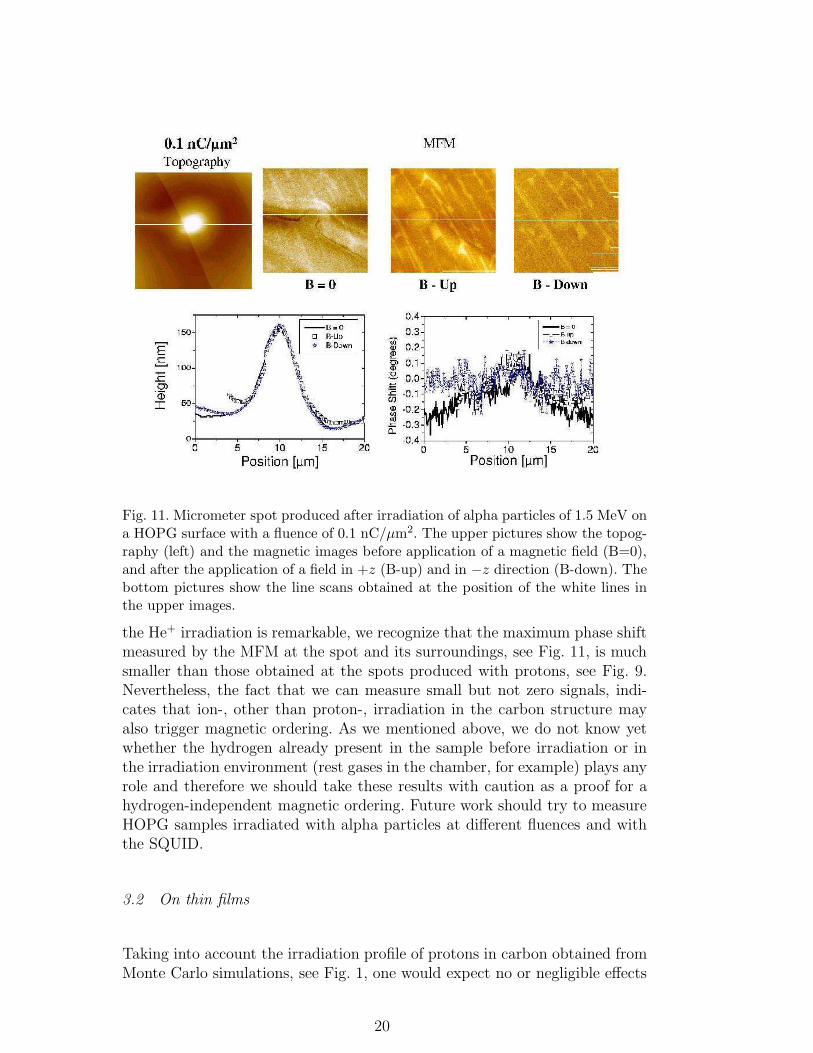
Fig. 11. Micrometer spot produced after irradiation of alpha particles of 1.5 MeV ona HOPG surface with a fluence of 0.1 nC/µm2. The upper pictures show the topog-raphy (left) and the magnetic images before application of a magnetic field (B=0),and after the application of a field in +z (B-up) and in −z direction (B-down). Thebottom pictures show the line scans obtained at the position of the white lines inthe upper images.
the He+ irradiation is remarkable, we recognize that the maximum phase shiftmeasured by the MFM at the spot and its surroundings, see Fig. 11, is muchsmaller than those obtained at the spots produced with protons, see Fig. 9.Nevertheless, the fact that we can measure small but not zero signals, indi-cates that ion-, other than proton-, irradiation in the carbon structure mayalso trigger magnetic ordering. As we mentioned above, we do not know yetwhether the hydrogen already present in the sample before irradiation or inthe irradiation environment (rest gases in the chamber, for example) plays anyrole and therefore we should take these results with caution as a proof for ahydrogen-independent magnetic ordering. Future work should try to measureHOPG samples irradiated with alpha particles at different fluences and withthe SQUID.
3.2 On thin films
Taking into account the irradiation profile of protons in carbon obtained fromMonte Carlo simulations, see Fig. 1, one would expect no or negligible effects
20
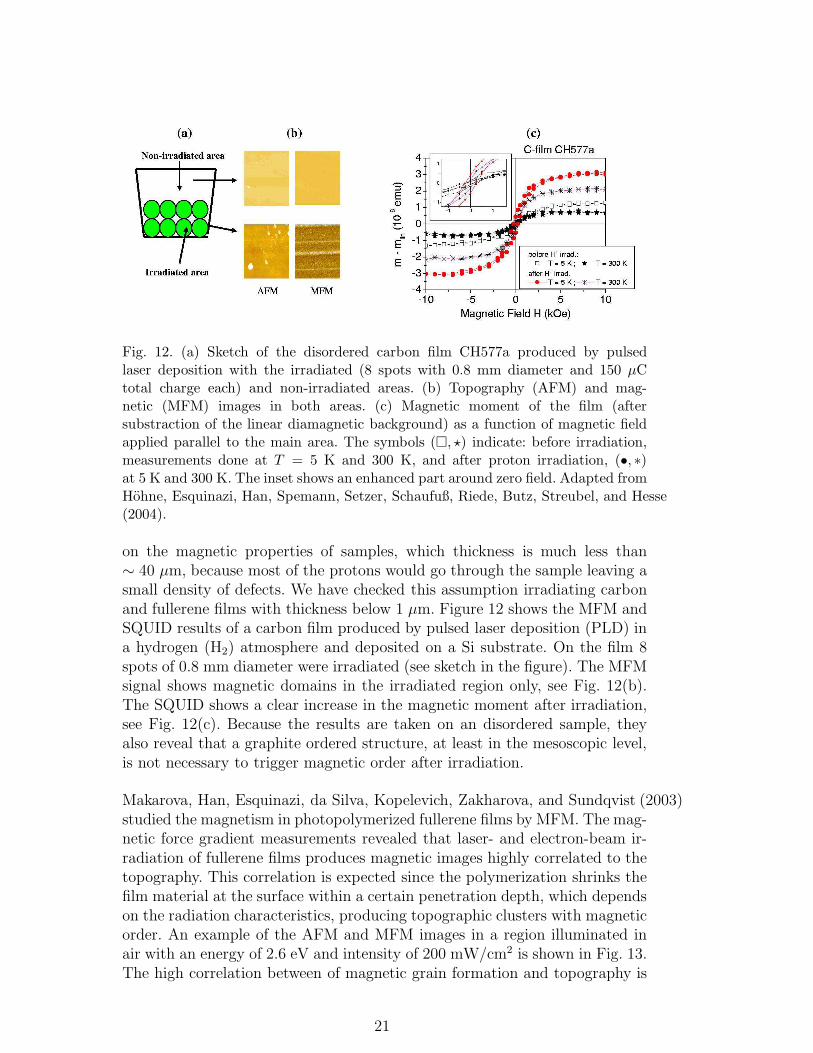
Fig. 12. (a) Sketch of the disordered carbon film CH577a produced by pulsedlaser deposition with the irradiated (8 spots with 0.8 mm diameter and 150 µCtotal charge each) and non-irradiated areas. (b) Topography (AFM) and mag-netic (MFM) images in both areas. (c) Magnetic moment of the film (aftersubstraction of the linear diamagnetic background) as a function of magnetic fieldapplied parallel to the main area. The symbols (�, ⋆) indicate: before irradiation,measurements done at T = 5 K and 300 K, and after proton irradiation, (•, ∗)at 5 K and 300 K. The inset shows an enhanced part around zero field. Adapted fromHohne, Esquinazi, Han, Spemann, Setzer, Schaufuß, Riede, Butz, Streubel, and Hesse(2004).
on the magnetic properties of samples, which thickness is much less than∼ 40 µm, because most of the protons would go through the sample leaving asmall density of defects. We have checked this assumption irradiating carbonand fullerene films with thickness below 1 µm. Figure 12 shows the MFM andSQUID results of a carbon film produced by pulsed laser deposition (PLD) ina hydrogen (H2) atmosphere and deposited on a Si substrate. On the film 8spots of 0.8 mm diameter were irradiated (see sketch in the figure). The MFMsignal shows magnetic domains in the irradiated region only, see Fig. 12(b).The SQUID shows a clear increase in the magnetic moment after irradiation,see Fig. 12(c). Because the results are taken on an disordered sample, theyalso reveal that a graphite ordered structure, at least in the mesoscopic level,is not necessary to trigger magnetic order after irradiation.
Makarova, Han, Esquinazi, da Silva, Kopelevich, Zakharova, and Sundqvist (2003)studied the magnetism in photopolymerized fullerene films by MFM. The mag-netic force gradient measurements revealed that laser- and electron-beam ir-radiation of fullerene films produces magnetic images highly correlated to thetopography. This correlation is expected since the polymerization shrinks thefilm material at the surface within a certain penetration depth, which dependson the radiation characteristics, producing topographic clusters with magneticorder. An example of the AFM and MFM images in a region illuminated inair with an energy of 2.6 eV and intensity of 200 mW/cm2 is shown in Fig. 13.The high correlation between of magnetic grain formation and topography is
21
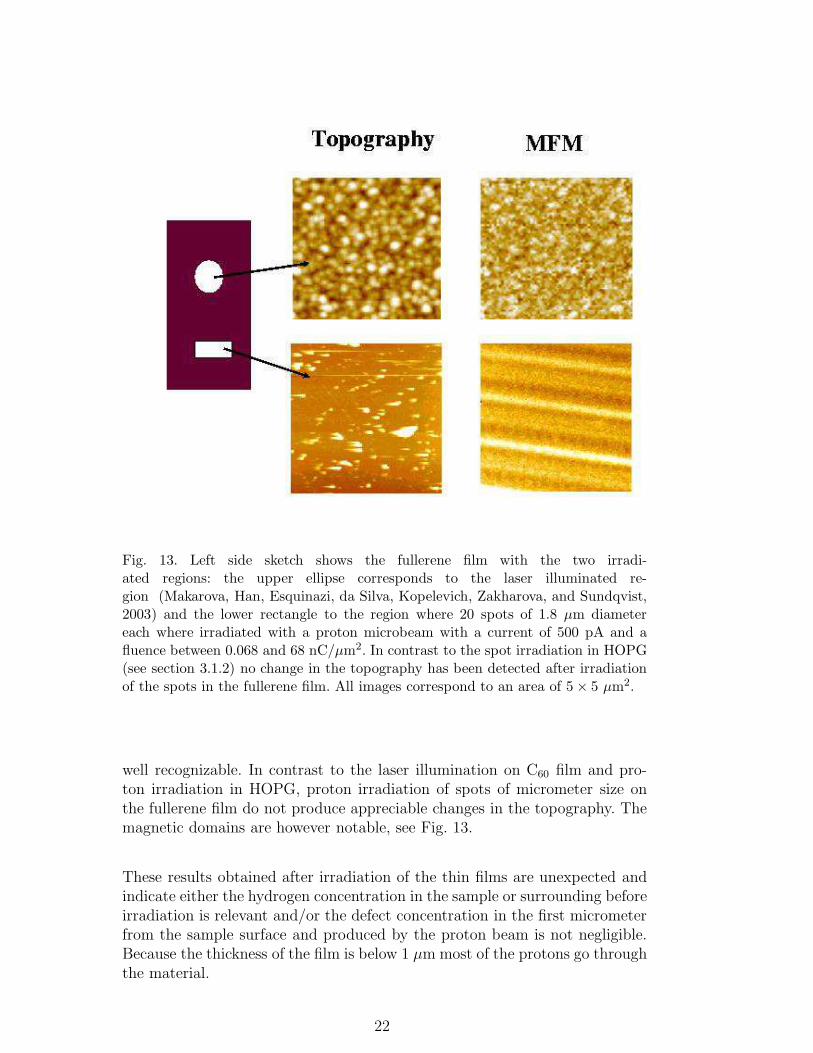
Fig. 13. Left side sketch shows the fullerene film with the two irradi-ated regions: the upper ellipse corresponds to the laser illuminated re-gion (Makarova, Han, Esquinazi, da Silva, Kopelevich, Zakharova, and Sundqvist,2003) and the lower rectangle to the region where 20 spots of 1.8 µm diametereach where irradiated with a proton microbeam with a current of 500 pA and afluence between 0.068 and 68 nC/µm2. In contrast to the spot irradiation in HOPG(see section 3.1.2) no change in the topography has been detected after irradiationof the spots in the fullerene film. All images correspond to an area of 5 × 5 µm2.
well recognizable. In contrast to the laser illumination on C60 film and pro-ton irradiation in HOPG, proton irradiation of spots of micrometer size onthe fullerene film do not produce appreciable changes in the topography. Themagnetic domains are however notable, see Fig. 13.
These results obtained after irradiation of the thin films are unexpected andindicate either the hydrogen concentration in the sample or surrounding beforeirradiation is relevant and/or the defect concentration in the first micrometerfrom the sample surface and produced by the proton beam is not negligible.Because the thickness of the film is below 1 µm most of the protons go throughthe material.
22
4 Annealing and Aging Effects
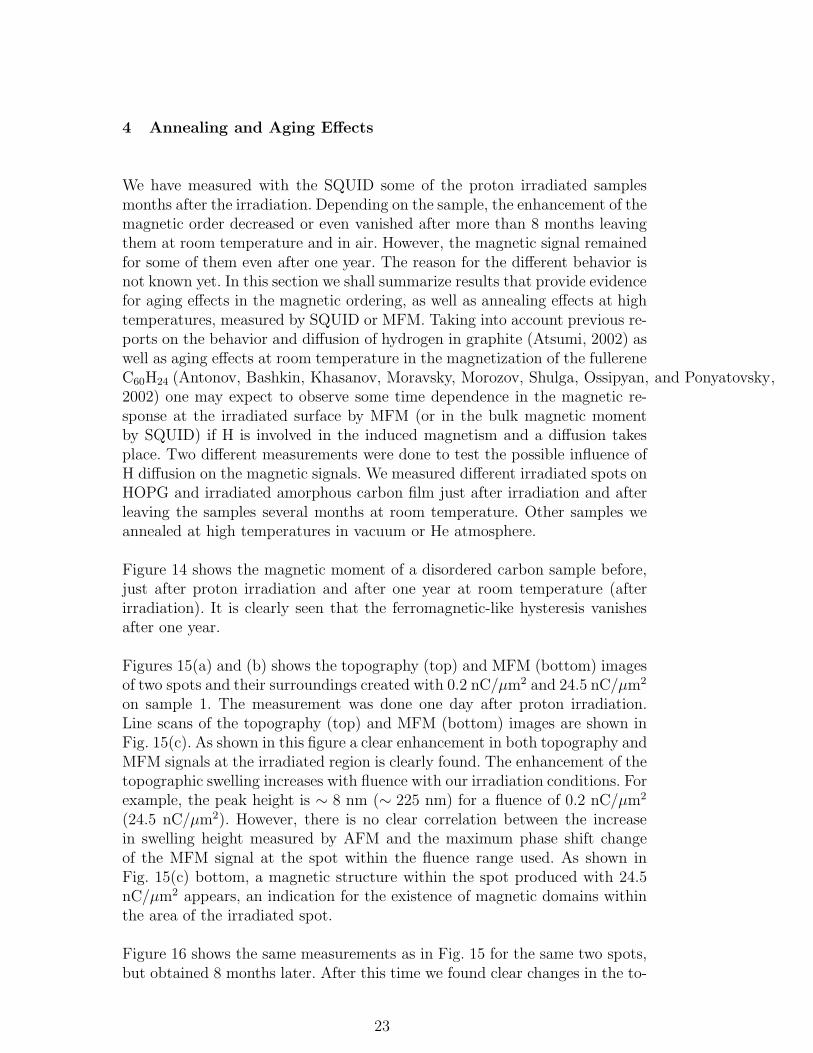
We have measured with the SQUID some of the proton irradiated samplesmonths after the irradiation. Depending on the sample, the enhancement of themagnetic order decreased or even vanished after more than 8 months leavingthem at room temperature and in air. However, the magnetic signal remainedfor some of them even after one year. The reason for the different behavior isnot known yet. In this section we shall summarize results that provide evidencefor aging effects in the magnetic ordering, as well as annealing effects at hightemperatures, measured by SQUID or MFM. Taking into account previous re-ports on the behavior and diffusion of hydrogen in graphite (Atsumi, 2002) aswell as aging effects at room temperature in the magnetization of the fullereneC60H24 (Antonov, Bashkin, Khasanov, Moravsky, Morozov, Shulga, Ossipyan, and Ponyatovsky,2002) one may expect to observe some time dependence in the magnetic re-sponse at the irradiated surface by MFM (or in the bulk magnetic momentby SQUID) if H is involved in the induced magnetism and a diffusion takesplace. Two different measurements were done to test the possible influence ofH diffusion on the magnetic signals. We measured different irradiated spots onHOPG and irradiated amorphous carbon film just after irradiation and afterleaving the samples several months at room temperature. Other samples weannealed at high temperatures in vacuum or He atmosphere.
Figure 14 shows the magnetic moment of a disordered carbon sample before,just after proton irradiation and after one year at room temperature (afterirradiation). It is clearly seen that the ferromagnetic-like hysteresis vanishesafter one year.
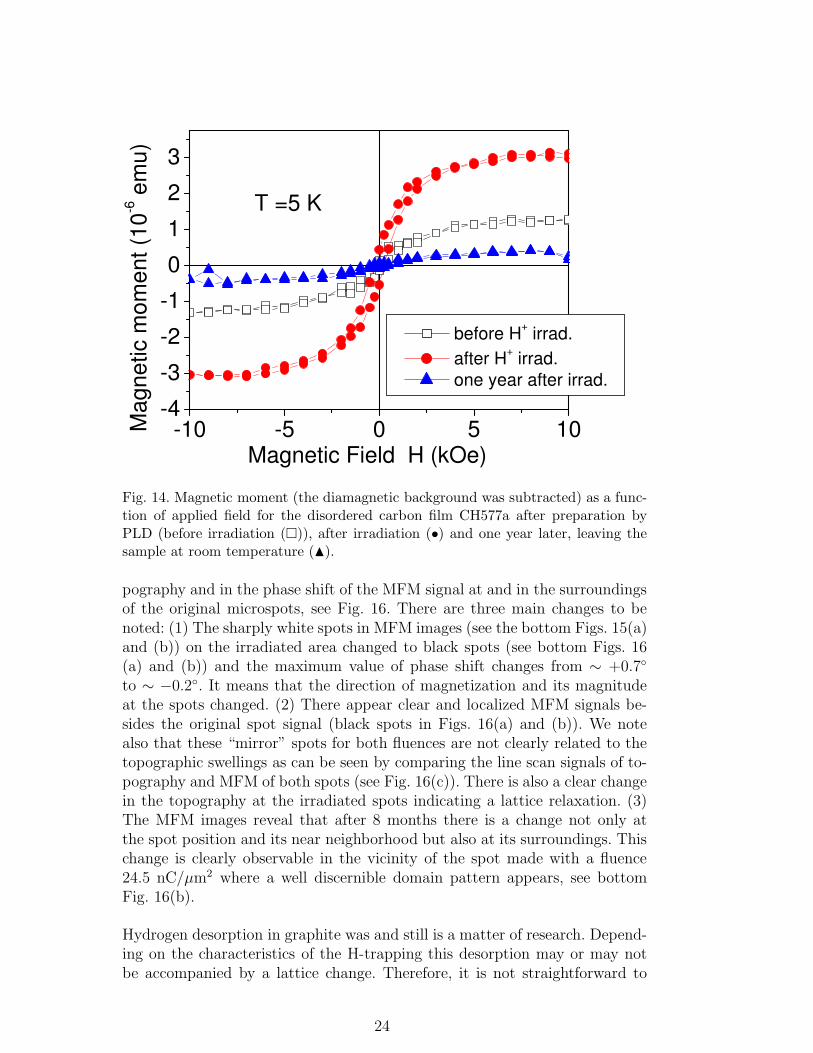
Figures 15(a) and (b) shows the topography (top) and MFM (bottom) imagesof two spots and their surroundings created with 0.2 nC/µm2 and 24.5 nC/µm2
on sample 1. The measurement was done one day after proton irradiation.Line scans of the topography (top) and MFM (bottom) images are shown inFig. 15(c). As shown in this figure a clear enhancement in both topography andMFM signals at the irradiated region is clearly found. The enhancement of thetopographic swelling increases with fluence with our irradiation conditions. Forexample, the peak height is ∼ 8 nm (∼ 225 nm) for a fluence of 0.2 nC/µm2
(24.5 nC/µm2). However, there is no clear correlation between the increasein swelling height measured by AFM and the maximum phase shift changeof the MFM signal at the spot within the fluence range used. As shown inFig. 15(c) bottom, a magnetic structure within the spot produced with 24.5nC/µm2 appears, an indication for the existence of magnetic domains withinthe area of the irradiated spot.
Figure 16 shows the same measurements as in Fig. 15 for the same two spots,but obtained 8 months later. After this time we found clear changes in the to-
23
-10 -5 0 5 10-4
-3
-2
-1
0
1
2
3
T =5 K
before H+ irrad.
after H+ irrad.
one year after irrad.
Ma
gn
etic m
om
en
t (1
0-6 e
mu
)
Magnetic Field H (kOe)
Fig. 14. Magnetic moment (the diamagnetic background was subtracted) as a func-tion of applied field for the disordered carbon film CH577a after preparation byPLD (before irradiation (�)), after irradiation (•) and one year later, leaving thesample at room temperature (N).
pography and in the phase shift of the MFM signal at and in the surroundingsof the original microspots, see Fig. 16. There are three main changes to benoted: (1) The sharply white spots in MFM images (see the bottom Figs. 15(a)and (b)) on the irradiated area changed to black spots (see bottom Figs. 16(a) and (b)) and the maximum value of phase shift changes from ∼ +0.7◦
to ∼ −0.2◦. It means that the direction of magnetization and its magnitudeat the spots changed. (2) There appear clear and localized MFM signals be-sides the original spot signal (black spots in Figs. 16(a) and (b)). We notealso that these “mirror” spots for both fluences are not clearly related to thetopographic swellings as can be seen by comparing the line scan signals of to-pography and MFM of both spots (see Fig. 16(c)). There is also a clear changein the topography at the irradiated spots indicating a lattice relaxation. (3)The MFM images reveal that after 8 months there is a change not only atthe spot position and its near neighborhood but also at its surroundings. Thischange is clearly observable in the vicinity of the spot made with a fluence24.5 nC/µm2 where a well discernible domain pattern appears, see bottomFig. 16(b).
Hydrogen desorption in graphite was and still is a matter of research. Depend-ing on the characteristics of the H-trapping this desorption may or may notbe accompanied by a lattice change. Therefore, it is not straightforward to
24
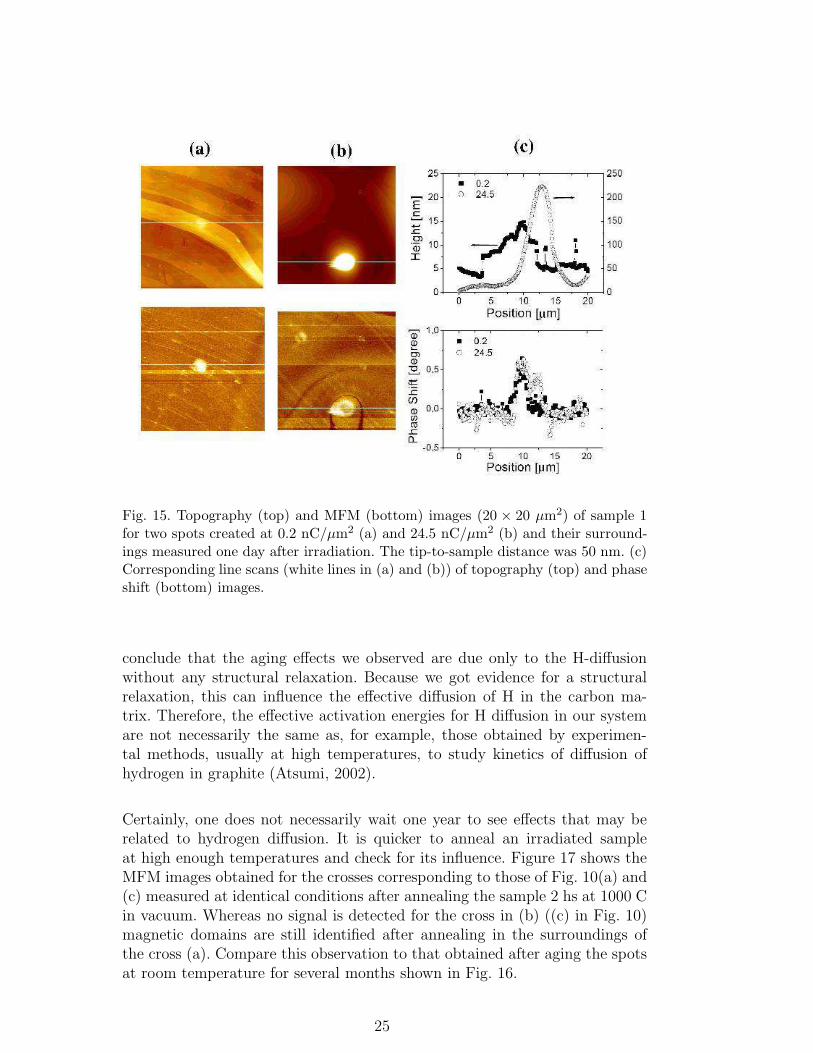
Fig. 15. Topography (top) and MFM (bottom) images (20 × 20 µm2) of sample 1for two spots created at 0.2 nC/µm2 (a) and 24.5 nC/µm2 (b) and their surround-ings measured one day after irradiation. The tip-to-sample distance was 50 nm. (c)Corresponding line scans (white lines in (a) and (b)) of topography (top) and phaseshift (bottom) images.
conclude that the aging effects we observed are due only to the H-diffusionwithout any structural relaxation. Because we got evidence for a structuralrelaxation, this can influence the effective diffusion of H in the carbon ma-trix. Therefore, the effective activation energies for H diffusion in our systemare not necessarily the same as, for example, those obtained by experimen-tal methods, usually at high temperatures, to study kinetics of diffusion ofhydrogen in graphite (Atsumi, 2002).
Certainly, one does not necessarily wait one year to see effects that may berelated to hydrogen diffusion. It is quicker to anneal an irradiated sampleat high enough temperatures and check for its influence. Figure 17 shows theMFM images obtained for the crosses corresponding to those of Fig. 10(a) and(c) measured at identical conditions after annealing the sample 2 hs at 1000 Cin vacuum. Whereas no signal is detected for the cross in (b) ((c) in Fig. 10)magnetic domains are still identified after annealing in the surroundings ofthe cross (a). Compare this observation to that obtained after aging the spotsat room temperature for several months shown in Fig. 16.
25

Fig. 16. (a) and (b) Topography (top) and MFM (bottom) images (20 × 20 µm2)of the same spots of Fig. 15 and their surroundings measured after 8 months. Thetip-to-sample distance was 50 nm. (c) Corresponding line scans (white lines in (a)and (b)) of the topography (top) and phase shift (bottom) images.
Fig. 17. The figures (a) and (b) show magnetic images of the same crosses shown inFig. 10(a) and (c) measured under similar conditions with similar MFM tips afterannealing them in vacuum at 1000 C for 2 hs. Whereas the crosses are not anymorevisible in MFM, domain structure is still detected in (a).
26
5 Conclusion and Open Issues
In this chapter we have reviewed the main observations after proton irradi-ation of carbon structures. The main results indicate that proton irradiationcan trigger magnetic ordering in graphite. The results after proton irradiationleave no doubt that magnetic ordering exists in a carbon structure withoutthe influence of magnetic ions. Neither the total amount of magnetic impuri-ties is sufficient to account for the measured magnetization nor the creation ofmagnetic spots in the micrometer range with the proton micro-beam can beunderstood based on magnetic metal-ion impurity concentration below 1 ppmas the PIXE results indicate. The results obtained up today do indicate thatdifferent parameters and sample states may play a role in determining thestrength of the induced magnetic ordering. Broad irradiation (i.e. with a pro-ton beam of large diameter) appears to be less effective. The reason for thisbehavior will be studied in the future, but we speculate that it may be dueto the produced defect density. Further experimental characterization (usingthe broad spectrum of methods in magnetism research) and sample prepara-tion studies are necessary to understand and stabilize the magnetic orderingfound in carbon structures. The following issues should be clarified in the nearfuture:
(1) The role of H-atoms, implanted by irradiation as well as those already inthe sample.
(2) The contribution to the magnetic order from lattice defects produced byirradiation and their possible influence as H-trapping centers.
(3) Dependence of the magnetic order on the induced type of defect.(4) The maximum achievable saturation magnetization in carbon structures.(5) The range of Curie temperature.(6) Influence of the ion current, fluence and energy of the irradiated particle
on the magnetic order.(7) Influence of sample temperature.(8) Influence of the irradiation angle with respect to the crystallographic
c-axis of graphite.(9) Influence of ion irradiation (other than proton) on the magnetism of
carbon structures.(10) The effective magnetic moment of magnetic impurities in graphite as well
as in disordered carbon structures.
An answer to part of these open questions will take several years of research.
Summarizing briefly recently published theoretical work, which is correlatedto the influence of hydrogen in carbon magnetism we note that:
(1) Hydrogenated nanographite can have a spontaneous magnetization due to
27

different numbers of mono- and dihydrogenated carbon atoms (Kusakabe and Maruyama,2003). Theoretical work using local-spin-density approximation calcu-lates the spin polarization of the graphite bands when different atomsas hydrogen, fluor or oxygen are added on a graphene layer and predictsmagnetic ordering with fully or partially spin-polarized flat band, uponthe added atom (Maruyama and Kusakabe, 2004). Theoretical simula-tions indicate that a magnetic ordered state should be easier to achievewith a mixture of carbon-hydrogen bonds than fluorinated nanographite(Maruyama, Kusakabe, Tsuneyuki, Akagi, Yoshimoto, and Yamauchi, 2004).Although the calculations were done attaching the hydrogen at the car-bon atoms at the edges of a graphene layer, one may speculate thathydrogen can trigger the sp2-sp3 unbalance promoting magnetic orderingin different carbon structures.
(2) Recently published work indicates that hydrogen modifies substantiallythe electronic structure of graphite around it. According to STM/AFMmeasurements (Ruffieux, Groning, Schwaller, Schlapbach, and Groning, 2000)a single H-atom interacting with a graphite surface modifies the electronicstructure over a distance of 20 to 25 lattice constants.
(3) Muon spin rotation/relaxation experiments (Chakhalian, Kiefl, Dunsiger, MacFarlane, Miller, Sonier,2002) indicate that a positive muon in graphite triggers a local magneticmoment around it. Recently published theoretical work (Duplock, Scheffler, and Lindan,2004) supports this conclusion. It also indicates that upon the type of de-fect in a graphene layer, hydrogen may not trigger any magnetic ordering.
(4) The magnetic moment and diffusion of adatom defects in a graphite sheetwere studied by Lehtinen, Foster, Ayuela, Krasheninnikov, Nordlund, and Nieminen(2003). The results of a full spin-polarized density functional theory in-dicate that these defects may have a magnetic moment of about 0.5 µB.The calculations of Lehtinen, Foster, Ma, Krasheninnikov, and Nieminen(2004) indicate that if an hydrogen encounters an empty vacancy, then itcompensates the dangling bond and the magnetic moment of the vacancyvanishes. However, if a vacancy is saturated by an hydrogen atom, a sec-ond hydrogen atom will bond to the other side of the vacancy having amagnetic moment of 1.2 µB localized on the dangling sp2 bond.
(5) New theoretical and experimental work (Chan, Montanari, Gale, Bennington, Taylor, and Harrison2004) suggests that hydrogen may play also an important role on themagnetic ordering found in fullerenes.
Acknowledgements
This research is supported by the Deutsche Forschungsgemeinschaft underDFG ES 86/11-1.
28
References
Abe, H., Naramoto, H., Iwase, A., Kinoshita, C., 1997. Effect of damage cascadeson the irradiation-induced amorphization in graphite. Nuclear Instruments andMethods in Physics Research B 127/128, 681–684.
Antonov, V. E., Bashkin, I. O., Khasanov, S. S., Moravsky, A. P., Morozov, Y. G.,Shulga, Y. M., Ossipyan, Y. A., Ponyatovsky, E. G., 2002. Magnetic ordering inhydrofullerite C60H24. J. of Alloys and Compounds 330-332, 365–368.
Atsumi, H., 2002. Hydrogen bulk retention in graphite and kinetics of diffusion.Journal of Nuclear materials 307-311, 1466–1470.
Banhart, F., 1999. Irradiation effects in carbon nanostructures. Rep. Prog. Phys.62, 1181–1221.
Butz, T., Spemann, D., Han, K.-H., Hohne, R., Setzer, A., Esquinazi, P., 2005. Therole of nuclear nanoprobes in inducing magnetic ordering in graphite. HyperfineInteractions (in press) .
Chakhalian, J. A., Kiefl, R. F., Dunsiger, S. R., MacFarlane, W. A., Miller, R.,Sonier, J. E., Fischer, J. E., 2002. Evidence for local moment formation arounda positive muon in graphite. Phys. Rev. B 66, 155107–1–8.
Chan, J. A., Montanari, B., Gale, J. D., Bennington, S. M., Taylor, J. W., Harrison,N. M., 2004. Magnetic properties of polymerized C60: The influence of defects andhydrogen. Phys. Rev. B 70, 041403(R)–1–4.
Duplock, E. J., Scheffler, M., Lindan, P. J. D., 2004. Hallmark of perfect graphite.Phys. Rev. Lett. 92, 225502–1–4.
Esquinazi, P., Han, K.-H., Hohne, R., Spemann, D., Setzer, A., Butz, T., 2005.Examples of room-temperature magnetic ordering in carbon-based structures.Phase Transitions 78, 155–168.
Esquinazi, P., Setzer, A., Hohne, R., Semmelhack, C., Kopelevich, Y., Spemann, D.,Butz, T., Kohlstrunk, B., Losche, M., 2002. Ferromagnetism in oriented graphitesamples. Phys. Rev. B 66, 024429–1–10.
Esquinazi, P., Spemann, D., Hohne, R., Setzer, A., Han, K.-H., Butz, T., 2003.Induced magnetic ordering by proton irradiation in graphite. Phys. Rev. Lett.91, 227201–1–4.
Estrade-Szwarckopf, H., 2004. XPS photoemission in carbonaceous materials: A“defect” peak beside the graphitic asymmetric peak. Carbon 42, 1713–1721.
Fujita, M., Wakabayashi, K., Nakada, K., Kusakabe, K., 1996. Peculiar localizedstate at zigzag graphite edge. J. Phys. Soc. Jpn. 65, 1920–1923.
Gonzalez, J., Guinea, F., Vozmediano, M. A. H., 2001. Electron-electron interactionsin graphene sheets. Phys. Rev. B 63, 134421–1–8.
Han, K.-H., Esquinazi, P., 2004. Quantitative determination of the magnetizationof proton irradiated spots in graphite with magnetic force microscopy. J. Appl.Phys. 96, 1581–1584.
Han, K.-H., Spemann, D., Esquinazi, P., Hohne, R., Riede, V., Butz, T., 2003a.Ferromagnetic spots in graphite produced by proton irradiation. Adv. Mater. 15,1719–1722.
Han, K.-H., Spemann, D., Hohne, R., Setzer, A., Makarova, T., Esquinazi, P., Butz,T., 2003c. Addendum. Carbon 41, 2425.
Han, K.-H., Spemann, D., Hohne, R., Setzer, A., Makarova, T., Esquinazi, P., Butz,
29
T., 2003b. Observation of intrinsic magnetic domains in C60 polymer. Carbon 41,785–795.
Hohne, R., Esquinazi, P., Han, K.-H., Spemann, D., Setzer, A., Schaufuß, U., Riede,V., Butz, T., Streubel, P., Hesse, R., 2004. Ferromagnetic structures in graphiteand amorphous carbon films produced by high energy proton irradiation. In:Raabe, D. (Ed.), Proceedings of the 16. International Conference of Soft MagneticMaterials (ISBN 3-514-00711-X).
Kelly, B. T., 1981. Physics of Graphite. London: Applied Science Publishers.Koike, J., Pedraza, D. F., 1994. Dimensional changes in highly oriented pyrolytic
graphite due to electron-irradiation. J. Mater. Res. 9, 1899–1907.Kusakabe, K., Maruyama, M., 2003. Magnetic nanographite. Phys. Rev. B 67,
092406–1–4.Lehtinen, P. O., Foster, A. S., Ayuela, A., Krasheninnikov, A., Nordlund, K., Niem-
inen, R. M., 2003. Magnetic properties and diffusion of adatoms on a graphenesheet. Phys. Rev. Lett. 91, 017202–1–4.
Lehtinen, P. O., Foster, A. S., Ma, Y., Krasheninnikov, A., Nieminen, R. M., 2004.Irradiation-induced magnetism in graphite: a density-functional study. Phys. Rev.Lett. 93, 187202–1–4.
Lohau, J., Kirsch, S., Carl, A., Dumpich, G., Wassermann, E., 1999. Quantitativedetermination of effective dipole and monopole moments of magnetic force mi-croscopy tips. J. Appl. Phys. 86, 3410–3417.
Lohau, J., Kirsch, S., Carl, A., Wassermann, E., 2000. Quantitative determinationof the magnetization and stray field of a single domain Co/Pt dot with magneticforce microscopy. Appl. Phys. Lett. 76, 3094–3096.
Makarova, T., Han, K., Esquinazi, P., da Silva, R. R., Kopelevich, Y., Zakharova,I. B., Sundqvist, B., 2003. Magnetism in photopolymerized fullerenes. Carbon 41,1575–1584.
Makarova, T., 2003. Magnetism of carbon-based materials. Vol. 45 of Studies of HighTemperature Superconductors. NOVA Science Publishers, Inc., pp. 107–169.
Maruyama, M., Kusakabe, K., Tsuneyuki, S., Akagi, K., Yoshimoto, Y., Yamauchi,J., 2004. Magnetic properties of nanographite with modified zigzag edges. J. ofPhysics and Chemistry of Solids 65, 119–122.
Maruyama, M., Kusakabe, K., 2004. Theoretical prediction of synthesis methods tocreate magnetic nanographite. J. Phys. Soc. Jpn. 73, 656–663.
Murata, K., Ushijima, H., Ueda, H., Kawaguchi, K., 1991. Magnetic properties ofamorphous-like carbons prepared by tetraaza compounds by the chemical vapourdeposition (CVD) method. J. Chem. Soc., Chem. Commun. , 1265–6.
Murata, K., Ushijima, H., Ueda, H., Kawaguchi, K., 1992. A stable carbon-basedorganic magnet. J. Chem. Soc., Chem. Commun. , 567–569.
Muto, S., Tanabe, T., 1997. Damage process of electron irradiated graphite stud-ied by transmission electron microscopy: I. High resolution observation of highlygraphitized carbon fibre. Phil. Mag. A 76, 679–690.
Niwase, K., 1995. Irradiation-induced amorphization of graphite. Phys. Rev. B 52,15785–98.
Ovchinnikov, A. A., Shamovsky, I. L., 1991. The structure of ferromagnetic phaseof carbon. J. of Molecular Structure (Theochem) 251, 133–140.
Rousseau, B., Estrade-Szwarckopf, H., Thomann, A.-L., Brault, P., 2003. Stable C-
30
atom displacements on HOPG surface under plasma low-energy argon ion bom-bardment. Appl. Phys. A 77, 591–598.
Ruffieux, R., Groning, O., Schwaller, P., Schlapbach, L., Groning, P., 2000. Hydro-gen atoms cause long-range electronic effects on graphite. Phys. Rev. Lett. 84,4910–4914.
Schindler, K., Spemann, D., Ziese, M., Diaconu, M., Schmidt, H., Esquinazi, P.,Butz, T., 2005. Magnetic crosses produced with a proton microbeam on a graphitesurface. To be published .
Siegele, R., Roth, J., Scherzer, B. M. U., Pennycook, S. J., 1993. Damage anddeuterium trapping in highly-oriented pyrolytic graphite. J. Appl. Phys. 73, 2225–2233.
Spemann, D., Han, K.-H., Esquinazi, P., Hohne, R., Butz, T., 2004. Ferromagneticmicrostructures in highly oriented pyrolytic graphite created by high energy pro-ton irradiation. Nuclear Instruments and Methods in Physics Research B 219-220,886–890.
Spemann, D., Han, K.-H., Hohne, R., Makarova, T., Esquinazi, P., Butz, T., 2003.Evidence for intrinsic weak ferromagnetism in a C60 polymer by PIXE and MFM.Nuclear Instruments and Methods in Physics Research 210, 531–536.
Takeuchi, M., Muto, S., Tanabe, T., Arai, S., Kuroyanagi, T., 1997. Damage pro-cess of electron irradiated graphite studied by transmission electron microscopy:II. Analysis of extended energy-loss fine structure of highly oriented pyrolyticgraphite. Phil. Mag. A 76, 691–700.
Tanabe, T., 1996. Radiation damage of graphite - degradation of material parame-ters and defect structures. Phys. Scr. T64, 7–16.
Wang, T., Wang, W., Chen, B., 1992. The irradiation effect of MeV protons ondiamond-like carbon films. Nuclear Instruments and Methods in Physics ResearchB 71, 186–190.
Ziegler, J. F., 1977-1985. The stopping and range of ions in matter. Pergamon Press,New York.
31
Copyright © 2022 FDOKUMEN