Indonesia’s Toll-Road Infrastructure Finance Case Study of Jasa Marga and Its corporatization
23
Indonesia’s Toll-Road Infrastructure Finance Case Study of Jasa Marga and Its corporatization Dwi P Bhakti – LKY Fellow 1 Presented to Risk Management Class guided by Prof. Akash Deep (Kennedy School of Government – Harvard) Abstract The Indonesian toll road is not new. It started in 1978 with launched theJagorawiTol road continued by several toll sections in the following years. The industry faced common issues as elsewhere, including inefficiency, high level risks due to highly leverage of liabilities and investment environment. JasaMarga, the Indonesian state owned enterprise, which operated toll road almost the last three decades. By far, the company has successfully managed almost 13 toll sections, which spread in all Indonesian provinces. Some emerging cities around Indonesia have forced the company to serve a higher demand for toll roads. The main problem faced by the company is that the highly leverages has led the difficulties to add the additional borrowing. The lack of capacity borrowing has reinforced the company to seek an alternative new financing. The Initial Public Offering is widely recognized to deliberate the company from their handicap. Background The Asian financial crisis in 1997 left Indonesia with huge economical, political and social consequences. Right after the 1 Paper dedicated and presented to Class of Advanced Risk Management supervised by Professor Akash Deep, Kennedy School Government, Harvard, in Falls 2007. Indonesian Infrastructure Finance - 1 - Presented for API-148
-
Upload
perbanasinstitute -
Category
Documents
-
view
2 -
download
0
Transcript of Indonesia’s Toll-Road Infrastructure Finance Case Study of Jasa Marga and Its corporatization
Indonesia’s Toll-Road InfrastructureFinance
Case Study of Jasa Marga and Itscorporatization
Dwi P Bhakti – LKY Fellow1
Presented to Risk Management Class guided by Prof. AkashDeep (Kennedy School of Government – Harvard)
AbstractThe Indonesian toll road is not new. It started in 1978 with launched theJagorawiTol
road continued by several toll sections in the following years. The industry faced
common issues as elsewhere, including inefficiency, high level risks due to highly
leverage of liabilities and investment environment. JasaMarga, the Indonesian state
owned enterprise, which operated toll road almost the last three decades. By far, the
company has successfully managed almost 13 toll sections, which spread in all
Indonesian provinces. Some emerging cities around Indonesia have forced the
company to serve a higher demand for toll roads. The main problem faced by the
company is that the highly leverages has led the difficulties to add the additional
borrowing. The lack of capacity borrowing has reinforced the company to seek an
alternative new financing. The Initial Public Offering is widely recognized to deliberate
the company from their handicap.
BackgroundThe Asian financial crisis in 1997 left Indonesia with huge
economical, political and social consequences. Right after the
1 Paper dedicated and presented to Class of Advanced Risk Management supervised by Professor Akash Deep, Kennedy School Government, Harvard,in Falls 2007.Indonesian Infrastructure Finance - 1 - Presented for API-148

crisis, the country sustained a minus growth rate (-13,72% in
1998) with more than 4,4 million people unemployed. The
Indonesian government had no choice but turning to IMF for a
bailout package of 43 billion US$, which also demanded a thorough
restructuring the country’s economy, including liberalization of
transportation sector 2(Exhibit 1)
The Indonesian Toll-Road, is facing common issues of
efficiency, high level of risks due to liabilities burden and
investment environment uncertainties. JasaMarga, The Indonesian’s
toll-road state owned company – for several past decades being
the national pride, was also plagued by corruption scandals, bidding
collusion and rent seeking. Almost all corruption cases were related
to the family members of the former President Suharto.3 The
severe economic conditions of the country after the financial
crisis, coupled with internal problems of inefficiency dictated
the needs for a thorough institutional change with regard to the
state governance over the transportation sector, as well as
JasaMargainternal restructuring.
The toll-road in Indonesia is not new. The first toll road
embarked operating in 1978. This toll road was built by
government mostly used G to G loan. To manage and operate the
toll-road, PT JasaMarga (Persero), a state owned company, was
established. By now, almost 600 KM of Toll Road are operated in
Indonesia, mostly in 7 biggest city including Jakarta, Surabaya,
Semarang, Medan, Bandung, Jogya-Solo and Makassar. Most of Toll2Washington Post Indonesia Special Report. Available athttp://www.washingtonpost.com/wp-srv/inatl/longterm/indonesia/timeline.htm Last accessed February 10, 2007. 3Jakarta Post, Wednesday, December 3, 2003. Available athttp://www.indonesia-house.org/focus/corruption/2003/12/120303House_form_team_27_to_monitor_Pertamina.htm Last accessed 10 of February, 2007. Indonesian Infrastructure Finance - 2 - Presented for API-148

road or nearby 370 KM operated by JasaMarga and 230 KM by
Private investor.
Under such circumstances, the government has initiated to
corporatize JasaMarga through Initial Public Offering in the capital market. The
company will release 30% of government ownership which previously
had 100% ownership. According to latest report, the company will
sell 2,040 billion shares with nominal IDR500 or equivalent to
US$114 million (in terms of IDR9,000/US$).4 As of June 2007,
Jasamarga recorded an gross revenue amounted to $US129 millions
or rising 5.2% compared to previous year. While Net Income after
tax has increased to 65,6% or becomes IDR72.6 billions or
equivalent to US$8.1 million.
Scope of Objective and the Study
This proposal attempts to figure out JasaMarga’s as the
front liner Indonesia’s State Owned Enterprises associated with
its corporatization into capital market. The main reason for
JasaMarga’s privatization is various, including government’s
commitment to serve toll-road which connect two big cities -
Jakarta-Surabaya, development toll-road in out of Java and
establishment Jakarta Outer Ring Road (JORR). The latter project
associated with problem faced by JakartaCity, most notably
traffic jam. JORR is widely believed as the best solution to
overcome “ a huge parking in the toll-road during busiest hour”-
addressed to Jakarta transportation problem. By these corporate4 Great Appreciate to my Colleague , Edwin Syahruzat who contributed for the paper which focus on the Toll Road Project in Indonesia. Computation in this paper using Add in from Excel Program for FinancialStatement Projection and Eview Software for Time Series ModellingIndonesian Infrastructure Finance - 3 - Presented for API-148

action, Jasamarga tries to empower capital structure in respect to company’s
working capital. Due to the fact that, the company are engaging
in several project, including JORR (Jakarta Outer Ring Road).
Armed with the analysis of company as the state owned
enterprise for more than 20 years, the paper try to figure out
valuation the company, which imply to share price for Company’s
Initial Public Offering. The study is primarily based on Discounted Cash
Flow approach to count the project and company valuation and cope with
company’s capital structure as wells country risk factor.
Another factor for the company’s IPO is that for the last
decades Jakarta Stock Exchange with respect to Toll Road Industry
only determined by a single player, namely PT. CiptaMarga Nusa
Pala (CMNP). The latter company refers to a former President
Soeharto’s daughter who operated Toll Road in down town of
Jakarta. The company’s IPO is expected to bolster market capitalization of
Jakarta Stock Exchange Market, to improve such an industry to be more
competitive as well as “breakthrough” in raising fund for the project.
Industry DriversThe Indonesian toll road is primarily depends on various factors,
so called key driver, including :
A large number of vehicles, associated with the litigation
that the existing of highway was inadequate to serve and
imply to higher an accident.
Traffic jam, has embodied with Jakarta and other capital
city, especially in the busy hours.
Indonesian Infrastructure Finance - 4 - Presented for API-148

Accessabilty to economic growth pole, that refers to
emerging city that developed around Jakarta, such Cirebon
and Banten.
Foreign loan, which connect with a large number of toll-
road infrastructure development project. Over the last
decades, the government was primarily depend on foreign loan
to finance the toll infrastructure.
Government Regulation, which largely determine investor’s
willingness to invest in the domestic market.
Toll Tariff, correlated with situation where investor
analyze to comes in. However, in most cases, regardless of
whether price unchanged, foreign investor remains high.
The two other drivers which has largely affected toll-road
infrastructure in Indonesia are national currency and
interest rate during construction. The main reason for national
currency as the driver is that he currency has mainly determined
raw materials of toll-road, so either its volatility or
stability affect investor’s preference. The reason for interest
during construction as a key driver is that the investor are
looking for a minimum interest rate or otherwise stack in another
sector. That is why, from 19 toll-road section offered by the
government, remains two toll road with respect to a small
traffic and highly risk of toll-road due to counter of highway.
Over the last two decades jasamarga has figure out the
Indonesian economy through a remarkable of issuance Bonds. Since
1983 Jasamarga engaged in the bonds market and had successfully
raised to total amount of IDR1.9 Trillion. The main reason for
embedding the company with a remarkable story is that Jasamarga
Indonesian Infrastructure Finance - 5 - Presented for API-148

has verified its capacity to borrow and never been in default on
its borrowings. This candid story could not been achieved even by
its competitor, Citra MargaNusaphalaPersada (CMNP), which had a
privilege during Soeharto Era. To illustrate this, during the
economy crises the company was reinforced to restructure its
bonds.
As of December 2006, the total debt outstanding was IDR2.63
trillion consisting of commercial bank loans, bonds and two steps
loan from the government. This amount translates into a net
gearing ratio of 126%. Currently, JasaMarga’s debt/equity ratio
already reached 3.4 x and the interest coverage ratio 1.6x (on a
gross interest basis). Given that fact, JasaMarga’s capacity to
raise funds is almost exhausted. Therefore, JasaMarga needs to
raise capital through Initial Public Offering to increase its
borrowing capacity, especially cope with the three new project in
coming years.
In the early stages of the industry, toll road development
was supported by government funding. Two steps loan from
international bodies such as Worldbank and ADB came later to
support toll-road as an alternative funding to pure government
funding.
JasaMarga has a long history in the toll road project in
Indonesia since 1978. Several candid stories embedded with
JasaMarga including major player in this field which stack on 75%
ownership, a good relation with government especially in
regulatory body and has superberb technical know-how in toll
road construction.
The bonds covenant requires that the debt/equity ratio
should not exceed The tenor of the issued bonds spans between
Indonesian Infrastructure Finance - 6 - Presented for API-148
5-12 years privilege including tax pre-emptive, soft loan and
any good reward from the government. There have been long
standing question on how the company can work together with
CMNP, a private company as operator of Toll-road. The main
reason for this collaboration is that CMNP belongs to a former
president Soeharto’s daughter had several benefited as either
special vehicle or long-arm of incumbent power.
In a crisis time, the company had seriously detected by
problems such as affordability of debt repayment, restructuring
company refer to downsizing and regulation that seemed odds.
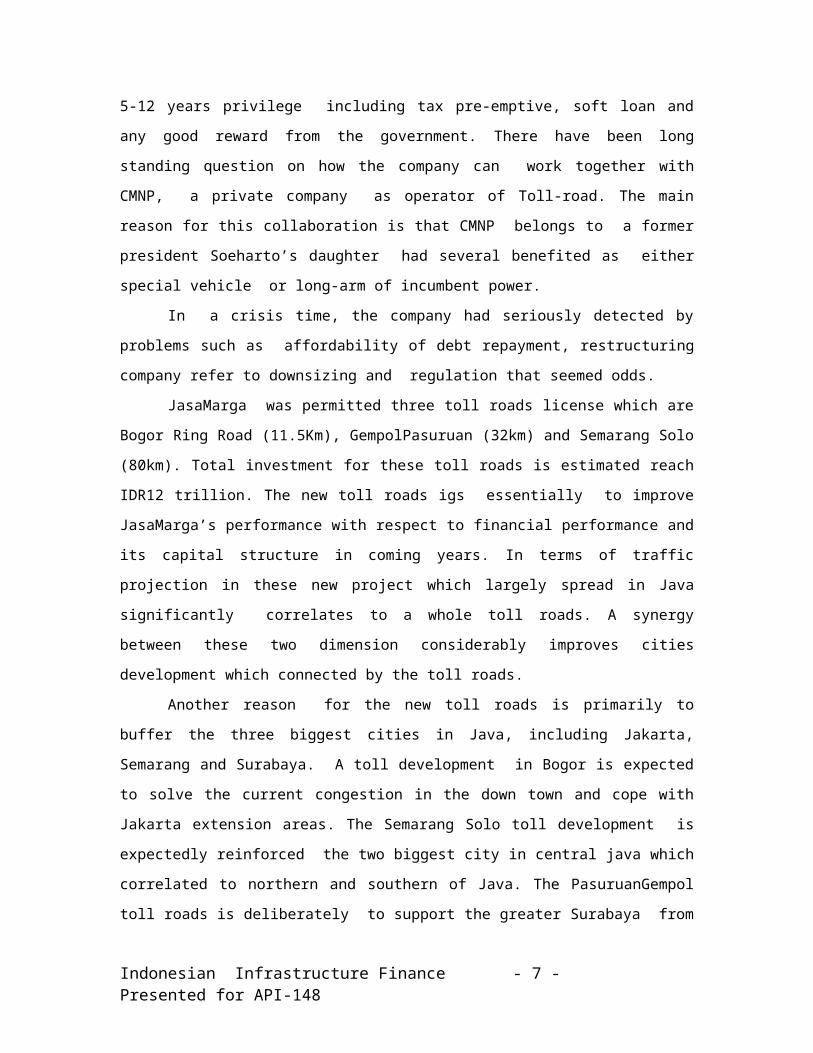
JasaMarga was permitted three toll roads license which are
Bogor Ring Road (11.5Km), GempolPasuruan (32km) and Semarang Solo
(80km). Total investment for these toll roads is estimated reach
IDR12 trillion. The new toll roads igs essentially to improve
JasaMarga’s performance with respect to financial performance and
its capital structure in coming years. In terms of traffic
projection in these new project which largely spread in Java
significantly correlates to a whole toll roads. A synergy
between these two dimension considerably improves cities
development which connected by the toll roads.
Another reason for the new toll roads is primarily to
buffer the three biggest cities in Java, including Jakarta,
Semarang and Surabaya. A toll development in Bogor is expected
to solve the current congestion in the down town and cope with
Jakarta extension areas. The Semarang Solo toll development is
expectedly reinforced the two biggest city in central java which
correlated to northern and southern of Java. The PasuruanGempol
toll roads is deliberately to support the greater Surabaya from
Indonesian Infrastructure Finance - 7 - Presented for API-148

the most congested in eastern java and come up with accelerating
behind the city.
Most Factors Affecting Project
Basically the government intends to build amount to 1,600
Km of toll roads across Java and some part in other province
such Medan and Makassar. The total investment for those
project would be around IDR90 trillion. These would provide
opportunity for investor that are interested in the toll road
business in Indonesia.
For the last 5 years, a decentralization associated with a
greater portion of local government in share with central
government, has implied local development more robust. To
illustrate, most regional provinces have successfully a bigger
share with respect to dividend from industry such oil and gas,
natural resources and other revenues coming from economic
activities. The overall development should carry the regional
development to be more active especially in the toll road
project which has proven multiplier effect to the whole economy.
Technically, there are three main components of a newly developed
toll road, namely construction, land clearing and financial cost
which have 72% of total cost development.
The main contribution for Jasa Marga’s revenue mainly from
JTR (Jakarta Inner Toll road), Jagorawi (Jakarta – Bogor),
Jakarta Cikampek and Jakarta Tangerang. These sections contribution
reach 80% of total revenue. By far, Jakarta has the highest
traffic in Indonesia with most congestion during the day. Given
Indonesian Infrastructure Finance - 8 - Presented for API-148
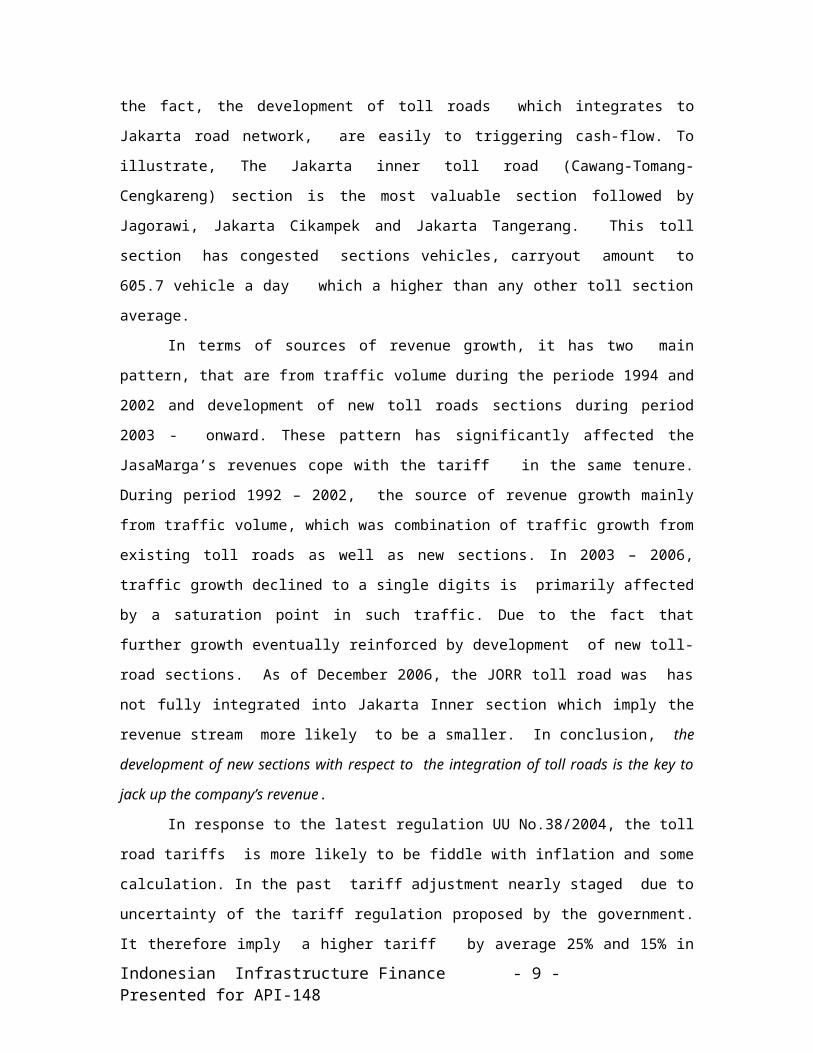
the fact, the development of toll roads which integrates to
Jakarta road network, are easily to triggering cash-flow. To
illustrate, The Jakarta inner toll road (Cawang-Tomang-
Cengkareng) section is the most valuable section followed by
Jagorawi, Jakarta Cikampek and Jakarta Tangerang. This toll
section has congested sections vehicles, carryout amount to
605.7 vehicle a day which a higher than any other toll section
average.
In terms of sources of revenue growth, it has two main
pattern, that are from traffic volume during the periode 1994 and
2002 and development of new toll roads sections during period
2003 - onward. These pattern has significantly affected the
JasaMarga’s revenues cope with the tariff in the same tenure.
During period 1992 – 2002, the source of revenue growth mainly
from traffic volume, which was combination of traffic growth from
existing toll roads as well as new sections. In 2003 – 2006,
traffic growth declined to a single digits is primarily affected
by a saturation point in such traffic. Due to the fact that
further growth eventually reinforced by development of new toll-
road sections. As of December 2006, the JORR toll road was has
not fully integrated into Jakarta Inner section which imply the
revenue stream more likely to be a smaller. In conclusion, the
development of new sections with respect to the integration of toll roads is the key to
jack up the company’s revenue.
In response to the latest regulation UU No.38/2004, the toll
road tariffs is more likely to be fiddle with inflation and some
calculation. In the past tariff adjustment nearly staged due to
uncertainty of the tariff regulation proposed by the government.
It therefore imply a higher tariff by average 25% and 15% in
Indonesian Infrastructure Finance - 9 - Presented for API-148

both year 2003 and 2005 respectively. The tariff adjustment has
significantly affected the toll collection which eventually taken
into account of JasaMarga’s revenue.
Based on toll tariff, JasaMarga is still comparable to
operators of toll-roads in elsewhere, especially in Malaysia
which refers to Malaysian Berhad and Thailand that refer to
Bangkok Express way. However, the Indonsian toll road are still
below the Eurpean, Australian and Chinese operators. The main
reason for these comparison is that the three main operator such
countries have a learning curve so implied the revenues stream
and minimizing cost as well. Under such conditions, the
Indonesian toll road operator still has lack experience cope with
the regulatory and supra structure in such countries.
In terms of tariff toll roads, it primarily depend on the
concession period and construction cost. There was common jargon
in the toll road, the concession right around 35-40 years,
while tariff adjustment associated with local inflation. The toll
tariff represents the longest distance traveled for class
vehicles such a passenger car.
Under such circumstances and armed with the government’s
commitment to develop another toll sections, the company is
potentially expands and achieve the optimum level. Given the
fact that JasaMarga has still lower compared to the world class
toll roads especially from Europe and China. Total assets of
JasaMarga is only represent around 10% of the largest toll road
operator Abertis Infrastructure from Spain. (see Exhibit 5)
In terms of debt equity ratio, JasaMarga has already
exhausted its borrowing capacity as the ratio has reached 3.91x
as of December 2005. This ratio has further above the average
Indonesian Infrastructure Finance - 10 - Presented for API-148

toll road operator which have average 2.1x. The company tried to
reduce the ratio through several financial engineering and
corporate action for the last three years. By far, as of
December 2006, the ratio which represent the capacity borrowing,
has lowered to 2.86x. The main reason for this was primarily
affected by the company’s ability to repaid bonds and cope with
finalized some toll sections which has significantly improved
company’s revenues.
The operational efficiency which associated with EBITDA margin
showed that, the company still lacks operational efficiency
compared to the world class standards. JasaMarga’s EBITDA margin
was 47% in year 2004 and 54% in year 2005 which still lower
compared to the average toll road world operator. To
illustrate the lower efficiency of company, the average EBITDA
margin of 70% refers to the company’s ability operates the toll
road. Given that litigation, the company should improve the toll
collection efficiency.
The ROE indicator figures out that the company has 14% of
ROE which has higher than industry average. The reason for this
higher due to higher gearing. By far, JasaMarga is still able to
provide a healthy return to equity investors. A higher ROE of
JasaMarga convinces the investor to finance or stacking the
capital in JASA MARGA to deliver the new project that coming
in.
The risk and its Mitigation is the main factor affecting the
project hitherto. Generally, Jasa Marga has proposed a concession
right for 40 years for its existing toll road. Based on the
regulation UU No. 38/200, JasaMarga should fully function as a
toll road operator, while regulatory issues should be tackled
Indonesian Infrastructure Finance - 11 - Presented for API-148

by BPJT (the regulatory body under President Republic of
Indonesia. Prior to this regulation was issued, the existing
toll roads were injected into JasaMarga as Government capital
injection. The new regulation gave the preemptive for the
JasaMarga to hold the concession rights and upon maturity the
assets will be transferred to the Government. Therefore, all
toll roads, should be under the schemes proposed by the
government, namely build operate and transfer (BOT)
There have been long question standing concerned with the
tariff adjustment. Almost for the last two decades, the
government increased toll road tariff only 4 times since 1990.
The first tariff adjustment occurred in 1991 with an increase
between 30-33% to selected toll roads. The second adjustment by
an average of 10% was settled in 1996, but only for Jakarta Inner
down road. The Toll tariff adjustment again happened in 2003 with
average increase of 25% on the all toll roads. The last tariff,
occurred in August 2005 with an average increases of 15%,
especially on toll road sections except the toll road to the
airports.
The law of 38/2004 stated that toll tariff could be raised
with a benchmark to the regional inflation every two years.
Previously, the ruling for tariff increases was about 25% within
three every three years which based on Law no. 36/2003. However,
since the regulation stated that
By far, most investors unlikely happy with the land clearing
with regard to the toll road project. The land clearing should be
handled by the government through Ministry of Public Works. To
entertain the new investor, investors liable to reimburse the
cost for land clearing. Land and acquisition may vary from
Indonesian Infrastructure Finance - 12 - Presented for API-148

location, which will eventually increase the investment cost.
Under such circumstances, land rights are sometimes in dispute,
which imply the completion risk. The latest regulation Perpres
No. 36/2005 stated that the government could revoke land rights
for public purposes. Therefore, toll roads has taken into account
the public purpose category. Although land acquisition is ensured
legally, the challenges for the next period most probably the
enforcement of the law which tend lately.
Specifically, land acquisition price is determined on
negotiation with referral to NJOP (tax object value). This area
potentially lead disagreement on land price and will delay the
completion of toll road projects. To minimize this, the
government should buy out land rights at NJOP price if any
deadlock occurs.
To illustrate this phenomena, the JORR land acquisition is
genuine illustrative of how the difficult of land acquisition.
Due to the fact that, several sections which have the land
acquisition problems implied for delayed in couple of years. In
the case of JORR land acquisition, the section from Pondok Pinang
to Veteran was delayed for almost three years
Valuation of the company
In terms of JasaMarga’s performance, the valuation should
respect to:
Indonesian Infrastructure Finance - 13 - Presented for API-148

1. Existing toll roads, which refers 13 sections with a total
length of 460.5 Km. We assume that JasaMarga has a
concession period of 40 years for all sections.
2. The new toll roads, which reflects the concession in Bogor
Ring Road, Semarang Solo and GempolPasuruan as well as
Jakarta Outer Ring Roads (JORR) that in completion.
3. Potential toll roads of 500 Km. In this regard, JasaMarga
intends to build another 500 Km of toll-road or equivalent
to IDR37.5 trillion of investment cost as reserves to
maintain leadership in such industry. By far, the company
has still captured 80% of market share and may possibly to
decline such around 51%.
Main Assumption of the toll road can be classified as follows:
The study assumes that IRR at 23% for the new projects,
which is based on the company ‘s indication
Debt equity structure for existing business is 60:40 based
on the current structure while for the new project is
70:30.
Cost of equity 20% and cost of debt 13% and risk free rate
12%. These variable are attributable to 13.5% of WACC in
terms of existing business and 12.4% for new projects.
Different WACC for existing and new project is largely due
to different capital structure.
Calculating the NPV of existing business, we get an equity
value ofIDR 4.7 tillion, with PBV multiple of 2,7 x. If we add up he
existing business with the 3 new project and additional 500 Km,
the NPV of equity should rise to IDR 9.3 trillion, resulting in the
Indonesian Infrastructure Finance - 14 - Presented for API-148

PBV multiple inching up marginally to 2.1x.Compared to the
average industry of 2.4x, with a PBV of 2.1x, JasaMArga generates
returns again its book value. JasaMarga creates significant net
present value compared to its capital instment.
Based on the world’s toll road operators, the average P/E
was 18.9x in year 2005 and EV/EBITDA of 11.2 in the same year.
Armed with the highest and lowest P/E multiple the industry,
JasaMarga could potentially have an equity value between IDR2.5
trillion to IDR6.5 trillion. However, in terms of industry
average, JasaMarga’s equity translate to IDR4.3 trillion. The
calculation is made by net profit of IDR462 billion in year
2006.
In terms of EV/EBITDA with regard to the world toll
operator, the industry EV/EBITDA average is 11x for year 200,
ranging from 6x to 28.6x. We find the highest multiple of 28.6x
from Transurban seems irrelevant due to loss position in year
2005. It therefore, by used range 6.0x to 13.6x, JasaMarga’s
value equity is valued between IDR1.7 trillion and IDR8.8
trillion. While, by using the industry average, the equity value
is attributable to IDR 6.6 trillion.
Under such valuation, with regard to the upper and lower
band of valuation of such methods, we come up with an equity
range of JasaMarga between IDR2.7 trillion to IDR7.5 trillion.
Citra MargaPersada (CMNP) is private toll-road operator,
originated from the former president Soeharto’s daughter
businesses. In 1994 the company listed on Jakarta Stock Exchange
and followed by several corporate actions by the following year.
However, the company’s performance was associated with tied
relationship to power, that most notably former president
Indonesian Infrastructure Finance - 15 - Presented for API-148

Soeharto. That is why, when the monetary crisis in 1997, the
company faced financial distressed largely due to excess
capacity borrowing from issuance bonds. By then, the company
was relatively stable and has successfully managed toll road
operation.
Based on year 2005, annualized Earning Per Share (EPS) of
CMNP should be IDR40/share, translating into P/ER of 19.8x in
that year. Using CMNP multiple of 19.8x, JasaMArga’s equity value
could be IDR4.5 trillion. Similarly, by using the EV/EBVITDA of
CMNP which stated on 6.1x, the JasaMarga equity value is
translated to be around IDR6.2t trillion.
Recommendation
The main lesson from JasaMarga’s company with respect to its
valuation are correlated to the existing toll road operation
cope with the next revenue stream coming from the new
project. The latter is associated with Bogor – Ring road,
Semarang Solo and Surabaya Gempol. In this regard, revenue
stream is largely determined by traffic volume and its
tariff.
Traffic volume which translate into JasaMarga’s revenue
stream is attributable to 13 of toll sections for existing
toll road operation and the next 3 toll section. In terms
of contribution to the revenue, CawangTomangCengkareng
(CTC) has been entitled as the biggest contributor to the
company which reach 29.9% of total during year 2005.
Indonesian Infrastructure Finance - 16 - Presented for API-148

The valuation of company refers to several methods which
largely based on Discounted cash flow. In terms of moderate
valuation with regard to discount rate 14.6% of WACC,
JasaMarga’s equity value is set about IDR4.3 trillion.
Assumed that company’s auction in the Jakarta Stock
Exchange is set 30%, it leads the share price in public
around IDR4,300. By this litigation, the company’s decision
to setup IDR1,800 was supposed naïve. The main reason for
higher price auction is that, if the price was above the
value of the firm, the government was the beneficiary of
this premium and would promise that the buyers would be
compensated through tariffs. While, in the investor’s point,
there will be an explicit bargain.
Indonesian Infrastructure Finance - 17 - Presented for API-148
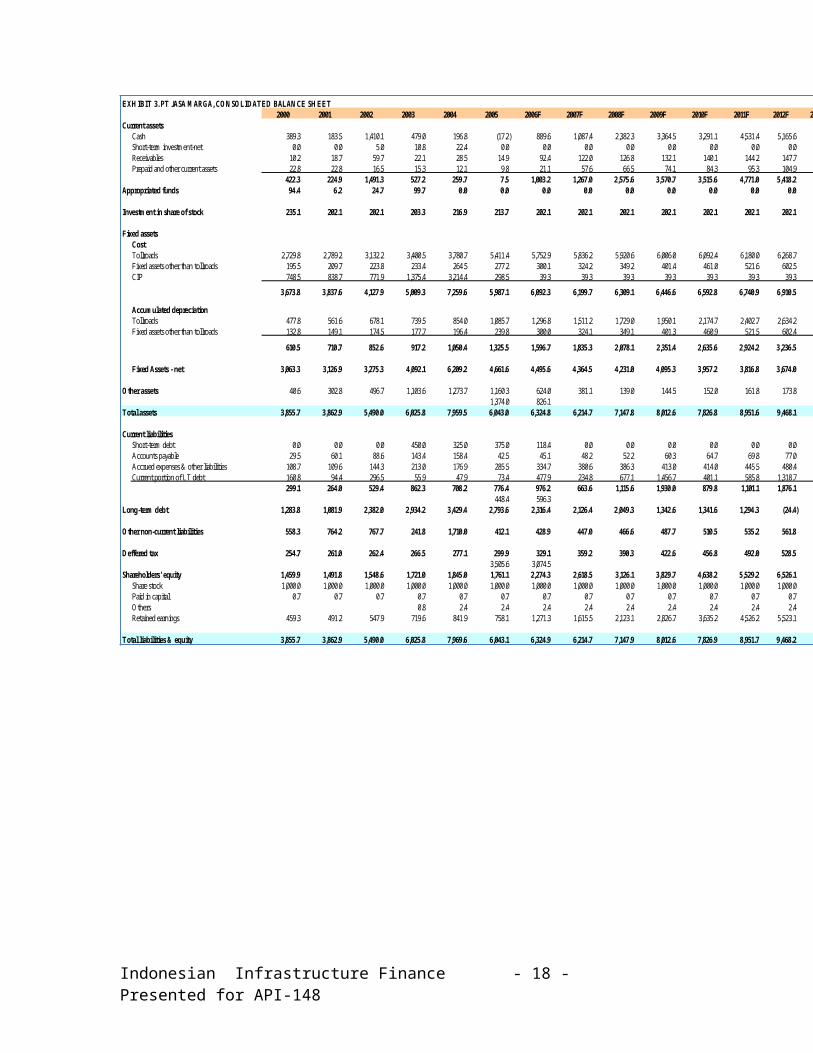
EXH IBIT 3. PT JASA M ARGA, CO N SO LIDATED BALAN CE SH EET2000 2001 2002 2003 2004 2005 2006F 2007F 2008F 2009F 2010F 2011F 2012F 2013F 2014F 2015F
Current assetsCash 389.3 183.5 1,410.1 479.0 196.8 (17.2) 889.6 1,087.4 2,382.3 3,364.5 3,291.1 4,531.4 5,165.6 5,233.0 6,782.4 8,449.4Short-term investment-net 0.0 0.0 5.0 10.8 22.4 0.0 0.0 0.0 0.0 0.0 0.0 0.0 0.0 0.0 0.0 0.0Receivables 10.2 18.7 59.7 22.1 28.5 14.9 92.4 122.0 126.8 132.1 140.1 144.2 147.7 158.2 163.9 167.6Prepaid and other current assets 22.8 22.8 16.5 15.3 12.1 9.8 21.1 57.6 66.5 74.1 84.3 95.3 104.9 115.3 131.6 147.0
422.3 224.9 1,491.3 527.2 259.7 7.5 1,003.2 1,267.0 2,575.6 3,570.7 3,515.6 4,771.0 5,418.2 5,506.5 7,077.9 8,764.0Appropriated funds 94.4 6.2 24.7 99.7 0.0 0.0 0.0 0.0 0.0 0.0 0.0 0.0 0.0 0.0 0.0 0.0
Investm ent in share of stock 235.1 202.1 202.1 203.3 216.9 213.7 202.1 202.1 202.1 202.1 202.1 202.1 202.1 202.1 202.1 202.1
Fixed assetsCostTollroads 2,729.8 2,789.2 3,132.2 3,400.5 3,780.7 5,411.4 5,752.9 5,836.2 5,920.6 6,006.0 6,092.4 6,180.0 6,268.7 6,358.6 6,449.6 6,541.8Fixed assets other than tollroads 195.5 209.7 223.8 233.4 264.5 277.2 300.1 324.2 349.2 401.4 461.0 521.6 602.5 683.8 765.9 851.2CIP 748.5 838.7 771.9 1,375.4 3,214.4 298.5 39.3 39.3 39.3 39.3 39.3 39.3 39.3 39.3 39.3 39.3
3,673.8 3,837.6 4,127.9 5,009.3 7,259.6 5,987.1 6,092.3 6,199.7 6,309.1 6,446.6 6,592.8 6,740.9 6,910.5 7,081.7 7,254.7 7,432.3
Accum ulated depreciationTollroads 477.8 561.6 678.1 739.5 854.0 1,085.7 1,296.8 1,511.2 1,729.0 1,950.1 2,174.7 2,402.7 2,634.2 2,869.1 3,107.7 3,349.8Fixed assets other than tollroads 132.8 149.1 174.5 177.7 196.4 239.8 300.0 324.1 349.1 401.3 460.9 521.5 602.4 683.7 765.7 851.1
610.5 710.7 852.6 917.2 1,050.4 1,325.5 1,596.7 1,835.3 2,078.1 2,351.4 2,635.6 2,924.2 3,236.5 3,552.9 3,873.4 4,200.9
Fixed Assets - net 3,063.3 3,126.9 3,275.3 4,092.1 6,209.2 4,661.6 4,495.6 4,364.5 4,231.0 4,095.3 3,957.2 3,816.8 3,674.0 3,528.8 3,381.3 3,231.4
Other assets 40.6 302.8 496.7 1,103.6 1,273.7 1,160.3 624.0 381.1 139.0 144.5 152.0 161.8 173.8 187.4 203.1 221.01,374.0 826.1
Total assets 3,855.7 3,862.9 5,490.0 6,025.8 7,959.5 6,043.0 6,324.8 6,214.7 7,147.8 8,012.6 7,826.8 8,951.6 9,468.1 9,424.8 10,864.4 12,418.6
Current liabilitiesShort-term debt 0.0 0.0 0.0 450.0 325.0 375.0 118.4 0.0 0.0 0.0 0.0 0.0 0.0 0.0 0.0 0.0Accounts payable 29.5 60.1 88.6 143.4 158.4 42.5 45.1 48.2 52.2 60.3 64.7 69.8 77.0 83.3 90.1 97.7Accrued expenses & other liabilities 108.7 109.6 144.3 213.0 176.9 285.5 334.7 380.6 386.3 413.0 414.0 445.5 480.4 492.9 523.2 574.1Current portion of LT debt 160.8 94.4 296.5 55.9 47.9 73.4 477.9 234.8 677.1 1,456.7 401.1 585.8 1,318.7 1.1 58.1 0.0
299.1 264.0 529.4 862.3 708.2 776.4 976.2 663.6 1,115.6 1,930.0 879.8 1,101.1 1,876.1 577.2 671.4 671.8448.4 596.3
Long-term debt 1,283.8 1,081.9 2,382.0 2,934.2 3,429.4 2,793.6 2,316.4 2,126.4 2,049.3 1,342.6 1,341.6 1,294.3 (24.4) (25.4) (83.5) (83.5)
Other non-current liabilities 558.3 764.2 767.7 241.8 1,710.0 412.1 428.9 447.0 466.6 487.7 510.5 535.2 561.8 590.5 621.6 655.1
Deffered tax 254.7 261.0 262.4 266.5 277.1 299.9 329.1 359.2 390.3 422.6 456.8 492.0 528.5 566.7 606.5 648.33,505.6 3,074.5
Shareholders' equity 1,459.9 1,491.8 1,548.6 1,721.0 1,845.0 1,761.1 2,274.3 2,618.5 3,126.1 3,829.7 4,638.2 5,529.2 6,526.1 7,715.9 9,048.5 10,526.9Share stock 1,000.0 1,000.0 1,000.0 1,000.0 1,000.0 1,000.0 1,000.0 1,000.0 1,000.0 1,000.0 1,000.0 1,000.0 1,000.0 1,000.0 1,000.0 1,000.0Paid in capital 0.7 0.7 0.7 0.7 0.7 0.7 0.7 0.7 0.7 0.7 0.7 0.7 0.7 0.7 0.7 0.7Others 0.8 2.4 2.4 2.4 2.4 2.4 2.4 2.4 2.4 2.4 2.4 2.4 2.4Retained earnings 459.3 491.2 547.9 719.6 841.9 758.1 1,271.3 1,615.5 2,123.1 2,826.7 3,635.2 4,526.2 5,523.1 6,712.9 8,045.5 9,523.9
Total liabilities & equity 3,855.7 3,862.9 5,490.0 6,025.8 7,969.6 6,043.1 6,324.9 6,214.7 7,147.9 8,012.6 7,826.9 8,951.7 9,468.2 9,424.9 10,864.4 12,418.7
Indonesian Infrastructure Finance - 18 - Presented for API-148

EXH IBIT 4. PT JASA M ARGA, CO N SO LID ATED PRO FIT & LO SS2000 2001 2002 2003 2004 2005 2006 2007 2008 2009 2010 2011 2012 2013 2014 2015
RevenueToll revenue 846.0 918.5 1,009.6 1,274.8 1,532.0 1,797.2 2,270.4 2,467.7 2,748.2 3,269.2 3,577.8 3,942.2 4,333.0 4,775.6 5,264.6 5,828.0Other tollroads revenue 7.2 10.0 57.1 71.4 99.5 126.7 140.3 153.8 166.2 179.4 195.6 211.1 227.7 248.5 268.0 288.9
Toll operating revenue 853.2 928.5 1,066.7 1,346.2 1,631.6 1,923.9 2,410.7 2,621.6 2,914.4 3,448.6 3,773.4 4,153.3 4,560.7 5,024.0 5,532.5 6,117.0growth 14.6% 8.8% 14.9% 26.2% 21.2% 17.9% 25.3% 8.7% 11.2% 18.3% 9.4% 10.1% 9.8% 10.2% 10.1% 10.6%
O perating expensesToll collection 131.3 166.1 209.3 264.2 277.7 299.7 338.9 368.5 401.9 442.0 482.3 526.7 575.2 629.1 688.1 753.2Toll service 55.0 69.9 87.0 104.0 116.4 126.4 140.8 149.6 160.3 176.1 188.4 202.2 216.8 233.2 250.9 270.4Toll maintenance 114.6 118.6 146.4 161.4 202.9 263.8 215.2 225.6 236.8 249.2 264.7 281.2 298.6 319.4 341.4 364.9Joint operation 109.8 108.2 117.9 136.7 139.2 161.1 211.6 229.7 257.0 306.6 338.9 369.1 410.6 452.5 498.9 552.2General & adm inistrative 154.8 211.4 265.7 306.5 351.8 439.8 520.1 559.9 612.9 703.3 763.2 832.3 905.9 989.3 1,080.5 1,183.7
Total operating expense 565.6 674.2 826.2 973.0 1,088.0 1,290.8 1,426.6 1,533.2 1,668.8 1,877.2 2,037.5 2,211.4 2,407.1 2,623.5 2,859.7 3,124.5growth 15.1% 19.2% 22.5% 17.8% 11.8% 18.6% 10.5% 7.5% 8.8% 12.5% 8.5% 8.5% 8.8% 9.0% 9.0% 9.3%
O perating profit 287.6 254.3 240.6 373.2 543.6 633.1 984.1 1,088.3 1,245.6 1,571.4 1,735.8 1,941.9 2,153.6 2,400.6 2,672.8 2,992.5growth 13.7% -11.6% -5.4% 55.1% 45.6% 16.5% 55.4% 10.6% 14.4% 26.2% 10.5% 11.9% 10.9% 11.5% 11.3% 12.0%
Depreciation and amortization 124.1 132.2 166.8 150.6 200.7 254.0 324.3 334.3 345.2 359.2 380.3 390.8 406.2 423.7 442.2 464.4
EBITDA 411.7 386.6 407.4 523.8 744.2 887.1 1,308.4 1,422.6 1,590.8 1,930.6 2,116.1 2,332.7 2,559.8 2,824.3 3,115.0 3,456.9518.8 574.2 674.5 944.9 1,141.0
O ther (incom e)/expenseInterest income (39.4) (35.8) (38.4) (37.9) (13.9) (7.9) (31.0) (37.4) (36.8) (41.6) (51.3) (57.0) (69.6) (69.6) (69.6) (69.6)Interest expenses 73.0 75.0 91.1 106.2 217.7 498.4 243.9 346.2 276.1 255.1 154.1 151.9 151.9 51.7 0.0 0.0
growth -36.5% 2.7% 21.5% 16.6% 104.9% 129.0% -51.1% 41.9% -20.2% -7.6% -39.6% -1.4% 0.0% -66.0% -100.0% #DIV/0!Others-net 53.6 6.2 (4.8) (2.4) (7.1) 23.4 (4.4) (5.3) (6.7) (9.3) (10.9) (12.7) (14.7) (16.9) (19.3) (22.1)
Total other expense (incom e) 86.9 45.4 48.1 65.9 196.6 513.9 208.6 303.5 232.6 204.2 91.9 82.3 67.7 (34.8) (88.9) (91.7)
Incom e before tax 200.7 208.9 192.4 307.3 347.0 119.1 775.5 784.9 1,013.0 1,367.2 1,643.9 1,859.6 2,085.9 2,435.3 2,761.7 3,084.2
Corporate incom e tax 51.2 51.2 56.9 100.8 107.2 55.0 238.6 242.0 304.6 401.5 478.1 537.3 599.8 695.7 785.5 874.5Current tax 42.6 51.2 49.1 96.7 96.6 32.2 209.4 211.9 273.5 369.2 443.9 502.1 563.2 657.5 745.7 832.7
tax ratio 21.2% 24.5% 25.5% 31.5% 27.8% 27.0% 27.0% 27.0% 27.0% 27.0% 27.0% 27.0% 27.0% 27.0% 27.0% 27.0%Deffered tax 8.6 (0.0) 7.7 4.1 10.6 22.9 29.2 30.1 31.1 32.3 34.2 35.2 36.6 38.1 39.8 41.8
Extraordinary loss/(gain) (22.7) (9.3)
N et profit/(loss) 149.5 157.7 135.6 229.2 249.1 64.1 536.9 542.9 708.4 965.8 1,165.8 1,322.3 1,486.2 1,739.7 1,976.3 2,209.7
Indonesian Infrastructure Finance - 19 - Presented for API-148
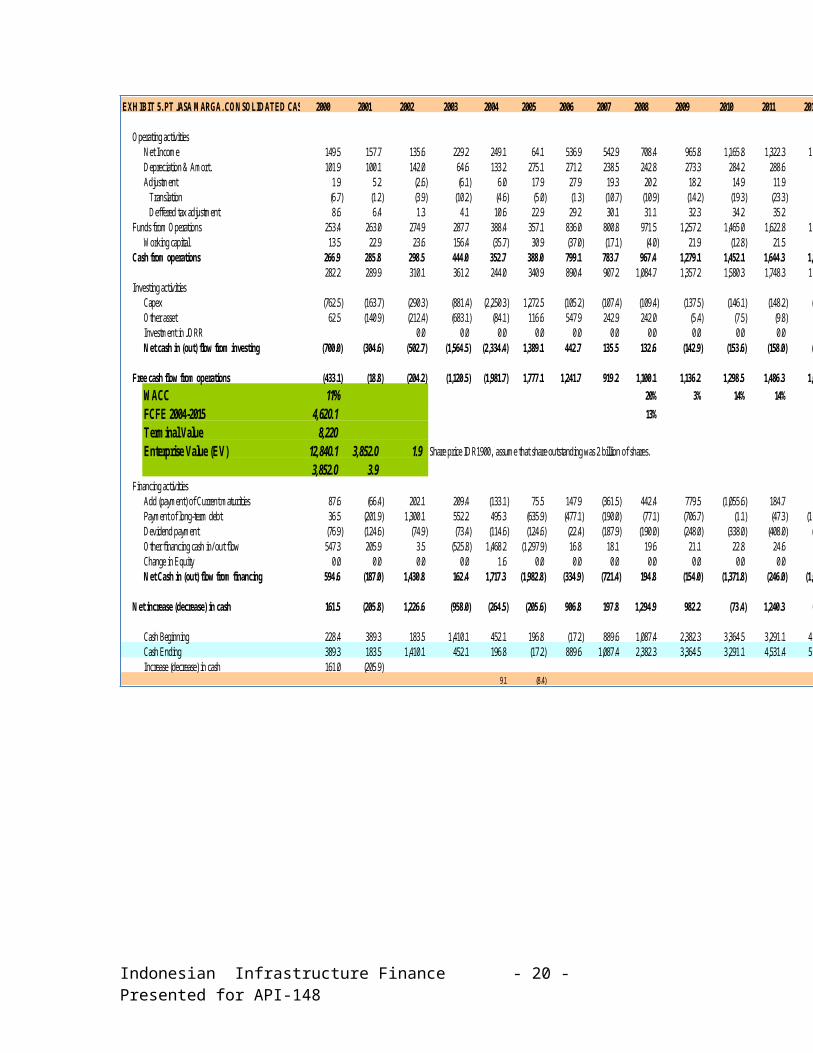
EXH IBIT 5. PT JASA M ARGA, CO N SO LID ATED CASH FLO W2000 2001 2002 2003 2004 2005 2006 2007 2008 2009 2010 2011 2012 2013 2014 2015
O perating activitiesNet Income 149.5 157.7 135.6 229.2 249.1 64.1 536.9 542.9 708.4 965.8 1,165.8 1,322.3 1,486.2 1,739.7 1,976.3 2,209.7Depreciation & Amort. 101.9 100.1 142.0 64.6 133.2 275.1 271.2 238.5 242.8 273.3 284.2 288.6 312.3 316.4 320.5 327.4Adjustment 1.9 5.2 (2.6) (6.1) 6.0 17.9 27.9 19.3 20.2 18.2 14.9 11.9 10.1 8.4 5.0 2.3 Translation (6.7) (1.2) (3.9) (10.2) (4.6) (5.0) (1.3) (10.7) (10.9) (14.2) (19.3) (23.3) (26.4) (29.7) (34.8) (39.5) Deffered tax adjustment 8.6 6.4 1.3 4.1 10.6 22.9 29.2 30.1 31.1 32.3 34.2 35.2 36.6 38.1 39.8 41.8
Funds from O perations 253.4 263.0 274.9 287.7 388.4 357.1 836.0 800.8 971.5 1,257.2 1,465.0 1,622.8 1,808.6 2,064.4 2,301.8 2,539.4W orking capital 13.5 22.9 23.6 156.4 (35.7) 30.9 (37.0) (17.1) (4.0) 21.9 (12.8) 21.5 29.1 (2.2) 15.2 39.4
Cash from operations 266.9 285.8 298.5 444.0 352.7 388.0 799.1 783.7 967.4 1,279.1 1,452.1 1,644.3 1,837.7 2,062.3 2,317.0 2,578.8282.2 289.9 310.1 361.2 244.0 340.9 890.4 907.2 1,084.7 1,357.2 1,580.3 1,748.3 1,928.9 2,201.5 2,458.2 2,715.9
Investing activitiesCapex (762.5) (163.7) (290.3) (881.4) (2,250.3) 1,272.5 (105.2) (107.4) (109.4) (137.5) (146.1) (148.2) (169.6) (171.2) (173.0) (177.5)Other asset 62.5 (140.9) (212.4) (683.1) (84.1) 116.6 547.9 242.9 242.0 (5.4) (7.5) (9.8) (12.0) (13.6) (15.7) (18.0)Investment in JO RR 0.0 0.0 0.0 0.0 0.0 0.0 0.0 0.0 0.0 0.0 0.0 0.0 0.0 0.0N et cash in (out) flow from investing (700.0) (304.6) (502.7) (1,564.5) (2,334.4) 1,389.1 442.7 135.5 132.6 (142.9) (153.6) (158.0) (181.5) (184.8) (188.7) (195.5)
Free cash flow from operations (433.1) (18.8) (204.2) (1,120.5) (1,981.7) 1,777.1 1,241.7 919.2 1,100.1 1,136.2 1,298.5 1,486.3 1,656.2 1,877.4 2,128.3 2,383.2W ACC 11% 20% 3% 14% 14% 11% 13% 13% 12%FCFE 2004-2015 4,620.1 13% 159%Term inal Value 8,220 27%Enterprise Value (EV) 12,840.1 3,852.0 1.9 Share price IDR1900, assume that share outstanding was 2 billion of shares.
3,852.0 3.9Financing activities
Add (payment) of Current maturities 87.6 (66.4) 202.1 209.4 (133.1) 75.5 147.9 (361.5) 442.4 779.5 (1,055.6) 184.7 732.9 (1,317.6) 57.0 (58.1)Payment of long-term debt 36.5 (201.9) 1,300.1 552.2 495.3 (635.9) (477.1) (190.0) (77.1) (706.7) (1.1) (47.3) (1,318.7) (1.1) (58.1) 0.0Devidend payment (76.9) (124.6) (74.9) (73.4) (114.6) (124.6) (22.4) (187.9) (190.0) (248.0) (338.0) (408.0) (462.8) (520.2) (608.9) (691.7)Other financing cash in/out flow 547.3 205.9 3.5 (525.8) 1,468.2 (1,297.9) 16.8 18.1 19.6 21.1 22.8 24.6 26.6 28.7 31.0 33.5Change in Equity 0.0 0.0 0.0 0.0 1.6 0.0 0.0 0.0 0.0 0.0 0.0 0.0 0.0 0.0 0.0 0.0N et Cash in (out) flow from financing 594.6 (187.0) 1,430.8 162.4 1,717.3 (1,982.8) (334.9) (721.4) 194.8 (154.0) (1,371.8) (246.0) (1,022.0) (1,810.1) (578.9) (716.2)
N et increase (decrease) in cash 161.5 (205.8) 1,226.6 (958.0) (264.5) (205.6) 906.8 197.8 1,294.9 982.2 (73.4) 1,240.3 634.2 67.4 1,549.4 1,667.0
Cash Beginning 228.4 389.3 183.5 1,410.1 452.1 196.8 (17.2) 889.6 1,087.4 2,382.3 3,364.5 3,291.1 4,531.4 5,165.6 5,233.0 6,782.4Cash Ending 389.3 183.5 1,410.1 452.1 196.8 (17.2) 889.6 1,087.4 2,382.3 3,364.5 3,291.1 4,531.4 5,165.6 5,233.0 6,782.4 8,449.4Increase (decrease) in cash 161.0 (205.9)
9.1 (8.4)
Indonesian Infrastructure Finance - 20 - Presented for API-148

EXH IBIT 6. RATIO - JASA M ARGA (Consolidated with JO RR)Year ended 31 D ec 2000 2001 2002 2003 2004 2005 2006 2007f 2008f 2009f 2010f 2011f 2012f 2013f 2014f 2015fProfitabilityROA (% ) 3.9 4.1 2.5 3.8 3.1 1.1 8.5 8.7 9.9 12.1 14.9 14.8 15.7 18.5 18.2 17.8ROE (% ) 10.2 10.6 8.8 13.3 13.5 3.6 23.6 20.7 22.7 25.2 25.1 23.9 22.8 22.5 21.8 21.0ROCE (% ) 5.1 5.9 3.2 4.4 4.4 1.3 10.4 10.9 12.1 14.6 18.3 17.8 19.0 22.6 21.9 21.2O perating margin (% ) 33.7 27.4 22.6 27.7 33.3 32.9 40.8 41.5 42.7 45.6 46.0 46.8 47.2 47.8 48.3 48.9EBITDA m argin (% ) 48.3 41.6 38.2 38.9 45.6 46.1 54.3 54.3 54.6 56.0 56.1 56.2 56.1 56.2 56.3 56.5Net profit margin(% ) 17.5 17.0 12.7 17.0 15.3 3.3 22.3 20.7 24.3 28.0 30.9 31.8 32.6 34.6 35.7 36.1Sales turnover (x) 0.2 0.2 0.2 0.2 0.2 0.3 0.4 0.4 0.4 0.4 0.5 0.5 0.5 0.5 0.5 0.5Fixed assets turnover (X) 0.3 0.3 0.3 0.3 0.3 0.4 0.5 0.6 0.7 0.8 1.0 1.1 1.2 1.4 1.6 1.9EBIT margin (% ) 32.1 30.6 26.6 32.4 35.2 32.1 42.3 43.1 44.2 47.0 47.6 48.4 49.1 49.5 0.0 0.0
CapitalizationTotal debt/Total asset (% ) 37.5 30.5 48.8 57.1 47.8 53.6 46.1 38.0 38.1 34.9 22.3 21.0 13.7 (0.3) (0.2) (0.7)Debt/equity (X) 1.0 0.8 1.7 2.0 1.6 1.6 2.5 2.5 3.3 2.4 1.8 1.4 1.3 1.1 0.7 0.6
CoverageEBITDA/Interest (X) 5.6 5.2 4.5 4.9 3.4 1.3 3.5 4.1 5.8 7.6 13.7 15.4 16.8 54.6 #DIV/0! #DIV/0!Net debt/FFO (X) 4.2 3.8 4.6 10.3 9.3 9.1 2.4 1.6 0.4 Net Cash Net Cash Net Cash Net Cash Net Cash Net Cash Net CashNet debt/EBITDA (X) 2.6 2.6 3.1 5.7 4.8 3.7 1.5 0.9 0.2 Net Cash Net Cash Net Cash Net Cash Net Cash Net Cash Net CashNet Debt (Net Cash), Rp bn 1,055.2 992.8 1,268.4 2,961.2 3,605.5 3,259.2 2,023.1 1,273.7 344.1 Net Cash Net Cash Net Cash Net Cash Net Cash Net Cash Net CashFFO/Total Debt (% ) 17.5 22.4 10.3 8.4 10.2 11.0 28.7 33.9 35.6 44.9 84.1 86.3 139.7 (8,468.6) (9,044.6) (3,041.0)Redemption Period 5.7 4.5 9.7 12.0 9.8 9.1 3.5 2.9 2.8 2.2 1.2 1.2 0.7 (0.0) (0.0) (0.0)
LiquidityCurrent Ratio (X) 1.4 0.9 2.8 0.6 0.4 0.0 1.0 1.9 2.3 1.9 4.0 4.3 2.9 9.5 10.5 13.0
Indonesian Infrastructure Finance - 21 - Presented for API-148

Exhibit 7. Revenue BreakdownToll revenue 846.0 918.5 1,009.6 1,274.8 1,532.0 1,797.2 2,270.4 2,467.7 2,748.2 3,269.2 3,577.8 3,942.2 4,333.0 4,775.6 5,264.6 5,828.0
growth 14.5% 8.6% 9.9% 26.3% 20.2% 17.3% 26.3% 8.7% 11.4% 19.0% 9.4% 10.2% 9.9% 10.2% 10.2% 10.7%Jakarta-Cikampek 226.3 246.1 250.8 264.9 347.2 393.7 589.5 703.1 838.0 1,076.1 1,255.2 1,462.8 1,703.3 1,981.7 2,303.5 2,675.3
15.9% 8.8% 1.9% 5.6% 31.1% 13.4% 49.7% 19.3% 19.2% 28.4% 16.6% 16.5% 16.4% 16.3% 16.2% 16.1%Camareng 187.6 209.7 268.5 411.1 474.0 494.2 584.1 637.8 689.8 789.1 820.6 853.5 887.6 923.1 960.0 998.4
19.0% 11.8% 28.0% 53.1% 15.3% 4.3% 18.2% 9.2% 8.2% 14.4% 4.0% 4.0% 4.0% 4.0% 4.0% 4.0%Jagorawi 148.3 160.5 171.7 207.1 215.4 234.1 261.4 274.6 288.4 330.0 343.2 356.9 371.2 386.0 401.5 417.5
10.3% 8.2% 7.0% 20.6% 4.0% 8.7% 11.7% 5.0% 5.0% 14.4% 4.0% 4.0% 4.0% 4.0% 4.0% 4.0%Jakarta-Tanggerang 107.3 113.0 124.0 145.4 166.5 192.6 215.7 226.6 238.0 272.3 288.9 306.4 325.1 344.8 365.8 388.0
11.4% 5.3% 9.7% 17.3% 14.5% 15.7% 12.0% 5.0% 5.0% 14.4% 6.1% 6.1% 6.1% 6.1% 6.1% 6.1%Surabaya-Gempol 74.5 80.1 83.8 101.3 119.0 124.9 141.9 152.0 162.8 186.3 197.6 209.6 222.3 235.8 250.2 265.4
11.9% 7.5% 4.7% 20.8% 17.5% 5.0% 13.6% 7.1% 7.1% 14.4% 6.1% 6.1% 6.1% 6.1% 6.1% 6.1%Purbaleunyi (Padaleunyi) 56.3 60.6 63.9 78.6 101.7 218.3 248.0 268.1 287.1 331.7 355.3 380.6 411.6 440.9 472.3 510.8
14.4% 7.7% 5.3% 23.0% 29.4% 114.6% 13.6% 8.1% 7.1% 15.5% 7.1% 7.1% 8.1% 7.1% 7.1% 8.2%Semarang 15.6 16.4 15.9 20.2 25.0 28.8 32.4 34.7 37.2 42.5 45.6 48.8 52.3 56.0 60.0 64.2
9.9% 4.6% -3.0% 27.7% 23.5% 15.1% 12.5% 7.1% 7.1% 14.4% 7.1% 7.1% 7.1% 7.1% 7.1% 7.1%Belmera 15.4 16.5 17.4 22.1 26.9 30.0 34.4 37.2 40.3 46.1 49.4 52.9 56.6 60.7 65.0 69.6
15.1% 7.3% 5.2% 27.4% 21.4% 11.8% 14.7% 8.1% 8.2% 14.4% 7.1% 7.1% 7.1% 7.1% 7.1% 7.1%Palikanci 11.0 11.8 13.7 22.4 30.0 38.1 47.4 58.6 69.4 87.8 104.0 117.8 139.6 165.3 187.3 221.9
31.8% 7.2% 15.9% 64.0% 34.1% 26.9% 24.4% 23.6% 18.5% 26.5% 18.5% 13.3% 18.5% 18.5% 13.3% 18.5%JO RR (seksi E1,E2 & W 2-S) 26.4 42.3 47.4 0.0 0.0 0.0 0.0 0.0 0.0 0.0 0.0 0.0
60.4%Citarum 3.7 3.8 3.9 1.7 0.0 0.0 0.0 0.0 0.0 0.0 0.0 0.0 0.0 0.0 0.0 0.0
8.7% 1.7% 4.3% -57.5%Cikampek-Padalarang I & III (Start from Sreptember/2003) 0.0 0.0 0.0 61.3 68.0 75.0 97.2 107.4 118.2 153.0 163.4 181.2 199.0 216.8
Surabaya-M ojokerto (operated in 2005) 0.0 0.0 115.7 137.5 160.4 224.9 246.8 266.6 359.9 404.2 460.7 517.2 573.7
Indonesian Infrastructure Finance - 22 - Presented for API-148

Exhibit 7. Traffic Actual and ForecastVehicle traffic
Jakarta-Cikampek 102.1 105.6 107.9 104.5 105.8 124.7 146.0 170.7 199.5 232.9 271.6 316.5 368.6 428.8 498.4 578.9growth 10.9% 3.5% 2.1% -3.1% 1.2% 17.9% 17.0% 16.9% 16.8% 16.7% 16.6% 16.5% 16.4% 16.3% 16.2% 16.1%
Cam areng 180.3 199.1 221.1 241.7 258.1 264.1 277.3 294.0 308.7 321.0 333.8 347.2 361.1 375.5 390.5 406.2growth 16.9% 10.4% 11.0% 9.3% 6.8% 2.3% 5.0% 6.0% 5.0% 4.0% 4.0% 4.0% 4.0% 4.0% 4.0% 4.0%
Jagorawi 87.5 94.0 100.2 108.0 115.8 119.3 123.2 128.1 133.2 138.5 144.1 149.8 155.8 162.1 168.5 175.3growth 10.0% 7.4% 6.6% 7.8% 7.2% 3.0% 3.2% 4.0% 4.0% 4.0% 4.0% 4.0% 4.0% 4.0% 4.0% 4.0%
Jakarta-Tanggerang 72.4 75.7 84.3 89.7 97.3 107.2 111.0 115.4 120.0 124.8 129.8 135.0 140.4 146.0 151.9 158.0growth 11.7% 4.6% 11.3% 6.4% 8.4% 10.2% 3.5% 4.0% 4.0% 4.0% 4.0% 4.0% 4.0% 4.0% 4.0% 4.0%
Surabaya-Gempol 59.4 63.8 67.1 63.3 62.8 63.3 66.4 69.8 73.2 76.2 79.2 82.4 85.7 89.1 92.7 96.4growth 11.6% 7.5% 5.2% -5.6% -0.8% 0.7% 5.0% 5.0% 5.0% 4.0% 4.0% 4.0% 4.0% 4.0% 4.0% 4.0%
Purbaleunyi (Padaleunyi) 36.4 39.0 41.1 42.5 41.9 50.5 53.0 56.2 59.0 61.9 64.4 67.0 70.4 73.2 76.1 79.9growth 12.6% 7.3% 5.4% 3.4% -1.5% 20.4% 5.0% 6.0% 5.0% 5.0% 4.0% 4.0% 5.0% 4.0% 4.0% 5.0%
Semarang 20.8 22.2 21.9 22.5 24.2 25.8 26.9 27.9 29.0 30.2 31.4 32.7 34.0 35.3 36.7 38.2growth 9.8% 6.6% -1.2% 2.8% 7.6% 6.6% 4.0% 4.0% 4.0% 4.0% 4.0% 4.0% 4.0% 4.0% 4.0% 4.0%
Belmera 11.9 12.8 13.9 14.6 15.4 16.2 17.2 18.1 19.0 19.7 20.5 21.3 22.2 23.1 24.0 25.0growth 15.5% 7.7% 8.2% 5.2% 5.4% 5.4% 6.0% 5.0% 5.0% 4.0% 4.0% 4.0% 4.0% 4.0% 4.0% 4.0%
Palikanci 3.6 5.6 7.6 10.1 12.0 13.3 15.3 18.3 21.1 24.2 27.9 30.6 35.2 40.5 44.6 51.3growth 24.3% 55.4% 36.6% 33.1% 18.0% 11.0% 15.0% 20.0% 15.0% 15.0% 15.0% 10.0% 15.0% 15.0% 10.0% 15.0%
Citarum 7.9 8.1 8.6 3.7 0.0 0.0 0.0 0.0 0.0 0.0 0.0 0.0 0.0 0.0 0.0 0.0growth 7.7% 3.0% 6.1% -56.7% 3.0% 3.0% 3.0% 3.0% 3.0% 3.0% 3.0% 3.0% 3.0% 3.0% 3.0% 3.0%
JORR (seksi E1,E2 & W 2-S) 16.4 24.3 27.2growth 47.8% 12.0%Total 582.2 626.0 673.7 700.8 749.7 808.8 863.4 898.4 962.7 1,029.5 1,102.8 1,182.6 1,273.3 1,373.6 1,483.5 1,609.0
12.9% 7.5% 7.6% 4.0% 7.0% 7.9% 6.8% 4.1% 7.2% 6.9% 7.1% 7.2% 7.7% 7.9% 8.0% 8.5%
Indonesian Infrastructure Finance - 23 - Presented for API-148