INDO ENERGY INTERNATIONAL LTD.
465
INDO ENERGY INTERNATIONAL LTD. 10 th May, 2021 Ministry of Environment, Forest and Climate Change Indira Paryavaran Bhavan, Jor Bagh Aliganj, New Delhi – 110 003 [F.No.10-34/2015-IA.III], IA/MH.MIS/335872015 Subject: Development of Deep Water Jetty Facility and Capacity expansion at existing Inland Water Jetty Facility on Kandalika river, Village Korlai, District Raigad, Maharashtra - submissions in response to additional information requisitioned, 49 th EAC meeting, EAC Infra – 2, 25 th February, 2020 Dear Sir With reference to the above mentioned Minutes of the EAC Meeting, we are furnishing herewith additional information as sought. We are sorry for the delay in submission of reply which was partly due to delay in obtainment of requisite clarifications and NOC/clarification from the respective offices due to lockdown for Covid19 pandemic for perusal and record of your good office. The compliance of the recommendations are hereby attached as per the below table of contents. We humbly request the esteemed Ministry for condoning the delay in submission of the documents, and to re- consider our case for hearing before the EAC, and oblige. Thanking you Yours faithfully Capt. RK Karnal Director Indo Energy International Ltd.
-
Upload
khangminh22 -
Category
Documents
-
view
0 -
download
0
Transcript of INDO ENERGY INTERNATIONAL LTD.

INDO ENERGY INTERNATIONAL LTD.
10th May, 2021
Ministry of Environment, Forest and Climate Change Indira Paryavaran Bhavan, Jor Bagh Aliganj, New Delhi – 110 003
[F.No.10-34/2015-IA.III], IA/MH.MIS/335872015
Subject: Development of Deep Water Jetty Facility and Capacity expansion at existing Inland Water
Jetty Facility on Kandalika river, Village Korlai, District Raigad, Maharashtra - submissions in response to additional information requisitioned, 49th EAC meeting, EAC Infra – 2, 25th February, 2020
Dear Sir With reference to the above mentioned Minutes of the EAC Meeting, we are furnishing herewith additional information as sought. We are sorry for the delay in submission of reply which was partly due to delay in obtainment of requisite clarifications and NOC/clarification from the respective offices due to lockdown for Covid19 pandemic for perusal and record of your good office. The compliance of the recommendations are hereby attached as per the below table of contents. We humbly request the esteemed Ministry for condoning the delay in submission of the documents, and to re-consider our case for hearing before the EAC, and oblige. Thanking you Yours faithfully
Capt. RK Karnal Director Indo Energy International Ltd.

Table of Contents
Sr.No Details sought Compliance
i. Upload copy of updated EIA/EMP Report along with point-wise ToR Compliance and Annexures.
Page No: 3 to 409
ii. Upload copy of CZMA recommendations given by Maharashtra CZMA
Page No: 411 to 418
iii. Certificate from Chief Wild Life Warden regarding permissibility and distance of the project from Phansad Wildlife Sanctuary.
Page No: 419 to 420
iv. Certificate from Archaeological Survey of India regarding permissibility and distance of the project from Korlai Fort.
Page No: 421 to 422
v. Impacts of the proposed project on crocodiles present in the upstream of the Kundalika estuary
Page No: 423 to 426
vi. A study on impacts of accidental spillage due to ship grounding or collision through model and its mitigation.
Page No: 427 to 453
vii. Point-wise details of each of the issues raised during public hearing and commitments made by the project proponent with EMP.
Page No: 454 to 460
viii. Details of EIA Consultant along with Accreditation Certificate
NABET Certificate: Page No: 6 Consultant details:Page No:246-247
ix. Plan for Corporate Environment Responsibility (CER) as specified under Ministry’s Office Memorandum issued vide letter F.No. 22-65/2017-IA.III dated 01.05.2018.
Page No: 462 to 465

ENVIRONMENTAL IMPACT ASSESSMENT REPORT
PROJECT
DEVELOPMENT OF “DEEP WATER JETTY” FACILITY ON KUNDALIKA RIVER, VILLAGE-
KORLAI, DITRICT-RAIGAD, MAHARASHTRA & CAPACITY EXPANSION OF EXISTING
INLAND WATER JETTY FACILITY, ON KUNDALIKA RIVER, VILLAGE-SANEGAON,
DISTRICT-RAIGAD, MAHARASHTRA
PROJECT PROPONENT
INDO ENERGY INTERNATIONAL PVT. LTD.
Submitted by

IETINDO ENERGY INTERNATIONAL LTD.
UNDERTAKING BY THE PROJECT PROPONENT
This is to certify that:
I, N'lr. Deepak Kumar Sai8al IDirector') ol Indo Enc] g,v Interlrationnl Ltd. 0EILI do herebj,solemnly state about EIA report to develop "Dcep Watcr Jett-v f:lcility on Kundalika
River, village 1(orlai and capacity expansion at existing Inland Water Jetty l.acilit,,, on
Kunclalika River at village Sanegaon, districl Raigad, Nl.harashtra" as follours:
. No nodcrnization activity has been undertaken in violation ol the provision olEIA notificalion.
. I hereby undeft.ke thnt the data and lnlbrnation givcn in thc application,enclosure and olher documents ale true to tlrc best of my knorvlerlge ancl belieland I arn a$/are that ifeny part ofthe data and infol-mation subnlitled is Found to
be false and misleading at any stage, the proj-.ct will be relected and clearancegiven, if anv to the Project will be revoked at our own risk ancl cost.
. I hereby subnlit this underlaking as part of the EIA report, orr/ing the content
[inlorDraLion and dala] olthe EIA Reltort.
. There is no lltigation pcnding against the projecl and/or land in ll,hich theploject is ploposcd to be set up and that for alrv suclt litigation \,vhatsoever thesole responsibilily r'!,ill bc borne by the "Project Proponent".
For Indo IFlernational Ltd. (tElL),
Deepal( I(un_i
Director
Place: X'lumbaiDare 21l04/2021
6x"r1*:..r\!( rer ;5(\#v

TERRACON ECOTECH PVT.LTD. 202, Kingston, Tejpal Road, Vile Parle (East), Mumbai-400057. INDIA Tel: 91.22.20863940/41/42
CIN: U74140MH2008PTC188663; GST no. 27AADCT0972A1ZN Email: [email protected]. Website : www.terraconindia.com
UNDERTAKING BY EIA CONSULTING ORGANIZATION
This is to certify that: -
I, Pravin Shinde, Environmental Coordinator for submission of the project report for obtaining Environmental & CRZ Clearance to develop “Deep Water Jetty facility on Kundalika River, village Korlai and capacity expansion at existing Inland Water Jetty Facility, on Kundalika River at village Sanegaon, district Raigad, Maharashtra” coordinated by Deepak Kumar Saigal (Director).
The information contained in this report is based on the scientific analysis of data, information and drawings provided by Project Proponent (IEIL) and from authentic sources and nodal agencies during the time of the study.
No any violation of provisions of EIA Notification Date: 14.09.2006, and amendments made thereafter, circulars and OM issued their under.
Date: 08.05.2021 Name & Sign: Dr. Pravin Shinde
Place: Mumbai Designation: Asst. General Manager (Environmental Coordinator)

Declaration by Experts contributing to the EIA
I hereby certify that I was part of the EIA team in the following capacity that developed this
EIA report to develop “Deep Water Jetty facility on Kundalika River, village Korlai and
capacity expansion at existing Inland Water Jetty Facility, on Kundalika River at village
Sanegaon, district Raigad, Maharashtra”.
EIA Coordinator: Dr. Pravin Shinde
Signature & Date:
Period of involvement: May 2021 till final clearance
S. No. Name of Expert Functional
Area Period of involvement Signature
Functional Area Experts (FAE)
1. Pravin Shinde EB April 2021 to
final clearance
2. Rupa Shah SHW April 2021
3. Smita Patil WP & SC April 2021 to
final clearance
4. Prasanta Das SE April 2021
5. Ravindra Kode RH April 2021
6. Manish Sharma GEO & HG April 2021
7. Neha Sharma AP April 2021
Functional Area Associates (FAA)
8. Abhijeet Jagtap EB April 2021
Mentor
9. Monowar Khalid EB April 2021
Team Members
10. Akshay Nachane April 2021
11. Shrutika Pandit April 2021 to
final clearance

S. No. Name of Expert Functional
Area Period of involvement Signature
12. Ashok Yashwant April 2021 to
final clearance
Declaration by the Head of the Accredited Consultant Organization/authorized person
I Ashok Jain, hereby confirm that the above-mentioned experts prepared the EIA Report to
develop “Deep Water Jetty facility on Kundalika River, village Korlai and capacity expansion
at existing Inland Water Jetty Facility, on Kundalika River at village Sanegaon, district
Raigad, Maharashtra”. I also confirm that the consultant organization shall be fully
accountable for any miss-leading information mentioned in this report.
Signature with date:
8th May2021
Name: Mr. Ashok Jain
Name of the EIA Consultant Organization: Terracon Ecotech Pvt. Ltd.
NABET Certificate No: NABET/EIA/1922/RA 0147 valid till Jan 20, 2022.

EIA for proposed jetty at Korlai River and expansion of existing jetty at Sanegaon by Indo Energy International Ltd.
TEPL/ENV/CBS/2021‐05 I
ExecutiveSummary

EIA for proposed jetty at Korlai River and expansion of existing jetty at Sanegaon by Indo Energy International Ltd.
TEPL/ENV/CBS/2021‐05 II
EXECUTIVE SUMMARY
INTRODUCTION
Indo Energy International Limited (IEIL) is a company in the sector of Infrastructure Development and Power. Set up in 1999, it is promoted by Esquire Shipping Pvt. Ltd. To cargo by sea, train or road, and also clearance, cargo handling, warehousing and distribution. Some of the services are chartering and brokerage, ship agency management, shipping consulting and multi modal transport. IEIL has an operational multipurpose jetty at Sanegaon since 2009. The jetty has been approved by Customs, through their notification dated 2 Feb 2010, for unloading of imported goods namely Iron, Iron ore pellets, Iron ore concentrate, Coal, Dolomite/Limestone, Petroleum Gas, Steel melting scrap, HDI chips/fines, Pulp, Magnesite, Sulphur. The jetty has also been approved by customs for loading of export goods namely Sponge Iron, rejects of Iron Ore chips and Bauxite. IEIL has 6000 m2 of notified unloading/loading area (200 m x 30 m) at Sanegaon and has a custom bonded area of around 40,000 m2. The IEIL proposes to develop Deep Water Jetty facility on Kundalika River, village Korlai, district Raigad, Maharashtra and capacity expansion at existing Inland Water Jetty Facility, on Kundalika River at village Sanegaon, district Raigad, Maharashtra. The proposed port will be developed in 3 phases, at Korlai Phase I‐9.25 MMT, Phase II‐16.75 MMT, Phase III‐23.50. Geographical coordinates of project is 18° 32’ 10.92” N, 72° 55’ 11.65” E. Capacity expansion at Sanegaon will be achieved by all year round operations as mother vessels will discharge at Korlai Jetty, by using bigger size barges of 4500 DWT and by dredging of channel from Korlai to Sanegaon to 3.1 m CD.
The capacity of existing facility at Sanegaon is largely limited due to Handling of Coal at the anchorage is unreliable as is non‐operational for about 4 months during southwest monsoon, Depth (draught) available in the River is tide assisted and capacity of the Barges are largely limited and restricted by the Bridge spans (Salav Bridge), it has to cross for transiting to IWT. Improvement of capacity and construction of new jetty will Ensure round the year operation by shifting anchorage operations inside the creek also Undertake dredging wherever required to improve available draught in the river and rationalize barge dimensions to increase capacity.
IEIL has entrusted the works for the planning, engineering design, project management and commissioning for the proposed project to C‐Borne Services (CBS). Terracon Ecotech Pvt. Ltd., a NABET accredited environmental consultant has been appointed by CBS for providing the services to obtain Environment & CRZ clearance for the proposed project.
The proposed project attracts Environment clearance under Sector 33 and falls in category A as per EIA Notification 2006 and its subsequent amendments as project attracts general condition.

EIA for proposed jetty at Korlai River and expansion of existing jetty at Sanegaon by Indo Energy International Ltd.
TEPL/ENV/CBS/2021‐05 III
Further it also attracts CRZ Clearance under CRZ notification 2011. The proposed deep water jetty facility project falls under CRZ IVB, II and IB according to the CRZ map, whereas, capacity expansion of existing inland water jetty facility at Sanegaon falls under CRZ III and CRZ I (ii). The CRZ map (HTL/LTL Demarcation) for this project is prepared by National Centre for Sustainable Costal Management (NCSCM) Chennai.
Public Consultation was carried out at two different locations for Korlai and Sanegaon projects. First public hearing for Korlai Project was held at mount Carmel High School, on 19.11.2016, Second hearing was held for Sanegaon Project on 21.11.2016 near project site respectively and public MoM of same is published by MPCB (Raigad II SRO).
As per EIA Notification 2006 and its amendments, ToR application were submitted to MoEFCC for grant of ToR on 10th November 2015 and further presentation was held in EAC meeting on 21st and 22nd December 2015, TOR was issued on 28th January, 2016 vide letter no. F. No.10‐34/2015‐IA.III and extended by one year in 2019.
PROJECT DESCRIPTION
The proposed project involves development of the jetty about 525 m x 46 m with one 8 m x 8 m mooring dolphin on the east side. The project will involve dredging a 14.5 km channel requiring 11 million cum of dredging for a depth of 11.0 m CD in Phase I. In second phase channel length would increase to 17.5 km and would require 23 million cum (i.e. 12 million cum additional) of dredging for a channel depth of 14.6 m CD. In the final phase the channel length would increase to 21.5 km and would require 35.5 million cum (i.e. additional 12.5 million cum) dredging for a channel depth of 19.0 m CD and Dredging of 0.99 Mm3 in the inner channel from Korlai to Sanegaon for a depth of 3.1 m CD. The salient features of proposed facility are as following:
a) The Jetty will be provided with mobile harbour cranes in the first phase and with fixed ship unloaders in the final phase.
b) The equipment will discharge in to hoppers and through covered conveyors to the covered stock yard.
c) Dust suppression mechanisms would be in place. d) Palletized cargo and containers would be handled using mobile harbour cranes and
taken to the yard by tractor‐trailers. e) The cargo receipt and dispatch would be fully mechanized. f) The barge loading system would be installed for emission free loading.
Dredging work
A 17.5 km channel consisting of 23 million cum of dredging for Panamax Vessels and about 35.5 million cum for Cape Vessels would be required in the ultimate stage. Initial channel will be narrow and limited to 160 m width with a draft of 11 m and involve 11 million cum of

EIA for proposed jetty at Korlai River and expansion of existing jetty at Sanegaon by Indo Energy International Ltd.
TEPL/ENV/CBS/2021‐05 IV
dredging, which will be subsequently dredged to have navigable depth of around 14.6 m and further increased to 19.0 m in the final phase. The dredging spoils of the inner harbour would be used for reclamation of back up area.
Raw material
The raw materials used for the construction of wharf will including cement, aggregates, rock, sand, steel, etc. Soil, sand, gravel, stone aggregates will be procured from nearby licensed sources; whereas, Cement and steel will be procured from reputed manufacturers as per availability. Transportation of the raw material will be by road & Sea.
Manpower
Local labours will be hired during construction phase and operation phase. Total manpower requirement for construction phase will be 850 and operation phase will be 350.
Water requirement
The total water requirement, the per capita consumption for the in port consumption is taken as 90 liters per day. The occupancy is taken as 350 in the port. Total consumption will be 31, 500 liters per day. The water requirement shall be sourced from MIDC or irrigation department.
Power requirement
It is proposed that the incoming HT supply is taken from the nearest substation at voltage level of 33 KV. Single transformer of capacity of 33 KV/ 11 KV, 12 MVA oil filled out door type shall be installed. A 33 KV switch yard is to be set up near to the Port area from where three or four 11 KV feeders are taken to feed the port equipment. 33 KV and 1l KV control rooms are required near the yard. 11 KV supply will feed Transformers for Dry Bulk Terminal (Iron Ore), Dry Bulk Terminal (Coal) and common utility. Each Transformer size could be selected based on the individual total connected load.
Waste management
During construction phase sewage will be generated from workers camp which will be treated in STP. Total sewage generation during operation phase will be 28.3 m3/day. Sewage Treatment Plant of capacity 30 m3/day will be provided to treat the sewage. Treated sewage will be used for gardening, dust suppression and the sludge will be used as manure. In any case there will be no disposal of treated sewage in marine water. Water mixed with coal particles during sprinkling will be collected through channel along the storage into a clarifier system wherein water and coal dust will be separated
The debris generated due to dredging will be majorly used for reclamation of backup area of the port and the balance is to be disposed in deep sea at designated area. The other solid waste will be segregated. Recyclable waste will be disposed of through approved vendors and remaining waste will be disposed off though approved facility.

EIA for proposed jetty at Korlai River and expansion of existing jetty at Sanegaon by Indo Energy International Ltd.
TEPL/ENV/CBS/2021‐05 V
Project implementation period and cost
The project implementation schedule will be of 30 months. The total cost of the project is INR 2000 Crores. For Phase I – INR 1160.83 Cr, For Phase II‐ INR 408.70 Cr, For Phase III‐ INR 430.70 Cr.
DESCRIPTION OF ENVIRONMENT
Baseline environmental study was carried out in post‐monsoon in October 2015 to February 2016 for Soil quality, Ambient air quality, Water quality, Terrestrial ecology, Marine ecology, Noise level monitoring and Socio‐economic studies in an area of 10 km radius from proposed project site.
Monitoring surveys of the study area (project area) has been carried out in one season i.e. October 2015 to February 2016. In addition separate studies for the bed material and marine ecology were carried out between March 2016 and May 15th 2016. The Ambient Air quality monitoring was carried out by the MoEF and CC approved lab Enviro care Pvt. Ltd. Whereas water and soil sampling and analysis were carried out by NABL approved Ana laboratories.
Land Environment
Soil
The soil samples collected from four locations shows pH in slight to moderate alkaline range. The soil texture was found to be loamy due to which it shows low moisture content. Moderate levels of EC indicate no effect of salinity in soil. Absence of heavy metals shows that there is no pollution due to domestic or industrial waste. Organic matter in range of 1.77 to 2.86 showed good quality of soil. Soil sample of project site showed natural levels other micro and macronutrients.
Marine Water
The pH of marine water samples at all the four locations sampled was found to be moderately alkaline. Electrical conductivity and Salinity are present at optimum levels of sea water. Micro & macro nutrients are present at natural levels. Also presence of COD, BOD, heavy metals and Oil & Grease indicates commercial or domestic pollution in the sampled areas. Overall qualitative analysis of marine water indicated presence of source of pollution which may be due to anthropogenic activities, industrial waste, and domestic waste and boat movements.
Marine Ecology
The concentration and the numerical abundance of the phytoplankton indicate the fertility of a region. The Asterionella Formosa, Navicula, Coscinodiscus and Streptotheca species was little dominant which was recorded in all stations, no rare or endangered group of phytoplankton were found in the area. The concentration and the numerical abundance of the zooplankton indicate the high productive water body. Luciferid shrimps (larvae and adults) had the highest contribution in abundance, in the coastal and oceanic region. The

EIA for proposed jetty at Korlai River and expansion of existing jetty at Sanegaon by Indo Energy International Ltd.
TEPL/ENV/CBS/2021‐05 VI
sample analysis results reveal high benthic productivity in the study area. Brachyuran, Nereis and Oyster were dominant.
Terrestrial Ecology
Fauna
In the core, total 21 species of faunal species were encountered based on random survey. The avian group was the most diverse followed by insects. Common sandpiper (Actitish hypoleucos) and Indian pond heron (Ardeola grayii) are the most common bird species in the core. The butterfly‐Small Salmon Arab (Colotis amata) is the most dominating insect species in core.
Flora
During the study, random sampling along with systematic sampling using nested quadrates was undertaken in the core and buffer. Based on the data collected by these techniques an overall species list was generated. In all, 164 species were encountered during this rapid single season study. These 164 species belonged to 58 families. The species observed can be further categorized into following habits:
Habit Number of species
Tree 66Herb 49 Climber 28 Shrub 19Epiphyte 2
Ambient Air Quality
Ambient Air Quality Monitoring was carried out for 8 locations as per NAAQM specifications of CPCB for the parameters PM10, PM2.5, SO2, NOx and samples were collected on 24 hours basis for all parameters and one hour sampling for CO as per standard method. Additionally O3, NH3, C6H6, BaP, Pb, As and Ni were analyzed. Frequency of sampling was twice a week during study period.
During the study period in the entire study area the maximum value of PM2.5 was observed at Mandala i.e. 18.59 μg/m3 and the lowest was observed at project site i.e 14.60 μg/m3. PM 10 was maximum at Mandala and minimum at project site the values are 51.20 μg/m3 42.78 μg/m3 respectively. The minimum SOx concentration value of 6.88 μg/m3 was observed at project site and maximum concentration of 7.98 μg/m3 was observed at Salav. Maximum concentration of NOx was observed at Mandala i.e. 16.94 μg/m3 and minimum concentration of NOx was observed at Project site i.e. 13.48 μg/m3. The other parameters recorded includes Ammonia, Ozone, Nickel CO, Lead(Pb), Arsenic (As), Benzene, Benzo(a) pyrene were found to be within permissible limits.

EIA for proposed jetty at Korlai River and expansion of existing jetty at Sanegaon by Indo Energy International Ltd.
TEPL/ENV/CBS/2021‐05 VII
Ambient Noise Quality
The monitoring of ambient noise was conducted to assess the background noise levels at eight (08) nos. Noise monitoring was carried out for 8 location within 10 km radius of project site. All the readings are within CPCB norms.
Socio‐Economic Profile
The proposed project is expected to have positive impact on socio‐economic status of the region. Priority for employment will be given to the local people, depending on their skills. Project will as contribute in strengthening the nation’s defence mechanism.
ANTICIPATED IMPACTS AND MITIGATION MEASURES
Construction Phase
Area Impact Mitigation Measure
Land/soil Environment
Disposal of solid waste from labour camps and construction activities may lead to soil contamination, thereby disturbing soil micro‐flora. Disposal of dredged material on the land area may lead to soil degradation. Storage of raw material on land may lead to accidental spillage of oil or run‐off due to rain water.
Color coded containers will be provided for solid waste collection. Also, toilets will be provided to avoid open defecation. The re‐usable construction solid waste shall be reused for land filling and reclaiming activities, rest shall be disposed off as per existing local norms. The dredged material generated shall be reused for reclamation and remaining waste will be disposed off in deep sea at designated site.
Marine environment
The capital dredged and the disposal site of dredged material temporary biological impacts depending on the prevailing flora and fauna at the sites, areas involved and dredging duration. Water turbidity and aqueous discharges (oily wastes, sanitary wastes) from the dredgers, barges and workboats involved in the activity may
Dredging will be confined to only those areas earmarked for the purpose to limit the impact and the dredged sediment will be carefully disposed at pre‐decided sites at shore terminal area or used in construction During construction period, suitable barrier will be used to protect the adjoining water bodies
EIA for proposed jetty at Korlai River and expansion of existing jetty at Sanegaon by Indo Energy International Ltd.
TEPL/ENV/CBS/2021‐05 VIII
Area Impact Mitigation Measure
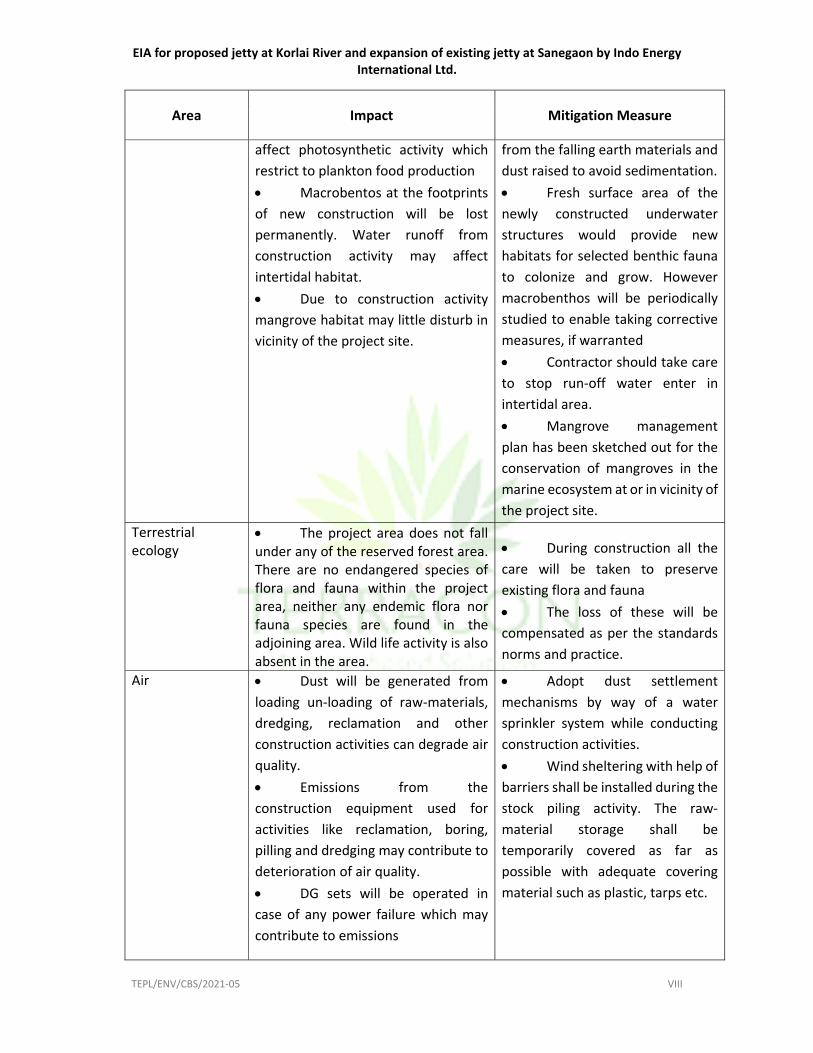
affect photosynthetic activity which restrict to plankton food production Macrobentos at the footprints of new construction will be lost permanently. Water runoff from construction activity may affect intertidal habitat. Due to construction activity mangrove habitat may little disturb in vicinity of the project site.
from the falling earth materials and dust raised to avoid sedimentation. Fresh surface area of the newly constructed underwater structures would provide new habitats for selected benthic fauna to colonize and grow. However macrobenthos will be periodically studied to enable taking corrective measures, if warranted Contractor should take care to stop run‐off water enter in intertidal area. Mangrove management plan has been sketched out for the conservation of mangroves in the marine ecosystem at or in vicinity of the project site.
Terrestrial ecology
The project area does not fall under any of the reserved forest area. There are no endangered species of flora and fauna within the project area, neither any endemic flora nor fauna species are found in the adjoining area. Wild life activity is also absent in the area.
During construction all the care will be taken to preserve existing flora and fauna The loss of these will be compensated as per the standards norms and practice.
Air Dust will be generated from loading un‐loading of raw‐materials, dredging, reclamation and other construction activities can degrade air quality. Emissions from the construction equipment used for activities like reclamation, boring, pilling and dredging may contribute to deterioration of air quality. DG sets will be operated in case of any power failure which may contribute to emissions
Adopt dust settlement mechanisms by way of a water sprinkler system while conducting construction activities. Wind sheltering with help of barriers shall be installed during the stock piling activity. The raw‐material storage shall be temporarily covered as far as possible with adequate covering material such as plastic, tarps etc.

EIA for proposed jetty at Korlai River and expansion of existing jetty at Sanegaon by Indo Energy International Ltd.
TEPL/ENV/CBS/2021‐05 IX
Area Impact Mitigation Measure
Dust masks will be provided to workers toll minimize their exposure to dust. It will be ensured that loading, transfer, and discharge of construction materials take place with a minimum height of fall, and shielded against wind. Dust suppression spray unit will be deployed where necessary. Vehicles having Government license and certificate for transportation of construction will be commissioned. The DG sets should be provided with adequate stack height for the proper dispersal of the pollutants.
Noise Construction activities will have major impact on noise environment. The major sources of noise pollution during construction phase would be operation of equipment engaged in various construction activities. • Noise would be generated during transportation, loading and unloading of raw materials, dredging process, use of DG sets.
• All construction equipment shall be fitted with exhaust silencer. Damaged silencer to be promptly replaced and equipment should be maintained properly by the contractor. • It will be ensured specified noise emission standards are met. • DG sets will be used with acoustic enclosure. • • Aspects of the land reclamation construction that generate excessive noise, such as pile driving, will be undertaken during daylight hours where possible • Protect the amenity of surrounding area by ensuring that noise levels meet the statutory requirements and acceptable standards.
Socio‐Economics Positive impacts in terms of direct employment generation as
Inconvenience caused to people during construction phase

EIA for proposed jetty at Korlai River and expansion of existing jetty at Sanegaon by Indo Energy International Ltd.
TEPL/ENV/CBS/2021‐05 X
Area Impact Mitigation Measure
construction of the proposed project will need skilled and semi‐skilled labours. There can be inconvenience caused to the people during construction period in terms of high noise levels, traffic, etc.
will be kept at a minimal level. Use of silencer in noise producing equipment’s and proper maintenance of vehicles should be done wherever possible. Safe navigation routes should be created for civilians to minimize the inconvenience caused to them during construction.
Operation Phase
Area Impact Mitigation Measures
Soil Oily wastes and dredged material removed during maintenance dredging may lead to contamination of land environment. Solid waste generated may contaminate the area and lead to foul smell if not maintained well.
Oily wastes and dredged material removed during maintenance dredging may lead to contamination of land environment. Solid waste generated may contaminate the area and lead to foul smell if not maintained well.
Marine environment
The waste water generated due to sprinkling of water on coal stack may lead to water contamination. The sewage generated from ships if not managed properly may lead to nuisance to local people and loss of aesthetic value of the area. Further aqueous discharges from vessels such as dumping of ship waste (sullage/ sewage), oil contaminated bilge water, holding cleaning and tank cleaning residues (slop), and spillages upon re‐fueling and lubricating oil changes and disposal of solid wastes may
The waste water generated due to sprinkling of water on coal stack shall be collected and treated in clarifier; the treated water shall be reused for sprinkling purposed while the dust will be sent to coal stack. The sewage will be treated in the Sewage treatment plant and the treated water shall be utilized in landscaping and dust suppression, whereas the sludge shall be used as manure.

EIA for proposed jetty at Korlai River and expansion of existing jetty at Sanegaon by Indo Energy International Ltd.
TEPL/ENV/CBS/2021‐05 XI
Area Impact Mitigation Measures
contaminate quality of sea water and sediment too. Loading and unloading activities may lead to accidental spillage of material. Storm water drainage system may lead to increase in levels of oil & grease due to spillage or leakage. Water used for hydraulic testing may mix with any of the water body.
The sewage from the ships will also be treated within the ships and hence there will be no risk of contamination of surface or groundwater as a result of the effluent or waste discharge from the ships when within the port area. Ships will not be allowed to release any oily bilge waste or ballast water in the sea within port limits and hence wastes from the ships will also not affect any surface or groundwater according to the International Convention for the Prevention of Pollution from Ships, 1973, as modified by the protocol of 1978 (MARPOL, 73/78), Aqueous discharges from vessels and disposal of solid wastes will be regulated to minimize impact on marine water and sediment quantity. Due care will be taken such that no water pollution/ contamination occurs during loading and unloading activities. The runoff from the slipway, berths, etc will be collected and treated into the effluent treatment plant. Proper storm water drainage system with adequate oil & grease traps shall be incorporated in order to

EIA for proposed jetty at Korlai River and expansion of existing jetty at Sanegaon by Indo Energy International Ltd.
TEPL/ENV/CBS/2021‐05 XII
Area Impact Mitigation Measures
remove any spillage/ leakage/ runoff of oil and other wastes in sea water. Water used for hydraulic testing will not be allowed to mix with any of the water body and will be disposed off through drainage system of local authority.
Terrestrial Ecology
There will be no significant impact of the project on flora and fauna and other vegetation due to any of the pollution parameters during operational phase of the project. No significant impact is envisaged on the local terrestrial flora fauna during the operational phase of the project. Since there are no reserved forests or forest area in the project area, there will not be any violation of flora and fauna. Negligible Impact on marine flora fauna is envisaged due to navigation of ships, loading unloading of cargos, run‐off water from the refueling stations etc. Green belt development will help in attenuating any pollution caused during the operation of the proposed facility.
Proper care will be taken to maintain eco‐balance.
Air Environment
Air quality may impact while loading, unloading and transportation of coal. The major activities envisaged in the proposed project is fugitive emissions from the cargo loading and unloading activities, DG sets, navigational equipment/ machinery.
Water spray or sprinkler system will be provided at the barge unloader, coal stacks and truck loading station. Regular monitoring of air quality as mentioned in EMP will enable to keep the air

EIA for proposed jetty at Korlai River and expansion of existing jetty at Sanegaon by Indo Energy International Ltd.
TEPL/ENV/CBS/2021‐05 XIII
Area Impact Mitigation Measures
Over‐fueling or careless fuelling practices may also lead to impacts on air quality of the project site area.
quality below permissible standards The exhaust emissions from ships/vessels shall be controlled on the ship itself by providing long stacks with air emission control option such as sea‐water scrubbing and fuel substitution. D.G Set will be used only in case of emergency with proper enclosures. Control and check will be kept on careless fuelling of the ships if any and excessive trafficking of the ships at one place. Approach roads will be covered with green belt on both the sides to avoid any air quality problems to the nearby residents. Road Furniture / Signboards will be put along the approach roads and at project building requesting motorists to avoid idling or/and stoppage of the vehicles at non‐designated places
Noise Environment
During the operation phase, noise will be generated due to the operation of the generators, pumps, engines of boats and ships, cranes for handling vessel and shipment. DG set installed for power backup may also result in increase of noise levels of the area when used.
All vehicles used for operation shall be properly maintained by doing properly lubrication and servicing to keep noise/vibration within permissible limits. Silent DG sets will be used during operation with proper enclosures.
ENVIRONMENTAL MONITORING PROGRAM
EIA for proposed jetty at Korlai River and expansion of existing jetty at Sanegaon by Indo Energy International Ltd.
TEPL/ENV/CBS/2021‐05 XIV
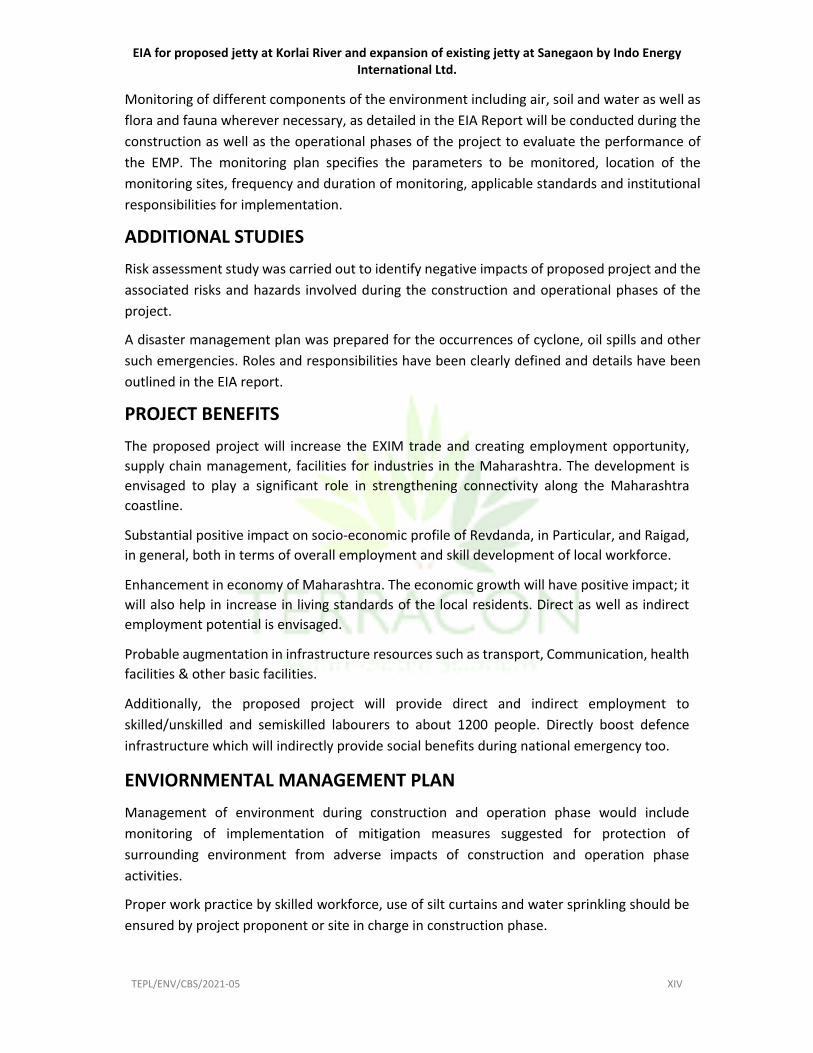
Monitoring of different components of the environment including air, soil and water as well as flora and fauna wherever necessary, as detailed in the EIA Report will be conducted during the construction as well as the operational phases of the project to evaluate the performance of the EMP. The monitoring plan specifies the parameters to be monitored, location of the monitoring sites, frequency and duration of monitoring, applicable standards and institutional responsibilities for implementation.
ADDITIONAL STUDIES
Risk assessment study was carried out to identify negative impacts of proposed project and the associated risks and hazards involved during the construction and operational phases of the project.
A disaster management plan was prepared for the occurrences of cyclone, oil spills and other such emergencies. Roles and responsibilities have been clearly defined and details have been outlined in the EIA report.
PROJECT BENEFITS
The proposed project will increase the EXIM trade and creating employment opportunity, supply chain management, facilities for industries in the Maharashtra. The development is envisaged to play a significant role in strengthening connectivity along the Maharashtra coastline.
Substantial positive impact on socio‐economic profile of Revdanda, in Particular, and Raigad, in general, both in terms of overall employment and skill development of local workforce.
Enhancement in economy of Maharashtra. The economic growth will have positive impact; it will also help in increase in living standards of the local residents. Direct as well as indirect employment potential is envisaged.
Probable augmentation in infrastructure resources such as transport, Communication, health facilities & other basic facilities.
Additionally, the proposed project will provide direct and indirect employment to skilled/unskilled and semiskilled labourers to about 1200 people. Directly boost defence infrastructure which will indirectly provide social benefits during national emergency too.
ENVIORNMENTAL MANAGEMENT PLAN
Management of environment during construction and operation phase would include monitoring of implementation of mitigation measures suggested for protection of surrounding environment from adverse impacts of construction and operation phase activities.
Proper work practice by skilled workforce, use of silt curtains and water sprinkling should be ensured by project proponent or site in charge in construction phase.

EIA for proposed jetty at Korlai River and expansion of existing jetty at Sanegaon by Indo Energy International Ltd.
TEPL/ENV/CBS/2021‐05 XV
Appropriate measures should be taken to reduce noise levels to the possible extent. Training should be given to all the workers for the proper handling of equipment’s with Personal Protective Equipment (PPE).
The cost estimates for implementing EMP shall be INR 1.5 Crores. The cost includes solid waste management, installation of sanitary facilities, STP, ETP, noise meters green belt development etc. The cost required for implementation of Environmental Monitoring Programme for marine ecology and ambient air quality during construction phase is INR 35 lacs.
The cost required for implementation of Environmental Monitoring Programme for marine water quality, ambient air quality monitoring and effluent management from coal stack yard during operation phase is INR 75 lacs per annum.
The cost estimates for implementing EMP during construction phase will be Rs. 21.10 lakhs and Rs. 10.00 lakhs during operation phase.
As a responsible corporate, M/s Indo‐Energy International Limited would integrate its environment, HR and ethical business policies with appropriate community engagement and gender equity. The major social sectors IEIL would emphasize for the local community developments are Education, Water Sanitation, Health, Livelihood and Empowerment, Sports, Environment, and Infrastructure Development. The total budgetary cost towards the CSR plan to be implanted is INR 40 Cr.
SUMMARY AND CONCLUSION
From the Environmental Impact Assessment study, it can be concluded that this project under consideration will not have any significant negative impacts. All possible environment aspects have been adequately assessed and necessary control measures have been formulated to meet the statutory requirements. Thus implementing this project will have positive impacts.

EIA for proposed jetty at Korlai River and expansion of existing jetty at Sanegaon by Indo Energy
International Ltd.
TEPL/ENV/CBS/2021‐05 1
Table of Contents
1. Introduction ........................................................................................................................................ 11
1.1. Preamble ..................................................................................................................................... 11
1.2. General Information on Port and Harbour ................................................................................. 11
1.3. Environment Clearance Process ................................................................................................. 11
1.3.1. Classification of proposed project as per EIA Notification, 2006 ........................................ 14
1.4. CRZ Clearance Process ................................................................................................................ 14
1.5. Classification of the project as per CRZ notification 2011 .......................................................... 16
1.6. Terms Of Reference (TOR) .......................................................................................................... 19
1.7. Validity of EC and CRZ clearance ................................................................................................. 24
1.8. Post Environmental Clearance Monitoring ................................................................................. 25
1.9. Applicable Legal and Policy Framework ...................................................................................... 25
1.10. Generic Structure of the document ........................................................................................ 28
1.11. Introduction of Project Proponent ......................................................................................... 29
1.12. Brief Description of the Project .............................................................................................. 30
1.13. Need of the project ................................................................................................................. 32
1.14. Regulatory Compliance ........................................................................................................... 32
1.15. Environmental Sensitivity ....................................................................................................... 32
2. Project Description.............................................................................................................................. 37
2.1. General ........................................................................................................................................ 37
2.2. Description of Project Site .......................................................................................................... 37
2.2.1. Existing Infrastructure ......................................................................................................... 38
2.3. Project Details of Proposed Jetty ................................................................................................ 39
2.3.1. Salient features of proposed port configuration ................................................................ 40
2.4. Project Details of Sanegaon Facility ............................................................................................ 43
2.4.1. Existing Facility .................................................................................................................... 43
2.4.2. Need of Expansion at Sanegaon Facility ............................................................................. 43
2.4.3. Improvements proposed for Augmenting Capacity ............................................................ 43
2.5. Present Opration ......................................................................................................................... 46
2.6. Traffic Study & Demand Assessment .......................................................................................... 46
2.6.1. Methodology ....................................................................................................................... 46
2.6.2. Forecast Model ................................................................................................................... 46
2.6.3. Total Traffic for the port ..................................................................................................... 47

EIA for proposed jetty at Korlai River and expansion of existing jetty at Sanegaon by Indo Energy
International Ltd.
TEPL/ENV/CBS/2021‐05 2
2.7. Engineering surveys and investigations ...................................................................................... 48
2.7.1. Objective of Work ............................................................................................................... 48
2.7.2. Laboratory testing ............................................................................................................... 48
2.7.3. Soil Condition ...................................................................................................................... 48
2.7.4. Foundation Recommendation ............................................................................................ 49
2.7.5. Dredgeability ....................................................................................................................... 49
2.8. Development plans for proposed jetty ....................................................................................... 49
2.8.1. Demarcation of Port Basin .................................................................................................. 49
2.9. Navigation Channel ..................................................................................................................... 49
2.9.1. Alignment ............................................................................................................................ 50
2.9.2. Navigational Requirements ................................................................................................. 51
2.9.3. Model Bathymetry .............................................................................................................. 51
2.9.4. Hydrodynamic Model .......................................................................................................... 52
2.9.5. Turning Circle in the basin................................................................................................... 53
2.9.6. Berths .................................................................................................................................. 54
2.9.7. Berth Requirements ............................................................................................................ 54
2.9.8. Width of the Berth .............................................................................................................. 55
2.10. On shore layout & requirements ............................................................................................ 60
2.10.1. Utilization of land reclaimed for the Project.................................................................... 60
2.10.2. Storage Area. ................................................................................................................... 61
2.10.3. Operation area at the Berth ............................................................................................ 61
2.10.4. Ship Unloading ................................................................................................................ 62
2.10.5. Proposed System ............................................................................................................. 62
2.10.6. Edible Oil ......................................................................................................................... 64
2.10.7. Proposed System (Edible Oil) .......................................................................................... 68
2.10.8. Bauxite ............................................................................................................................ 68
2.10.9. Reclaiming and Ship loading ........................................................................................... 68
2.10.10. System Description .......................................................................................................... 69
2.10.11. Reclaiming and Ship loading ............................................................................................ 69
2.11. Stacking area Computation ..................................................................................................... 69
2.12. Dredging .................................................................................................................................. 70
2.12.1. Quantity of dredging ....................................................................................................... 70
2.12.2. Dredged Volume ............................................................................................................. 70
2.12.3. Dispersion of Dredged material ...................................................................................... 72
2.12.4. Reclamation .................................................................................................................... 73

EIA for proposed jetty at Korlai River and expansion of existing jetty at Sanegaon by Indo Energy
International Ltd.
TEPL/ENV/CBS/2021‐05 3
2.13. Road And Rail Connectivity ..................................................................................................... 74
2.13.1. Road ................................................................................................................................ 74
2.13.2. Rail ................................................................................................................................... 75
2.14. Natural resources .................................................................................................................... 75
2.14.1. Water requirement ......................................................................................................... 75
2.14.2. Power requirement ......................................................................................................... 76
2.14.3. Wastewater Generation and Management .................................................................... 76
2.14.4. Solid Waste Generation and Management ..................................................................... 76
2.15. Manpower requirement ......................................................................................................... 77
2.16. Project implementation schedule ........................................................................................... 77
3. Description of environment ................................................................................................................ 79
3.1. General ........................................................................................................................................ 79
3.2. Study Area ................................................................................................................................... 79
3.3. Topographic Survey .................................................................................................................... 80
3.4. Geology ....................................................................................................................................... 81
3.4.1. Drainage Pattern ................................................................................................................. 81
3.5. Physiography ............................................................................................................................... 82
3.6. Land Use ...................................................................................................................................... 84
3.7. Shore line .................................................................................................................................... 86
3.8. Seismicty ..................................................................................................................................... 87
3.9. Cyclone zone ............................................................................................................................... 88
3.10. Water Environment ................................................................................................................ 89
3.11. Biological Environment ........................................................................................................... 91
3.11.1. Marine Ecology................................................................................................................ 91
3.11.2. Terrestrial Ecology .......................................................................................................... 96
3.11.3. Material and methods ..................................................................................................... 96
3.11.4. Sampling Stations ............................................................................................................ 98
3.12. Air Environment .................................................................................................................... 107
3.12.1. Meteorological Data ..................................................................................................... 107
3.12.2. Secondary ...................................................................................................................... 107
3.13. Air Quality ............................................................................................................................. 126
3.14. Noise Quality ......................................................................................................................... 139
3.15. Socio‐Economic Environment ............................................................................................... 141
4. Anticipated environmental impact and mitigation measures .......................................................... 147
4.1. Environmental Impact Assessment Definitions (EIA) ................................................................ 147

EIA for proposed jetty at Korlai River and expansion of existing jetty at Sanegaon by Indo Energy
International Ltd.
TEPL/ENV/CBS/2021‐05 4
4.2. Purpose of Environment Impact Assessment ........................................................................... 147
4.3. Potential Environment Impacts of the Project ......................................................................... 148
4.4. Environment impact assessment and mitigation measures ..................................................... 148
4.4.1. Introduction ...................................................................................................................... 148
4.5. Significant Environmental Impacts and Mitigative Measures .................................................. 148
4.5.2. Important attributes during construction phase .............................................................. 150
4.6. Impacts during construction phase ........................................................................................... 151
4.6.1. Air quality .......................................................................................................................... 151
4.6.2. Noise quality ..................................................................................................................... 152
4.6.3. Water quality .................................................................................................................... 153
4.6.4. Land environment ............................................................................................................. 155
4.6.5. Topography soil and geology ............................................................................................ 156
4.6.6. Reserved forest and fauna ................................................................................................ 156
4.6.7. Land use ............................................................................................................................ 156
4.6.8. Impacts on utility services and community severance ..................................................... 157
4.6.9. Marine Environment ......................................................................................................... 157
4.6.10. Impacts during operation phase ................................................................................... 158
4.6.11. Air quality ...................................................................................................................... 158
4.6.12. Noise quality ................................................................................................................. 159
4.6.13. Water quality ................................................................................................................ 160
4.6.14. Land Environment ......................................................................................................... 161
4.6.15. Ecological resources and flora and fauna ..................................................................... 161
4.6.16. Land use ........................................................................................................................ 162
4.6.17. Oil spills: ........................................................................................................................ 163
4.6.18. Mangrove: ..................................................................................................................... 163
4.6.19. Dredging and dredged material management activities: ............................................. 164
4.6.20. IMPACTS ON QUALITY OF LIFE ...................................................................................... 164
4.6.21. Construction Phase ....................................................................................................... 165
4.6.22. Operation Phase ............................................................................................................ 168
4.6.23. Evaluation of impacts .................................................................................................... 171
4.6.24. Evaluation of impacts .................................................................................................... 171
5. Alternative Analysis........................................................................................................................... 174
6. Environmental Monitoring programme ............................................................................................ 178
6.1. The Need ................................................................................................................................... 178
6.2. Monitoring Plan ........................................................................................................................ 179

EIA for proposed jetty at Korlai River and expansion of existing jetty at Sanegaon by Indo Energy
International Ltd.
TEPL/ENV/CBS/2021‐05 5
6.2.1. Monitoring during Construction Phase ............................................................................. 179
6.2.2. Monitoring during the Operational Phase ........................................................................ 179
6.3. Reporting ................................................................................................................................... 179
6.3.1. Compliance Reports .......................................................................................................... 179
7. Additional Studies ............................................................................................................................. 184
7.1. Environmental risk .................................................................................................................... 184
7.1.1. Risk identification and quantification ............................................................................... 184
7.1.2. Risk mitigation ................................................................................................................... 184
7.1.3. Concept of risk assessment ............................................................................................... 185
7.1.4. Leaks and spillages ............................................................................................................ 185
7.1.5. Risk analysis study ............................................................................................................. 187
7.2. Onsite emergency plan ............................................................................................................. 188
7.2.1. Life saving appliances and arrangements ......................................................................... 189
7.2.2. Occupational health and safety ........................................................................................ 189
7.3. Disaster management plan (dmp) ............................................................................................ 191
7.3.1. Disaster management plan objective ............................................................................... 191
7.3.2. Emergency plan for berths and vessel terminal ............................................................... 192
7.3.3. Rough weather .................................................................................................................. 192
7.3.4. First aid & fire fighting services ......................................................................................... 192
7.3.5. Identification of major hazards ......................................................................................... 192
7.4. Emergency response measures for natural hazards ................................................................. 193
7.4.1. Response in case of earthquake ....................................................................................... 193
7.4.2. Response in case of Fire .................................................................................................... 194
7.4.3. Response in case of Tsunamis/Storm Surges .................................................................... 195
7.5. Identification and assessment of hazards ................................................................................. 196
8. Project benefits ................................................................................................................................. 199
8.1. Economic Benefits ..................................................................................................................... 199
8.2. Socio‐economical benefits ........................................................................................................ 199
8.3. Aesthetics and landscape .......................................................................................................... 199
8.4. Corporate environmental responsibility ................................................................................... 199
9. Environmental Management Plan .................................................................................................... 204
9.1. General ...................................................................................................................................... 204
9.2. Objectives of Environment Management ................................................................................. 204
9.3. Identification of implementing authority ................................................................................. 205
9.4. EMP for Construction and Operation Phase ............................................................................. 205

EIA for proposed jetty at Korlai River and expansion of existing jetty at Sanegaon by Indo Energy
International Ltd.
TEPL/ENV/CBS/2021‐05 6
9.4.1. Construction Phase ........................................................................................................... 205
9.4.2. Operation Phase ................................................................................................................ 208
9.5. Details of management plans ................................................................................................... 211
9.5.1. Water Management .......................................................................................................... 211
9.5.2. Control of Water Pollution from Marine Transportation ................................................. 211
9.5.3. Solid and Hazardous Waste Management Plan ................................................................ 212
9.5.4. Other waste ....................................................................................................................... 213
9.5.5. Energy conservation .......................................................................................................... 214
9.5.6. Plantation, Landscaping and Ecological Management ..................................................... 215
9.6. Environment Management Cost ............................................................................................... 216
9.6.1. Environmental training ..................................................................................................... 217
10. Summary & Conclusion ................................................................................................................ 219
10.1. Summary ............................................................................................................................... 219
10.2. Conclusion ............................................................................................................................. 222
11. Disclosure of Consultants............................................................................................................. 224
11.1. About Consultant .................................................................................................................. 224
11.2. Accreditation of Organisation ............................................................................................... 224
11.3. Services ................................................................................................................................. 224
ListofFigures
Figure 1.1 Project layout for proposed deep water jetty superimposed on CRZ map ............................... 17
Figure 1.2 Project layout superimposed on CRZ map for Capacity expansion of Sanegaon facility ........... 18
Figure 1.3 Project location map .................................................................................................................. 31
Figure 1.4 Environment sensitivity map ..................................................................................................... 35
Figure 2.1 Korlai Deepwater Jetty off the mouth of the Kundalika River ................................................... 37
Figure 2.2 Existing JSW Revdanda port facility ........................................................................................... 38
Figure 2.3 Existing Sanegaon Facility .......................................................................................................... 39
Figure 2.4 Middle Spans of Bridge on Kundalika River ............................................................................... 39
Figure 2.5 Concept plan for development of jetty on Kundalika River ....................................................... 40
Figure 2.6Layou of proposed jetty .............................................................................................................. 42
Figure 2.7 Existing Sanegaon facility ........................................................................................................... 43
Figure 2.8Layout for Sanegaon facility ........................................................................................................ 45
Figure 2.9 Location of present unloading facility at Sanegaon on the West Coast of India .................... 46
Figure 2.10Methodology adopted for the traffic study and demand ......................................................... 46
Figure 2.11 Total Traffic for the Proposed Facility at Revdanda ................................................................. 47

EIA for proposed jetty at Korlai River and expansion of existing jetty at Sanegaon by Indo Energy
International Ltd.
TEPL/ENV/CBS/2021‐05 7
Figure 2.12 Location of the port basin ........................................................................................................ 49
Figure 2.13 Navigation channel plan – Navigation chart #2026 (Extract) .................................................. 51
Figure 2.14 Bathymetry of the Kundalika River and Arabian Sea for computation .................................... 52
Figure 2.15 Flow concentration/or stagnation ........................................................................................... 53
Figure 2.16 Bathymetry of the Kundalika River and Arabian Sea for computation (Close up) .................. 53
Figure 2.17 Cross section of Approach trestle ............................................................................................ 55
Figure 2.18 Section of the Berth facility ...................................................................................................... 56
Figure 2.19Flow diagram for coal handling ................................................................................................ 60
Figure 2.20 Section of the Final Phase Stock yard for coal ......................................................................... 61
Figure 2.21 Operation at the berth ............................................................................................................. 62
Figure 2.22 Storage Shed for fertilizers ...................................................................................................... 63
Figure 2.23 Truck and Rake loading shed for fertilizers .............................................................................. 64
Figure 2.24 Unloading of ship by flexible hose ........................................................................................... 65
Figure 2.25 Unloading of ship by unloading arms ...................................................................................... 65
Figure 2.26 The P&I diagram for the Liquid cargo handling ....................................................................... 66
Figure 2.27 Truck/Wagon Loading System for POL/OIL .............................................................................. 67
Figure 2.28 Loading arrangements at the Bauxite Yard ............................................................................. 68
Figure 2.29 Inner and Outer Navigational Channel used for computation of quantities ........................... 71
Figure 2.30 Computation of Dredged Volume ............................................................................................ 71
Figure 2.31 Dumping location of dredged materials .................................................................................. 72
Figure 2.32 Model simulated deposition depth after dumping ................................................................. 73
Figure 2.33 Layout of the Berth along with the approaches and mooring dolphin ................................... 74
Figure 3.1 Topography map ........................................................................................................................ 80
Figure 3.2: Drainage map of Raigad ............................................................................................................ 82
Figure 3.3 Physiography map of Raigad district .......................................................................................... 83
Figure 3.4 Land use map of proposed project site ..................................................................................... 85
Figure 3.5 Physical setting of the Shorelines & creek area fo Korli deep water jetty ................................. 86
Figure 3.6 Map showing seismic zones of India .......................................................................................... 87
Figure 3.7 : Wind and Cyclone Zones in IndiaSediment Quality ................................................................. 88
Figure 3.8 Water Sampling .......................................................................................................................... 91
Figure 3.9 Sampling locations for flora & fauna ......................................................................................... 99
Figure 3.10 Marine sampling locationsFlora ............................................................................................. 100
Figure 3.11wind rose ................................................................................................................................ 108
Figure 3.12 Data collection stations.......................................................................................................... 125
Figure 3.13 Measured Current Strength and Direction at Location C1 .................................................... 125
Figure 3.14 Measured Current Strength and Direction at Location C2 .................................................... 126
Figure 3.15 Graph of Ambient Air Quality Analysis for PM10 .................................................................... 136

EIA for proposed jetty at Korlai River and expansion of existing jetty at Sanegaon by Indo Energy
International Ltd.
TEPL/ENV/CBS/2021‐05 8
Figure 3.16Graph of Ambient Air Quality Analysis for PM2.5 .................................................................... 136
Figure 3.17Graph of Ambient Air Quality Analysis for SO2 ....................................................................... 137
Figure 3.18Graph of Ambient Air Quality Analysis for NO2 ...................................................................... 137
Figure 3.19Graph of Ambient Air Quality Analysis for NH3 ...................................................................... 138
Figure 3.20Graph of Ambient Air Quality Analysis for CO ........................................................................ 138
Figure 3.21Graph of Ambient Air Quality Analysis for Ozone .................................................................. 139
Figure 5.1 Possible locations of the port .................................................................................................. 174
List of Tables
Table 1.1 Standard ToR ............................................................................................................................... 19
Table 1.2 Additional ToR ............................................................................................................................ 23
Table 1.3 Applicable legal and policy framework ....................................................................................... 25
Table 1.4: Environment sensitivity of the project sites .............................................................................. 32
Table 2.1: Salient features of proposed jetty facility .................................................................................. 40
Table 2.2 Existing and Projected Traffic at the Sanegaon Barge facility ..................................................... 44
Table 2.3 Design vessels for the Proposed Jetty/Port ................................................................................ 50
Table 2.4 Berth Requirements in Phase –I .................................................................................................. 57
Table 2.5 Berth Requirements in Phase – II ................................................................................................ 57
Table 2.6 Berth Requirements in Phase – III ............................................................................................... 58
Table 2.7 Occupancy of the ship unloader fertilizer handling for .............................................................. 62
Table 2.8 Storage area requirements for various phases ........................................................................... 69
Table 2.9Designed Ship Vessel Size ............................................................................................................ 70
Table 2.10 Designed depths in the Navigation channel for a vessel draft of 14.3 m ................................. 70
Table 3.1 Environmental Monitoring Stations ............................................................................................ 80
Table 3.2 Damage capacity of cyclone ........................................................................................................ 88
Table 3.3 Phytoplankton Species observed ................................................................................................ 92
Table 3.4: Observed Zooplankton Species with Diversity Index ................................................................. 94
Table 3.5: Observed Macro Benthic Fauna ................................................................................................. 95
Table 3.6 Habitat summary of the EB sampling points ............................................................................... 98
Table 3.7 Wind data .................................................................................................................................. 108
Table 3.8 Ambient Air Quality Monitoring Standards (CPCB) ................................................................... 127
Table 3.9 Techniques for Measurement of Pollutants ............................................................................. 127
Table 3.10 Ambient Air Monitoring Report .............................................................................................. 129
Table 3.11 Ambient Air Quality Recorded at eight locations .................................................................... 135
Table 3.12 Ambient Noise Levels .............................................................................................................. 140
Table 3.13: Basic features of Maharashtra ............................................................................................... 141

EIA for proposed jetty at Korlai River and expansion of existing jetty at Sanegaon by Indo Energy
International Ltd.
TEPL/ENV/CBS/2021‐05 9
Table 3.14: Maharashtra Population (SC and ST) ..................................................................................... 142
Table 3.15: Maharashtra Literacy Level .................................................................................................... 142
Table 3.16: Maharashtra Worker Population ........................................................................................... 142
Table 3.17: Basic features of Raigad district ............................................................................................. 143
Table 3.18: Raigad District Population (SC and ST) ................................................................................... 143
Table 3.19: Raigad District Literacy Level ................................................................................................. 144
Table 3.20: Raigad District Worker Population ......................................................................................... 144
Table 4.1Environmental Impacts and Mitigation Measures ..................................................................... 165
Table 4.2Environmental Impacts and Mitigation Measures ..................................................................... 168
Table 4.3 List of possible environment impacts due to proposed project ............................................... 172
Table 5.1 Multi‐criteria analysis of the three port locations .................................................................... 175
Table 6.1 Environmental Monitoring Plan during project construction phase and operation phase ...... 180
Table 7.1 Information to be Maintained of Emergency Response Agencies. ........................................... 190
Table 7.2 Summary of the Disasters Preparedness Plans ......................................................................... 196
Table 9.1: Environment Management Plan for Construction Phase ........................................................ 206
Table 9.2: EMP for Operation Phase ......................................................................................................... 209
Table 9.3 Budgetary rovision for EMP during Construction Phase ........................................................... 216
Table 9.4 Budgetary Provision for EMP during Operation Phase ............................................................. 216
List of Annexures
Annexure 1: Awarded ToR Annexure 2: Ship tranquillity study Annexure 3: Appendix for Terrestrial Ecology Annexure 4: Compliance for 49th EAC meeting

EIA for proposed jetty at Korlai River and expansion of existing jetty at Sanegaon by Indo Energy
International Ltd.
TEPL/ENV/CBS/2021‐05 10
Chapter1Introduction

EIA for proposed jetty at Korlai River and expansion of existing jetty at Sanegaon by Indo Energy
International Ltd.
TEPL/ENV/CBS/2021‐05 11
1. INTRODUCTION
1.1. PREAMBLE
An Environmental Impact Assessment (EIA) is an assessment of the impacts ‐ adverse or beneficial ‐ that a proposed project may have on the environment, together consisting of the natural, social and economic aspects. Its purpose is to identify, examine, assess and evaluate the likely and probable impacts of a proposed project on the environment and thereby, to design action plans to minimize adverse impacts on the environment.
The Ministry of Environment, Forest & Climate Change, Government of India, New Delhi (MoEFCC), through its EIA Notification number SO1533 (E) issued on 14th September 2006 and its subsequent amendments, under the Environment Protection Act, 1986. The EIA notification 2006 categorizes various projects and subscribes different processes for Environment Clearance.
EC procedure outlined in the EIA Notification reduces conflicts by promoting community participation, public information and transparent decisions as well as helps in developing the base for environmentally sound project.
1.2. GENERAL INFORMATION ON PORT AND HARBOUR
Ports and harbours serve an essential medium of maritime trade in India. Country’s 95% trade by volume and 70% by value occurs through maritime transport. Enhancement of standard of living calls for continual growth in the economy and commensurate development of all the associated sectors of the country as a whole. The intensification of maritime traffic needs sustainable management of ports to reduce harmful consequences on local population and environment as well as economy of the country.
Port activities can cause deterioration of air and marine ecology in the surrounding areas due to multifarious activities. Hence, for the determination of levels of pollution, identification of pollution sources, control and disposal of waste from various point and non‐point sources and for prediction of pollution levels for future, regular monitoring and assessment are required for ports.
In order to assess the likely impacts arising during construction and operation of port, harbour or other facilities using inshore and foreshore zones, EIA study is undertaken, followed by preparation of a detailed Environment Management Plan (EMP) to ensure effectiveness of the impact mitigation strategies implemented.
1.3. ENVIRONMENT CLEARANCE PROCESS
The Ministry of Environment, Forest & Climate Change, Government of India, New Delhi (MoEFCC), through its EIA Notification number SO1533 (E) issued on 14th September 2006 and its subsequent amendments, under the Environment Protection Act, 1986, classified the Ports, harbors, break waters and dredging projects into two Categories. The project handling ≥ 5 MTPA (Million Tons Per Annum) of cargo falls under Category A and the project handling <5 MTPA of cargo and ≥10,000 TPA of fish handling capacity falls under Category B. Category A projects (including new, expansion and modernization of existing projects) require Prior EC from MoEFCC

EIA for proposed jetty at Korlai River and expansion of existing jetty at Sanegaon by Indo Energy
International Ltd.
TEPL/ENV/CBS/2021‐05 12
while Category B projects are to be considered by the State Level Environmental Impact Assessment Authority (SEIAA), constituted by MoEFCC. If in case the “General Condition” given in the EIA Notification are applicable to any Category B project, it is be treated as a Category A and will be appraised by EAC. Given below are the General Conditions specified to in the Notification:
New EIA notification 2020 is published but still is in draft stage. It can be applicable to the project if it is finalized and relished by MoEFCC in span of acquiring EC for this project If located in whole or in part within 5 km from the boundary of: (I) Protected areas notified under the Wildlife (Protection) Act, 1972; (II) Critically polluted areas as identified by the CPCB from time to time; (III) Eco‐sensitive areas as notified under section 3 of the Environment (Protection) Act, 1986 (IV) Inter‐state boundaries and international boundaries
Application for Prior Environmental Clearance (EC)
An EIA project is initiated by the project proponent submitting a ToR application for an EC to either the MoEFCC or the SEAC as the case may be. The application is made in the Form 1 format provided in the EIA Notification. Form 1 covers basic information about the project. As a part of Form 1 the project proponent has to propose a set of Terms of Reference (ToR) for the EIA studies that it would undertake for the project and a copy of the pre‐feasibility project report. The process of EC can begin only after the approval of ToR from MoEFCC or SEAC. Stages in the EC Process for New Projects
The EC process for new projects comprises of a maximum of four stages, all of which may not apply to particular cases as set forth below in this Notification. These four stages in sequential order are: ‐ • Stage (1) Screening (Only for Category ‘B’ projects and activities) • Stage (2) Scoping • Stage (3) Public Consultation • Stage (4) Appraisal Stage (1) ‐ Screening
In case of Category ‘B’ projects or activities, this stage involves the scrutiny of the Form 1 by the concerned SEAC for determining whether or not the project or activity requires further environmental studies for preparation of an EIA report for its appraisal prior to the grant of the EC depending upon the nature and location specificity of the project. The projects requiring an EIA is termed Category ‘B1’ and remaining projects as Category ‘B2’ which do not require an EIA. For categorization of projects into B1 or B2 the MOEFCC issues appropriate guidelines from time to time.
Stage (2) ‐ Scoping
“Scoping” refers to the process by which the EAC in the case of Category ‘A’ projects or activities, and SEAC in the case of Category ‘B1’ projects or activities, including applications for expansion and/or modernization, determine detailed and comprehensive ToR addressing all relevant

EIA for proposed jetty at Korlai River and expansion of existing jetty at Sanegaon by Indo Energy
International Ltd.
TEPL/ENV/CBS/2021‐05 13
environmental concerns for the preparation of EIA Report in respect of the project or activity for which prior environmental clearance is sought.
Stage (3): Public Consultation
“Public Consultation” refers to the process by which the concerns of local affected persons and others who have plausible stake in the environmental impacts of the project or activity are ascertained with a view to taking into account all the material concerns in the project or activity design as appropriate. All Category ‘A’ and Category B1 projects or activities are required to undertake Public Consultation, in accordance with the procedure described in Appendix IV of the Notification, except the following:
a. Modernization of irrigation projects. b. All Category ‘B2’ projects and activities. c. All projects or activities concerning national defense and security or involving other
strategic considerations as determined by the Central Government. The Public Hearing ordinarily has two components comprising of:
(a) A Public Hearing at the project site or in its close proximity – district‐wise to be carried out in the manner prescribed in Appendix IV for ascertaining concerns of the project affected persons;
(b) Obtain responses in writing from other concerned persons having a plausible stake in the environmental aspects of the project or activity and attempting to satisfy them through facts if some of the concerns are unfounded or due to incorrect assessment of the consequences.
The public hearing at, or in close proximity to, the site(s) in all cases is to be conducted by the State Pollution Control Board (SPCB) or the Union territory Pollution Control Committee (UTPCC) concerned in the specified manner and forward the proceedings to the regulatory authority concerned within 45 (forty‐five) days of a request to the effect from the applicant.
Stage (4): Appraisal
Appraisal means the detailed scrutiny by the EAC or SEAC of the application and other documents like Detailed Project Report (DPR), the Final EIA and EMP Report, outcome of the Public Consultations including Public Hearing proceedings, submitted by the applicant to the regulatory authority concerned for grant of environmental clearance. On conclusion of this proceeding, the EAC or SEAC concerned makes categorical recommendations to the regulatory authority concerned either for grant of EC on stipulated terms and conditions, or rejection of the application for EC, together with reasons for the same.
Grant or Rejection of EC
The regulatory authority considers the recommendations of the EAC or SEAC concerned and convey its decision to the applicant within 45 days of the receipt of the recommendations of the EAC or the SEAC concerned or in other words within 105 days of the receipt of the Final EIA, and

EIA for proposed jetty at Korlai River and expansion of existing jetty at Sanegaon by Indo Energy
International Ltd.
TEPL/ENV/CBS/2021‐05 14
where EIA is not required, within 105 days of the receipt of the complete application with requisite documents, except as indicated otherwise in the Notification.
1.3.1. CLASSIFICATION OF PROPOSED PROJECT AS PER EIA NOTIFICATION, 2006
The proposed project “Development of deep water jetty facility on Kundalika river, village‐Korlai, Ditrict‐Raigad, Maharashtra & capacity expansion of existing inland water jetty facility, on Kundalika rivers village‐Sanegaon, Ditrict‐Raigad, Maharashtra” falls under Category A as per EIA Notification 2006 and its subsequent amendments as proposed project involves development of the Jetty about 525 m long with one 8 m x 8 m mooring dolphin on the east side. The project will involve dredging a 14.5 km channel requiring 11 million cum of dredging for a depth of 11.0 m CD in Phase I. In second phase channel length would increase to 17.5 km and would require 23 million cum (i.e. 12 million cum additional) of dredging for a channel depth of 14.6 m CD. In the final phase the channel length would increase to 21.5 km and would require 35.5 million cum (i.e. additional 12.5 million cum) dredging for a channel depth of 19.0 m CD and Dredging of 0.99 Mm3 in the inner channel from Korlai to Sanegaon for a depth of 3.1 m CD.
Public Consultation was carried out at two different locations for Korlai and Sanegaon projects. First public hearing for Korlai Project was held at Mount Carmel High School, on 19.11.2016, Second hearing was held for Sanegaon Project on 21.11.2016 near project site respectively and public MoM of same is published by MPCB (Raigad II SRO)..
1.4. CRZ CLEARANCE PROCESS
MoEFCC had declared coastal stretches as Coastal Regulation Zone and imposed restrictions on industries, operations and processes in the CRZ through a Notification in 2019 and outlined the procedure for obtaining the CRZ clearance for the developmental activities in the CRZ.
However, as per the letter no. F.No.19‐36/2017‐IA.III dated 26.02.2019 by MoEFCC, clarification on implementation of project falling in CRZ area in Maharashtra has been given which directs to state that “Until the CZMPs of Maharashtra prepared under provision of CRZ notification 2011 are updated/revised under provision of CRZ notification 2019 issued vide GSR 37(E),dated 18.01.2019 the provision of CRZ notification 2011 shall continue to be followed for appraisal and CRZ clearance of projects in CRZ area and provision of new notification shall not apply”.
Hence, as per the Coastal Regulation Zone Notification 2011 and its amendments thereafter; for regulating development activities along the coast open to the sea, the coastal stretches within 500 m of High Tide Line (HTL) on the landward side are classified into four categories, namely: CRZ (I), (II), (III) and (IV).
1. CRZ‐I: (A): The areas that are ecologically sensitive and the geomorphological features which play a role in the maintaining the integrity of the coast,‐ (i) mangroves; (ii) coral reefs; (iii) sand beaches and sand dunes; (iv) mudflats; (v) protected areas under the Wild Life (Protection) Act, 1972 (53 of 1972), the Forest (Conservation) Act, 1980 (69 of 1980) or Environment (Protection) Act, 1986 (29 of 1986); (vi) salt marshes; (vii) turtle nesting grounds; (viii) horse shoe crabs

EIA for proposed jetty at Korlai River and expansion of existing jetty at Sanegaon by Indo Energy
International Ltd.
TEPL/ENV/CBS/2021‐05 15
habitats; (ix) sea grass beds; (x) sea weed beds; (xi) nesting grounds of birds; (xii) fishing villages and areas of traditional rights.
(B) ‐ The area between Low Tide Line and High Tide Line.
2. CRZ‐II ‐ The areas that have been developed up to or close to the shoreline.
3. CRZ‐III ‐ Areas that are relatively undisturbed and those do not belong to either CRZ‐I or II which include coastal zone in the rural areas (developed and undeveloped) and also areas within municipal limits or in other legally designated urban areas, which are not substantially built up.
4. CRZ‐IV: CRZ IV shall constitute the water area and is further classified as follows:
(A) The water area from the Low Tide Line to twelve nautical miles on the seaward side; and
(B) The water area of the tidal influenced water body from the mouth of the water body at the sea up to the influence of tide which is measured as five parts per thousand during the driest season of the year.
If an organization wishes to obtain CRZ clearance for the development/construction activity, it will be first required to prepare an EIA report for the project. An important step for preparing EIA for CRZ clearance is to classify the site to appropriate CRZ category. This is to be done by the help of CRZ mapping of the area through an agency authorized by the MOEFCC. CRZ map which is to be in 1:4000 scale normally shows the area of 7 km radius from the proposed project site. Various technical aspects like HTL, LTL, eco sensitive areas etc. are to be shown on the map along with the superimposition of the proposed project. The MOEFCC has authorized 8 agencies across India to undertake the CRZ mapping.
Authorized agencies by MoEFCC for carrying out CRZ mapping are:
Space Application Centre–Ahmadabad Centre for Remote Sensing–CESS, Thiruvananthapuram Institute for Remote Sensing–Anna University–Chennai Institute for wetland Management and ecological designs–Kolkata National Hydrographic Office–Dehradun National Institute of Oceanography–Goa National Institute of Ocean Technology– Chennai National Centre for Sustainable Coastal Management (NCSCM).
Every coastal state in India has a Coastal Zone Management Authority (CZMA) which has the mandate to accord CRZ clearance / recommendation to the proposed development activity. The documents and reports that need to be submitted for consideration of the CRZ clearance are given below:
Project summary details which includes relevant information about the project in a summarized form
EIA Report

EIA for proposed jetty at Korlai River and expansion of existing jetty at Sanegaon by Indo Energy
International Ltd.
TEPL/ENV/CBS/2021‐05 16
Disaster Management Report, Risk Assessment Report and Management Plan CRZ map indicating HTL and LTL demarcated by an authorized agency (1:4000 scale) Project layout superimposed on the CRZ map No Objection Certificate from the concerned State Pollution Control Board or Union
territory Pollution Control Committee for the projects involving discharge of effluents, solid wastes, sewage etc.
The concerned CZMA examines the above documents in accordance with the approved EMP and CRZ Notification and calls for a meeting within 60 days from the receipt of above documents. If the Committee finds the proposed project appropriate for clearance their recommendation is forward to MoEFCC or SEIAA where final clearance is granted to the project.
1.5. CLASSIFICATION OF THE PROJECT AS PER CRZ NOTIFICATION 2011
The proposed deep water jetty facility project fall under CRZ IVB, II and IB according to the CRZ map. The CRZ map (HTL/LTL Demarcation) for this project is prepared by National Centre for Sustainable Costal Management (NCSCM) Chennai. Capacity expansion of existing inland water jetty facility at Sanegaon falls under CRZ III, CRZ I. Project layout superimposed on approved CRZ map for proposed deep water jetty given in Figure 1.1. and for Capacity expansion for Sanegaon facility is given in
Figure 1.2.

EIA for proposed jetty at Korlai River and expansion of existing jetty at Sanegaon by Indo Energy International Ltd.
TEPL/ENV/CBS/2021‐05 17
Figure 1.1 Project layout for proposed deep water jetty superimposed on CRZ map

EIA for proposed jetty at Korlai River and expansion of existing jetty at Sanegaon by Indo Energy International Ltd.
TEPL/ENV/CBS/2021‐05 18
Figure 1.2 Project layout superimposed on CRZ map for Capacity expansion of Sanegaon facility

EIA for proposed jetty at Korlai River and expansion of existing jetty at Sanegaon by Indo Energy
International Ltd.
TEPL/ENV/CBS/2021‐05 19
1.6. TERMS OF REFERENCE (TOR)
As per EIA Notification 2006 and its amendments, ToR application (Form‐I, Prefeasibility Report and proposed ToR) were submitted to MoEFCC for grant of ToR on 10th of November 2015. The ToR presentation was conducted during meeting held on 21st and 22nd December 2015 TOR was issued on 28th January, 2016 vide letter no. F. No.10‐34/2015‐IA.III (Annexure 1). On the basis of recommendations of the Committee, Ministry of Environment, Forest and climate Change hereby accord approval to the project for award of TOR with following stipulations as listed in Table 1.1 and Table 1.2
Table 1.1 Standard ToR
S. No. Standard ToR Compliance
1
Reason for selecting the site with details of alternative sites examined/rejected/selected on merit with comparative statement and reason/basis for selection. The examination should justify site suitability in terms of environmental angles, resources sustainability associated with selected site as compared to rejected sites. The analysis should include parameters considered along with weightage criteria for short listing selected site.
Details of Alternatives are given in Chapter 5
2
Details of the land use break‐up for the proposed project. Details of the land use around 10 km radius of the project site. Examine and submit details of land use around the 10 km radius of the project site and map of the project area and 10 km area from boundary of the proposed/existing project area, delineation project area notified under the wildlife (protection) Act 1972/critically polluted area as identified by CPCB from time to time/ notified eco‐ sensitivity area/interstate boundaries and international boundaries. Analysis should be made based on latest satellite imagery for land use with raw images.
Land use map is presented inChapter 3 and the details of Study Area of 10 km radius around the project site are given in Chapter 3 Section 3.5
3
Submit the present land use and permission required for any conversion such as forest, agriculture, etc. land acquisition status, rehabilitation of communities / villages and present status of such activities.
Present land use is included in Chapter 3 section 3.6. Conversion of forest land is not involved.

EIA for proposed jetty at Korlai River and expansion of existing jetty at Sanegaon by Indo Energy
International Ltd.
TEPL/ENV/CBS/2021‐05 20
S. No. Standard ToR Compliance
4
Examine and submit the water bodies including the seasonal ones within the corridor of impact along with their status, volumetric capacity, and quality likely impacts on them due to the project.
Water bodies in the study area are mentioned in Chapter 3 section 3.10. The impacts on water bodies due proposed project and its mitigation measures are given in Chapters 4.
5 Submit a copy of the contour plan with slope, drainage pattern of the site and surrounding area.
Contour plan and drainage pattern is given in Chapter 3 section 3.3.1
6 Submit the details of terrain, level with respect to MSL, filling required, source of filling materials and transportation details etc.
Details are provided in chapter 2 section 2.12.4
7
Examine road/rail connectivity to the project site and impact on the existing traffic network due to the proposed project/activities. A detailed traffic and transportation study should be made for existing and projected passenger and cargo traffic.
Information on road/rail connectivity and impact on the existing traffic network due to the proposed project including transportation study are discussed in Chapter 2 section.2.13
8 Submit details regarding R&R involved in the project.
R & R issues are not involved in the proposed project.
9
Submit a copy of layout superimposed on the HTL/LTL map demarcated by an authorized agency on 1:4000 scale along with the recommendation of the SCZMA.
CRZ map with the project layout superimposed on the drawing prepared by (NCSCM) is reproduced in Chapter 1 section 1.4.1.
10 Submit the status of shore line change at the project site.
Studies on shore line change are including in Chapter 3 section.3.7
11 Details of the layout plan including details of channel, breakwaters, dredging, disposal and reclamation.
Layout plan and details of navigation channel are discussed in Chapter 2 section. 2.3.2,2.4.2 and 2.9
12
Details of handling of each cargo, storage, transport along with spillage control, dust prevention measures. In case of coal, mineral cargo, details of storage and closed conveyance, dust suppression and prevention filters.
Details are given in Chapter 2 section and Chapter 9 section 9.5.
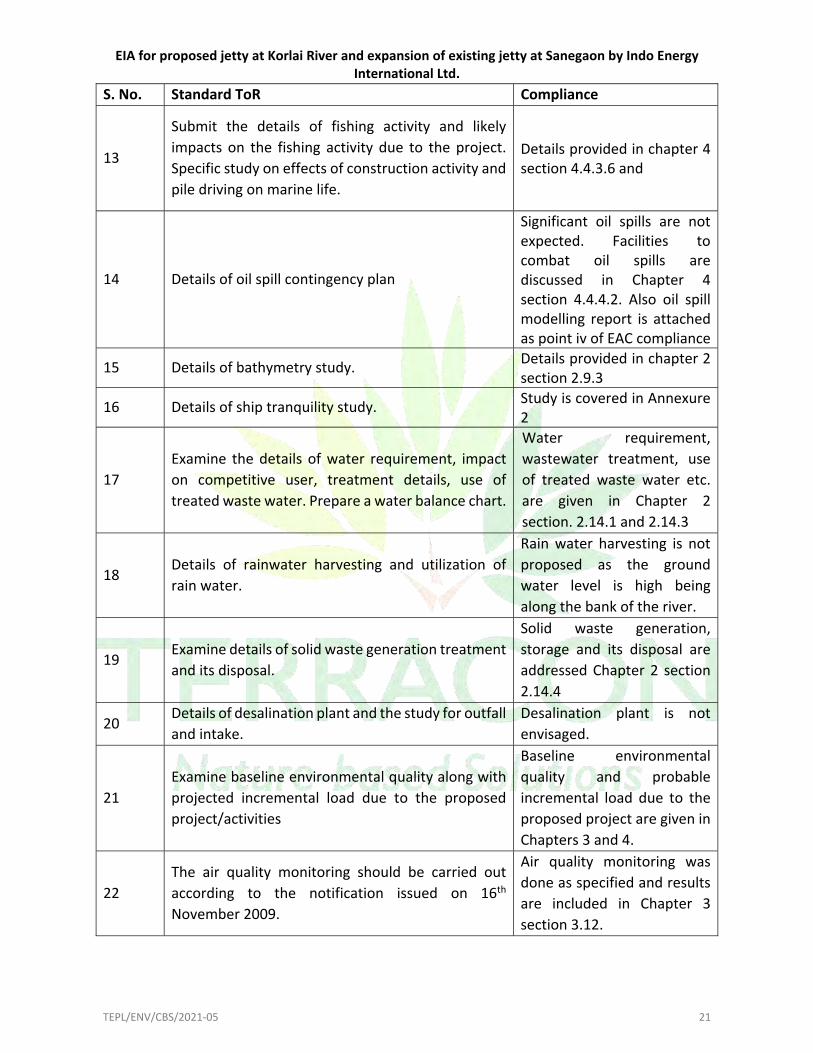
EIA for proposed jetty at Korlai River and expansion of existing jetty at Sanegaon by Indo Energy
International Ltd.
TEPL/ENV/CBS/2021‐05 21
S. No. Standard ToR Compliance
13
Submit the details of fishing activity and likely impacts on the fishing activity due to the project. Specific study on effects of construction activity and pile driving on marine life.
Details provided in chapter 4 section 4.4.3.6 and
14 Details of oil spill contingency plan
Significant oil spills are not expected. Facilities to combat oil spills are discussed in Chapter 4 section 4.4.4.2. Also oil spill modelling report is attached as point iv of EAC compliance
15 Details of bathymetry study. Details provided in chapter 2 section 2.9.3
16 Details of ship tranquility study. Study is covered in Annexure 2
17 Examine the details of water requirement, impact on competitive user, treatment details, use of treated waste water. Prepare a water balance chart.
Water requirement, wastewater treatment, use of treated waste water etc. are given in Chapter 2 section. 2.14.1 and 2.14.3
18 Details of rainwater harvesting and utilization of rain water.
Rain water harvesting is not proposed as the ground water level is high being along the bank of the river.
19 Examine details of solid waste generation treatment and its disposal.
Solid waste generation, storage and its disposal are addressed Chapter 2 section 2.14.4
20 Details of desalination plant and the study for outfall and intake.
Desalination plant is not envisaged.
21 Examine baseline environmental quality along with projected incremental load due to the proposed project/activities
Baseline environmental quality and probable incremental load due to the proposed project are given in Chapters 3 and 4.
22 The air quality monitoring should be carried out according to the notification issued on 16th November 2009.
Air quality monitoring was done as specified and results are included in Chapter 3 section 3.12.

EIA for proposed jetty at Korlai River and expansion of existing jetty at Sanegaon by Indo Energy
International Ltd.
TEPL/ENV/CBS/2021‐05 22
S. No. Standard ToR Compliance
23
Examine separately the details for construction and operation phase both for environmental management plan and environmental monitoring plan with cost and parameters.
Environment management Plan and Environment Monitoring Plan for construction and operation phases are addressed in Chapter 6 and 10 respectively.
24
Submit details of a comprehensive risk assessment and disaster management plan including emergency evacuation during evacuation during natural and man ‐ made disasters
Comprehensive risk assessment and disaster management plan is given in chapter 7 of EIA report
25
Submit details of the trees to be cut including their species and weather it also involves any protected or endangered species. Measures taken to reduce the number of trees to be removed should be explained in detail. Submit the details of compensatory plantation. Explore the possibilities of relocating the existing trees.
Tree cutting is not envisaged for the proposed project.
26
Examine the details of afforestation measures indicating land and financial outlay. Landscape plan, green belts and open spaces may be described. A thick green belt should be planned all around the nearest settlement to mitigate noise and vibrations. The identification of species/ plants should be made on the basis of botanical studies.
Plantation, landscaping and ecological management are addressed in Chapters 9 section 9.5.5
27
The public hearing should be conducted for the project in accordance with provisions of Environment Impact Assessment Notification, 2006 and the issues raised by the public should be addressed in the Environmental Management Plan. The Public Hearing should be conducted based on the ToR letter issued by the Ministry and not on the basis of Minutes of the meeting available on the website.
Public Consultation was carried out at two different locations for Korlai and Sanegaon projects. 01. Public hearing for Korlai
Project was held at Mount Carmel High School, on 19.11.2016.
02. Public hearing was held for Sanegaon Project on 21.11.2016 near project site respectively and public MoM of same is

EIA for proposed jetty at Korlai River and expansion of existing jetty at Sanegaon by Indo Energy
International Ltd.
TEPL/ENV/CBS/2021‐05 23
S. No. Standard ToR Compliance
published by MPCB (Raigad II SRO).
28
A detailed draft EIA/EMP report should be prepared in accordance with the above additional ToR and should be submitted to the ministry in accordance with the notification.
The final EIA report including EMP will be submitted to EAC.
29 Details of litigation pending against the project , if any, with direction/order passed by any court of law against the project should be given
There is no litigation pending against the project.
30 The cost of the project (Capital Cost and recurring cost) as well as the cost towards the implementation of EMP should be clearly spelt out.
Details included in Chapter 9 section 9.6.
31
Any further clarifications on carrying out the above studies including anticipated impacts due to the project and mitigative measures, project proponent can refer to the model ToR available on Ministry website "http://moef.nic.in/manual/Port and harbour".
This suggestion is noted.
Table 1.2 Additional ToR
S. No. Standard ToR Compliance
1 Importance and benefits of the project. Details provided in chapter 8
2
A separate chapter on status of compliance of Environmental Conditions granted by state/Centre to be provided. As per circular dated 30” May. 2012 issued by MoEF. a certified report by Regional Office. MoEF&CC on status of compliance of conditions on existing unit to be provided in EIA‐EMP report
Not Applicable
3 Copy of consent to establish and consent to operate for the existing facilities. In Process
4 Submit a copy of layout superimposed on the HTULTL map demarcated by an authorized agency on 1 4000 scale.
CRZ map with the project layout superimposed on the drawing prepared by (NCSCM) is reproduced in Chapter 1 section 1.4.1.
5 Various Ports facilities with capacities for the existing as well as proposed project.
Details mentioned in Chapter 1 section 1.5
6 List of cargo to be handled along with mode of transportation.
Details mentioned in Chapter 2 section 2.2.1

EIA for proposed jetty at Korlai River and expansion of existing jetty at Sanegaon by Indo Energy
International Ltd.
TEPL/ENV/CBS/2021‐05 24
S. No. Standard ToR Compliance
7 Layout plan of existing Port and Proposed Port. Details mentioned in Chapter 2 section 2.11
8 Details of air pollution control measures to be taken as well as cost to be incurred
Impacts and mitigation measures for controlling air quality are addressed in Chapter 4 section 1.4.4 and the implementation cost of EMP is included in Chapter 9 section 9.6.
9 Total water consumption and its source. Wastewater management plan.
Total water consumption and its sources are given in Chapter 2 section. Water management plan is given in chapter 9 section 9.5.1
10 Details of Environmental Monitoring Plan. Details for Environmental Monitoring Plan are given in Chapter 6.
11 Disaster Management Plan for the above terminal.
Incorporated in Chapter Chapter 7 section 7.3
12 Layout plan of existing and proposed Greenbelt.
25% of toal area for green belt and roads in Proposed jetty and 10% area for green belt in Sanegaon facility.
13 Status of court case pending against the project. There is no litigation pending against the project.
14 Recommendation of the SCZMA.
Recommendation received from MCZMA in MoM dated 09.01.2018 and 24.05.2019 which are attached herewith as point number ii of 49th EAC compliance
15 A tabular chart with index for point wise compliance of above TORs.
Incorporated in Chapter 1 section 1.5
16
Public hearing to be conducted and issues raised and commitments made by the project proponent on the same should be included in EIA/EMP Report in the form of tabular chart with financial budget for complying with the commitments made.
Incorporated in Chapter1 Section 1.6
1.7. VALIDITY OF EC AND CRZ CLEARANCE

EIA for proposed jetty at Korlai River and expansion of existing jetty at Sanegaon by Indo Energy
International Ltd.
TEPL/ENV/CBS/2021‐05 25
The environmental clearance granted for ports and harbour sector is valid for a period of seven years as per amendment in EIA notification 2006 notified via a Notification, S.O. 1411(E) dated 29 April, 2015.
As per the CRZ Notification 2011 and its subsequent amendment, the clearance accorded to the projects under the notifications shall be valid for the period of seven years from the date of issue of the clearance for commencement of construction.
1.8. POST ENVIRONMENTAL CLEARANCE MONITORING
As per CRZ and EIA Notifications it is mandatory to submit the half‐yearly compliance reports of the conditions in the EC on 1st June and 1st December of each calendar year to the concerned regulatory authority. All such reports are public documents. The latest such compliance report is to be displayed on the website of the concerned regulatory authority.
1.9. APPLICABLE LEGAL AND POLICY FRAMEWORK
Applicable legal policy and framework is given in Table 1.3
Table 1.3 Applicable legal and policy framework
Sr. No. Components Regulatory Bodies Notifications/Rules / Acts
etc. as applicable
1. Environment Ministry of Environment Forest and climate change
Environment Protection Act 1986
2. Environment Clearance Ministry of Environment Forest and climate change
EIA Notification 2006
3. Coastal Regulatory zone clearance
Ministry of Environment Forest and climate change
CRZ Notification 2011
4. Solid Waste management
‐ Solid waste management rules, 2016
5. E‐Waste management ‐ E‐ waste management rule, 2016
6. Plastic waste management
‐ Plastic waste management
Air quality monitoring and preservation
7.
Dust Mitigation Measures for Construction and Demolition Activities for projects requiring Environmental Clearance
‐ Notification GSR 94(E) dated 25.01.2018 of MoEFCC

EIA for proposed jetty at Korlai River and expansion of existing jetty at Sanegaon by Indo Energy
International Ltd.
TEPL/ENV/CBS/2021‐05 26
8.
Diesel power generating sets proposed as source of backup power should be of enclosed type and conform
‐ Environment protection Act, 1986
9.
All demolition and construction waste shall be managed as per the provisions
‐ Construction and demolition waste rule 2016.
Water quality monitoring and preservation
10. Ground water recharge /Ground water dewatering
‐ CGWB norms
11.
Sludge from the onsite sewage treatment, including septic tanks, shall be collected, conveyed and disposed
‐
Ministry of Urban Development, Central Public Health and Environmental Engineering Organization (CPHEEO) Manual on Sewerage and Sewage Treatment Systems, 2013.
12.
The quantity of fresh water usage, water recycling and rainwater harvesting shall be measured and recorded to monitor the water balance as projected by the project Proponent. The record shall be submitted (Six monthly compliance)
to Regional Officer of the Ministry
According to CPCB guideline
Noise monitoring and prevention 13. Ambient Noise ‐
14. Noise monitoring (Six monthly compliance)
Regional Officer of the Ministry
Noise Pollution (Control and Regulation) Rules, 2000
Waste Management
15. A certificate handling municipal solid wastes, indicating the
competent authority handling municipal solid wastes
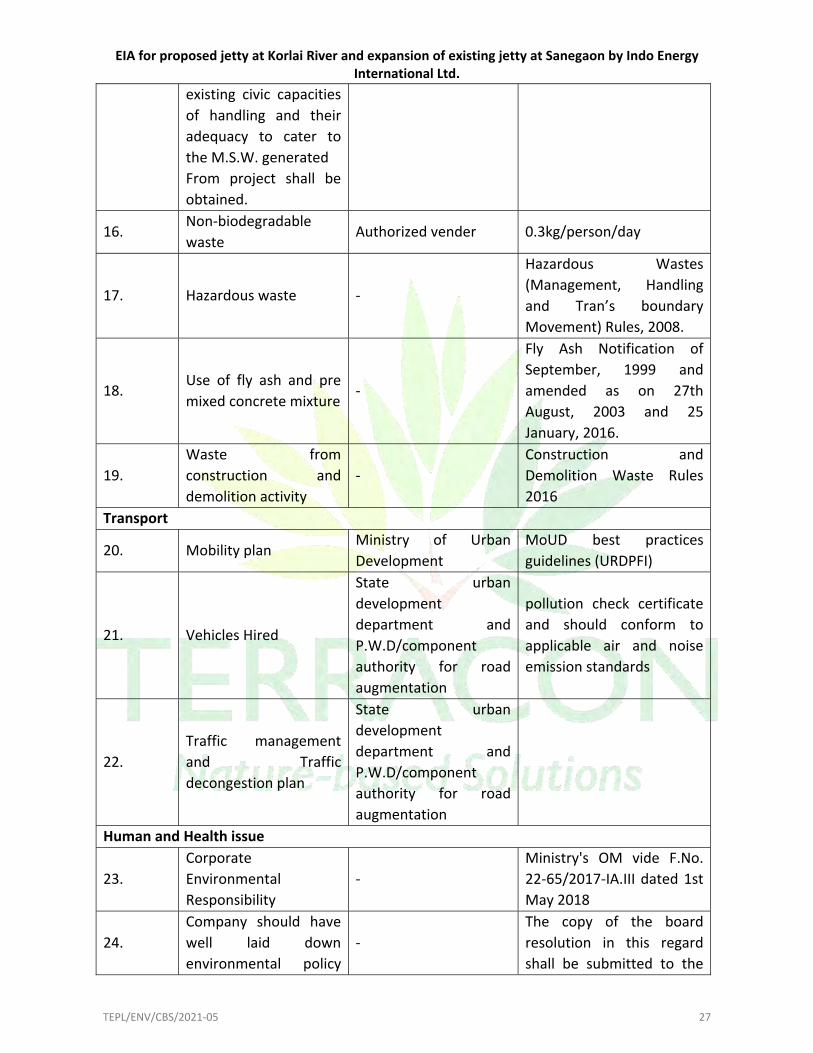
EIA for proposed jetty at Korlai River and expansion of existing jetty at Sanegaon by Indo Energy
International Ltd.
TEPL/ENV/CBS/2021‐05 27
existing civic capacities of handling and their adequacy to cater to the M.S.W. generated From project shall be obtained.
16. Non‐biodegradable waste
Authorized vender 0.3kg/person/day
17. Hazardous waste ‐
Hazardous Wastes (Management, Handling and Tran’s boundary Movement) Rules, 2008.
18. Use of fly ash and pre mixed concrete mixture
‐
Fly Ash Notification of September, 1999 and amended as on 27th August, 2003 and 25 January, 2016.
19. Waste from construction and demolition activity
‐ Construction and Demolition Waste Rules 2016
Transport
20. Mobility plan Ministry of Urban Development
MoUD best practices guidelines (URDPFI)
21. Vehicles Hired
State urban development department and P.W.D/component authority for road augmentation
pollution check certificate and should conform to applicable air and noise emission standards
22. Traffic management and Traffic decongestion plan
State urban development department and P.W.D/component authority for road augmentation
Human and Health issue
23. Corporate Environmental Responsibility
‐ Ministry's OM vide F.No. 22‐65/2017‐IA.III dated 1st May 2018
24. Company should have well laid down environmental policy
‐ The copy of the board resolution in this regard shall be submitted to the

EIA for proposed jetty at Korlai River and expansion of existing jetty at Sanegaon by Indo Energy
International Ltd.
TEPL/ENV/CBS/2021‐05 28
and standard operation procedure and must report in case of and violation/deviation
MoEFCC as a part of six‐monthly report
25.
Action plan for implementing EMP and environmental conditions along with responsibility matrix
‐
Year wise progress of implementation of action plan shall be reported to the Ministry/Regional Office along with the Six‐Monthly Compliance Report
Miscellaneous
26. Submission of Copies of EC
Head of local bodies Panchayat Municipal Bodies Relevant government officials
27. Upload status of compliance
‐ On website and in 6 monthly compliance report
28. environmental statement for each financial year in Form‐V
State Pollution Control Board
Environment (Protection) Rules, 1986
29. Any appeal against EC National Green TribunalNational Green Tribunal Act, 2010.
30. Disaster Management 44 DM_act2005
31.
Ancient Monuments and Archaeological site & Remains Act
Act to provide conservation of cultural and historical remains found in India.
Ancient Monuments and Archaeological site & Remains Act, 1958
1.10. GENERIC STRUCTURE OF THE DOCUMENT
The following chapters have been included in this EIA report, which is in line with the Generic Structure of Environmental Impact Assessment and as per the EIA Notification 2006:
1. Introduction
This chapter contains the scope of the study, purpose of the report, identification of project proponent and details of the environmental and CRZ clearance processes.
2. Project description
This chapter covers the description of the project, such as the type of project, need for the project, project location, project layout, and the project implementation schedule, estimated cost of development etc.
3. Description of the Environment

EIA for proposed jetty at Korlai River and expansion of existing jetty at Sanegaon by Indo Energy
International Ltd.
TEPL/ENV/CBS/2021‐05 29
This chapter contains the comprehensive data on the existing and additional data collected on the baseline environmental data in the study area as well as in the surrounding area that is likely to be affected by the proposed activity.
4. Anticipated Environmental Impacts & Mitigation Measures
This chapter covers the anticipated impact on the environment and mitigation measures. It consists of the details of the impact on the baseline parameters, both during the construction and operational phases and the mitigation measures to be implemented by the proponent.
5. Analysis of Alternatives (Technology & Site)
This chapter covers the details of various alternatives both in respect of location of site and technologies to be deployed, in case the initial scoping exercise considers such a need.
6. Environmental Monitoring Program
This chapter covers the planned Environmental Monitoring Program. It includes the technical aspects of monitoring the effectiveness of mitigation measures.
7. Additional Studies
This chapter covers the details of the additional studies, if any, required in addition to those specified in the standard TOR.
8. Project Benefits
This chapter covers the benefits accruing to the locality, neighborhood, region and nation as a whole. It should bring out details of benefits by way of improvements in the physical infrastructure, social infrastructure, employment potential and other tangible benefits.
9. Environmental Management Plan (EMP)
This chapter comprehensively presents the Environmental Management Plan (EMP), which includes the administrative and technical setup, summary matrix of EMP, the cost involved to implement the EMP, both during the construction and operational phases.
10. Summary & Conclusion
This chapter makes the summary of the full EIA report condensed to ten A‐4 size pages at the maximum. It provides the overall justification for implementation of the project and should explain how the adverse effects are proposed to be mitigated.
11. Disclosure of Consultants engaged This chapter includes the names of the consultants engaged with their brief resume and nature of consultancy rendered.
1.11. INTRODUCTION OF PROJECT PROPONENT
Indo Energy International Limited (IEIL) is a company in the sector of Infrastructure Development and Power. Set up in 1999, it is promoted by Esquire Shipping Pvt. Ltd. To cargo by sea, train or road, and also clearance, cargo handling, warehousing and distribution. Some of the services are chartering and brokerage, ship agency management, shipping consulting and multi modal transport.

EIA for proposed jetty at Korlai River and expansion of existing jetty at Sanegaon by Indo Energy
International Ltd.
TEPL/ENV/CBS/2021‐05 30
IEIL started out by servicing the needs of the power sector by building a jetty and barge unloading points. The company specializes in the fields of – Handling of import/export bulk cargo like Steam Coal, Iron Ore, Bauxite, Lime Stone, Sulphur; International trading; Multi modal transport; Port infrastructure development; Marine surveys and consulting. In 2009 the company also built a fair weather multi‐ purpose terminal, notified under the Indian Customs Act 1962, to handle all import/export and coastal cargos at the rate of 12000‐ 20000 MT/day.
IEIL has an operational multipurpose jetty at Sanegaon since 2009. The jetty has been approved by Customs, through their notification dated 2 Feb 2010, for unloading of imported goods namely Iron, Iron ore pellets, Iron ore concentrate, Coal, Dolomite/Limestone, Petroleum Gas, Steel melting scrap, HDI chips/fines, Pulp, Magnesite, Sulphur. The jetty has also been approved by customs for loading of export goods namely Sponge Iron, rejects of Iron Ore chips and Bauxite. IEIL has 6000 m2 of notified unloading/loading area (200 m x 30 m) at Sanegaon and has a custom bonded area of around 40,000 m
1.12. BRIEF DESCRIPTION OF THE PROJECT
The IEIL proposes to develop Deep Water Jetty facility on Kundalika River, village Korlai, district Raigad, Maharashtra and capacity expansion at existing Inland Water Jetty Facility, on Kundalika River at village Sanegaon, district Raigad, Maharashtra. The proposed port will be developed in 3 phases, at Korlai Phase I‐9.25 MMT, Phase II‐16.75 MMT, Phase III‐23.50. Geographical coordinates of project is 180 32’ 10.92” N, 720 55’ 11.65” E
IEIL is presently engaged in transportation and trading of Coal using lighterage facility at Sanegaon, located on the Right Bank of the Kundalika River, about 50 km south of Mumbai by sea and about 130 km by road. IEIL intends to expand the facility to include the coal required for the proposed power plant planned to be located close to the riverine facility at Sanegaon. The existing Jetty is about 21 km upstream (refer Figure 1.1 below) on the right bank of the river Kundalika and is about 200 m long with a backup area of about 5 hectare for storage, handling and dispatch of material. The clear span between the intermediate bridge piers is 36 m. project location map is given in Figure 1.3.

EIA for proposed jetty at Korlai River and expansion of existing jetty at Sanegaon by Indo Energy International Ltd.
TEPL/ENV/CBS/2021‐05 31
Figure 1.3 Project location map

EIA for proposed jetty at Korlai River and expansion of existing jetty at Sanegaon by Indo Energy
International Ltd.
TEPL/ENV/CBS/2021‐05 32
1.13. NEED OF THE PROJECT
The capacity of existing facility at Sanegaon is largely limited due to Handling of Coal at the anchorage is unreliable as is non‐operational for about 4 months during southwest monsoon, Depth (draught) available in the River is tide assisted and capacity of the Barges are largely limited and restricted by the Bridge spans (Salav Bridge), it has to cross for transiting to IWT.Improvement of capacity and construction of new jetty will Ensure round the year operation by shifting anchorage operations inside the creek also Undertake dredging wherever required to improve available draught in the river and rationalize barge dimensions to increase capacity.
1.14. REGULATORY COMPLIANCE
Environmental impact assessment notification, 2006 and amendments Coastal Regulation Zone Notification, 2011 and subsequent amendments Coastal Regulation Zone Notification, 2019 Technical Guidance Manual for Ports and harbours, Feb 2015 by ASCI CRZ prepared as per CRZ notification 2011. Documents received from C‐Born Services Preliminary project report Detailed Project Report
1.15. ENVIRONMENTAL SENSITIVITY
The environment setting for the proposed project is as shown in given in Table 1.4. and environmental sensitivity map will be given in .Figure 1.4
Table 1.4: Environment sensitivity of the project sites
Sr.
No. Areas Yes/No
Name/Identity (within 15 km.)
Proposed project location
boundary
1
Areas protected under international conventions, national or local legislation for their ecological, landscape, cultural or other related value
Yes
Phansad wild life Sanctuary is ~ 14.7 km away from Proposed Korlai Jetty and ~ 14.43 km away from existing Sanegaon facility.
2
Areas which are important or sensitive for ecological reasons ‐ Wetlands, watercourses or other water bodies, coastal zone, biospheres, mountains, forests
Yes Proposed Korlai Jetty project lies in CRZ IVB, II and IB.and Sanegaon facility lies in III.

EIA for proposed jetty at Korlai River and expansion of existing jetty at Sanegaon by Indo Energy
International Ltd.
TEPL/ENV/CBS/2021‐05 33
Sr.
No. Areas Yes/No
Name/Identity (within 15 km.)
Proposed project location
boundary
3
Areas used by protected, important or sensitive species of flora or fauna for breeding, nesting, foraging, resting, over wintering, migration
No Not Applicable
4 Inland, coastal, marine or underground waters
Yes The proposed project will be in the Arabian sea
5 State, National boundaries No Not applicable
6 Routes or facilities used by the public for access to recreation or other tourist, pilgrim areas
No Not applicable
7 Defense installations No Not applicable
8 Densely populated or built‐up area Yes Korlai village ~ 1km away
9 Areas occupied by sensitive man‐made land uses (hospitals, schools, places of worship, community facilities)
Yes
Korlai Church ~ 1.1km . from Korlai jetty
There are several schools and health centers within 15 km of both project site
10
Areas containing important, high quality or scarce resources (ground water resources, surface resources, forestry, agriculture, fisheries, tourism, minerals)
Yes
Revdanda fort ~1.26 km from proposed Korlai Jetty and 14.04 km from sanegaon fort.
Korlai fort ~. 1.2 km from proposed Korlai jetty.
Korlai light house ~1.4 km
11
Areas already subjected to pollution or environmental damage. (those where existing legal environmental standards are exceeded)
No Not applicable
12
Areas susceptible to natural hazard which could cause the project to present environmental problems (earthquakes, subsidence, landslides,
No
The project area is classified in Zone IV as per NDMA, Earthquake vulnerability map, having moderate seismic intensity to earthquake.

EIA for proposed jetty at Korlai River and expansion of existing jetty at Sanegaon by Indo Energy
International Ltd.
TEPL/ENV/CBS/2021‐05 34
Sr.
No. Areas Yes/No
Name/Identity (within 15 km.)
Proposed project location
boundary
erosion, flooding or extreme or adverse climatic conditions)

EIA for proposed jetty at Korlai River and expansion of existing jetty at Sanegaon by Indo Energy International Ltd.
TEPL/ENV/CBS/2021‐05 35
Figure 1.4 Environment sensitivity map

EIA for proposed jetty at Korlai River and expansion of existing jetty at Sanegaon by Indo Energy
International Ltd.
TEPL/ENV/CBS/2021‐05 36
Chapter2Project
Discription

EIA for proposed jetty at Korlai River and expansion of existing jetty at Sanegaon by Indo Energy
International Ltd.
TEPL/ENV/CBS/2021‐05 37
2. PROJECT DESCRIPTION
2.1. GENERAL
The Indo Energy International Limited (IEIL) proposed development of Deep Water Jetty Facility on Kundalika River, village Korlai, district Raigad, Maharashtra and capacity expansion at existing Inland Water Jetty Facility, on Kundalika River at village Sanegaon, district Raigad,Maharashtra.. The facility would be equipped with a 160/180/225 m wide dredged approachchannel, 500/550 m diameter turning circle, port basin of adequate depth and a 525 m berth with a mooring dolphin to the East. There will be total 4 numbers of berths for cargo transfer and one additional berth for mooring of the port crafts.
In addition, the existing Sanegaon facility would be augmented by upgrading of equipment,mechanization of storage and stacking, loading, unloading arrangements, for handling barges upto 4500 MT. Accordingly, the existing channel would have to be deepened (dredged) for handling these higher draught vessels. The proposed port will be developed in 3 phases, at Korlai, Phase I‐9.25 MMT, Phase II‐ 16.75 MMT, Phase III‐23.50 MMT, at Sanegaon 5‐6 MMT (included in above projections).
2.2. DESCRIPTION OF PROJECT SITE
The proposed project site is on Kundalika River, village Korlai, district Raigad, Maharashtra Revdanda Port lies in the estuary of Kundalika River The estuary entrance is protected by a peninsula on west side of entrance on which the Korlai Fort is situated. The Korlai Headland provides the necessary protection from southwesterly waves; however the Kundalika estuary remains disturbed due to the westerly waves.. The proposed facility located between geographical co‐ordinates of latitude 18° 32' 9.66"N, longitude 72° 54' 54.88"E and latitude 18° 32' 11.82"N, longitude 72° 55' 11.71"E, on the left bank of the Kundalika River, North East of ‘Rat Island’
Figure 2.1 Korlai Deepwater Jetty off the mouth of the Kundalika River
Two major ports along the West coast namely JNPT and Mumbai Port both Major Ports arelocated about 52 and 48 km north respectively. In the South about 32 km away a Private port islocated at Dighi in the Rajpuri creek.The only other deep‐water Port in the state of

EIA for proposed jetty at Korlai River and expansion of existing jetty at Sanegaon by Indo Energy
International Ltd.
TEPL/ENV/CBS/2021‐05 38
Maharashtra is located about 145 km south at Jaigarh, In Ratnagiri District; capable of handling up to Cape Size vessels (180,000 DWT).
2.2.1. EXISTING INFRASTRUCTURE
Revdanda Port lies in the estuary of Kundalika River. The estuary entrance is protected by a peninsula on west side of entrance on which Korlai fort is situated. Though there is protection from south westerly waves, the westerly waves enter the Kundalika estuary entrance. The prevailing depth in berthing basin at port facility is 5 to 6 m from chart datum.
IEIL operations are mostly concentrated in the Sanegaon area. The Sanegaon facility consists of a 200 m long concrete Jetty attached to a 5 hectare storage area. The barges operate between the anchorage and the existing barge handling facility at Sanegaon. Google image of facilities given in
In view of the limited depth and presence of a sand bar at confluence of Kundalika River with ocean the port is used as lighterage port located at Sanegaon. Coal is transshipped in the self‐ propelled ISV barges of capacity 2500 ‐ 2800 DWT from mother vessel at anchorage. A 100 m wide, 7 nautical miles long entrance channel leads from anchorage point to JSW jetty for safe navigation of barges. At the confluence of Kundalika River with ocean a shallow sandbar has been formed, depth over sandbar is only 0.5 to 1.5 m and channel is maintained by regular dredging. Google image of facilities given in Figure 1.2
A bridge exists on Kundalika River about 400 m east of existing JSW jetty. The bridge has nine (9) spans and the middle span has air drought of 9.6 m at highest high tide of +4.60 m. The clear horizontal span at soffit of beam is 38 m. Middle spans of Bridge on Kundalika River are shown in Figure 2.4.
Figure 2.2 Existing JSW Revdanda port facility

EIA for proposed jetty at Korlai River and expansion of existing jetty at Sanegaon by Indo Energy
International Ltd.
TEPL/ENV/CBS/2021‐05 39
Figure 2.3 Existing Sanegaon Facility
Figure 2.4 Middle Spans of Bridge on Kundalika River
2.3. PROJECT DETAILS OF PROPOSED JETTY
The proposed project is a conventional marine project requiring new jetty of 525 m length, with one mooring dolphin 25 m from the jetty on the eastern side of the berth. The location and alignment of the berth to be decided through model studies & reclamation of about 50 ha for foreshore facilities at village Korlai, district Raigad, Maharashtra. The capacity expansion at Sanegaon (lnland water facility) will be by upgrading the equipments and by operating throughout the year deploying improved types of barges of 4500 DWT size and dredging the inner channel for the same. The waterfront has a depth between 3 and 5 m and shallow region (‘0’ m contour) near the bank line. Hydrographic chart 2026 indicates that the 5 m contour is at about 2.5 km and 10 m contour at 5.0 km from the shore line. There is a channel for the existing lighterage operation. Hence the approach channel as required in the
Existing Sanegaon Facility

EIA for proposed jetty at Korlai River and expansion of existing jetty at Sanegaon by Indo Energy
International Ltd.
TEPL/ENV/CBS/2021‐05 40
various phases shall be dredged. There will be 4 berths in all for cargo handling and one berth for mooring of Port Crafts.In addition to the approach channel, there will be a 500 m diameter turning circle and deeper port basin for allowing mother vessels of various sizes, starting from Handymax to Cape size, at all stages of the tide. There will be a barge loading berth on the side of the reclamation for meeting the requirements of the Sanegaon facility and others.
2.3.1. SALIENT FEATURES OF PROPOSED PORT CONFIGURATION
The Jetty is aligned to the predominant tidal current. The size of the berth 525 m x 46 m +2 approaches to the stack area. One 8 m x 8 m mooring dolphin on the eastern side of the jetty 125 acre (50 ha) reclaimed area for stacking and cargo handling will be provided. The port will be designed to handle Panamax sized vessels in the first phase and Cape size carriers in the final phase. No breakwater protection is required, as the Korlai head land provides the required tranquility.
Figure 2.5 Concept plan for development of jetty on Kundalika River
A 17.5 km channel consisting of 23 million cum of dredging for Panamax Vessels and about 34 million cum for Cape Vessels would be required in the ultimate stage. Initial channel will be narrow and limited to 160 m width with a draft of 11 m and involve 11 million cum of dredging, which will be subsequently dredged to have navigable depth of around 15.60 m and further increased to 19.8 m in the final phase. The dredging spoils of the inner harbour would be used for reclamation of back up area.
Table 2.1: Salient features of proposed jetty facility
Type of Jetty Open coast, Naturally protected, all weather, deep draft jetty (no breakwaters)
Existing features Deep embayment with shallow area near shore, for creating reclaimed land, no trees, no mudflat, no mangroves, no creeklets
Breakwater No Breakwater

EIA for proposed jetty at Korlai River and expansion of existing jetty at Sanegaon by Indo Energy
International Ltd.
TEPL/ENV/CBS/2021‐05 41
Berths and Mooring Structures
One continuous berth of 525 m length with one mooring dolphins on the East side of the berth for handling bulk cargo, general cargo, container, palletized, unitized and liquid cargo.
Basin Dredged uniform depth of (‐) 11 m initially, 15.6 m in the second and 19.8 m in the final phase. All depths are with respect to CD
Channel 160/180/200 m wide, (‐) 11 m deep initially and thereafter 14.6 m deep, 17.5 km long
Dredging 11 million cum for handymax vessels, 23 million cum for panamax vessels and 34 million cum for cape vessels About 1.5 million cum for inner channel from Korlai to Sanegaon for 4500 DWT barges
Land/ Reclaimed Land
Reclaimed land of 125 acres (50 Ha), to accommodate bulk cargo stockyard, hard stands, silos, covered transit sheds, container stack yard , ICD, railway yard etc.
Navigation Aids Channel markers with solar lanterns. Flotilla Tugs with firefighting capability, pilot launch, utility crafts. Linkage Last mile rail connectivity of ~ 40 km from Roha BG trunk line.
Road Linkage From Salav to Roha Port Amenities
Marine terminal, fire fighting arrangement, STPs, workshop, canteen, administrative offices, offices of stewards/CF agents, security, ICD & CFS.
The Jetty will be provided with mobile harbour cranes in the first phase and with fixed ship unloaders in the final phase.
The Equipments will discharge in to hoppers and through covered conveyors to the covered stockyard.
Palletised cargo and containers would be handled using mobile harbour cranes and taken to the yard by tractor‐trailers.
The cargo receipt and dispatch would be fully mechanised. The barge loading system would be installed for emission free loading.
Layout of proposed jetty is given in Figure 2.6

EIA for proposed jetty at Korlai River and expansion of existing jetty at Sanegaon by Indo Energy International Ltd.
TEPL/ENV/CBS/2021‐05 42
Figure 2.6Layou of proposed jetty

EIA for proposed jetty at Korlai River and expansion of existing jetty at Sanegaon by Indo Energy
International Ltd.
TEPL/ENV/CBS/2021‐05 43
2.4. PROJECT DETAILS OF SANEGAON FACILITY
2.4.1. EXISTING FACILITY
Indo Energy International Limited ha existing facility for coal handling at Sanegaon which is operational science 2009. The Multipurpose terminal has a capacity of handling, storing and dispatching of about 1.0 million tonnes of Bulk cargo annually. The Terminal also has an open storage space of 60000 square meters away from population centres for limiting the environmental pollution due to fugitive emissions. Water sprinklers and other dust suppression system are located strategically for pollution prevention. This terminal is very conveniently located at a distance of about 100 KM from New Bombay, about 10 km from the Roha railway Siding and about 12 KM from the nearest National Highway. The Multipurpose terminal has all the advantages to make it highly viable location for the various Industries located in the immediate as well as the entire State of Maharashtra & Karnataka to move their raw materials and thus reducing their production costs and provide cheaper products to the end user. Existing facility consist of jetty and coal storage and handling yard about 21 km upstream from proposed Korlai facility. The Inland Waterway course is served by barges of 2500 DWT (draft ‐2.5 m CD).Google image of existing facility is shown in
Figure 2.7 Existing Sanegaon facility
2.4.2. NEED OF EXPANSION AT SANEGAON FACILITY
Handling of Coal at the anchorage is unreliable as is non‐operational for about 4 months during southwest monsoon.
Depth (draught) available in the River is tide assisted.
2.4.3. IMPROVEMENTS PROPOSED FOR AUGMENTING CAPACITY

EIA for proposed jetty at Korlai River and expansion of existing jetty at Sanegaon by Indo Energy
International Ltd.
TEPL/ENV/CBS/2021‐05 44
Intervention would involve streamlining the existing operation using the existing resources and adding only minimal equipment and facilities as stated below: also layout of Sanegaon facility is given in Figure 2.8
Handling wharf: 200 m The handling equipment will be replaced with new similar kind machines – Sennebogen
Material handler or similar type The stack yards will be streamlined, only 3 stacks with a capacity of 240,000 MT will be
used Stacker cum Reclaimer in phases shall be deployed for supplying to the truck loader or to
the power plant. Dredging of channel from Korlai to Sanegaon to 3.1 m CD. Use of 4500 DWT barges All year round operations as mother vessels will discharge at Korlai Jetty.
Table 2.2 Existing and Projected Traffic at the Sanegaon Barge facility
Sr.No Cargo Handled Handled Handled Expected Projected 2012‐2013 Tonne
2013‐2014 Tonne
2014‐2015 Tonne
2015‐2016 Tonne
2016‐2017 Tonne
1 Coal 740542 522881 800000 1500000 1500000

EIA for proposed jetty at Korlai River and expansion of existing jetty at Sanegaon by Indo Energy International Ltd.
TEPL/ENV/CBS/2021‐05 45
Figure 2.8Layout for Sanegaon facility

EIA for proposed jetty at Korlai River and expansion of existing jetty at Sanegaon by Indo Energy
International Ltd.
TEPL/ENV/CBS/2021‐05 46
2.5. PRESENT OPRATION
IEIL is presently engaged in transportation and trading of coal using lighterage facility at Sanegaon, located on the right bank of the Kundalika River, about 50 km south of Mumbai by sea and about 130 km by road as shown in .Figure 2.9
Figure 2.9 Location of present unloading facility at Sanegaon on the West Coast of India
2.6. TRAFFIC STUDY & DEMAND ASSESSMENT
2.6.1. METHODOLOGY
The methodology adopted for the traffic study and demand assessment is presented in the Figure 2.10 below and all the steps carried out are explained below.
Figure 2.10Methodology adopted for the traffic study and demand
2.6.2. FORECAST MODEL

EIA for proposed jetty at Korlai River and expansion of existing jetty at Sanegaon by Indo Energy
International Ltd.
TEPL/ENV/CBS/2021‐05 47
Current port traffic in India and Maharashtra The statistics of the traffic handled at the Indian Major and Minor Ports from 1996‐97 to the present were obtained.
Forecast of future port traffic First, a series of macroeconomic figures that reflect the economic and social growth of the country (Gross Domestic Product GDP, Population, and Per Capita Income –PCI) were analyzed over the period 1996‐97 to present. The growth estimates of these parameters until 2040‐41 was also obtained. Secondly, an analysis of the relation between these macroeconomic variables and the port traffic from 1996‐97 to the present was carried out, obtaining well correlated linear regressions. Finally, using the linear regressions line and the macroeconomic variables projection estimates for the next 30 years, the port traffic projection until 2040 was estimated.
This study was performed both for India and Maharashtra State. The traffic projection based in correlation with PCI for Karnataka State means there will be cumulative annual traffic growth of 7.78 %.
Selection of the type of cargo to be moved through Korlai Port. Current total traffic of the cargo. For these cargos the current total traffic were obtained. Future total traffic of the cargo.
The future projection of the iron ore requirements, coal import and steel production were obtained from various information sources. The projected port traffic forecast also was obtained in addition the miscellaneous cargoes such as Fertilizer, Edible oil and such other cargoes requiring distribution in the hinterland.
2.6.3. TOTAL TRAFFIC FOR THE PORT
The location advantage offered by the port could act as a viable alternative for various existing as well as upcoming industries.
Direct berthing of mother vessels would bring down the logistics cost and would imbibe more efficiency by doing away from the anchorage handling in the region including the Mumbai Port.
Inland water connectivity to the port and the handling facility upstream provides greater penetration to the hinterland.
Readymade rail connectivity provides connectivity unparalleled in the region. Hence with the requisite efficiency the following total traffic for the facility could be realistically predicted.
Figure 2.11 Total Traffic for the Proposed Facility at Revdanda
Traffic Year 5 Year 10 Year 15 Year 25 Export/Import
Coal 5.00 10.00 12.00 12.00 Import IBRM 1.0 2.0 2.5 3.0 Import Lime Stone/Dolomite 0.5 1.0 1.5 1.5 Import Iron and Steel 0.5 1.0 1.5 2.5 Export Bauxite 0.25 05 0.5 0.5 Import

EIA for proposed jetty at Korlai River and expansion of existing jetty at Sanegaon by Indo Energy
International Ltd.
TEPL/ENV/CBS/2021‐05 48
Cement 0.5 0.5 0.5 1.0 Import Fertilizer 0.5 0.50 1.0 1.0 Import/Export Containers 0.5 0.5 0.5 1.0 Import/Export Liquid Cargos (Edible Oil)
0.25 0.5 0.5 1.0 Import/Export
Molasses 0.25 0.25 0.25 0.5 Export Transshipment Cargo 2.0 3.0 5.0 5.0 Transshipment Total 9.25 16.75 20.75 23.5
2.7. ENGINEERING SURVEYS AND INVESTIGATIONS
The field investigation forms an important component of the port development process. It must be recognized that the quality of output is proportionate to the quality of input and as such more the availability of quality data more accurate would be the results. In the proposed proposal, the measure cost component is expected from dredging and the berth construction. Hence it was considered necessary to carry out additional boreholes.
2.7.1. OBJECTIVE OF WORK
The field investigation forms an important component of the port development process. It must be recognized that the quality of output is proportionate to the quality of input and as such more the availability of quality data more accurate would be the results. In the proposed proposal, the measure cost component is expected from dredging and the berth construction. Hence it was considered necessary to carry out additional boreholes.
2.7.2. LABORATORY TESTING
Selected soil samples, collected during boring/drilling of boreholes were subjected to laboratory tests to determine the index and engineering characteristics as specified. The classification, index property, NMC, specific gravity, density, and chemical tests were carried out on the soil samples.
Following tests were performed
1. Particle size distribution.
2. Sedimentation/ Hydrometer analysis.
3. Alterberg limits.
4. Particle density/ Specific gravity.
2.7.3. SOIL CONDITION
Sub‐Seabed Condition: The subsea conditions at the proposed locations of the various structures are investigated.
Navigation Channel: The area for the proposed Navigation Channel is investigated by drilling Seven (7) boreholes MBH‐53 to MBH‐59. The Sub Surface stratigraphy is graphically depicted in Plate 3 thru Section A‐A.

EIA for proposed jetty at Korlai River and expansion of existing jetty at Sanegaon by Indo Energy
International Ltd.
TEPL/ENV/CBS/2021‐05 49
Jetty: Bore whole no. MBH‐60 was located near the proposed jetty. The sub surface comprises top layer of Medium dense SAND up to ‐14.40 m CD. The SPT (“N”) value varies from 11 to 22. This is followed by a 1.0 m thick layer of soft to firm CLAY, underlain by Residual Soil (Grade VI) followed by bedrock that is basalt.
2.7.4. FOUNDATION RECOMMENDATION
The subsea study indicates that, the sub soil mainly comprises of medium dense underlain by soft to firm clay. As the sandy soils encountered are of Medium Dense consistency they will not provide enough end bearing capacity to the piles required for the load coming from the heavy superstructure. Similarly, the Soft to Stiff clay layers encountered are not of enough thickness to provide the required skin resistance. The piles are to be terminated in rock at the level found at the particular location. The Piles installed will be end‐bearing piles socketed into rock.
2.7.5. DREDGEABILITY
Dredgeability is defined as the ease with which the material can be dredge. The channel locations are investigated by drilling MBH‐53 thru MBH‐59. The subsurface stratigraphy as revealed from the soil investigations indicates soft material up to ‐14.70 m CD in the channel, dredgeable by suction dredgers. However, with little deftness, the Channel could be suitably aligned to be ready for Panamax vessels
2.8. DEVELOPMENT PLANS FOR PROPOSED JETTY
2.8.1. DEMARCATION OF PORT BASIN
According to the available land for the onshore development, the port basin is located at the widest part of the river, i.e. at the river mouth. The approach channel, the turning area, the port basin etc. would be created at this location, for the largest possible ship.
Figure 2.12 Location of the port basin
2.9. NAVIGATION CHANNEL

EIA for proposed jetty at Korlai River and expansion of existing jetty at Sanegaon by Indo Energy
International Ltd.
TEPL/ENV/CBS/2021‐05 50
The capital objective of navigation channel is to define the geometric characteristics of the approach waterway for the new port (dimensions and alignment) and the navigational requirements.
Table 2.3 Design vessels for the Proposed Jetty/Port
Type DWT LOA B D
Bulk Carriers 105,000 270.0 m 43.5 m 14.0 m
Multipurpose Carriers 80,000 240.0 m 36.5 m 14.0 m
Crude Oil Tankers 85,000 260.0 m 40.0 m 14.0 m
Liquid Gas Carriers 60,000 265.0 m 42.2 m 13.5 m
Container ships 80,000 290.0 m 42.5 m 14.0 m
Ro‐Ro vessels 50,000 287.0 m 32.2 m 12.4 m
General cargo vessels 40,000 209.0 m 30.0 m 12.5 m
Car carriers 30,000 193.0 m 32.2 m 11.7 m
Ferries 25,000 197.0 m 30.6 m 7.1 m
Passenger cruise ships 80,000 (GT) 272.0 m 35.0 m 8.0 m
Maximum sizes 105,000 290.0 m 43.5 m 14.0 m
The highlighted ships (bulk carriers and container ships) represent the greatest ships dimensions and hence could be considered as the design dimensions for the port components. It must also be recognized; that though the traffic studies indicate that this facility is for predominantly handling of coal, provision for container handling may not be completely out of place, since, high value CR coils and value added steel products are general ly taken in containers for export. Hence it was considered prudent to plan for the turning and accommodation of container vessel as well, which could be implemented with very little incremental cost. When defining the navigation channel, the beam of the vessel can be considered as the limiting factor. Therefore we can affirm that the bulk carriers are the most difficult ship for navigation at this port.
2.9.1. ALIGNMENT
The alignment of the navigation channel, especially at open sea areas, is mainly considered by the meteorological conditions that can affect the maneuverability conditions of the vessels sailing through the channel. The principal meteorological agents that affect the ships maneuverability are (from most important to least important) the wind, the currents and the waves. It is not always easy to fully avoid these agents, which when acting on the ship transversally, increases the effect over the maneuverability of vessels. The effect considerably increases when angles between the ship’s axis and the agent –wind, current or wave, is over 45 º.

EIA for proposed jetty at Korlai River and expansion of existing jetty at Sanegaon by Indo Energy
International Ltd.
TEPL/ENV/CBS/2021‐05 51
The main currents at the area are produced by the river discharge, the tides and the long shore movements. The discharges from the river are approximately NNW, and that is conditioned mainly by the geometry of the river mouth.
Obviously it is not possible to obtain an alignment such that all the wind directions attack the vessels longitudinally (i.e. with an angle less than 45º), but the transversal wind directions can be reduced.
Considering all the factors mentioned above the alignment of the outer channel has been planned along 070˚ ‐ 250˚. The navigation channel is shown on navigation chart 2026 in Figure 2.13
Figure 2.13 Navigation channel plan – Navigation chart #2026 (Extract)
2.9.2. NAVIGATIONAL REQUIREMENTS
In this facility floating lateral markers (buoys) are proposed to be used to signal its navigation channel, with a longitudinal distance between markers of 2,000 meters. These buoys can be staggered on either side of the channel, which will reduce the number of buoys.
2.9.3. MODEL BATHYMETRY
The overall shape of Kundalika River is funnel shaped with general depths varying between 2 m and 4 m (B.C.D). The sites of the jetty structure are proposed in Kundalika River and are on the left (south) bank near village Salav on the west coast of India. Bathymetry at the project site between Arabian Sea and Kundalika River indicates that the depths are shallow. For the study under considerations following bathymetry charts were used:
1. Navigation chart no. 2026 for depths – 19m contour to ‐4 m contour
2. Hydrographic survey charts of MMB in 2005 extending deep in to the river up to the HTL.

EIA for proposed jetty at Korlai River and expansion of existing jetty at Sanegaon by Indo Energy
International Ltd.
TEPL/ENV/CBS/2021‐05 52
Figure 2.14 Bathymetry of the Kundalika River and Arabian Sea for computation
2.9.4. HYDRODYNAMIC MODEL
The study was carried out in a zonal model, so that local hydrodynamics could be accurately simulated and computed bereft of any boundary effects. The initial simulation was carried out for the existing condition and the model would be calibrated utilizing the site collected data. The calibrated model then would be used for simulating the effects after the developments proposed.
The overall shape of Kundalika River is funnel shaped with general depths varying between 2 m and 4 m (B.C.D). The sites of the jetty structure are proposed in Kundalika River and are on the left (south) bank near village Korlai on the west coast of India. Bathymetry at the project site between Arabian Sea and Kundalika River indicates that the depths are shallow. For the study under considerations following data charts were used to create the MIKE 21 Bathymetry shown in.Figure 2.15 and Figure 2.16 Project was crafted on the bases of results of hydrodynamic modelling such as there would be no flow concentration/or stagnation, morphology of the region would not change and would not lead to sedimentation or erosion.

EIA for proposed jetty at Korlai River and expansion of existing jetty at Sanegaon by Indo Energy
International Ltd.
TEPL/ENV/CBS/2021‐05 53
Figure 2.15 Flow concentration/or stagnation
Figure 2.16 Bathymetry of the Kundalika River and Arabian Sea for computation (Close up)
2.9.5. TURNING CIRCLE IN THE BASIN
In the case of the proposed Port the Turning Circle would be located upstream in the North West direction, behind the Korlai Headland. It has been endevoured to reduce the capital as well as the maintenance dredging of the Turning Circle area. Further, the location is selected so as to have zero hard material dredging atleast in the first phase. Never the less the turning circle dimensiosn will be optimum considering transquil environment it is proposed be located. Therefore, the assistance of tugs has been considered and a diameter of 2 times the length of

EIA for proposed jetty at Korlai River and expansion of existing jetty at Sanegaon by Indo Energy
International Ltd.
TEPL/ENV/CBS/2021‐05 54
the largest ship has been applied. The design vessel for the port as per Technical Feasibility Report (TFR) is 290 m long. Thus, a turning circle with a diameter of 500 m (1.7 L) has been considered based on the PINAC recommendations. The turning circles will be dredged to ‐16 m CD, which is similar to the depths provided in the inner channel.
2.9.6. BERTHS
Taking into account the results of the traffic study performed, berth alignment has been established. Berths are aligned to the predominant directions of tidal current for a length of 525 m, which is 115o to the true North. There will be a mooring dolphin on the eastern side of Jetty, so that two Panamax vessels could be accommodated with deft and one Panamax and one Handymax with ease.
2.9.7. BERTH REQUIREMENTS
The computations for ship calls, berth days, and berth requirements are given in Table 2.4, Table 2.5 and Table 2.62.11 below for Phase I (5 Years), Phase II (10 Years) and Phase III (30 Years) scenario.
Port projects have a long gestation period as the cargo build up is gradual and time consuming. Hence determining the design vessel for a new port would be dynamic and would depend on the market forces. In the initial years of the development, the port would be using vessels of lower capacity which would gradually increase to the envisaged sizes of Panamx Vessels and beyond. However, for the computations of Table 2.4 valid for the first phase operations, 105,000 DWT vessel is considered as the design vessel. However, due to the mix in the population of the ship visiting the port, a lower average parcel size of 80000 is considered.
Till the end of year 10, i.e. the end of Phase – II, the same vessel size is considered. However, in the later stages the vessel size would increase to 180,000 DWT based on demand.
Similarly, the equipment build up at the berth as well as the stack yard would be gradual and based on the need and efficiency desired. Based on the above principle, the operation would commence with 2 MHCs at the berth, which would be gradually built up to gantry unloaders in phase II. Similarly upgradation of the stack yard equipment would be planned in phases.
In Phase II the vessel size is kept similar while the Jetty is now equipped with higher capacity Gantry Cranes. 2 no. berths would be sufficient for the projected 17 MTPA cargo. In Phase III, Cape size vessels with average size of 180,000 DWT would be expected to handle the bulk cargo. The corresponding size of the Lime Stone and Bauxite vessels also has been increased. However, for this case two berths may not be sufficient since the general cargo handling takes up more time and keeps the berth more occupied, due to two main reasons‐
1. Lower parcel size and 2. Lower handling rate
It must also be recognized that the additional hours indicated in the table will comprise of the following:
1. Berthing time : 2 Hours

EIA for proposed jetty at Korlai River and expansion of existing jetty at Sanegaon by Indo Energy
International Ltd.
TEPL/ENV/CBS/2021‐05 55
2. Berth readiness for Handling : 1 hours 3. Un‐berthing time : 2 Hours
2.9.8. WIDTH OF THE BERTH
The width of the berth is calculated two ways, besides the functional requirements. The first being the width necessitated by accommodation of a riveted slope under the berth and second the crane rails for special purpose cargos. In the first type berths are generally shore connected wharfs and have contiguous land area behind the berth. In this case the berth would have to accommodate a sloping apron below the deck, so that the earth retained remains stable. In the second type, the unloader’s requirement dictates the width. For example, for efficient functioning of the container unloading crane, the standard crane rails on the Jetty are about 30.48 m apart. This would make the width of the berth about 50 m considering the forward distance and the areas for keeping the hatch covers. In the present case, since the cargo would be mostly Bulk cargoes, the Crane rails shall be about 22 m apart. Considering the distance of 3.5 m between the forward crane and the Jetty front line, and a transport lane of 8 m, the total width = 22+3.5+8 = 33.5. Considering the distance between the center of the back row pile and the edge of the jetty as 2 m, total width = 35.5 say 36 m. Cross section of Approach trestle is given in Figure 2.6 and Section of the Berth facility Figure 2.7.
Figure 2.17 Cross section of Approach trestle

EIA for proposed jetty at Korlai River and expansion of existing jetty at Sanegaon by Indo Energy
International Ltd.
TEPL/ENV/CBS/2021‐05 56
Figure 2.18 Section of the Berth facility

EIA for proposed jetty at Korlai River and expansion of existing jetty at Sanegaon by Indo Energy International Ltd.
TEPL/ENV/CBS/2021‐05 57
Table 2.4 Berth Requirements in Phase –I
Cargo Traffic Avg.
Parcel
Size
Ship
Calls
Avg.
Handling
Rates
Handling
Rates at
70 %
efficiency
Ship Time at Berth Working
Hours /
Day
Berth
Days
per S
hip
Required
Berth
Time
Berth Available
Berth
Time
Berth
Occupancy
No. Of
Berths
Service Additional Total
Phase ‐I Tons Tons No. TPHs Hrs Hrs Hrs Hrs Days Days No. Days No. No.Coal 3000000 80000 37.5 2000 1400 57 5 62.0 24 1.4 97.1 1 330 0.7 0.42
Iron Ore 1000000 80000 12.5 3000 2100 38.1 5 43.1 24 1.27 22.4 1 330 0.7 0.10
Lime Stone
500000 45000 11.1 2000 1400 32.1 5 37.1 24 1.55 17.2 1 330 0.7 0.07
Bauxite 500000 45000 11.1 2000 1400 32.1 5 37.1 24 1.55 17.2 1 330 0.7 0.07
Fertilizer 1000000 45000 22.2 1200 840 53.6 5 58.6 24 2.44 54.2 1 330 0.7 0.23
Iron S crap
250000 30000 8.3 800 560 53.6 5 58.6 24 2.44 20.3 1 330 0.7 0.09
HBI Chips
250000 30000 8.3 800 560 53.6 5 58.6 24 2.44 20.3 1 330 0.7 0.09
Iron & S teel
500000 25000 20.0 800 560 44.6 5 49.6 24 2.07 41.4 1 330 0.7 0.18
Other 500000 30000 16.7 800 560 53.6 5 58.6 24 2.4 40.7 1 330 0.7 0.18
Total 750000
0
147.8 418 463 330.9 1.43
Table 2.5 Berth Requirements in Phase – II
Traffic Avg.
Parcel Size
Ship
Calls Avg.
Handling
Rates
Handling
Rates at
70 % efficiency
Ship Time at Berth Working
Hours/Day Berth
Days
per S
hip
Required
Berth
Time
Berth Available
Berth
Time
Berth
Occupancy No of Berths
Services Additional Total
Phase‐II Tons Tons No. TPHs Hrs Hrs Hrs Hrs Days Days No. Days No. No.
Coal 9000000 80000 112.5 4000 2800 29.0 5 34.0 24 1.40 157.4 1 330 0.7 0.68
Iron Ore 2000000 80000 25.0 5000 3500 22.9 5 27.9 24 1.16 29.0 1 330 0.7 0.13
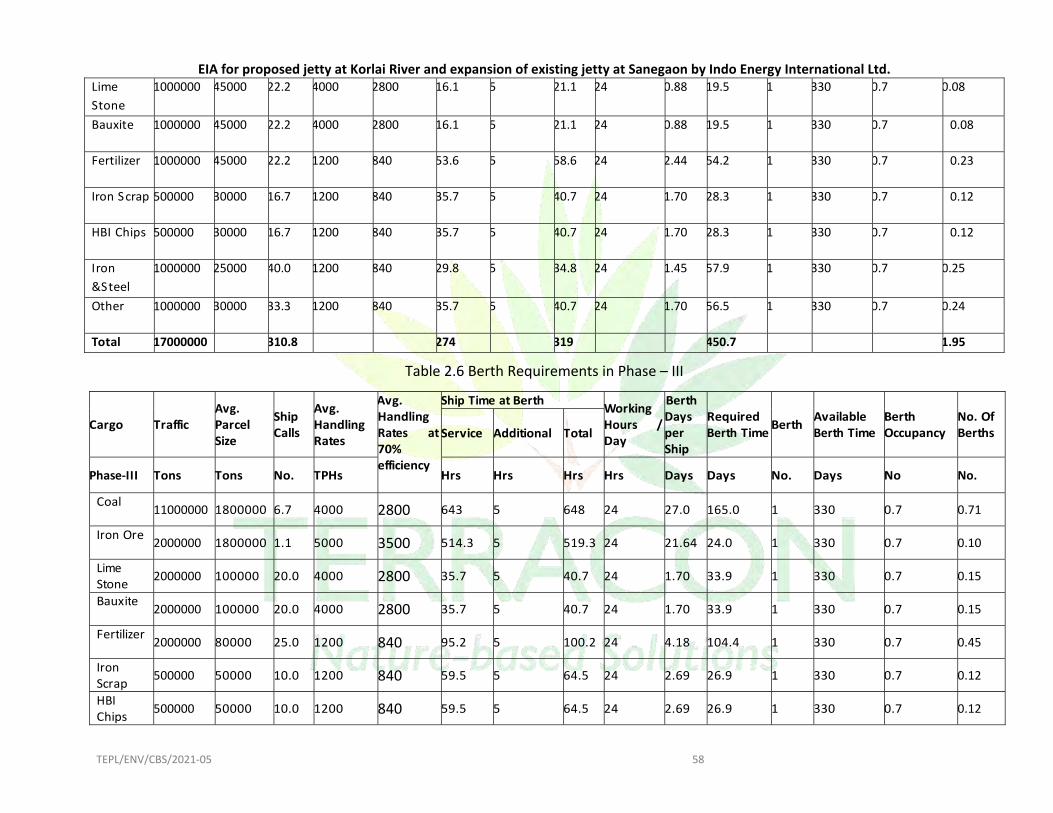
EIA for proposed jetty at Korlai River and expansion of existing jetty at Sanegaon by Indo Energy International Ltd.
TEPL/ENV/CBS/2021‐05 58
Lime Stone
1000000 45000 22.2 4000 2800 16.1 5 21.1 24 0.88 19.5 1 330 0.7 0.08
Bauxite 1000000 45000 22.2 4000 2800 16.1 5 21.1 24 0.88 19.5 1 330 0.7 0.08
Fertilizer 1000000 45000 22.2 1200 840 53.6 5 58.6 24 2.44 54.2 1 330 0.7 0.23
Iron S crap 500000 30000 16.7 1200 840 35.7 5 40.7 24 1.70 28.3 1 330 0.7 0.12
HBI Chips 500000 30000 16.7 1200 840 35.7 5 40.7 24 1.70 28.3 1 330 0.7 0.12
Iron &S teel
1000000 25000 40.0 1200 840 29.8 5 34.8 24 1.45 57.9 1 330 0.7 0.25
Other 1000000 30000 33.3 1200 840 35.7 5 40.7 24 1.70 56.5 1 330 0.7 0.24
Total 17000000 310.8 274 319 450.7 1.95
Table 2.6 Berth Requirements in Phase – III
Cargo Traffic Avg. Parcel Size
Ship Calls
Avg. Handling Rates
Avg. Handling Rates at70% efficiency
Ship Time at BerthWorking Hours / Day
Berth Days per Ship
Required Berth Time
Berth Available Berth Time
Berth Occupancy
No. Of Berths Service Additional Total
Phase‐III Tons Tons No. TPHs Hrs Hrs Hrs Hrs Days Days No. Days No No.
Coal 11000000 1800000 6.7 4000 2800 643 5 648 24 27.0 165.0 1 330 0.7 0.71
Iron Ore 2000000 1800000 1.1 5000 3500 514.3 5 519.3 24 21.64 24.0 1 330 0.7 0.10
Lime Stone 2000000 100000 20.0 4000 2800 35.7 5 40.7 24 1.70 33.9 1 330 0.7 0.15
Bauxite 2000000 100000 20.0 4000 2800 35.7 5 40.7 24 1.70 33.9 1 330 0.7 0.15
Fertilizer 2000000 80000 25.0 1200 840 95.2 5 100.2 24 4.18 104.4 1 330 0.7 0.45
Iron Scrap 500000 50000 10.0 1200 840 59.5 5 64.5 24 2.69 26.9 1 330 0.7 0.12
HBI Chips 500000 50000 10.0 1200 840 59.5 5 64.5 24 2.69 26.9 1 330 0.7 0.12

EIA for proposed jetty at Korlai River and expansion of existing jetty at Sanegaon by Indo Energy International Ltd.
TEPL/ENV/CBS/2021‐05 59
Iron &Steel 1000000 50000 20.0 1200 840 59.5 5 64.5 24 2.69 53.8 1 330 0.7 0.23
Other 1000000 50000 20.0 1200 840 59.5 5 64.5 27 2.70 53.8 1 330 0.7 0.23
Total 22000000 132.2 1562 1607 522.6 2.26

EIA for proposed jetty at Korlai River and expansion of existing jetty at Sanegaon by Indo Energy
International Ltd.
TEPL/ENV/CBS/2021‐05 60
Orientation
The orientation of the berth inside an estuary with tidal currents driving the flow hydrodynamics, the orientation of the berth alignments are in general guided by the flow vectors. Since the predominant current direction is 115o ‐ 295o, the Jetty shall be aligned to the same as shown in Figure 2.5.
2.10. ON SHORE LAYOUT & REQUIREMENTS
2.10.1. UTILIZATION OF LAND RECLAIMED FOR THE PROJECT
According to the results of the traffic study, for the design of the port of onshore layout two types of terminals have been considered:
Dry Bulk Terminal: For the design of this terminal, both coal import and export has been taken into account with independent handling of operations for both. Thus two circuits have been defined: one for export and other for coal import.
Multipurpose Terminal: The steel products export circuit has been considered. The northern area is defined for possible future extension.
Figure 2.19Flow diagram for coal handling

EIA for proposed jetty at Korlai River and expansion of existing jetty at Sanegaon by Indo Energy
International Ltd.
TEPL/ENV/CBS/2021‐05 61
2.10.2. STORAGE AREA.
The maximum area required for the coal stacking would be 10 ha at the last phase of development.
Figure 2.20 Section of the Final Phase Stock yard for coal
2.10.3. OPERATION AREA AT THE BERTH
The berth operation area would have the facility to receive as well as load the barges/ships as the case may be. All the conveyor belts will have a capacity of 5000 tonnes/h in stacking mode and 3000 tonnes/h in the reclaiming mode. Average unloading capacity of the unloaders is 2500 tonnes/h and average throughput of each ship/barge loader must be at least 1,500 tph. Two ship loaders at each berth position with adequate capacity have been chosen instead of only one higher capacity ship loader because:
i) In case of maintenance or breakdown of one ship loader the operation at the berth position can continue (although with lower throughput)
ii) The width of this operation area is 46 m. Two bulk carriers can be unloaded with coal simultaneously, whenever the berth no 2 is not occupied by the coal loading operation.

EIA for proposed jetty at Korlai River and expansion of existing jetty at Sanegaon by Indo Energy
International Ltd.
TEPL/ENV/CBS/2021‐05 62
Figure 2.21 Operation at the berth
2.10.4. SHIP UNLOADING
Since the Berth No.1 will be fully occupied with handling of coal, Berth no 2 will have to be made equipped for the other cargo handling including fertilizers. A ship unloader‐cum‐loader will be an ideal option rather than having two separate machines i.e. ship unloader (for import) and ship loader (for export). The ship unloader capacity is proposed as 2000 TPH (rated) standardizing with the existing unloader capacity with a view to provide flexibility and spare time availability for handling other cargo at this berth. The occupancy of ship unloader for fertilizers is analysed below in Table 2.7
Table 2.7 Occupancy of the ship unloader fertilizer handling for
Throughput 1.5 MTPA Ship Size (Avg.) 50,000DWT Unloader Capacity (Rated) 2000 TPH Unloading Efficiency 55% Berth time required for handling the throughput ~45 days in a year
2.10.5. PROPOSED SYSTEM
One combined ship unloader‐cum‐loader having an unloading capacity (rated) of 2000 TPH will be installed on Berth no 2 along with a new conveyor stream (parallel to the existing stream). The new receiving conveyors up to and within the storage will be rated for 2000 TPH having belt width as 1400 mm. The storage conveyor will be elevated and provided with an overhead tripper to facilitate stacking in storage shed of the fertilizers received from the berth (ref. Figure 2.22).

EIA for proposed jetty at Korlai River and expansion of existing jetty at Sanegaon by Indo Energy
International Ltd.
TEPL/ENV/CBS/2021‐05 63
Figure 2.22 Storage Shed for fertilizers
The storage will be in a covered shed having a capacity of about 100,000 T. The reclaimed conveyor in the shed will be rated at about 625 TPH and will be equipped with four fixed hoppers provided with 175 TPH vibrating feeders. Payloaders (3 cu. m. bucket capacity) will be used for loading the fertilizers from the storage shed into the hoppers. Conveyor streams, from storage shed to wagon (bag) loading will be common for handling lime stone, bauxite and fertilizers for reasons explained earlier. Since the materials are not compatible, cleaning system will be provided at the transfer points to clean the belt. The cleaning system would mostly comprise of a washing system and a drying system. For example, when fertilizer is handled after the coal in the same conveying system, the belt needs to be washed with water. After washing the belt must be dried up using compressed air. However, many times washing is not required when coal is handled after fertilizer, unless the coal is used in a blast furnace. Hoods will be provided on the belt conveyors while their supporting gallery will be open type. Bagging station will comprise of a continuous elevated hopper having six outlets, each equipped with two bagging and stitching machines, thus having 12 Nos. bagging machines in the initial stage, which subsequently could be duplicated in case the need arises.
Material received from the storage will be discharged into the elevated hoppers via a shuttle conveyor Bagging Station, which is planned adjoining and in the middle of the wagon loading platform about 720 m long x 15 m wide x 1.1 m high. Bags from the bagging stations will be brought to the platform by the bag conveyors with mobile discharge chute to facilitate discharge bags onto the platform. Bags are planned to be loaded manually into the wagons.
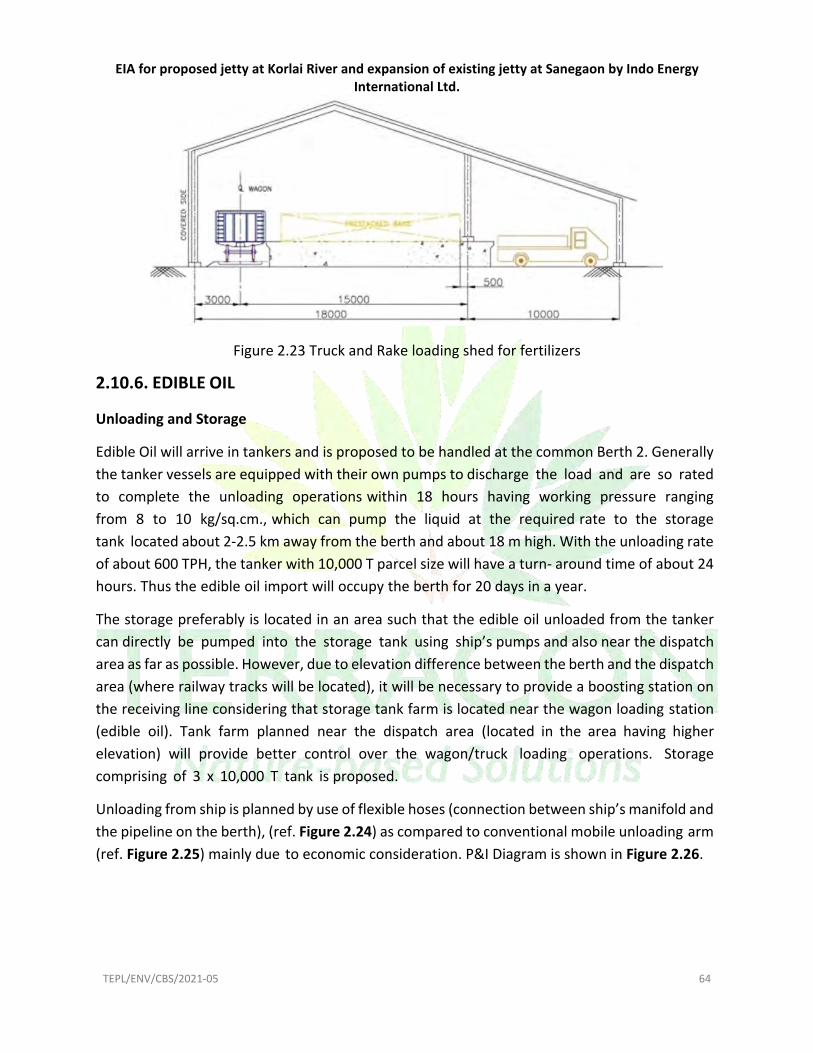
EIA for proposed jetty at Korlai River and expansion of existing jetty at Sanegaon by Indo Energy
International Ltd.
TEPL/ENV/CBS/2021‐05 64
Figure 2.23 Truck and Rake loading shed for fertilizers
2.10.6. EDIBLE OIL
Unloading and Storage
Edible Oil will arrive in tankers and is proposed to be handled at the common Berth 2. Generally the tanker vessels are equipped with their own pumps to discharge the load and are so rated to complete the unloading operations within 18 hours having working pressure ranging from 8 to 10 kg/sq.cm., which can pump the liquid at the required rate to the storage tank located about 2‐2.5 km away from the berth and about 18 m high. With the unloading rate of about 600 TPH, the tanker with 10,000 T parcel size will have a turn‐ around time of about 24 hours. Thus the edible oil import will occupy the berth for 20 days in a year.
The storage preferably is located in an area such that the edible oil unloaded from the tanker can directly be pumped into the storage tank using ship’s pumps and also near the dispatch area as far as possible. However, due to elevation difference between the berth and the dispatch area (where railway tracks will be located), it will be necessary to provide a boosting station on the receiving line considering that storage tank farm is located near the wagon loading station (edible oil). Tank farm planned near the dispatch area (located in the area having higher elevation) will provide better control over the wagon/truck loading operations. Storage comprising of 3 x 10,000 T tank is proposed.
Unloading from ship is planned by use of flexible hoses (connection between ship’s manifold and the pipeline on the berth), (ref. Figure 2.24) as compared to conventional mobile unloading arm (ref. Figure 2.25) mainly due to economic consideration. P&I Diagram is shown in Figure 2.26.

EIA for proposed jetty at Korlai River and expansion of existing jetty at Sanegaon by Indo Energy
International Ltd.
TEPL/ENV/CBS/2021‐05 65
Figure 2.24 Unloading of ship by flexible hose
Figure 2.25 Unloading of ship by unloading arms

EIA for proposed jetty at Korlai River and expansion of existing jetty at Sanegaon by Indo Energy International Ltd.
TEPL/ENV/CBS/2021‐05 66
Figure 2.26 The P&I diagram for the Liquid cargo handling

EIA for proposed jetty at Korlai River and expansion of existing jetty at Sanegaon by Indo Energy International Ltd.
TEPL/ENV/CBS/2021‐05 67
Figure 2.27 Truck/Wagon Loading System for POL/OIL

EIA for proposed jetty at Korlai River and expansion of existing jetty at Sanegaon by Indo Energy
International Ltd.
TEPL/ENV/CBS/2021‐05 68
2.10.7. PROPOSED SYSTEM (EDIBLE OIL)
As explained above, it is proposed to use flexible hose for unloading the liquid from the ship by operating the ship’s pumps at 600 TPH. The receiving pipeline, 300 mm diameter, from berth to storage will be supported from the conveyor gallery (fertilizer/coal) as far as possible. Since the ship’s pumps are expected to be inadequate to pump the liquid into storage tanks located in the area having elevation about 30 m more above the berth elevation, it is proposed to provide the receiving pipeline (300 mm dia) with a booster pump to do the needful. Tank farm will comprise 3 tanks of 10,000 T capacity having 25 m dia and 15 m high.
2.10.8. BAUXITE
Throughput = 0.5 to 1 MTPA (Export); receipt in Trucks. Since the cargo arrival is by trucks, the unloading station shall ideally be located as close to the stockyard area as far as possible to reduce the transportation distance between the two areas, i.e. unloading station and the stockyard. The material will be stacked in an open stockyard having capacity of about 67,000 tonnes. Stockyard is planned North East of berth with a view to minimise the conveying distance between the stockyard and the berth.
2.10.9. RECLAIMING AND SHIP LOADING
Berth 2 will remain occupied for Import Cargo (Fertilizers, Edible Oil) for a duration of 60 (45 + 15) days with 155 days as spare time available, considering 65% berth occupancy, for handling other cargo like the one under consideration, i.e. Bauxite. With ship loading rate of 2000 TPH and system efficiency as 65% (on conservative side), a ship of 50,000 DWT could be loaded in about 39 hours. Analysis of data appearing in the Drewry reveal reporting of only 14 fixtures of Bauxite during Jan to Nov 2009 with ship loading rate of 24,000 Tonnes per day for ships ranging from 50,000 to 60,000 DWT. With 1500 TPH, ship loading rate considered in the facility, average loading rate of 24,000 – 25,000 Tonnes per day is achievable. With quantum of import and export cargo proposed to be handled at berth 2, total berth utilization time will thus be about 120 days per annum, i.e. 60 days for bauxite and 60 for other cargo.
Figure 2.28 Loading arrangements at the Bauxite Yard

EIA for proposed jetty at Korlai River and expansion of existing jetty at Sanegaon by Indo Energy
International Ltd.
TEPL/ENV/CBS/2021‐05 69
2.10.10. SYSTEM DESCRIPTION
Belt conveyors (same as the one used for the Bauxite) from the berth transport the cargo to the stockyard and the same will be stacked via an overhead tripper provided with shuttle conveyor. The discharge from the shuttle conveyor will be through a telescopic chute to reduce the dust emission. Dumpers with about 15 T payloads will be loaded in loading hoppers provided with vibrating feeders each rated at 125 TPH. With two hoppers, two dumpers can be unloaded simultaneously. Throughput = 0.75 MTPA (Export) to 1.5 MTPA; receipt in Trailers and rakes. Since the cargo arrival is by trailers and rakes, the unloading station shall ideally be located as close to the stockyard area as far as possible to reduce the transportation distance between the two areas i.e. unloading station and the stockyard.
2.10.11. RECLAIMING AND SHIP LOADING
Berth 2 is proposed to be used for handling of this cargo. The average parcel load of the ship is about 50,000 T. Hence there will be about 30 ship calls a year. The loading shall be carried out through MHCs, with an average handling rate of 1400 T at 70% efficiency.
Hence the loading time would be around 44 hours, which is about 2.2 days per shipload. Hence the berth would be occupied for 66 days. However, by using two MHCs would reduce the berth occupancy to 33 days. Hence the total number of utilisation of the berth no. 2 is for 181 + 33 = 214 days with 20 days spare with berth occupancy of 70%, which is allowed for 2 berths.
2.11. STACKING AREA COMPUTATION
The area required for coal stacking is about 10 ha. The total storage required for all the cargos and the associated facilities as in the Feasibility document is given in the Table below.
Table 2.8 Storage area requirements for various phases
Sr.No Particulars First Phase Ultimate Phase
3.75* 3.75* 2 Dry Bulk Stackyard Area
Coal Stackyard 7 10 IRMB Stackyard 0.75 1.5 Limestone Stackyard 0.7 1.2 Bauxoite Stackyard 0.5 0.5
3 Container Stackyard area 1.5 2.5 4 General Cargo (Cement + Fertilizer + General Bulk,
etc.) 1.4 5.0
5 Liquid Bulk Cargo 0 2 6 Iron and Steel products 0.5 1.0 7 Wagon Loading and Engine Escape Line facilities 00 10.0 8 Others
Conveyor Corridor 0.5 1.0 Pipelines 0 1.0

EIA for proposed jetty at Korlai River and expansion of existing jetty at Sanegaon by Indo Energy
International Ltd.
TEPL/ENV/CBS/2021‐05 70
Truck terminal 0.5 2 Sewage Treatment Plant 0.5 1 Common User Facility 0 2 Misc. Port related facilities 0 2
Total 15.4 43.2 Greenbelt and others (Roads) @ 25% of total 19.0 54.0**In the above table the computations have considered the following;
1. Specific gravity of Iron Ore : 2.5 tonnes/m3 2. Specific gravity of Lime Stone : 1.0 tonnes/m3 3. Specific gravity of Bauxite : 1.2 tonnes/m3 4. The angle of repose of Iron : 40O 5. The angle of repose of other cargo : 30O Since the first phase dredging would generate huge quantities of good quality materials it is better to reclaim the entire 50 ha = 125 acres of land in the first phase itself, so that the consolidation over the years will make the required ground improved for construction.
2.12. DREDGING
2.12.1. QUANTITY OF DREDGING
Dredged Depth
The design ship has the following size;
Table 2.9Designed Ship Vessel Size
Ship DWT L B D Design Ship 105,000 290.0 m 43.5 m 14.0 m
Hence with the under‐keel clearance the depth in the channel at various sections would be as follows: (PIANC recommendation based on the environmental parameters)
Table 2.10 Designed depths in the Navigation channel for a vessel draft of 14.3 m
INNER CHANNEL OUTER CHANNEL KEEL CLEARANCE DEPTH KEEL CLEARANCE DEPTH
SUMMARY 14% 2.0 m 16.0 m 27% 3.8 m 17.8 m
2.12.2. DREDGED VOLUME
Computation of the dredging volumes is based on the Chart no. 1204/2010 and Navigational Chart no. 2026/211. The channel has been divided in two smaller stretches and average depth along the stretch is considered. This computation is approximate and detailed computation could be carried out at the DPR stage when the actual depths for the outer channel are surveyed and accurate depths at closer intervals are available.
Based on the available information on the subsoil (boreholes data), it could be safely assumed that the initial design depths could be achieved only by dredging soft material. However, detailed

EIA for proposed jetty at Korlai River and expansion of existing jetty at Sanegaon by Indo Energy
International Ltd.
TEPL/ENV/CBS/2021‐05 71
examination of the Geo‐technical data along with the Geophysical imprints reveals that, there is a possibility of occurrence of rock at the entrance of the creek, just past the existing sand bar. Therefore, 0.2 million cum of hand rock dredging is considered in the current calculations. This is however, subjected to verification at the DPR stage, when more detailed geo‐technical surveys would be carried out. It must be recognised that in order to allow navigation of Cape Size vessels these rock dredging quantities may further increase. This is a subject matter of verification at the DPR stage.
Figure 2.29 Inner and Outer Navigational Channel used for computation of quantities
Figure 2.30 Computation of Dredged Volume
Sl. No Length in mWidth in m DesignedDredged
depth in m
Existing
Depth in m
Depth to
be
dredged in
m
Volume1
(central) in
m3
Volume 2
(slope) in m3 Total
Volume in
m3
Part A – Approach Channel for the Direct Berthing Jetty at Korlai
A1 700 180 14.6 4.5 10.1 1272600 357035 1629635A2 750 180 14.6 3.5 11.1 1498500 462037.5 1960537.5A3 600 180 14.6 6.0 8.60 928800 221880 1150680A4 800 180 14.6 3.5 11.1 1598400 492840 2091240A5 350 180 14.6 2.0 12.6 793800 277830 1071630A6 500 180 14.6 3.5 11.1 999000 308025 1307025A7 800 180 14.6 4.4 10.2 1468800 416160 1884960A8 450 180 14.6 5.5 9.10 737100 186322.5 923422.5A9 12550 180 14.6 10.25 4.35 9626650 1187387 10814037(Weathered) Rock Dredging 200,000
Total A 17500 ‐‐ ‐‐ ‐‐ ‐‐ 19123650 3909517 23033167
Part B – Inner Channel for the Sanegaon Facility
B1 20540 80 3.1 2.2 0.9 1478488 295776 1508064

EIA for proposed jetty at Korlai River and expansion of existing jetty at Sanegaon by Indo Energy
International Ltd.
TEPL/ENV/CBS/2021‐05 72
Grand
Total
20602138 3939093 24541231
In the first phase however, a lesser depth for handling handy max vessel may be evaluated, for the sake of making the port viable. However, keeping pace with the traffic the dredged depth would be increased for the Cape handling which would be in the tune of 34.0 million cubic meters.
2.12.3. DISPERSION OF DREDGED MATERIAL
Identification of the dumping site in the offshore area was carried out so that after dumping the resulting concentration in the identified location is within permissible limits. The already calibrated hydrodynamic model was coupled with a dispersion module to give the likely spread (dispersion) of the dumped material. Dumping location of dredged materials is given in Figure 2.31
DHI selected the modelled dumping grounds based on information and earlier studies provided by the client. Two locations 18°31'41"N, 72°41'32"E for the northern dumping site and 18°28'21"N, 72°42'53"E for the southern dumping site are selected which are approx. 24 km from the shore.
Figure 2.31 Dumping location of dredged materials
The dispersion of dredge spoil around the disposal area was simulated for the Northeast monsoon period from 26.10.2016 to 26.11.2016. The spread of the disposed sediment on the sea floor after the one month of sediment disposal for the Northern location is shown in Figure 2.32.

EIA for proposed jetty at Korlai River and expansion of existing jetty at Sanegaon by Indo Energy
International Ltd.
TEPL/ENV/CBS/2021‐05 73
Figure 2.32 Model simulated deposition depth after dumping
The dispersion studies carried out at the proposed north and south dumping locations indicated that irrespective of the phase of the tide, dumped material does not enter the proposed extension of the outer channel. Also, material could be dumped inside the periphery of about 1.5 km radius from the suggested location. About 20 Million cum of the dredged material resulting from the capital dredging is assumed to be disposed of suitably at these two locations. For maintenance dredging, these dumping locations could also be utilised for disposing of dredged material during the maintenance of the channel, if the properties of the dumped material do not significantly changed from the material considered in the study. The model also indicated that the average depth of deposition after dumping is about 0.30 m.
2.12.4. RECLAMATION
From the examination of the boreholes it was ascertained that there is good quality sand on the top 7 m of the seabed. This could be used for reclaiming the land between the high‐water line and the 0 m contour. This area would be utilized for material handling and storage.
The reclamation would be carried out between retaining embankments. The dredged material could be directly pumped in to the enclosed area through rain or by pumping through floating pipelines.
The tentative area for the reclamation and the berth is shown in Figure 2.2. The berth close up showing the details of the berth area and the dolphin and approaches is shown in figure 2.23 below.
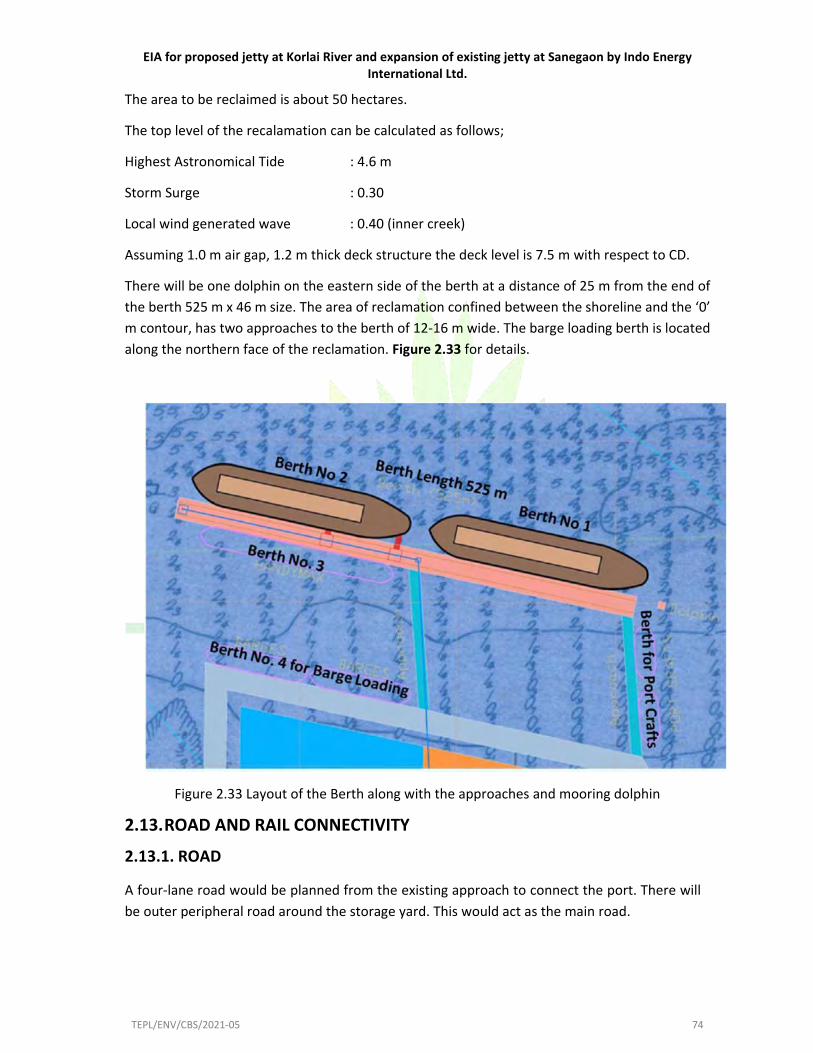
EIA for proposed jetty at Korlai River and expansion of existing jetty at Sanegaon by Indo Energy
International Ltd.
TEPL/ENV/CBS/2021‐05 74
The area to be reclaimed is about 50 hectares.
The top level of the recalamation can be calculated as follows;
Highest Astronomical Tide : 4.6 m
Storm Surge : 0.30
Local wind generated wave : 0.40 (inner creek)
Assuming 1.0 m air gap, 1.2 m thick deck structure the deck level is 7.5 m with respect to CD.
There will be one dolphin on the eastern side of the berth at a distance of 25 m from the end of the berth 525 m x 46 m size. The area of reclamation confined between the shoreline and the ‘0’ m contour, has two approaches to the berth of 12‐16 m wide. The barge loading berth is located along the northern face of the reclamation. Figure 2.33 for details.
Figure 2.33 Layout of the Berth along with the approaches and mooring dolphin
2.13. ROAD AND RAIL CONNECTIVITY
2.13.1. ROAD
A four‐lane road would be planned from the existing approach to connect the port. There will be outer peripheral road around the storage yard. This would act as the main road.

EIA for proposed jetty at Korlai River and expansion of existing jetty at Sanegaon by Indo Energy
International Ltd.
TEPL/ENV/CBS/2021‐05 75
There will be internal roads, which would be connecting the peripheral road based on requirement and alignment of the starage areas.
In the final phase there would be four lane road connecting the port to Roha shall be establisehed for better communication.
2.13.2. RAIL
The nearest railhead is near Roha, which is located around 40 kms away on the Kokan railways network
2.14. NATURAL RESOURCES
2.14.1. WATER REQUIREMENT
2.14.1.1. Domestic requirement
Water requirement for meeting domestic water requirement in construction phase will be 38.25 KLD and in operation phase will be 35.5 KLD.
The per capita consumption for the in port consumption is taken as 90 liters per day.residential accommodation would be permitted inside the CRZ area. The occupancy is taken as 350 in the port. Total consumption will be 35,500 liters per day. A reservoir of capacity 1 lakh liters is proposed at location of highest contour. The water would be received from the MIDC supplies. All the utility buildings shall be provided with individual Overhead Tanks in order to achieve water supply system. The pump room will be under the Overhead tank connected with a water treatment plant (WTP) if required. Otherwise, the raw water will be directly fed to the OHT. The Pumps are so selected to fill the tank once in a day. Two numbers (one as standby) 25 HP water supply pump with suitable pump panel is proposed. Pipelines are spread over the area underground/ in built‐up trench and provided with outlet points wherever necessary.
Water requirment for Jetty Activities
Sr.No Activities Phase I Final Phase
Potable water Demand (Other than Port Building) 17 17 Potable water Demand (Port Users & Operation
Buildings) 18 18
Fire Demand in Buildings 30 30 Water Demand for washing and servicing 15 15 Total water demand for Coal Stackyard Dust
Suppression System for 2 days 200 500
Total water demand for IBRM Stackyard Dust Suppression System for 2 days
100 250
Fire Fighting Demand in Stackyard area 100 1080 Total (in cum/day) 480 1080 Total (in MLD) 0.48 1.08

EIA for proposed jetty at Korlai River and expansion of existing jetty at Sanegaon by Indo Energy
International Ltd.
TEPL/ENV/CBS/2021‐05 76
2.14.2. POWER REQUIREMENT
Electrical system design should from an integral part of the project. Selection of equipment distribution pattern, cable route, and earthing arrangement, location of switches boards, captive power requirement etc., shall be considered for preparing schemes. Obtain a general layout, mark it with major loads at various locations was the method used to determine the appropriate total load in KW/KVA.
It is proposed that the incoming HT supply is taken from the nearest substation at voltage level of 33 KV. Single transformer of capacity of 33 KV/ 11 KV, 12 MVA oil filled out door type shall be installed. Detailed working of the power requirements are given in the TFR document. A 33 KV switch yard is to be set up near to the Port area from where three or four 11 KV feeders are taken to feed the Port equipment.
33 KV and 11 KV control rooms are required near the Yard. 11 KV supply will feed Transformers for Dry Bulk Terminal (Iron Ore), Dry Bulk Terminal (coal) and common utility. Each Transformer size could be selected based on the individual total connected load.
Outdoor transformers are preferable where space is not a constraint and in the case of those for which the main switch board can be away from the transformer. But in large industries, larger transformers are invariable which will be indoor type since it requires bus trunking at the LT side and main switchboard should be near the trunking.
For outdoor transformers, 11KV supply is drawn to the consumers premise through OH lines and received at a separate DP structure for mounting it. There will be another DP structure for the consumer for fixing the AB switch and fuses. Substation for Iron ore and Coal is considered separately in different locations.
2.14.3. WASTEWATER GENERATION AND MANAGEMENT
During construction phase sewage will be generated from workers camp which will be treated in STP. Total sewage generation during operation phase will be 28.3 m3/day. Sewage Treatment Plant of capacity 30 m3/day will be provided to treat the sewage.
The sewage network includes HDPE pipelines, Manholes, Gully chambers, Inspection chambers, Oil and soap removal chambers. Most of the work involves civil construction activity with construction of the flow path of sewage to the Sewage Treatment Plant. The sewage network is connected to the Sewage Treatment Plant at the final phase of flow from a far point of origin. A network of such lines equipped with appropriate manholes will be led to the mouth of the STP. The treated water will be used for irrigation or dust suppression. Sludge generated will be used as manure.
2.14.4. SOLID WASTE GENERATION AND MANAGEMENT
Construction waste will be disposed suitably as per Maharashtra Pollution Control Board (MPCB) guidelines through contractors. In operation phase Solid waste generated is proposed to be sent to authorized and organized solid waste management units. Estimated Amount of solid waste to be generated in construction phase will be 340 Kg/day and in operation phase will be 140 Kg/day.

EIA for proposed jetty at Korlai River and expansion of existing jetty at Sanegaon by Indo Energy
International Ltd.
TEPL/ENV/CBS/2021‐05 77
2.15. MANPOWER REQUIREMENT
Man power requirement in construction phase is 850 and of operation phase is 350.
2.16. PROJECT IMPLEMENTATION SCHEDULE
The project implementation schedule for construction of proposed wharf will be of 30 months

EIA for proposed jetty at Korlai River and expansion of existing jetty at Sanegaon by Indo Energy
International Ltd.
TEPL/ENV/CBS/2021‐05 78
CHAPTER03BASELINE
ENVIRONMENTALSTATUS

EIA for proposed jetty at Korlai River and expansion of existing jetty at Sanegaon by Indo Energy
International Ltd.
TEPL/ENV/CBS/2021‐05 79
3. DESCRIPTION OF ENVIRONMENT
3.1. GENERAL
Baseline data is a preliminary step in the EIA process collected within 10 km radius of the proposed project sites for environmental components. Baseline data is collected to serve two purposes in the EIA study, first it helps to understand the current conditions of the area, and how the project needs to be implemented considering these conditions and second, it helps to assess and predict the possible environmental changes that could occur, once the project is proceeding.
Baseline data is the data collected for various factors of the project study. This includes: Physical‐ the area, the soil properties, the geological characteristics, the topography,
watershed properties, etc. Chemical‐ water, air, noise and soil pollution levels, etc. Biological‐ the biodiversity of the area, types of flora and fauna, species richness, species
distribution, types of ecosystems, presence or absence of endangered species and/or sensitive ecosystems etc.
Socioeconomic‐ demography, social structure, economic conditions, developmental capabilities, displacement of locals, etc.
Cultural‐ location and state of archaeological and/or religious sites.
The levels of the various environmental parameters which could be affected significantly due to the project activities are measured.
For the proposed project baseline data was collected and monitored for one season (Pre‐monsoon) Secondary data was collected from various Government organizations, news articles and research papers.
M/s Ana Laboratories was involved in for environmental baseline studies for components like ambient air, soil, water, noise marine water & sediment, marine biology.
Monitoring surveys of the study area (project area) has been carried out in one season i.e. October 2015 to February 2016. In addition separate studies for the bed material and marine ecology were carried out between March 2016 and May 15th 2016.
3.2. STUDY AREA
The environmental baseline data was collected in the pre‐monsoon and post‐monsoon season for an area of 10 km radius from proposed project site. The secondary data for the Raigad region was collected from various secondary sources such as published reports, online literature review, NDMA, CGWB report, etc.
The entire project area is divided in to various environmental segments in order to establish baseline environmental study. The various 8 locations selected on the merits of environmental settings are indicated in Table 3.1

EIA for proposed jetty at Korlai River and expansion of existing jetty at Sanegaon by Indo Energy
International Ltd.
TEPL/ENV/CBS/2021‐05 80
Table 3.1 Environmental Monitoring Stations
3.3. TOPOGRAPHIC SURVEY
Topographic maps are detailed, accurate graphic representations of features that appear on the Earth's surface. The features include roads, buildings, urban development, railways, airports, names of places and geographic features, administrative boundaries, state and international borders, reserves, hydrography, relief and vegetation the project area. These were later verified by using SOI topo sheet. The proposed project study area (10 km) falls in Topo sheet no. E43G13 on scale of 1:50000. The topo sheet is given in
Figure 3.1 Topography map
SR. NO. STUDY LOCATION
01 Project Site02 Bagmala03 Walke04 Mandala05 Vave 06 Talekhar 07 Salav 08 Korlai
Proposed
Jetty
Existing Facility

EIA for proposed jetty at Korlai River and expansion of existing jetty at Sanegaon by Indo Energy
International Ltd.
TEPL/ENV/CBS/2021‐05 81
3.4. GEOLOGY
Geologically, the Konkan lowlands are a platform of marine denudation raised to form a narrow plain. The geology of the entire district consists of dark coloured volcanic lava flows and laterites which date back to the Mesozoic Era. These are spread out in the form of horizontal sheets or beds and have innumerable spurs, hills, ridges, peaks and plateau, the lava are termed as plateau basalts. Since these basaltic lava flows cover an extensive region in the Deccan and frequently present step like appearance to the hills and ridges, they are commonly known as “Deccan trap”.
The rocks either by exploration into massive spheroid boulders, which are usually seen on hill slopes and foot hills. The Deccan traps generally lack minerals of economic importance but being hard, dense and durable, are most suitable as building materials. There are two well‐known groups of springs in the district, namely the Unhere and Sav springs. These are known to possess medicinal value in curing skin diseases and rheumatic complains. Nodular Kankar, a concretionary lime carbonate, is usually found sporadically on soils and alluvium covering the Deccan trap in the district. The sea shells found along the coast at places are used for the manufacturing lime; salt is produced by direct evaporation of sea water near Uran, Sheva, Karanja, Pen and Panvel town. The region is made up of Basalt and Laterite and both are used as a building material. Bauxite is available in Murud and Shrivardhan tehsils. At few places, especially in Varanda Ghats area zeolites are reported.
3.4.1. DRAINAGE PATTERN
The district is drained by short westwards flowing parallel streams, which originate in the Sahyadri hills in the east and flow into the Arabian Sea. These streams are swift and erode material and deposit on the shoreline. Besides the general parallel pattern of the rivers, the tributary pattern tends, at places, to be rectangular suggesting the adaptation of stream to the local rock structure. In the north‐west the Panvel creek collects water from a radial pattern of short stream of which the Kalundri River is a major stream but others are very short and seasonal. The Patalganga, Bhogawati and Amba rivers drain mainly Khalapur, Sudhagad and Pen tehsils into the Dharamtar creek. The Patalganga River receives the tail water of the Khopoli Hydel Power Station. The Kundlika or Roha River drains a narrow central belt into the Chaul creek. The Mandad river drainage basin is like an amphitheater closing round the wide estuary at the mouth of Janjira fort. The southern part of the district is drained by the well‐developed system of the Savitri. The main tributaries of the Savitri are the Ghod, the Gandhari, the Kal, the Nageshri rivers. The map of drainage pattern is given in Figure 3.2.

EIA for proposed jetty at Korlai River and expansion of existing jetty at Sanegaon by Indo Energy
International Ltd.
TEPL/ENV/CBS/2021‐05 82
Figure 3.2: Drainage map of Raigad
3.5. PHYSIOGRAPHY
Raigad district forms a part of Maharashtra littoral, the micro level divisions of coastal plain. It is slightly elongated in the north ‐ south direction. Raigad has a long indented coastline. The length of the coastline is about 240 km, with a number of creeks and inlets, suggesting submergence confirmed by the submerged khair forest in Thane creek and Mumbai harbour. Though the districts form an important part of the traditional “Konkan Plain‟, ruggedness and uneven topography are its governing physical features. The Sahyadri (Western Ghats) in the east send several transverse numbers of subsidiary hills westwards denying the plains of a uniform level and continuous character. On the basis of variation in local relief, the district can be classified into six groups’ i.e.
i. Sahyadri Hills ii. Konkan Forested Hills iii. Sudhagad Plateau iv. Ulhas Basin v. Kal‐ Savitri Valley vi. Raigad Coast
The physiography map for Raigad is given in Figure 3.3

EIA for proposed jetty at Korlai River and expansion of existing jetty at Sanegaon by Indo Energy
International Ltd.
TEPL/ENV/CBS/2021‐05 83
Figure 3.3 Physiography map of Raigad district
The district has three physiographic divisions i.e. (i) Coastal zone in west covers about 20% of the district (ii) Central zone covers about 1/3rd of the district, consisting of fertile land in low lying area (iii) Hilly zone in the eastern part highly uneven in altitude and covered with forest. This hill range is characterized by ruggedness and uneven topography, with crest line of peaks and saddles forming the eastern horizon. Ulhas, Panvel and Patalganga are the three main rivers in northern

EIA for proposed jetty at Korlai River and expansion of existing jetty at Sanegaon by Indo Energy
International Ltd.
TEPL/ENV/CBS/2021‐05 84
part. Kundalika River is the main river in central part whereas in the southern part Savitri River is the main river.
The soils in the district are formed from the Deccan Trap which is predominating rock formation with small out crops of Laterite at a few places in the Poladpur taluka and Matheran hill. The soils are grouped as Forest, Varkas, Rice, Khar or Saline, Coastal Alluvium and Laterite as per the location and topographical situation.
3.6. LAND USE
Primary Data
In the present study, both digital image processing and using visual interpretation technique were used to generate an output of Land use / Land cover map of study area on 1: 50,000 scale.
Methodology: The methodology used for the study consists of the following components:
(i) Base Map Preparation
The base map was prepared using the Survey of India reference map on 1:50,000 scale. Interpreted thematic details were transferred on the base map. Besides, other supporting data like project reports and statistical data published by various Government departments have also been used.
(ii) Ground Truth Data Collection
Ground data on geo‐environmental components of the study area were collected for verification of information about the different features on the study areas. During the ground truth, detailed information on agricultural practices, wastelands, mining, industrial area etc. was collected along with other land features.
(iii) Interpretation of Remote Sensing Data
A hybrid technique has been used i.e. visual interpretation and digital processing for identification of different land use /land cover classes based on the image characteristics like tone, size, shape, pattern, texture, location and association etc. An image interpretation keys were developed based on such image characteristics, which enable interpretation of satellite images for land use/land cover features. Further, the land use/land cover and other baseline layers were put in a GIS database for integration, analysis, statistics generation and final out in the form of land use the land cover map.
Land use pattern was determined for 7km radius of project site. It was observed that as proposed area surrounding the project consist mostly of Agricultural land, Thorn scrub and Moist Deciduous forest with spars settlement and mangrove. Land use of the proposed site on scale 1:50000 is given in Figure 3.4.

EIA for proposed jetty at Korlai River and expansion of existing jetty at Sanegaon by Indo Energy
International Ltd.
TEPL/ENV/CBS/2021‐05 85
Figure 3.4 Land use map of proposed project site

EIA for proposed jetty at Korlai River and expansion of existing jetty at Sanegaon by Indo Energy
International Ltd.
TEPL/ENV/CBS/2021‐05 86
3.7. SHORE LINE
The coastal stretch in the vicinity of the Revadanda/Salav/Korlai is covered by Naval Hydrographic chart nos. 2026. It can be seen from this chart that the coastline is pierced by the Kundalika River, which divides the shore line in to two distinct segments. While the southern shoreline is mostly North‐South direction, the Northern shoreline makes an angle of 3400 ‐ 3500 N. The estuary entrance is protected by a peninsula on the west of entrance known as Korlai Headland, providing the necessary protection from the south‐westerly waves.
The shoreline near the entrance is generally rocky and fronts an elevated plateau. The slopes of the shoreline are steep and almost vertical on the southern part of the estuary. The shoreline of the bay is generally in the east‐west direction and is fringed with laterite rocky outcrops. The Southern shoreline carries the Korlai Fort and small hamlet of fishermen community. To the north of the entrance the shoreline is flatter and fronts a white and wide beach. The foreshore of this area is in general flat and more populated than the southern part of the shoreline. The shoreline is mildly sloping along the coastline. The near shore area behind the development zone is shallow and located in a slight embayment, creating conducive zone for reclamation for the port back up without affecting the creek morphology adversely. Physical setting of the Shorelines & creek area is given in Figure 3.5
Figure 3.5 Physical setting of the Shorelines & creek area fo Korli deep water jetty
The existing facility at Sanegaon on the Right bank of the Kundalika River is shown on the Satellite imagery obtained from the Google satellite archives. The depth of water upstream of the facility is about 2 to 3 m along the deepest channel. The downstream area is deeper than the upstream, because of the channelization and meandering respectively. The upstream of the existing facility, the river meanders due to the tidal effect and stagnating flows especially in the non‐monsoon conditions. The channelization happens right at the facility. Due to the flow channelization, depths in the river below this point are slightly better varying between 2.5 to 3.5 m with respect to the Chart Datum.

EIA for proposed jetty at Korlai River and expansion of existing jetty at Sanegaon by Indo Energy
International Ltd.
TEPL/ENV/CBS/2021‐05 87
3.8. SEISMICTY
The project area is classified in Zone IV as per NDMA, Earthquake vulnerability map, having moderate seismic intensity to earthquake. All the construction of the proposed project would adhere to the norms for this seismic zone and seismic zone is as given in Figure 3.6
Figure 3.6 Map showing seismic zones of India
Project Location
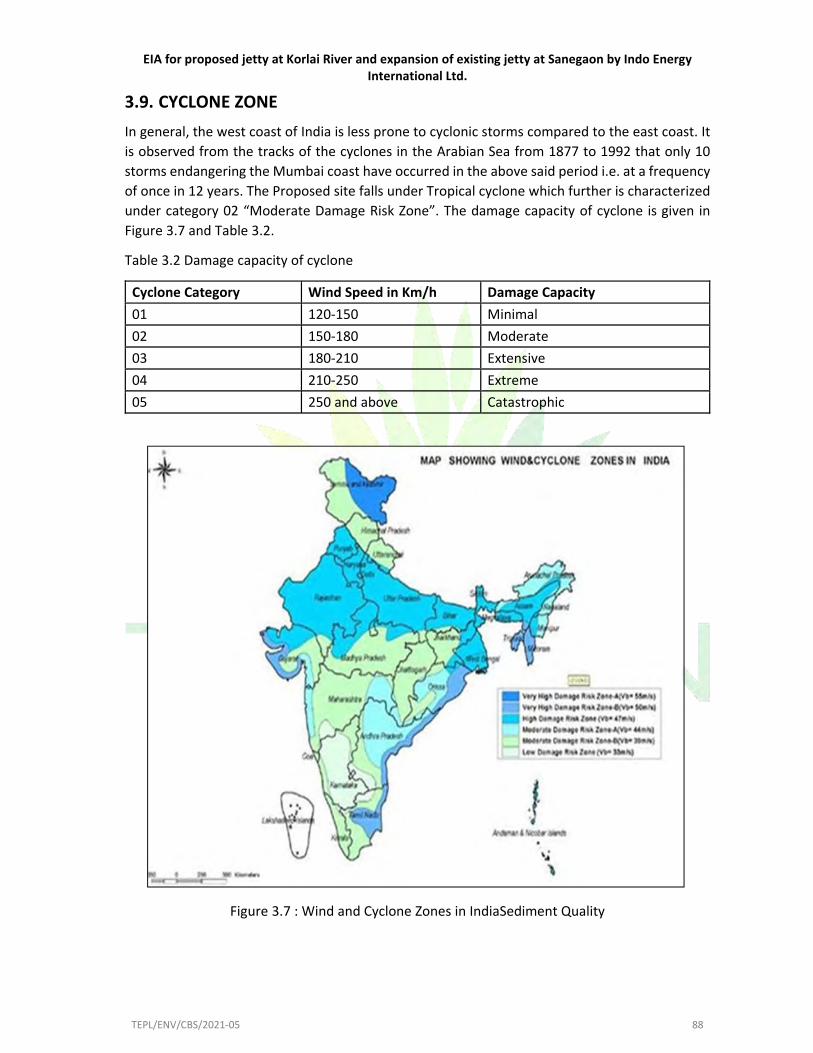
EIA for proposed jetty at Korlai River and expansion of existing jetty at Sanegaon by Indo Energy
International Ltd.
TEPL/ENV/CBS/2021‐05 88
3.9. CYCLONE ZONE
In general, the west coast of India is less prone to cyclonic storms compared to the east coast. It is observed from the tracks of the cyclones in the Arabian Sea from 1877 to 1992 that only 10 storms endangering the Mumbai coast have occurred in the above said period i.e. at a frequency of once in 12 years. The Proposed site falls under Tropical cyclone which further is characterized under category 02 “Moderate Damage Risk Zone”. The damage capacity of cyclone is given in Figure 3.7 and Table 3.2.
Table 3.2 Damage capacity of cyclone
Cyclone Category Wind Speed in Km/h Damage Capacity 01 120‐150 Minimal02 150‐180 Moderate03 180‐210 Extensive04 210‐250 Extreme05 250 and above Catastrophic
Figure 3.7 : Wind and Cyclone Zones in IndiaSediment Quality
Project Location

EIA for proposed jetty at Korlai River and expansion of existing jetty at Sanegaon by Indo Energy
International Ltd.
TEPL/ENV/CBS/2021‐05 89
Secondary Data
Deccan Trap basal of upper Cretaceous to lower Eocene is the major rock formation and intruded by a number of dykes. Soil sediments found in most part of the river is found to be sandy clay. The river does not show braiding which is popularly attributed to heavy sediment load in a river having a wide and shallow cross section. The river does not have a steep gradient which may cause increase in velocity and turbulence. The slopes of this river indicate that it does not fall under rapid zone. It is also observed that there is negligible migration of the settlement of soil in the river.
The river shows salinity variation at high tide as well as at low tide. The sedimentology and vegetation cover of island groups nearby are influenced by these salinity changes at high tide and low tide in the river. Rate of sedimentation is highly dependent on the amount of suspended sediment matter. The rate is found to be highest in between 12 to 15 km from the mouth of the river. {Source: Detailed project report: Revadanda creek/Kundalika river (client:IWAI) http://iwai.nic.in/sites/default/files/6770816065NW‐85%20Final%20DPR_Revdanda.pdf and A geo‐environmental study of creek and river islands in Kundalika between Kopri and Bahe in Raigad district of Maharashtra http://hdl.handle.net/10603/2499}
Primary Data
The sediment sampling stations were decided on the basis of site specific information such as source of pollution along the sampling site, existing ecology etc. Sediment samples were collected at 16 locations.
Methodology for Sample Collection, Preservation and Analysis
All samples were collected within the survey area using a suitable grab sampler and sub‐sampled in plastic zip lock bags. The samples were transported to the laboratory and analyzed for selected physical and chemical parameters using standard methods.
Interpretation
Presence of heavy metals and oil & grease could be as a result of the operation of boats and vessels where oil leakage or grease mixing/solid waste in water can be a source of contamination. Also, higher levels of iron & chromium may be due to industrial & domestic activity and other existing structures.
3.10. WATER ENVIRONMENT
Water environment includes two environmental settings, i.e. ground and surface. Baseline data with regard to these two environmental settings was generated. The results were compared to CPCB’s stipulated criteria for raw water usages, use based classification of surface water and water quality standards for coastal waters.
Secondary data
Kundalika is a non‐perennial river having a length of approximately 35.5 km. The river flows from hilly areas near Roha city and merges in the creek at Salav. MIDC has established an industrial estate at Dhatav, on the bank of this river. It is a prime source of water for the industrial estate,

EIA for proposed jetty at Korlai River and expansion of existing jetty at Sanegaon by Indo Energy
International Ltd.
TEPL/ENV/CBS/2021‐05 90
for nearby villages and for Roha city. Saline water zone starts from the downstream of MIDC to Salav.
Kundalika River falls under priority class II which means it falls in a relatively more polluted category. One of main reasons for the pollution of this river is due to the discharge of domestic wastes from villages/towns along the bank of the river. Major villages/towns along the bank of river are Roha, Astami, Bhira and Kolad. The wastes are direct discharged into the river without any treatment and have become a regular and substantial source of pollution of the sweet water zone of the river. A report of MPCB in 2019 shows that the total discharge of sewage in Roha city was 2.8 MLD. There are no STPs in that area to treat the sewage. BOD and COD of a drain at Ashtami Bridge, Roha was found to be 105.0 mg/l and 228 mg/l indicating high amount of pollution. MPCB under the project National Water Monitoring Programme (NWMP) monitors the quality of Kundalika River. From this data it was observed that most of the locations were not complying to the bathing standards.
Other important reason for pollution in the river is that there are a number of industries present near the river which use water from that river. MIDC Roha has 41 units out of which 35 are effluent generating units. For these industries there is a common effluent treatment plant (CETP) of Roha Industrial Association (ROHA) having a capacity of22.5 MLD. After treatment, the effluent is disposed in the creek 14.7 km away from CETP. From these industries, there is no direct discharge of effluents into the Kundalika river. It was observed that the CETP had an efficiency of 75%, was not able to attain the discharge limit of 100mg/l and 250 mg/l for BOD and COD respectively. (Source: Detailed project report: Revadanda creek/Kundalika river (client:IWAI) http://iwai.nic.in/sites/default/files/6770816065NW‐85%20Final%20DPR_Revdanda.pdf Report on Action plan for clean‐up of pollution stretch of Kundalika river https://www.mpcb.gov.in/sites/default/files/river‐polluted/action‐plan priority/priority_I_KUNDALIKA_28052019.pdf).
Primary data
To assess the quality of water representative samples were collected from sixteen different sampling stations within the survey area.
Methodology for Sample Collection, Preservation and Analysis
The representative water samples were collected at 16 locations within the impact zone to evolve a general background of the project sites in 2 liter pre‐cleaned bottles. Appropriate preservatives according to the CPCB (Guidelines for Water Quality Management, 2008) were added and samples were stored in ice‐box at temperature of 4°C in dark & brought to the laboratory with utmost care. Highly unstable parameters like pH, temperature, turbidity were measured on site and dissolved oxygen (DO) of the samples was fixed immediately. Photographs of the water sampling are as shown in Figure 3.8.
Standard analytical methods were adopted for the analysis of physio‐chemical, microbiological and heavy metal analysis. Analysis was carried out within the stipulated time period.

EIA for proposed jetty at Korlai River and expansion of existing jetty at Sanegaon by Indo Energy
International Ltd.
TEPL/ENV/CBS/2021‐05 91
Figure 3.8 Water Sampling
Interpretation:
The pH of water samples at all the locations was found to be moderately alkaline. Electrical conductivity and Salinity are present at optimum levels of sea water. Micro & macro nutrients are present at natural levels. Also presence of COD, BOD, heavy metals and Oil & Grease indicates commercial or domestic pollution in the sampled areas. Overall on basis of secondary data and qualitative analysis of the water, it can be concluded that the presence of source of pollution may be due to anthropogenic activities, industrial waste, domestic waste and boat movements.
3.11. BIOLOGICAL ENVIRONMENT
3.11.1. MARINE ECOLOGY
In view of the need for conservation of environmental quality and biodiversity, study of biological environment is one of the most important components for ecological assessment. Ecological system shows inter relationship between biotic and abiotic components including dependence, competition and mutualism. Biotic component comprises of both plant and animal communities, which interact not only within and between them but also with the abiotic components viz., physical and chemical components of the environment. Generally biological communities are the indicators of climatic conditions, dependent on environmental condition and resource of its distribution and survival. It may change if there is alteration in the environmental variables like temperature, humidity, rainfall, soil characteristics, topography etc., which are responsible for maintaining the homeostasis of the environment. The species of flora and fauna in the environment are organized into natural communities with mutual dependencies and show various responses and sensitivities to anthropogenic influences. The changes in biotic community are studied in the pattern of distribution, abundance and diversity.
3.11.1.1. Phytoplankton
Plankton is an important component of an aquatic ecosystem, which responds to ecosystem alterations rather rapidly. It is due to the fact that planktonic organisms, which react to different

EIA for proposed jetty at Korlai River and expansion of existing jetty at Sanegaon by Indo Energy
International Ltd.
TEPL/ENV/CBS/2021‐05 92
types of water pollution, play a key role in turnover of organic matter and energy through the ecosystem. This reaction is very rapid because of relatively short lifetime and high reproduction rates of these organisms. Since the phytoplankton plays a key role of primary producer in aquatic environment, it is the first component in the trophic tier to be affected by pollution. Phytoplankton can grow rapidly and form massive blooms that can be regulated by environmental factors such as nutrients, availability of light and biotic interaction with grazers. Phytoplankton is generally microscopic and passive drifters with the currents.
Methodology for Sample Collection, Preservation and Analysis of Phytoplankton
Phytoplankton was enumerated from unfiltered water samples. Plastic bucket was used for collection of water samples. Phytoplankton samples were collected from different locations in 250 ml plastic bottles. After collection samples was preserved with Lugol’s solution and brought to the laboratory with utmost care. To prevent outside contamination, the bottle were closed properly. Phytoplankton samples were allowed to settle; 1 ml of aliquot of sample was taken for quantitative population analysis and Bio‐diversity indices. Organisms were counted under microscope using standard identification key.
Result
Phytoplankton counts recorded at different sampling stations are presented in Table 3.3.
Table 3.3 Phytoplankton Species observed
Sr. No. Species observed in core area Species observed in buffer area 1. Asterionella sp. Asterionella sp. 2. Thalassiothrix sp Thalassiothrix sp 3. Streptotheca sp Streptotheca sp 4. Navicula sp Navicula sp 5. Coscinodiscuss sp Coscinodiscuss sp 6. Skeletonema sp Skeletonema sp 7. Thalassiosira sp Thalassiosira sp 8. cyclotella sp cyclotella sp 9. Odontella sp Odontella sp 10. Rhizosolenia sp Rhizosolenia sp11. Leptocylindrus sp Leptocylindrus sp 12. - Guinardia sp13. - Ditylum sp14. - Dictyocha sp 15. - Melosira sp16. - Triceratium sp 17. - Asteromphalus sp 18. - Pleurosigma sp 19. - Gyrosigma sp 20. - Trichodesmium sp 21. - Thalassionem sp

EIA for proposed jetty at Korlai River and expansion of existing jetty at Sanegaon by Indo Energy
International Ltd.
TEPL/ENV/CBS/2021‐05 93
Sr. No. Species observed in core area Species observed in buffer area 22. - Nitzschia sp 23. - Grammatophora sp 24. - Chaetoceros sp 25. - Ceratium furca 26. - Ceratium tripos 27. - Pyrophacus sp 28. - Phaeodactylum sp 29. - Climacodium sp 30. - Planktoneilla sp 31. - Peridinium sp32. - Surirella sp33. - Dytilum sp34. - Clostidium sp35. - Actinoptychus sp
Interpretation
The concentration and the numerical abundance of the phytoplankton indicate the fertility of a region. Samples were collected in core area (project site) and buffer area (offshore area) however the highest diversity index was observed in buffer area. The Asterionella Formosa, Navicula, Coscinodiscus and Streptotheca species was little dominant which was recorded in all stations. Asterionella formosa is one of the most common planktonic diatoms which is found in eutrophic water however its density has been interpreted as a response to atmospheric nutrient enrichment (Saros et al. 2005, Saros et al. 2010). Coscinodiscus and Streptotheca is very common plankton its widespread showed very high cell density in warm water, it presence is an indication of organic pollution (Naik et al., 2009; Sahu et al., 2012).This results show that study area water body received high organic load and rich in nitrogen concentration because high concentration of Navicula diatom is indicate high loads of nutrients which will be increased productivity in algae, resulting in blooms that can cause low dissolved oxygen and fish kills. However there is no rare or endangered group of phytoplankton were found in the area.
3.11.1.2. Zooplankton
Zooplankton is a very important group in the aquatic ecosystem and acts as the primary consumer. The zooplankton serves as the natural food source for many aquatic organisms, including fishes. Creek water zooplankton show considerable variety comprising of members of almost every group from protozoa to chordate. Depending on seasons and environmental conditions, the plankton community shows pronounced variation in its character and composition.
Methodology for Sample Collection, Preservation and Analysis of Zooplankton
Desired volumes of the waters were filtered through plankton net (300 μm mesh size) Zooplankton samples were collected from different locations in 250 ml plastic bottles. After

EIA for proposed jetty at Korlai River and expansion of existing jetty at Sanegaon by Indo Energy
International Ltd.
TEPL/ENV/CBS/2021‐05 94
collection samples was preserved with 5% buffered formalin solution and brought to the laboratory with utmost care. Samples were allowed to settle; 1 mL of sample was taken for quantitative analysis of density, bio‐diversity indices and total bio‐mass. Different zooplankton taxa were sorted, identified and enumerated under stereoscopic microscope. Organisms were counted under microscope using standard identification key.
Result
Zooplankton groups were observed and their Shannon‐Wiever index is given in the Table 3.4
Table 3.4: Observed Zooplankton Species with Diversity Index
Sr. No. Species observed in core area Species observed in buffer area 1. Gastropod larva Copepoda
2. Bivalve larva Amphipoda
3. Copepoda Polychaeta larvae
4. Fish larvae Decapoda larvae
5. Amphipoda Chaetognatha
6. Polychaeta larvae Gastropod larva
7. Decapoda larvae Fish larvae
8. Chaetognatha Foraminifera
9. Lucifers Nauplius larva
10. Foraminifera Cladocera
11. ‐ Hydromedusa
12. ‐ Medusa
13. ‐ Lammalibranch
14. ‐ Cephalopoda larvae
15. ‐ Salpidae
16. ‐ Heteropoda
17. ‐ Invertebrate larva
18. ‐ brachiopooda larva
19. ‐ Ctenophora
20. ‐ Isopoda
Interpretation
The concentration and the numerical abundance of the zooplankton indicate the high productive water body. Samples were collected in core area (project site) and buffer area (offshore area) however the highest diversity index was observed in buffer area. The Copepoda, Amphipods and Lucifer larva species was little dominant which was recorded in all stations. Copepods are a group of small crustaceans found in nearly every freshwater and saltwater habitat. Some species are planktonic, and some are benthic. Pollution affects its molecular biology i.e. Swimming behavior, reproduction etc. Copepod constitutes one of the major zooplankton community and serves as food for several fishes and play major role in the fisheries. luciferid shrimps (larvae and adults)

EIA for proposed jetty at Korlai River and expansion of existing jetty at Sanegaon by Indo Energy
International Ltd.
TEPL/ENV/CBS/2021‐05 95
had the highest contribution in abundance, in the coastal and oceanic region. Low salinity coastal waters are preferred for the reproduction of many of these organisms (Borradaile, 1915) (Harper, 1968;Lee et al., 1992;Teodoro et al., 2012), Amphipods are considered a sensitive group to pollution, Sewage pollution produced a decrease in the abundance and richness of amphipods whereas some of the species appeared to be more tolerant to the sewage input. Study area high Amphipods concentration indicates pollution level of water.
3.11.1.3. Benthos
The organisms which inhabit the bottom of aquatic body are called benthos. Many of them are sessile while; some creep over or burrow in mud. The quality and quantity of animals found at the bottom is not only related to the nature of substrata but also to depth, the kind and the quality of aquatic plants present in such environment and food availability. Their number and distribution also depend upon physico‐chemical properties of water, community structure and other factors.
Methodology for Sample Collection, Preservation and Analysis of Benthos
Sediment samples were collected from locations by using van veen grab quadrant sampler. Benthic organisms was separated out using 500 micron mesh sieve and preserved in rose Bengal and 5% formalin solution Samples were sorted‐out separately and macro benthic specimens were identified to the lowest possible level under a stereoscopic microscope. All identified specimens were referred by quantitative analysis of density, bio‐diversity indices & total bio‐mass. After analysis sample was preserved in 10% formalin and density was expressed in no/m2.
Results
Macro benthic fauna were observed is given in the Table 3.5.
Table 3.5: Observed Macro Benthic Fauna
Sr. No. Species observed in core area Species observed in buffer area 1. Brachyuran sp Anomura
2. Nereis sp Capitellidae sp
3. Syllis sp Caprella sp
4. Notomastus sp Cardita sp
5. Gafrarium Cumacea
6. Oysrer spat Cyathura
7. Planaxis sp Donax sp
8. Caprella sp Gafrarium
9. Corophium sp Hydrozoa
10. Hydrozoa Katelysia
11. Anomura Marginella sp
12. Megalona sp Megalona sp
13. Donax sp Murucidea sp
14. Charybdis sp Nassaria sp

EIA for proposed jetty at Korlai River and expansion of existing jetty at Sanegaon by Indo Energy
International Ltd.
TEPL/ENV/CBS/2021‐05 96
Sr. No. Species observed in core area Species observed in buffer area 15. Grapus sp 1 Nereis sp
16. Grapus sp 2 Oligochaeta
17. Ocypode Olivia sp
18. Uca sp. Oysrer spat
19. Diogenes sp Paphia sp
20. ‐ Planaxis sp
Interpretation
A benthic survey was conducted to provide baseline macro benthic status in the study area so samples were collected in core area (project site) and buffer area (offshore area). The sample analysis results reveal high benthic productivity in the study area. Considering core and buffer area Brachyuran, Nereis and Oyster was little dominant. Brachyuran crabs are highly diverse organisms. To check the effectiveness of the pollutants do affect different levels of ecosystem and the effect can be traced using Brachyuran crab as a bio indicator species. Nereis (polychaete) is found in shallow and brackish waters. Its high density found in sewage deposition of particulate organic matter and nutrient enrichment area. Nereis serves as a good bio‐monitor of pollution in different sewage sites. Nereis greater dependence on deposit feeding, rather than filter feeding typical in clean sites. Oysters act a filtering out chemical and pollutants and leaving behind clean water. So high density of Neris and Oyster indicate the study site is quite polluted
3.11.2. TERRESTRIAL ECOLOGY
The present document is a flora, fauna and associated ecology status assessment report for the new and the expansion project being proposed by the IEIL through their consultants C‐Borne services, Mumbai. The project location is at Sanegaon on Kundalika River near Korlai, Raigad in the state of Maharashtra.
In‐order to review the present status of natural ecology and biodiversity elements in the ‐core area and surrounding region i.e. buffer area. The objectives of this study was to provide an assessment of present status of flora, fauna and ecological habitat in the site, comment upon ecological richness, assess the occurrence of ecologically important or rare variety of floral and faunal species, evaluate possible direct or indirect impact of the project on ecology ‐ biodiversity and suggest mitigation measures accordingly.
3.11.3. MATERIAL AND METHODS
Desk Study
The purpose of the desk study was to identify habitats and species of conservation value that may not have been present or apparent during the survey visit (e.g. season specific plants). The desk study was also helpful in understanding the historical biodiversity and ecological status of the site related to ecology and biodiversity of the region or of other related areas encompassing

EIA for proposed jetty at Korlai River and expansion of existing jetty at Sanegaon by Indo Energy
International Ltd.
TEPL/ENV/CBS/2021‐05 97
the proposed site. Literature survey was also undertaken by collecting and stating research papers and reports specific to the region.
Habitat Survey
To collect data on flora (Herbs, Shrubs and Trees) and fauna (Birds, Insects, Spiders, Reptiles, Mammals) various strategies were practiced. These strategies differed as per the habit and habitat of concerned group of species.
Flora
The structure and composition of vegetation cover was studied by using Phytosociological methods. Analysis and estimation of diversity, density, dominance and frequency of different members of plant populations encountered were made. Observations were made in the forest area as well as in non‐forest areas by laying plots and adopting quadrate method. The quadrate method included laying down square sample plots or units for quantitative analysis of vegetation. The sample plot method given by Clements (1898); Philips (1959); Muller and Ellenberg (1974) and Rau and Wooten (1988) EIA Hand Book (ch.7, pp.44) was followed. The Quadrate sizes of 1 m x 1m, 5m x 5m and 10m x 10m were taken for herbs, shrub and trees respectively.
Co‐existence and competition both are affected directly by the number of individuals in the community. Therefore, it is essential to know the quantitative structure of the community. To characterize the community as whole, certain derived parameters are used i.e. Density, Frequency, Abundance, and Importance Value Index (IVI). Diversity Index (Simpson (D), and Shannon (H) was used to understanding the biodiversity significance of habitats in the study area and study areas as whole.
To summarize, the following parameters were used during the Floristic diversity and Phytosociological assessment:
1. Density, Frequency, Dominance, Abundance 2. Importance Value Index (IVI) (by following Cottam and Curtis,1956) 3. Simpsons Index (D) 4. Shannon index (W)
Fauna and Avifauna
The assessment of wild fauna was based on random search‐research survey. For animals, other than directly sighted, secondary evidences were recorded through calls, dung boles, scats, spoors, rub signs, signs of debarking, drag mark etc. For birds, actual counts at each sampling site were made, by walking through a chosen one‐kilometer stretch of the site and the number of birds were directly counted and listed. A species list was prepared along with taxonomic position of each species.
Technology used
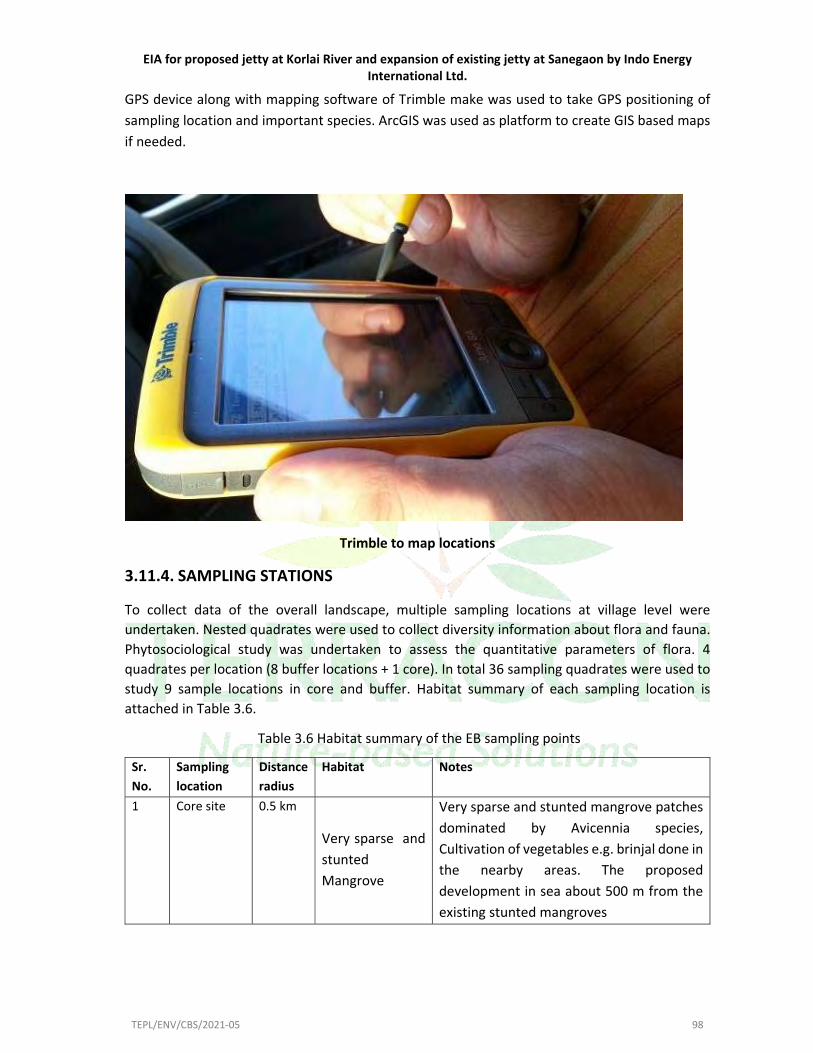
EIA for proposed jetty at Korlai River and expansion of existing jetty at Sanegaon by Indo Energy
International Ltd.
TEPL/ENV/CBS/2021‐05 98
GPS device along with mapping software of Trimble make was used to take GPS positioning of sampling location and important species. ArcGIS was used as platform to create GIS based maps if needed.
Trimble to map locations
3.11.4. SAMPLING STATIONS
To collect data of the overall landscape, multiple sampling locations at village level were undertaken. Nested quadrates were used to collect diversity information about flora and fauna. Phytosociological study was undertaken to assess the quantitative parameters of flora. 4 quadrates per location (8 buffer locations + 1 core). In total 36 sampling quadrates were used to study 9 sample locations in core and buffer. Habitat summary of each sampling location is attached in Table 3.6.
Table 3.6 Habitat summary of the EB sampling points
Sr.
No.
Sampling
location
Distance
radius
Habitat Notes
1 Core site 0.5 km
Very sparse and stunted Mangrove
Very sparse and stunted mangrove patches dominated by Avicennia species, Cultivation of vegetables e.g. brinjal done in the nearby areas. The proposed development in sea about 500 m from the existing stunted mangroves

EIA for proposed jetty at Korlai River and expansion of existing jetty at Sanegaon by Indo Energy
International Ltd.
TEPL/ENV/CBS/2021‐05 99
2 Korlai fort
2
Plantations on mountain surrounded by coastal ecosystem
Tourist spot with high human activity, monoculture of Acacia aurculiformis‐the Australian acacia
3 Korlai Forest
Low human impact, potential for highbiodiversity
4 Revdanda jetty
Mangrove Mangrove patches dominated by Avicennia species, presence of migratory birds
5 Barashiv 5
Dense forest Selective logging6 Mahalunge
Forest Some forest patches converted to plantations of mango, cashew & jackfruit
7 Amali Dense forest
Selective logging
8 Revdanda Beach
Beach (Coastal System)
Tourist spot which has high human activity, monoculture of plant species like casuarinas, coconut & areca nut in the surrounding areas
9 Agrav jetty Mangrove
Mangrove species dominated by Avicennia species, presence of migratory birds
Figure 3.9 Sampling locations for flora & fauna

EIA for proposed jetty at Korlai River and expansion of existing jetty at Sanegaon by Indo Energy
International Ltd.
TEPL/ENV/CBS/2021‐05 100
Figure 3.10 Marine sampling locationsFlora

EIA for proposed jetty at Korlai River and expansion of existing jetty at Sanegaon by Indo Energy
International Ltd.
TEPL/ENV/CBS/2021‐05 101
3.11.4.1. Floral
Study was undertaken to document diversity of herb, shrub, climber and tree species existing in the areas falling within the core site and Buffer region. Background information on floristic diversity from literature survey was used to create a detailed account of local vegetation that might occur at the study site.
Sampling was done following the quadrat method. Quadrats were laid randomly at various locations within the Core and Buffer region of the project. Random survey was also undertaken to create a detailed inventory of species. Plants were photographed and specimens that could not be identified on field were photographed for off‐field analysis. Based on the direct field observation and strategic selection of sampling locations primary data was collected to represent the status of flora prevalent in the core site and the buffer region of the project
Observations
Habitats within 2 km radius from core comprise of sea, river, forest patches, agricultural patches, plantations & mangrove dominated areas. Plantation of coconut, areca nut, mango etc. is prominent towards Revdanda. Korlai has a mix of agriculture, forest & plantation. In many parts of the area, the forest is converted into plantations. Indirect evidences of foxes as well as Indian peafowl were found in forest and mangrove patches within 2 km range. South east region comprises of moist deciduous forest with some area comprising scrub land & agriculture including human habitation
Habitats in 5 km radius from core comprises of sea, river, forest, agriculture, plantation & mangrove ecosystem. Plantation of coconut, areca nut, mango etc. is prominent towards North. Southern part has a mix of agriculture, forest & plantation.
Mangrove ecosystem dominates all along the Kundalika River which serve as nesting & feeding ground for various migratory birds which include birds like black headed ibis, gulls, terns etc. In many parts, the forest is converted into a plantation. South section has biodiversity important areas as the Phansad wildlife Sanctuary is very close to it. However, the port area both the bankline and the water area to be used for reclaimation is devoid of any mangroves.
Species richness
Species richness indicates the total number of species present in a given area or a category. The total species richness is often used as an indicator of biodiversity value. The species richness in the core site was measured by calculating the total number of species encountered during the study phase. We followed two methods of estimating species richness – (i) by pooling species from all observations, random and quadrate and (ii) species from vegetation quadrates.
Total 18 species were encountered during the study phase in and around (2 km) the core. The biodiversity of the area around the core site is dominated by endogenic trees followed by herbs and shrubs. The 18 species encountered in the core can be categorized into following habit combinations. The immediate work site is away from the mangrove population and no mangrove would be affected by the project.
The checklist of species observed in the core is attached in Appendix 2.1a of Annexure 3

EIA for proposed jetty at Korlai River and expansion of existing jetty at Sanegaon by Indo Energy
International Ltd.
TEPL/ENV/CBS/2021‐05 102
Phytosociological study
Phytosociological study is used to quantify species composition, relative abundance and importance of species in the given area. We undertook phytosociological study by using quadrate sampling technique. Following are the observations of phytosociological assessment in core.
To understand which species dominates the plant community documented in the core, a relative abundance of each species was calculated. The relative abundance is abundance measured in relation to other co‐occurring species. On the basis of the relative abundance value it was found that the overall plant community was very uneven i.e. dominated by just few species. The evenness of the community can be further evaluated by measuring biodiversity index.
The vegetation diversity around the core, about 300 m away, is dominated by three species of Avicennia marina (50%), Avicennia officianlis (20%) and Sonneretia alba (17.5%).Mangroves are considered key habitats of coastal ecosystem and are ecologically critical as breeding and feeding zones of various fishes and bird species. However, the proposed area is devoid of mangroves except for sparse and stunted patches. The list of species in core along with relative abundance, dominance and importance value index is attached in Appendix 2.1b of Annexure 3.
Flora in the Buffer range
The region covering the buffer range belong to the Mangrove dominated ecosystem. The dominant vegetation in the forests in the Buffer region can be broadly categorized as mix of southern tropical mix deciduous forests and tropical forest. In the Buffer range, the vegetation diversity can be divided into mostly urban, agricultural and forest based. Common cultivable plants such as Banyan, Pipal, Coconut and Peltaforum can be observed in areas within city. In the forested landscapes the floristic diversity is composed of Pongamia pinnata (Karanj), Terminalia
belerica (Behada), Garuga pinnata (Kakad), Lannea coromandalica (Shemat), Wrightia
tinctoria (Kuda), Lagerstromia indica (Tamhan), Morina tinctoria (Baratondi), Butea monospera,
Erythrina indica (Pangara)and related species. To understand more objectively the vegetation diversity prevalent in the buffer, a random qualitative sampling was done to generate species richness value. Further a quantitative assessment was done using quadrates. The list of species in buffer along with relative abundance, dominance and importance value index is attached in Appendix 2.2b of Annexure 3
Qualitative study
During the study, random sampling along with systematic sampling using nested quadrates was undertaken in the core and buffer. Based on the data collected by these techniques an overall species list was generated. In all, 164 species were encountered during this rapid single season study. These 164 species belonged to 58 families. The species observed can be further categorized into following habits:
Habit Number of species
Tree 66 Herb 49 Climber 28

EIA for proposed jetty at Korlai River and expansion of existing jetty at Sanegaon by Indo Energy
International Ltd.
TEPL/ENV/CBS/2021‐05 103
Shrub 19 Epiphyte 2 Quantitative study
To understand the community structure, phytosociological analysis was undertaken based on vegetation sampling using quadrates. The species observed in the buffer had higher beta diversity (number of unique species) compared to the core sites. Also the species observed in the overall buffer are representative of the mosaic of landcovers such as mangrove, deciduous forests, agricultural systems, etc. prevalent in the buffer.
Species richness is the most basic form of biodiversity measurement. We measured species richness from plots which also gave us opportunity to evaluate species accumulation curve and bootstrap the plot based richness measures to account for sampling bias and provide better comparison.
Based on the species richness, the buffer area as expected has more species than the areas within 2 km radius and core. The 5km radius can also be considered as buffer area. Areas in buffer have higher species richness than the core.
On the basis of relative abundance and importance value index, the mangroves and mangrove associates dominate in the buffer followed by other more deciduous forest specific species such as Zizyphus, Wrightia and Tectona. Also including many invasive exotic species such as Lantana and Alternenthera.
Domesticated plants during the survey
List of plant species associated with plantations, avenues and agricultural landscapes (Domestic plants) were made. In total 30 species of plants were observed to be very commonly used as domesticated species in the nearby locations of the project site and the buffer region. Considerable numbers of these species are exotic species. Native species must be promoted to enhance the native ecology.
Agriculture and Horticulture plant species
Some common plants planted in orchards and plantations by locals are:
Sr. no. Fruiting plants Major Field crops Vegetables 1. Mango Red gram Tomato 2. Citrus Sorghum Brinjal 3. Tamarind Chickpea Onion 4. Banana Sunflower Green chilly 5. Guava Bajra Beetle vine 6. Custard apple Groundnut Turmeric 7. Bael Soya bean
Ecologically important species
Plant species form the basis of ecological interaction in nature. In the web of life, the diversity, density and abundance of plants species are decisive factors. More the native plant species

EIA for proposed jetty at Korlai River and expansion of existing jetty at Sanegaon by Indo Energy
International Ltd.
TEPL/ENV/CBS/2021‐05 104
better is the association with faunal diversity. Documenting local species that are ecologically important may be helpful in restoration and greenbelt development planning. With the help of actual field observations and literature review, a list of plant species that are ecologically significant was prepared. These plant species are considered ecologically important as they attract and support faunal diversity. These plants can be helpful in restoration of natural ecology if planted in strategic composition. List of ecologically important plants found in the region is attached in the Appendix 2.2d of Annexure 3
Protected species in the region
The project area and the buffer fall into the tropical moist mixed deciduous forest and estuarine ecosystem. The floristic composition in the less disturbed forest patches are represented by Terminalia arjuna, Butea monosperma, several species of Ficus genera, Cassia fistula and Zizyphus oenoplia.
Other than the common species that represent the general structure of the forest, there can be species that are rare, endangered, and vulnerable or near threatened. These species often have very niche temporal and spatial distribution and may not be encountered during a short term survey. However, a list of Rare, Endangered, Vulnerable or Near Threatened species (RET) was extracted on the basis of literature review, by analysis of the species distribution and also by examining the possibility of being found in the buffer habitat region.
None of the RET listted were actually observed during the study in the buffer region of the project
Conclusion
Total number of plant species observed in the core site : 18 Total number of species observed in the buffer region : 164 Number of quadrates used in studying buffer region : 36 Number of locations studied in Buffer : 9
3.11.4.2. Fauna
To study faunal diversity and richness in the area, random sightings were preferred and various methods of observation were practiced. For reptiles, stone lifting was done; rock crevices and wall space of structures in the site were checked. Amphibians were searched near the stagnant water pools and small streams. Insects were observed on underside of leaves, nests, rock crevices, bushes and other places. Birds were studied by point sampling method and mammal diversity assessment was based on indirect evidences and random interviews with the local human community. Quantitative analysis was done for mammals and aves. While for reptiles, insects and spiders, species richness was evaluated by qualitative sampling.
In the core, total 21 species of faunal species were encountered based on random survey. The avian group was the most diverse followed by insects.
Mammal diversity
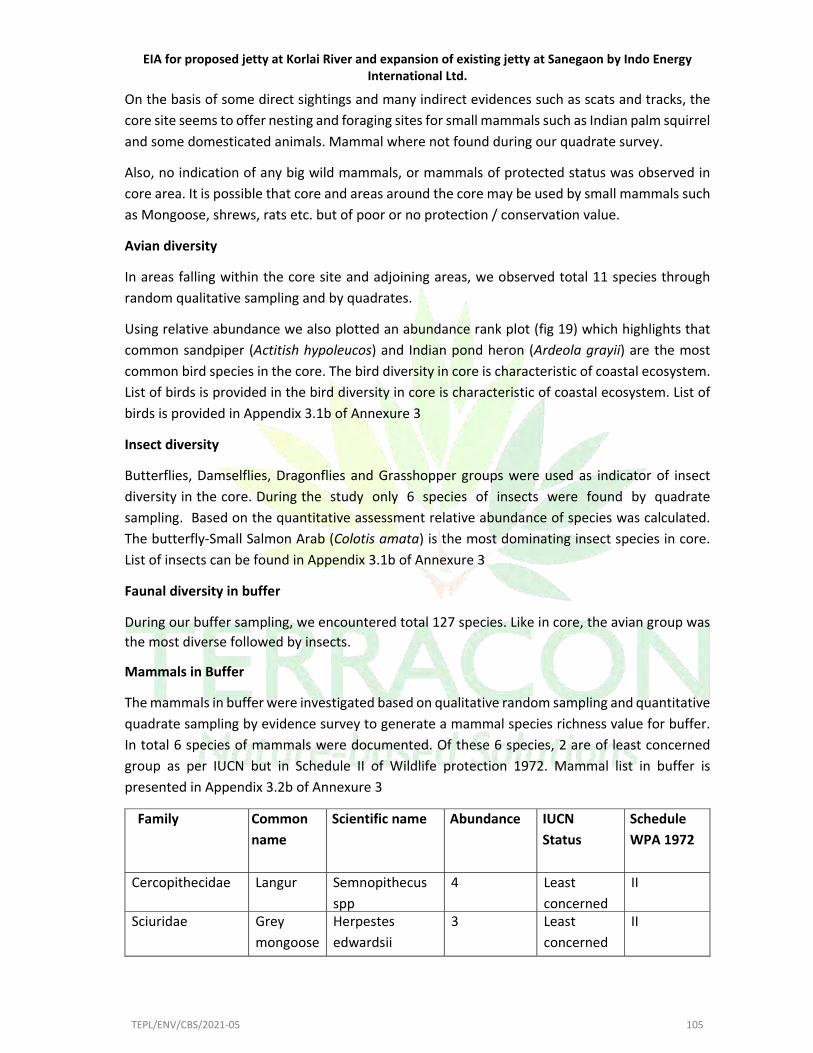
EIA for proposed jetty at Korlai River and expansion of existing jetty at Sanegaon by Indo Energy
International Ltd.
TEPL/ENV/CBS/2021‐05 105
On the basis of some direct sightings and many indirect evidences such as scats and tracks, the core site seems to offer nesting and foraging sites for small mammals such as Indian palm squirrel and some domesticated animals. Mammal where not found during our quadrate survey.
Also, no indication of any big wild mammals, or mammals of protected status was observed in core area. It is possible that core and areas around the core may be used by small mammals such as Mongoose, shrews, rats etc. but of poor or no protection / conservation value.
Avian diversity
In areas falling within the core site and adjoining areas, we observed total 11 species through random qualitative sampling and by quadrates.
Using relative abundance we also plotted an abundance rank plot (fig 19) which highlights that common sandpiper (Actitish hypoleucos) and Indian pond heron (Ardeola grayii) are the most common bird species in the core. The bird diversity in core is characteristic of coastal ecosystem. List of birds is provided in the bird diversity in core is characteristic of coastal ecosystem. List of birds is provided in Appendix 3.1b of Annexure 3
Insect diversity
Butterflies, Damselflies, Dragonflies and Grasshopper groups were used as indicator of insect diversity in the core. During the study only 6 species of insects were found by quadrate sampling. Based on the quantitative assessment relative abundance of species was calculated. The butterfly‐Small Salmon Arab (Colotis amata) is the most dominating insect species in core. List of insects can be found in Appendix 3.1b of Annexure 3
Faunal diversity in buffer
During our buffer sampling, we encountered total 127 species. Like in core, the avian group was the most diverse followed by insects.
Mammals in Buffer
The mammals in buffer were investigated based on qualitative random sampling and quantitative quadrate sampling by evidence survey to generate a mammal species richness value for buffer. In total 6 species of mammals were documented. Of these 6 species, 2 are of least concerned group as per IUCN but in Schedule II of Wildlife protection 1972. Mammal list in buffer is presented in Appendix 3.2b of Annexure 3
Family Common
name
Scientific name Abundance IUCN
Status
Schedule
WPA 1972
Cercopithecidae Langur Semnopithecus spp
4 Least concerned
II
Sciuridae Grey mongoose
Herpestes edwardsii
3 Least concerned
II

EIA for proposed jetty at Korlai River and expansion of existing jetty at Sanegaon by Indo Energy
International Ltd.
TEPL/ENV/CBS/2021‐05 106
Aves in Buffer
On the basis of quantitative sampling by point count method, 70 species of birds were found. Out of these bird species 2 species, Indian Peafowl and Osprey was found to be in Schedule‐I as per Indian wildlife protection act 1972 (WPA 1972) . The Indian spotted eagle is vulnerable as per IUCN.
In the buffer species such as Red‐whiskered bulbul (Pycnonotus jocosus), Green bee‐eater (Merops orientalis), Little egret (Egretta garzetta), Blyth's reed warbler (Acrocephalus dumetorum), Purple‐rumped sunbird (Leptocoma zeylonica) are the top 5 most common species. Insects in Buffer
We observed in total 33 species of insects by quadrate sampling. These 33 species in quadrates belonged to 10 insect groups ‐ Butterflies, Grasshoppers, Dragonflies, Bugs, Beetles, Wasps, Damselflies, Flies, Mantids and. Of these groups, butterflies were the most diverse.
Other faunal diversity in core and buffer
Reptile and Amphibian Diversity: During survey the, 1 species of reptile and 1 species of amphibians were found in areas close to the project site. On expanding, the survey to nearby ranges in the Buffer region, 3 species of reptiles and 1 species of amphibians were encountered.
Spider diversity: Spiders are functionally important features in any ecosystem. They play a unique role of controlling pests or specifically population of insects in an ecosystem. The species observed in the site area were common species and are associated with urban environments. However, in the forest and areas with thick vegetation, more forest representative individuals/species were observed. The list of insect species in buffer along with their relative abundances can be found in Appendix 3.2b Of Annexure 3
Conclusion
Core:
Number of Mammal species observed in the core site: 1 Number of Bird species observed in the core site: 11 Number of Insect species observed core site: 06 Number of reptile and amphibian species observed in the core site: 2 Mammal species in core: Indian palm squirrel
Buffer:
Number of mammal species in buffer: 6 Number of Bird species observed in Buffer: 70 Number of Insect species observed in Buffer: 33

EIA for proposed jetty at Korlai River and expansion of existing jetty at Sanegaon by Indo Energy
International Ltd.
TEPL/ENV/CBS/2021‐05 107
Number of Reptile and amphibian observed in Buffer: 3 Protected species:
Birds:
Scientific name Common name Family IUCN status Schedule
WPA 1972
Pandion haliaetus Osprey Pandionidae Least concern I Pavo cristatus Indian peafowl Phasianidae Least concern I Clanga hastata Indian spotted eagle Accipitridae vulnerable ‐
Mammals:
Family Common
name
Scientific name Abundance IUCN
status
Schedule
1972WPA
Cercopithecidae Langur Semnopithecus spp
4 Least concerned
II
Sciuridae Grey mongoose
Herpestes dwardsii
3 Least concerned
‐
3.12. AIR ENVIRONMENT
3.12.1. METEOROLOGICAL DATA
The study of meteorological conditions of a particular region is of utmost importance to understand the variations in the ambient air quality status in that region. The prevailing meteorology at project site plays a crucial role in transport and dispersion of air pollutants. A Meteorology station for collection of meteorological data was installed at the project site during baseline monitoring period.
3.12.2. SECONDARY
Secondary data was collected for wind direction and wind speed for a year and wind rose of the same derived for better understanding of climatic condition of the project site. Wind data is given in Table 3.7 and wind rose is given in Figure 3.11.

EIA for proposed jetty at Korlai River and expansion of existing jetty at Sanegaon by Indo Energy
International Ltd.
TEPL/ENV/CBS/2021‐05 108
Table 3.7 Wind data
Figure 3.11wind rose

EIA for proposed jetty at Korlai River and expansion of existing jetty at Sanegaon by Indo Energy
International Ltd.
TEPL/ENV/CBS/2021‐05 109
3.12.2.1. Temperature
The characteristic feature of the climate is in occurrence of extreme temperature conditions. The mean daily maximum & minimum temperature is recorded in the month of May & January, which is about 32.1ºC & 17.6ºC respectively.
3.12.2.2. Wind
The mean monthly wind velocity is highest during the month of December with a wind speed of 01‐19 km/hr occurring for 29 days & is lowest during the month of July with a wind speed of 1‐19 km/hr occurring for 12 days. The mean wind speed prevailing in the area is 4 km/hr.
3.12.2.3. Humidity & Vapour pressure
Relative humidity varies from month to month, being maximum during the month of July i.e. during monsoon & minimum during the month of January. The average humidity is 78.91%. The average vapour pressure is 26.09 hPa with maximum vapour pressure in the month of June of about 33 hPa & minimum of 16.7 hPa in the month of January.
3.12.2.4. Rainfall
The project site receives greater part of annual rainfall from South West monsoon between June to September accounting for nearly 85% of annual rainfall & the remaining 15% of the rainfall is recorded during the rest of the year. The average yearly rainfall in the study area is about 2177 mm. usually maximum average monthly rainfall of 741.8 mm occurs in July. January & February are generally the driest month of the year. There is practically no rainfall from December to April.
Year Month Day Hour W.S. (m/sec)
W.D. (Deg)
TMP (°C)
HMD (%)
2016 1 14 11 1.6 249 25.6 45.02016 1 14 12 1.1 266 27.1 42.32016 1 14 13 1.0 342 27.6 41.82016 1 14 14 0.7 256 27.7 40.7 2016 1 14 15 0.5 333 25.6 48.72016 1 14 16 1.5 273 23.6 55.6 2016 1 14 17 1.3 128 23.4 59.32016 1 14 18 1.6 264 22.4 65.1 2016 1 14 19 1.5 271 21.6 69.9 2016 1 14 20 1.1 337 20.3 78.3 2016 1 14 21 0.8 309 18.8 79.9 2016 1 14 22 0.2 175 18.3 81.0 2016 1 14 23 0.4 199 18.5 84.2 2016 1 15 0 0.1 342 17.6 83.5 2016 1 15 1 0.0 189 17.2 85.0 2016 1 15 2 0.2 338 17.3 84.5 2016 1 15 3 0.2 100 17.6 83.52016 1 15 4 0.1 104 18.2 76.32016 1 15 5 0.8 240 19.6 74.82016 1 15 6 0.0 228 19.5 73.3
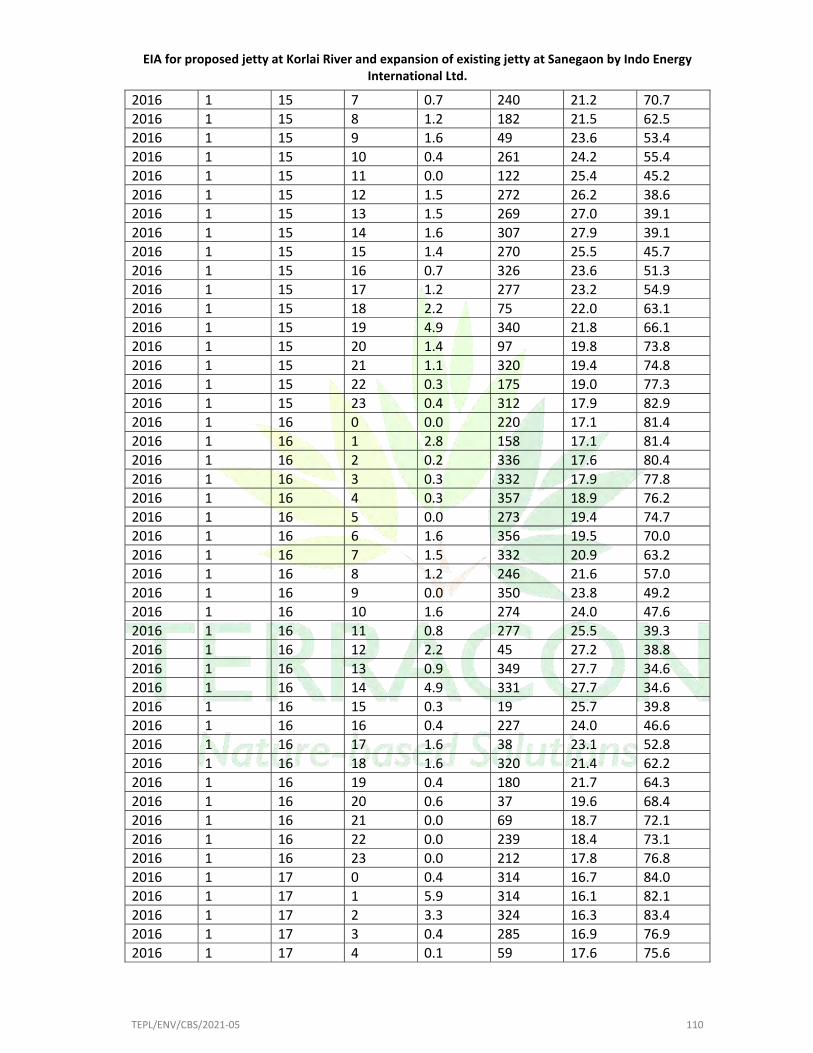
EIA for proposed jetty at Korlai River and expansion of existing jetty at Sanegaon by Indo Energy
International Ltd.
TEPL/ENV/CBS/2021‐05 110
2016 1 15 7 0.7 240 21.2 70.72016 1 15 8 1.2 182 21.5 62.52016 1 15 9 1.6 49 23.6 53.42016 1 15 10 0.4 261 24.2 55.42016 1 15 11 0.0 122 25.4 45.22016 1 15 12 1.5 272 26.2 38.62016 1 15 13 1.5 269 27.0 39.12016 1 15 14 1.6 307 27.9 39.1 2016 1 15 15 1.4 270 25.5 45.7 2016 1 15 16 0.7 326 23.6 51.3 2016 1 15 17 1.2 277 23.2 54.9 2016 1 15 18 2.2 75 22.0 63.1 2016 1 15 19 4.9 340 21.8 66.1 2016 1 15 20 1.4 97 19.8 73.8 2016 1 15 21 1.1 320 19.4 74.8 2016 1 15 22 0.3 175 19.0 77.3 2016 1 15 23 0.4 312 17.9 82.92016 1 16 0 0.0 220 17.1 81.42016 1 16 1 2.8 158 17.1 81.42016 1 16 2 0.2 336 17.6 80.42016 1 16 3 0.3 332 17.9 77.82016 1 16 4 0.3 357 18.9 76.22016 1 16 5 0.0 273 19.4 74.72016 1 16 6 1.6 356 19.5 70.0 2016 1 16 7 1.5 332 20.9 63.2 2016 1 16 8 1.2 246 21.6 57.0 2016 1 16 9 0.0 350 23.8 49.2 2016 1 16 10 1.6 274 24.0 47.6 2016 1 16 11 0.8 277 25.5 39.3 2016 1 16 12 2.2 45 27.2 38.8 2016 1 16 13 0.9 349 27.7 34.6 2016 1 16 14 4.9 331 27.7 34.6 2016 1 16 15 0.3 19 25.7 39.8 2016 1 16 16 0.4 227 24.0 46.62016 1 16 17 1.6 38 23.1 52.82016 1 16 18 1.6 320 21.4 62.22016 1 16 19 0.4 180 21.7 64.3 2016 1 16 20 0.6 37 19.6 68.42016 1 16 21 0.0 69 18.7 72.12016 1 16 22 0.0 239 18.4 73.1 2016 1 16 23 0.0 212 17.8 76.8 2016 1 17 0 0.4 314 16.7 84.0 2016 1 17 1 5.9 314 16.1 82.1 2016 1 17 2 3.3 324 16.3 83.4 2016 1 17 3 0.4 285 16.9 76.9 2016 1 17 4 0.1 59 17.6 75.6

EIA for proposed jetty at Korlai River and expansion of existing jetty at Sanegaon by Indo Energy
International Ltd.
TEPL/ENV/CBS/2021‐05 111
2016 1 17 5 0.2 36 19.3 72.32016 1 17 6 2.2 358 19.1 71.02016 1 17 7 0.5 295 20.4 64.52016 1 17 8 3.6 44 22.1 56.12016 1 17 9 0.0 221 23.3 42.42016 1 17 10 1.3 47 24.6 43.72016 1 17 11 0.7 87 26.4 34.02016 1 17 12 0.0 325 27.4 25.5 2016 1 17 13 4.0 35 28.6 22.3 2016 1 17 14 0.2 209 28.6 20.3 2016 1 17 15 2.8 96 26.0 34.0 2016 1 17 16 1.4 295 24.2 41.8 2016 1 17 17 1.4 319 23.7 41.8 2016 1 17 18 1.3 321 21.2 56.1 2016 1 17 19 1.8 138 21.7 57.4 2016 1 17 20 0.8 324 19.3 65.8 2016 1 17 21 0.0 60 18.9 69.12016 1 17 22 0.3 144 18.3 71.02016 1 17 23 0.8 326 16.8 74.92016 1 18 0 1.7 157 16.5 87.12016 1 18 1 0.1 165 16.4 90.02016 1 18 2 0.2 98 16.1 87.12016 1 18 3 0.1 172 17.0 83.52016 1 18 4 1.6 317 18.6 80.6 2016 1 18 5 1.4 290 18.6 79.4 2016 1 18 6 1.8 59 19.3 76.4 2016 1 18 7 1.0 348 20.8 70.5 2016 1 18 8 1.0 277 21.3 61.1 2016 1 18 9 2.7 249 24.5 53.4 2016 1 18 10 5.5 315 24.5 49.9 2016 1 18 11 1.3 260 25.8 45.2 2016 1 18 12 1.0 160 27.1 38.1 2016 1 18 13 0.3 190 27.8 35.1 2016 1 18 14 1.2 330 29.0 31.62016 1 18 15 5.4 4 25.9 44.02016 1 18 16 1.1 342 23.9 51.72016 1 18 17 1.1 244 23.7 55.8 2016 1 18 18 2.5 35 22.5 63.52016 1 18 19 0.2 159 21.2 66.42016 1 18 20 4.1 2 19.6 77.6 2016 1 18 21 0.7 262 18.9 76.4 2016 1 18 22 0.2 288 18.6 83.5 2016 1 18 23 0.5 328 17.7 84.7 2016 1 19 0 1.1 316 15.5 77.0 2016 1 19 1 1.3 290 15.0 78.3 2016 1 19 2 0.4 267 15.1 78.3

EIA for proposed jetty at Korlai River and expansion of existing jetty at Sanegaon by Indo Energy
International Ltd.
TEPL/ENV/CBS/2021‐05 112
2016 1 19 3 0.3 216 16.8 75.72016 1 19 4 0.4 353 16.6 70.42016 1 19 5 0.4 268 17.9 65.12016 1 19 6 0.9 332 18.3 63.82016 1 19 7 1.1 41 19.0 55.92016 1 19 8 1.0 98 20.2 47.32016 1 19 9 0.6 263 23.5 36.12016 1 19 10 1.0 43 23.5 37.4 2016 1 19 11 1.5 288 24.8 26.9 2016 1 19 12 0.9 333 26.3 23.6 2016 1 19 13 5.6 1 26.7 19.6 2016 1 19 14 0.1 349 27.4 13.0 2016 1 19 15 1.3 329 24.9 25.5 2016 1 19 16 1.5 40 23.3 34.1 2016 1 19 17 2.0 349 23.3 42.0 2016 1 19 18 1.2 42 21.1 51.3 2016 1 19 19 1.4 264 20.7 52.62016 1 19 20 0.3 357 18.4 61.22016 1 19 21 1.3 323 17.0 63.22016 1 19 22 0.3 15 16.6 71.72016 1 19 23 0.0 191 15.8 71.12016 1 20 0 1.1 307 12.5 60.42016 1 20 1 3.3 308 12.2 60.42016 1 20 2 0.1 153 12.7 60.9 2016 1 20 3 2.0 323 12.9 53.9 2016 1 20 4 0.1 301 14.5 53.9 2016 1 20 5 1.1 92 14.9 51.2 2016 1 20 6 1.5 326 16.3 47.4 2016 1 20 7 0.8 84 19.9 43.1 2016 1 20 8 0.5 305 20.5 35.5 2016 1 20 9 1.5 262 21.9 28.0 2016 1 20 10 1.3 309 23.3 26.9 2016 1 20 11 2.5 320 26.0 16.6 2016 1 20 12 2.2 348 27.5 11.22016 1 20 13 0.0 140 28.2 9.62016 1 20 14 0.6 340 29.3 11.22016 1 20 15 0.8 254 25.7 17.7 2016 1 20 16 1.5 331 24.4 24.22016 1 20 17 0.8 321 22.1 27.42016 1 20 18 0.9 307 19.9 36.6 2016 1 20 19 1.5 4 19.4 42.6 2016 1 20 20 1.3 352 15.8 48.0 2016 1 20 21 3.2 244 14.9 48.5 2016 1 20 22 6.1 84 14.5 52.8 2016 1 20 23 0.2 263 14.0 58.2 2016 1 21 0 0.1 107 15.5 66.9

EIA for proposed jetty at Korlai River and expansion of existing jetty at Sanegaon by Indo Energy
International Ltd.
TEPL/ENV/CBS/2021‐05 113
2016 1 21 1 0.4 327 15.2 66.42016 1 21 2 5.1 278 15.5 65.82016 1 21 3 0.4 1 16.4 64.22016 1 21 4 2.1 159 18.2 57.62016 1 21 5 0.0 201 17.7 55.42016 1 21 6 1.2 266 19.5 53.72016 1 21 7 1.3 325 21.9 43.82016 1 21 8 0.7 320 21.7 42.2 2016 1 21 9 1.1 254 24.3 37.2 2016 1 21 10 0.1 55 25.6 30.1 2016 1 21 11 1.4 131 28.0 21.8 2016 1 21 12 0.2 301 28.3 20.7 2016 1 21 13 1.3 345 30.5 18.5 2016 1 21 14 1.2 315 30.8 13.0 2016 1 21 15 4.6 130 28.1 26.8 2016 1 21 16 0.7 2 24.9 32.8 2016 1 21 17 0.1 290 24.8 32.32016 1 21 18 1.0 314 21.6 44.42016 1 21 19 1.6 314 21.7 48.22016 1 21 20 1.2 329 19.8 51.52016 1 21 21 1.6 263 18.0 58.72016 1 21 22 10.3 279 17.4 59.82016 1 21 23 0.4 63 16.8 64.72016 1 22 0 1.1 320 17.6 42.0 2016 1 22 1 6.3 312 17.5 42.0 2016 1 22 2 2.9 271 17.2 41.4 2016 1 22 3 0.0 21 18.8 38.3 2016 1 22 4 0.3 202 20.0 38.0 2016 1 22 5 6.3 279 19.6 36.4 2016 1 22 6 0.8 342 21.1 34.6 2016 1 22 7 1.6 45 22.1 29.0 2016 1 22 8 0.8 272 23.0 28.1 2016 1 22 9 0.0 170 26.6 24.3 2016 1 22 10 1.2 159 26.5 22.22016 1 22 11 0.8 241 29.0 18.12016 1 22 12 1.5 345 29.3 17.22016 1 22 13 4.8 9 31.3 14.1 2016 1 22 14 0.9 347 32.0 11.92016 1 22 15 1.5 43 28.9 18.82016 1 22 16 1.5 184 26.2 21.9 2016 1 22 17 1.5 337 25.4 22.5 2016 1 22 18 1.1 57 24.5 28.1 2016 1 22 19 0.7 35 23.2 28.4 2016 1 22 20 2.3 343 21.2 35.5 2016 1 22 21 1.3 331 19.9 37.4 2016 1 22 22 0.4 219 19.1 37.7

EIA for proposed jetty at Korlai River and expansion of existing jetty at Sanegaon by Indo Energy
International Ltd.
TEPL/ENV/CBS/2021‐05 114
2016 1 22 23 0.4 358 19.3 39.82016 1 23 0 0.2 32 16.4 56.12016 1 23 1 0.8 282 16.0 56.62016 1 23 2 0.3 5 16.4 55.72016 1 23 3 0.4 240 17.3 50.32016 1 23 4 0.2 230 19.1 49.42016 1 23 5 0.2 295 19.4 46.22016 1 23 6 5.1 276 20.5 45.8 2016 1 23 7 0.0 356 21.8 38.1 2016 1 23 8 0.0 247 24.6 37.7 2016 1 23 9 0.7 75 27.5 27.8 2016 1 23 10 4.9 306 28.6 27.8 2016 1 23 11 1.0 350 30.2 21.9 2016 1 23 12 0.3 178 31.7 16.1 2016 1 23 13 1.4 52 33.1 15.2 2016 1 23 14 1.1 354 32.4 13.8 2016 1 23 15 5.5 331 30.6 21.02016 1 23 16 1.6 64 27.2 26.42016 1 23 17 0.9 327 26.6 30.02016 1 23 18 1.4 317 24.1 34.52016 1 23 19 1.4 36 24.1 41.32016 1 23 20 1.2 261 19.6 45.32016 1 23 21 1.3 262 19.1 46.72016 1 23 22 0.2 4 19.2 51.2 2016 1 23 23 0.3 96 17.6 53.9 2016 1 24 0 1.4 89 16.2 66.5 2016 1 24 1 1.8 322 16.3 66.5 2016 1 24 2 0.1 128 16.7 65.0 2016 1 24 3 1.3 268 18.4 59.9 2016 1 24 4 0.3 321 18.6 57.8 2016 1 24 5 1.1 270 19.6 54.8 2016 1 24 6 0.6 305 19.4 56.3 2016 1 24 7 1.1 61 21.1 44.1 2016 1 24 8 0.7 357 24.2 44.62016 1 24 9 1.3 348 26.0 37.42016 1 24 10 1.6 62 27.7 34.42016 1 24 11 1.2 289 29.3 28.8 2016 1 24 12 1.4 328 31.8 20.62016 1 24 13 0.7 256 32.7 17.02016 1 24 14 0.3 268 32.7 17.0 2016 1 24 15 0.8 318 29.3 27.7 2016 1 24 16 0.8 342 27.4 31.8 2016 1 24 17 0.9 88 25.4 34.9 2016 1 24 18 1.3 252 23.7 45.6 2016 1 24 19 0.7 359 23.7 48.1 2016 1 24 20 1.3 334 19.9 53.2

EIA for proposed jetty at Korlai River and expansion of existing jetty at Sanegaon by Indo Energy
International Ltd.
TEPL/ENV/CBS/2021‐05 115
2016 1 24 21 1.1 344 18.6 58.32016 1 24 22 1.3 316 18.4 60.92016 1 24 23 1.7 324 17.4 63.42016 1 25 0 0.0 124 15.5 75.02016 1 25 1 0.1 219 15.3 75.02016 1 25 2 1.2 268 15.3 72.62016 1 25 3 5.2 96 17.4 70.92016 1 25 4 1.2 308 18.1 66.2 2016 1 25 5 0.8 317 18.2 62.6 2016 1 25 6 3.0 306 19.1 60.3 2016 1 25 7 0.9 323 21.8 54.4 2016 1 25 8 0.6 308 23.3 50.8 2016 1 25 9 3.2 352 24.9 38.4 2016 1 25 10 3.9 270 26.9 37.2 2016 1 25 11 0.1 213 29.5 30.2 2016 1 25 12 1.1 305 31.2 23.7 2016 1 25 13 0.2 9 30.8 21.92016 1 25 14 2.8 329 30.5 16.02016 1 25 15 1.6 3 29.5 25.42016 1 25 16 3.7 57 26.7 37.22016 1 25 17 0.8 137 25.9 38.42016 1 25 18 0.9 289 22.8 47.92016 1 25 19 1.6 321 22.5 49.02016 1 25 20 0.8 322 19.9 58.5 2016 1 25 21 4.6 139 18.9 62.6 2016 1 25 22 0.2 6 17.2 66.7 2016 1 25 23 0.4 63 17.0 70.9 2016 1 26 0 5.1 153 13.2 71.7 2016 1 26 1 2.1 298 13.0 73.4 2016 1 26 2 0.3 186 13.3 71.7 2016 1 26 3 0.6 344 14.6 69.9 2016 1 26 4 0.3 344 15.4 67.6 2016 1 26 5 0.7 142 15.7 64.7 2016 1 26 6 0.6 329 17.6 61.22016 1 26 7 1.1 330 19.6 56.02016 1 26 8 3.0 336 19.7 46.72016 1 26 9 0.1 132 22.8 39.2 2016 1 26 10 0.7 75 23.4 37.52016 1 26 11 1.1 3 25.8 28.22016 1 26 12 0.6 69 26.8 27.6 2016 1 26 13 4.0 243 27.6 18.9 2016 1 26 14 4.7 333 28.8 21.2 2016 1 26 15 1.5 247 25.0 27.0 2016 1 26 16 0.9 279 23.9 35.1 2016 1 26 17 1.2 326 22.8 40.9 2016 1 26 18 6.2 9 20.2 50.8

EIA for proposed jetty at Korlai River and expansion of existing jetty at Sanegaon by Indo Energy
International Ltd.
TEPL/ENV/CBS/2021‐05 116
2016 1 26 19 0.9 304 19.7 49.62016 1 26 20 0.6 317 16.7 60.12016 1 26 21 3.0 72 15.7 65.32016 1 26 22 6.7 315 14.8 65.32016 1 26 23 2.9 263 13.8 65.32016 1 27 0 1.0 275 16.5 88.02016 1 27 1 0.2 189 16.1 88.02016 1 27 2 1.0 328 16.1 87.5 2016 1 27 3 3.9 315 16.7 82.2 2016 1 27 4 0.7 257 17.3 78.5 2016 1 27 5 0.1 351 18.9 74.8 2016 1 27 6 0.3 263 19.4 76.3 2016 1 27 7 1.6 271 20.6 66.8 2016 1 27 8 1.6 281 21.8 62.6 2016 1 27 9 1.3 345 23.4 53.6 2016 1 27 10 5.5 54 23.8 51.4 2016 1 27 11 0.3 206 26.0 44.02016 1 27 12 0.7 303 26.2 45.12016 1 27 13 1.2 269 28.0 35.02016 1 27 14 1.4 41 26.8 37.72016 1 27 15 0.6 10 25.4 44.52016 1 27 16 1.5 295 23.4 54.62016 1 27 17 0.7 41 23.8 55.12016 1 27 18 1.2 262 21.6 66.8 2016 1 27 19 0.3 4 21.2 67.3 2016 1 27 20 0.0 87 18.6 77.4 2016 1 27 21 0.1 253 18.2 76.3 2016 1 27 22 0.3 251 18.4 78.5 2016 1 27 23 0.4 334 17.6 85.4 2016 1 28 0 1.3 339 14.7 83.5 2016 1 28 1 1.4 325 14.4 85.4 2016 1 28 2 0.2 352 14.7 84.1 2016 1 28 3 1.5 253 15.4 79.8 2016 1 28 4 6.8 305 16.9 77.92016 1 28 5 0.2 177 17.4 73.02016 1 28 6 0.9 268 19.2 70.52016 1 28 7 0.7 38 21.9 63.7 2016 1 28 8 0.8 256 22.8 59.32016 1 28 9 3.4 327 24.6 47.62016 1 28 10 1.6 325 26.2 43.8 2016 1 28 11 0.8 37 27.9 33.3 2016 1 28 12 1.0 96 30.2 33.9 2016 1 28 13 1.1 252 31.5 27.7 2016 1 28 14 0.6 357 31.1 30.2 2016 1 28 15 0.4 185 28.9 34.5 2016 1 28 16 0.0 301 26.2 45.7

EIA for proposed jetty at Korlai River and expansion of existing jetty at Sanegaon by Indo Energy
International Ltd.
TEPL/ENV/CBS/2021‐05 117
2016 1 28 17 1.2 142 24.1 46.32016 1 28 18 0.9 10 22.6 57.52016 1 28 19 1.4 334 21.4 59.32016 1 28 20 1.3 55 19.2 68.02016 1 28 21 0.4 61 17.1 70.52016 1 28 22 6.7 56 17.1 79.22016 1 28 23 0.0 199 15.4 82.92016 1 29 0 0.8 312 17.0 88.1 2016 1 29 1 2.7 325 17.5 88.1 2016 1 29 2 0.2 219 17.2 88.7 2016 1 29 3 0.3 280 18.6 85.5 2016 1 29 4 1.5 331 19.4 79.6 2016 1 29 5 0.2 245 20.0 76.4 2016 1 29 6 0.2 144 21.5 71.8 2016 1 29 7 0.7 335 22.3 66.6 2016 1 29 8 0.3 226 24.4 64.0 2016 1 29 9 1.3 271 26.4 49.72016 1 29 10 0.7 335 27.9 50.42016 1 29 11 1.2 335 30.4 36.12016 1 29 12 1.5 317 31.2 35.42016 1 29 13 2.9 283 31.9 28.92016 1 29 14 1.1 306 32.8 29.62016 1 29 15 1.3 331 29.5 36.72016 1 29 16 0.3 204 28.2 45.8 2016 1 29 17 0.8 330 26.4 50.4 2016 1 29 18 0.2 264 24.7 64.0 2016 1 29 19 4.0 317 24.0 61.4 2016 1 29 20 1.3 286 21.2 73.8 2016 1 29 21 1.4 318 19.9 73.8 2016 1 29 22 0.7 128 19.6 80.3 2016 1 29 23 0.0 73 18.1 80.3 2016 1 30 0 1.8 336 18.7 77.6 2016 1 30 1 2.1 308 18.4 76.7 2016 1 30 2 0.0 308 18.3 77.62016 1 30 3 1.1 307 20.0 72.82016 1 30 4 0.2 323 19.7 72.82016 1 30 5 0.4 22 21.1 70.7 2016 1 30 6 0.4 49 20.8 65.12016 1 30 7 0.9 317 24.2 63.02016 1 30 8 1.1 309 25.0 56.5 2016 1 30 9 4.7 296 25.7 54.4 2016 1 30 10 1.4 89 27.5 47.9 2016 1 30 11 0.0 82 29.2 42.3 2016 1 30 12 1.6 100 31.3 37.2 2016 1 30 13 1.1 332 30.7 36.7 2016 1 30 14 0.6 330 31.7 35.9

EIA for proposed jetty at Korlai River and expansion of existing jetty at Sanegaon by Indo Energy
International Ltd.
TEPL/ENV/CBS/2021‐05 118
2016 1 30 15 0.8 249 29.6 45.82016 1 30 16 2.8 254 27.0 49.62016 1 30 17 1.6 75 26.0 53.52016 1 30 18 1.1 130 25.0 59.52016 1 30 19 1.1 315 23.0 59.12016 1 30 20 1.1 69 21.5 69.42016 1 30 21 2.8 52 20.4 69.02016 1 30 22 0.8 99 19.8 73.3 2016 1 30 23 4.5 38 19.8 73.3 2016 1 31 0 0.4 14 18.1 84.3 2016 1 31 1 0.4 152 18.3 86.5 2016 1 31 2 0.3 94 18.4 85.9 2016 1 31 3 0.0 109 19.5 83.2 2016 1 31 4 1.3 306 20.4 76.6 2016 1 31 5 0.6 313 21.5 76.6 2016 1 31 6 0.9 238 22.2 73.3 2016 1 31 7 2.7 92 23.0 66.72016 1 31 8 1.5 287 25.0 62.32016 1 31 9 0.8 276 25.8 52.42016 1 31 10 1.5 45 26.7 53.52016 1 31 11 0.7 86 28.5 43.62016 1 31 12 0.8 345 29.2 37.52016 1 31 13 1.6 275 31.3 34.22016 1 31 14 0.2 43 30.9 35.9 2016 1 31 15 1.3 79 28.6 44.7 2016 1 31 16 0.8 324 27.1 53.5 2016 1 31 17 0.2 292 26.3 55.7 2016 1 31 18 0.1 58 23.9 63.9 2016 1 31 19 1.1 332 23.6 67.8 2016 1 31 20 1.4 348 22.2 76.0 2016 1 31 21 1.4 71 21.4 76.0 2016 1 31 22 0.0 71 20.4 76.0 2016 1 31 23 0.0 21 20.1 81.5 2016 2 1 0 0.1 43 18.6 84.32016 2 1 1 1.2 308 18.0 85.92016 2 1 2 0.4 53 18.3 86.52016 2 1 3 0.0 283 19.7 82.6 2016 2 1 4 0.4 348 20.5 76.62016 2 1 5 0.8 315 20.7 76.62016 2 1 6 0.3 70 21.4 70.5 2016 2 1 7 1.3 334 22.5 70.5 2016 2 1 8 0.0 249 24.9 63.9 2016 2 1 9 1.6 355 25.7 52.4 2016 2 1 10 0.1 110 27.1 54.0 2016 2 1 11 1.0 340 29.9 43.6 2016 2 1 12 1.1 288 30.6 39.7

EIA for proposed jetty at Korlai River and expansion of existing jetty at Sanegaon by Indo Energy
International Ltd.
TEPL/ENV/CBS/2021‐05 119
2016 2 1 13 5.5 131 30.9 37.52016 2 1 14 0.9 320 30.7 33.72016 2 1 15 1.2 323 28.6 45.82016 2 1 16 1.0 342 26.7 49.62016 2 1 17 1.5 79 26.8 54.62016 2 1 18 2.1 77 24.2 62.32016 2 1 19 2.6 330 23.9 66.12016 2 1 20 0.3 245 20.9 73.3 2016 2 1 21 1.4 315 21.2 73.3 2016 2 1 22 1.4 101 19.7 79.3 2016 2 1 23 0.1 358 19.3 81.0 2016 2 2 0 0.0 172 17.3 74.0 2016 2 2 1 0.4 62 17.3 75.0 2016 2 2 2 0.4 109 17.6 73.5 2016 2 2 3 0.9 3 18.4 71.0 2016 2 2 4 2.1 306 20.2 66.5 2016 2 2 5 0.0 71 20.7 68.52016 2 2 6 1.3 75 21.2 61.02016 2 2 7 4.0 341 23.7 60.02016 2 2 8 0.6 323 24.8 51.52016 2 2 9 0.3 356 26.8 46.52016 2 2 10 0.7 40 26.6 42.02016 2 2 11 3.3 275 30.6 35.52016 2 2 12 1.0 241 31.2 36.0 2016 2 2 13 4.8 334 32.5 28.0 2016 2 2 14 0.6 240 31.9 28.5 2016 2 2 15 1.6 340 30.0 38.5 2016 2 2 16 0.8 315 27.9 45.5 2016 2 2 17 0.7 309 27.4 45.0 2016 2 2 18 1.6 355 23.9 53.5 2016 2 2 19 4.4 351 23.9 58.0 2016 2 2 20 1.2 87 21.2 62.0 2016 2 2 21 0.8 340 20.2 65.0 2016 2 2 22 1.4 321 20.0 66.52016 2 2 23 2.0 243 17.8 69.52016 2 3 0 1.9 282 15.2 82.42016 2 3 1 0.9 331 15.0 81.8 2016 2 3 2 6.7 317 15.5 81.12016 2 3 3 2.0 291 17.0 76.22016 2 3 4 0.9 305 17.9 76.8 2016 2 3 5 5.9 256 17.6 71.2 2016 2 3 6 0.3 256 18.4 68.1 2016 2 3 7 1.3 312 21.6 57.6 2016 2 3 8 0.4 161 22.1 53.2 2016 2 3 9 1.3 278 24.7 48.9 2016 2 3 10 1.0 347 26.4 39.6

EIA for proposed jetty at Korlai River and expansion of existing jetty at Sanegaon by Indo Energy
International Ltd.
TEPL/ENV/CBS/2021‐05 120
2016 2 3 11 1.1 336 28.3 34.62016 2 3 12 1.4 42 30.6 33.42016 2 3 13 0.9 342 30.5 27.22016 2 3 14 3.9 336 31.2 25.32016 2 3 15 0.8 83 28.3 30.92016 2 3 16 1.3 22 26.6 45.82016 2 3 17 0.8 268 26.1 42.72016 2 3 18 5.3 322 22.8 53.2 2016 2 3 19 1.3 71 22.0 56.3 2016 2 3 20 0.4 340 18.9 70.0 2016 2 3 21 0.9 303 17.7 73.7 2016 2 3 22 0.2 34 18.1 72.5 2016 2 3 23 0.2 319 15.9 74.9 2016 2 4 0 2.1 339 14.3 81.4 2016 2 4 1 0.6 316 14.2 80.2 2016 2 4 2 0.2 252 14.5 81.4 2016 2 4 3 4.3 260 15.4 74.92016 2 4 4 4.8 316 16.4 73.22016 2 4 5 0.2 78 17.8 67.82016 2 4 6 1.3 346 18.8 64.32016 2 4 7 1.3 319 20.1 56.02016 2 4 8 0.5 310 22.0 54.32016 2 4 9 1.5 73 23.9 44.82016 2 4 10 0.9 348 24.4 43.1 2016 2 4 11 0.1 170 27.0 33.0 2016 2 4 12 0.2 45 29.2 27.7 2016 2 4 13 1.4 37 28.7 27.1 2016 2 4 14 1.6 260 28.4 28.3 2016 2 4 15 0.9 287 27.1 37.2 2016 2 4 16 0.9 342 24.4 45.4 2016 2 4 17 0.0 172 23.4 46.6 2016 2 4 18 0.9 351 22.0 56.0 2016 2 4 19 3.3 341 19.8 59.0 2016 2 4 20 7.4 314 17.5 66.72016 2 4 21 1.9 74 16.9 73.22016 2 4 22 0.0 147 15.8 74.92016 2 4 23 1.5 133 14.8 79.1 2016 2 5 0 0.0 357 16.4 88.72016 2 5 1 2.6 307 16.4 89.32016 2 5 2 0.0 310 16.5 89.3 2016 2 5 3 3.5 266 17.4 84.6 2016 2 5 4 0.1 300 18.6 80.6 2016 2 5 5 2.0 338 18.1 75.3 2016 2 5 6 4.8 294 19.9 72.6 2016 2 5 7 1.4 310 21.5 69.2 2016 2 5 8 0.3 26 22.1 59.9

EIA for proposed jetty at Korlai River and expansion of existing jetty at Sanegaon by Indo Energy
International Ltd.
TEPL/ENV/CBS/2021‐05 121
2016 2 5 9 0.9 271 24.3 52.52016 2 5 10 4.1 95 25.0 44.42016 2 5 11 3.9 49 26.5 37.12016 2 5 12 5.2 53 26.4 33.12016 2 5 13 3.7 312 27.8 23.72016 2 5 14 1.2 313 28.6 26.42016 2 5 15 5.5 48 26.5 35.72016 2 5 16 3.2 273 24.8 47.1 2016 2 5 17 1.3 23 24.5 48.5 2016 2 5 18 0.7 253 21.2 56.5 2016 2 5 19 0.1 251 21.5 61.9 2016 2 5 20 2.5 307 19.3 75.9 2016 2 5 21 0.8 41 18.7 73.3 2016 2 5 22 8.5 261 18.0 78.6 2016 2 5 23 2.1 306 16.9 81.3 2016 2 6 0 1.4 315 17.6 88.1 2016 2 6 1 1.4 270 17.1 88.72016 2 6 2 1.7 293 17.6 88.72016 2 6 3 0.3 337 18.3 85.02016 2 6 4 0.0 47 18.2 80.62016 2 6 5 4.8 95 18.8 74.92016 2 6 6 2.4 260 19.5 74.92016 2 6 7 0.1 45 21.1 61.72016 2 6 8 1.6 347 22.0 59.8 2016 2 6 9 1.4 5 24.2 52.2 2016 2 6 10 3.4 267 23.8 47.2 2016 2 6 11 0.4 202 25.3 42.8 2016 2 6 12 0.9 272 27.2 32.0 2016 2 6 13 3.8 336 27.7 27.0 2016 2 6 14 0.1 158 27.5 27.0 2016 2 6 15 1.1 321 26.1 39.0 2016 2 6 16 0.5 61 24.6 47.8 2016 2 6 17 2.0 46 24.0 50.3 2016 2 6 18 1.3 253 21.4 62.32016 2 6 19 0.6 281 20.9 64.22016 2 6 20 1.5 279 20.1 72.42016 2 6 21 1.5 336 19.2 80.6 2016 2 6 22 0.4 215 18.8 83.12016 2 6 23 2.0 270 17.9 83.12016 2 7 0 0.8 319 17.0 88.9 2016 2 7 1 0.1 293 17.3 88.4 2016 2 7 2 0.3 171 17.4 88.4 2016 2 7 3 0.1 78 18.1 84.5 2016 2 7 4 0.5 246 18.1 83.4 2016 2 7 5 0.6 326 19.4 78.5 2016 2 7 6 1.3 294 19.3 74.1

EIA for proposed jetty at Korlai River and expansion of existing jetty at Sanegaon by Indo Energy
International Ltd.
TEPL/ENV/CBS/2021‐05 122
2016 2 7 7 5.5 330 21.1 66.92016 2 7 8 3.6 307 21.4 67.52016 2 7 9 0.6 305 23.2 58.12016 2 7 10 3.2 341 24.2 52.12016 2 7 11 1.3 271 26.4 44.92016 2 7 12 4.8 267 25.8 45.52016 2 7 13 0.3 217 27.9 40.52016 2 7 14 1.1 342 27.3 37.2 2016 2 7 15 1.1 35 25.9 43.3 2016 2 7 16 2.8 51 24.6 54.8 2016 2 7 17 1.5 330 23.7 59.2 2016 2 7 18 2.3 275 22.2 65.3 2016 2 7 19 1.4 132 21.1 70.8 2016 2 7 20 1.2 316 19.9 74.1 2016 2 7 21 1.4 257 19.8 81.2 2016 2 7 22 2.2 91 18.2 82.3 2016 2 7 23 1.8 314 18.2 87.32016 2 8 0 0.1 6 14.0 82.02016 2 8 1 0.0 54 14.5 81.62016 2 8 2 1.1 100 14.5 82.02016 2 8 3 1.1 261 15.9 78.22016 2 8 4 5.7 317 15.8 78.22016 2 8 5 0.0 276 17.4 75.32016 2 8 6 4.9 47 18.6 71.0 2016 2 8 7 1.1 320 19.6 63.8 2016 2 8 8 0.8 55 21.7 62.8 2016 2 8 9 1.0 99 24.4 54.2 2016 2 8 10 1.0 49 24.4 50.4 2016 2 8 11 0.6 76 26.8 46.0 2016 2 8 12 0.8 322 27.8 42.2 2016 2 8 13 0.0 47 28.4 36.4 2016 2 8 14 0.7 336 29.4 37.9 2016 2 8 15 1.6 335 26.8 44.6 2016 2 8 16 1.5 320 24.1 54.22016 2 8 17 0.2 181 24.4 55.22016 2 8 18 0.2 126 21.5 61.42016 2 8 19 4.0 336 21.2 63.3 2016 2 8 20 2.1 143 18.0 70.52016 2 8 21 0.7 321 16.4 73.42016 2 8 22 0.2 270 15.8 73.4 2016 2 8 23 0.2 99 14.8 80.1 2016 2 9 0 1.0 130 17.3 87.3 2016 2 9 1 0.3 6 17.1 88.4 2016 2 9 2 0.7 252 17.7 86.8 2016 2 9 3 0.4 321 19.0 81.7 2016 2 9 4 0.0 6 19.1 78.9

EIA for proposed jetty at Korlai River and expansion of existing jetty at Sanegaon by Indo Energy
International Ltd.
TEPL/ENV/CBS/2021‐05 123
2016 2 9 5 0.4 327 20.1 75.62016 2 9 6 0.6 46 20.3 76.72016 2 9 7 1.6 244 21.7 66.62016 2 9 8 1.2 348 22.6 64.42016 2 9 9 0.7 67 25.5 56.52016 2 9 10 1.2 332 25.5 53.22016 2 9 11 0.2 23 28.1 45.32016 2 9 12 0.4 273 28.6 35.8 2016 2 9 13 0.4 219 29.6 34.1 2016 2 9 14 0.8 240 29.6 34.1 2016 2 9 15 0.6 63 27.4 44.8 2016 2 9 16 0.7 353 25.6 52.6 2016 2 9 17 0.6 80 24.4 52.6 2016 2 9 18 1.6 2 22.2 62.7 2016 2 9 19 0.4 311 22.7 68.3 2016 2 9 20 0.2 259 20.6 76.1 2016 2 9 21 1.4 313 19.5 77.22016 2 9 22 6.5 315 19.0 81.72016 2 9 23 0.4 331 19.0 80.62016 2 10 0 2.0 125 19.6 87.42016 2 10 1 1.8 89 19.3 88.02016 2 10 2 3.0 309 19.6 89.32016 2 10 3 0.4 285 20.3 86.02016 2 10 4 0.3 313 21.0 82.1 2016 2 10 5 1.5 309 21.2 76.1 2016 2 10 6 1.3 294 21.5 74.2 2016 2 10 7 0.6 1 23.1 62.9 2016 2 10 8 0.2 192 23.6 62.9 2016 2 10 9 4.3 51 25.6 47.1 2016 2 10 10 4.9 157 26.5 46.4 2016 2 10 11 3.5 326 27.8 35.2 2016 2 10 12 1.4 263 28.0 35.2 2016 2 10 13 1.4 7 29.6 25.3 2016 2 10 14 1.3 78 29.7 28.02016 2 10 15 1.3 56 28.1 34.62016 2 10 16 1.4 329 26.4 50.42016 2 10 17 5.5 308 25.7 51.7 2016 2 10 18 0.6 85 24.5 61.62016 2 10 19 1.2 77 23.2 66.22016 2 10 20 5.5 77 21.4 70.9 2016 2 10 21 1.2 257 21.5 79.4 2016 2 10 22 1.6 335 20.3 78.8 2016 2 10 23 0.2 309 20.4 86.7 2016 2 11 0 1.4 306 19.1 82.0 2016 2 11 1 2.2 280 19.1 82.3 2016 2 11 2 0.2 138 19.2 82.3

EIA for proposed jetty at Korlai River and expansion of existing jetty at Sanegaon by Indo Energy
International Ltd.
TEPL/ENV/CBS/2021‐05 124
2016 2 11 3 0.4 209 19.9 81.32016 2 11 4 0.8 256 20.4 76.42016 2 11 5 0.2 279 20.4 76.02016 2 11 6 0.6 341 21.2 74.3Interpretation: Meteorological parameters such as wind, temperature and humidity was carried out in the month of January and February 2016. Maximum wind speed for months of January and February is about 10.3 m/s, Temperature is mostly humid with maximum humidity is 90 % and minimum humidity being 9.6%.Highest temperature for these months is 33.1 (°C) while lowest is 12.2 (°C).
3.12.2.5. Tides
The tidal variations in Mumbai waters are mainly semi‐diurnal but with an appreciable diurnal element which produces unequal tides on most days and causes wide variations in extreme levels such that the lowest HW is actually lower than the highest LW. Generally in the narrow estuarine areas, spatial variation of tide is likely to be prominent and the area like Kundalika River is not an exception and there is significant variation in high water levels as one moves upstream compared to open area water levels. This results increased tidal current upstream of river. The excursion length ranges almost 25 km during flood conditions. The tidal data for tidal cycle of 15 days was collected at existing jetty location (Latitude 18˚ 32’16.17 N and Longitude 72˚ 55’ 29.73 E) situated near the mouth of Kundalika River. The data was collected. at a sampling interval of 15 mins. The lowest tidal level is 0.23 m CD and highest level is 3.9 m. The maximum tidal range is 3.5 m, and minimum tidal range is 1.9 m. All levels are with respect to chart datum.
3.12.2.6. Currents
The measurement of current data at C1 (latitude 18º 32’ 26” N & longitude 72” 54’ 46” E) & C2 (latitude 18” 32’ 30” N & longitude 72” 57’ 30” E) carried out. The observations were carried out at surface, mid depth and 1m above seabed level. These data were collected simultaneously at 15 minutes interval for which the tidal data was also collected. The typical plot of current strength and direction at C1 and C2 locations are shown in Figure 3.2 and 3.3. The data at C2 indicates that strength of current at mid depth is as high as 1.60 m/s. It also indicates that during the flood the predominant direction varies between 115° and 125°, while during ebb flow the direction is steady and is at 295° with respect to north. The current strength measured at 1 m depth below the surface indicates that maximum strength.

EIA for proposed jetty at Korlai River and expansion of existing jetty at Sanegaon by Indo Energy
International Ltd.
TEPL/ENV/CBS/2021‐05 125
Figure 3.12 Data collection stations
Figure 3.13 Measured Current Strength and Direction at Location C1
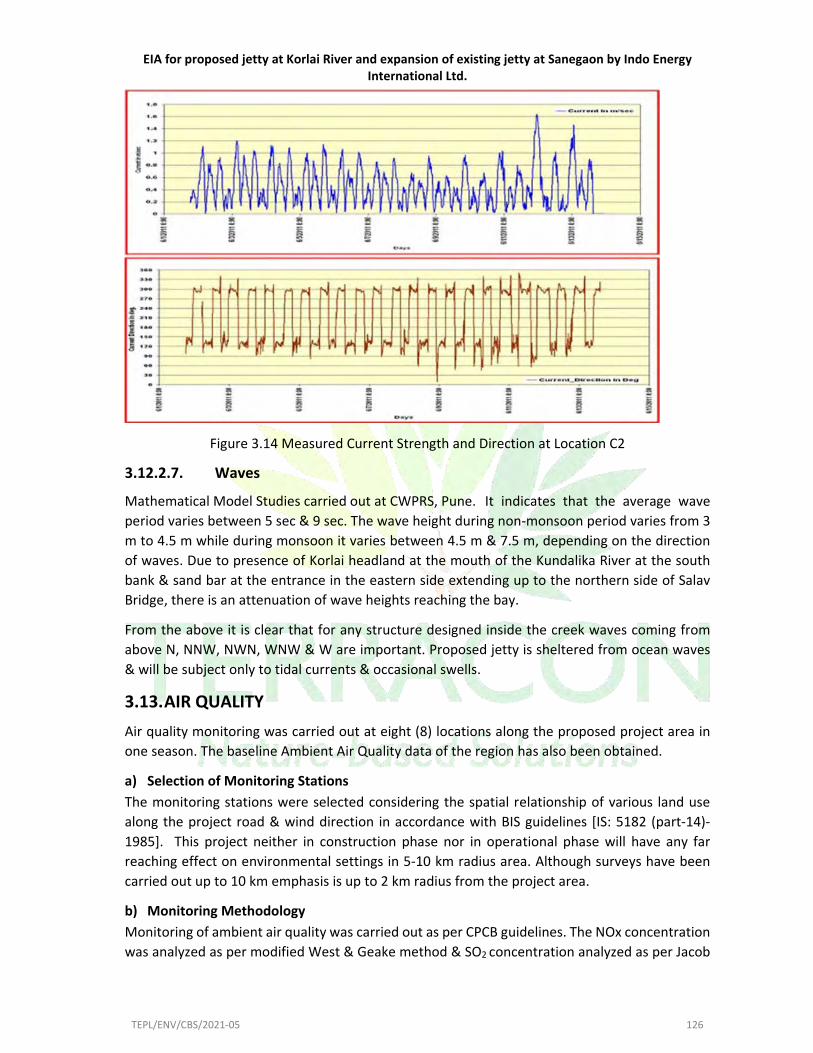
EIA for proposed jetty at Korlai River and expansion of existing jetty at Sanegaon by Indo Energy
International Ltd.
TEPL/ENV/CBS/2021‐05 126
Figure 3.14 Measured Current Strength and Direction at Location C2
3.12.2.7. Waves
Mathematical Model Studies carried out at CWPRS, Pune. It indicates that the average wave period varies between 5 sec & 9 sec. The wave height during non‐monsoon period varies from 3 m to 4.5 m while during monsoon it varies between 4.5 m & 7.5 m, depending on the direction of waves. Due to presence of Korlai headland at the mouth of the Kundalika River at the south bank & sand bar at the entrance in the eastern side extending up to the northern side of Salav Bridge, there is an attenuation of wave heights reaching the bay.
From the above it is clear that for any structure designed inside the creek waves coming from above N, NNW, NWN, WNW & W are important. Proposed jetty is sheltered from ocean waves & will be subject only to tidal currents & occasional swells.
3.13. AIR QUALITY
Air quality monitoring was carried out at eight (8) locations along the proposed project area in one season. The baseline Ambient Air Quality data of the region has also been obtained.
a) Selection of Monitoring Stations
The monitoring stations were selected considering the spatial relationship of various land use along the project road & wind direction in accordance with BIS guidelines [IS: 5182 (part‐14)‐1985]. This project neither in construction phase nor in operational phase will have any far reaching effect on environmental settings in 5‐10 km radius area. Although surveys have been carried out up to 10 km emphasis is up to 2 km radius from the project area.
b) Monitoring Methodology
Monitoring of ambient air quality was carried out as per CPCB guidelines. The NOx concentration was analyzed as per modified West & Geake method & SO2 concentration analyzed as per Jacob

EIA for proposed jetty at Korlai River and expansion of existing jetty at Sanegaon by Indo Energy
International Ltd.
TEPL/ENV/CBS/2021‐05 127
& Hochheise. Ambient Air Quality Standards stipulated by CPCB are presented in Table 3.8.The ambient air monitoring has been carried out at all the six segments mentioned.
Table 3.8 Ambient Air Quality Monitoring Standards (CPCB)
Pollutant Time Weighted
Average
Concentration in Ambient Air
Industrial,
Residential, Rural
and other areas
Ecologically Sensitive
areas notified by
Central Government
Sulphur Dioxide (SO2) (g/m3)
Annual Average* 24 hours**
50 80
20 80
Oxides of Nitrogen (NOx) (g/m3)
Annual Average* 24 hours**
40 80
30 80
Particulate Matter (PM10) (g/m3)
Annual Average* 24 hours**
60 100
60 100
Particulate matter (PM2.5) (g/m3)
Annual Average* 24 hours**
40 60
40 60
Carbon Monoxide (CO) (mg/m3)
8 hours**1 hour
0204
02 04
Table 3.9 Techniques for Measurement of Pollutants
Sr.
No. Pollutant Code Of Practice
Methods Of
Measurement
Minimum
Detectable Limit
1 Sulphur Dioxide (SO2)
IS‐5182 (Part‐II):2001 RA 2012
Improved West and Geake
6.5 µg/m3
2 Nitrogen Dioxide (NO2)
IS‐5182 (Part‐VI): 2006 RA 2012
Modified Jacob & Hochheiser (Na‐Arsenite)
4.0 µg/m3
3 Particulate Matter (size less than 10 µm) or PM10
IS‐5182 (PART‐23):2006 & CPCB Guidelines
Gravimetric
10 µg/m3
4 Particulate Matter (size less than 2.5 µm) or PM2.5
5 µg/m3
5 Ozone (O3) IS‐5182 (Part‐IX):1974 & CPCB Guidelines
Spectrophotometric Method
1 µg/m3
6 Carbon Monoxide (CO)
IS: 5182 (Part‐X) & CPCB Guidelines
Non Dispersive Infra Red (NDIR) spectroscopy
0.1 mg/m3
7 Ammonia (NH3) APHA, (Method‐401) & CPCB Guidelines
Indophenol blue method
6 µg/m3

EIA for proposed jetty at Korlai River and expansion of existing jetty at Sanegaon by Indo Energy
International Ltd.
TEPL/ENV/CBS/2021‐05 128
8 Benzene (C6H6) IS‐5182 (Part‐XI):2006 & CPCB Guidelines
Gas Chromatography 1.0 µg/m3
9 Benzo (a) Pyrene (BaP) – particulate phase only,
IS‐5182 (Part‐XII):2004 & CPCB Guidelines
Solvent extraction followed by HPLC analysis
0.5 ng/m3
10 Lead (Pb) USEPA/625/R‐96/0109/IO‐3.1& 3.2 & CPCB Guidelines
AAS method 0.1 µg/m3
11 Arsenic (As) 1 ng/m3 12 Nickel (Ni) 1 ng/m3

EIA for proposed jetty at Korlai River and expansion of existing jetty at Sanegaon by Indo Energy International Ltd.
TEPL/ENV/CBS/2021‐05 129
Table 3.10 Ambient Air Monitoring Report
Location (01) : Project Site Date of Monitoring
WEEK
PM10
PM2.5
SO2
NOX
Pb
NH3
C6H6
O3 As Ni B‐(a)‐P
CO 0600 ‐ 1400
1400 ‐ 2200
2200 ‐ 0600
0600 ‐ 1400
1400 ‐ 2200
2200 ‐ 0600
µg/m3 ng/m3 mg/m3 14/1/2016 I 41.8 14.5 6.8 13.4 <0.1 8.6 <1.0 6.2 5.6 6.3 <1.0 <1.0 <0.5 0.41 0.82 0.60 19/1/2016 45.6 15.7 7.1 14.0 <0.1 9.7 <1.0 5.7 4.9 6.6 <1.0 <1.0 <0.5 0.84 0.70 0.57 21/1/2016 II 43.3 15.1 7.3 14.3 <0.1 9.2 <1.0 5.4 4.3 6.8 <1.0 <1.0 <0.5 0.65 0.78 0.8127/1/2016 42.7 14.6 6.6 13.0 <0.1 10.7 <1.0 4.8 3.2 7.7 <1.0 <1.0 <0.5 0.81 0.42 0.47 29/1/2016 III 44.9 15.5 7.0 13.7 <0.1 10.2 <1.0 5.2 7.4 4.1 <1.0 <1.0 <0.5 0.80 0.45 0.46 02/02/2016 42.0 14.2 6.8 13.2 <0.1 9.9 <1.0 7.3 6.2 4.5 <1.0 <1.0 <0.5 0.58 0.83 0.57 04/02/2016 IV 40.6 13.4 6.5 12.7 <0.1 8.8 <1.0 4.2 5.0 4.0 <1.0 <1.0 <0.5 0.70 0.57 0.6809/02/2016 41.3 13.8 6.9 13.5 <0.1 9.7 <1.0 3.6 7.5 5.3 <1.0 <1.0 <0.5 0.48 0.72 0.38 CPCB Limits 100 60 80 80 1 400 5 100 6 20 1 2 Minimum 40.6 13.4 6.5 12.7 <0.1 8.6 <1.0 3.2 <1.0 <1.0 <0.5 0.38 Maximum 45.6 15.7 7.3 14.3 <0.1 10.7 <1.0 7.7 <1.0 <1.0 <0.5 0.84Average 42.78 14.60 6.88 13.48 – 9.60 – 5.49 – – – 0.63
Location (02) : Bagmala Date of Monitoring
WEEK
PM10
PM2.5
SO2
NOX
Pb
NH3
C6H6
O3 As Ni B‐(a)‐P
CO 0600 ‐ 1400
1400 ‐ 2200
2200 ‐ 0600
0600 ‐ 1400
1400 ‐ 2200
2200 ‐ 0600
µg/m3 ng/m3 mg/m3

EIA for proposed jetty at Korlai River and expansion of existing jetty at Sanegaon by Indo Energy International Ltd.
TEPL/ENV/CBS/2021‐05 130
14/1/2016 I 45.8 15.7 7.8 15.5 <0.1 9.1 <1.0 5.4 4.3 6.4 <1.0 <1.0 <0.5 0.92 0.59 0.9219/1/2016 48.2 16.6 7.3 14.3 <0.1 9.7 <1.0 5.1 4.7 3.8 <1.0 <1.0 <0.5 0.86 0.84 0.9021/1/2016 II 51.3 17.8 8.1 16.1 <0.1 10.4 <1.0 6.9 4.0 6.2 <1.0 <1.0 <0.5 0.72 0.96 0.56 27/1/2016 46.1 15.5 8.4 16.7 <0.1 10.8 <1.0 4.6 4.4 5.7 <1.0 <1.0 <0.5 0.40 0.49 0.80 29/1/2016 III 43.7 15.8 8.7 17.2 <0.1 9.9 <1.0 4.2 5.1 6.8 <1.0 <1.0 <0.5 0.61 0.92 0.76 02/02/2016 52.6 17.2 7.4 14.5 <0.1 9.5 <1.0 5.7 6.3 4.6 <1.0 <1.0 <0.5 0.91 0.82 0.8704/02/2016 IV 50.1 17.2 7.9 15.6 <0.1 8.6 <1.0 5.4 4.1 6.7 <1.0 <1.0 <0.5 0.58 0.81 0.63 09/02/2016 47.3 16.3 9.2 17.5 <0.1 9.4 <1.0 7.2 7.6 5.1 <1.0 <1.0 <0.5 0.87 0.61 0.54 CPCB Limits 100 60 80 80 1 400 5 100 6 20 1 2 Minimum 43.7 15.5 7.3 14.3 <0.1 8.6 <1.0 3.8 <1.0 <1.0 <0.5 0.40Maximum 52.6 17.8 9.2 17.5 <0.1 10.8 <1.0 7.6 <1.0 <1.0 <0.5 0.96 Average 48.14 16.51 8.10 15.93 – 9.68 – 5.43 – – – 0.75 Location (03) : Walke Date of Monitoring
WEEK
PM10
PM2.5 SO2 NOX Pb NH3 C6H6
O3 As Ni B‐(a)‐P
CO0600 ‐ 1400
1400 ‐ 2200
2200 ‐ 0600
0600 ‐ 1400
1400 ‐ 2200
2200 ‐ 0600
µg/m3 ng/m3 mg/m3 14/1/2016 I 47.6 17.7 7.5 14.7 <0.1 8.9 <1.0 6.9 7.8 7.1 <1.0 <1.0 <0.5 0.70 0.42 0.69 19/1/2016 52.4 19.2 8.1 16.1 <0.1 9.5 <1.0 5.7 4.6 7.9 <1.0 <1.0 <0.5 0.75 0.69 0.48 21/1/2016 II 46.8 17.5 8.4 16.5 <0.1 10.4 <1.0 4.0 5.3 5.8 <1.0 <1.0 <0.5 0.65 0.78 0.54 27/1/2016 51.0 19.1 7.8 15.3 <0.1 9.8 1.14 6.2 3.5 7.4 <1.0 <1.0 <0.5 0.85 0.46 0.82 29/1/2016 III 53.0 18.5 8.2 16.2 <0.1 10.2 <1.0 5.8 4.1 6.2 <1.0 <1.0 <0.5 0.82 0.79 0.53 02/02/2016 49.3 18.3 8.6 17.0 <0.1 9.9 <1.0 7.1 5.2 6.0 <1.0 <1.0 <0.5 0.60 0.43 0.77

EIA for proposed jetty at Korlai River and expansion of existing jetty at Sanegaon by Indo Energy International Ltd.
TEPL/ENV/CBS/2021‐05 131
04/02/2016 IV 48.0 17.5 7.2 14.5 <0.1 10.8 1.06 7.2 4.0 6.1 <1.0 <1.0 <0.5 0.41 0.87 0.8009/02/2016 50.8 18.2 8.2 16.2 <0.1 10.3 <1.0 6.8 5.8 7.1 <1.0 <1.0 <0.5 0.55 0.83 0.62 CPCB Limits 100 60 80 80 1 400 5 100 6 20 1 2 Minimum 46.8 17.5 7.2 14.5 <0.1 8.9 1.06 3.5 <1.0 <1.0 <0.5 0.41 Maximum 53.0 19.2 8.6 17.0 <0.1 10.8 1.14 7.9 <1.0 <1.0 <0.5 0.87Average 49.86 18.25 8.00 15.81 – 9.98 1.10 5.98 – – – 0.66 Location (04) : Mandala
Date of Monitoring
WEEK
PM10
PM2.5
SO2
NOX
Pb
NH3
C6H6
O3 As Ni B‐(a)‐P
CO 0600 ‐ 1400
1400 ‐ 2200
2200 ‐ 0600
0600 ‐ 1400
1400 ‐ 2200
2200 ‐ 0600
µg/m3 ng/m3 mg/m3 15/1/2016 I 48.0 17.7 7.6 15.1 <0.1 9.4 <1.0 6.7 7.0 4.8 <1.0 <1.0 <0.5 0.43 0.56 0.4618/1/2016 50.6 18.2 8.9 17.5 <0.1 9.9 <1.0 5.1 7.3 5.7 <1.0 <1.0 <0.5 0.40 0.72 0.55 22/1/2016 II 51.3 18.6 8.5 16.7 <0.1 10.3 <1.0 4.9 5.5 3.2 <1.0 <1.0 <0.5 0.43 0.46 0.6325/1/2016 52.4 19.1 8.1 15.5 <0.1 10.6 <1.0 4.8 5.9 3.7 <1.0 <1.0 <0.5 0.97 0.69 0.41 30/1/2016 III 49.3 17.8 9.5 18.9 <0.1 9.2 <1.0 7.6 7.0 5.5 <1.0 <1.0 <0.5 0.56 0.94 0.41 01/02/2016 54.1 19.5 9.2 18.1 <0.1 8.5 1.03 4.7 5.1 6.0 <1.0 <1.0 <0.5 1.01 0.42 0.62 05/02/2016 IV 51.7 18.8 8.4 16.5 <0.1 9.6 <1.0 6.2 4.5 5.8 <1.0 <1.0 <0.5 0.66 0.86 0.5208/02/2016 52.2 19.0 8.7 17.2 <0.1 9.1 <1.0 5.3 4.2 7.7 <1.0 <1.0 <0.5 0.84 0.87 0.53 CPCB Limits 100 60 80 80 1 400 5 100 6 20 1 2 Minimum 48.0 17.7 7.6 15.1 <0.1 8.5 1.03 3.2 <1.0 <1.0 <0.5 0.40 Maximum 54.1 19.5 9.5 18.9 <0.1 10.6 1.03 7.7 <1.0 <1.0 <0.5 1.01Average 51.20 18.59 8.61 16.94 – 9.58 1.03 5.59 – – – 0.62

EIA for proposed jetty at Korlai River and expansion of existing jetty at Sanegaon by Indo Energy International Ltd.
TEPL/ENV/CBS/2021‐05 132
Location (05) : Vave
Date of Monitoring
WEEK
PM10
PM2.5
SO2
NOX
Pb
NH3
C6H6
O3 As Ni B‐(a)‐P
CO 0600 ‐ 1400
1400 ‐ 2200
2200 ‐ 0600
0600 ‐ 1400
1400 ‐ 2200
2200 ‐ 0600
µg/m3 ng/m3 mg/m3 15/1/2016 I 48.9 17.8 7.9 15.6 <0.1 9.5 <1.0 4.3 5.6 6.2 <1.0 <1.0 <0.5 0.66 0.87 0.83 18/1/2016 52.4 19.2 8.4 16.4 <0.1 10.7 <1.0 5.0 7.2 5.9 <1.0 <1.0 <0.5 0.87 0.77 0.9022/1/2016 II 45.6 16.6 9.5 18.7 <0.1 9.8 <1.0 7.0 4.1 5.2 <1.0 <1.0 <0.5 0.96 0.55 0.98 25/1/2016 50.7 18.4 7.4 14.3 <0.1 10.0 <1.0 7.4 5.5 6.1 <1.0 <1.0 <0.5 0.92 0.70 0.56 30/1/2016 III 51.5 18.6 9.2 18.1 <0.1 10.4 <1.0 5.5 4.6 3.5 <1.0 <1.0 <0.5 0.75 0.58 0.70 01/02/2016 48.6 17.7 8.4 16.5 <0.1 9.7 <1.0 5.0 6.2 6.4 <1.0 <1.0 <0.5 0.46 0.73 0.4605/02/2016 IV 50.4 18.2 9.8 19.3 <0.1 10.2 <1.0 6.6 3.1 7.4 <1.0 <1.0 <0.5 0.78 0.50 0.93 08/02/2016 51.7 18.7 7.6 15.1 <0.1 9.9 <1.0 3.9 7.5 7.1 <1.0 <1.0 <0.5 0.98 0.89 0.77 CPCB Limits 100 60 80 80 1 400 5 100 6 20 1 2 Minimum 45.6 16.6 7.4 14.3 <0.1 9.5 <1.0 3.1 <1.0 <1.0 <0.5 0.46Maximum 52.4 19.2 9.8 19.3 <0.1 10.7 <1.0 7.5 <1.0 <1.0 <0.5 0.98 Average 49.98 18.15 8.53 16.75 – 10.03 – 5.68 – – – 0.75 Location (06) : Talekhar
Date of Monitoring
WEEK
PM10
PM2.5
SO2
NOX
Pb
NH3
C6H6
O3 As Ni B‐(a)‐P
CO 0600 ‐ 1400
1400 ‐ 2200
2200 ‐ 0600
0600 ‐ 1400
1400 ‐ 2200
2200 ‐ 0600
µg/m3 ng/m3 mg/m3 15/1/2016 I 46.7 17.1 7.5 14.6 <0.1 9.8 <1.0 7.7 6.8 4.6 <1.0 <1.0 <0.5 1.02 0.99 1.03

EIA for proposed jetty at Korlai River and expansion of existing jetty at Sanegaon by Indo Energy International Ltd.
TEPL/ENV/CBS/2021‐05 133
18/1/2016 50.2 18.4 8.3 16.3 <0.1 10.8 <1.0 6.0 6.5 7.3 <1.0 <1.0 <0.5 0.75 0.91 0.8622/1/2016 II 48.3 17.6 8.7 17.1 <0.1 9.2 1.04 4.9 4.3 6.5 <1.0 <1.0 <0.5 0.93 0.56 0.57 25/1/2016 52.1 19.1 7.9 15.4 <0.1 8.7 <1.0 4.6 6.1 6.3 <1.0 <1.0 <0.5 0.56 0.59 0.71 30/1/2016 III 50.6 18.2 8.3 16.3 <0.1 9.6 <1.0 7.7 3.6 4.0 <1.0 <1.0 <0.5 0.96 0.77 0.59 01/02/2016 49.2 17.6 8.9 17.5 <0.1 10.5 <1.0 5.5 7.0 6.8 <1.0 <1.0 <0.5 0.52 0.76 0.5405/02/2016 IV 47.3 17.0 9.2 18.1 <0.1 9.7 1.11 6.3 7.3 3.6 <1.0 <1.0 <0.5 0.97 0.47 0.53 08/02/2016 51.1 18.4 8.0 15.8 <0.1 9.4 <1.0 7.8 5.7 4.3 <1.0 <1.0 <0.5 0.78 0.68 0.44 CPCB Limits 100 60 80 80 1 400 5 100 6 20 1 2 Minimum 46.7 17.0 7.5 14.6 <0.1 8.7 1.04 3.6 <1.0 <1.0 <0.5 0.44Maximum 52.1 19.1 9.2 18.1 <0.1 10.8 1.11 7.8 <1.0 <1.0 <0.5 1.03 Average 49.44 17.93 8.35 16.39 – 9.71 1.08 5.88 – – – 0.73 Location (07) : Salav
Date of Monitoring
WEEK
PM10
PM2.5
SO2
NOX
Pb
NH3
C6H6
O3 As Ni B‐(a)‐P
CO 0600 ‐ 1400
1400 ‐ 2200
2200 ‐ 0600
0600 ‐ 1400
1400 ‐ 2200
2200 ‐ 0600
µg/m3 ng/m3 mg/m314/1/2016 I 46.1 15.2 7.5 15 <0.1 9 <1.0 5.4 4.3 6.4 <1.0 <1.0 <0.5 0.92 0.59 0.92 19/1/2016 47.2 16.9 7 14.7 <0.1 9.2 <1.0 5.1 4.7 3.8 <1.0 <1.0 <0.5 0.86 0.84 0.9 21/1/2016 II 50.9 16.8 8.3 16.7 <0.1 10.1 <1.0 6.9 4 6.2 <1.0 <1.0 <0.5 0.72 0.96 0.5627/1/2016 45.8 15.1 8.4 16.3 <0.1 10.5 <1.0 4.6 4.4 5.7 <1.0 <1.0 <0.5 0.4 0.49 0.8 29/1/2016 III 42.8 15.7 8.8 17.1 <0.1 9.6 <1.0 4.2 5.1 6.8 <1.0 <1.0 <0.5 0.61 0.92 0.762/2/2016 51.6 17.3 7.2 15 <0.1 9.2 <1.0 5.7 6.3 4.6 <1.0 <1.0 <0.5 0.91 0.82 0.874/2/2016 IV 49.7 16.9 7.5 15.1 <0.1 8.8 <1.0 5.4 4.1 6.7 <1.0 <1.0 <0.5 0.58 0.81 0.639/2/2016 46.8 16.4 9.1 17 <0.1 9.1 <1.0 7.2 7.6 5.1 <1.0 <1.0 <0.5 0.87 0.61 0.54CPCB Limits 100 60 80 80 1 400 5 100 6 20 1 2

EIA for proposed jetty at Korlai River and expansion of existing jetty at Sanegaon by Indo Energy International Ltd.
TEPL/ENV/CBS/2021‐05 134
Minimum 42.8 15.1 7 14.7 <0.1 8.8 <1.0 3.8 <1.0 <1.0 <0.5 0.4Maximum 51.6 17.3 9.1 17.1 <0.1 10.8 <1.0 7.6 <1.0 <1.0 <0.5 0.96Average 47.61 16.29 7.98 15.86 – 9.44 – 5.43 – – – 0.75 Location (08) : Korlai
O3 As Ni B‐(a)‐P
CODate of Monitoring
WEEK PM10 PM2.5 SO2 NOX Pb NH3 C6H6 0600 ‐ 1400
1400 ‐ 2200
2200 ‐ 0600
0600 ‐ 1400
1400 ‐ 2200
2200 ‐ 0600
µg/m3 ng/m3 mg/m3 14/1/2016 I 45.5 15 7.7 15.7 <0.1 9.8 <1.0 5.1 4.5 6.6 <1.0 <1.0 <0.5 0.95 0.55 0.89 19/1/2016 48.1 16.2 7.2 14.2 <0.1 9.1 <1.0 5.3 5.1 3.5 <1.0 <1.0 <0.5 0.78 0.82 0.91 21/1/2016 II 51.2 16 8 16.3 <0.1 10.3 <1.0 6.5 4.3 6.7 <1.0 <1.0 <0.5 0.69 0.94 0.6 27/1/2016 46 15.2 8.1 16.6 <0.1 10.1 <1.0 4.1 4.2 5.2 <1.0 <1.0 <0.5 0.45 0.51 0.78 29/1/2016 III 41.2 15.1 8.5 17.5 <0.1 9.5 <1.0 4.4 5.7 6.6 <1.0 <1.0 <0.5 0.63 0.89 0.72 2/2/2016 50.9 17.8 7 15.2 <0.1 9.1 <1.0 5 6.2 4.1 <1.0 <1.0 <0.5 0.9 0.79 0.85 4/2/2016 IV 48.7 15.5 7.7 15.7 <0.1 8.7 <1.0 5.2 4.3 6.8 <1.0 <1.0 <0.5 0.6 0.8 0.62 9/2/2016 47 16.3 9.3 17.1 <0.1 9.3 <1.0 7 7.1 5.3 <1.0 <1.0 <0.5 0.82 0.65 0.51 CPCB Limits 100 60 80 80 1 400 5 100 6 20 1 2Minimum 41.2 15 7 14.2 <0.1 8.7 <1.0 3.5 <1.0 <1.0 <0.5 0.45Maximum 51.2 17.8 9.3 17.5 <0.1 10.8 <1.0 7.1 <1.0 <1.0 <0.5 0.95Average 47.3 15.89 7.9 16.0 – 9.49 – 5.37 – – – 0.74BDL: Below Detection Level (All Parameter Units Are µg/M3) Standard from ‘The Air (Prevention and Control of Pollution) Act, 19

EIA for proposed jetty at Korlai River and expansion of existing jetty at Sanegaon by Indo Energy
International Ltd.
TEPL/ENV/CBS/2021‐05 135
Table 3.11 Ambient Air Quality Recorded at eight locations
Sr. No.
Parameter
Units
Locations Permissible limitsProje
ct site
Bagmala
Walke
Mandala
Vave
Talekhar
Salav
Korlai
1 PM2.5 µg/m3
14.60
16.51 18.25
18.59 18.15
17.93 16.29
15.89
60.0
2 PM10 µg/m3
42.78
48.14 49.86
51.20 49.98
49.44 47.61
47.3 100.0
3 SO2 µg/m3
6.88 8.10 8.00 8.61 8.53 8.35 7.98 7.9 80.0
4 NOX µg/m3
13.48
15.93 15.81
16.94 16.75
16.39 15.86
16.0 80.0
5 Pb µg/m3
<0.1 <0.1 <0.1 <0.1 <0.1 <0.1 <0.1 <0.1 1.0
6 NH3 µg/m3
9.60 9.68 9.98 9.58 10.03
9.71 9.44 9.49 400.0
7 C6H6 µg/m3
<1.0 <1.0 1.10 1.03 <0.1 1.08 <0.1 <0.1 5.0
8 O3 µg/m3
5.49 5.43 5.98 5.59 5.68 5.88 5.43 5.37 100.0
9 As µg/m3
<1.0 <1.0 <0.1 <0.1 <0.1 <0.1 <0.1 <0.1 6.0
10 Ni µg/m3
<1.0 <1.0 <0.1 <0.1 <0.1 <0.1 <0.1 <0.1 20.0
11 B‐(a)‐P µg/m3
<0.5 <0.5 <0.5 <0.5 <0.5 <0.5 <0.5 <0.5 1.0
12 CO µg/m3
0.63 0.75 0.66 0.62 0.75 0.73 0.75 0.74 2.0
The Ambient Air quality monitoring was carried out at eight locations including project site within the project area within 10 Km radius. The results of ambient air quality are presented in Table 3.10 and Table 3.11.

EIA for proposed jetty at Korlai River and expansion of existing jetty at Sanegaon by Indo Energy
International Ltd.
TEPL/ENV/CBS/2021‐05 136
Figure 3.15 Graph of Ambient Air Quality Analysis for PM10
Figure 3.16Graph of Ambient Air Quality Analysis for PM2.5

EIA for proposed jetty at Korlai River and expansion of existing jetty at Sanegaon by Indo Energy
International Ltd.
TEPL/ENV/CBS/2021‐05 137
Figure 3.17Graph of Ambient Air Quality Analysis for SO2
Figure 3.18Graph of Ambient Air Quality Analysis for NO2

EIA for proposed jetty at Korlai River and expansion of existing jetty at Sanegaon by Indo Energy
International Ltd.
TEPL/ENV/CBS/2021‐05 138
Figure 3.19Graph of Ambient Air Quality Analysis for NH3
Figure 3.20Graph of Ambient Air Quality Analysis for CO

EIA for proposed jetty at Korlai River and expansion of existing jetty at Sanegaon by Indo Energy
International Ltd.
TEPL/ENV/CBS/2021‐05 139
Figure 3.21Graph of Ambient Air Quality Analysis for Ozone
Interpretation
During the study period in the entire study area the maximum value of PM2.5 was observed at Mandala i.e. 18.59 μg/m3 and the lowest was observed at project site i.e 14.60 μg/m3. PM 10 was maximum at Mandala and minimum at project site the values are 51.20 μg/m3 42.78 μg/m3 respectively.
The minimum SOx concentration value of 6.88 μg/m3 was observed at project site and maximum concentration of 7.98 μg/m3 was observed at Salav.
Maximum concentration of NOx was observed at Mandala i.e. 16.94 μg/m3 and minimum concentration of NOx was observed at Project site i.e. 13.48 μg/m3.
The other parameters recorded includes Ammonia, Ozone, Nikel CO, Lead(Pb), Arsenic (As), Benzene, Benzo(a) pyrene were found to be within permissible limits.
3.14. NOISE QUALITY
The following sources were used as secondary data:
• Literature Review
• CPCB guidelines
• Previous reports
Primary Data

EIA for proposed jetty at Korlai River and expansion of existing jetty at Sanegaon by Indo Energy
International Ltd.
TEPL/ENV/CBS/2021‐05 140
A preliminary reconnaissance survey has been undertaken to identify different noise generating sources based on the activities in the study area. To establish the ambient noise in the study area, monitoring of ambient noise level was carried out at three locations for each scheme in the study area.
Methodology of Ambient Noise Monitoring
Noise levels were monitored as per the CPCB 2015 guidelines for the study period. Noise measurements for 24‐hour period were made a 8 locations near project site.. Noise levels were measured using Noise Meter PCE‐322A meter manufactured by PCE Instruments..
Area Category of Area Permissible Limit
Leq Day time Leq Night time
A Industrial Area 75 70 B Commercial Area 65 55 C Residential Area 55 45 D Silence Zone 50 40
Note - 1 Day time is reckoned in between 6.a m and 10 p.m. Note - 2 Nighttime is reckoned in between 10 p.m. and 6 p.m.
Table 3.12 Ambient Noise Levels
Location Project site
Bagmala
Walke Mandala
Vave Talekhar Salav Korlai
DATE 19/1/16
21/1/16 27/1/16
18/1/16 22/1/16 29/1/16 28/1/16
20/1/16
Hourly L e
q
06:00 40.8 44.4 40.5 44.0 41.2 41.8 40.7 40.5 07:00 44.4 48.6 47.8 47.5 46.4 46.9 45.3 45.7 08:00 44.0 50.0 47.9 52.1 45.1 48.0 46 47.3 09:00 43.6 53.7 50.1 46.0 48.7 48.4 48 47.6 10:00 43.5 50.8 48.3 49.2 53.1 51.0 54.1 51.3 11:00 48.8 50.4 53.1 52.5 50.7 52.1 51.3 52.2 12:00 44.8 50.3 54.2 50.8 50.1 52.8 51.2 52.1 13:00 46.3 49.3 52.8 50.9 51.4 55.1 50.5 55.7 14:00 51.6 48.1 50.6 48.0 53.9 48.9 55 47.9 15:00 45.2 50.4 50.0 48.3 55.5 50.7 55.1 50.1 16:00 44.4 52.8 48.7 47.7 50.4 46.7 49.9 46.4 17:00 42.2 51.9 44.8 49.5 51.8 51.1 50.7 51.3 18:00 44.8 49.4 48.8 48.2 51.7 48.6 52.5 48.1 19:00 44.4 53.2 45.8 53.8 49.3 50.0 49.1 49.7 20:00 43.7 52.1 44.5 49.1 45.3 46.4 45.1 46.2 21:00 43.8 46.2 44.5 47.6 47.7 44.9 46.3 44.1 22:00 39.6 43.4 41.2 42.4 42.6 40.5 41.5 40.3

EIA for proposed jetty at Korlai River and expansion of existing jetty at Sanegaon by Indo Energy
International Ltd.
TEPL/ENV/CBS/2021‐05 141
23:00 39.7 43.4 42.1 41.5 40.3 40.6 40.2 40.1 00:00 39.0 42.8 40.2 40.2 40.5 40.3 40.7 40.4 01:00 38.6 40.6 39.2 39.6 39.6 39.4 38.7 38.7 02:00 38.7 41.4 39.7 39.9 39.9 39.9 40.1 40.1 03:00 40.5 39.3 40.3 40.3 39.4 40.2 38.8 41 04:00 39.8 40.5 39.6 40.3 40.7 39.6 40.2 38.5 05:00 40.7 42.3 41.2 42.0 41.5 40.8 41.8 41.2
Leq Day 45.6 50.7 49.6 49.8 50.8 50.0 51.3 50.4 Leq Night 39.6 41.9 40.5 40.9 40.7 40.2 38.7 37.7 LDN 47.4 51.1 49.9 50.2 50.8 50.1 50.9 50.2
Interpretation The projects site is located in the west coast of Arabian Sea. The ambient noise monitoring is carried out at nearby surrounding to establish the baseline conditions in the area for comparison with future levels during construction phase.
The monitoring of ambient noise was conducted to assess the background noise levels at 8 locations. Noise levels during day time (Lday) ranges from 45.6 to 51.3 dB (A) and night time (Lnight) ranges from 37.7 to 41.9 dB (A).it was observed that maximum day time knowledge is found in Salav and for night time is found in Project site All the readings are within CPCB norms.
3.15. SOCIO‐ECONOMIC ENVIRONMENT
3.15.1.1. Maharashtra State
The published information included the websites of the Government of India and the Government of Maharashtra and the Census of India data 2011, which was utilized to enlist the socio‐economic profile of the project area. As seen in Table 3.13, Maharashtra is the third largest state in India with an area of 3,07,713 sq. km. and a population of 11.2 crore. It is one of the wealthiest and most developed states in the country, which constitutes approximately 5.8 crore of male and 5.4 crore of female population. The density of the state overall is 365/km2. The literacy rate is of the state is 82.34 percent. The sex ratio is 929 females per 1000 males.
Table 3.13: Basic features of Maharashtra
Sr. No. Particulars Details
1 Geographical location Geographical Coordinates of Maharashtra are 19.7515° N, 75.7139° E
2 Area 3,07,713 Sq. km. 3 Population 11,23,74,333 4 Population (Male) 5,82,43,056 5 Population (Female) 5,41.31,277 6 Population density 365 per Sq. km. 7 Sex ratio 929 females per 1000 males

EIA for proposed jetty at Korlai River and expansion of existing jetty at Sanegaon by Indo Energy
International Ltd.
TEPL/ENV/CBS/2021‐05 142
8 Literacy rate 82.34 percent 9 Decadal Growth percentage 15.99 percent
Source: Census 2011
As seen in Table 3.14, 20 percent of the total population of Maharashtra consists of SC and ST. The state consists of 1.3 crore population of scheduled caste of which 67 lakh are males and 65 lakh are females. The state also has 1.05 crore of scheduled tribes of which 53 lakh are males and 51 lakh are females.
Table 3.14: Maharashtra Population (SC and ST)
Caste Total Male Female
SC 1,32,75,898 67,67,759 65,08,139 ST 1,05,10,213 53,15,025 51,95,188
Source: Census 2011
As seen in Table 3.15, Maharashtra has a good literacy overall, with a literate population of 8,15,54,290 out of 11.2 crore individuals that is 82.34 percent of literacy rate overall. 4.5 crore out of 5.8 crore males are literate. Literacy rate is good among males i.e. 88.38 percent. The literacy rate among females is relatively low, with 25 percent of female population being illiterate. Only 3.6 crore out of 5.4 crore females are literate.
Table 3.15: Maharashtra Literacy Level
Parameter Male Female
Literacy 4,52,57,584 3,62,96,706
Percentage 88.38 75.87 Source: Census 2011
Table 3.16 shows the work population of Maharashtra. Around 4,94,27,878 people are working as per census of 2011. Out of which 3.2 crore are males and 1.6 crore are females which is 32 percent of the worker population. This shows that females are not very keen to work which also coincides with low literacy rate in females.
Table 3.16: Maharashtra Worker Population
Parameter Male Female
Workers (Main and Marginal) 3,26,16,875 1,68,11,003
Percentage 56 31.06 Source: Census 2011
3.15.1.2. Raigad District

EIA for proposed jetty at Korlai River and expansion of existing jetty at Sanegaon by Indo Energy
International Ltd.
TEPL/ENV/CBS/2021‐05 143
According to Census 2011 Raigad had a population of 26.3 lakhs of which males were 13.4 lakh and remaining 12.8 lakh were females, spread over urban & rural section. Total area of the Raigad district is 7,152 square kilometre. Total No. of households are around 6.1 lakh.
Average literacy rate of Raigad was 73.64% in 2011; on comparing gender wise, male and female literacy were 54.62% and 45.37% of total literate respectively. Total literate in Raigad District were 19.3 lakh of which male and female were 10.5 lakh and 8.8 lakh respectively. Sex ratio is 959 females per 1000 males.
Table 3.17: Basic features of Raigad district
Sr. No. Particulars Details
1 Geographical location Geographical Coordinates Raigad: 18.5158° N, 73.1822° E
2 Area 7,152 Sq. Km
3 Population 26,34,200 Population (Male) 13,44,345 Population (Female) 12,89,855
4 Population density ~ 368 per square km 5 Sex Ratio 959 females per 1000 males 6 Literacy rate 73.64 % 7 Decadal Growth percentage (+) 19.31
Source: Census 2011
Table 3.18 shows the population of SC and ST in Raigad district. Raigad district has a total of 1,34,952 people belonging to scheduled caste out of which 67,980 are males and 66,972 are females. They constitute 5.12 percent of the total Raigad district population. Raigad district also has a total of 3,05,125 people belonging to scheduled tribe (ST) out of which 1,51,468 are females and the rest 1,53,657 are males. They constitute 11.58 percent of the total population of Raigad district.
Table 3.18: Raigad District Population (SC and ST)
Caste Total Male Female
SC 1,34,952 67,980 66,972 ST 3,05,125 1,53,657 1,51,468
Source: Census 2011
Table 3.19 shows the literacy rate of Raigad district population. Raigad district has a total of 19,39,994 literate people which is 73.64 percent of the total population. The literacy among males is 10.59 lakh which are 78.82 percent of the total male population. The literacy among female population is 8.80 lakh which are of 68.24 percent of total female population.

EIA for proposed jetty at Korlai River and expansion of existing jetty at Sanegaon by Indo Energy
International Ltd.
TEPL/ENV/CBS/2021‐05 144
Table 3.19: Raigad District Literacy Level
Particulars Male Female
Literacy 10,59,692 8,80,302 Percentage 78.82 68.24
Source: Census 2011
Table 3.20 shows the working population of Raigad district. The total population of Raigad district consist of 10,72,969 workers. 7.53 lakh males are workers which constitute 70.25 percent of the total workers population. Number of female workers is 3.19 lakh females are working which are 29.74 of the total workers population.
Table 3.20: Raigad District Worker Population
Particulars Male Female
Workers (Main and Marginal) 7,53,843 3,19,126
Percentage 70.25 29.74 Source: Census 2011
The other parameters recorded includes Ammonia, Ozone, Nikel CO, Lead(Pb), Arsenic (As), Benzene, Benzo(a) pyrene were found to be within permissible limits.
– Socioeconomic status of nearby villages
Name of village/ town
class No of houses
Population
Children(0‐6)
SC ST Literacy
Illiterate
Total work
Working Population
Non‐working Population
Kude Total 81 293 24 4 0 192 101 159 157 134 Male 0 142 11 3 0 106 36 82 81 60 Female
0 151 13 1 0 86 65 77 76 74
sanegaon
Total 153 655 55 172 72 511 144 405 397 250 Male 0 337 26 96 35 292 45 212 210 125 Female
0 318 29 76 37 219 99 193 187 125
Ashtami
Total 26 146 21 0 27 105 41 56 48 90 Male 0 82 8 0 16 68 14 49 43 33 Female
0 64 13 0 17 37 27 7 5 57
Shenvai
Total 268 1134 92 34 168 825 282 646 484 488 Male 0 582 46 12 82 470 112 378 301 204 Female
0 552 46 22 86 382 170 268 183 284
Bhilji Total 135 592 60 0 0 447 145 370 264 222

EIA for proposed jetty at Korlai River and expansion of existing jetty at Sanegaon by Indo Energy
International Ltd.
TEPL/ENV/CBS/2021‐05 145
Male 0 286 31 0 0 238 48 186 130 100 Female
0 306 29 0 0 209 97 184 134 122
Bhise Total 181 815 73 5 0 643 172 409 359 406 Male 0 424 39 3 0 363 61 270 258 154 Female
0 391 34 2 0 280 111 139 101 252
Yesade
Total 39 153 7 0 0 125 28 90 75 63 Male 0 68 3 0 0 60 8 47 41 21 Female
0 85 4 0 0 65 20 43 34 42
Roha Total 34267
146261
15670 6351
21652
104186
42075
64614
50839 81647
Male 0 75048 8101 3134
10889
58202
16846
43456
36090 31592
Female
0 71213 7569 3217
0763
45984
25729
21158
14749 50055
Medhe
Total 326 93 93 30 30 1025 271 835 302 461 Male 0 41 41 12 25 549 90 446 253 193 Female
0 52 52 18 15 476 181 389 49 268
Chanere
Total 241 945 107 73 29 729 246 327 263 618 Male 0 4884 62 34 13 390 94 253 210 231 Female
0 461 45 39 16 339 122 74 53 387
Socioeconomic data for the villages has been collected from the Census of India, 2011. Korlai, Salav, Borlai and Cheher are the larger villages among the 12 villages within 5 km
of the site. The villages are characterized by very high literacy rate even for female population. Significant proportion of the population of village Borli are Schedule Tribes. Small village
of Kolamandale is primarily a tribal village. The villages enjoy good level of development and standard of living. All villages have
electrification, access to clean drinking water and village roads. Primary medical facilities are available at Salav and Revdanda

EIA for proposed jetty at Korlai River and expansion of existing jetty at Sanegaon by Indo Energy
International Ltd.
TEPL/ENV/CBS/2021‐05 146
CHAPTER4ANTICIPATED
ENVIRONMENTALIMPACTS
&MITIGATIONMEASURE

EIA for proposed jetty at Korlai River and expansion of existing jetty at Sanegaon by Indo Energy
International Ltd.
TEPL/ENV/CBS/2021‐05 147
4. ANTICIPATED ENVIRONMENTAL IMPACT AND MITIGATION
MEASURES
4.1. ENVIRONMENTAL IMPACT ASSESSMENT DEFINITIONS (EIA)
A process or set of activities designed to contribute pertinent environmental information to project or programme decision‐making. It is a process, which attempts to identify, predict and assess the likely consequences of proposed development activities. EIA is a planning aid concerned with identifying, predicting and assessing impacts arising from proposed activities such as policies, programs, plans and development projects which may affect the environment. EIA is a basic tool for the sound assessment of development proposals to determine the potential environmental, social and health effects of a proposed development.
Environment Impact Assessment is becoming more and more common. Based on the “Law of Environment Protection” in India, environmental impact of every planned engineering project, including regulation works for navigation channels, should be carried. The local environmental protection bureau, where the project is located, will examine the potential impact on environment. The project will be approved, only when its environment impacts are acceptable. A thorough environmental impact assessment must incorporate an assessment of the economic impact of a project, the physical and chemical condition of the area, the flora and fauna and human reflections.
4.2. PURPOSE OF ENVIRONMENT IMPACT ASSESSMENT
The projects, like any others, have impacts in the environment at a smaller degree. The magnitude of the impacts, of course, depends on the scale of the works. For this reason one should also realize that the extent of the investigation is not always the same. The points to be considered for EIA are given below. One should assess for every project, in the feasibility study, the scope and the size of EIA.
A complete Environment Impact Assessment study should describe the following items. A description of the “as is” situation before the project starts in the area influenced by
the project. A description of the proposed project and its influence on the environment after
completion. A description of the works and actions to be carried out to implement the project. A description of the probable impact of all works and action described relating to‐
The biological equilibrium, including;
The regional ecosystem The fluvial ecosystem and The human ecosystem
The non‐biological equilibrium, including

EIA for proposed jetty at Korlai River and expansion of existing jetty at Sanegaon by Indo Energy
International Ltd.
TEPL/ENV/CBS/2021‐05 148
Water quality Air quality Socio‐economic factors Landscape Land use Noise Employment Infrastructure Recreational activities and The possible beneficial environmental effects of the project. The possible adverse environment effects of the project An evaluation of the effects of various execution methods during the implementation
period of the project An evaluation of the effects during the period the project is commissioned An evaluation of the effects of demolishing a structure during the period of construction An evaluation of the irreversibility of impacts The range of primary, secondary and tertiary impacts (direct or indirect) of the project A proposal for remedial actions to reduce the impacts of the project
4.3. POTENTIAL ENVIRONMENT IMPACTS OF THE PROJECT
The first step of an environmental impact assessment is to identify the potential effects of a project on environment. In this section, attempts will be made on outlining possible effects of the project on environment, together with mitigation measures.
4.4. ENVIRONMENT IMPACT ASSESSMENT AND MITIGATION MEASURES
4.4.1. INTRODUCTION
This chapter deals with the assessment of project impacts on environment. Mitigative measures are suggested to minimize the likely negative impacts. An environmental management plan is also suggested along with an estimate of environmental costs as an input for evaluation the economic feasibility of the project.
The project will have impacts of varying magnitude on different environmental components. These impacts could be categorized as‐
Primary impacts, i.e. impacts which occur as a direct result of the project activities Secondary and tertiary impacts, i.e. impacts that occur as a result of primary impacts.
Impacts could occur during the construction phase as well as during the operational phase. Impacts during these phases are discussed separately in this chapter.
4.5. SIGNIFICANT ENVIRONMENTAL IMPACTS AND MITIGATIVE MEASURES

EIA for proposed jetty at Korlai River and expansion of existing jetty at Sanegaon by Indo Energy
International Ltd.
TEPL/ENV/CBS/2021‐05 149
In view of the above study, we will sub divide the key environmental factors into 3 groups:‐
In respect of existing status In respect of construction phase and In respect of operation phase
The type and magnitude of the impacts is entirely site specific. In order to logically analyze situation on a probable scale, following standards have been devised for the project under consideration to quantify the impact:
0 = No Impact ‐ 1 = Negligible ‐ 2 = Mild ‐ 3 = Moderate ‐ 4 = Significant ‐ 5 = Severe Utility of the above noted qualitative scale is that it can be used as a method to approximately indicate varying order of caution while dealing with different stretches of the project.(referTable 4.3)
Each of the negative impacts on the environment requires consideration of mitigative measures. Some of these measures require judicious application of road engineering design and construction methodology while others require special techniques. An attempt has been made to indicate the required mitigative measures for each type of identified negative impact.
4.5.1.1. Impacts from the project Location
Potential Impact due to Port Location
Port projects may also involve changes in land terrain like reclamation of areas for creation of huge extant of port infrastructure like operational areas, storages, roads, railway lines etc.
Coastline changes like erosion or accretion may be expected due to the establishment of ports.
Transportation of huge quantities of construction material for the berths, operational, administrative and welfare buildings, land filling/development, formation of storage and stacking yards etc.,
During operations phase of the port may result in excessive use of existing public infrastructure like roads, railways and in‐land waterways etc., resulting in congestion and early ageing etc.
Public utilities such as water supply, drainage, electrical power etc. may also get undue demand.
Mitigation measures

EIA for proposed jetty at Korlai River and expansion of existing jetty at Sanegaon by Indo Energy
International Ltd.
TEPL/ENV/CBS/2021‐05 150
Careful site selection and port design should be carried out, focusing on the possibility of limiting the extent of land area requirement.
Coast line changes like erosion or accretion due to interference to littoral process, likely to have serious consequences are to be assessed by proper techniques sometimes involving mathematical/physical model studies to ascertain remedial measures such as shore protection works, sand by passing etc.
Rainwater harvesting systems shall be provided. Drainages, roads and rail connectivity should suitably designed and implemented to
overcome affects of changes in land terrain. Existing network of road and rail infrastructure will be improved by suitable expansion
including development of bye passes as part of project to avoid congestion of existing road rail net works and resulting inconvenience to the public.
Utilities like water supply, surface drainage including storm water, sewage treatment/disposal, waste management/disposal, and electrical power supply shall be augmented or developed as the case may be part of the port project.
4.5.2. IMPORTANT ATTRIBUTES DURING CONSTRUCTION PHASE
The major activities during the construction phase of the project will be: Transportation of pre cast material and solid wastes. Construction and dredging activities for the proposed project. Reclamation activities for the proposed multipurpose jetty. Construction of berthing facility, ship parking facility. Ship lifts stations development. Storage of materials and equipments. Construction of support infrastructure such as offices, toilets, etc. Construction of internal roads, and other infrastructure. Operational construction equipment. Runoff from construction debris and sanitary wastes (Construction workers camp). Disposal of liquid and solid wastes generated during construction.
Impacts of these activities on various components of the environment are discussed in the following subsections. It must be noted that most of the impacts during the construction phase will be temporary, and will not be felt at the end of the construction phase. However proper mitigative measures are provided for the minimization of the impacts caused by these activities which we shall see further in detail.
4.5.2.1. POSITIVE IMPACTS
Some of the potential positive impacts expected from the project are: Significant improvement in coastal trade along with the development of nearby ports.

EIA for proposed jetty at Korlai River and expansion of existing jetty at Sanegaon by Indo Energy
International Ltd.
TEPL/ENV/CBS/2021‐05 151
Development of ancillary facilities along with the ship/ barge resting facilities. Opportunities for locals for better employment. No additional burden on existing water and power supply. Commercial development of the locality Proper care monitoring of environmental parameters. Increase in aesthetic value due to project after completion
4.5.2.2. ADVERSE IMPACTS
Assessment has been made of the adverse impacts due to the project. These could be during construction and / or operation stages of the project. The details of the measures to be adopted including mitigative measures have been mentioned in this chapter.
4.6. IMPACTS DURING CONSTRUCTION PHASE
4.6.1. AIR QUALITY
The proposed project involves the construction of jetty followed by reclamation, dredging, use of DG sets and various construction equipment which leads to dust emissions and gaseous emissions. The reclamation and dredging activity will have impact on air quality due to running of cranes, dredgers etc. and DG sets.
Major emissions would be limited to the wind‐blown dust due to the movement of vehicles and construction equipment as well from exhaust from vehicles, machinery, DG set and ships. Hence, the potential impact on air environment during the construction phase would be marginal.
Impacts
Loading un‐loading of raw‐materials, dredging, reclamation and other construction activities shall impact the air environment. However this will be a temporary and short duration, reversible impact. Moreover proper mitigative measures shall be followed during the construction phase.
Dust will be generated from construction activities and the airborne cement particles can degrade air quality.
Emissions from the construction equipment used for activities like reclamation, boring, pilling and dredging may contribute to deterioration of air quality.
DG sets will be operated in case of any power failure which may contribute to emissions. Emission of gases from equipment deployed during construction.
Impact also includes accidental leakage of emissions, exposures, fumes, odors, hazardous airborne emissions and water front industries.
Mitigation measures
The project proponent shall adopt dust settlement mechanisms by way of a water sprinkler system while conducting construction activities.

EIA for proposed jetty at Korlai River and expansion of existing jetty at Sanegaon by Indo Energy
International Ltd.
TEPL/ENV/CBS/2021‐05 152
The project proponent shall take ample measures to ensure that all vehicles (construction machineries, ships, boats, trucks etc.) involved in the construction of the proposed project are regularly serviced and maintained in order to minimize the generation of dust and other pollutants.
Restriction of vehicle movements and vehicle speeds to reduce dust emissions. General housekeeping practices and regular maintenance of equipment and machinery
will be done. Effective system of dust control shall be installed during handling and storage of coal. No construction material except piles and other support structures will be permitted into
waterway during construction phase. Wind sheltering with help of barriers shall be installed during the stock piling activity. The
raw‐material storage shall be temporarily covered as far as possible with adequate covering material such as plastic, tarps etc.
Green belt will be developed hence vegetation cover will act as a barrier for any penetration of air quality and odor in the nearby area also institutional arrangements will be proposed with other agencies for effective implementation of environmental measures, applicable environmental standards and compliance.
This vegetation cover will act as a barrier for any penetration of air quality and odor in the nearby area.
Approach roads will be covered with green belt on both the sides to avoid any air quality problems to the nearby residents.
Signboards will be put along the approach roads and at project Site requesting motorists to avoid idling or/and stoppage of the vehicles at non‐designated places.
4.6.2. NOISE QUALITY
Construction activities may create a problem of noise and vibration generated by construction equipment, truck traffic, work vessels and other similar sources. The principle source of noise along the project area is expected from vehicles. Since there is smooth movement without any obstruction and proper dispersion, there will not be any increase in the noise levels. However, noise levels on the existing roads are expected to be reduced considerably.
Impacts
Construction activities will have major impact on noise environment. The major sources of noise pollution during construction phase would be operation of
equipment engaged in various construction activities. The expected noise sources during construction phase are listed in table below
Noise Source during Construction Phase
Activities Equipment

EIA for proposed jetty at Korlai River and expansion of existing jetty at Sanegaon by Indo Energy
International Ltd.
TEPL/ENV/CBS/2021‐05 153
Dredging Construction crane, haul truck, excavator, dozer and dredger. oard engines, propellers and thrusters
Reclamation piling for the berth and from construction equipment including trucks and dozers
Foundation Excavator, Concrete Mixer, Roller / Compactor etc.Others Horn / Siren, DG Sets, Compressor Motors, Pumps
Dredging process consists of a number of noise emitting activities which were grouped under sediment excavation, sediment transport and placement of sediment (dredged materials) for back filling.
Noise would be generated during transportation, loading and unloading of raw materials, use of DG sets.
Mitigation measures
All construction equipment shall be fitted with exhaust silencer. Damaged silencer to be promptly replaced by the contractor.
Ready mix concrete will be used for any concrete work so that batching plant etc. will not be installed at site. This will totally reduce noise generation from this important construction machinery.
Proper maintenance of equipment shall be undertaken with the provision of enclosures and intake silencers.
DG sets, if used, shall adhere to the noise and air emission standards of MoEF & CC. Construction works will be undertaken in the agreed working hours. Construction
activities involving generation of high noise shall be avoided between 10 pm and 6 am in the residential and sensitive areas.
Personal protective equipments will be given to the workers working in the areas of high noise generation.
Continuous Noise monitoring will be carried out during operational phase to collect comparative data.
Transmission of noise and vibration are limited by the distance from their sources. Noise could be considerably reduced by adoption of low noise equipment or installation of sound insulation fences. Green belt shall also attenuate the noise levels.
For the pilling activity hydraulic or manual pilling equipment will be put to use.
4.6.3. WATER QUALITY
The project site is located at latitude 18° 32' 9.66” N and longitude 72° 54' 54.88” E & latitude 18° 32' 11.82” N and longitude 72° 55' 11.71” E on the left bank of the Kundalika River.

EIA for proposed jetty at Korlai River and expansion of existing jetty at Sanegaon by Indo Energy
International Ltd.
TEPL/ENV/CBS/2021‐05 154
Revdanda port lies in the estuary of Kundalika River. The estuary entrance is protected by a peninsula on west side of entrance on which the Korlai Fort is situated.
A water storage system to meet the demands of the proposed facilities can be created with a connection from the main supply line of MIDC & other irrigation department. This in‐turn can be distributed to other parts of the site and its associated facilities.
Anticipated Impacts
Sea water quality will be affected during the dredging and piling activities which will lead to increase in turbidity and disturbance of water column
Site specific pollution of sea water due to seepage of oil/grease from construction equipment due to leakage or accidental spillage is envisaged.
Heavy metal pollution due to entry of various metal pieces emanating from equipment/ chemical etc. during construction phase.
Construction activities may disturb the navigation of other ships in the proposed project area.
Mixing of storm water may increase levels of oil and grease in the sea water Run‐off of sewage water generated due to labour camp or water used for hydraulic
testing may mix with sea water and further contaminate the same. Mitigation measures
Dredging will be undertaken in a manner that uses the best practicable available technology to minimize impacts on the site or adjacent area. The dredged material will be pumped up carefully such that less dispersion of sediment occurs. The dredged material will be reused for reclamation as much feasible and the rest of it will be disposed off in deep sea.
During construction period, suitable barrier will be used to protect the adjoining water bodies from the falling earth materials and dust raised to avoid sedimentation.
Removal of contaminated sediments, capping, as well as periodical beach nourishment could be effective measures against adverse effects on water quality.
All diesel and motor oil stored on the site will be stored in bounded area away from the shore. Signs will be posted indicating the storage of these substances. Also, intercepting drains around the site of construction and designated places for the machines where refuelling and change of lubricants shall be carried out.
To avoid pollution due to heavy metals it is proposed to use pre‐cast material wherever possible so as to avoid any mixing of run‐off water with storm water drain during construction.
Navigational aids such as channel beacons, buoys will be provided during construction phase for other proper movement of other ships.
Adequate storm water drainage will be provided all along the project area. Oil Traps will be installed in the storm water drainage in order to remove any oil & grease matter

EIA for proposed jetty at Korlai River and expansion of existing jetty at Sanegaon by Indo Energy
International Ltd.
TEPL/ENV/CBS/2021‐05 155
caused due to run‐off. The surface run off shall be made to pass through oil and grease cum sedimentation chamber.
Installations of lavatory for construction workers at a minimum distance of 200 m from water bodies and provision for composting the domestic refuse will be done. Also, sewage generated from labour camp will be conventionally treated in Sewage Treatment Plant and therefore avoid mixing with surrounding environment.
Use of environmental friendly degreasers and detergents will be promoted. Water used for hydraulic testing will not be allowed to mix with any of the water body
and will be disposed off through drainage system of local authority. No impacts on ground water quality and its availability are anticipated as a result of the proposed actions at the sites.
4.6.4. LAND ENVIRONMENT
The solid wastes will be generated in the form of dredged material during construction and dredging activities. There will be certain impacts on land environment due to the proposed developmental activity. During construction phase slight impact on the land environment is envisaged because of constructional activity and dredge material disposal management. Baseline sediment analysis for the project has been incorporated in chapter 3, which shows adequate amounts of nutrients in the sediment quality. Greenbelt development within and around the project site will help in improving the ecology and aesthetic value of the area. The planted trees will absorb specific air pollutants, reduce noise pollution, control soil temperature, help for holding moisture in soil, attract more birds and will help in maintaining the overall environmental quality.
Anticipated Impacts
Disposal of solid waste from labour camps and construction activities may lead to soil contamination, thereby disturbing soil micro‐flora.
Disposal of dredged material on the land area may lead to soil degradation. Storage of raw material on land may lead to accidental spillage of oil or run‐off due to rain
water. Mitigation measures
Proper solid waste disposal management will be done during the construction phase. Color coded containers will be provided for solid waste collection. Also, toilets will be provided to avoid open defecation.
All the construction waste debris will be collected and segregated at site before disposal. The re‐usable construction solid waste shall be reused for land filling and reclaiming activities, rest shall be disposed off as per existing local norms.

EIA for proposed jetty at Korlai River and expansion of existing jetty at Sanegaon by Indo Energy
International Ltd.
TEPL/ENV/CBS/2021‐05 156
The dredged material generated during maintenance dredging will mainly consist of soft silty clay which shall be reused for reclamation and remaining waste will be disposed off in deep sea at designated site.
Oil and fuel will be stored in separate bunkers. Proper maintenance of the construction and dredging equipment will be done to avoid spillage or leakage of oil or other greasy material on the land environment.
4.6.5. TOPOGRAPHY SOIL AND GEOLOGY
Project is located in Korlai & Sanegaon village, Tehsil Murud & Roha, Dist. Raigad, on the left bank of Kundalika River. The existing land under consideration falls in CRZ area. Good drainage facilities are available in the form of Sewage Treatment Plant. The dredged material generated dredging will mainly be reused for reclamation and remaining waste will be disposed off in deep sea.
Mitigation Measures
Green belt of proper size and shape will be developed to increase the aesthetic value of the project.
The dredged material shall be either re‐used during land reclamation or disposed off in deep sea in the identified location.
Reclamation bunds shall be constructed. Approach bund and temporary road will be constructed for reclamation purpose.
Adequate ground treatment is proposed after reclaimed land. The construction and building materials will be taken only from selected/ approved/
licensed borrow area to avoid any adverse effect in the area. Cutting material will be utilized for earthwork filling requirement.
Design of all structures will take the area’s seismic characteristics into account.
4.6.6. RESERVED FOREST AND FAUNA
The project area does not fall under any of the reserved forest area. There are no endangered species of flora and fauna within the project area, neither any endemic flora nor fauna species are found in the adjoining area. Wild life activity is also absent in the area.
Mitigation Measures
During construction all the care will be taken to preserve existing flora and fauna The loss of these will be compensated as per the standards norms and practice.
4.6.7. LAND USE
The project area on the landside consists of main & arterials roads including commercial establishments. No agricultural or forestland is involved. The existing approach arterial roads will

EIA for proposed jetty at Korlai River and expansion of existing jetty at Sanegaon by Indo Energy
International Ltd.
TEPL/ENV/CBS/2021‐05 157
not be altered during pre and post development. Stone rubble, aggregate etc. is to be procured from existing authorized quarries.
Mitigation Measures
Development of any land will be in accordance with the government regulations. Care will be taken to ensure that the construction worker’s camp doesn’t disturb the
surrounding land use pattern. The care will be taken to avoid cutting of any vegetation and if any portion is cut for any
purpose it will be restored and replanted according to the standards norms. Proper navigational channels will be provided during construction phase and dredging
activity. Reclamation bunds shall be constructed. Approach bund and temporary road will be
constructed for reclamation purpose. Adequate ground treatment is proposed after reclaimed land.
4.6.8. IMPACTS ON UTILITY SERVICES AND COMMUNITY SEVERANCE
Utility lines like electric poles, telephone poles, transformers high and low tension electric lines and telephone lines which may be affected by project, if any, will be identified with respect to their locations in the project area. Community severance and sensitive receptors like religious places community centers schools, inhabitant centers and cattle crossing location etc. will be taken in to consideration during construction phase.
4.6.9. MARINE ENVIRONMENT
The marine environment and biodiversity includes the fishes, benthic flora‐fauna and other marine organisms which may be affected by the proposed project activity. Since the proposed project comes in the inter tidal region of the Revdanda creek
Anticipated Impact:
The capital dredged and the disposal site of dredged material temporary biological impacts depending on the prevailing flora and fauna at the sites, areas involved and dredging duration
Water turbidity and aqueous discharges (oily wastes, sanitary wastes) from the dredgers, barges and workboats involved in the activity may affect photosynthetic activity which restrict to plankton food production
Macrobentos at the footprints of new construction will be lost permanently. Water runoff from construction activity may affect intertidal habitat.
Due to construction activity mangrove habitat may little disturb in vicinity of the project site.

EIA for proposed jetty at Korlai River and expansion of existing jetty at Sanegaon by Indo Energy
International Ltd.
TEPL/ENV/CBS/2021‐05 158
Mitigation Measures:
Dredging will be confined to only those areas earmarked for the purpose to limit the impact and the dredged sediment will be carefully disposed at pre‐decided sites at shore terminal area or used in construction
During construction period, suitable barrier will be used to protect the adjoining water bodies from the falling earth materials and dust raised to avoid sedimentation.
Fresh surface area of the newly constructed underwater structures would provide new habitats for selected benthic fauna to colonize and grow. However macrobenthos will be periodically studied to enable taking corrective measures, if warranted
Contractor should take care to stop run‐off water enter in intertidal area. Mangrove management plan has been sketched out for the conservation of mangroves
in the marine ecosystem at or in vicinity of the project site.
4.6.10. IMPACTS DURING OPERATION PHASE
4.6.10.1. Positive impacts of the proposed project
Any developmental project related to infrastructure and community development would have its own impacts on various parameters. These impacts, besides moderate on environment during construction phase, may also have sustainable positive impacts. The said project certainly has certain positive impacts on socio‐economy as well as environmental factors. The social impact will include additional employment and commercialization of the area. The project will also enhance aesthetic look of the area.
4.6.11. AIR QUALITY
The proposed not involve any major impact on air quality of the area; however various activities related to proposed facility may cause negligible impact on air quality of the area. Ambient air quality at all the sites was monitored for baseline conditions. The proposed project operations such as loading, unloading of ships, ship fuelling activities and ancillary activities shall generate dust emissions and VOC’s. Particulate emissions will be generated from loading and unloading operations. Moving of vehicles shall also emit small amount of vehicular pollution.
Anticipated Impacts
Air quality may impact while loading, unloading and transportation of coal. The major activities envisaged in the proposed project is fugitive emissions from the cargo
loading and unloading activities. Emissions from DG sets, navigational equipment/machinery. During operation phase over‐fueling or careless fuelling practices may also lead to
impacts on air quality of the project site area.

EIA for proposed jetty at Korlai River and expansion of existing jetty at Sanegaon by Indo Energy
International Ltd.
TEPL/ENV/CBS/2021‐05 159
Mitigation measures
Effective system of dust control shall be installed during handling and storage of coal. Water spray or sprinkler system will be provided at the barge unloader, coal stacks and
truck loading station. Regular monitoring of air quality as mentioned in EMP will enable to keep the air quality
below permissible standards The exhaust emissions from ships/vessels shall be controlled on the ship itself by
providing long stacks with air emission control option such as sea‐water scrubbing and fuel substitution.
Day to day management and maintenance of the facility and the ancillary structures. D.G Set will be used only in case of emergency with proper enclosures in order to reduce
the impact of air emissions. Control and check will be kept on careless fuelling of the ships if any and excessive
trafficking of the ships at one place. This vegetation cover will also act as a barrier for any penetration of air quality and odour
in the nearby area. Approach roads will be covered with green belt on both the sides to avoid any air quality
problems to the nearby residents. Road Furniture / Signboards will be put along the approach roads and at project building
requesting motorists to avoid idling or/and stoppage of the vehicles at non‐designated places.
4.6.12. NOISE QUALITY
Major noise generating sources are loading and unloading of cargo, equipment handling and vehicular movement.
Mitigation measures
Noise barriers in terms of vegetation cover wherever required will be used for attenuation of noise.
Signboards will be put along the approach roads and at terminal building requesting motorists to avoid unusual use of horns and also for avoiding idling noise.
Major Noise generating equipment will be designed such that the cumulative noise at a distance of 1 m remains 80 dB(A), by giving proper acoustic enclosures to such noise generating equipment’s and machinery.
The occupational noise exposures to the workers in the form of 8 hourly time weighted average will be maintained within the prescribed OSHA standard limits.
Workers exposed to excessive noise will be given appropriate PPE including ear plugs, muffs.

EIA for proposed jetty at Korlai River and expansion of existing jetty at Sanegaon by Indo Energy
International Ltd.
TEPL/ENV/CBS/2021‐05 160
Continuous noise monitoring will be carried out during operational phase to collect comparative data.
Proper maintenance of the equipment’s in terms of noise generation will carried out.
4.6.13. WATER QUALITY
The proposed project activities such as ship washing and surface run‐off during operation phase shall impact on the water quality of the area. The effluent ship parking facility and sewage water from the onsite support facilities shall impact on the water quality of the area. Proper mitigative measures are proposed for the treatment and disposal of waste water generated from the ship multipurpose terminal and berthing facility.
Anticipated impacts
The waste water generated due to sprinkling of water on coal stack may lead to water contamination.
The sewage generated from ships if not managed properly may lead to nuisance to local people and loss of aesthetic value of the area. Further aqueous discharges from vessels such as dumping of ship waste (sullage/ sewage), oil contaminated bilge water, holding cleaning and tank cleaning residues (slop), and spillages upon re‐fueling and lubricating oil changes and disposal of solid wastes may contaminate quality of sea water and sediment too.
Loading and unloading activities may lead to accidental spillage of material. Storm water drainage system may lead to increase in levels of oil & grease due to spillage
or leakage. Water used for hydraulic testing may mix with any of the water body.
Mitigation measures
The waste water generated due to sprinkling of water on coal stack shall be collected and treated in clarifier; the treated water shall be reused for sprinkling purposed while the dust will be sent to coal stack.
The sewage will be treated in the Sewage treatment plant and the treated water shall be utilized in landscaping and dust suppression, whereas the sludge shall be used as manure.
The sewage from the ships will also be treated within the ships and hence there will be no risk of contamination of surface or groundwater as a result of the effluent or waste discharge from the ships when within the port area.
Ships will not be allowed to release any oily bilge waste or ballast water in the sea within port limits and hence wastes from the ships will also not affect any surface or groundwater according to the International Convention for the Prevention of Pollution from Ships, 1973, as modified by the protocol of 1978 (MARPOL, 73/78),
Aqueous discharges from vessels and disposal of solid wastes will be regulated to minimize impact on marine water and sediment quantity.

EIA for proposed jetty at Korlai River and expansion of existing jetty at Sanegaon by Indo Energy
International Ltd.
TEPL/ENV/CBS/2021‐05 161
Due care will be taken such that no water pollution/ contamination occurs during loading and unloading activities.
The runoff from the slipway, berths, etc will be collected and treated into the effluent treatment plant.
Proper storm water drainage system with adequate oil & grease traps shall be incorporated in order to remove any spillage/ leakage/ runoff of oil and other wastes in sea water.
Water used for hydraulic testing will not be allowed to mix with any of the water body and will be disposed off through drainage system of local authority.
Alternatives for reducing waste include oil/water separation and waste oil reclamation will also be considered
4.6.14. LAND ENVIRONMENT
Since the proposed project deals with ship loading, unloading and berthing facility there will not be any major hazardous waste generation on site. The solid waste generated on the facility will be collected, segregated. Recycle bale waste will such as paper, glass metal etc. will be sold to authorise vendor and remaining waste will be disposed off to the local municipal authority. Major issues like oil spillage and refuelling will be handled carefully and proper solid/hazardous waste management will be implemented.
Anticipated Impacts
Oily wastes and dredged material removed during maintenance dredging may lead to contamination of land environment.
Solid waste generated may contaminate the area and lead to foul smell if not maintained well.
Mitigation measures
Dredged material removed during maintenance dredging will be disposed off in deep sea at designated area.
Solid waste will be segregated into recyclable, degradable and non‐degradable at site itself. The recyclable waste will be either reused or given to authorize end‐users, whereas remaining solid waste shall be handled to local municipal authority.
4.6.15. ECOLOGICAL RESOURCES AND FLORA AND FAUNA
There will be no significant impact of the project on flora and fauna and other vegetation due to any of the pollution parameters during operational phase of the project. No significant impact is envisaged on the local terrestrial flora fauna during the operational phase of the project. Since there are no reserved forests or forest area in the project area, there will not be any violation of flora and fauna.
EIA for proposed jetty at Korlai River and expansion of existing jetty at Sanegaon by Indo Energy
International Ltd.
TEPL/ENV/CBS/2021‐05 162
Negligible Impact on marine flora fauna is envisaged due to navigation of ships, loading unloading of cargos, run‐off water from the refueling stations etc. However, proper mitigative measures will be taken to minimize the impacts due to the operation of the proposed project. Green belt development will help in attenuating any pollution caused during the operation of the proposed facility.
Mitigation measures
Criss‐cross drainage system installed with oil & grease traps, channelized into main storm water drainage will be incorporated in so as to ensure all the run‐off water is treated and channelized into storm water drainage leaving no run‐off water going directly into sea.
The waste water generated due to sprinkling of water on coal stack shall be collected and treated in clarifier; the treated water shall be reused for sprinkling purposed while the dust will be resend to coal stack.
The route of navigation of ships will be designed such that the fishery in the nearby area will not be affected.
The navigational route will be designed keeping in mind the mangrove patches in the farther end of the creek such that the water currents towards the mangroves will be least affected.
The sewage from the ships will also be treated within the ships and hence there will be no risk of contamination of surface or groundwater as a result of the effluent or waste discharge from the ships when within the port area.
Ships will not be allowed to release any oily bilge waste or ballast water in the sea within port limits and hence wastes from the ships will also not affect any surface or groundwater.
Aqueous discharges from vessels such as dumping of ship waste (sullage/ sewage), Oil contaminated bilge water, holding cleaning and tank cleaning residues(slop), and spillages upon re‐fueling and lubricating oil changes and disposal of solid wastes will be regulated to minimize impact on marine water and sediment quantity.
4.6.16. LAND USE
The land use pattern, which will undergo slight changes, will not be further altered during operational phase. The land use covered under green belt will be maintained during operational phase. The commercial activities may increase on the land ward side with proper layout and permission from local authorities. The aesthetic look of the said land use will be enhanced by green belt & other signage with proper architectural plans.
Mitigation measures
A green strip of local trees on both sides of the road will be planted on the approach roads Tree loss due to access roads, if any, will be mitigated by tree planting programs at the
ratio of 1:2, i.e. two tree plantations for one tree cutting.

EIA for proposed jetty at Korlai River and expansion of existing jetty at Sanegaon by Indo Energy
International Ltd.
TEPL/ENV/CBS/2021‐05 163
4.6.17. OIL SPILLS:
Oil spills are an unlikely phenomenon in this harbour. In the unlikely event of leakage of fuel from the ships, this may cause damage aquatic biology and near‐by mangrove communities by coating roots, limiting the transport of oxygen to the underground roots. However, proper mitigative measures will be in place to avoid any such oil spillage. Oil spill Contingency Plan has also been sketched out in order to reduce the impact of oil spillage.
Mitigation measures:
The used oils and lubricants will be collected in drums from the equipment such as diesel engines; compressors etc. and either re‐used or will be sent to MPCB authorized recyclers.
The ship terminal will have a wastewater treatment plant with oil and grease trap wherein all the waste water will be channelized.
Oil traps will be installed in the storm water drainage in order to remove any oil & grease matter caused due to run‐off. The surface run off shall be made to pass through oil and grease cum sedimentation chamber.
Intercepting drains around the site of construction and designated places for the machines where refueling and change of lubricants shall be carried out.
4.6.18. MANGROVE:
The proposed developmental activity may impact the mangrove community downstream of the project site. There are no mangroves in the area under reclamation; hence no direct destruction of mangroves is envisaged due to the development.
Direct loss of mangroves is associated with the damage or removal of mangrove due to the proposed project. Since the proposed project layout for port facilities is located on a reclaimed area connected to shore damage is minimized. There shall be no direct loss of mangroves since the proposed project area is beyond the mangrove patch.
Mitigation Measures:
No direct loss of Mangroves is envisaged, however proper care shall be taken in case of any loss.
Optimum layout at the entrance to the creek is envisaged by proper assessment of all the alternatives such that, minimal disturbance shall be caused to the tidal currents towards the creek.
Mangrove mapping shall be done before carrying out the construction activity as a measure to preserve the mangrove community.

EIA for proposed jetty at Korlai River and expansion of existing jetty at Sanegaon by Indo Energy
International Ltd.
TEPL/ENV/CBS/2021‐05 164
In case of any direct loss caused to the mangroves, if any, the same shall be replanted in the nearby area by beach nourishment and safe transportation of the affected mangrove species.
4.6.19. DREDGING AND DREDGED MATERIAL MANAGEMENT ACTIVITIES:
During operation phase there is no major effect seen on water body and aquatic biology (plankton, benthos, fish and nearby mangrove habitat)
Mitigation Measures
Environmental friendly dredging techniques which are designed to dredge with a minimum of turbidity such as Environmental disc‐cutter “Vetch” can be used. Here the cutter is provided with a closed, adjustable visor system. Turbidity‐free dredging of high‐density mixture concentrations is achieved with the aid of a process control system through which the position of the visor and the suction flow can be regulated. .
The maintenance dredged material will be pumped up carefully such that less dispersion of soil occurs. The dredged material will be reused for reclamation as much feasible and the rest of it will be disposed in deep sea at designated location.
4.6.20. IMPACTS ON QUALITY OF LIFE
Socio‐Economic Condition
The socio‐economic scenario in the region will certainly change with positive impact on the existing regional socio‐economic pattern. There will be change in employment pattern with local residents will be given preference for jobs opportunities and/or self‐employment. The economic growth will have positive impact; it will also help in increase in living standards of the local residents. Due to enhancement in infrastructure facilities and utilities in living condition will also improve. It will have positive effect on industrial sector in the area.
Accident hazards and safety
During operational phase accidents / hazards will be greatly minimized and ensure further safety of the local people. In addition, by adopting mitigation measures will ensure an efficient traffic system with high standards of safety. Onsite and Offsite Emergency Preparedness Plan as well as Disaster Management Plan have been sketched out and shall be implemented. The Risk analysis for the proposed project is also carried out.
Aesthetics and landscape
The landscaping and tree plantation with regular monitoring will greatly enhance aesthetic beauty. The proposed ship terminal along with its ancillary structures will add to the existing aesthetic beauty of the area. A detailed Green Belt Plan will be encouraged during operational phase.
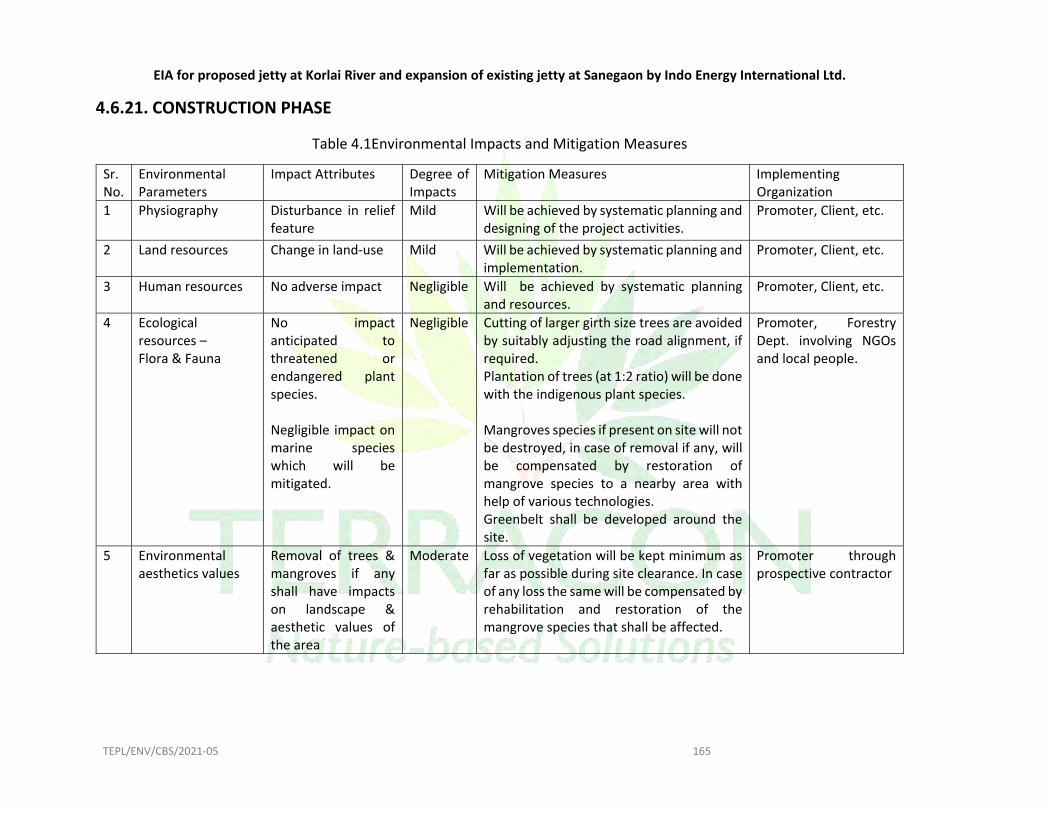
EIA for proposed jetty at Korlai River and expansion of existing jetty at Sanegaon by Indo Energy International Ltd.
TEPL/ENV/CBS/2021‐05 165
4.6.21. CONSTRUCTION PHASE
Table 4.1Environmental Impacts and Mitigation Measures
Sr. No.
Environmental Parameters
Impact Attributes Degree of Impacts
Mitigation Measures Implementing Organization
1 Physiography Disturbance in relief feature
Mild Will be achieved by systematic planning and designing of the project activities.
Promoter, Client, etc.
2 Land resources Change in land‐use Mild Will be achieved by systematic planning and implementation.
Promoter, Client, etc.
3 Human resources No adverse impact Negligible Will be achieved by systematic planning and resources.
Promoter, Client, etc.
4 Ecological resources – Flora & Fauna
No impact anticipated to threatened or endangered plant species. Negligible impact on marine species which will be mitigated.
Negligible Cutting of larger girth size trees are avoided by suitably adjusting the road alignment, if required. Plantation of trees (at 1:2 ratio) will be done with the indigenous plant species. Mangroves species if present on site will not be destroyed, in case of removal if any, will be compensated by restoration of mangrove species to a nearby area with help of various technologies. Greenbelt shall be developed around the site.
Promoter, Forestry Dept. involving NGOs and local people.
5 Environmental aesthetics values
Removal of trees & mangroves if any shall have impacts on landscape & aesthetic values of the area
Moderate Loss of vegetation will be kept minimum as far as possible during site clearance. In case of any loss the same will be compensated by rehabilitation and restoration of the mangrove species that shall be affected.
Promoter through prospective contractor

EIA for proposed jetty at Korlai River and expansion of existing jetty at Sanegaon by Indo Energy International Ltd.
TEPL/ENV/CBS/2021‐05 166
Sr. No.
Environmental Parameters
Impact Attributes Degree of Impacts
Mitigation Measures Implementing Organization
6 Utility & infrastructural facilities
Removal of utility line like electrical poles, telephone poles, transformer, HT & LT lines, if any
Moderate Shifting and elevation of utility lines will be done in consultation with concerned Government Organizations.
Promoter, telecommunication dept. & line dept. of GoM.
7 Sub‐surface hydrology
No wells and hand pumps are existing in project area
Negligible Whenever possible, care is taken to avoid its relocation by judicious engineering road design. Temporary alternative water sources will be provided in case drinking water means are affected.
Promoter through prospective contractor
8 Religious places ‐‐‐‐‐ ‐‐‐‐ ‐‐‐‐‐‐‐‐‐‐‐‐‐‐‐ ‐‐‐‐‐‐‐
9 Geology Not much affected Negligible Systematic planning and implementation during the construction and dredging. Reclamation will be done with systemic planning and least disturbance to the natural geology.
Promoter through prospective contractor
10 Surface of water Contamination from solid wastes and sewage generated due to construction labour camp Surface runoff from the ship terminal and parking facility.
Mild Installations of lavatory for construction workers at a minimum distance of 200 m from water bodies and provision for composting the domestic refuse.
Promoter through prospective contractor

EIA for proposed jetty at Korlai River and expansion of existing jetty at Sanegaon by Indo Energy International Ltd.
TEPL/ENV/CBS/2021‐05 167
Sr. No.
Environmental Parameters
Impact Attributes Degree of Impacts
Mitigation Measures Implementing Organization
11 Air quality Short‐term deterioration of air quality due to generation of fugitive dust. Dredging activities and other construction activities leading to fugitive emission.
Moderate Trucks carrying soil, sand, stone, will be covered to avoid spilling. Fugitive dust sources will be sprayed with water to suppress dust. Emissions from vehicles & machinery will be checked regularly & maintained properly to confirm to National and State Emission Standards Barriers during construction activities such as dredging will be installed.
Promoter through Prospective Contractor (PC)
12 Noise level Increased noise levels due to project activities
Mild All the equipments will be duly lubricated, maintained in good working condition to minimize noise levels. Stationary construction equipments will be placed as far as possible from dense habitation. Green belt barrier. Provision of protection devices (ear plugs) to be provided to the workers operating in the vicinity of high noise generating machineries.
Promoter through Prospective Contractor (PC)
13 Ecological resources – Flora & Fauna
No endangered species found
Negligible Proper care will be taken to maintain eco‐balance.
Promoter through Prospective Contractor (PC)
14 Land use Land acquisition is as per the government regulation and policy. Mild impacts on local land use may be visualized
Mild Proper management planning will be achieved.
Promoter through Prospective Contractor (PC)

EIA for proposed jetty at Korlai River and expansion of existing jetty at Sanegaon by Indo Energy International Ltd.
TEPL/ENV/CBS/2021‐05 168
Sr. No.
Environmental Parameters
Impact Attributes Degree of Impacts
Mitigation Measures Implementing Organization
15 Construction workers camp
Impacts on community health
Mild Supply of safe drinking water to the construction camp. Provision of adequate drainage system to avoid undesirable water logging. Provision of hygienic facilities to construction workers camp is made. A system of regular disposal of domestic waste & sewage.
Promoter through prospective contractor (PC)
16 Accident hazards and safety
Short term impacts from road accidents. Impacts from accidents during handling and use of Construction machinery.
Mild Proper traffic diversion and management during construction. Construction Safety measures will be employed. Proper warning signs will be used at construction site.
Promoter through prospective contractor (PC)
4.6.22. OPERATION PHASE
Table 4.2Environmental Impacts and Mitigation Measures
Sr.
No.
Project Related Issues Actions to be Taken Responsible Organisation
1 Prevention of Road side Squatters or indirect Urban Sprawls
Involve land use planning agencies like the Revenue Department at all levels during operation stage.
Plan and control development activity. Removal, cleaning of squatter and temporary hutments
of construction workers once construction activities has been completed.
P & C in consultation with the Municipal corporation.
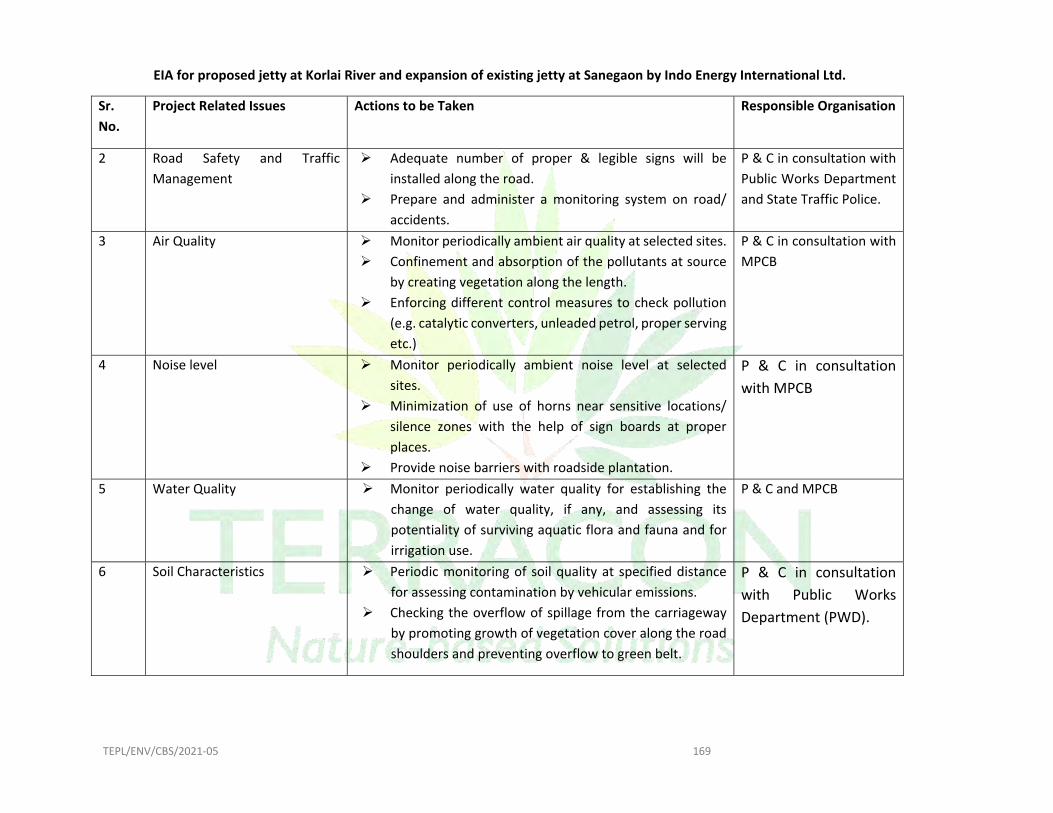
EIA for proposed jetty at Korlai River and expansion of existing jetty at Sanegaon by Indo Energy International Ltd.
TEPL/ENV/CBS/2021‐05 169
Sr.
No.
Project Related Issues Actions to be Taken Responsible Organisation
2 Road Safety and Traffic Management
Adequate number of proper & legible signs will be installed along the road.
Prepare and administer a monitoring system on road/ accidents.
P & C in consultation with Public Works Department and State Traffic Police.
3 Air Quality Monitor periodically ambient air quality at selected sites. Confinement and absorption of the pollutants at source
by creating vegetation along the length. Enforcing different control measures to check pollution
(e.g. catalytic converters, unleaded petrol, proper serving etc.)
P & C in consultation with MPCB
4 Noise level Monitor periodically ambient noise level at selected sites.
Minimization of use of horns near sensitive locations/ silence zones with the help of sign boards at proper places.
Provide noise barriers with roadside plantation.
P & C in consultation with MPCB
5 Water Quality Monitor periodically water quality for establishing the change of water quality, if any, and assessing its potentiality of surviving aquatic flora and fauna and for irrigation use.
P & C and MPCB
6 Soil Characteristics Periodic monitoring of soil quality at specified distance for assessing contamination by vehicular emissions.
Checking the overflow of spillage from the carriageway by promoting growth of vegetation cover along the road shoulders and preventing overflow to green belt.
P & C in consultation with Public Works Department (PWD).

EIA for proposed jetty at Korlai River and expansion of existing jetty at Sanegaon by Indo Energy International Ltd.
TEPL/ENV/CBS/2021‐05 170
Sr.
No.
Project Related Issues Actions to be Taken Responsible Organisation
7 Maintenance of Avenue trees Plantation will be undertaken by the concession company on an aggressive note along the whole stretches on the both sides of the road.
Restoration of Mangroves if any will be done adequately with proper technology.
P & C in consultation with authorities and State forest Department
8 Human Health and Safety Vulnerable stretches, which are prone to accidents, will be identified.
Adopt Safety measures and other control measure during Operation of the facility. Installing proper road signs, marking along the whole
stretch of the tolled highway in the form of cautioning, informatory and mandatory signs of gantry mounted overhead sizes.
Installing fire safety measures, electrical safety measures, Personal protective Equipments and other work‐safety measures.
Incorporation of On‐site Emergency Preparedness, Off‐site Emergency Plan, Disaster Management Plan
P & C in consultation with MPCB. State Public Health Works Department (PWD)

EIA for proposed jetty at Korlai River and expansion of existing jetty at Sanegaon by Indo Energy
International Ltd.
TEPL/ENV/CBS/2021‐05 171
4.6.23. Evaluation of impacts
The Environment impact of the project has been discussed in this chapter and the potential of the impact is mainly under the construction and operational phase. The type and magnitude of the impact is entirely site specific.
4.6.23.1. Impacts from Project Location
Project location plays an important role in prevention of adverse impacts and to minimize the mitigative measures. These measures can be classified as follows: ‐
Through Engineering Design Through project Scheduling Through Tree Planting Through Rehabilitation & Resettlement Planning or through property constructed and maintained
labour camps. Through post construction by providing facilities other Government, Departments and agencies
to watch, monitor, enforce environment standards.
All this is presented in individuals tables
4.6.24. Evaluation of impacts
Evaluation of impacts has been done for following issues namely: Environmental Impact due to project location Environmental Impact from construction camps Environmental Impact from road construction phase Environmental Impact from Operation phase.

EIA for proposed jetty at Korlai River and expansion of existing jetty at Sanegaon by Indo Energy
International Ltd.
TEPL/ENV/CBS/2021‐05 172
Table 4.3 List of possible environment impacts due to proposed project
Sr. No. Attributes Proposed
Development
Impact Marks
Mitigative measures
1 Project Location 2 Change in land use pattern 2 Soil Slippage 1 Proper soil engineering and foundation
designs and structural protection 3 Rock Quarrying 1 Material will be obtained from authorized
agencies 4 Air quality 2 Provision of adequate monitoring during
operational phase, no changes in this line during construction period due to proper mitigative measures.
5 Water Quality 2 Sewage Treatment Plant (STP) and Effluent treatment plant (ETP) during operational phase.
6 Noise Quality
2 Proper noise control management plan during construction period, noise barriers in terms of thick vegetation proposed.
7 Land use 2 The land use pattern shall change after the proposed project.
8 Reduction in built habitation of structures
1 Not Applicable
9 Displacement of population
0 No encroachments or settlements.
10 Heritage / Archaeology 0 No such structures within the project area. 11 Socio ‐ economy 1 Better employment opportunities,
improved economic status, increase in commercial and business opportunity.
12 Loss of Environmental Aesthetics
1 Proposed project will cause changes in the existing Land use of the site, however, enhancement in the environmental settings envisaged.
Note: The total negative impact is only 14 where severe most could have been 5 x 12 = 60. So negative impact is 23% to positive impact is 77%.As the total positive impact of the project is 77, therefore, it can be concluded that this is an environment friendly project.

EIA for proposed jetty at Korlai River and expansion of existing jetty at Sanegaon by Indo Energy
International Ltd.
TEPL/ENV/CBS/2021‐05 173
Chapter5Alternative
Analysis

EIA for proposed jetty at Korlai River and expansion of existing jetty at Sanegaon by Indo Energy
International Ltd.
TEPL/ENV/CBS/2021‐05 174
5. ALTERNATIVE ANALYSIS The proposed project is to develop Deep Water Jetty facility on Kundalika River, village Korlai, district Raigad, Maharashtra and capacity expansion at existing Inland Water Jetty Facility, on Kundalika River at village Sanegaon, district Raigad, Maharashtra.
This study of preliminary nature was carried out for selection of the project site of proposed deep water jetty. The preliminary study of alternatives was carried out, considering both inner and outer locations on Kundalika River and three locations on the same shore where selected. All of the 3 locations where selected in such a way that river and tidal flow was not affected. The three locations were drawn within same onshore area, so that all of them had the same capacity and they were comparable. The road accesses also all the location where also considered. All the site alternative are represented in Figure 5.1
Figure 5.1 Possible locations of the port
A multi‐criteria analysis of the three locations is presented in Table 5.1. The figures between brackets [ ] represent the evaluation of each location for each aspect according to the following criteria:
3 = positive 2 = medium 1 = negative

EIA for proposed jetty at Korlai River and expansion of existing jetty at Sanegaon by Indo Energy
International Ltd.
TEPL/ENV/CBS/2021‐05 175
Table 5.1 Multi‐criteria analysis of the three port locations
Criteria Location 1 Location 2 Location 3 Technical aspects
Score Technical aspects
Score Technical aspects
Score
Need of breakwater
Yes [1] Yes [1] No [3]
Need of dredging
High [2] Low/Medium [3] Medium [1]
Road connection
Easy and cheap (short)
[2] Difficult (dueto the topography & habitation)
[1] Easy and inexpensive (Very short)
[3]
Railway connection
Longer Route through habitation (Long)
[1] Very difficultand expensive (due to the topography
[1] Easy but expensive (long)
[2]
Possibility of extension
Easy and cheap
[3] Difficult and expensive
[1] Limited [2]
Criteria Environmental aspects
Score Environmental aspects
Score Environmental aspects
Score
Impact on beaches
Disappearance of 600 m beach
[1] Disappearance of 400 m beaches
[1] No effect [1]
Impact on estuary dynamics
Minimum [3] Minimum [3] Impact due to dredging
[1]
Impact on flora and fauna
Higher [1] Medium [2] Lower [3]
Social Impact
Higher [1] Closer to FortKorlai
[1] Least Impact as on reclaimed land
[3]

EIA for proposed jetty at Korlai River and expansion of existing jetty at Sanegaon by Indo Energy
International Ltd.
TEPL/ENV/CBS/2021‐05 176
Final
assessment [15] [13] [19]
From the Table 5.1, it was clear that the location no. 3 which is located inside the Revadanda creek is the most suited for the port, with minimum impact on the immediate environs and therefore ideal for port development.
EIA for proposed jetty at Korlai River and expansion of existing jetty at Sanegaon by Indo Energy
International Ltd.
TEPL/ENV/CBS/2021‐05 177
Chapter6:EnvironmentalMonitoringProgramme

EIA for proposed jetty at Korlai River and expansion of existing jetty at Sanegaon by Indo Energy
International Ltd.
TEPL/ENV/CBS/2021‐05 178
6. ENVIRONMENTAL MONITORING PROGRAMME
6.1. THE NEED
An Environmental Monitoring Plan provides a delivery mechanism to address the adverse environmental impacts of a project during its execution, to enhance project benefits and finally to introduce standards of good practice to be adopted. With the knowledge of baseline conditions, the monitoring program serves as an indicator for any deterioration in environmental conditions due to operation of the project, to enable taking up suitable mitigation steps in time to safeguard the environment. Monitoring is as important as control of pollution since the efficiency of control measures can be determined by monitoring.
Thus the Environmental Monitoring Plan subsequent to the project implementation indicates or otherwise if the project activities are being undertaken keeping with good industry practices. Evidently, the post‐project monitoring provides necessary feedback about the actual environmental impacts of the project activities and reveals whether the implementation of the EMP effectively support the suggested mitigation measures. Thus, periodic monitoring of designated environment‐related parameters is vital to assess the status of environment during the operational phase of any project.
Monitoring of different components of the environment including air, soil and water as well as flora and fauna wherever applicable is mandatory to meet regulatory permit requirements and to assess the performance of EMP implementation. The project proponent needs to report every six months on the progress of implementation of the conditions of the clearance. Expert team from the designated Regional Office may also visit the project site to ascertain the implementation of the conditions of clearance and also the EMP. Further, the SPCBs make it mandatory for the project proponent to meet the conditions of the clearance in addition to several other stipulations made while granting the Consent to Operate without which the proposed transport facility cannot be commenced.
Objectives of Environmental Monitoring Plan To define the responsibilities of the project proponents, contractors and
environmental monitoring personnel and provide means of effective communication of environmental issues among them.
To delineate monitoring mechanism and identify monitoring parameters. To assess validity of environment‐related predictions and evaluations made during
planning stage. To pinpoint deviations if any from the predicted impacts on the environment. To review the EMP and implement actions to remedy the situation, if required. To verify evaluations made during risk and impact assessments and measure
operational and efficiency of mitigation measures. To assess compliance with statutory and corporate requirements. To provide the basis for environmental audit.

EIA for proposed jetty at Korlai River and expansion of existing jetty at Sanegaon by Indo Energy
International Ltd.
TEPL/ENV/CBS/2021‐05 179
6.2. MONITORING PLAN
The project proponent will have a comprehensive approach towards the construction activities at site and the ensuing operations. Environment, Health and Safety (EHS) principles will be built into the design stages, which are followed when contracts are drafted for project management, operations and maintenance. While different agencies may be involved in executing and operating different aspects of the project, the developer has overall responsibility for the execution of the Monitoring Plan.
With reference to these, proponent will confirm that the contractor(s) during the construction and operation phases undertake(s) the implementation and adherence to plan that addresses impacts and mitigation measures. Adequate budgetary provisions will be made for fulfilling developer's obligations arising from the implementation of measures towards the betterment of environment.
Correct methodology for collection of samples and their analyses using appropriate and approved methods is imperative for dependable output of monitoring. To ascertain this it must be ensured that sampling and analysis proposed in the monitoring plan are carried out by a NABL and MoEFCC accredited laboratory under the supervision of the project proponent.
6.2.1. MONITORING DURING CONSTRUCTION PHASE
From a monitoring perspective, the important environmental components are water, air, noise, soil, sediment, flora, fauna, and occupational health. The sampling and analysis proposed in the monitoring plan will be carried out by the proponent directly or by a contracted qualified agency. Summary of Environmental Monitoring Programme during construction phase is given in Table 6.1.
6.2.2. MONITORING DURING THE OPERATIONAL PHASE
The project proponent is responsible for monitoring environmental components during the operational phase even when activities are out‐sourced to third parties. The proponent will develop a separate Operational Environment Monitoring Plan for specific project sites such as indoor monitoring at vulnerable areas in the terminal, jetty etc. Summary of Environmental Monitoring Programme during the operational phase is given in.Table 6.1.
The implementation of the Environment Monitoring Plan will be the responsibility of the Environment Management Cell within the project framework which will generated monitoring reports, findings and conclusions on a regular basis.
6.3. REPORTING
6.3.1. COMPLIANCE REPORTS
As a part of environmental monitoring program, following compliance reports shall be submitted to MPCB and Regional Office of MOEFCC.

EIA for proposed jetty at Korlai River and expansion of existing jetty at Sanegaon by Indo Energy
International Ltd.
TEPL/ENV/CBS/2021‐05 180
Half yearly compliance reports in respect of the conditions stipulated in the terms and conditions of the clearance.
Environmental statement to MPCB, every year. Format for maintaining records of hazardous waste in Form 3 as per Hazardous Waste
(Management, Handling and Transboundary movement) Rules, 2016. Format for maintaining notification of major accident in Schedule 6 as per MISHC
rules, 1989 (as amended).
Table 6.1 Environmental Monitoring Plan during project construction phase and operation phase
Sr. no
Aspects Parameters to be monitored
Location Frequency of monitoring
Methodology
1 Ambient Air Quality
PM10, PM2.5, S02, NOx, CO,
Minimum 3 locations should be monitored near project site
Monitoring every six months (as per CPCB guidelines)
NAAQS, 2009. 24 hour reading as per standards for (PM10, PM2.5, SO2, NO2) &1 hours for CO & 8 hours for HC
2 Ambient Noise Quality
Noise intensity in dB(A) Day & Night, Leq, Lmin, Lmax, L10, L90, L50
Minimum 3 locations within 500 m representing different receptors
Monitoring every six months (as per CPCB guidelines)
24 hour reading as per standards.
3 Ground Water Quality
pH, salinity, total dissolved solids, BOD, Coliform count, electrical conductivity, Chlorides & COD
3‐4 locations in and around the site
Monitoring every six months (as per CPCB guidelines)
Two litres of samples from each source, locations are chosen based on availability of ground water body within study area.
4 Surface Water Quality
Colour, Temperature, Turbidity, Electrical Conductivity, Total dissolved solids, Total suspended solids pH,
3‐4 locations in and around the site
Monitoring every six months (as per CPCB guidelines)
Two litres of samples from each source. Sampling locations are

EIA for proposed jetty at Korlai River and expansion of existing jetty at Sanegaon by Indo Energy
International Ltd.
TEPL/ENV/CBS/2021‐05 181
salinity, Dissolve Oxygen, Alkalinity as CaCO3, BOD, COD, Nitrate, Sulphates, Phosphate as PO4, Calcium Heavy Metals (Arsenic, Zinc, Cadmium, and Lead), Chlorides, Boron, Iron, Fluorides, Copper and Chromium, Total Coliform count
chosen based on presence of surface water bodies in the study area.
5 Marine Water quality
Physio‐chemical: Temperature, Transparency, EC, turbidity, TDS, Alkalinity, Salinity, TSS, pH, DO, COD, Sulphates, Ammonia, total Nitrogen Chlorides, BOD, Phosphates, Sodium, Potassium, Silicates, Hydrocarbon, Nitrates, Nitrites, Oil &Grease, Heavy metals (Pb, Hg, As, Zn, Cr, Cd, Cu, Fe).
3‐4 locations in and around the site
Monitoring every six months (as per CPCB guidelines)
Two litres of samples from each station.
Locations are planned depending on current pattern and intensity of impact of construction activity. Biological parameters:
Phytoplankton (No. of species and their density) , Zooplankton (No. of species and their density)
6 Marine Sediment Quality
Physio‐chemical parameters : Size and Texture , colour, pH, oil & grease, nitrogen, phosphorus, sulphide, heavy metals (Arsenic, Iron, Lead, Zinc, Cobalt, Copper, Cadmium, Nickel, Silver), organic nitrogen
At 3‐4 locations
Monitoring every six months (as per CPCB guidelines)
1 Grab sample from each station. Locations are planned depending on current pattern and intensity of impact of construction activity.
Biological parameters: Benthos (Macro‐benthos)
7 Soil Quality
Soil texture, pH, Electrical Conductivity, Salinity, Sodium, Nitrates, Phosphates, Organic content, potassium
At 2 locations (project site & transportation route)
Once in a season monitoring except for monsoon (once a year)
1kg sample at every station

EIA for proposed jetty at Korlai River and expansion of existing jetty at Sanegaon by Indo Energy
International Ltd.
TEPL/ENV/CBS/2021‐05 182
8 Ecology Survey of flora & fauna At site
Monitoring every six months (as per CPCB guidelines)
‐
9 Greenbelt Development
Rate of Survival and Growth Of Various Species
At site Once per month ‐

EIA for proposed jetty at Korlai River and expansion of existing jetty at Sanegaon by Indo Energy
International Ltd.
TEPL/ENV/CBS/2021‐05 183
CHAPTER 07
ADDITIONAL STUDIES

EIA for proposed jetty at Korlai River and expansion of existing jetty at Sanegaon by Indo Energy
International Ltd.
TEPL/ENV/CBS/2021‐05 184
7. ADDITIONAL STUDIES
This chapter broadly deals with Risk Assessment study Disaster Management of Proposed project of “proposed jetty at Korlai River and expansion of existing jetty at Sonegaon by Indo Energy International Ltd”. Risk assessment, disaster management plan and natural resource conservation plan are also included in this chapter.
7.1. ENVIRONMENTAL RISK
Environmental risks are inherent in the construction and operation of ports and terminals. Because of where they are located, special consideration needs to be given to the potential harm that could be caused by significant pollution of coastal or estuarine environs as a result of their construction or operation. Strict environmental legislation in many countries has resulted in defined requirements for port and terminal operators to assess the potential for environmental impacts, and to manage their business activities accordingly. Heightened public awareness of environmental issues has also led to the enhanced potential for third‐party claims for pollution and environmental damage. Environmental risks can arise at all stages of the port and terminal life cycle: Construction – Dredging, removal, and disposal of contaminated material, transportation
and storage of significant overburden. Operation – Pollution and environmental damage caused by contaminants released
during the handling, movement, and storage of products and goods, and associated health and safety risks.
Closure and restoration – Extensive ground works mean that risks include the treatment and disposal of contaminated sediments. While many environmental risks are generic, others are specific to the particular facility.
The significance of site‐specific risks will depend on the environmental characteristics and sensitivity of the surrounding area, often categorized in terms of the surrounding land and coastal habitats.
7.1.1. RISK IDENTIFICATION AND QUANTIFICATION
Detailed analysis by risk type: – Market (e.g. commodity risk, interest rates, foreign exchange). Operational (construction risk, completion of milestones & start‐ups) Human capital (health, welfare, and pensions) Demand forecasting
7.1.2. RISK MITIGATION
1. Operational and construction safety management system, Evacuation & Fire fighting, First aid training, Training, including portfolio insurance procurement.
2. Development of Skill Human capital against natural & man made threats.
3. Minimizing Environmental risk.

EIA for proposed jetty at Korlai River and expansion of existing jetty at Sanegaon by Indo Energy
International Ltd.
TEPL/ENV/CBS/2021‐05 185
4. Weather risk.
7.1.3. CONCEPT OF RISK ASSESSMENT
The concept of risk assessment and its engineering application has been well acclaimed since more than a decade. A variety of major accidents have focused attention on the dangers of risk exposure for human health and environment. Risk analysis provides numerical measures of the risk that a particular facility posses to the public. It begins with identification of potential risk involving events and determination of the impact of each event. The consequences of each event are than calculated for numerous combinations of weather conditions and wind directions these consequence predictions are combined to provide numerical measure soft the risk for the entire facility. Risk for a particular facility is based on the following variables: Multiple accident outcomes Population disturbance Site‐specific meteorological data “Risk analysis is a tool which helps to translate hindsight (accidents) into foresight (planning), showing ways and means (improved engineering, procedure and supervision) to prevent the calculated accident from happening. Visualize failure scenarios for the structures, handling equipment and estimate distances safe from damage.
7.1.4. LEAKS AND SPILLAGES
It will be of prime importance to protect the marine and terrestrial ecosystem during the operations of crafts. The various possibilities of leakages and spillages of the fuel includes following probabilities 1) Spillages of fuel during re‐fueling 2) Leakages of fuel during navigation 3) Leakages of fuel from storage tanks 4) Leakage or spillage during ship washing process
7.1.4.1. Spillages of Fuel during Re‐ Fueling
The crafts will require fueling its operation depending upon its trips two end fro. There will be a possibility of spillage of fuel during re‐fueling process. This may lead to disturbance in the shore ecosystem in a temporary manner. The spillage portion will be although small one, it may affect the natural marine life to save extent. To avoid such accidental spillage, following measures shall be adopted
Proper routine checks shall be performed on the pipeline used for re‐fueling, various pumps, motor valves etc.
Safety audit shall be performed yearly to account for the performance of the re‐ fueling system.
Chemical foam system shall be kept accessible to spray on the spillage. Oil‐water separator shall be installed.

EIA for proposed jetty at Korlai River and expansion of existing jetty at Sanegaon by Indo Energy
International Ltd.
TEPL/ENV/CBS/2021‐05 186
Area of spillage will be contented using HDP or PE pipes. Oil Spill Contingency Plan will be followed.
In case of such a spillage oil‐water separator shall be immensely used to recover the oil spread on the surface of seawater. In case, of major spillage, containment technique shall be employed immediately and oil shall be recovered without further spreading it on the sandy shore. Therefore, the major methods to be adopted for the oil spill closed to the shore shall be; i) Containment technique ii) Scavenging iii) Mechanical removal iv) Dispersion technique v) Use of absorbing material Incase Oil spill accident, the below given mitigative measures shall be taken in order to preserve the mangroves from damage due to oil spill: Booming and skimming of oil on the water surface in mangrove creeks Pumping of bulk oil from the sediment surface, depressions and channels Water flushing of free oil from sediment surface and mangroves into areas where it may
be collected Use of absorbent materials, with subsequent collection and disposal.
7.1.4.2. Leakages of Fuel during Navigation
There is a possibility of fuel being leaked from engine room because of various reasons. It may even happen during a collision and fuel/oil may spread on larger area in the sea. To prevent such accidental leakages, proper mechanical maintenance shall be carried out during the routine surveys as mentioned above. In case of such an event the craft shall be very well equipped with recovery system. These leakages can lead to water pollution leading to damage to mangroves, fishes, spawning problems, distraction of marine eco‐culture, odor problem, and effect on marine bio‐diversity. Various mitigation measures will be enforced depending upon type of oil, quantity of spread, distance from the shore, etc. such as: i. Burning of the oil ii. Scheming the surface with a suction device iii. Absorbent technique iv. Gelling method v. SilIking method vi. Emulsification / dispersion
7.1.4.3. Leakages of fuel from storage tanks
There will be possibility of minor/major leak from the storage tank. It may be due to faulty materials of construction, faulty erection, etc. Periodical checks shall be carried out of the tanks to find minor leakages, which may not be detected, in the routine course. Proper care

EIA for proposed jetty at Korlai River and expansion of existing jetty at Sanegaon by Indo Energy
International Ltd.
TEPL/ENV/CBS/2021‐05 187
should be taken to avoid the leakage of such materials into the sea. In case of such events following emergency measures shall be taken: i. The marine terminal building shall be well equipped with oil containment facilities. ii. There shall be a small drainage system near the fuel storage tanks, which can carry the
leaked oil to the oil‐water separator. The storage area is channelized with storm water drainage with inbuilt oil & grease traps at various locations which shall separate oil discharges from the run‐off water.
iii. Absorbent and dispersion techniques made available near the fuel storage tanks. iv. Intercepting drains will be provided around the site of construction and designated
places for the machines where refueling and change of lubricants shall be carried out, in order trap any oil & grease discharge from the same.
v. The used oils and lubricants will be collected in drums from the equipment such as Diesel engines, compressors etc and will be send to the firm which is MPCB authorized and registered with MPCB, for recycling.
vi. These gases would be stored in enclosed tanks (Bullets) and would be routed through secured pipelines to consumers such as Automatic Panel Welding Machine, KOIKE machines etc the regular checks of gas cylinders and gas systems is carried out to prevent any gas leakages.
vii. Proper channeling from all over the seaward side of the project side will be done such as to avoid any such spillage/ leakage to enter the sea‐water.
7.1.4.4. Leakage or spillage during ship washing process
Since the proposed terminal shall provide the berthing and parking facility of ships. There will be as such no major impact of oil spillage on the environment. However, there is a possibility of spillage during the ship washing process from the ship parking facility. These Spills can further contaminate the land as well as water, if it is not properly channelized. However, proper mitigative measures are taken in order to avoid any such spillage/ leakage during the workshop processes. i. The intercepting drains passing from the area are installed with oil & grease trap to
entrap the oil spills, the remaining water will then be sent to sedimentation tank where it will be further treated for oil spills and pollutants. The treated water will be reused within the plant.
ii. Awareness amongst the workers regarding safe handling techniques and safety measures will be made through various workshops and seminars.
iii. In case of any accidental spill, all processes will be brought to halt.
7.1.5. RISK ANALYSIS STUDY
Identification of potential physical hazards which could trigger loss causing events such as fire and explosion, leakage of flammable materials etc. from the proposed facility.

EIA for proposed jetty at Korlai River and expansion of existing jetty at Sanegaon by Indo Energy
International Ltd.
TEPL/ENV/CBS/2021‐05 188
Identifying the Maximum Credible Loss Scenarios (MCLS) for the vulnerable areas in the storage areas in the facility for assessing the magnitude and severity of the impact of various failure scenarios in terms of damage to property and injury to personnel.
Recommendations for risk reduction shall be made on the basis of the above for minimizing, if not eliminating various hazards and providing information on improvement of safety systems, where necessary.
The major risk is envisaged from the storage yards, fueling of cargos. The leakage in piping, pumps and electrical fault can lead to hazardous event.
A complete Risk Assessment will be done and the mitigative measures as well as safety measures will be proposed for the same.
7.2. ONSITE EMERGENCY PLAN
Assessing the adequacy of available resources to take care of emergencies as identified in the risk analysis study. Providing recommendations on the infrastructure, communication system and other facilities such as first aid, security, fire fighting etc. in view of effective handling of the emergencies identified. Specifying the roles and relationship amongst personnel from the facility and outside agencies for effective handling of the emergencies. Identification of assembly points and escapes routes for evacuation. Preparation of an Onsite Emergency Response Plan Document is envisaged. The stages of On‐site Emergency Plan include: 1. Outline Emergency Response Team.
Designated person in charge. Key responsibility of each individual. Telephone numbers for key people.
2. Risk Evaluation on preliminary hazards
Type, Quantity and Storage method of Hazardous materials used at site along with MSDS.
Location of possible Hazards (Process, Storage‐yard, Transfer, Piping, etc.)\Type of Accidents.
Special handling requirements, fire fighting procedures as per MSDS. Safety measures to be taken and installed if any.
3. Details regarding Location of Key‐personals. Emergency Control room, if provided. Emergency Telephone numbers. First‐aid Kit and Fire Extinguisher locations. Warning alarm, safety and security. Precautions during design and Engineering. Continuous surveillance. Details of Hospital and Fire‐brigade facility. Procedures for notifying family members of injured employees. Procedure for reporting emergencies.

EIA for proposed jetty at Korlai River and expansion of existing jetty at Sanegaon by Indo Energy
International Ltd.
TEPL/ENV/CBS/2021‐05 189
4. Awareness amongst workers for
Knowledge of chemicals used (property, toxicity, handling methods, etc) Use of fire‐fighting equipment and first‐aid. Mock‐drill for Hazards and Disasters. Use of personal protective equipment. Procedure for reporting emergency. Knowledge of alarm systems. Manuals for each Operating system.
5. Control Plans
Emergency Control plans. Safe time to resume work after an emergency. Control measures for any spillage, leakage, explosion, etc.
7.2.1. LIFE SAVING APPLIANCES AND ARRANGEMENTS
It is one of the important aspects towards the mitigative measures to be adopted on the craft. It is also recommended to have safety appliances and arrangements even at ship terminal facility, in case of emergency for the craft during its navigation. Various life saving arrangements/appliances shall be made available for such eventualities. The major issues to be tackled for the life saving or rescue operations will be during any eventualities arising out of collision or submergence of the craft. In case of such eventualities various life saving appliances such as embarkation ladder, float free launching pads, spaces for laundry emersion suit inflammable appliances shall be made available on the craft. In addition to this life saving appliances an effective ladder communication system shall be made available on the crafts. In the event of noting such as event at the marine terminal control room to allowing life
saving appliances kept ready. Rescue boat, which is design to rescue person in distress and to marshal survival craft. Retrieval rescue team for the safe recovery of the survivors and evacuation. Retro reflective material for detection of damaged craft in poor tight conditions Embarkation ladder to permit safe access at the survival craft. Live saving appliances such as thermal, protective aid emersion suit radio life saving
appliances radiotelegraph installations in lifeboats shall be made available. Life buoys compiling with the requirement and regulation shall be kept ready and
accessible during emergency life jackets etc shall be accessible Trained personnel with experience of rescue operation shall be provided on board on
rescue boat. In case of addition to the rescue boat craft with all novel life saving appliances it is
recommended that to take help of Coast Guards and also naval helicopters to search the exact site of accident.
7.2.2. OCCUPATIONAL HEALTH AND SAFETY

EIA for proposed jetty at Korlai River and expansion of existing jetty at Sanegaon by Indo Energy
International Ltd.
TEPL/ENV/CBS/2021‐05 190
Specific occupational health and safety issues relevant to proposed project primarily include the following: Physical hazards Chemical hazards Confined Spaces Exposure to Organic Inorganic Dust Exposure to Noise
The main sources of physical hazards at ports are associated with cargo handling and use of associated machinery and vehicles. However this shall be taken care of by applying all the terminal related norms and standards. The workers and vehicles passageway shall be kept separate. Avoiding entry of workers as far as possible in the area of ship loading and unloading activity and areas where grab is operational. The chemical hazards are related to inhalation of fumes during fueling refueling or other emissions from the cargo. This can be eliminated by providing adequate personal protective Equipments to the workers working in such areas of exposure. The workers working in Confined spaces shall follow the General EHS Guidelines for working in confined spaces. They will also be provided with relevant personal protective equipment. Noise pollution can cause due to one of the various activities at the terminal or parking facility. However, proper mitigative measures are out‐lined for control of noise at the Facility. Onsite medical facility will be provided in case of any hazard or casualty during the operational phase. Fire safety measures shall be incorporated and implemented. Periodic health check‐up of all the workers shall be carried out.
Table 7.1 Information to be Maintained of Emergency Response Agencies.
No. Personnel Contact number
1 Collector +91‐2141‐222001, 02141‐222118
2 Ambulance suppliers +91 2141 224515, +91 2141 220225
3 Police station 02141 222100, +912141240033
4 Maharashtra State Electrical Distribution Company Limited (MSEDCL) 1800‐1023435, 1800‐2333435
5 Station help‐line number 086526 13697 6 State Transport Manager 02194 242447 7 Superintendent of Police 9870562001 8 Municipal Corporation 02141‐222015 9 Fire brigade near to jetty location +91 02194163600 10 Earth moving machinery near jetty location 020 2428 1504
11 Medical shops near 10 km area +91 9420392691, +91 9271777178
12 Tahsildar 02145‐222142 13 Private transporters +91 9226382172
14 Maritime SAR (Search and Rescue operation) Emergency services to Indian coast guards 1554

EIA for proposed jetty at Korlai River and expansion of existing jetty at Sanegaon by Indo Energy
International Ltd.
TEPL/ENV/CBS/2021‐05 191
7.3. DISASTER MANAGEMENT PLAN (DMP)
Disaster Management implies continuous and integrated process of planning, organizing, coordinating and implementing measures for natural and manmade events. Also, disaster. management is a set of actions and processes designed to lessen disastrous effects before, during and after a disaster.
7.3.1. DISASTER MANAGEMENT PLAN OBJECTIVE
To localize the emergency To minimize the consequences To ensure that the following concepts are considered, namely rescue, first aid, evacuation,
rehabilitation, spreading the information To identify type of major disasters which may occur To minimize the effect of accidents Elimination of hazard will require equipment like fire fighting equipments, water sprays, emergency shutoff valves and purposeful construction. Minimizing the effect will be prompt action by operating and emergency staff, rescue, first aid, evacuation, rehabilitation and giving information promptly to people living / working nearby. b) Types of Possible Emergencies:
Fire on berth / approach trestle / storage / buildings Spillage while bunkering by vessel Spillage due to collision in channel Natural calamities like cyclone / rough weather / earthquake/ Tsunami War situation/ Air strike.
c) Functions of Disaster Management
Controlling spread of accidental effects with minimum damage to men, material, machine and structures. To inform relevant agencies and request for help. To rescue victims and provide succor. To protect other and safely evacuate. To inform nearby inhabitations. To identify the affected persons and inform their relatives. To provide authentic information to news media and other. To preserve relevant records and equipment needed as evidence in any subsequent
inquiry. To rehabilitate the affected areas and alot specific assignment to available manpower. d) Classification of Accident
Level I : Operator Level Level II : Local / Community Level Level III : Regional level Level IV : International level

EIA for proposed jetty at Korlai River and expansion of existing jetty at Sanegaon by Indo Energy
International Ltd.
TEPL/ENV/CBS/2021‐05 192
e) Critical Targets
Disaster Management Plan is prepared after identifying the objects likely to be affected in the event of emergency. The target of fire includes personnel if emergency occurs at service platform during discharging of vessel and tank farm on shore. f) Control Room (CR)
A control room will be established at a location away from likely spots of accidents and shall be easily accessible. Better location will be near the room from where all unloading operation are conducted and controlled.
7.3.2. EMERGENCY PLAN FOR BERTHS AND VESSEL TERMINAL
This plan will be drawn up in consultation with authority, fire brigade, coast guard and police etc. The plan will include: Specific initial action to be taken by those at the location of emergency (to notify time,
position source and cause of spill) to control room and Coast guard. Immediate action to combat Oil –pollution. Evaluations of situation by on scene controller regarding threat posed by spill and identify
threatened resources. Details of Communication system available siren code. An inventory including location details of emergency equipment. Sound alarm‐terminal fire fighting staff to fight fire. Mobilize fire‐fighting equipment. Electric power to switch off ‐ emergency lighting to switch on. The ships calling at termianal will be advised of the terminal's emergency plan particularly
the alarm signals and procedures to summon assistance in the event of an emergency, on board.
7.3.3. ROUGH WEATHER
The rough weather operations will be controlled in three stages Green Status ‐ the operations of loading / unloading will be carried out as planned. Yellow status ‐ This is an alert stage indicating possibility of rough weather, still operations
can be continued with all emergency precautions. Red Status ‐ Emergency situation or rough weather; operation will be suspended ‐
Activities controlled by In charge of emergency operations. The vessel / tanker is to be unearthed to safe anchorage or will be advised to proceed to sea.
7.3.4. FIRST AID & FIRE FIGHTING SERVICES
The proposed project will have full‐fledged medical facilities as well as fire fighting facilities available in the area.
7.3.5. IDENTIFICATION OF MAJOR HAZARDS

EIA for proposed jetty at Korlai River and expansion of existing jetty at Sanegaon by Indo Energy
International Ltd.
TEPL/ENV/CBS/2021‐05 193
The hazards occurring at Proposed Project can be broadly classified as natural and man‐made hazards. Some of the hazards existing at site are as follows: Earthquakes Fire Tsunamis
Earth Quake
An earthquake is a sudden, rapid shaking of the Earth caused by the breaking and shifting of rock beneath the Earth's surface. This shaking can cause buildings, dams and bridges to collapse; disrupt gas, electric, and phone service; and sometimes trigger landslides, flash floods and fires; all these are possible scenarios at Proposed Project. Buildings with foundations resting on unstable soil and slopes are most at risk. The greatest danger for people in an earthquake exists directly outside buildings, at exits, and alongside exterior walls. Ground movement during an earthquake is seldom the direct cause of death or injury. Most earthquake‐related casualties result from collapsing walls, flying glass, and falling objects.
Fire
Fire is the most probable emergency scenario at proposed project. Fire can be caused in buildings and installations as electrical fire, chemical fire (leakage of LPG), Fuel fire (HSD storage tanks) or fire in buildings. To handle this scenario an onsite emergency plan has been developed by the security team and is currently operational.
Tsunamis
Tsunamis are generated by large and rapid displacements of water, mainly from sudden and large scale changes in the configuration of the sea floor associated with fault displacement or gigantic underwater landslides, which could be mainly due to earthquakes. Earthquakes generate tsunamis by vertical movement of the sea floor as in normal faulting or thrust faulting. If the sea floor movement is horizontal, tsunamis are not generated as in strike slip earthquake. Sometimes they are triggered by marine landslides into or under the water surface, also generated by volcanic activity and meteorite impacts, but such events are extremely rare. Tsunami hazard along a coastline is therefore a combination of all the potential sources of tsunamis that lie in the neighboring sea or ocean. Tsunami waves travel at a speed of approximately 700 km/ hr in 4000 m of water. In 10 m of water the velocity drops to about 36 km/hr.
7.4. EMERGENCY RESPONSE MEASURES FOR NATURAL HAZARDS
Natural Hazards cannot be prevented. However with mitigation measures the effects/damages could be reduced.
7.4.1. RESPONSE IN CASE OF EARTHQUAKE

EIA for proposed jetty at Korlai River and expansion of existing jetty at Sanegaon by Indo Energy
International Ltd.
TEPL/ENV/CBS/2021‐05 194
Response procedures for worker 1. If indoors:
Take cover under a piece of heavy furniture or against an inside wall and hold on. 2. If indoors:
Stop the process and move away from machinery, equipment, etc. Avoid moving around until the shaking stops.
3. If outdoors: Move into the open, away from process area, office building and utility wires. Gather at the Evacuation point mentioned during the safety drill and await
instructions. 4. If in a moving vehicle:
Stop quickly and stay in the vehicle. Once the shaking has stopped, proceed with caution.
5. After be prepared for aftershocks. Although smaller than the main shock, aftershocks cause additional damage and may
bring weakened structures down. Aftershocks can occur in the first hours, days, weeks, or even months after the quake.
6. Help injured or trapped co‐workers. Give first aid where appropriate. Do not move seriously injured persons unless they
are in immediate danger of further injury. Call for help. Use Emergency numbers. Stay out of damaged buildings, machinery, equipments. Get your entire process area checked with Safety officers Use the telephone only for emergency calls.
Emergency Response Procedure
1. Initiate the Quick Response Team and First aid team for earthquake response 2. Give a long siren for earthquake warning 3. Inform the necessary authorities for aid 4. Ensure no personnel or residents are stuck beneath any debris 5. Ensure that all residents and personnel standing outside near the buildings are taken
to open areas. 6. Close the entry gate to restrict any incoming traffic 7. Inform Electrical department to shut off the utilities. 8. Ensure that the first aid ambulance and fire tender vehicles are mobilized 9. Ensure that emergency telephone number is only used for this purpose 10. Check the utilities and storage tanks for any damage. 11. Inform structural engineers to check for any damage to the Dam structure
7.4.2. RESPONSE IN CASE OF FIRE
On sighting a fire the first person should immediately inform the control room. If the fire is small engage in extinguishing the fire using the nearest fire extinguisher or
retrieve the property that may be damaged.

EIA for proposed jetty at Korlai River and expansion of existing jetty at Sanegaon by Indo Energy
International Ltd.
TEPL/ENV/CBS/2021‐05 195
Guide staff to the emergency assembly point. The control room will immediately inform the first aid centre and the quick response
team, which has trained fire‐fighting personnel. Mobilize the fire tender. The Quick Response team will immediately move to the point of fire and take all necessary
steps to stop the fire. If the fire is not controllable and spreads to the other area then immediately inform the security post who would in turn inform the district authorities and call for external help.
First aid team will provide immediate relief to the injured personnel at the scene of incidence. The patients would then be evacuated on priority to the dispensary or hospital based on their condition.
Instructions for an Individual in case of fire
Get out of buildings as quickly and as safely as possible. If outdoors stop all processes and inform the control room using emergency alarm system and Emergency numbers.
Use the stairs to escape. When evacuating, stay low to the ground. Evacuate and assemble at the assembly point decided previously.
If possible, cover mouth with a cloth to avoid inhaling smoke and gases. Close doors in each room after escaping to delay the spread of the fire. If in a room with a closed door. If smoke is pouring in around the bottom of the door or it feels hot, keep the door closed. Open a window to escape or for fresh air while awaiting rescue. If there is no smoke at the bottom or top and the door is not hot, then open the door
slowly. If there is too much smoke or fire in the hall, slam the door shut. Call the security from the nearest phone Inform security gate if there are any persons trapped in the house or injured. Stay out of damaged buildings. Check that all wiring and utilities are safe.
7.4.3. RESPONSE IN CASE OF TSUNAMIS/STORM SURGES
a) Structural measures:
1. Construction of cyclone shelters 2. Plantation of mangroves and coastal forests along the coast line acting as Bioshields 3. Development of a network of local knowledge centers (rural/urban) along the coast lines
to provide necessary training and emergency communication during crisis time 4. Construction of location specific sea walls and coral reefs in consultation with experts 5. Development of well designed break waters along the coast to provide necessary cushion
against cyclone and tsunami hazards 6. Development of tsunami detection, forecasting and warning dissemination centres
EIA for proposed jetty at Korlai River and expansion of existing jetty at Sanegaon by Indo Energy
International Ltd.
TEPL/ENV/CBS/2021‐05 196
7. Development of a “Bio‐Shield” ‐ a narrow strip of land along coastline. Permanent structures, if any in this zone with strict implementation of suggested norms. Bio‐Shield can be developed as coastal zone disaster management sanctuary, which must have thick plantation and public spaces for public awareness, dissemination and demonstration.
8. Increasing the river dike height, increasing the height of the coast by filling up of coastal sand of the same place.
9. Identification of vulnerable structures and appropriate retrofitting for tsunami/cyclone resistance of all such buildings as well as appropriate planning, designing, construction of new facilities like Critical infrastructures e.g. power stations, warehouses, oil and other storage tanks etc.
located along the coastline. All other infrastructure facilities located in the coastal areas. Public buildings and private houses. All marine structures. Construction and maintenance of national and state highways and other coastal roads.
b) Non‐Structural Measures
1. Coastal regulations Zone Act – Strict implementation. 2. Aggressive capacity building requirements for the local people and the administration
for facing the disasters in wake of tsunami and cyclone, ‘based on cutting edge level’ 3. Developing tools and techniques for risk transfer in highly vulnerable areas 4. Conserving and developing Natural Bioshields (Mangroves) and shelterbelt
plantations (Casuarina) 5. Maintaining natural sand dunes. 6. Maintaining and promoting beach development. 7. Having diverse livelihood options. 8. Launching a series of public awareness campaign throughout the coastal area by
various means. 9. Training of local administration in forecasting warning dissemination and evacuation
techniques 10. Awareness generation and training among the fishermen, coast guards, officials from
fisheries department and port authorities and local district officials etc., in connection with evacuation and post tsunami storm surge management activities. Regular drills should be conducted to test the efficacy of the DM plans.
7.5. IDENTIFICATION AND ASSESSMENT OF HAZARDS
Storms, Floods and fires are potential disasters for such Projects. Their likelihood of occurrence and the resulting risk of damage should be incorporated into the design analysis of each project facility.
Table 7.2 Summary of the Disasters Preparedness Plans
DISASTER DESCRIPTION RESPONSE PLAN STAGES

EIA for proposed jetty at Korlai River and expansion of existing jetty at Sanegaon by Indo Energy
International Ltd.
TEPL/ENV/CBS/2021‐05 197
Hurricanes and storms
Depending on the magnitude storms can damage the infrastructure of the project area to varying extent, thereby affecting its operation
Hurricane Preparedness Plan Secure insurance coverage.
Alert, Response Recovery
Earthquake The proposed site is not in an earthquake prone area. Thus less chances of earthquake are envisaged.
Building and construction shall adhere to the earthquake efficiency norms.
Planning, Response, Damage Assessment and Recovery.
Fire Fire outbreaks also vary in size and location and cause irreparable damage to the infrastructure.
Fire Prevention and Preparedness Plan Install fire fighting equipments Electrical work will be done by certified electrician. Provide proper Insurance coverage.
Response, Planning Fire Drills, Damage Assessment.
Oil Spills and leaks
Oil or fuel spill due to accidents or leakages pose a serious impact to the sensitive environment.
Spill Contingency Plan All petroleum products stored in bunded areas.
Report and Response, Recovery
Climate change
This natural occurring phenomena can pose a risk to the project if not adapted in time.
Contingency Plan Alert, Response
Medical Medical emergencies can occur at any moment and therefore requires a quick and coordinated effort to respond to the need.
Medical Emergency Plan First aid equipment and staff trained in CPR.
Response, Recovery

EIA for proposed jetty at Korlai River and expansion of existing jetty at Sanegaon by Indo Energy
International Ltd.
TEPL/ENV/CBS/2021‐05 198
Chapter8ProjectBenefit

EIA for proposed jetty at Korlai River and expansion of existing jetty at Sanegaon by Indo Energy
International Ltd.
TEPL/ENV/CBS/2021‐05 199
8. PROJECT BENEFITS
8.1. ECONOMIC BENEFITS
The EXIM trade due to this facility will increase and creating employment opportunity, supply chain management, facilities for industries in the Maharashtra.
The development is envisaged to play a significant role in strengthening connectivity along the Maharashtra coastline.
Enhancement in economy of Maharashtra. The economic growth will have positive impact; it will also help in increase in living standards of the local residents.
Substantial positive impact on socio‐economic profile of Revdanda, in Particular, and Raigad, in general, both in terms of overall employment and skill development of local workforce.
Direct as well as indirect employment potential is envisaged. Probable augmentation in infrastructure resources such as transport, Communication,
health facilities & other basic facilities.
8.2. SOCIO‐ECONOMICAL BENEFITS
The socio‐economic scenario in the region will certainly change with positive impact on the existing regional socio‐economic pattern.
There will be change in employment pattern with local residents will be given preference for jobs opportunities and/or self‐employment.
Due to enhancement in infrastructure facilities and utilities in living condition will also improve.
8.3. AESTHETICS AND LANDSCAPE
It is proposed to develop greenbelt around the plant, which will go a long way to achieve environmental protection as well as aesthetics of the area.
A vegetative cover at both ends of the project and also along internal roads will certainly reduce the air pollution.
This vegetation cover will also act as a barrier for any penetration of air quality and odor in the nearby area.
Approach roads will be covered with green belt on both the sides to avoid any air quality problems to the nearby residents.
8.4. CORPORATE ENVIRONMENTAL RESPONSIBILITY
Plan for Corporate Environment Responsibility (CER) as specified under Ministry’s Office Memorandum issued vide letter F. No. 22‐65/2017‐IA.III dated 01.05.2018.
With reference to the above OM following are the concerns raised during the public consultation and thereof the commitments made by the project proponent to address the same:

EIA for proposed jetty at Korlai River and expansion of existing jetty at Sanegaon by Indo Energy
International Ltd.
TEPL/ENV/CBS/2021‐05 200
SR. NO
ISSUES RAISED WITH RESPECT TO ENVIRONMENT
COMMITMENT BY IEIL
A. Korlai fort: With reference to MoM of public hearing held on 19th November 2016
1.
Suffering of local people due to coal dust nuisance. This may also affect the adjacent eco‐friendly village Chaul, which is at a distance of 400 mtrs.
Use of slit curtains will be done to minimize the coal dust emission. Also water spray or sprinkler system will be provided at the barge unloader, coal stacks and truck loading station.
2.
Coal and other mineral material will be handled in the project, contamination of sea water with liquid material may occur, due to this many fishes may die.
Use of slit curtains will be done to minimize the coal dust emission. For development of fisheries Rs. 6 crores are allotted under ESR activity.
3.
Reserved forest Phansad is near to the proposed project site. Due to the project, activities such as fishing, ecology of the area and the reserved forest will be ruined.
Phansad wild life Sanctuary is ~ 14.7 km away from proposed Korlai Jetty and ~ 14.43 km away from existing Sanegaon facility, hence no adverse impact is envisaged.
4. Possibilities of noise pollution during handling of cargo.
Use of noise barrier equipment and roadside plantation may aid in reducing noise pollution
5. Coconut and Arecanut cultivation may get burnt.
6. Health and livelihood of people will be in danger due to environmental pollution
Proper mitigation measures and implementation plan addressed in EIA report and same will be practiced to avoid pollution.
7. No proper facilities available for material storage and transportation. This will affect the environment of the area
Raw material storage facility is earmarked and the location for same is shown in Chapter 2 of EIA report
8.
In the report it is mentioned that there are neither mangroves nor mud at project site. Whereas mangroves and mud are present in the project site.
The proposed area is devoid of mangroves except for sparse and stunted patches. Site photographs are shown in EIA report chapter 3 Also, port area both the bank line and the water area to be used for reclamation is devoid of any mangroves
9. In the project it in mentioned that there is no creek. Creek exists in the project site.
The river has tidal influence water creek is certain part of river stretch, as project covers large stretch of the river common word river is utilized.
10
Brinjals and vegetables cultivated by local Christian families are very popular in the area. The project will destroy agricultural businesses in that area.
Care will be taken that project will not hamper local community
11There will be violation of Article 48, 51 of the constitution of India due to proposed project.
No violation of article 48 (organize agriculture and animal husbandry on modern and scientific lines) and 51

EIA for proposed jetty at Korlai River and expansion of existing jetty at Sanegaon by Indo Energy
International Ltd.
TEPL/ENV/CBS/2021‐05 201
SR. NO
ISSUES RAISED WITH RESPECT TO ENVIRONMENT
COMMITMENT BY IEIL
(international peace and security) envisaged
12Various species of birds and animals will be affected due to dust emissions done by the proposed project
Proper mitigation measures proposed to combat dust emissions in the area due to proposed project.
13 Kundalika river water pollution due to dust emission from the proposed project.
Silt curtains to be used to minimize pollution of Kundalika river.
14. B. Sanegaon Village: With reference to MoM of public hearing held on 21st November 2016
15 Nuisance problems due to dust emission is being faced by the local people. Coal powder is being deposited on surrounding trees.
Use of slit curtains will be done to minimize the coal dust emission. Also water spray or sprinkler system will be provided at the barge unloader, coal stacks and truck loading station.
16 There will be water shortage, agricultural and farming activities will be affected due to increase in river depth.
In construction phase water will be sourced from eater tankers and in operation phase water would be received from the MIDC supplies.
17 Proposed project will affect the surrounding villages and mangroves due to excavation of mud from river.
Care will be taken that mangroves are not affected.
18 Kundalika river water contamination due to water sprinkled on coal. Fishes may die due to this.
The effluent from coal stack yard will be collected in clarifier wherein clear water will be reused for sprinkling purposed and dust particles will be resend in coal stack yard. Further, water mixed with coal particles during sprinkling will be collected through channel along the storage into a clarifier system wherein water and coal dust will be separated. Also, for development of fisheries Rs. 75 Lakhs are allotted under ESR activity.
19 Erosion can take place due to increase in channel depth.
Shoreline will be assessed by proper techniques sometimes involving mathematical/physical model studies to ascertain remedial measures such as shore protection works, sand by passing etc.
20 Coal transporting vehicles are overloaded, they are not covered in tarpaulin sheet. This is causing dust emission.
Proper precautionary measures will be adopted to minimize dust emission in the area due to the proposed project such as use of tarpaulin, water

EIA for proposed jetty at Korlai River and expansion of existing jetty at Sanegaon by Indo Energy
International Ltd.
TEPL/ENV/CBS/2021‐05 202
SR. NO
ISSUES RAISED WITH RESPECT TO ENVIRONMENT
COMMITMENT BY IEIL
sprinklers and maintained speed limits.
21 It is wrongly mentioned that there are no wild life. Surrounding area of 700 to 800 acres will be affected due to increasing navigation channel depth.
Care will be taken that surrounded wild life will are not affected.
Additional as a responsible corporate, M/s Indo-Energy International Limited would integrate its environment, HR and ethical business policies with appropriate community engagement and gender equity. The major social sectors IEIL would emphasize for the local community developments are Education, Water Sanitation, Health, Livelihood and Empowerment, Sports, Environment, and Infrastructure Development. The total budgetary cost towards the CSR plan to be implanted is INR 40 Cr.

EIA for proposed jetty at Korlai River and expansion of existing jetty at Sanegaon by Indo Energy
International Ltd.
TEPL/ENV/CBS/2021‐05 203
Chapter9EnvironmentalManagement
Plan

EIA for proposed jetty at Korlai River and expansion of existing jetty at Sanegaon by Indo Energy
International Ltd.
TEPL/ENV/CBS/2021‐05 204
9. ENVIRONMENTAL MANAGEMENT PLAN
9.1. GENERAL
An Environmental Management Plan (EMP) consists of a set of mitigation measures and compensatory. These measures are to be taken during the construction and operational phase of the project to eliminate adverse environmental impacts, to offset them or to reduce them to acceptable levels. The environmental management must be integrated into the process of project planning so that ecological balance of the area is maintained and adverse effects are minimized. EMP should be viewed as a commitment on the part of the proponent to minimize environmental impacts.
Environmental Management Plan gives the tools to assess and manage environmental issues during every phase of project or operations. The outcome minimizes the risk of costly & time consuming environmental issues, while maximizing productivity and performance. It provides a framework through which environmental priorities, responsibilities and risks are systematically managed.
In many instances, it has been found that successful implementation of EMP has resulted in reduction in project costs in the long run. This is because the EMP contains proposals for optimum usage of available resources plans to address minor faults at the initial stage.
As mentioned in Chapter 1 & 2, proposed project is to develop Deep Water Jetty facility on Kundalika River, village Korlai and capacity expansion at existing Inland Water Jetty Facility, on Kundalika River at village Sanegaon, district Raigad, Maharashtra, hence, it is essential to ensure the quality of existing environment and maintenance of same. The proposed project should incorporate environmental and technical alternatives at the initial stages of project development.
9.2. OBJECTIVES OF ENVIRONMENT MANAGEMENT
The main aim of the EMP is to ensure that the various adverse impacts are mitigated and the positive impacts are enhanced which can be established as follows:
To enhance the environmental and infrastructure benefits of a proposal To avoid, minimize or remediate the adverse impacts; To ensure that the residual adverse impacts are kept within acceptable levels. To maintain ecological integrity and establish necessary action for unforeseen
impact occur The EMP is proactive in nature and should be upgraded if new facilities or modification of existing facilities, with environmental concerns, come up.
EMP included four major elements:

EIA for proposed jetty at Korlai River and expansion of existing jetty at Sanegaon by Indo Energy
International Ltd.
TEPL/ENV/CBS/2021‐05 205
Commitment and Policy: The project will strive to provide and implement the Environmental Management Plan that incorporates all issues related to air, land and water.
Planning: This includes identification of environmental impacts, legal requirements, and setting environmental objectives. The various potential impacts are discussed under chapter 5
Implementation: This comprises of resources available to the developers, accountability of contractors, training of operational staff associated with environmental control facilities and documentation of measures to be taken.
Measurement and evaluation: This includes monitoring, corrective actions, and record keeping.
9.3. IDENTIFICATION OF IMPLEMENTING AUTHORITY
The responsibility for the implementation of the EMP will be with the Promoter and Contractor (P & C). An environmental management cell (EMC) will be established by the P & C for implementing the mitigative measures. To mobilize the appropriate expertise to design diverse type of mitigation measures. The P & C need to be collaborating with order institutions in the public and private sector viz. State Forest Department, State Public Health Engineering Department, State Traffic Department, and State Police Department etc. The EMC will ensure timely implementation of various mitigative measures at different stages of the project i.e. during construction and operation stage and the completion of the project within scheduled time frame.
In addition, an Environmental Officer will be appointed by project authorities for management of the project with the objective of reviewing and assessing the progress made by the concession company in implementing the suggested mitigative measures.
9.4. EMP FOR CONSTRUCTION AND OPERATION PHASE
This section of the report identifies standard methods and practices as part of mitigation measures with respect to environmental, social and health impacts identified generically and specifically for the proposed construction and operation of the project in chapter 5. For each aspect, the environmental management plan is prepared to minimize the impact on the surrounding environment during the construction and operation phase.
9.4.1. CONSTRUCTION PHASE
Environmental impact from proposed development is likely to occur during the construction stage. Following Table 9.1 outlines Environment Management Aspects and measure to be monitored along with necessary action plan and its frequency during construction phase.

EIA for proposed jetty at Korlai River and expansion of existing jetty at Sanegaon by Indo Energy International Ltd.
TEPL/ENV/CBS/2021‐05 206
Table 9.1: Environment Management Plan for Construction Phase
Sr. No. Environment Management Aspects
Measures to be Monitored
Action Plan Frequency (as per action plan)
Resources Required Responsibility
1. Air quality PM10 & PM2.5 in Airfor monitoring dust emission
1. Vehicles carrying construction material and storage area to be covered by traps.
2. Regular Water sprinkling on roads
3. Maintenance and servicing of construction machinery / transportation vehicle.
Regularly during construction period
1. Covered storage area 2. Water sprinklers 3. Maintenance and
servicing and keeping valid certificates and records
Promoter and Contractor
2. Noise level Monitoring of noise level
1. Construction activities strictly prohibiting between 10 pm and 6 pm near habitation
2. Provision of Personal protective equipment to workers being exposed high noise levels
3. Vegetative and solid barrier along inhabitant centre and sensitive receptor.
4. DG set with acoustic enclosure
Regularly during construction period
1. Vegetation cover surrounding the construction area
2. PPE to workers 3. Acoustic enclosure
Promoter and Contractor

EIA for proposed jetty at Korlai River and expansion of existing jetty at Sanegaon by Indo Energy International Ltd.
TEPL/ENV/CBS/2021‐05 207
Sr. No. Environment Management Aspects
Measures to be Monitored
Action Plan Frequency (as per action plan)
Resources Required Responsibility
3. Water quality Quality of marine water and sediment
1. Training to all workers on best practices to avoid spilling of raw materials & avoid run‐off from site to be enforced.
2. Storm water during monsoon to be properly channeled
3. Stored raw materials to be covered properly to avoid run‐off
4. Monitoring and guidance to workforce
Monthly during construction stage
1. Training to workforce2. Silt curtain/suitable
barriers 3. Regular checking and
maintenance of construction machinery to be done to avoid spillage of oil and hazardous substance.
4. Cleaning of channels for discharge storm water.
5. Scheduling of ship/vessel trips
Promoter and Contractor
4. Soil Quality Physiochemical parameter
1. Storage of raw material in covered designated areas to avoid soil contamination.
2. Solid waste generated will be segregated accordingly and handed over to the respective authority for final disposal
3. Provision of toilets
Regularly during construction period
1. Covered storage area.2. Color coded containers
will be provided for solid waste collection.
3. Regular maintenance of toilets
Promoter and Contractor
5. Marine ecology Mangrove enumeration
1. Mangrove management plan for the conservation
Regularly during construction period
1. Following the sketched plan Promoter and
Contractor

EIA for proposed jetty at Korlai River and expansion of existing jetty at Sanegaon by Indo Energy International Ltd.
TEPL/ENV/CBS/2021‐05 208
Sr. No. Environment Management Aspects
Measures to be Monitored
Action Plan Frequency (as per action plan)
Resources Required Responsibility
6. Occupational Health and Safety
1. Training to workforce
2. Usage of PPE by workforce
1. Training to all workers on health and safety best practices
2. Provision of PPE to workforce
Regularly during construction stage
Training and PPE to the workforce
Promoter and Contractor
7. Dredging management
Dredging material disposal
Dredging material to be use for backfilling and disposal to selected site
As per required quantity
Licensed carriers to transport and disposal at designated site
Promoter and Contractor
8. Spillage management
Spillage of oil from heavy vessels Oil contingency plan Regularly during
construction Equipment and Personnel Promoter and Contractor
9. Traffic management Record maintenance of vehicle and ships
Traffic management plan Regularly during construction stage
Skilled Workforce and data
management
Promoter and Contractor
9.4.2. OPERATION PHASE
An Environment Management Plan for the operation phase of proposed project is given below in Table 9.2

EIA for proposed jetty at Korlai River and expansion of existing jetty at Sanegaon by Indo Energy International Ltd.
TEPL/ENV/CBS/2021‐05 209
Table 9.2: EMP for Operation Phase
Sr. No. Environment Management Aspects
Measures to be Monitored
Action Plan Frequency Resources Required
Responsibility
1. Air monitoring for PM10 and PM2.5 (dust emission)
Air quality
1. Vegetation cover 2. Enforcing different
control measures to check pollution Regularly (as
required)
Periodic maintenance of vegetation cover.
Promoter and Contractor in consultation with MPCB
2. Road Safety and Traffic Management Traffic management
1. Adequate number of proper & legible signs will be installed along the road.
2. Prepare and administer a monitoring system on road/ accidents.
Regularly (as required) Skilled workforce
Promoter and Contractor in consultation with Public Works Department and State Traffic Police
3. Marine environment
Water & sediment physio‐chemical parameter (as per CPCB norms)
1. Regulation of ship waste2. Provision of storm water
drainage system 3. Follow MARPOL norms
Regularly (as required)
1. Proper record maintenance of waste regulation.
2. Maintenance of drainage system.
Promoter through prospective contractor

EIA for proposed jetty at Korlai River and expansion of existing jetty at Sanegaon by Indo Energy International Ltd.
TEPL/ENV/CBS/2021‐05 210
Sr. No. Environment Management Aspects
Measures to be Monitored
Action Plan Frequency Resources Required
Responsibility
4 Solid and liquid waste Waste management
1. Strict following of solid waste & liquid waste management at site 2. Follow MARPOL norms
Regularly (as required)
Dustbins, waste collector
Promoter through prospective contractor
5
Occupational Health and Safety health of worker and
accidents at site Provision of PPE/PPA to workforce Regularly
Personal protective equipment’s(PPE)/ Personal protective apparel(PPA) and training
Promoter through prospective contractor

EIA for proposed jetty at Korlai River and expansion of existing jetty at Sanegaon by Indo Energy International Ltd.
TEPL/ENV/CBS/2021‐05 211
9.5. DETAILS OF MANAGEMENT PLANS
9.5.1. WATER MANAGEMENT
The water constitutes one of the major component and its consumption and generation of waste accounts for the major environmental factor. The water management includes source of raw water, storage and treatment of raw water and its consumption in various uses. Generation of used / waste water, its treatment and disposal, recycling/ reused possibilities. It is a prime concern and duty of the project proponent to initiate and implement a proper water management plan during construction and operational phases. A water storage system to meet the demands of the proposed facilities can be created with a connection from the main supply line of MIDC / MJP. During construction phase most of the water will be required for the various construction activities, hydraulic tests etc. and also for labour camp. The water consumption during the operational phase will be consumed for domestic purposes.
During operation phase, sewage generated will be treated in sewage treatment plant and treated wastewater will be reused in gardening and for dust suppression. The sludge from sewage treatment will be used as manure. The effluent from coal stack yard will be collected in clarifier wherein clear water will be reused for sprinkling purposed and dust particles will be resend in coal stack yard. A drainage system will be provided with buried perforated drain lines connected to open concrete trenches.
9.5.2. CONTROL OF WATER POLLUTION FROM MARINE TRANSPORTATION
The International Convention for the Prevention of Pollution from Ships, 1973, as modified by the protocol of 1978 (MARPOL, 73/78), has issued guidelines for prevention of Marine Pollution. Some of the guidelines applicable for the proposed project are listed as below and should be strictly adhered to for prevention of marine pollution.
Ships are prohibited to discharge oil or oily water such as oily bilge water containing more than 15 ppm of oil within 19 km (12 miles) of land
Sewage generated at the ship should not be disposed off into the sea, unless it is treated or it is disposed off at a certain distance from land
No ballast water containing harmful aquatic organisms or pathogens may be discharged from a vessel into waters.
All vessels must be operated in compliance with the requirements specified in that marine pollution prevention Convention.
A person wishing to discharge a pollutant or harmful substance for the purpose associated with responding to a specific pollution incident shall apply in writing to the Director for a Discharge Permit and shall provide the required information

EIA for proposed jetty at Korlai River and expansion of existing jetty at Sanegaon by Indo Energy International Ltd.
TEPL/ENV/CBS/2021‐05 212
All vessels will comply with all of the design and pollution prevention equipment provisions specified in that Convention.
Garbage produced on ship must be kept on board and discharged either ashore or into the sea under certain conditions, such as distance from the land; discharge of all plastics is prohibited.
Water Conservation Management Plan
It will be the prime duty and concern of the promoters to scientifically planned water conservation and its management. Water conservation plans consists of recycling of wastewater, enforcing alternative sources of water and reduction or minimization of water consumed.
Water consumption minimization
This can be achieved by using various water saving appliances and water management measures in a planned way. The water management measures message will be spread to all users by way of signage and awareness posters at the proper locations. Specific measures that will be implemented include the following:
Reduce toilet cistern volume in single flush models Promote awareness on water conservation and reducing water wastage. Drip irrigation system shall be used for lawns and other green area. Drip irrigation can
save between 15‐40% of the water use, compared with other watering techniques. Use of low‐ volume, low‐ angle sprinklers for lawn areas. Select controllers with adjustable watering schedules and moisture sensors to account for
seasonal variations, and calibrate them during commissioning.
9.5.3. SOLID AND HAZARDOUS WASTE MANAGEMENT PLAN
The project development will be carried out in phases. The port will generate floating population, thus the quantity of waste generated will vary. However, on an average waste generation will be constant, and a broad outline on reducing the effect of solid waste on the environment is given below.
During construction phase, the project site will generate large amount of waste. The solid wastes will be generated in the form of dredged material during construction and dredging activities. Wastes from construction activity includes, construction debris and other waste. The following section discusses management of each type of waste. Being predominantly inert in nature construction and demolition waste does not cause chemical or biological pollution. Hence, maximum effort should be done to reuse the waste.

EIA for proposed jetty at Korlai River and expansion of existing jetty at Sanegaon by Indo Energy International Ltd.
TEPL/ENV/CBS/2021‐05 213
The dredged material generated during maintenance dredging will mainly consist of soft silty clay which shall be reused for reclamation and remaining waste will be disposed off in deep sea.
Saleable items such as metal scrap should be kept separately and cleared off as soon as possible.
Large unusable material should be sent for land filling in designated areas of Municipal Corporation.
Recycled aggregate will be used for filter application, and as a sub‐base for road construction. Mixed debris with high gypsum, plaster shall not be used as fill, as they are highly susceptible to contamination, and will be given to recyclers.
Bricks and rubbles can be used as fill material at project site or sold to vendors and builders.
During construction also this management practice would be implemented. Non‐reusable waste will be disposed of at approved dumping ground and landfills.
In the operation phase only organic and in organic waste will be generated from proposed Project. Apart from organic waste or food scrap there will be paper and plastics in considerable amount.
MoEFCC formulate the draft Municipal Solid Waste (Management and Handling) Rules in September 1999 and subsequently notified the MSW rules in September 2000. The management of MSW is covered under the schedule II of the Rules and provides directions for segregation, collection, storage, transportation, processing and disposal of waste.
9.5.4. OTHER WASTE
Construction sites are sources of some toxic substances, such as paints, solvents, adhesives and sealants. Empty containers of these substances shall be returned back to the manufactures or dealers as the case may be.
Some management practices to be developed are:
Paint brushes and equipment for water and oil based paints shall be cleaned within a contained area and shall not be allowed to contaminate site soils, watercourses, or drainage systems.
Provide adequate hazardous waste storage facilities and taking away by the supplier any balance material after use.
Clearly label all hazardous waste containers with the waste being stored and the date of generation.
Educate employees and sub‐contractors on hazardous waste storage.

EIA for proposed jetty at Korlai River and expansion of existing jetty at Sanegaon by Indo Energy International Ltd.
TEPL/ENV/CBS/2021‐05 214
Instruct employees and sub‐contractors in identification of hazardous and solid waste
9.5.4.1. Public Awareness
Public awareness will be there on waste segregation and disposal rules. The residents, workers and staff periodic awareness talks will be given waste management. Signboards and information boards will be put up in required area in English and local language (Marathi).
9.5.4.2. Waste Segregation
The debris generated due to dredging will be majorly used for reclamation of backup area of the port and the balance is to be disposed in deep sea. The other solid waste will be segregated. Recyclable waste will be disposed of through approved vendors and remaining waste will be disposed off though approved facility.
9.5.4.3. Waste treatment and disposal
During construction phase sewage will be generated from workers camp which will be treated in STP. Total sewage generation during operation phase will be 28.3 m3/day. Sewage Treatment Plant of capacity 30 m3/day will be provided to treat the sewage. Treated sewage will be used for gardening, dust suppression and the sludge will be used as manure. In any case there will be no disposal of treated sewage in marine water. Water mixed with coal particles during sprinkling will be collected through channel along the storage into a clarifier system wherein water and coal dust will be separated. Clear
9.5.5. ENERGY CONSERVATION
Energy conservation measures are often the easiest, quickest and cheapest way to reduce costs and be environmentally pro–active. Energy conservation program will be implemented through measures taken both on energy demand and supply.
Supply Energy Conservation
Demand
Utilize energy –efficient diesel generators
Exploring the possibilities of introducing renewable energy
Reduce Consumption Use energy efficient appliances Create Guest Awareness Segregation of Areas for light
points

EIA for proposed jetty at Korlai River and expansion of existing jetty at Sanegaon by Indo Energy International Ltd.
TEPL/ENV/CBS/2021‐05 215
Figure 8.1: Energy Conservation Model
Energy conservation will be one of the focuses during the complex planning and operation stages. The conservation efforts would consist of the following:
Architectural design
Maximize the use of natural lighting through design Energy Saving Practices
Purchase of energy efficient appliances Constant monitoring of energy consumption and defining targets for energy conservation Adjusting the settings and illumination levels to ensure minimum energy used for desired
comfort levels. Use of compact fluorescent lamps and low voltage lighting Sunscreen films on windows to reduce heating inside the building
Behavioral Change on Consumption
Promoting awareness on energy conservation among the employees and staff. Training staff on methods of energy conservation and to vigilant to such opportunities.
9.5.6. PLANTATION, LANDSCAPING AND ECOLOGICAL MANAGEMENT
During the construction phase, following precautions should be followed:
Restriction of construction activities to defined project areas, which are ecologically less sensitive.
Restriction on location of labour camps and offices for project staff near the project area to avoid human induced secondary additional impacts on the flora and fauna species.
Cutting, uprooting, coppicing of trees or small trees present in and around the project site for cooking, burning or heating purposes by the labors will be prohibited and suitable alternatives for this purpose will be found.
After completion of major construction work, the green belt will be developed with recommended plant species, as there will be no or less disturbance in these areas.
Cutting, uprooting of existing plants in the periphery will be prohibited and other plants in the site will be minimized.
After completion of soil work, temporary vegetation preferably grasses to be planted to minimize soil erosion.

EIA for proposed jetty at Korlai River and expansion of existing jetty at Sanegaon by Indo Energy International Ltd.
TEPL/ENV/CBS/2021‐05 216
During, operation phase, enhancement of the current ecology at the site will be done through the following measures:
Plantation and Landscaping Green belt development
In green belt development, a suitable plantation matrix will be adopted for the green belt development. It will also include earth filling and providing manure, which may be required for the proper nutritional balance and nourishment of the sapling.
9.6. ENVIRONMENT MANAGEMENT COST
An effective Environmental Management Plan (EMP) is proposed for the construction phase and operational phase of the project to conserve the environment at site. . The total cost of the project is INR 2000 Crores. For Phase I – INR 1160.83 Cr, For Phase II‐ INR 408.70 Cr, For Phase III‐ INR 430.70 Cr. The cost estimates for implementing EMP during construction phase shall be Rs. 21.10 lakh and for operation phase shall be 10.00 lakh. The details of EMP are as under Table 9.3 and Table 9.4
Table 9.3 Budgetary rovision for EMP during Construction Phase
SN Parameter Total Cost Rs. (in lakhs)
1 Pollution Control Measures Water sprinklers for dust control 02.00 Acoustic enclosures 01.20 Solid Waste Management 00.40 For marine‐ silt curtain 07:50 2. Environmental Monitoring (As per CPCB norms) 03.00 3 Occupational Health & Safety Measures Personal Protective Equipment 01.00 Health Check Up 01.50 Fire Management 01.50 EHS Training Programs 03.00 Total cost 21.10
Table 9.4 Budgetary Provision for EMP during Operation Phase
SN Parameter Total Cost Rs. (in lakhs)/year
1. Environmental Monitoring (As per CPCB norms) 03:00 2. Solid & Liquid Waste Management 01:00 3. EHS Training Programs & Health Check Up 05:00 4. Miscellaneous 01:00

EIA for proposed jetty at Korlai River and expansion of existing jetty at Sanegaon by Indo Energy International Ltd.
TEPL/ENV/CBS/2021‐05 217
SN Parameter Total Cost Rs. (in lakhs)/year
Total Cost 10.00
The Environmental Management Plan should be effectively implemented so that maximum benefit could be achieved
9.6.1. ENVIRONMENTAL TRAINING
The Environment Management Cell (EMC), in addition to implementing and monitoring different environmental attributes, will also be actively involved in imparting training and raising environmental awareness of Construction Engineers/ Contractors and other staff members/ workers so as to enable them take the environmental aspects into consideration as and when required. In the long run, the EMC can impart additional and specialized training in environmental management of the road and building construction system.

EIA for proposed jetty at Korlai River and expansion of existing jetty at Sanegaon by Indo Energy International Ltd.
TEPL/ENV/CBS/2021‐05 218
Chapter10Summary&Conclusion

EIA for proposed jetty at Korlai River and expansion of existing jetty at Sanegaon by Indo Energy International Ltd.
TEPL/ENV/CBS/2021‐05 219
10. SUMMARY & CONCLUSION
10.1. SUMMARY
The IEIL proposes to develop Deep Water Jetty facility on Kundalika River, village Korlai, district Raigad, Maharashtra and capacity expansion at existing Inland Water Jetty Facility, on Kundalika River at village Sanegaon, district Raigad, Maharashtra. The proposed port will be developed in 3 phases, at Korlai Phase I‐9.25 MMT, Phase II‐16.75 MMT, Phase III‐23.50. Geographical coordinates of project is 18°32’ 10.92” N, 72°55’ 11.65” E. Capacity expansion at Sanegaon will be achieved by all year round operations as mother vessels will discharge at Korlai Jetty, by using bigger size barges of 4500 DWT and by dredging of channel from Korlai to Sanegaon to 3.1 m CD.
IEIL is presently engaged in transportation and trading of Coal using lighterage facility at Sanegaon, located on the Right Bank of the Kundalika River, about 50 km south of Mumbai by sea and about 130 km by road. IEIL intends to expand the facility to include the coal required for the proposed power plant planned to be located close to the riverine facility at Sanegaon. The existing Jetty is about 21 km upstream on the right bank of the river Kundalika and is about 200 m long with a backup area of about 5 hectare for storage, handling and dispatch of material. The clear span between the intermediate bridge piers is 36 m in the road bridge across the Kundalika River at Revdanda.
The proposed project attracts Environment clearance under Sector 33 and falls in category A as per EIA Notification 2006 and its subsequent amendments as project attracts general condition.
Further it also attracts CRZ Clearance under CRZ notification 2011. The proposed deep water jetty facility project falls under CRZ IVB, II and IB according to the CRZ map, whereas, capacity expansion of existing inland water jetty facility at Sanegaon falls under CRZ III, CRZ I. The CRZ map (HTL/LTL Demarcation) for this project is prepared by National Centre for Sustainable Costal Management (NCSCM) Chennai.
Public Consultation was carried out at two different locations for Korlai and Sanegaon projects. First public hearing for Korlai Project was held at Mount Carmel High School, on 19.11.2016, Second hearing was held for Sanegaon Project on 21.11.2016 near project site respectively and public MoM of same is published by MPCB (Raigad II SRO).
As per EIA Notification 2006 and its amendments, ToR application were submitted to MoEFCC for grant of ToR on 10th November 2015 and further presentation was held in EAC meeting on 21st and 22nd December 2015, TOR was issued on 28th January, 2016 vide letter no. F. No.10‐34/2015‐IA.III and extended by one year in 2019.
The proposed project involves development of the jetty about 525 m long with one 8 m x 8 m mooring dolphin on the east side. The project will involve dredging a 14.5 km channel requiring 11 million cum of dredging for a depth of 11.0 m CD in Phase I. In second phase channel length would increase to 17.5 km and would require 23 million cum (i.e. 12 million cum additional) of dredging for a channel depth of 14.6 m CD. In the final phase the channel length would increase to 21.5 km and would require 35.5 million cum

EIA for proposed jetty at Korlai River and expansion of existing jetty at Sanegaon by Indo Energy International Ltd.
TEPL/ENV/CBS/2021‐05 220
(i.e. additional 12.5 million cum) dredging for a channel depth of 19.0 m CD and Dredging of 0.99 Mm3 in the inner channel from Korlai to Sanegaon for a depth of 3.1 m CD.
The salient features of proposed facility are as following:
a. The Jetty will be provided with mobile harbour cranes in the first phase and with fixed ship unloaders in the final phase.
b. The equipment will discharge in to hoppers and through covered conveyors to the covered stock yard.
c. Dust suppression mechanisms would be in place. d. Palletized cargo and containers would be handled using mobile harbour cranes and taken to the
yard by tractor‐trailers. e. The cargo receipt and dispatch would be fully mechanized. f. The barge loading system would be installed for emission free loading.
Local labours will be hired during construction phase and operation phase. Total manpower requirement for construction phase will be about 850 and operation phase will be 350 no.
The total water requirement, the per capita consumption for the in port consumption is taken as 90 liters per day. The occupancy is taken as 350 in the port. Total consumption will be 31, 500 liters per day. The water requirement shall be sourced from MIDC or irrigation department.
During construction phase sewage will be generated from workers camp which will be treated in STP. Total sewage generation during operation phase will be 28.3 m3/day. Sewage Treatment Plant of capacity 30 m3/day will be provided to treat the sewage. Treated sewage will be used for gardening, dust suppression and the sludge will be used as manure. In any case there will be no disposal of treated sewage in marine water. Water mixed with coal particles during sprinkling will be collected through channel along the storage into a clarifier system wherein water and coal dust will be separated.
For power requirement, it is proposed that the incoming HT supply is taken from the nearest substation at voltage level of 33 KV. Single transformer of capacity of 33 KV/ 11 KV, 12 MVA oil filled out door type shall be installed. A 33 KV switch yard is to be set up near to the Port area from where three or four 11 KV feeders are taken to feed the port equipment. 33 KV and 1l KV control rooms are required near the yard. 11 KV supply will feed Transformers for Dry Bulk Terminal (Iron Ore), Dry Bulk Terminal (Coal) and common utility. Each Transformer size could be selected based on the individual total connected load.
The debris generated due to dredging will be majorly used for reclamation of backup area of the port and the balance is to be disposed in deep sea at designated area. The other solid waste will be segregated. Recyclable waste will be disposed of through approved vendors and remaining waste will be disposed off though approved facility.
The project implementation schedule will be of 30 months. The total cost of the project is INR 2000 Crores. For Phase I – INR 1160.83 Cr, For Phase II‐ INR 408.70 Cr, For Phase III‐ INR 430.70 Cr.

EIA for proposed jetty at Korlai River and expansion of existing jetty at Sanegaon by Indo Energy International Ltd.
TEPL/ENV/CBS/2021‐05 221
Primary and secondary data were used to assess the environmental impacts of the proposed project. The environmental impacts were anticipated in a comprehensive manner.
The baseline data was studied for understanding the existing environmental setting of the study area (within 10 km radius of the proposed project site).
Monitoring (sample collection and analysis) by NABL approved lab was done in pre‐monsoon and post‐monsoon season; the following environmental components were studied:
Land Soil environment Water environment Marine environment Biological environment Air environment Noise Socio‐economic status
Baseline data analysis showed most of the parameters of the environmental components to be within the prescribed limits.
The anticipated impacts on the environmental, social and health components associated with the proposed project were identified and mitigation measures are proposed for the same. Marine water quality and biology is likely to be impacted during construction phase.
As part of mitigation measures with respect to environmental, social and health impacts identified for the proposed project, the environmental management plan is prepared to minimize the impact of atmospheric emissions, spillage, solid wastes & noise generation on the surrounding environment during the construction and operation phase.
The cost estimates for implementing EMP shall be INR 1.5 Crores. The cost includes solid waste management, installation of sanitary facilities, STP, ETP, noise meters green belt development etc. The cost required for implementation of Environmental Monitoring Programme for marine ecology and ambient air quality during construction phase is INR 35 lacs.
The cost required for implementation of Environmental Monitoring Programme for marine water quality, ambient air quality monitoring and effluent management from coal stack yard during operation phase is INR 75 lacs per annum.
The cost estimates for implementing EMP during construction phase will be Rs. 21.10 lakhs and Rs. 10.00 lakhs during operation phase.
As a responsible corporate, M/s Indo‐Energy International Limited would integrate its environment, HR and ethical business policies with appropriate community engagement and gender equity. The major social sectors IEIL would emphasize for the local community developments are Education,
EIA for proposed jetty at Korlai River and expansion of existing jetty at Sanegaon by Indo Energy International Ltd.
TEPL/ENV/CBS/2021‐05 222
Water Sanitation, Health, Livelihood and Empowerment, Sports, Environment, and Infrastructure Development. The total budgetary cost towards the CSR plan to be implanted is INR 40 Cr.
Additionally, the proposed project will provide direct and indirect employment to skilled/unskilled and semiskilled labourers to about 1200 pople. Directly boost defence infrastructure which will indirectly provide social benefits during national emergency too.
10.2. CONCLUSION
From the Environmental Impact Assessment study, it can be concluded that this project under consideration will not have any significant negative impacts. All possible environment aspects have been adequately assessed and necessary control measures have been formulated to meet the statutory requirements. Thus implementing this project will have positive impacts.

EIA for proposed jetty at Korlai River and expansion of existing jetty at Sanegaon by Indo Energy International Ltd.
TEPL/ENV/CBS/2021‐05 223
Chapter11DISCLOSURE
OFCONSULTANTS

EIA for proposed jetty at Korlai River and expansion of existing jetty at Sanegaon by Indo Energy International Ltd.
TEPL/ENV/CBS/2021‐05 224
11. DISCLOSURE OF CONSULTANTS
11.1. ABOUT CONSULTANT
M/s. Terracon Ecotech Pvt. Ltd. (TEPL) has created a visible difference in the domain of ecology, biodiversity, environment and sustainability since its formation in 2008. Having worked and completed more than 80 projects with 40+ clients spread over 12 states of India has resulted in country wide exposure and experience. An experienced team of experts (both in‐house and empaneled) that intersect science/research, business and advocacy provides much needed balance to understand and create client specific solutions in the areas of environment, sustainability and natural resource management.
TEPL is a BIS quality approved certified (ISO 9001:2008) firm which favors the sustainable management of natural resources as well as the protection of the environment. In its recognition of humanity as a participant in ecosystems, the movement is centered on ecology, health and human rights. Conservation of environment simply implies the sustainable use as well as management of natural resources which include wildlife, water, air, and earth deposits.
11.2. ACCREDITATION OF ORGANISATION
TEPL mission is to serve government and industries with its technical and business knowledge in delivering sustainable solutions that ensure growth in their economic, social and natural capital.
M/s. Terracon Ecotech Pvt. Ltd. (TEPL) 202, Kingston Tejpal road, Vile Parle (East), Mumbai is accredited under QCI‐NABET Accreditation Scheme for EIA Consultant Organization (Version 3). Certificate No. NABET/EIA/1619/RA 0029, Issue date: 14th Feb 2017, Category ‘A’.
Organization’s aim to be India’s leading ecological solutions & natural resource management strategic consultancy firm. Its strengths include its technical knowledge and capabilities in the domain of ecology, botany, agriculture and environmental science, as well as its deep understanding of today’s sustainability issues and ability to design forward‐thinking sustainability strategies.
11.3. SERVICES
TEPL services and offerings i.e Urban Ecology, Biodiversity Conservation, Marine Ecology, Natural Resource Management, Ecological Restoration, Energy Management, Sustainability & Climate Change, Renewable Energy, Carbon Advisory & Environmental Finance Services are suitable for Central Government, State Governments, Local Governments, Zilla Parishads, Municipal Corporations, as well as Panchayats, Non – Government Organizations, Industrial projects.

Annexure 1
Awarded ToR

Scanned by CamScanner

Scanned by CamScanner

Scanned by CamScanner

Scanned by CamScanner
Annexure 2
Ship tranquillity study

Mathematical Model Studies for the Development of the Direct Berthing Deepwater Jetty inside the Revadanda Creek and the Inland Water Facility at Sanegaon, Raigarh, Maharashtra
Mathematical Modelling
Final Report
June 2016

This report has been prepared under the DHI Business Management System certified by BVC to comply with ISO 9001 (Quality Management), ISO 14001 (Environmental
Management), OHSAS 18001 (Health and Safety Management)
Approved by Dr. Flemming Jakobsen Managing Director

DHI (India) Water & Environment Pvt Ltd•NSIC Bhawan, IIIrd Floor, NSIC-STP Complex•Okhla Industrial Estate•IN-11 00 20New Delhi• India
Telephone: +91 11 4703 4500 • Telefax: +91 11 4703 4501 • • www.dhigroup.com
Mathematical Model Studies for the Development of the Direct Berthing Deepwater Jetty inside the Revadanda Creek and the Inland Water Facility at Sanegaon, Raigarh, Maharashtra
Mathematical Modelling
Final Report
June 2016
Prepared for Indo Energy International Ltd.
and their consultants C-Borne Services Represented by Capt. R.K. Karnal (IEIL)
Report authors Dr. Ruchi Kalra, Dr. Susant K Misra, Mr. V. Jinesh Kumar, Mr Arjun S
Quality assurance Dr. Flemming Jakobsen, Managing Director
Project number 63801014
Approval date 15th June 2016
Revision A
Classification Confidential

© DHI. All rights reserved. No parts of this document may be reproduced, transmitted or otherwise disseminated in any form or by any means outside the recipient’s organisation without the prior written permission of DHI.
i
CONTENTS
1 Introduction ............................................................................................. 1 1.1 DHI Project ............................................................................................................... 1 1.2 Background .............................................................................................................. 1 1.3 Scope of Work ......................................................................................................... 2 1.3.1 Secondary data collection and review ..................................................................... 2 1.3.2 Numerical modelling ................................................................................................ 3 1.4 Outline of the report ................................................................................................. 3
2 Site Conditions ........................................................................................ 4 2.1 General .................................................................................................................... 4 2.2 Shoreline Environment ............................................................................................. 5 2.3 Tides ........................................................................................................................ 7 2.4 Wind ......................................................................................................................... 8 2.5 Wave Climate - Offshore conditions ........................................................................ 8 2.6 Storms/Cyclones ...................................................................................................... 8
3 Analysis of Secondary Data ................................................................. 10 3.1 Data provided by the client .................................................................................... 10 3.2 Secondary Wind and Wave Data procured by DHI ............................................... 11 3.2.1 Wind Data Analysis ................................................................................................ 11 3.2.2 Offshore Wave Data Analysis ................................................................................ 24
4 Numerical Modelling Studies ................................................................ 48 4.1 Hydrodynamic Modelling ........................................................................................ 48 4.1.1 Bathymetry ............................................................................................................. 48 4.1.2 Boundary Conditions .............................................................................................. 56 4.1.3 Bed Resistance ...................................................................................................... 56 4.1.4 Production Period .................................................................................................. 56 4.1.5 Model Calibration and Validation ........................................................................... 56 4.1.6 Model Results ........................................................................................................ 59 4.2 Spectral Wave Modelling ....................................................................................... 76 4.2.1 Bathymetry ............................................................................................................. 76 4.2.2 Boundary Conditions .............................................................................................. 79 4.2.3 Wind Forcing .......................................................................................................... 81 4.2.4 Spectral Wave Model Calibration and Validation................................................... 81 4.2.5 Wave Model Results for proposed facility .............................................................. 85 4.3 Wave tranquillity at the proposed facility ............................................................... 90 4.4 Downtime Study ..................................................................................................... 90 4.5 Cyclone Modelling .................................................................................................. 90 4.5.1 Tropical Cyclone Tracks ........................................................................................ 90 4.6 Sediment Transport modelling ............................................................................... 95 4.7 Shoreline changes ................................................................................................. 98 4.8 Dredge Disposal modelling .................................................................................... 99
5 Conclusion ........................................................................................... 101

ii
LIST OF FIGURES Figure 1.1 Location of present unloading facility at Sanegaon on the West Coast of India ..... 1 Figure 2.1 Location of Proposed facility off the mouth of Kundalika River ............................... 4 Figure 2.2 Existing JSW Revdanda port facility at Maharashtra coast ..................................... 5 Figure 2.3 Local Bathymetry off Revdanda ............................................................................... 6 Figure 2.4 Local Bathymetry showing very near to the study area ........................................... 6 Figure 2.5 Local Bathymetry showing very near to the prosed facility and existing JSW jetty. 7 Figure 2.6 Tracks of the cyclones passed through the study area during 1915 to 2014 .......... 8 Figure 3.1 Location of the different data bases ....................................................................... 10 Figure 3.2 Extraction Location of UKMO data ........................................................................ 11 Figure 3.3 Rose (speed and direction) of wind data for 1 January 2006 to 31 December
2015 ....................................................................................................................... 12 Figure 3.4 Scatter Plot of wind data for 1 January 2006 to 31 December 2015 ..................... 12 Figure 3.5 Annual wind roses wind data from 1 January 2006 to 31 December 2015
(Direction coming from) .......................................................................................... 13 Figure 3.6 Monthly Rose (January- August) of wind data from 2006 - 2015 (Direction coming
from) ....................................................................................................................... 14 Figure 3.7 Monthly Rose (November - December) of wind data from 2006 – 2015 (Direction
coming from) .......................................................................................................... 15 Figure 3.8 Percentage of exceedance probability of wind speed based on UKMO (2006 -
2015) ...................................................................................................................... 23 Figure 3.9 Rose plot (Significant wave height and direction) for the period 1 January 2006 to
31 December 2015 ................................................................................................ 25 Figure 3.10 Scatter Plot (Significant wave height and direction) for the period 1 January 2006
to 31 December 2015 ............................................................................................ 25 Figure 3.11 Rose plot (Peak wave period and direction) for the period 1 January 2006 to 31
December 2015 ..................................................................................................... 26 Figure 3.12 Scatter Plot (peak wave period and direction) for the period 1 January 2006 to 31
December 2015 ..................................................................................................... 26 Figure 3.13 Rose plot (Zero crossing wave period and wave direction) for the period 1 January
2006 to 31 December 2015 ................................................................................... 27 Figure 3.14 Scatter Plot (Zero crossing wave period and direction) for the period 1 January
2006 to 31 December 2015 ................................................................................... 27 Figure 3.15 Annual Wave Roses of significant wave height (m) from 1 January 2006 to 31
December 2015 ..................................................................................................... 28 Figure 3.16 Monthly Rose (January- October) of significant wave height from 2006 to 2015 .. 29 Figure 3.17 Monthly Rose (November - December) of significant wave height from 2006 to
2015 ....................................................................................................................... 30 Figure 3.18 Monthly Rose (January-October) of peak wave period from 2006 to 2015 ........... 30 Figure 3.19 Monthly Rose (November-December) of peak wave period from 2006 to 2015 ... 31 Figure 3.20 Percentage of exceedance probability for significant wave height for the period of
1 January 2006 to 31 December 2015 .................................................................. 47 Figure 3.21 Percentage of exceedance probability for peak wave period for the period of 1
January 2006 to 31 December 2015 ..................................................................... 47 Figure 4.1 Water depth points with tidal stations (source: C-map) ......................................... 49 Figure 4.2 Snapshot of water elevation at Arnalapada, Vasai, Bandra & Apollo Bandra
(source: C-map) ..................................................................................................... 50 Figure 4.3 Snapshot of water elevation at Trombay, Mora Bandar, Revas Bandar &
Revadanda (source: C-map) .................................................................................. 51 Figure 4.4 Snapshot of water elevation at Murud-janjira harbour, Bankot, Port Dabhol &
Jaigarh (source: C-map) ........................................................................................ 52 Figure 4.5 Snapshot of water elevation at Ratnagiri (source: C-map) .................................... 53 Figure 4.6 Bathymetry of a full model domain (HD Model). .................................................... 53 Figure 4.7 Zoom in figure of bathymetry snapshot including mesh ........................................ 54 Figure 4.8 Zoom in figure of bathymetry snapshot including mesh very near to approach
channel ................................................................................................................... 54

iii
Figure 4.9 Zoom in figure of bathymetry snapshot showing the location of the proposed facility ..................................................................................................................... 54
Figure 4.10 Bathymetry snapshot including the proposed facility ............................................. 55 Figure 4.11 Zoom in figure of bathymetry snapshot including proposed facility ....................... 55 Figure 4.12 Comparison of measured and simulated water level at the third pillar of the
Revdanda Bridge ................................................................................................... 57 Figure 4.13 Comparison of measured and simulated current speed at location CM1 .............. 57 Figure 4.14 Comparison of measured and simulated current direction at location CM1 .......... 58 Figure 4.15 Comparison of measured and simulated current speed at location CM2 .............. 58 Figure 4.16 Comparison of measured and simulated current direction at location CM2 .......... 58 Figure 4.17 Comparison of measured and simulated current speed at location CM3 .............. 59 Figure 4.18 Comparison of measured and simulated current direction at location CM3 .......... 59 Figure 4.19 Maximum current speed during NE monsoon with existing condition ................... 60 Figure 4.20 Zoom figure in Maximum current speed during NE monsoon with existing
condition ................................................................................................................. 60 Figure 4.21 Mean current speed during NE monsoon with existing condition .......................... 61 Figure 4.22 Zoom figure in mean current speed during NE monsoon with existing condition .. 61 Figure 4.23 Snapshot of current pattern during peak flood tide and NE monsoon with existing
condition ................................................................................................................. 61 Figure 4.24 Very close snapshot of current pattern during peak flood tide and NE monsoon
with existing condition ............................................................................................ 62 Figure 4.25 Snapshot of current pattern during the ebb flood tide and NE monsoon with
existing condition ................................................................................................... 62 Figure 4.26 Very close snapshot of current pattern during the ebb flood tide and NE monsoon
with existing condition ............................................................................................ 62 Figure 4.27 Location of extraction Points t1, t2, t3, t4 at existing condition .............................. 63 Figure 4.28 Time series corresponding to surface elevation at extraction locations for existing
conditions ............................................................................................................... 63 Figure 4.29 Time series corresponding to current speed at extraction locations for existing
conditions at t1. ...................................................................................................... 63 Figure 4.30 Time series corresponding to current speed at extraction locations for existing
conditions at t2. ...................................................................................................... 64 Figure 4.31 Time series corresponding to current speed at extraction locations for existing
conditions at t3. ...................................................................................................... 64 Figure 4.32 Time series corresponding to current speed at extraction locations for existing
conditions at t4. ...................................................................................................... 64 Figure 4.33 Time series corresponding to current direction at extraction locations for existing
conditions ............................................................................................................... 65 Figure 4.34 Rose corresponding to current speed at extraction locations for existing
condition ................................................................................................................. 65 Figure 4.35 Maximum current speed during NE monsoon with proposed facility ..................... 66 Figure 4.36 Zoom figure in Maximum current speed during NE monsoon with proposed
facility ..................................................................................................................... 66 Figure 4.37 Mean current speed during NE monsoon with proposed facility ........................... 67 Figure 4.38 Zoom figure in mean current speed during NE monsoon with proposed facility ... 67 Figure 4.39 Snapshot of current pattern during peak flood tide and NE monsoon with proposed
facility ..................................................................................................................... 68 Figure 4.40 Very close snapshot of current pattern during peak flood tide and NE monsoon
with proposed facility .............................................................................................. 68 Figure 4.41 Snapshot of current pattern during ebb tide and NE monsoon with proposed
facility ..................................................................................................................... 69 Figure 4.42 Very close snapshot of current pattern during ebb tide and NE monsoon with
proposed facility ..................................................................................................... 69 Figure 4.43 Location of extraction points t1, t2, t3, t4 ............................................................... 70 Figure 4.44 Rose corresponding to current speed at extraction locations with proposed facility
condition ................................................................................................................. 70 Figure 4.45 Extraction points for existing and proposed facility conditions .............................. 72 Figure 4.46 Extent of regional model domain ........................................................................... 77

iv
Figure 4.47 Extent of regional model domain with local boundary point .................................. 78 Figure 4.48 Extent of local model domain with existing condition ............................................ 78 Figure 4.49 Time series plots of Hs, Hmax, Tz and MWD at entrance of the approach
channel ................................................................................................................... 80 Figure 4.50 Time series comparison between measured and model simulated significant wave
height Hs [m] for locations CM2 ............................................................................. 81 Figure 4.51 Time series comparison between measured and model simulated significant wave
height Hs [m] for locations CM 3 ............................................................................ 82 Figure 4.52 Snapshot for nearshore wave transformation result (Maximum wave height) during
June 2015 (Existing Condition). ............................................................................. 83 Figure 4.53 Snapshot for nearshore wave transformation result (Significant wave height)
during June 2015 (Existing Condition). .................................................................. 83 Figure 4.54 Snapshot for nearshore wave transformation result (Zero crossing wave period)
during June 2015 (Existing Condition). .................................................................. 84 Figure 4.55 Snapshot for nearshore wave transformation result (mean wave direction) during
June 2015 (Existing Condition). ............................................................................. 84 Figure 4.56 Extent of regional model domain with proposed facility with mesh ....................... 85 Figure 4.57 Extent of local model domain with proposed facility without mesh ........................ 85 Figure 4.58 Snapshot for nearshore wave transformation result (Significant wave height)
during June 2007 (Proposed Condition). ............................................................... 86 Figure 4.59 Snapshot for nearshore wave transformation result (Significant wave height)
during June 2007 including extraction locations .................................................... 86 Figure 4.60 Snapshot for nearshore wave transformation result (maximum wave height) during
June 2007 for proposed condition ......................................................................... 87 Figure 4.61 Snapshot for nearshore wave transformation result (Zero crossing wave period)
during June 2007 for proposed condition .............................................................. 87 Figure 4.62 Snapshot for nearshore wave transformation result (mean wave direction) during
June 2007 for proposed condition ......................................................................... 87 Figure 4.63 The time series plot of significant wave height (Hs), Maximum wave height
(Hmax), Zero crossing wave Period (Tz), and mean wave direction (MWD) during 2006 at the four extraction locations. ..................................................................... 88
Figure 4.64 Synthetic cyclone track with satellite imagery ........................................................ 92 Figure 4.65 Model domain for Cyclonic condition with synthetic cyclone track ........................ 93 Figure 4.66 Snap short of storm surge near the proposed facility with extraction points ......... 94 Figure 4.67 Time series plot of storm surge near the proposed facility .................................... 94 Figure 4.68 Snap short of cyclonic waves near the proposed facility with extraction points .... 94 Figure 4.69 Time series plot of cyclonic wave heights near the proposed facility .................... 95 Figure 4.70 snapshot of bed level change for the existing condition ........................................ 96 Figure 4.71 Very close snapshot of bed level change for the existing condition ...................... 96 Figure 4.72 snapshot of bed level change for the proposed marine facility.............................. 97 Figure 4.73 Very close snapshot of bed level change for the proposed marine facility ............ 97 Figure 4.74 Bed level changes and sedimentation quantity for different section at proposed
marine facility ......................................................................................................... 98 Figure 4.77 Satellite imagery of the shoreline .......................................................................... 99 Figure 4.75 Dumping location of dredged materials ............................................................... 100 Figure 4.76 TO be updated after the model simulation is completed ..................................... 100
LIST OF TABLES Table 2.1 Tidal Levels at Revdanda ........................................................................................ 7 Table 2.2 Month wise distribution of storms that crossed within 150 km radius from the
proposed site during the period (1915–2014) .......................................................... 9 Table 3.1 UKMO wind statistics for the period of 1 January 2006 to 31 December 2015
(Direction coming from) .......................................................................................... 16 Table 3.2 UKMO wind statistics for the month of January 2006 to 2015 (Direction coming
from) ....................................................................................................................... 16

v
Table 3.3 UKMO wind statistics for the month of February 2006 to 2015 (Direction coming from) ....................................................................................................................... 17
Table 3.4 UKMO wind statistics for the month of March 2006 to 2015 (Direction coming from) ....................................................................................................................... 17
Table 3.5 UKMO wind statistics for the month of April 2006 to 2015 (Direction coming from) ....................................................................................................................... 18
Table 3.6 UKMO wind statistics for the month of May 2006 to 2015 (Direction coming from) ....................................................................................................................... 18
Table 3.7 UKMO wind statistics for the month of Jun 2006 to 2015 (Direction coming from) ....................................................................................................................... 19
Table 3.8 UKMO wind statistics for the month of July 2006 to 2015 (Direction coming from) ....................................................................................................................... 19
Table 3.9 UKMO wind statistics for the month of August 2006 to 2015 (Direction coming from) ....................................................................................................................... 20
Table 3.10 UKMO wind statistics for the month of September 2006 to 2015 (Direction coming from) ....................................................................................................................... 20
Table 3.11 UKMO wind statistics for the month of October 2006 to 2015 (Direction coming from) ....................................................................................................................... 21
Table 3.12 UKMO wind statistics for the month of November 2006 to 2015 (Direction coming from) ....................................................................................................................... 21
Table 3.13 UKMO wind statistics for the month of December 2006 to 2015 (Direction coming from) ....................................................................................................................... 22
Table 3.14 UKMO wave statistics (Significant wave height Vs Wave Direction) for the period of 1 January 2006 to 31 December 2015 .............................................................. 32
Table 3.15 UKMO wave statistics (Peak wave period; tp Vs significant wave height; Hs) for the period of 1 January 2006 to 31 December 2015 ............................................. 33
Table 3.16 UKMO wave statistics (Zero crossing wave period; tz Vs significant wave height; Hs) for the period of 1 January 2006 to 31 December 2015 ................................. 34
Table 3.17 Monthly UKMO wave statistics (Significant wave height Vs Wave Direction) for the month of January 2006 to 2015 ............................................................................. 35
Table 3.18 Monthly UKMO wave statistics (Significant wave height Vs Wave Direction) for the month of February 2006 to 2015............................................................................ 36
Table 3.19 Monthly UKMO wave statistics (Significant wave height Vs Wave Direction) for the month of March 2006 to 2015 ................................................................................ 37
Table 3.20 Monthly UKMO wave statistics (Significant wave height Vs Wave Direction) for the month of April 2006 to 2015 ................................................................................... 38
Table 3.21 Monthly UKMO wave statistics (Significant wave height Vs Wave Direction) for the month of May 2006 to 2015 ................................................................................... 39
Table 3.22 Monthly UKMO wave statistics (Significant wave height Vs Wave Direction) for the month of June 2006 to 2015 .................................................................................. 40
Table 3.23 Monthly UKMO wave statistics (Significant wave height Vs Wave Direction) for the month of July 2006 to 2015 .................................................................................... 41
Table 3.24 Monthly UKMO wave statistics (Significant wave height Vs Wave Direction) for the month of August 2006 to 2015 ............................................................................... 42
Table 3.25 Monthly UKMO wave statistics (Significant wave height Vs Wave Direction) for the month of September 2006 to 2015 ........................................................................ 43
Table 3.26 Monthly UKMO wave statistics (Significant wave height Vs Wave Direction) for the month of October 2006 to 2015 ............................................................................. 44
Table 3.27 Monthly UKMO wave statistics (Significant wave height Vs Wave Direction) for the month of November 2006 to 2015 ......................................................................... 45
Table 3.28 Monthly UKMO wave statistics (Significant wave height Vs Wave Direction) for the month of December 2006 to 2015 ......................................................................... 46
Table 4.1 Simulated water level and current pattern at different locations for existing conditions ............................................................................................................... 73
Table 4.2 Simulated water level and current pattern at different locations with proposed facility ..................................................................................................................... 74
Table 4.3 Standard deviation between existing and proposed facility ................................... 75

vi
Table 4.4 Comparison of wave characteristics at a deep water location with simulated & NIOT wave Atlas .................................................................................................... 82
Table 4.5 Percentage of occurrence for significant wave height Vs zero crossing wave period ..................................................................................................................... 89
Table 4.6 Percentage of occurrence for maximum wave height Vs zero crossing wave period ..................................................................................................................... 89
Table 4.7 Synthetic cyclones considered............................................................................... 91

1
1 Introduction
1.1 DHI Project
M/s C-Borne Services, Navi Mumbai has engaged DHI (India) Water and Environment Pvt Ltd. to carry out the mathematical modelling for development of the direct berthing deep-water Jetty inside Revadanda Creek at the confluence of the Kundalika River with sea and the Sanegaon facility. DHI (India) is submitting this final report according to the Scope of Work given below.
1.2 Background
C-Borne Services was appointed by Indo Energy International Ltd. (IEIL) as a consulting firm to conduct various studies for development of the direct berthing deep-water Jetty inside Revadanda Creek at the confluence of the Kundalika River with sea and the Sanegaon facility.
Indo-Energy Limited (IEIL), is presently engaged in transportation and trading of Coal using lighterage facility at Sanegaon, located on the Right Bank of the Kundalika River, about 50 km south of Mumbai as shown in Figure 1.1 below.
Figure 1.1 Location of present unloading facility at Sanegaon on the West Coast of India
IEIL intends to expand the facility to include the Coal required for the proposed Power Plant planned to be located close to the riverine facility at Sanegaon. The existing Jetty is about 21 km upstream on the right bank of the river Kundalika and is about 200 m long with a backup area of about 5 hectare for storage, handling and despatch of material.
The sizes of the barges moving in the River are largely controlled by the depth in the river and the navigation width offered by the bridge piers downstream of the River.
The clear span between the intermediate bridge piers is 36 m. In order to ensure safe navigation, the beam of the barges would have to be limited to about 15 to 16 m, especially

2
in the monsoon, when the higher current could affect the stability and navigational control of such vessels. The dimensions of the present day barges used by IEIL generally agree with the above assertion and are as follows:
1. Length over all (LoA): 60 m
2. Beam: 14 m
3. Loaded Draught: 3.8 m
4. Capacity: About 2500 DWT
The capacity of the present day operations is largely limited by the following three factors and has limited capacity of about 1 million tons of coal per year.
1. Handling of the coal at the anchorage which is non-operational for about 4 months during south west monsoon
2. Depth (Draught available in the river)
3. Capacity of the Barges
In order to improve the capacity of this transportation chain, following recommendations are proposed:
1. Ensure all year by shifting mother ship operations inside the creek
2. Undertake dredging wherever required to improve the available draught in the river
3. Modernise/ Mechanise handling system at the jetty
4. Rationalise dimensions of the barges to increase carrying capacity of the barges
1.3 Scope of Work
This main objective of this study is to conduct mathematical modelling study on waves, hydraulics and sediment transport, required to support a development expansion of the existing as well as the new facility inside the creek. Based on the objective following scope of work was defined for the present study. The scope of the study is as follows:
1.3.1 Secondary data collection and review 1. Collection and review of existing data delivered by the client , the head supplier or
the client and other relevant sources, preparation of data as input data for the numerical study and assessment of data quality for all modelling relevant input data.
2. Wind data: Secondary data of wind condition will be procured from UKMO or GROW (whichever is available) for a period minimum of 10 years.
3. Wave data: Secondary data for wave condition will be procured from UKMO or GROW (whichever is available) for a period minimum of 10 years.

3
1.3.2 Numerical modelling
1. Hydrodynamic model: Set-up of a 2-dimensional numerical hydrodynamic model and simulation of water levels and currents during one typical season conditions will be selected for the baseline conditions. The calibration will be based on existing site measurements of hydrodynamic processes. The HD-model will be the basis for all following models and simulations.
2. Cyclonic storm surge model: Setup and estimation of storm surge induced water levels and currents for near the proposed location.
3. Spectral wave model: Set-up of a 2-dimensional numerical spectral wave model and simulation of wave height, wave directions and periods for the baseline conditions. The calibration will be based on existing site measurements on waves.
4. Hydrodynamic and wave pre-study (For Phase 1): Pre-study of the hydrodynamics (HD) and waves (SW) including one concept plan for the development of jetty on an analysis for water levels, currents. The impacts of reclamation and dredging in the hydrodynamics will be examined
5. Sedimentation model: Based on the Set-up of the HD and the SW-Model from Point 3 and 4 a sedimentation model will be build-up. And the annual siltation in the deep channel and river channel will be simulated.
6. Dredge Disposal Study: The suitable dumping location for the dredge spoil will be identified.
7. Downtime study: The wave penetration inside the creek and the down time at the berth and the wave heights at the berth around the year will be determined.
8. Assessment of Shoreline Changes: Coastal Impact Assessment studies due to development of the facility will be done.
1.4 Outline of the report
The kick off meeting for the present project was held on the 17th March 2016. During the meeting the methodology and schedule for the execution of the project was presented.
The model relevant data was provided by the client through e-mail and the same was reviewed and prepared for numerical study.
Subsequent to the kick-off meeting, a review meeting was held on 6th May 2016. In the meeting preliminary Hydrodynamics and Wave results for baseline conditions were presented and phase wise layout development was discussed.
The present report on the study is divided in to the following sections;
Section – 2 : Site Conditions Section – 3 : Secondary Data Analysis and Reviews Section – 4 : Numerical Modelling Section – 5 : Conclusions

4
2 Site Conditions
2.1 General
The proposed Revdanda facility is located between geographical co‐ordinates of latitude 18° 32' 9.66"N, longitude 72°54' 54.88"E and latitude 18° 32' 11.82"N, longitude 72° 55' 11.71"E, on the left bank of the Kundalika River, North East of Rat Island (Figure 2.1).
The Revadanda creek formed by the confluence of the Kundalika River and the Arabian Sea is protected naturally from the predominant SW waves by the Korlai headland.
East of the proposed facility there is an existing JSW jetty which is a 235 m concrete block gravity wall Jetty with end radius at both ends of 7.5 m. JSW jetty has mooring dolphins which lie 21 m to the east, thereby increasing the total length of the jetty to 256 m. This Jetty is L shaped and both the faces of jetty are used for berthing of vessels. The north face accommodates two (2) unloading berths and one (1) loading berth. The Southern face of jetty is used for mooring of barges awaiting discharge, barges undergoing repairs and idle barges. The south face provides two berths. Existing JSW Revdanda Port facility is shown in Figure 2.2.
At the confluence of Kundalika River with sea, a shallow sandbar has been formed and depth over sandbar is only 0.5 to 1.5 m. In view of the limited depth, the port is used as lighterage port. Coal is transshipped in the selfpropelled RSV II/IV barges of capacity 2500 ‐ 2800 DWT from mother vessel at anchorage. A 100 m wide, 7 nautical miles long entrance channel leads from anchorage point to JSW jetty for safe navigation of barges.
A bridge exists on Kundalika River about 400 m east of existing JSW jetty.
Figure 2.1 Location of Proposed facility off the mouth of Kundalika River

5
Figure 2.2 Existing JSW Revdanda port facility at Maharashtra coast
2.2 Shoreline Environment
The bathymetry map extracted from DHI’s in-house tool C-map for Site location is shown in Figures 2.3 to 2.5. The bathymetry map indicates 10 m contour reaching within approx. 20 km from the mouth of the creek and shows offshore currents having a magnitude of approx. 0.5 knots.
It can be seen that the depths in the creek near the proposed port facility along the navigation channel vary from ‐3 m CD to ‐5 m CD.
The water depth in and around the existing JSW Revdanda jetty are of the order of ‐5 m CD. However, in the fairway the depths range from – 3 m CD to ‐5 m CD.
There are sandy shoals and pockets of shallower depths at the creek entrance and the depths reduce to about ‐0.5 m CD to ‐1 m CD.

6
Figure 2.3 Local Bathymetry off Revdanda
Figure 2.4 Local Bathymetry showing very near to the study area

7
Figure 2.5 Local Bathymetry showing very near to the prosed facility and existing JSW jetty.
2.3 Tides
The Naval Hydrographical Chart No 211 gives information on the tide and tidal levels and is reproduced in Table 2.1. The spring and neap tidal ranges are 2.6m and 1.6 m respectively.
Table 2.1 Tidal Levels at Revdanda
MHWS 3.6
MHWN 3.3
MSL 2.4
MLWN 1.7
MLWS 1.0
Generally in the narrow estuarine areas, spatial variation of tide is likely to be prominent and the area like Kundalika River is not an exception and there is significant variation in high water levels as one moves upstream compared to open area water levels. This results in increased tidal current upstream of river.

8
2.4 Wind
During the months of June, July and August, the wind direction is SW-WSW. For rest of the months, predominant wind direction is NNE-N-NNW in the area. The wind speed is less than 10 m/s for 95% of the time (Table 3.1). The wind roses and statistical analysis are given in Section 3.
2.5 Wave Climate - Offshore conditions
It may be seen that the predominant directions of waves in the deep sea are from SW. It can also be seen that waves are less than 2 m, 4 m, and 5 m in height for 76%, 97.0% and 99.8% of the time respectively. The wave roses and statistical analysis are given in Section 3.
2.6 Storms/Cyclones
The north Indian Ocean accounts for 7% of global tropical cyclones (ref /1/, Gray, W. M. 1968). More cyclones occur in the Bay of Bengal than in the Arabian Sea; the ratio of their respective frequencies is about 4:1 (ref /2/, Dube S.K. 1997).
The storm tracks and atmospheric conditions during storms are available with the India Meteorological Department. The best tracks recorded for the period 1916 to 2015 from (websites) India Meteorological Department (IMD, India) are given in Figure 2.6.
Figure 2.6 Tracks of the cyclones passed through the study area during 1915 to 2014
The number of cyclones that has occurred within the vicinity of 150 km to the proposed project locations between the years 1916 and 2015 are 6 and their month wise distribution is given in Table 2.2. The frequency of storms that crossed the proposed project region during the month of October and November is the highest (02) and the frequency during the months of May and June are significantly less (01 each), while no cyclone has crossed the coast in January to April, July to September and December.

9
Table 2.2 Month wise distribution of storms that crossed within 150 km radius from the proposed site during the period (1915–2014)
Months Cyclone crossed
January -
February -
March -
April -
May 01
June 01
July -
August -
September -
October 02
November 02
December -
Total 06

10
3 Analysis of Secondary Data
3.1 Data provided by the client
The following data relevant for the model calibration and validation has been provided by the Client and reviewed by DHI:
Tide data from 26 October 2015 to 16 November 2015.
Location of station: Revdanda Bridge-3rd Pillar
• Latitude: 18°32'19.48"N
• Longitude: 72°55'51.40"E Refer to Figure 3.1 for station location.
Currents data (Acoustic Doppler Current Profiler) from 26 October 2015 to 16 November 2015 Location of station: CM 1
• Latitude: 18°32'12.47"N
• Longitude: 72°54'52.62"E Location of station CM 2
• Latitude: 18°32'59.12"N
• Longitude: 72°53'55.88"E Location of station CM 3
• Latitude: 18°31'27.00"N
• Longitude: 72°48'32.00"E Refer to Figure 3.1 for all the three station locations.
Waves data at the same locations and for the same period where the currents data were
measured (see above current data details)
Figure 3.1 Location of the different data bases

11
3.2 Secondary Wind and Wave Data procured by DHI
DHI has procured offshore 3-hourly wind and wave data from the United Kingdom Meteorological Office (UKMO) which covers the period of 10 years from 1 January 2006 to 31 December 2015. UKMO data has been derived on the basis of a well-recognized regional wave hind cast model.
The UKMO data obtained for the extraction point 18°30'58"N and 72° 4'12.00"E (Figure 3.2) forms a very useful data set, particularly for transforming from deep water to shallow water location.
Figure 3.2 Extraction Location of UKMO data
3.2.1 Wind Data Analysis Offshore 3-hourly marine wind data from the UK Meteorological Office (UKMO) from January 2006 to June 2015 is procured.
It should be noted that since the UKMO data are offshore wind data, land and sea breeze effects are not represented in the data. Furthermore, due to the limited spatial and time resolution of the UKMO wave hind cast model, cyclones cannot be expected to be fully resolved in the data.
The UKMO wind rose and scatter plot generated from the UKMO wind fields for 1 January 2006 to 31 December 2015 is presented in Figures 3.3 and 3.4 respectively. The annual wind roses form January 2006 to 31 December 2015 is shown in Figure 3.5. Similarly, the monthly wind roses are shown in Figures 3.6-3.7 (for the data set of 1 January 2006 to 31 December 2015).
The corresponding statistical analysis of wind fields for 1 January 2006 to 31 December 2015 is presented in Table 3.1 and the monthly statistical analysis of wind fields for 1 January 2006 to 31 December 2015 are presented in Table 3.2 to 3.13. From the table it

12
is found that wind speeds are below 10 m/s for approx. 95% of the time. The corresponding percentage of exceedance probability of wind speed is given in Figure 3.8.
Figure 3.3 Rose (speed and direction) of wind data for 1 January 2006 to 31 December 2015
Figure 3.4 Scatter Plot of wind data for 1 January 2006 to 31 December 2015

13
Figure 3.5 Annual wind roses wind data from 1 January 2006 to 31 December 2015 (Direction coming from)

14
Figure 3.6 Monthly Rose (January- August) of wind data from 2006 - 2015 (Direction coming from)

15
Figure 3.7 Monthly Rose (November - December) of wind data from 2006 – 2015 (Direction coming from)

16
Table 3.1 UKMO wind statistics for the period of 1 January 2006 to 31 December 2015 (Direction coming from)
Wind Speed (m/s)
Percentage of Occurrence for Wind Direction (deg) %
From To 0 -22.5
22.5- 45
45-67.5
67.5-
90
90-
112.5
112.5-
135
135-
157.5
157.5-
180
180-
202.5
202.5-
225
225-
247.5
247.5-
270
270-
292.5
292.5-
315
315-
337.5
337.5-360.0
0 < 2 0.39 0.30 0.28 0.18 0.14 0.08 0.10 0.13 0.14 0.11 0.19 0.21 0.36 0.40 0.51 0.35 3.87
2 <4 3.05 1.90 0.99 0.36 0.25 0.16 0.11 0.14 0.16 0.31 0.86 1.61 2.61 2.61 2.70 2.82 20.64
4 <6 6.48 3.45 1.30 0.41 0.13 0.04 0.04 0.07 0.18 0.52 1.61 3.07 3.72 4.38 5.22 5.62 36.27
6 <8 4.48 2.17 0.60 0.26 0.05 0.06 0.09 0.06 0.13 0.43 2.19 4.16 1.81 1.51 2.61 2.94 23.54
8 <10 0.96 0.57 0.11 0.04 0.02 0.01 0.05 0.08 0.06 0.18 2.34 4.38 0.71 0.22 0.34 0.18 10.24
≥10 0.09 0.07 0.02 0.00 0.01 0.01 0.04 0.03 0.01 0.08 1.43 3.41 0.20 0.02 0.01 0.01 5.44
Total (%) 15.45 8.45 3.30 1.26 0.60 0.36 0.42 0.51 0.67 1.63 8.63 16.83 9.42 9.14 11.39 11.92 100.00
Table 3.2 UKMO wind statistics for the month of January 2006 to 2015 (Direction coming from)
Wind Speed (m/s)
Percentage of Occurrence for Wind Direction (deg) %
From To 0 -22.5
22.5- 45
45-67.5
67.5-
90
90-
112.5
112.5-
135
135-
157.5
157.5-
180
180-
202.5
202.5-
225
225-
247.5
247.5-
270
270-
292.5
292.5-
315
315-
337.5
337.5-360.0
0 < 2 0.48 0.40 0.28 0.24 0.16 0.00 0.08 0.04 0.04 0.00 0.12 0.04 0.20 0.16 0.44 0.40 3.10
2 <4 4.68 2.86 0.81 0.36 0.08 0.04 0.00 0.00 0.00 0.00 0.00 0.04 0.56 0.93 1.49 3.99 15.85
4 <6 16.73 7.66 2.10 0.48 0.08 0.00 0.00 0.00 0.00 0.00 0.00 0.00 0.08 0.97 2.54 8.43 39.07
6 <8 19.44 5.81 0.77 0.08 0.00 0.00 0.00 0.00 0.00 0.00 0.00 0.00 0.00 0.08 0.97 6.65 33.79
8 <10 4.84 1.94 0.20 0.04 0.00 0.00 0.00 0.00 0.00 0.00 0.00 0.00 0.00 0.00 0.16 0.32 7.50
≥10 0.24 0.36 0.04 0.00 0.00 0.00 0.00 0.00 0.00 0.00 0.00 0.00 0.00 0.00 0.00 0.04 0.69
Total (%) 46.41 19.03 4.19 1.21 0.32 0.04 0.08 0.04 0.04 0.00 0.12 0.08 0.85 2.14 5.60 19.84 100.00

17
Table 3.3 UKMO wind statistics for the month of February 2006 to 2015 (Direction coming from)
Wind Speed (m/s)
Percentage of Occurrence for Wind Direction (deg) %
From To 0 -22.5
22.5- 45
45-67.5
67.5-
90
90-
112.5
112.5-
135
135-
157.5
157.5-
180
180-
202.5
202.5-
225
225-
247.5
247.5-
270
270-
292.5
292.5-
315
315-
337.5
337.5-360.0
0 < 2 0.44 0.40 0.13 0.13 0.04 0.04 0.00 0.09 0.13 0.04 0.27 0.22 0.35 0.62 0.40 0.53 3.86
2 <4 3.10 1.60 0.89 0.13 0.18 0.04 0.00 0.04 0.00 0.13 0.04 0.49 1.29 2.48 6.03 5.32 21.76
4 <6 10.33 2.48 0.62 0.04 0.09 0.00 0.00 0.00 0.00 0.00 0.18 0.84 0.71 2.08 9.04 17.77 44.19
6 <8 7.89 1.68 0.22 0.04 0.00 0.00 0.00 0.09 0.00 0.00 0.00 0.22 0.04 0.35 2.79 10.33 23.67
8 <10 3.32 1.20 0.00 0.00 0.00 0.00 0.00 0.00 0.00 0.00 0.00 0.00 0.00 0.09 0.53 0.80 5.94
≥10 0.44 0.00 0.00 0.00 0.00 0.00 0.00 0.00 0.00 0.00 0.00 0.00 0.00 0.00 0.00 0.13 0.58
Total (%) 25.53 7.36 1.86 0.35 0.31 0.09 0.00 0.22 0.13 0.18 0.49 1.77 2.39 5.63 18.79 34.88 100.00
Table 3.4 UKMO wind statistics for the month of March 2006 to 2015 (Direction coming from) Wind Speed (m/s)
Percentage of Occurrence for Wind Direction (deg) %
From To 0 -22.5
22.5- 45
45-67.5
67.5-
90
90-
112.5
112.5-
135
135-
157.5
157.5-
180
180-
202.5
202.5-
225
225-
247.5
247.5-
270
270-
292.5
292.5-
315
315-
337.5
337.5-360.0
0 < 2 0.40 0.24 0.32 0.20 0.16 0.12 0.12 0.12 0.24 0.00 0.36 0.16 0.60 0.60 0.73 0.20 4.60
2 <4 2.38 0.85 0.16 0.00 0.04 0.16 0.12 0.08 0.20 0.12 0.40 0.97 1.85 3.10 5.16 5.00 20.60
4 <6 5.24 1.01 0.12 0.04 0.00 0.00 0.00 0.00 0.00 0.00 0.04 0.24 1.73 6.45 16.81 13.55 45.24
6 <8 3.71 0.65 0.08 0.00 0.00 0.00 0.00 0.00 0.00 0.04 0.08 0.00 0.12 1.90 10.16 9.15 25.89
8 <10 0.93 0.16 0.00 0.00 0.00 0.00 0.00 0.00 0.00 0.00 0.04 0.20 0.00 0.00 1.13 1.05 3.51
≥10 0.04 0.04 0.00 0.00 0.00 0.00 0.00 0.00 0.00 0.00 0.00 0.00 0.00 0.00 0.08 0.00 0.16
Total (%) 12.70 2.94 0.69 0.24 0.20 0.28 0.24 0.20 0.44 0.16 0.93 1.57 4.31 12.06 34.07 28.95 100.00

18
Table 3.5 UKMO wind statistics for the month of April 2006 to 2015 (Direction coming from)
Wind Speed (m/s)
Percentage of Occurrence for Wind Direction (deg) %
From To 0 -22.5
22.5- 45
45-67.5
67.5-
90
90-
112.5
112.5-
135
135-
157.5
157.5-
180
180-
202.5
202.5-
225
225-
247.5
247.5-
270
270-
292.5
292.5-
315
315-
337.5
337.5-360.0
0 < 2 0.71 0.13 0.04 0.04 0.08 0.00 0.04 0.04 0.08 0.17 0.25 0.58 1.08 1.00 1.08 0.38 5.71
2 <4 0.67 0.08 0.04 0.00 0.00 0.04 0.00 0.04 0.08 0.33 1.17 3.46 6.17 6.92 5.08 3.04 27.13
4 <6 1.46 0.08 0.00 0.00 0.00 0.00 0.00 0.00 0.00 0.04 0.54 1.67 5.79 13.17 14.46 7.33 44.54
6 <8 0.25 0.08 0.00 0.00 0.00 0.00 0.00 0.00 0.00 0.00 0.00 0.13 0.46 6.04 9.83 3.25 20.04
8 <10 0.04 0.08 0.00 0.00 0.00 0.00 0.00 0.00 0.00 0.00 0.00 0.00 0.00 0.63 1.79 0.00 2.54
≥10 0.00 0.00 0.00 0.00 0.00 0.00 0.00 0.00 0.00 0.00 0.00 0.00 0.00 0.04 0.00 0.00 0.04
Total (%) 3.13 0.46 0.08 0.04 0.08 0.04 0.04 0.08 0.17 0.54 1.96 5.83 13.50 27.79 32.25 14.00 100.00
Table 3.6 UKMO wind statistics for the month of May 2006 to 2015 (Direction coming from)
Wind Speed (m/s)
Percentage of Occurrence for Wind Direction (deg) %
From To 0 -22.5
22.5- 45
45-67.5
67.5-
90
90-
112.5
112.5-
135
135-
157.5
157.5-
180
180-
202.5
202.5-
225
225-
247.5
247.5-
270
270-
292.5
292.5-
315
315-
337.5
337.5-360.0
0 < 2 0.16 0.12 0.04 0.04 0.00 0.00 0.12 0.04 0.08 0.08 0.08 0.24 0.52 0.24 0.36 0.12 2.26
2 <4 0.12 0.04 0.00 0.00 0.00 0.00 0.00 0.00 0.16 0.60 2.38 4.35 8.23 5.60 2.10 0.85 24.44
4 <6 0.08 0.00 0.00 0.00 0.00 0.00 0.00 0.00 0.20 0.69 5.36 10.89 16.77 15.00 5.32 0.97 55.28
6 <8 0.00 0.00 0.00 0.00 0.00 0.00 0.00 0.00 0.12 0.36 0.77 2.46 3.83 5.12 3.63 0.32 16.61
8 <10 0.00 0.00 0.00 0.00 0.00 0.00 0.00 0.00 0.00 0.04 0.12 0.12 0.52 0.52 0.08 0.00 1.41
≥10 0.00 0.00 0.00 0.00 0.00 0.00 0.00 0.00 0.00 0.00 0.00 0.00 0.00 0.00 0.00 0.00 0.00
Total (%) 0.36 0.16 0.04 0.04 0.00 0.00 0.12 0.04 0.56 1.77 8.71 18.06 29.88 26.49 11.49 2.26 100.00

19
Table 3.7 UKMO wind statistics for the month of Jun 2006 to 2015 (Direction coming from)
Wind Speed (m/s)
Percentage of Occurrence for Wind Direction (deg) %
From To 0 -22.5
22.5- 45
45-67.5
67.5-
90
90-
112.5
112.5-
135
135-
157.5
157.5-
180
180-
202.5
202.5-
225
225-
247.5
247.5-
270
270-
292.5
292.5-
315
315-
337.5
337.5-360.0
0 < 2 0.04 0.08 0.21 0.00 0.08 0.17 0.08 0.13 0.21 0.13 0.33 0.13 0.08 0.17 0.25 0.17 2.25
2 <4 0.21 0.17 0.13 0.00 0.21 0.17 0.21 0.63 0.88 1.33 2.75 3.38 2.42 1.25 0.58 0.38 14.67
4 <6 0.00 0.21 0.13 0.04 0.00 0.13 0.17 0.67 1.38 2.25 4.83 8.29 4.00 2.00 0.75 0.00 24.83
6 <8 0.04 0.04 0.04 0.00 0.08 0.25 0.50 0.38 0.88 2.29 7.83 9.08 2.17 0.04 0.00 0.04 23.67
8 <10 0.00 0.00 0.00 0.00 0.00 0.00 0.42 0.92 0.67 1.67 9.96 8.50 0.38 0.29 0.00 0.00 22.79
≥10 0.00 0.00 0.00 0.00 0.00 0.04 0.42 0.42 0.08 0.92 6.21 3.42 0.17 0.13 0.00 0.00 11.79
Total (%) 0.29 0.50 0.50 0.04 0.38 0.75 1.79 3.13 4.08 8.58 31.92 32.79 9.21 3.88 1.58 0.58 100.00
Table 3.8 UKMO wind statistics for the month of July 2006 to 2015 (Direction coming from)
Wind Speed (m/s)
Percentage of Occurrence for Wind Direction (deg) %
From To 0 -22.5
22.5- 45
45-67.5
67.5-
90
90-
112.5
112.5-
135
135-
157.5
157.5-
180
180-
202.5
202.5-
225
225-
247.5
247.5-
270
270-
292.5
292.5-
315
315-
337.5
337.5-360.0
0 < 2 0.00 0.00 0.00 0.00 0.00 0.00 0.00 0.00 0.00 0.00 0.00 0.00 0.00 0.00 0.00 0.00 0.00
2 <4 0.00 0.00 0.00 0.00 0.00 0.00 0.00 0.00 0.08 0.24 0.48 0.60 0.52 0.08 0.00 0.00 2.02
4 <6 0.00 0.00 0.00 0.00 0.00 0.00 0.00 0.00 0.00 0.73 2.62 3.51 1.25 0.36 0.08 0.00 8.55
6 <8 0.00 0.00 0.00 0.00 0.00 0.00 0.00 0.00 0.00 0.36 7.50 12.30 2.18 0.08 0.00 0.00 22.42
8 <10 0.00 0.00 0.00 0.00 0.00 0.00 0.00 0.00 0.00 0.04 9.68 22.34 2.06 0.00 0.00 0.00 34.11
≥10 0.00 0.00 0.00 0.00 0.00 0.00 0.00 0.00 0.00 0.00 7.18 24.84 0.89 0.00 0.00 0.00 32.90
Total (%) 0.00 0.00 0.00 0.00 0.00 0.00 0.00 0.00 0.08 1.37 27.46 63.59 6.90 0.52 0.08 0.00 100.00

20
Table 3.9 UKMO wind statistics for the month of August 2006 to 2015 (Direction coming from)
Wind Speed (m/s)
Percentage of Occurrence for Wind Direction (deg) %
From To 0 -22.5
22.5- 45
45-67.5
67.5-
90
90-
112.5
112.5-
135
135-
157.5
157.5-
180
180-
202.5
202.5-
225
225-
247.5
247.5-
270
270-
292.5
292.5-
315
315-
337.5
337.5-360.0
0 < 2 0.00 0.00 0.00 0.00 0.00 0.00 0.00 0.00 0.00 0.00 0.00 0.04 0.08 0.08 0.04 0.00 0.24
2 <4 0.00 0.00 0.00 0.00 0.00 0.00 0.00 0.00 0.04 0.08 0.52 1.29 2.26 1.05 0.40 0.32 5.97
4 <6 0.00 0.00 0.00 0.00 0.00 0.00 0.00 0.00 0.08 0.69 2.42 5.93 7.26 2.74 0.97 0.16 20.24
6 <8 0.00 0.00 0.00 0.00 0.00 0.00 0.00 0.00 0.08 0.28 5.36 17.94 8.39 1.17 0.12 0.00 33.35
8 <10 0.00 0.00 0.00 0.00 0.00 0.00 0.00 0.00 0.00 0.00 5.93 16.45 2.90 0.04 0.00 0.00 25.32
≥10 0.00 0.00 0.00 0.00 0.00 0.00 0.00 0.00 0.00 0.00 2.50 11.09 1.25 0.04 0.00 0.00 14.88
Total (%) 0.00 0.00 0.00 0.00 0.00 0.00 0.00 0.00 0.20 1.05 16.73 52.74 22.14 5.12 1.53 0.48 100.00
Table 3.10 UKMO wind statistics for the month of September 2006 to 2015 (Direction coming from)
Wind Speed (m/s)
Percentage of Occurrence for Wind Direction (deg) %
From To 0 -22.5
22.5- 45
45-67.5
67.5-
90
90-
112.5
112.5-
135
135-
157.5
157.5-
180
180-
202.5
202.5-
225
225-
247.5
247.5-
270
270-
292.5
292.5-
315
315-
337.5
337.5-360.0
0 < 2 0.04 0.21 0.08 0.04 0.29 0.17 0.21 0.42 0.42 0.46 0.50 0.58 0.75 0.67 0.67 0.25 5.75
2 <4 0.92 0.58 0.25 0.04 0.08 0.21 0.13 0.25 0.21 0.54 2.04 3.96 6.04 6.17 4.92 1.83 28.17
4 <6 1.25 0.17 0.04 0.04 0.00 0.00 0.00 0.00 0.33 1.79 3.21 4.17 5.42 6.25 5.79 1.75 30.21
6 <8 0.08 0.29 0.00 0.00 0.00 0.00 0.00 0.00 0.29 1.83 4.71 7.33 3.63 2.54 2.50 0.92 24.13
8 <10 0.00 0.00 0.00 0.00 0.00 0.00 0.00 0.00 0.04 0.46 2.25 4.38 1.67 0.54 0.13 0.00 9.46
≥10 0.00 0.00 0.00 0.00 0.00 0.00 0.00 0.00 0.04 0.08 1.17 0.92 0.08 0.00 0.00 0.00 2.29
Total (%) 2.29 1.25 0.38 0.13 0.38 0.38 0.33 0.67 1.33 5.17 13.88 21.33 17.58 16.17 14.00 4.75 100.00

21
Table 3.11 UKMO wind statistics for the month of October 2006 to 2015 (Direction coming from)
Wind Speed (m/s)
Percentage of Occurrence for Wind Direction (deg) %
From To 0 -22.5
22.5- 45
45-67.5
67.5-
90
90-
112.5
112.5-
135
135-
157.5
157.5-
180
180-
202.5
202.5-
225
225-
247.5
247.5-
270
270-
292.5
292.5-
315
315-
337.5
337.5-360.0
0 < 2 1.09 0.81 0.89 0.65 0.56 0.24 0.40 0.40 0.32 0.16 0.24 0.36 0.56 0.81 1.29 0.93 9.72
2 <4 9.03 5.32 2.86 1.01 0.93 0.69 0.36 0.36 0.12 0.24 0.32 0.73 1.90 3.15 3.71 5.28 36.01
4 <6 10.20 6.94 2.78 1.29 0.60 0.16 0.12 0.08 0.00 0.08 0.08 1.09 1.41 3.27 5.24 6.17 39.52
6 <8 2.50 2.98 1.53 0.52 0.24 0.24 0.36 0.00 0.00 0.00 0.00 0.12 0.73 0.73 1.21 1.01 12.18
8 <10 0.00 0.16 0.16 0.04 0.08 0.16 0.08 0.00 0.00 0.00 0.00 0.00 0.89 0.56 0.28 0.00 2.42
≥10 0.00 0.04 0.00 0.00 0.08 0.04 0.00 0.00 0.00 0.00 0.00 0.00 0.00 0.00 0.00 0.00 0.16
Total (%) 22.82 16.25 8.23 3.51 2.50 1.53 1.33 0.85 0.44 0.48 0.65 2.30 5.48 8.51 11.73 13.39 100.00
Table 3.12 UKMO wind statistics for the month of November 2006 to 2015 (Direction coming from) Wind Speed (m/s)
Percentage of Occurrence for Wind Direction (deg) %
From To 0 -22.5
22.5- 45
45-67.5
67.5-
90
90-
112.5
112.5-
135
135-
157.5
157.5-
180
180-
202.5
202.5-
225
225-
247.5
247.5-
270
270-
292.5
292.5-
315
315-
337.5
337.5-360.0
0 < 2 0.50 0.67 0.96 0.50 0.17 0.13 0.13 0.17 0.17 0.21 0.13 0.17 0.08 0.33 0.29 0.75 5.33
2 <4 8.58 6.29 4.63 1.79 0.92 0.33 0.42 0.21 0.17 0.13 0.25 0.08 0.08 0.42 1.38 2.96 28.63
4 <6 15.75 11.75 6.50 1.96 0.42 0.21 0.25 0.08 0.17 0.04 0.00 0.04 0.00 0.04 0.33 4.67 42.21
6 <8 7.38 7.29 2.33 1.63 0.21 0.21 0.17 0.25 0.17 0.00 0.00 0.00 0.00 0.00 0.08 1.38 21.08
8 <10 0.25 1.04 0.50 0.42 0.08 0.00 0.08 0.04 0.00 0.00 0.00 0.00 0.00 0.00 0.00 0.00 2.42
≥10 0.00 0.00 0.21 0.04 0.00 0.00 0.08 0.00 0.00 0.00 0.00 0.00 0.00 0.00 0.00 0.00 0.33
Total (%) 32.46 27.04 15.13 6.33 1.79 0.88 1.13 0.75 0.67 0.38 0.38 0.29 0.17 0.79 2.08 9.75 100.00
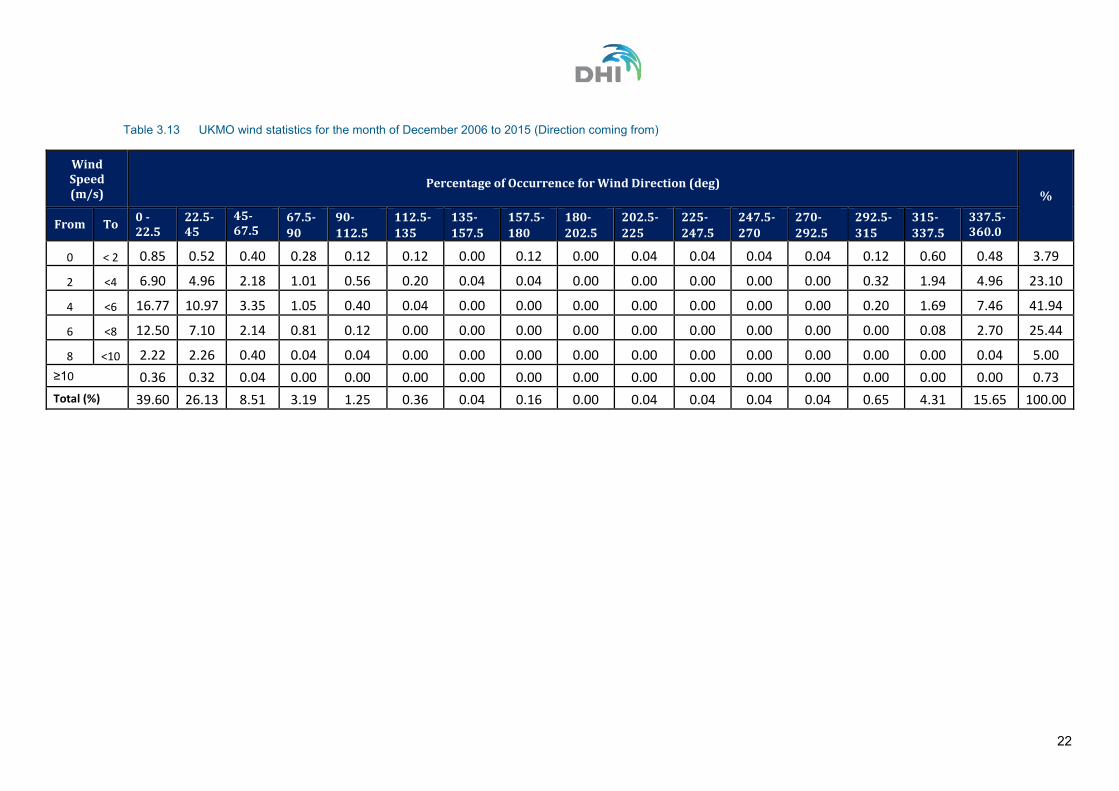
22
Table 3.13 UKMO wind statistics for the month of December 2006 to 2015 (Direction coming from)
Wind Speed (m/s)
Percentage of Occurrence for Wind Direction (deg) %
From To 0 -22.5
22.5- 45
45-67.5
67.5-
90
90-
112.5
112.5-
135
135-
157.5
157.5-
180
180-
202.5
202.5-
225
225-
247.5
247.5-
270
270-
292.5
292.5-
315
315-
337.5
337.5-360.0
0 < 2 0.85 0.52 0.40 0.28 0.12 0.12 0.00 0.12 0.00 0.04 0.04 0.04 0.04 0.12 0.60 0.48 3.79
2 <4 6.90 4.96 2.18 1.01 0.56 0.20 0.04 0.04 0.00 0.00 0.00 0.00 0.00 0.32 1.94 4.96 23.10
4 <6 16.77 10.97 3.35 1.05 0.40 0.04 0.00 0.00 0.00 0.00 0.00 0.00 0.00 0.20 1.69 7.46 41.94
6 <8 12.50 7.10 2.14 0.81 0.12 0.00 0.00 0.00 0.00 0.00 0.00 0.00 0.00 0.00 0.08 2.70 25.44
8 <10 2.22 2.26 0.40 0.04 0.04 0.00 0.00 0.00 0.00 0.00 0.00 0.00 0.00 0.00 0.00 0.04 5.00
≥10 0.36 0.32 0.04 0.00 0.00 0.00 0.00 0.00 0.00 0.00 0.00 0.00 0.00 0.00 0.00 0.00 0.73
Total (%) 39.60 26.13 8.51 3.19 1.25 0.36 0.04 0.16 0.00 0.04 0.04 0.04 0.04 0.65 4.31 15.65 100.00

23
Figure 3.8 Percentage of exceedance probability of wind speed based on UKMO (2006 -2015)

24
3.2.2 Offshore Wave Data Analysis Offshore 3-hourly United Kingdom Meteorological Office (UKMO) wave data was procured from 1 January 2006 to 31 December 2015 at the following location: Latitude: 18°30'58"N Longitude: 72° 4'12.00"E Refer to Figure 1.1 for station location. The wave rose and scatter plot (significant wave height vs wave direction) corresponding to 10 years period from 1 January 2006 to 31 December 2015 is given in Figures 3.9 and 3.10 respectively.
The rose plot and scatter plot corresponding to peak wave period vs wave direction from 1 January 2006 to 31 December 2015 is given in Figure 3.11 and Figure 3.12 respectively.
The rose plot and scatter plot corresponding to Zero crossing wave period vs wave direction from 1 January 2006 to 31 December 2015 is given in Figure 3.13 and Figure 3.14 respectively.
The corresponding annual and monthly wave roses (significant wave height vs wave direction) are given in Figure 3.15 - Figure 3.17 respectively.
The monthly roses corresponding to peak wave period is given in Figures 3.18 and 3.19 respectively.
The statistical analysis corresponding to significant wave height vs wave direction and significant wave height vs peak wave period from 1 January 2006 to 31 December 2015 is given in Table 3.14 to 3.16 respectively.
The corresponding monthly statistical wave analysis is given in Tables 3.17- 3.28.
The corresponding Exceedance probability plot for significant wave height and peak wave period is given in Figures 3.20 and 3.21 respectively.

25
Figure 3.9 Rose plot (Significant wave height and direction) for the period 1 January 2006 to 31 December 2015
Figure 3.10 Scatter Plot (Significant wave height and direction) for the period 1 January 2006 to 31 December 2015

26
Figure 3.11 Rose plot (Peak wave period and direction) for the period 1 January 2006 to 31 December 2015
Figure 3.12 Scatter Plot (peak wave period and direction) for the period 1 January 2006 to 31 December 2015

27
Figure 3.13 Rose plot (Zero crossing wave period and wave direction) for the period 1 January 2006 to 31 December 2015
Figure 3.14 Scatter Plot (Zero crossing wave period and direction) for the period 1 January 2006 to 31 December 2015

28
Figure 3.15 Annual Wave Roses of significant wave height (m) from 1 January 2006 to 31 December 2015

29
Figure 3.16 Monthly Rose (January- October) of significant wave height from 2006 to 2015

30
Figure 3.17 Monthly Rose (November - December) of significant wave height from 2006 to 2015
Figure 3.18 Monthly Rose (January-October) of peak wave period from 2006 to 2015

31
Figure 3.19 Monthly Rose (November-December) of peak wave period from 2006 to 2015

32
Table 3.14 UKMO wave statistics (Significant wave height Vs Wave Direction) for the period of 1 January 2006 to 31 December 2015
Significant wave
height (m/s)
Percentage of Occurrence for Wave Direction (deg) %
From To 0 -22.5
22.5- 45
45-67.5
67.5-90
90-112.5
112.5-135
135-157.5
157.5-180
180-202.5
202.5-225
225-247.5
247.5-270
270-292.5
292.5- 315
315-337.5
337.5-360.0
0 <0.5 0.14 0.12 0.10 0.06 0.04 0.06 0.09 0.12 0.85 1.68 0.91 0.89 0.70 0.39 0.26 0.35 6.76
0.5 <1.0 1.66 0.54 0.39 0.18 0.17 0.12 0.14 0.23 1.27 6.29 6.70 6.82 6.12 4.86 3.86 4.33 43.68
1.0 <1.5 0.97 0.05 0.01 0.01 0.01 0.01 0.02 0.04 0.16 1.93 6.52 3.97 1.92 1.50 0.92 1.62 19.67
1.5 <2.0 0.28 0.00 0.00 0.01 0.00 0.00 0.01 0.07 0.08 0.24 3.25 1.47 0.12 0.07 0.03 0.23 5.85
2.0 <2.5 0.01 0.00 0.00 0.00 0.00 0.01 0.00 0.00 0.04 0.06 3.43 2.20 0.00 0.00 0.00 0.00 5.77
2.5 <3.0 0.00 0.00 0.00 0.00 0.00 0.00 0.00 0.01 0.03 0.05 4.01 2.02 0.00 0.00 0.00 0.00 6.12
3.0 <3.5 0.00 0.00 0.00 0.00 0.00 0.00 0.00 0.00 0.02 0.01 2.30 2.27 0.00 0.00 0.00 0.00 4.60
3.5 <4.0 0.00 0.00 0.00 0.00 0.00 0.00 0.00 0.00 0.02 0.02 2.24 1.70 0.00 0.00 0.00 0.00 3.97
4.0 <4.5 0.00 0.00 0.00 0.00 0.00 0.00 0.00 0.00 0.00 0.02 1.16 1.31 0.00 0.00 0.00 0.00 2.49
4.5 <5.0 0.00 0.00 0.00 0.00 0.00 0.00 0.00 0.00 0.00 0.00 0.47 0.30 0.00 0.00 0.00 0.00 0.77
≥5.0 0.00 0.00 0.00 0.00 0.00 0.00 0.00 0.00 0.00 0.00 0.28 0.04 0.00 0.00 0.00 0.00 0.32
Total (%) 3.07 0.72 0.50 0.26 0.23 0.20 0.26 0.47 2.47 10.31 31.28 22.99 8.86 6.82 5.07 6.52 100.00

33
Table 3.15 UKMO wave statistics (Peak wave period; tp Vs significant wave height; Hs) for the period of 1 January 2006 to 31 December 2015
Significant wave
height (m/s)
Percentage of Occurrence for Peak wave period (sec) %
From To 0-2 2-4 4-6 6-8 8-10 10-12 12-14 14-16 16-18 18-20 ≥ 20
0 <0.5 0.00 0.05 0.02 0.02 0.11 1.80 3.44 1.01 0.27 0.03 0.01 6.76
0.5 <1.0 0.00 1.34 2.80 0.71 0.43 6.47 20.01 8.45 2.85 0.53 0.11 43.68
1.0 <1.5 0.00 0.02 3.21 1.62 1.58 1.02 5.96 4.15 1.73 0.35 0.02 19.67
1.5 <2.0 0.00 0.00 0.60 0.72 2.61 0.26 0.59 0.60 0.36 0.10 0.01 5.85
2.0 <2.5 0.00 0.00 0.02 0.43 3.91 1.06 0.09 0.12 0.12 0.02 0.00 5.77
2.5 <3.0 0.00 0.00 0.00 0.10 3.49 2.30 0.02 0.13 0.08 0.01 0.00 6.12
3.0 <3.5 0.00 0.00 0.00 0.01 2.01 2.54 0.04 0.00 0.00 0.00 0.00 4.60
3.5 <4.0 0.00 0.00 0.00 0.00 0.82 3.05 0.07 0.00 0.03 0.00 0.00 3.97
4.0 <4.5 0.00 0.00 0.00 0.00 0.12 2.29 0.09 0.00 0.00 0.00 0.00 2.49
4.5 <5.0 0.00 0.00 0.00 0.00 0.01 0.72 0.04 0.00 0.00 0.00 0.00 0.77
≥5.0 0.00 0.00 0.00 0.00 0.00 0.22 0.10 0.00 0.00 0.00 0.00 0.32
Total (%) 0.00 1.41 6.65 3.60 15.08 21.74 30.45 14.46 5.43 1.04 0.15 100.00

34
Table 3.16 UKMO wave statistics (Zero crossing wave period; tz Vs significant wave height; Hs) for the period of 1 January 2006 to 31 December
2015
Significant wave
height (m/s)
Percentage of Occurrence for Zero crossing wave period (sec) %
From To 0-2 2-4 4-6 6-8 8-10 10-12 12-14 14-16 16-18 18-20 ≥ 20
0 <0.5 0.00 3.15 2.35 0.75 0.40 0.09 0.02 0.00 0.00 0.00 0.00 6.76
0.5 <1.0 0.00 19.71 19.80 3.08 0.85 0.18 0.05 0.02 0.00 0.00 0.00 43.68
1.0 <1.5 0.00 2.08 13.05 3.85 0.48 0.11 0.10 0.00 0.00 0.00 0.00 19.67
1.5 <2.0 0.00 0.00 3.06 2.63 0.17 0.00 0.00 0.00 0.00 0.00 0.00 5.85
2.0 <2.5 0.00 0.00 2.05 3.58 0.14 0.00 0.00 0.00 0.00 0.00 0.00 5.77
2.5 <3.0 0.00 0.00 0.47 5.54 0.11 0.00 0.00 0.00 0.00 0.00 0.00 6.12
3.0 <3.5 0.00 0.00 0.00 4.55 0.05 0.00 0.00 0.00 0.00 0.00 0.00 4.60
3.5 <4.0 0.00 0.00 0.00 3.95 0.02 0.00 0.00 0.00 0.00 0.00 0.00 3.97
4.0 <4.5 0.00 0.00 0.00 2.43 0.06 0.00 0.00 0.00 0.00 0.00 0.00 2.49
4.5 <5.0 0.00 0.00 0.00 0.75 0.02 0.00 0.00 0.00 0.00 0.00 0.00 0.77
≥5.0 0.00 0.00 0.00 0.12 0.20 0.00 0.00 0.00 0.00 0.00 0.00 0.32
Total (%) 0.00 24.93 40.77 31.23 2.50 0.38 0.17 0.02 0.00 0.00 0.00 100.00
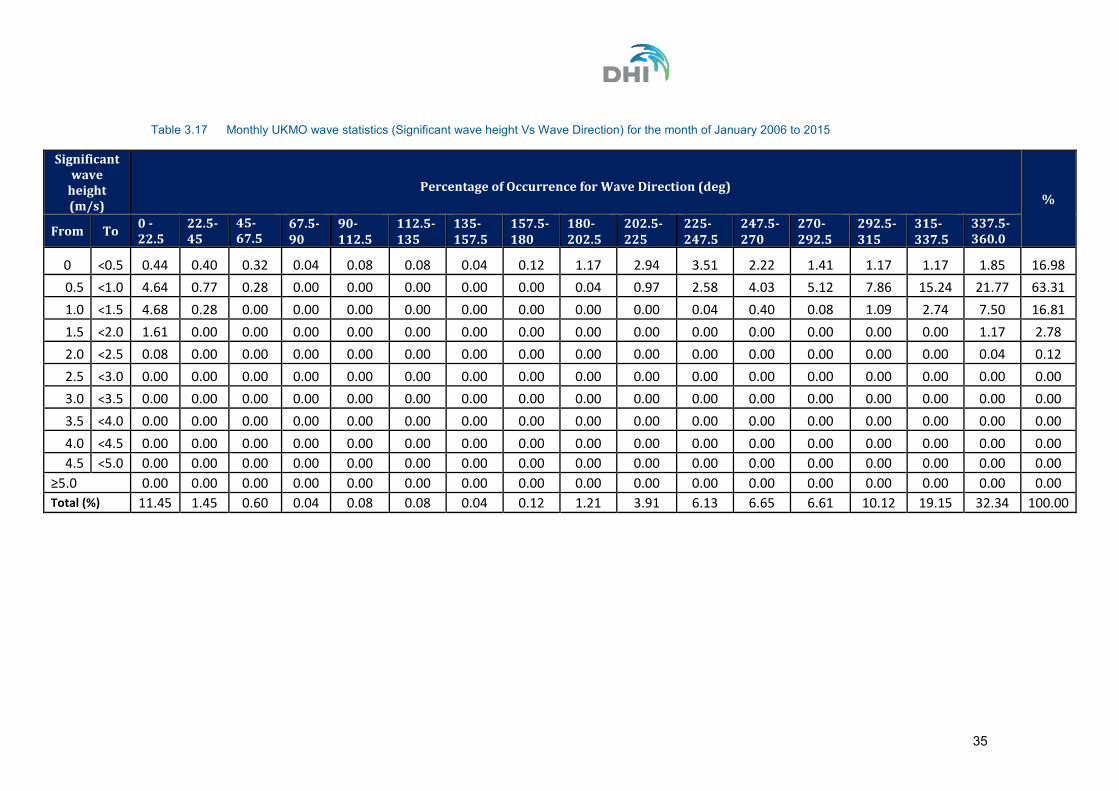
35
Table 3.17 Monthly UKMO wave statistics (Significant wave height Vs Wave Direction) for the month of January 2006 to 2015
Significant wave
height (m/s)
Percentage of Occurrence for Wave Direction (deg) %
From To 0 -22.5
22.5- 45
45-67.5
67.5-90
90-112.5
112.5-135
135-157.5
157.5-180
180-202.5
202.5-225
225-247.5
247.5-270
270-292.5
292.5- 315
315-337.5
337.5-360.0
0 <0.5 0.44 0.40 0.32 0.04 0.08 0.08 0.04 0.12 1.17 2.94 3.51 2.22 1.41 1.17 1.17 1.85 16.98
0.5 <1.0 4.64 0.77 0.28 0.00 0.00 0.00 0.00 0.00 0.04 0.97 2.58 4.03 5.12 7.86 15.24 21.77 63.31
1.0 <1.5 4.68 0.28 0.00 0.00 0.00 0.00 0.00 0.00 0.00 0.00 0.04 0.40 0.08 1.09 2.74 7.50 16.81
1.5 <2.0 1.61 0.00 0.00 0.00 0.00 0.00 0.00 0.00 0.00 0.00 0.00 0.00 0.00 0.00 0.00 1.17 2.78
2.0 <2.5 0.08 0.00 0.00 0.00 0.00 0.00 0.00 0.00 0.00 0.00 0.00 0.00 0.00 0.00 0.00 0.04 0.12
2.5 <3.0 0.00 0.00 0.00 0.00 0.00 0.00 0.00 0.00 0.00 0.00 0.00 0.00 0.00 0.00 0.00 0.00 0.00
3.0 <3.5 0.00 0.00 0.00 0.00 0.00 0.00 0.00 0.00 0.00 0.00 0.00 0.00 0.00 0.00 0.00 0.00 0.00
3.5 <4.0 0.00 0.00 0.00 0.00 0.00 0.00 0.00 0.00 0.00 0.00 0.00 0.00 0.00 0.00 0.00 0.00 0.00
4.0 <4.5 0.00 0.00 0.00 0.00 0.00 0.00 0.00 0.00 0.00 0.00 0.00 0.00 0.00 0.00 0.00 0.00 0.00
4.5 <5.0 0.00 0.00 0.00 0.00 0.00 0.00 0.00 0.00 0.00 0.00 0.00 0.00 0.00 0.00 0.00 0.00 0.00
≥5.0 0.00 0.00 0.00 0.00 0.00 0.00 0.00 0.00 0.00 0.00 0.00 0.00 0.00 0.00 0.00 0.00 0.00
Total (%) 11.45 1.45 0.60 0.04 0.08 0.08 0.04 0.12 1.21 3.91 6.13 6.65 6.61 10.12 19.15 32.34 100.00

36
Table 3.18 Monthly UKMO wave statistics (Significant wave height Vs Wave Direction) for the month of February 2006 to 2015
Significant wave
height (m/s)
Percentage of Occurrence for Wave Direction (deg) %
From To 0 -22.5
22.5- 45
45-67.5
67.5-90
90-112.5
112.5-135
135-157.5
157.5-180
180-202.5
202.5-225
225-247.5
247.5-270
270-292.5
292.5- 315
315-337.5
337.5-360.0
0 <0.5 0.27 0.13 0.00 0.04 0.00 0.00 0.22 0.18 0.49 2.70 3.59 4.74 4.48 1.55 0.53 0.40 19.33
0.5 <1.0 1.42 0.09 0.00 0.00 0.00 0.00 0.04 0.04 0.00 2.08 4.12 7.62 12.46 19.50 12.72 5.76 65.87
1.0 <1.5 0.89 0.00 0.00 0.00 0.00 0.00 0.00 0.00 0.00 0.00 0.00 0.09 0.22 3.01 3.46 5.45 13.12
1.5 <2.0 0.18 0.00 0.00 0.00 0.00 0.00 0.00 0.00 0.00 0.00 0.00 0.00 0.00 0.18 0.31 1.02 1.68
2.0 <2.5 0.00 0.00 0.00 0.00 0.00 0.00 0.00 0.00 0.00 0.00 0.00 0.00 0.00 0.00 0.00 0.00 0.00
2.5 <3.0 0.00 0.00 0.00 0.00 0.00 0.00 0.00 0.00 0.00 0.00 0.00 0.00 0.00 0.00 0.00 0.00 0.00
3.0 <3.5 0.00 0.00 0.00 0.00 0.00 0.00 0.00 0.00 0.00 0.00 0.00 0.00 0.00 0.00 0.00 0.00 0.00
3.5 <4.0 0.00 0.00 0.00 0.00 0.00 0.00 0.00 0.00 0.00 0.00 0.00 0.00 0.00 0.00 0.00 0.00 0.00
4.0 <4.5 0.00 0.00 0.00 0.00 0.00 0.00 0.00 0.00 0.00 0.00 0.00 0.00 0.00 0.00 0.00 0.00 0.00
4.5 <5.0 0.00 0.00 0.00 0.00 0.00 0.00 0.00 0.00 0.00 0.00 0.00 0.00 0.00 0.00 0.00 0.00 0.00
≥5.0 0.00 0.00 0.00 0.00 0.00 0.00 0.00 0.00 0.00 0.00 0.00 0.00 0.00 0.00 0.00 0.00 0.00
Total (%) 2.75 0.22 0.00 0.04 0.00 0.00 0.27 0.22 0.49 4.79 7.71 12.46 17.15 24.25 17.02 12.63 100.00

37
Table 3.19 Monthly UKMO wave statistics (Significant wave height Vs Wave Direction) for the month of March 2006 to 2015
Significant wave
height (m/s)
Percentage of Occurrence for Wave Direction (deg) %
From To 0 -22.5
22.5- 45
45-67.5
67.5-90
90-112.5
112.5-135
135-157.5
157.5-180
180-202.5
202.5-225
225-247.5
247.5-270
270-292.5
292.5- 315
315-337.5
337.5-360.0
0 <0.5 0.00 0.00 0.00 0.00 0.00 0.00 0.00 0.00 0.00 1.73 0.93 1.45 0.89 0.24 0.00 0.00 5.24
0.5 <1.0 0.24 0.00 0.00 0.00 0.00 0.00 0.00 0.04 0.12 8.43 11.33 15.44 21.61 16.37 3.95 1.29 78.83
1.0 <1.5 0.28 0.00 0.00 0.00 0.00 0.00 0.00 0.00 0.00 0.16 0.52 0.44 3.19 6.65 2.62 1.65 15.52
1.5 <2.0 0.04 0.00 0.00 0.00 0.00 0.00 0.00 0.00 0.00 0.00 0.00 0.12 0.12 0.00 0.00 0.12 0.40
2.0 <2.5 0.00 0.00 0.00 0.00 0.00 0.00 0.00 0.00 0.00 0.00 0.00 0.00 0.00 0.00 0.00 0.00 0.00
2.5 <3.0 0.00 0.00 0.00 0.00 0.00 0.00 0.00 0.00 0.00 0.00 0.00 0.00 0.00 0.00 0.00 0.00 0.00
3.0 <3.5 0.00 0.00 0.00 0.00 0.00 0.00 0.00 0.00 0.00 0.00 0.00 0.00 0.00 0.00 0.00 0.00 0.00
3.5 <4.0 0.00 0.00 0.00 0.00 0.00 0.00 0.00 0.00 0.00 0.00 0.00 0.00 0.00 0.00 0.00 0.00 0.00
4.0 <4.5 0.00 0.00 0.00 0.00 0.00 0.00 0.00 0.00 0.00 0.00 0.00 0.00 0.00 0.00 0.00 0.00 0.00
4.5 <5.0 0.00 0.00 0.00 0.00 0.00 0.00 0.00 0.00 0.00 0.00 0.00 0.00 0.00 0.00 0.00 0.00 0.00
≥5.0 0.00 0.00 0.00 0.00 0.00 0.00 0.00 0.00 0.00 0.00 0.00 0.00 0.00 0.00 0.00 0.00 0.00
Total (%) 0.56 0.00 0.00 0.00 0.00 0.00 0.00 0.04 0.12 10.32 12.78 17.46 25.81 23.27 6.57 3.06 100.00

38
Table 3.20 Monthly UKMO wave statistics (Significant wave height Vs Wave Direction) for the month of April 2006 to 2015
Significant wave
height (m/s)
Percentage of Occurrence for Wave Direction (deg) %
From To 0 -22.5
22.5- 45
45-67.5
67.5-90
90-112.5
112.5-135
135-157.5
157.5-180
180-202.5
202.5-225
225-247.5
247.5-270
270-292.5
292.5- 315
315-337.5
337.5-360.0
0 <0.5 0.00 0.00 0.00 0.00 0.00 0.00 0.00 0.00 0.00 0.04 0.13 0.17 0.00 0.00 0.00 0.00 0.33
0.5 <1.0 0.04 0.00 0.00 0.00 0.00 0.00 0.00 0.00 0.00 3.42 18.17 22.83 21.50 5.00 0.21 0.29 71.46
1.0 <1.5 0.00 0.00 0.00 0.00 0.00 0.00 0.00 0.00 0.00 2.04 6.17 5.71 7.67 5.08 0.42 0.17 27.25
1.5 <2.0 0.00 0.00 0.00 0.00 0.00 0.00 0.00 0.00 0.00 0.00 0.00 0.33 0.00 0.63 0.00 0.00 0.96
2.0 <2.5 0.00 0.00 0.00 0.00 0.00 0.00 0.00 0.00 0.00 0.00 0.00 0.00 0.00 0.00 0.00 0.00 0.00
2.5 <3.0 0.00 0.00 0.00 0.00 0.00 0.00 0.00 0.00 0.00 0.00 0.00 0.00 0.00 0.00 0.00 0.00 0.00
3.0 <3.5 0.00 0.00 0.00 0.00 0.00 0.00 0.00 0.00 0.00 0.00 0.00 0.00 0.00 0.00 0.00 0.00 0.00
3.5 <4.0 0.00 0.00 0.00 0.00 0.00 0.00 0.00 0.00 0.00 0.00 0.00 0.00 0.00 0.00 0.00 0.00 0.00
4.0 <4.5 0.00 0.00 0.00 0.00 0.00 0.00 0.00 0.00 0.00 0.00 0.00 0.00 0.00 0.00 0.00 0.00 0.00
4.5 <5.0 0.00 0.00 0.00 0.00 0.00 0.00 0.00 0.00 0.00 0.00 0.00 0.00 0.00 0.00 0.00 0.00 0.00
≥5.0 0.00 0.00 0.00 0.00 0.00 0.00 0.00 0.00 0.00 0.00 0.00 0.00 0.00 0.00 0.00 0.00 0.00
Total (%) 0.04 0.00 0.00 0.00 0.00 0.00 0.00 0.00 0.00 5.50 24.46 29.04 29.17 10.71 0.63 0.46 100.00

39
Table 3.21 Monthly UKMO wave statistics (Significant wave height Vs Wave Direction) for the month of May 2006 to 2015
Significant wave
height (m/s)
Percentage of Occurrence for Wave Direction (deg) %
From To 0 -22.5
22.5- 45
45-67.5
67.5-90
90-112.5
112.5-135
135-157.5
157.5-180
180-202.5
202.5-225
225-247.5
247.5-270
270-292.5
292.5- 315
315-337.5
337.5-360.0
0 <0.5 0.00 0.00 0.00 0.00 0.00 0.00 0.00 0.00 0.00 0.00 0.00 0.00 0.00 0.00 0.00 0.00 0.00
0.5 <1.0 0.00 0.00 0.00 0.00 0.00 0.00 0.00 0.00 0.00 0.44 9.68 13.91 1.85 0.00 0.00 0.00 25.89
1.0 <1.5 0.00 0.00 0.00 0.00 0.00 0.00 0.00 0.00 0.00 2.98 25.56 26.53 8.95 0.48 0.00 0.00 64.52
1.5 <2.0 0.00 0.00 0.00 0.00 0.00 0.00 0.00 0.00 0.00 0.08 4.80 2.82 0.36 0.00 0.00 0.00 8.06
2.0 <2.5 0.00 0.00 0.00 0.00 0.00 0.00 0.00 0.00 0.00 0.00 0.00 0.93 0.00 0.00 0.00 0.00 0.93
2.5 <3.0 0.00 0.00 0.00 0.00 0.00 0.00 0.00 0.00 0.00 0.00 0.00 0.16 0.00 0.00 0.00 0.00 0.16
3.0 <3.5 0.00 0.00 0.00 0.00 0.00 0.00 0.00 0.00 0.00 0.00 0.36 0.08 0.00 0.00 0.00 0.00 0.44
3.5 <4.0 0.00 0.00 0.00 0.00 0.00 0.00 0.00 0.00 0.00 0.00 0.00 0.00 0.00 0.00 0.00 0.00 0.00
4.0 <4.5 0.00 0.00 0.00 0.00 0.00 0.00 0.00 0.00 0.00 0.00 0.00 0.00 0.00 0.00 0.00 0.00 0.00
4.5 <5.0 0.00 0.00 0.00 0.00 0.00 0.00 0.00 0.00 0.00 0.00 0.00 0.00 0.00 0.00 0.00 0.00 0.00
≥5.0 0.00 0.00 0.00 0.00 0.00 0.00 0.00 0.00 0.00 0.00 0.00 0.00 0.00 0.00 0.00 0.00 0.00
Total (%) 0.00 0.00 0.00 0.00 0.00 0.00 0.00 0.00 0.00 3.51 40.40 44.44 11.17 0.48 0.00 0.00 100.00

40
Table 3.22 Monthly UKMO wave statistics (Significant wave height Vs Wave Direction) for the month of June 2006 to 2015
Significant wave
height (m/s)
Percentage of Occurrence for Wave Direction (deg) %
From To 0 -22.5
22.5- 45
45-67.5
67.5-90
90-112.5
112.5-135
135-157.5
157.5-180
180-202.5
202.5-225
225-247.5
247.5-270
270-292.5
292.5- 315
315-337.5
337.5-360.0
0 <0.5 0.00 0.00 0.00 0.00 0.00 0.00 0.00 0.00 0.00 0.00 0.00 0.00 0.00 0.00 0.00 0.00 0.00
0.5 <1.0 0.00 0.00 0.00 0.00 0.00 0.00 0.00 0.00 0.13 0.13 0.04 0.08 0.00 0.00 0.00 0.00 0.38
1.0 <1.5 0.00 0.00 0.00 0.00 0.00 0.00 0.00 0.00 0.25 1.67 7.38 4.46 0.00 0.00 0.00 0.00 13.75
1.5 <2.0 0.00 0.00 0.00 0.00 0.00 0.00 0.00 0.00 0.42 0.75 7.96 2.21 0.00 0.00 0.00 0.00 11.33
2.0 <2.5 0.00 0.00 0.00 0.00 0.00 0.00 0.00 0.04 0.54 0.63 12.08 1.83 0.00 0.00 0.00 0.00 15.13
2.5 <3.0 0.00 0.00 0.00 0.00 0.00 0.00 0.00 0.08 0.38 0.63 15.54 4.04 0.00 0.00 0.00 0.00 20.67
3.0 <3.5 0.00 0.00 0.00 0.00 0.00 0.00 0.00 0.00 0.21 0.13 8.25 4.29 0.00 0.00 0.00 0.00 12.88
3.5 <4.0 0.00 0.00 0.00 0.00 0.00 0.00 0.00 0.00 0.21 0.21 11.08 3.42 0.00 0.00 0.00 0.00 14.92
4.0 <4.5 0.00 0.00 0.00 0.00 0.00 0.00 0.00 0.00 0.00 0.21 5.54 1.54 0.00 0.00 0.00 0.00 7.29
4.5 <5.0 0.00 0.00 0.00 0.00 0.00 0.00 0.00 0.00 0.00 0.04 1.13 0.17 0.00 0.00 0.00 0.00 1.33
≥5.0 0.00 0.00 0.00 0.00 0.00 0.00 0.00 0.00 0.00 0.00 2.33 0.00 0.00 0.00 0.00 0.00 2.33
Total (%) 0.00 0.00 0.00 0.00 0.00 0.00 0.00 0.13 2.13 4.38 71.33 22.04 0.00 0.00 0.00 0.00 100.00

41
Table 3.23 Monthly UKMO wave statistics (Significant wave height Vs Wave Direction) for the month of July 2006 to 2015
Significant wave
height (m/s)
Percentage of Occurrence for Wave Direction (deg) %
From To 0 -22.5
22.5- 45
45-67.5
67.5-90
90-112.5
112.5-135
135-157.5
157.5-180
180-202.5
202.5-225
225-247.5
247.5-270
270-292.5
292.5- 315
315-337.5
337.5-360.0
0 <0.5 0.00 0.00 0.00 0.00 0.00 0.00 0.00 0.00 0.00 0.00 0.00 0.00 0.00 0.00 0.00 0.00 0.00
0.5 <1.0 0.00 0.00 0.00 0.00 0.00 0.00 0.00 0.00 0.00 0.00 0.00 0.00 0.00 0.00 0.00 0.00 0.00
1.0 <1.5 0.00 0.00 0.00 0.00 0.00 0.00 0.00 0.00 0.00 0.00 0.00 0.00 0.00 0.00 0.00 0.00 0.00
1.5 <2.0 0.00 0.00 0.00 0.00 0.00 0.00 0.00 0.00 0.00 0.00 0.89 0.12 0.00 0.00 0.00 0.00 1.01
2.0 <2.5 0.00 0.00 0.00 0.00 0.00 0.00 0.00 0.00 0.00 0.00 3.02 3.02 0.00 0.00 0.00 0.00 6.05
2.5 <3.0 0.00 0.00 0.00 0.00 0.00 0.00 0.00 0.00 0.00 0.00 13.02 6.73 0.00 0.00 0.00 0.00 19.76
3.0 <3.5 0.00 0.00 0.00 0.00 0.00 0.00 0.00 0.00 0.00 0.00 12.78 12.98 0.00 0.00 0.00 0.00 25.77
3.5 <4.0 0.00 0.00 0.00 0.00 0.00 0.00 0.00 0.00 0.00 0.00 11.98 10.04 0.00 0.00 0.00 0.00 22.02
4.0 <4.5 0.00 0.00 0.00 0.00 0.00 0.00 0.00 0.00 0.00 0.00 6.33 10.77 0.00 0.00 0.00 0.00 17.10
4.5 <5.0 0.00 0.00 0.00 0.00 0.00 0.00 0.00 0.00 0.00 0.00 4.27 2.58 0.00 0.00 0.00 0.00 6.85
≥5.0 0.00 0.00 0.00 0.00 0.00 0.00 0.00 0.00 0.00 0.00 1.05 0.40 0.00 0.00 0.00 0.00 1.45
Total (%) 0.00 0.00 0.00 0.00 0.00 0.00 0.00 0.00 0.00 0.00 53.35 46.65 0.00 0.00 0.00 0.00 100.00

42
Table 3.24 Monthly UKMO wave statistics (Significant wave height Vs Wave Direction) for the month of August 2006 to 2015
Significant wave
height (m/s)
Percentage of Occurrence for Wave Direction (deg) %
From To 0 -22.5
22.5- 45
45-67.5
67.5-90
90-112.5
112.5-135
135-157.5
157.5-180
180-202.5
202.5-225
225-247.5
247.5-270
270-292.5
292.5- 315
315-337.5
337.5-360.0
0 <0.5 0.00 0.00 0.00 0.00 0.00 0.00 0.00 0.00 0.00 0.00 0.00 0.00 0.00 0.00 0.00 0.00 0.00
0.5 <1.0 0.00 0.00 0.00 0.00 0.00 0.00 0.00 0.00 0.00 0.00 0.00 0.00 0.00 0.00 0.00 0.00 0.00
1.0 <1.5 0.00 0.00 0.00 0.00 0.00 0.00 0.00 0.00 0.00 0.00 2.98 1.01 0.00 0.00 0.00 0.00 3.99
1.5 <2.0 0.00 0.00 0.00 0.00 0.00 0.00 0.00 0.00 0.00 0.04 8.47 6.90 0.00 0.00 0.00 0.00 15.40
2.0 <2.5 0.00 0.00 0.00 0.00 0.00 0.00 0.00 0.00 0.00 0.00 15.77 14.56 0.00 0.00 0.00 0.00 30.32
2.5 <3.0 0.00 0.00 0.00 0.00 0.00 0.00 0.00 0.00 0.00 0.00 12.26 9.76 0.00 0.00 0.00 0.00 22.02
3.0 <3.5 0.00 0.00 0.00 0.00 0.00 0.00 0.00 0.00 0.00 0.00 4.96 8.51 0.00 0.00 0.00 0.00 13.47
3.5 <4.0 0.00 0.00 0.00 0.00 0.00 0.00 0.00 0.00 0.00 0.00 2.66 6.41 0.00 0.00 0.00 0.00 9.07
4.0 <4.5 0.00 0.00 0.00 0.00 0.00 0.00 0.00 0.00 0.00 0.00 1.69 3.19 0.00 0.00 0.00 0.00 4.88
4.5 <5.0 0.00 0.00 0.00 0.00 0.00 0.00 0.00 0.00 0.00 0.00 0.00 0.77 0.00 0.00 0.00 0.00 0.77
≥5.0 0.00 0.00 0.00 0.00 0.00 0.00 0.00 0.00 0.00 0.00 0.00 0.08 0.00 0.00 0.00 0.00 0.08
Total (%) 0.00 0.00 0.00 0.00 0.00 0.00 0.00 0.00 0.00 0.04 48.79 51.17 0.00 0.00 0.00 0.00 100.00

43
Table 3.25 Monthly UKMO wave statistics (Significant wave height Vs Wave Direction) for the month of September 2006 to 2015
Significant wave
height (m/s)
Percentage of Occurrence for Wave Direction (deg) %
From To 0 -22.5
22.5- 45
45-67.5
67.5-90
90-112.5
112.5-135
135-157.5
157.5-180
180-202.5
202.5-225
225-247.5
247.5-270
270-292.5
292.5- 315
315-337.5
337.5-360.0
0 <0.5 0.00 0.00 0.00 0.00 0.00 0.00 0.00 0.00 0.00 0.00 0.00 0.00 0.00 0.00 0.00 0.00 0.00
0.5 <1.0 0.00 0.00 0.00 0.00 0.00 0.00 0.00 0.00 0.00 3.42 5.50 3.58 0.75 0.50 0.08 0.00 13.83
1.0 <1.5 0.00 0.00 0.00 0.00 0.00 0.00 0.00 0.00 0.00 3.00 24.96 5.50 1.29 0.46 0.04 0.00 35.25
1.5 <2.0 0.00 0.00 0.00 0.00 0.00 0.00 0.00 0.00 0.00 0.46 16.92 3.33 0.38 0.00 0.00 0.00 21.08
2.0 <2.5 0.00 0.00 0.00 0.00 0.00 0.00 0.00 0.00 0.00 0.00 10.29 5.17 0.00 0.00 0.00 0.00 15.46
2.5 <3.0 0.00 0.00 0.00 0.00 0.00 0.00 0.00 0.00 0.00 0.00 7.13 3.33 0.00 0.00 0.00 0.00 10.46
3.0 <3.5 0.00 0.00 0.00 0.00 0.00 0.00 0.00 0.00 0.00 0.00 1.08 1.08 0.00 0.00 0.00 0.00 2.17
3.5 <4.0 0.00 0.00 0.00 0.00 0.00 0.00 0.00 0.00 0.00 0.00 1.00 0.25 0.00 0.00 0.00 0.00 1.25
4.0 <4.5 0.00 0.00 0.00 0.00 0.00 0.00 0.00 0.00 0.00 0.00 0.33 0.00 0.00 0.00 0.00 0.00 0.33
4.5 <5.0 0.00 0.00 0.00 0.00 0.00 0.00 0.00 0.00 0.00 0.00 0.17 0.00 0.00 0.00 0.00 0.00 0.17
≥5.0 0.00 0.00 0.00 0.00 0.00 0.00 0.00 0.00 0.00 0.00 0.00 0.00 0.00 0.00 0.00 0.00 0.00
Total (%) 0.00 0.00 0.00 0.00 0.00 0.00 0.00 0.00 0.00 6.88 67.38 22.25 2.42 0.96 0.13 0.00 100.00

44
Table 3.26 Monthly UKMO wave statistics (Significant wave height Vs Wave Direction) for the month of October 2006 to 2015
Significant wave
height (m/s)
Percentage of Occurrence for Wave Direction (deg) %
From To 0 -22.5
22.5- 45
45-67.5
67.5-90
90-112.5
112.5-135
135-157.5
157.5-180
180-202.5
202.5-225
225-247.5
247.5-270
270-292.5
292.5- 315
315-337.5
337.5-360.0
0 <0.5 0.04 0.00 0.00 0.00 0.00 0.08 0.40 0.52 2.50 2.98 0.65 0.52 0.12 0.00 0.00 0.00 7.82
0.5 <1.0 1.05 0.44 0.73 0.24 0.36 0.36 0.44 0.56 5.81 27.78 12.70 6.13 2.02 1.77 1.21 0.97 62.58
1.0 <1.5 0.12 0.00 0.00 0.00 0.04 0.08 0.16 0.04 0.97 10.24 9.48 2.26 0.52 0.40 0.16 0.08 24.56
1.5 <2.0 0.00 0.00 0.00 0.00 0.00 0.00 0.00 0.56 0.32 0.93 0.04 1.69 0.60 0.00 0.04 0.08 4.27
2.0 <2.5 0.00 0.00 0.00 0.00 0.00 0.00 0.00 0.00 0.00 0.12 0.00 0.65 0.00 0.00 0.00 0.00 0.77
2.5 <3.0 0.00 0.00 0.00 0.00 0.00 0.00 0.00 0.00 0.00 0.00 0.00 0.00 0.00 0.00 0.00 0.00 0.00
3.0 <3.5 0.00 0.00 0.00 0.00 0.00 0.00 0.00 0.00 0.00 0.00 0.00 0.00 0.00 0.00 0.00 0.00 0.00
3.5 <4.0 0.00 0.00 0.00 0.00 0.00 0.00 0.00 0.00 0.00 0.00 0.00 0.00 0.00 0.00 0.00 0.00 0.00
4.0 <4.5 0.00 0.00 0.00 0.00 0.00 0.00 0.00 0.00 0.00 0.00 0.00 0.00 0.00 0.00 0.00 0.00 0.00
4.5 <5.0 0.00 0.00 0.00 0.00 0.00 0.00 0.00 0.00 0.00 0.00 0.00 0.00 0.00 0.00 0.00 0.00 0.00
≥5.0 0.00 0.00 0.00 0.00 0.00 0.00 0.00 0.00 0.00 0.00 0.00 0.00 0.00 0.00 0.00 0.00 0.00
Total (%) 1.21 0.44 0.73 0.24 0.40 0.52 1.01 1.69 9.60 42.06 22.86 11.25 3.27 2.18 1.41 1.13 100.00

45
Table 3.27 Monthly UKMO wave statistics (Significant wave height Vs Wave Direction) for the month of November 2006 to 2015
Significant wave
height (m/s)
Percentage of Occurrence for Wave Direction (deg) %
From To 0 -22.5
22.5- 45
45-67.5
67.5-90
90-112.5
112.5-135
135-157.5
157.5-180
180-202.5
202.5-225
225-247.5
247.5-270
270-292.5
292.5- 315
315-337.5
337.5-360.0
0 <0.5 0.17 0.25 0.46 0.46 0.33 0.29 0.17 0.29 4.33 4.79 0.92 0.54 0.58 0.79 0.38 0.50 15.25
0.5 <1.0 5.04 2.71 2.08 0.88 1.25 0.67 0.88 1.67 7.83 21.17 7.75 4.17 3.83 2.50 5.25 6.21 73.88
1.0 <1.5 0.96 0.08 0.08 0.08 0.04 0.04 0.08 0.50 0.71 3.00 0.75 0.75 0.63 0.25 0.29 1.17 9.42
1.5 <2.0 0.00 0.00 0.00 0.08 0.00 0.00 0.08 0.25 0.25 0.63 0.00 0.00 0.00 0.00 0.00 0.00 1.29
2.0 <2.5 0.00 0.00 0.00 0.00 0.04 0.08 0.04 0.00 0.00 0.00 0.00 0.00 0.00 0.00 0.00 0.00 0.17
2.5 <3.0 0.00 0.00 0.00 0.00 0.00 0.00 0.00 0.00 0.00 0.00 0.00 0.00 0.00 0.00 0.00 0.00 0.00
3.0 <3.5 0.00 0.00 0.00 0.00 0.00 0.00 0.00 0.00 0.00 0.00 0.00 0.00 0.00 0.00 0.00 0.00 0.00
3.5 <4.0 0.00 0.00 0.00 0.00 0.00 0.00 0.00 0.00 0.00 0.00 0.00 0.00 0.00 0.00 0.00 0.00 0.00
4.0 <4.5 0.00 0.00 0.00 0.00 0.00 0.00 0.00 0.00 0.00 0.00 0.00 0.00 0.00 0.00 0.00 0.00 0.00
4.5 <5.0 0.00 0.00 0.00 0.00 0.00 0.00 0.00 0.00 0.00 0.00 0.00 0.00 0.00 0.00 0.00 0.00 0.00
≥5.0 0.00 0.00 0.00 0.00 0.00 0.00 0.00 0.00 0.00 0.00 0.00 0.00 0.00 0.00 0.00 0.00 0.00
Total (%) 6.17 3.04 2.63 1.50 1.67 1.08 1.25 2.71 13.13 29.58 9.42 5.46 5.04 3.54 5.92 7.88 100.00

46
Table 3.28 Monthly UKMO wave statistics (Significant wave height Vs Wave Direction) for the month of December 2006 to 2015
Significant wave
height (m/s)
Percentage of Occurrence for Wave Direction (deg) %
From To 0 -22.5
22.5- 45
45-67.5
67.5-90
90-112.5
112.5-135
135-157.5
157.5-180
180-202.5
202.5-225
225-247.5
247.5-270
270-292.5
292.5- 315
315-337.5
337.5-360.0
0 <0.5 0.81 0.65 0.44 0.20 0.12 0.24 0.20 0.28 1.69 5.00 1.41 1.29 1.17 1.01 1.01 1.41 16.94
0.5 <1.0 7.46 2.50 1.53 1.05 0.44 0.44 0.32 0.40 1.25 7.38 8.47 4.19 4.92 5.77 8.10 15.44 69.68
1.0 <1.5 4.56 0.28 0.08 0.00 0.00 0.00 0.00 0.00 0.04 0.00 0.24 0.12 0.36 0.73 1.49 3.55 11.45
1.5 <2.0 1.53 0.00 0.00 0.00 0.00 0.00 0.00 0.00 0.00 0.00 0.00 0.00 0.00 0.00 0.00 0.36 1.90
2.0 <2.5 0.04 0.00 0.00 0.00 0.00 0.00 0.00 0.00 0.00 0.00 0.00 0.00 0.00 0.00 0.00 0.00 0.04
2.5 <3.0 0.00 0.00 0.00 0.00 0.00 0.00 0.00 0.00 0.00 0.00 0.00 0.00 0.00 0.00 0.00 0.00 0.00
3.0 <3.5 0.00 0.00 0.00 0.00 0.00 0.00 0.00 0.00 0.00 0.00 0.00 0.00 0.00 0.00 0.00 0.00 0.00
3.5 <4.0 0.00 0.00 0.00 0.00 0.00 0.00 0.00 0.00 0.00 0.00 0.00 0.00 0.00 0.00 0.00 0.00 0.00
4.0 <4.5 0.00 0.00 0.00 0.00 0.00 0.00 0.00 0.00 0.00 0.00 0.00 0.00 0.00 0.00 0.00 0.00 0.00
4.5 <5.0 0.00 0.00 0.00 0.00 0.00 0.00 0.00 0.00 0.00 0.00 0.00 0.00 0.00 0.00 0.00 0.00 0.00
≥5.0 0.00 0.00 0.00 0.00 0.00 0.00 0.00 0.00 0.00 0.00 0.00 0.00 0.00 0.00 0.00 0.00 0.00
Total (%) 14.40 3.43 2.06 1.25 0.56 0.69 0.52 0.69 2.98 12.38 10.12 5.60 6.45 7.50 10.60 20.77 100.00

47
Figure 3.20 Percentage of exceedance probability for significant wave height for the
period of 1 January 2006 to 31 December 2015
Figure 3.21 Percentage of exceedance probability for peak wave period for the period of 1 January 2006 to 31 December 2015

48
4 Numerical Modelling Studies
Numerical simulations were carried out for determining the flow dynamics and the near shore waves. The discussion below gives a brief description of the modelling tools, the procedure adopted and the results of the simulations.
4.1 Hydrodynamic Modelling
Hydrodynamic modelling is carried out using DHI’s MIKE21 FM (Flexible Mesh) HD model. The model simulates 2D free-surface flows, solving the depth averaged Navier-Stokes equations and is applicable to the simulation of hydrodynamic processes in lakes, estuaries, bays, coastal areas and seas. The FM module of MIKE 21 is based on Flexible Mesh approach using triangular and quadrangular elements for addressing geometrical flexibility to complex coastlines, like archipelago, lagoons, estuaries etc.
The hydrodynamic model simulates water level variations and flows in response to a variety of forcing functions. The effects and facilities in the HD includes:
Bottom shear stress Wind shear stress Barometric pressure gradients Coriolis force Momentum dispersion Sources and Sinks Evaporation Flooding and Drying Wave radiation stress
MIKE 21 FM can be applied to a wide range of hydraulic and related phenomena including modelling of tidal hydraulics, wind and wave generated currents, storm surges. The main governing conditions which affect the performance of the hydrodynamic model are:
Bathymetry Boundary conditions (wind and water level on open boundaries) Bottom resistance Eddy viscosity
4.1.1 Bathymetry Existing bathymetry of the region is prepared on the basis of MIKE – CMAP supplemented with at site-specific data provided by the client near the proposed study area. C-Map is a global digitised chart, which includes the water depth contours and water surface elevation data (tidal stations) for the entire globe. The C-Map depth points can be seen in Figure 4.1, which were imported on to the MIKE 21 suite, for setting up the bathymetry. The water elevation from C-map data base at different locations given in Figure 4.1 are shown in Figures 4.2 to 4.5 respectively.
The bathymetry of the baseline (Existing) conditions used for the hydrodynamic simulations is given in Figure 4.6 and the corresponding fine resolution in the port area is given Figures 4.7 to 4.9.

49
The mesh ranges from fine resolution near-shore of 50m to 2,700m offshore and a very fine resolution (10 m) inside the creek. , along the channel, entrance of the creek and proposed facility.
Later, proposed facility layouts are introduced in the existing bathymetry, where navigational channel (180 m width) is considered to be deepened to -14.5 m and the turning circle of diameter 500 m to -15.5 m depth. The berth pocket in front of the jetty is maintained at the same depth of -15.5 m. The depths behind the main berth and at the barge berth were maintained at -12 m and -6 m respectively. The depth on the eastern part of the jetty for the Port crafts are in the range of (-3) to (-5) m. Model Bathymetry of the domain after including the proposed facility layout is given in Figure 4.10 and the corresponding zoon-in figure showing fine resolution near the port area is shown in Figure 4.11.
Figure 4.1 Water depth points with tidal stations (source: C-map)

50
Figure 4.2 Snapshot of water elevation at Arnalapada, Vasai, Bandra & Apollo Bandra (source: C-map)

51
Figure 4.3 Snapshot of water elevation at Trombay, Mora Bandar, Revas Bandar & Revadanda (source: C-map)

52
Figure 4.4 Snapshot of water elevation at Murud-janjira harbour, Bankot, Port Dabhol & Jaigarh (source: C-map)

53
Figure 4.5 Snapshot of water elevation at Ratnagiri (source: C-map)
Figure 4.6 Bathymetry of a full model domain (HD Model).

54
Figure 4.7 Zoom in figure of bathymetry snapshot including mesh
Figure 4.8 Zoom in figure of bathymetry snapshot including mesh very near to approach
channel
Figure 4.9 Zoom in figure of bathymetry snapshot showing the location of the proposed facility

55
Figure 4.10 Bathymetry snapshot including the proposed facility
Figure 4.11 Zoom in figure of bathymetry snapshot including proposed facility

56
4.1.2 Boundary Conditions The boundary conditions for the HD model were extracted from DHI’s Global tide prediction model. This model is a Global tide prediction model assimilated with 20 years of SSH from TOPEX/POSEIDON altimetry data. It represents the major diurnal (K1, O1, P1 and Q1) and semidiurnal tidal constituents (M2, S2, N2 and K2) with a spatial resolution of 0.25 × 0.25 degrees. For the present study, Model was trained providing three open sea boundaries which were extracted from this Tide model. However, the boundary condition of upstream discharge for Kundalika River is approximately 40 m3/s.
Wind is introduced over model as the atmospheric boundary condition through a speed dependent wind friction coefficient. The source of winds are derived from the UKMO dataset.
4.1.3 Bed Resistance The MIKE21 hydrodynamic model is governed by the Reynolds-Averaged Navier-Stokes (RANS) equations, which are depth-integrated over the water column to finally yield the St. Venant equations. In the governing equations, the friction parameter is expressed as:
3/12hMgk
Where M (m1/3/s) is the Manning Number (the Manning Number is also seen in the literature as n=1/M). The importance of Manning Number is well known in both traditional as well as numerical hydraulics.
A varying manning number is applied throughout the model domain to get a reasonable calibration to the tidal water level, both amplitude and phase.
4.1.4 Production Period The hydrodynamic modelling is carried out for a periods of 22 days period to cover the full spring and neap phase of tidal cycle for validating the model. The production period of the hydrodynamic model is given below.
Tide with North east monsoon winds: 26 October 2015 to 16 November 2015.
4.1.5 Model Calibration and Validation The results of calibration are provided in this section. This calibration is based on the field collected data provided by the client.
The current data (magnitude and direction) was available at three locations namely CM1, CM2 and CM3 (Figure 3.1). The location of tide measurements at third pillar of Revadanda Bridge is also shown in Figure 3.1.
Figure 4.12 gives the calibration plot with respect to water surface elevation. The simulated tidal levels are having a good agreement with the measured data. The comparison of the

57
simulated and measured water level is in the acceptable range with RMS deviation of 0.17, which accounts about 2% of the tidal range.
Calibration and validation with respect to current speed and direction has been carried out at three locations CM1, CM2 and CM3.
The predicted and measured current speed and direction at locations CM1, CM2 and CM3 has been represented in Figure 4.13 -14, Figures 4.15-16 and Figure 4.17-18 respectively. From the figure it could be seen that the results are in agreement with the field measured data with the error of around 10-15% which can be attributed to the changes in the bathymetry.
HD model gives depth averaged current. The surface and bottom currents may have minor variation. Hence it is suggested to use following simplified formulation for estimating current at desired layers,
Current at a Layer = 1.142 X Depth Averaged Current x ( Layer Depth
Total Water Depth)
0.142
NB: Layer depth is numbered inversely like at 15m water depth, the surface layer is 15 and bottom layer is 1.
Figure 4.12 Comparison of measured and simulated water level at the third pillar of the Revdanda Bridge
Figure 4.13 Comparison of measured and simulated current speed at location CM1

58
Figure 4.14 Comparison of measured and simulated current direction at location CM1
Figure 4.15 Comparison of measured and simulated current speed at location CM2
Figure 4.16 Comparison of measured and simulated current direction at location CM2

59
Figure 4.17 Comparison of measured and simulated current speed at location CM3
Figure 4.18 Comparison of measured and simulated current direction at location CM3
4.1.6 Model Results
4.1.6.1 Existing conditions On calibrating and validating the model satisfactorily, the results were analysed in the region with particular focus on the proposed facility.
The simulated depth averaged currents are analysed statistically to give mean currents speed and maximum current speeds as shown in Figures 4.19 to 4.22.
Figure 4.23, gives the snapshot of the flow vectors for flood conditions and the closer view is shown in figure 4.24. The snapshot of flow vectors during ebb and its closer view is shown in Figures 4.25 and 4.26.
Model simulated surface elevation and current speed and current direction were extracted at four locations as given in Figure 4.27.

60
The time series at the extraction locations for surface elevation, current speed and current direction are given in Figure 4.28, 4.29-4.32, 4.33 respectively. Figure 4.34 gives the rose plots corresponding to current speed and current direction at the extraction locations.
Figure 4.19 Maximum current speed during NE monsoon with existing condition
Figure 4.20 Zoom figure in Maximum current speed during NE monsoon with existing condition

61
Figure 4.21 Mean current speed during NE monsoon with existing condition
Figure 4.22 Zoom figure in mean current speed during NE monsoon with existing condition
Figure 4.23 Snapshot of current pattern during peak flood tide and NE monsoon with existing condition

62
Figure 4.24 Very close snapshot of current pattern during peak flood tide and NE monsoon with existing condition
Figure 4.25 Snapshot of current pattern during the ebb flood tide and NE monsoon with existing condition
Figure 4.26 Very close snapshot of current pattern during the ebb flood tide and NE monsoon with existing condition

63
Figure 4.27 Location of extraction Points t1, t2, t3, t4 at existing condition
Figure 4.28 Time series corresponding to surface elevation at extraction locations for existing conditions
Figure 4.29 Time series corresponding to current speed at extraction locations for existing conditions at t1.

64
Figure 4.30 Time series corresponding to current speed at extraction locations for existing conditions at t2.
Figure 4.31 Time series corresponding to current speed at extraction locations for existing conditions at t3.
Figure 4.32 Time series corresponding to current speed at extraction locations for existing conditions at t4.

65
Figure 4.33 Time series corresponding to current direction at extraction locations for existing conditions
Figure 4.34 Rose corresponding to current speed at extraction locations for existing condition
4.1.6.2 Proposed Facility Condition The hydrodynamic model was then simulated for the proposed marine facility and the simulated depth averaged currents were analysed to give instantaneous maximum currents speed and mean current speeds and directions as shown in Figures 4.35 to 4.39 respectively.

66
The snapshot of current pattern during peak flood tide is shown in Figures 4.39 and its zoom-in figure in 4.40. Similarly, the snapshot of current pattern during the ebb tide is shown in Figures 4.41 and its zoom-in figure in 4.42.
Figure 4.44 gives the rose plots corresponding to current speed and current direction at the extraction locations marked in Figure 4.43.
Figure 4.35 Maximum current speed during NE monsoon with proposed facility
Figure 4.36 Zoom figure in Maximum current speed during NE monsoon with proposed facility

67
Figure 4.37 Mean current speed during NE monsoon with proposed facility
Figure 4.38 Zoom figure in mean current speed during NE monsoon with proposed facility

68
Figure 4.39 Snapshot of current pattern during peak flood tide and NE monsoon with proposed facility
Figure 4.40 Very close snapshot of current pattern during peak flood tide and NE monsoon with proposed facility

69
Figure 4.41 Snapshot of current pattern during ebb tide and NE monsoon with proposed facility
Figure 4.42 Very close snapshot of current pattern during ebb tide and NE monsoon with proposed facility

70
Figure 4.43 Location of extraction points t1, t2, t3, t4
Figure 4.44 Rose corresponding to current speed at extraction locations with proposed facility condition

71
4.1.6.3 Comparison between existing and proposed facility conditions
The statistical maximum and mean corresponding to model simulated water level and currents were compared for the existing and proposed facility conditions for the location as given in Figure 4.45.
Table 4.1 and Table 4.2 corresponds to the existing conditions and proposed facility conditions respectively. The standard deviation between the two conditions are given in Table 4.3.
It can be seen that the maximum current speed is decreased for the proposed facility conditions at the locations where the channel is dredged.

72
Figure 4.45 Extraction points for existing and proposed facility conditions

73
Table 4.1 Simulated water level and current pattern at different locations for existing conditions
Sl. No.
Geographical Coordinates (WGS 84) , UTM-43 Water level (m) Current speed (m/s) Latitude, N Longitude, E Easting (m) Northing (m) Maximum Average Maximum Average
1 18.50859 72.76418 263950 2047918 4.264 2.288 0.48 0.18 2 18.52255 72.80484 268263 2049411 4.288 2.286 0.49 0.19 3 18.54460 72.88702 276971 2051748 4.345 2.282 0.53 0.18 4 18.54809 72.90083 278433 2052117 4.359 2.281 0.90 0.21 5 18.53959 72.91343 279753 2051161 4.365 2.276 1.20 0.27 6 18.53763 72.91674 280100 2050940 4.373 2.278 1.30 0.26 7 18.53713 72.91914 280353 2050882 4.380 2.278 1.35 0.27 8 18.53704 72.91655 280079 2050875 4.373 2.278 1.38 0.28 9 18.53596 72.91634 280055 2050755 4.376 2.280 0.92 0.23
10 18.53578 72.91739 280166 2050734 4.377 2.279 1.05 0.26 11 18.53614 72.92039 280483 2050771 4.384 2.280 1.32 0.27 12 18.53551 72.92046 280490 2050701 4.385 2.281 0.94 0.24 13 18.53861 72.92564 281041 2051038 4.397 2.278 1.08 0.27 14 18.54003 72.92909 281407 2051190 4.405 2.271 1.37 0.37 15 18.54458 72.94656 283257 2051673 4.457 2.272 1.32 0.36 16 18.54217 72.95862 284528 2051392 4.484 2.272 1.51 0.36 17 18.53349 72.97091 285814 2050416 4.505 2.275 1.17 0.29 18 18.52019 72.97289 286007 2048942 4.516 2.279 0.87 0.19 19 18.45593 73.01109 289963 2041784 4.571 2.288 0.40 0.09 20 18.46228 73.02392 291326 2042471 4.605 2.288 0.33 0.08 21 18.47497 73.02719 291686 2043873 4.644 2.288 0.15 0.04 22 18.47842 73.03718 292746 2044243 4.657 2.288 0.14 0.04 23 18.48450 73.04277 293343 2044910 4.666 2.287 0.10 0.05 24 18.48449 73.04655 293743 2044904 4.667 2.287 0.12 0.03

74
Table 4.2 Simulated water level and current pattern at different locations with proposed facility
Sl. No.
Geographical Coordinates (WGS 84) , UTM-43 Water level (m) Current speed (m/s) Latitude, N Longitude, E Easting (m) Northing (m) Maximum Average Maximum Average
1 18.50859 72.76418 263950 2047918 4.265 2.288 0.48 0.19 2 18.52255 72.80484 268263 2049411 4.291 2.286 0.42 0.16 3 18.54460 72.88702 276971 2051748 4.349 2.283 0.36 0.11 4 18.54809 72.90083 278433 2052117 4.362 2.282 0.50 0.13 5 18.53959 72.91343 279753 2051161 4.375 2.281 0.49 0.13 6 18.53763 72.91674 280100 2050940 4.380 2.282 0.40 0.12 7 18.53713 72.91914 280353 2050882 4.382 2.282 0.42 0.12 8 18.53704 72.91655 280079 2050875 4.380 2.282 0.38 0.12 9 18.53596 72.91634 280055 2050755 4.380 2.282 0.43 0.12
10 18.53578 72.91739 280166 2050734 4.381 2.282 0.43 0.12 11 18.53614 72.92039 280483 2050771 4.385 2.283 0.50 0.15 12 18.53551 72.92046 280490 2050701 4.386 2.283 0.39 0.11 13 18.53861 72.92564 281041 2051038 4.393 2.280 0.66 0.19 14 18.54003 72.92909 281407 2051190 4.398 2.271 1.34 0.37 15 18.54458 72.94656 283257 2051673 4.434 2.275 1.11 0.30 16 18.54217 72.95862 284528 2051392 4.450 2.274 1.23 0.31 17 18.53349 72.97091 285814 2050416 4.468 2.276 1.14 0.29 18 18.52019 72.97289 286007 2048942 4.478 2.280 0.90 0.20 19 18.45593 73.01109 289963 2041784 4.497 2.288 0.36 0.10 20 18.46228 73.02392 291326 2042471 4.540 2.289 0.30 0.08 21 18.47497 73.02719 291686 2043873 4.569 2.289 0.15 0.04 22 18.47842 73.03718 292746 2044243 4.579 2.288 0.14 0.04 23 18.48450 73.04277 293343 2044910 4.585 2.288 0.10 0.04 24 18.48449 73.04655 293743 2044904 4.585 2.287 0.13 0.04

75
Table 4.3 Standard deviation between existing and proposed facility
Sl. No.
Geographical Coordinates (WGS 84) , UTM-43 Water level (m) Current speed (m/s) Latitude, N Longitude, E Easting (m) Northing (m) Maximum Average Maximum Average
1 18.50859 72.76418 263950 2047918 0.0007 0.0000 0.0000 0.0071 2 18.52255 72.80484 268263 2049411 0.0021 0.0000 0.0495 0.0212 3 18.54460 72.88702 276971 2051748 0.0028 0.0007 0.1202 0.0495 4 18.54809 72.90083 278433 2052117 0.0021 0.0007 0.2828 0.0566 5 18.53959 72.91343 279753 2051161 0.0071 0.0035 0.5020 0.0990 6 18.53763 72.91674 280100 2050940 0.0049 0.0028 0.6364 0.0990 7 18.53713 72.91914 280353 2050882 0.0014 0.0028 0.6576 0.1061 8 18.53704 72.91655 280079 2050875 0.0049 0.0028 0.7071 0.1131 9 18.53596 72.91634 280055 2050755 0.0028 0.0014 0.3465 0.0778
10 18.53578 72.91739 280166 2050734 0.0028 0.0021 0.4384 0.0990 11 18.53614 72.92039 280483 2050771 0.0007 0.0021 0.5798 0.0849 12 18.53551 72.92046 280490 2050701 0.0007 0.0014 0.3889 0.0919 13 18.53861 72.92564 281041 2051038 0.0028 0.0014 0.2970 0.0566 14 18.54003 72.92909 281407 2051190 0.0049 0.0000 0.0212 0.0000 15 18.54458 72.94656 283257 2051673 0.0163 0.0021 0.1485 0.0424 16 18.54217 72.95862 284528 2051392 0.0240 0.0014 0.1980 0.0354 17 18.53349 72.97091 285814 2050416 0.0262 0.0007 0.0212 0.0000 18 18.52019 72.97289 286007 2048942 0.0269 0.0007 0.0212 0.0071 19 18.45593 73.01109 289963 2041784 0.0523 0.0000 0.0283 0.0071 20 18.46228 73.02392 291326 2042471 0.0460 0.0007 0.0212 0.0000 21 18.47497 73.02719 291686 2043873 0.0530 0.0007 0.0000 0.0000 22 18.47842 73.03718 292746 2044243 0.0552 0.0000 0.0000 0.0000 23 18.48450 73.04277 293343 2044910 0.0573 0.0007 0.0000 0.0071 24 18.48449 73.04655 293743 2044904 0.0580 0.0000 0.0071 0.0071

76
4.2 Spectral Wave Modelling
2D wind-wave hindcast modelling has been carried out to transform the offshore wave field (UKMO data) to the proposed facility location.
The wave climate is mainly dominated by a combination of locally-generated wind waves and incoming swell waves from offshore. The modelling has been carried out using DHI’s MIKE 21 Spectral Wave (SW) model. It is a 3rd generation spectral wind-wave model based on the finite volume method on unstructured meshes and enables full time domain simulations, which prove to be important for the present development site. The model simulates the growth, decay and transformation of wind-generated waves and swells in offshore and coastal area. For more details on the model, refer to Sørensen (2004).
DHI’s MIKE 21 SW is well-established modelling system that has been used in numerous met-ocean studies worldwide. MIKE 21 SW includes the following physical phenomena:
Wave growth by action of wind
Non-linear wave-wave interaction
Dissipation due to white-capping
Dissipation due to bottom friction
Dissipation due to depth-induced wave breaking
Refraction and shoaling due to depth variations
Wave-current interaction
Effect of time-varying water depth
Diffraction (Holthuijsen’s parameterised spectral diffraction).
The discretisation of the governing equations in geographical and spectral space is performed using cell-centred finite volume method. In the geographical domain, an unstructured mesh technique is used. The time integration is performed using fractional step approach where a multi-sequence explicit method is applied for the propagation of wave action.
4.2.1 Bathymetry The model domain for wave model is chosen according to the position of UKMO locations (Given in Figure 3.7) over the area, so that it will be easier to apply the boundary conditions.
Since the spatial extent is quite large, so it is computationally impractical to use fine resolution model for the entire area. So, two models were used to resolve the physical processes at the project site, i.e., Regional model and local model.
Regional model with resolution varying from 5 km to1 km is shown in figures 4.46 & 4.47 respectively .The local model resolution varies from 1km to 20 m at the existing facility (Figure 4.48).

77
The water depths were extracted from digitised bathymetry chart, i.e. MIKE C-MAP data base updated with the more detailed local bathymetry provided by the client.
This bathymetry was used as the model domain in order to simulate the wave conditions, and evaluating effects near-shore.
Figure 4.46 Extent of regional model domain

78
Figure 4.47 Extent of regional model domain with local boundary point
Figure 4.48 Extent of local model domain with existing condition
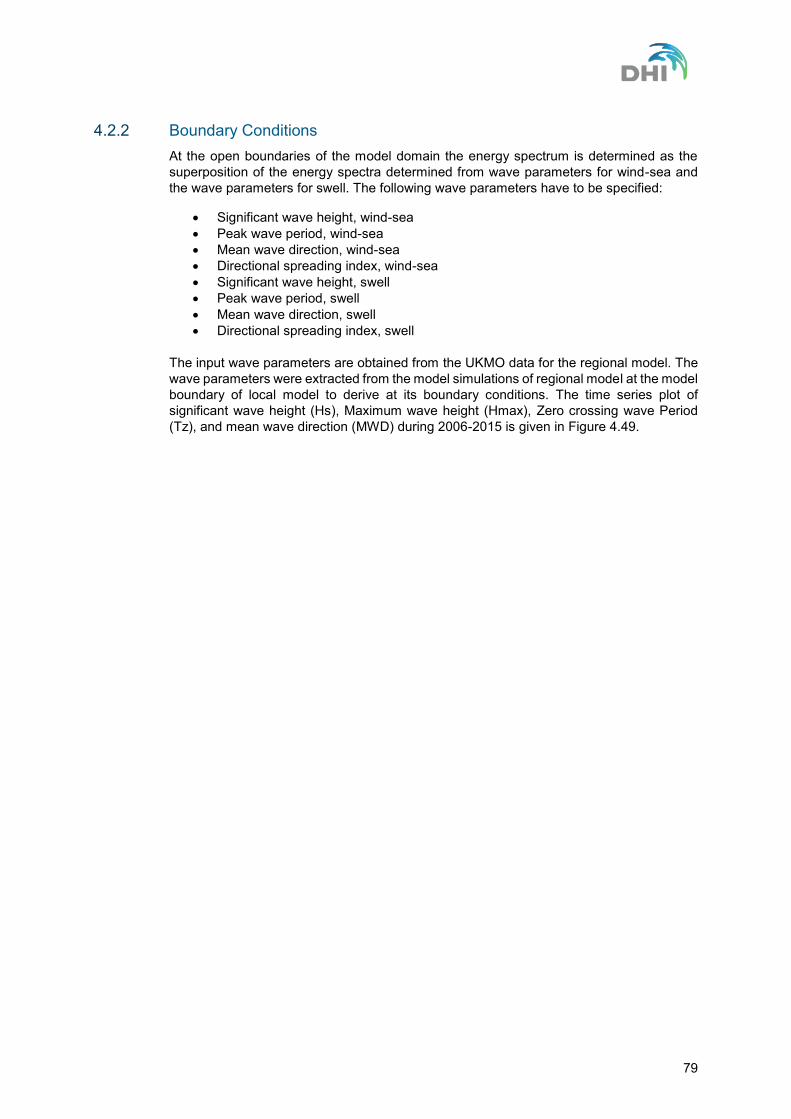
79
4.2.2 Boundary Conditions At the open boundaries of the model domain the energy spectrum is determined as the superposition of the energy spectra determined from wave parameters for wind-sea and the wave parameters for swell. The following wave parameters have to be specified:
Significant wave height, wind-sea Peak wave period, wind-sea Mean wave direction, wind-sea Directional spreading index, wind-sea Significant wave height, swell Peak wave period, swell Mean wave direction, swell Directional spreading index, swell
The input wave parameters are obtained from the UKMO data for the regional model. The wave parameters were extracted from the model simulations of regional model at the model boundary of local model to derive at its boundary conditions. The time series plot of significant wave height (Hs), Maximum wave height (Hmax), Zero crossing wave Period (Tz), and mean wave direction (MWD) during 2006-2015 is given in Figure 4.49.

80
Figure 4.49 Time series plots of Hs, Hmax, Tz and MWD at entrance of the approach channel

81
4.2.3 Wind Forcing For the SW model, a wind field is applied as wind forcing. The wind field is generated using the offshore UKMO wind data.
4.2.4 Spectral Wave Model Calibration and Validation The model results have to be validated with the observational data for their reliability. On this aspect, field observation buoy data provided by the client was used.
Figures 4.50 to 4.51 show comparison between observed and model simulated resultant parameters and the result shows a good correlation between observed and model simulation.
The near shore wave data provided by the client covers a limited period of approx. one non monsoon month. The site specific wave data does not include the monsoon months and the period covered is insufficient for validation.
Hence for further validation purpose, the site specific wave data from NIOT wave atlas was used. The comparison between model simulated waves and NIOT wave Atlas at a deep water location is given in Table 4.4.
Figures 4.52 to 4.55 shows the snapshot for nearshore wave transformation result for existing conditions for the month of June, 2015.
Figure 4.50 Time series comparison between measured and model simulated significant wave height Hs [m] for locations CM2

82
Figure 4.51 Time series comparison between measured and model simulated significant wave height Hs [m] for locations CM 3
Table 4.4 Comparison of wave characteristics at a deep water location with simulated & NIOT wave Atlas
Months Simulated data NIOT Wave Atlas
Hs in metre
Tm in second
WӨ in degree
Hs in metre
Tm in second
WӨ in degree
January 0.5-1.0 3-5 290-360 0.5-1.0 3-5 270-315 February 0.5-1.0 3-5 270-360 0.5-1.0 3-5 270-315 March 0.5-1.0 3-5 225-315 0.5-1.0 3-5 255-315 April 0.5-1.0 3-5 225-300 0.5-1.0 3-5 240-300 May 0.5-1.5 3-6 225-280 0.5-1.5 3-6 225-285 June 1.0-2.5 5-8 225-260 1.0-2.5 5-8 240-270 July 1.5-3.0 5-8 225-260 1.5-3.0 5-8 255-270 August 1.0-2.5 4-7 225-270 1.0-2.5 4-7 255-270 September 0.5-2.0 4-7 225-270 0.5-2.0 4-7 240-270 October 0.5-1.0 4-6 200-270 0.5-1.0 4-6 210-270 November 0.5-1.0 3-6 205-290 0.5-1.0 3-6 295-285 December 0.5-1.0 3-5 210-360 0.5-1.0 3-5 255-315

83
Figure 4.52 Snapshot for nearshore wave transformation result (Maximum wave height) during June 2015 (Existing Condition).
Figure 4.53 Snapshot for nearshore wave transformation result (Significant wave height) during June 2015 (Existing Condition).

84
Figure 4.54 Snapshot for nearshore wave transformation result (Zero crossing wave period) during June 2015 (Existing Condition).
Figure 4.55 Snapshot for nearshore wave transformation result (mean wave direction) during June 2015 (Existing Condition).

85
4.2.5 Wave Model Results for proposed facility Based on the calibrated wave model described in the previous section, wave field was simulated with UKMO data base for the model domain including the proposed facility. The bathymetry is shown in Figures 4.56 and 4.57 respectively.
Figure 4.56 Extent of regional model domain with proposed facility with mesh
Figure 4.57 Extent of local model domain with proposed facility without mesh

86
Figures 4.58 and 4.59 shows the snapshot for nearshore wave transformation result (Significant wave height, Hs) near to the proposed facility for the month of June, 2007. The corresponding snapshot for maximum wave height, zero crossing wave period and mean wave direction are given in Figures 4.60, 4.61 and 4.62 respectively.
The time series plot of significant wave height (Hs), Maximum wave height (Hmax), Zero crossing wave Period (Tz), and mean wave direction (MWD) during 2006 at the four extraction locations are given in Figure 4.63.
The percentage occurrence of significant wave height vs Zero crossing wave period and maximum wave height vs Zero crossing wave period at the proposed facility location (t3) is given in Tables 4.5 and 4.6 respectively.
Figure 4.58 Snapshot for nearshore wave transformation result (Significant wave height) during June 2007 (Proposed Condition).
Figure 4.59 Snapshot for nearshore wave transformation result (Significant wave height) during June 2007 including extraction locations

87
Figure 4.60 Snapshot for nearshore wave transformation result (maximum wave height) during June 2007 for proposed condition
Figure 4.61 Snapshot for nearshore wave transformation result (Zero crossing wave period) during June 2007 for proposed condition
Figure 4.62 Snapshot for nearshore wave transformation result (mean wave direction) during June 2007 for proposed condition

88
Figure 4.63 The time series plot of significant wave height (Hs), Maximum wave height (Hmax), Zero crossing wave Period (Tz), and mean wave direction (MWD) during 2006 at the four extraction locations.

89
Table 4.5 Percentage of occurrence for significant wave height Vs zero crossing wave period
Peak wave period (s)
Percentage of Occurrence for significant wave height Vs Zero crossing wave period (%) during 2006 at t3 location
%
From To <0.05 0.05-0.10 0.10-0.15 0.15-0.20 0.20-0.25 0.25-0.30 0.30-0.35 0.35-0.40 0.40-0.45 0.45-0.50 ≥0.5
0 <0.8 0.00 0.00 0.00 0.00 0.00 0.00 0.00 0.00 0.00 0.00 0.00 0.00
0.8 <1.6 9.55 33.89 3.85 0.06 0.00 0.00 0.00 0.00 0.00 0.00 0.00 47.35
1.6 <2.4 38.16 13.66 0.02 0.00 0.00 0.00 0.00 0.00 0.01 0.00 0.00 51.86
2.4 <3.2 0.49 0.00 0.00 0.00 0.00 0.00 0.00 0.00 0.00 0.00 0.00 0.49
3.2 <4.0 0.27 0.00 0.00 0.00 0.00 0.00 0.00 0.00 0.00 0.00 0.00 0.27 ≥4.0 0.02 0.00 0.00 0.00 0.00 0.00 0.00 0.00 0.00 0.00 0.00 0.02 Total (%) 48.50 47.56 3.87 0.06 0.00 0.00 0.00 0.00 0.01 0.00 0.00 100.0
Table 4.6 Percentage of occurrence for maximum wave height Vs zero crossing wave period
Peak wave period (s)
Percentage of Occurrence for maximum wave height Vs Zero crossing wave period (%) during 2006 at t3 location
%
From To <0.05 0.05-0.10 0.10-0.15 0.15-0.20 0.20-0.25 0.25-0.30 0.30-0.35 0.35-0.40 0.40-0.45 0.45-0.50 ≥0.5
0 <0.8 0.00 0.00 0.00 0.00 0.00 0.00 0.00 0.00 0.00 0.00 0.00 0.00
0.8 <1.6 1.03 7.37 14.92 17.84 5.65 0.43 0.10 0.00 0.00 0.00 0.00 47.35
1.6 <2.4 19.81 17.76 10.26 3.89 0.13 0.00 0.00 0.00 0.00 0.00 0.01 51.86
2.4 <3.2 0.00 0.49 0.00 0.00 0.00 0.00 0.00 0.00 0.00 0.00 0.00 0.49
3.2 <4.0 0.00 0.27 0.00 0.00 0.00 0.00 0.00 0.00 0.00 0.00 0.00 0.27 ≥4.0 0.00 0.02 0.00 0.00 0.00 0.00 0.00 0.00 0.00 0.00 0.00 0.02 Total (%) 20.83 25.92 25.18 21.74 5.78 0.43 0.10 0.00 0.00 0.00 0.01 100.0

90
4.3 Wave tranquillity at the proposed facility
The wave transformation (Section 4.2) from the open ocean into the river in the presence of proposed marine facility with existing JSW jetty was simulated using MIKE 21 SW (Spectral Wave) module. The results reveal that the deep water wave heights attenuate to very less energy by the time they reach the prosed marine facility (location t3) indicating tranquil wave conditions during the monsoon and non-monsoon periods. Further, the waves get totally attenuated inside the Kundalika River towards the upstream. The proposed marine facility would form a good protected harbour area.
4.4 Downtime Study
The downtime of the operations at the proposed facility depends on the probability of exceedance of met-ocean conditions above the thresholds required for safe operations of vessels.
Considering the threshold values (Hs>0.5m, current speed > 1 m/s, wind > 20 knots) at the proposed facility (extraction location t3), the exceedance percentage is approx. zero.
However, long-term observations in proximity to the proposed facility is required for obtaining downtime with a higher level of confidence, especially concerning seasonal/monthly variations.
The present analysis pertains to normal operating conditions; it does not include extreme events like the possible land fall of cyclones. Considering the frequency of cyclonic storms crossing the coast during 1915-2015 (Section 2.6), there is an average of only 1 cyclone per 15 year. Hence, a downtime of approx. 0.5-day/year (one week per cyclone) is envisaged for extreme events. This sort of downtime should be predicted based on met-ocean forecast for the area, once the facility is in operation.
4.5 Cyclone Modelling
4.5.1 Tropical Cyclone Tracks As a tropical cyclone passes over sea surface, it simultaneously generates storm surge and cyclonic waves associated with low pressure and turning wind. Extreme waves and surges are generated by cyclonic turning wind fields as they propagate to the coast. The associated wave heights and water levels are exceptionally high and the characteristics change from storm to storm. These parameters are important to a large extent for planning and safe design of coastal structures. The information on the frequency and intensity of the storms passing over the study area is illustrated by the recorded best tracks obtained from (websites of) India Meteorological Department (IMD, India) and weather Unisys.
From these storm track data, cyclonic stages, maximum wind speed of the system, pressure drop, radius to maximum wind are retrieved and estimated.
The processes of selecting design water level and waves are site specific. Long-term measurements of water levels and waves are seldom available in Indian Coast. Hence storm surge and cyclonic waves are hindcasted from cyclonic track records for arriving at extreme conditions at the proposed facility location. The methodology adopted for
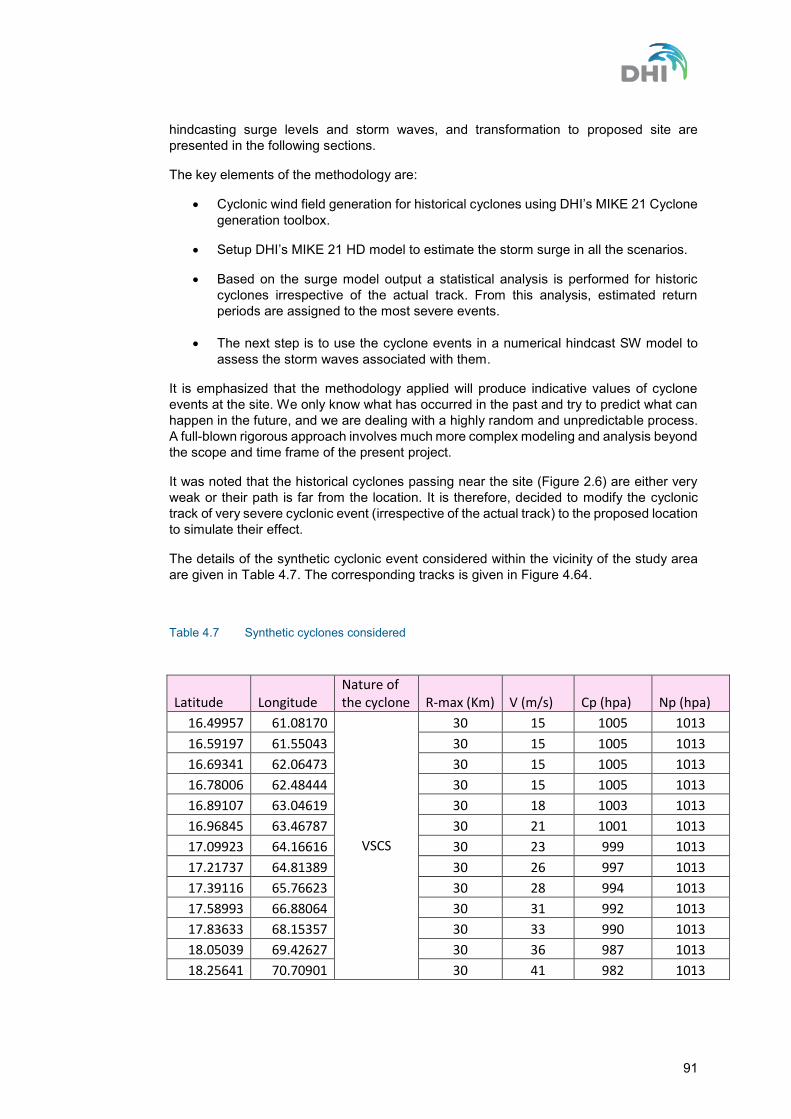
91
hindcasting surge levels and storm waves, and transformation to proposed site are presented in the following sections.
The key elements of the methodology are:
Cyclonic wind field generation for historical cyclones using DHI’s MIKE 21 Cyclone generation toolbox.
Setup DHI’s MIKE 21 HD model to estimate the storm surge in all the scenarios.
Based on the surge model output a statistical analysis is performed for historic cyclones irrespective of the actual track. From this analysis, estimated return periods are assigned to the most severe events.
The next step is to use the cyclone events in a numerical hindcast SW model to assess the storm waves associated with them.
It is emphasized that the methodology applied will produce indicative values of cyclone events at the site. We only know what has occurred in the past and try to predict what can happen in the future, and we are dealing with a highly random and unpredictable process. A full-blown rigorous approach involves much more complex modeling and analysis beyond the scope and time frame of the present project.
It was noted that the historical cyclones passing near the site (Figure 2.6) are either very weak or their path is far from the location. It is therefore, decided to modify the cyclonic track of very severe cyclonic event (irrespective of the actual track) to the proposed location to simulate their effect.
The details of the synthetic cyclonic event considered within the vicinity of the study area are given in Table 4.7. The corresponding tracks is given in Figure 4.64.
Table 4.7 Synthetic cyclones considered
Latitude Longitude Nature of the cyclone R-max (Km) V (m/s) Cp (hpa) Np (hpa)
16.49957 61.08170
VSCS
30 15 1005 1013
16.59197 61.55043 30 15 1005 1013
16.69341 62.06473 30 15 1005 1013
16.78006 62.48444 30 15 1005 1013
16.89107 63.04619 30 18 1003 1013
16.96845 63.46787 30 21 1001 1013
17.09923 64.16616 30 23 999 1013
17.21737 64.81389 30 26 997 1013
17.39116 65.76623 30 28 994 1013
17.58993 66.88064 30 31 992 1013
17.83633 68.15357 30 33 990 1013
18.05039 69.42627 30 36 987 1013
18.25641 70.70901 30 41 982 1013

92
Figure 4.64 Synthetic cyclone track with satellite imagery
Storm surge is atmospherically forced oscillations of the sea water level due to the presence of a storm. As a storm approaches the coastline, it acts like a sequence of events. In a storm surge, the three important phenomena are:
Forerunners Surge elevation Resurgence
Forerunner is the gradual rise in sea level that precedes the arrival of the cyclone, which may occur while the storm centre is at great distance from the point of observation. The surge elevation is the substantial rise in water level that accompanies violent winds of the storm and resurgence occur after the passage of a cyclone. Cyclone induced storm surge may contribute significantly to the design water level for coastal infrastructure.
For this present study the storm tracks and atmospheric conditions during historic storms in Arabian Sea were collected for past 100 years. In the past century, only six cyclone crossed in 150 Km radius. So it is clearly indicated that the study area was non cyclogenesis. But the worst scenario, synthetic cyclone is considered in the present simulation. The present simulation gives a detailed and critical picture of the surge level for the proposed study area. This attempt may be helpful for future analysis.
18.46713 72.06183 30 44 979 1013
18.65520 73.53481 30 41 982 1013
18.80991 74.87932 30 36 987 1013
18.93086 76.15037 30 26 997 1013
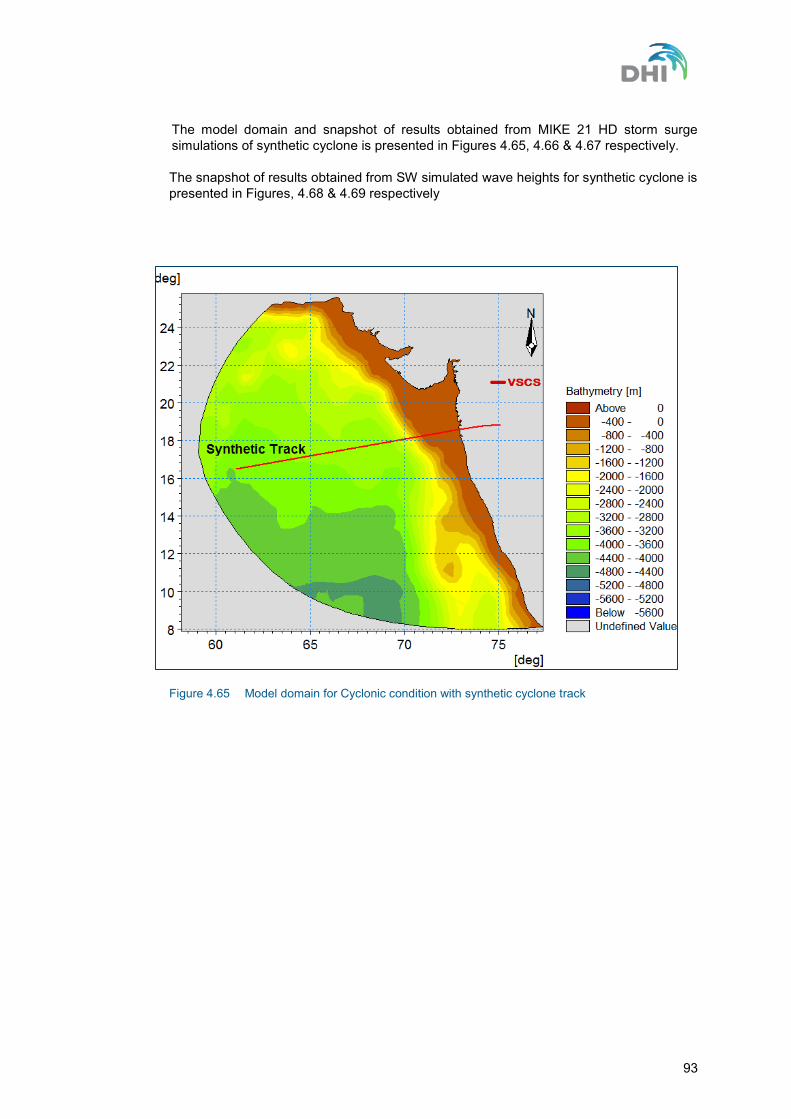
93
The model domain and snapshot of results obtained from MIKE 21 HD storm surge simulations of synthetic cyclone is presented in Figures 4.65, 4.66 & 4.67 respectively. The snapshot of results obtained from SW simulated wave heights for synthetic cyclone is presented in Figures, 4.68 & 4.69 respectively
Figure 4.65 Model domain for Cyclonic condition with synthetic cyclone track

94
Figure 4.66 Snap short of storm surge near the proposed facility with extraction points
Figure 4.67 Time series plot of storm surge near the proposed facility
Figure 4.68 Snap short of cyclonic waves near the proposed facility with extraction points

95
Figure 4.69 Time series plot of cyclonic wave heights near the proposed facility
Based on the simulation results, storm surge level (Figure 4.67) and extreme wave parameters (Figure 4.69) are obtained at proposed facility. It shall be noticed that the study approach produces estimates for a synthetic extreme event.
4.6 Sediment Transport modelling A preliminary model using MIKE 21FM ST was set up to simulate the sedimentation in the proposed area. The model domain was kept same as used in HD Modelling (Section 4.2).
Sediment characteristic is very important in determining the total sediment transport load. The geometrical characteristics of the bed material are represented through the median grain size (d50) when numerically calculating the concentration of suspended sediment and the sediment transport.
The sediment distribution is internally described in the MIKE21 ST module by a log-normal grain curve which is calculated on the basis of the median grain size d50. The sediment characteristic in the whole domain is chosen to be fine sand with d50 of 0.17mm. This assumption is based on the data provided by the client.
The sediment transport modelling was carried out for the same period of from 26th October 2015 to 16th November 2015 as HD model.
The calculation of the bed level change assumes the bulk density of pure quartz sand of 2,650 kg/m3. The numbers in terms of bed level change will vary by considering different bulk densities.
The bed level change at the entrance and in the channel can be observed in Figure 4.70 and 4.71 for existing conditions and Figure 4.72 and 4.73 for proposed facility condition.
The statistical results of the 22 days simulation for the proposed facility are presented in terms of incremental annual mean bed level change which is given by scaling of bed level changes observed during simulation periods (Figure 4.74).

96
Figure 4.70 snapshot of bed level change for the existing condition
Figure 4.71 Very close snapshot of bed level change for the existing condition

97
Figure 4.72 snapshot of bed level change for the proposed marine facility
Figure 4.73 Very close snapshot of bed level change for the proposed marine facility

98
Figure 4.74 Bed level changes and sedimentation quantity for different section at proposed marine facility
The average rate of siltation per annum along the various reaches of channel approaching the proposed facility is given above.
The average rate of siltation in the area proposed to be dredged corresponds to quantum of siltation of approx. 1.5 million Cum.
The siltation rates are not uniform over the area under consideration and vary based on the prevailing hydrodynamic conditions.
The rates of siltation estimated from model are based on the fact that the entire dredged area is maintained to the required depths and deposition is due to settlement of suspended sediment material.
It is also important to mention that since the entire area which will be dredged is a virgin land, it is likely that there is possibility of increase in siltation than estimates by model studies during initial few years till the side slopes of dredged/nearby area gets stabilized.
4.7 Shoreline changes The objective of the present assessment is to analyse the effect of the proposed development on the sedimentation regime within the port area, and determine coastal impacts, if any.
The longshore transport is governing the availability of sediments and thus the sedimentation in the access channel. Therefore, as long as there are no significant changes in the longshore transport due to external factors, no major changes in sedimentation in the area are expected.
The satellite imageries were analysed to ascertain the shoreline evolution for past 11 years. Three satellite imageries (Figure 4.75) corresponding to the spring tide period (2005, 2013

99
and 2015) are given below. An examination of the high water line for the past 11 years indicates that the shoreline is quite stable.
The Maharashtra coast experiences low annual net transport. The coast of Maharashtra is very stable and it does not have a problem of annual net erosion or excess deposition as reported in Chandramohan et. al. 1992 (ref/3/).
Hence it is concluded that there will be no significant shoreline impact with the proposed development.
Figure 4.75 Satellite imagery of the shoreline
4.8 Dredge Disposal modelling Identification of the dumping site in the offshore area was carried out so that after dumping the resulting concentration in the identified location is within permissible limits. The already calibrated hydrodynamic model was coupled with a dispersion module to give the likely spread (dispersion) of the dumped material.
DHI selected the modelled dumping grounds based on information and earlier studies provided by the client. Two locations 18°31'41"N, 72°41'32"E for the northern dumping site and 18°28'21"N, 72°42'53"E for the southern dumping site are selected which are approx. 24 km from the shore (Figure 4.76).

100
Figure 4.76 Dumping location of dredged materials
The dispersion of dredge spoil around the disposal area was simulated for the Northeast monsoon period from 26.10.206 to 26.11.2016. The spread of the disposed sediment on the sea floor after the one month of sediment disposal for the Northern location is shown in Fig. 4.77.
Figure 4.77 Model simulated deposition depth after dumping
The dispersion studies carried out at the proposed north and south dumping locations indicated that irrespective of the phase of the tide, dumped material does not enter the proposed extension of the outer channel. Also, material could be dumped inside the periphery of about 1.5 km radius from the suggested location. About 20 Million cum of the dredged material resulting from the capital dredging is assumed to be disposed off suitably at these two locations. For maintenance dredging, these dumping locations could also be utilised for disposing of dredged material during the maintenance of the channel, if the properties of the dumped material do not significantly changed from the material considered in the study.

101
5 Conclusion
The proposed Revdanda facility is located on the left bank of the Kundalika River.
The Revadanda creek formed by the confluence of the Kundalika River and the Arabian Sea is protected naturally from the predominant SW waves by the Korlai headland.
East of the proposed facility there is an existing JSW jetty and a bridge exists on Kundalika River about 400 m east of existing JSW jetty.
The hydrodynamic conditions were simulated using MIKE 21 HD FM model and the proposed facility is found to be well aligned with respect to the flow conditions with current speed of less than 0.5 m/s near the proposed facility. The maximum spring tidal range at the proposed facility is observed to be approx. 4.0 m.
Offshore wind and wave data was acquired from the United Kingdom Meteorological Office (UKMO) between 2006 and 2015 at a location 18°30'58"N and 72° 4'12.00"E, which is approximately 90 km off the coast.
MIKE 21 SW model was applied to transform the offshore wave climate to the nearshore conditions in the vicinity of the proposed facility. Results were presented as maps showing the spatial variation of the wave climate as well as wave roses and probability exceedance tables. The conclusion from the one year simulation is that the proposed facility is well protected with low wave disturbance indicating tranquil conditions.
To study the extreme weather conditions, hind casting was carried out for a synthetic cyclonic event considered within the vicinity of the study area. A storm surge of approx. 0.9 m and significant wave of 0.45 m was simulated at the proposed marine facility.
The results of the hydrodynamic simulations have been applied to simulate the sediment transport in order to estimate the sedimentation and bed level change for the proposed marine facility and presented in terms of incremental annual mean bed level change which is given by scaling of bed level changes observed during simulation periods. The quantity of siltation is simulated to be of the order of 1.5 million cu. m for the navigational channel.
No significant shoreline impact with the proposed development is envisaged.
The material obtained from dredging of the channel and the port area is to be dumped at a disposal ground located about 24 km from the shore line at 18°31'41"N, 72°41'32"E for the northern dumping site and 18°28'21"N, 72°42'53"E for the southern dumping site

102
References
/1/ Gray, W.M. (1968) Global view of the origin of tropical disturbances and storms. Mon. Wea. Rev., 96, 669-700
/2/ Dube, S.K., Rao, A.D., Sinha, P.C., Murty, T.S. and Bahulayan, N. (1997) Storm surge in the Bay of Bengal and Arabian Sea: The problem and its prediction. Mausam, Vol.48; 283-304p.
/3/ Chandramohan, P. and Nayak, B. U. (1992) Longshore Sediment Transport Model for the Indian West Coast, Journal of Coastal Research, Vol. 8; 775-787p

Annexure 3
Appendix for Terrestrial Ecology

Annexure 3 :Appendix for Terrestrial Ecology Appendix 1: Sampling location
Sr. No.
Sampling locations
Quadrate number
Quadrate code
Distance radius
Habitat Impact notes
1
Core site q1 s1q1 0.5 km Very sparse and stunted Mangrove away from the site
moderate Sparse mangrove patches dominated by Avicennia species, away from the proposed development.
Cultivation of vegetatbles-e.g. brinjal done in the nearby areas.
2
Core site q2 s1q2 0.5 km Mangrove moderate Sparse mangrove patches dominated by Avicennia species, away from the proposed
development. 3 Core site q3 s1q3 0.5 km Mangrove moderate Sparse mangrove patches dominated by
Avicennia species, away from the proposed development.
4 Core site q4 s1q4 0.5 km Mangrove moderate Sparse mangrove patches dominated by Avicennia species, away from the proposed
development. 5 Barashiv
q1 s2q1 5 km Dense forest low Selective logging
6 Barashiv
q2 s2q2 5 km Dense forest low Selective logging
7 Barashiv
q3 s2q3 5 km Dense forest low Selective logging
8 Barashiv
q4 s2q4 5 km Dense forest low Selective logging
9 Mahalunge q1 s3q1 5 km Forest moderate Some forest patches converted to plantations of mango, cashew & jackfruit

Sr. No.
Sampling locations
Quadrate number
Quadrate code
Distance radius
Habitat Impact notes
10 Mahalunge q2 s3q2 5 km Forest moderate Some forest patches converted to plantations of mango, cashew & jackfruit
11 Mahalunge q3 s3q3 5 km Forest moderate Some forest patches converted to plantations of mango, cashew & jackfruit
12 Mahalunge q4 s3q4 5 km Forest moderate Some forest patches converted to plantations of mango, cashew & jackfruit
13 Amali
q1 s4q1 5 km Dense forest moderate Selective logging
14 Amali
q2 s4q2 5 km Dense forest moderate Selective logging
15 Amali
q3 s4q3 5 km Dense forest moderate Selective logging
16 Amali
q4 s4q4 5 km Dense forest moderate Selective logging
17 Revdanda beach
q1 s5q1 5 km Beach (coastal ecosystem)
high Tourist spot which has high human activity, monoculture of plant species like casuarinas, coconut & areca nut in the surrounding areas
18
Revdanda beach
q2 s5q2 5 km Beach (coastal ecosystem)
high Tourist spot with high human activity, monoculture of plant species like casuarinas, coconut & areca nut in the surrounding areas
19 Revdanda beach
q3 s5q3 5 km Beach (coastal ecosystem)
high Tourist spot with high human activity, monoculture of plant species like casuarinas, coconut & areca nut in the surrounding areas
20 Revdanda beach
q4 s5q4 5 km Beach (coastal ecosystem)
high Tourist spot with high human activity, monoculture of plant species like casuarinas, coconut & areca nut in the surrounding areas

Sr. No.
Sampling locations
Quadrate number
Quadrate code
Distance radius
Habitat Impact notes
21 Korlai fort q1 s6q1 2 km Plantations on mountain
surrounded by coastal ecosystem
high Tourist spot with high human activity
22 Korlai fort q2 s6q2 2 km Plantations on mountain
surrounded by coastal ecosystem
high Tourist spot with high human activity, monoculture of Acacia aurculiformi-the Australian
acacia
23 Korlai fort q3 s6q3 2 km Plantations on mountain
surrounded by coastal ecosystem
high Tourist spot with high human activity, monoculture of Acacia aurculiformi-the
Australian acacia
24 Korlai fort q4 s6q4 2 km Plantations on mountain
surrounded by coastal ecosystem
high Tourist spot with high human activity, monoculture of Acacia aurculiformi-the
Australian acacia
25 Korlai
q1 s7q1 2 km Agriculture moderate Agricultural landuse
26 Korlai
q2 s7q2 2 km Forest Low Low human impact, potential for high biodiversity
27 Korlai
q3 s7q3 2 km Forest Low Low human impact, potential for high biodiversity
28 Korlai
q4 s7q4 2 km Forest Low Low human impact, potential for high biodiversity
29 Revdanda jetty
q1 s8q1 2 km Mangrove moderate Mangrove species dominated by Avicennia species, presence of migratory birds

Sr. No.
Sampling locations
Quadrate number
Quadrate code
Distance radius
Habitat Impact notes
30 Revdanda jetty
q2 s8q2 2 km Mangrove moderate Mangrove species dominated by Avicennia species, presence of migratory birds
31 Revdanda jetty
q3 s8q3 2 km Mangrove moderate Mangrove species dominated by Avicennia species, presence of migratory birds
32 Revdanda jetty
q4 s8q4 2 km Mangrove moderate Mangrove species dominated by Avicennia species, presence of migratory birds
33 Agrav jetty q1 s9q1 5 km Mangrove moderate Mangrove species dominated by Avicennia species, presence of migratory birds
34 Agrav jetty q2 s9q2 5 km Mangrove moderate Mangrove species dominated by Avicennia species, presence of migratory birds
35 Agrav jetty q3 s9q3 5 km Mangrove moderate Mangrove species dominated by Avicennia species, presence of migratory birds
36 Agrav jetty q4 s9q4 5 km Mangrove moderate Mangrove species dominated by Avicennia species, presence of migratory birds

Appendix 2: Flora Appendix 2.1 Flora in Core Appendix 2.1 a Checklist of flora in core
Sr. No. Scientific name Common name Family Habit
1 Avicennia marina (Forssk.)Vierh Mauritian grass Avicenniaceae Tree 2 Avicennia officinalis L. Tivar Avicenniaceae Tree 3 Pongamia pinnata (L.) Pierre Karanj Fabbaceae Tree 4 Sonneratia alba Sm. Karpu Acanthaceae Tree 5 Zizyphus mauritiana Lamk. Ber Rhamnaceae Tree 6 Erythrina stricta Roxb. Phangara Fabbaceae Tree 7 Kirganelia reticulata (Poir) Baill. Pitouri Euphorbiaceae Shrub 8 Ricinus communis Linn. Castor Euphorbiaceae Shrub 9 Achyranthes aspera L. Tivar Amaranthaceae Herb
10 Ageratum conyzoides L. Aghada Asteraceae Herb 11 Alternanthera paronychioides St. -Hill. Osadi Amaranthaceae Herb 12 Apluda mutica L. Smooth chaff Flower Poaceae Herb 13 Celosia argentea L. Kurdu Amaranthaceae Herb 14 Crotalaria juncea L. Sun hemp Fabaceae Herb 15 Mimosa pudica L. Lajalu Mimosaceae Herb 16 Scoparia dulcis L. Sweet Broom Weed Scrophulariaceae Herb 17 Sida cordata (Burm.f.) Borssum Bhui-chikna Malvaceae Herb 18 Cocculus hirsutus (L.) Diels Vasan vel Menispermaceae Climber

Appendix 2.1 b Phytosociological study in core I: Individuals- Number of individuals encountered-abundance, O: Occurrence -Number of quadrate a species has occurred in, RDo: Relative Dominance, RF: Relative Frequency, IVI: Importance Value Index
Sr. No. Scientific.name Habit Family Common name I O Rdo RF IVI 1 Avicennia marina (Forssk.) Vierh. Tree Avicenniaceae Tivar 32 4 50.79365 30.76923 81.56288 2 Avicennia officinalis L. Tree Avicenniaceae Tivar 13 3 20.63492 23.07692 43.71184 3 Sonneratia alba Sm. Tree Acanthaceae Karpu 11 3 17.46032 23.07692 40.53724 4 Pongamia pinnata (L.) Pierre Tree Fabbaceae Karanj 5 2 7.936508 15.38462 23.32112 5 Erythrina stricta Roxb. Tree Fabbaceae Phangara 2 1 3.174603 7.692308 10.86691
Appendix 2.2 Flora in Buffer Appendix 2.2 a Checklist of flora in buffer Sr. No. Scientific name Common name Family Habit
1 Acacia auriculiformis A.Cunn.exBenth. Australian babhul Mimosaceae Tree 2 Acacia catechuoides (Roxb.)Benth. Khair Mimosaceae Tree
3 Albizia odoratissima (L.f.) Benth. Chinchwa Mimosaceae Tree 4 Alstonia scholaris (L.) R.Br. Saptaparni Apocynaceae Tree 5 Anacardium occidentale L. Kaju Anacardiaceae Tree
6 Annona reticulata Linn. Ramphal Annonaceae Tree 7 Artocarpus heterophyllus Lamk. Phanas Moraceae Tree 8 Artocarpus incisus (Thunb.) L.f. Nirphanas Moraceae Tree
9 Avicennia officinalis L. Tivar Avicenniaceae Tree 10 Avicennia marina (Forssk.) Vierh. Tivar Avicenniaceae Tree
11 Bridelia spinosa Willd. Asana Euphorbiaceae Tree 12 Careya arborea Roxb. Kumbh Lecythidaceae Tree 13 Carica papaya L. Pappayi Caricaceae Tree

Sr. No. Scientific name Common name Family Habit
14 Caryota urens L. Bherli Mad Arecaceae Tree 15 Casuarina equisetifolia J. R. & G. Forst Suru Casuarinaceae Tree 16 Ceiba pentandra (L.) Gaertn. Kapok Malvaceae Tree
17 Cocos nucifera L. Naral Arecaceae Tree 18 Cordia dichotoma Forst.f. Bhokar Boraginaceae Tree 19 Delonix regia (Hook.) Rafin. Gulmohar Caesalpiniaceae Tree
20 Erythrina variegata L. Pangro Fabaceae Tree
21 Eucalyptus globulus Labil. Nilgiri Myrtaceae Tree
22 Ficus benghalensis L. Vad Moraceae Tree
23 Ficus hispida L.f. Kala Umber Moraceae Tree 24 Ficus racemosa L. Umber Moraceae Tree
25 Ficus religiosa L. Pimpal Moraceae Tree 26 Ficus callosa Willd. Calloused fig Moraceae Tree 27 Firmiana colorata (Roxb.) Br. Kavas Sterculiaceae Tree
28 Flacourtia indica (Burm.f.) Merr. Athruna Flacourtiaeae Tree
29 Gliricidia sepium (Jacq.) Walp. Giripushpa Fabaceae Tree
30 Grewia tiliaefolia Vahl Dhaman Tiliaceae Tree 31 Jatropha curcas Linn. Mogali erand Euphorbiaceae Tree 32 Lagerstroemia parviflora Roxb. Nana Lythraceae Tree 33 Lannea coromandelica (Houtt.) Merrill Shemat Anacardiaceae Tree 34 Leucaena leucocephala (Lamk.) De Wit. Subabhul Mimosaceae Tree 35 Macaranga peltata (Roxb.) Muell-Arg. Chanda Euphorbiaceae Tree

Sr. No. Scientific name Common name Family Habit
36 Mallotus philipinensis (Lamk.) Muell.-Arg. Shendri Euphorbiaceae Tree 37 Mangifera indica L. Amba Anacardiaceae Tree 38 Manilkara hexandra (Roxb.) Dubard Ceylon iron wood, Khirni Sapotaceae Tree 39 Memecylon umbellatum Burm. f. Anjan Melastomataceae Tree 40 Morinda pubesence Sm. Bartondi (Mp) Rubiaceae Tree 41 Oroxylum indicum (L.) Vent. Tetu Bignoniaceae Tree 42 Peltophorum pterocarpum (DC.) Bk.exHyn Sonmohar Caesalpiniaceae Tree 43 Plumeria alba L. Champa Apocynaceae Tree 44 Polyalthia longifolia (Sonn.) Thw. Asupalav (Pasarat) Annonaceae Tree 45 Pongamia pinnata (L.) Pierre Karanj Fabaceae Tree 46 Pterocarpus marsupium Roxb. `Bibla Fabaceae Tree 47 Rhizophora mucronata Lam. Asiatic Mangroove Rhizophoraceae Tree 48 Salmalia rubra (Buch.-Ham.) S. Dutta & P. Harvey Kate savar Bombacaceae Tree 49 Salvadora persica Linn. Pilu, Pilva Salvadoraceae Tree 50 Samania saman (Jacq.) Merrill Raintree Mimosaceae Tree 51 Sonneratia alba Sm. Karpu Acanthaceae Tree 52 Sterculia urens Roxb. Kahandol Sterculiaceae Tree 53 Streblus asper Lour. Kharoti Moraceae Tree 54 Syzygium cuminii (L.) Skeels Jamun Myrtaceae Tree 55 Tamarindus indica L. Chinch Caesalpiniaceae Tree 56 Tectona grandis L.f. Sag Verbenaceae Tree 57 Terminalia bellirica (Gaertn.) Roxb. Beheda Combretaceae Tree 58 Terminalia catappa L. Deshi badam Combretaceae Tree 59 Terminalia crenulata (Heyne) Roth Ain Combretaceae Tree

Sr. No. Scientific name Common name Family Habit
60 Terminalia paniculata Roth Kindal Combretaceae Tree 61 Thespesia populnea (L.) Sol.exCor. Bhend Malvaceae Tree 62 Vitex negundo L. Nirgudi Verbenaceae Tree 63 Zanthoxylum rhetsa DC Tirphal Rutaceae Tree 64 Zizyphus mauritiana Lamk. Ber Rhamnaceae Tree 65 Bombax ceiba L. Kate savar Bombacaceae Tree 66 Azadirachta indica (L.) Juss. Kadu Neem Meliaceae Tree 67 Abelmoschus manihot (Linn.) Medicus Raan Bhendi Malvaceae Shrub 68 Acanthus ilicifolius L. Marangi Acanthaceae Shrub 69 Calotropis gigantea (L.) R.Br. Akra,Ruie Asclepiadaceae Shrub 70 Calotropis procera (Ait.) R.Br. Akra,Ruie Asclepiadaceae Shrub 71 Catunaregam spinosa (Thunb.) Tiruveng. Gela Rubiaceae Shrub 72 Citrus limon (L.) Osbeck Nimbu Rutaceae Shrub 73 Crotalaria verrucosa L. Blue rattlepod, Sagartag Fabaceae Shrub 74 Ervatamia alternifolia (L.) S.M.Almeida Naag-kuda Apocynaceae Shrub 75 Eupatorium repandum Willd. Ranmodi Asteraceae Shrub 76 Hamelia patens Jacq. Firebush Rubiaceae Shrub 77 Helicteris isora L. Murad-sheng Sterculiaceae Shrub 78 Ixora parviflora Lamk. Lokhandi Rubiaceae Shrub 79 Kirganelia reticulata (Poir) Baill. Pitouri Euphorbiaceae Shrub 80 Lantana camara L. Ghaneri Verbenaceae Shrub 81 Leea macrophylla Roxb Gajkarni Leeaceae Shrub 82 Leea indica (Burm. f.) Merr. Karkani Leeaceae Shrub 83 Psidium guajava Linn. Peru Myrtaceae Shrub

Sr. No. Scientific name Common name Family Habit
84 Woodfordia fruticosa (L.) Kurz. Dhaiti Lythraceae Shrub 85 Carissa carandas L. Karvanda Apocynaceae Shrub 86 Abutilon indicum (L.) Sweet Mudra Malvaceae Herb 87 Acalypha indica Linn. Kupi Euphorbiaceae Herb 88 Achyranthes aspera L. Aghada Amaranthaceae Herb 89 Aerva lanta (Linn.) Juss. Kapuri-Madhuri Amaranthaceae Herb 90 Ageratum conyzoides L. Osadi Asteraceae Herb 91 Alternanthera paronychioides St. -Hill. Smooth chaff Flower Amaranthaceae Herb 92 Alysicarpus vaginalis (L.) DC., Chipta Fabaceae Herb 93 Andrographis paniculata (Burm.f.) Wall.ex Nees Kariyat Acanthaceae Herb 94 Anisomeles heyneana Benth. Chandar , Gopali Lamiaceae Herb 95 Apluda mutica L. Mauritian grass Poaceae Herb 96 Barleria pretoriensis C.B.Clarke Vajradanti Acanthaceae Herb 97 Blepharis maderaspatensis (L.) Roth, Creeping Blepharis Acanthaceae Herb 98 Blumea sp. Asteraceae Herb 99 Canscora diffusa (Vahl) R.Br. Kilwar Gentianaceae Herb
100 Cassia tora L. Takla Caesalpiniaceae Herb 101 Celosia argentea L. Kurdu Amaranthaceae Herb 102 Colocasia esculenta (L.) Schott Aaloo Araceae Herb 103 Crotalaria juncea L. Sun hemp Fabaceae Herb 104 Crotalaria pallida Aiton Sun hemp Fabaceae Herb 105 Cyathocline purpurea Gangotra Asteraceae Herb 106 Cyperus difformis L. Variable flatedge Cyperaceae Herb 107 Cyperus irea L. Kangaroo grass Cyperaceae Herb

Sr. No. Scientific name Common name Family Habit
108 Desmodium triflorum (L.) DC Ranmethi Fabaceae Herb 109 Eranthemum roseum (Vahl) R.Br. Dasmuli Acanthaceae Herb 110 Gomphrena celosioides Mart. Prostrate gomphrena Amaranthaceae Herb 111 Hemegraphis latebrosa (Roth) Nees Shade loving Acanthaceae Herb 112 Hygrophila ringens (L.) R. Br. ex Spreng. Erect hygrophilla Acanthaceae Herb 113 Hyptis suaveolens (Linn.) Poir Bhustrena Lamiaceae Herb 114 Ixora coccinea L. Patkalin Rubiaceae Shrub 115 Leucas aspera (Willd.) Link. Tumba Lamiaceae Herb 116 Ludwigia perensis Linn. Paddy clove Onagraceae Herb 117 Malachra capitata L. Ranbhendi Malvaceae Herb 118 Ocimum tenuiflorum L. Tulsi Lamiaceae Herb 119 Oldenlandia herbacea (L.) Roxb. Slender oldenlandia Rubiaceae Herb 120 Oplismenus compositus Beauv. Running mountaingrass Poaceae Herb 121 Pedilanthus tithymaloides (L.) Poit. Devil'sBackbone Euphorbiaceae Herb 122 Plumbago zyelanica L. Chitrak Plumbaginaceae Herb 123 Portulaca oleracea Linn. Ghol Portulacaceae Herb 124 Scoparia dulcis L. Sweet Broom Weed Scrophulariaceae Herb 125 Sida cordata (Burm.f.) Borssum Bhui-chikna Malvaceae Herb 126 Sida rhombifolia L. Chikna Malvaceae Herb 127 Sphaeranthus indicus L. Gorakhmundi Asteraceae Herb 128 Synedrella nodiflora (L.) Gartn. Pig Grass Asteraceae Herb 129 Tephrosia purpurea (L.) Pers. Unchali Fabaceae Herb 130 Themeda quadrivalvis (Linn.) O. Kuntze Kangaroo Grass Poaceae Herb 131 Tridax procumbens L. Dagdipala,Ekdandi Asteraceae Herb

Sr. No. Scientific name Common name Family Habit
132 Triumfetta rhomboidea Jaquin Ottu Pullu Tiliaceae Herb 133 Urena lobata L. Van-bhendi Malvaceae Herb 134 Vernonia cinerea (L.) Less. Sahadevi Asteraceae Herb 135 Dendrophthoe falcata (L.f.) Ettingsh. Vanda Loranthaceae Epiphyte 136 Vanda sp. Orchidaceae Epiphyte 137 Abrus precatorius L. Gunj Fabaceae Climber 138 Argyreia nervosa (Burm. f.) Bojer Elephant Creeper Convolvulaceae Climber 139 Bridelia stipularis (L.) Blume Patharphodi Euphorbiaceae Climber 140 Cajanus scarabaeoides (L.) Thouars Ghoshyachi vel Fabaceae Climber 141 Calycopteris floribunda Lamk. Ukshi Combretaceae Climber 142 Canavalia gladiata (Jacq.) DC. Abhai Fabaceae Climber 143 Capparis zeylanica L. Tarati Capparaceae Climber 144 Celastrus paniculatus Kanguni, Black oil plant Celastraceae Climber 145 Coccinea grandis (L.) Voight Tondli Cucurbitaceae Climber 146 Cocculus hirsutus (L.) Diels Vasan vel Menispermaceae Climber 147 Cucumis melo L. Wild Melon Cucurbitaceae Climber 148 Cucumis sativus L. Cucumber Cucurbitaceae Climber 149 Cyclea peltata (Lamk.) Hook.f. & Thoms. Pakar Menispermaceae Climber 150 Dalbergia volabilis Roxb. Alai Fabaceae Climber 151 Dregea volubilis (L.f.) Benth. Ex Hoo.f. Hiran Dodi Asclepiadaceae Climber 152 Evolvulus nummularifolia L. Nimulvel Convolvulaceae Climber 153 Ficus repens Roxb. ex Sm. Black ficus Moraceae Climber 154 Hemidesmus indicus (Linn.) Schult. Anantmul Periplocaceae Climber 155 Ipomoea biloba Forssk. Morning glory Convolvulaceae Climber

Sr. No. Scientific name Common name Family Habit
156 Jasminum malabaricum Wight Malabar Jasmine, Kusar Oleaceae Climber 157 Momordica charantia Linn. Karela Cucurbitaceae Climber 158 Mucuna pruriens (L.) DC. Prodr. Khaj-kuili Fabaceae Climber 159 Paracalyx scariosus (Roxb.)Ali Ran ghevda Fabaceae Climber 160 Passiflora foetida Linn. Veli-ghani Passifloraceae Climber 161 Quisqualis indica Linn. Madhumalti Combretaceae Climber 162 Smilax zeylanica L. Ghotvel Smilacaceae Climber 163 Zizyphus oenoplia (L.) Mill. Burgi Rhamnaceae Climber 164 Zizyphus xylopyra (Retz.) Willd. Giti Rhamnaceae Climber
Appendix 2.2 b Phytosociological study in buffer I: Individuals- Number of individuals encountered-abundance, O: Occurrence -Number of quadrate a species has occurred in, RDo: Relative Dominance, RF: Relative Frequency, IVI: Importance Value Index
Sr. No.
Scientific name Habit Common name
I O Rdo RF IVI
1 Carissa carandas L. Karvanda Shrub 48 13 4.98 4.02 9.0092 2 Avicennia marina (Forssk.) Vierh. Tivar Tree 43 8 4.47 2.48 6.942 3 Hemigraphis latebrosa (Heyne ex Roth) Nees in DC Shade loving hemigraphis Herb 33 10 3.43 3.1 6.5228 4 Eupatorium odorata Ranmodi Shrub 33 7 3.43 2.17 5.594 5 Lantana camara L. Ghaneri Shrub 33 7 3.43 2.17 5.594 6 Zizyphus mauritiana Lamk. Ber Tree 32 9 3.32 2.79 6.1093 7 Themeda quadrivalvis (Linn.) O. Kuntze Kangaroo grass Herb 32 7 3.32 2.17 5.4901 8 Wrightia tinctoria (Roxb.) R.Br Kuda Tree 26 8 2.7 2.48 5.1767 9 Avicennia officinalis L. Tivar Tree 26 7 2.7 2.17 4.8671 10 Alternanthera paronychioides St. -Hill. Smooth chaff flower Herb 25 6 2.6 1.86 4.4536 11 Tectona grandis L.f. Sag Tree 24 6 2.49 1.86 4.3498
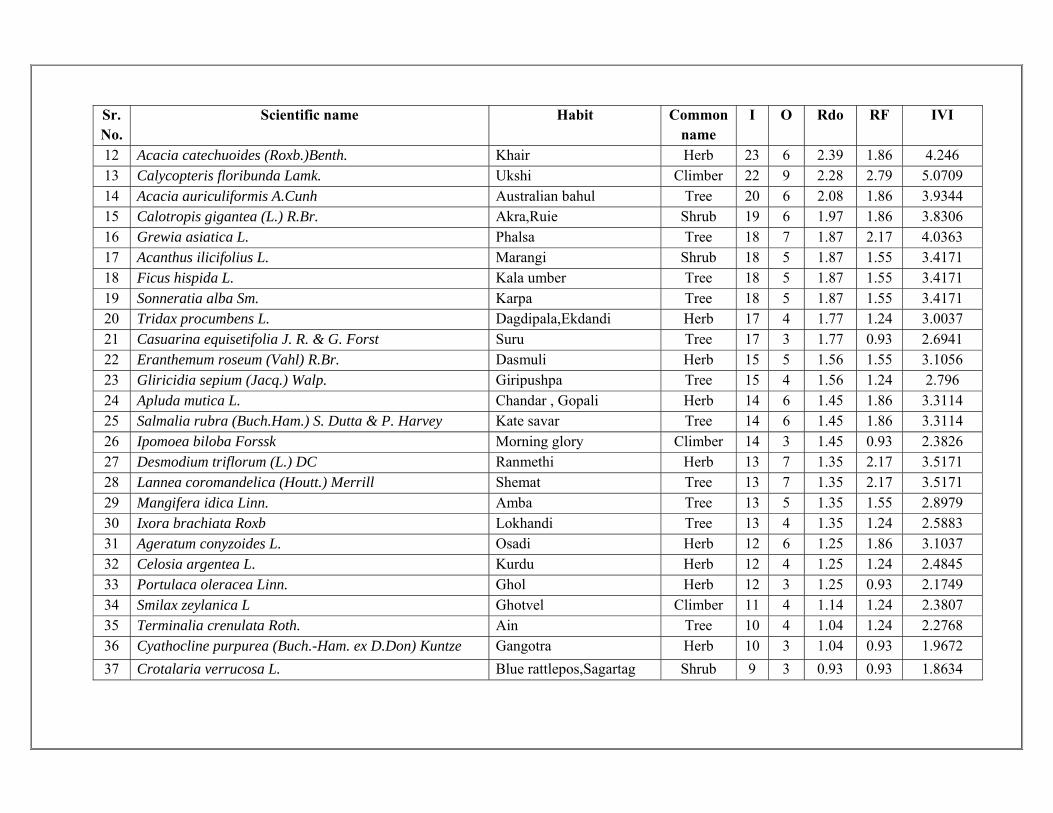
Sr. No.
Scientific name Habit Common name
I O Rdo RF IVI
12 Acacia catechuoides (Roxb.)Benth. Khair Herb 23 6 2.39 1.86 4.246 13 Calycopteris floribunda Lamk. Ukshi Climber 22 9 2.28 2.79 5.0709 14 Acacia auriculiformis A.Cunh Australian bahul Tree 20 6 2.08 1.86 3.9344 15 Calotropis gigantea (L.) R.Br. Akra,Ruie Shrub 19 6 1.97 1.86 3.8306 16 Grewia asiatica L. Phalsa Tree 18 7 1.87 2.17 4.0363 17 Acanthus ilicifolius L. Marangi Shrub 18 5 1.87 1.55 3.4171 18 Ficus hispida L. Kala umber Tree 18 5 1.87 1.55 3.4171 19 Sonneratia alba Sm. Karpa Tree 18 5 1.87 1.55 3.4171 20 Tridax procumbens L. Dagdipala,Ekdandi Herb 17 4 1.77 1.24 3.0037 21 Casuarina equisetifolia J. R. & G. Forst Suru Tree 17 3 1.77 0.93 2.6941 22 Eranthemum roseum (Vahl) R.Br. Dasmuli Herb 15 5 1.56 1.55 3.1056 23 Gliricidia sepium (Jacq.) Walp. Giripushpa Tree 15 4 1.56 1.24 2.796 24 Apluda mutica L. Chandar , Gopali Herb 14 6 1.45 1.86 3.3114 25 Salmalia rubra (Buch.Ham.) S. Dutta & P. Harvey Kate savar Tree 14 6 1.45 1.86 3.3114 26 Ipomoea biloba Forssk Morning glory Climber 14 3 1.45 0.93 2.3826 27 Desmodium triflorum (L.) DC Ranmethi Herb 13 7 1.35 2.17 3.5171 28 Lannea coromandelica (Houtt.) Merrill Shemat Tree 13 7 1.35 2.17 3.5171 29 Mangifera idica Linn. Amba Tree 13 5 1.35 1.55 2.8979 30 Ixora brachiata Roxb Lokhandi Tree 13 4 1.35 1.24 2.5883 31 Ageratum conyzoides L. Osadi Herb 12 6 1.25 1.86 3.1037 32 Celosia argentea L. Kurdu Herb 12 4 1.25 1.24 2.4845 33 Portulaca oleracea Linn. Ghol Herb 12 3 1.25 0.93 2.1749 34 Smilax zeylanica L Ghotvel Climber 11 4 1.14 1.24 2.3807 35 Terminalia crenulata Roth. Ain Tree 10 4 1.04 1.24 2.2768 36 Cyathocline purpurea (Buch.-Ham. ex D.Don) Kuntze Gangotra Herb 10 3 1.04 0.93 1.9672 37 Crotalaria verrucosa L. Blue rattlepos,Sagartag Shrub 9 3 0.93 0.93 1.8634

Sr. No.
Scientific name Habit Common name
I O Rdo RF IVI
38 Helicteres isora L. Murud sheng Shrub 9 3 0.93 0.93 1.8634 39 Hemidesmus indicus (Linn.) Schult. Anantmul Climber 9 3 0.93 0.93 1.8634 40 Blepharis maderaspatensis (L.) Roth. Creeping blepharis Herb 8 4 0.83 1.24 2.0691 41 Macaranga peltata (Roxb.) Muell-Arg. Chanda Tree 8 4 0.83 1.24 2.0691 42 Lanatana camara Ghaneri Shrub 8 2 0.83 0.62 1.4499 43 Flacourtia montana Graham. Athruna Tree 7 3 0.73 0.93 1.6557 44 Cyclea peltata (Lamk.) Hk.f. Pakar Climber 7 2 0.73 0.62 1.3461 45 Dalbergia volubilis Roxb Alai Climber 7 2 0.73 0.62 1.3461 46 Tephrosia purpurea (L.) Pers. Unchali Herb 7 2 0.73 0.62 1.3461 47 Cocculus hirsutus (L.) Diels. Vasan vel Climber 6 3 0.62 0.93 1.5518 48 Pongamia pinnata (L.) Pierre Karanj Tree 6 3 0.62 0.93 1.5518 49 Salvadora persica Linn. Pilu ,Pilva Tree 6 3 0.62 0.93 1.5518 50 Kirganelia reticulata (Poir) Baill. Pitouri Shrub 6 2 0.62 0.62 1.2422 51 Mucuna pruriens (L.) DC. Prodr. Khaj-Kuili Climber 6 2 0.62 0.62 1.2422 52 Urena lobata L. Van-Bhendi Herb 6 2 0.62 0.62 1.2422 53 Careya arborea Roxb Kumbha Tree 5 5 0.52 1.55 2.0672 54 Canavalia gladiata (Jacq.) DC. Abhai Climber 5 3 0.52 0.93 1.448 55 Thespesia populnea (L.) Sol.exCor. Bhend Tree 5 3 0.52 0.93 1.448 56 Andrographis paniculata (Burm.f.) Wall.ex Nees Kariyat Herb 5 2 0.52 0.62 1.1384 57 Anogeisus latifolia (Roxb.ex DC.) Guillemin. & Perottet. Dhavda Tree 5 2 0.52 0.62 1.1384 58 Barleria pretoriensis C.B.Clarke Vajradanti Herb 5 2 0.52 0.62 1.1384 59 Sida rhombifolia L. Chikna Herb 5 2 0.52 0.62 1.1384 60 Vitex negundo L. Nirgudi Tree 5 2 0.52 0.62 1.1384 61 Hyptis suaveolens (Linn.) Poir Bhustrena Herb 5 1 0.52 0.31 0.8288 62 Anisomeles heyneana Benth Chandar Gopali Herb 4 3 0.42 0.93 1.3442 63 Triumfetta rhomboidea Jaquin Ottu Pullu Herb 4 1 0.42 0.31 0.725

Sr. No.
Scientific name Habit Common name
I O Rdo RF IVI
64 Bridelia spinosa Willd. Asana Tree 3 3 0.31 0.93 1.2403 65 Ficus racemosa L. Umber Tree 3 3 0.31 0.93 1.2403 66 Ixora coccinea L. Patkalin Shrub 3 2 0.31 0.62 0.9307 67 Streblus asper Lour. Kharoti Tree 3 2 0.31 0.62 0.9307 68 Woodfordia subfruticosa (L.) Kurz Dhaiti Shrub 3 2 0.31 0.62 0.9307 69 Blumea oxyodonta DC. Spiny leaved blumea Herb 3 1 0.31 0.31 0.6211 70 Cordia dichotoma Forst.f. Bhokar Tree 3 1 0.31 0.31 0.6211 71 Eclipta prostrata (L.) L. Bhringraj Herb 3 1 0.31 0.31 0.6211 72 Leucaena leucocephala (Lamk.) De Wit. Subabhul Tree 3 1 0.31 0.31 0.6211 73 Microcos paniculata L. Hansoli,Shiral Tree 3 1 0.31 0.31 0.6211 74 Triumfetta rhomboidea Jacq Ottu pullu Herb 3 1 0.31 0.31 0.6211 75 Azadirachta indica (L.) Juss. Kadu neem Tree 2 2 0.21 0.62 0.8269 76 Abrus precatorius L. Gunj Climber 2 1 0.21 0.31 0.5173 77 Dregea volubilis (L.f.) Benth. ex Hoo.f. Hiran dodi Climber 2 1 0.21 0.31 0.5173 78 Ficus benghalensis L. Vad Tree 2 1 0.21 0.31 0.5173 79 Grewia tiliaefolia Vahl Dhaman Tree 2 1 0.21 0.31 0.5173 80 Smilex indica Ghotvel Climber 2 1 0.21 0.31 0.5173 81 Abelmoschus manihot (L.) Medic Raan Bhendi Shrub 1 1 0.1 0.31 0.4134 82 Bauhinia racemosa Lamk. Apta Tree 1 1 0.1 0.31 0.4134 83 Borasus flabelliformis L. Tad Tree 1 1 0.1 0.31 0.4134 84 Bridelia stipularis (L.) Blume Patharphodi Tree 1 1 0.1 0.31 0.4134 85 Catunaregam spinsa (Thunb.) Triveng. Gela Tree 1 1 0.1 0.31 0.4134 86 Coccinea grandis (L.) Voight. Tondli Climber 1 1 0.1 0.31 0.4134 87 Diploclisia glaucescens (Bl.) Diels. Ramrakh Climber 1 1 0.1 0.31 0.4134 88 Flacourtia indica Athrun Tree 1 1 0.1 0.31 0.4134 89 Leea macrophylla Roxb Gajkarni Shrub 1 1 0.1 0.31 0.4134
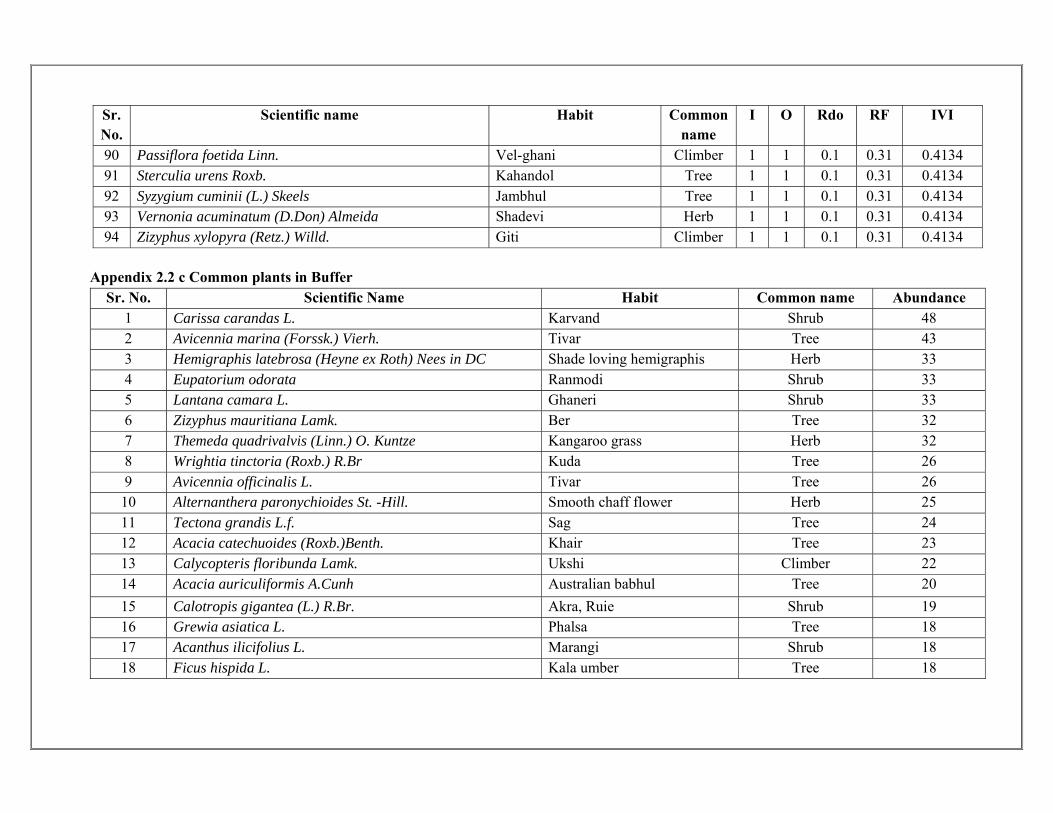
Sr. No.
Scientific name Habit Common name
I O Rdo RF IVI
90 Passiflora foetida Linn. Vel-ghani Climber 1 1 0.1 0.31 0.4134 91 Sterculia urens Roxb. Kahandol Tree 1 1 0.1 0.31 0.4134 92 Syzygium cuminii (L.) Skeels Jambhul Tree 1 1 0.1 0.31 0.4134 93 Vernonia acuminatum (D.Don) Almeida Shadevi Herb 1 1 0.1 0.31 0.4134 94 Zizyphus xylopyra (Retz.) Willd. Giti Climber 1 1 0.1 0.31 0.4134
Appendix 2.2 c Common plants in Buffer
Sr. No. Scientific Name Habit Common name Abundance 1 Carissa carandas L. Karvand Shrub 48 2 Avicennia marina (Forssk.) Vierh. Tivar Tree 43 3 Hemigraphis latebrosa (Heyne ex Roth) Nees in DC Shade loving hemigraphis Herb 33 4 Eupatorium odorata Ranmodi Shrub 33 5 Lantana camara L. Ghaneri Shrub 33 6 Zizyphus mauritiana Lamk. Ber Tree 32 7 Themeda quadrivalvis (Linn.) O. Kuntze Kangaroo grass Herb 32 8 Wrightia tinctoria (Roxb.) R.Br Kuda Tree 26 9 Avicennia officinalis L. Tivar Tree 26
10 Alternanthera paronychioides St. -Hill. Smooth chaff flower Herb 25 11 Tectona grandis L.f. Sag Tree 24 12 Acacia catechuoides (Roxb.)Benth. Khair Tree 23 13 Calycopteris floribunda Lamk. Ukshi Climber 22 14 Acacia auriculiformis A.Cunh Australian babhul Tree 20 15 Calotropis gigantea (L.) R.Br. Akra, Ruie Shrub 19 16 Grewia asiatica L. Phalsa Tree 18 17 Acanthus ilicifolius L. Marangi Shrub 18 18 Ficus hispida L. Kala umber Tree 18

Sr. No. Scientific Name Habit Common name Abundance 19 Sonneratia alba Sm. Karpu Tree 18 20 Tridax procumbens L. Dagdipala, Ekdandi Herb 17 21 Casuarina equisetifolia J. R. & G. Forst Suru Tree 17 22 Eranthemum roseum (Vahl) R.Br. Dasmuli Herb 15 23 Gliricidia sepium (Jacq.) Walp. Giripushpa Tree 15 24 Apluda mutica L. Mauritian grass Herb 14 25 Salmalia rubra (Buch.?Ham.) S. Dutta & P. Harvey Kate savar Tree 14 26 Ipomoea biloba Forssk Morning glory Climber 14 27 Desmodium triflorum (L.) DC Ranmethi Herb 13 28 Lannea coromandelica (Houtt.) Merrill Shemat Tree 13 29 Mangifera idica Linn. Amba Tree 13 30 Ixora brachiata Roxb Lokhandi Shrub 13
Appendix 2.2 d ecologically important species Note: These are non-mangrove species. These represent ecologically important species in and around the degraded forest patches.
Sr. No. Plant species Common Name
Family Habit Status Main Attractant for animals
1. Acacia catechu Khair Leguminosae Tree Native Flowers 2. Aegele marmelos Bel Rutaceae Tree Native Flowers and fruits 3. Albizia lebbeck Kala-siris Leguminosae Tree Native Flower and Fruits 4. Anogeissus latifolia Dhaora Sappotaceae Tree Native Fruits 5. Bauhinia purpurea Keolar Leguminosae Tree Native Flowers 6. Bauhinia racemosa Asta Leguminosae Tree Native Flowers 7. Bombax ceiba Semal Malvaceae Tree Native Flowers 8. Bridelia retusa Kasai Euphorbiaceae Tree Native Fruits 9. Buchanania latifolia Achar Anacardiaceae Tree Native Fruits
10. Butea monosperma Palas Leguminosae Tree Native Flowers

Sr. No. Plant species Common Name
Family Habit Status Main Attractant for animals
11. Carreya arborea Kumbhi Lecythedaceae Tree Native Flowers 12. Casaeria graveolens Gilchi Samydaceae Tree Native 13. Cassia fistula Amaltas Leguminosae Tree Native Fruits 14. Dalbergia latifolia Shisham Leguminosae Tree Native 15. Dalbergia sisoo Sisoo Leguminosae Tree Native Fruits 16. Diospyros melanoxylon Tendu Ebenaceae Tree Native Fruits 17. Diospyros montana Bistendu Ebenaceae Tree Native Fruits 18. Ficus benghalensis Bar Moraceae Tree Native Fruits 19. Ficus glomerata Gular Moraceae Tree Native Fruits 20. Ficus infectoria Pakar Moraceae Tree Native Fruits 21. Ficus religiosa Pipal Moraceae Tree Native Fruits 22. Flacourtia indica Native Fruits 23. Garuga pinnata Kekad Burseraceae Tree Native Flowers and fruits 24. Gmelina arborea Gamari Verbenaceae Tree Native Flower 25. Grewia tilifolia Dhaman Tiliaceae Tree Native Flower 26. Holoptelia integrifolia Chirol Ulmaceae Tree Native Fruit 27. Lagerstroemia parviflora Seja Lythraceae Tree Native Flower 28. Lannea coromondalica Jhingan Anacardiaceae Tree Native Fruits 29. Madhuca longifolia Mahua Euphorbiaceae Tree Native Flowers 30. Mangifera indica Amba Anacardiaceae Tree Native Flower and Fruits 31. Pongamia pinnata Karanj Leguminosae Tree Native Flowers 32. Pterocarpus marsupium Bijasal Leguminosae Tree Native Fruits 33. Schleichera oleosa Kusum Sapindaceae Tree Native Fruits 34. Sterculia urens Kulu Sterculiaceae Tree Native Fruits 35. Tamarindus indica Imli Leguminosae Tree Introduced Fruits 36. Tectona grandis Sagon Verbenaceae Tree Native Flowers

Sr. No. Plant species Common Name
Family Habit Status Main Attractant for animals
37. Terminalia arjuna Arjun Combretaceae Tree Native Fruits and flowers 38. Terminalia belerica Bahera Combretaceae Tree Native Flowers 39. Terminalia chebula Harra Combretaceae Tree Native Flowers 40. Terminalia tomentosa Tondri Combretaceae Tree Native Flowers
Appendix 3: Fauna Appendix 3.1 Fauna in Core Appendix 3.1 a Checklist of faunal species in core
Sr. No.
Scientific name Common name Family Faunal group
IUCN status Schedule
(WPA 1972)
1 Plexippus paykulli jumping spider Salticidae Arachnida - - 2 Cyrtophora bidenta tent spider Araneidae Arachnida - - 3 Egretta garzetta Little Egret Ardeidae Avian Least Concern IV 4 Acrocephalus dumetorum Blyth's Reed Warbler Acrocephalidae Avian Least Concern - 5 Actitis hypoleucos Common Sandpiper Scolopacidae Avian Least Concern IV 6 Alcedo atthis Common Kingfisher Alcedinidae Avian Least Concern IV 7 Ardeola grayii Indian Pond Heron Ardeidae Avian Least Concern IV 8 gelochelidon nilotica Common Gull-billed Tern Laridae Avian Least Concern - 9 Halcyon smyrnensis White-breasted Kingfisher Alcedinidae Avian Least Concern IV
10 Pluvialis squatarola Grey Plover Charadriidae Avian Least Concern IV 11 Tringa stagnatilis Marsh Sandpiper Scolopacidae Avian Least Concern IV 12 Tringa totanus Common Redshank Scolopacidae Avian Least Concern IV 13 Ariadne merione Common Castor Nymphalidae Insecta - - 14 Catopsilia pomona Lemon Emigrant Pieridae Insecta - - 15 Colotis amata Small Salmon Arab Pieridae Insecta - - 16 Danaus genutia Striped Tiger Nymphalidae Insecta - -

Sr. No.
Scientific name Common name Family Faunal group
IUCN status Schedule
(WPA 1972)
17 Euploea core Common Crow Nymphalidae Insecta Least Concern - 18 Papilio polytes Common Mormon Papilionidae Insecta - - 19 Ocypodinae sp. Ghost Crab Ocypodidae Malacostraca - - 20 Uca sp. Feedler Crab Ocypodidae Malacostraca - -
Appendix 3.1 b Fauna diversity by quadrate sampling in core
Sr. No. Scientific name Common name Faunal group Abundance Occurrence 1 Halcyon smyrnensis White-breasted Kingfisher Avian 1 1 2 Pluvialis squatarola Grey Plover Avian 1 1 3 Acrocephalus dumetorum Blyth’s Reed Warbler Avian 2 1 4 Egretta garzetta Little Egret Avian 2 2 5 Tringa stagnatilis Marsh Sandpiper Avian 2 1 6 Alcedo atthis Common Kingfisher Avian 4 2 7 gelochelidon nilotica Gull-billed Tern Avian 7 1 8 Tringa totanus Common Redshank Avian 9 2 9 Ardeola grayii Indian Pond Heron Avian 10 3
10 Actitis hypoleucos Common Sandpiper Avian 58 3 11 Ariadne merione Common Castor Insecta 1 1 12 Danaus genutia Striped Tiger Insecta 1 1 13 Papilio polytes Common Mormon Insecta 1 1 14 Euploea core Common Crow Insecta 2 2 15 Catopsilia pomona Common Emigrant Insecta 3 2 16 Colotis amata Salmon Arab Insecta 50 1 17 Uca Fiddler Crab Malacostraca 20 1

Sr. No. Scientific name Common name Faunal group Abundance Occurrence 18 Ocypodinae Ghost Crab Malacostraca 25 1
Appendix 3.2 Fauna in Buffer Appendix 3.2 a Checklist of faunal species in Buffer
Sr. No.
Scientific name Common name Family Faunal groupIUCN Status
Schedule (WPA 1972)
1 Oxudercinae sp. Mudskipper Gobiidae Actinopterygii - -
2 Argiope anasuja Signature Spider Araneidae Arachnida - -
3 Castianeira longipalpa Long-palped Ant-mimicking Sac Spider
Corinnidae Arachnida - -
4 Chilobrachys fimbriatus Indian Violet Tarantula Theraphosidae Arachnida Least Concern - 5 Cyrtophora sp. Tent spider Araneidae Arachnida - - 6 Heterometrus longimanus Asian Forest Scorpion Scorpionidae Arachnida - - 7 Hippasa partita Funnel web spider Agelenidae Arachnida - - 8 Lycosidae sp. Wolf spider Lycosidae Arachnida - - 9 Salticidae jumping spider Salticidae Arachnida - -
10 Hottentotta sp. Hottentotta Buthidae Arachnida - - 11 Pandion haliaetus osprey Pandionidae Avian Least Concern I 12 Pavo cristatus Indian Peafowl Phasianidae Avian Least Concern I 13 Accipiter badius Shikra Accipitridae Avian Least Concern - 14 Clanga hastata Indian Spotted Eagle Accipitridae Avian Vulnerable -
15 Acridotheres tristis Common Myna Sturnidae Avian Least Concern IV
16 Actitis hypoleucos Common Sandpiper Scolopacidae Avian Least Concern IV
17 Alcedo atthis Common Kingfisher Alcedinidae Avian Least Concern IV
18 Ardea intermedia Intermediate Egret Ardeidae Avian Least Concern IV
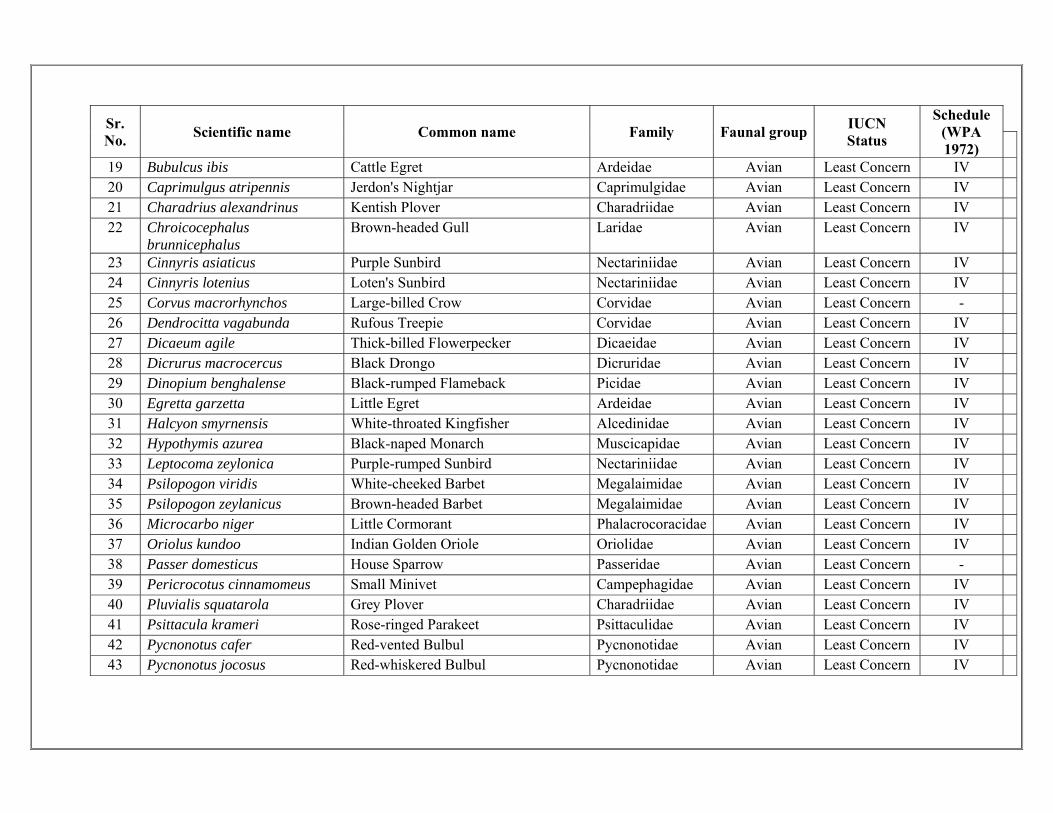
Sr. No.
Scientific name Common name Family Faunal groupIUCN Status
Schedule (WPA 1972)
19 Bubulcus ibis Cattle Egret Ardeidae Avian Least Concern IV
20 Caprimulgus atripennis Jerdon's Nightjar Caprimulgidae Avian Least Concern IV
21 Charadrius alexandrinus Kentish Plover Charadriidae Avian Least Concern IV
22 Chroicocephalus brunnicephalus
Brown-headed Gull Laridae Avian Least Concern IV
23 Cinnyris asiaticus Purple Sunbird Nectariniidae Avian Least Concern IV
24 Cinnyris lotenius Loten's Sunbird Nectariniidae Avian Least Concern IV
25 Corvus macrorhynchos Large-billed Crow Corvidae Avian Least Concern -
26 Dendrocitta vagabunda Rufous Treepie Corvidae Avian Least Concern IV
27 Dicaeum agile Thick-billed Flowerpecker Dicaeidae Avian Least Concern IV 28 Dicrurus macrocercus Black Drongo Dicruridae Avian Least Concern IV 29 Dinopium benghalense Black-rumped Flameback Picidae Avian Least Concern IV 30 Egretta garzetta Little Egret Ardeidae Avian Least Concern IV 31 Halcyon smyrnensis White-throated Kingfisher Alcedinidae Avian Least Concern IV 32 Hypothymis azurea Black-naped Monarch Muscicapidae Avian Least Concern IV 33 Leptocoma zeylonica Purple-rumped Sunbird Nectariniidae Avian Least Concern IV 34 Psilopogon viridis White-cheeked Barbet Megalaimidae Avian Least Concern IV 35 Psilopogon zeylanicus Brown-headed Barbet Megalaimidae Avian Least Concern IV 36 Microcarbo niger Little Cormorant Phalacrocoracidae Avian Least Concern IV 37 Oriolus kundoo Indian Golden Oriole Oriolidae Avian Least Concern IV 38 Passer domesticus House Sparrow Passeridae Avian Least Concern - 39 Pericrocotus cinnamomeus Small Minivet Campephagidae Avian Least Concern IV
40 Pluvialis squatarola Grey Plover Charadriidae Avian Least Concern IV
41 Psittacula krameri Rose-ringed Parakeet Psittaculidae Avian Least Concern IV
42 Pycnonotus cafer Red-vented Bulbul Pycnonotidae Avian Least Concern IV
43 Pycnonotus jocosus Red-whiskered Bulbul Pycnonotidae Avian Least Concern IV

Sr. No.
Scientific name Common name Family Faunal groupIUCN Status
Schedule (WPA 1972)
44 Pycnonotus luteolus White-browed Bulbul Pycnonotidae Avian Least Concern IV
45 Rhipidura albicollis White-throated Fantail Rhipiduridae Avian Least Concern -
46 Spilopelia senegalensis Laughing Dove Columbidae Avian Least Concern IV
47 Spilopelia suratensis Western Spotted Dove Columbidae Avian Least Concern IV
48 Threskiornis melanocephalus Black-headed Ibis Threskiornithidae Avian Near Threatened
IV
49 Treron phoenicopterus Yellow-footed Green-pigeon Columbidae Avian Least Concern IV
50 Tringa stagnatilis Marsh Sandpiper Scolopacidae Avian Least Concern IV
51 Larus ichthyaetus Pallas's Gull Laridae Avian Least Concern -
52 Pernis ptilorhynchus Oriental Honey-buzzard Accipitridae Avian Least Concern - 53 Acrocephalus dumetorum Blyth's Reed-warbler Acrocephalidae Avian Least Concern - 54 Aquila rapax Tawny Eagle Accipitridae Avian Vulnerable - 55 Ardeola grayii Indian Pond-heron Ardeidae Avian Least Concern IV 56 Cecropis daurica Red-rumped Swallow Hirundinidae Avian Least Concern - 57 Centropus sinensis Greater Coucal Cuculidae Avian Least Concern - 58 Circus aeruginosus Western Marsh-harrier Acipitridae Avian Least Concern - 59 Cisticola juncidis Zitting Cisticola Cisticolidae Avian Least Concern - 60 Columba livia Rock Dove Columbidae Avian Least Concern - 61 Cypsiurus balasiensis Asian Palm-swift Apodidae Avian Least Concern - 62 Egretta gularis Western Reef-egret Ardeidae Avian Least Concern IV 63 Eudynamys scolopaceus Western Koel Cuculidae Avian Least Concern - 64 Gelochelidon nilotica Common Gull-billed Tern Laridae Avian Least Concern -
65 Gymnoris xanthocollis Chestnut-shouldered Bush-sparrow Passeridae Avian Least Concern -
66 Haliastur indus Brahminy Kite Accipitridae Avian Least Concern -
67 Hieraaetus pennatus Booted Eagle Accipitridae Avian Least Concern -
68 Lanius schach Long-tailed Shrike Laniidae Avian Least Concern -

Sr. No.
Scientific name Common name Family Faunal groupIUCN Status
Schedule (WPA 1972)
69 Larus canus Mew Gull / Common Gull Laridae Avian Least Concern -
70 Merops orientalis Green Bee-eater Meropidae Avian Least Concern -
71 Monticola solitarius Blue Rock-thrush Muscicapidae Avian Least Concern IV
72 Orthotomus sutorius Common Tailorbird Cisticolidae Avian Least Concern -
73 Phylloscopus trochiloides Greenish Warbler Phylloscopidae Avian Least Concern -
74 Prinia hodgsonii Grey-breasted Prinia Cisticolidae Avian Least Concern -
75 Copsychus fulicatus Indian Robin Muscicapidae Avian Least Concern IV
76 Ariadne merione Common Castor Nymphalidae Insecta - -
77 Blaberus giganteus forest cockroach Blaberidae Insecta - -
78 Caelifera Grasshopper -- Insecta - - 79 Castalius rosimon Common Pierrot Lycaenidae Insecta - - 80 Catochrysops strabo Forget-Me-Not Lycaenidae Insecta - - 81 Catopsilia pomona Lemon Emigrant Pieridae Insecta - - 82 Colotis amata Small Salmon Arab Pieridae Insecta - - 83 Crematogaster sp. Crematogaster ant Formicidae Insecta - - 84 Danaus genutia Striped Tiger Nymphalidae Insecta - - 85 Euchrysops cnejus Gram Blue Lycaenidae Insecta - II 86 Eurema hecabe Common Grass Yellow Pieridae Insecta - - 87 Symphaedra nais Baronet Nymphalidae Insecta - - 88 Parantica aglea Glassy Tiger Nymphalidae Insecta - - 89 Ischnura sp. Ischnura sp. damselfly Coenagrionidae Insecta - - 90 Jamides celeno Common Cerulean Lycaenidae Insecta - -
91 Junonia lemonias Lemon Pansy Nymphalidae Insecta - -
92 Junonia orithya Blue Pansy Nymphalidae Insecta - -
93 Lepisma saccharina Silverfish Lepismatidae Insecta - -
94 Leptosia nina Psyche Pieridae Insecta - -

Sr. No.
Scientific name Common name Family Faunal groupIUCN Status
Schedule (WPA 1972)
95 Oecophylla sp. Weaver ant Formicidae Insecta - -
96 Oniscidea sp. woodlouse Malacostraca Insecta - -
97 Orthetrum sabina Slender Skimmer / Green Marsh Hawk
Libellulidae Insecta Least Concern -
98 Papilio polytes Common Mormon Papilionidae Insecta - -
99 Pareronia valeria common wanderer Pieridae Insecta - -
100 Phalanta phalantha Common Leopard Nymphalidae Insecta - -
101 Xylocopa carpenter bee Apidae Insecta - -
102 spp2 Tree hopper Membracidae Insecta - -
103 Paguroidea sp. Hermit Crab species Coenobitidae Malacostraca - - 104 Ocypodinae sp. Ghost Crab Ocypodidae Malacostraca - - 105 Uca sp/ Feedler Crab Ocypodidae Malacostraca - - 106 Urva edwardsii Indian Gray Mongoose Herpestidae Mammalia Least Concern II 107 Semnopithecus hypoleucos Black-footed Gray Langur cercopithecidae Mammalia Least Concern II 108 Funambulus palmarum Three-striped Palm Squirrel Sciuridae Mammalia Least Concern - 109 Sus scrofa wild boar Suidae Mammalia Least Concern III 110 Vulpes bengalensis Indian Fox Canidae Mammalia Least Concern II 111 Lepus nigricollis Black-naped Hare Leporidae Mammalia Least Concern IV 112 Monilesaurus rouxii Forest Blood Sucker Agamidae Reptilia Least Concern - 113 Hemidactylus brookii Brook's Gecko Gekkonidae Reptilia Least Concern - 114 Eutropis carinata Keeled Indian Mabuya Scincidae Reptilia Least Concern -

Appendix 3.2 b Fauna diversity by quadrate sampling in buffer Sr. No.
Scientific name Faunal group Abundance Occurrence
1 Argiope anasuja Arachnida 1 1 2 Chilobrachys fimbriatus Arachnida 1 1 3 Cyrtophora Arachnida 1 1 4 Heterometrus longimanus Arachnida 1 1 5 Salticidae Arachnida 1 1 6 Scorpio hottentotta Arachnida 1 1 7 sp3 Arachnida 1 1 8 Castianeira longipalpa Arachnida 2 2 9 Hippasa partita Arachnida 15 6
10 Acridotheres tristis Avian 1 1 11 Aquila rapax Avian 1 1 12 Ardea alba Avian 1 1 13 Chroicocephalus brunnicephalus Avian 1 1 14 Cinnyris lotenius Avian 1 1 15 Circus aeruginosus Avian 1 1 16 Clanga hastata Avian 1 1 17 Dinopium benghalense Avian 1 1 18 Monticola solitarius Avian 1 1 19 Oriolus kundoo Avian 1 1 20 Pandion haliaetus Avian 1 1 21 Pernis ptilorhynchus Avian 1 1 22 Rhipidura albicollis Avian 1 1 23 Sialia sialis Avian 1 1 24 sp5 Avian 1 1 25 sp6 Avian 1 1 26 Actitis hypoleucos Avian 2 2 27 Centropus sinensis Avian 2 2 28 Cisticola juncidis Avian 2 1 29 Corvus splendens Avian 2 2 30 Cypsiurus balasiensis Avian 2 1 31 Dendrocitta vagabunda Avian 2 1 32 Eudynamys scolopaceus Avian 2 1 33 Ichthyaetus ichthyaetus Avian 2 1 34 Megalaima viridis Avian 2 1 35 Megalaima zeylanica Avian 2 2 36 Microcarbo niger Avian 2 2 37 Spilopelia senegalensis Avian 2 1 38 Accipiter badius Avian 3 3 39 Alcedo atthis Avian 3 3 40 Ardea intermedia Avian 3 1

Sr. No.
Scientific name Faunal group Abundance Occurrence
41 Caprimulgus atripennis Avian 3 1 42 Halcyon smyrnensis Avian 3 3 43 Lanius schach Avian 3 3 44 Orthotomus sutorius Avian 3 1 45 Psittacula krameri Avian 3 1 46 Tringa stagnatilis Avian 3 1 47 Corvus culminatus Avian 4 2 48 Corvus macrorhynchos Avian 4 4 49 Hypothymis azurea Avian 4 1 50 Pavo cristatus Avian 4 1 51 Petronia xanthocollis Avian 4 1 52 Threskiornis melanocephalus Avian 4 2 53 Bubulcus ibis Avian 5 3 54 Charadrius alexandrinus Avian 5 2 55 Cinnyris asiaticus Avian 5 3 56 Egretta gularis Avian 5 2 57 Hieraaetus pennatus Avian 5 3 58 Phylloscopus trochiloides Avian 5 3 59 Spilopelia chinensis Avian 5 5 60 Turdoides striata Avian 6 2 61 Columba livia Avian 7 2 62 Tringa totanus Avian 7 1 63 Larus canus Avian 8 4 64 Saxicoloides fulicatus Avian 8 4 65 Pericrocotus cinnamomeus Avian 9 2 66 Cecropis daurica Avian 10 2 67 Prinia hodgsonii Avian 10 4 68 Pycnonotus cafer Avian 10 3 69 Passer domesticus Avian 11 1 70 Dicrurus macrocercus Avian 14 7 71 Haliastur Indus Avian 14 5 72 gelochelidon nilotica Avian 15 3 73 Ardeola Avian 17 5 74 Treron phoenicoptera Avian 21 2 75 Leptocoma zeylonica Avian 25 5 76 Acrocephalus dumetorum Avian 28 11 77 Egretta garzetta Avian 39 4 78 Merops orientalis Avian 39 7 79 Pycnonotus jocosus Avian 47 6 80 Scolopendra polymorpha Chilopoda 1 1 81 Scutigera coleoptrata Chilopoda 1 1

Sr. No.
Scientific name Faunal group Abundance Occurrence
82 Abisara echerius Insecta 1 1 83 Blaberus giganteus Insecta 1 1 84 C. corticicola Insecta 1 1 85 Caelifera Insecta 1 1 86 Catochrysops strabo Insecta 1 1 87 Crematogaster corticicola Insecta 1 1 88 Euthalia nais Insecta 1 1 89 Ideopsis similis Insecta 1 1 90 Ischnura sp. Insecta 1 1 91 Junonia orithyaq Insecta 1 1 92 Neptis hylas Insecta 1 1 93 Orthetrum sabina Insecta 1 1 94 Pareronia valeria Insecta 1 1 95 Phalanta phalantha Insecta 1 1 96 sp4 Insecta 1 1 97 Xylocopa Insecta 1 1 98 Ariadne merione Insecta 2 1 99 Atrophaneura hector Insecta 2 2
100 Danaus genutia Insecta 2 2 101 Euchrysops cnejus Insecta 2 2 102 Junonia lemonias Insecta 2 2 103 Oecophylla Insecta 2 2 104 sp1 Insecta 2 2 105 Jamides celeno Insecta 4 3 106 Spindasis vulcanus Insecta 4 3 107 Castalius rosimon Insecta 5 4 108 Catopsilia pomona Insecta 5 5 109 Delias eucharis Insecta 5 4 110 Oniscidea Insecta 6 1 111 Papilio polytes Insecta 6 4 112 Eurema hecabe Insecta 9 3 113 Leptosia nina Insecta 10 4 114 Lepisma saccharina Insecta 12 5 115 Colotis amata Insecta 15 3 116 Euploea core Insecta 19 4 117 Paguroidea Malacostraca 1 1 118 Ocypodinae Malacostraca 2 2 119 Funambulus palmarum Mammalia 1 1 120 Sus scrofa Mammalia 1 1 121 Vulpes bengalensis Mammalia 1 1 122 sp2 (Hare) Mammalia 2 2

Sr. No.
Scientific name Faunal group Abundance Occurrence
123 Urva edwardsii Mammalia 3 2 124 Semnopithecus hypoleucos Mammalia 4 2 125 Hemidactylus brookii Reptilia 2 2 126 Calotes Reptilia 4 4 127 Mabuya carinata Reptilia 14 5
Appendix 4.a Marine diversity in Core
Sr. No. Marine faunal group Species group 1 Zooplankton Gastropod larva 2 Zooplankton Bivalve larva 3 Zooplankton Copepoda 4 Zooplankton Fish larvae 5 Zooplankton Amphipoda 6 Zooplankton Polychaeta larvae 7 Zooplankton Decapoda larvae 8 Zooplankton Chaetognatha 9 Zooplankton Lucifers
10 Zooplankton Foraminifera 11 Phytoplankton Asterionella sp. 12 Phytoplankton Thalassiothrix sp 13 Phytoplankton Streptotheca sp 14 Phytoplankton Navicula sp 15 Phytoplankton Coscinodiscuss sp 16 Phytoplankton Skeletonema sp 17 Phytoplankton Thalassiosira sp 18 Phytoplankton cyclotella sp 19 Phytoplankton Odontella sp 20 Phytoplankton Rhizosolenia sp 21 Phytoplankton Leptocylindrus sp 22 Benthos Brachyuran sp 23 Benthos Nereis sp 24 Benthos Syllis sp 25 Benthos Notomastus sp 26 Benthos Gafrarium 27 Benthos Oysrer spat 28 Benthos Planaxis sp 29 Benthos Caprella sp 30 Benthos Corophium sp 31 Benthos Hydrozoa 32 Benthos Anomura 33 Benthos Megalona sp

Sr. No. Marine faunal group Species group 34 Benthos Donax sp 35 Brachymura Charybdis sp 36 Brachymura Grapus sp 1 37 Brachymura Grapus sp 2 38 Brachymura Ocypode 39 Anomura Uca sp. 40 Anomura Diogenes sp
Appendix 4.b Marine diversity in buffer
Sr. No. Marine faunal group Species group 1 Zooplankton Copepoda 2 Zooplankton Amphipoda 3 Zooplankton Polychaeta larvae 4 Zooplankton Decapoda larvae
5 Zooplankton Chaetognatha 6 Zooplankton Gastropod larva 7 Zooplankton Fish larvae 8 Zooplankton Foraminifera 9 Zooplankton Nauplius larva
10 Zooplankton Cladocera 11 Zooplankton Hydromedusa 12 Zooplankton Medusa 13 Zooplankton Lammalibranch 14 Zooplankton Cephalopoda larvae 15 Zooplankton Salpidae 16 Zooplankton heteropoda 17 Zooplankton Invertebrate larva 18 Zooplankton brachiopooda larva 19 Zooplankton Ctenophora 20 Zooplankton isopoda 21 Phytoplankton Asterionella sp. 22 Phytoplankton Thalassiothrix sp 23 Phytoplankton Streptotheca sp 24 Phytoplankton Navicula sp 25 Phytoplankton Coscinodiscuss sp 26 Phytoplankton Skeletonema sp 27 Phytoplankton Thalassiosira sp 28 Phytoplankton cyclotella sp 29 Phytoplankton Odontella sp 30 Phytoplankton Rhizosolenia sp 31 Phytoplankton Leptocylindrus sp 32 Phytoplankton Guinardia sp

Sr. No. Marine faunal group Species group 33 Phytoplankton Ditylum sp 34 Phytoplankton Dictyocha sp 35 Phytoplankton Melosira sp 36 Phytoplankton Triceratium sp 37 Phytoplankton Asteromphalus sp 38 Phytoplankton Pleurosigma sp 39 Phytoplankton Gyrosigma sp 40 Phytoplankton Trichodesmium sp 41 Phytoplankton Thalassionem sp 42 Phytoplankton Nitzschia sp 43 Phytoplankton Grammatophora sp 44 Phytoplankton Chaetoceros sp 45 Phytoplankton Ceratium furca 46 Phytoplankton Ceratium tripos 47 Phytoplankton Pyrophacus sp 48 Phytoplankton Phaeodactylum sp 49 Phytoplankton Climacodium sp 50 Phytoplankton Planktoneilla sp 51 Phytoplankton Peridinium sp 52 Phytoplankton Surirella sp 53 Phytoplankton Dytilum sp 54 Phytoplankton Clostidium sp 55 Phytoplankton Actinoptychus sp 56 Benthos Anomura 57 Benthos Capitellidae sp 58 Benthos Caprella sp 59 Benthos Cardita sp 60 Benthos Cumacea 61 Benthos Cyathura 62 Benthos Donax sp 63 Benthos Gafrarium 64 Benthos Hydrozoa 65 Benthos Katelysia 66 Benthos Marginella sp 67 Benthos Megalona sp 68 Benthos Murucidea sp 69 Benthos Nassaria sp 70 Benthos Nereis sp 71 Benthos Oligochaeta 72 Benthos Olivia sp 73 Benthos Oysrer spat 74 Benthos Paphia sp

Sr. No. Marine faunal group Species group 75 Benthos Planaxis sp 76 Brachymura Scylla serrata 77 Brachymura Charybdis sp 78 Brachymura Grapus sp 1 79 Brachymura Grapus sp 2 80 Brachymura Ocypode 81 Anomura Uca sp. 82 Anomura Diogenes sp

Appendix 4.c Marine diversity based on market and random survey Sr. No Family Scientific Name Common Name Type
1 Clupidae Sardinella longiceps Indian oil sardine Fish 2 Engraulidae Coilia dussumieri Golden ancovy Fish 3 Stromateidae Parastromateus niger Black pomfret Fish 4 Scombridae scomberomorus guttatus Surmai Fish 5 Scombridae scomberomorus commerson surmai Fish 6 Nemipteridae Arius dussumeri cat fish Fish 7 Synodontidae harpadon nehereus Bombay duck Fish 8 Cynoglossidae Cynoglossus arel Ghost crab Fish 9 Sciaenidae johnius dussumieri Dhoma Fish
10 Scatophagidae Scatophagus argus Spotted scat Fish 11 Carcharhinidae Scoliodon sp Dog fish Fish 12 Teripontidae terapon theraps perch Fish 13 Penaeidae Penaeus monodon - Prawn 14 Penaeidae Penaeus indicus - Prawn 15 Penaeidae Penaeus japonicus - Prawn 16 Penaeidae Metapenaeus monoceros - Prawn 17 Palinuridae Panulirus sp - Prawn 18 Portunidae Scylla serrata - Crab 19 Portunidae Portunus sanguinolentus - Crab 20 Brachyura Charybdis sp - Crab 21 Brachyura Grapus sp 1 - Crab 22 Brachyura Grapus sp 2 - Crab 23 Brachyura Ocypode Ghost crab Crab 24 Anomura Uca sp. Fiddler crab Crab 25 Anomura Diogenes sp Hermit crab Crab

Sr. No Family Scientific Name Common Name Type 26 Anomura Calcinus sp Hermit crab Crab 27 Trochidae Trochus chloromphalus A.Adams, 1853 - Gastropod 28 Trochidae Trochus radiatus Gmelin, 1791 - Gastropod 29 Trochidae Umbonium vestiarium Linnaeus, 1758 - Gastropod 30 Neritidae Nerita oryzarum Recluz, 1841 - Gastropod 31 Neritidae Nerita violacea Gmelin,1791 - Gastropod 32 Neritidae Nerita litterata Gmelin, 1791 - Gastropod 33 Littorinidae Littoraria intermediate Philippi, 1846 - Gastropod 34 Littorinidae Littoraria undulata Gray, 1839 - Gastropod 35 Potamididae Cerithidropsilla cingulata Gmelin,1791 - Gastropod 36 Naticidae Natica maculosa Lamarck, 1822 - Gastropod 37 Turridae Paradrillia patruelis E.A.Smith, 1875 - Gastropod 38 Buccinidae Pollia rubiginosa Reeve, 1846 - Gastropod 39 Babylonidae Babylonia spirata Linnaeus, 1758 - Gastropod 40 pyrinidae Euplica scripta Lamarck, 1822 - Gastropod 41 Scaphandridae Eocylichna protracta A.A.Gould ,1859 - Gastropod 42 olividae Oliva oliva Linnaeus, 1758 - Gastropod 43 Terebridridae Granuliterebra bathyrhaphe - Gastropod

11.0 Photo Feature
Figure 27 : Core Site (Stunted mangroves 300 – 500 m from proposed development)
Figure 28 : Team working in field

Figure 29: Ixora coccinea
Figure 30 : Eranthemum roseum (Vahl) R.Br.

Figure 31: Abrus precatorius L.
Figure 32: Plumbago Zyelanica L.

Figure 33: Convolus Sps.
Figure 34: Barleria Pretoriensis C.B. Clark
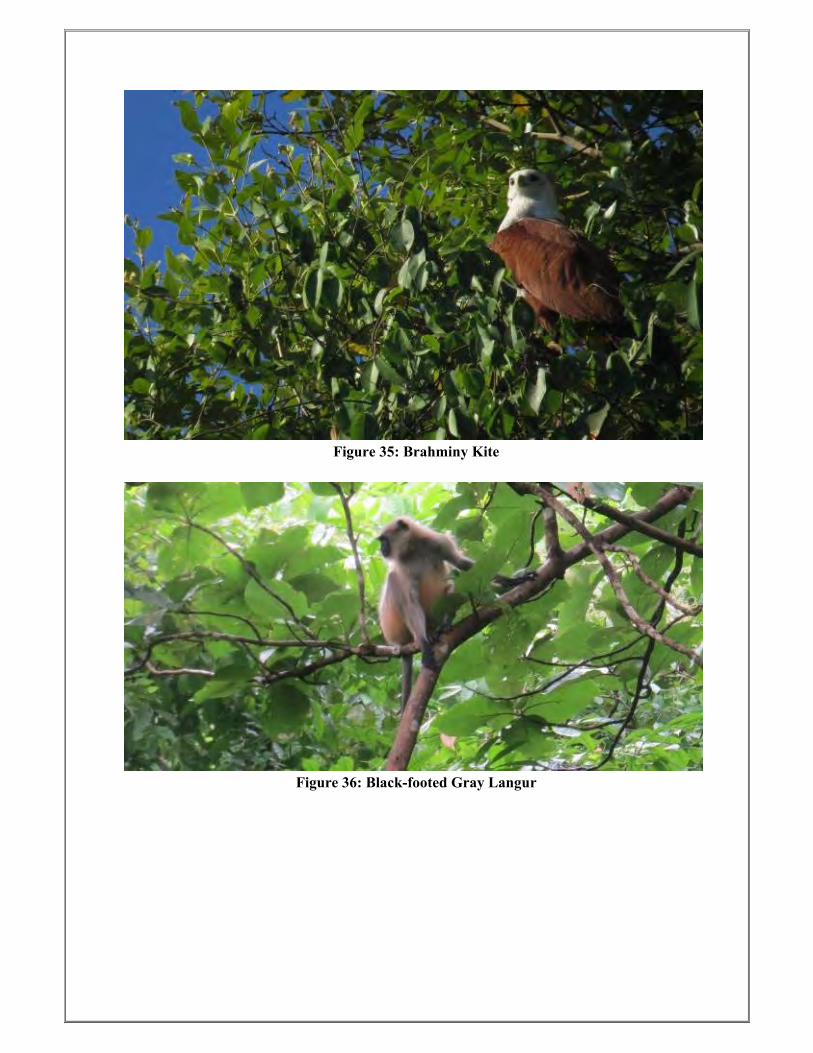
Figure 35: Brahminy Kite
Figure 36: Black-footed Gray Langur

Figure 37: House Centipede
Figure 38: Common Kingfisher

Figure 39: Osprey
Figure 40: Garden Lizard

Figure 41: Ghost Crab
Figure 42: Small Salmon A

Annexure 4
Compliance for 49th EAC Meeting

i. Upload copy of updated EIA/EMP
Report along with point‐wise ToR
Compliance and Annexures.
EIA/EMP is updated as per standard ToR and Awarded ToR. Point wise compliance of standard ToR and Awarded is given in Chapter 1 of EIA report.

ii. Upload copy of CZMA
recommendations given by
Maharashtra CZMA

I~
3. ·1 he proposal was deliberated in l l 6111 meeting of the MCLMA wherein 22"J March, 2017 wherein the Authority decided to, isit the site. Accordingly. site visit "as conducted on
a) The proposal is for 1) direct berthing deep water jetty facility on Kundalika River. village Korlai and 2) capacity enhancement at existing Inland Water Jett) Facility on Kundalika River at Village anegaon. 1 al. i\turud, Dist. Raigad.
b) The jell) facility is proposed on the Jell bank of the Kundalika River. in the Lee of the Korlai head. which will provide the necessary tranquil condition for the jetty operations.
c) I he Jett} is about 525 m long with one 8m x 8 m mooring dolphin on the East. d) The project will involve dredging up to a 14.5 km ling channel requiring I I million
cum of dredging for a depth of 11.0 m CD in phase I for l land) max vessels. Tn second phase channel length would increase to I 7.5km involving 23millon cum of dredging for a channel depth of 14.6m CD for Panamax vessels. In the final phase the channel length would increase to 2 I .5km and would require 35.2 million cum dredging for a channel depth of 19.0m CD for capsized , cssels. The dredging of the inner channel in the river for facilitating movement of 4500 D\\ T barges would involve 0.99 Mm3 for a depth of 3.1 m to CD.
c) As per the CRZ map prepared by NCSCM in I: 4000 scales. the project is proposed in CRZ I (8). CRZ Ill. CRL IV area.
I) I he PP has submitted the Rapid £:.IA/EMP for the project.
" Ihc Authority noted the detail as follows:
The proposal regarding proposed direct berthing deep , .. ater jetty facility on Kundalika River. village Korlai and capacity enhancement at existing Inland Water Jetty Facility on Kundalika River at Village anegaon. I al. Murud. Dist. Raigad b) Mis lndo Energy International Limited was considered in I l61h & 121'' meeting of Maharashtra Coastal Zone Management Authority (MC7.MA) held on 22"d to 23rd March.2017 and I 51h to I 61h September 2017 respectively.
Proposed direct berthing deep water jetty facility on Kundalika River. , illage Korlai and capacity enhancement at existing Inland Water Jett) lacility on Kundalika River at Village Sanegaon, Tal. Murud. Dist Raigad b) ~1 s lndo Inergy International Limited.
ubject:
To. Director (IA-Ill). Coastal Zone Regulation. Government of India. Ministry of Lnv ironmcnt. l-oresrs & Climate Change. lndira Paryavaran Bhavan. Jor Bagh Road. New Delhi - 1 IO 003
'-lo. CRl- 2011/ CR-4 TC 4 Office of the - vtaharashtra Coastal Lone Management Authority, Lnv ironment Department, I S'h floor, l\c,, Administrative Building, Mantralaya. Mumbai- 400 032. Date: 09'11 January, 2018
Tel 1'.Jo .. 22873844 E-mail : dirl.1neHnh<a'nic in \\ ebsite· https: mczma.mahar3!>htra.go\ .in/
\IAHARA~llTRA COASTAL ZO 'E MANAGEME T Al'THORITY

2
General Conditions: 1. The MCZMA reserves the right to revoke this recommendation. if the conditions
stipulated are not complied with to the satisfaction of the MCZMA or Environment Department.
11. The MCZMA or any other competent authority may stipulate any additional conditions subsequently. if deemed necessary. for environmental protection. which shall be complied with.
Specific conditions: 1. Proposed project should be as per the provisions of CRZ Notification.2011 (amended
from time to time) 11. All other required permission from different statutory authorities should be obtained.
5. After deliberation. the Authority decided lo recommend the proposal of direct berthing deep water jetty facility to MoEF. New Delhi subject to observations as stated above. I Iowever. the proposal for Expansion of the Sancgoan jetty at village Sanegoan is not recommended at present for the observations and compliance as staled above.
4. During the meeting, the Authority observed the followings: a) There will be change in hydrodynamic of the flow of the Revdanda creek due lo the
proposed construction of port and reclamation of 50 Ha area for stoppage of goods. b) PP needs to make a detailed plan for traffic management for carry ing cargoes.
considering the availability of narrow road adjacent to proposed port. The PP to develop detail traffic now management plan.
c) PP to redesign and construct. develop and monitor the existing roads proposed to be utilised for heavy cargo movement. considering its frequency.
d) PP lo ensure livelihood of local fisherman is not impacted due to proposed port and also develop alternate livelihood means under the project.
c) PP to submit the compliance of the Environment Clearance granted to Sanegoan jetty. Expansion of the Sancgoan jetty ma) not be permissible at present without compliance of the issues raised by committee of the Maharashtra Legislative Assembly in July. 2017.
a) The proponents should explore and submit the alternative plans/proposal for the proposed jetty facility those have minimal reclamation and alteration of local geomorphology.
b) There is involvement of a significant alteration of local geomorphology. reclamation of over 50 ha area. drastic change in the tidal water inflow and its distribution at the river mouth, extension of project actix ity right in the water channel.
c) The proponents have explained the need of having merry go round model of a railway line for convenient operation which was not mentioned in the EIA report the CRL map submitted and even the presentation made by the agency during 1 I 61h meeting of MCZMA.
d) Anticipating the scale of this proposal and its impact on the local inhabitants and resources, their perceptions about this development and its impact on to their livelihood has to be respected and counted in the studies.
I 6th July. 2017 by the Dr. Mahesh Sindikar. Expert Member. MCZMA with other officials. Mr. Pinto, VC from Mis Jndo Energy International Ltd and consultants for the project Captain Rohila. and Mr. Ajinkya were present for the site visit. The Authority look on record the site visit report of the expert member of the MCZMA.

3
Copy for information to: 1. Additional Chief Secretary, Environment & Chairman. MCZMA. Environment
Dept. Room No. 217, Annexe Building. Mantralaya. Mumbai. 2. Member ecretary, Maharashtra Pollution Control Board. KaJpataru Point. 3rd and
4th floor. Opp. CincMax Theatre. Sion (E). Mumbai-400 022 ~-~istrict Collector, Raigad
/- ~s. India Energy International Ltd, 609-610, Vindhya Commercial Complex. Sector-I 1. CBD Belapur. Navi Mumbai
5. Select File- TC 4
Dire . Em ironment & Member Secretary, MCZMA
6. The agenda item. minutes and the copy of this recommendation on the website of MCZMA i.e. http://mczma.maharashtra.gov.in.
111. A copy of the recommendation letter shall be marked to the concerned local body/ local NGO, if any. from whom any suggestion/ representation has been received while processing the proposal.
rv, The environmental safeguard measures should be implemented in letter and spirit. v. This recommendation will be valid for 5 years from the date of issue of
recommendation for commencement of construction & operation. No construction should be initiated till final permission from MoEF is obtained to the project.
vi. The recommendation from CRZ point of view is being issued without prejudice to the action initiated under EP Act or any court case pending in the court of law and it does not mean that project proponent has not violated an) environmental laws in the past and whatever decision under EP Act or of the Hon'blc court will be binding on the project proponent. I lence this recommendation does not give immunity to the project proponent in the case filed against him. if an) or action initiated under EP Act.


iii. Certificate from Chief Wild Life
Warden regarding permissibility and
distance of the project from Phansad
Wildlife Sanctuary.


iv. Certificate from Archaeological
Survey of India regarding
permissibility and distance of the
project from Korlai Fort.


v. Impacts of the proposed project on
crocodiles present in the upstream
of the Kundalika estuary.

Impact Mitigation plan for Crocodiles in the Project area
Mugger Crocodile also known as the Mugger or Marsh Crocodile (Crocodylus palustris) is a medium-sized crocodile having broadest snout among the living members of the genus Crocodylus. It is a species restricted to Indian sub-continent, and habits river, lakes and marshes. Adaptation of this species to big reservoirs, irrigation canals, and man-made ponds have been recorded in India, Pakistan, Sri Lanka and Iran. In few cases, its also have been found inhabiting coastal saltwater lagoons and estuaries. Crocodiles being reptiles having no homeostasis, are known to bask in the heat of the sunlight (Da Silva, 2010).
This species is protected under schedule I of the Wildlife (Protection) Act, 1972 of India. In terms of International conservation status, it is also categorized as “Vulnerable” species by International Union for The Conservation of Nature and Natural Resources (IUCN). These factors make it crucial for understanding the presence of the animal in the project area.
Mugger is a hole nesting species, with egg-laying taking place during the annual dry season. After attaining maturity, female lays eggs from 25-30 in number. Incubation period for these
eggs on an average is about couple of months (Da Silva, 2010).
Muggers are known to dig burrows, which provides protection to them and their eggs as well. Muggers take refuge in these burrows during hot day time as well. And critical role is played by such burrows in survival of crocodiles as burrows allow crocodiles to avoid exposure to excessively low or high temperatures (Da Silva, 2010).
Figure 1: Representative image of a crocodile from Kokan region

Principal threats to mugger identified were habitat destruction and fragmentation, drowning in fishing nets, egg predation by humans, etc. (Da Silva, 2010)
Understanding the presence of an animal
1. In order to learn about current status of the mugger population, a detailed species-specific survey shall be carried out.
2. As a part of the assessment, nesting sites and regularly used basking sites should be identified, monitored and mapped.
3. Survey should be conducted in the entire river stretch of the project area and also presence of the animal should be checked couple of kilometres outside the study area to estimate probability of the animal coming in the project area.
4. Socio-ecological surveys involving interviews with locals should be conducted for estimating current and past sightings of the animals.
Assuming the presence of Mugger in the project area, following impacts and mitigations have been drafted
Impacts during construction phase:
1. Dumping of construction material can disturb the animal or its nesting habitat or both
2. Noise and vibration can startle the animal and can make it leave the area / habitat.
3. Increased turbidity might make animal to leave the area
4. Construction workers knowingly or unknowingly creating man-animal conflict situations.
5. Waste released by construction worker can damage the habitat of not just crocodile but also of other animals and plants.
Impact during operational phase:
1. Accidents with vessels can result in injuries or fatalities to the animal
2. Vessel operation if not maintained properly are prone to oil and fuel spillage. Such accidents can damage animal life.
3. Vessel operation might damage / disturb the nesting habitats of the animal.
4. Wastage released from vessel and operational activities can damage the wildlife significantly.
Mitigation plan during construction phase:
5. Covering of construction material during transport and storage in order to avoid spillage of the material and prevent disturbance to the animal and nesting site of the animal.

6. Animal movement due to noise and vibration can be temporary and this impact is reversible type as animal can return to the nesting site once the disturbance stops.
7. Noise barriers and efficient construction equipment shall be used to in order to reduce the impact from noise and vibration.
8. Increased turbidity does disturb the animal, but muggers have been known to inhabit such turbid waters. Also, one the disturbance causing turbidity stops, animal can return to its habitat.
9. In order to learn about current status of the mugger population, a detailed species-specific survey shall be carried out. To reduce man-animal conflict such surveys can help manage safe operating protocols or guidelines around the area of operation and construction.
10. Locals should be made aware about the animal in case its presence is detected from the survey.
11. Regular monitoring for animal activity is advised to understand its movement in the project area clearly.
12. Proper waste management plan shall be prepared and shall be monitored for implementation. Regular assessments of its implementation shall be done.
Mitigation during operational phase
13. Vessel operators shall be sensitized towards safety of such faunal elements while operating their vessels in the water.
14. During operation care should be taken that no amount of oil or any fuel or chemical spillage shall occur at site of operation.
15. In case of sightings of animal, vessel operator or team shall be to document it regularly and keep a database on the same.
16. Corrective measures for operation of the vessels shall be taken with the help of data collected regularly.
17. Identified mugger burrows should be prevented from grazers to prevent mugger as well as to prevent man-animal conflict in the area.
18. Proper waste management plan shall be prepared and shall be monitored for implementation. Regular assessments of its implementation shall be done.
19. Capacity building and awareness generation shall be done for local communities with respect to the presence of mugger, and dos and don’ts.
References
Da Silva, A. a. (2010). Mugger Crocodile Crocodylus palustris. Crocodiles. Status Survey and
Conservation Action .

vi. A study on impacts of accidental
spillage due to ship grounding or
collision through model and its
mitigation.

Spill Modelling for the Development of the Direct Berthing Deepwater Jetty inside the Revadanda Creek and Inland Water Facility at Sanegaon, Raigarh, Maharashtra
Final Report
July 2020

This report has been prepared under the DHI Business Management System certified by BVC to comply with ISO 9001 (Quality Management), ISO 14001 (Environmental
Management), OHSAS 18001 (Health and Safety Management)
Approved by Dr. Tirumaleswara Reddy Technical Director

DHI (India) Water & Environment Pvt Ltd•Unit No. 612, Sixth Floor, DLF Prime Tower• Plot No. F-79-80 Okhla Phase-1• IN-11 00 20 New Delhi• India Telephone: +91 11 4704 6256 • www.dhigroup.com
Spill Modelling for the Development of the Direct Berthing Deepwater Jetty inside the Revadanda Creek and Inland Water Facility at Sanegaon, Raigarh, Maharashtra
Final Report
July 2020
Prepared for Indo Energy International Ltd.
and their consultants C-Borne Services LLP Represented by Capt. R.K. Karnal (IEIL)
Report authors Mr. Jinesh Kumar
Quality assurance Dr. N T Reddy
Project number 63801014
Approval date 18th July 2020
Revision B
Classification Confidential © DHI. All rights reserved. No parts of this document may be reproduced, transmitted or otherwise disseminated in any form or by any means outside the recipient’s organisation without the prior written permission of DHI.
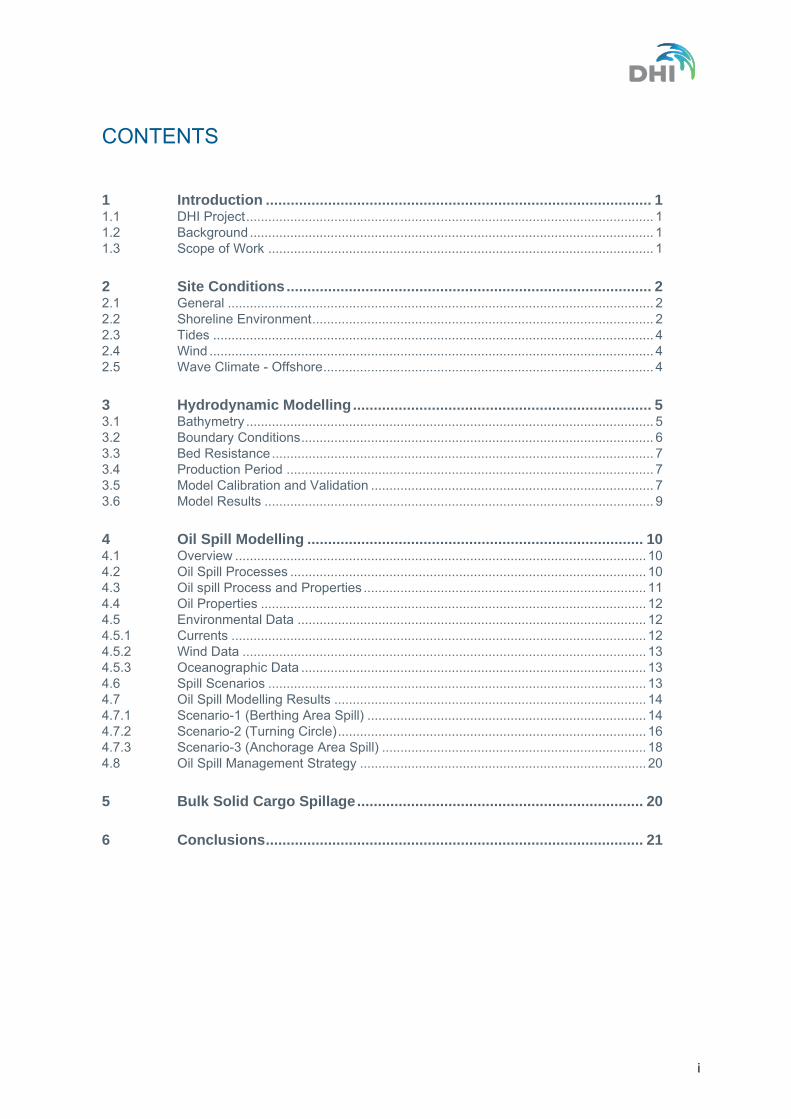
i
CONTENTS
1 Introduction ............................................................................................. 1 1.1 DHI Project ............................................................................................................... 1 1.2 Background .............................................................................................................. 1 1.3 Scope of Work ......................................................................................................... 1
2 Site Conditions ........................................................................................ 2 2.1 General .................................................................................................................... 2 2.2 Shoreline Environment ............................................................................................. 2 2.3 Tides ........................................................................................................................ 4 2.4 Wind ......................................................................................................................... 4 2.5 Wave Climate - Offshore .......................................................................................... 4
3 Hydrodynamic Modelling ........................................................................ 5 3.1 Bathymetry ............................................................................................................... 5 3.2 Boundary Conditions ................................................................................................ 6 3.3 Bed Resistance ........................................................................................................ 7 3.4 Production Period .................................................................................................... 7 3.5 Model Calibration and Validation ............................................................................. 7 3.6 Model Results .......................................................................................................... 9
4 Oil Spill Modelling ................................................................................. 10 4.1 Overview ................................................................................................................ 10 4.2 Oil Spill Processes ................................................................................................. 10 4.3 Oil spill Process and Properties ............................................................................. 11 4.4 Oil Properties ......................................................................................................... 12 4.5 Environmental Data ............................................................................................... 12 4.5.1 Currents ................................................................................................................. 12 4.5.2 Wind Data .............................................................................................................. 13 4.5.3 Oceanographic Data .............................................................................................. 13 4.6 Spill Scenarios ....................................................................................................... 13 4.7 Oil Spill Modelling Results ..................................................................................... 14 4.7.1 Scenario-1 (Berthing Area Spill) ............................................................................ 14 4.7.2 Scenario-2 (Turning Circle) .................................................................................... 16 4.7.3 Scenario-3 (Anchorage Area Spill) ........................................................................ 18 4.8 Oil Spill Management Strategy .............................................................................. 20
5 Bulk Solid Cargo Spillage ..................................................................... 20
6 Conclusions ........................................................................................... 21

ii
LIST OF FIGURES Figure 1-1 Location of present unloading facility at Sanegaon on the West Coast of India ..... 1 Figure 2-1 Location of Proposed facility off the mouth of Kundalika River ............................... 2 Figure 2-2 Local Bathymetry showing very near to the study area ........................................... 3 Figure 2-3 Local Bathymetry showing very near to the prosed facility and existing JSW jetty. 3 Figure 3-1 Water depth points with tidal stations (source: C-map) ........................................... 6 Figure 3-2 Zoom in figure of bathymetry snapshot showing the location of the proposed
facility ....................................................................................................................... 6 Figure 3-3 Comparison of measured and simulated water level at third pillar of Revdanda
Bridge ....................................................................................................................... 8 Figure 3-4 Comparison of measured and simulated current speed at location CM1 ................ 8 Figure 3-5 Comparison of measured and simulated current speed at location CM2 ................ 8 Figure 3-6 Comparison of measured and simulated current speed at location CM3 ................ 8 Figure 3-7 Very close snapshot of current pattern during peak flood tide and NE monsoon
with existing condition .............................................................................................. 9 Figure 3-8 Very close snapshot of current pattern during the ebb tide and NE monsoon with
existing condition ..................................................................................................... 9 Figure 4-1 Processes acting on spilled oil .................................................................................. 10 Figure 4-2 A schematic representation of the fate of a crude oil showing changes in the relative
importance of weathering processes with time ...................................................... 11 Figure 4-3 Spill locations ............................................................................................................ 14 Figure 4-4 Maximum thickness during SW monsoon for simulation between 04 July 2015 to 19
July 2015 ................................................................................................................ 15 Figure 4-5 Maximum thickness during NE monsoon for simulation between 26 October 2015 to
11 November 2015. ............................................................................................... 15 Figure 4-6 Maximum thickness during SW monsoon for simulation between 04 July 2015 to 19
July 2015 ................................................................................................................ 17 Figure 4-7 Maximum thickness during NE monsoon for simulation between 26 October 2015 to
11 November 2015. ............................................................................................... 17 Figure 4-8 Maximum thickness during SW monsoon for simulation between 04 July 2015 to 19
July 2015 ................................................................................................................ 19 Figure 4-9 Maximum thickness during NE monsoon for simulation between 26 October 2015 to
11 November 2015 ................................................................................................ 19
LIST OF TABLES Table 2-1 Tidal Levels in m at Revdanda................................................................................. 4 Table 4-1 Oil fractions ............................................................................................................ 12 Table 4-2 Spill parameter for scenarios 1-3 ........................................................................... 13

1
1 Introduction
1.1 DHI Project
M/s C-Borne Services LLP, Navi Mumbai has engaged DHI (India) Water & Environment Pvt Ltd. to carry out the oil spill and bulk solid cargo spill modelling for development of the direct berthing deep-water Jetty inside Revadanda Creek at the confluence of the Kundalika River with sea and the Sanegaon facility. DHI (India) is submitting this modelling report according to the Scope of Work given below.
1.2 Background
C-Borne Services LLP was appointed by Indo Energy International Ltd. (IEIL) as a consulting firm to conduct various studies for development of the direct berthing deep-water Jetty inside Revadanda Creek at the confluence of the Kundalika River with sea and the Sanegaon facility.
Indo-Energy Limited (IEIL), is presently engaged in transportation and trading of Coal using lighterage facility at Sanegaon, located on the Right Bank of the Kundalika River, about 50 km south of Mumbai as shown in Figure 1-1 below.
Figure 1-1 Location of present unloading facility at Sanegaon on the West Coast of India
1.3 Scope of Work
The scope of the work is to conduct oil spill modelling and bulk solid cargo spill assessment required to support the proposed expansion of the existing as well as the new facility inside the creek.

2
2 Site Conditions
2.1 General
The proposed Revdanda facility is located between geographical co‐ordinates of latitude 18° 32' 9.66"N, longitude 72°54' 54.88"E and latitude 18° 32' 11.82"N, longitude 72° 55' 11.71"E, on the left bank of the Kundalika River, North East of Rat Island (Figure 2-1).
The Revadanda creek formed by the confluence of the Kundalika River and the Arabian Sea is protected naturally from the predominant SW waves by the Korlai headland.
East of the proposed facility there is an existing JSW jetty which is a 235 m concrete block gravity wall Jetty with end radius at both ends of 7.5 m. JSW jetty has mooring dolphins which lie 21 m to the east, thereby increasing the total length of the jetty to 256 m. This Jetty is L shaped and both the faces of jetty are used for berthing of vessels. The north face accommodates two (2) unloading berths and one (1) loading berth. The Southern face of jetty is used for mooring of barges awaiting discharge, barges undergoing repairs and idle barges.
At the confluence of Kundalika River with sea, a shallow sandbar has been formed and depth over sandbar is only 0.5 to 1.5 m. In view of the limited depth, the port is used as lighterage port. Coal is transhipped in the self-propelled RSV II/IV barges of capacity 2500 ‐ 2800 DWT from mother vessel at anchorage. A 100 m wide, 7 nautical miles long entrance channel leads from anchorage point to JSW jetty for safe navigation of barges.
A bridge exists on Kundalika River about 400 m east of existing JSW jetty.
Figure 2-1 Location of Proposed facility off the mouth of Kundalika River
2.2 Shoreline Environment
The bathymetry map extracted from DHI’s in-house tool C-map for Site location is shown in Figure 2-2 and Figure 2-3. The bathymetry map indicates 10 m contour reaching within approx. 20 km from the mouth of the creek and shows offshore currents having a magnitude of approx. 0.5 knots.
The depths in the creek near the proposed port facility along the navigation channel vary from ‐3 m CD to ‐5 m CD.

3
The water depth in and around the existing JSW Revdanda jetty are of the order of ‐5 m CD. However, in the fairway the depths range from -3 m CD to ‐5 m CD.
There are sandy shoals and pockets of shallower depths at the creek entrance and the depths reduce to about ‐0.5 m CD to ‐1 m CD.
Figure 2-2 Local Bathymetry showing very near to the study area
Figure 2-3 Local Bathymetry showing very near to the prosed facility and existing JSW jetty.

4
2.3 Tides
The Naval Hydrographical Chart No 211 gives information on the tide and tidal levels and is reproduced in Table 2-1. The spring and neap tidal ranges are 2.6 m and 1.6 m respectively.
Table 2-1 Tidal Levels in m at Revdanda
MHWS 3.6
MHWN 3.3
MSL 2.4
MLWN 1.7
MLWS 1.0
Generally in the narrow estuarine areas, spatial variation of tide is likely to be prominent and the area like Kundalika River is not an exception and there is significant variation in high water levels as one moves upstream compared to open area water levels. This results in increased tidal current upstream of river.
2.4 Wind
During the months of June, July and August, the wind direction is SW-WSW. For rest of the months, predominant wind direction is NNE-N-NNW in the area. The wind speed is less than 10 m/s for 95% of the time.
2.5 Wave Climate - Offshore
It may be seen that the predominant directions of waves in the deep sea are from SW. It can also be seen that waves are less than 2 m, 4 m, and 5 m in height for 76%, 97.0% and 99.8% of the time respectively.

5
3 Hydrodynamic Modelling
Hydrodynamic modelling is carried out using DHI’s MIKE21 FM (Flexible Mesh) HD model. The model simulates 2D free-surface flows, solving the depth averaged Navier-Stokes equations and is applicable to the simulation of hydrodynamic processes in lakes, estuaries, bays, coastal areas and seas. The FM module of MIKE 21 is based on Flexible Mesh approach using triangular and quadrangular elements for addressing geometrical flexibility to complex coastlines, like archipelago, lagoons, estuaries etc.
The hydrodynamic model simulates water level variations and flows in response to a variety of forcing functions. The effects and facilities in the HD include:
• Bottom shear stress • Wind shear stress • Barometric pressure gradients • Coriolis force • Momentum dispersion • Sources and Sinks • Evaporation • Flooding and Drying • Wave radiation stress
MIKE 21 FM can be applied to a wide range of hydraulic and related phenomena including modelling of tidal hydraulics, wind and wave generated currents, storm surges. The main governing conditions which affect the performance of the hydrodynamic model are:
• Bathymetry • Boundary conditions (wind and water level on open boundaries) • Bottom resistance • Eddy viscosity
3.1 Bathymetry
Existing bathymetry of the region is prepared based on MIKE – CMAP supplemented with at site-specific data provided by the client near the proposed study area. C-Map is a global digitised chart, which includes the water depth contours and water surface elevation data (tidal stations) for the entire globe. The C-Map depth points can be seen in Figure 3-1, which were imported on to the MIKE 21 suite, for setting up the bathymetry.
The mesh ranges from fine resolution near-shore of 50m to 2,700m offshore and a very fine resolution (10 m) inside the creek, along the channel, entrance of the creek and proposed facility.
The proposed facility layouts are introduced in the existing bathymetry, where navigational channel (180 m width) is deepened to -14.5 m and the turning circle of diameter 500 m to -15.5 m depth. The berth pocket in front of the jetty is maintained at the same depth of -5.5m. The depths behind the main berth and at the barge berth were maintained at -12 m and -6 m respectively. The depth on the eastern part of the jetty for the Port crafts are in the range of (-3) to (-5) m. Model Bathymetry of the domain after including the proposed facility layout is given in Figure 3-2.

6
Figure 3-1 Water depth points with tidal stations (source: C-map)
Figure 3-2 Zoom in figure of bathymetry snapshot showing the location of the proposed facility
3.2 Boundary Conditions
The boundary conditions for the HD model were extracted from DHI’s Global tide prediction model. This model is a Global tide prediction model assimilated with 20 years of SSH from TOPEX/POSEIDON altimetry data. It represents the major diurnal (K1, O1, P1 and Q1) and semidiurnal tidal constituents (M2, S2, N2 and K2) with a spatial resolution of 0.25 × 0.25 degrees. For the present study, Model was trained providing three open sea boundaries which were extracted from this Tide model. However, the boundary condition of upstream discharge for Kundalika River is approximately 40 m3/s.

7
Wind is introduced over model as the atmospheric boundary condition through a speed dependent wind friction coefficient. The source of winds is derived from the UKMO dataset.
3.3 Bed Resistance
The MIKE21 hydrodynamic model is governed by the Reynolds-Averaged Navier-Stokes (RANS) equations, which are depth-integrated over the water column to finally yield the St. Venant equations. In the governing equations, the friction parameter is expressed as:
3/12hMgk =
Where M (m1/3/s) is the Manning Number (the Manning Number is also seen in the literature as n=1/M). The importance of Manning Number is well known in both traditional as well as numerical hydraulics. A varying Manning number is applied throughout the model domain to get a reasonable calibration to the tidal water level, both amplitude and phase.
3.4 Production Period
The hydrodynamic modelling is carried out for a periods of 22 days period to cover the full spring and neap phase of tidal cycle for validating the model. The production period of the hydrodynamic model is given below. Tide with northeast monsoon winds: 26 October to 16 November 2015.
3.5 Model Calibration and Validation
The results of calibration are provided in this section. This calibration is based on the field collected data provided by the client. Figure 3-3 gives the calibration plot with respect to water surface elevation. The simulated tidal levels are having a good agreement with the measured data. The comparison of the simulated and measured water level is in the acceptable range with RMS deviation of 0.17, which accounts about 2% of the tidal range.
Calibration and validation with respect to current speed and direction has been carried out at three locations CM1, CM2 and CM3. The predicted and measured current speed and direction at locations CM1, CM2 and CM3 has been represented in Figure 3-4 to Figure 3-6 respectively. From the figure it could be seen that the results are in agreement with the field measured data with the error of around 10-15% which can be attributed to the changes in the bathymetry.
HD model gives depth averaged current. The surface and bottom currents may have minor variation. Hence it is suggested to use following simplified formulation for estimating current at desired layers,
Current at a Layer = 1.142 X Depth Averaged Current x ( Layer Depth
Total Water Depth)
0.142
NB: Layer depth is numbered inversely like at 15m water depth, the surface layer is 15 and bottom layer is 1.

8
Figure 3-3 Comparison of measured and simulated water level at third pillar of Revdanda Bridge
Figure 3-4 Comparison of measured and simulated current speed at location CM1
Figure 3-5 Comparison of measured and simulated current speed at location CM2
Figure 3-6 Comparison of measured and simulated current speed at location CM3

9
3.6 Model Results
On calibrating and validating the model satisfactorily, the results were analysed in the region with particular focus on the proposed facility.
Figure 3-7 and Figure 3-8, gives the snapshot of the flow vectors during flood and ebb conditions.
Figure 3-7 Very close snapshot of current pattern during peak flood tide and NE monsoon with existing condition
Figure 3-8 Very close snapshot of current pattern during the ebb tide and NE monsoon with existing condition

10
4 Oil Spill Modelling
4.1 Overview
An oil slick on the surface will be subject to transport by predominant currents and winds. A good hydrodynamic model and good information on local winds at the spill site are therefore critical for predicting the movements of the oil. The HD modelling has been carried out using DHI MIKE21 modelling suite. The simulation of the hydrocarbon spills has been carried out using DHI’s Oil Spill model MIKE 21 OS. In this model the oil is represented as (Lagrangian) particles being advected with the surrounding water body and exposed to weathering processes. The advection (drift) of the individual particles is determined by the combined effects of current, wind and bed drag. The model provides information on oil slick locations, the amount of oil left on the sea surface, the slick mobility and the evolution of the physiochemical properties of the oil. The weathering processes included in the model are described below.
4.2 Oil Spill Processes
MIKE 21 OS model describes the spreading and weathering of oil spills in an aquatic environment under the influence of water movements and the associated dispersion processes (Figure 4-1). The oil itself is defined according to its distillation properties and chemical structure.
Figure 4-1 Processes acting on spilled oil
The following processes are considered in the models (Figure 4.1)
• Spreading (through advection by currents and dispersion)

11
• Evaporation
• Emulsification
• Vertical dispersion
• Dissolution
The physical and chemical changes that spilled oil undergoes are collectively known as weathering. Although the individual processes causing these changes may act simultaneously, their relative importance vary with time. Together they affect the behaviour of the oil and determine the fate. These processes are illustrated in Figure 4-2 for a spill of a typical medium crude oil under moderate sea conditions. Sedimentation only occurs for very heavy oils in connection with mineral particles (sand/clay). Biodegradation and photo-oxidation only affect oil spills in the longer term (i.e. weeks to months or years).
Figure 4-2 A schematic representation of the fate of a crude oil showing changes in the relative importance of weathering processes with time
4.3 Oil spill Process and Properties
The different parameters applied for the oil spill processes are listed below.
• Spreading: The currents define the water movement (advection) while the dispersion in the OS module is described using three dispersion coefficients that are proportional to the current in the longitudinal, transverse and vertical directions. Proportionality constants of 1.0 [m], 0.1 [m] and 0.01 [m] respectively were applied.
• Evaporation: Evaporation is given as a constant that is proportional to the amount of the evaporated oil. A default value of 0.0292 (dimensionless) has been applied.
• Emulsification: The emulsification process (water uptake) leads to a reduction in concentration, but also diminishes the evaporation of components from an emulsion. For the present study the emulsification is not included.
• Dispersion (called entrainment in MIKE 21 OS): The entrainment of oil (or vertical dispersion) into the water column is simulated using an interfacial tension parameter with a value of 20 dyne/cm (default value) valid for nonbreaking waves.

12
• Dissolution: The volume of oil leaving the slick due to dissolution is calculated via a mass transfer coefficient set to a default value of 2.36·10-6 (dimensionless).
Additionally, the heat transport is considered in MIKE 21 OS with the following parameters used in the balance calculation:
• Albedo value: 0.14
• Emissivity of oil: 0.8
• Emissivity of water: 0.95
• Emissivity of air: 0.82
4.4 Oil Properties
Oil properties are described in MIKE 21 OS through the percentage of each eight oil fractions given in Table 4-1.
Table 4-1 Oil fractions
Fraction Description Boiling range Values (%)
1 C6 – C12 (Paraffin) 69 – 2300 C 6.3
2 C13 – C25 (Paraffin) 230 – 4050 C 29.3
3 C6 – C12 (Cycloparaffin) 70 – 2300 C 15.3
4 C13 – C23 (Cycloparaffin) 230 – 4050 C 5.2
5 C6 – C11 (Aromatic) 80 – 2400 C 3.9
6 C12 – C18 (Aromatic) 240 – 4000 C 10
7 C9 – C25 (Napthteno-aromatic) 180 – 4000 C 10
8 Residual (incl. heterocycles) >4000 C 20
Additionally, a viscosity of 3.24 and reference temperature of 200 C are included in the spill modelling setup.
4.5 Environmental Data
As outline previously in the report, the hydrodynamic and wind conditions are key to driving the oil spill model.
4.5.1 Currents The drift applied in the oil spill simulations is a combination of a traditional bed shear profile (logarithmic from the hydrodynamic model simulation and wind acceleration of particles

13
directly exposed to the wind). The drift profile applied in the model is the sum of these two profiles.
4.5.2 Wind Data Wind data obtained from the DHI secondary data sources is applied in the oil spill model to describe the surface drift.
4.5.3 Oceanographic Data A constant salinity of 33 psu and a constant sea water temperature of 27 degree C have been applied.
4.6 Spill Scenarios
Three spill scenarios have been modelled:
Scenario 1- Leakages during loading and unloading processes at berth area
Scenario 2- Collision at the turning circle
Scenario 3- Collison at waiting/anchorage area with possible rupture of hale and grounding
Details of the individual oil spill scenarios are given in Table 4-2. Each spill simulates fuel oil as a conservative approach.
Table 4-2 Spill parameter for scenarios 1-3
Scenario Number 1 2 3
Location Near Berth At Turning Circle At Anchorage
Area
Type of oil Fuel oil Fuel oil Fuel oil
Total Spill 1000 Tonnes 10000 Tonnes 10000 Tonnes
Spill duration 2 hr 6 hrs 6 hrs
Simulation duration 15 days 15 days 15 days
Temperature 26 26 26
Water depth 14.5m 15.5m 15.5m
The locations of the spill are shown in Figure 4-3

14
Figure 4-3 Spill locations
4.7 Oil Spill Modelling Results
The results from the combination of 3 spill scenarios and 6 individual start times within the two monsoon seasons are presented by plots of arrival times and oil thickness.
4.7.1 Scenario-1 (Berthing Area Spill) Figure 4-5 and Figure 4-4 show the maximum oil thickness at the end of 15 day simulation occurring during Sw and NE monsoon.
Some key observations include:
• During SW monsoon, the oil slick can travel beyond the berthing area and enter inside the Revdanda river within the simulated two-week period, carried by the monsoon generated net currents.
• During NE monsoon, the oil slick is concentrated within the berth area and does not travel far away towards the Revdanda river
• The oil spill coverage is less during NE monsoon as it has higher probability to contained by west of the proposed development as shown in Figure 4-5.
• The oil slick travels towards coastline during NE monsoon while having a higher probability of being pushed more towards river during the SW monsoon.
• For some combination of tide and wind conditions, the oil slick tends to get trapped within the port premises in the model.

15
Figure 4-4 Maximum thickness during SW monsoon for simulation between 04 July 2015 to 19 July 2015
Figure 4-5 Maximum thickness during NE monsoon for simulation between 26 October 2015 to 11 November 2015.

16
4.7.2 Scenario-2 (Turning Circle) Figure 4-6 and Figure 4-7 show the maximum oil slick thickness at the end of 15 days simulation occurring during SW and NE monsoon for Scenario 2.
• The pattern for the spill in the turning circle is similar to the berthing area spill with the following main differences:
• The spill area is more exposed to the current flowing by the harbour and the slick therefore leaves the turning circle faster and spreads towards offshore during NE monsoon.
• The slick travels significantly further towards offshore during NE monsoon due to the more exposed spill location
• The oil slick travels towards coastline during SW monsoon due to the monsoon wind direction occurrence
• The probability of slick being contained within the harbour area is also much smaller than compared to the spill at the berthing area.
• The same precautions in the result interpretation apply as for spill Scenario 1 during SW monsoon, i.e it would be expected that the sea breeze effects and waves would lead to impacts along the coastline and rivermouth.

17
Figure 4-6 Maximum thickness during SW monsoon for simulation between 04 July 2015 to 19 July 2015
Figure 4-7 Maximum thickness during NE monsoon for simulation between 26 October 2015 to 11 November 2015.

18
4.7.3 Scenario-3 (Anchorage Area Spill) Spill Scenario 3 is at the Anchorage area well seaward of the proposed development. Figure 4-8 and Figure 4-9 show maximum oil thickness at the end of 15days simulation occurring during NE and SW monsoon respectively.
• With the same climatic scenarios, the slick behaviour with seasons is similar for spill Scenario 1 and 2. Notable differences for Spill Scenario 3 include:
• The spill occurs further off-shore, and the slick therefore travels offshore during NE monsoon.
• During SW monsoon conditions, the slick may reach coastline and it is possible that sea breeze effects would further increase risk that the slick is drawn along the coastline

19
Figure 4-8 Maximum thickness during SW monsoon for simulation between 04 July 2015 to 19 July 2015
Figure 4-9 Maximum thickness during NE monsoon for simulation between 26 October 2015 to 11 November 2015

20
4.8 Oil Spill Management Strategy
The oil spill modelling study indicates that, the fuel oil spill of 15000T will spread over a width of 2000m and will reach the mouth of the Revdanda river. Accordingly, the resource requirement based on the existing sea conditions and other environmental factors, should be kept in readiness in the study area. Resources such as booms, skimmers, dispersants and other necessary equipment should be placed in the Port for quick oil spill combat operations.
Priority should be given to contain the oil spill by physical means such as booms and skimmers. Dispersants (chemicals) should be used only if necessary, depending on the clean-up situation and damage that is likely to occur to the environment.
An Oil Spill Contingency Plan is an important working document that identifies the oil spill risks, the appropriate response strategies, the resources required to submit a response and the training and exercise necessary to ensure practicality and effectiveness of the plan. The purpose of this document is to provide guidance for the Disaster Management groups of the port. The main objective of the Contingency Plan is to prepare a Pollution control team to respond to the situation within maximum 30 minutes and also to ensure efficient communication processes as the communication plays an important role in the efficient management of an oil spill response.
5 Bulk Solid Cargo Spillage
Bulk solid cargo, consists of a combination of particles, granules, or any larger pieces of material, generally uniform in composition, and loaded directly into the cargo spaces without any intermediate form of containment. Most dry bulk cargo is prone to spillage, and if allowed to happen can pose environmental problems even for ports which handle comparatively low tonnages.
With advances in technologies, the equipment’ is provided with state-of-the-art pollution control measures such as, water fog system at the cargo hoppers and transfer point to arrest any unlikely dust emission. The cargo unloading grabs are also specially made spillage proof.
However, in the unlikely event of cargo spillage, due to heaviness of the material it is likely to sink to the sea bottom. These cargos are in general are not toxic and therefore would not cause appreciable water contamination. The spilled material in water however small quantities, would be cleaned from time to time and are not likely to cause any water pollution. The specific gravity of the material would not allow movement of these material under the combined action of the current and waves in the protected harbour environment. Accordingly, there would not be any appreciable effect on the immediate environs.
Since, the fines are very less, particle tracking model would not yield any significant result. It is therefore, a necessary requirement to design the equipment which are largely spillage proof and accidental spillage, if any would be on rarest of rare occasions. In case of such occurrences, immediate cleaning of the seabed in a radius of about 500-1000 meters would be carried out using appropriate equipment.
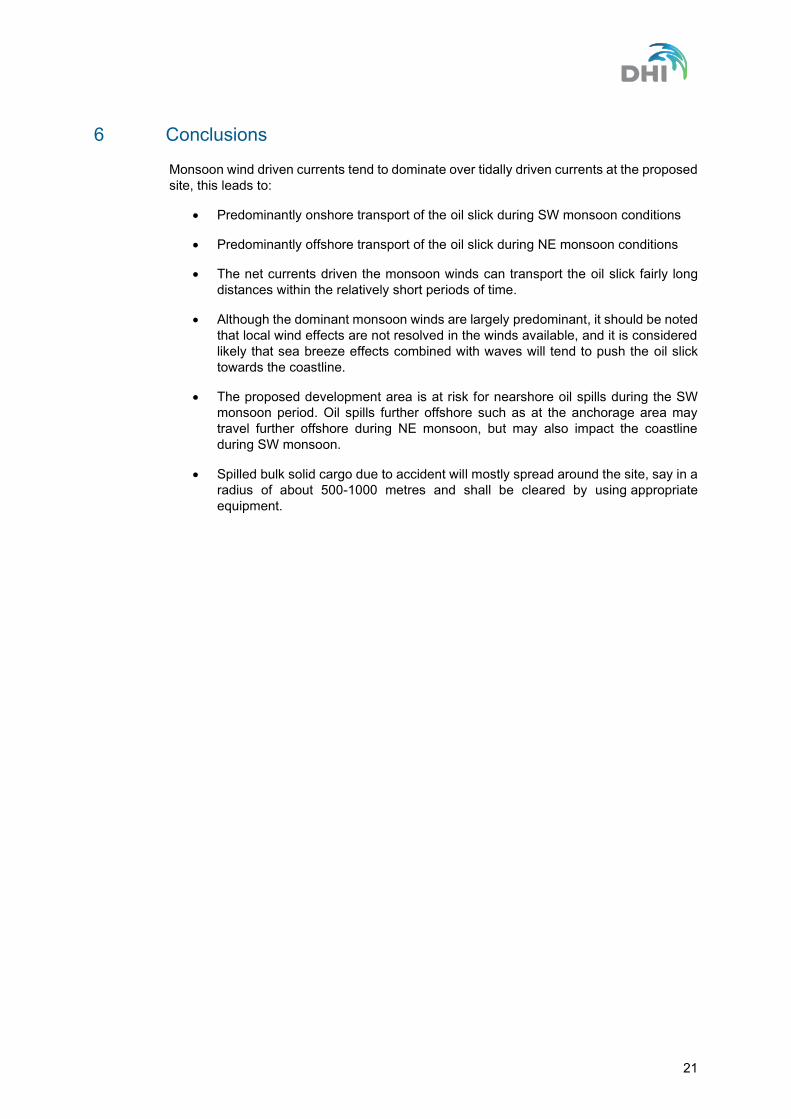
21
6 Conclusions
Monsoon wind driven currents tend to dominate over tidally driven currents at the proposed site, this leads to:
• Predominantly onshore transport of the oil slick during SW monsoon conditions
• Predominantly offshore transport of the oil slick during NE monsoon conditions
• The net currents driven the monsoon winds can transport the oil slick fairly long distances within the relatively short periods of time.
• Although the dominant monsoon winds are largely predominant, it should be noted that local wind effects are not resolved in the winds available, and it is considered likely that sea breeze effects combined with waves will tend to push the oil slick towards the coastline.
• The proposed development area is at risk for nearshore oil spills during the SW monsoon period. Oil spills further offshore such as at the anchorage area may travel further offshore during NE monsoon, but may also impact the coastline during SW monsoon.
• Spilled bulk solid cargo due to accident will mostly spread around the site, say in a radius of about 500-1000 metres and shall be cleared by using appropriate equipment.

vii. Point‐wise details of each of the
issues raised during public hearing
and commitments made by the
project proponent with EMP.

Indo Energy International Ltd.
Point-wise details of each of the issues raised during public hearing and commitments made
by the project proponent with EMP.
19th November, 2016, at Mr. Carmel School, Korlai, Ta. Murud, Dist. Raigad
Sh. Kiran Panbude, Additional District Magistrate, Raigad
Dr. AN Harshwardhan, RO, MPCB, Raigad
Sr. No.
Concerns raised
Our Response
1 The contents of the presentation are not correct. Local people are suffering due to nuisance of coal dust. As mentioned in the presentation, if 200 trucks are required for material transportation; the connecting roads are inadequate. The adjacent eco-friendly VIllage Chaul, is at a distance of 400 mtrs. Government has planned to develop Allbag and Murud as "Tourist Spots." In the project, coal and other mineral material will be handled. Due to contamination of sea water with liquid material of project, the fishes may die. The livelihood of local families is solely dependent on fishing. The project proponent has not implemented any scheme under CSR activities at Sanegaon. The project proponent was not willing to provide financial assistance to the family of deceased employee. The Reserved Forest Phanasad is near to the proposed project site. Due to the project, fishing activities, ecology of the area and Reserved Forest will be ruined. Korlai Fort of Archaeological Department and Phansad Reserved Forest having area of 6979 hector are nearby the project site. There Is one Light House near the proposed project. All these wlll be affected due to the proposed project. About sixteen types of minerals will be handled In the project. People may suffer from Cancer, Skin diseases and various other diseases due to handling of coal. There are possibilities of noise pollution during cargo handling. The ill-effects of pollution are observed in the vicinity of Sanegaon project. The proposed project may degrade surrounding environment, the eco-friendly Chaul village will also be affected. Coconut and Arecanut cultivation will be burnt. The health and livelihood of people will be in danger. Facilities for material storage and transportation are not available In the project. As the project will affect environment, we are opposing lt.
Project representative explained about the project and various mitigation measures in place to regulate traffic congestion on the present roads. The two lane Korlai-Roha road have been four-laned and carrying capacity of the roads have increased to take load of cargo evacuation by road. The project side is outside of the ecosensitive zone of the Phansad WS. Care will be taken that fishing carried out in the river is not hampered due to proposed project. Cautious care will be taken in controlling air pollution from the project. Proposal was submitted to Archaeological Survey of India but it was stated that Proposed project is outside Notified Zone of Korlai Fort hence NOC is not required
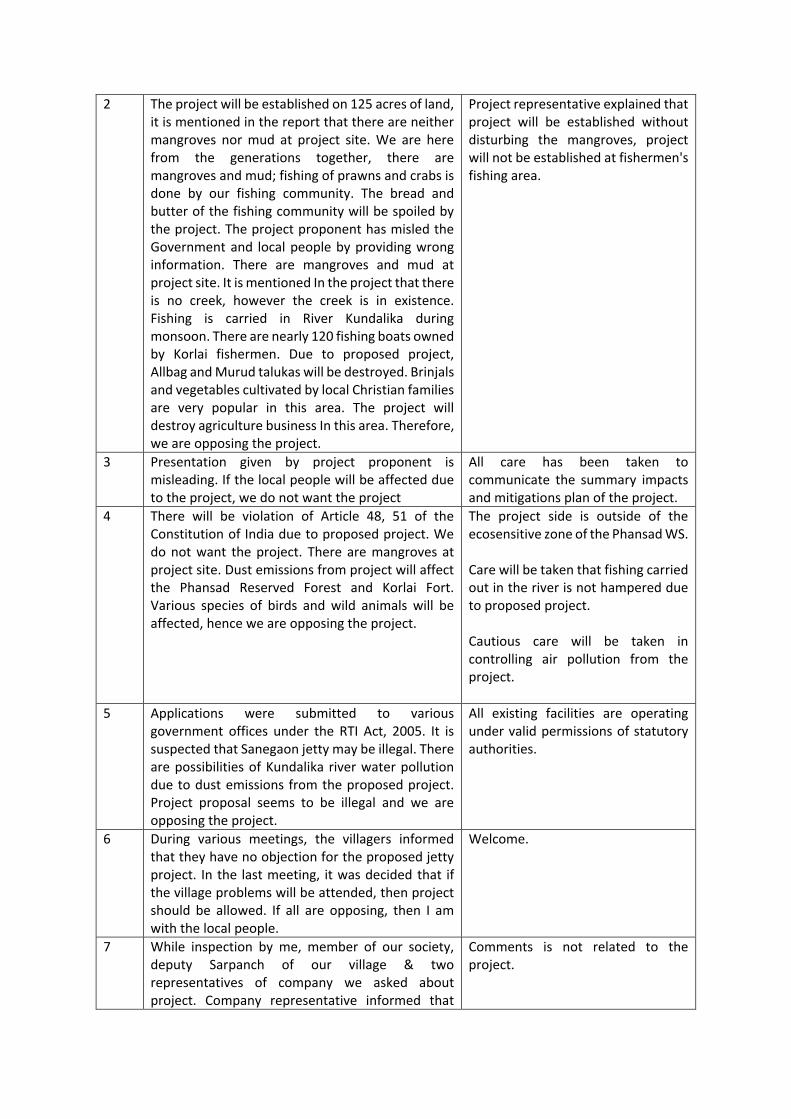
Indo Energy International Ltd.
2 The project will be established on 125 acres of land, it is mentioned in the report that there are neither mangroves nor mud at project site. We are here from the generations together, there are mangroves and mud; fishing of prawns and crabs is done by our fishing community. The bread and butter of the fishing community will be spoiled by the project. The project proponent has misled the Government and local people by providing wrong information. There are mangroves and mud at project site. It is mentioned In the project that there is no creek, however the creek is in existence. Fishing is carried in River Kundalika during monsoon. There are nearly 120 fishing boats owned by Korlai fishermen. Due to proposed project, Allbag and Murud talukas will be destroyed. Brinjals and vegetables cultivated by local Christian families are very popular in this area. The project will destroy agriculture business In this area. Therefore, we are opposing the project.
Project representative explained that project will be established without disturbing the mangroves, project will not be established at fishermen's fishing area.
3 Presentation given by project proponent is misleading. If the local people will be affected due to the project, we do not want the project
All care has been taken to communicate the summary impacts and mitigations plan of the project.
4 There will be violation of Article 48, 51 of the Constitution of India due to proposed project. We do not want the project. There are mangroves at project site. Dust emissions from project will affect the Phansad Reserved Forest and Korlai Fort. Various species of birds and wild animals will be affected, hence we are opposing the project.
The project side is outside of the ecosensitive zone of the Phansad WS. Care will be taken that fishing carried out in the river is not hampered due to proposed project. Cautious care will be taken in controlling air pollution from the project.
5 Applications were submitted to various government offices under the RTI Act, 2005. It is suspected that Sanegaon jetty may be illegal. There are possibilities of Kundalika river water pollution due to dust emissions from the proposed project. Project proposal seems to be illegal and we are opposing the project.
All existing facilities are operating under valid permissions of statutory authorities.
6 During various meetings, the villagers informed that they have no objection for the proposed jetty project. In the last meeting, it was decided that if the village problems will be attended, then project should be allowed. If all are opposing, then I am with the local people.
Welcome.
7 While inspection by me, member of our society, deputy Sarpanch of our village & two representatives of company we asked about project. Company representative informed that
Comments is not related to the project.

Indo Energy International Ltd.
project will be developed leaving area of 500 meters near to Kasha. Afterwards area of Birla company will be left. If area of 500 meters will be leaved it Is not related with our creek. Sufficient space is not available for handling of 2,000 Ton material and cargoes.
8 Proper information in respect of job opportunities in the project should be given. It is informed' during presentation that there will be job opportunities for 120 personnel. The proposed project will affect environment, we are opposing the project.
Job opportunities will be given to locals on a priority basis subject to skill availability.
9 Information given in the presentation is inadequate. Details of land admeasuring 120 acres is not explained.
All care has been taken to communicate the summary impacts and mitigations plan of the project.
10 Safety measures will not be implemented and local people will suffer due to project.
All care has been taken to communicate the summary impacts and mitigations plan of the project.
11 Our Korlai village is gifted with greenery and natural beauty. We are opposing the project.
Proposed project will not hamper the surrounding region.
21th November, 2016, at near Sanegaon Jetty site Ta. Roha, Dist. Raigad
Sh. Kiran Panbude, Additional District Magistrate, Raigad
Dr. AN Harshwardhan, RO, MPCB, Raigad
Sr. No.
Concerns raised
Our Response
1. Local residents are facing nuisance problems due to dust emissions from existing project. Due to this, local students are taking admission in Roha School which is at far distance than local school. Coal powder emissions are deposited on surrounding trees.
A comprehensive dust control system will be implemented to ensure no dust nuisance occurs outside the Sanegaon facility boundary.
2. It is necessary to verify distance of project from environmental sensitive zone and forest areas. Due to increasing river depth, agricultural and farming activities will be affected, there will shortage of drinking water.
All care has been taken to communicate the summary impacts and mitigations plan of the project.
3. Who is responsible for conducting the public hearing, which Government Officials are conducting the hearing?
The hearing was being conducted as per MoEF & CC, GoI notification. Chairman of the Public Hearing Committee is attending the hearing as representative of District Magistrate, Raigad. Convenor of the public hearing introduced the Government Officials on the dias to the public.
4. Whether public hearing was conducted for establishment of existing project jetty in 2009?
Environmental clearance to the project was accorded in the year

Indo Energy International Ltd.
He has submitted RTI application to various government offices, in response MPCB has communicated that public hearing not required for the project. Surrounding villages and mangroves will be affected due to excavation of mud from river. Kundalika river water will be contaminated due to run off water sprinkled on coal, due to this fish kill may happen, affecting the livelihood of fishermen.
2005 far before MoEF&CC, GoI notification dated 14th September, 2006. Public hearing was not required at that time. No mangrove or fishing activity will be effected due to the proposed modernization.
5. Thousands of acres of agricultural land became non-productive due to discharging of polluted water by the industry located at MIDC Dhatav. By discussing issues of dust and smell nuisance, people should take commitment from the industry. For compensation, people should discuss with the company. We can solve the problem by mutual understanding and discussions.
A comprehensive dust control system will be implemented to ensure no dust nuisance occurs outside the Sanegaon facility boundary.
6. There was erosion on the river bank of length about 1.5 to 2.0 k.m. in the year 2009 for the water transportation. Due to increasing channel depth, further erosion will take place, we are opposing the project.
No erosion has been observed in the river; the same is due to low flow in the river and very weak tidal incursion.
7. Shri Shantaram Ganu Shelke asked for name and address of project occupier. Surrounding villagers and students of Asharam School are suffering due to the project. He asked information about local and other State I outside Region company employees. The condition of Sanegaon-Nidi Road Is worst and repairing of the same is essential.
Earlier depth of navigation channel was 3.0 meters and it will be increased up to 3.1 meters. Effluent Treatment Plant is installed in the existing project and it will be upgraded during expansion. Regular health check-up of school students is carried by the company, the employees are insured by company. Captain Karnal is Occupier of company who is residing at Vashi, Navi Mumbai.
8. The insurance compensation is yet not received by the family of deceased employee, Shri Santosh Thakur.
The company has deposited the requisite insurance amount in the office of commissioner of Labour, the compensation will be disbursed from commissioner of Labour office. Company has made all expenses during the medical treatment of deceased Shri Santosh Thakur.
9. Company has destroyed mangroves at Gut no.12 to 66, Village Sanegaon. The coal transporting dredgers have damaged the fishing nets of fishermen. Water and air pollution Is being created by the company.
No mangrove or fishing activity will be effected due to the proposed modernization.

Indo Energy International Ltd.
Road condition IS affected due to material transportation. Company should be closed down.
10. There is a development in this area due to the company. Instead of arguments, villagers should discuss with company for their problems.
Company agrees for further discussion
11. C Dust is emission in his agricultural land which is adjacent to company; however, company is not considering his problems. For control of dust emissions, water sprinkling should be done on the road between Sanegaon to Nidi. Coal should be covered by tarpaulin sheet during transportation.
Agreed
12. Company's coal transporting vehicles are over-loaded and dust is emitted during transportation as coal is not covered by tarpaulin sheet. Water sprinkling is done upto Shenvai village by the company and the same should be sprinkled upto Nidi village. The arrogant drivers drive vehicles in dangerous speed.
Agreed
13. Pollution control measures should be strictly Implemented. Polluted water should not be disposed Into creek. Proper care should be taken for protection of fishermen's business. Care should also be taken to avoid dust deposition on surrounding trees. It should be noted that the local people are mostly doing fishing business.
Agreed
14. Locals are doing fishing and sand dredging business. Dhatav MIDC is located at a distance of 21 Kms. Company has donated school bus and now should provide ambulance for the villagers. Company should take Into confidence the local people to solve their problem and provide them employment opportunities. We are supporting the project.
Care will be taken that fishing activity is not affected by Sanegaon facility. Local will be prioritized for new employment opportunity in facility. Village development will be taken up as per CSR and CER guidelines.----
15. Company should control their pollution and provide good road for the students of Ashram Shaia. The Development Fund should be utilized for constructing roads, providing drinking water facilities, expenses of water bills under CSR activities. We are not against the project.
Village development will be taken up as per CSR and CER guidelines.agree
16. Company should control their air pollution problems and avoid coal dust emission.
Point noted
17. The coastal area and agriculture is affected, also there are water scarcity problems.
Village development will be taken up as per CSR and CER guidelines.
18. In the report, it is wrongly mentioned that there are is no wild life. In the report, JNPT location is
Aerial distance is considered hence 45km.

Indo Energy International Ltd.
shown at a distance of 45 Kms from the project, however, actually it is about 70 to 80 Kms from the project. Surrounding area of 700 to 800 acres will be affected due to increasing navigation channel depth. Fishermen and villagers will be affected, we are opposing the project.
19. Fishing nets of fishermen are damaged due to company operations, but compensation is not given to them by Company. There are mangroves in the surrounding area. Company Is violating various Government Enactments and various Articles of Indian Constitution.
Project representative Shri Mahadik informed that fishermen should inform the company about damage of their fishing nets. As per demand of people, water sprinkling will be done on road between Sanegaon to Nidi.
Detailed Environmental Management plan is given in Chapter 9 and Environmental Corporate
responsibility (CER) is given in 8.4 of the EIA report

viii. Details of EIA Consultant along with
Accreditation Certificate.
Details of EIA consultant is provided in chapter 11 of EIA report and valid Accreditation Certificate is attached in EIA report

ix. Plan for Corporate Environment
Responsibility (CER) as specified
under Ministry’s Office
Memorandum issued vide letter
F.No. 22‐65/2017‐IA.III dated
01.05.2018.

CORPORATE ENVIRONMENTAL RESPONSIBILITY
Plan for Corporate Environment Responsibility (CER) as specified under Ministry’s Office
Memorandum issued vide letter F. No. 22-65/2017-IA.III dated 01.05.2018.
With reference to the above OM following are the concerns raised during the public consultation and thereof the commitments made by the project proponent to address the same:
SR. NO
ISSUES RAISED WITH RESPECT TO ENVIRONMENT
COMMITMENT BY IEIL
A. Korlai fort: With reference to MoM of public hearing held on 19th November 2016
Suffering of local people due to coal dust nuisance. This may also affect the adjacent eco-friendly village Chaul, which is at a distance of 400 mtrs.
Use of slit curtains will be done to minimize the coal dust emission. Also water spray or sprinkler system will be provided at the barge unloader, coal stacks and truck loading station.
Coal and other mineral material will be handled in the project, contamination of sea water with liquid material may occur, due to this many fishes may die.
Use of slit curtains will be done to minimize the coal dust emission. For development of fisheries Rs. 6 crores are allotted under ESR activity.
Reserved forest Phansad is near to the proposed project site. Due to the project, activities such as fishing, ecology of the area and the reserved forest will be ruined.
Phansad wild life Sanctuary is ~ 14.7 km away from proposed Korlai Jetty and ~ 14.43 km away from existing Sanegaon facility, hence no adverse impact is envisaged.
Possibilities of noise pollution during handling of cargo.
Use of noise barrier equipment and roadside plantation may aid in reducing noise pollution
Coconut and Arecanut cultivation may get burnt.
Health and livelihood of people will be in danger due to environmental pollution
Proper mitigation measures and implementation plan addressed in EIA report and same will be practiced to avoid pollution.
No proper facilities available for material storage and transportation. This will affect the environment of the area
Raw material storage facility is earmarked and the location for same is shown in Chapter 2 of EIA report
In the report it is mentioned that there are neither mangroves nor mud at project site. Whereas mangroves and mud are present in the project site.
The proposed area is devoid of mangroves except for sparse and stunted patches. Site photographs are shown in EIA report chapter 3 Also, port area both the bank line and the water area to be used for reclamation is devoid of any mangroves

SR. NO
ISSUES RAISED WITH RESPECT TO ENVIRONMENT
COMMITMENT BY IEIL
In the project it in mentioned that there is no creek. Creek exists in the project site.
The river has tidal influence water creek is certain part of river stretch, as project covers large stretch of the river common word river is utilized.
Brinjals and vegetables cultivated by local Christian families are very popular in the area. The project will destroy agricultural businesses in that area.
Care will be taken that project will not hamper local community
There will be violation of Article 48, 51 of the constitution of India due to proposed project.
No violation of article 48 (organize agriculture and animal husbandry on modern and scientific lines) and 51 (international peace and security) envisaged
Various species of birds and animals will be affected due to dust emissions done by the proposed project
Proper mitigation measures proposed to combat dust emissions in the area due to proposed project.
Kundalika river water pollution due to dust emission from the proposed project.
Silt curtains to be used to minimize pollution of Kundalika river.
B. Sanegaon Village: With reference to MoM of public hearing held on 21st November 2016
Nuisance problems due to dust emission is being faced by the local people. Coal powder is being deposited on surrounding trees.
Use of slit curtains will be done to minimize the coal dust emission. Also water spray or sprinkler system will be provided at the barge unloader, coal stacks and truck loading station.
There will be water shortage, agricultural and farming activities will be affected due to increase in river depth.
In construction phase water will be sourced from eater tankers and in operation phase water would be received from the MIDC supplies.
Proposed project will affect the surrounding villages and mangroves due to excavation of mud from river.
Kundalika river water contamination due to water sprinkled on coal. Fishes may die due to this.
The effluent from coal stack yard will be collected in clarifier wherein clear water will be reused for sprinkling purposed and dust particles will be resend in coal stack yard. Further, water mixed with coal particles during sprinkling will be collected through channel along the storage into a clarifier system wherein water and coal dust will be separated.

SR. NO
ISSUES RAISED WITH RESPECT TO ENVIRONMENT
COMMITMENT BY IEIL
Also, for development of fisheries Rs. 75 Lakhs are allotted under ESR activity.
Erosion can take place due to increase in channel depth.
Shoreline will be assessed by proper techniques sometimes involving mathematical/physical model studies to ascertain remedial measures such as shore protection works, sand by passing etc.
The company has destroyed mangroves at Gut No. 12 to 66 in Sanegaon village. It also generates a lot of water and air pollution.
Coal transporting vehicles are overloaded, they are not covered in tarpaulin sheet. This is causing dust emission.
Proper precautionary measures will be adopted to minimize dust emission in the area due to the proposed project such as use of tarpaulin, water sprinklers and maintained speed limits.
It is wrongly mentioned that there are no wild life. Surrounding area of 700 to 800 acres will be affected due to increasing navigation channel depth.
Additional as a responsible corporate, M/s Indo-Energy International Limited would integrate its environment, HR and ethical business policies with appropriate community engagement and gender equity. The major social sectors IEIL would emphasize for the local community developments are Education, Water Sanitation, Health, Livelihood and Empowerment, Sports, Environment, and Infrastructure Development. The total budgetary cost towards the CSR plan to be implanted is INR 40 Cr.