CD Equisearch Pvt Ltd isearch Pvt Ltd - Moneycontrol
13
CD Equisearch P Equities Derivatives Commoditie Bajaj Corp. Ltd. No. of shares (m) 147.5 Mkt cap (Rs crs/$m) 6680/982.1 Current price (Rs/$) 453/6.7 Price target (Rs/$) 505/7.4 52 W H/L (Rs.) 525/341 Book Value (Rs/$) 30/0.4 Beta 0.3 Daily volume NSE (avg. monthly) 63870 P/BV (FY19e/20e) 14.3/13.2 P/E (FY19e/20e) 28.8/26.9 EPS growth (FY18/19e/20e) -9.3/9.9/7.0 ROE (FY18/19e/20e) 46.9/50.5/51.0 OPM(FY18/19e/20e) 30.6/30.1/30.6 D/E ratio (FY18/19e/20e) 0.0/0.1/0.1 BSE Code 533229 NSE Code BAJAJCORP Bloomberg BJCOR IN Reuters BACO.BO Shareholding pattern % Promoters 66.9 MFs / Banks / FIs 4.6 Foreign Portfolio Investors 25.1 Govt. holding - Public & others 3.4 Total 100.0 As on March 31, 2018 Recommendation Accumulate Phone: + 91 (33) 4488 0011 E- mail: [email protected] Figures (Rs crs) Income from operations Other Income EBIDTA (other income included) PAT after EO EPS (Rs.) EPS growth (%) Q • • • • • Pvt Ltd es Distributio n of Mutual Funds Dis FY16 FY17 FY18 799.72 796.90 828.49 28.70 39.39 24.43 302.39 302.98 278.35 233.42 232.64 211.08 15.83 15.77 14.31 11.3 -0.3 -9.3 Quarterly Highlights • Spurred by sturdy offtake, Bajaj Corp’s domestic adjusting for GST impact) in Q4FY18. Modern tr 23.9%, while sales via general trade vertical grew The international business division demonstrated degrowth of 32.9%. The CSD (Canteen Stores D slight recovery after quarters of lower sales and po o-y. • Almonds Drops Hair Oil (ADHO), flagship prod decent sequential volume growth of 6.9% y-o-y share (volume) to 7.6% from 7.2% in the previo category. Market share (in terms of value) of AD 62.2% in light hair oil segment owing to an elev Substantial investment in modern trade was un stimulate the offtake of ADHO. • The sales volume of ‘others’ category more than do of Coco Jasmine Hair Oil in Maharashtra during company to cater to the value added coconut Brahmi Amla, launched in Q3FY18, doubled registering a volume growth of 39% (y-o-y). • The trending crude oil price posed significant risk In Q4FY18, the average price of Bajaj’s key raw crude) witnessed a price hike to Rs 65.45/kg from and Rs 48.22/kg in Q4 of previous year. The av spiked up by ~5% y-o-y to Rs 85.51/kg. Hedging o up of LLP at lower cost aided OPM at 32.4%. Y company to undertake a price hike, in the month o more than 100ml and reduce the quantity for small • The stock currently trades at 28.8x FY19e EPS of R Rs 16.83. Business disruption in the wake of GST an correct itself in the following quarters. Bajaj Corps products and establish itself as a full FMCG comp modern trade (more profitable than general tra direct distribution would doubtlessly help the com Yet, rising raw material cost remain a cause of co focus on new product launches may affect the ADHO. On balance, we assign ‘accumulate’ reco target price of Rs 505 (previous target Rs 463) base year average TTM P/E is 27.5) over a period of 9-12 May 23, 2018 stribution of Life Insurance FY19e FY20e 897.06 981.47 34.54 35.84 304.46 336.66 232.06 248.30 15.73 16.83 9.9 7.0 c revenue grew by 11.6% (after rade witnessed sales growth of w by 11.1% during the quarter. d strikingly poor performance - Department) channel exhibited osted revenue growth of 5.6% y- duct of the company, witnessed in Q4FY18, raising the market ous quarter in the total hair oil DHO rose to its highest level to vation of 120 bps over Q3FY18. ndertaken by the company to oubled on account of the launch the quarter, which enabled the t oil segment. Bajaj Ayurvedic in offtake in Q4FY18 (q-o-q) to the margins of the company. material, LLP (a derivative of Rs 61.22/kg in previous quarter verage price of refined oil also of commodity cost and stocking Yet, the uptrend compelled the of April, for ADHO for SKU’s of ler SKU’s. Rs 15.73 and 26.9x FY20e EPS of nd poor monsoon is expected to attempts to diversify its pool of pany. Increasing dependence on ade) and initiatives to increase mpany to launch new products. oncern. Additionally, increasing e sales of its flagship product, ommendation on the stock with ed on 30x FY20e earnings (three 2 months.
-
Upload
khangminh22 -
Category
Documents
-
view
1 -
download
0
Transcript of CD Equisearch Pvt Ltd isearch Pvt Ltd - Moneycontrol

CD Equisearch Pvt Ltd
Equities Derivatives Commoditie
Bajaj Corp. Ltd.
No. of shares (m) 147.5
Mkt cap (Rs crs/$m) 6680/982.1
Current price (Rs/$) 453/6.7
Price target (Rs/$)
505/7.4
52 W H/L (Rs.) 525/341
Book Value (Rs/$) 30/0.4
Beta 0.3
Daily volume NSE (avg. monthly) 63870
P/BV (FY19e/20e)
14.3/13.2
P/E (FY19e/20e) 28.8/26.9
EPS growth (FY18/19e/20e) -9.3/9.9/7.0
ROE (FY18/19e/20e) 46.9/50.5/51.0
OPM(FY18/19e/20e) 30.6/30.1/30.6
D/E ratio (FY18/19e/20e) 0.0/0.1/0.1
BSE Code 533229
NSE Code BAJAJCORP
Bloomberg BJCOR IN
Reuters BACO.BO
Shareholding pattern %
Promoters 66.9
MFs / Banks / FIs 4.6
Foreign Portfolio Investors 25.1
Govt. holding -
Public & others 3.4
Total 100.0
As on March 31, 2018
Recommendation
Accumulate
Phone: + 91 (33) 4488 0011
E- mail: [email protected]
Figures (Rs crs)
Income from operations
Other Income
EBIDTA (other income included)
PAT after EO
EPS (Rs.)
EPS growth (%)
Quarterly Highlights•
•
•
•
•
CD Equisearch Pvt Ltd
ities Distribution of Mutual Funds Dist
FY16 FY17 FY18
799.72 796.90 828.49
28.70 39.39 24.43
302.39 302.98 278.35
233.42
232.64 211.08
15.83 15.77 14.31
11.3 -0.3 -9.3
Quarterly Highlights • Spurred by sturdy offtake, Bajaj Corp’s domestic revenue grew by 11.6
adjusting for GST impact) in Q4FY18. Modern trade witnessed
23.9%, while sales via general trade vertical grew by 11.1% during the quarter.
The international business division demonstrated
degrowth of 32.9%. The CSD (Canteen Stores Department) channel exhibited
slight recovery after quarters of lower sales and posted revenue growth of 5.6% y
o-y.
• Almonds Drops Hair Oil (ADHO), flagship product of the company, witnessed
decent sequential volume growth of 6.9% y-o-y in Q4FY18, raising the market
share (volume) to 7.6% from 7.2% in the previous quarter in the total hair oil
category. Market share (in terms of value) of ADHO rose to its highest level to
62.2% in light hair oil segment owing to an elevation of 120 bps over Q3FY18.
Substantial investment in modern trade was unde
stimulate the offtake of ADHO.
• The sales volume of ‘others’ category more than doubled on account of the launch
of Coco Jasmine Hair Oil in Maharashtra during the quarter, which enabled the
company to cater to the value added coconut oil segment. Bajaj Ayurvedic
Brahmi Amla, launched in Q3FY18, doubled in offtake in Q4FY18 (q
registering a volume growth of 39% (y-o-y).
• The trending crude oil price posed significant risk to the margins of the company.
In Q4FY18, the average price of Bajaj’s key raw material, LLP (a derivative of
crude) witnessed a price hike to Rs 65.45/kg from Rs 61.22/kg in previous quarter
and Rs 48.22/kg in Q4 of previous year. The average price of refined oil also
spiked up by ~5% y-o-y to Rs 85.51/kg. Hedging of commodity cost and stocking
up of LLP at lower cost aided OPM at 32.4%. Yet, the uptrend compelled the
company to undertake a price hike, in the month of April, for ADHO for SKU’s of
more than 100ml and reduce the quantity for smaller SKU’s.
• The stock currently trades at 28.8x FY19e EPS of Rs 15.73 and 26.9
Rs 16.83. Business disruption in the wake of GST and poor monsoon is expected to
correct itself in the following quarters. Bajaj Corps attempts to diversify its pool of
products and establish itself as a full FMCG company. Increasing dependence on
modern trade (more profitable than general trade) and initiatives to increase
direct distribution would doubtlessly help the company
Yet, rising raw material cost remain a cause of concern. Additio
focus on new product launches may affect the sales of its flagship product
ADHO. On balance, we assign ‘accumulate’ recommendation on the stock with
target price of Rs 505 (previous target Rs 463) based
year average TTM P/E is 27.5) over a period of 9-12 months.
CD Equisearch Pvt Ltd May 23, 2018
istribution of Life Insurance
FY19e FY20e
897.06 981.47
34.54 35.84
304.46 336.66
232.06 248.30
15.73 16.83
9.9 7.0
domestic revenue grew by 11.6% (after
adjusting for GST impact) in Q4FY18. Modern trade witnessed sales growth of
while sales via general trade vertical grew by 11.1% during the quarter.
international business division demonstrated strikingly poor performance -
The CSD (Canteen Stores Department) channel exhibited
covery after quarters of lower sales and posted revenue growth of 5.6% y-
Almonds Drops Hair Oil (ADHO), flagship product of the company, witnessed
y in Q4FY18, raising the market
7.2% in the previous quarter in the total hair oil
category. Market share (in terms of value) of ADHO rose to its highest level to
62.2% in light hair oil segment owing to an elevation of 120 bps over Q3FY18.
Substantial investment in modern trade was undertaken by the company to
The sales volume of ‘others’ category more than doubled on account of the launch
of Coco Jasmine Hair Oil in Maharashtra during the quarter, which enabled the
onut oil segment. Bajaj Ayurvedic
Brahmi Amla, launched in Q3FY18, doubled in offtake in Q4FY18 (q-o-q)
The trending crude oil price posed significant risk to the margins of the company.
ice of Bajaj’s key raw material, LLP (a derivative of
crude) witnessed a price hike to Rs 65.45/kg from Rs 61.22/kg in previous quarter
and Rs 48.22/kg in Q4 of previous year. The average price of refined oil also
ging of commodity cost and stocking
up of LLP at lower cost aided OPM at 32.4%. Yet, the uptrend compelled the
company to undertake a price hike, in the month of April, for ADHO for SKU’s of
more than 100ml and reduce the quantity for smaller SKU’s.
stock currently trades at 28.8x FY19e EPS of Rs 15.73 and 26.9x FY20e EPS of
Business disruption in the wake of GST and poor monsoon is expected to
correct itself in the following quarters. Bajaj Corps attempts to diversify its pool of
nd establish itself as a full FMCG company. Increasing dependence on
modern trade (more profitable than general trade) and initiatives to increase
direct distribution would doubtlessly help the company to launch new products.
remain a cause of concern. Additionally, increasing
focus on new product launches may affect the sales of its flagship product,
. On balance, we assign ‘accumulate’ recommendation on the stock with
vious target Rs 463) based on 30x FY20e earnings (three
12 months.

CD Equisearch Pvt Ltd
Equities Derivatives Commoditie
[
Outlook & Recommendation
FMCG Industry Outlook
The Indian FMCG sector has been growing at a robust pace galvanized by a large middle class population, rise in per capita
consumption, changing consumer lifestyle, growing income and proliferation of e
population, consumerism and brand consciousness on the rise, India is emerging as one of the large economies in the world in
terms of purchasing power and consumer spending. India’s FMCG sector is an important contributor to its GDP growth. It is
the fourth largest sector in the Indian economy and employs approximately 5% of the total factory employment. Rising
globalization, product innovation, infrastructure development and advancement of supply chain efficiencies are some of the
supply side factors driving the growth of the FMCG industry.
Over the years, both rural and urban segments have contributed to the growth in FMCG
like implementation of GST, FDI (up to 100% allowed under single brand retail and up to 51% under multi brand
Security Bill, are all expected to have a positive impact on this sector
compliance. IBEF reckons the household and personal care segments account for nearly 50% of the overall FMCG market. I
reckons that the market size of personal care has grown to $12.58 bn in 2017 from less than $3 bn in 2000. The total
consumption expenditure in India, one of the main drive
2016-2021.
Source: Care Ratings
The rural income in India is forecast to reach $1.8 trillion by FY21 from $572 bn in 2017. This will lead to an estimated gro
of 4.4% CAGR to raise the rural per capita disposable income to $631 by 2020. The rising in
augment the share of non food expenditure in rural India.
Accounting for a revenue share of about 60%, rural segment is the largest contributor to the overall revenue generated by the
FMCG sector in India. With FMCG products accounting for 50% of the total rural spending, a
market provides lucrative opportunity for further
FMCG companies, has increased demand for high quality goods and services in rural India.
Source: IBEF
2
CD Equisearch Pvt Ltd
ities Distribution of Mutual Funds Dist
The Indian FMCG sector has been growing at a robust pace galvanized by a large middle class population, rise in per capita
consumption, changing consumer lifestyle, growing income and proliferation of e-commerce market. Moreover, with young
sumerism and brand consciousness on the rise, India is emerging as one of the large economies in the world in
terms of purchasing power and consumer spending. India’s FMCG sector is an important contributor to its GDP growth. It is
r in the Indian economy and employs approximately 5% of the total factory employment. Rising
globalization, product innovation, infrastructure development and advancement of supply chain efficiencies are some of the
f the FMCG industry.
Over the years, both rural and urban segments have contributed to the growth in FMCG sector. Several government initiatives
implementation of GST, FDI (up to 100% allowed under single brand retail and up to 51% under multi brand
Security Bill, are all expected to have a positive impact on this sector with the system embracing greater transparency and
ousehold and personal care segments account for nearly 50% of the overall FMCG market. I
that the market size of personal care has grown to $12.58 bn in 2017 from less than $3 bn in 2000. The total
consumption expenditure in India, one of the main drivers of FMCG growth, is forecast to increase at a CAGR of 22.6% during
The rural income in India is forecast to reach $1.8 trillion by FY21 from $572 bn in 2017. This will lead to an estimated gro
of 4.4% CAGR to raise the rural per capita disposable income to $631 by 2020. The rising in
augment the share of non food expenditure in rural India.
Accounting for a revenue share of about 60%, rural segment is the largest contributor to the overall revenue generated by the
With FMCG products accounting for 50% of the total rural spending, a low penetration level in the rural
further growth. Improved distribution channels of various manufacturing and
sed demand for high quality goods and services in rural India.
2
CD Equisearch Pvt Ltd
istribution of Life Insurance
The Indian FMCG sector has been growing at a robust pace galvanized by a large middle class population, rise in per capita
commerce market. Moreover, with young
sumerism and brand consciousness on the rise, India is emerging as one of the large economies in the world in
terms of purchasing power and consumer spending. India’s FMCG sector is an important contributor to its GDP growth. It is
r in the Indian economy and employs approximately 5% of the total factory employment. Rising
globalization, product innovation, infrastructure development and advancement of supply chain efficiencies are some of the
. Several government initiatives
implementation of GST, FDI (up to 100% allowed under single brand retail and up to 51% under multi brand retail), Food
with the system embracing greater transparency and
ousehold and personal care segments account for nearly 50% of the overall FMCG market. IBEF
that the market size of personal care has grown to $12.58 bn in 2017 from less than $3 bn in 2000. The total
to increase at a CAGR of 22.6% during
The rural income in India is forecast to reach $1.8 trillion by FY21 from $572 bn in 2017. This will lead to an estimated growth
of 4.4% CAGR to raise the rural per capita disposable income to $631 by 2020. The rising income levels will doubtlessly
Accounting for a revenue share of about 60%, rural segment is the largest contributor to the overall revenue generated by the
low penetration level in the rural
Improved distribution channels of various manufacturing and

CD Equisearch Pvt Ltd
Equities Derivatives Commoditie
India’s retail market is estimated to reach $1.1 trillion by 2020 from $672 bn in 2016,
in modern trade by 20 – 25% per annum, which is likely to boost revenues of FMCG companies.
witnessing faster growth in modern trade. Ayurveda products are increasing
growth of FMCG major, Patanjali Ayurveda, which
Health and wellness is significantly influencing and shaping consumer preferences resulting in increasing number of customers
shifting to natural and ayurvedic products. IBEF, therefore, projects the contribution of herbal products to the overall personal
care market products in India to grow to 10% in FY20 from 6
forecast to attain a market value of $20 bn by 2025 from $6.5 bn in 2017.
Source: IBEF Source: IBEF
IBEF estimates that about 40% of all the FMCG purchases will be done online by 2020 and therefore, offer a $5
opportunity to FMCG sectors in India. The FMCG sector is also expected to reap benefits of GST implementation that will lead
to re evaluation of the procurement and distribution channels. The elimination of cascading effects of tax is expected to low
the input costs and improve profitability. Additionally, removal of excise duty on products would improve cash flows.
With FMCG products having demand throughout the year, investment in this sector attracts investors. Low penetration of
branded products provides additional scope
products through internet and different channels of sales
market. The number of online users in India is projec
number of digital buyers in India stood at 130.4 mn in 2016
infrastructure and employment under the Union Budge
These initiatives are expected to increase the disposable income of the people, especially in the rural area, which w
augment growth in the sector.
3
CD Equisearch Pvt Ltd
ities Distribution of Mutual Funds Dist
India’s retail market is estimated to reach $1.1 trillion by 2020 from $672 bn in 2016, according to IBEF,
25% per annum, which is likely to boost revenues of FMCG companies.
Ayurveda products are increasingly becoming popular among people
or, Patanjali Ayurveda, which reported revenue of $1.57 bn in FY17.
Health and wellness is significantly influencing and shaping consumer preferences resulting in increasing number of customers
products. IBEF, therefore, projects the contribution of herbal products to the overall personal
care market products in India to grow to 10% in FY20 from 6-7% in FY17. The beauty, cosmetics and grooming market in India is
of $20 bn by 2025 from $6.5 bn in 2017.
IBEF estimates that about 40% of all the FMCG purchases will be done online by 2020 and therefore, offer a $5
ctors in India. The FMCG sector is also expected to reap benefits of GST implementation that will lead
to re evaluation of the procurement and distribution channels. The elimination of cascading effects of tax is expected to low
ve profitability. Additionally, removal of excise duty on products would improve cash flows.
With FMCG products having demand throughout the year, investment in this sector attracts investors. Low penetration of
branded products provides additional scope for growth in volumes. Growing awareness, easier access
products through internet and different channels of sales, and changing lifestyles are the key growth drivers for the consumer
market. The number of online users in India is projected to surpass 850 mn by 2025 - a statistics portal, Statista, claims that the
number of digital buyers in India stood at 130.4 mn in 2016. Government’s focus on agriculture, MSMEs, education, healthcare,
infrastructure and employment under the Union Budget 2018-19 is expected to have a positive impact
These initiatives are expected to increase the disposable income of the people, especially in the rural area, which w
3
CD Equisearch Pvt Ltd
istribution of Life Insurance
according to IBEF, supplementary to growth
25% per annum, which is likely to boost revenues of FMCG companies. Tier II and III cities are
becoming popular among people - resulting in
Health and wellness is significantly influencing and shaping consumer preferences resulting in increasing number of customers
products. IBEF, therefore, projects the contribution of herbal products to the overall personal
7% in FY17. The beauty, cosmetics and grooming market in India is
IBEF estimates that about 40% of all the FMCG purchases will be done online by 2020 and therefore, offer a $5-6 bn business
ctors in India. The FMCG sector is also expected to reap benefits of GST implementation that will lead
to re evaluation of the procurement and distribution channels. The elimination of cascading effects of tax is expected to lower
ve profitability. Additionally, removal of excise duty on products would improve cash flows.
With FMCG products having demand throughout the year, investment in this sector attracts investors. Low penetration of
Growing awareness, easier access and availability of
, and changing lifestyles are the key growth drivers for the consumer
a statistics portal, Statista, claims that the
. Government’s focus on agriculture, MSMEs, education, healthcare,
impact on the FMCG business.
These initiatives are expected to increase the disposable income of the people, especially in the rural area, which will be
CD Equisearch Pvt Ltd
Equities Derivatives Commoditie
Financials and Valuations
The hair oil category contributes close to 33% to the overall hair care segment with a market value of Rs 22575 crs. With a large
proportion of its revenues owing to its hair oil segment, Bajaj Corp seeks to diversify its product portfolio and transform i
‘complete FMCG company’ through its focus and increased investment on innovation. Additionally, the company is confident to
launch a new product every quarter under its ‘Naya Bajaj
in the FMCG and hair oil market as part of their growth strategy by acquiring niche brands that can derive synergistic benefits
from Bajaj Corp’s strong distribution network.
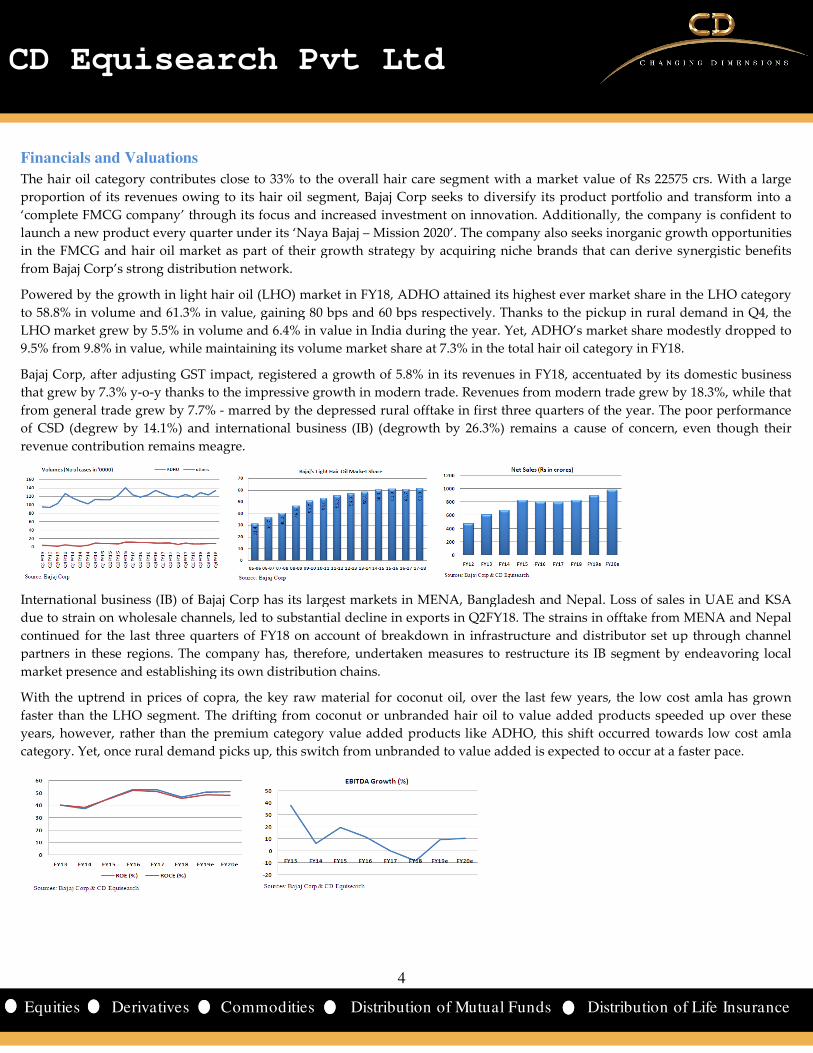
Powered by the growth in light hair oil (LHO) market in FY18, ADHO attained its hig
to 58.8% in volume and 61.3% in value, gaining 80 bps and 60 bps respectively. Thanks to the pickup in rural demand in Q4, th
LHO market grew by 5.5% in volume and 6.4% in value in India during the year. Yet, ADH
9.5% from 9.8% in value, while maintaining its volume market share at 7.3% in the total hair oil category in FY18.
Bajaj Corp, after adjusting GST impact, registered a growth of 5.8% in its revenues in FY18, accentuate
that grew by 7.3% y-o-y thanks to the impressive growth in modern trade. Revenues from modern trade grew by 18.3%, while that
from general trade grew by 7.7% - marred by the depressed rural offtake in first three quarters of the
of CSD (degrew by 14.1%) and international business (IB) (degrowth by 26.3%) remains a cause of concern, even though their
revenue contribution remains meagre.
International business (IB) of Bajaj Corp has its largest
due to strain on wholesale channels, led to substantial decline in exports in Q2FY18. The strains in offtake from MENA and Ne
continued for the last three quarters of FY18 on account of
partners in these regions. The company has, therefore, undertaken measures to restructure its IB segment by endeavoring local
market presence and establishing its own distribution chains.
With the uptrend in prices of copra, the key raw material for coconut
faster than the LHO segment. The drifting from coconut or unbranded hair oil to value added products speeded up over these
years, however, rather than the premium category value added products like ADHO, this shift occurred towards low cost amla
category. Yet, once rural demand picks up, this switch from unbranded to value added is expected to occur at a faster pace.
4
CD Equisearch Pvt Ltd
ities Distribution of Mutual Funds Dist
hair oil category contributes close to 33% to the overall hair care segment with a market value of Rs 22575 crs. With a large
proportion of its revenues owing to its hair oil segment, Bajaj Corp seeks to diversify its product portfolio and transform i
‘complete FMCG company’ through its focus and increased investment on innovation. Additionally, the company is confident to
launch a new product every quarter under its ‘Naya Bajaj – Mission 2020’. The company also seeks inorganic growth opportunities
the FMCG and hair oil market as part of their growth strategy by acquiring niche brands that can derive synergistic benefits
Powered by the growth in light hair oil (LHO) market in FY18, ADHO attained its highest ever market share in the LHO category
to 58.8% in volume and 61.3% in value, gaining 80 bps and 60 bps respectively. Thanks to the pickup in rural demand in Q4, th
LHO market grew by 5.5% in volume and 6.4% in value in India during the year. Yet, ADHO’s market share modestly dropped to
9.5% from 9.8% in value, while maintaining its volume market share at 7.3% in the total hair oil category in FY18.
Bajaj Corp, after adjusting GST impact, registered a growth of 5.8% in its revenues in FY18, accentuate
y thanks to the impressive growth in modern trade. Revenues from modern trade grew by 18.3%, while that
marred by the depressed rural offtake in first three quarters of the
of CSD (degrew by 14.1%) and international business (IB) (degrowth by 26.3%) remains a cause of concern, even though their
International business (IB) of Bajaj Corp has its largest markets in MENA, Bangladesh and Nepal. Loss of sales in UAE and KSA
due to strain on wholesale channels, led to substantial decline in exports in Q2FY18. The strains in offtake from MENA and Ne
continued for the last three quarters of FY18 on account of breakdown in infrastructure and distributor set up through channel
partners in these regions. The company has, therefore, undertaken measures to restructure its IB segment by endeavoring local
market presence and establishing its own distribution chains.
With the uptrend in prices of copra, the key raw material for coconut oil, over the last few years, the low cost amla has grown
faster than the LHO segment. The drifting from coconut or unbranded hair oil to value added products speeded up over these
s, however, rather than the premium category value added products like ADHO, this shift occurred towards low cost amla
category. Yet, once rural demand picks up, this switch from unbranded to value added is expected to occur at a faster pace.
4
CD Equisearch Pvt Ltd
istribution of Life Insurance
hair oil category contributes close to 33% to the overall hair care segment with a market value of Rs 22575 crs. With a large
proportion of its revenues owing to its hair oil segment, Bajaj Corp seeks to diversify its product portfolio and transform into a
‘complete FMCG company’ through its focus and increased investment on innovation. Additionally, the company is confident to
The company also seeks inorganic growth opportunities
the FMCG and hair oil market as part of their growth strategy by acquiring niche brands that can derive synergistic benefits
hest ever market share in the LHO category
to 58.8% in volume and 61.3% in value, gaining 80 bps and 60 bps respectively. Thanks to the pickup in rural demand in Q4, the
O’s market share modestly dropped to
9.5% from 9.8% in value, while maintaining its volume market share at 7.3% in the total hair oil category in FY18.
Bajaj Corp, after adjusting GST impact, registered a growth of 5.8% in its revenues in FY18, accentuated by its domestic business
y thanks to the impressive growth in modern trade. Revenues from modern trade grew by 18.3%, while that
marred by the depressed rural offtake in first three quarters of the year. The poor performance
of CSD (degrew by 14.1%) and international business (IB) (degrowth by 26.3%) remains a cause of concern, even though their
markets in MENA, Bangladesh and Nepal. Loss of sales in UAE and KSA
due to strain on wholesale channels, led to substantial decline in exports in Q2FY18. The strains in offtake from MENA and Nepal
breakdown in infrastructure and distributor set up through channel
partners in these regions. The company has, therefore, undertaken measures to restructure its IB segment by endeavoring local
, over the last few years, the low cost amla has grown
faster than the LHO segment. The drifting from coconut or unbranded hair oil to value added products speeded up over these
s, however, rather than the premium category value added products like ADHO, this shift occurred towards low cost amla
category. Yet, once rural demand picks up, this switch from unbranded to value added is expected to occur at a faster pace.

CD Equisearch Pvt Ltd
Equities Derivatives Commoditie
Bajaj Corp had set up an innovation centre in the beginning of FY18. The R&D centre restaged the Bajaj Brahmi Amla hair oil
(BAHO) variant during the year, which differentiated itself through premium packaging, reformulation and extensive
advertisement of specific claim of hair fall reduction. The growth momentum of BAHO continued after its launch, witnessing
value offtake of more than seven times its previous variant in the last three quarters of FY18. The innovation centre also de
Coco Jasmine hair oil that was launched only in Maharashtra in Q4FY18.
Bajaj Corp tapped the skin care market by acquiring Nomarks brand in 2013. The attempt of the company to focus on the face
wash category of the brand by way of repackaging and repositioning did not
the brand, the company is now concentrating on its creams by integrating its marketing campaign and revamping its distributio
network. Extensive trials are being undertaken for the brand with a focus
India coverage, this distribution plan has been undertaken in only two states in India with intent to expand in more states.
initiatives have started bearing fruitful results with traction in sales.
The company commissioned a state of art manufacturing facility in Guwahati in FY17 to cater to the trending demand of hair oi
and expand further in North and North East India. The income tax and GST benefits also add to the rationale for expansion
Guwahati. A production unit in Baroda is under the pipeline that will constitute significant portion of FY19 capex. With siza
raw material availability in Gujarat, Baroda plant will induce cost savings. Additionally, the company has also undertaken d
optimization program under which, the company is reducing its depots in an attempt to
The stock currently trades at 28.8x FY19e EPS of Rs 15.73 and 26.9
like sales force automation in order to improve
efficiency through uninterrupted backend integration of data. Rebuilding of its IB,
in Guwahati, expansion of its product basket and
revenues. Reducing dependence on wholesale and increasing focus on direct distribution will assist
products in the pipeline and help foster its business.
material cost would impact margins. Additionally, the cut throat competition in the FMCG space cannot be neglected. Weighing
all odds, we assign ‘accumulate’ recommendation on the stock with target price of
FY20e earnings over a period of 9-12 months. For more information, refer to our August report.
5
CD Equisearch Pvt Ltd
ities Distribution of Mutual Funds Dist
Bajaj Corp had set up an innovation centre in the beginning of FY18. The R&D centre restaged the Bajaj Brahmi Amla hair oil
(BAHO) variant during the year, which differentiated itself through premium packaging, reformulation and extensive
t of specific claim of hair fall reduction. The growth momentum of BAHO continued after its launch, witnessing
value offtake of more than seven times its previous variant in the last three quarters of FY18. The innovation centre also de
hair oil that was launched only in Maharashtra in Q4FY18.
Bajaj Corp tapped the skin care market by acquiring Nomarks brand in 2013. The attempt of the company to focus on the face
wash category of the brand by way of repackaging and repositioning did not work in its favour. In order to revive the sales from
the brand, the company is now concentrating on its creams by integrating its marketing campaign and revamping its distributio
network. Extensive trials are being undertaken for the brand with a focus on distribution through the chemist panel. With pan
India coverage, this distribution plan has been undertaken in only two states in India with intent to expand in more states.
initiatives have started bearing fruitful results with traction in sales.
The company commissioned a state of art manufacturing facility in Guwahati in FY17 to cater to the trending demand of hair oi
and expand further in North and North East India. The income tax and GST benefits also add to the rationale for expansion
Guwahati. A production unit in Baroda is under the pipeline that will constitute significant portion of FY19 capex. With siza
raw material availability in Gujarat, Baroda plant will induce cost savings. Additionally, the company has also undertaken d
optimization program under which, the company is reducing its depots in an attempt to optimize costs.
e stock currently trades at 28.8x FY19e EPS of Rs 15.73 and 26.9x FY20e EPS of Rs 16.83. Bajaj C
sales force automation in order to improve its area coverage and control of distribution and thereby enhance its operational
efficiency through uninterrupted backend integration of data. Rebuilding of its IB, expansion in Baroda,
n Guwahati, expansion of its product basket and duplication of Nomarks strategy in other states will doubtlessly improve
revenues. Reducing dependence on wholesale and increasing focus on direct distribution will assist
ts in the pipeline and help foster its business. Nevertheless, the rising crude oil prices and the consequent soaring of raw
margins. Additionally, the cut throat competition in the FMCG space cannot be neglected. Weighing
ds, we assign ‘accumulate’ recommendation on the stock with target price of Rs 505 (previous target Rs 463)
12 months. For more information, refer to our August report.
5
CD Equisearch Pvt Ltd
istribution of Life Insurance
Bajaj Corp had set up an innovation centre in the beginning of FY18. The R&D centre restaged the Bajaj Brahmi Amla hair oil
(BAHO) variant during the year, which differentiated itself through premium packaging, reformulation and extensive
t of specific claim of hair fall reduction. The growth momentum of BAHO continued after its launch, witnessing
value offtake of more than seven times its previous variant in the last three quarters of FY18. The innovation centre also delivered
Bajaj Corp tapped the skin care market by acquiring Nomarks brand in 2013. The attempt of the company to focus on the face
work in its favour. In order to revive the sales from
the brand, the company is now concentrating on its creams by integrating its marketing campaign and revamping its distribution
on distribution through the chemist panel. With pan
India coverage, this distribution plan has been undertaken in only two states in India with intent to expand in more states. Such
The company commissioned a state of art manufacturing facility in Guwahati in FY17 to cater to the trending demand of hair oils
and expand further in North and North East India. The income tax and GST benefits also add to the rationale for expansion in
Guwahati. A production unit in Baroda is under the pipeline that will constitute significant portion of FY19 capex. With sizable
raw material availability in Gujarat, Baroda plant will induce cost savings. Additionally, the company has also undertaken depot
optimize costs.
Bajaj Corp is undertaking measures
coverage and control of distribution and thereby enhance its operational
expansion in Baroda, ramping up of capacities
of Nomarks strategy in other states will doubtlessly improve
revenues. Reducing dependence on wholesale and increasing focus on direct distribution will assist better transfusion of the new
Nevertheless, the rising crude oil prices and the consequent soaring of raw
margins. Additionally, the cut throat competition in the FMCG space cannot be neglected. Weighing
(previous target Rs 463) based on 30x

CD Equisearch Pvt Ltd
Equities Derivatives Commoditie
Cross Sectional Analysis
Company Equity CMP MCAP* Sales*
Bajaj Corp 15 453 6680 828
Marico 129 313 40385 6322
Dabur India 176 375 66004 7748
Emami 23 1024 23251 2531
*figures in crores; calculations on ttm basis All ratios adjusted for goodwill and revaluation reserve; sales estimated for Dabur & Emami as quarterly excise data unavailable.Emami’s PAT adjusted for amortization and impairment of intangible assets (brand, trade mark etc)
Marico’s FMCG business registered a value gr
quarters of FY18. In Q4FY18, Marico’s rural sales grew by 12%, outpacing the urban sales growth by 5%. Canteen Stores
Department (CSD) rebounded after four consecutive quarters of decline and grew by 32%. Modern trade and e
continued to proliferate during the year galvanized by facto
and variety of brands, growing relevance of digital market place and attractive prices.
Marico’s revenue from international operations grew by 12.5% y
currency terms, the business grew by 9% during the year. Revenues from Bangladesh grew by 13% in FY18, in constant
currency, accentuated by the non coconut oil portfolio that grew by 32%, increasing its contribution to the business in
Bangladesh to 26% in FY18 from 10% in FY12. Headwinds in the male shampoo category in Vietnam depressed sales growth
from south East Asia by 2% in FY18. Despite macroeconomic challenges, revenues from South Africa grew by 16% during the
year, while that from Middle East and North Africa unveiled volume led recovery.
During the year, Marico’s FMCG business in India registered a growth of 8.5% y
was paltry at 1% owing to a one off decline in the coconut oil portfolio a
growth in the last quarter was largely on account of significant increase in copra price (75%) during the year, which instiga
the price hike in coconut oil portfolio. The parachute rigids (36% of FY18 I
5% in Q4FY18 - as a result of concentrated price hikes (~22%)
demonetization). Therefore, volume growth of parachute rigids stood at only 2% during the
in Q1 and price hike in Q4. Marico is aggressively investing in the e
~2% of the India business by FY19.
6
CD Equisearch Pvt Ltd
ities Distribution of Mutual Funds Dist
Sales* Profit* OPM (%) NPM (%) Int Cov ROE (%)
828 211 30.6 25.5 221.2 46.9
6322 814 18.0 13.1 70.1 41.7
7748 1366 20.9 17.7 33.2 33.3
2531 307 28.4 12.2 12.5 17.9
; sales estimated for Dabur & Emami as quarterly excise data unavailable. Emami’s PAT adjusted for amortization and impairment of intangible assets (brand, trade mark etc)
growth of 7% in FY18. Rural growth surpassed urban growth for the last three
rural sales grew by 12%, outpacing the urban sales growth by 5%. Canteen Stores
Department (CSD) rebounded after four consecutive quarters of decline and grew by 32%. Modern trade and e
continued to proliferate during the year galvanized by factors like comfortable shopping experience, access to diverse categories
and variety of brands, growing relevance of digital market place and attractive prices.
Marico’s revenue from international operations grew by 12.5% y-o-y in Q4FY18 but was muted for th
currency terms, the business grew by 9% during the year. Revenues from Bangladesh grew by 13% in FY18, in constant
currency, accentuated by the non coconut oil portfolio that grew by 32%, increasing its contribution to the business in
angladesh to 26% in FY18 from 10% in FY12. Headwinds in the male shampoo category in Vietnam depressed sales growth
from south East Asia by 2% in FY18. Despite macroeconomic challenges, revenues from South Africa grew by 16% during the
m Middle East and North Africa unveiled volume led recovery.
During the year, Marico’s FMCG business in India registered a growth of 8.5% y-o-y. The volume growth in India in Q4FY18
was paltry at 1% owing to a one off decline in the coconut oil portfolio and headwinds in saffola edible oils. The 12% value
growth in the last quarter was largely on account of significant increase in copra price (75%) during the year, which instiga
the price hike in coconut oil portfolio. The parachute rigids (36% of FY18 India business turnover) posted volume degrowth of
as a result of concentrated price hikes (~22%) - as compared to 15% growth in volumes in Q4FY17 (post
demonetization). Therefore, volume growth of parachute rigids stood at only 2% during the year marred by pre GST destocking
in Q1 and price hike in Q4. Marico is aggressively investing in the e-commerce business to double its share of contribution to
6
CD Equisearch Pvt Ltd
istribution of Life Insurance
ROE (%) Mcap/ Sales*
P/BV P/E
46.9 8.1 14.9 31.6
41.7 6.4 19.6 49.6
33.3 8.5 16.6 48.3
17.9 9.2 12.8 75.7
% in FY18. Rural growth surpassed urban growth for the last three
rural sales grew by 12%, outpacing the urban sales growth by 5%. Canteen Stores
Department (CSD) rebounded after four consecutive quarters of decline and grew by 32%. Modern trade and e-commerce
rs like comfortable shopping experience, access to diverse categories
y in Q4FY18 but was muted for the year. In constant
currency terms, the business grew by 9% during the year. Revenues from Bangladesh grew by 13% in FY18, in constant
currency, accentuated by the non coconut oil portfolio that grew by 32%, increasing its contribution to the business in
angladesh to 26% in FY18 from 10% in FY12. Headwinds in the male shampoo category in Vietnam depressed sales growth
from south East Asia by 2% in FY18. Despite macroeconomic challenges, revenues from South Africa grew by 16% during the
y. The volume growth in India in Q4FY18
fola edible oils. The 12% value
growth in the last quarter was largely on account of significant increase in copra price (75%) during the year, which instigated
ndia business turnover) posted volume degrowth of
as compared to 15% growth in volumes in Q4FY17 (post
year marred by pre GST destocking
commerce business to double its share of contribution to

CD Equisearch Pvt Ltd
Equities Derivatives Commoditie
Dabur India reported comparable consolidated revenue growth of 11.1% in Q4FY18, while it’s consolidated net profit surged
by 18.9% to Rs 396.20 crs as a result of strong upswing in key business categories and geographies. Its international busines
reported a growth of 16.8% (in constant currency), thanks to the 51% sales growth in GCC markets
in Saudi Arabia – during the previous quarter. Sales growth in Egypt and Nepal stood at 38% and 19% respectively. The
domestic FMCG business registered a volume growth of
Dabur’s comparable consolidated revenues grew by 6.9% in FY18. Government’s focus on rural growth as well as expectations
of favourable monsoon would further boost consumer demand.
Emami’s product portfolio consists of over 300 diverse products that are available via more than 8.5 lakh retail outlets thro
~3150 distributors across India. Thanks to the aggressive spending on new launches, Emami’
Though consolidated net revenues during the year grew by 1.7%, PAT degrew by 9.8% y
during Q4FY18 and by 4% in FY18, while the international business grew by 37% and 14% during Q4FY18 and FY18
respectively stroked by robust growth in SAARC, Middle East, North Africa and Pakistan. The CSD business degrew by 4% in
FY18. Higher fiscal spending coupled with normal monsoon expectation and post GST stabilization will enable the company to
grow further.
7
CD Equisearch Pvt Ltd
ities Distribution of Mutual Funds Dist
consolidated revenue growth of 11.1% in Q4FY18, while it’s consolidated net profit surged
by 18.9% to Rs 396.20 crs as a result of strong upswing in key business categories and geographies. Its international busines
currency), thanks to the 51% sales growth in GCC markets
during the previous quarter. Sales growth in Egypt and Nepal stood at 38% and 19% respectively. The
domestic FMCG business registered a volume growth of 7.7% in Q4FY18 illustrating signs of revival in consumer sentiment.
Dabur’s comparable consolidated revenues grew by 6.9% in FY18. Government’s focus on rural growth as well as expectations
of favourable monsoon would further boost consumer demand.
Emami’s product portfolio consists of over 300 diverse products that are available via more than 8.5 lakh retail outlets thro
Thanks to the aggressive spending on new launches, Emami’s EBITDA fell by 5.2% in FY18.
hough consolidated net revenues during the year grew by 1.7%, PAT degrew by 9.8% y-o-y. Domestic revenues grew by 10%
during Q4FY18 and by 4% in FY18, while the international business grew by 37% and 14% during Q4FY18 and FY18
t growth in SAARC, Middle East, North Africa and Pakistan. The CSD business degrew by 4% in
FY18. Higher fiscal spending coupled with normal monsoon expectation and post GST stabilization will enable the company to
7
CD Equisearch Pvt Ltd
istribution of Life Insurance
consolidated revenue growth of 11.1% in Q4FY18, while it’s consolidated net profit surged
by 18.9% to Rs 396.20 crs as a result of strong upswing in key business categories and geographies. Its international business
currency), thanks to the 51% sales growth in GCC markets – largely led by 82% growth
during the previous quarter. Sales growth in Egypt and Nepal stood at 38% and 19% respectively. The
7.7% in Q4FY18 illustrating signs of revival in consumer sentiment.
Dabur’s comparable consolidated revenues grew by 6.9% in FY18. Government’s focus on rural growth as well as expectations
Emami’s product portfolio consists of over 300 diverse products that are available via more than 8.5 lakh retail outlets through
s EBITDA fell by 5.2% in FY18.
y. Domestic revenues grew by 10%
during Q4FY18 and by 4% in FY18, while the international business grew by 37% and 14% during Q4FY18 and FY18
t growth in SAARC, Middle East, North Africa and Pakistan. The CSD business degrew by 4% in
FY18. Higher fiscal spending coupled with normal monsoon expectation and post GST stabilization will enable the company to

CD Equisearch Pvt Ltd
Equities Derivatives Commoditie
Financials Quarterly Results- Standalone
Income From Operations
Other Income
Total Income
Total Expenditure
EBITDA
Interest
Depreciation
PBT
Tax
PAT
Exceptional Item
Adjusted Net Profit
EPS(Rs)
Income Statement- Consolidated
Income From Operations
Other Income
Total Income
Total Expenditure
EBITDA (other income included)
Interest
Depreciation
Exceptional Item
Net Profit
EPS(Rs)
8
CD Equisearch Pvt Ltd
ities Distribution of Mutual Funds Dist
Figures in crores
Q4FY18 Q4FY17 % chg FY18 FY17
221.60 204.54 8.3 831.21 792.54
0.86 2.32 -63.1 24.35 39.35
Total Income 222.46 206.86 7.5 855.56 831.89
Total Expenditure 149.78 138.32 8.3 572.56 526.93
EBITDA 72.68 68.53 6.0 283.00 304.95
0.38 0.27 42.3 1.16 0.93
1.83 1.40 31.1 6.85 23.15
PBT 70.47 66.87 5.4 274.98 280.87
Tax 15.05 14.21 6.0 58.71 59.92
PAT 55.41 52.67 5.2 216.27 220.96
Exceptional Item - - - 0.00 -14.46
Adjusted Net Profit 55.41 52.67 5.2 216.27 235.42
EPS(Rs) 3.76 3.57 5.2 14.66 15.96
Consolidated Figure in crores
FY16 FY17 FY18 FY19e FY20e
799.72 796.90 828.49 897.06 981.47
28.70 39.39 24.43 34.54
Total Income 828.42 836.29 852.92 931.60 1017.31
Total Expenditure 526.03 533.31 574.57 627.13 680.65
EBITDA (other income included) 302.39 302.98 278.35 304.46 336.66
0.23 1.03 1.23 1.62
51.88 23.70 7.38 9.09
PBT 250.29 278.25 269.75 293.75 322.47
Tax 53.85 60.01 58.67 61.69
PAT 196.44 218.24 211.08 232.06 248.30
Exceptional Item -36.98 -14.40 - -
Net Profit 233.42 232.64 211.08 232.06 248.30
EPS(Rs) 15.83 15.77 14.31 15.73
8
CD Equisearch Pvt Ltd
istribution of Life Insurance
Figures in crores
%
chg
4.9
-38.1
2.8
8.7
-7.2
24.4
-70.4
-2.1
-2.0
-2.1
-100.0
-8.1
-8.1
Figure in crores FY20e
981.47
35.84
1017.31
680.65
336.66
2.32
11.87
322.47
74.17
248.30
-
248.30
16.83
CD Equisearch Pvt Ltd
Equities Derivatives Commoditie
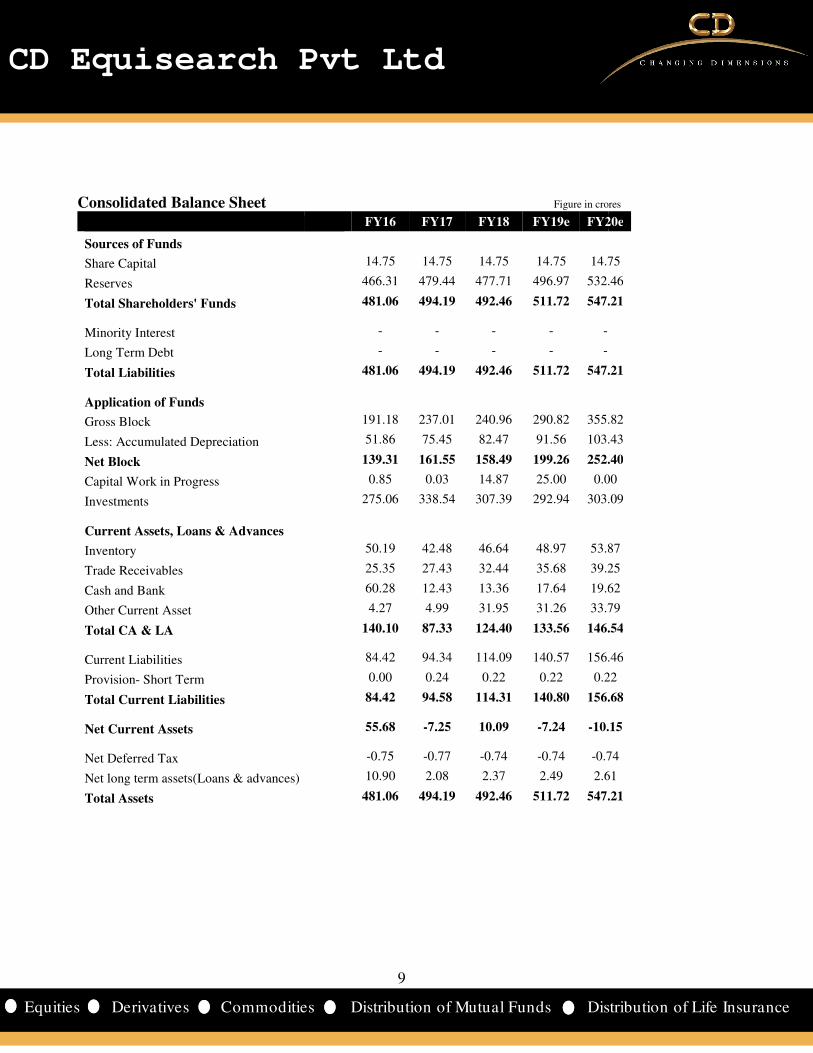
Consolidated Balance Sheet
Sources of Funds
Share Capital
Reserves
Total Shareholders' Funds
Minority Interest
Long Term Debt
Total Liabilities
Application of Funds
Gross Block
Less: Accumulated Depreciation
Net Block
Capital Work in Progress
Investments
Current Assets, Loans & Advances
Inventory
Trade Receivables
Cash and Bank
Other Current Asset
Total CA & LA
Current Liabilities
Provision- Short Term
Total Current Liabilities
Net Current Assets
Net Deferred Tax
Net long term assets(Loans & advances)
Total Assets
9
CD Equisearch Pvt Ltd
ities Distribution of Mutual Funds Dist
Figure in crores
FY16 FY17 FY18 FY19e FY20e
14.75 14.75 14.75 14.75 14.75
466.31 479.44 477.71 496.97 532.46
481.06 494.19 492.46 511.72 547.21
- - - - -
- - - - -
481.06 494.19 492.46 511.72 547.21
191.18 237.01 240.96 290.82 355.82
51.86 75.45 82.47 91.56 103.43
139.31 161.55 158.49 199.26 252.40
0.85 0.03 14.87 25.00 0.00
275.06 338.54 307.39 292.94 303.09
50.19 42.48 46.64 48.97 53.87
25.35 27.43 32.44 35.68 39.25
60.28 12.43 13.36 17.64 19.62
4.27 4.99 31.95 31.26 33.79
140.10 87.33 124.40 133.56 146.54
84.42 94.34 114.09 140.57 156.46
0.00 0.24 0.22 0.22 0.22
84.42 94.58 114.31 140.80 156.68
55.68 -7.25 10.09 -7.24 -10.15
-0.75 -0.77 -0.74 -0.74 -0.74
10.90 2.08 2.37 2.49 2.61
481.06 494.19 492.46 511.72 547.21
9
CD Equisearch Pvt Ltd
istribution of Life Insurance
Figure in crores FY20e
14.75
532.46
547.21
547.21
355.82
103.43
252.40
0.00
303.09
53.87
39.25
19.62
33.79
146.54
156.46
0.22
156.68
10.15
0.74
2.61
547.21

CD Equisearch Pvt Ltd
Equities Derivatives Commoditie
Key Financial Ratios
Growth Ratios (%)
Revenue
EBITDA
Net Profit
EPS
Margins (%)
Operating Profit Margin
Gross profit Margin
Net Profit Margin
Return (%)
ROCE
ROE
Valuations
Market Cap/ Sales
EV/EBITDA
P/E
P/BV
Other Ratios
Interest Coverage
Debt Equity
Current Ratio
Turnover Ratios
Fixed Asset Turnover
Total Asset Turnover
Debtors Turnover
Inventory Turnover
Creditor Turnover
WC Ratios
Debtor Days
Inventory Days
Creditor Days
Cash Conversion Cycle
10
CD Equisearch Pvt Ltd
ities Distribution of Mutual Funds Dist
FY16 FY17 FY18 FY19e FY20e
-3.1 -0.4 4.0 8.3
11.7 0.2 -8.1 9.4
11.3 -0.3 -9.3 9.9
11.3 -0.3 -9.3 9.9
34.2 33.1 30.6 30.1
37.8 37.9 33.4 33.8
29.2 29.2 25.5 25.9
52.3 51.1 45.6 48.5
52.8 52.3 46.9 50.5
7.1 7.3 8.4 7.4
17.7 18.1 23.9 20.9
24.4 25.0 33.0 28.8
13.0 12.9 15.5 14.3
1314.8 288.1 221.2 181.9 139.8
0.0 0.0 0.0 0.1
4.9 4.5 3.8 3.0
6.7 7.4 7.1 6.6
1.8 1.8 1.8 2.0
41.4 30.2 27.7 26.3
11.8 11.5 12.9 13.1
11.1 12.7 11.5 10.0
8.8 12.1 13.2 13.9
31.0 31.7 28.3 27.8
32.9 28.7 31.8 36.6
6.9 15.1 9.7 5.1
10
CD Equisearch Pvt Ltd
istribution of Life Insurance
FY20e
9.4
10.6
7.0
7.0
30.6
34.1
25.3
48.2
51.0
6.8
18.9
26.9
13.2
139.8
0.1
2.9
5.4
2.0
26.2
13.2
9.8
13.9
27.6
37.1
4.4

CD Equisearch Pvt Ltd
Equities Derivatives Commoditie
Cumulative Financial Data FY15-16
Volumes (cases in lakhs) 107
Income from operations 1625
Operating profit 513
EBIT 563
PBT 563
PAT 443
Dividends 408
OPM (%) 31.6
NPM (%) 27.3
ROE (%) 48.5
ROCE (%) 48.0
Debt Equity* 0.0
Fixed asset turnover 5.6
Debtors turnover 48.2
Inventory turnover 12.4
Creditors turnover 13.2
Debtor days 7.6
Inventory days 29.4
Creditor days 27.6
Cash conversion 9.4
Dividend payout ratio (%) 110.5 FY15-16 implies two years ending fiscal 16; FY15 data not IND*as at terminal year
Depressed by the twin impact of demonetization and GST, the volume growth and revenues in FY17
table) owing to reduced offtake, adverse impact on various channels of distribution and short term confusion regarding
various aspects of GST. At the wholesale level, mos
early FY17 was already under significant strain as a result of suppressed consumption stoked by two consecutive years of
drought. Modest recovery in the next two fiscal is expected with a
trade receivables since FY14 explains the sharp fall in debtor’s turnover ratio over the years.
Bajaj Corp is poised to grow on the backdrop of its expansion plans to boost its capacity as well as the
added products in its pipeline. Yet, margins would be held hostage to surge in prices of key raw materials like LLP and refin
oil. Revival of rural demand and restructuring of its international business would help foster its busi
conversion cycle is expected to further improve.
11
CD Equisearch Pvt Ltd
ities Distribution of Mutual Funds Dist
FY17-18 FY19e-20e
107 115
1625 1879
518 571
569 620
566 616
444 480
417 426
31.8 30.4
27.3 25.6
50.0 50.4
48.9 48.2
0.0 0.0
7.7 5.8
28.1 26.2
11.4 13.0
10.7 9.9
13.0 13.9
31.9 28.1
34.1 37.0
10.8 5.0
97.1 88.6
plies two years ending fiscal 16; FY15 data not IND-AS compliant.
demonetization and GST, the volume growth and revenues in FY17
table) owing to reduced offtake, adverse impact on various channels of distribution and short term confusion regarding
various aspects of GST. At the wholesale level, most FMCG businesses witnessed contraction of their pipeline. Demand in
early FY17 was already under significant strain as a result of suppressed consumption stoked by two consecutive years of
drought. Modest recovery in the next two fiscal is expected with a volume growth estimated at 7.5%. Consistent uptrend in
trade receivables since FY14 explains the sharp fall in debtor’s turnover ratio over the years.
Bajaj Corp is poised to grow on the backdrop of its expansion plans to boost its capacity as well as the
added products in its pipeline. Yet, margins would be held hostage to surge in prices of key raw materials like LLP and refin
oil. Revival of rural demand and restructuring of its international business would help foster its busi
conversion cycle is expected to further improve.
11
CD Equisearch Pvt Ltd
istribution of Life Insurance
demonetization and GST, the volume growth and revenues in FY17-18 remained muted (see
table) owing to reduced offtake, adverse impact on various channels of distribution and short term confusion regarding
t FMCG businesses witnessed contraction of their pipeline. Demand in
early FY17 was already under significant strain as a result of suppressed consumption stoked by two consecutive years of
volume growth estimated at 7.5%. Consistent uptrend in
Bajaj Corp is poised to grow on the backdrop of its expansion plans to boost its capacity as well as the launch of various value
added products in its pipeline. Yet, margins would be held hostage to surge in prices of key raw materials like LLP and refined
oil. Revival of rural demand and restructuring of its international business would help foster its business further. The cash
CD Equisearch Pvt Ltd
Equities Derivatives Commoditie
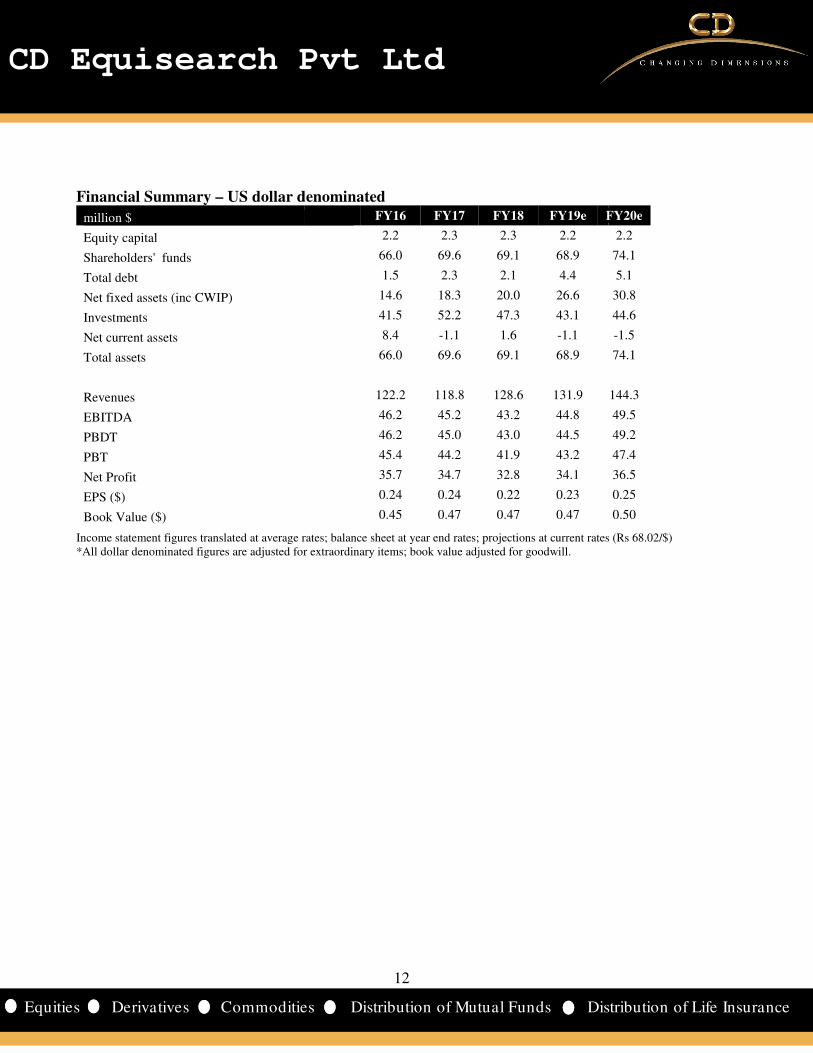
Financial Summary – US dollar denominated
million $
Equity capital
Shareholders' funds
Total debt
Net fixed assets (inc CWIP)
Investments
Net current assets
Total assets
Revenues
EBITDA
PBDT
PBT
Net Profit
EPS ($)
Book Value ($)
Income statement figures translated at average rates; balance *All dollar denominated figures are adjusted for extraordinary
12
CD Equisearch Pvt Ltd
ities Distribution of Mutual Funds Dist
US dollar denominated FY16 FY17 FY18 FY19e FY20e
2.2 2.3 2.3 2.2
66.0 69.6 69.1 68.9
1.5 2.3 2.1 4.4
14.6 18.3 20.0 26.6
41.5 52.2 47.3 43.1
8.4 -1.1 1.6 -1.1
66.0 69.6 69.1 68.9
122.2 118.8 128.6 131.9
46.2 45.2 43.2 44.8
46.2 45.0 43.0 44.5
45.4 44.2 41.9 43.2
35.7 34.7 32.8 34.1
0.24 0.24 0.22 0.23
0.45 0.47 0.47 0.47
Income statement figures translated at average rates; balance sheet at year end rates; projections at current rates (Rs 68.02*All dollar denominated figures are adjusted for extraordinary items; book value adjusted for goodwill.
12
CD Equisearch Pvt Ltd
istribution of Life Insurance
FY20e
2.2
74.1
5.1
30.8
44.6
-1.5
74.1
144.3
49.5
49.2
47.4
36.5
0.25
0.50
tions at current rates (Rs 68.02/$)
CD Equisearch Pvt Ltd
Equities Derivatives Commoditie
Disclosure & Disclaimer
CD Equisearch Private Limited (hereinafter referred to as
Bombay Stock Exchange Limited and Metropolitan Stock Exchange of India Limited (Formerly known as MCX Stock Exchange
Equi is also registered as Depository Participant with CDSL and AMFI registered Mutual Fund Advisor. The associates of CD Eq
engaged in activities relating to NBFC-ND - Financing and Investment, Commodity Broking, Real Estate, etc.
CD Equi is registered under SEBI (Research Analysts) Regulations, 2014 with SEBI Registration no INH300002274. Further, CD Equi
declares that –
• No disciplinary action has been taken against CD Equi by any of the regulatory authorities.
• CD Equi/its associates/research analysts do not have any financial interest/beneficial interest of more than one percent/material
conflict of interest in the subject company(s)
• CD Equi/its associates/research analysts have not received a
months.
• CD Equi/its research analysts has not served as an officer, director or employee of company covered by analysts and has not b
engaged in market making activity of the company cov
This document is solely for the personal information of the recipient and must not be singularly used as the basis of any inv
Nothing in this document should be construed as investment or financial advice. Each recipient of this document s
investigations as they deem necessary to arrive at an independent evaluation of an investment in the securities of the compan
in this document (including the merits and risks involved) and should consult their own advisors to
an investment.
Reports based on technical and derivative analysis center on studying charts of a stock's price movement, outstanding positio
volume, as opposed to focusing on a company's fundamentals
The information in this document has been printed on the basis of publicly available information, internal data and other rel
believed to be true but we do not represent that it is accurate or complete and it should not be relied on as such, as this document is for
general guidance only. CD Equi or any of its affiliates/group companies shall not be in any way responsible for any loss or d
arise to any person from any inadvertent error in the information contained in this report. CD Equi has not independently verified all the
information contained within this document. Accordingly, we cannot testify nor make any representation or warranty, express o
the accuracy, contents or data contained within this document.
While, CD Equi endeavors to update on a reasonable basis the information discussed in this material, there may be regulatory
other reasons that prevent us from doing so.
This document is being supplied to you solely for your information and its contents, information or data may not be reproduced,
redistributed or passed on, directly or indirectly. Neither, CD Equi nor its directors, employees or affiliates shall be liab
damage that may arise from or in connection with the use of this information.
CD Equisearch Private Limited (CIN: U67120WB1995PTC071521)
Registered Office: 37, Shakespeare Sarani, 3rd Floor, Kolkata
Vasawani Mansion, 5th Floor, Dinshaw Wachha Road, Churchgate, Mumbai
Website: www.cdequi.com; Email: [email protected]
buy: >20% accumulate: >10% to ≤20% hold:
Exchange Rates Used- Indicative
Rs/$ FY15 FY16
Average 61.15 65.46
Year end 62.59 66.33
All $ values mentioned in the write-up translated at the average
current exchange rate. Cumulative dollar figure is the sum of respective yearly dollar value
13
CD Equisearch Pvt Ltd
ities Distribution of Mutual Funds Dist
CD Equisearch Private Limited (hereinafter referred to as ‘CD Equi’) is a Member registered with National Stock Exchange of India Limited,
Bombay Stock Exchange Limited and Metropolitan Stock Exchange of India Limited (Formerly known as MCX Stock Exchange
Equi is also registered as Depository Participant with CDSL and AMFI registered Mutual Fund Advisor. The associates of CD Eq
Financing and Investment, Commodity Broking, Real Estate, etc.
Equi is registered under SEBI (Research Analysts) Regulations, 2014 with SEBI Registration no INH300002274. Further, CD Equi
No disciplinary action has been taken against CD Equi by any of the regulatory authorities.
sociates/research analysts do not have any financial interest/beneficial interest of more than one percent/material
conflict of interest in the subject company(s) (kindly disclose if otherwise).
CD Equi/its associates/research analysts have not received any compensation from the subject company(s) during the past twelve
CD Equi/its research analysts has not served as an officer, director or employee of company covered by analysts and has not b
engaged in market making activity of the company covered by analysts.
This document is solely for the personal information of the recipient and must not be singularly used as the basis of any inv
Nothing in this document should be construed as investment or financial advice. Each recipient of this document s
investigations as they deem necessary to arrive at an independent evaluation of an investment in the securities of the compan
in this document (including the merits and risks involved) and should consult their own advisors to determine the merits and risks of such
Reports based on technical and derivative analysis center on studying charts of a stock's price movement, outstanding positio
volume, as opposed to focusing on a company's fundamentals and as such, may not match with a report on a company's fundamentals.
The information in this document has been printed on the basis of publicly available information, internal data and other rel
hat it is accurate or complete and it should not be relied on as such, as this document is for
general guidance only. CD Equi or any of its affiliates/group companies shall not be in any way responsible for any loss or d
rom any inadvertent error in the information contained in this report. CD Equi has not independently verified all the
information contained within this document. Accordingly, we cannot testify nor make any representation or warranty, express o
the accuracy, contents or data contained within this document.
While, CD Equi endeavors to update on a reasonable basis the information discussed in this material, there may be regulatory
document is being supplied to you solely for your information and its contents, information or data may not be reproduced,
redistributed or passed on, directly or indirectly. Neither, CD Equi nor its directors, employees or affiliates shall be liab
damage that may arise from or in connection with the use of this information.
CD Equisearch Private Limited (CIN: U67120WB1995PTC071521)
Floor, Kolkata – 700 017; Phone: +91(33) 4488 0000; Fax: +91(33) 2289 2557 Corporate Office: 10,
Floor, Dinshaw Wachha Road, Churchgate, Mumbai – 400 020. Phone: +91(22) 2283 0652/0653; Fax: +91(22) 2283, 2276
Website: www.cdequi.com; Email: [email protected]
hold: ≥-10% to ≤10% reduce: ≥-20% to <-10% sell: <
FY17 FY18
67.09 64.45
64.84 65.04
up translated at the average rate of the respective quarter/ year as applicable. Projections converted at
current exchange rate. Cumulative dollar figure is the sum of respective yearly dollar value.
13
CD Equisearch Pvt Ltd
istribution of Life Insurance
) is a Member registered with National Stock Exchange of India Limited,
Bombay Stock Exchange Limited and Metropolitan Stock Exchange of India Limited (Formerly known as MCX Stock Exchange Limited). CD
Equi is also registered as Depository Participant with CDSL and AMFI registered Mutual Fund Advisor. The associates of CD Equi are
Financing and Investment, Commodity Broking, Real Estate, etc.
Equi is registered under SEBI (Research Analysts) Regulations, 2014 with SEBI Registration no INH300002274. Further, CD Equi hereby
sociates/research analysts do not have any financial interest/beneficial interest of more than one percent/material
ny compensation from the subject company(s) during the past twelve
CD Equi/its research analysts has not served as an officer, director or employee of company covered by analysts and has not been
This document is solely for the personal information of the recipient and must not be singularly used as the basis of any investment decision.
Nothing in this document should be construed as investment or financial advice. Each recipient of this document should make such
investigations as they deem necessary to arrive at an independent evaluation of an investment in the securities of the companies referred to
determine the merits and risks of such
Reports based on technical and derivative analysis center on studying charts of a stock's price movement, outstanding positions and trading
and as such, may not match with a report on a company's fundamentals.
The information in this document has been printed on the basis of publicly available information, internal data and other reliable sources
hat it is accurate or complete and it should not be relied on as such, as this document is for
general guidance only. CD Equi or any of its affiliates/group companies shall not be in any way responsible for any loss or damage that may
rom any inadvertent error in the information contained in this report. CD Equi has not independently verified all the
information contained within this document. Accordingly, we cannot testify nor make any representation or warranty, express or implied, to
While, CD Equi endeavors to update on a reasonable basis the information discussed in this material, there may be regulatory compliance or
document is being supplied to you solely for your information and its contents, information or data may not be reproduced,
redistributed or passed on, directly or indirectly. Neither, CD Equi nor its directors, employees or affiliates shall be liable for any loss or
33) 2289 2557 Corporate Office: 10,
400 020. Phone: +91(22) 2283 0652/0653; Fax: +91(22) 2283, 2276
<-20%
rate of the respective quarter/ year as applicable. Projections converted at