NOVEL Engineering Consultants Pvt. Ltd.
45
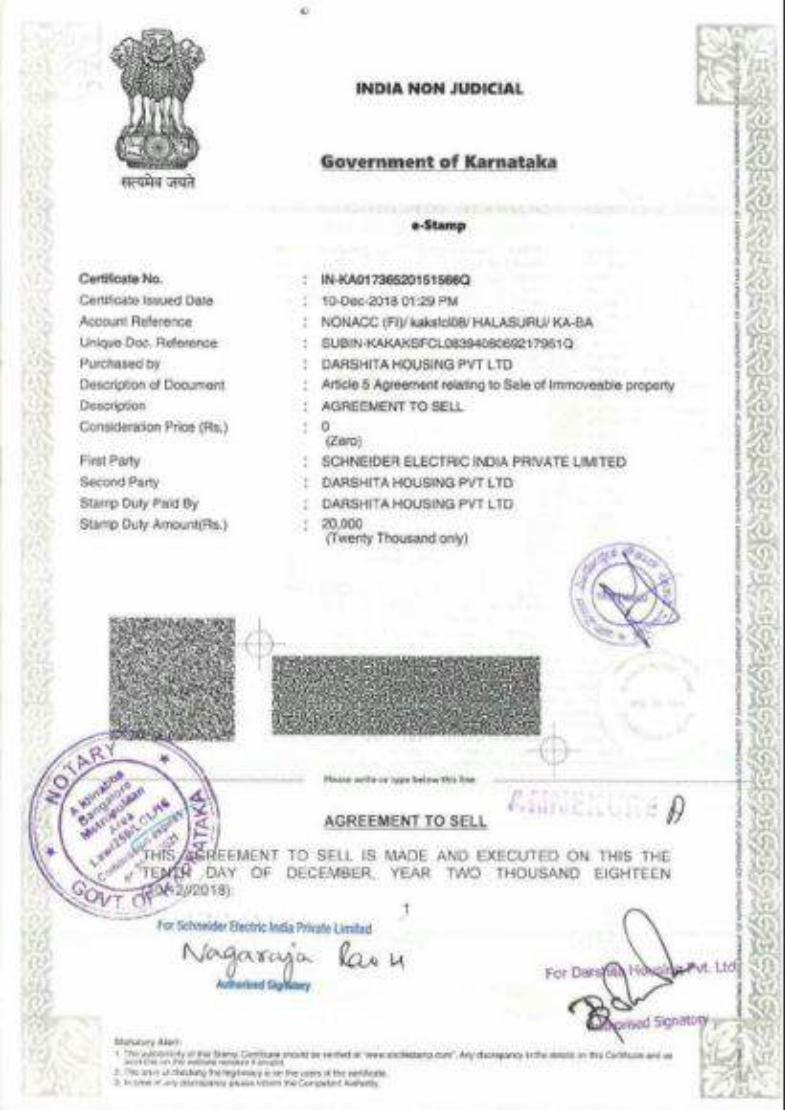
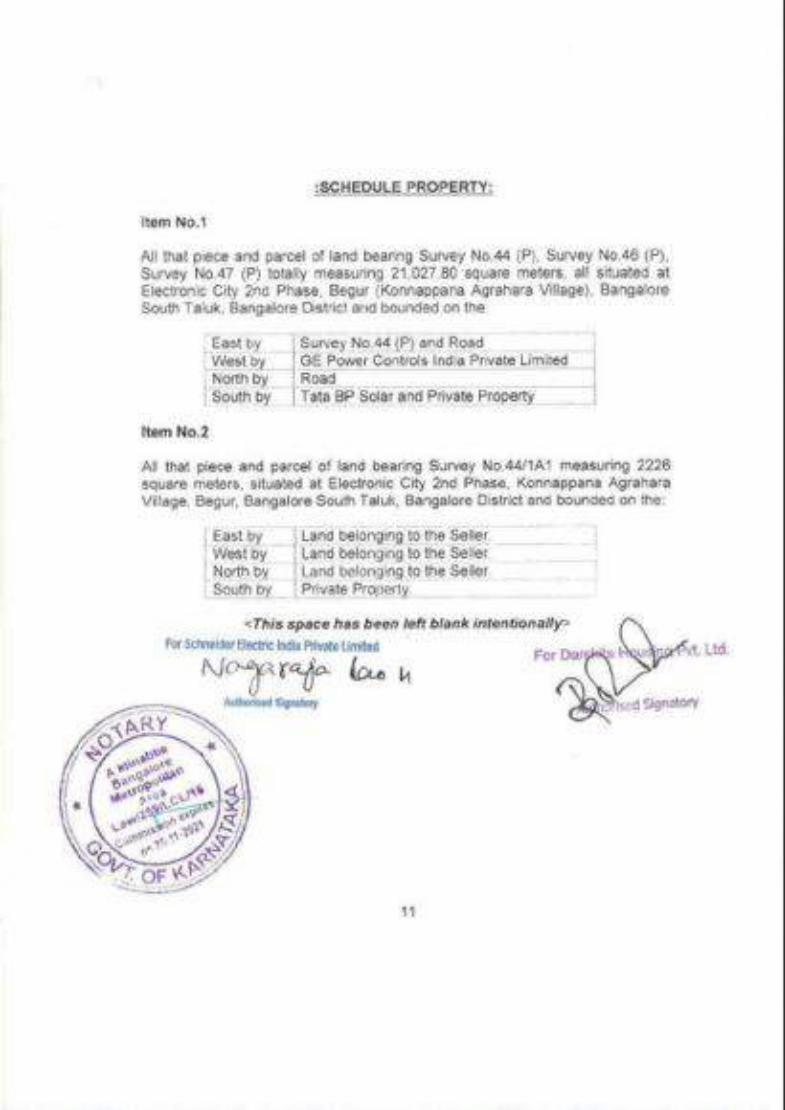
NOVEL Engineering Consultants Pvt. Ltd. MOEF REPORT FEASIBILITY REPORT FOR SEWAGE TREATMENT PLANT OF CAPACITY – 325 KLD FOR PROPOSED IT OFFICE BUILDING AT SY. NOS. 44(P), 46(P) & 47(P), ELECTRONIC CITY 2ND PHASE, KONAPPANA AGRAHARA VILLAGE, BEGUR HOBLI, BENGALURU SOUTH TALUK, BENGALURU. PROPONENT M/S. DARSHITA HOUSING PRIVATE LIMITED, 4TH FLOOR, SALARPURIA WINDSOR, NO.3, ULSOOR ROAD, BENGALURU – 560 042. CONSULTANTS NOVEL ENGINEERING CONSULTANTS PVT. LTD. BUILD. NO.55, FLAT NO-1, GROUND FLOOR, 8 TH CROSS, 5 TH MAIN, MALLESHWARAM, BANGALORE-560003 TEL: 23342576 FAX:41490317
-
Upload
khangminh22 -
Category
Documents
-
view
0 -
download
0
Transcript of NOVEL Engineering Consultants Pvt. Ltd.
NOVEL Engineering Consultants Pvt. Ltd.
\
MOEF REPORT
OF 4
FEASIBILITY REPORT FOR
SEWAGE TREATMENT PLANT OF CAPACITY – 325 KLD
FOR PROPOSED IT OFFICE BUILDING
AT SY. NOS. 44(P), 46(P) & 47(P),
ELECTRONIC CITY 2ND PHASE,
KONAPPANA AGRAHARA VILLAGE, BEGUR HOBLI,
BENGALURU SOUTH TALUK,
BENGALURU.
PROPONENT
M/S. DARSHITA HOUSING PRIVATE LIMITED,
4TH FLOOR, SALARPURIA WINDSOR, NO.3,
ULSOOR ROAD, BENGALURU – 560 042.
CONSULTANTS
NOVEL ENGINEERING CONSULTANTS PVT. LTD.
BUILD. NO.55, FLAT NO-1, GROUND FLOOR,
8TH CROSS, 5TH MAIN, MALLESHWARAM,
BANGALORE-560003
TEL: 23342576
FAX:41490317
NOVEL Engineering Consultants Pvt. Ltd.
\
MOEF REPORT
OF 4
A WATER SUPPLY & DISTRIBUTION 1.0 CONCEPT
The proposed IT office building at At Sy. Nos. 44(P), 46(P) & 47(P), Electronic City 2nd Phase, Konappana Agrahara Village, Begur Hobli, Bengaluru South Taluk, Bengaluru comprises of basement, ground floor and 13 upper floors. The lower basement, ground floor and first floors are planned for car parking and area for services. The proposed IT office building is provided with the following services. Water supply, storage and distribution system. Sewage collection, treatment and reuse. Rainwater collection and reuse/ Ground Recharge. Storm water disposal system.
2.0 WATER REQUIREMENT Refer to the regulations of National building code, the average per capita water is assumed to be 45 litres per day. Occupancy load considered is 10.0sq.mtrs /person. The water requirement is calculated as follows. Total 6266 persons x 45litres per head per day = 281,970Litres Water requirement for cafeteria & kitchen approx. = 30,000 Litres Average daily water requirement =3,11,970 Litres Say The total daily water requirement is 312 Cu.mtrs. PUMPING & DISTRIBUTION
3.1 TREATED DOMESTIC WATER Distribution System: The domestic water supply to the building will be through hydro-pneumatic system with minimum
residual pressure of 1.0 kg/cm2 at the remotest fixture. 3.2 FLUSHING WATER
The recycled water supply to the building will be system gravity system through the from the overhead water tank located at terrace level.
3.3 AUTOMATIC LIQUID LEVEL CONTROLLER These are units built in electronic circuitry, which monitors the water level in underground sump or in overhead tank through sensors. It has a closed loop sequence of operation to analyse and evaluate the system operation. The level indicators will be provided in the underground sump to indicate the percentage water level in the sump to avoid dry run protection of pumps. Overflow pipes are provided for all the tanks for manual control of pumps incase level control system fails.
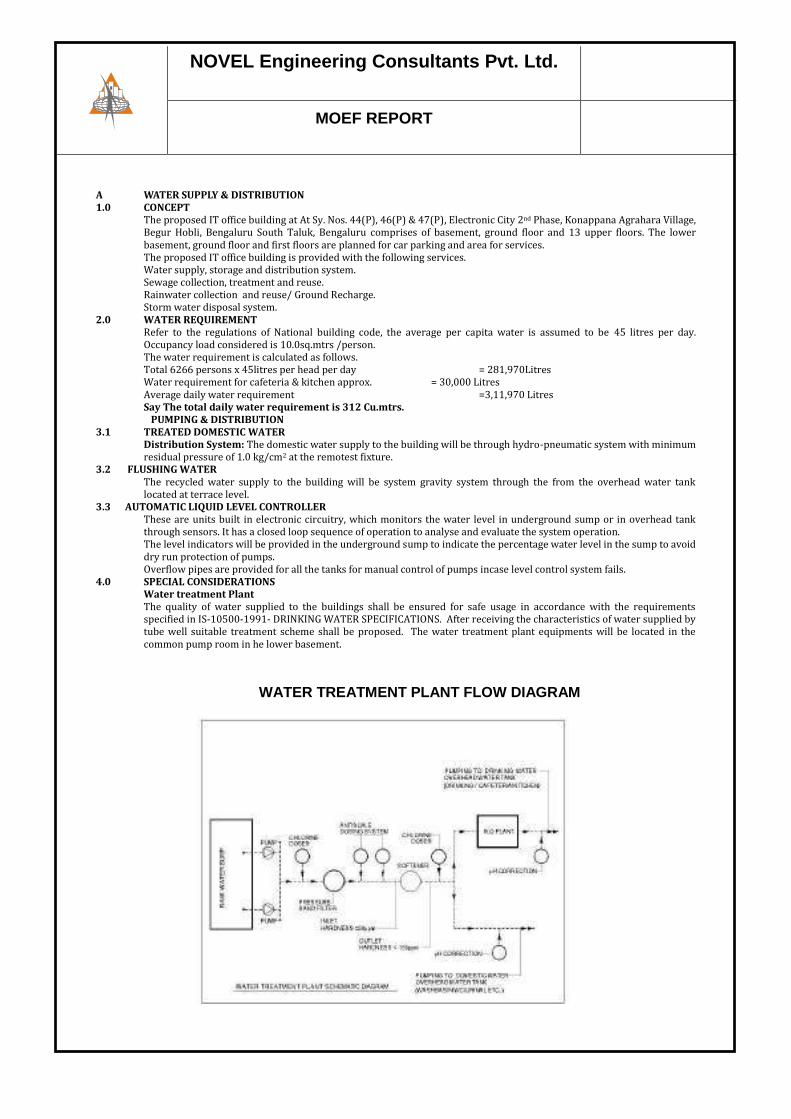
4.0 SPECIAL CONSIDERATIONS Water treatment Plant The quality of water supplied to the buildings shall be ensured for safe usage in accordance with the requirements specified in IS-10500-1991- DRINKING WATER SPECIFICATIONS. After receiving the characteristics of water supplied by tube well suitable treatment scheme shall be proposed. The water treatment plant equipments will be located in the common pump room in he lower basement.
WATER TREATMENT PLANT FLOW DIAGRAM

NOVEL Engineering Consultants Pvt. Ltd.
\
MOEF REPORT
OF 4
WATER BALANCE CHART
Fresh water Requirement/day
= 172 cum/day
Total Water Requirement
312 cum/day
Recycled water Requirement/day
for flushing
= 140.0 cum/day
Qty of sewage
Generated –296.0cu.m
= 300.0cu.m
Water supply
Roof Rain Water
collection Sump 113
cum/day
Cap. Of STP – 325.00 cum recycled
water Generated – 300.0 cum/day
Toilet flushing 140.0cu.m
Landscaping 55.0 Cu.m
Water cascade – 5 cu.m
95% = 296.0
Air conditioning – 100 cu.m
Zero discharge from STP

NOVEL Engineering Consultants Pvt. Ltd.
\
MOEF REPORT
OF 4
B SEWERAGE SYSTEM 1.0 CONCEPT
The sewerage system for the project is designed as separate sanitary sewer concept, separating the storm water. 20 BASIS OF DESIGN
The system of pipe sizing is based on fixture units as follows: Water Closet with cistern : 4 Units Kitchen Sink : 2 Units Shower : 2 Units Wash Basin : 2 Units Urinals : 5 Units
3.0 SANITARY FIXTURES Best quality sanitary fixtures and brass chrome plated fittings shall be used. Each gents toilets shall be provided with European water closet with concealed flush valve and health faucet, wash basins with pillar cocks, Auto flush urinals, standard accessories like toilet paper holder, towel ring, coat hook shall be provided in the room toilets. Ladies toilets shall be provided with the same fittings except the urinals.
4.0 SEWAGE COLLECTION The sewerage system shall be designed as two pipe system as per IS specifications. The sullage waste generated from the sink, utility, etc., shall be collected through a vertical waste stack. The waste stack shall be extended minimum 900mm above the terrace level as waste vent. The sewage generated from the water closets and urinal shall be collected through a vertical soil stack. The soil stack shall be extended minimum 900mm above the terrace level as a soil vent and fitted with vent cowl at top. The stack vent shall be provided with antisiphonage pipe with cross vents from the soil stacks at all floor levels above the overflow level of the fixture group in the respective floor shall be provided. The antisiphonage pipe shall be originated from the termination point of soil stack at ground level before connecting to the inspection chamber. The antisiphonage pipe shall be extended upto the last floor and connect to the soil stack above the overflow level of the fixture group in the last floor.
6.0 ESTIMATION OF SANITARY SEWAGE The estimation of sanitary sewage is based on the per capita sewage flow. Although the entire spent water from the hospital building should contribute to the total flow in sanitary sewer, generally about 90 - 95% of water supply is expected to reach the sewers.
7.0 SELF CLEANSING VELOCITY Self cleansing velocity is determined by considering the particle size and specific weight of suspended solids in sewers. Velocity of 0.75 m/sec to 1.20 m/sec at design peak flow is considered. The velocity of sewer shall not be less than 0.6 m/sec during dry weather flow condition.
8.0 SEWER NETWORK The sullage and sewage from the fixtures collected and conveyed to gully traps and inspection chambers. From the last manhole the sewage is further conveyed to the Sewage treatment plant. Provision of connection to the BWSSB sewer line will also made to dispose the excess treated water into the BWSSB manhole during the monsoon season.
9.0 SEWER NETWORK The sullage and sewage from the fixtures collected and conveyed to gully traps and inspection chambers. From the last manhole the sewage is further conveyed to the Sewage treatment plant. Sewers are designed to carry wastewater along with the suspended solids in such a manner that deposition and odour nuisance shall be kept to a minimum. Sewers are also designed for flows with free water surface and self-cleansing velocities. Sewer appurtenances are devices necessary for proper functioning of the complete sanitary system. The appurtenances include gully traps, manholes, inspection chambers, and out fall structures.
10.0 QUANTITY AND QUALITY OF WASTEWATERS The wastewater quantity from domestic sources is considered at maximum of 95% of water consumed. The quality of raw effluent and treated effluent is considered as below: Quantity water consumed per day will be 312 cum Quantity of sewage generated per day will be 296. 0cum. Say 300 Cum generated from basement. Capacity of STP planned will. 321. 0 cum. Say 325 cu.m
10.1 BASIC DATA ON WASTE WATER (SEWAGE) Quantity : 325 KLD pH : 6 – 7 Suspended Solids : 300 – 400 mg/lit Bacteriological quality (as per coliform Standards) : Unsafe BOD 5 : 300 – 350mg/lit COD : 700 – 800mg/lit Ammoniacal nitrogen content : 4 – 40 mg/lit Oil & Grease : 50mg/lit
10.2 TREATED WASTE WATER (SEWAGE) QUALITY for irrigation- After Tertiary Treatment As stipulated by Karnataka State Pollution Control Board (KSPCB), the treated effluent quality shall be within the following values for various parameters, for both present and future.

NOVEL Engineering Consultants Pvt. Ltd.
\
MOEF REPORT
OF 4
Quantity : 325 KLD PH : 6 .5 – 7.5 Suspended Solids mg/lit : 10mg/lit Turbidity, NTU : 1 BOD5 : 10mg/lit COD : 50 mg/lit Oil & Grease : 5 mg/lit Free chlorine ppm : > 2.0
10.3 Treated water characteristics for flushing should be as under: After Ultra
Filtration Quantity 325 KLD BOD mg / l ≤ 5 COD mg / l ≤ 20 TSS mg / l ≤Non detectable pH - 6.5 – 8.0 Total Coliform MPN / 100ml ≤ 100 E Coli MPN / 100ml ≤ Below Detectable Limits (Post
Chlorination after UF) Colour - Clear, Unobjectionable
11.0 SEWAGE TEATMENT PLANT (STP) – TECHNOLOGY – SBR
The sewage from the inspection chamber shall be conveyed through the external sewerage network of the project and finally disposed into the sewage treatment plant. The capacity of the sewage treatment plant is worked out to be. 325Cu.mtrs. The approximate space required for each STP will be 350 Sq.mtrs. STP can be constructed totally below ground with an accessible stair case to reach the pump. The below ground STP requires mechanical ventilation. The object of sewage treatment is to stabilize decomposable organic matter present in sewage so as to produce an effluent and sludge, which can be disposed of in the environment without causing health hazards or nuisance. The degree of treatment to be adopted should not only meet the requirement of regulatory agencies but also result in the maximum use of end products consistent with economy. Extended Aeration with sequential batch reactor technology is proposed.
12.0 SEQUENTIAL BATCH REACTOR The process of BOQ removal, nitrification/de-nitrification, phosphorus removal and sludge separation are achieved continuously in a single SBR tank. The process operates on the continuous inflow and batch outflow principle. The phases of aeration, settling, decantation occur sequentially and are controlled by a PLC. The tank is divided into pre-aeration and main aeration tanks by a baffle wall with openings at the bottom. The sewage flows continuously into the pre-aeration tank. Which acts as a biological selector enhancing the growth of the most desirable organisms while limiting the growth of the filamentous bacteria. Sewage from pre-aeration tank flows through openings at the bottom of the baffle wall and into the main aeration tank where BOD removal and nitrification occur. After aeration phase, sludge separation occurs in the settling phase. After settling, the clear water from top is removed through a PLC operated decanter. De-nitrification occurs during anoxic periods of settling and decant phases. The excess sludge is wasted during decant phase. The SBR treated water is disinfected using sodium hypochlorite and filtered through a pressure sand filter. The final treated water will be stored for recycling for gardening purpose. The waste sludge is used as manure after dewatering through filter press. It is recommended to provide ultra-filtration after the tertiary treatment to bring down the BOD content less than 5 ppm. The efficiency of a treatment plant depends not only on proper design and construction but also on good operation and maintenance. The Characteristics of Raw sewage shall be as follows pH = 6 - 7 TSS = 400 mg / litre BOD5 = 300 - 350 mg / litre COD = 450 - 500 mg / litre Characteristic of Treated sewage shall be as follows pH = 7 - 8 TSS = 10 mg / litre BOD5 = 5 mg / litre COD = 30 mg / litre SLUDGE HANDLING SYSTEM
The sludge formed in the process of bio-degradation is collected in Sludge holding Tank from where it will be fed to Teknofunghi Bags for further dewatering. This dewatered sludge and has to be disposed off suitably. ULTRA FILTERATION
NOVEL Engineering Consultants Pvt. Ltd.
\
MOEF REPORT
OF 4
The clarified treated sewage would be pumped through the Ultra Filtration System for reduction of BOD, COD, SS and pathogens. The UF treated water is collected in the UF Permeate Tank. This treated can be used for flushing, gardening and other secondary applications.
TEKNOBAG DRAIMAD _SLUDGE HANDLING SYSTEM
DESCRIPTION:
The TEKNOBAG-DRAIMAD system facilitates the dewatering of sludge coming from sewage treatment plants using disposable bags, accordance with the TEKNOFANGHI patent.
This system is modular and is designed to optimise the filling and initial dewatering cycle of the filter bags. Once this cycle is over the filter bags have be removed sealed and stored in the open air for a further dehydration, reducing the weight and volume of the sludge cake. The special water repellent material of the bags prevents rainwater from entering but allows dehydration of the contents by evaporation. Filter bags, if desired can be reused by washing the same.
Filtering module TEKNOBAG-DRAIMAD type 02BM, with two bags, closed on three sides, gravity or by Sludge Feed pumps. The unit is complete with:
One open top tank, with one gasketted throat to suspend the bags and one DN 50 overflow pipe, all made of AISI 304; One bag clamping FSCIX01, allowing adjustable and rapid sealing, made of AISI 304; One bottom support grid for the bag, made of rectangular section tubes, designed for the rational drawing of the bag, made of
AISI 304; One filtrate collection tank, with sloped bottom and 2” GF outlet port, all made of AISI 304; One frontal door set PNLL/02, composed of one door with double handle made in shock resistant polymer. All parts assembled and ready to start up.
13.0 DISPOSAL OF TREATED SEWAGE After the treatment the recycled water will be used for landscaping. During rainy season / monsoon the treated effluent if not used for landscaping, the same will be transported through the tankers to nearest municipal parks.
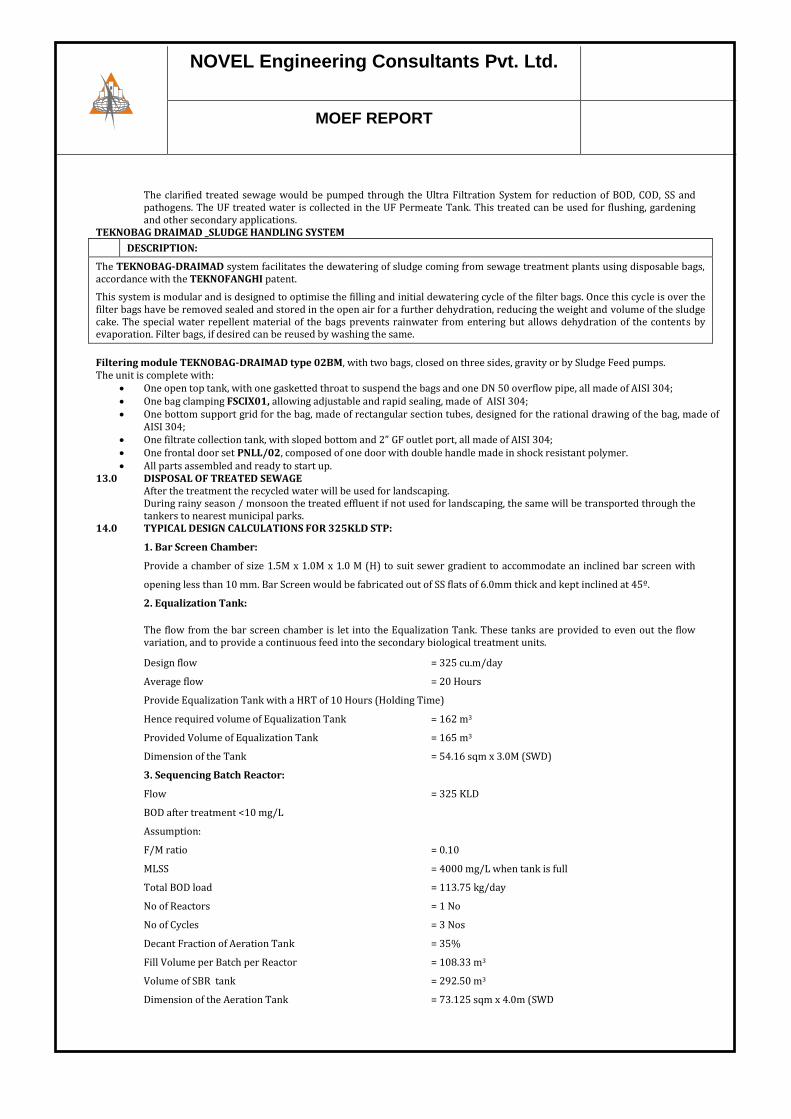
14.0 TYPICAL DESIGN CALCULATIONS FOR 325KLD STP:
1. Bar Screen Chamber:
Provide a chamber of size 1.5M x 1.0M x 1.0 M (H) to suit sewer gradient to accommodate an inclined bar screen with
opening less than 10 mm. Bar Screen would be fabricated out of SS flats of 6.0mm thick and kept inclined at 45º.
2. Equalization Tank:
The flow from the bar screen chamber is let into the Equalization Tank. These tanks are provided to even out the flow variation, and to provide a continuous feed into the secondary biological treatment units.
Design flow = 325 cu.m/day
Average flow = 20 Hours
Provide Equalization Tank with a HRT of 10 Hours (Holding Time)
Hence required volume of Equalization Tank = 162 m3
Provided Volume of Equalization Tank = 165 m3
Dimension of the Tank = 54.16 sqm x 3.0M (SWD)
3. Sequencing Batch Reactor:
Flow = 325 KLD
BOD after treatment <10 mg/L
Assumption:
F/M ratio = 0.10
MLSS = 4000 mg/L when tank is full
Total BOD load = 113.75 kg/day
No of Reactors = 1 No
No of Cycles = 3 Nos
Decant Fraction of Aeration Tank = 35%
Fill Volume per Batch per Reactor = 108.33 m3
Volume of SBR tank = 292.50 m3
Dimension of the Aeration Tank = 73.125 sqm x 4.0m (SWD
NOVEL Engineering Consultants Pvt. Ltd.
\
MOEF REPORT
OF 4
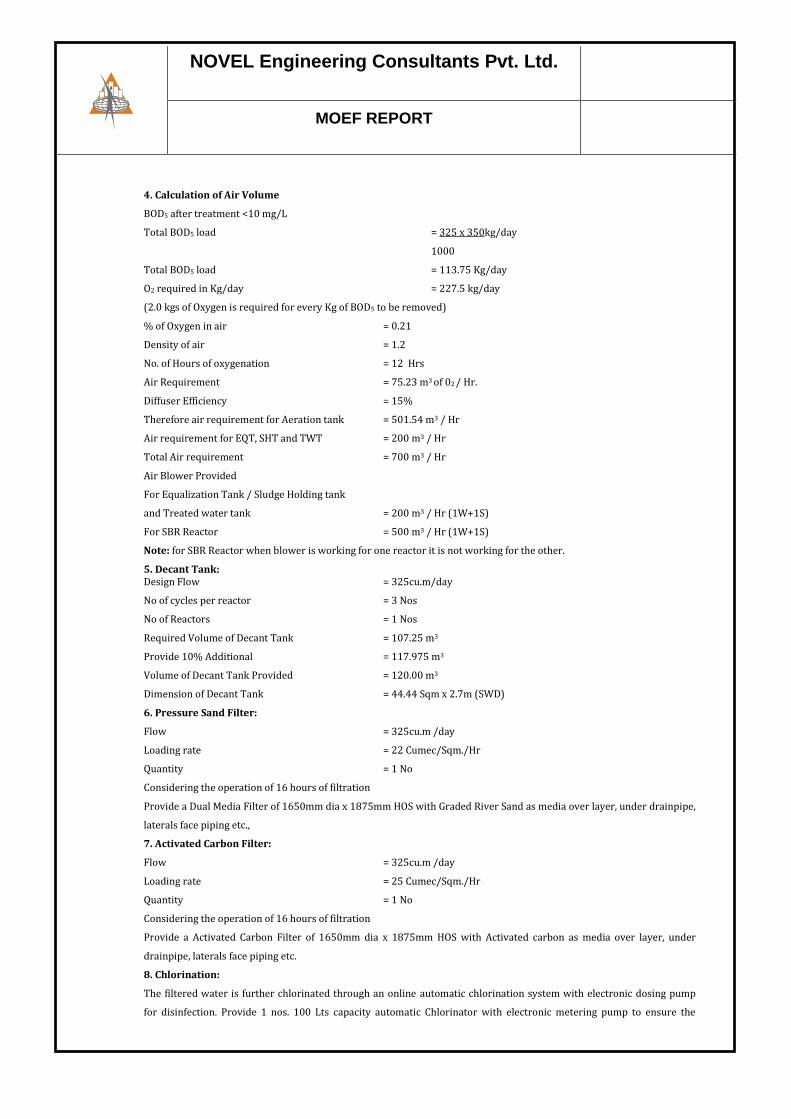
4. Calculation of Air Volume
BOD5 after treatment <10 mg/L
Total BOD5 load = 325 x 350kg/day
1000
Total BOD5 load = 113.75 Kg/day
O2 required in Kg/day = 227.5 kg/day
(2.0 kgs of Oxygen is required for every Kg of BOD5 to be removed)
% of Oxygen in air = 0.21
Density of air = 1.2
No. of Hours of oxygenation = 12 Hrs
Air Requirement = 75.23 m3 of 02 / Hr.
Diffuser Efficiency = 15%
Therefore air requirement for Aeration tank = 501.54 m3 / Hr
Air requirement for EQT, SHT and TWT = 200 m3 / Hr
Total Air requirement = 700 m3 / Hr
Air Blower Provided
For Equalization Tank / Sludge Holding tank
and Treated water tank = 200 m3 / Hr (1W+1S)
For SBR Reactor = 500 m3 / Hr (1W+1S)
Note: for SBR Reactor when blower is working for one reactor it is not working for the other.
5. Decant Tank: Design Flow = 325cu.m/day
No of cycles per reactor = 3 Nos
No of Reactors = 1 Nos
Required Volume of Decant Tank = 107.25 m3
Provide 10% Additional = 117.975 m3
Volume of Decant Tank Provided = 120.00 m3
Dimension of Decant Tank = 44.44 Sqm x 2.7m (SWD)
6. Pressure Sand Filter:
Flow = 325cu.m /day
Loading rate = 22 Cumec/Sqm./Hr
Quantity = 1 No
Considering the operation of 16 hours of filtration
Provide a Dual Media Filter of 1650mm dia x 1875mm HOS with Graded River Sand as media over layer, under drainpipe,
laterals face piping etc.,
7. Activated Carbon Filter:
Flow = 325cu.m /day
Loading rate = 25 Cumec/Sqm./Hr
Quantity = 1 No
Considering the operation of 16 hours of filtration
Provide a Activated Carbon Filter of 1650mm dia x 1875mm HOS with Activated carbon as media over layer, under
drainpipe, laterals face piping etc.
8. Chlorination:
The filtered water is further chlorinated through an online automatic chlorination system with electronic dosing pump
for disinfection. Provide 1 nos. 100 Lts capacity automatic Chlorinator with electronic metering pump to ensure the
NOVEL Engineering Consultants Pvt. Ltd.
\
MOEF REPORT
OF 4
residual chlorine level to be less than 2 PPM for disinfect ion so that it will not affect the plantations. The Chlorinator shall
be coupled with the filter outlet.
9. Treated Water Tank:
Volume required for the Treated water tank is 60% of the total plant volume
Hence, required volume of the Treated Water Tank = 195 m3
The Treated Water Tank Provided = 250 m3
Dimension of the Treated Water Tank =2.50 sqm x 4.0m (SWD)
10. Sludge Holding Tank:
Volume required for the Sludge Holding Tank is 10% of the total plant volume.
Volume of the Tank = 33 m3
Provided Volume = 40m3
Dimension of the Tank = 10.00 sqm x 4.0M (SWD)
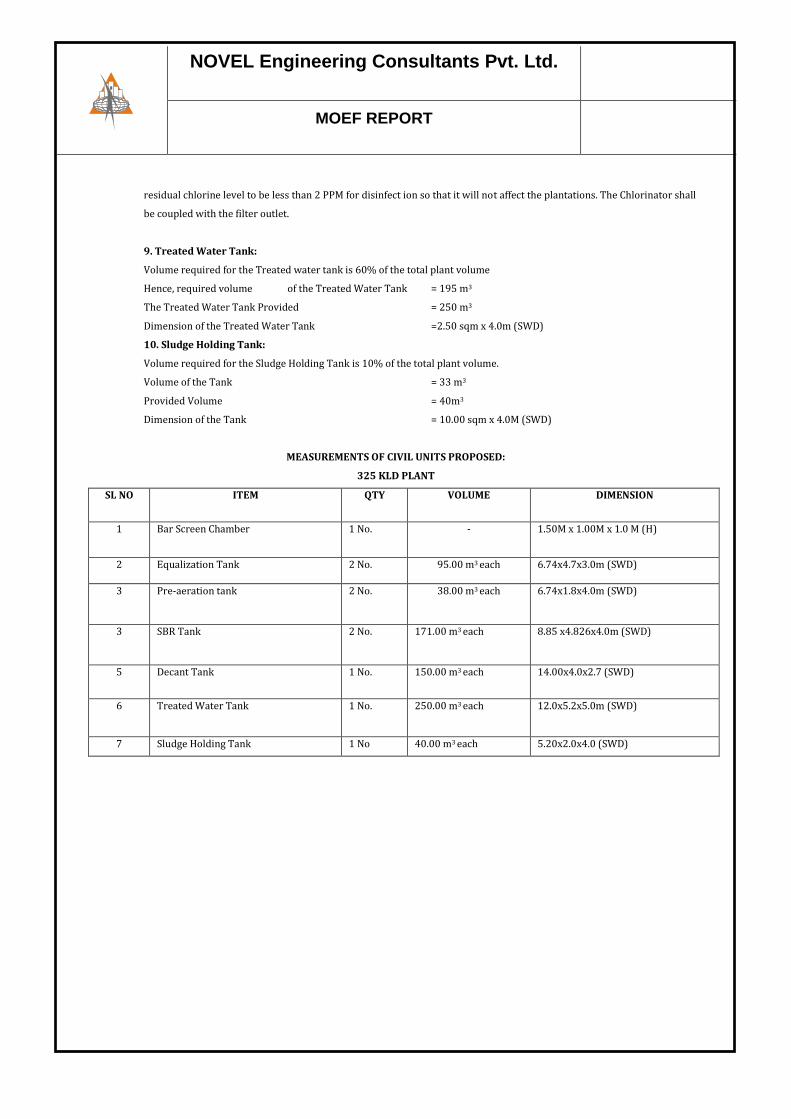
MEASUREMENTS OF CIVIL UNITS PROPOSED:
325 KLD PLANT
SL NO ITEM QTY VOLUME DIMENSION
1 Bar Screen Chamber 1 No. - 1.50M x 1.00M x 1.0 M (H)
2 Equalization Tank 2 No. 95.00 m3 each 6.74x4.7x3.0m (SWD)
3 Pre-aeration tank 2 No. 38.00 m3 each 6.74x1.8x4.0m (SWD)
3 SBR Tank 2 No. 171.00 m3 each 8.85 x4.826x4.0m (SWD)
5 Decant Tank 1 No. 150.00 m3 each 14.00x4.0x2.7 (SWD)
6 Treated Water Tank 1 No. 250.00 m3 each 12.0x5.2x5.0m (SWD)
7 Sludge Holding Tank 1 No 40.00 m3 each 5.20x2.0x4.0 (SWD)
TRAFFIC IMPACT ASSESSMENT STUDIES FOR
PROPOSED IT OFFICE BUILDING
AT SY. NOS. 44(P), 46(P) & 47(P), ELECTRONIC CITY 2ND PHASE,
KONAPPANA AGRAHARA VILLAGE, BEGUR HOBLI, BENGALURU SOUTH TALUK,
BENGALURU.
Prepared by,
Prof. M N SREEHARI
Vijayanagar, Bengaluru-40
Email:[email protected]
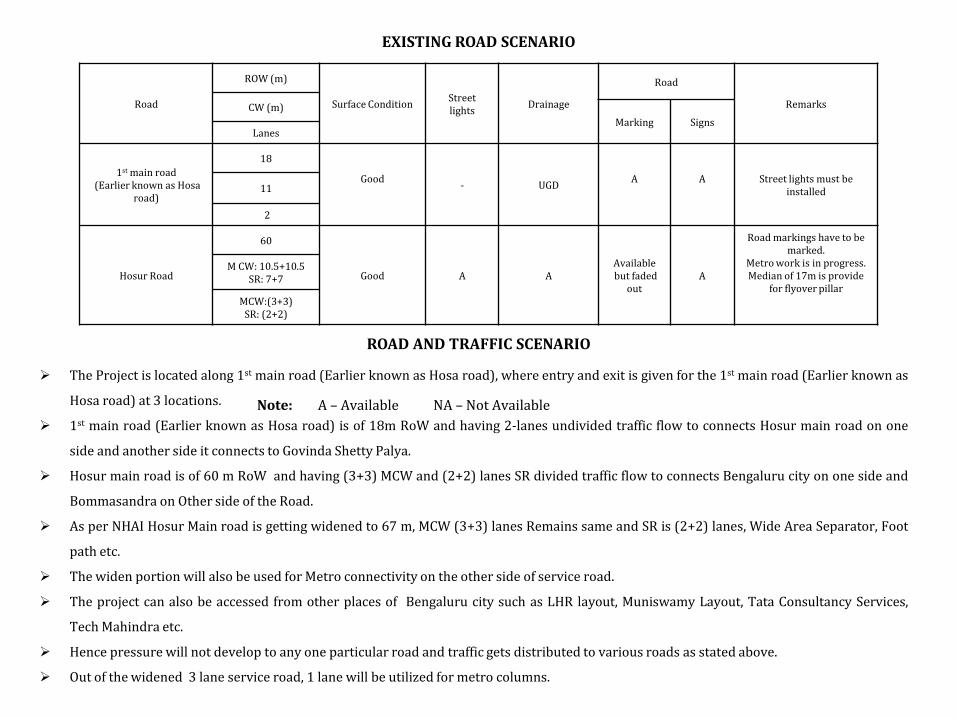
EXISTING ROAD SCENARIO
Note: A – Available NA – Not Available
Road
ROW (m)
Surface Condition Street lights
Drainage
Road
Remarks CW (m)
Marking Signs Lanes
1st main road (Earlier known as Hosa
road)
18
Good
- UGD A
A
Street lights must be installed 11
2
Hosur Road
60
Good A A Available but faded
out A
Road markings have to be marked.
Metro work is in progress. Median of 17m is provide
for flyover pillar
M CW: 10.5+10.5 SR: 7+7
MCW:(3+3) SR: (2+2)
The Project is located along 1st main road (Earlier known as Hosa road), where entry and exit is given for the 1st main road (Earlier known as
Hosa road) at 3 locations.
1st main road (Earlier known as Hosa road) is of 18m RoW and having 2-lanes undivided traffic flow to connects Hosur main road on one
side and another side it connects to Govinda Shetty Palya.
Hosur main road is of 60 m RoW and having (3+3) MCW and (2+2) lanes SR divided traffic flow to connects Bengaluru city on one side and
Bommasandra on Other side of the Road.
As per NHAI Hosur Main road is getting widened to 67 m, MCW (3+3) lanes Remains same and SR is (2+2) lanes, Wide Area Separator, Foot
path etc.
The widen portion will also be used for Metro connectivity on the other side of service road.
The project can also be accessed from other places of Bengaluru city such as LHR layout, Muniswamy Layout, Tata Consultancy Services,
Tech Mahindra etc.
Hence pressure will not develop to any one particular road and traffic gets distributed to various roads as stated above.
Out of the widened 3 lane service road, 1 lane will be utilized for metro columns.
ROAD AND TRAFFIC SCENARIO

SPEED SPECTRUM FOR THE STUDY ROAD (KMPH)
Road Towards 2 Wh 3 Wh 4 Wh (C,J,V) TT
Buses/
Lorries
Max Min Max Min Max Min Max Min Max Min
1st main road (Earlier known as Hosa road)
(2-lanes Undivided)
37 34 28 16 46 27 21 16 19 14
Hosur Road
Hosur (MCW 3-lanes)
42 37 24 18 49 41 31 25 29 23
Hosur (SR 2-lanes)
29 26 21 15 40 33 23 21 21 19
Bengaluru City
(MCW 3-lanes) 46 37 23 19 44 37 32 26 30 24
Bengaluru City
(SR 2-lanes) 39 30 26 20 32 28 24 21 22 19
REAL TIME TRAFFIC SCENARIO ALONG 1ST MAIN ROAD (2 LANES UNDIVIDED)
Note: The highest peak observed is 956 PCU’s/hr as per IRC-106:1990 during 9:00 am to10:00 am.
Time 2Wh 3Wh 4Wh B/L TT Total V/C 7:00-8:00am 159(80) 27(20) 97(97) 6(12) 17(51) 306(260) 0.12
8:00-9:00 426(213) 59(44) 229(229) 17(34) 28(84) 759(604) 0.27
9:00-10:00 623(312) 89(67) 352(352) 29(58) 56(168) 1149(956) 0.43
10:00-11:00 463(232) 61(46) 374(374) 9(18) 45(135) 952(804) 0.37
4:00-5:00pm 403(202) 48(36) 162(162) 7(14) 25(75) 645(489) 0.22
5:00-6:00 557(279) 64(48) 298(298) 31(62) 38(114) 988(801) 0.36
6:00-7:00 639(320) 57(43) 348(348) 15(30) 46(138) 1105(878) 0.40
7:00-8:00 576(288) 47(35) 301(301) 4(8) 41(123) 969(755) 0.34
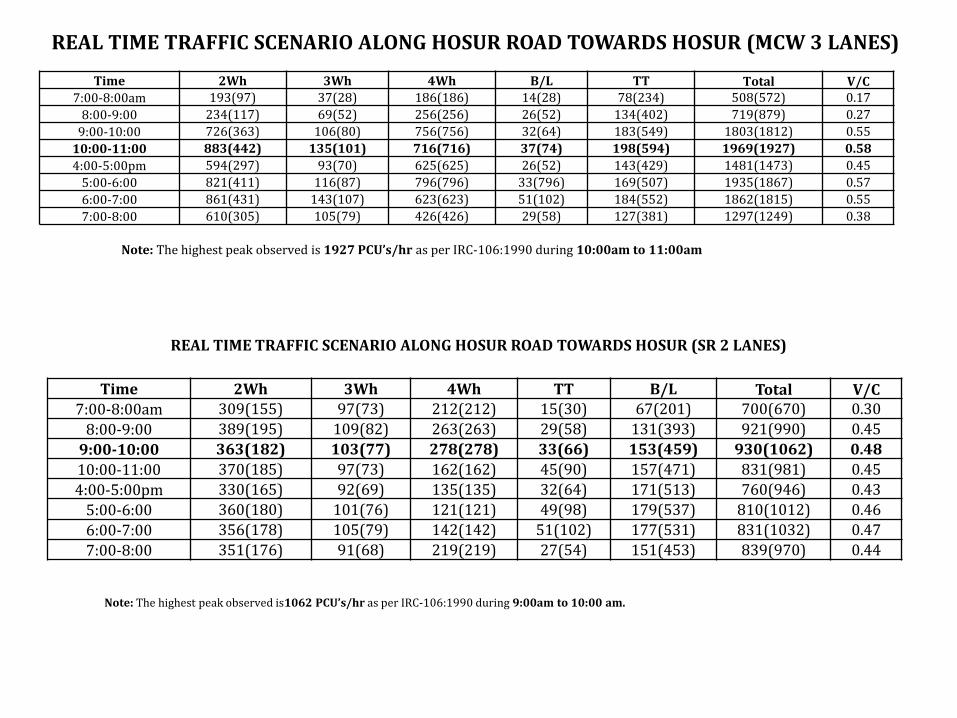
REAL TIME TRAFFIC SCENARIO ALONG HOSUR ROAD TOWARDS HOSUR (MCW 3 LANES)
Note: The highest peak observed is 1927 PCU’s/hr as per IRC-106:1990 during 10:00am to 11:00am
Time 2Wh 3Wh 4Wh B/L TT Total V/C 7:00-8:00am 193(97) 37(28) 186(186) 14(28) 78(234) 508(572) 0.17
8:00-9:00 234(117) 69(52) 256(256) 26(52) 134(402) 719(879) 0.27
9:00-10:00 726(363) 106(80) 756(756) 32(64) 183(549) 1803(1812) 0.55
10:00-11:00 883(442) 135(101) 716(716) 37(74) 198(594) 1969(1927) 0.58
4:00-5:00pm 594(297) 93(70) 625(625) 26(52) 143(429) 1481(1473) 0.45
5:00-6:00 821(411) 116(87) 796(796) 33(796) 169(507) 1935(1867) 0.57
6:00-7:00 861(431) 143(107) 623(623) 51(102) 184(552) 1862(1815) 0.55
7:00-8:00 610(305) 105(79) 426(426) 29(58) 127(381) 1297(1249) 0.38
REAL TIME TRAFFIC SCENARIO ALONG HOSUR ROAD TOWARDS HOSUR (SR 2 LANES)
Note: The highest peak observed is1062 PCU’s/hr as per IRC-106:1990 during 9:00am to 10:00 am.
Time 2Wh 3Wh 4Wh TT B/L Total V/C 7:00-8:00am 309(155) 97(73) 212(212) 15(30) 67(201) 700(670) 0.30
8:00-9:00 389(195) 109(82) 263(263) 29(58) 131(393) 921(990) 0.45
9:00-10:00 363(182) 103(77) 278(278) 33(66) 153(459) 930(1062) 0.48
10:00-11:00 370(185) 97(73) 162(162) 45(90) 157(471) 831(981) 0.45
4:00-5:00pm 330(165) 92(69) 135(135) 32(64) 171(513) 760(946) 0.43
5:00-6:00 360(180) 101(76) 121(121) 49(98) 179(537) 810(1012) 0.46
6:00-7:00 356(178) 105(79) 142(142) 51(102) 177(531) 831(1032) 0.47
7:00-8:00 351(176) 91(68) 219(219) 27(54) 151(453) 839(970) 0.44
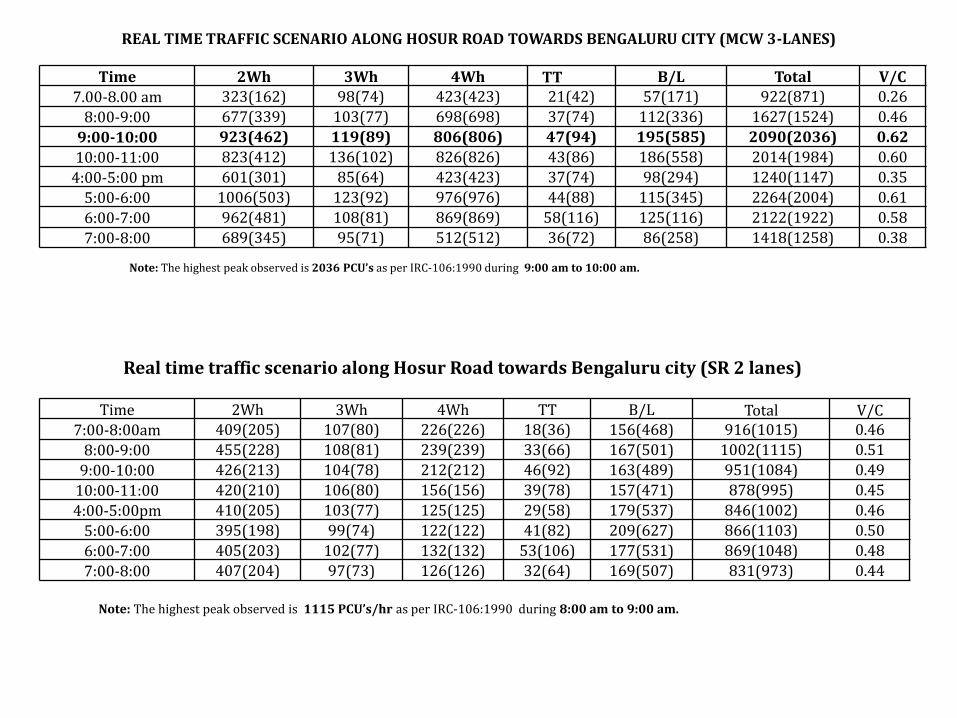
REAL TIME TRAFFIC SCENARIO ALONG HOSUR ROAD TOWARDS BENGALURU CITY (MCW 3-LANES)
Note: The highest peak observed is 2036 PCU’s as per IRC-106:1990 during 9:00 am to 10:00 am.
Time 2Wh 3Wh 4Wh TT B/L Total V/C
7.00-8.00 am 323(162) 98(74) 423(423) 21(42) 57(171) 922(871) 0.26
8:00-9:00 677(339) 103(77) 698(698) 37(74) 112(336) 1627(1524) 0.46
9:00-10:00 923(462) 119(89) 806(806) 47(94) 195(585) 2090(2036) 0.62
10:00-11:00 823(412) 136(102) 826(826) 43(86) 186(558) 2014(1984) 0.60
4:00-5:00 pm 601(301) 85(64) 423(423) 37(74) 98(294) 1240(1147) 0.35
5:00-6:00 1006(503) 123(92) 976(976) 44(88) 115(345) 2264(2004) 0.61
6:00-7:00 962(481) 108(81) 869(869) 58(116) 125(116) 2122(1922) 0.58
7:00-8:00 689(345) 95(71) 512(512) 36(72) 86(258) 1418(1258) 0.38
Real time traffic scenario along Hosur Road towards Bengaluru city (SR 2 lanes)
Note: The highest peak observed is 1115 PCU’s/hr as per IRC-106:1990 during 8:00 am to 9:00 am.
Time 2Wh 3Wh 4Wh TT B/L Total V/C 7:00-8:00am 409(205) 107(80) 226(226) 18(36) 156(468) 916(1015) 0.46
8:00-9:00 455(228) 108(81) 239(239) 33(66) 167(501) 1002(1115) 0.51
9:00-10:00 426(213) 104(78) 212(212) 46(92) 163(489) 951(1084) 0.49
10:00-11:00 420(210) 106(80) 156(156) 39(78) 157(471) 878(995) 0.45
4:00-5:00pm 410(205) 103(77) 125(125) 29(58) 179(537) 846(1002) 0.46
5:00-6:00 395(198) 99(74) 122(122) 41(82) 209(627) 866(1103) 0.50
6:00-7:00 405(203) 102(77) 132(132) 53(106) 177(531) 869(1048) 0.48
7:00-8:00 407(204) 97(73) 126(126) 32(64) 169(507) 831(973) 0.44
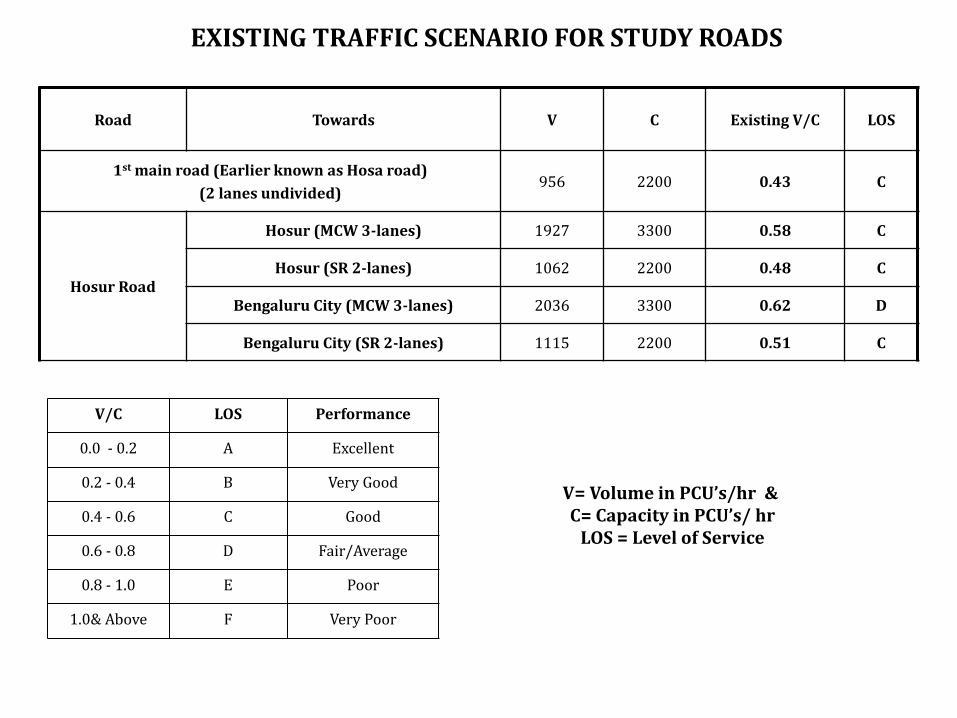
V= Volume in PCU’s/hr & C= Capacity in PCU’s/ hr
LOS = Level of Service
V/C LOS Performance
0.0 - 0.2 A Excellent
0.2 - 0.4 B Very Good
0.4 - 0.6 C Good
0.6 - 0.8 D Fair/Average
0.8 - 1.0 E Poor
1.0& Above F Very Poor
EXISTING TRAFFIC SCENARIO FOR STUDY ROADS
Road Towards V C Existing V/C LOS
1st main road (Earlier known as Hosa road)
(2 lanes undivided) 956 2200 0.43 C
Hosur Road
Hosur (MCW 3-lanes) 1927 3300 0.58 C
Hosur (SR 2-lanes) 1062 2200 0.48 C
Bengaluru City (MCW 3-lanes) 2036 3300 0.62 D
Bengaluru City (SR 2-lanes) 1115 2200 0.51 C
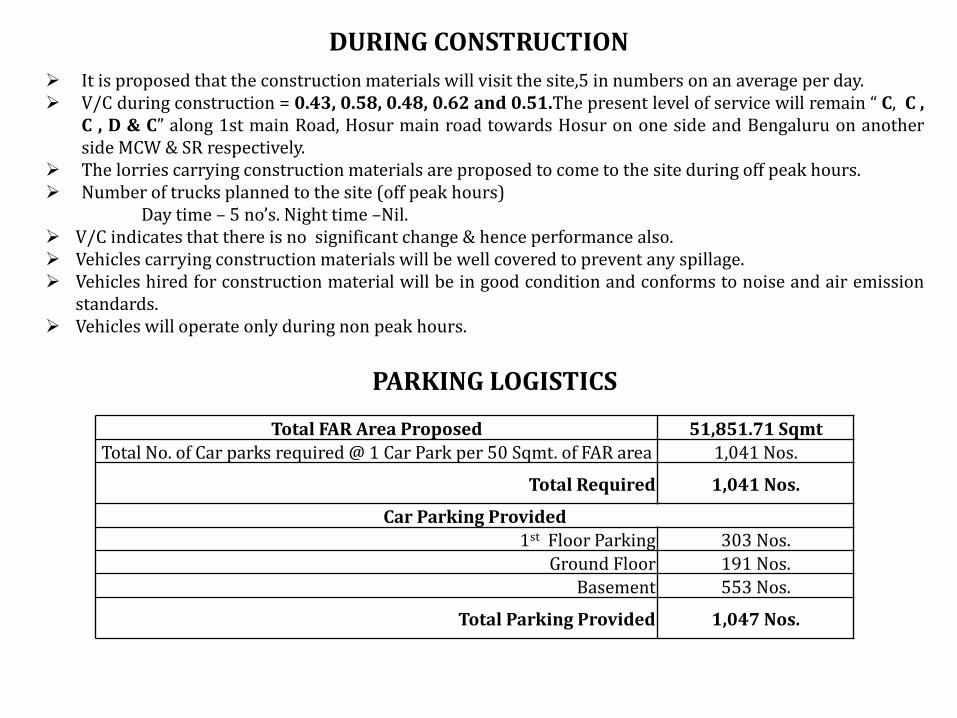
It is proposed that the construction materials will visit the site,5 in numbers on an average per day. V/C during construction = 0.43, 0.58, 0.48, 0.62 and 0.51.The present level of service will remain “ C, C ,
C , D & C” along 1st main Road, Hosur main road towards Hosur on one side and Bengaluru on another side MCW & SR respectively.
The lorries carrying construction materials are proposed to come to the site during off peak hours. Number of trucks planned to the site (off peak hours) Day time – 5 no’s. Night time –Nil. V/C indicates that there is no significant change & hence performance also. Vehicles carrying construction materials will be well covered to prevent any spillage. Vehicles hired for construction material will be in good condition and conforms to noise and air emission
standards. Vehicles will operate only during non peak hours.
DURING CONSTRUCTION
PARKING LOGISTICS
Total FAR Area Proposed 51,851.71 Sqmt
Total No. of Car parks required @ 1 Car Park per 50 Sqmt. of FAR area 1,041 Nos.
Total Required 1,041 Nos.
Car Parking Provided
1st Floor Parking 303 Nos.
Ground Floor 191 Nos.
Basement 553 Nos.
Total Parking Provided 1,047 Nos.

FLOW CHART OF TRAFFIC/ TRIPS DISTRIBUTION
1st Main Road (Earlier known as Hosa road)
100 %= 116
Towards electronic city phase II
80% = 93
Towards Govinda Shetty palya
20% = 23
Towards Hosur
15% =17
Towards Bengaluru
65% = 76
Towards Hosur Road 80% = 93
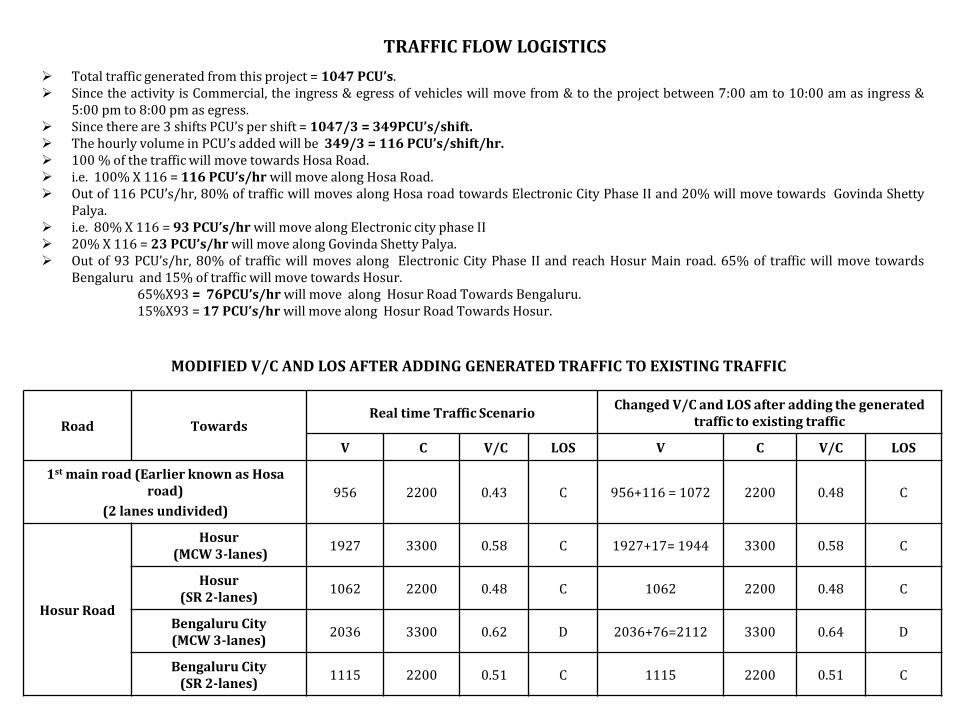
TRAFFIC FLOW LOGISTICS
Total traffic generated from this project = 1047 PCU’s. Since the activity is Commercial, the ingress & egress of vehicles will move from & to the project between 7:00 am to 10:00 am as ingress &
5:00 pm to 8:00 pm as egress. Since there are 3 shifts PCU’s per shift = 1047/3 = 349PCU’s/shift. The hourly volume in PCU’s added will be 349/3 = 116 PCU’s/shift/hr. 100 % of the traffic will move towards Hosa Road. i.e. 100% X 116 = 116 PCU’s/hr will move along Hosa Road. Out of 116 PCU’s/hr, 80% of traffic will moves along Hosa road towards Electronic City Phase II and 20% will move towards Govinda Shetty
Palya. i.e. 80% X 116 = 93 PCU’s/hr will move along Electronic city phase II 20% X 116 = 23 PCU’s/hr will move along Govinda Shetty Palya. Out of 93 PCU’s/hr, 80% of traffic will moves along Electronic City Phase II and reach Hosur Main road. 65% of traffic will move towards
Bengaluru and 15% of traffic will move towards Hosur. 65%X93 = 76PCU’s/hr will move along Hosur Road Towards Bengaluru. 15%X93 = 17 PCU’s/hr will move along Hosur Road Towards Hosur.
MODIFIED V/C AND LOS AFTER ADDING GENERATED TRAFFIC TO EXISTING TRAFFIC
Road Towards Real time Traffic Scenario
Changed V/C and LOS after adding the generated traffic to existing traffic
V C V/C LOS V C V/C LOS
1st main road (Earlier known as Hosa road)
(2 lanes undivided)
956 2200 0.43 C 956+116 = 1072 2200 0.48 C
Hosur Road
Hosur (MCW 3-lanes)
1927 3300 0.58 C 1927+17= 1944 3300 0.58 C
Hosur (SR 2-lanes)
1062 2200 0.48 C 1062 2200 0.48 C
Bengaluru City (MCW 3-lanes)
2036 3300 0.62 D 2036+76=2112 3300 0.64 D
Bengaluru City (SR 2-lanes)
1115 2200 0.51 C 1115 2200 0.51 C
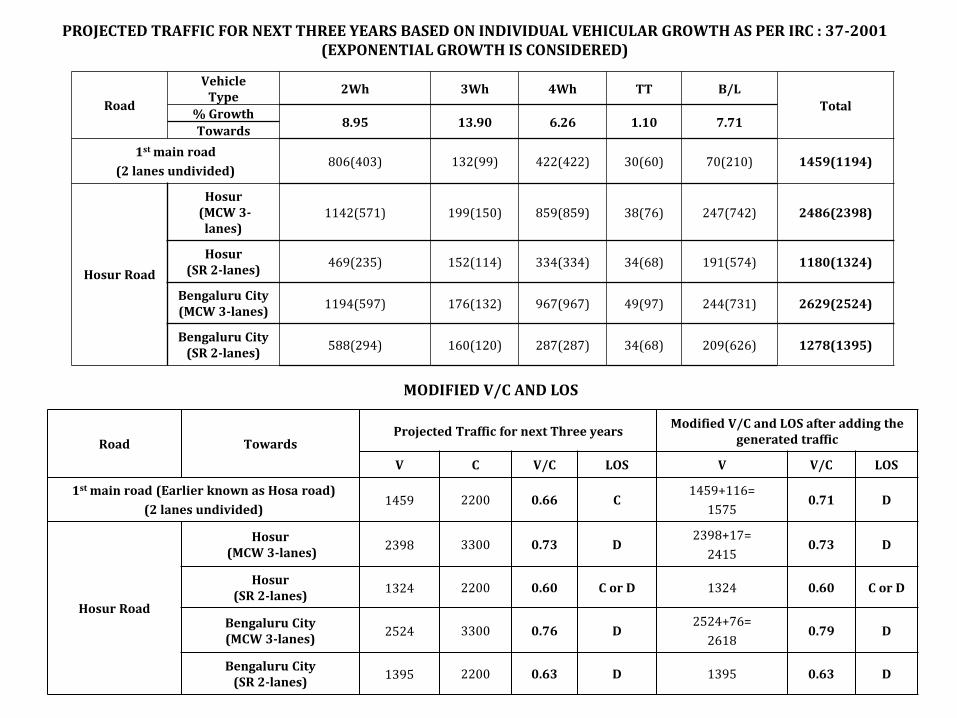
PROJECTED TRAFFIC FOR NEXT THREE YEARS BASED ON INDIVIDUAL VEHICULAR GROWTH AS PER IRC : 37-2001 (EXPONENTIAL GROWTH IS CONSIDERED)
Road
Vehicle Type
2Wh 3Wh 4Wh TT B/L
Total % Growth
8.95 13.90 6.26 1.10 7.71 Towards
1st main road
(2 lanes undivided) 806(403) 132(99) 422(422) 30(60) 70(210) 1459(1194)
Hosur Road
Hosur (MCW 3-
lanes) 1142(571) 199(150) 859(859) 38(76) 247(742) 2486(2398)
Hosur (SR 2-lanes)
469(235) 152(114) 334(334) 34(68) 191(574) 1180(1324)
Bengaluru City (MCW 3-lanes)
1194(597) 176(132) 967(967) 49(97) 244(731) 2629(2524)
Bengaluru City (SR 2-lanes)
588(294) 160(120) 287(287) 34(68) 209(626) 1278(1395)
MODIFIED V/C AND LOS
Road Towards Projected Traffic for next Three years
Modified V/C and LOS after adding the generated traffic
V C V/C LOS V V/C LOS
1st main road (Earlier known as Hosa road)
(2 lanes undivided) 1459 2200 0.66 C
1459+116=
1575 0.71 D
Hosur Road
Hosur (MCW 3-lanes)
2398 3300 0.73 D 2398+17=
2415 0.73 D
Hosur (SR 2-lanes)
1324 2200 0.60 C or D 1324 0.60 C or D
Bengaluru City (MCW 3-lanes)
2524 3300 0.76 D 2524+76=
2618 0.79 D
Bengaluru City (SR 2-lanes)
1395 2200 0.63 D 1395 0.63 D
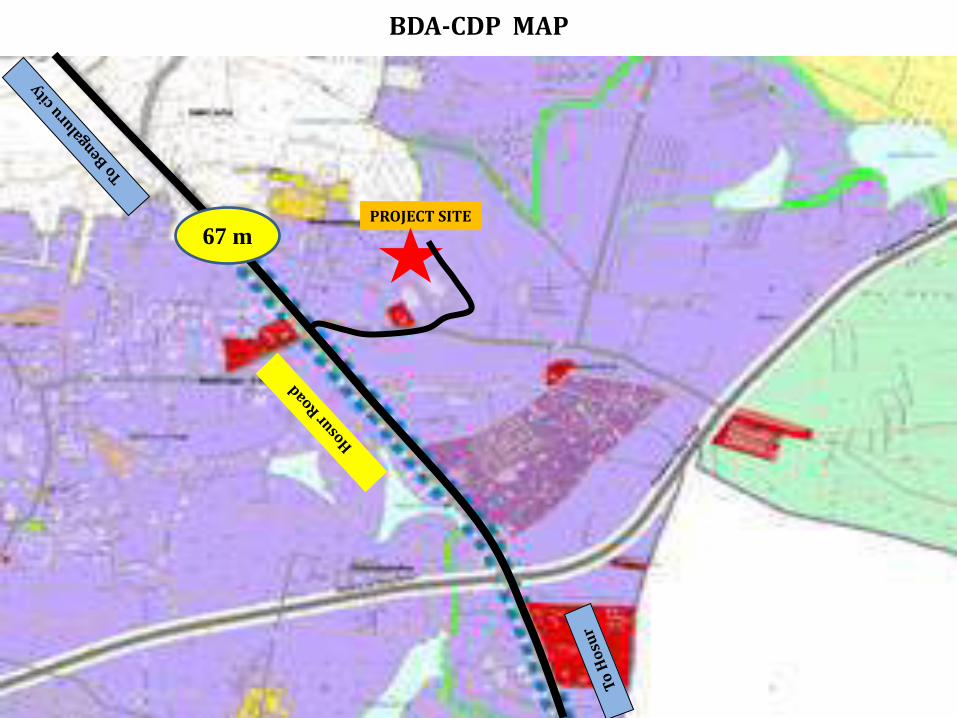
BDA-CDP MAP
67 m PROJECT SITE

As per BDA- CDP, Hosur Road is getting widened to 67 m RoW facilitating (3+3) lanes MCW and (2+2) SR.
Out of the widened 3 lane service road ( towards Bengaluru city), 1 lane will be utilized for metro
columns.
CHANGED SCENARIO (ROAD WIDENING)
Road Towards
Modified V/C and LOS after adding generated traffic
Changed Scenario-1 after widening
V C V/C LOS V C V/C LOS
1st main road (Earlier known as Hosa road)
1575 2200 0.71 D 1575 2200 0.71 D
Hosur Road
Hosur (MCW)
2415 3300 0.73 D 2415 3300 0.73 D
Hosur (SR)
1324 2200 0.60 C or D 1324 2200 0.60 C or D
Bengaluru City (MCW)
2618 3300 0.79 D 2618 3300 0.79 D
Bengaluru City (SR)
1395 2200 0.63 D 1395 2200 0.63 D
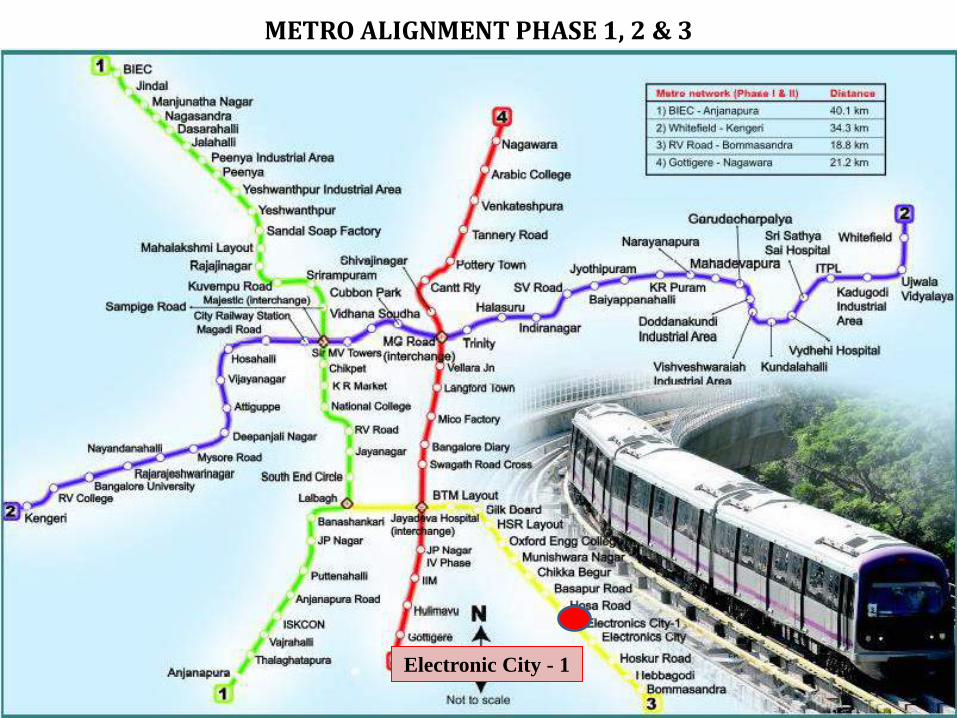
Electronic City - 1
METRO ALIGNMENT PHASE 1, 2 & 3
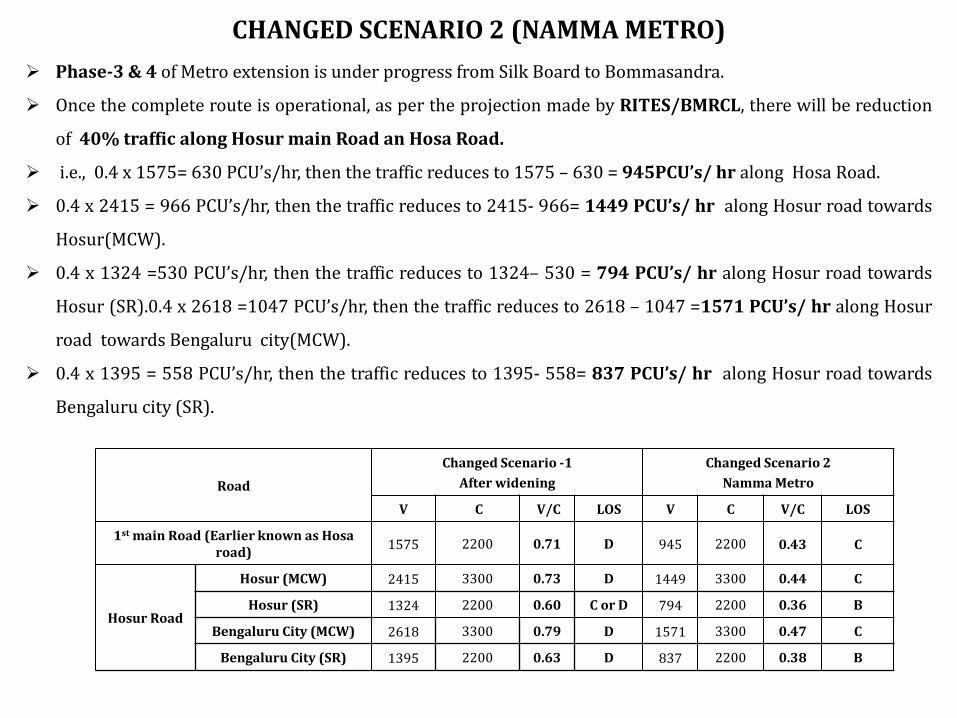
CHANGED SCENARIO 2 (NAMMA METRO)
Phase-3 & 4 of Metro extension is under progress from Silk Board to Bommasandra.
Once the complete route is operational, as per the projection made by RITES/BMRCL, there will be reduction
of 40% traffic along Hosur main Road an Hosa Road.
i.e., 0.4 x 1575= 630 PCU’s/hr, then the traffic reduces to 1575 – 630 = 945PCU’s/ hr along Hosa Road.
0.4 x 2415 = 966 PCU’s/hr, then the traffic reduces to 2415- 966= 1449 PCU’s/ hr along Hosur road towards
Hosur(MCW).
0.4 x 1324 =530 PCU’s/hr, then the traffic reduces to 1324– 530 = 794 PCU’s/ hr along Hosur road towards
Hosur (SR).0.4 x 2618 =1047 PCU’s/hr, then the traffic reduces to 2618 – 1047 =1571 PCU’s/ hr along Hosur
road towards Bengaluru city(MCW).
0.4 x 1395 = 558 PCU’s/hr, then the traffic reduces to 1395- 558= 837 PCU’s/ hr along Hosur road towards
Bengaluru city (SR).
Road
Changed Scenario -1
After widening
Changed Scenario 2
Namma Metro
V C V/C LOS V C V/C LOS
1st main Road (Earlier known as Hosa road)
1575 2200 0.71 D 945 2200 0.43 C
Hosur Road
Hosur (MCW) 2415 3300 0.73 D 1449 3300 0.44 C
Hosur (SR) 1324 2200 0.60 C or D 794 2200 0.36 B
Bengaluru City (MCW) 2618 3300 0.79 D 1571 3300 0.47 C
Bengaluru City (SR) 1395 2200 0.63 D 837 2200 0.38 B
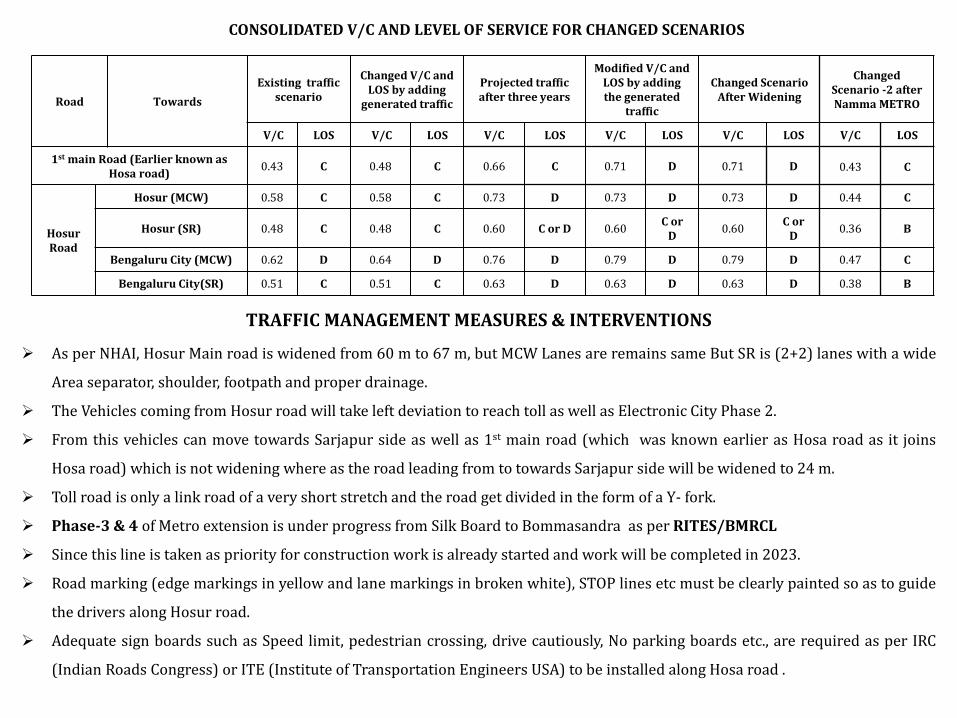
CONSOLIDATED V/C AND LEVEL OF SERVICE FOR CHANGED SCENARIOS
Road Towards
Existing traffic scenario
Changed V/C and LOS by adding
generated traffic
Projected traffic after three years
Modified V/C and LOS by adding the generated
traffic
Changed Scenario After Widening
Changed Scenario -2 after Namma METRO
V/C LOS V/C LOS V/C LOS V/C LOS V/C LOS V/C LOS
1st main Road (Earlier known as Hosa road)
0.43 C 0.48 C 0.66 C 0.71 D 0.71 D 0.43 C
Hosur Road
Hosur (MCW) 0.58 C 0.58 C 0.73 D 0.73 D 0.73 D 0.44 C
Hosur (SR) 0.48 C 0.48 C 0.60 C or D 0.60 C or
D 0.60
C or D
0.36 B
Bengaluru City (MCW) 0.62 D 0.64 D 0.76 D 0.79 D 0.79 D 0.47 C
Bengaluru City(SR) 0.51 C 0.51 C 0.63 D 0.63 D 0.63 D 0.38 B
TRAFFIC MANAGEMENT MEASURES & INTERVENTIONS
As per NHAI, Hosur Main road is widened from 60 m to 67 m, but MCW Lanes are remains same But SR is (2+2) lanes with a wide
Area separator, shoulder, footpath and proper drainage.
The Vehicles coming from Hosur road will take left deviation to reach toll as well as Electronic City Phase 2.
From this vehicles can move towards Sarjapur side as well as 1st main road (which was known earlier as Hosa road as it joins
Hosa road) which is not widening where as the road leading from to towards Sarjapur side will be widened to 24 m.
Toll road is only a link road of a very short stretch and the road get divided in the form of a Y- fork.
Phase-3 & 4 of Metro extension is under progress from Silk Board to Bommasandra as per RITES/BMRCL
Since this line is taken as priority for construction work is already started and work will be completed in 2023.
Road marking (edge markings in yellow and lane markings in broken white), STOP lines etc must be clearly painted so as to guide
the drivers along Hosur road.
Adequate sign boards such as Speed limit, pedestrian crossing, drive cautiously, No parking boards etc., are required as per IRC
(Indian Roads Congress) or ITE (Institute of Transportation Engineers USA) to be installed along Hosa road .
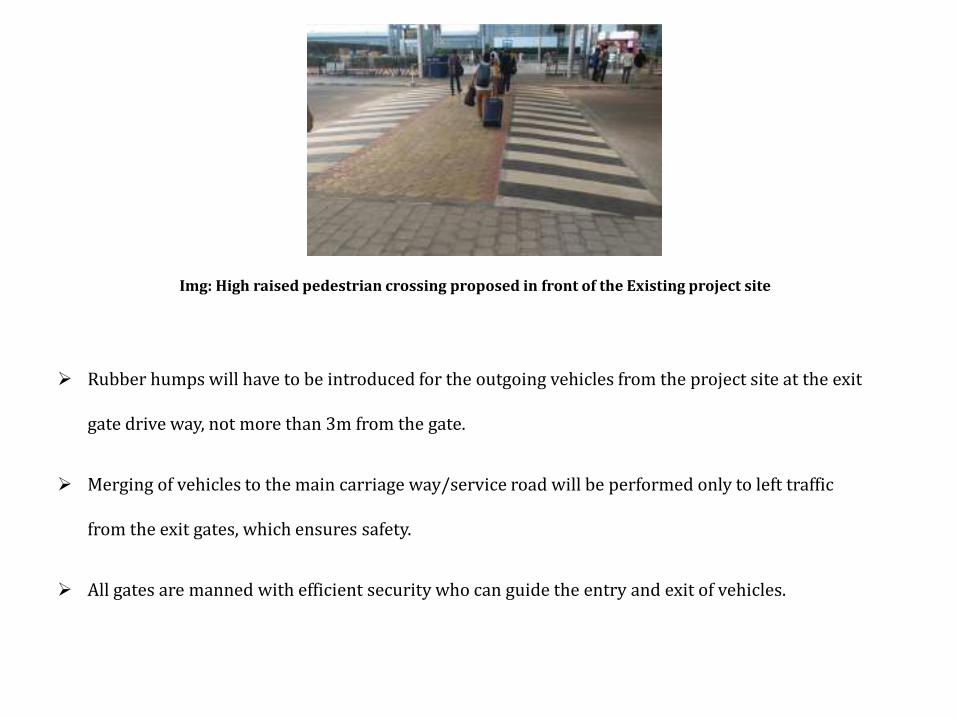
Img: High raised pedestrian crossing proposed in front of the Existing project site
Rubber humps will have to be introduced for the outgoing vehicles from the project site at the exit
gate drive way, not more than 3m from the gate.
Merging of vehicles to the main carriage way/service road will be performed only to left traffic
from the exit gates, which ensures safety.
All gates are manned with efficient security who can guide the entry and exit of vehicles.
PROJECT NO : 7411
PROJECT NAME : Proposed IT Office Building
1. INTRODUCTION
M/s. Darshita Housing Private Limited are proposing to IT Office Building
B+G+13 FLOORS. At Sy. Nos. 44(P), 46(P) & 47(P), Electronic City 2nd Phase,
Konappana Agrahara Village, Begur Hobli, Bengaluru South Taluk, Bengaluru. Soil
Exploration work was referred to this firm by M/s. Darshita Housing Private Limited,
with a view to determining the soil properties of the area and to arrive at the most
suitable foundation system for the proposed structure. For this purpose nine boreholes
were bored upto a depth varying from 18.0M below ground level. The boreholes were
terminated after drilling for the required depth in the medium rock layer. The
boreholes locations are given in Fig.1. The work comprised of conducting Standard
Penetration Tests in the field and collecting samples for testing in the laboratory. The
report presents the details of the work, analysis of test results and foundation
recommendations made based on the analysis.
2.EXPLORATION TECHNIQUE
Rotary Drilling technique was adopted for boring in this area. Casing
pipes and bentonite slurry were used to protect the sides of the boreholes. Standard
Penetration Tests were conducted at change of layers and at specified intervals
Disturbed samples were collected in plastic bags from all the layers for visual
observation and classification tests. Undisturbed samples could not be collected since
the soil layers met with were essentially cohesionless in nature. Core samples were
collected from medium rock layers.
P.N. 7411
2
3.SOIL PROFILE
The profile of the area as observed in the boreholes is given in Figs. 2 to
10. The top soil of 0.5M is filling. The underlying layer is laterite upto 2.0 to 5.5M
followed by disintegrated rock. The medium rock appearing at depths varying from
11.0M to over 18.0M below ground level. No water table was met with in the boreholes
below ground level at the time of exploration. However, water table could rise to 1 to
2M below ground level during rainy season.
4. ANALYSIS OF TEST RESULTS
1. Standard Penetration Test
2. Grain Size Analysis
3 Determination of Specific Gravity
4 Crushing strength of Rock
An analysis of the results of these tests were presented in this section of the
report.
4.1 Standard Penetration Test
These tests were conducted at change of layers and at specified intervals,
commencing the test at 1.5 M below ground level. The results are presented
graphically in Figs. 2 to 10. The relative density of the cohesionless layers obtained
from the N values are given in the bore logs.
4. 2 Grain Size Analysis
Combined sieve and hydrometer analyses were conducted on the various
samples collected. The results are given in Table-1. Based on the proportion of the
different soil constituents, the soil is classified using the Triangular Chart .
4.3 Determination of Specific Gravity
The specific gravities of the soil grains were determined from the various
samples collected. The results are given in Table-1. No abnormal value is noted in the
test results.
4.4 Crushing Strength of Rock
Core samples collected from medium rock layers were tested for
determining crushing strength of rock. The results are given in Table -2.

P.N. 7411
3
5. FOUNDATION ANALYSIS
5.1 Shallow Foundations
For the proposed structure shallow foundations can be given at any
depth from 1.5M, resting the foundation on the laterite/ disintegrated rock layer.
The safe bearing capacity of these cohesionless layers could be computed
using the formula,
Qa = (0.5 x B x N + DfNq) 2.5
Where,
B = Width of footing
= Submerged unit weight of soil
taken as 1 gm/cc,
Df = Depth of surcharge
N Nq = Bearing capacity factors based
on the N values taken from Fig-11
Based on the above, the SBC that could be followed are as follows for a
minimum width of foundation of 1 M.
Depth
(M)
SBC
(kg/cm^2)
Without
Basement
With
Basement
1.5 1.5
3.0 2.0 2.5
4.5 3.0 4.0
6.0 to 11.0 Limited to 5.0
Below
11.0
Limited to 7.5
When the foundations are placed fully on the medium rock layer, the SBC
that could be adopted is 10.0 kg/cm^2 based on the crushing strength of rock.
The settlement of the foundations would be within 25mm
P.N. 7411
4
Over excavation in the foundation trenches should be refilled by concrete of
adequate grade according to SBC.
6. MODULUS OF SUB-GRADE REACTION
The k values under submerged condition are as follows
Depth
(m)
Kg/cm^3
1.8 1.5
3.0 to 6.0 2.5
6.0 down 5.0
7. EXCAVATION PROCEDURE
1. Vertical cuts could be given for excavation. In the weak laterite
formation slope of 1½ vertical to 1 horizontal may be given.
2. Normal excavators would be required for excavation
3. Slush formed by any water accumulation should be removed and
refilled by lean concrete.
4. If water accumulates in the foundation trenches, dewatering should
be done by pumping out water from a level lower than the foundation level to maintain
downward flow of water.
5 The exposed side of excavation should be covered by plastic sheet
during rainy season and surface drain provided to prevent water from flowing on the
cut surface.
8. CONCLUSIONS
1. The area explored has got top soil of 0.5M is filling. The underlying
layer is laterite upto 2.0 to 5.5M followed by disintegrated rock. The medium rock
appearing at depths varying from 11.0M to over 18.0M below ground level. No water
table was met with in the boreholes below ground level at the time of exploration.
However, water table could rise to 1 to 2M below ground level during rainy season.

P.N. 7411
5
2. For the proposed structure shallow foundations can be given at
any depth from 1.5M, resting the foundation on the laterite/ disintegrated rock layer
with the SBCs suggested for different depths.
3. When the foundations are placed on the medium rock layer, the
SBC that could be adopted is 10.0 kg/cm^2.
4 The settlement of the shallow foundation would be within 25mm.
5. Over excavations in the foundation trenches should be refilled by
concrete of adequate grade according to SBC.
6. Suggested excavation procedure should be adopted while
undertaking the construction.
F.S.ENGINEERS PVT.LTD (Dr. A. Verghese Chummar)
NEW NO.98,(Old No.109) VELACHERY ROAD Director
GUINDY Dated: June 19th, 2019
CHENNAI – 600 032


HYDROLOGICAL STUDY REPORT
FOR
PROPOSED IT OFFICE BUILDING
PROJECT LOCATION
AT SY. NOS. 44(P), 46(P) & 47(P),
ELECTRONIC CITY 2ND PHASE,
KONAPPANA AGRAHARA VILLAGE, BEGUR HOBLI,
BENGALURU SOUTH TALUK,
BENGALURU.
PROPONENT
M/s. DARSHITA HOUSING PVT LTD,
4TH FLOOR, SALARPURIA WINDSOR, NO.3,
ULSOOR ROAD, BENGALURU – 560 042.
PREPARED BY
MR. C.S.RAMASESHA,
EX MEMBER CGWB
BENGALURU,
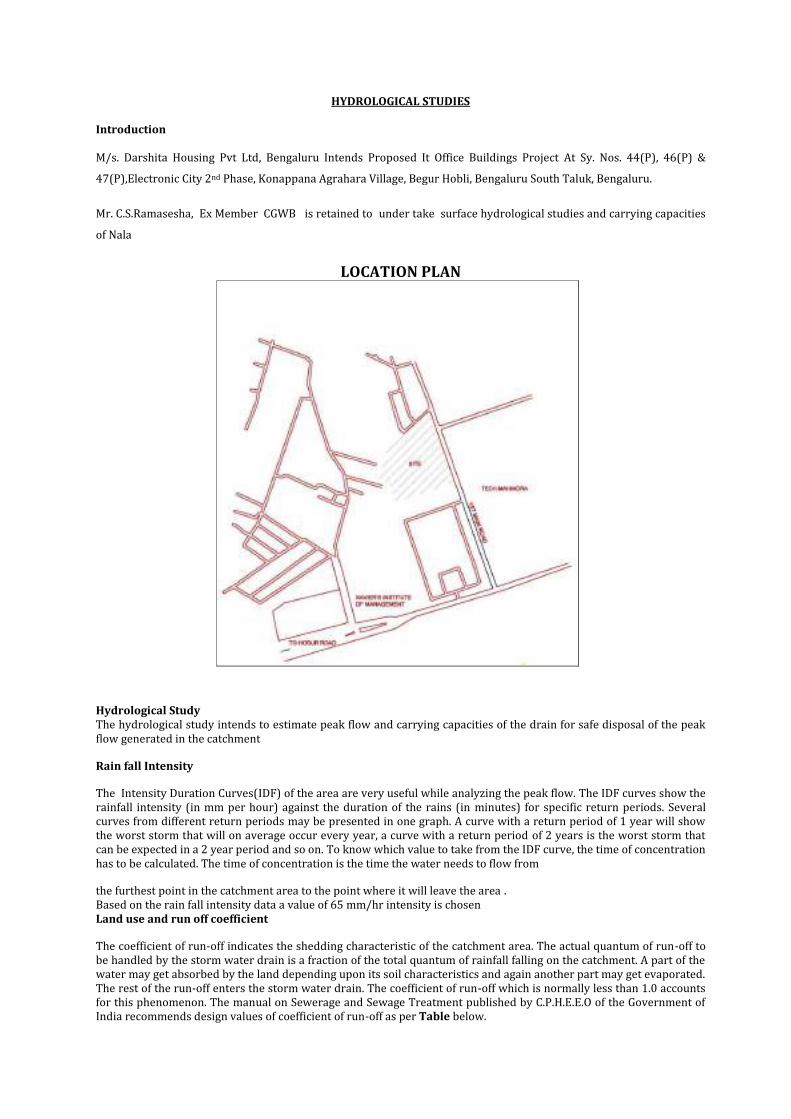
HYDROLOGICAL STUDIES Introduction M/s. Darshita Housing Pvt Ltd, Bengaluru Intends Proposed It Office Buildings Project At Sy. Nos. 44(P), 46(P) &
47(P),Electronic City 2nd Phase, Konappana Agrahara Village, Begur Hobli, Bengaluru South Taluk, Bengaluru.
Mr. C.S.Ramasesha, Ex Member CGWB is retained to under take surface hydrological studies and carrying capacities
of Nala
LOCATION PLAN
Hydrological Study The hydrological study intends to estimate peak flow and carrying capacities of the drain for safe disposal of the peak flow generated in the catchment
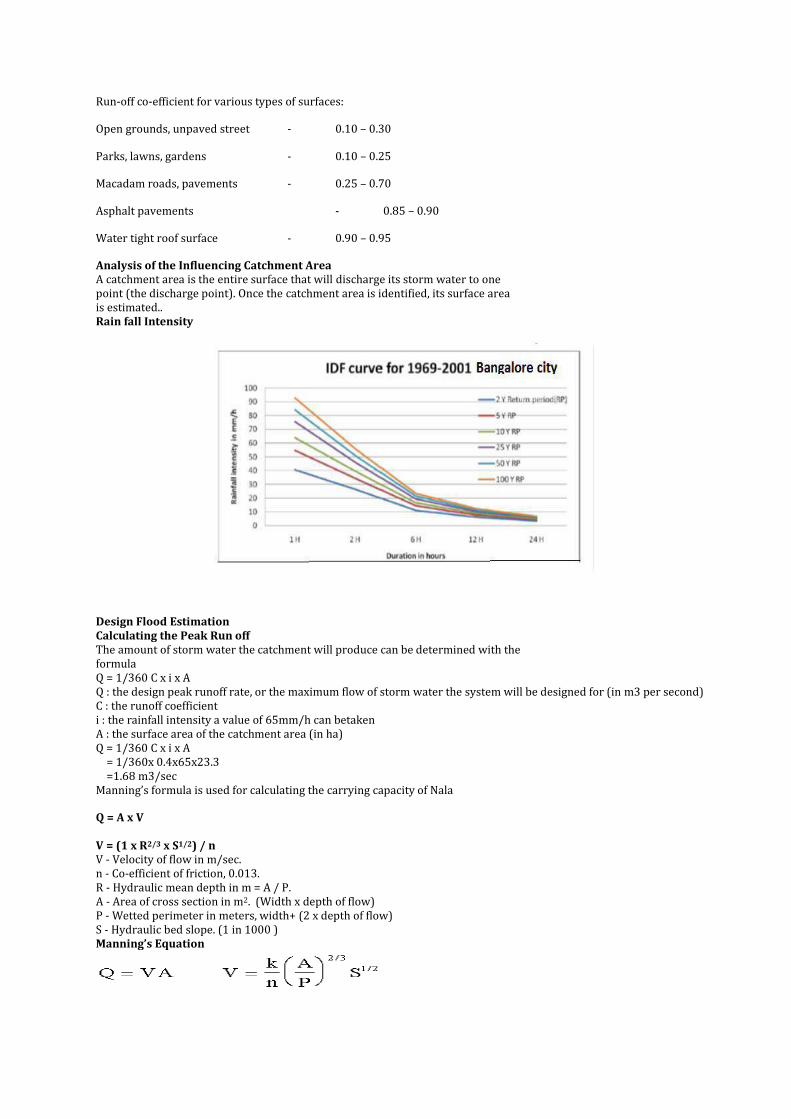
Rain fall Intensity
The Intensity Duration Curves(IDF) of the area are very useful while analyzing the peak flow. The IDF curves show the rainfall intensity (in mm per hour) against the duration of the rains (in minutes) for specific return periods. Several curves from different return periods may be presented in one graph. A curve with a return period of 1 year will show the worst storm that will on average occur every year, a curve with a return period of 2 years is the worst storm that can be expected in a 2 year period and so on. To know which value to take from the IDF curve, the time of concentration has to be calculated. The time of concentration is the time the water needs to flow from
the furthest point in the catchment area to the point where it will leave the area . Based on the rain fall intensity data a value of 65 mm/hr intensity is chosen Land use and run off coefficient
The coefficient of run-off indicates the shedding characteristic of the catchment area. The actual quantum of run-off to be handled by the storm water drain is a fraction of the total quantum of rainfall falling on the catchment. A part of the water may get absorbed by the land depending upon its soil characteristics and again another part may get evaporated. The rest of the run-off enters the storm water drain. The coefficient of run-off which is normally less than 1.0 accounts for this phenomenon. The manual on Sewerage and Sewage Treatment published by C.P.H.E.E.O of the Government of India recommends design values of coefficient of run-off as per Table below.
Run-off co-efficient for various types of surfaces:
Open grounds, unpaved street - 0.10 – 0.30
Parks, lawns, gardens - 0.10 – 0.25
Macadam roads, pavements - 0.25 – 0.70
Asphalt pavements - 0.85 – 0.90
Water tight roof surface - 0.90 – 0.95
Analysis of the Influencing Catchment Area A catchment area is the entire surface that will discharge its storm water to one point (the discharge point). Once the catchment area is identified, its surface area is estimated.. Rain fall Intensity
Design Flood Estimation Calculating the Peak Run off The amount of storm water the catchment will produce can be determined with the formula Q = 1/360 C x i x A Q : the design peak runoff rate, or the maximum flow of storm water the system will be designed for (in m3 per second) C : the runoff coefficient i : the rainfall intensity a value of 65mm/h can betaken A : the surface area of the catchment area (in ha) Q = 1/360 C x i x A = 1/360x 0.4x65x23.3 =1.68 m3/sec Manning’s formula is used for calculating the carrying capacity of Nala
Q = A x V V = (1 x R2/3 x S1/2) / n V - Velocity of flow in m/sec. n - Co-efficient of friction, 0.013. R - Hydraulic mean depth in m = A / P. A - Area of cross section in m2. (Width x depth of flow) P - Wetted perimeter in meters, width+ (2 x depth of flow) S - Hydraulic bed slope. (1 in 1000 ) Manning’s Equation
k is a unit conversion factor: k=1.49 for English units (feet and seconds).
k=1.0 for SI units (meters and seconds). A=Flow area of channel. P=Wetted perimeter. Q=Discharge (flow rate). S=Downward (longitudinal) slope of the channel. V=Average velocity in the channel.
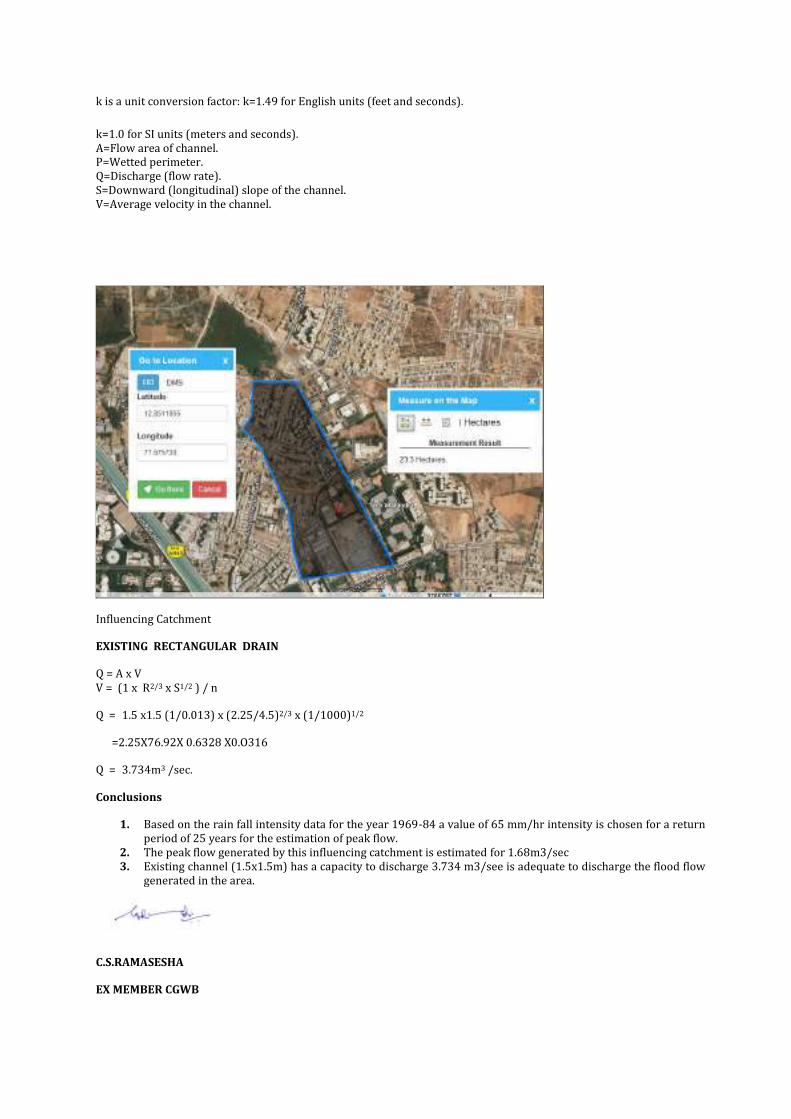
Influencing Catchment
EXISTING RECTANGULAR DRAIN
Q = A x V V = (1 x R2/3 x S1/2 ) / n
Q = 1.5 x1.5 (1/0.013) x (2.25/4.5)2/3 x (1/1000)1/2
=2.25X76.92X 0.6328 X0.O316
Q = 3.734m3 /sec.
Conclusions
1. Based on the rain fall intensity data for the year 1969-84 a value of 65 mm/hr intensity is chosen for a return period of 25 years for the estimation of peak flow.
2. The peak flow generated by this influencing catchment is estimated for 1.68m3/sec 3. Existing channel (1.5x1.5m) has a capacity to discharge 3.734 m3/see is adequate to discharge the flood flow
generated in the area.
C.S.RAMASESHA
EX MEMBER CGWB