
KARTHIK AGRO INDUSTRIES PVT. LTD. - Environmental ...
258
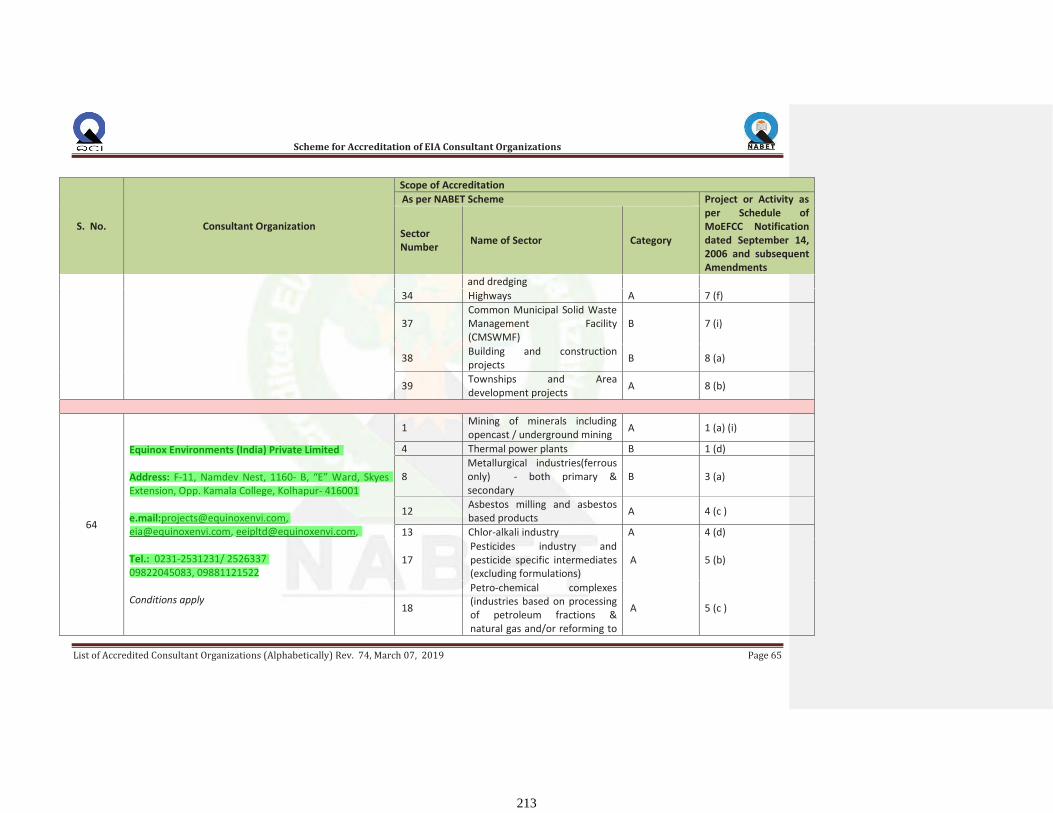
KARTHIK AGRO INDUSTRIES PVT. LTD. HOOLAGERI VILLAGE, TAL.: BADAMI, DIST.: BAGALKOTE, KARNATAKA EQUINOX ENVIRONMENTS (I) PVT. LTD., PREPARED BY ENVIRONMENTAL; CIVIL & CHEMICAL ENGINEERS, CONSULTANTS & ANALYSTS, KOLHAPUR (MS) E-mail: [email protected], [email protected] An ISO 9001:2015 & QCI NABET ACCREDITED ORGANIZATION P-566-KAIPLEIA-DISTILLERY-10-2020 (EIA) REPORT FOR EXPANSION OF 65 KLPD TO 180 KLPD MOLASSES/ GRAIN BASED DISTILLERY BY ENVIRONMENTAL IMPACT ASSESSMENT NOVEMBER - 2021 (Revision - 02)
-
Upload
khangminh22 -
Category
Documents
-
view
2 -
download
0
Transcript of KARTHIK AGRO INDUSTRIES PVT. LTD. - Environmental ...

KARTHIK AGRO INDUSTRIES PVT. LTD.HOOLAGERI VILLAGE, TAL.: BADAMI,
DIST.: BAGALKOTE, KARNATAKA
EQUINOX ENVIRONMENTS (I) PVT. LTD.,
PREPARED BY
ENVIRONMENTAL; CIVIL & CHEMICAL ENGINEERS, CONSULTANTS & ANALYSTS, KOLHAPUR (MS)
E-mail: [email protected], [email protected]
An ISO 9001:2015 & QCI NABET ACCREDITED ORGANIZATION
P-566-KAIPLEIA-DISTILLERY-10-2020
(EIA) REPORT
FOR
EXPANSION OF 65 KLPD TO 180 KLPD MOLASSES/
GRAIN BASED DISTILLERY
BY
ENVIRONMENTAL IMPACT ASSESSMENT
NOVEMBER - 2021
(Revision - 02)


IV
ACKNOWLEDGEMENT I am extremely thankful to the management of Karthik Agro Industries Pvt. Ltd, (KAIPL) located at Hoolageri Village, Taluka: Badami, District :Bagalkote (Karnataka) for entrusting assignments of the EIA studies and Environmental Clearance (EC) procurement in respect of proposed expansion of Distillery. It was indeed a great experience to have interactions, involvement and discussions with the management and technical experts of KAIPL. Their knowledge and co-operation as well as support given during the EIA Report preparation impressed me a lot. Sharing of thoughts and planning with Mr. Karthik L. Maishyal, Vice Precident of KAIPL was always an interesting thing during the course of assignment. Thank you very much sir! Prompt response as well as help from Mr. Raju Godekattu; Marketing Manager during providing certain information, documentation and data related to the production, processes and details of manufacturing is duly appreciated. Also, the co-operation of staff of KAIPL is duly acknowledged here.
I must thank our Technical Directors and In-house Functional Area Experts (FAE) Ms. Sulakshana Ayarekar, as well as our other Empaneled Functional Area Experts Dr. J. B. Pishte, Dr. B. Thorat, Mr. Yuvraj Damugade, Dr. R. Mudaliyar, Dr. Vasant Jugale and Mr. Vinaykumar Kurakula for their able and timely contributions in the EIA studies and report preparation. Despite their busy schedules in the universities, colleges and own professions, they were always available, on time, for the necessary inputs; field visits and discussions.
My staff of the EIA Study Cell here must receive a commendation and credit for all the in-house management and inputs during the monitoring, report preparation and presentations. Our other In-house experts of various functional areas have also contributed their best.
Last but not the least, the contributions from my non-technical staff and laboratory team is also duly appreciated here.
DR. SANGRAM GHUGARE Chartered Engineer
Chairman & MD Equinox Environments (India) Pvt. Ltd. (EEIPL); Kolhapur

V
CAUTION
The information, data, figures, flow charts and drawings in respect of manufacturing processes, mass balance, chemical reactions, production layouts and instrumentation details included in this Environmental Impact Assessment (EIA) Report are the sole property of Karthik Agro Industries Pvt. Ltd. (KAIPL) located at Hoolageri Village, Taluka: Badami, District :Bagalkote (Karnataka). Some of the products, reactions and process methodologies may be patented. The style and format of this EIA Report as well as the data, processing and presentations of various environmental features, environmental management planning; designs; drawings; plates; calculations, demonstrations on attributes towards pollution control and abatement aspects etc. are the intellectual property of M/s. Equinox Environments (India) Pvt. Ltd. (EEIPL); Kolhapur. All maps (District, State, Country etc.) enclosed in this reports for referring information are purely indicative, graphical & not to scale. Under no circumstances, any part of this report may be used; reproduced; translated; recorded or copied in any form and manner except by the Govt. authorities requiring this report for taking decisions, based on details and information provided in same, during the Environmental Clearance procedure carried out as per EIA Notification No. S.O. 1533 (E) dated 14.09.2006 as amended from time to time.
Equinox Environments (India) Pvt. Ltd. (EEIPL); Kolhapur Environmental, Civil & Chemical Engineers, Consultants & Analysts
ISO 9001: 2015 & QCI-NABET accredited Organization

CERTIFICATE Declaration by Expert contributing to the Draft EIA in respect of proposed Expansion Grain / Molasses based Distillery from 65 to 180 KLPD. Expansion project will be implemented in the existing 65 KLPD Distillery premises by Karthik Agro Industries Pvt. Ltd. (KAIPL), located at Hoolageri Village, Taluka: Badami, District :Bagalkote (Karnataka) We, hereby, certify that we were a part of the EIA team in the following capacities that developed the above EIA.
Project No. P-566-KAIPL-EIA-DISTILLERY-10-2020 EIA Coordinators Name : Ms. Sulakshna Ayarekar
Period of Involvement : October 2020 – December 2021 Contact Information : [email protected]
Functional Area Expert:
Sr. No.
Functional Area
Name of the expert/s
Involvement (Period & Task)
Signature
1 WP Dr. Sangram Ghugare
October 2020 – December 2021 Study of process and operations Site visit and finalization of water
sampling locations Preparation of water balance and
identification of wastewater generation. Evaluation of water pollution & control
management Identification of impacts, suggestion and
finalization of mitigation measures Study on Treatment of effluents through
existing ETP and to be upgraded under proposed expansion was contemplated and designs were done accordingly.
2 EB Sulakshna Ayarekar
October 2020 – December 2021 Selection of Site for conducting
ecological & biodiversity status of the study region.
Interaction with Govt. offices and agencies for certain secondary data and information pertaining to region specific issues
Study of terrestrial fauna by sighting, noting pug-marks, calls, sounds, droppings, nests and burrows etc.
Interaction with local residents for obtaining information about various

Sr. No.
Functional Area
Name of the expert/s
Involvement (Period & Task)
Signature
species of animals and birds usually observed their existence and importance in the study region.
Review of rules, legislation and criteria towards knowing and understanding inclusion in the study region of any eco-sensitive zones, wild life sanctuary.
Collection, compilation and presentation of the data as well as incorporation of same in to the EIA report.
3 SE Dr. V. B. Jugale
October 2020 – December 2021 Collection of data on socio-economic
aspects in study area through surveys. Public opinions and recording of events
for future industrialization in the study area.
Study of sociological aspects like human settlement, demographic and infrastructural facilities available in study area.
Compilation of primary and secondary data and its inclusion in EIA report.
4 AP Mr. Yuvraj Damugade
October 2020 – December 2021 Involved in detailed study of mass
balance w.r.t. raw materials & products especially from view point of process emissions.
Site visit and finalization sampling locations.
Planning & identifying the most appropriate air pollution control equipment from view points of efficiencies, capital as well as O & M cost & suitability.
Identification of impact and suggesting the mitigation measures.
5 AQ October 2020 – December 2021 Designing of Ambient AQM network for
use in prediction modeling and micro metrological data development.
Development and application of air quality models in prediction of pollutant dispersion.
Plotting of isopleths of GLCs, Worst case scenarios prediction w.r.t. source and receptors.
Sr. No.
Functional Area
Name of the expert/s
Involvement (Period & Task)
Signature
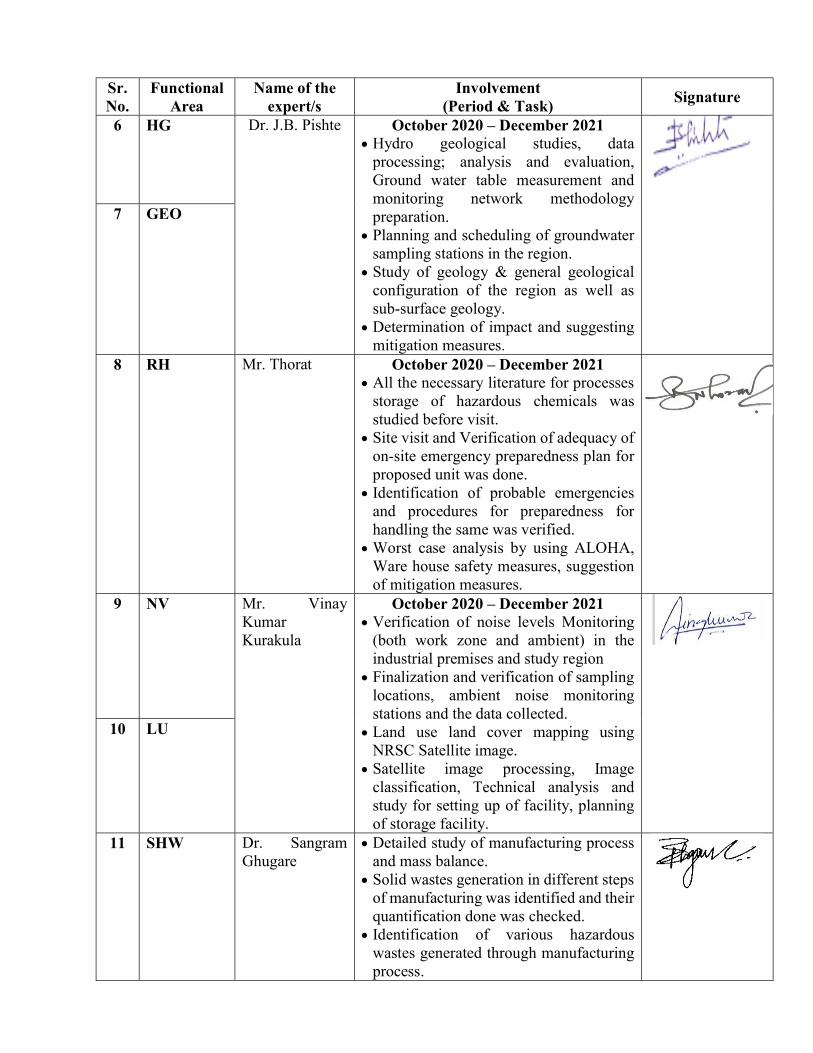
6 HG Dr. J.B. Pishte
October 2020 – December 2021 Hydro geological studies, data
processing; analysis and evaluation, Ground water table measurement and monitoring network methodology preparation.
Planning and scheduling of groundwater sampling stations in the region.
Study of geology & general geological configuration of the region as well as sub-surface geology.
Determination of impact and suggesting mitigation measures.
7 GEO
8 RH Mr. Thorat
October 2020 – December 2021 All the necessary literature for processes
storage of hazardous chemicals was studied before visit.
Site visit and Verification of adequacy of on-site emergency preparedness plan for proposed unit was done.
Identification of probable emergencies and procedures for preparedness for handling the same was verified.
Worst case analysis by using ALOHA, Ware house safety measures, suggestion of mitigation measures.
9 NV Mr. Vinay Kumar Kurakula
October 2020 – December 2021 Verification of noise levels Monitoring
(both work zone and ambient) in the industrial premises and study region
Finalization and verification of sampling locations, ambient noise monitoring stations and the data collected.
Land use land cover mapping using NRSC Satellite image.
Satellite image processing, Image classification, Technical analysis and study for setting up of facility, planning of storage facility.
10 LU
11 SHW Dr. Sangram Ghugare
Detailed study of manufacturing process and mass balance.
Solid wastes generation in different steps of manufacturing was identified and their quantification done was checked.
Identification of various hazardous wastes generated through manufacturing process.

Sr. No.
Functional Area
Name of the expert/s
Involvement (Period & Task)
Signature
Practices of storage and disposal of HW its impact and mitigation measures.
12 SC Mr. Ratnakumar Mudliar
October 2020 – December 2021 Involvement physical analysis &
characterization of the soils. Identification of Impact and its
mitigation measures. Interpretation of soil analysis, results and
data including comparison of same with standard soil classification.
Collection, study and evaluation of soil information from data obtained from secondary sources & its interpretation.
Declaration by the Head of the Accredited Consultant Organization/authorized person: I, M/s. Equinox Environments (I) Pvt. Ltd. (EEIPL); Kolhapur, Environmental & Civil Engineers, Consultants and Analysts., hereby confirm that the above mentioned experts were involved in preparation of EIA Report in respect of Expansion of Grain / Molasses based Distillery from 65 to 180 KLPD. Expansion project will be implemented in the existing 65 KLPD Distillery premises by Karthik Agro Industries Pvt. Ltd. (KAIPL), located at Hoolageri Village, Taluka: Badami, District :Bagalkote (Karnataka). I also confirm that the consultant organization shall be fully accountable for any mis-leading information mentioned in this statement. Signature: Name: Dr. Sangram Ghugare Designation: Chairman & MD
Name of the EIA Consultant Organization: M/s. Equinox Environments (I) Pvt. Ltd. (EEIPL); Kolhapur. NABET Certificate No. & Issue Date: NABET/IA/1821/ RA 0135, Validity – 15/01/2022

ABBREVIATIONS
AAQM Ambient Air Quality Monitoring ACF Activated Carbon Filter AP Air Pollution AQ Air Quality BIS Bureau of Indian Standards
BOD Biological Oxygen Demand CGWB Central Ground Water Board CMD Cubic Meter per Day CO Carbon Monoxide CO2 Carbon Dioxide. COD Chemical Oxygen Demand CPCB Central Pollution Control Board CPU Condensate Pollution Unit
CREP Corporate Responsibility For Environmental Protection CSR Corporate Sector Responsibility CTE Consent to Establish CTO Consent to Operate CWC Central Water Commission
dB (A) Decibel (Ambient) DG Diesel Generator
DIRD Directorate of Irrigation Research and Development DO Dissolved Oxygen
EAC Expert Appraisal Committee EB Ecological Biodiversity EC Environmental Clearance
EEIPL Equinox Environments India Pvt. Ltd. EIA Environmental Impact Assessment EMP Environmental Management Plant ENA Extra Neutral Alcohol EPA Environmental Protection Act ETP Effluent Treatment Plant GEO Geology GLC Ground Level Conservation
GSDA Ground Water Survey and Development Agency HG Hydrology, Ground Water and Water Conservation
HSD High Speed Diesel IMD Indian Metrological Department IRS Indian Remote Sensing IS Indian Standards
ISO International Organization For Standardization KL Kilo Liter
KAIPL Karthik Agro Industries Pvt Ltd KSPCB Karnataka State Pollution Control Board KLPD Kilo Liter per Day KVA Kilo Volt Ampere LC Land Cover

LU Land Use MEE Multiple Effect Evaporator
MoEFCC Ministry of Environment, Forest and Climate Change MT Metric Tone N North
NAAQS National Ambient Air Quality Standard NE North-East NOx Oxides of Nitrogen NTU Nephelometric Turbidity Units NV Noise and Vibration
O&M Operation and Maintenance OHSAS Occupational Health and Safety Management System Standards.
PLC Programmable Logic Controller PM Particulate Matter PP Project Proponent
PSF Pressure Sand Filter RO Reverse Osmosis RS Rectified spirits SC Soil conservation SE Socio - Economic
SEIAA State Environment Impact Assessment Authority SHE Safety and Health Environment SHW Solid and Hazardous Waste SO2 Sulphur Dioxide SPM Suspended Particulate Matter SS Suspended Solids
STP Sewage Treatment Plant SW South -west
SWD Side Water Depth TCD Tones Crushing Per Day TDS Total Dissolved Solids ToR Terms of References TPH Tones Per Hour W West

XIII
CONFIGURATION OF REPORT
Chapter 1 - Introduction
This chapter is an introductory chapter, presenting the background information of the project, its location, objective of project, scope of study and documentation and compliance of ToRs.
Chapter 2 - Project Description
This chapter deals with technology and process to be used for the proposed expansion of the project. It also deals with the sources of pollution and mitigation measures under existing and expansion activities.
Chapter 3 - Description of the Environment
In this chapter, study of various attributes of environment such as Air, Water, Noise, Soil, Land Use Pattern, Geology, Hydro-geology and Ecology is carried out so as to describe the existing environmental status. Also, present social status is discussed to know if there are any sensitive issues in the area.
Chapter 4 - Environmental Impacts and Mitigation Measures This chapter presents the conclusion drawn by studying the impact considering both the pre - project and post project scenario. It describes the sum impact of the proposed project and mitigation measures for abatement of the pollution.
Chapter 5 - Analysis of Alternatives Various alternatives in terms of site selection and technology to be used are discussed in this chapter and the environment friendly and best suited technology is selected for the expansion project. Chapter 6 - Environmental Monitoring Program
This chapter deals with the planning of Environmental Monitoring Program both during construction phase and operational phase to assess the performance of pollution control equipments to be installed.
Chapter 7 - Additional Studies
This chapter illustrates possible risk areas under the proposed expansion project and safety and disaster management plan prepared to mitigate the same
Chapter 8 - Project Benefits
This chapter describes the predictable benefits due to proposed expansion of sugar factory in existing premises of co-gen plant.
Chapter 9 - Environment Cost Benefit Analysis This chapter deals with Cost-benefit analysis provides an organizational framework for identifying, quantifying, and comparing the costs and benefits (measured in rupees) of a proposed project action. Chapter 10 - Environmental Management Plan
This chapter deals with the protection and mitigation measures for abatement of pollution after execution of the project. It also deals with the roles and responsibilities of the environmental management cell for proper implementation of the Environmental Management Plan.
Chapter 11 - Summary and Conclusion

XIV
This chapter summarizes the conclusion of the Draft EIA report.
Chapter 12 - Disclosure of Consultant Organization
In this chapter the name and brief resume of the consultant organization engaged in preparation of the Draft EIA report is presented.
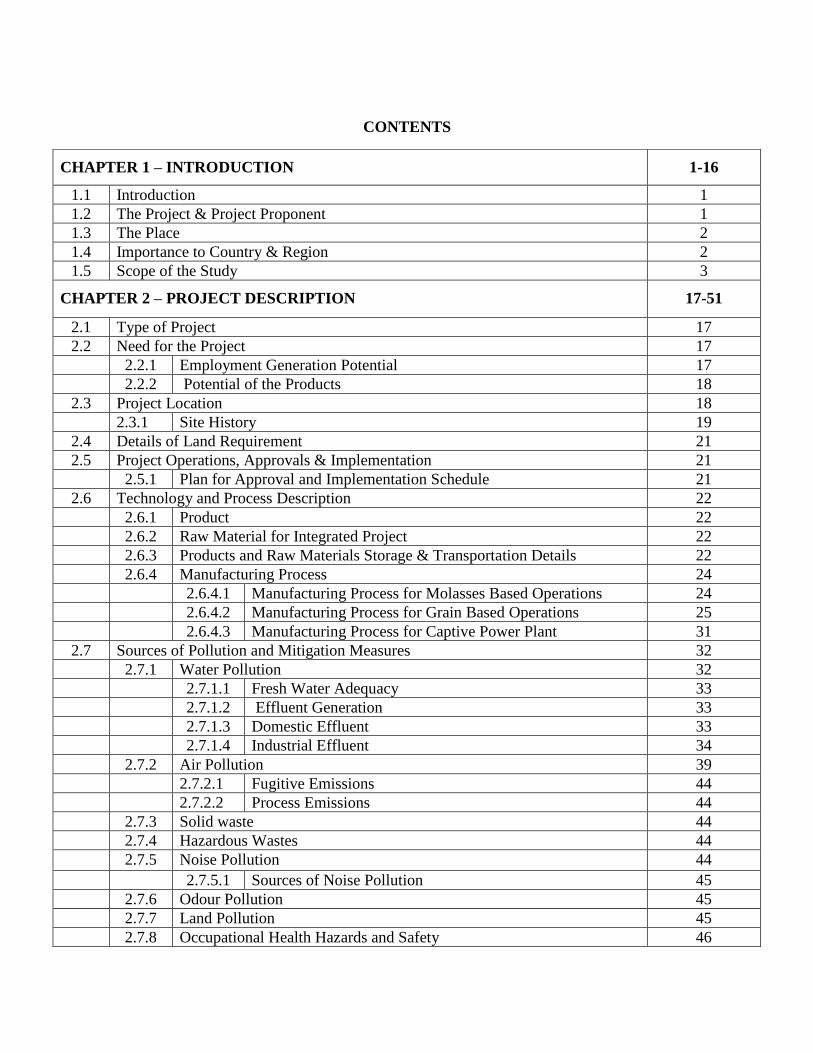
CONTENTS
CHAPTER 1 – INTRODUCTION 1-16
1.1 Introduction 1 1.2 The Project & Project Proponent 1 1.3 The Place 2 1.4 Importance to Country & Region 2 1.5 Scope of the Study 3
CHAPTER 2 – PROJECT DESCRIPTION 17-51
2.1 Type of Project 17 2.2 Need for the Project 17
2.2.1 Employment Generation Potential 17 2.2.2 Potential of the Products 18
2.3 Project Location 18 2.3.1 Site History 19
2.4 Details of Land Requirement 21 2.5 Project Operations, Approvals & Implementation 21
2.5.1 Plan for Approval and Implementation Schedule 21 2.6 Technology and Process Description 22
2.6.1 Product 22 2.6.2 Raw Material for Integrated Project 22 2.6.3 Products and Raw Materials Storage & Transportation Details 22 2.6.4 Manufacturing Process 24 2.6.4.1 Manufacturing Process for Molasses Based Operations 24 2.6.4.2 Manufacturing Process for Grain Based Operations 25 2.6.4.3 Manufacturing Process for Captive Power Plant 31
2.7 Sources of Pollution and Mitigation Measures 32 2.7.1 Water Pollution 32
2.7.1.1 Fresh Water Adequacy 33 2.7.1.2 Effluent Generation 33 2.7.1.3 Domestic Effluent 33 2.7.1.4 Industrial Effluent 34 2.7.2 Air Pollution 39 2.7.2.1 Fugitive Emissions 44 2.7.2.2 Process Emissions 44 2.7.3 Solid waste 44 2.7.4 Hazardous Wastes 44 2.7.5 Noise Pollution 44 2.7.5.1 Sources of Noise Pollution 45 2.7.6 Odour Pollution 45 2.7.7 Land Pollution 45 2.7.8 Occupational Health Hazards and Safety 46

2.7.9 Budgetary Allocation by Industry towards Environment Protection 46 2.8 Green Belt Development Plan 47
2.8.1 Area Calculation for Green Belt Plan 47 2.8.2 Existing Tree Plantation 47 2.8.3 Proposed Tree Plantation 48 2.8.4 Criteria for Green Belt Development 48
2.9 Rain Water Harvesting 49 2.9.1 Existing Rain Water Harvesting Details 49 2.9.2 Proposed Rain Water Harvesting Details 50
CHAPTER 3 – DESCRIPTION OF THE ENVIRONMENT 52-127
3.1 Introduction 52 3.2 Land Use and Land Cover (LU & LC) 52
3.2.1 Scope of work 52 3.2.2 Study Area & Location 52 3.2.3 Purpose of Land Use Mapping 52 3.2.4 Land use Map Analysis 53 3.2.5 Methodology for LU & LC Study 53
3.3 Land Use Studies 58 3.3.1 Land Use of Study Area 59 3.3.2 Land Use Map 61 3.3.3 Settlement Map 62 3.3.4 Eco- Sensitive Map 63 3.3.5 Contour Map 64 3.3.6 Drainage Map 65
3.4 Soil Characteristics 66 3.4.1 Introduction 66 3.4.2 Soil Quality: Present Status 66 3.4.3 Methodology 67 3.4.3.1 Methodology of Data Generation 67 3.4.3.2 Sources of Information 67 3.4.4 Comments on Soil Characteristics 69 3.4.5 Physical Characters 73 3.4.6 Chemical Characters 73
3.5 Drainage and Geomorphology 79 3.5.1 Methodology 79 3.5.1.1 Literature Review 79 3.5.2 Data Generation 79
3.5.2.1 Hydrogeology 79 3.5.2.2 Geology 79 3.5.3 Data Analysis and Interpretation 79 3.5.3.1 Hydrogeology 79 3.5.3.2. Geology 80 3.5.4 Description of the environment 80

3.5.4.1 Geomorphology 80 3.5.4.2 Drainage 80
3.6 Geology, Hydrology & Hydrogeology 80 3.6.1 Geology 80 3.6.2 Hydrogeology 80 3.6.2.1 Groundwater Resources 80 3.6.2.2 Groundwater Quality 81
3.7 Water Quality 82 3.7.1 Introduction 82 3.7.2 Methodology 82 3.7.2.1 Methodology of Data Generation 82 3.7.2.2 Sampling Procedure for Primary Data Generation 83 3.7.3 Presentation of Results 83 3.7.3.1 Surface Water 83 3.7.3.2 Ground Water 88
3.8 Meteorology 92 3.8.1 Introduction 92 3.8.2 Methodology 93 3.8.2.1 Methodology of Data Generation 93 3.8.2.2 Sources of Information 93
3.9 Air Quality 93 3.9.1 Introduction 93 3.9.2 Methodology 94 3.9.2.1 Selection of Sampling Location 94 3.9.2.2 Parameters, Frequency and Analysis Methods for AAQ
Monitoring 94
3.9.3 Presentation of Results 95 3.9.4 Observations Based On Period October – November – December 2019 95
3.10 Noise Level Survey 100 3.10.1 Introduction 100 3.10.2 Identification of Sampling Location 101 3.10.3 Ambient Noise Monitoring Stations 101 3.10.4 Method of Monitoring 103 3.10.5 Prese Standards for Noise Levels 103 3.10.5.1 Standards for Occupational Noise ( U.S.A) 103 3.10.5.2 OSHA Standards 103 3.10.6 Presentation of Results 104 3.10.6.1 Noise Modeling 104
3.11 Socio-Economic Profile 105 3.11.1 Introduction 105 3.11.2 Need of the Project 105 3.11.3 Socio-Economic Study 106 3.11.4 Social Infrastructure 108 3.11.5 Source of Information 9108

3.11.6 Social Vulnerability 109 3.11.7 Impact Assessment 110 3.11.8 SE Profile of The Study Area 114 3.11.9 Cultural Vulnerability 117 3.11.10 Employment Generation 117 3.11.11 Project Benefits 118 3.11.12 Willingness to Pay and Willingness to Accept 118 3.11.13 Mitigation of hazards 118 3.11.14 Conclusions 119
3.12 Ecology 119 3.12.1 Study Area 119 3.12.2 Methodology 120 3.12.3 Ecology 120 3.12.3.1 Field Observations 120 3.12.3.2 Questionnaire Survey 121 3.12.4 Biodiversity 121 3.12.4.1 Field Observations 121 3.12.4.2 Questionnaire Survey 122 3.12.4.3 Environmental Impact of Proposed Project on Ecology and
Biodiversity in Region 123
3.12.5 Green Belt 123 3.12.6 CER Activity 124
CHAPTER 4 – ENVIRONMENTAL IMPACTS & MITIGATION MEASURES 128-167
4.1 Introduction 128 4.2 Construction Phase 128 4.3 Operation Phase 131
4.3.1 Impact on Air Quality 133 4.3.1.1 GLC Evaluation through Air Dispersion Modeling 133 4.3.1.2 Baseline Ambient Air Concentrations 134 4.3.1.3 Mitigation Measures 144 4.3.2 Impact on Climate 145 4.3.3 Impact on Water Resources 145
4.3.3.1 Surface Water (Quality & Quantity) 145
4.3.3.2 Ground Water (Quality & Quantity) 148 4.3.3.3 Mitigation Measures 149 4.3.4 Impact on Soil and Agriculture 150 4.3.4.1 Construction Phase 150 4.3.4.2 Operational Phase 150 4.3.4.3 Mitigation measure 151
4.3.5 Impact of Solid and Hazardous Wastes 152 4.3.5.1 Mitigation Measures 152 4.3.6 Impact on Noise Levels 154 4.3.6.1 Mitigation Measures 155

4.3.7 Impact of Vibration 156 4.3.8 Impact on Land Use 156 4.3.9 Impact on Ecology and Bio-diversity 157 4.3.9.1 Mitigation Measures 157 4.3.10 Impact on Socio Economic Status of Study Area 157 4.3.10.1 Mitigation Measures 157 4.3.11 Occupational Health and Safety 157
4.3.11.1 Mitigation Measures 158 4.3.12 Impact on Historical Places 158
4.4 Evaluation of Impact 158 4.5 Environmental Impact Evaluation for KAIPL 159 4.6 Impacts due to Decommissioning Activity 166
4.6.1 Decommissioning Phase 166
CHAPTER 5 – ANALYSIS OF ALTERNATIVE 168-169
5.1 Introduction 168 5.2 Analysis of alternative sites 168 5.3 Alternative Technologies 168
5.3.1 Distillery 168 5.3.1.1 Fermentation Process 168 5.3.1.2 Distillation Process 168 5.3.1.3 Technology for Abating Pollution 169
CHAPTER 6 – ENVIRONMENTAL MONITORING PROGRAM 170-179
6.1 Introduction 170 6.2 Monitoring Program during Construction Phase 170 6.3 Monitoring during the Post Construction/ Operational Phase 170
6.3.1 Air Pollution Management 171 6.3.2 Water Management 171 6.3.3 Noise Level Management 171 6.3.4 Land Management 172 6.3.5 Dust Management 172 6.3.6 Odour Management 173 6.3.7 Operation Control and Equipment Maintenance 173 6.3.8 Occupational Health and Safety Measures 173 6.3.9 Measures for Socio-Economic Development 174 6.3.9.1 Better Employment Opportunities 174 6.3.9.2 CER Plan 175 6.3.10 Proposed CER Plan by KAIPL 175 6.3.11 Measures for Improvement of Ecology 175
6.4 Environmental Monitoring Program Schedule 176 6.5 Compliance With CREP Guidelines 176

CHAPTER 7- ADDITIONAL STUDIES 180-191
7.1 Public Consultation 180 7.1.1 Details of Public Hearing 180 7.1.2 Public Hearing Issues & Compliance 180
7.2 R & R Action Plan 183 7.3 Risk Assessment Introduction 183 7.4 Objectives And Scope of the RH Report 183
7.4.1 Objective of the Risk and Hazard analysis 183 7.4.2 Methodology 183 7.4.2.1 Identify hazards based on 183 7.4.2.2 Hazard Assessment 183 7.4.2.3 Recommendations 183 7.4.3 Hazards during construction phase 184 7.4.4 Hazards during operation phase 184
7.5 Distillery Plant 184 7.5.1 Hazard Identification: Production of Alcohol (Distillery) 184 7.5.1.1 Hazard Identification: Alcohol Storage 185 7.5.1.2 Qualitative Risk analysis 185 7.5.1.3 Hazard Identification: Molasses / Grain Storage 186
7.5.1.4 Present Scenario 187 7.5.1.5 Mitigation Measures 187 7.6 Other Area of Hazard Identification in Complex 187 7.6.1 Mitigation Measures to Avoid Accidents 188 7.7 Boiler Section 188 7.7.1 Establishing a Fire Fighting Group 188 7.7.1.1 Safety and firefighting tips 189 7.8 On-site Emergency Plan 189 7.9 Occupational Health Aspects & Medical Provision in Factory 190 7.9.1 Medical check-up 190 7.9.2 Occupational Health Center: OHC 190 7.10 EHS Policy 191
CHAPTER 8 – PROJECT BENEFITS 192-193
8.1 Introduction 192 8.1.1 Improvement in the Physical Infrastructure 192 8.1.2 Improvement in the Social Infrastructure 192
8.2 Activities Done By KAIPL Under CER 192 8.3 Employment Potential 193 8.4 Other Tangible Benefits 193

CHAPTER 9 – ENVIRONMENT COST BENEFIT ANALYSIS 194-196
9.1 Introduction 194 9.2 Proposed Project 194 9.3 Way forward 195
9.3.1 Cost benefit by Govt. of India policy for the country 195 9.4 Conclusion 196
CHAPTER 10 – ENVIRONMENTAL MANAGEMENT PLAN 197-202
10.1 Introduction 197 10.2 Environmental Management Cell (EMC) 197 10.3 Working Of Environmental Management Plan 198 10.4 Recommendation & Implementation Schedule 199
10.4.1 Summary of Recommendations 199 10.5 Environmental Post Monitoring Program 201 10.6 Post Environmental Monitoring Program 202 10.7 Monitoring Equipment 202
CHAPTER 11 – SUMMARY AND CONCLUSION 203 - 207
11.1 Introduction 203 11.2 Project at A Glance 203 11.3 Process Description 204
11.3.1 Product and Raw Material 204 11.4 Sources of Pollution and Mitigation Measures 204
11.4.1 Water Pollution 204 11.4.2 Air Pollution 205 11.4.3 Noise Pollution 205 11.4.4 Solid Waste 205 11.4.5 Hazardous Waste 206 11.4.6 Odour Pollution 206
11.5 Green Belt Development 206 11.6 Environmental Monitoring Program 206 11.7 Environment Management Plan 206 11.8 Conclusion 206
CHAPTER 12- DISCLOSURE OF CONSULTANTS 208-209 12.1 The Organization 208-209

LIST OF TABLES
Table No. Name of Table Page No. 1.1 Project Investment Details 1 1.2 Promoters of KAIPL 1 1.3 Summary of Terms of Reference 4 2.1 Details of Manpower 17 2.2 Salient features of Project Site 18 2.3 Details of Area Break Up 21 2.4 Working Pattern 21 2.5 Plan for Project Implementation schedule 21 2.6 List of Product & By-product 22 2.7 List of Raw Materials 22 2.8 Raw Material Transportation Details (Traffic Density) 23 2.9 Product & By-product Transportation Details 23 2.10 Raw Material Storage Details 23 2.11 Product Storage Details (Existing) 23 2.12 Electricity Requirement Details 31 2.13 Steam Balance 32 2.14 Details of Water Consumption in Distillery 33 2.15 Details of Effluent Generation in Grain Based Operation 34 2.16 Details of Effluent Generation in Molasses Based Operation 34 2.17 DDGS specifications 35 2.18 Details of Multiple Effect Evaporator (MEE) 35 2.19 Molasses Spent wash Characteristics 35 2.20 Details of Boilers and D.G. Sets in KAIPL 39 2.21 Characteristics of Fuel 39 2.22 Fuel Storage Details 39 2.23 Details of APC for boilers 39 2.24 Results for Self-Monitoring of ETP Effluent Samples of Jan.2020 to
Dec.2020 41
2.25 Results for Self-Monitoring of Stack Emission Samples of Jan.2020 to Dec.2020
41
2.26 Results for Self-Monitoring of DG Set Emission Samples of Jan.2020 to Dec.2020
41
2.27 Results for Self-Monitoring of Ambient Noise Samples of Jan.2020 to Dec.2020
41
2.28 Results for Self-Monitoring of AAQM Samples of Jan.2020 to Dec.2020 42 2.29 Details of Solid Waste 44 2.30 Capital as well as O & M Cost 46 2.31 Area Details 47 2.32 List of Trees Planted Under Existing Project 47 2.33 Area Taken for RWH 50 3.1 Satellite Data Details 53

Table No. Name of Table Page No. 3.2 Area Statistics for Land Use Land Cover Classes 59 3.3 Analytical Techniques for Soil Analysis 67 3.4 Soil Sampling Locations 67 3.5 Standard Soil Classification 68 3.6 Existing Soil Characteristics 68 3.7 Status of Groundwater Quality in bore wells observed in the Area 81 3.8 Monitoring Locations for Surface Water 82 3.9 Monitoring Locations for Ground Water 82 3.10 Surface Water 83 3.11 Ground water 88 3.12 Meteorological Parameters 93 3.13 AAQM Location Details 94 3.14 AAQ Parameters, Monitoring Frequency and Analysis Methods 94 3.15 Summary of the AAQ Monitoring Results for Season
[October – November – December 2020] 95
3.16 National Ambient Air Quality Standards (NAAQS) by CPCB 95 3.17 Noise Sampling Locations 101 3.18 Ambient Noise Level Standards 103 3.19 Standards for Occupational Exposure 103 3.20 OSHA Standards for Occupational Exposure 103 3.21 Ambient Noise Levels 104 3.22 Villages within the radius of 10 km in the Study Area 107 3.23 Sample Villages Surveyed 112 3.24 Summary of SE Field Survey 115 3.25 Data Interpretation 116 3.26 Names of the Villages Studied for EB and Questionnaire Survey, Their
ESA Status &Distance from the Project Site 120
3.27 List of fauna observed during the field survey 124 3.28 List of Dominant floral species observed during survey 125 3.29 List of floral commonly reported by the respondents during Survey 126 3.30 List of fauna commonly reported by the locals during survey 127 4.1 Impact Identification and Mitigation Measures due to Construction Phase 128 4.2 Disposal of Waste Generation during Construction Phase 131 4.3 Identification of Impacts on Environment due to Operation Phase 132 4.4 Predominant Wind Directions 133 4.5 Baseline Concentrations at Site 134 4.6 GLC with Incremental Increase in PM10 Values (g/M3) 136 4.7 GLC with Incremental Increase in PM2.5 values 137 4.8 GLC with Incremental Increase in SO2 Values (μg/M3) with Operation of
APC 138
4.9 GLC with Incremental Increase in NOx Values (μg/M3) with APC in Operation
139
4.10 GLC with Incremental Increase in PM10 values for Non-Operation of APC 140

Table No. Name of Table Page No. 4.11 GLC with Incremental Increase in PM2.5 Values for (Non-Operation of
APC) 141
4.12 Quantification of Pollutants’ Load (Distillery Spent wash) 146 4.13 Quantification of Pollutants Load (Effluent from Molasses based
Distillery) 146
4.14 Quantification of Pollutants Load (Effluent from Grain based Distillery) 147 4.15 Waste Minimization Techniques 152 4.16 Permissible Exposure in Case of Continuous Noise 155 4.17 Standards In Respect of Ambient Noise Levels 155 4.18 Existing Environmental Status in Study Area 160 4.19 Application of Battelle Environmental Evaluation System (BEES) 162 4.20 Identification of RED Flags to the Potential Problem Areas in BEES 165 4.18 The Mitigation Measures 166 4.19 Identification of Impacts due to Decommissioning of KAIPL 166 5.1 Technology for Abating Pollution 169 6.1 Trees with Good Canopy for Noise Attenuation 172 6.2 Health Care Facility Equipment 174 6.3 Proposed CER activities by YAPL 175 6.4 CER Implementation Schedule 175 6.5 Plan for Monitoring of Environmental Attributes in and around KAIPL 177 6.6 Environmental Monitoring Schedule within Industrial Premises 178 6.7 Environmental Monitoring Schedule Surrounding Industrial Premises 179 7.1 Points Raised in the PH & Response of PP 181 7.2 Hazards during the Construction Phase 184 7.3 Hazards during operation phase 184 7.4 Alcohol Storage Arrangements at KAIPL Site (Existing) 185 7.5 Degree of Hazard 186 7.6 Raw Material Storage Tanks 186 7.9 Possible Hazardous Locations onsite 187 7.10 Fire Fighting Details 189 8.1 Activities done Under CER 192 10.1 Environmental Management Cell in KAIPL 197 10.2 Summary of Recommendations 199 10.3 Implementation Schedule 201 10.4 Compliance against the Consent Condition 202 11.1 Project Investment Details 203 11.2 Salient Features of the KAIPL Project Site 203 11.3 List of Products & By-products 204 11.4 List of Raw Materials 204 11.5 Solid Waste Details 205 11.6 Area Details 206

LIST OF FIGURES
Figure No. Name of Figure Page No. 1.1 Photograph of KAIPL Project Complex 2 2.1 Location of the Project Site 19 2.2 Images Showing Site History 20 2.3 Mass Balance and Process flow chart for existing 65 KLPD Grain based
Distillery 29
2.4 Mass Balance and Process flow chart for existing 65 KLPD Molasses based Distillery
30
2.5 Mass Balance and Process Flow Chart for 180 KLPD Grain Based Distillery
30
2.6 Mass Balance and Process Flow Chart for 180 KLPD Molasses Based Distillery
31
2.7 Process Flow Chart for Captive Power Plant 32 2.8 Flow Chart of Existing Distillery CPU (Capacity 1000 KLPD) 36 2.9 Flow Chart of Proposed Distillery CPU (Capacity 1000 KLPD) 36 2.10 Cross Section of Spentwash Tank 37 2.11 Flow Chart of Proposed STP 37 2.12 Photographs of Existing ETP 38 2.13 Photographs Showing Existing Online Continues Monitoring System to
Stack (OCMS) 40
2.14 Photographs of Existing Green Belt 49 2.14 Photographs Rain Water Harvesting Points 50 3.1 Process Flow Chart 54 3.2 Location Map of YAPL 55 3.3 Google Image Showing Villages within Study Area 56 3.4 Satellite Image 57 3.5 Visual Interpretation Keys used for the Study 58 3.6 Land Use and Land Cover Statistics 59 3.7 Topographical Map 60 3.8 Land Use and Land Cover Map 61 3.9 Settlement Map 62 3.10 Eco- Sensitive Map 63 3.11 Contour Map 64 3.12 Drainage Map 65 3.13 Baseline Environmental Details: Soil Environment 70 3.14 Soil Analysis 71 3.15 Soil Analysis 71 3.16 Soil Analysis 72 3.17 Soil Analysis 72 3.18 Soil Map 78 3.19 Baseline Environmental Details: Surface Water 85 3.20 Surface Water Analysis 86

Figure No. Name of Figure Page No. 3.21 Surface Water Analysis 86 3.22 Surface Water Analysis 87 3.23 Surface Water Analysis 87 3.24 Baseline Environmental Details: Ground Water 89 3.25 Ground Water Analysis 90 3.26 Ground Water Analysis 90 3.27 Ground Water Analysis 91 3.28 Ground Water Analysis 91 3.29 Ground Water Analysis 92 3.30 Baseline Environmental Details: AAQM Environment 97 3.31 AAQM Parameters – Oct. 2020 98 3.32 AAQM Parameters – Nov. 2020 98 3.33 AAQM Parameters – Dec. 2020 99 3.34 AAQM Parameters – Oct. 2020 - Dec. 2020 99 3.35 AQI 100 3.36 Noise Monitoring Locations 102 3.37 Noise Analysis 104 3.38 Male and Female Population in Sample Villages 113 3.39 Literacy in the study area 113 3.40 Ratio of Marginal Workers to Total Workers 113 3.41 Ratio of Children Population to total Population 114 3.42 Ratio of Agricultural Laborer’s to Cultivators 114 3.43 Cultural Resilience and Village Lake 117 4.1 Flow Chart of Impact Identification 131 4.2 Windrose for the Month October-November-December 2020 135 4.3 Isopleths of PM10(24 Hrs Max. Conc. in μg/m3) 136 4.4 Isopleths of PM2.5(24 Hrs Max Conc. in μg/m3) 137 4.5 Isopleths of SO2 (24 Hrs Max. Conc. in μg/M3) 138 4.6 Isopleths of NOx (24 Hrs Max. Conc. in μg/M3) 139 4.7 Isopleths of PM10 (24 Hrs Max Conc. in μg/M3) 140 4.8 Isopleths of PM2.5 (24 Hrs Max Conc. in μg/M3) 141 4.9 Graphs for Isopleths of PM10 with & without APC 142 4.10 Graphs for Isopleths of PM2.5 with & without APC 142 4.11 Graphs for Isopleths of SO2 143 4.12 Graphs for Isopleths of NOx 143 9.1 Cost Benefit Analysis 195 10.1 Environmental Management Cell and Responsibilities 198 10.2 Environmental Management Plan 198

1
Chapter 1
Introduction
1.1 INTRODUCTION
'Environmental Impact Assessment (EIA)' is the process of evaluating likely environmental impacts, both positive and negative, of a new or expansion project by taking into account natural, social and economic aspects. It also comprises of suggesting possible mitigation measures, for negative impacts, before implementation or expansion of project. Main objectives of an EIA report are -
To describe a pre-project baseline condition with respect to Environmental Indicators. To identify possible sources of pollution and their environmental impacts including
identifying risks associated with setting up of a new project and suggesting appropriate mitigation measures for alleviating adverse impacts to the extent possible.
To suggest environmental / risk management plans for implementing the mitigation measures.
Ultimate aim of EIA report preparation is that the project proponent (PP) can use this report as a manual for developing company’s environmental strategy, communication
and formulating environmental policy.
Molasses is a very important by-product of the sugar industry which is a raw material for distillery manufacturing alcohol. There is a good demand for alcohol produced from molasses based distillery as well as grain based distillery in country in the country. Also, alcohol has good export potential. In view of this Karthik Agro Industries Pvt. Ltd (KAIPL) has planned to go for expansion of its existing 65 KLPD to 180 KLPD Molasses/ Grain based Distillery along with electricity generation from 1.4 MW to 5.4 MW.
1.2 THE PROJECT & PROPONENTS
Project site of KAIPL is located At.: Hoolageri Village, Taluka: Badami, District: Bagalkote (Karnataka). This report has been prepared in overall context of EIA as per the provisions of “EIA Notification No. S.O. 1533 (E)” dated 14.09.2006; and amendments thereto issued by Ministry of Environment, Forest and Climate Change (MoEFCC); New Delhi. Now, as per the amended “EIA Notification No. S.O. 1960 (E)” dated 13.06.2019; the project comes
under activity 5(g) (I & ii)- Distilleries; comes under Category ‘A’. Draft EIA report comprises of requisite information and details w.r.t. project as mentioned in the standard Terms of Reference (TORs) issued by MoEFCC vide letter No. J-11011/224/2008-IA II (I) dated 22.01.2021 to KAIPL.
KAIPL is registered under Company’s Act 1956 vide Registration No.
U15323KA2007PTC041485 in 2006-07. The Department of Excise, Government of Karnataka has issued latest Distillery License number - ECD/05/REV/Bagalkot/2015-16, Dated 24.6.2015.
Table 1.1 Project Investment Details
No. Industrial Unit Capital Investment (Rs. Cr.) Existing Proposed Total
1. Distillery 48 116.5 164.5
Table 1.2 Promoters of KAIPL
No. Name Designation 1 Lingaraj H Mashyal Managing Director 2 Vandana L Mashyal Director

2
1.3 THE PLACE
Proposed expansion of distillery will be carried out in existing premises of KAIPL complex. Total land acquired by the KAIPL is 16.18 Ha. Details of area break up are presented in Chapter 2 at Table - 2.3. A No Objection Certificate (NOC) for distillery expansion project has been obtained from Grampanchayat Hoolageri. Same is attached at Certificate and Other Documents of this EIA report. Refer figure 2.1 for location details. Following aspects have been taken into consideration while planning expansion activities in the KAIPL complex - Proximity to the raw material availability. Adequate land for implementation of proposed distillery expansion project. Nearest city Bagalkot is 12 km away from the project site which is very well connected
with other parts of the country by roads, rail. Availability as well as ease towards supply of utilities such as water, steam & electricity
from existing setup for conducting proposed expansion operations and processes. No rehabilitation and resettlement are required to be done.
Figure 1.1 Photograph of KAIPL Project Complex
1.4 IMPORTANCE TO COUNTRY & REGION
Alcohol has assumed very important place in the Country’s economy. It is a vital raw
material for a number of chemicals. It has been a source of a large amount of revenue by way of excise duty levied by the Govt. on alcoholic liquors. It has a potential as fuel in the form of power alcohol for blending with petrol. Also, the fermentation alcohol has great demand in countries like Japan, U.S.A., Canada, Sri Lanka etc., as the synthetic alcohol produced by these countries, from naphtha of petroleum crude, is not useful for beverages. India is the fourth largest producer of alcohol in the world and there has been a consistent increase in its production over the last 22 years or so. (Reference: Opportunities For Green Chemistry Initiatives: Molasses Based Distilleries, 2014).
Considering the upcoming demand of alcohol, the management of KAIPL has decided to go for an expansion of 65 KLPD to 180 KLPD Molasses/Grain based Distillery. Ethyl Alcohol is an important feedstock for manufacture of a number of chemicals. These chemicals are primarily basic carbon based products like Acetic Acid, Butanol, Butadiene, Acetic

3
Anhydride, Vinyl Acetate, PVC etc. Acetic Acid & Butanol, which are needed in pharmaceuticals, paints and in many other industries, are important value added products.
Ethylene, Ethylene oxide and Mono-ethylene glycol are also produced via petrochemical route. However, due to the latest technological developments and taking in to account the ever-increasing cost of petrochemical raw materials, it is now possible as well as more economical to produce Ethylene oxide, Mono-ethylene glycol etc. starting from ethanol. The petrochemical route needs designing of plants in mega range. Alcohol has an advantage of setting up of plants in medium as well as mini range. Average capacities of Indian molasses based distilleries ranges between 30 to 60 KLPD.
Gap between availability of alcohol and its requirement by industries is increasing constantly. During last decade, number of alcohol-based industries has come up and existing ones have marginally increased their capacities. Raw material needs of these alcohol-based industries have to be met to facilitate maximum capacity utilization of units in order to meet domestic demands for end products. These units are starving for want of raw materials. Shortage is wide spread and has hit most of the chemical drug and allied industries. Producers of insulin, antibiotics, tonics and several other essential bulk drugs as well as finished formulations are unable to obtain their quota of industrial alcohol, which is a vital raw material for them.
Denatured Spirits and Rectified Spirit are made unfit for drinking by addition of certain chemicals which have strong disagreeable odour and which cannot be easily separated from spirit. Denatured Spirits are taxed at nominal rates so that their use in industries becomes economical. Use of alcohol for purpose of potable liquor is as high as that for the industrial purpose. Alcohol is used for manufacture of country liquor, which is used by common masses. This is manufactured by diluting rectified spirit with water to different grades of 250 U. P. strength. Different varieties are produced by addition of flavors and are called spiced liquor. Liquors are manufactured in a synthetic way to imitate foreign liquors viz. Whisky, Brandy, Rum and Gin. They are called IMFL. Excise duty on IMFL is much higher than that on country liquor. Supply of country liquor at low rates is very much needed to keep away the illicit liquor manufacturers and traders. IMFL requires alcohol of very high purity. For this purpose separate distillation plant to redistill and purify Rectified Spirit is necessary, this alcohol is called Extra Neutral Alcohol (ENA). It is also useful in cosmetics and perfumes manufacturing.
Alcohol has great future as a renewable source of energy. Trend for use of alcohol as an alternative to mineral fuel oils is well established as oil and natural gas sources are depleting at faster rates. It could, therefore, be seen that demand for alcohol will be ever increasing and there would not be any problem of marketing alcohol, which would be produced by distillery. Manufacture of alcoholic beverages from the alcohol is also an attractive diversification as there is a great demand for the beverages. Moreover, diversification by way of manufacturing alcohol based chemicals, such as acetic acid, acetic anhydride, ethyl acetate, ethyl benzene, vinyl acetate etc., would be a big boon to the distillery.
1.5 SCOPE OF THE STUDY
This EIA report has been complied with the Terms of References (TORs) formulated and presented by the Industry as well as those additionally issued by the MoEFCC. Compliance towards ToRs granted have been summarized hereunder.
4
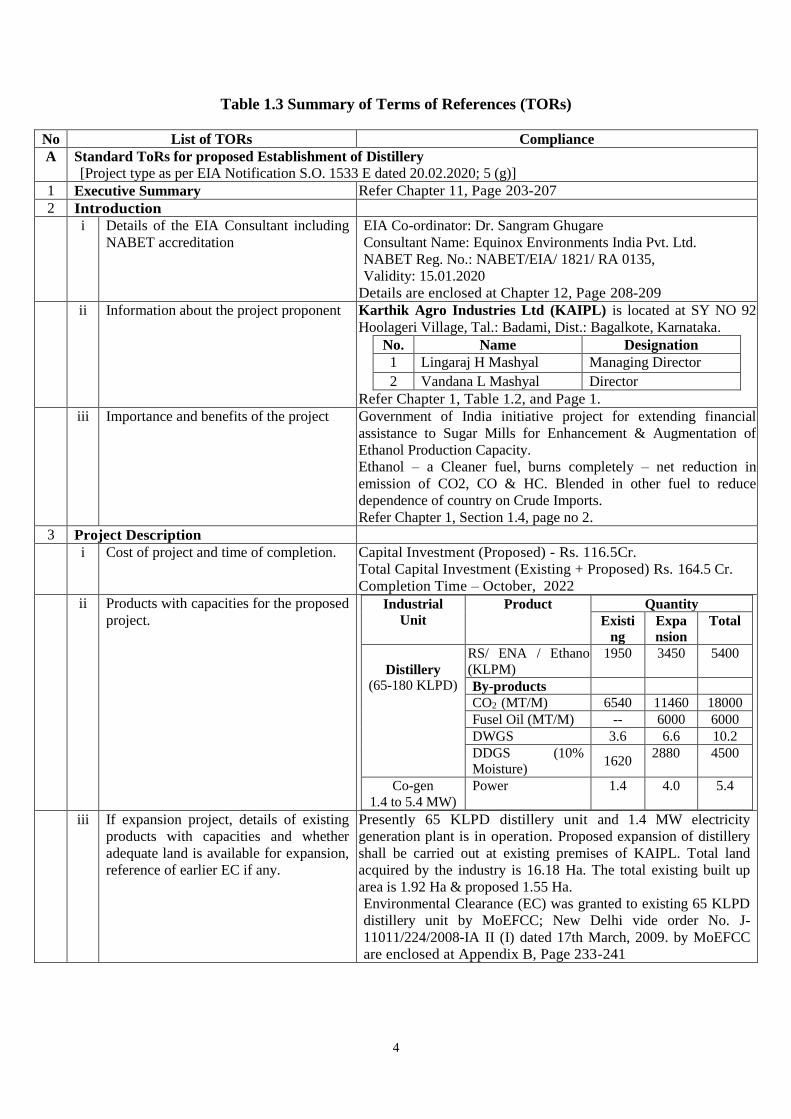
Table 1.3 Summary of Terms of References (TORs)
No List of TORs Compliance A Standard ToRs for proposed Establishment of Distillery
[Project type as per EIA Notification S.O. 1533 E dated 20.02.2020; 5 (g)] 1 Executive Summary Refer Chapter 11, Page 203-207 2 Introduction i Details of the EIA Consultant including
NABET accreditation EIA Co-ordinator: Dr. Sangram Ghugare Consultant Name: Equinox Environments India Pvt. Ltd. NABET Reg. No.: NABET/EIA/ 1821/ RA 0135, Validity: 15.01.2020
Details are enclosed at Chapter 12, Page 208-209 ii Information about the project proponent Karthik Agro Industries Ltd (KAIPL) is located at SY NO 92
Hoolageri Village, Tal.: Badami, Dist.: Bagalkote, Karnataka. No. Name Designation 1 Lingaraj H Mashyal Managing Director 2 Vandana L Mashyal Director
Refer Chapter 1, Table 1.2, and Page 1. iii Importance and benefits of the project Government of India initiative project for extending financial
assistance to Sugar Mills for Enhancement & Augmentation of Ethanol Production Capacity. Ethanol – a Cleaner fuel, burns completely – net reduction in emission of CO2, CO & HC. Blended in other fuel to reduce dependence of country on Crude Imports. Refer Chapter 1, Section 1.4, page no 2.
3 Project Description i Cost of project and time of completion. Capital Investment (Proposed) - Rs. 116.5Cr.
Total Capital Investment (Existing + Proposed) Rs. 164.5 Cr. Completion Time – October, 2022
ii Products with capacities for the proposed project.
Industrial Unit
Product Quantity Existi
ng Expansion
Total
Distillery
(65-180 KLPD)
RS/ ENA / Ethanol (KLPM)
1950 3450 5400
By-products CO2
(MT/M) 6540 11460 18000 Fusel Oil (MT/M) -- 6000 6000 DWGS 3.6 6.6 10.2 DDGS (10% Moisture)
1620 2880 4500
Co-gen 1.4 to 5.4 MW)
Power 1.4 4.0 5.4
iii If expansion project, details of existing products with capacities and whether adequate land is available for expansion, reference of earlier EC if any.
Presently 65 KLPD distillery unit and 1.4 MW electricity generation plant is in operation. Proposed expansion of distillery shall be carried out at existing premises of KAIPL. Total land acquired by the industry is 16.18 Ha. The total existing built up area is 1.92 Ha & proposed 1.55 Ha. Environmental Clearance (EC) was granted to existing 65 KLPD distillery unit by MoEFCC; New Delhi vide order No. J-11011/224/2008-IA II (I) dated 17th March, 2009. by MoEFCC are enclosed at Appendix B, Page 233-241

5
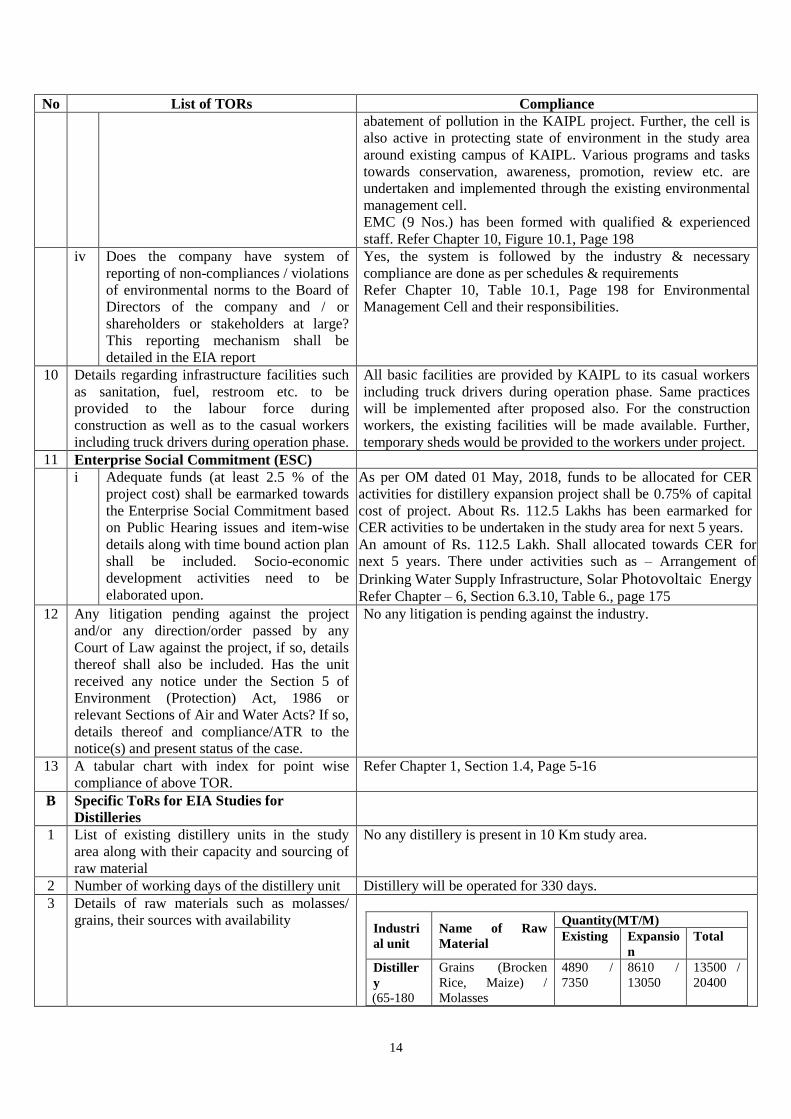
No List of TORs Compliance iv List of raw materials required and their
source along with mode of transportation.
List of Raw Materials- Industrial unit
Name of Raw Material
Quantity(MT/M) Existing Expansion Total
Distillery
(65-180 KLPD)
Grains (Brocken Rice, Maize) / Molasses
4890 / 7350
8610 / 13050
13500 /
20400
Yeast 5.7 9.6 15.3 Urea 44.7 78.6 123 De-foaming Oil 223 394 617 Alcozyme G Pro 0.03 0.06 0.09 Anzyme Liquiflow Yield (Liquification)
1.8 3.3 5.1
Saczyme Yield (Sacrification)
4.5 8 12.6
Source: Molasses-open tender, Nearby Sugar Factories, Grains – Nearby talukas, other raw materials from local vendors.
v Other chemicals and materials required with quantities and storage capacities
vi Details of Emission, effluents, hazardous waste generation and their management.
Emissions: Distillery (expansion) - Under molasses based operations a new 40 TPH incineration boiler will be installed on site with 100 M height & ESP as APC Equipment. Under Grain based operation a 50 TPH boiler will be installed with 61 M height & ESP as APC Equipment. Distillery (Existing) - 16 TPH Boilers are already installed. M.D.C. (Mechanical Dust Collector) as APC equipment along with common Stack of 41M respectively. Effluent: In molasses operations effluent generated will be segregated in strong & weak streams. Raw spentwash is strong stream effluent from molasses based operations. Thereunder, 1440 CMD raw spentwash shall be concentrated in Multiple Effect Evaporator (MEE). The Concentrated Spent wash to the tune of 288 CMD will be incinerated in incineration boiler. Other effluents @1579CMD are weak stream effluent which will be treated in CPU. Treated effluent from CPU will be reused for industrial operations, thereby achieving ZLD for process effluent. One additional CPU will be provided under expansion of 1000 CMD capacity. Moreover, RO unit will be installed to existing CPU for recycling effluent which is not being done presently. Under existing Grain Distillery operations; Wet Cake from. Other effluents generated from the grain distillery plant comprise of FOC lees, PRC lees, Thick Slope, RC less and condensate which are treated in Existing CUP & the treated effluent is reused for watering of Green Belt. It is proposed to reuse this treated water after installing RO unit in existing CPU. After expansion lees & other effluent @ 1157 CMD will be treated in existing & new CPUs having capacity 1000 M3/Day each. Treated effluent from CPU will be reused for industrial operations, thereby achieving ZLD for process effluent. Wet cake i.e. Distillers Wet Grains with Solubles (DWGS-70% moisture) @ 600 MT/D w generated after decantation of spentwash which is sold to farmers as cattle feed. Under expansion it is planned to install dryer which will result in to loss of moisture thereby forming Distillers Dry Grains with Soluble (DDGS- 10% moisture) @200 MT/D. This DDGS has more shelf life & sold as cattle feed.

6
No List of TORs Compliance Hazardous waste: No hazardous waste will be generated from distillery Solid Waste: Distillery (Expansion) - Boiler Ash @ 81 MT/D will be given to Brick Manufacturer. Yeast Sludge @ 39 MT/D & CPU Sludge @ 1 MT/D same will be Burnt in Incineration Boiler.
vii Requirement of water, power, with source of supply, status of approval, water balance diagram, man-power requirement (regular and contract)
• Water Use- Under molasses based distillery - Total after expansion: 2218 CMD (723 (Fresh) +1422 Treated effluent from Molasses Distillery CPU)+ 65(RWH Water)+8 (STP treated water)
• Under Grain based distillery - Total after expansion: 2104 CMD (896 (Fresh) + 65 (RWH Water) +8 (STP treated water) + 1135 Treated effluent from Grain Distillery CPU
• Existing molasses based Distillery : 723 CMD (fresh) • Existing Grain based distillery - 896 CMD (fresh) • Source: Ghatprabha River; Permission from Irrigation Dept.
taken. • Electricity : Source : Own 5.4 MW Cogeneration plant • Man power :197 existing • More details are given in chapter 2, Section 2.7 for Water
requirement viii Process description along with major
equipment’s and machineries, process
flow sheet (quantitative) from raw material to products to be provided
Bagasse Storage: Fire, Sulphur storage: Dust Explosion & fire, SO2
production: Toxic gas leakage, High Pressure Steam: Explosion. Refer Chapter 2, Section 2.6.2 for manufacturing process, and Figure 2.3 to 2.6 for process flow sheet Page 24-31 Appendix – C Page for list of equipment’s. Page No.242-243
ix Hazard identification and details of proposed safety systems.
Molasses Tanks: Rupture & Leakage, Alcohol Tanks: Fire, SO2: Leakage, Safety Valves, Dyke Walls, External Cooing, Flame-proof Electrical Fitting- Fire Fighting System provided, Onsite Emergency Plan have been prepared by industry. Boiler house (explosion- maintenance and operation of boiler by certified boiler attendants), Bagasse & Sulphur storage (fire & explosion- provision of fire extinguishers). Details are elaborated in Chapter - 7, Page 180-191
x Expansion/modernization proposals a. Copy of all the Environmental
Clearance(s) including Amendments thereto obtained for the project from MOEF/SEIAA shall be attached as an Annexure. A certified copy of the latest Monitoring Report of the Regional Office of the Ministry of Environment and Forests as per circular dated 30th May, 2012 on the status of compliance of conditions stipulated in all the existing environmental clearances including Amendments shall be provided. In addition, status of compliance of Consent to Operate for the ongoing/ existing operation of the project from SPCB shall be attached with the EIA-EMP report.
Environmental Clearance (EC) was granted to existing 65 KLPD distillery unit by MoEFCC; New Delhi vide order No. J-11011/224/2008-IA II (I) dated 17th March, 2009. Existing units of distillery unit have been granted Consent for Operate (CFO) by KSPCB are enclosed at Appendix B, Page 233-241.
b. In case the existing project has not Same as above

7
No List of TORs Compliance obtained environmental clearance, reasons for not taking EC under the provisions of the EIA Notification 1994 and/ or EIA Notification 2006 shall be provided. Copies of Consent to Establish/ No Objection Certificate and Consent to Operate (in case of units operating prior to EIA Notification 2006, CTE and CTO of FY 2005 - 2006) obtained from the SPCB shall be submitted. Further, compliance report to the conditions of consents from the SPCB shall be submitted.
4 Site Details i Location of the project site covering
village, Taluka/ Tehsil, District and State, Justification for selecting the site, whether other sites were considered.
Proposed project by Karthik Agro Industries Ltd (KAIPL). is an expansion of grain/molasses based distillery from 65 KLPD to 180 KLPD in the existing premises of standalone distillery 65 KLPD Distillery & 1.4 MW Co-gen Plant. At located at SY NO 92 Hoolageri Village, Tal.: Badami, Dist.: Bagalkote, Karnataka. Refer Chapter – 2, Section 2.3.1, Figure- 2.1, Page 18- 19 for details of location of project.
ii A toposheet of the study area of radius of 10km and site location on 1:50,000/1:25,000 scale on an A3/A2 sheet. (including all eco-sensitive areas and environmentally sensitive places)
Toposheet of project is presented at Chapter – 3, Section 3.3.1, Figure 3.7, and Page 60.
iii Details w.r.t. option analysis for selection of site.
The expansion of distillery will be done within the existing premises of KAIPL at SY NO 92 Hoolageri Village, Tal.: Badami, Dist.: Bagalkote, Karnataka. Industry has sufficient land for implementation of new project and hence no any alternative sites were considered.
iv Co-ordinates (lat-long) of all four corners of the site.
Latitude 16° 8'38.41"N, Longitude 75°35'34.76"E Latitude 16° 8'35.60"N, Longitude 75°35'44.97"E Latitude 16° 8'17.67"N, Longitude 75°35'41.85"E Latitude 16° 8'20.55"N, Longitude 75°35'33.26"E
v Google map-Earth downloaded of the project site.
Refer Chapter – 3 , Figure 3.3, Page 56 for Google image of 10 Km study area around the project site
vi Layout maps indicating existing unit as well as proposed unit indicating storage area, plant area, greenbelt area, utilities etc. If located within an Industrial area/Estate/Complex, layout of Industrial Area indicating location of unit within the Industrial area/Estate.
Plot layout of project is presented at Appendix – A, page No. 232
vii Photographs of the proposed and existing (if applicable) plant site. If existing, show photographs of plantation/greenbelt, in particular.
Photographs of existing project complex are presented at Chapter 1, Figure 1.1, and Page 2. Photographs of existing green belt are presented at Appendix H. Page No. 363-367

8
No List of TORs Compliance viii Landuse break-up of total land of the
project site (identified and acquired), government/private - agricultural, forest, wasteland, water bodies, settlements, etc shall be included. (not required for industrial area).
Total land acquired by KAIPL is 16.18 Ha. Existing built-up area is 1.92 Ha, built-up area proposed under distillery expansion will be 1.55 Ha.
ix A list of major industries with name and type within study area (10 km radius) shall be incorporated. Land use details of the study area.
KAIDB at 3.75 km
x Geological features and Geo-hydrological status of the study area shall be included.
Geological Features: The district is underlain mainly by the crystalline formations namely granites, gneisses, metasediments of Dharwar super group, shales sandstones, quartzites and limestone, basalt and river alluvium. The district is endowed with a fairly rich mineral and rock wealths like limestone, granites, dolomites etc. In the study area, red sandstone can be seen in road sections. Geo-Hydrogeology: The hydrogeology of the study area is governed by depth of weathering and physical nature of sandstone rock. The weathered portions at shallow depth have better porosity and permeability facilitating groundwater movement from surface to the saturated zone. Porosity in sandstone is favorable for movement and storage of groundwater. Natural recharge from rains in monsoon and later from surface water bodies like river, and its tributary streams, canals, ponds, lakes and artificial reservoirs augments the groundwater in non-monsoon season. Refer Chapter – 3, Section 3.6 Page 85 for Geological features and Geo-hydrological status of the study area
xi Details of Drainage of the project up to 5km radius of study area. If the site is within 1km radius of any major river, peak & lean season river discharge as well as flood occurrence frequency based on peak rainfall data of the past 30 years. Details of Flood Level of the project site & maximum Flood Level of the river shall also be provided. (mega green field projects)
Drainage: The KAIPL Project site is situated in Ghatprabha River Basin which is a tributary of Krishna River. Ghataprabha River is nine kilometers north from project site. The first order streams of tributary of Ghataprabha river originate on north sides of the project site and flow northeast to meethe mainstream. The normal annual rainfall in Badami taluka, where the project is situated is around546 mm. Refer Chapter – 3, Section 3.5.4.2 for study of Drainage & Geomorphology. Drainage map is at figure 3.19, 3.20 page 83, 84.
xii Status of acquisition of land. If acquisition is not complete, stage of the acquisition process and expected time of complete possession of the land.
Present project complex land is acquired by KAIPL & expansion project will be implemented in its premises.
xiii R & R details in respect of land in line with state Government policy
No any R & R plan prepared as expansion project will be implemented in existing plant premises.
5 Forest and wildlife related issues (if applicable)
i Permission and approval for the use of forest land (forestry clearance), if any, and recommendations of the State Forest Department. (if applicable) Not Applicable
ii Landuse map based on High resolution satellite imagery (GPS) of the proposed site delineating the forestland (in case of

9
No List of TORs Compliance projects involving forest land more than 40 ha)
iii Status of Application submitted for obtaining the stage I forestry clearance along with latest status shall be submitted.
iv The projects to be located within 10 km of the National Parks, Sanctuaries, Biosphere Reserves, Migratory Corridors of Wild Animals, the project proponent shall submit the map duly authenticated by Chief Wildlife Warden showing these features vis-à-vis the project location and the recommendations or comments of the Chief Wildlife Warden-thereon
v Wildlife Conservation Plan duly authenticated by the Chief Wildlife Warden of the State Government for conservation of Schedule I fauna, if any exists in the study area
vi Copy of application submitted for clearance under the Wildlife (Protection) Act, 1972, to the Standing Committee of the National Board for Wildlife
6 Environmental Status October 2020- November 2020 – December 2020 i Determination of atmospheric inversion
level at the project site and site-specific micrometeorological data using temperature, relative humidity, hourly wind speed and direction and rainfall.
By using Meteorological data the wind rose have been plotted. Same are reflected in Chapter 4, figure 4.2, Page 135.
ii AAQ data (except monsoon) at 8 locations for PM10, PM2.5, SO2, NOx, CO and other parameters relevant to the project shall be collected. The monitoring stations shall be based CPCB guidelines and take into account the pre-dominant wind direction, population zone and sensitive receptors including reserved forests.
8 Locations – Industrial Site, Bagalkote, Gaddanakeri, Suliker, Tulasigere, Kerkalmaui, Jalageri, Kerkalmatti was carried out. Baseline data indicates that ranges of Concentrations of PM10 (54.45-64.15), PM2.5 (19.17 – 22.55), SO2 (18.65 – 26.06), NOX (30.76 – 24.45), CO (0.080 – 0.90) respectively. Refer Chapter – 3, Section 3.9.2, Table 3.15 Page 96-101 Annexure - III for AAQM Report, Page 485-492 iii Raw data of all AAQ measurement for
12 weeks of all stations as per frequency given in the NAAQM Notification of Nov. 2009 along with - min., max., average and 98% values for each of the AAQ parameters from data of all AAQ stations should be provided as an annexure to the EIA Report.
iv Surface water quality of nearby River (100 M upstream and downstream of discharge point) and other surface drains at eight locations as per CPCB/ MoEF&CC guidelines.
6 Locations – Hoolageri, Hoolageri, Hoolageri, Muchakhandi, Chickka-Shellikeri, Yadahalli. It is observed that, Water at all sites is found neutral in nature. BOD values were in the range of 6.87 – 20.82 mg/l while COD ranges from 16.25 – 55. 63 mg/l. TDS values ranges from 14.05 to 61.99 mg/l. It is also seen that, at some locations values of TDS & The total hardness exceeded

10
No List of TORs Compliance the limit. Further, at all sites, water samples showed presence of total coliforms and fecal coliforms which are above the prescribed permissible limits. For more information, Refer Chapter – 3, Section 3.7, Table 3.10, Page 83-88 for surface water location. Annexure – IV for Page – 493-496
v Whether the site falls near to polluted stretch of river identified by the CPCB/ MoEF&CC, if yes give details.
No any polluted stretch of river identified by CPCB/MoEFCC
vi Ground water monitoring at minimum at 8 locations shall be included.
Ground water collected from 8 different locations from 10 Km Study area. pH values were observed in the range of 7.32 to 7.94. TDS were found in the range of 194.77 mg/l to 382.06 mg/l. COD values observed in the range of 18.25 mg/l to 34.68 mg/l and that for BOD in the range of 7.79 mg/l to 13.41 mg/l. At all sites, water samples showed presence of total coliforms and fecal coliforms. Ground water results of these sample sites showed that the water is chemically as well as biologically not potable. For more information, Refer Chapter – 3, Section 3.7, Table 3.11, Page 89-93 for ground water location. Annexure - V Page 497-502
vii Noise levels monitoring at 8 locations within the study area.
The monitoring was carried out on 24-hourly basis and the hourly Leq. values were derived and 8 Locations from village Site Project Site, Kerkalmath, Gangan Budihal, Kagalgomb, Gaddanakeri L, Simikeri, Hosanmumal, Yedanali. Leq(day) ranges from 51.3 to 66.2 dB(A), Leq(night) ranges from 40.8 to 63.1 dB(A), Leq(dn) ranges from 51.4 to 70.1 dB(A). For more information, Refer Chapter – 3, Section 3.10, Table 3.21 Page 105 for noise level monitoring results. Annexure VI - Pg. 503-504.
viii Soil Characteristic as per CPCB guidelines.
Soil quality monitoring was carried around the study area for 8 Locations – Hoolageri, Hoolageri, Ganganbudihal, Simileri, Kagalgomb, Yaragoppa Inam, Karagri, Kalasakoppa (Refer Chapter – 3, Section 3.4, Table 3.6, and Page 66-69 for soil location. Annexure - I for Soil Monitoring Report, Pg. 457-460
ix Traffic study of the area, type of vehicles, frequency of vehicles for transportation of materials, additional traffic due to proposed project, parking arrangement etc.
Types & Frequency of vehicles –Tractor trolley (15 Nos.) Tankers – (20 Nos.), Trucks (18 Nos.), Ample parking space is provided. Refer Chapter – 2, Table 2.8, page 23 for transportation details.
x Detailed description of flora and fauna (terrestrial and aquatic) existing in the study area shall be given with special reference to rare, endemic and endangered species. If Schedule-I fauna are found within the study area, a Wildlife Conservation Plan shall be prepared and furnished.
Habitats : Terrestrial - open scrub, fallow and agriculture, Aquatic - Rivers, Streams, Tanks, ponds Fauna: A total of 34 bird species belonging to 11 orders, 23 families and 31 genera were recorded during the brief field survey. Out of these 23 species were common resident, 8 species were not common resident, 2 species were not common winter visitors and 1 species is common winter visitors Flora: 7 trees and 2 shrub species were observed during field investigation, dominant tree species being Acacia nilotica, Azadirachta indica, Tamarindus indica and Prosopis sp. Considering relatively limited study sites, short study duration, the brief opportunistic observations are considerable. For more details refer Chapter 3, Section 3.12. Page 120-127
xi Socio-economic status of the study area. Survey was carried out in 10 villages within 10 Km study area. Findings: male population –53%, female population – 47%, Main
11
No List of TORs Compliance occupation – agriculture (40%), Service (9%), Private Business (15%) Other waged labour (35%) & Govt. Jobs (1%) satisfactory educational facilities. Refer Chapter – 3, section 3.11, Page 106-120 for details of socio-economic profile of study area.
7 Impact and Environment Management Plan
i Assessment of ground level concentration of pollutants from the stack emission based on site specific meteorological features. In case the project is located on a hilly terrain, the AQIP Modeling shall be done using inputs of the specific terrain characteristics for determining the potential impacts of the project on the AAQ. Cumulative impact of all sources of emissions (including transportation) on the AAQ of the area shall be assessed. Details of the model used and the input data used for modeling shall also be provided. The air quality contours shall be plotted on a location map showing the location of project site, habitation nearby, sensitive receptors, if any.
Output of GLC run for various scenarios in respect of activities to be undertaken under KAIPL expansion project for new boiler is carried out & presented in Chapter 4, Section 4.3.1.2, Page 134-143.
ii Water Quality modeling - in case of discharge in water body
The Industry is ZLD. No Discharge in any Water Body
iii Impact of the transport of the raw materials and end products on the surrounding environment shall be assessed and provided. In this regard, options for transport of raw materials and finished products and wastes (large quantities) by rail/rail-cum road transport or conveyor cum- rail transport shall be examined.
Entire transportation of products and raw material shall be done by road. No major and permanent impact expected. Raw materials and products are transported by road through trucks, tractors etc.
iv A note on treatment of wastewater from different plant operations, extent recycled and reused for different purposes shall be included. Complete scheme of effluent treatment. Characteristics of untreated and treated effluent to meet the prescribed standards of discharge under E (P) Rules.
Molasses based Distillery (Expansion): Raw Spentwash shall be conc. in Multi Effect Evaporator (MEE). Conc. Spentwash shall be burnt in incineration boiler. Grain based Distillery (Expansion): After expansion lees & other effluent @ 1157 CMD will be treated in existing & new CPUs having capacity 1000 M3/Day each. Treated effluent from CPU will be reused for industrial operations, thereby achieving Zero Liquid Discharge (ZLD) for process effluent. .Domestic effluent will be treated in STP. Refer Chapter –2, Section 2.7, page 32-35 for detailed treatment of wastewater. Refer fig 2.8,2.9,2.10 for flow diagram of CUP, ETP and STP etc.
v Details of stack emission and action plan for control of emissions to meet standards.
The stack emissions from boiler shall be TPM, SO2, CO & NOX. Under proposed molasses based operations a new 40 TPH incineration boiler will be installed on site. Coal (166 MT/D) Bagasse (400 MT/D) + Spentwash (388 MT/D) used as a fuel with 100 M height & ESP as APC Equipment. Under Grain based operation a 50 TPH boiler will be installed. Husk (225 MT/D) /

12
No List of TORs Compliance Bagasse (500 MT/D) will be used as a fuel with 61 M height & ESP as APC Equipment. Refer Chapter – 2, Section 2.7.2, Table 2.20, and Page 39 for action plan of stack emissions.
vi Measures for fugitive emission control Sources: mill house, sugar bagging, bagasse, pressmud ash storage yard, internal kuccha roads, bagasse conveyor; feeding section, improper function of APC equipment etc. Measures : Proper exhaust & ventilation arrangements, monitoring of proper working of pollution control equipments, proper handling; storage& disposal of dust collected, use of PPE’s for staff and workers, augmentation of existing green belt with adequate density, provision of properly surfaced internal roads and work premises (tarred and concrete). Refer Chapter – 2, Section 2.7.2.1, Page 44
vii Details of hazardous waste generation & their storage, utilization & management. Copies of MOU regarding utilization of solid and hazardous waste in cement plant shall also be included. EMP shall include the concept of waste - minimization, recycle/reuse/recover techniques, Energy conservation, & natural resource conservation.
No hazardous waste will be generated from distillery.
viii Proper utilization of fly ash shall be ensured as per Fly Ash Notification, 2009. A detailed plan of action shall be provided.
Presently, Boiler Ash @ 29 MT/D will be given to Brick Manufacturer. Yeast Sludge @ 14 MT/D & CPU Sludge @ 1 MT/D same will be Burnt in Incineration Boiler. Distillery (Expansion) - Boiler Ash @ 81 MT/D will be given to Brick Manufacturer. Yeast Sludge @ 39 MT/D & CPU Sludge @ 1 MT/D same will be Burnt in Incineration Boiler Details Refer Chapter – 2, Table 2.29, Page 44 for details
ix Action plan for the green belt development plan in 33 % area i.e. land with not less than 1,500 trees per ha. Giving details of species, width of plantation, planning schedule etc. shall be included. The green belt shall be around the project boundary and a scheme for greening of the roads used for the project shall also be incorporated.
Under KAIPL project complex an area of about 6.4 Ha is already developed under green belt. Which is about 40 % of total plot area. Which is sufficient as per norm of i.e Green belt should be 33% of total plot area. Hence there will not be any propose area under green belt. Refer Chapter – 2, Section 2.8 Page 47- 49 for details of green belt and Appendix – H for green belt development plan Page 363-367
x Action plan for rainwater harvesting measures at plant site shall be submitted to harvest rainwater from the roof tops and storm water drains to recharge the ground water and also to use for the various activities at the project site to conserve fresh water and reduce the water requirement from other sources.
Rain Water Harvesting (RWH) measures through surface & rooftop shall be done under expansion unit. Rooftop Harvesting: 1,966.78 M3 Surface Harvesting: 19,220.1 M3 About 21,186.88 M3 of rainwater become available during every season from the Rooftop harvesting operations. Detailed about rainwater harvesting presented at Chapter – 2, Section 2.9, Page 50-51.
xi Total capital cost and recurring cost/annum for environmental pollution control measures shall be included.
Capital cost for environmental pollution control under proposed project will be Rs. 7905 Lacs and recurring cost will be Rs 820 Lacs. For details refer Chapter – 2, section 2.7.9, Table 2.30, Page 46 - 47
xii Action plan for post-project environmental monitoring shall be submitted.
Regular monthly & quarterly monitoring is being done by industry. Same practices shall be continued after expansion. Refer Chapter – 6, Table 6.7 Page 179

13
No List of TORs Compliance xiii Onsite and Offsite Disaster (natural and
Man-made) Preparedness and Emergency Management Plan including Risk Assessment and damage control. Disaster management plan should be linked with District Disaster Management Plan.
Refer Chapter – 7, Section 7.8, Page 189
8 Occupational health i Plan and fund allocation to ensure the
occupational health & safety of all contract and casual workers
Under proposed activities Rs. 50 Lakhs will be allocated for Occupational Health & Safety of workers. Refer Chapter – 2, section 2.7.9, Table 2.30, Page 46 - 47
ii Details of exposure specific health status evaluation of worker. If the workers' health is being evaluated by pre designed format, chest x rays, Audiometry, Spirometry, Vision testing (Far & Near vision, colour vision and any other ocular defect) ECG, during preplacement and periodical examinations give the details of the same. Details regarding last month analyzed data of above mentioned parameters as per age, sex, duration of exposure and department wise.
Occupational Health Center is provided at site. Regular medical checkup of employees is being done for existing unit. Pre & post medical check-ups done. Employees are regularly examined & medical records are maintained. Pulmonary function test, Chest X-ray, Audiometric Test, Spirometry, Vision test, ECG are conducted. All health & safety measures provided to workers. Health Check-up Reports of workers are enclosed at Appendix- O, Page 403-408.
iii Details of existing Occupational & Safety Hazards. What are the exposure levels of hazards and whether they are within Permissible Exposure level (PEL). If these are not within PEL, what measures the company has adopted to keep them within PEL so that health of the workers can be preserved,
Release of toxic chemicals & materials (Molasses), gases & fumes (SO2), accidents due to explosion & fire, Noise exposure. More details are given in Chapter 7, Page 180-191
iv Annual report of health status of workers with special reference to Occupational Health and Safety.
Health checkup reports are presented at Appendix- O, Page 403-408.
9 Corporate Environment Policy i Does the company have a well laid down
Environment Policy approved by its Board of Directors? If so, it may be detailed in the EIA report.
EHS policy is presented at Appendix- P, Page 409-410.
ii Does the Environment Policy prescribe for standard operating process /procedures to bring into focus any infringement /deviation/ violation of the environmental or forest norms/conditions? If so, it may be detailed in EIA.
iii What is the hierarchical system or Administrative order of the company to deal with the environmental issues and for ensuring compliance with the environmental clearance conditions? Details of this system may be given.
EMC has been formed with qualified and experienced staff. The cell works under Chairperson of the industry and Directors, Environment and Safety Officer, Lab Analyst, ETP Operators and other qualified and experienced responsible persons from certain departments have been taken as members. The EMC is responsible for all the activities and actions as well as outputs and management of entire infrastructure provided for control and
14
No List of TORs Compliance abatement of pollution in the KAIPL project. Further, the cell is also active in protecting state of environment in the study area around existing campus of KAIPL. Various programs and tasks towards conservation, awareness, promotion, review etc. are undertaken and implemented through the existing environmental management cell. EMC (9 Nos.) has been formed with qualified & experienced staff. Refer Chapter 10, Figure 10.1, Page 198
iv Does the company have system of reporting of non-compliances / violations of environmental norms to the Board of Directors of the company and / or shareholders or stakeholders at large? This reporting mechanism shall be detailed in the EIA report
Yes, the system is followed by the industry & necessary compliance are done as per schedules & requirements Refer Chapter 10, Table 10.1, Page 198 for Environmental Management Cell and their responsibilities.
10 Details regarding infrastructure facilities such as sanitation, fuel, restroom etc. to be provided to the labour force during construction as well as to the casual workers including truck drivers during operation phase.
All basic facilities are provided by KAIPL to its casual workers including truck drivers during operation phase. Same practices will be implemented after proposed also. For the construction workers, the existing facilities will be made available. Further, temporary sheds would be provided to the workers under project.
11 Enterprise Social Commitment (ESC) i Adequate funds (at least 2.5 % of the
project cost) shall be earmarked towards the Enterprise Social Commitment based on Public Hearing issues and item-wise details along with time bound action plan shall be included. Socio-economic development activities need to be elaborated upon.
As per OM dated 01 May, 2018, funds to be allocated for CER activities for distillery expansion project shall be 0.75% of capital cost of project. About Rs. 112.5 Lakhs has been earmarked for CER activities to be undertaken in the study area for next 5 years. An amount of Rs. 112.5 Lakh. Shall allocated towards CER for next 5 years. There under activities such as – Arrangement of Drinking Water Supply Infrastructure, Solar Photovoltaic Energy Refer Chapter – 6, Section 6.3.10, Table 6., page 175
12 Any litigation pending against the project and/or any direction/order passed by any Court of Law against the project, if so, details thereof shall also be included. Has the unit received any notice under the Section 5 of Environment (Protection) Act, 1986 or relevant Sections of Air and Water Acts? If so, details thereof and compliance/ATR to the notice(s) and present status of the case.
No any litigation is pending against the industry.
13 A tabular chart with index for point wise compliance of above TOR.
Refer Chapter 1, Section 1.4, Page 5-16
B Specific ToRs for EIA Studies for Distilleries
1 List of existing distillery units in the study area along with their capacity and sourcing of raw material
No any distillery is present in 10 Km study area.
2 Number of working days of the distillery unit Distillery will be operated for 330 days. 3 Details of raw materials such as molasses/
grains, their sources with availability List of Raw Materials-
Industrial unit
Name of Raw Material
Quantity(MT/M) Existing Expansio
n Total
Distillery (65-180
Grains (Brocken Rice, Maize) / Molasses
4890 / 7350
8610 / 13050
13500 / 20400

15
No List of TORs Compliance KLPD) Yeast 5.7 9.6 15.3
Urea 44.7 78.6 123
De-foaming Oil 223 394 617 Alcozyme G Pro 0.03 0.06 0.09 Anzyme Liquiflow Yield (Liquification)
1.8 3.3 5.1
Saczyme Yield (Sacrification)
4.5 8 12.6
Source: Molasses-open tender, Nearby Sugar Factories, Grains – Nearby talukas, other raw materials from local vendors.
4 Details of the use of steam from the boiler Steam required for distillery operations shall be taken from existing as well as proposed incineration boiler.
5 Surface and Ground water quality around proposed spentwash store lagoon, and compost yard
Piezometers will be installed to assess ground water quality.
6 Plan to reduce spent wash generation within 6-8 KL/KL of alcohol produced.
To reduce the spentwash generation, a yeast culture Saccharomyces cerevisiae will be used. By using this culture there will be reduction in spentwash generation (8 KL/KL of alcohol) shall be achieved.
7 Proposed effluent treatment system for molasses/ grain based distillery (spent wash, spentlees, condensate and utilities) as well as domestic sewage and scheme for achieving zero effluent discharge (ZLD).
In molasses operations effluent generated will be segregated in strong & weak streams. Raw spentwash is strong stream effluent from molasses based operations. Thereunder, 1440 CMD raw spentwash will be generated. Same shall be concentrated in Multiple Effect Evaporator (MEE). The Concentrated Spent wash to the tune of 288 CMD will be incinerated in incineration boiler. Other effluents generated @1579CMD in the form of spent lees @ 288 CMD, condensate @ 1152 CMD, cooling, boiler blow down, lab-wash & DM backwash @ 142 CMD are weak stream effluent which will be treated in CPU. Treated effluent from CPU will be reused for industrial operations, thereby achieving Zero Liquid Discharge (ZLD) for process effluent. One additional CPU will be provided under expansion of 1000 CMD capacity. Moreover, RO unit will be installed to existing CPU for recycling effluent which is not being done presently. Under existing Grain Distillery operations; Wet Cake from decantation operation and Thin Slop from MEE are mixed together and this mixture known as DWGS (Distillers’ Wet Grain with Solubles) is used as Cattle
Feed. Other effluents generated from the grain distillery plant comprise of FOC lees, PRC lees, Thick Slope, RC less and condensate which are treated in Existing CUP & the treated effluent is reused for watering of Green Belt. It is proposed to reuse this treated water after installing RO unit in existing CPU. After expansion lees & other effluent @ 1157 CMD will be treated in existing & new CPUs having capacity 1000 M3/Day each. Treated effluent from CPU will be reused for industrial operations, thereby achieving Zero Liquid Discharge (ZLD) for process effluent. Wet cake i.e. Distillers Wet Grains with Solubles (DWGS-70% moisture) @ 600 MT/D w generated after decantation of spentwash which is sold to farmers as cattle feed. Under expansion it is planned to install dryer which will result in to loss of moisture thereby forming Distillers Dry Grains with Soluble (DDGS- 10% moisture) @200 MT/D. This DDGS has more shelf life & sold as cattle feed.

16
No List of TORs Compliance 8 Proposed action to restrict fresh water
consumption within 10 KL/KL of alcohol production.
Under molasses based distillery - Total after expansion: 2218 CMD (723 (Fresh) +1422 Treated effluent from Molasses Distillery CPU)+ 65 (RWH Water)+8 (STP treated water) Under Grain based distillery - Total after expansion: 2104 CMD (896 (Fresh) + 65 (RWH Water) +8 (STP treated water) +1135Treated effluent from Molasses Distillery CPU). Existing molasses based Distillery : 964 CMD (fresh )Existing Grain based distillery - 1004 CMD (fresh) Refer Chapter 2, Section 2.7.1, Table 2.14 at Page 32-33
9 Details about capacity of spentwash holding tank, material used, design consideration, No. of piezometers to be proposed around spent wash holding tank.
A 5 day spentwash storage tank is provided on site, constructed as per CREP norms. Refer Chapter 2, Section 2.7.1 Figure: 2.9, page 37
10 Action plan to control ground water pollution No any effluent/ waste shall be discharged in surface / ground water. Excess cane condensate as well treated effluent will be used for gardening in own premises.
11 Details of solid waste management including management of boiler ash, yeast etc. Details of incinerated spentwash ash generation and its disposal.
Presently, Boiler Ash @ 39 MT/D will be given to Brick Manufacturer. Yeast Sludge @ 14 MT/D & CPU Sludge @ 1 MT/D same will be Burnt in Incineration Boiler. Distillery (Expansion) - Boiler Ash @ 81 MT/D will be given to Brick Manufacturer. Yeast Sludge @ 39 MT/D & CPU Sludge @ 1 MT/D same will be Burnt in Incineration Boiler Details Refer Chapter – 2, Table 2.29, Page 44 for details
12 Details of bio-composting yard (if applicable) Under Molasses based distillery - Raw Spentwash from existing 65 KLPD plant shall be conc. in Multi Effect Evaporator (MEE). Conc. Spentwash shall be burnt in incineration boiler. Same process will be followed after expansion. Under Grain based distillery - Wet will be generated after decantation of spentwash, sold to farmers as cattle feed. This wet cake further dried in dryers will result in to loss of moisture thereby forming Distillers Dry Grains with Soluble. This DDGS has more shelf life & sold as cattle feed. Refer chapter 2 Section 2.7.1, table 2.16, 2.17, Page 34-35
13 Action plan to control odour pollution Odour: Molasses handling and storage, Fermenters, effluent storage; treatment & disposal, effluent carrying drains, sludge storage areas etc. Adoption of GMPs, awareness and training for workers, use of PPEs near odour potential prone areas. Collection of yeast sludge from fermentation section in closed silo system, its dewatering (mechanical) and immediate disposal through incineration in boiler.
14 Arrangement for installation of continuous online monitoring system (24x7 monitoring device)
KAIPL has installed online monitoring system to its existing boiler stack. Same practices will be followed after expansion.

17
Chapter 2
Project Description
2.1 TYPE OF PROJECT
Proposed project by Karthik Agro Industries Pvt. Ltd, is an Expansion of Grain /Molasses based Distillery from 65 to180 KLPD along with electricity generation from 1.4 MW to 5.4 MW. By Karthik Agro Industries Pvt. Ltd (KAIPL) At: Sy No 92 Hoolageri Village, Tal: Badami, Dist.: Bagalkote, Karnataka.
2.2 NEED OF THE PROJECT
The production of alcohol is gaining more importance with regards to production, usage, easy availability of raw materials. With an increase in business, it has a considerable share in national income. Further, there is a good demand for alcohol in the country as well as production and consumption of alcohol in India is quite balanced. Alcohol is blended with petroleum fuels, used in medicines &drugs in pharmaceutical industry, utilized in perfumes, cosmetics and vegetable essences, in manufacture of IMFL & Country Liquors. Apart from this, following are also needs of the project.
This project proposal shows the techno-economic viability of the distillery cum –Slop Fired Boiler (Ethanol and ENA) for the production of the fuel alcohol (Ethanol) as well as Extra Neutral Alcohol (ENA) from Molasses and Grains. Currently the country has a burden of foreign currency expenditure for supplying the growing gasoline and Petrol demand and this is becoming worse as the price of petroleum increases. Hence, using alternative primary fuel sources to these fuels is essential in order to pace with the increase demand for fuel.
The production of Ethanol from Molasses is one of the cheapest solutions of this fuel supply. The government is therefore willing to manufacture Ethanol which can be mixed with gasoline in fixed proportions and substituting Petrol and Diesel considering the sugar industry as a primary source for this form of supplemental fuel production.
In light of same the Ministry of Petroleum and Natural Gas formally released the document National Policy on Biofuels 2018, which proposed blend targets of E20 and B5 be met by 2030.
The new ethanol-blending program (EBP) stipulates procurement of ethanol produced directly from B-Heavy Molasses, Sugarcane Juice, and damaged Food Grains such as wheat and broken rice. Damaged food grains are allowed when they are unfit for human consumption and under surplus conditions.
2.2.1 Employment Generation Potential
Increase in employment would improve the socio-economic status of people in the study area in terms of local labour employment and contract basis jobs. Whenever there is planning towards new establishment or enhancement of production then always there is requirement of additional manpower. But in case of proposed expansion project as the plant will be based on PLC no additional manpower will be required. Details on number of workers employed which are 90% from local areas under existing project is presented under Table No.2.1.
Table 2.1 Details of Manpower
No. Unit Existing
Skilled Unskilled 1 Distillery 86 111 Grand Total 197

18
2.2.2 Potential of the Products
Under proposed project products like RS/ ENA /Ethanol will be manufactured. ENA is used in the production of alcoholic beverages such as whisky, vodka, gin, cane, liqueurs, and alcoholic fruit beverages and aperitifs. Apart from this, it also serves as an essential ingredient in the manufacturing of several cosmetics and personal care products, such as perfume, toiletries, cologne, hair spray, air fresheners, detergents, etc. As a good solvent, it is used in the production of some lacquers, paints and ink for the printing industry, besides being used in pharmaceutical products in products such as antiseptics, drug, syrups, medicated sprays, etc. The market for ENA in India has reached a value of INR 90.4 Billion in 2020. As per forecast of experts, the market is likely to continue its strong growth during 2021-2026.
Ethanol produced from proposed project has a demand for blending in petrol/diesel after making anhydrous alcohol from the conventional rectified spirit. In 2014, less than 1% ethanol was being blended with petrol against the target of 5%. Now, this ratio has reached 8.5% and next year it is going to be 10%. The government have set a target of reaching 10% ethanol-blending by 2022 (10% of ethanol mixed with 90% of petrol) - and 20% by 2030. The electricity produced from proposed Captive Power Plant shall be used for industrial operations thereby reducing dependency on Karnataka Power Corporation Limited.
2.3 LOCATION
The proposed expansion activities would be carried out in existing premises At: Sy No 92 Hoolageri Village, Tal.: Badami, Dist.: Bagalkote, Karnataka. The geographical location of the site is16°8'29.08"N latitude and 75°35'38.05"E longitude. While making selection of site for existing activities of KAIPL; certain aspects were taken in to consideration prominently. Same were namely - (1) availability of all basic facilities like water, electricity, man power, raw material such as molasses etc., (2) rail and road links to prominent market places so that procurement of raw material as well as marketing of finished product was easier and economical, (3) availability of good communication facilities and (4) no rehabilitation and resettlement required, (5) no national park or wildlife habitats were located in immediate vicinity of the project site.
Table 2.2 Salient Features of Project Site
No Particulars Details 1 Name and Address of the Industry Karthik Agro Industries Pvt. Ltd. (KAIPL), Hoolageri
Village, Taluka: Badami, District: Bagalkote (Karnataka) Gat No. 89, 92, 93, 94
2 Land acquired by the Industry 1,61,874 Sq.M. (16.18 Ha) 3 Elevation 572 M above MSL 4 Nearest habitation Kerkalmatti Village (1.77 Km) 5 Nearest city Bagalkot (8 Km) 6 Nearest highway NH-52 (0.89Km) East 7 Nearest railway station Bagalkote Railway Station (12.06 Km) North - East 8 Nearest airport Belagaum Airport (111.25 Km). 9 Nearest tourist place(s) Badami(24),Hampi (128.89 Km)
10 Defense installations Nil within 10 Km radius 11 Archaeological important Nil within 10 Km radius, Badami Cave Temples, a
UNESCO world heritage site at24 km distance from the site. 12 Critically / Severely polluted areas
declared by CPCB/MoEFCC Nil within Study Area of 10 Km radius
13 Ecological sensitive zones Nil within 10 Km radius
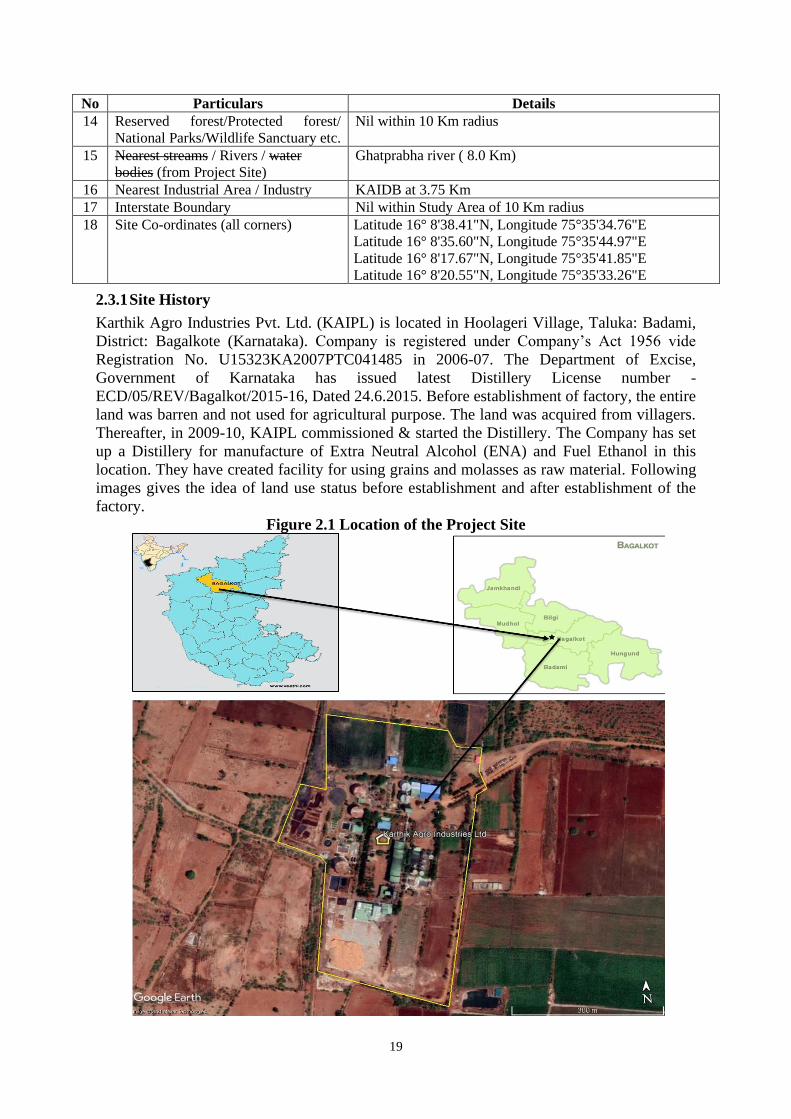
19
No Particulars Details 14 Reserved forest/Protected forest/
National Parks/Wildlife Sanctuary etc. Nil within 10 Km radius
15 Nearest streams / Rivers / water bodies (from Project Site)
Ghatprabha river ( 8.0 Km)
16 Nearest Industrial Area / Industry KAIDB at 3.75 Km 17 Interstate Boundary Nil within Study Area of 10 Km radius 18 Site Co-ordinates (all corners) Latitude 16° 8'38.41"N, Longitude 75°35'34.76"E
Latitude 16° 8'35.60"N, Longitude 75°35'44.97"E Latitude 16° 8'17.67"N, Longitude 75°35'41.85"E Latitude 16° 8'20.55"N, Longitude 75°35'33.26"E
2.3.1 Site History
Karthik Agro Industries Pvt. Ltd. (KAIPL) is located in Hoolageri Village, Taluka: Badami, District: Bagalkote (Karnataka). Company is registered under Company’s Act 1956 vide
Registration No. U15323KA2007PTC041485 in 2006-07. The Department of Excise, Government of Karnataka has issued latest Distillery License number - ECD/05/REV/Bagalkot/2015-16, Dated 24.6.2015. Before establishment of factory, the entire land was barren and not used for agricultural purpose. The land was acquired from villagers. Thereafter, in 2009-10, KAIPL commissioned & started the Distillery. The Company has set up a Distillery for manufacture of Extra Neutral Alcohol (ENA) and Fuel Ethanol in this location. They have created facility for using grains and molasses as raw material. Following images gives the idea of land use status before establishment and after establishment of the factory.
Figure 2.1 Location of the Project Site

20
Figure 2.2 Images Showing Site History
Land use Status of KAIPL – Year 2005
Land use Status of KAIPL – Year 2019

21
2.4 DETAILS OF LAND REQUIREMENT
Table 2.3Details of Area Break Up
No. Description Area. (Sq. m)
Existing Expansion Total
1 Total Plot Area 1,61,874 -- 1,61,874 2 Total Built up Area i. Captive Power Plant
19250 15550 34800 ii. Distillery Total Built Up area 19250 15550 34800 3 Area Under Road 16000 16000 4 Parking Area 32375 32375 % on Total Plot Area 20% 20% 5 Green Belt Area 64,000 -- 64,000 % on Total Plot Area 40% 40% 6 Total Open Area 30,249 14,699
2.5 PROJECTOPERATIONS, APPROVALS & IMPLEMENTATION
Proposed expansion project would be implemented only after obtaining requisite approvals, permissions, consents from concerned authorities namely KPCB and MoEFCC. Project would be formulated in such a fashion and manner so that the utmost care of safety norms and environment protection measures shall be taken. Activities in operation at KAIPL project complex are-
1. Manufacturing of 65 KLPD Alcohol from Grain Based/ Molasses. 2. Generation of f 1.4 MW Captive Power Plant
Environmental Clearance (EC) is procured for existing 65 KLPD distillery unit from MoEFCC; New Delhi vide order No. J-11011/224/2008-IA II (I) dated 17th March, 2009. Subsequently, the project have been granted Consent to Operate (CTO) by KSPCB. Copy of same is presented at Appendix-B. The 1.4 MW Co- Gen Plant on site do not attract the condition of prior Environmental Clearance as per the EIA Notification No. S.O. 1533 (E) dated 14.09.2006 and amendments thereto. Therefore, Consent from Pollution Control Board is procured for same. Details on days of operation of distillery & Cogen Plant is given in Table 2.4.
Table 2.4Working Pattern
No. Type of Activity Days of Operation 1 Distillery (Grains/Molasses) 330 2 Co-gen Plant 330
2.5.1. Plan for Approval and Implementation Schedule
Table 2.5 Plan for Project Implementation Schedule
No Activity Approval / Implementation Schedule 1 Grant of EC by MoEFCC; New Delhi January 2022 2 Application for CTE to KSPCB February 2022
Total land acquired by KAIPL is16.18 Ha. Existing built-up area of Distillery is 1.9 Ha, Additional built-up area proposed under expansion is 1.55 Ha. Detailed area break-up is presented at Table 2.3. It could be seen that sufficient land is available with KAIPL for expansion of distillery. Refer Appendix-A for plot layout plan of project site

22
No Activity Approval / Implementation Schedule 3 Construction and Erection of Machinery March 2022 4 Application for CTO to KSPCB September 2022 5 Trials & Commissioning of Project October 2022
2.6 TECHNOLOGY &PROCESS DESCRIPTION
2.6.1 Products
Details of products that are being manufactured under existing distillery as well as those to be manufactured under expansion are represented in Table 2.6.
Table 2.6List of Products & By-products
Industrial Unit Products & By-products Units Quantities Existing Proposed Total
Distillery (65 to 180 KLPD)
Rectified Spirit/ ENA/ Ethanol/ Absolute Alcohol (AA)
KL/M 1950 3450 5400
By-product DWGS MT/M 6540 11460 18000 DDGS (10% Moisture) MT/M -- 6000 6000 Fusel Oil MT/M 3.6 6.6 10.2 CO2 MT/M 1620 2880 4500
Co-gen (1.4 to 5.4 MW)
Power MW 1.4 4.0 5.4
Carbon dioxide (CO2) generated from both Grain & molasses based distillery operations will be recovery plant, further purified and sold in market. Dry Grain Soluble/ Wet Grain Soluble generated from grain based distillery will be used as cattle feed.
2.6.2 Raw Materials for Integrated Project
Basic raw materials required for Distillery along with their quantities and sources are listed in the table 2.7.Refer Appendix-C for list of equipment under existing as well as expansion project.
Table 2.7List of Raw Materials
Industrial unit Name of Raw Material
Quantity(MT/M) Source
Existing Expansion Total
Distillery (65-180 KLPD)
Grains (Brocken Rice, Maize) / Molasses
4890 / 7350
8610 / 13050
13500 /
20400
Grain from Nearby Talukas & Molasses through open tender. Nearby sugar Factories, Refineries.
Yeast 5.7 9.6 15.3
Local Vendors
Urea 44.7 78.6 123 De-foaming Oil 223 394 617 Alcozyme G Pro 0.03 0.06 0.09 Anzyme Liquiflow Yield (Liquification)
1.8 3.3 5.1
Saczyme Yield (Sacrification) 4.5 8 12.6
2.6.3 Products and Raw Materials Storage& Transportation Details
Grains (Brocken Rice, Maize) which is made available from local market or local farmers and Molasses from nearby sugar factories shall be purchase through tendering. Raw material is transported to site by roads. Grains are stored in silo on site. Refer table 2.8 for raw material storage details.

23
Table 2.8 Raw Material Transportation Details (Traffic Density)
No. Type of Vehicle Avg. wt. (MT) / Vehicle
Daily No. of Vehicles
Raw Material (MT)
A Molasses Tanker 20 34 680 B Grains 1 Tractor Trolleys 15 15 225 2 Trucks 18 13 234 Total 15 459
Table 2.9 Product & By-product Transportation Details
No. Product Type of Vehicles
Frequency of Vehicle/Day
Avg. Vehicle Capacity
Quantity of Final Product Transported
1 Alcohol Tanker 6 30-40 KL 180 KLPD 2 DDGS/DWGS Tractor 8-9 25 MT 200 TPD
Table 2.10 Raw Material Storage Details
No. Description Details Grain Storage Molasses Storage Existing After Expansion Existing
1 Capacity 2500 MT Each 2500 MT Each 8300 MT Each 2 No. of Silos 2 4 2 3 Type Covered Covered Covered 4 Dimensions 18.3M Dia X 15.8
M Ht.(Each) 18.3M Dia X 15.8
M Ht.(Each) 25.5 M Dia X 11.75
M Ht.(Each)
Table 2.11 Product Storage Details (Existing)
No Description Height(M) Dia. (M) Capacity (Lakh Lit.)
1 RS Storage Tanks Tank No. 03 (ENA Storage Tank) 12,500 9,600 9,04,779 Tank No. 04 (ENA Storage Tank) 12,500 9,600 9,04,779 Tank No. 20 ( ENA Storage Tank) 12,530 9,600 9,06,950 Tank No. 12 (ENA Receiver Tank) 5,250 4,300 76,241 Tank No. 13 (ENA Receiver Tank) 5,250 4,300 76,241 Tank No. 14 ( ENA Receiver Tank) 5,250 4,300 76,241 Tank No. 15 (ENA Receiver Tank) 5,250 4,300 76,241
Total 30,21,472 2 Impure Spirit / Tech. Alcohol
Tank No. 05 (Storage Tank) 12,500 9,600 9,04,779 Tank No. 09(Receiver Tank) 3,000 2,000 9,425 Tank No. 10 (Receiver Tank) 3,000 2,000 9,425 Tank No. 11 (Receiver Tank) 3,000 2,000 9,425
Total 9,33,054 3 Fuel Ethanol
Tank No. 18 (Storage Tank) 12,500 9,600 9,04,779 Tank No. 19 (Storage Tank) 12,500 9,600 9,04,779 Tank No. 16 (Receiver Tank) 5,250 4,300 76,241 Tank No. 17 (Receiver Tank) 5,250 4,300 76,241
Total 19,62,040 Gross Capacity 59,16,566

24
2.6.4 Manufacturing Process
2.6.4.1 Manufacturing Process Molasses Based Operations
A. Fermentation
Molasses, diluted with water to the desired concentration is metered continuously into a bigger fomenters where maximum reaction for conversion will take place. Additives like urea (if required in the form of pellets or prills) and deforming oil are also introduced in the fomenters as required. There is an automatic foam level sensing and dosing system for de-foaming oil. Every Kilogram of alcohol produced, generates about 290 Kcal of heat. This excess heat is removed by continuous circulation of the fermenting wash through an external plate heat exchanger called the Fermented Cooler. The fermented temperature is always maintained between 30 and 33 deg. C, the range optimum for efficient fermentation. The yeast for fermentation is initially (i.e. during start-up of plant) developed in Propagation Section described further on. Once propagated, available cell population of about 300-500 million cells/ml is maintained by yeast recycling and continuous aeration of the fermented. Fluctuations in the yeast count of ±20 % have little effect on the overall fermented productivity. Yeast cell vitality which is usually above 70% may, in times of stress (such as prolonged shut-downs) drop to 50 % without affecting the fermentation. Fermented wash passes through Decanter Centrifuge, where the concentrated sludge of 25 – 30% v/v is generated which can be disposed on the sludge drying beds or can beaded in the composting. The clarified portion of the wash is taken back to wash holding tank for feeding the distillation section for alcohol recovery.
Propagation-
Propagation section is a feeder unit to the fermenter. Schizosaccharomycae crevice Yeast is used. This is grown in 3 stages. The first two stages are designed for aseptic growth. Propagation vessel III, develops the inoculums using pasteurized molasses solution as the medium. This vessel has a dual function. During propagation, it serves for inoculums build-up. When the fermented enters the continuous production mode, Propagation Vessel III issued as an intermediate wash tank. Propagation is carried out only to start up the process initially or after very long shut-downs during which the fermented is emptied.
B. Integrated Distillation Section
Distillation section is designed with multi pressure vacuum distillation technique to produce 60 KLPD Rectified spirit or 60KLPD Rectified spirit & 60 KLPD ENA& 60 KLPD ethanol. The system designed is integrated for minimum steam consumption while producing Rectified Spirit & ENA & ethanol directly from the fermented wash. The system comprises of Wash-cum-Degasifies Column with Rectifier Column, & Heads Column. The clarified wash after heating in wash heater by overhead vapours from wash column is further heated in spent wash heater is fed to degasifying section of column. The beer/ wash column is operated under vacuum and designed with sieve trays. The design of wash column enables operation of the column continuously for longer durations (minimum 180 days without opening for cleaning). The energy to beer column is provided by re-boiler located at the bottom of column and heated by overhead vapors from rectifier column. The raw spirit approx. 40% w/w is sent to intermediate raw spirit tank. Raw Spirit is then fed to stripper rectifier column for removing high volatile impurities. Fusel oils are tapped from appropriate trays and separated in fusel oil decanter after cooling in fusel oil cooler. The rectifier column is designed to operate under pressure with Sieve tray construction and heated by steam through re-boiler located at the bottom of column. The alcohol from rectifier column is then taken to product cooler to cool it down to 33DegC.The Technical Alcohol cut from the top of the

25
Degasifying section is taken to degas condenser & condensed against water. The condensate is then fed to heads / aldehyde column where it is diluted with water for further rectification in the column & finally the technical Alcohol cut is removed from the top vent condensers of the heads column as Grade –II rectified spirit. The Rectified sprit from product cooler can be stored in storage vats or it can be send to further set of columns for removing impurities & making Neutral Alcohol by Re distillation of Rectified Spirit. While refining the Rectified spirit will be diverted & proceed through another sets of Distillation columns in closed circuit for removing impurities & polishing to produce 60 KLPD ENA.
Extra Neutralization Alcohol -
RS of 94.68-95% v/v strength is fed to the Extractive Distillation column. Dilution water is fed on the top most tray of the column with a dilution ratio of 1:9. Dilution of water is maintained in column such a way that it selects the higher alcohols and other impurities to move upward and extracts alcohol to the bottom. Purified dilute alcohol is removed from the bottom of the column and fed to rectification column, which concentrates alcohol to 96% v/v. High-grade spirit is drawn from one of the upper trays of the rectification column and then fed to simmering column for removal of methanol. ENA is taken out from bottom of the simmering column. Lees of column are recycled as dilution water after a part of it is purged.
Lower side draw streams are taken from rectification column to avoid fusel oil build up in the column. These streams are sent to the FOC column where these fusel oils are concentrated and then sent to decanter where these streams are diluted with water and fusel oil rich layer is separated. Washings are sent back to the column to recover alcohol. An impure sprit cut will be taken from top of this column. In case the main Rectified Spirit plant is closed, we can still make ENA by processing Rectified Spirit through series of various purifying & Refining Distillation columns provided in the main battery of Distillation columns.
C. Evaporation Section
Spent wash from Analyzer column is passed through a forced circulation re-boiler to generate vapors. This concentrates the effluent and reduces the volume further. This Spent is fed to Falling Film Evaporation and forced circulation evaporation Plant for further reduction in volume of Effluent. The 60% concentrated spent wash is further spray in Incineration Boiler & burn in the Furness as a fuel.
2.6.4.2 Manufacturing Process for Grain Based Operations
Incoming grains are inspected upon receipt. Inspection is carried out to determine bushel weight, moisture content, mold infestation and general appearance. Accepted grains are unloaded into silos for storage before milling. Stored grains are weighed to determine incoming quantity.
A. Grain Milling Section
The purpose of milling is to break up the grains to the required particle size in order to facilitate subsequent penetration of water in the cooking process. The milling section of the plant has the necessary equipment’s for cleaning of the raw materials and screening the milled floor so as to get the desired particle size. Selected hammer mill will be able to mill the grains. Raw material is first milled to form flour in the milling section. Reduced particle size makes the starch accessible to gelatinization during cooking. In this mill 20 to 30% oversize particles will be recycled for second milling.

26
B. Liquefaction
Liquefaction initiates the conversion of starch into simple molecules of dextrin. It is divided into three sub processes. i.e. Pre liquefaction, jet cooking and post liquefaction.
i. Pre- Liquefaction
This involves partial hydrolysis/liquefaction of starch, in presence of enzyme -amylase, at a temperature much below the gelatinization temperature. Gelatinization results in reduction in viscosity of the mash. Gelatinization temperature varies for the different grains (e.g. for corn, it is 62-720C and for sorghum, it is 68-770 C). Part of the enzyme is added in this step after necessary adjustment of pH and Ca++ ion concentration
ii. Post- Liquefaction
Retention time in post-liquefaction/ flash chamber is 30 minutes Second part of -amylase enzyme is added in post-liquefaction. Jet-cooked slurry is again held at high temperature in presence of enzyme to complete the process of post-liquefaction. -amylase enzyme used will be able to break down the starch molecule at higher temperature
C. Scarification
Scarification is the formation of sugars. Here, it is done enzymatically by breakdown of dextrin. Here the dextrin is acted upon by a second enzyme for further breakdown and release of sugars.
i. Fermentation
The fermentation process employs a special yeast culture, which can withstand variations in the grain slurry quality, temperature and other shock loads. Batch Fermentation plant consists of six numbers fermenters connected in series with all the accessories like plate heat exchangers for cooling, sparges, broth mixers and air blowers etc. The yeast is immobilized using special media and it remains in the fermentation plant throughout and hence it gives tremendous advantages in maintaining the yeast population and in combating the bacterial infection. Grain slurry after weighing is also pre-treated to an appropriate sugar concentration while pumping through Batch Broth Mixer into the fermenter. The fermenters are then inoculated with culture developed in the culture vessels. This culturing with suitable yeast is carried out only during the start-up of the plant. The culture thus developed maintains itself in fermenters on a batch basis.
To help the fermentation sustain the assailable nitrogen are added in the medium in the form of Urea and DAP as required. Temperature in the fermenters is maintained to an optimum level as required for efficient reaction with the help of Plate Heat Exchanger and recirculation pumping system. This recirculation also helps in proper mixing of fermented wash. The retention time for the reaction is provided. Air blower is provided to supply the necessary oxygen required for the yeast and also for agitation. After completion of reaction the fermented wash is delivered to clarified wash tank.
The CO2, which is liberated, is scrubbed in water, with the help of CO2 Scrubber. This CO2 contains ethanol, which is recovered by collecting CO2 Scrubber water into Sludge Trough. The diluted sludge is pumped into Sludge Settling clarifier. The fermented mash collected in the Clarified Wash Tank is then pumped to Analyzer column for distillation. A closed loop cooling tower system with an induced draft-cooling tower with circulation pumps is also provided to ensure higher cooling efficiency and to minimize water wastages.

27
D. Process Description for Multi pressure Wash to ENA, RS Distillation
The vacuum distillation has many advantages over conventional distillation atmospheric distillation plants like lower energy requirement, very good quality alcohol and less scaling of the distillation trays due to sludge. The vacuum distillation produces ethanol of international quality standards and there is a lot of demand of ethanol from the vacuum distillation process. “The Extra Neutral Alcohol produced from this latest technology will meet most of the
international quality standards for ethanol like US Pharmacopoeia, British Pharmacopoeia and Japanese standards.
The vacuum distillation approximately requires 50% less steam as compared with the conventional old distillation technologies. The vacuum distillation consists of distillation columns with high efficiency column trays, condensers, Reboiler, vacuum pumps and reflux pumps. A closed loop cooling tower system with an induced draft-cooling tower with circulation pumps is also provided to ensure higher cooling efficiency and to minimize water wastages.
In this vacuum distillation ethanol is separated and concentrated using principle of fractional distillation. This is based on difference in boiling points of volatile compounds in mixture. There are seven columns in the system Primary column also called Primary column, Pre Rectifier cum Exhaust column, Rectifier Column, Hydro extractive distillation column, Refining column, De-aldehyde Column and Defusal Column. The Primary or Mash column is operated under vacuum and it is heated using the vapours from the Rectifier column, which is operated under a slightly higher pressure. The vacuum operation of the Primary column will help in reducing the overall energy requirement and also improve the product quality.
Due to vacuum operation of the Primary column the scaling of the column trays is minimized and plant can be operated without stoppage for a longer duration as compared with atmospheric plant. The fermented mash is preheated using a beer heater at the top of the Pre Rectifier / exhaust column and followed by a plate heat exchanger and finally delivered to the top of Degasser column. The pre heating of mash in two stages recovers energy and saves steam required for the distillation. The mash runs down the Primary column trays from tray to tray, while vapour goes up in the column contacting the mash at each tray.
As a result of this contact and boiling, ethanol and other impurities along with some water are stripped in the form of vapours and remaining mash in the form of vinasse (effluent) is disposed off from the bottom of the Primary column for CPU.
When the vapours of ethanol and other volatile compounds reach the top, they are separated out from the top of Primary column and are then fed to pre rectifier exhaust column. The heat is supplied by the Rectifies vapours from the Reboiler provided at the bottom of the Primary column.
Two Reboilers are provided at the bottom of the Primary column to facilitate the heat transfer from Rectifier column vapours to Primary column. The vapours from Primary top are fed to Rectifier /exhaust column for purification. Alcohol from the top of rectifier Columns are also diluted with soft water and are fed to Hydro extractive distillation column. A Reboiler is installed at the bottom of the Hydro extractive distillation column. Impurities such as Aldehydes and Fusel oil are removed from the top of the Hydro extractive distillation Column.
Impurities like ester which is removed from top section of hydro extractive column are fed to Fusel oil concentration column, while dilute ethanol along with fewer impurities, are fed to
28
Rectifier column middle. Steam is fed to Hydro extractive distillation column through Reboiler.
A Reboiler is installed at the bottom of the Rectifier column, which heats the process liquid i.e. alcohol and water received from the Hydro extractive distillation column, indirectly with the help of steam. In the Rectifier column, the ethanol is concentrated to 96 % by refluxing the Rectifier reflux liquid. Extra neutral ethanol (ENA) is tapped from the top of Rectifier column, which is directly sent to refining column for removal of other low boiling impurities. While the bottom product of the Rectifier column called spent lees is drained off. The higher alcohols also called light and heavy fusel oils are removed from the middle portion of the Rectifier column so that they are not mixed with Extra Neutral Alcohol. Light and Heavy fusel oil from Rectifier column and top cut from Hydro extractive distillation column is fed to fusel oil concentration column.
The steam is delivered from the bottom of the Defusal Column to allow the desired separation. Fusel oil consisting of higher alcohols viz. Amyl alcohol, iso amyl alcohol, n-propanol etc. are concentrated near middle portion of Fusel oil concentration column and can be removed and separated in the Fusel Oil Decanter in sufficient higher concentration. While the bottom product called spent lees is drained off. The top product from the De-aldehyde Column is cooled in the cooler and sent to storage as Technical Alcohol.
The Refining column is fed with the ENA from the Rectifier column, which is boiled off in the Refining column to remove the low boiling impurities like methanol and mercaptans. Extra Neutral Alcohol (ENA) is tapped from the bottom of the Refining column, which is cooled up to 300C, by passing through ENA cooler. The impure ethanol, which contains many impurities, is drawn from the top of the Refining column and cooled in the cooler and sent to storage as Technical Alcohol. Both fermentation and distillation are operated with PLC computer controls system. This will help in maintaining the parameters. Alcohol stripped whole stillage is subjected to centrifugation to separate suspended fibrous mass and thin stillage. This thin stillage is concentrated in multi-effect evaporation system, which is supplied with steam. Part of thin stillage is recycled back to be used in the process as backset. Water vapours coming out of evaporator is condensed and sent back to be used as recycle condensate. Concentrated thin stillage in form of syrup is taken to the drying section where it is mixed with the fibrous mass and subjected to drying in the decanter-dryer system to produce DDGS. This also requires additional steam. The final moisture content of DDGS is about 10%.
E. Process Description for Molecular Sieve Technology for Ethanol Production
Molecular sieve technology works on the principle of pressure swing adsorption. Here water is removed by adsorbing on surface of `molecular sieves' and then cyclically removing it under different conditions (steaming).
Molecular sieves are nothing but synthetic zeolites typically 3Ao zeolites. Zeolites are synthetic crystalline alum inosilicates. This material has strong affinity for water. They adsorb water in cold condition and desorb water when heated. This principle is used to dehydrate ethanol. The crystalline structure of zeolites is complex and gives this material the ability to adsorb or reject material based on molecular sizes. Water molecule can enter the sieve and be adsorbed, but larger alcohol molecule will not be retained and will go through the bed. There can be two to three beds in parallel. Once a particular bed is saturated with water, it is heated with steam so that adsorbed water is desorbed from the bed. Till that time, other bed is used for dehydration.

29
F. DDGS Production
Alcohol stripped whole stillage is subjected to centrifugation to separate suspended fibrous mass and thin stillage. This thin stillage is concentrated in multi-effect evaporation system, which is supplied with steam. Part of thin stillage is recycled back to be used in the process as backset. Water vapour’s coming out of evaporator is condensed and sent back to be used as
recycle condensate. Concentrated thin stillage in form of syrup is taken to the drying section where it is mixed with the fibrous mass and subjected to drying in the decanter-dryer system to produce DDGS. This also requires additional steam. The final moisture content of DDGS is about 10 %.Quantity of DDGS produced to the tune of 46 MT/day has been envisaged under the proposed project.
Figure 2.3 Mass Balance & Process Flow Chart for Existing 65 KLPD Distillery (Grain Based)

30
Figure 2.4Mass Balance & Process Flow Chart for Existing 65 KLPD Distillery (Molasses Based)
Figure 2.5Mass Balance and Process Flow Chart for 180 KLPD Distillery (Grain Based)

31
Figure 2.6Mass Balance and Process Flow Chart for 180 KLPD Distillery (Molasses Based)
2.6.4.3 Manufacturing Process for Captive Power Plant
The Electricity generated from existing 16 TPH boiler is 1.4 MW. Under proposed expansion project 50 TPH boiler will be installed with extraction cum condensate steam turbine of 4.0 MW to generated 4.0 MW electricity. Steam parameters are 63 bar pressure and 4200C temperature. Steam turbine has provisions for steam extraction points, which is used to supply steam to process. A branch line from main steam piping with a pressure reducing station, shall supply pegging steam to deaerator. Steam system design is provided for an emergency by pass with pressure reducing and de super heating stations to meet the process steam demand during forced outage of steam turbine /generator unit. Extraction cum condensing turbine system is designed to supply 3.5bar steam. The Electricity generated is 4.0 MW.
Steam Turbine Generator: One condensing steam turbine generator with one main stop valve and independent bar lift type control valves system; one controlled extraction, one uncontrolled extraction ports, combined lubrication and hydraulic oil system. Brush less generator, gland steam sealing system, complete with instrumentation and control and rated at 11 kV, 3 phase, 50 Hz, Power factor (PF) + 0.8. Refer Figure 2.7Process Flow Chart for Captive Power Plant.
Table 2.12 Electricity Requirement
No. Industrial Unit Existing (MW) After Expansion (MW) Source 1 Distillery 1.4 3.7 Turbine generation
Electricity required for distillery would be met from its own 4.0 MW proposed Turbine.

32
Figure 2.7 Process Flow Chart for Captive Power Plant
Table 2.13 Steam Balance
No. Particulars Unit Steam Requirement Grains Molasses A Total Steam Generation TPH 50 40 1 Steam Utilization 2 Wash to RS TPH -- 10.3 3 Wash to ENA TPH -- 14.4 4 RS to Ethanol TPH -- 2.5 5 Wash to Ethanol TPH 10.80 -- 6 CO2 Recovery Plant TPH 0.9 0.9 7 Liquification TPH 2.71 -- 7 ATFD /DDGS Dryer TPH 6.75 -- 8 Boiler Auxiliary Consumption TPH 4.29 -- Steam to Distillery plant TPH 25.45 28.08 9 Evaporation 8.11 10.8
Total Utilization TPH 33.5586 38.88
2.7 SOURCES OF POLLUTION AND MITIGATION MEASURES
Basic sources of pollution from existing and proposed distillery operations are mainly operations &processes in industry, boilers and stand by D. G. set. Detailed identification and quantification of impacts, due to above sources, are separated under various heads. They are - (1) Water Pollution, (2) Air Pollution, (3) Noise Pollution, (4) Hazardous Wastes, (5) Solid Waste (6) Odour Pollution, (7) Land Pollution & (8) Occupational Health Hazards and safety.
2.7.1 Water Pollution (WP)
Assignment w.r.t. water pollution aspect was done by Dr. Sangram Ghugare who is an in-house Functional Area Expert (FAE) for WP. Requirement for fresh water on site will be met from Ghatprabha river. Water lifting permission has been procured from Irrigation Department, Bagalkote. Same is attached at Appendix- D for reference. Details of water consumption are presented in Table 2.14.

33
Table 2.14Details of Water Consumption in Distillery
No. Description Grain Based (M3/D) Molasses Based (M3/D) Existing After Expansion Existing After Expansion
1. Domestic #11 #11 #11 #11 2. Industrial a. Process #348 964 (Ω674+ #290) #525 1458(♣1422 + #36)
b. Scrubber Decanter & DM Water
#137 380 (Ω32+ #348) - -
c. Cooling Makeup #91 Ω252 #91 #252 d. Boiler Makeup #40 #135 #40 #135 e. DM Backwash #8 Ω30 #8 #30 f. Lab & Washing #8 Ω10 #8 #10 g. Ash Quenching #1 Ω2 #1 #2
Industrial Use #633 1773 (#773 + Ω1000)
(56 % Recycle)
#673 1887 (♣1422 +#465) (75 % Recycle)
3. Gardening & Green Belt #320 320 (#112+$65+Ø8+
Ω135)
#320 320 (#247+$65+Ø8)
Grand Total (1+2+3) #964 2104 (#896+ $65+Ø8 +Ω1135)
#1004 2218 (♣1422+#723 + $65+ Ø8)
Fresh Water Consumption: (Norm 100 Lit/ MT of Cane Crushed)
9.7 KL/KL
4.2 KL/KL 10 KL/KL
2.58 KL/KL
Note:# - Fresh water from Ghatprabha River, ♣ - Molasses based Distillery CPU Treated Effluent Recycle, Ω- Grain based Distillery CPU Treated Effluent Recycle,$- Harvested Rain Water, Ø- STP treated water
2.7.1.1 Fresh Water Adequacy:
For KAIPL total after expansion project; total fresh water requirement for 330 Days shall be - 896 CMD X 330 Days = 2,95,680 M3/Season ----- A
From above calculations; it is seen that total fresh water requirement in KAIPL campus after expansion is 2,95,680 M3/Annum. Permission granted to KAIPL by Irrigation Department for lifting fresh water from the Ghatprabha River is 5,49,347 M3/Annum which is more than the actual water utilization after expansion activity. 2.7.1.2 Effluent Generation
Effluent would be generated from the various operations & processes from existing activities as well as expansion of distillery. Details of the same are presented in table 2.15 & 2.16
2.7.1.3 Domestic Effluent
Domestic effluent from existing activities is to the tune of 8 M3/Day and same is being treated separately in septic tanks followed by soak pits provided in a decentralized manner. Under expansion activities, there will be no any increase in domestic effluent as no new man power will be hired. But it is proposed to install Sewage Treatment Plant (STP) for treating existing 8 CMD sewage. Further, the treated effluent shall be reused for flushing.
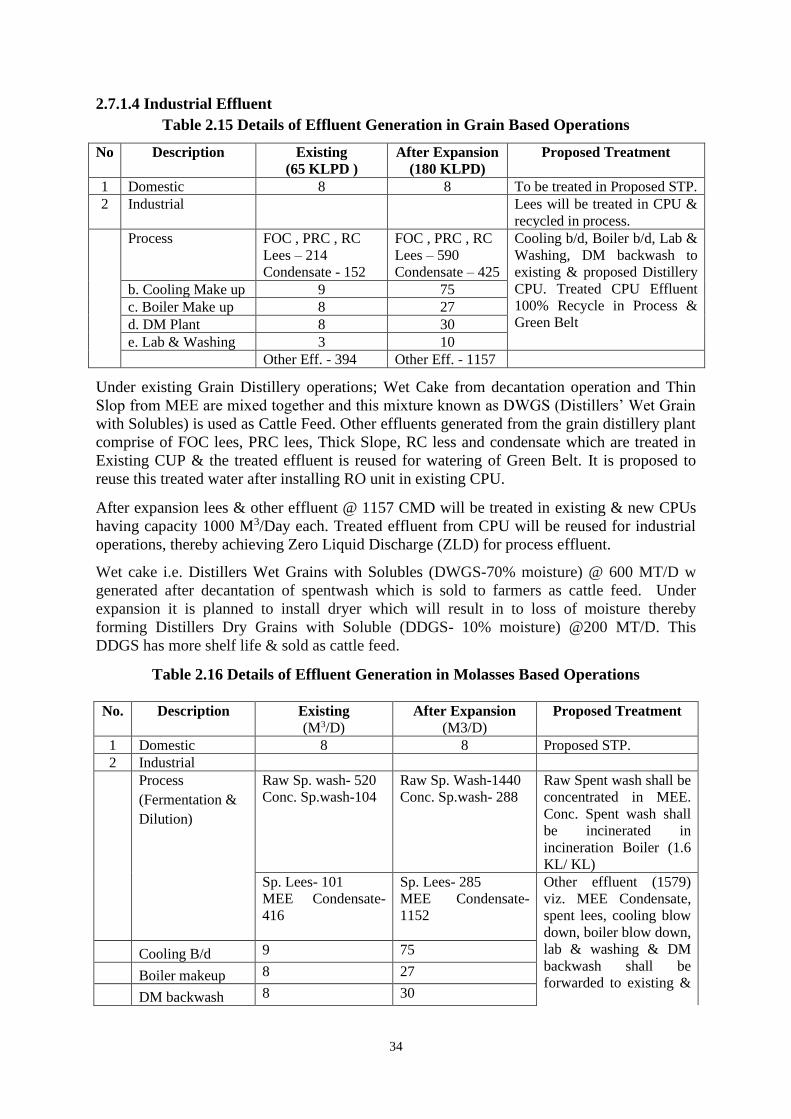
34
2.7.1.4 Industrial Effluent Table 2.15 Details of Effluent Generation in Grain Based Operations
No Description Existing (65 KLPD )
After Expansion (180 KLPD)
Proposed Treatment
1 Domestic 8 8 To be treated in Proposed STP. 2 Industrial Lees will be treated in CPU &
recycled in process. Process FOC , PRC , RC
Lees – 214 Condensate - 152
FOC , PRC , RC Lees – 590 Condensate – 425
Cooling b/d, Boiler b/d, Lab & Washing, DM backwash to existing & proposed Distillery CPU. Treated CPU Effluent 100% Recycle in Process & Green Belt
b. Cooling Make up 9 75 c. Boiler Make up 8 27 d. DM Plant 8 30 e. Lab & Washing 3 10 Other Eff. - 394 Other Eff. - 1157
Under existing Grain Distillery operations; Wet Cake from decantation operation and Thin Slop from MEE are mixed together and this mixture known as DWGS (Distillers’ Wet Grain
with Solubles) is used as Cattle Feed. Other effluents generated from the grain distillery plant comprise of FOC lees, PRC lees, Thick Slope, RC less and condensate which are treated in Existing CUP & the treated effluent is reused for watering of Green Belt. It is proposed to reuse this treated water after installing RO unit in existing CPU.
After expansion lees & other effluent @ 1157 CMD will be treated in existing & new CPUs having capacity 1000 M3/Day each. Treated effluent from CPU will be reused for industrial operations, thereby achieving Zero Liquid Discharge (ZLD) for process effluent.
Wet cake i.e. Distillers Wet Grains with Solubles (DWGS-70% moisture) @ 600 MT/D w generated after decantation of spentwash which is sold to farmers as cattle feed. Under expansion it is planned to install dryer which will result in to loss of moisture thereby forming Distillers Dry Grains with Soluble (DDGS- 10% moisture) @200 MT/D. This DDGS has more shelf life & sold as cattle feed.
Table 2.16 Details of Effluent Generation in Molasses Based Operations
No. Description Existing (M3/D)
After Expansion (M3/D)
Proposed Treatment
1 Domestic 8 8 Proposed STP. 2 Industrial Process
(Fermentation & Dilution)
Raw Sp. wash- 520 Conc. Sp.wash-104
Raw Sp. Wash-1440 Conc. Sp.wash- 288
Raw Spent wash shall be concentrated in MEE. Conc. Spent wash shall be incinerated in incineration Boiler (1.6 KL/ KL)
Sp. Lees- 101 MEE Condensate- 416
Sp. Lees- 285 MEE Condensate-1152
Other effluent (1579) viz. MEE Condensate, spent lees, cooling blow down, boiler blow down, lab & washing & DM backwash shall be forwarded to existing &
Cooling B/d 9 75
Boiler makeup 8 27
DM backwash 8 30

35
No. Description Existing (M3/D)
After Expansion (M3/D)
Proposed Treatment
Lab &Washing 3 10 proposed distillery CPU. Treated effluent shall be recycled in process to achieve ZLD of process effluent.
3 Total Other eff. 28 Other Effluent- 142 4 Grand Total
(1+2+3) Other Effluents-545 Spentwash- 104
Other Effluents-1579 Spentwash- 288
5 Norm: Spent wash Generation 8 KL/KL of Alcohol.
(1.6 KL/KL) (1.6 KL/KL)
In molasses operations effluent generated will be segregated in strong & weak streams. Raw spentwash is strong stream effluent from molasses based operations. Thereunder, 1440 CMD raw spentwash will be generated. Same shall be concentrated in Multiple Effect Evaporator (MEE). The Concentrated Spent wash to the tune of 288 CMD will be incinerated in incineration boiler.
Other effluents generated @1579CMD in the form of spent lees @ 288 CMD, condensate @ 1152 CMD, cooling, boiler blow down, lab-wash & DM backwash @ 142 CMD are weak stream effluent which will be treated in CPU. Treated effluent from CPU will be reused for industrial operations, thereby achieving Zero Liquid Discharge (ZLD) for process effluent. One additional CPU will be provided under expansion of 1000 CMD capacity. Moreover, RO unit will be installed to existing CPU for recycling effluent which is not being done presently.
Table 2.17 DDGS specifications
No. Description Quantity / Percentage (% w/w) 1 Moisture Content 10 2 Dry matter solids 90 3 Proteins 36-38 4 Fats & oils 6-8 5 Inorganic ash 3-5 6 Other organics 39-43
Table 2.18 Details of Multiple Effect Evaporator (MEE)
No. Description Existing Details After Expansion Details 1 Type Falling film + forced circulation Falling film + forced circulation 2 Capacity 600 M3/day 1500 M3/day 3 Raw spent wash 520 M3/day 1440 M3/day 4 Operation Efficiency % 85% 85%
Table 2.19Molasses Spentwash Characteristics
No. Parameter Raw Spentwash Concentrated Spentwash 1 pH 3.9 - 4.5 4.0 - 5.0 2 Total Solids (mg/l) 1,00,000- 1,20,000 5,10,000 - 5,65,000 3 SS (mg/l) 20,000 - 25,000 85,000 -1,00,000 4 TDS (mg/l) 80,000 - 95,000 4,25,000-4,65,000 5 BOD (mg/l) 60,000 - 80,000 3,35,000 - 3,80,000 6 COD (mg/l) 1,20,000-1,40,000 6,25,000- 6,50,000

36
Figure 2.8Flow Chart of Existing Distillery CPU (Capacity 1000 KLD)
Figure 2.9 Flow Chart of Proposed Distillery CPU (Capacity 1000 KLD)

37
Figure 2.10 Cross Section of Spentwash Tank
Figure 2.11 Flow Chart of Proposed STP

38
Figure 2.12 – Photographs of Existing ETP

39
2.7.2 Air Pollution
Air Pollution can be defined as the presence in the outdoor atmosphere, of one or more air contaminants (i.e. dust, fumes, gas, mist, odour, smoke or vapour) in sufficient quantities, of such characteristics and of such duration so as to threaten or to be injurious to human, plant or animal life or to property, or which reasonably interferes with the comfortable enjoyment of life or property. The assignments w.r.t. air pollution (AP) and air quality (AQ) including modeling were undertaken by in-house FAE of EEIPL namely Mr. Yuvraj Damugade. Details of existing and proposed sources of air pollution & control equipment are presented in Table 2.20. Fuel Storage and ESP details are in Table 2.22& 2.23respectively.
Table 2.20 Details of Boilers and D.G. Sets in KAIPL
Sr. No.
Description Sources Boilers DG Set
Proposed Existing Existing Attached to- Boiler 2
(Molasses Operations)
Boiler 3 (Grain Operations)
Boiler 1 DG Set
1 Capacity 40 TPH 50 TPH 16 TPH 500 KVA 2 Fuel type Coal / Bagasse
+ Spentwash Husk / Bagasse Husk /
Bagasse+Spentwash HSD
3 Fuel Qty. (MT/D) 166 / 400 +388 225/500 72 / 160 + 140 125 Lit/Hr 4 MOC Carbon- Steal Carbon- Steal Carbon- Steal MS 5 Shape Rectangular Rectangular Rectangular 6 Height, AGL 100 M 61 M 47 M 7 Diameter (internal) 2M 2M 2M 2.1M 8 APC equipment ESP ESP M.D.C. (Mechanical
Dust Collector) -
Refer Appendix E for Stack height Calculation
Table 2.21Characteristics of Fuel
No Fuel Description Bagasse Coal Spentwash HSD
1 Calorific value, Kcal/Kg 2,000- 2,200 4000- 5500 1500-2000 10,200 2 Ash content 2-3% 13 % 18 % 0.1 % 3 Sulphur content 0.05% 0.5 % 0.65 % 1.0 %
Table 2.22 Fuel Storage Details
No. Fuel Storage Area Storage Capacity Handling 1 Bagasse Bagasse Yard 8000 MT Belt Conveyor 2 Husk Husk Yard 500 MT Belt Conveyor
Table 2.23 Details of APC for boilers
No Description Proposed Boiler 1 Boiler Capacity (TPH) 40 50 2 Fuel Bagasse/Coal; + Sp. Wash Husk / Bagasse 3 APC Attached ESP ESP 4 Outlet Emission 100 mg/Nm3 100 mg/Nm3 5 Removal Efficiency 98 % 98 %

40
Figure 2.13 Photographs Showing Existing Online Continues Monitoring System to Stack (OCMS)
The KSPCB periodically monitors the quality of effluents and emissions. However, prominently samples of untreated and treated effluent of ETP are collected under distillery project. However, the industry has a practice of self-monitoring done for distillery project where under samples of raw and treated effluent, Stack emissions are collected and analyzed through a MoEFCC approved and NABL accredited laboratory. (Refer Appendix F for Self-Monitoring reports) Also, AAQM, Noise and bore Well samples were collected and analyzed. Hence, most of the data presented in following sections is taken from self-monitoring assignments conducted over last year of distillery operations. Accordingly, results have been presented in following Tables -

41
Table No. 2.24 Results for Self-Monitoring of ETP Effluent Samples of Jan.2020 to Dec.2020
Jan-20
Feb-20
Mar-20
Jun-20
Jul-20
Aug-20
Sep-20
Oct-20
Nov-20
Dec-20
KSPCB Limit
pH 7.32 7.73 7.02 7.1 7.36 7.78 7.12 7.59 7.27 6.8 5.5-8.5
BOD 25 10 11 16 23 41 34 42 23 20 100
COD 88 44 40 44 72 128 104 136 80 64 NS
Sodium 352 70 55.48 51.6 70 88 156 224 24 30 NS
Phosphorous 5.24 2.16 1.77 0.39 0.82 0.32 0.875 0.72 0.47 0.33 NS
Magnesium 116.64 14.58 29.16 21.87 24.3 9.72 14.58 19.44 12.15 19.44 NS
Sulphate 148.75 126.24 91.56 54.38 68.4 51.13 15.6 19.14 24.13 39.12 NS
Chloride 859.73 199.93 159.95 104.97 99.97 129.96 374.88 254.92 204.93 220.36 NS
Potassium 15.2 8.2 2.54 5.6 8.4 7.2 5.8 6.6 8 7 NS
Temperature 25 25 25 25 25.5 22.6 24.5 24.6 24.9 25.5 NS
Calcium 192 100 48 56 72 52 56 40 60 48 NS
Nitrogen 12.51 6.44 7.18 4.41 4.44 2.05 4.22 4.4 4.71 5.45 NS
TDS 1761 882 514 468 482 412 798 702 798 715 NS
Table No. 2.25 Results for Self-Monitoring of Stack Emission Samples of Jan.2020 to Dec.2020
Jan-20 Feb-20 Mar-20 Jun-20 Jul-20 Aug-20 Sep-20 Oct-20 Nov-20 Dec-20 PM(mg/Nm3) 32.77 36.95 48.85 34.67 43.4 18.62 30.42 36.13 41.14 82.02 KSPCB Limit 150
Table No. 2.26 Results for Self-Monitoring of DG Set Emission Samples of Jan.2020 to Dec.2020
Jan-20 Feb-20 Mar-20 Jun-20 Jul-20 Aug-20 Sep-20 Oct-20 Nov-20 Dec-20 PM(mg/Nm3) 39.27 43.84 37.4 32.91 24.93 17.53 22.07 27.43 26.76 29.44 SO2(mg/Nm3) 16.33 19.46 17.55 19.46 15.71 11.6 16.49 16.64 15.99 20.06 NOx(mg/Nm3) 20.38 22.43 26.72 24.1 21 18.44 20.39 23.79 19.67 17.23
Table No. 2.27 Results for Self-Monitoring of Ambient Noise Samples of Jan.2020 to Dec.2020
Note: ND- Monitoring Not Done
Near DG Set
3717- Open Door Near DG Set Closed Door
Near DG Set 3718-Open Door
Near DG Set Closed Door
Jan-20 85.67 76.88 84.54 71.57
Feb-20 84.92 76.59 82.53 72.01
Mar-20 90.57 65.12 89.44 63.83
Apr-20 84.45 62.71 82.09 61.9
Jul-20 87.06 62.73 83.2 59.93
Aug-20 91.69 64.83 86.82 61.47
Sep-20 95.19 69.62 93.77 66.99
Oct-20 92.73 67.71 90.53 64.17
Nov-20 96.42 68.52 88.01 62.38
Dec-20 88.82 63.78 84.27 58.22

42
Table No. 2.28 Results for Self-Monitoring of AAQM Samples ofJan.2020 to Dec.2020 No
Location Jan-20 No Feb-20
PM10 PM2.5 SO2 NOX Lead Nickel CO Ozone NH3 PM10 PM2.5 SO2 NOX Lead Nickel CO Ozone NH3
1 Near Main Gate
78 27 4.07 15.87 0.011 3.44 0.91 3.05 10.06 2 81 29 2.67 14.08 BDL BDL 1.02 2.8 11.13
Near ETP Plant
80 21 3.5 12.83 0.01 3 0.81 3.01 11.35 86 28 3.22 13.66 0.047 BDL 0.66 2.57 9.89
Near Boiler Area
76 26 3.18 13.52 0.021 9.83 0.85 2.66 10.01 67 23 2.61 11.45 0.049 BDL 0.97 3.12 8.55
Near Hooligeri Village
75 18 3.86 17.94 0.019 8.82 0.7 2.49 11.18 69 22 3.31 13.25 0.024 BDL 0.83 2.96 10.22
Near Kerkalmatti Village
84 24 2.38 16.28 0.01 4.04 0.76 2.83 10.2 73 26 2.65 17.95 0.034 BDL 0.77 3.09 11.08
Mar.2020 Jun.2020 3 Near Main
Gate 78 32 3.15 17.25 BDL BDL 0.88 1.26 10.45 4 75 29 2.97 14.08 0.031 6.5 0.88 2.2 10.91
Near ETP Plant
64 21 2.67 12.92 BDL BDL 0.75 2.05 10.18 59 18 2.08 15.32 0.028 8.7 0.71 2.54 10.43
Near Boiler Area
74 25 3.06 14.35 BDL BDL 0.52 1.88 9.91 67 20 2.35 14.9 0.002 BDL 0.48 1.67 10.16
Near Hooligeri
Village
72 27 2.81 15.59 BDL BDL 0.6 2.15 11.42 63 24 3.09 16.7 0.003 BDL 0.82 2.76 10.97
Near Kerkalmatti
Village
70 24 2.99 15.04 BDL BDL 0.57 1.74 11.3 76 26 3.18 17.53 0.029 11.2 0.34 1.64 11.68
July.2020 Aug.2020 5 Near Main
Gate 82 33 4.21 20.29 0.026 5.24 0.56 3.17 12.24 6 77 27 2.85 15.63 0.041 7.86 0.67 2.88 11.09
Near ETP Plant
70 27 2.33 17.53 0.036 4.12 0.22 1.69 11.49 53 19 1.77 10.1 0.07 6.5 0.19 1.35 10.42
Near Boiler Area
58 17 2.97 11.73 0.013 BDL 0.21 2.06 10.52 87 31 2.97 19.83 0.105 18.51 0.52 2.34 11.67
Near Hooligeri
56 21 3.31 14.63 0.017 BDL 0.67 1.94 10.14 59 18 2.31 10.39 0.062 9.66 0.75 2.02 10.64

43
No Location
Jan-20 No Feb-20 PM10 PM2.5 SO2 NOX Lead Nickel CO Ozone NH3 PM10 PM2.5 SO2 NOX Lead Nickel CO Ozone NH3
Village
Near Kerkalmatti
Village
61 28 2.76 16.56 0.046 7.68 0.19 4.66 10.97 69 25 3.14 11.15 0.068 9.83 0.24 3.19 10.9
Sept.2020 Oct.2020 7 Near Main
Gate 68 24 3.27 12.58 0.08 9.09 0.73 3.58 10.02 8 76 32 4.12 18.59 0.01 6 0.81 3.02 11.48
Near ETP Plant
78 29 3.06 12.68 0.027 BDL 0.84 2.89 10.88 71 27 3.46 16.87 0.12 5 0.71 2.09 11.53
Near Boiler Area
72 23 4.3 16.21 0.019 BDL 0.68 2.45 10.82 63 21 2.8 11.82 0.01 1.2 0.76 3.29 10.29
Near Hooligeri
Village
85 30 4.38 11.92 0.027 3.93 0.88 2.75 11.58 59 19 2.27 10.58 BDL BDL 0.91 3.29 10.48
Near Kerkalmatti
Village
52 19 2.24 19.73 0.025 BDL 0.49 2.12 9.8 69 23 2.69 13.15 0.015 5 0.59 2.58 10.89
Nov.2020 Dec.2020 9 Near Main
Gate 70 26 3.08 11.25 0.03 5.2 0.86 3.53 10.39 10 56 19 4.69 14.43 0.03 4.2 0.96 3.02 6.41
Near ETP Plant
52 17 1.82 8.39 BDL 5.9 0.96 2.86 10.54 86 36 5.24 18.87 0.009 BDL 1.03 3.26 7.32
Near Boiler Area
63 19 2.44 10.87 0.06 2.4 0.57 2.67 10.49 95 38 6.53 21.31 0,10 2.2 0.87 2.64 5.33
Near Hooligeri
Village
74 29 2.52 12.39 BDL BDL 0.83 2.36 10.87 71 27 4.27 17.53 BDL BDL 0.99 2.54 6.1
Near Kerkalmatti
Village
79 33 3.93 17.16 BDL 6 0.68 3.01 11.07 48 15 3.66 12.65 0.026 5.8 0.5 3.29 7.64
Notes : All results expressed in above table are in μg / M3except CO in mg/M3

44
2.7.2.1 Fugitive Emissions Fugitive emission under proposed activity of distillery shall be mainly dust emissions. Source of same are internal kuccha roads, ash storage yard in KAIPL plant and improper function of APC equipment etc. Trouble with dust in work zone and ambient atmospheres shall be controlled by certain dedicated measures. An action plan has been prepared in industry that includes- monitoring of proper working of pollution control equipment, proper handling; storage and disposal of dust collected, augmentation of proposed green belt with adequate density and type to control and attenuate dust transfer in the premises, provision of properly surfaced internal roads and works premises (tarred and concrete).
2.7.2.2 Process Emissions
The CO2 generation shall take place in fermenter of the distillery. After expansion, CO2 to the tune of 150 MT/D will be released from 180 KLPD distillery operations. In a fermentation, sugar in the wash gets converted to ethyl alcohol through metabolic activities of yeast. Consequently, CO2 is evolved as emission of the bio-chemical reaction. CO2 has been labeled as one of the major gases responsible for the green-house effect, its release in the atmosphere has to be properly controlled. To curb this process emission CO2 would be bottled and supplied to manufacturers of beverages /secondary uses.
2.7.3 Solid Waste
Solid wastes from the Industries are categorized as hazardous and non-hazardous. Wastes that pose a substantial danger immediately or over a period of time to human, plant or animal life are classified as hazardous wastes. On- hazardous waste is defined as the waste that contributes no damage to human or animal life. However, it only adds to the quantity of waste. Assignment w.r.t. solid and hazardous waste was done by empaneled FAE Dr. Sangram Ghugare for SHW.
Ash generated from boilers will be collected separately and taken to ash storage area. Agreement with brick manufacturer industry shall be done. Water sprinkling arrangement would be made to avoid suspension of fly ash into air.
Table 2.29 Details of Solid Waste
No. Description Quantity (MT/D) Disposal Facility
Existing After Expansion 1 Boiler Ash 29 81 Sold to Bricks Manufacturer 2 Yeast Sludge 14 39 Burnt in Incineration Boiler 3 CPU Sludge 1 1
Refer Appendix – G Ash Agreement with brick manufactures for Ash utilization
2.7.4 Hazardous Wastes
No any hazardous waste will be generated from distillery.
2.7.5 Noise Pollution
Noise is normally defined as objectionable or unwanted sound, which is without agreeable quality and essentially non-euphonious. The concern on noise depends upon the noise level near the source, on the work environment and near the residential zone. Earlier, noise was summarized to be exclusively an occupational problem. But, since the effects are found also on people who are not directly involved, it has acquired wider dimension. Hence, it is necessary to know the noise levels near the sources as well as near the residential colonies.

45
2.7.5.1 Sources of Noise Pollution
In the distillery unit; noise generating sources generally are the boiler house, cane crushing section and mill house, distillation section etc. The expected noise levels in these sections will be in the range of 60 to 65 dB (A). All preventive measures such as regular operation & maintenance of pumps, motors and compressors will be carried out and enclosures will be provided to abate noise levels at source.
Adequate noise abatement measures like silencer will be implemented in this section. Moreover, enclosures to the machinery will be provided wherever possible. It is predicted from an experience elsewhere that the magnitude of noise levels, from various sources, to the human habitation at a distance of 0.5 Km will be around 12 dB (A). Therefore, there will be no any significant change in the background noise levels in the premises of the industrial unit. Already a green belt has been provided in and around the industry. The same will be further augmented adequately and properly so that it will further attenuate the noise levels. The noise will also be created by movement of trucks/ tractor trolleys and other vehicles for material transportation. However, this will not be of a continuous nature and will not have much impact on the work environment of the project site. Insulation helps considerably in limiting noise levels. The workers entering the plant shall be protected by earmuffs, which will give the reduction of about 30 dB (A).
2.7.6 Odour Pollution
There are number of odour sources in distillery, which include of molasses, spentwash, DWGS etc. handling and storage which is caused due to bacterial growth in interconnecting pipes & unattended drains. The measures shall be adopted under proposed expansion unit for controlling the same are proper housekeeping, sludge management in biological ETP units, steaming of major pipe lines, regular use of bleaching powder in the drains, efficient handling, prompt.
Presently, spentwash is carried through closed pipeline and concentrated in MEE. Hence, odour nuisance due to spentwash storage activity is entirely eliminated. Same practice will be followed under expansion. To abate the odour nuisance, the KAIPL has a concrete planning which includes following steps and actions-
1. Adoption of GMPs (Good Management Practices). 2. Use of PPEs like masks at odour prone areas. 3. Closed and online system for carrying spent wash to the treatment units, MEE etc. 4. Suitable plantation of fragrant species in and around the treatment units, which can
minimize undesirable smells. 5. Industry has provided covered fermentation system, 6. Collection of waste yeast sludge from fermentation section in a closed system and its
immediate and proper disposal. 7. Reduced volume of effluents (spent wash, spent lees) by adopting strategic approaches
such as use of the effluents back in process under Reduce-Reuse-Recycle planning. 8. Arranging awareness and training camps for workers. 9. Closed and online system for carrying spentwash to the treatment units, viz. MEE etc.
2.7.7Land Pollution
Land pollution may take place due to use of untreated effluent for gardening / irrigation purpose. Fly ash, if deposited on land, would lead to land pollution.

46
As mentioned above, spent wash from distillery is concentrated in MEE and the concentrated spent wash is mixed with coal or bagasse and burned in incineration boiler. Same methodology will be followed after expansion. Other effluents generated from distillery activities like spent lees, boiler & cooling blow downs are treated along with the condensate from MEE in a dedicated CPU. Treated effluent is recycled in process operations like molasses dilution as well as liquefaction of flour etc. Same methodology will be practice under expansion. Solid waste generated from distillery is in the form of yeast sludge, CPU sludge; the same issued as manure. Boiler ash generated will be forwarded to brick manufacturing industry.
2.7.8 Occupational Health Hazards and Safety
• Pre & post medical check-ups done of all the employees. Occupational health surveillance is being carried out for all workers on regular basis. Pulmonary function test and periodical medical checkup is done once in every year. A record of health checkup is also maintained on site. Refer Appendix N for health checkup report
• OHS hazards anticipated in the KAIPL complex is mostly due to chemical exposure hazard, physical hazard due to electrical & mechanical operations &maintenance works.
• Accidental skin or eye irritation & burns, respiratory & pulmonary diseases on exposure to chemicals, fire etc.
• Accidents resulting from unsafe conditions due to poor housekeeping& not using PPE’s • Accidents due to unsafe practice of operation and maintenance like gas cutting and
wielding may lead to injuries to various parts of the body. • Muscular & skeletal disorders like muscular pains, spinal & joint pains due to ergonomic
problems, lifting with wrong postures etc.
2.7.9 Budgetary Allocation by Industry towards Environment Protection
Capital as well as O & M cost towards environmental aspects under existing & expansion project in KAIPL complex is as follows -
Table 2.30 Capital as well as O & M Cost
No. Description
Cost Component (Rs. Lakhs)
Capital Annual O & M
A. Expansion Project 1 APC Equipment’s [ESP for 2 boilers – 2 Nos. (Stack height 100 M)
& OCMS, Dryer for Grain 6600 650
2 Spentwash Storage Tank, Installation of STP, MEE, installation CPU & OCMS.
1150 110
3 Noise Pollution Control 30 10 4 Occupational Health & Safety 50 15 5 Environmental. Monitoring 25 15 6 Green Belt Augmentation & Rain Water Harvesting Plan 50 20 Total; (68 % of Capital Investment of Rs. 116.5 Cr) 7905 820
B. Existing Unit 1 Air Pollution Control Equipment: MDC, 47 M Ht. Stack 200 25 2 Water Pollution Control: MEE, Incineration Boiler, ETP 870 45 3 Noise Pollution Control 20 2 4 Environmental Monitoring & Management 25 2 5 Occupational Health & Safety 25 2

47
No. Description
Cost Component (Rs. Lakhs)
Capital Annual O & M
6 Green Belt Development 75 10 Total; ( 25 % of Capital Investment of Rs. 48 Cr) 1215 86
Grand Total; ( 55 % of Capital Investment of Rs. 164.5 Cr) 9120 906
2.8 GREEN BELT DEVELOPMENT PLAN
Impact due to noise generation and particulate emission can be abated by plantation of green belt. Accordingly a comprehensive green belt has already been developed in KAIPL campus. Further, under proposed expansion augmentation of existing green belt shall be done in phase wise manner. Native and fast growing species shall be selected for green belt development.
2.8.1 Area Calculation for Green Belt Plan Table 2.31 Area Details
No. Description Area (Sq. M) 1 Total Built up Area after expansion 95,690 2 Total Open Area after expansion 2,184 3 Existing Green Belt Area (40% of Total Plot Area) 64,000 Total Plot Area 1,61,874
Refer detailed area break up of industry at Table 2.3above.
2.8.2 Existing Tree Plantation
Total open space available in KAIPL premises is 1.47 Ha. As per MoEFCC norms, green belt 7areais under green belt which is 40% of total plot area. List of existing trees existing plant given in following table.
Table 2.32 List of Trees Planted Under Existing Project
No Species Name Quantity 1 Teak 4188 2 Tamarind 69 3 Dwarf Huns 15 4 Kalpavriksha (Coconut) 201 5 Banana 200 6 Neem 250 7 Guava 300 8 Cikku 25 9 Lemmon 12 10 Silver Oak 122 11 Mango 50 12 Honge 4020 13 Bottle Palm Tree 310 14 Almond 560 15 Eucalyptus 1350 16 Acacia 920 17 Ashoka Tree 100 18 Royal Plalm 200 19 Sandalwood 2000 20 Fig Plant 500 21 Sitaphala 1700 Total 17,092

48
2.8.3 Proposed Tree Plantation
Under the expansion of distillery project, green belt will be augmented on Existing Area. List of trees to be planted is appended at Appendix H. Also, refer same appendix for proposed green belt plan.
A comprehensive ‘Green Belt Development' programme would be implemented in a phase
wise manner under proposed activities, salient features of which are as follows –
1. Tree plantation at different tiers to suit existing topography 2. Avenue plantation along the roads and shelterbelt plantation along the peripheral fence of
the plots 3. Mass Plantation in certain pockets in the KAIPL campus 4. Plantation of peculiar tree species serving typical purposes such as noise attenuation and
dust suppression at selected premises 5. Lawns and landscaped gardens in the campus
To arrest dust and to attenuate noise, plantation of certain species like Mangiferaindica (Mango), Sesbania grandiflora (Shewarie) Derris indica (Karanj), Terminalia catappa (Indian Almond Tree), Polyalthia longifolia (Ashok) etc. shall be done. 2.8.4 Criteria for Green Belt Development Emission of SPM, SO2 is the main criteria for consideration of green belt development. Plantation under green belt is provided to abate effects of the above emissions. Moreover, there would also be control on noise from the industry to surrounding localities as considerable attenuation would occur due to the barrier of trees provided in the green belt. Preparation for Plantation: • Take pits of 2X2X2 ft. for good soil strata while 3X3X3 ft. for poor soils or murum strata. • Expose them to direct sun for 15 days • Fill the pits as per availability of site soil-
o In case of shortage of good quality site soil: site soil (35%) + good fertile soil (35%) + good composted cow dung (30%) + Neem cake (200 gm)
o In case of good quality site soil: site soil (80%) + good composted cow dung (20%) + Neem cake (200gm) + leaf litter and grass or agri residue.
• Plant appropriate sapling after rain starts • Start watering after rains • Make shade for saplings when temperatures rise, generally after February or March
depending upon local climate and condition of plants. This can be managed with bamboo sticks and locally available grass.

49
Figure 2.14 Photographs of Existing Green Belt
2.9 RAIN WATER HARVESTING 2.9.1 Existing Rainwater Harvesting Details
Industry has already adopted rainwater-harvesting system. Three Rain Water harvesting Pits have been constructed for the plant area
1 Near Main Gate: The storm water drains of Vehicle Parking area, Weigh Bridge, and Main Gate are connected to the pond.
• Dimension of the pit: 3.00 m X 3.00m X 2.00m • Total Volume of the pit - 18 M3.
2 Near Weighing Bridge: The storm water drains of Mill Section area. • Dimension of the pit: 3.00m X 3.00m X 2.00m • Total Volume of the pit – 18 M3.
3 Near Mill Side Silo: The storm water drains of Bagasse yard, Workshop area, were house, Distillery section and Evaporation.
• Dimension of the pit: 5.00m X 5.00m X 3.00m • Total Volume of the Pit - 75 M3.
Total Existing Storage Capacity: 1,11,000 Liters = 111 M3

50
Figure 2.15 Photographs Rain Water Harvesting Points
• Average annual rainfall in the area = 692 mm. = 0.69 M
• RWH = Area x Rainfall Depth x Run off Coefficient Accordingly, area consider for RWH is presented at following Table
Table 2.33 Area Taken for RWH
Sr. No.
Description Area (Sq. M.)
Runoff Factors
Considered
Average Annual Rain
Fall (M)
RWH Quantity (M3)
Hence, the total water becoming available after rooftop and land harvesting would be
2.9.2 Proposed Rainwater Harvesting Details RWH could be of two types namely - 1. Harvesting from ground 2. Harvesting from rooftops.
1 Roof Top Harvesting i. Rooftop Area 34,800 0.8 0.69 19,210 Total Rooftop Harvesting 19,210
2 Surface Water Harvesting i. Green Belt Area 64,000 0.3 0.69 13,248.0 ii. Open Space 2,184 0.3 0.69 452.1 iii. Area Under Road 16,000 0.5 0.69 5,520.0 Total Surface Water Harvesting 19,220.1

51
Rooftop Harvesting + Surface Harvesting = Total RWH 1,966.78 + 19,220.1 = 21,186.88M3
= 21.19 ML
Thus, about 21,186.88 M3 of rainwater could become available during every season from the RWH operations. On the open land in the premises counter bunding, terracing and dressing would be done so as to divert the rainwater as per natural slopes to various tranches excavated on the plot in a decentralized manner. Further, the recharge points would be located as per geometry of zones. This when charged to open / bore wells would definitely have a positive impact on the ground water quantity.

52
Chapter 3
Description of the Environment
3.1 INTRODUCTION
The term Land Use relates to the human activity or economic function associated with a specific piece of Land, while the term Land Cover relates to the type of feature present on the surface of the earth (Lillesand and Kiefer, 2000). The knowledge of Land Use Land Cover is important for many planning and management activities as it is considered as an essential element for modeling and understanding the earth system. Land use maps are presently being developed from local to National to Global Scales for Environmental Impact Studies. The satellite Remote Sensing technology has found its acceptance worldwide for rapid resource assessment and monitoring, particularly in the developing world. All these advancement have widened the applicability of Remotely Sensed data in various areas, like forest cover, vegetation type mapping, and their changes in regional scale. If satellite data is judiciously used along with the sufficient ground data, it is possible to carry out detailed forest inventories, monitoring of land Use and vegetation cover at various scales. The 10 Km study area in respect of proposed expansion project by KAIPL falls at post SY NO 92 Hoolageri Village, Tal.: Badami, Dist.: Bagalkote, Karnataka. Industrial site is located at 16°8'29.08"N latitude and 75°35'38.05"E longitude.
3.2 LAND USE AND LAND COVER (LU&LC)
The assignment w.r.t. land use and land cover mapping of study area using LISS IV Satellite Image has been done by Mr. Vinaykumar Kurakula, an empanelled FAE of EEIPL for LU & LC. The scope of work methodology involved and allied details are presented in following paragraphs.
3.2.1 Scope of Work
Major objective of the assignment was to prepare Land Use Land Cover map of the study area while demarcating topographic features especially emphasizing drainage map of the region.
3.2.2 Study Area & Location
The study area is located around the Karthik Agro Industries Pvt. Ltd. Plot/Survey,Gut No. Sy No 92, Hoolageri Village, Tal. Badami, Dist. Bagalkot, Karnataka State. The population of Bagalkot district as per 2011 census and the population in the study area is 1,11,993. Total Literacy rate of Bagalkot is 85.40 %. Male Literacy of Bagalkot is 91.73% while female literacy stands at 79.04 %.
3.2.3 Purpose of Land Use Mapping
Land use study requires data regarding topography, zoning, settlement, industry, forest, roads and traffic etc. Collection of this data was done from various secondary sources viz. census books, revenue records, state and central government offices, Survey of India toposheets etc. and through primary field surveys as well as high resolution multi spectral satellite image from IRSRESOURCESAT 2 Satellite with LISS IV sensor. The date of pass of the image is 10-Feb, 2021. Image has a spatial resolution of 5M X 5M. Apart from LULC Map, topographic features of the region were extracted covering village locations, streams, roads, river in the satellite image. In addition to this, natural drainage network is also captured to prepare drainage map as required. Purposes of land use studies are– • To determine the present land use pattern; • To analyze the impact on land use due to industrial growth in the study area;

53
• To give recommendations for optimizing the future land use pattern vis-à-vis growth of industries in the study area and its associated impacts.
3.2.4 Land use Map Analysis
Land use Mapping was done based on the image color, texture, Tone etc. Following steps are used to analyze the Land use pattern of project site: • Collection of IRS Resourcesat-2 images and made fused and blended the images for color
combinations using Image interpreter-Utilities and Layer stack option available in ERDAS.
• Identification AOI and made a buffer of 10km radius. • Enhance the Fused and blended IRS Resourcesat-2 image using the Spatial, Radiometric
and Temporal options in ERDAS. • Rectified the IRS Resourcesat-2 image using Georeferencing technique, Toposheet to get
UTM coordinate system. • Subset the IRS Resourcesat-2 images and Toposheet using 10Kms buffer AOI. • Automatic classifications done for IRS Resourcesat-2 images using maximum iterations
and number of options in unsupervised classification options. • Created the signature file by selecting the more samples of different features with AOI on
Unsupervised classification image. • Export to Vector layer from supervised classification image. • Conducting QC / QA and finalized the data.
Table 3.1 Satellite Data Details
No. Satellite Data Date Format 1 IRS–Resourcesat-2 LISS- IV 10-Feb,2021 TIFF
Source: NRSC, Hyderabad
Since all the data of the study area were geo-referenced to UTM 43N WGS84 projection system, the satellite images were also obtained with the same coordinate system from NRSA.
Before image classification was carried out, the satellite images was pre-processed. All the processing and classification of the satellite images were performed in the ERDAS Imagine 9.1 software. The data was delivered in separate bands of 2, 3 and 4. The first step was to stack together to get a composite. The scenes were then mosaic together since the study area covered parts of both the scenes. Once a satisfactory mosaic was done whereby the joins were no longer visible and the radiometric resolution of both the scenes were matched. This subset of the original images was then run through the unsupervised classification tool of the software to finally create the grouping of classes present in the study area.
3.2.5 Methodology for LU & LC Study
The overall methodology adopted and followed to achieve the objectives of the present study involves the following steps: • Satellite data of IRS Resourcesat-2 sensor is geometrically corrected and enhanced using
principal component method and Nearest Neighborhood resampling technique. • Preparation of basic themes like layout map, transport & settlement map and from the
satellite image by visual interpretation. • Essential maps (related to natural resources) like Land use / Land cover map are prepared
by visual interpretation of the satellite imagery. Visual interpretation is carried out based on the image characteristics like tone, size, shape, pattern, texture, location, association, background etc. in conjunction with existing maps/ literature.

54
• Preliminary quality check and necessary corrections are carried out for all the maps prepared.
• All the maps prepared are converted into soft copy by digitization of contours and drainages. In that process editing, labeling, mosaicing, quality checking, data integration etc are done, finally Land use areas are measured in Square Kilometers.
Figure 3.1 Process Flow Chart

55
Figure 3.2 Location Map of KAIPL

56
Figure 3.3 Google Image Showing Villages within Study Area
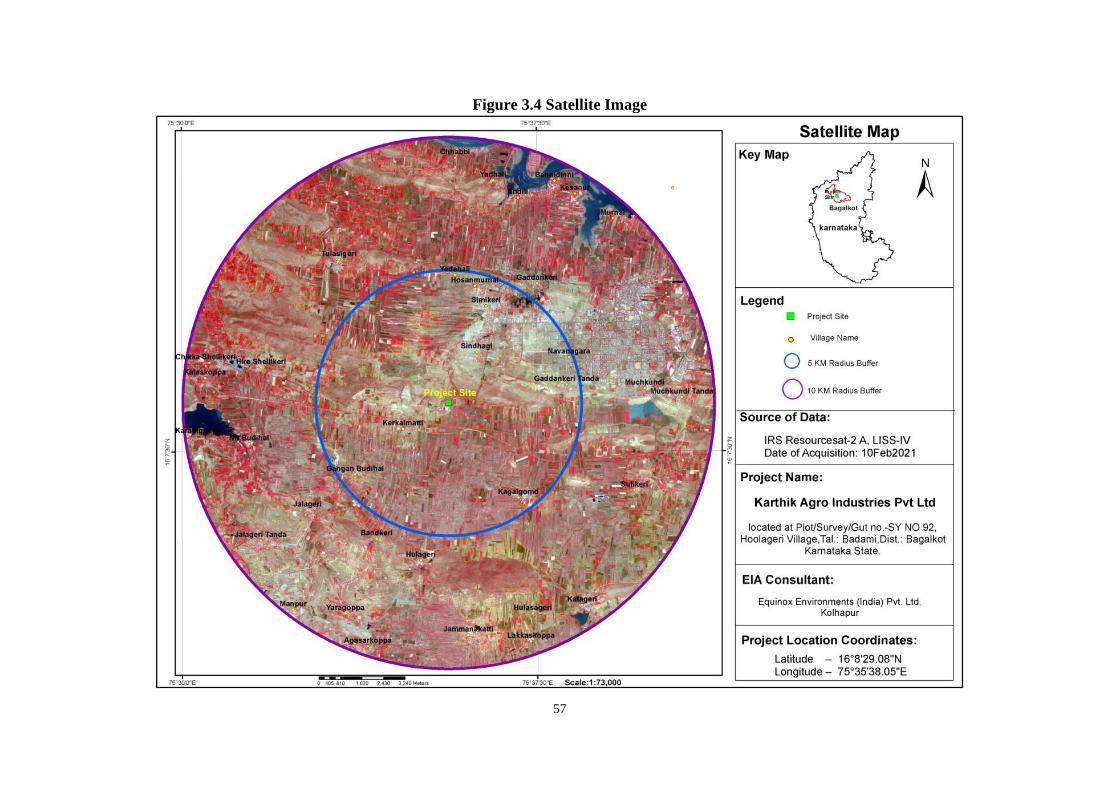
57
Figure 3.4 Satellite Image
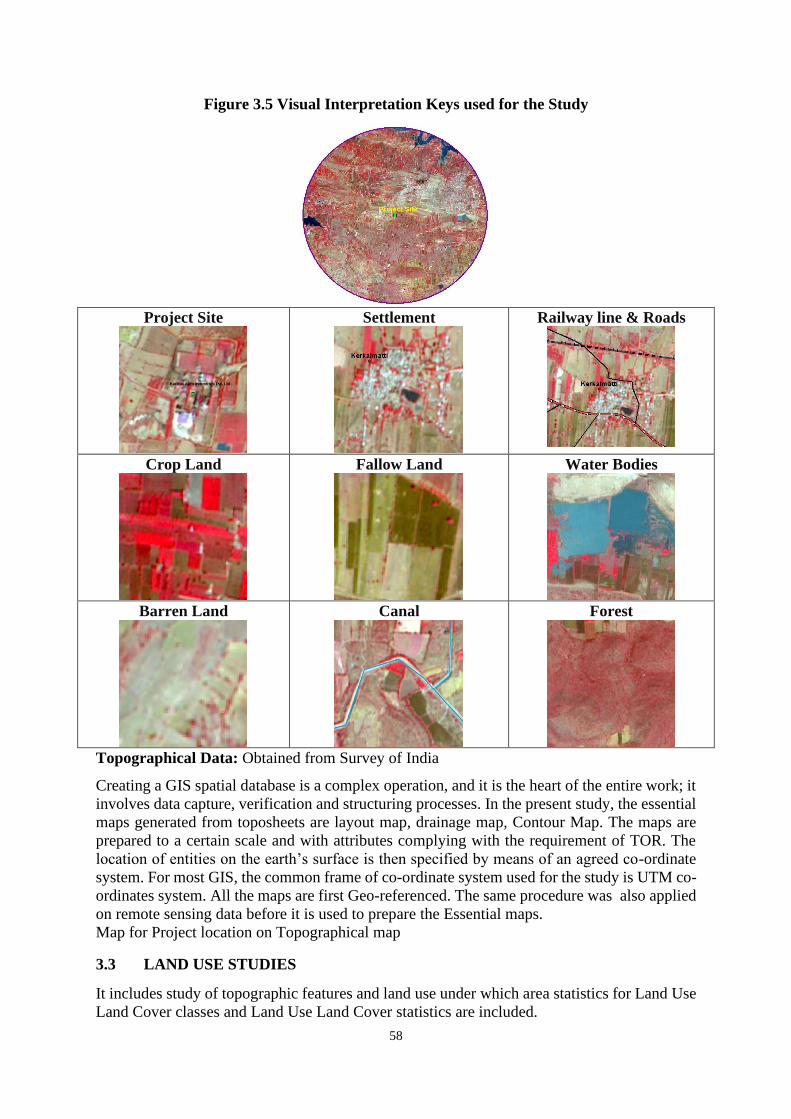
58
Figure 3.5 Visual Interpretation Keys used for the Study
Project Site
Settlement
Railway line & Roads
Crop Land
Fallow Land
Water Bodies
Barren Land
Canal
Forest
Topographical Data: Obtained from Survey of India
Creating a GIS spatial database is a complex operation, and it is the heart of the entire work; it involves data capture, verification and structuring processes. In the present study, the essential maps generated from toposheets are layout map, drainage map, Contour Map. The maps are prepared to a certain scale and with attributes complying with the requirement of TOR. The location of entities on the earth’s surface is then specified by means of an agreed co-ordinate system. For most GIS, the common frame of co-ordinate system used for the study is UTM co-ordinates system. All the maps are first Geo-referenced. The same procedure was also applied on remote sensing data before it is used to prepare the Essential maps. Map for Project location on Topographical map
3.3 LAND USE STUDIES
It includes study of topographic features and land use under which area statistics for Land Use Land Cover classes and Land Use Land Cover statistics are included.

59
3.3.1 Land Use of Study Area
Land use map developed was based on the image colour, texture, tone and also ground truth verification data. Ground truth verification was carried out to validate the results of classified image and reconciliation was carried out with actual location of land mark features such as water bodies, forest land, agriculture land, etc. The supervised classification of the satellite image yielded the following classes:
Table 3.2 Area Statistics for Land Use Land Cover Classes
No. Classes Area Ha. % Remarks
1 Built Up Area 3272 10.42 The surrounding villages around the project site are well developed with road electricity, and water connectivity.
2 Crop Land 9236 29.40 This area has good water supply from nearby river and reservoir. Major crop cultivated is sugar cane, wheat, rice ground nut and sunflower.
3 Fallow Land 7854 25.00 This fallow land is because of changing of crop type and also because of leaving the land uncultivated to get fertile..
4 Barren Land 6722 21.40 The Barren land occupies 21.40% of the total study area and the pattern is scattered type. the ground surface is rocky where plantation growth is very minimal
5 Water Bodies 945 3.01 water bodies occupies about 3.01% in this study area. 6 Forest 3386 10.78 Forest land contributes to 10.78% of the study area.
Total 31415 100.00 Graphical Presentation of Land use classification within 10 Km radius of proposed project.
Figure 3.6 Land Use Land Cover Statistics
10.42%
29.40%
25%
21.40%
3.01%
10.78%
Land Use Classification
Built Up Area
Crop Land
Fallow Land
Barren Land
Water Bodies
Forest

60
Figure 3.7 Topographical Map

61
3.3.2 Land Use Map
Land use map developed was based on the image color, texture, tone and also ground truth verification data. Ground truth verification was carried out to validate the results of classified image and reconciliation was carried out with actual location of land mark features such as water bodies, forest land, agriculture land, etc.Map for the Land use classification found within 10 Kms. Radius buffers.
Figure 3.8 Land Use and Land Cover Map

62
3.3.3 Settlement Map
The area has good literacy rate and there is a lot of development taking place in this area. All the villages are well connected with the roads. Because of existing of other industries the area is well developed with proposer roads, water and electricity supply
Figure 3.9 Settlement Map

63
3.3.4 Eco-Sensitive Map Eco-sensitive map is a matter of more concern because the proposed expansion project should not hamper the natural eco system and surrounding natural resources. The Eco- sensitive map of the proposed expansion project site was developed on the Karnataka state map, showing all the eco-sensitive area of Karnataka state. As per the map, there are no eco-sensitive zones falling within 10 km radius from the proposed project site.
Figure 3.10 Eco-Sensitive Map

64
3.3.5 Contour Map
The contours are digitized using the topographical maps with scale 1:50,000. Mean Sea level in the 10 km buffer zone. The source of the contour is from survey of India, topographical map. The proposed site is located at an height of around 600 m w.r.t mean Sea level. The contour map of the study area is given below:
Figure 3.11 Contour Map

65
3.3.5 Drainage Map
The drainage map of the study area was mapped using the field data and topographical map. The drainage map shows that there are not many water bodies in the 10km radius of proposed project site.
Figure 3.12 Drainage Map

66
3.4 SOIL CHARACTERISTICS
3.4.1 Introduction
Agriculture is the main occupation pattern in the area. Hence, it is essential to determine agriculture potential of soil from the area and identify the impacts of urbanization and industrialization in the area. Study has been conducted to determine the agricultural and afforestation potential of the soil. Assignment w.r.t. soil studies were done by Dr. R. Mudliyar; the Functional Area Expert for Soil Characteristics (SC).
3.4.2 Soil Quality (Present Status)
The premises have a gentle terrain and no prime agricultural land is altered. Distillery will be established on land owned by Karthik Agro Industries Pvt Ltd., (KAIPL) at Hoolageri Village, Tal: Badami, Dist.: Bagalkote, Karnataka. Geographical location of the site is Latitude - 16° 8'17.53"N, Longitude - 75°35'41.67"E. Distillery will be established on land already owned by KAIPL; hence no any alternative sites were examined.
No rehabilitation and resettlement will be required. Mainly soil found in the study region is very shallow, well drained clayed soils on gently sloping undulating lands with moderate erosion; associated with deep, moderately well drained, fine calculus soils with moderate erosion. The drainage map indicates that study area is well balanced water drainage pattern across the study area of 10KM, and no water bodies or river is at project site or around the 2KM area. Soil quality is the capacity of a specific kind of soil to function, within natural or Managed ecosystem boundaries, to sustain plant and animal productivity, maintain or enhance water and air quality and support human health and habitation. Soil quality reflects how well a soil performs the functions of maintaining biodiversity and productivity, partitioning water and solute flow, filtering and buffering, nutrient cycling and providing support for plants and other structures. Thus, soil quality plays vital role in any particular geographical phenomenon of ecology as well as physico- chemical environment. Soil quality can indicate the current as well as future issues related with the water, ecology and life in the particular region. Thus, it is clearly visible that soil Contamination may result in eventuality in form of contamination of water, ecological destruction, and loss of productivity, food crisis and so threat to life The major source of contamination is wastes from industries as well as overuse of fertilizers & pesticide. Thus, to determine the exact impacts of any proposed project, it is very essential to determine the existing status of soil quality and existing stress through a study of soil quality assessment. Considering this, for studying soils of the region, sampling locations were selected to assess the existing soil conditions in and around the project area representing various, physiographic conditions, geology, land form and land use conditions. The physical, chemical characteristics were determined. The samples were collected by soil auger and other required equipments, up to a depth of 30 cm. as per standard soil sampling procedure , given in Soil survey manual , All India soil and land use survey, New Delhi- 1970 of Ministry of agriculture, Govt. of India
The present study of the soil profile establishes the baseline characteristics and this will help in future identification of the incremental concentrations if any, due to the operation of the project. The sampling locations have been identified with the following objectives:
• To determine the baseline soil characteristics of the study area; • To determine the impact of industrialization on soil characteristics; and • To determine the impact on soils more importantly from agricultural productivity point of
view.

67
3.4.3 Methodology
Eight locations in and around the proposed plant boundary were selected for soil sampling. At each location, soil samples were collected from surface 0 to 30 cm depth and are homogenized and collected after quartering. The homogenized samples were analyzed for physical and chemical characteristics. The soil samples were collected during post-monsoon season.
3.4.3.1 Methodology of Data Generation
Physical and chemical properties and heavy metal concentrations of the soil were analyzed. Soil samples were collected once during Oct-Nov-Dec-2020. Samples have been analyzed by laboratories per the established scientific methods for physico-chemical parameters. Methodology adopted for each parameter is described in table 3.3.
3.4.3.2 Sources of Information
In addition to field surveys, the other sources of information were offices of National Bureau of Soil Survey and Land Use Planning (NBSS and LUP) as well as District Census Data from Census of India, 2011.
Table 3.3 Analytical Techniques for Soil Analysis
Parameter Method (ASTM Number) pH pH meter (D 1293-84) Electrical conductivity Conductivity meter (D 1125-82) Grain size distribution Sieve analysis (D 422 – 63) Textural classification Chart developed by Public Roads Administration Bulk density Sand replacement, core cutter Sodium absorption ratio Flame photometric (D 1428-82) Nitrogen Kjeldahl distillation (D 3590-84) Phosphorus Molybdenum blue, colourimetric (D 515-82) Potassium Flame photometric (D 1428-82) Iron AAS (D 1068-84) Zinc AAS (D 1691-84) Boron Surcumin, colourimetric (D 3082-79)
Overall, Eight Soil Sampling points were selected. Locations are listed in Table 3.4. Soil characteristics presented in Table 3.6 are compared with standard classification given in Table 3.5. Refer Annexure-I for Soil monitoring reports.
Table 3.4 Soil Sampling Locations
No Name of Location
Type Co-ordinates Distance from site Km
Direction Latitude (N) Longitude (E)
1 Hoolageri (S1) Rural 16° 6'14.07"N 75°35'29.39"E 4.15 S 2 Hoolageri (S2) Industri
al 16° 8'32.21"N 75°35'40.56"E Sample taken
within Ind Sample taken
within Ind 3 Ganganbudihal (S3) Rural 16° 8'19.63"N 75°33'42.07"E 3.46 W 4 Simileri (S4) Rural 16°10'47.10"N 75°36'41.91"E 4.65 NNE 5 Kagalgomb (S5) Rural 16° 6'59.29"N 75°37'50.57"E 4.80 SE 6 Yaragoppa Inam (S6) Rural 16° 4'50.09"N 75°34'30.89"E 7.02 SSW 7 Karagri (S7) Rural 16° 4'26.94"N 75°38'41.18"E 9.21 SSE 8 Kalasakoppa (S8) Rural 16°10'36.28"N 75°30'37.97"E 9.74 WNW

68
Table 3.5 Standard Soil Classification
No Soil Tests Classification 1 pH <4.5 Extremely acidic
4.51- 5.50 Very strongly acidic 5.51-6.00 moderately acidic 6.01-6.50 slightly acidic 6.51-7.30 Neutral 7.31-7.80 slightly alkaline 7.81-8.50 moderately alkaline 8.51-9.0 strongly alkaline 9.01 very strongly alkaline
2 Salinity Electrical Conductivity (µmhos/cm) (1ppm = 640 µmho/cm)
Up to 1.00 Average 1.01-2.00 harmful to germination 2.01-3.00 harmful to crops (sensitive to salts)
3 Organic Carbon (%) Up to 0.2: very less 0.21-0.4: less 0.41-0.5 medium, 0.51-0.8: on an average sufficient 0.81-1.00: sufficient, >1.0 more than sufficient
4 Nitrogen (Kg/ha) Up to 50 very less 51-100 less 101-150 good 151-300 Better, >300 sufficient
5 Phosphorus (Kg/ha) Up to 15 very less 16-30 less 31-50 medium, 51-65 on an average sufficient 66-80 sufficient >80 more than sufficient
6 Potash (Kg/ha) 0 -120 very less, 120-180 less, 181-240 medium, 241-300 average, 301-360 better, >360 more than sufficient
Table 3.6 Existing Soil Characteristics
No Parameters Units Location Analysis Method
S 1 Hoolag
eri (Rural)
S 2 Hoolageri (Industrial)
S 3 Ganganbu
dihal
S 4 Simikeri S 5
Kagalgomb
S 6 Yarago-ppaInam
S 7 Katageri
S 8 Kalasakop
p
1 Colour - Medium
Black Medium
Black Medium Black
Medium Black
Medium Black
Medium Black
Medium Black
Medium Black
IS 2720
2 Grain Size Distribution
IS 2720-P4
a Sand % 26 38 22 18 17 20 22 18 b Silt % 14 17 17 14 13 16 11 10 c Clay % 60 45 61 68 70 64 67 72 3 Texture Class Clay Clay Clay Clay Clay Clay Clay Clay IS 2720
4 Bulk Density gm/cc 1.32 1.49 1.29 1.22 1.18 1.27 1.25 1.15 IS 2720-
p2
5 Permeability cm/hr 0.76 0.86 0.69 0.38 0.76 0.69 0.48 0.25 IS :2720 P-17/36
6 Water Holding capacity
% 58.33 42.91 59.42 67.55 69.84 63.10 66.87 74.21 IS 14765
7 Porosity % 61.24 44.72 62.11 69.02 71.30 65.95 68.92 72.56 IS 2720 8
pH (1: Aq Extraction) -- 7.99 8.11 7.94 7.73 7.67 7.89 7.82 7.54 IS 2720 (Part 26)
9 Electrical Conductivity
µS/cm 1018.83 398.54 1115.35 1459.56 1560.13 1205.87 1327.13 1729.79 IS:1892
10 Cation Exchange Capacity
meq/ 100gm 48.45 26.44 51.73 66.35 76.52 57.75 61.07 82.09 IS 2720
11 Exchangeable Calcium
meq/ 100gm 32.57 18.14 33.63 43.21 48.75 37.90 39.06 52.32 IS 2720
12 Exchangeable Magnesium
meq/ 100gm 15.20 7.95 17.34 22.19 26.74 19.05 21.14 28.65 IS 2720
13 Exchangeable Potassium
meq/ 100gm 0.44 0.17 0.49 0.60 0.64 0.52 0.56 0.71 IS 2720
14 Exchangeable Sodium meq/ 100gm 0.24 0.18 0.27 0.35 0.39 0.28 0.31 0.41 IS 2720

69
No Parameters Units Location Analysis Method
S 1 Hoolag
eri (Rural)
S 2 Hoolageri (Industrial)
S 3 Ganganbu
dihal
S 4 Simikeri S 5
Kagalgomb
S 6 Yarago-ppaInam
S 7 Katageri
S 8 Kalasakop
p
15 Sodium Absorption Ratio
---------- 0.049 0.050 0.053 0.061 0.063 0.052 0.057 0.064 IS 2720
16 Nitrogen (N) Kg/ha 112.34 55.76 119.80 159.67 171.36 128.62 143.20 185.92 IS
14684:1999, 2005
17 Available Phosphorous (P)
Kg/ha 55.69 31.43 58.22 77.01 82.64 64.12 69.04 90.35 IS 2720
18 Available Potassium Kg/ha 170.34 64.61 189.47 234.93 250.39 200.96 219.22 276.90 IS 2720
19 Organic Carbon %
0.58 0.22 0.60 0.72 0.76 0.63 0.69 0.81 IS 2720-
P22
20 Organic Matter %
1.00 0.38 1.03 1.24 1.31 1.08 1.19 1.39 IS 2720-
P22
21 Water Soluble Chloride (Cl)
mg/kg 155.31 40.77 160.49 192.58 201.46 164.20 179.35 230.65 IS:812 P-4
22 Water Soluble Sulphate (SO4)
mg/kg 84.20 34.10 95.77 141.33 150.30 108.63 121.69 162.53 IS 2720-
27 23 Aluminum (Al) % 0.02 0.01 0.01 0.01 0.02 0.01 0.01 0.02
USEPA Method 3050B
24 Total Iron (Fe) % 0.21 0.03 0.25 0.39 0.47 0.29 0.35 0.50 25 Manganese (Mn) mg/kg 15.42 6.07 20.31 28.50 30.99 23.87 25.11 34.47 26 Boron (B) mg/kg 31.38 12.10 34.10 45.21 50.21 36.92 40.76 55.95 27 Zinc ( Zn) mg/kg 42.36 15.63 49.87 65.84 69.74 55.41 61.39 75.08 28 Total Chromium (Cr) mg/kg BDL 0.01 BDL 0.01 BDL BDL 0.01 0.01 29 Lead (Pb) mg/kg BDL BDL BDL BDL BDL BDL BDL BDL 30 Nickel (Ni) mg/kg 10.34 4.93 12.71 19.68 21.43 16.20 17.35 25.69 31 Arsenic (As) mg/kg BDL BDL BDL BDL BDL BDL BDL BDL 32 Mercury (Hg) mg/kg BDL BDL BDL BDL BDL BDL BDL BDL 33 Cadmium (Cd) mg/kg BDL BDL BDL BDL BDL BDL BDL BDL 34 Barium as (Ba) mg/kg 4.90 1.53 6.11 12.36 15.85 8.43 11.39 20.36 35 Selenium (Se) mg/kg BDL BDL BDL BDL BDL BDL BDL BDL 36 Copper (Cu) mg/kg 0.12 0.05 0.19 0.41 0.45 0.29 0.33 0.56
3.4.4 Comments on Soil Characteristics
From the interpretation of field data, physical and chemical data it can be concluded that: Soils are shallow black soils did not differ significantly in properties as that of shallow soils in scarcity area. As per the physical data soils are fine texture, having low bulk density, imperatively good water holding capacity, and slow permeability. As per physical characters soils are rated as moderate to good for agriculture. Main higher values for chemical parameters were recorded at project site as compare to other study area sampling location mainly outside the 5KM radii of study area compare to KAIPL. Therefore, project proponent needs to take care of any further soil degradation through soil conservation & remediation measures as prescribed by MOEFCC/CPCB guidelines. As per chemical characters soil reaction (pH) soils are neutral, slightly to moderately alkaline and electrical conductivity (EC) is non saline (normal). Organic matter is better to sufficient. Macro nutrient like nitrogen is better to sufficient and phosphorus is medium to sufficient, potassium is low, calcium, magnesium are medium to good and base saturation is moderate to good Sodium is below the limit to make soil saline or sodic or alkali. Micro-nutrients, Mn (very low may cause deficiency), Zn, Fe ,Al ( nil to low, will cause deficiency), B is low( may cause deficiency) SO4 low to medium and Cl are medium to high. Cation Exchange capacity is high indicating to good fertility. Exchangeable Ca is moderate with good base saturation, Ex K is low, and Ex Na is also low not indicating any alkalinity. Sodium adsorption ratio indicates the soils are normal

70
Figure 3.13 Baseline Environmental Details: Soil Environment

71
Figure 3.14 Soil Analysis
Figure 3.15 Soil Analysis

72
Figure 3.16 Soil Analysis
Figure 3.17 Soil Analysis

73
3.4.5 Physical Characters
The physical characters include Bulk density, grain size distribution (textural analysis). a. Grain size distribution: Texture indicates relative proportion of various sizes of primary
soil particles such as sand, silt and clay present in the soil. Based on their quantities present in the soil sample and using the textural classification diagram. Mostly all samples contains clay, sand & silt in which Sand is highest at locations namely S1 (35%) to minimum at S5 (17%) and for Silt at S3 (17%) & min at S8(10%) & S8(72%) and S2(50%) max & min at project Site for Clay. The textural classes of eight soil samples are clayey (fine) Bulk density values confirm the textural class. The average Sand, Silt and Clay in % is 22.25±5.92, 13.75±2.371, and 64.87±7.03 respectively. This indicates it has clayey type mostly across all locations.
b. Bulk Density: In case of bulk density total soil space (space occupied by solid and pore spaces combined) are taken in to consideration. Soil texture, soil structure and organic matter content are the factors influencing the bulk density of a soil. Bulk Density, besides being an interesting and significant physical characteristic, is very important as a basis for certain computations. The Bulk density of the eight soil sample under consideration ranges between minimum at S6(1.15gm/cc) & max. at Project site S2 (1.39 gm/cc), and confirms the fine texture of the soils of the area under study.
c. Porosity: The pore space of a soil is the space occupied by air and water and is expressed as percent pore space. The amount of this pore space is determined by structural conditions, that is by inter- related influence of texture, compactness and aggregation. Porosity is also related to aeration and retention and movement of water in the soil. The porosity of eight soil sample ranges minimum at S2 (46.72%) whereas, maximum at S8 (72.56%) and is good in accordance to the texture of soil, and considered good for air and water movement in the soil for crops
d. Permeability: permeability is the entry of fluid from one medium to another. In soil – water relationship, it means entry of water from air in to soil. Permeability rate is defined as maximum rate at which a soil in a given condition can absorb rain or irrigation water as it comes at soil surface, permeability rate is the rate of water entry in to the soil when flow is non-divergent. Study shows that permeability of eight samples under study has minimum at S8 (0.25cm/hr) whereas maximum found at S2 (0.86 cm/hr) and therefore based on above analysis it could be classified as slow to moderate for agriculture and conservation, indicating good availability of moisture to cops after rain or irrigation.
e. Water Holding Capacity (WHC): Water holding capacity of soil is the maximum amount of moisture, a dry soil is capable of holding, under given standard condition. If the moisture content is increased further percolation result WHC is of great value to practical agriculture, since it provides a simple means to determine moisture content. WHC required for good crop growth is 35 to 70%. The WHC of the eight soil samples is between 48.91% to 74.21% and is moderate to good indicating availability of water for crop growth indicating somewhat less frequent water application for growing crops. Drip irrigation could be alternate for optimum application of water. The average WHC for study area was analysed to be 63.53±7.92 %
3.4.6 Chemical Characters:
The parameters considered for chemical analysis are: Soil reaction (pH), Electrical conductivity (EC), Cation Exchange Capacity (CEC)) Cations, like Calcium, Magnesium, Sodium and Potassium, water soluble sulphates ,and chlorides, sodium Adsorption Ratio (SAR).,, Macro nutrients like Available Nitrogen, total Organic carbon, organic matter

74
Available phosphorus, available potassium Micro nutrients like Iron Zinc, manganese and boron. Heavy metals like, Chromium(Cr), Lead (Pb), Nickel (Ni),Arsenic(As), Mercury (Hg) and Cadmium (Cd) a. Soil reaction (pH): The nutritional importance of pH is illustrated, thus hydrogen ion
concentration has influence not only on, solubility of nutrients, but also upon facility with which these nutrients are absorbed by plants, even already in soil solution for e.g. Fe,Mn and Zn become less available as pH rises from 4.5 to 7. At pH 6.5 to7.0 utilization of nitrate and ammonia nitrogen becomes more available. In case of phosphorus it becomes less available to plant as pH increases above 8.5, due to its fixation in exchange complex of soil. For the eight soil sample under consideration the pH ranges between 7.54 to 8.11 indicating soils are neutral.
b. Electrical conductivity (EC): The salt content of the soils are estimated by EC measurements, and is useful to designate soils as normal or sodic (saline). Electrical conductivity is expressed as µmhos/cm at 25◦C, µsmhos/ cm or mmhos /cm or sm/cm. The
EC of eight soil samples is between 1729.79 to 789.74 with average value around 1275.8±306.19 µs/cm and are near the limits to be called as saline and hence the soils are normal to hard for crop growth & germination as per soil classification table
c. Organic Carbon / Organic matter( %): Although accounting for only a small part of the total soil mass in mineral soils, organic matter influences physical, chemical, and biological activities in the soil. Organic matter in the soil is plant and animal residue which serves as a reserve for many essential nutrients, especially nitrogen. Determination of organic matter helps to estimate the nitrogen which will be released by bacterial activity for the next season depending on the conditions, soil aeration, pH, type of organic material, and other factors. The eight soil samples under consideration contain 1.29 to 0.58 % organic matter with Organic carbon content in range of 0.81 to 0.42 %; OM is calculated from organic carbon estimation. As per crop requirements the soils are having more than sufficient organic matter content in different samples, required for growing crop in next season.
d. Available Nitrogen (N): Nitrogen is a part of all living cells and is a necessary part of all proteins, enzymes and metabolic processes involved in the synthesis and transfer of energy. Nitrogen is a part of chlorophyll, the green pigment of the plant that is responsible for photosynthesis. Helps plants with rapid growth, increasing seed and fruit production and improving the quality of leaf and forage crops. The available nitrogen in the eight samples in question, as per analysis ranges between185.92 to 105.76 mg/kg showing less to good nitrogen content for crop growth.
e. Available Phosphorus (P): Like nitrogen, phosphorus (P) is an essential part of the process of photosynthesis. Involved in the formation of all oils, sugars, starches, etc. Helps with the transformation of solar energy into chemical energy; proper plant maturation; withstanding stress. Effects rapid growth, .Encourages blooming and root growth. The phosphorus content of soil of eight samples ranges between 90.35 to 41.43 mg/kg and falls under less or deficient category. In different samples for crop growth.
f. Available Potassium (K): Potassium is absorbed by plants in larger amounts than any other mineral element except nitrogen and, in some cases, calcium. Helps in the building of protein, photosynthesis, fruit quality and reduction of diseases. The Potassium content of eight soil samples ranges between 276.9 to 125.61 mg/Kg and is moderate to less for crop growth.
g. Cation Exchange capacity (CEC): The total amount of exchangeable cations that a soil can retain is designated as cation exchange capacity (CEC) and usually expressed as me/100gm of soil. Determination of amount of cations present in soil is useful, because CEC influences the availability of adsorbed cations to both higher plants and soil microorganisms. Thus CEC is directly related to fertility of soils. The CEC of the eight samples ranges

75
between 82.09 to 29.59 meq / 100gm soil. A soil with low CEC indicates low fertility and soils with high CEC indicates high fertility. Eight soil samples are fine textured having high percentage of clay with dominating montmorrilonitic clay mineral, showing high CEC, in turn fertility is also high.
h. Exchangeable Calcium (Ca++): Calcium, an essential part of plant cell wall structure, provides for normal transport and retention of other elements as well as strength in the plant. It is also thought to counteract the effect of alkali salts and organic acids within a plant and soil acidity. The exchangeable calcium content of eight soil samples ranges between 52.32 to 20.14 meq/100gm soil, and having good base saturation percentage (ranging from 50 to51 %). For normal crop growth a calcium base saturation percent of soils between 50 to 75% 50% is required. The average Ca in study area was analysed around 29.605±6.059 meq/100gm soil.
i. Exchangeable Magnesium (Mg++): Magnesium is part of the chlorophyll in all green plants and essential for photosynthesis. It also helps activate many plant enzymes needed for growth. The magnesium content of the eight soil samples ranges 28.65 to 8.95meq/100 gm soil( BS % is 50%, which is further adding to base saturation. Magnesium base saturation percent of 5 to 15 % is normal.
j. Exchangeable Sodium (Na+): Though sodium is not an essential plant nutrient, but it has some role in potassium nutrition. Sodium also has a role in affecting the pH of soils; Sodium present above a certain limit makes soil alkaline which affect soil physical condition, and fixing of available phosphorus. Out of the eight samples sodium ranges between 0.41 to 0.18 meq/100gm soil, which is below the content(i.e. ESP is below 15%) at which soil show, saline alkali or alkaline properties, hence no adverse effect on soils.
k. Exchangeable Potassium (K+): Potassium is absorbed by plants in larger amounts than any other mineral element except nitrogen and, in some cases, potassium Helps in the building of protein, photosynthesis, fruit quality and reduction of diseases. The Potassium content of one soil sample is 0.71 to 0.32 meq/100 gm and is low for crop growth.
l. Sodium Adsorption ratio (SAR): Sodium adsorption ratio is ratio of Na+ to under root of Ca + +Mg++ by 2. SAR values of soil solution along with EC and pH helps in diagnosing soils as normal, saline, saline-alkali or alkali. The eight soil samples show SAR values between 0.064 to 0.047.
m. Iron (Fe): Iron is essential for crop and other plants for chlorophyll formation Iron deficiency likely occurs in soils with high pH, poor aeration, excessive phosphorus, or low organic matter. It may be produced also by an imbalance of Mo, Cu, and Mn. In plants, the deficiency shows up as a pale green leaf color (chlorosis) with sharp distinction between green veins and yellow intervenial tissues. The iron content of eight samples ranges 0.5 to 0.13 % and is normal.
n. Aluminum (Al): Exchangeable Aluminum (Al) is not present in a plant available form in soils with a pH above 5.5 and therefore tests for extractable aluminum need only be done on distinctly acid soils. In soils with a pH range of 4.5 - 5.5 are those most likely to be affected by aluminum toxicity. In the eight samples the total Aluminum is between 0.02 to 0.01%.
o. Manganese( Mn): Is an important plant micro nutrient and is required by plants in second greater quantity compared to iron, like any other element, it can have limiting factor on plant growth, if it is deficient or toxic in plant tissue. Manganese is used in plants as major contribution to various biological systems, including photo synthesis, respiration and nitrogen assimilation. Mn content in the eight samples ranges between 34.47 to 9.07 mg/kg and is moderate for plants.
p. Zinc (Zn): Zn deficiency most often is present in sandy soils with neutral or alkaline pH, or with low organic matter. Total zinc may be high but the availability depends on other

76
factors. In the present eight samples Zinc content ranges between 75.08 to 23.63 mg/kg or ppm and are low, considered deficient for crop growth.
q. Boron (B): There is a very narrow range between deficiency and toxicity in boron. Deficiencies are more often when organic matter is low and dry weather slows the decomposition. Uptake of boron is reduced at pH level higher than 7.0 Plant toxicity symptoms manifest as leaf tip and marginal chlorosis. Boron toxicity occurs in dry areas and is generally associated with irrigation water. In the eight samples of the project the boron content is between 55.95 to 22.1 mg/kg is low and will cause deficiency to crops.
r. Water-Soluble Sulphates as SO4: This test measures readily available sulphur in the form of dissolved plus absorbed sulphate. Sulphur testing is important where low sulphur or sulphurfree fertilizers are used, such as high analysis NPK fertilizers. Retention of sulphate sulphur by the soil is related to its phosphate retention, with high leaching losses of sulphate being associated with low phosphate retention soils. This should also be taken into account when considering sulphur fertilizer options. In the eight samples the water soluble sulphate as SO4 ranges between 162.53 to 54.11 mg/kg and medium to moderate.
s. Water Soluble Chlorides as Cl: The Cl−anion does not form complexes readily, and shows little affinity (or specificity) in its adsorption to soil components. Thus, Cl−
movement within the soil is largely determined by water flows. Chlorine is an essential micronutrient for higher plants. It is present mainly as Cl−. Chloride is a major osmotically
active solute in the vacuole and is involved in both turgor- and osmo regulation. In the cytoplasm it may regulate the activities of key enzymes. In addition, Cl−also acts as a
counter anion and Cl− fluxes are implicated in the stabilization of membrane potential,
regulation of intracellular pH gradients and electrical excitability. In the eight samples the water soluble chloride ranges between 230.65 to 140.77 mg/kg and is medium to moderate.
t. Heavy Metals: Soils may become contaminated by the accumulation of heavy metals and metalloids through emissions from the rapidly expanding industrial areas, mine tailings, disposal of high metal wastes, leaded gasoline and paints, land application of fertilizers, animal manures, sewage sludge, pesticides, wastewater irrigation, coal combustion residues, spillage of petrochemicals, and atmospheric deposition. Heavy metals constitute an ill- defined group of inorganic chemical hazards, and those most commonly found at contaminated sites are lead (Pb), chromium (Cr), arsenic (As), zinc (Zn), cadmium (Cd),), mercury (Hg), and nickel (Ni) Soils are the major sink for heavy metals released into the environment by aforementioned anthropogenic activities and unlike organic contaminants which are oxidized to carbon (IV) oxide by microbial action, most metals do not undergo microbial or chemical degradation and their total concentration in soils persists for a long time after their introduction Changes in their chemical forms (speciation) and bioavailability are, however, possible. The presence of toxic metals in soil can severely inhibit the biodegradation of organic contaminants [Heavy metal contamination of soil may pose risks and hazards to humans and the ecosystem through: direct ingestion or contact with contaminated soil, the food chain (soil-plant-human or soil-plantanimal- human), drinking of contaminated ground water, reduction in food quality (safety and marketability) via phyto-toxicity, reduction in land usability for agricultural production causing food insecurity, and land tenure problems.
u. Chromium (Cr) : Chromium mobility depends on sorption characteristics of the soil, including clay content, iron oxide content, and the amount of organic matter present. Chromium can be transported by surface runoff to surface waters in its soluble or precipitated form. Soluble and un-adsorbed chromium complexes can leach from soil into groundwater. The leachability of Cr (VI) increases as soil pH increases. Most of Cr released into natural waters is particle associated, however, and is ultimately deposited into the

77
sediment. In the eight samples the chromium is below detectible limit and 0.01 hence no chromium contamination.
v. Lead (Pb): Typical mean Pb concentration for surface soils worldwide averages 32 mg kg−1 and ranges from 10 to 67 mg kg−1 The most serious source of exposure to soil lead is through direct ingestion of contaminated soil or dust. In general, plants do not absorb or accumulate lead. However, in soils testing high in lead, it is possible for some lead to be taken up. Studies have shown that lead does not readily accumulate in the fruiting parts of vegetable and fruit crops (e.g., corn, beans, squash, tomatoes, strawberries, and apples). Higher concentrations are more likely to be found in leafy vegetables (e.g., lettuce) and on the surface of root crops (e.g., carrots). Since plants do not take up large quantities of soil lead, the lead levels in soil considered safe for plants will be much higher than soil lead levels where eating of soil is a concern (pica). Generally, it has been considered safe to use garden produce grown in soils with total lead levels less than 300 ppm. The risk of lead poisoning through the food chain increases as the soil lead level rises above this concentration. Even at soil levels above 300 ppm, most of the risk is from lead contaminated soil or dust deposits on the plants rather than from uptake of lead by the plant. In the eight samples the Lead ranges in BDL ie., within permissible limit.
w. Nickel (Ni): Nickel is an element that occurs in the environment only at very low levels and is essential in small doses, but it can be dangerous when the maximum tolerable amounts are exceeded. . It usually takes a long time for nickel to be removed from air. The larger part of all Ni compounds that are released to the environment will adsorb to sediment or soil particles and become immobile as a result. In acidic soils, however, Ni becomes more mobile and often leaches down to the adjacent groundwater. In the eight soil samples, the nickel content is between 25.69 to 4.93 and below limit of contamination.
x. Arsenic (As): Arsenate can adsorb or co precipitates with metal sulfides and has a high affinity for other sulfur compounds. Elemental arsenic and arsine, AsH3, may be present under extreme reducing conditions. Biotransformation (via methylation) of arsenic creates methylated derivatives of arsine. As compounds adsorb strongly to soils and are therefore transported only over short distances in groundwater and surface water. In the eight samples the arsenic values are below detectible limit and within permissible limit of contamination.
y. Mercury (Hg): Sorption to soils, sediments, and humic materials is an important mechanism for the removal of Hg from solution. Sorption is pH dependent and increases as pH increases. Mercury may also be removed from solution by co-precipitation with sulphides. Under anaerobic conditions, both organic and inorganic forms of Hg may be converted to alkylated forms by microbial activity, such as by sulfur-reducing bacteria. Elemental mercury may also be formed under anaerobic conditions by demethylation of methyl mercury, or by reduction of Hg (II). Acidic conditions (pH < 4) also favor the formation of methyl mercury, whereas higher pH values favor precipitation of HgS(s) .In the eight samples the mercury content is below detectible limit and within permissible limit of contamination.
z. Cadmium (Cd): The application of agricultural inputs such as fertilizers, pesticides, and biosolids (sewage sludge), the disposal of industrial wastes or the deposition of atmospheric contaminants increases the total concentration of Cd in soils, and the bioavailability of this Cd determines whether plant Cd uptake occurs to a significant degree. Cadmium is very bio - persistent but has few toxicological properties and, once absorbed by an organism, remains resident for many years. The eight samples contain cadmium is BDL then within permissible limits of contamination.

78
Figure 3.18 Soil Map

79
3.5. DRAINAGE AND GEOMORPHOLOGY
Assignment w.r.t. Hydrology, Ground water & Water conservation and Geology (HG & GEO) has been done by Dr. J. B. Pishte, who is an empanelled expert FAE of EEIPL for Geology. Scope of work methodology involved and allied details are presented in following paragraphs.
A visit to the project site and field work in the surrounding area was carried out on post monsoon period, to study Geology & Hydrogeology (HG-Geo) of the area and assess the possible impact of the project on the environment. This EIA Report covers results of studies carried out in the area of influence of project. It is based on primary data collected by observations during field visit and secondary data obtained through dialogue with local people and previous literature from different sources.
3.5.1. Methodology
3.5.1.1. Literature Review
Reports of Central Ground Water Board and Groundwater Surveys and Development Agency of the State are useful to begin with the work. But such literature generally relates to district or State level. Therefore, content related to the study area had to be extracted carefully from such reports. Literature related to effluents and waste waters of the project and their impact on geology and water regime was also referred to.
3.5.2. Data Generation
Many times, only general and statistical information is available, hence visit to the study area and generation of primary data becomes necessary. A visit to the project site and field work in the surrounding area was carried out to study Geology and Hydrogeology (HG-Geo) of the area.
3.5.2.1 Hydrogeology
The general information on hydrogeology of the area is gathered from report of CGWB, and well inventory carried out in the area around project site. The water samples for quality analysis were collected from areas around the project site.
3.5.2.2 Geology
Observations on rock types, their textures and structures were made in surface outcrops, dug well sections, road sections, stream sections, and other types of excavations existing in the area.
3.5.3. Data Analysis and Interpretation
3.5.3.1 Hydrogeology
Groundwater flow directions in the study area were deduced from well inventory data. This information is used in interpretation of the direction/s of probable movement of contamination plume, if any, originating from the proposed project activity. Ground water samples were handed over to M/s Equinox Environments Pvt. Ltd., Kolhapur, for analysis. Interpretations regarding water quality parameters were made by referring to prescribed standards; and books and research papers on quality of ground water

80
3.5.3.2 Geology
Rock types, their textures and structures observed in the area were identified by visual examination in situ and hand specimens broken from outcrops wherever necessary.
3.5.4 Description of the environment
3.5.4.1. Geomorphology
The topography of Badami taluka is rugged and undulating, traversed by chains of detached hills trending in EW direction. The ortho-quartzites and the banded hematite quartzites have formed well defined linear ridges. General topography of the area around KAIPL project site is undulated with a gentle slope towards North – towards Ghataprabha River, where the elevation is about 519 m above MSL. In the southern part of the project site, elevation is about 602 above MSL. Thus, the total relief in the area is only about 83 m. The entire area around the project site is covered with farmlands and reserved forest land. Reefer Figure 3.7 fro Topographical Map.
3.5.4.2. Drainage
The KAIPL Project site is situated in Ghataprabha River Basin which is a tributary of Krishna River. Ghataprabha River is nine kilometers north from project site. The first order streams of a tributary of Ghataprabha river originate on north sides of the project site and flow northeast to meet the mainstream. The normal annual rainfall in Badami taluka, where the project is situated is around 546 mm. Refer Figure 3.12 for Drainage Map. 3.6. GEOLOGY, HYDROLOGY & HYDROGEOLOGY
3.6.1. Geology
The district is underlain mainly by the crystalline formations namely granites, gneisses, metasediments of Dharwar super group, shales sandstones, quartzites and limestone, basalt and river alluvium. The district is endowed with a fairly rich mineral and rock wealths like limestone, granites, dolomites etc. In the study area, red sandstone can be seen in road sections.
3.6.2. Hydrogeology
The hydrogeology of the study area is governed by depth of weathering and physical nature of sandstone rock. The weathered portions at shallow depth have better porosity and permeability facilitating groundwater movement from surface to the saturated zone. Porosity in sandstone is favorable for movement and storage of groundwater. Natural recharge from rains in monsoon and later from surface water bodies like river, and its tributary streams, canals, ponds, lakes and artificial reservoirs augments the groundwater in non-monsoon season. Groundwater in the area of influence of the project is used mainly for irrigation purpose and for domestic use in farm houses.
3.6.2.1. Groundwater Resources
The groundwater is predominantly used for Irrigation in study area. Normal Rainfall of Bagalkote district is 580 mm/year. According to the Central Ground Water Board, during 10 year of period, 1996 to 2005, the annual rainfall of the Bagalkote District was between 500 to 650 mm. Accordingly, we can say the annual rainfall under the district is satisfactory. Similarly, project site situated in sandstone which is most favorable for the groundwater recharge in the study area.

81
Agricultural farming in the area is depends on Ghataprabha River as well as groundwater resources in the area. The Ghataprabha River is not a perennial river. In the summer farming is depended on Groundwater resources. Perennial crops are seen in patches only which are irrigated on dug wells and bore wells. 3.6.2.2. Groundwater Quality
The apparent groundwater quality observed in field during visit is good and suitable for drinking, domestic and irrigation purpose in and around project site. Table 3.7 below shows the status of groundwater quality in wells observed in the area along with the Laboratory Report of analysis received from laboratory (Annexure V).
Table 3.7 Status of Groundwater Quality in bore wells observed in the area
type of well Water quality Reported / Observed in field
Laboratory Report of analysis
Sample No. Parameters above prescribed limits (Except coliforms)
Bore well Suitable for Domestic and Irrigation Purpose
KAIPL GW 1 None
Bore well Potable, Used for drinking purpose KAIPL GW 2 None Bore well Potable, Used for Irrigation KAIPL GW 3 None Bore well Potable, Used for drinking purpose KAIPL GW 4 None Bore well Potable, Used for drinking purpose KAIPL GW 5 None Bore well Potable, Used for drinking purpose KAIPL GW 6 None Bore well Potable, Used for Irrigation KAIPL GW 7 None Bore well Potable, Used for drinking purpose KAIPL GW 8 None
It is seen from above field observation and lab analyses that water samples collected at all locations show parameters are within limits.

82
3.7. WATER QUALITY
3.7.1. Introduction
Selected water quality parameters, for surface and ground water resources from the study area, have been considered for assessing water environment and to evaluate impact due to the project. Understanding water quality is important in environmental impact assessment and to identify critical issues with a view to suggest appropriate mitigation measures for implementation.
3.7.2. Methodology
3.7.2.1. Methodology of Data Generation
Reconnaissance was undertaken and monitoring locations were finalized based on – (1) Topomaps and drainage map to identify major water bodies, and (2) likely areas which can represent baseline conditions. Sampling and analysis of water samples for physical, chemical and heavy metals were undertaken through NABL & MoEFCC; New Delhi approved laboratory of M/s. Green Enviro Safe Engineers & Consultant Pvt. Ltd., Pune which is NABL accredited & MoEFCC; New Delhi approved organization. Further, same has received certification of OHSAS 18001:2007 from DNV. Eight locations for surface water and Nine locations for ground water samples were selected which are listed in table 3.8 & 3.9
Table 3.8 Monitoring Locations for Surface Water
Station Code Name of the Station
Type Geographical Location Distance (Km)
Direction Longitude Latitude
KAIPL SW 1 Hoolageri Stream 16°6'52.78"N 75°36'45.41"E 3.60 SSE KAIPL SW 2 Hoolageri Stream 16°8'5.66"N 75°37'10.59"E 2.85 ESE KAIPL SW 3 Hoolageri Nala 16°7'57.75"N 75°37'32.80"E 3.55 ESE KAIPL SW 4 Muchakhandi Pond 16°8'27.79"N 75°39'57.33"E 7.71 E KAIPL SW 5 Chickka-Shellikeri Pond 16°8'11.99"N 75°30'40.08"E 8.87 W KAIPL SW 6 Yadahalli River 16°13'12.05"N 75°37'2.06"E 9.03 NNE
Note: Because of unavailability of Surface Water Body 8 location cannot be taken
Table 3.9 Monitoring Locations for Ground Water
Station Code Name of the Station
Type Geographical Location Distance (Km)
Direction Longitude Latitude
KAIPL GW 1 Hoolageri Bore well 16°8'33.62"N 75°36'1.08"E 0.72 ENE KAIPL GW 2 Hoolageri Bore well 16°8'11.17"N 75°36'2.16"E 0.90 SE KAIPL GW 3 Hoolageri Bore well 16°7'14.13"N 75°35'39.67"E 2.23 S KAIPL GW 4 Kerkalmatti Bore well 16°7'53.24"N 75°34'50.36"E 1.70 SW KAIPL GW 5 Goddanakeri Bore well 16°8'51.21"N 75°38'3.11"E 4.43 ENE KAIPL GW 6 Simikeri Bore well 16° 9'33.64"N 75°36'25.81"E 2.49 NE KAIPL GW 7 Hoolageri Bore well 16°8'18.13"N 75°35'42.31"E 0.35 SSE KAIPL GW 8 Kagalgomb Bore well 16°6'40.63"N 75°37'17.44"E 4.44 SE

83
3.7.2.2. Sampling Procedure for Primary Data Generation
Ground and surface water sources, covered in an area of 10 Km radius from the proposed site were examined for physico-chemical, heavy metal and bacteriological parameters in order to assess the effect of industrial and other activities on surface and ground water. The samples were collected and analyzed as per procedures specified in ‘Standard Methods for the Examination of Water and
Wastewater’ published by American Public Health Association (APHA).Samples for chemical
analysis were collected in polyethylene carboys. Samples were collected in sterilized glass bottles for bacteriological portability test. Parameters analyzed at the site were pH, temperature, odour, turbidity and dissolved oxygen using portable water analysis kits.
Selected physico-chemical and bacteriological parameters have been analyzed for assessing the existing water quality status in the core area. Results for the parameters analyzed in surface water samples, are compared with Class ‘C’ water as per IS: 10500:2012, Second Revision;
“Specifications for Drinking Water”.
3.7.3. Presentation of Results
3.7.3.1. Surface Water
Analysis results for surface water are given in table below. Copies of actual reports are presented at Annexure-IV
Table 3.10 Surface Water
No Parameter Unit
Location Limits IS 10500:20
12
SW 1 Hoolageri (Stream)
SW 2 Hoolager
i (Stream)
SW 3 Hoolag
eri (Nalla)
SW 4 Muchak
handi (Pond)
SW 4 Chickka-Shellikeri (Pond)
SW 6 Yadahall
i (River)
1 Color Hazen 0.90 0.70 3.80 2.70 2.40 1.10 5.00
2 Odor --
Agreeable Agreeabl
e Sewery
Agreeable
Agreeable Agreeabl
e Agreeabl
e 3 pH -- 7.58 7.53 7.91 7.74 7.80 7.60 6.5-8.5 4 Conductivity µS/cm 362.78 282.96 934.26 565.54 644.24 422.03 NS 5 TDS mg/lit 243.07 189.59 625.97 378.92 431.65 282.77 < 500.00 6 Turbidity NTU 0.21 0.17 0.95 0.35 0.38 0.23 < 1.00 7 TSS mg/lit 16.75 14.05 61.99 23.50 27.31 19.01 NS 8 D.O mg/lit 3.51 3.66 1.10 2.44 2.23 3.15 NS 9 COD mg/lit 20.14 16.25 55.63 30.81 34.54 25.31 NS 10 BOD 3 mg/lit 8.03 6.87 20.82 11.45 12.08 9.64 NS 11 Ammonical Nitrogen mg/lit 0.08 0.06 0.45 0.20 0.25 0.11 < 0.50 12 Nitrate as NO3 mg/lit 13.74 8.95 72.19 28.77 32.62 17.52 < 45.00 13 Nitrite as NO2 mg/lit 0.52 0.03 1.73 1.55 2.02 0.79 NS 14 Nitrogen as N mg/lit 8.25 5.74 30.44 16.02 20.45 11.46 NS 15 Phosphorous as PO4 mg/lit 2.03 1.16 4.13 2.94 3.18 2.53 NS 16 Potassium as K mg/lit 72.11 57.41 146.92 105.39 118.20 86.69 NS 17 Sodium as Na mg/lit 19.06 13.82 62.01 30.35 32.98 22.57 NS 18 Calcium as Ca mg/lit 58.74 45.96 99.20 74.98 80.12 61.30 < 75.00 19 Magnesium as Mg mg/lit 3.33 2.59 11.42 6.52 9.36 3.11 < 30.00
20 Total Hardness as CaCO3
mg/lit 160.57 125.57 295.05 214.31 238.86 166.06 < 200.00
21 Carbonates as CO32- mg/lit 1.75 1.25 25.78 17.04 20.53 2.36 NS
22 Bicarbonates as HCO3
mg/lit 30.69 25.53 75.01 45.77 54.86 36.95
NS
23 Chlorides as Cl- mg/lit 20.53 18.56 53.74 28.54 32.53 22.53 < 250.00 24 Sulphates as SO4 mg/lit 10.47 8.34 37.19 17.35 20.63 13.06 < 200.00 25 Sulphide as H2S mg/lit BDL BDL 0.03 0.01 0.01 BDL < 0.05

84
No Parameter Unit
Location Limits IS 10500:20
12
SW 1 Hoolageri (Stream)
SW 2 Hoolager
i (Stream)
SW 3 Hoolag
eri (Nalla)
SW 4 Muchak
handi (Pond)
SW 4 Chickka-Shellikeri (Pond)
SW 6 Yadahall
i (River)
26 Fluorides as F- mg/lit 0.08 0.05 0.91 0.35 0.43 0.11 < 1.00 27 Iron as Fe mg/lit 0.05 0.02 0.28 0.10 0.15 0.09 < 0.30 28 Aluminum as Al mg/lit BDL BDL BDL BDL BDL BDL <0.03 29 Barium as Ba mg/lit 0.05 0.02 0.28 0.12 0.15 0.08 <0.70 30 Boron as B mg/lit 0.02 0.01 0.3 0.14 0.18 0.06 < 0.50 31 Copper as Cu mg/lit BDL BDL BDL BDL BDL BDL < 0.05 32 Selenium as Se mg/lit BDL BDL BDL BDL BDL BDL <0.01 33 Zinc as Zn mg/lit 1.57 0.09 3.95 2.78 3.00 1.45 <5.00 34 Cadmium as Cd mg/lit BDL BDL BDL BDL BDL BDL <0.003 35 Lead as Pb mg/lit BDL BDL BDL BDL BDL BDL <0.01 36 Mercury as Hg mg/lit BDL BDL BDL BDL BDL BDL <0.001 37 Nickel as Ni mg/lit BDL BDL BDL BDL BDL BDL < 0.02 38 Arsenic as As mg/lit BDL BDL BDL BDL BDL BDL < 0.01 39 Chromium as Cr mg/lit BDL BDL 0.01 BDL BDL BDL < 0.05 40 Total Coli form No./100ml 110 80 560 276 346 136 Absent 41 Fecal Coli form No./100ml 48 32 214 102 124 64 Absent
Note: NS- Not Specified
Water at all sites is found neutral in nature. It is also seen that, at Location No. SW 3 & SW 5, values of TDS exceeded the limit. The total hardness of SW 3 is also exceeded the prescribed limit And at all sites, water samples showed presence of total coliforms and fecal coliforms which are above the prescribed permissible limits.
Hence, from above observations it could be seen that the Location No. 3 & 5 are chemically as well as biologically not potable. All other locations water is potable
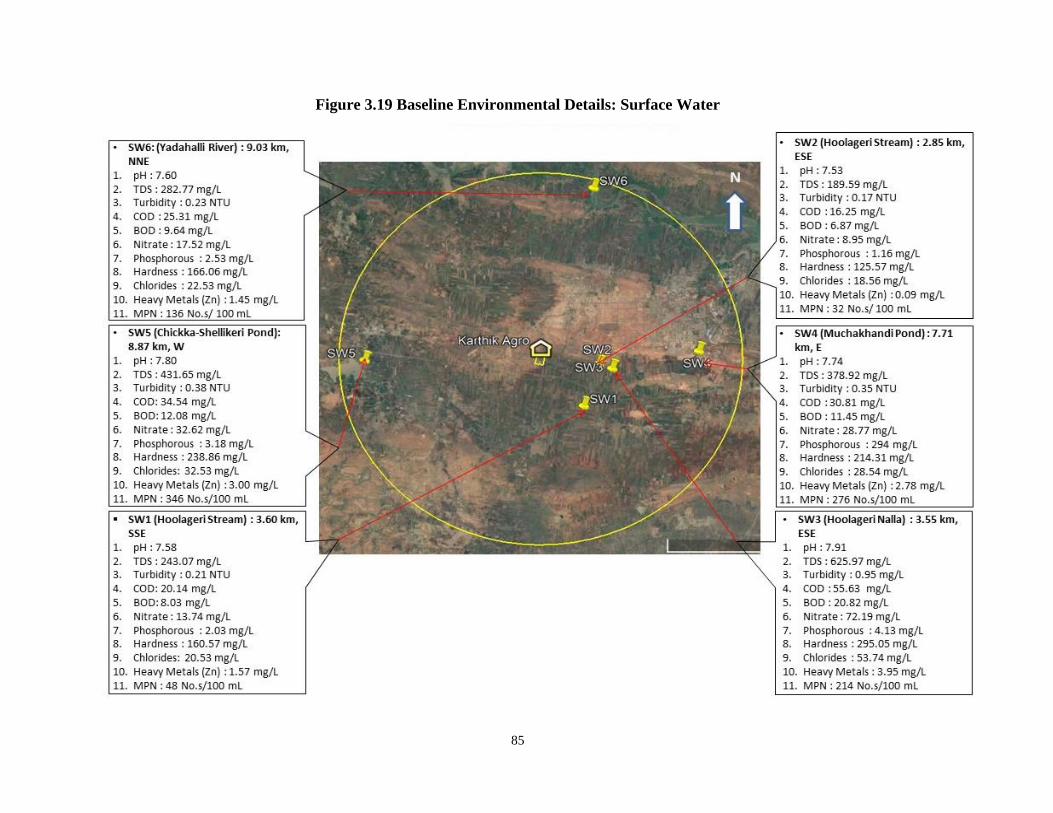
85
Figure 3.19 Baseline Environmental Details: Surface Water

86
Figure 3.20 Surface Water Analysis
Figure 3.21 Surface Water Analysis

87
Figure 3.22 Surface Water Analysis
Figure 3.23 Surface Water Analysis

88
3.7.3.2. Ground Water
Eight locations for ground water samples were selected which are listed below. Analysis results for the ground water samples are given in following Table 3.11. Copies of actual reports are presented at Annexure-V.
Table 3.11 Ground water
No Parameter Unit Location Limits IS
10500: 2012
GW 1 (BW)
Hoolageri
GW 2 (BW)
Hoolageri
GW 3 (BW)
Hoolageri
GW 4 (BW)
Kerkalmatti
GW 5 (BW) Goddan
akeri
GW 6 (BW)
Simikeri
GW 7 (BW)
Hoolageri
GW 8 (BW)
Kagalgomb
1 Color Hazen 0.70 0.90 1.50 0.80 0.70 0.90 1.40 0.80 5.00 2 Odor -- Agreeable Agreeable Agreeable Agreeable Agreeable Agreeable Agreeable Agreeable Agreeable 3 pH -- 7.89 7.75 7.94 7.32 7.65 7.50 7.61 7.72 6.5-8.5 4 Conductivity µS/cm 299.19 382.11 570.22 290.69 321.11 304.80 498.99 329.22 NS 5 TDS mg/lit 256.02 382.06 194.77 215.15 204.22 334.33 220.58 < 500.00 6 Turbidity NTU 0.10 0.16 0.25 0.14 0.11 0.18 0.23 0.12 < 1.00 7 TSS mg/lit 6.02 9.75 17.07 8.95 7.34 11.20 16.40 8.18 NS 8 COD mg/lit 19.16 26.43 34.68 18.25 21.09 19.95 30.24 21.40 NS 9 BOD 3 mg/lit 8.07 10.62 13.41 7.79 8.87 8.51 12.99 9.05 NS
10 Ammonical Nitrogen mg/lit 0.05 0.01 0.27 0.10 0.03 0.02 0.22 0.07 < 0.50 11 Nitrate as NO3 mg/lit 7.43 12.97 22.16 12.73 14.94 17.97 19.07 10.97 < 45.00 12 Nitrite as NO2 mg/lit 0.70 0.52 1.15 0.62 0.28 0.81 1.09 0.86 NS 13 Nitrogen as N mg/lit 1.61 2.36 7.53 3.29 1.62 1.52 5.63 2.02 NS 14 Phosphorous as PO4 mg/lit 0.49 0.33 1.20 0.35 0.62 0.78 1.07 0.64 NS 15 Potassium as K mg/lit 13.42 21.21 42.88 17.38 22.87 15.91 36.21 21.20 NS 16 Sodium as Na mg/lit 9.18 17.67 34.23 14.18 18.53 10.09 25.20 10.36 NS 17 Calcium as Ca mg/lit 28.25 40.96 50.30 29.53 35.36 31.70 46.12 46.25 < 75.00 18 Magnesium as Mg mg/lit 5.93 7.64 9.11 6.56 7.83 6.09 8.84 8.92 < 30.00 19 Total Hardness as CaCO3 mg/lit 95.06 133.88 163.28 100.85 120.66 104.34 151.72 152.38 < 200.00 20 Carbonates as CO3
2- mg/lit BDL BDL 0.55 BDL BDL BDL 0.43 BDL NS 21 Bicarbonates as HCO3 mg/lit 88.95 107.52 128.09 73.43 67.58 71.96 115.12 91.15 NS 22 Chlorides as Cl- mg/lit 30.88 25.87 52.05 20.52 26.60 33.05 46.86 19.56 < 250.00 23 Sulphates as SO4 mg/lit 12.56 17.35 29.75 15.23 18.51 14.12 25.85 8.28 < 200.00 24 Sulphide as H2S mg/lit BDL BDL 0.01 BDL BDL BDL 0.01 BDL < 0.05 25 Fluorides as F- mg/lit 0.07 0.10 0.30 0.05 0.09 0.10 0.25 0.11 < 1.00 26 Iron as Fe mg/lit 0.08 0.15 0.13 0.08 0.06 0.05 0.10 0.07 < 0.30 27 Aluminum as Al mg/lit BDL BDL BDL BDL BDL BDL BDL BDL <0.03 28 Barium as Ba mg/lit 0.06 0.02 0.15 0.09 0.04 0.03 0.09 0.03 <0.70 29 Boron as B mg/lit 0.08 0.05 0.12 0.07 0.01 0.02 0.05 0.09 < 0.50 30 Copper as Cu mg/lit BDL BDL 0.01 BDL BDL BDL BDL BDL < 0.05 31 Selenium as Se mg/lit BDL BDL BDL BDL BDL BDL BDL BDL <0.01 32 Zinc as Zn mg/lit 0.72 1.29 2.07 0.56 0.18 0.85 2.12 0.93 <5.00 33 Cadmium as Cd mg/lit BDL BDL BDL BDL BDL BDL BDL BDL <0.003 34 Lead as Pb mg/lit BDL BDL BDL BDL BDL BDL BDL BDL <0.01 35 Mercury as Hg mg/lit BDL BDL BDL BDL BDL BDL BDL BDL <0.001 36 Nickel as Ni mg/lit BDL BDL BDL BDL BDL BDL BDL BDL < 0.02 37 Arsenic as As mg/lit BDL BDL BDL BDL BDL BDL BDL BDL < 0.01 38 Chromium as Cr mg/lit BDL BDL BDL BDL BDL BDL BDL BDL < 0.05 39 Total Coli form No./100ml 18 14 34 26 30 28 32 22 Absent 40 Fecal Coli form No./100ml 6 4 12 8 12 10 10 6 Absent
Note: NS- Not Specified
Water at all sites is found alkaline in nature. All parameters are within limit. At all sites, water samples showed presence of total coliforms and fecal coliforms which are above the prescribed permissible limits. Hence, from above observations it could be seen that the water is chemically as well as biologically not potable.

89
Figure 3.24 Baseline Environmental Details: Ground Water

90
Figure 3.25 Ground Water Analysis
Figure 3.26 Ground Water Analysis

91
Figure 3.27 Ground Water Analysis
Figure 3.28 Ground Water Analysis
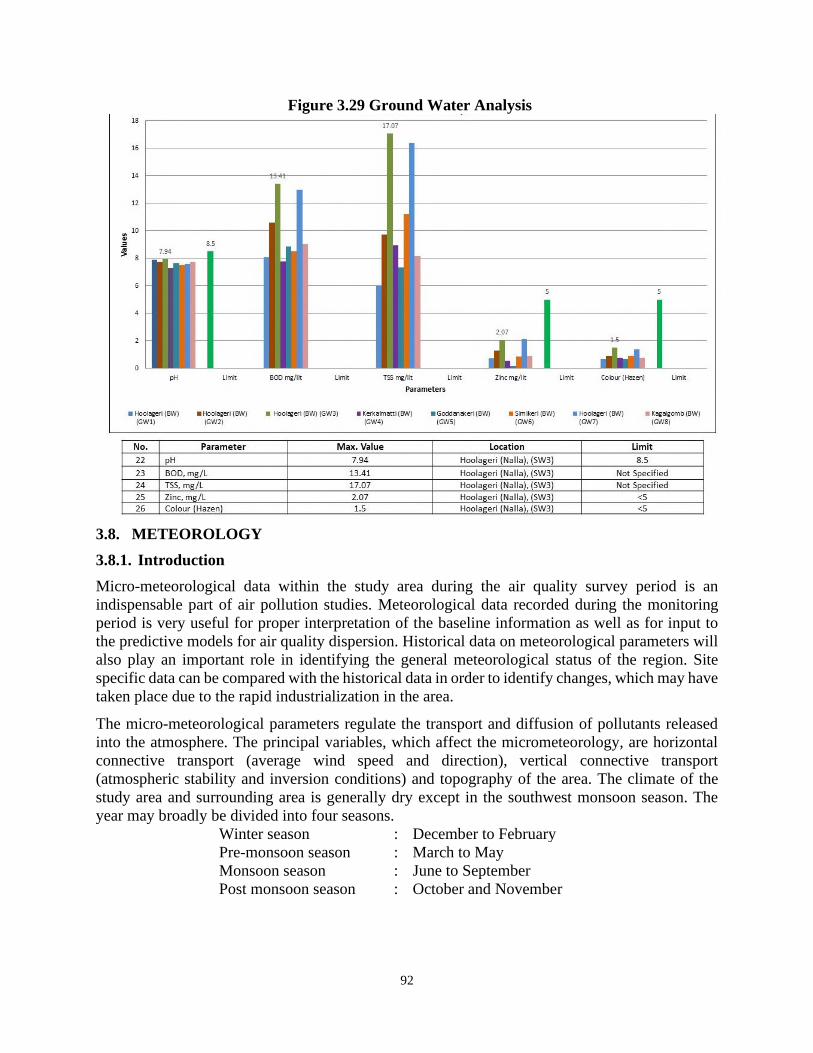
92
Figure 3.29 Ground Water Analysis
3.8. METEOROLOGY
3.8.1. Introduction
Micro-meteorological data within the study area during the air quality survey period is an indispensable part of air pollution studies. Meteorological data recorded during the monitoring period is very useful for proper interpretation of the baseline information as well as for input to the predictive models for air quality dispersion. Historical data on meteorological parameters will also play an important role in identifying the general meteorological status of the region. Site specific data can be compared with the historical data in order to identify changes, which may have taken place due to the rapid industrialization in the area.
The micro-meteorological parameters regulate the transport and diffusion of pollutants released into the atmosphere. The principal variables, which affect the micrometeorology, are horizontal connective transport (average wind speed and direction), vertical connective transport (atmospheric stability and inversion conditions) and topography of the area. The climate of the study area and surrounding area is generally dry except in the southwest monsoon season. The year may broadly be divided into four seasons.
Winter season : December to February
Pre-monsoon season : March to May
Monsoon season : June to September
Post monsoon season : October and November

93
Temperature
Winter lasts from December to mid-February with average minimum temperature of 14OC, followed by summer from February till May end, when the temperature may go up to 45OC and the average annual temperature of the area is 25OC.
Rainfall
The average rainfall in the region is approximately 692 mm annually weather is generally dry and hot in major part of the year.
3.8.2. Methodology
Methodology adopted for monitoring surface observations is as per standard norms laid down by Bureau of Indian Standards (BIS) and the Indian Meteorology Department (IMD). On-site monitoring was undertaken for various meteorological variables in order to generate the data, which is then compared with meteorological data generated by IMD from nearest station Beed.
3.8.2.1. Methodology of Data Generation
Meteorological data has been generated at the site. Meteorological parameters were monitored for one season i.e. from October – November – December 2020. Details of parameters monitored, equipments used & frequency of monitoring is given in Table 3.12
Table 3.12 Meteorological Parameters
No. Parameters Instrument Frequency 1 Wind Speed Counter Cup Anemometer Every Hour 2 Wind Direction Wind Vane Every Hour 3 Temperature Thermometer Min./Max. Once in a day 4 Relative Humidity Dry/Wet bulb Thermometer Twice a day
3.8.2.2. Sources of Information
Secondary information on meteorological conditions has been collected from the nearest IMD station at Bagalkote. Also, reference were taken from book climatological Normals (1971-2000). Wind roses, temperature, relative humidity, rainfall intensity have been compiled from IMD station, Beed. Similarly, data on cloud cover is compiled from climatological tables from the IMD station of Beed. Wind Speed and direction are recorded at site every hour.
3.9. AIR QUALITY
3.9.1. Introduction
Ambient air quality with respect to study zone of 10 Km radius around the KAIPL site forms the baseline information. Study area represents some urban environment although there is dominance of rural habitation. Various sources of air pollution in study area are commercial and residential activities from the urban as well as rural areas, transportation and vehicular traffic etc. Impact of said actions and events through various emissions is reflected in the results of AAQM. Major air pollutants released into atmosphere from the different sources are PM10, PM2.5, SO2, NOx and to small extent CO. However, these again vary with type and nature of the sources.
Presentation of results for the October-November-December 2020 survey is followed by observations. All the requisite monitoring assignments, sampling and analysis was conducted through the environmental laboratory of M/s. Green Enviro Safe Engineers & Consultant Pvt. Ltd.,

94
Puneis NABL accredited and MoEFCC; New Delhi approved organization. Further, same has received certifications namely ISO 9001– 2008, ISO 14001– 2004 and OHSAS 18001–2007 from DNV. Mr.Yuvraj Damugade who is FAE of EEIPL for AQ.
3.9.2. Methodology
3.9.2.1. Selection of Sampling Locations
Baseline status of AAQ has been assessed through an AAQM network. Design of monitoring network, in air quality surveillance program, is based on considerations namely - (1) Meteorological conditions, (2) Topography of the study area, (3) Representativeness of regional background air quality for obtaining baseline status, and (4) Representativeness of likely industrial impact areas. Ambient air monitoring was conducted in the study area to assess the quality of air for SO2, NOx, CO, PM10 and PM2.5.
AAQM stations were set up at eight locations with due consideration to above mentioned points, details of which are presented below. Monitoring of air quality was done here over a period of one season.Refer AAQM data for a period of one season enclosed at Annexure - III.
Table 3.13 AAQM Location Details
No. Location Direction From Site Distance (Km) Direction A1 Industrial Site -- --- --- A2 Bagalkote
Upwind 7.57 NE
A3 Gaddanakeri 5.47 NE A4 Sulikeri
Crosswind 7.68 SE
A5 Tulasigere 6.50 NW A6 Kerkalmaui
Downwind 5.91 SW
A7 Jalageri 5.94 SW A8 Kerkalmatti Nearest Habitat 1.91 SW
3.9.2.2. Parameters, Frequency and Analysis Methods for AAQ Monitoring
Frequency adopted for sampling is two days per week; 24 hourly for all eight ambient air quality stations. Baseline data of air environment, for all the eight monitoring stations, was generated. Details of same are presented in following table-
Table 3.14 AAQ Parameters, Monitoring Frequency and Analysis Methods
No. Parameters Frequency of Monitoring Analysis Methods 1. PM10 Continuous, 24 Hourly,
twice a week Gravimetric Method (IS:5182, Part IV)
2. PM2.5 Continuous, 24 Hourly, twice a week
Gravimetric Method (IS:5182, Part IV)
3. SO2 8 Hourly, three samples/day, twice a week
Modified West and Gaeke Method (IS:5182, Part II; Sodium Tetrachloro-mercurate).
4. NOx 8 Hourly, three samples/day, twice a week
Jacobs and Hochheiser Method (IS: 5182, Part VI)
5. CO Once in a day, Twice a week NDIR Method (IS: 5182, Part X)

95
3.9.3. Presentation of Results
The summary of results for analysis of ambient air monitoring is presented in Table 3.15. The permissible ambient air quality limits are also presented in Table 3.16
Table 3.15 Summary of the AAQ Monitoring Results for Season [October – November – December 2020]
Location
Industrial Site
Bagalkote Gaddanakeri Sulikeri Tulasigere Kerkalmaui Jalageri Kerkalmatti
PM10
g/M3 Max 65.90 55.70 55.90 55.70 55.90 55.80 55.90 54.50 Min 54.40 48.70 46.60 48.40 46.80 48.20 46.80 44.60 Avg 57.89 53.00 52.11 52.63 50.95 51.14 51.85 50.50
98% Percentile 64.15 55.56 55.85 55.70 55.81 55.75 55.85 54.45 PM2.5
g/M3 Max 22.60 20.70 20.40 20.80 20.90 19.40 20.80 19.50 Min 16.50 13.20 15.40 15.60 15.40 15.40 15.30 14.10 Avg 20.15 16.73 17.25 18.02 17.69 17.35 18.00 16.67
98% Percentile 22.55 20.33 20.26 20.75 20.76 19.17 20.80 19.45 SO2
g/M3 Max 26.20 19.80 19.70 20.10 18.90 18.70 19.40 19.40 Min 20.90 13.30 14.10 14.50 14.30 11.70 14.40 14.40 Avg 23.93 13.13 17.13 17.14 16.09 16.00 16.73 16.66
98% Percentile 26.06 19.57 19.56 19.55 18.90 18.65 19.26 19.26 NOx g/M3
Max 30.90 24.50 24.90 24.90 25.60 27.80 24.90 24.80 Min 26.10 19.40 21.70 21.40 21.70 18.80 20.10 20.40 Avg 28.76 22.27 23.24 23.40 23.32 21.80 22.80 22.46
98% Percentile 30.76 24.45 24.85 24.81 25.28 27.29 24.81 24.52 CO
mg/M3 Max 0.900 0.080 0.090 0.080 0.090 0.090 0.090 0.090 Min 0.100 0.020 0.020 0.010 0.010 0.020 0.030 0.010 Avg 0.600 0.056 0.055 0.055 0.057 0.060 0.055 0.052
98% Percentile 0.900 0.080 0.085 0.080 0.085 0.090 0.081 0.090 Notes: PM10, PM2.5, SO2 and NOx are computed based on 24 hourly values, CO is computed on hourly values
Table 3.16 National Ambient Air Quality Standards (NAAQS) by CPCB (Notification No. S.O.B-29016/20/90/PCI-L by MOEFCC; New Delhi dated 18.11.2009)
Zone Station Industrial, Residential,
Rural &Other Area Ecologically
Sensitive Area PM10
(g/M3) 24 Hr 100 100 A.A. 60 60
PM2.5
(g/M3) 24 Hr 60 60 A.A. 40 40
SO2
(g/M3) 24 Hr 80 80 A.A. 50 20
NOx (g/M3)
24 Hr 80 80 A.A. 40 30
CO (mg/M3)
8 Hr 2 2 1 Hr. 4 4
Note: A.A. represents “Annual Average
3.9.4. Observations Based On Period October – November – December 2019
Observations in respect of results presented in Table 3.15 are given below.
96
Particulate Matter (PM10)
PM10 values at all the eight locations are attributed to windblown dust. 98 percentile values at eight stations are observed between 54.45g/m3 to 64.15 g/m3 which is below the permissible value of 100 g/m3 for residential zones.
Particulate Matter (PM2.5)
All observed values are within the permissible limits for residential and rural conditions i.e. 60 g/M3. 98 percentile values at eight stations are observed in range between 19.17g/m3to 22.55g/m3which is below the permissible value of 60g/m3
Sulphur Dioxide (SO2)
All observations are well below permissible limits of 80 g/M3.98 percentile values at eight stations are observed in range between 18.65 g/m3 to 26.06g/m3 which is below the permissible value of 80g/m3
Nitrogen Oxides (NOx)
All observed values are within the permissible limits for residential and rural conditions (i.e. 80 g/M3).98 percentile values at eight stations are observed in range between 24.45g/m3to 30.76 g/m3which is below the permissible value of 80g/m3
Carbon Monoxide (CO)
All observed values are within the permissible limits for residential and rural conditions.98 percentile values at eight stations are observed in range between 0.08 mg/m3to 0.09mg/m3.

97
Figure 3.30 Baseline Environmental Details: AAQM Environment

98
Figure 3.31 AAQM Parameters – October 2020
Figure 3.32 AAQM Parameters – November 2020

99
Figure 3.33 AAQM Parameters – December 2020
Figure 3.34 October -December 2020
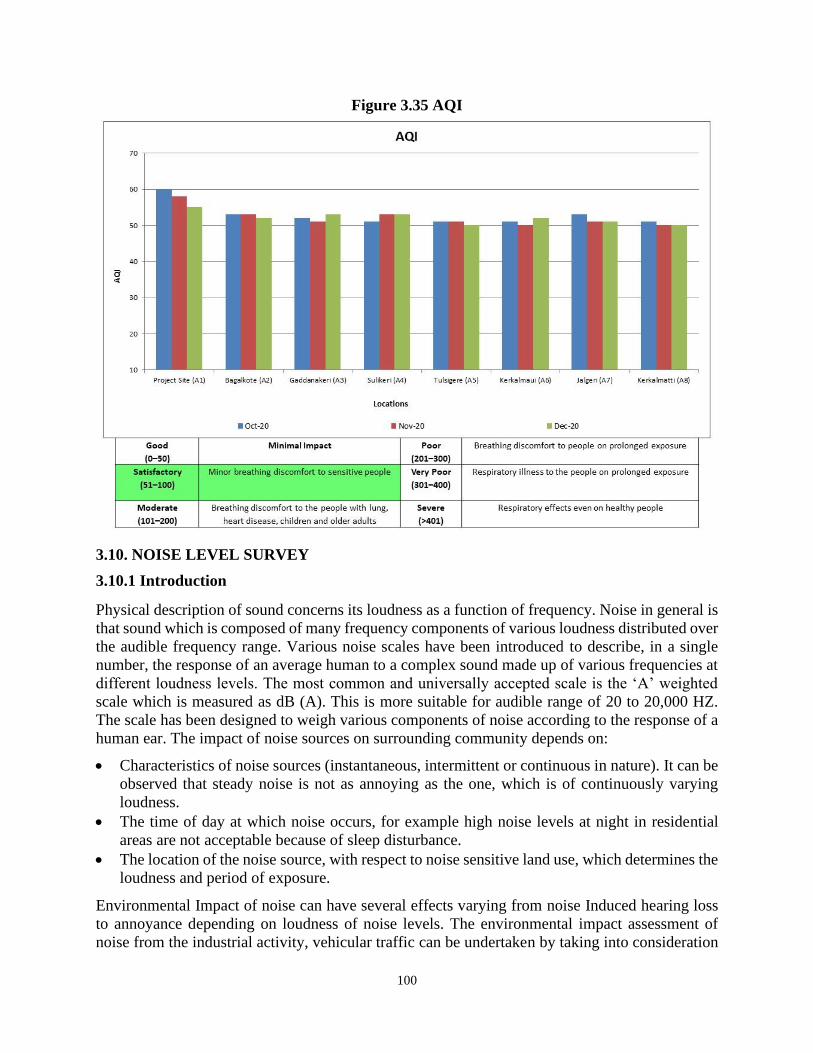
100
Figure 3.35 AQI
3.10. NOISE LEVEL SURVEY
3.10.1 Introduction
Physical description of sound concerns its loudness as a function of frequency. Noise in general is that sound which is composed of many frequency components of various loudness distributed over the audible frequency range. Various noise scales have been introduced to describe, in a single number, the response of an average human to a complex sound made up of various frequencies at different loudness levels. The most common and universally accepted scale is the ‘A’ weighted
scale which is measured as dB (A). This is more suitable for audible range of 20 to 20,000 HZ. The scale has been designed to weigh various components of noise according to the response of a human ear. The impact of noise sources on surrounding community depends on:
• Characteristics of noise sources (instantaneous, intermittent or continuous in nature). It can be observed that steady noise is not as annoying as the one, which is of continuously varying loudness.
• The time of day at which noise occurs, for example high noise levels at night in residential areas are not acceptable because of sleep disturbance.
• The location of the noise source, with respect to noise sensitive land use, which determines the loudness and period of exposure.
Environmental Impact of noise can have several effects varying from noise Induced hearing loss to annoyance depending on loudness of noise levels. The environmental impact assessment of noise from the industrial activity, vehicular traffic can be undertaken by taking into consideration

101
various factors like potential damage to hearing, physiological responses and annoyance and general community responses.
Study area of 10 Km radius with reference to industrial site was covered for noise environment. Four zones viz. residential, commercial, industrial and silent zones have been considered for noise monitoring. Some of the major arterial roads were covered to assess the noise due to traffic. Noise monitoring was undertaken for 24 hours at each location. The purpose of noise pollution impact assessment in the study area is to assess impact of total noise generated by industries and vehicular traffic on the human settlements within 10 Km radius. The main objectives of the studies conducted were -
➢ Assessment of background noise levels ➢ Identification and monitoring the major noise sources of the existing activity ➢ Impact of noise on the workers as well as on general population.
The assignment of noise was done by Functional Area Expert of EEIPL for NV - Mr. Vinay Kumar Kurakula in the Post Monsoon Period.
3.10.2 Identification of Sampling Locations
A preliminary reconnaissance survey was undertaken to identify the major noise generating sources in the area. Noise generating sources have been identified with respect to the activities, viz. industrial noise and ambient noise due to industries and traffic, which have impact on sensitive areas. The noise sampling locations have been indicated below.
3.10.3 Ambient Noise Monitoring Stations
Noise survey involved determination of noise levels, in decibels, at following 8locations in the study area. Noise levels were recorded once in a month for 24-hour period at each village. Refer Annexure-VI for copies of actual reports.
Table 3.17 Noise Sampling Locations
Code Location Distance from site (Km)
Direction w.r.t site
N1 Site - - N2 Kerkalmath 2 SW N3 Gangan Budihal 4.2 SW N4 Kagalgomb 4.7 SE N5 Gaddanakeri L 4.6 NE N6 Simikeri 3.4 NNE N7 Hosanmumal 4.2 NNE N8 Yedanali 4.8 N
A noise rating developed by EPA for specification of community noise from all the sources is the day-night sound level, (Ldn). It is similar to a 24-hour equivalent sound level except that during the night-time period, which extends from 10 PM to 6 AM, a 10 dB (A) weighing penalty is added to the instantaneous sound level before computing 24 hour average. This night time penalty is added to account for the fact that noise during night, when people usually sleep, is judged more annoying than the same noise during the daytime. For noise levels measured over a given period of time interval, it is possible to describe important features of noise using statistical quantities.

102
This is calculated using the percent of the certain noise levels exceeding during the time interval. The notation for the statistical quantities of noise levels is described below:
L10 is the noise level exceeded 10 percent of the time L50 is the noise level exceeded 50 percent of the time, and L90 is the noise level exceeded 90 percent of the time Lday is equivalent noise level measured over a period of time during day (6 AM to 10 PM). Lnight is equivalent noise level measured over a period of time during night (10 PM to 6 AM).
Equivalent Sound Pressure Level (Leq): The Leq is the equivalent continuous sound level that is equivalent to the same sound energy as the actual fluctuating sound measured in the same period. This is necessary because sound from noise source often fluctuates widely during a given period of time. This is calculated from the following equation
(L10-L90)2 Leq=L50+ ------------- 60 Ldn: The noise rating developed for community noise from all sources is all Day-Nights Sound Level (Ldn). It is similar to a 24 hr equivalent sound level except during night time period (10 PM to 6 AM) where a 10 dB (A) weighing penalty is added to the instantaneous sound level before computing the 24 hr average. The Ldn for a given location in a community may be calculated from the hourly Leq’s, by the equation.
Ldn=10 log {1/24[15(10 Ld/10) +9 (10(Ln+10)/10)]}
Where Ld is the equivalent sound level during the daytime (6 AM to 10 PM) and Ln is the equivalent sound level during the night-time (10 PM to 6 AM).
Figure 3.36 Noise Monitoring Locations

103
3.10.4 Method of Monitoring
A detailed noise level survey was undertaken to study the levels of noise, as the high noise levels may cause adverse effect on human beings and the associated environment. The noise level monitoring was carried out through MoEFCC; New Delhi approved laboratory-M/s. Green Enviro Safe Engineers 7 Consultant Pvt. Ltd., Pune - that has also received NABL as well as ISO 9001: 2008, ISO 14001:2004 and OHSAS 18001: 2007 accreditations.
3.10.5 Standards for Noise Levels
As can be seen from the table below, the maximum daytime Leq as well as night time Leq values were found to be 62dB(A) and 57 dB(A). The maximum values may be attributed towards the nearby commercial activities and traffic movements. The minimum values for day & night time were found to be 44dB(A) and 41dB(A) respectively.
Table 3.18 Ambient Noise Level Standards
Area Code Category
Limits in dB(A) Leq Day Time (6 AM to 10 PM) Night Time (10 PM to 6 AM)
A Industrial Area 75 70 B Commercial Area 65 55 C Residential Area 55 45 D Silence Zone 50 40
3.10.5.1 Standards for Occupational Noise (U.S.A)
Industrialized countries have specified limits for occupational noise exposure. The permissible noise exposure limit for industrial workers is primarily concerned with the harmful aspect of noise and its objective is to protect the hearing of majority of working people. The American Conference Government of Industrial Hygienists (ACGIH), USA has prescribed the following permissible noise exposure limits for industrial workers.
Table 3.19 Standards for Occupational Exposure
Exposure Time in Hour/day 8 4 2 1 ½ 1/4 1/8 1/16 1/32 Limit in dB(A) 090 093 096 099 102 105 108 111 114
Exposure to continuous or intermittent noise louder than 115 dB (A) should not be permitted. Exposure to pulse or impact noise should not exceed 140 dB (A)
3.10.5.2 OSHA Standards
The Occupational Safety and Health Administration (OSHA) have also prescribed the following allowable limits to noise exposure for industrial workers.
Table 3.20 OSHA Standards for Occupational Exposure
Duration per day (in hours) 8 6 4 3 2 1.5 1 0.5 0.25 Sound level in dB(A) 85 87 90 92 95 97 100 105 110

104
3.10.6 Presentation of Result
Table 3.21 Ambient Noise Levels
Sr. No. Location Average Noise Level in dB(A)
L10 L50 L90 Leq(day) Leq(night) Ldn 1 N1 63.6 64.5 66.7 66.2 63.1 70.1 2 N2 44.6 47.1 48.5 53.4 41.4 52.7 3 N3 44.7 46.2 48.1 51.3 41.5 51.4 4 N4 44.7 46.7 48.0 52.7 41.1 52.2 5 N5 44.7 46.4 47.8 52.4 40.8 51.9 6 N6 45.1 46.4 47.5 51.7 41.3 51.6 7 N7 45.1 46.5 48.1 51.5 41.8 51.6 8 N8 44.6 46.5 47.9 51.4 41.9 51.6
The ambient noise levels measured are presented in Table 3.21. The table indicates equivalent noise levels viz. L10, L50, L90, Lday, Lnight and Ldn at different places located within the study area. Similarly, these values viz. Leq, Lday, Lnight and Ldn are compared with the limits.
3.10.6.1 Noise Modelling
Noise modeling was carried out use the standard noise modeling software called Sound Plan. The main application of this software are prediction, assessment and mapping of environmental noise. This software models are also used for design of noise barriers.
Figure 3.37 Noise Analysis
105
3.11. SOCIO-ECONOMIC PROFILE
3.11.1. Introduction
Molasses is a very important by-product of the sugar industry. The profits earned by conversion of molasses into rectified spirit (RS), ENA, Bio-fuel, Ethanol and industrial alcohol are much higher than that of resale of molasses alone. Moreover, there is a good demand for alcohol in the country as production and consumption of alcohol in India are quite balanced. There is a good export potential in the country.
The crude oil price has been fluctuating in the world market and has increased significantly in the recent past, reaching a level of more than $ 140 per barrel. Such unforeseen escalation of crude oil prices is severely straining various economies the world over, particularly those of the developing countries. Petro-based oil meets about 95% of the requirement for transportation fuels, and the demand has been steadily rising. Currently, ethanol for EBP program is coming from molasses route as a by-product of sugar Industry. At the present levels of cane and sugar production (about 350 MMT & 26-28 MMT per annum resp.), the maximum quantity of molasses available is about 13 MMT, which is sufficient to produce about 300 crore liters of alcohol/ethanol. Currently, “C” heavy molasses is being used to produce alcohol/ethanol. Adoption of “B” heavy molasses route for ethanol production will be
encouraged as per availability of sugar. 1 MMT of Sugar sacrificed can produce 60 crore liters of ethanol. By utilizing this option participation by distilleries for ethanol production would improve. Ethanol will also be allowed to be produced directly from sugarcane juice to increase blending percentage (National Biofuel Policy, 2018).
3.11.2. Need of the Project
Over the last decade, Government has undertaken multiple interventions to promote biofuels in the country through structured programmes like Ethanol Blended Petrol Programme, National Biodiesel Mission and Biodiesel Blending Programme. Learning from the past experiences and demand supply status, Government has revamped these programmes by taking steps on pricing, incentives, opening alternate route for ethanol production, sale of biodiesel to bulk and retail customers, focus on R&D etc. These steps have influenced the biofuels programme in the country constructively. Bioethanol can be produced from multiple sources like sugar containing materials, starch containing materials, celluloses and lignocelluloses material including petrochemical route. However, the present policy of Ethanol Blended Petrol (EBP) Programme allows bioethanol to be procured from non-food feed stock like molasses, celluloses and lignocelluloses material including petrochemical route. Further, the scope of raw material for procurement of ethanol under EBP will be increased. The policy allows production of ethanol from “B” molasses as well as directly from
sugarcane juice. The policy also allows production of ethanol from damaged food grains like wheat, broken rice etc., which are unfitting for human consumption. Currently, ethanol for EBP program is coming from molasses route as a by-product of sugar Industry.
At the present levels of cane and sugar production (about 350 MMT & 26-28 MMT per annum resp.), the maximum quantity of molasses available is about 13 MMT, which is sufficient to produce about 300 crore liters of alcohol/ethanol. Currently, “C” heavy molasses is being used to
106
produce alcohol/ethanol. Adoption of “B” heavy molasses route for ethanol production will be
encouraged as per availability of sugar.
The MMT of sugar sacrificed can produce 60 crore liters of ethanol. By utilizing this option participation by distilleries for ethanol production would improve. Ethanol will also be allowed to be produced directly from sugarcane juice to increase blending percentage (National Biofuel Policy 2018). The main features of the Policy are;
1. Categorisation of Biofuels: Biofuels will be categorised into ‘Basic Biofuels’ viz. First
Generation (1G) bioethanol &biodiesel and ‘Advanced Biofuels’ – Second Generation (2G) ethanol, Municipal Solid Waste (MSW) to drop-in fuels, Third Generation (3G) biofuels, bio-CNG etc. for providing appropriate financial and fiscal incentives under each category.
2. Expansion of the scope of raw materials for ethanol production: The Policy expands the type of bio-raw materials for ethanol production by including Sugarcane Juice, Sugar containing materials like Sugar Beet, Sweet Sorghum, Starch containing materials like Corn, Cassava, Damaged food grains like wheat, broken rice, Rotten Potatoes etc. which are unusable for human consumption.
3. Surplus food grains can be used for ethanol production: During excess production, crop prices fall. Here, the Policy allows use of surplus food grains for production of ethanol with the approval of National Biofuel Coordination Committee.
4. Viability Gap Funding: For the generation of Advanced Biofuels, the Policy proposes a viability gap funding scheme for 2G ethanol Bio refineries with Rs.5000 crore in 6 years. In addition to this, additional tax incentives, higher purchase price as compared to 1G biofuels will be given for 2G ethanol generation.
5. Supply chain for biodiesel production: The Policy encourages setting up of supply chain mechanisms for biodiesel production from non-edible oilseeds, Used Cooking Oil, short gestation crops etc.
6. For the success of the policy, roles and responsibilities of all the concerned Ministries/Departments regarding biofuels has been ensured.
(https://lms.indianeconomy.net/economy-news/national-policy-biofuels-2018.html/ accessed on 20/05/2021 at 12.00 noon)
The policy will reduce imports, promote clear environment, ensure health benefits, waste management benefits, rising rural infrastructure and adding to the farm income in rural area.
3.11.3. Socio-Economic Study
This section covers the socio-economic livelihood of the villagers within the radius of 10 km of the project area. It helps in planning for mitigation measures against any adverse impacts and willingness to accept and willingness to pay for the project. Participatory, experience provides the real facts and the figures about the project impact on the area in general and the livelihood in particular. Besides, it provides, what is to be done in the project area if the vulnerability is at the crest level. It also persuades the proprietors by planting certain conditions that can be implemented to set free the livelihood in the project areas as a remedial measure.
The scope of the study is based on the TORs and the features of company’s registration. The EIA
or SIA is conducted on the basis of the scope of the project. The company’s proposed expansion
is based on some factors, which determines the scope of the study.

107
The SE study report is prepared on the basis of the factors endorsed by the company. The following factors are considered for the proposed expansion project;
Almetti dam is the main source of irrigation in the Bagalkot district area. 6. Existing infrastructure facilities and public utilities are effectively and economically utilised. 7. Adequate land for expansion is available. 8. Availability of raw materials, manpower and transport facilities are assured.
The project site is well connected by roads. State Highway SH-57 is at 5.00 Km, & National Highway NH-218 is at 1.00 Km from site. Nearest railway station is Bagalkot located at about 12 Km and nearest airport is Sambra located at about 130 Km from the site. Drinking Water Management for the proposed distillery expansion and water for processing as well as domestic purpose would be sourced from surface water from Ghatprabha River.
The scope of the study includes a detailed characterization of the environment in an area of 10 km radius of the proposed expansion project site for various environmental parameters like air, water, noise, land, biological and social-economic aspects.
The team of SE experts could not visit due to lockdown policy of the state Govt during January to May 2021. However, the project plan and the project site have been carefully studied with the help of secondary sources of data. The aspects and the segments of the impacts on various sections have been identified.
A Study Area
The area within the radius of 10 KM from the project has been earmarked. It covers 30 villages (see Table 3.10.1). However, we selected the villages within the radius of five km from the Karthik Agro Industries Pvt Ltd., (KAIPL) site. Consequently, the number of such villages is confined to seven. Table 3Error! No text of specified style in document..22 Villages within the radius of 10 km in
the Study Area
No Villages Distance Direction 1 Durganagar (Bagalkot taluka) 3.99 NE 2 Yadahalli (Bagalkot taluka) 7.95 NE 3 Kalasakopp (Bagalkot taluka) 9.50 W 4 Hire-Shellikeri (Bagalkot taluka). 5.27 W 5 Hoolageri 4.23 S 6 Bagalkote 7.57 NE 7 Gaddanakeri (Bagalkot taluka) 5.47 NE 8 Sulikeri 7.68 SE 9 Tulasigere (Bagalkot taluka) 6.50 NW
historical places within 10 Km radius of the plant site. 4. The site is well connected to State and National Highway and Railway Station 5. Ghatprabha and Krishna River is a perennial source of water flowing from the nearer places.
site. 3. There are no National Parks / Wild life Sanctuaries, historical places, Reserve Forests,
disposal of effluents and fringe benefits are assured. 2. Nearest habitation of village, Hoolageri is located at the distance of 2.23 Km from the plant
1. The existing plant is located in the Hoolageri l
Village, where the water availability,

108
No Villages Distance Direction 10 Kerkalmaui 5.91 SW 11 Jalageri 5.94 S 12 Kerkalmatti 1.91 SW 13 Kagalgomb 4.50 SE 14 Bandakeri 5.17 SW 15 Simkeri (Bagalkot taluka) 3.03 NW 16 Chickka-Shellikeri (Bagalkot taluka) 8.15 W 17 Neerabudhihal 7.55 SW 18 Anadinni (Bagalkot taluka) 7.92 NE 19 Bannidini (Bagalkot taluka) 9.50 NE 20 Krishnapur 9.57 SW 21 Bamadakeri 5.93 SW 22 Devanal (Bagalkot taluka) 9.87 NW 23 Yaragoppa 8.78 SW 24 Manpur 9.65 SW 25 Jammanakatti 8.76 S 26 Lakkaskoppa 9.43 SE 27 Muchkundi (Bagalkot taluka) 7.50 E 28 Sindhagi (Bagalkot taluka) 3.23 NE 29 Murnal (Bagalkot taluka) 9.73 NE 30 Kesanur (Bagalkot taluka) 9.77 NE
3.11.4. Social Infrastructure
There are adequate infrastructural facilities such as transportation, communication, banking, credit and marketing. There are improvements in the region that has taken place over the years since the commissioning of the plant. The project site is developed well with all basic infrastructure facilities such as proximity to man power, electricity, water supply, and transportation and telecommunication system. The industry has provided the employees with sufficient facilities including drinking water, toilets, sanitation facilities, power, communication etc. This initiative will continue in future also. The state Govt departments are supplementing the industrial requirements.
The general infrastructure in the region and roads will further grow with the project expansion. Its
rate of returns to the society is higher. They provide general incentives for growth of the region. It
has a long term impact on the region.
Infrastructural development obviously, helps to grow the transport modes and means in the region.
All families with some exceptions are settled around the project were in a positive response of
growing transport facilities in the villages due to the project. During the old technology the people
were against the industrial growth, but now technology enhancement has reduced the pollutions,
wastes, ground water contamination around the unit.
3.11.5. Source of Information
As per the scope of the study, the information on socio-economic aspects has been gathered and compiled from several secondary sources of data. These include Bagalkot District Collectorate, Agriculture Department, and Irrigation Department etc. The demographic data has mainly been compiled from the ‘District Census Handbook and the Socio-Economic Report on the Bagalkot District, as these documents are comprehensive and authentic. The relevant project report and other

109
relevant documents, census data, land records and maps, project designs/maps, literature on the
project area and its people were also well recognised and understood in respect of the project
expansion and the extension.
3.11.6. Social Vulnerability
In one of the KSNDMC (2017) conducted in Karnataka, the social vulnerability indicates the uneven preparedness of the people to distress in the locality. The livelihood of the society/community is dependent on the socio-economic conditions in the area. The purpose of assessing vulnerability is to identify the detrimental external events. Their potentials and social response to those events or appropriate actions that can be taken to reduce vulnerability before the potential for damage is realized. The vulnerability assessment can also be linked to sustainable livelihood framework since it covers human, natural, financial, social and physical aspects. The livelihood index that reflects the social vulnerability is dependent upon many factors/indicators. Among them, a few indicators (eight) which are of prime importance for vulnerability over a period and the percent literacy (2011) are considered while developing livelihood index (LI).
The sub-components (Indicators) considered for the LI index are as under: Sub-components (indicators) L1-Ratio of irrigated to total cultivated area per cent L2- Ratio of Number of marginal to total holdings per cent L3- Ratio of Number of small to total holdings per cent L4- Ratio of Number of semi-medium to total holdings per cent L5- Ratio of Number of medium to total holdings per cent L6- Ratio of Number of big (large) to total holdings per cent L7- Ratio of working to total population per cent L8- Ratio of Number of literates to total population per cent
The percent values of each indicator over the period can be averaged and used as data base for further analysis in developing the LI Index. The Bagalkot district belongs to chronic drought conditions in the state.
The KSNDMC study (2017) has indicated the livelihood based index value in Badami Taluk of Bagalkot district, which is estimated to 0.48. The CCI is indicated to 0.581, CSI is 0.148 and CI is indicated to 0.664 in the taluka area1.
The variability among the talukas in the state is limited possibly because of similar physical settings in the talukas. By this index, it is evident that the talukas with better natural resources supplemented by irrigation have better capacity to withstand the shock due to weather aberrations. Usually the talukas in the vicinity of cities/towns have better resilience /adaptive capacity since these cities/towns provide ample opportunities for the livelihood of the existing population. Additionally the talukas with higher percent of literacy show better livelihood opportunities. As per the minimum and maximum indices values in 176 taluks under each major component, five
1 Note: (LI = Life Based Index, CSI = Climate Soil Based Index, CCI = Climate Crop Cover Based Index, CI = Climate Based Index).

110
classes with fixed class interval were arrived. These classes (1, 2, 3, 4 and 5) were assigned to each taluk based on index value of the taluka2. ➢ The Badami taluka belongs to 3, 4, 5, 4 categories of LI, CCI, CSI, CI classes of the
vulnerability (chronic drought) conditions respectively. ➢ An average rainfall remains at 606 mm. ➢ The ratio (arithmetic mean) of irrigated area to total cultivated area in Badami taluka is 21 to
40 per cent. ➢ The adjoining talukas Mudhol and Nurgund have perennial irrigation with more than 80 per
cent of irrigated area due to Almetti Dam. ➢ The ratio of working population to total population is 31 to 40 per cent. ➢ The land holding ration of marginal farmers to total famers is less than 20 per cent in Badami
taluka. ➢ The land holding ratio of small farmers to total farmers is 31 to 40 per cent.
➢ Similarly, the land holding of large farmers in total farmers is 4 to 6 per cent. The project site is near to the cities. Consequently, the development outlook changes with the literacy rate also. The Composite index of Drought Vulnerability in Badami taluka is;
➢ LI = 0.48 (moderately vulnerable category), ➢ CSI = 0.148 (very highly vulnerable category), ➢ CCI = 0.581(highly vulnerable category), ➢ CI = 0.664 (highly vulnerable category). ➢ The composite vulnerability index i.e.;
DVI = (CI+CCI) - (LI+CSI) C1 = CCI + CI, C2 = LI + CSI, C1 - C2 = DVI
The values of the indices are estimated to; C1 = 1.25, C2 = 0.63, C1 – C2 = 0.61 and DVI = 0.89 (very highly vulnerable)
This indicates the SE profile of the zone under study.the zone is very highly vulnerable means drought prone. People are poor. Their livelihood is also vulnerable. Consequently the Nanjundappa Committee has recommended a special package for backward zones. The industrial agglomeration is one of the state policies to uplift the region. So, people are benefited by this endeavour. The industry provides direct and indirect employment to the local people. Besides, the subsidiary activities will be accelerated. The investment in MSMEs will also grow. The social and economic infrastructure has been provided by the State Department on the priority basis.
3.11.7. Impact Assessment
The Social Impact Assessment (SIA) is a process in the project cycle. It is an attempt to identify and quantify the impacts of both positive and negative on the society and the environment as a
2 Note: Based on the classes, such as 1) very slightly vulnerable, 2) slightly vulnerable, 3)
moderately vulnerable, 4) highly vulnerable and 5) very highly vulnerable.
111
whole. It is an attempt to make a project more advantageous and renovate those affected as project beneficiaries. It helps in planning for mitigation measures against any adverse impacts. It helps in evolving alternative participatory approach. Participatory experience provides the real facts and the figures about the impact on the area in general and the livelihood in particular. Industries are required for the development, but not at cost of ecological and environmental degradation vis a vis impact on the livelihood of the natives. Obviously, a tradeoff between the strong and the weak sustainability is essential. Environmentalists support the strong sustainability, while the economists support the weak sustainability.
A tradeoff can be attained by minimizing the negative values and maximising the positive values of the project, which ought to be the best practice of the environmental planning management. A project would bring the positive impact on the socio-economic life of the people settled in the area without harming the sustainability provided; it is well be planned and managed carefully. The tradeoff between the strong sustainability (environmentalist’s approach to serve the ecology and
environment) and weak sustainability (economist’s approach to serve the society and the economy)
can only be understood through social impact assessment (SIA).
The SIA can be classified as economic impact, social and cultural impact and psychological impacts. This can only be viewed through the field observations. The field survey of the project affected persons is normally proposed to identify the local livelihood of the people living around the site. Similarly, socio - economic study of Project Affected Persons (PAPs) (sample) covers;
• demography details - family size, sex ratio, literacy, dependency ratio, • operational holding - include lands leased in/out and encroached and cropping pattern, • other economic activities - skill base, • employment status and migration pattern, • household income by sources, • type and amount of household expenditure, • health and nutritional status, • social organization and leadership.
The expected outcome from the sample survey would be an understanding of the socio-economic conditions of the affected and host population provide input to the preparation of RAP help identify relocation sites identify alternatives for economic rehabilitation types of social organizations and leadership available for community mobilization, mechanism to resolve conflicts between displaced and host population effectiveness of implementing agencies.

112
Table 3.23 Sample Villages Surveyed No Items Sample Villages
Durganagar (Bagalkot taluka)
Hire-Shellikeri
Hoolageri
Kerkalmatti
Kagalgomb
Simkeri
Shindhagi
1 No of Households 270 418 404 479 526 1518 70 2 Total Population Person 1,658 2,158 1,928 2,533 2,656 7,653 402 3 Total Population Male 831 1,079 937 1,278 1,357 3,809 210 4 Total Population Female 827 1,079 991 1,255 1,299 3,844 192 5 Population in the age group 0-6 Person 278 383 225 370 353 1,076 54 6 Population in the age group 0-6 Male 132 186 110 201 195 574 32 7 Population in the age group 0-6 Female 146 197 115 169 158 502 22 8 Scheduled Castes population Person 1,639 159 352 289 551 1,201 10 9 Scheduled Castes population Male 822 80 159 145 264 576 4 10 Scheduled Castes population Female 817 79 193 144 287 625 6 11 Scheduled Tribes population Person 0 491 597 289 98 1,233 21 12 Scheduled Tribes population Male 0 245 301 136 47 606 9 13 Scheduled Tribes population Female 0 246 296 153 51 627 12 14 Literates Population Person 64.78 % 56.56 % 66.53 % 60.89 % 75.16 % 70.49 % 63.79 % 15 Literates Population Male 78.68 % 68.31 % 80.29 % 73.17 % 88.21 % 82.72 % 76.40 % 16 Literates Population Female 50.51 % 44.67 % 53.54 % 48.71 % 61.88 % 58.65 % 50.59 % 17 Total Worker Population Person 630 1,202 1,161 1,159 1,257 3,098 192 18 Total Worker Population Male 376 631 589 706 722 1,997 115 19 Total Worker Population Female 254 571 572 453 535 1,101 77 20 Main Working Population Person 441 723 771 842 1175 2383 136 21 Main Cultivator Population Person 77 337 288 333 336 374 91 22 Main Agricultural Labourers Population
Person 65 363 318 220 512 1056 35
23 Marginal Worker Population Person 189 479 440 317 82 715 56 24 Marginal Worker Population Male 32 213 71 109 15 366 7 25 Marginal Worker Population Female 157 266 369 208 67 349 49
Source: 1. https://www.census2011.co.in/data/subdistrict/5446-badami-bagalkot-karnataka.html 2. https://www.census2011.co.in/data/subdistrict/5447-bagalkot-bagalkot-karnataka.html

113
Figure 3.38 Male and Female Population in Sample Villages
Figure 3.39 Literacy in the study area
Figure 3.40 Ratio of Marginal Workers to Total Workers
0%
20%
40%
60%
80%
100%
1 2 3 4 5 6 7
Total Population Female
Total Population Male
0.00% 20.00% 40.00% 60.00% 80.00% 100.00%
1
2
3
4
5
6
7
Literates PopulationFemale
Literates Population Male
0
500
1000
1500
2000
2500
3000
3500
1 2 3 4 5 6 7
Total Worker PopulationPerson
Marginal WorkerPopulation Person

114
Figure 3.41 Ratio of Children Population to total Population
Figure 3.42 Ratio of Agricultural Labourers to Cultivators
3.11.8. SE Profile of The Study Area
The SE study is proposed to be conducted for these seven villages. The socio - economic study of the project covers; demography details, operational holding, cropping pattern, employment status and migration pattern, GDP etc. Table No 3.23 provides the details in this respect. The area within the radius of five kilomtres from the project site has been earmarked. It covers 7 villages. Hence, we selected seven villages for the collecting the field data. They are, Durganagar, Hire-Shellikeri, Hoolageri, Kerkalmatti, Kagalgomb, Simkeri and Shindhagi.
This section covers the socio-economic survey of the SE profile within the radius of 5 km of
the project area. It helps in planning for mitigation measures against any adverse impacts and
willingness to accept and willingness to pay for the project. Participatory experience provides
the real facts and the figures about the project impact on the area in general and the livelihood
in particular. Besides, it provides, what is to be done in the project area if the vulnerability is
0
1,000
2,000
3,000
4,000
5,000
6,000
7,000
8,000
1 2 3 4 5 6 7
Total Population Person
Population in the agegroup 0-6 Person
Main Cultivator…0
200
400
600
800
1000
1200
1 2 3 4 5 6 7
Main Cultivator PopulationPerson
Main AgriculturalLabourers PopulationPerson

115
at the crest level. It also persuades the proprietors by planting certain conditions that can be
implemented to set free the livelihood in the project areas as a remedial measure.
The seven villages are the main impact villages which will have positive and negative impact due to the expansion of this project. The process of collecting data using primary survey data follows to identify the villages to be surveyed, check the number of PAF in the village due to project, PAF to be surveyed individually, indirect effects to be surveyed using focus group discussion method having 15-20 persons in a group and physical survey of sanitation /drinking water facilities, banks, physical heath checks, availability of primary health centres/ dispensary/ hospitals, road conditions, educational facilities, source of income, average annual income of the villagers.
A socio economic survey within the buffer zone was conducted. The field data from various secondary sources was collected from the buffer zone, which includes the seven villages. The results of the field data is summarized in Table 3.24 below: The demographic features of the sample villages indicate the following features; 1. The sex ratio is almost equal in the villages. 2. The male literacy is higher than female. 3. The child population is around 13 per cent. 4. The ST population in some villages is large. 5. The ratio of agricultural workers to cultivators is high, which indicates the size of holding
in the villages. 6. Simkeri is having large households and Shindgi is very less number of households.
Table No 3.24 Summary of SE Field Survey
Field Data
No. Parameter
Name of the villages Durganaga
r Hire-
Shellikeri Hoolageri Kerkalmatt
i Kagalgom
b Simkeri Shindhagi
1 Households 270 418 404 479 526 1518 70
2 Occupation or source of income
Agriculture/ Service/ Labour/
Shop
Agriculture/ Service/ Labour/
Shop
Agriculture/ Service/ Labour/
Shop
Agriculture/ Service/ Labour/
Shop
Agriculture/ Service/ Labour/
Shop
Agriculture/ Service/ Labour/
Shop
Agriculture/ Service/ Labour/
Shop
3 Population 1,658 2,158 1,928
2,533
2,656
7,653
402
4
% of working status Farming 77 337 288 333 336 374 91
Agriculture Labour
65 363 318 220 512 1056 35
5 Private Job 10 30 35 25 12 22 3 Govt. Job 4 1 3 1 2 13 1 Self Emp. 4 5 2 7 2 24 2
6 Main crop Ragi, Jowar Ragi Jowar Ragi Jowar Ragi Jowar Ragi Jowar Ragi Jowar Ragi Jowar
7 School Anganwadi,
Primary, Private
Anganwadi,
Primary, Private
Primary School, Middle school
Aanganvadi Primary, Private
Anganwadi, Primary School
Anganwadi, Primary School, College
Anganwadi
8 Hospital Asha
Workers Asha
Workers Asha
Workers Asha
Workers Asha
Workers Asha
Workers no
9 Post office No Yes No No Yes Yes No

116
Field Data
No. Parameter
Name of the villages Durganaga
r Hire-
Shellikeri Hoolageri Kerkalmatt
i Kagalgom
b Simkeri Shindhagi
10 Bank/Credit Society
Yes Yes Yes Yes Yes Yes No
11 Market Yes Yes Shop & Business
Yes Shops and Business
Shops and Business
12 Electricity 100% 100% 100% 100% 100% 100% 80%
13 Sources of water
Supply water
Bore well
Supply Water
Bore well
Supply Water,
Bore well
Supply Water
Bore well
Supply Water,
Bore well
Supply Water,
Bore well
Supply Water
Bore well
14 Toilet facilities %
40 50 60 60 40 70 30
15 Transport system
Bike, Auto Bike Scooters, Bicycles,
Car
Scooters, Bicycles,
Car
Scooters, Bicycles,
Car
Scooters, Bicycles,
Car
Scooters, Bicycles,
Car 16 APL 60 50 40 50 60 60 50 17 BPL 40 50 60 50 40 40 40 The data interpretation of the field work is highlighted as under
Table 3.25 Data Interpretation
Parameter studied Data Interpretation
Housing
The housing condition in the buffer zone was found better than many of the rural areas. Pucca houses – 40% Semi pucca houses –3 0% Kuccha houses – 30%
Electricity
The availability of electricity connection was also found much better than most of the rural areas. Households having electric connection - 95% Households not having electric connection - 5%
Economic Category Composition
The Proportion of above poverty line was also found better. Not better than most of the rural areas. Households above poverty line - 55% Households below poverty line - 45%
Drinking Water
Households with piped water supply through Tube well – 45% Households using community hand pump - 55%
Education status
Adults educated – 40% Kids educating – 60%
Primary occupation
Farming - 40% Service - 9% Private business - 15% Other wages labour - 35 % Govt. Job – 1%

117
3.11.9. Cultural Vulnerability
The cultural vulnerability is observed in most of the modern societies. With the growth of the economic provisioning, normally, the vulnerability goes up. But the villages covered under field survey protect the resilience level at the higher level averaged at 1. Even after the growth, it is maintained by the villagers. Every village is having a temple. Rituals are regularly conducted in such villages. People worship the God and Goddesses. The socio-cultural vulnerability index is very less averaged at 1 in the villages. The cultural resilience is least vulnerable or increasing resilience in the study area (see fig below).
Figure 3.43 Cultural Resilience and Village Lake
Cultural resilience: least vulnerable or increasing resilience
The cultural resilience can be identical through; • Renovation of the village temples • Following the cultural traditions • Weekly marketing, fair, jatra-yatra in the villages • Gender balancing attitudes • Sanskar kedras, Balwadis, Anganwadis • NGOs, Youth clubs and Groups for social transformation and service to the
society
3.11.10. Employment Generation The proposed expansion project by industry would improve the socio-economic status of people in the study area in terms of local labor employment and contract basis jobs. The proposed expansion project activity might provide opportunities to the local populace, especially in business and other services. The improved employment potential and development of infrastructure are direct benefits resulting out of the projects. The proposed project will help to increase the socio-economic status of the local people. Project has created direct employment opportunities to 170-180 workers and indirect employment opportunities to around more than 100 people in the form of lorry operators, workers and other menial works. Revenue expenditure in the area will create additional purchasing power of the consumers, which intend to invest in consumer goods sector. Small micro enterprises will be grown in the project area.

118
3.11.11. Project Benefits
The business avenues in the project area will grow with the project. Small and Medium enterprising activities will grow due to the project in the area. Self and wage employment provides an opportunity to implement the inclusive grow model. Inclusiveness also increases with project, which brings out the elimination of the poverty in the region. People will not feel excluded. The rate of return on such incidences remains higher than the development of the developed one.
The establishment of this new project will be beneficial to the surrounding area/community in terms of employment generation, social development and other indirect benefits. This project will also reduce the demand and supply gap of high quality perfumery grade products in local as well as international market. It is anticipated that the proposed activity will provide benefits to locals during both construction and operational phase thereby helping in up-lift men of the locale specific socio-economic stature of the project affected area.
Overall benefits of the project can be summarized as follows; 1) The plant is located at Notified Industrial Area, therefore no human displacement or habitat
loss is envisaged. 2) Improvement in locale specific socio-economic aspects. 3) It will help in improving the infrastructural facilities 4) There are 100 employees working in the unit. The Industry has been employing mainly the
local people to improve the economic conditions of the surrounding area. 5) Under CSR activities the company will focus on locale specific aspects such as education
and skill development, health awareness to the people, water and sanitation and various social activities.
6) The project will also contribute in increase in revenue in form of various taxes which will be paid to government time to time. Company will also export their products to other country that also can be benefitted to the country by increase in excise and vat revenues.
7) The CSR activities planned by company can be considerably very beneficial for health, education, development of poor people, welfare of women and labour and support to disabled persons etc.
Thus, a significant benefit to the socio-economic environment is likely to be created due to the
proposed project and the project will help in developing the national income. 3.11.12. Willingness to Pay and Willingness to Accept
People of the project area are willing to accept the project as a tool of their livelihood
development and standard of living with employment income effects in the local areas. Any
development project has advantages and disadvantages. We have found out the better of
between the situations. Hazards any should mitigated properly. The tradeoff between strong
and weak sustainability is highly essential. The villagers were happy with the unit. No
complaints received during our field work. No ground water contamination occurred in the
nearby well and fountains. 3.11.13. Mitigation of hazards
Generally, environmental impacts can be categorized as either primary or secondary. Primary impacts are those, which are attributed directly by the project and secondary impacts are those, which are indirectly induced and typically include the associated physical and chemical reactions and changed patterns of social and economic activities by the proposed actions.

119
Any developmental endeavours render some pollution and waste, which needs to be minimized
through remedial systems. All families settled around know that the pollution increases through
such projects. However, the Karthik Agro Industries Pvt Ltd., (KAIPL) proposes to reduce the
pollutions through alternative waste management measures. People’s ability to accept the
project is strong. Minor hazards are proposed to be reduced with effective remedy, which does
not create any displacement, hence, no problem of rehabilitation occurs.
The villages surveyed have not been affected by ground water contamination. Water was drinkable and used by the public. There is no problem of odor since it has been taken care of with remedial measures.
3.11.14. Conclusions
The proposed distillery unit has low pollution potential. The water use will be minimized to improve the process. Fire protection and safety measures would be provided to take care of fire and explosion hazard. Direct and indirect employment opportunities would be extended to the local residents. Energy consumption of the unit is expected to be lowest in the industry compared to other similar technology supplier. The proposed project would be implemented by adopting latest technologies and equipments thereby minimizing the pollution load in Environment, achieving Zero Liquid Discharge (ZLD).
There is a maximum use of recycle water thereby reducing fresh water. The Karthik Agro Industries Pvt Ltd., (KAIPL) has a positive response from the public. The willingness to pay and the willingness to accept the project has positive outcome. The losses due to the polluting agents can be diluted through various methods. The unit has recycled the waste water. The social and cultural vulnerability index responds a very less and level of resilience is at the higher side. The families dwelling around could get more facilities due to the industrial zone during the corresponding period.
3.12 ECOLOGY
This EB report of Expansion of 65 KLPD Molasses/Grain Based Distillery to 180 KLPD Molasses/Grain Based Karthik Agro Industries Pvt Ltd., (KAIPL), Located at Village, Tal.: Badami, Dist.: Bagalkote, Karnataka is prepared by in-house FAE of EEIPL Sulakshana Ayrekar and Mr. Anup Gargate as a team member (EB).
3.12.1 Study Area
The study area (10 Km radius) from project site falls in Badami Tehsils of Bagalkote district, Karnataka. There are total of 36 villages and settlements in the study area, out of which 9 villages fall in 5 km radius and 27 villages between 5 to 10 km radius. The project site is situated at 586 m MSL. The climate is warm and dry throughout the year and rainfall is scarce. Bagalkot district receives the lowest rainfall annually in Karnataka. The average rainfall in the region is approximately 692 mm annually weather is generally dry and hot in major part of the year. Winter lasts from December to mid-February with average minimum temperature of 14OC, followed by summer from February till May end, when the temperature may go up to 45OC and the average annual temperature of the area is 25OC.
The LULC percentage, drawn from satellite imagery of the study area, reveals composition of the present land cover as fallow land (25.0%), barren land (21.40%), water bodies (3.01%), Forest (10.78%) and i.e. a total of 60.19% representing natural wilderness habitats in the area along with land use as rain fed and irrigated crop land (29.40%), builtup area (10.42%). The
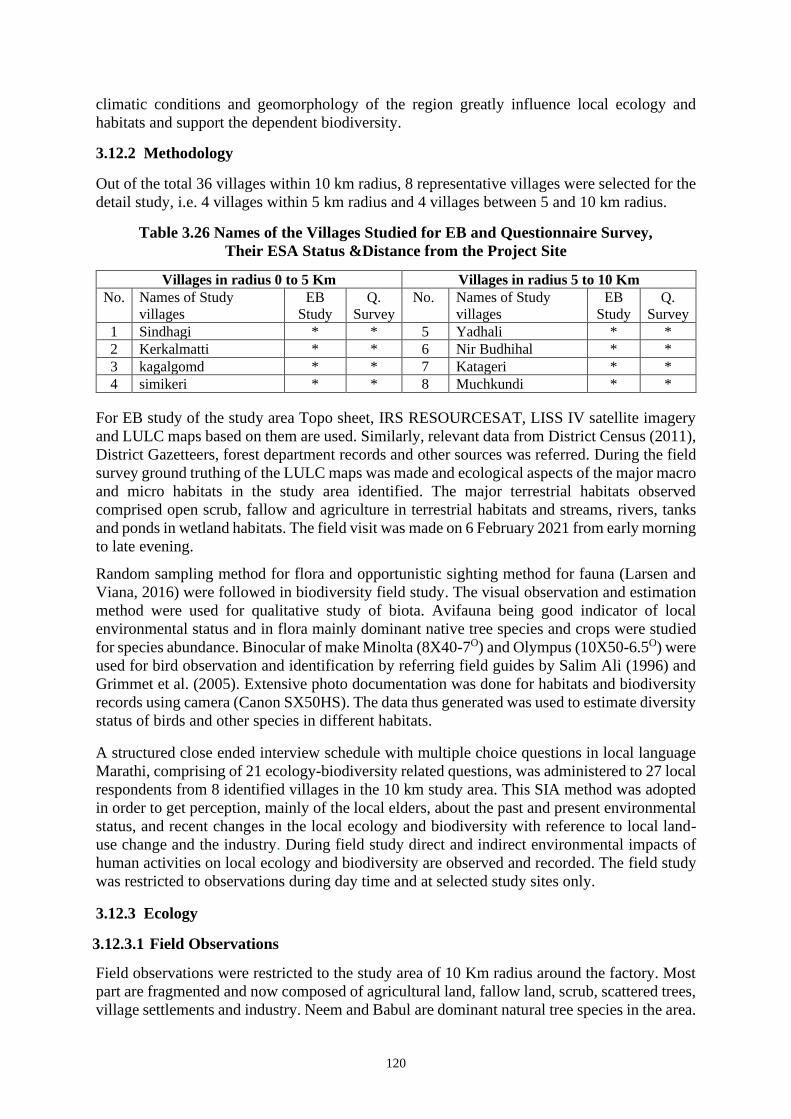
120
climatic conditions and geomorphology of the region greatly influence local ecology and habitats and support the dependent biodiversity.
3.12.2 Methodology
Out of the total 36 villages within 10 km radius, 8 representative villages were selected for the detail study, i.e. 4 villages within 5 km radius and 4 villages between 5 and 10 km radius.
Table 3.26 Names of the Villages Studied for EB and Questionnaire Survey, Their ESA Status &Distance from the Project Site
Villages in radius 0 to 5 Km Villages in radius 5 to 10 Km No. Names of Study
villages EB
Study Q.
Survey No. Names of Study
villages EB
Study Q.
Survey 1 Sindhagi * * 5 Yadhali * * 2 Kerkalmatti * * 6 Nir Budhihal * * 3 kagalgomd * * 7 Katageri * * 4 simikeri * * 8 Muchkundi * *
For EB study of the study area Topo sheet, IRS RESOURCESAT, LISS IV satellite imagery and LULC maps based on them are used. Similarly, relevant data from District Census (2011), District Gazetteers, forest department records and other sources was referred. During the field survey ground truthing of the LULC maps was made and ecological aspects of the major macro and micro habitats in the study area identified. The major terrestrial habitats observed comprised open scrub, fallow and agriculture in terrestrial habitats and streams, rivers, tanks and ponds in wetland habitats. The field visit was made on 6 February 2021 from early morning to late evening.
Random sampling method for flora and opportunistic sighting method for fauna (Larsen and Viana, 2016) were followed in biodiversity field study. The visual observation and estimation method were used for qualitative study of biota. Avifauna being good indicator of local environmental status and in flora mainly dominant native tree species and crops were studied for species abundance. Binocular of make Minolta (8X40-7O) and Olympus (10X50-6.5O) were used for bird observation and identification by referring field guides by Salim Ali (1996) and Grimmet et al. (2005). Extensive photo documentation was done for habitats and biodiversity records using camera (Canon SX50HS). The data thus generated was used to estimate diversity status of birds and other species in different habitats.
A structured close ended interview schedule with multiple choice questions in local language Marathi, comprising of 21 ecology-biodiversity related questions, was administered to 27 local respondents from 8 identified villages in the 10 km study area. This SIA method was adopted in order to get perception, mainly of the local elders, about the past and present environmental status, and recent changes in the local ecology and biodiversity with reference to local land-use change and the industry. During field study direct and indirect environmental impacts of human activities on local ecology and biodiversity are observed and recorded. The field study was restricted to observations during day time and at selected study sites only.
3.12.3 Ecology
3.12.3.1 Field Observations
Field observations were restricted to the study area of 10 Km radius around the factory. Most part are fragmented and now composed of agricultural land, fallow land, scrub, scattered trees, village settlements and industry. Neem and Babul are dominant natural tree species in the area.

121
Major crops in the study area are jowar, maize, and sugarcane. Plantations of Banana and papaya were also observed. The terrain in the study area is predominantly flat at an average elevation of 586 m MSL. The area is comprised of terrestrial ecosystems, dominated by patches of fallow land, scanty grasslands barren lands, and natural scrub; along with manmade ecosystems like agriculture farms, horticulture and human settlements with small pockets of woodland. The entire area supports a blend of micro ecosystems with the fragmented wilderness habitats. During summer the area represented a mosaic of habitats including fallow land, open scrubs and natural grasslands along with agriculture.
River Ghatprabha is the main source of water in the study area which further become part of Almatti reservoir, a large wetland habitat for birds in the area. Other major aquatic habitats in the region are major tank at village Neerabudihal, small village tank at Katageri and some major streams. Other minor aquatic habitats studied include marshy areas, seasonal streams and some small ponds in 10 km study area of the project site. At time of field visit, these wetlands were comparatively full of water and the smaller ones were partially full and supported moderate wetland habitat and avian diversity.
3.12.3.2 Questionnaire Survey
It is revealed from the perception of majority of the senior respondents, in the multiple-choice question survey, that in past the natural vegetation cover in the area was dominated by scanty open scrub and grasslands with small pockets of woodland and rain fed agriculture. These natural habitats are now fragmented and reduced in size. All the respondents opined for degradation and reduction in these grassland habitats (61), followed by open scrub (59%) and fallow land (34%). Most (72%) respondents believed moderate increase in agriculture habitats in the last two decades. This situation is responsible for decline in ecology and natural habitat quality.
In wetland habitats more than half of the respondents reported no major change while some informed qualitative and quantitative degradation of the major sources of water for livelihood and irrigation in the area. While some depend on diverse alternate water sources such as seasonal streams, irrigation canal, wells, tube wells, village ponds and tanks. Around 36% of the respondents commented on degradation of water quality of wetland habitats i.e. streams, tanks and ponds in the region. Over 38% respondents reported pollution of rivers and other wetlands. Majority (55%) believe that most of the natural water sources in the region have rapidly decreased due to over drawl for irrigation, particularly of sugarcane.
Different reasons were quoted by the respondents for the qualitative and quantitative degradation of natural habitats in the study area. Some believe that agricultural expansion (65%) and trees cutting (32%) are the two major causes for decline in the status of local ecology and biodiversity therein. This degradation of environmental status is further aggravated by pollution from local sewage (73%), urbanization (33%), and industrial pollution (29%). As per the respondents the present land-use in the area is dominated by agriculture and urbanization having inevitable cumulative negative impacts on the local environment and it is increasingly influencing the local ecology, natural and manmade habitats and their biodiversity.
3.12.4 Biodiversity
3.12.4.1 Field Observations
The local terrestrial areas, with patches of mixed scrub and barren lands with patchy grasslands, have all along been used by various local species as their natural habitats. Mosaics of traditional

122
agriculture fields, as manmade habitat are also supporting diverse biodiversity for years, which has coexisted with the agriculture practices in the region. According to Bagalkote Gazetteer (2006) the key mammal carnivorous found in the area include Jackal (Canisaureus indicus), Indian Wolf (Canis lupus pallipes) and Wild Cat (Felis silvestris ornate). The herbivorous commonly include, Hare (Lepus nigricollis) and Indian Gazelle (Gazella bennetti). In aquatic habitats common fish fauna from wetland resources comprised mainly cat fishes and local minor carps.
Almatti Reservior supports rich aquatic biodiversity and large number of local, regional, and trans boundary migratory birds. During the field study many local avifaunal species with few early migrants were observed in and around Almatti Reservior. Avifauna being considered as good indicator of local habitat health and biodiversity, due to their vital role in the food chains, the present field survey was mainly focused on local birds. A total of 34 bird species belonging to 11 orders, 23 families and 31 genera were recorded during the brief field survey. Out of these 23 species were common resident, 8 species were not common resident, 2 species were not common winter visitors and 1 species is common winter visitors. With regard to Feeding Guilds out of the 33 bird species 7 species are dependent on multiple sources for feeding while remaining 26 are dependent on single source. Out of these 26 single source species 7 species were Piscivorous, 8 were Insectivorous, 4 Grainivorous, 5 Omnivorous and 1 species was Carnivorous indicating existence of diverse food chains in the diverse local habitats. Sightings of Painted Stork (Mycteria leucocephala), River tern (Sterna aurantia) and Woolly Necked Stork (Ciconia episcopus) during study was encouraging, as first two bird species with IUCN status as ‘Near Threatened’ and last one ‘Vulnerable’ Globally. Moreover, Black-Shouldered Kite (Elanus caeruleus) is listed as ‘Schedule I’ species by WPA 1972. Considering relatively limited study sites, short study duration and unusually hot climate, the brief opportunistic biodiversity observations are relatively rich. In flora locally dominant wild tree and shrub species were recorded. These give indication of change in local environmental quality over a period. As birds are mostly associated with tree, shrub and grasses for their basic requirements, and are therefore themselves sensitive as indicators of environmental change. In flora, 7 trees and 2 shrub species were observed during field investigation, dominant tree species being Acacia nilotica, Azadirachta indica, Tamarindus indica and Prosopis sp. Considering relatively limited study sites, short study duration, the brief opportunistic observations are considerable. More information on biodiversity of the area was collected through questionnaire survey from local respondents. The lists of flora and fauna observed during the study are given in Table No 3.27 & 3.28 3.12.4.2 Questionnaire Survey It was revealed from the respondents that the common local trees in the region are Banyan, Peepal, Umbar, Tamarind, Drumstick, Babul, Neem, Jamun and Mango. Presently the major crop diversity in the area is sugarcane, jowar and wheat followed by, red gram and groundnut, along with diverse vegetables and chilli. In patchy homesteads and horticulture, species cultivated include Coconut, Guava, Sapodilla, Banana, Papaya and Custard Apple, depending on availability of water resource. The natural and the domesticated flora play vital role in overall biodiversity of the area.
According to respondents the common wild fauna in the area is Indian Wolf (Canis lupas) (WPA Schedule- I) and Jackal, Indian Fox, Common Mongoose, Bonnet Macaque, Common Langur (all in WPA Schedule- II), Indian Hare, Wild boar, Indian Porcupine, Indian Fruit Bat and Three-striped Palm Squirrel (all in WPA Schedule- IV). A large majority of respondents

123
also confirmed occurrence of common bird species i.e. Indian Peafowl (WPA Schedule- I), Common Myna, House Sparrow, Common Crow, Black Kite, Rose-Ringed Parakeet, Spotted Owlet, Rock Pigeon, Cattle Egrets, Common Quail, Francolin, Brahman kite, Black kite and some Raptor species. According to seniors lately the number of raptors like eagles, buzzards and falcons has drastically gone down, this is apparently due to loss of habitats and prey species. In reptiles, presence of Spectacled Cobra and Russel’s Viper (both in WPA Schedule-II), Indian Rat Snake, Common house gecko, Garden lizard and Indian Monitor Lizard (WPA Schedule- I) were reported from the region. For list of flora and fauna reported by the respondents from the study area is given in Table No. 3.29 & 3.30 3.12.4.3 Environmental Impact of Proposed Project on Ecology and Biodiversity in
Region
The probable impacts were considered for worst case scenario. The factory site is surrounded by agriculture fields and human settlements. Discharge of untreated wastewater and effluent from the industry in surrounding area can cause adverse environmental impact on terrestrial and aquatic habitats and dependent biodiversity and ground water resources. Therefore, any possibility of land and water contamination by the industry, affecting local ecology, biodiversity, neighbouring cropland and local habitation should be prevented. In case of air pollution, at times the industry is likely to contribute in SPM pollution load in the nearby area. In these circumstances there could be possible negative impacts particularly on avifauna, surrounding crops and local population. The mandatory Green Belt (GB) needs to be developed along the entire project plot periphery to restrict air pollution as per the TOR and according to the CPCB norms at the earliest. The pollution control measures as per EMP should strictly be implemented by the industry. It is to be ensured that hazardous effluents and wastes do not escape into neighbouring habitats i.e. agriculture fields, horticulture, and surrounding natural habitats through the streams, even if they may be seasonal, and ground water.
3.12.5 Green Belt
As per the standard TOR, under section 5.g. point 7.ix, 33% of the total plot area should be under Green Belt (GB), developed @ minimum 1500 woody trees per ha, as a belt all along the periphery of the total land of the industry. The total plot area is 16.1874 ha, thus 33% i.e. 5.34 ha area should be developed as GB of minimum 5-meter width, by planting a minimum of 8,010 trees, according to the TOR and as per the GB norms of (CPCB, 2000), MOEFCC. The existing green belt area shown by the proponent is 6.4 ha (40%). It was observed that the present plantation in GB is inadequate at some areas and need to develop as per norms.
It should be understood that the primary objective of the industrial GB development is for environmental protection and pollution mitigation and not for beautification or horticulture purpose as generally misinterpreted by most industries. In this case it is recommended that this mandatory GB development as per CPCB norms should be initiated on top priority at the earliest, to control air pollution as a mitigation mechanism. Further detail of the tree species, width of plantation, planning schedule etc. shall be included in the plan. The green belt shall be around the project’s total plot periphery and the scheme for greening of the roads used for the project shall also be incorporated as mentioned in the TOR. As per the CPCB, (2000) guidelines the industry should plant trees of recommended species for environmental protection and as mitigation measure from diverse pollutants, to safeguard the health of workers, neighboring population and biodiversity in general. No orchards or fruit bearing trees are desirable in GB or on industry premise to avoid possible harmful chemical contamination, bioaccumulation and bio magnification of hazardous chemicals in fruits and vegetables. Any

124
gardening, lawns etc. for beatification purpose if undertaken, it should be in addition to the mandatory GB as per the TOR.
3.12.6 CER Activity
Time bound CER activities for protection and conservation of the identified natural habitats in the vicinity, with joint participation of locals and industry, needs to be undertaken on priority.
1. The three villages in the study area namely i) Kerkalmaui, ii) Yadahalli and iii) Neerabudihal, being still in good ecology and biodiversity condition, are recommended under these activities for conservation of existing ecology and biodiversity.
2. Depending on local conditions the activities, such as i) block plantation of local tree species, ii) Removal of weeds and exotics, iii) Solid waste and sewage management, iv) Water and soil conservation, and v) Environment awareness campaign should be undertaken involving locals, particularly youth and women self-help groups.
In addition to proactively controlling negative impacts of industrial pollution on local ecology, above initiatives would help improve villager’s health, many of who are employed in this
industry. This will also motivate the locals and the industry employees alike to protect ecology in and around their own villages. The proposed CER activities of the industry should therefore be ecology based, time bound and result oriented for protection of local environment. The thrust of these CER activities should be based on the CER guidelines (2018) and ultimately focused on eco-friendly, self-reliant and sustainable development of the villages around the industry.
Table 3.27 List of fauna observed during the field survey
No Order Family Scientific Name Common Name Status Feeding guild
IUCN Status
1 Anseriformes Anatidae Anus poecilorhyncha
Spot-Billed Duck NR P LC
2 Charadriiformes Recurvirostridae Himantopus himantopus
Black Winged Stilt CR I/P LC
3 Charadriiformes Charadriidae Vanellus malabaricus
Yellow Wattled Lapwing
NR I LC
4 Charadriiformes Charadriidae Tringa hypoleucos Common Sandpiper CW I/P LC
5 Charadriiformes Charadriidae Vanellus indicus Red Wattled Lapwing
CR I LC
6 Charadriiformes Laridae Sterna aurantia River Tern NR I/P NT
7 Ciconiiformes Ardeidae Ardea cinerea Grey Heron NW P LC 8 Ciconiiformes Ardeidae Egretta garzetta Little Egret CR P LC 9 Ciconiiformes Ardeidae Ardeola grayii Indian Pond-Heron CR P LC
10 Ciconiiformes Ciconiidae Ciconia episcopus Woolly Necked Stork
NR P VU
11 Ciconiiformes Ciconiidae Mycteria leucocephala
Painted Stork NR P NT
12 Columbiformes Columbidae Columba livia Rock Pigeon CR G LC
13 Columbiformes Columbidae Streptopelia decaocto
Eurasion Collared-Dove
CR G LC
14 Columbiformes Columbidae Streptopelia senegalensis
Laughing Dove CR G LC
15 Coraciiformes Meropidae Merops orientalis Green Bee-Eater CR I LC

125
16 Coraciiformes Alcedinidae Halcyon smyrensis White Breasted Kingfisher
CR I/P LC
17 Cuculiformes Cuculida Centropus sinensis Southern Coucal CR I/F/G LC
18 Falconiformes Accipitridae Elanus caeruleus Black-Shouldered Kite
NR C LC
19 Passeriformes Hirundinidae Hirundo smithii Wire-Tail Swallow CR I LC
20 Passeriformes Pycnonotidae Pycnonotus cafer Red Vented Bulbul CR O LC
21 Passeriformes Corvidae Corvus spendense House crow CR O LC
22 Passeriformes Dicruridae Dicrurus adsimilis Black Drongo CR I LC
23 Passeriformes Laniidae Lanius vittatus Bay-Backed Shrike NR C/I LC
24 Passeriformes Motacillidae Motacilla maderaspatensis
White Browed Wagtail
NW I LC
25 Passeriformes Muscicapidae Saxicola caprata Pied Bush Chat CR I LC
26 Passeriformes Muscicapidae Saxicoloides fulicata
Indian Robin CR I LC
27 Passeriformes Passerinae Passer domesticus House Sparrow CR G LC
28 Passeriformes Sturnidae Acridotheris tristis Common Myna CR I/G LC
29 Passeriformes Sturnidae Sturnus pagodarum Brahminy Starling CR O LC
30 Pelecaniformes Phalacrocoracdiae Phalacrocorax niger
Little Cormorant CR P LC
31 Passeriformes Sturnidae Pastor roseus Rosy Starling NR I/G LC
32 Gruiformes Rallidae Fulica atra Common Coot CR O LC
33 Ciconiiformes Ciconiidae Anastomus oscitans Asian Openbill CR O LC 34
Galliformes Phasianidae Pavo cristatus Indian peafowl
CR O LC
Feeding Guild: C-Carnivore; F-Frugivore; G-Granivore; I-Insectivore; N-Nectarivore; O-Omnivore; P-Piscivore, Status: CR-Common Resident; NR- Not Common Resident; CW-Common Winter visitor; NW- Not Common Winter visitor IUCN Category: LC-Least Concern, NR-Near Threatened, V-Vulnerable
Table 3.28 List of Dominant floral species observed during survey
Sr. No. Scientific Name Common English name Marathi Name Tree
1. Ficus beghalensis Banyan Vad 2. Ficus religiosa Sacred Fig Peempal 3. Ficua recemosa Indian Fig Umbar 4. Tamarandus indica Tamarind Chinch 5. Azadirachta indica Neem Kadulimb 6. Mangifera indica Mango Amba 7. Acacia nilotica Acacia Babul
Shrub 8. Prosopis juliflora Prosopis Chilar 9. Ipomoea carnea Pink morning glory Besharmi

126
Table 3.29 List of fauna commonly reported by the respondents during survey
No. Scientific Name Common Name IUCN Status WPA 1972 Mammals
1 Lepus nigricollis Indian hare LC Sch IV 2 Canis aureus Jackal LC Sch II 3 Sus Scrofa cristatus Wild boar LC Sch III 4 Funambulus palmarum Three striped palm
squirrel LC NL
5 Macaca radiata bonnet macaque LC Sch II 6 Presbytis entellus Common langur LC Sch II 7 Hystrix indica Indian Porcupine LC Sch IV 8 Herpestes edwardsi Common mongoose LC Sch II 9 Vulpes bengalensis Indian Fox LC Sch II
10 Canis lupas Indian Wolf LC Sch I 11 Pteropus medius Indian flying fox LC Sch IV
Reptiles 1 Naja naja Spectacled cobra NL Sch II 2 Ptyas mucosa Indian rat snake NL Sch IV 3 Daboia russelii Russell’s viper NL Sch II 4 Varanus bengalensis Indian monitor lizard LC Sch I 5 Calotes versicolor Garden lizard NL NL 6 Hemidactylus frenatus Common house gecko NL NL
Amphibians 1 Hoplobatracus tigerinus Indian Bull Frog LC Sch IV
Birds 1 Pavo cristatus Indian peafowl LC Sch I 2 Acridotheres tristis Common myna LC Sch IV 3 Passer domesticus House sparrow LC Sch IV 4 Corvus spendens House crow LC Sch V 5 Milvus migrans Black kite LC Sch I 6 Psittacula krameri Rose-ringed parakeet LC Sch IV 7 Coturnix coturnix Common quail LC Sch IV 8 Francolinus sps. Francolin LC Sch IV 9 Athene brama Spotted Owlet LC NL
10 Columba livia Rock Pigeon LC NL 11 Bubulcus ibis Cattle Egrets LC NL
LC: Least Concern, NT: Near Threatened, VU: Vulnerable, EN: Endangered, NL: Not listed
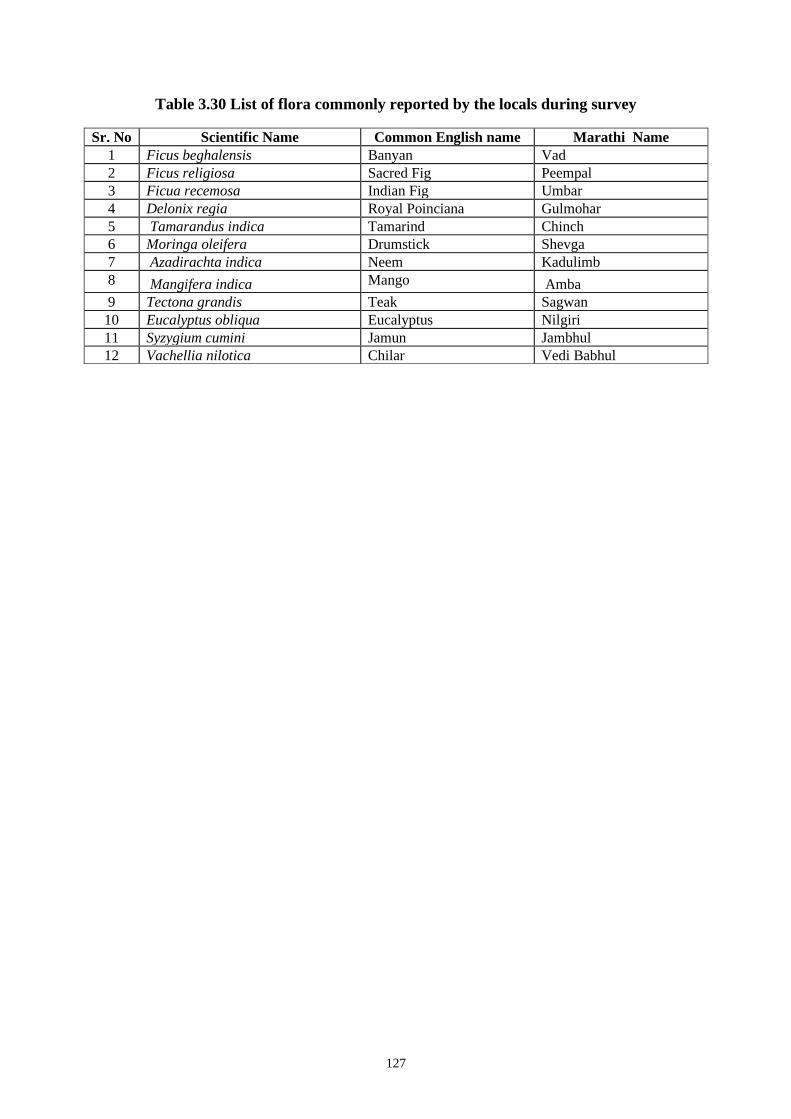
127
Table 3.30 List of flora commonly reported by the locals during survey
Sr. No Scientific Name Common English name Marathi Name 1 Ficus beghalensis Banyan Vad 2 Ficus religiosa Sacred Fig Peempal 3 Ficua recemosa Indian Fig Umbar 4 Delonix regia Royal Poinciana Gulmohar 5 Tamarandus indica Tamarind Chinch 6 Moringa oleifera Drumstick Shevga 7 Azadirachta indica Neem Kadulimb 8 Mangifera indica Mango Amba 9 Tectona grandis Teak Sagwan 10 Eucalyptus obliqua Eucalyptus Nilgiri 11 Syzygium cumini Jamun Jambhul 12 Vachellia nilotica Chilar Vedi Babhul

Chapter 4
Environmental Impacts & Mitigation Measures
4.1 INTRODUCTION
Evaluation of impacts on the environmental attributes, due to expansion of KAIPL distillery, is an important aspect to be studied. This chapter incorporates both, qualitative and quantitative descriptions of various environmental impacts due to proposed expansion of distillery by KAIPL. Various scientific techniques are available to predict and evaluate the impact of developmental activities on the physical, ecological and socio - economic environments. Predictions are superimposed over base line status (pre- project) of environmental quality to obtain final (post- project) environmental conditions.
‘Environmental Impact’ can be defined as any alteration of environmental conditions or creation of a new set of environmental conditions, adverse or beneficial, caused or induced by the action or set of actions under consideration. Generally, the environmental impacts can be categorized as either Primary or Secondary. Primary Impacts are those which are attributed directly to the project. On the other hand, Secondary Impacts are those which are indirectly induced and typically include the associated investments and changed patterns of social and economic activities by the proposed action. Proposed expansion project may influence environments of area in two phases:
Construction Phase: During the construction period, the impact may be temporary.
Operational Phase: Post construction phase may have long term effects on the environment.
4.2 CONSTRUCTION PHASE
Construction phase impacts on the environment can be considered short term. Activities during erection of the plant and civil structures may affect environment of area surrounding the site. Impacts as well as mitigation measures for the same are described below-
Table 4.1 Impact Identification and Mitigation Measures due to Construction Phase
No Env. Aspect Parameter Causes Impacts Types Mitigation measures / Remarks
1 Air Dust (SPM) Vehicular movement, drilling, excavation and land leveling
Respiratory problems - coughing and difficult or painful breathing; irritation in eyes.
High SO2 and NOx - lung disorders such as wheezing and shortness of breath.
Obstruction in activities like photosynthesis and evapo-transpiration due to deposition of dust on surface of leaves thereby reducing crop yield.
Minor (Negative Impact)
SO2 and NOX at single location will not increase as vehicular movement and machines will be mobile.
Control of dust emissions by sprinkling water on open spaces, kuccha roads, heaps of earthen filling material etc. until paved roads get constructed.
Provision of PPEs (Goggles and Masks) to staff and workers
Augmentation of existing green belt shall be done immediately after commencement of expansion.
SO2 Vehicular movement NOX
128

No Env. Aspect Parameter Causes Impacts Types Mitigation measures / Remarks
2 Water Deterioration of Water quantity, quality and aesthetics of water body.
Water requirement for construction and domestic activities.
Surface runoff & seepage
Domestic effluent
Spill from fuel, oil & other chemicals
Leachate from temporary waste dumps on site.
Industrial premises at KAIPL has already been well developed hence, construction to be taken up under expansion project shall have no significant impact on water environment. Some minor impacts are as follow-
Contamination of nearby water body
Silting of water bodies
Water borne disease
Minor (Negative Impact)
Proper and adequate segregation of construction area and appropriate drainages, to minimize runoff
Cutting and filling work will be avoided during rainy season.
Stone pitching on the slopes and construction of concrete drains for storm water to minimize soil erosion.
Development of green belt
Strengthening the existing green belt
Soil binding and fast growing vegetation to arrest soil erosion.
3 Noise Noise Nuisance and Disturbance
Construction equipment like dozers, scrapers, concrete mixers, cranes, pumps, compressors, pneumatic tools, saws, vibrators etc.
Continuous and intermediate source
During construction it is not a continuous source and hence do not pose a health risk or damage peoples' sense of hearing.
Adversely affects the quality of life of occupants and nearby residents.
Disturbance in nearby residents.
Constant exposure to high noise levels can result in damage of ear drums & loss of hearing.
Increased blood pressure levels, cardio-vascular disease and stress related heart problems.
Minor (Negative Impact)
Expansion of distillery project will be established in existing premises of KAIPL. There will be minimum construction work.
Provision of proper acoustic enclosure for noise generating and vibrating machinery.
Protective equipments such as ear plugs, earmuffs etc for workers will be provided.
Onsite workers must not be exposed, for more than 8 hours, to high noise generating sources.
4 Soil and Land use
Soil Quality and Topography
Spill from fuel, oil and other chemicals.
Substratum excavated
Affects the soil, micro as well as macro flora. Thereby, disturbing the nutritive
Minor (Negative Impact)
Proper maintenance of vehicles as well as machinery used during construction to avoid oil, fuel leakages.
129

No Env. Aspect Parameter Causes Impacts Types Mitigation measures / Remarks
during construction of foundations.
Improper storage of solid waste
composition of soil.
Positive benefits in the form of land leveling and tree plantation in the plant vicinity and other premises.
Bad aesthetics due to littering.
Disposal of waste to authorized recyclers and resellers.
5 Biodiversity and Habitat
Terrestrial as well as aquatic Flora, Fauna and Avifauna
Dust emissions
Noise generation
Influx of onsite workers
Flood lights, high masts etc.
No any major negative impacts envisaged but some minor impacts may be observed.
Retarded growth and productivity of the plants.
Minor (Negative Impact)
Noise generating and vibrating machinery would be provided with proper acoustic enclosure
Water sprinkling arrangement shall be provided to curb dust emissions during construction activities.
Workers staying onsite shall be supplied with fuel source such as LPG, Kerosene etc. for cooking. Moreover, proper care shall be taken so that the surrounding ecological area is duly conserved.
6 Risk, Hazard and Occupational health & Safety
Accidental risk and Hazard
Lifting of heavy tools & tackles, construction equipment
Repetitive motion, awkward postures and vibrations
High noise generating machinery
Continuous exposure to dust
Welding of metal parts
Cabling of electrical work.
Unhygienic conditions resulting from day-to-day activities of workers living
Physical problems viz. Carpal tunnel syndrome, tendonitis, back pain, muscle soreness and nerve damage reduction in hearing efficiency of workers
Shortness of breath following physical exertion, severe cough and chest pains
Fatigue and loss of appetite
Eye irritation and eye sight problems
Electrical shock Spread of various
diseases
Minor (Negative Impact)
Use of advanced technology and sophisticated machinery during construction
Maximum Employment of young and adequately trained persons (above 18 years)
Providing PPEs like masks, safety glasses, helmets, gum boots, ear plugs & ear muffs etc. to workers.
Proper earthing for electrical supply,
Separation of deep excavations and marking of dangerous areas with barricading etc.
24 X 7 medical aid with trained doctors and ambulance facility
Training to the workers from view points of safety, health and hygiene.
130

No Env. Aspect Parameter Causes Impacts Types Mitigation measures / Remarks
in the industrial area
7 Socio-Economic
Social and Economic status
Expansion of distillery
Primary and secondary employment generation
Major (Positive Impact)
There will be positive impact to the residents nearby industrial unit in the form of new job opportunities and increase in good employment generation potential.
Table 4.2 Disposal of Waste Generation during Construction Phase
No. Type of Waste Mitigation Measures 1 Metal scrap Sold to scrap dealers for reprocessing 2 Wooden scrap Utilized by local labours 3 Broken bricks, stones and cement
concrete wastes Used as filler material in plinth, low lying areas etc.
4 Paint cans, brushes and other plastic waste materials
Sold to re-cyclers, authorized re-processers
4.3 OPERATION PHASE
Operational phase activities may have impacts - minor or major, positive or negative on environmental disciplines such as soils, surface and ground water hydrology, micro meteorology, land use, water use, water and air quality, ecology, socio economics and noise environment. Description of various attributes and effects on same has been presented in following paragraphs.
Figure 4.1 Flow Chart of Impact Identification
131

Legends: SHW – Solid Hazardous Waste, EB- Ecological Biodiversity, RH- Risk & Hazards.
Table 4.3 Identification of Impacts on Environment due to Operation Phase
No Env. Aspects
Operations Activities Impact Identification
Mitigation Type of impact
1 Air Fermentation, Stack emissions from incineration boiler, Fuel storage yard, Ash Storage
Fermentation: CO2 gas release
Stack emissions: Particulate release.
Fuel & Ash Storage: Fugitive dust.
Overall increase in AAQ parameters like PM10, PM2.5, CO2 gas will contribute to greenhouse effect
Boilers is provided with ESP as APC with adequate height stack.
An impact due to air emissions on ambient conc. during non-operation of APC is described below at Section 4.3.1 of this Chapter.
Minor (Quantifiable)
2 Water polluti
on
Molasses storage tank, Spentwash storage tank
If spillage of Molasses, Spentwash & accidently discharged into water body, it may cause impact on water quality.
Addition of high organic pollution load in nearby water body i.e. Nallah.
Impacts due to operation activities are significant.
Quantification of accidental discharge into nearby nallah is given below at Section 4.3.3 of this Chapter.
Major (Quantifiable)
CPU Discharge of untreated / partially treated effluent
Parameters of untreated effluent of CPU will not add much organic load to receiving body if accidentally discharged.
-- Minor (Non-
Significant)
3 Noise Steam generation in Boiler (Steam vent off), Distillation column
Steam vent off, During
distillation of fermented wash
Temporary increase in workzone noise and ambient noise levels.
Steam vent off is not a regular practice it is once in six month during shut down of boiler.
Workers working in distillation section will be provided with ear plugs.
Minor (Non
quantifiable)
132

No Env. Aspects
Operations Activities Impact Identification
Mitigation Type of impact
4 Solid & Haz. Waste (SHW)
Ash storage Handling of ash during disposal.
It may lead to minor increase in air quality parameters.
Ash will be stored in silos with sprinkler arrangement & will be transported through covered vehicles.
Minor (Non-
quantifiable)
CPU Handling of sludge during disposal.
Non-scientific disposal of sludge, its littering and odour nuisance
CPU sludge disposed off immediately
5 Soil Stack emissions, spentwash handling, sludge handling,
Settling of stack emissions Accidental discharge of spentwash land area
There may be alteration of soil characteristics which may lead to decreased productivity.
APC would be provided to boiler and operated around clock. Spentwash handling will be done through closed HDPE pipes to avoid spillages or leakages.
Minor (Non-
quantifiable)
6 Risk & Hazard
Storage of alcohol
Release of alcohol vapors or fire in storage area
Due to fire it may affect the humans and property
Fire frightening lines are provided in existing area.
Also for expansion it will be done.
Major
4.3.1 Impact on Air Quality
A. Emissions from Fuel Burning
Major sources of air pollution will be boilers as well as vehicles used for transportation under proposed distillery boilers of capacity 40 TPH and 50 TPH will be installed. For 40 TPH boiler fuel shall be Coal / Bagasse + Spentwash (72MT/D / 160MT/D + 140MT/D) whereas for 50 TPH boiler fuel shall be Husk / Bagasse (225MT/D/500MT/D). ESP will be provided as APC equipment. Under existing distillery boiler of 16 TPH is installed. Stack emissions from boiler shall be in the form of particulate matter, SO2, CO, NOX.
In addition, vehicular exhaust may also contribute to air pollution through release of SO2, CO, NOx. Refer Table 2.20 of Chapter 2 for exiting boiler details and stacks of KAIPL.
4.3.1.1 GLC Evaluation through Air Dispersion Modeling
In order to study movement of particulate matter release into atmosphere from the source, Air Dispersion Model - AERMOD developed by the US Environmental Protection Agency (USEPA) is used. Software helps in knowing details of particulate dispersed in down wind direction and finally reaching the ground at farther distance from the source, Ground Level Concentrations (GLC) mainly depend upon the strength of emission source & micrometeorology of the study area. Site specific meteorological and AAQM data were collected for one season October-November-December 2020.Predominant wind direction are tabulated in following table –
Table 4.4 Predominant Wind Directions
No. Season Time (Hrs.) Predominant Wind
Direction Nearest Habitation
Downwind
1 Pre-monsoon 08:30
W Bagalkote 17:30
2 Monsoon
08:30 W Bagalkote
17:30 3
Post-monsoon 08:30
NE Kerkalmatti
17:30 4
Winter 08:30
NE Kerkalmatti 17:30
133

4.3.1.2 Baseline Ambient Air Concentrations
24 hourly 98th percentile concentrations of PM10, PM2.5, SO2 and NOx in ambient air, recorded during field study conducted for season October-November-December 2020are considered as baseline values. They represent impact due to operations of existing activities on this region. The impact due to operations of existing nearby industries on this region is represented by 98 percentile concentrations of above mentioned parameters at this location, which are considered as ‘Baseline Concentrations’ to determine the impact of activities in KAIPL on ambient air quality. The baseline concentrations are summarized in the following table
Table 4.5 Baseline Concentrations at site
Parameter PM10 PM2.5 SO2 NOX CO Conc. (g/m3) 64.15 22.55 26.06 30.76 0.90
NAAQS 100 g/m3 60 g/m3 80 g/m3 80 g/m3 4mg/m3
134

135
Figure 4.2 Wind rose for the Month October-November-December 2020

I. Predictions for Emissions from stack (Scenario- during operation of APC)
Figure 4.3 Isopleths of PM10 (24 Hrs Max. Conc. in μg/m3)
Maximum concentration of PM10 is 0.338μg/M3 towards West direction at 1.42Km from site
Table 4.6 GLC with Incremental Increase in PM10 Values (g/M3)
Sr.No
Location Direction
Distance from
site(Km)
98 Percentile baseline PM10 Conc. (g/M3)
Incremental PM10 GLC)
Total PM10
Prédictive GLC % Incremental Remark Impact
A B C D E F= (D+E) G=(E/D) x 100 -- --
1. Industrial Site --- --- 64.15 0.040 64.19 0.062 Total PM10
Predictive GLC lower than
standard 100 g/M3
Insignificant 2. Bagalkote NE 7.57 55.56 0.050 55.61 0.09
3. Gaddanakeri NE 5.47 55.85 0.050 55.9 0.09 4. Sulikeri SE 7.68 55.70 0.050 55.75 0.09 5. Tulasigere NW 6.50 55.81 0.040 55.85 0.07 6. Kerkalmaui SW 5.91 55.75 0.070 55.82 0.13 7. Jalageri SW 5.94 55.85 0.080 55.93 0.14 8. Kerkalmatti SW 1.91 54.45 0.080 54.53 0.15
136

Figure 4.4 Isopleths of PM2.5 (24 Hrs Max Conc. in μg/m3)
Maximum concentration of PM2.5 is 0.086μg/M3 towards West direction at 1.40 Km from site
Table 4.7 GLC with Incremental Increase in PM2.5 values
No Location Direction
Distance from
site(Km)
98 Percentile baseline PM2.5 Conc. (g/M3)
Incremental PM2.5 GLC
(g/M3)
Total PM2.5
Prédictive GLC
% Incremental Remark Impact
A B C D E F= (D+E) G=(E/D) x 100 -- --
1. Industrial Site --- --- 22.55 0.007 22.557 0.031 Total PM2.5
Predictive GLC
is lower than
standard of 60 g/M3
Insignificant 2. Bagalkote NE 7.57 20.33 0.010 20.34 0.05
3. Gaddanakeri NE 5.47 20.26 0.010 20.27 0.05 4. Sulikeri SE 7.68 20.75 0.010 20.76 0.05 5. Tulasigere NW 6.50 20.76 0.010 20.77 0.05 6. Kerkalmaui SW 5.91 19.17 0.030 19.2 0.16 7. Jalageri SW 5.94 20.80 0.010 20.81 0.05 8. Kerkalmatti SW 1.91 19.45 0.030 19.48 0.15
137

Figure 4.5 Isopleths of SO2 (24 Hrs Max Conc. in μg/m3):
Note: Maximum Concentration of SO2 is 3.05μg/M3 at 1.43 Km on West side of project site
Table 4.8 GLC with Incremental Increase in SO2 Values (μg/M3) with Operation of APC
Sr.No
Location Direction
Distance from site
(Km)
98 Percentile
baseline SO2 Conc. g/M3
Incremental SO2
GLC g/M3
Total SO2
Predictive GLC g/M3
% Increase
Remark
Impact
A B C D E F=
(D+E) G=(E/D)
x100 Total SO2 Predictive
GLC is lower
than prescribed standard
of 80 μg/M3
Insignificant
1. Industrial Site --- --- 26.06 0.30 26.36 1.151 2. Bagalkote NE 7.57 19.57 0.40 19.97 2.04 3. Gaddanakeri NE 5.47 19.56 0.50 20.06 2.56 4. Sulikeri SE 7.68 19.55 0.50 20.05 2.56 5. Tulasigere NW 6.50 18.90 0.40 19.3 2.12 6. Kerkalmaui SW 5.91 18.65 0.50 19.15 2.68 7. Jalageri SW 5.94 19.26 0.80 20.06 4.15 8. Kerkalmatti SW 1.91 19.26 1.00 20.26 5.19
138

Figure 4.6 Isopleths of NOx (24 Hrs Max Conc. in μg/m3)
Note: Maximum Concentration of NOx is 0.714 μg/M3 at 1.44 Km on West Side of project
site Table 4.9 GLC with Incremental Increase in NOx Values (μg/M3) with APC in Operation
Sr.No.
Location Direction
Distance from
Site(Km)
98 Percentile
baseline NOx Conc.
(μg /M3)
Incremental NOx GLC Value (μg
/M3)
Total NOx Predictive GLC (μg
/M3)
% Incremen
tal
Remark Impact
A B C D E F=
(D+E) G=(E/D)
x100 -- --
1 Industrial Site
--- --- 30.76 0.060 30.82 0.195 Total NOx Predictive GLC is lower than prescribed standard of 80 μg/M3
Insignificant
2 Bagalkote NE 7.57 24.45 0.10 24.55 0.41
3 Gaddanakeri NE 5.47 24.85 0.10 24.95 0.40
4 Sulikeri SE 7.68 24.81 0.10 24.91 0.40
5 Tulasigere NW 6.50 25.28 0.080 25.36 0.32
6 Kerkalmaui SW 5.91 27.29 0.10 27.39 0.37
7 Jalageri SW 5.94 24.81 0.20 25.01 0.81
8 Kerkalmatti SW 1.91 24.52 0.20 24.72 0.82
From Table 4.6, Table 4.7, Table 4.8, Table 4.9 (operation of APC equipment), it is seen that– 1. Incremental increase in PM10concentrationsat the 8 AAQM stations is in the range of
0.062% to 0.15% with the lowest concentration of 54.53 g/m3 at Kerkalmatti, the highest concentration of 64.19 g/m3 at Site; which are lesser than NAAQ standard of 100g/m3.
2. Incremental increase in PM2.5 concentrations at the 8 AAQM stations is in the range of 0.031% to 0.16% with the lowest concentration of 19.2g/m3 at Kerkalmaui, the highest concentration of 22.55 g/m3 at Site; which are lesser than NAAQ standard of 60 g/m3.
139

3. Incremental increase in SO2concentrations at 8 AAQM stations is in the range of 1.15% to 5.19% withthe lowest concentration of 19.15 g/m3 at Kerkalmaui, the highest concentration of 26.36 g/m3 at Site; which are lesser than NAAQ standard of 80 g/m3.
4. Incremental increase in NOx concentrations at the 8 AAQM stations is in the range of 0.195% to 0.82% with the lowest concentration of 24.55g/m3 at Bagalkote, the highest concentration of 30.82 g/m3 at Site; which are lesser than NAAQ standard of 80 g/m3.
From the above observations, it could be concluded that the impact on air quality at the 8 monitoring stations due to the boilers (stack emissions) with air pollution control equipment in operation is non-significant.
Impacts under Accidental Scenarios
II. Predictions for emissions from stack in worst case (Scenario - during non-operation of APC)
Figure 4.7 Isopleths of PM10 (24 Hrs Max Conc. in μg/m3)
Maximum concentration of PM10 is 15.5 μg/M3 towards West direction at 1.43 Km from site
Table 4.10 GLC with Incremental Increase in PM10 values for Non-Operation of APC
Sr. No.
Location Direction Distance (Km)
98 Percentile baseline PM10 Conc. (g/m3)
Incremental PM10 GLC
g/M3
Total PM10
Prédictive GLCg/M3
% Incremental
Remark Impact
A B C D E F= (D+E) G=(E/D) x
100 -- --
1. Industrial Site --- --- 64.15 2.0 66.15 3.118 Total PM10
Predictive GLC
lower than standard
of 100 g/m3
Insignificant 2. Bagalkote NE 7.57 55.56 2.0 57.56 3.60
3. Gaddanakeri NE 5.47 55.85 2.0 57.85 3.58 4. Sulikeri SE 7.68 55.70 2.0 57.7 3.59 5. Tulasigere NW 6.50 55.81 2.0 57.81 3.58 6. Kerkalmaui SW 5.91 55.75 3.0 58.75 5.38 7. Jalageri SW 5.94 55.85 3.0 58.85 5.37 8. Kerkalmatti SW 1.91 54.45 8.0 62.45 14.69
140
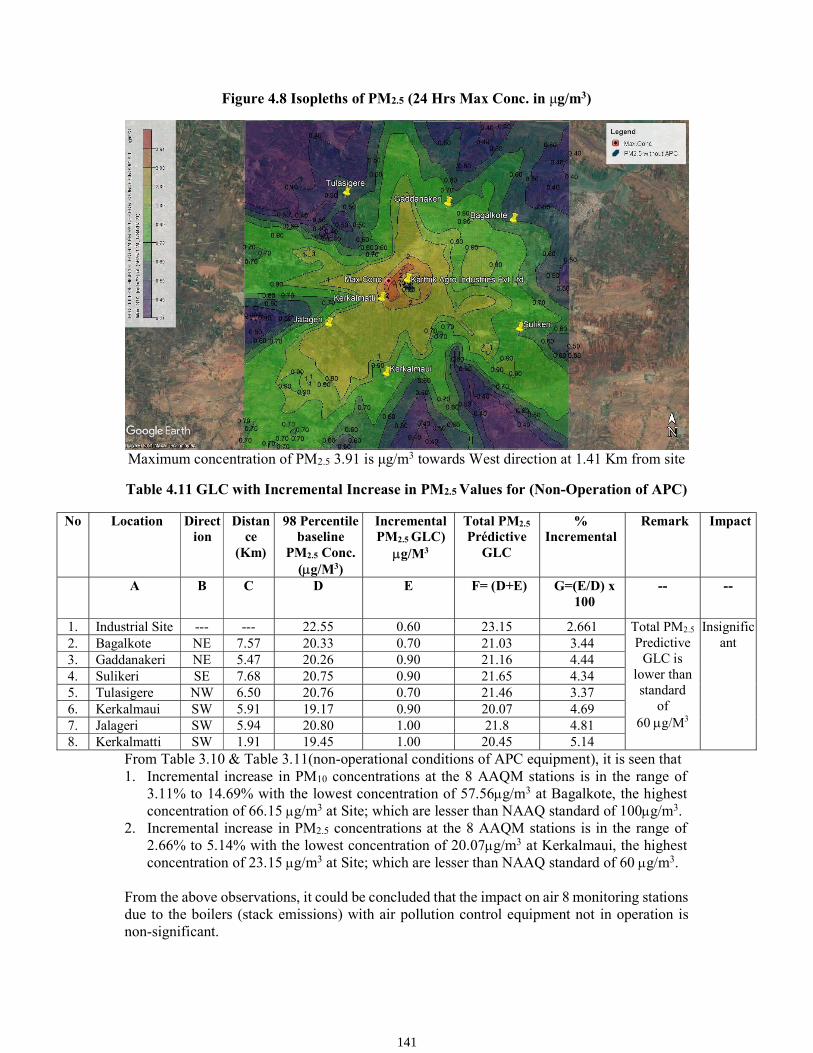
Figure 4.8 Isopleths of PM2.5 (24 Hrs Max Conc. in μg/m3)
Maximum concentration of PM2.5 3.91 is μg/m3 towards West direction at 1.41 Km from site
Table 4.11 GLC with Incremental Increase in PM2.5 Values for (Non-Operation of APC)
From Table 3.10 & Table 3.11(non-operational conditions of APC equipment), it is seen that 1. Incremental increase in PM10 concentrations at the 8 AAQM stations is in the range of
3.11% to 14.69% with the lowest concentration of 57.56g/m3 at Bagalkote, the highest concentration of 66.15 g/m3 at Site; which are lesser than NAAQ standard of 100g/m3.
2. Incremental increase in PM2.5 concentrations at the 8 AAQM stations is in the range of 2.66% to 5.14% with the lowest concentration of 20.07g/m3 at Kerkalmaui, the highest concentration of 23.15 g/m3 at Site; which are lesser than NAAQ standard of 60 g/m3.
From the above observations, it could be concluded that the impact on air 8 monitoring stations due to the boilers (stack emissions) with air pollution control equipment not in operation is non-significant.
No Location Direction
Distance
(Km)
98 Percentile baseline
PM2.5 Conc. (g/M3)
Incremental PM2.5 GLC)
g/M3
Total PM2.5
Prédictive GLC
% Incremental
Remark Impact
A B C D E F= (D+E) G=(E/D) x
100 -- --
1. Industrial Site --- --- 22.55 0.60 23.15 2.661 Total PM2.5
Predictive GLC is
lower than standard
of 60 g/M3
Insignificant 2. Bagalkote NE 7.57 20.33 0.70 21.03 3.44
3. Gaddanakeri NE 5.47 20.26 0.90 21.16 4.44 4. Sulikeri SE 7.68 20.75 0.90 21.65 4.34 5. Tulasigere NW 6.50 20.76 0.70 21.46 3.37 6. Kerkalmaui SW 5.91 19.17 0.90 20.07 4.69 7. Jalageri SW 5.94 20.80 1.00 21.8 4.81 8. Kerkalmatti SW 1.91 19.45 1.00 20.45 5.14
141

Analysis & Interpretation of GLC:
Figure 4.9 Graphs for Isopleths of PM10 with & without APC
Baseline Conc. of PM10 is observed as Min. 54.45g/m3 (Kerkalmatti) to Max. 64.15 g/m3 (Site). Among all AAQM stations, the PM10 baseline conc. is slight max. at Site. This may be because of poorly surfaced roads and vehicular transportation The Max. Incremental value for PM10 with APC is observed as 0.07g/m3at Kerkalmaui without APC is observed as 8 g/m3 at Kerkalmatti.
Figure 4.10 Graphs for Isopleths of PM2.5 with & without APC
100(g/m3 )
0
20
40
60
80
100
120
Conc
entr
atio
n (
g/m
3)
Locations
Incremental PM₁₀
Baseline Concentration KAIPLPredictive with APC KAIPL Predictive without APC
60 g/m3
010203040506070
Conc
entr
atio
n (u
g/M
ᶟ)
Locations
Incremental PM₂.₅
Baseline Concentration KAIPL Predivtive with APC KAIPL Predictive without APC
142

Baseline Conc. of PM2.5 is observed as Min.19.17 g/m3 (Kerkalmaui) to Max.22.55g/m3 (Site). Somewhat higher Conc. Pattern is observed at Industrial Site (22.55g/m3).This may be because of poorly surfaced roads and vehicular transportation The Max. Incremental value for PM2.5 with APC is observed as 0.03g/m3at Kerkalmatti without APC is observed as 1 g/m3 at Jalageri and Kerkalmatti
Figure 4.11 Graphs for Isopleths of SO2
Baseline Conc. of SO2 is observed as Min. 18.65g/m3 (Kerkalmaui) to Max. 26.06 g/m3 (Industrial Site). The reason for more SO2 Conc. is due to fuel burning in boilers and transportation. The Max. incremental value for SO2 is observed as 1 g/m3 at Kerkalmatti
Figure 4.12 Graphs for Isopleths of NOx
Baseline Conc. of NOx Conc. is observed between Min. 24.45g/m3 (Bagalkote) to Max.30.76 g/m3 (Industrial Site).The Max. Incremental value for NOx is observed as 0.2g/m3 at Jalageri and Kerkalmatti
80 g/m3
0102030405060708090
Conc
entr
atio
n (µ
g/M
ᶟ)
Locations
Incremental SO₂
Baseline Concentration KAIPLPredictive
80 g/m3
020406080
100
Conc
enta
rtio
n (µ
g/M
ᶟ)
Locations
Incremental NOx
Baseline Concentration YAPL Predictive
143

B. Fugitive Emissions
Fugitive emission under proposed activities of KAIPL shall be mainly the dust emissions. These will impact the working environment of the workers and will also settle on plants in the industrial premises. Consequence of this shall be respiratory disorders, aggravated coughing and difficult or painful breathing among the workers and reduced photosynthesis activity which shall impact the plant life. Also, inappropriate and non-scientific storage as well as longer holding periods of raw spentwash in the respective tanks and yeast sludge from fermenters shall lead to formation of aerobic-anaerobic conditions in the tank body thereby resulting in to uncontrolled release of gases comprising prominently of methane, hydrogen sulphide, sulphur dioxide and carbon di-oxide. The hydrogen sulphide imparts foul odour in the premises whereas SO2 lead to corrosive atmosphere. Moreover, inflammation of eyes, throat and respiratory track irritation are prominent effects observed in case of human being residing nearby the spentwash tank premises. Efficient and quick utilization of spentwash from the tanks and its incineration shall avoid holding up of same for longer periods and prevent formation of above mentioned gaseous emissions.
C. Process Emissions
CO2 can be generated from fermenters under distillery project. When let out in atmosphere could have undesirable effects in the surrounding ambience. Since CO2 has been labelled as one of the major gases responsible for green-house effect, its release in atmosphere has to be curbed as far as possible.
D. Odour Pollution
Odour can result from number of sources and operations in distillery. The same may include molasses handling and storage, Fermentors, effluent storage; treatment & disposal, effluent carrying drains, sludge storage areas etc. Under KAIPL distillery, every care shall be taken to avoid odour generation from above sources and actions so that eventual nuisance from same shall be abated. Especially, distillery fermentation section, distillation section for spentwash generation, spentwash handling; storage shall be provided prompt and proper attention. Aerobic pathways of degradation resulting due to excessively longer storage of spentwash, yeast sludge and similar putrescible materials shall give rise to foul smells as a result of generation of gases like hydrogen sulphide, sulphur di-oxide etc. These gases have very irritating effect on human beings and animals that come in their contact resulting in to coughing, sneezing, inflammation of upper respiratory track, irritation of eyes, sensation of nausea and vomiting. Unsanitary conditions responsible for odour trouble could give rise to other nuisance like fly and insect infestation.
4.3.1.3 Mitigation Measures
1. Emissions from Fuel Burning
Installation of ESP as APC Equipment to new boiler. It is proposed to install temperature, CO, CO2 and SO2 sensors for monitoring respective
parameters of the exhaust gases under installation of online monitoring system. Regular self-monitoring of AAQ and work zone air quality to be done by industry through
approved labs to check and control dust levels / concentrations at certain places so that same could be kept always below the stipulated norms.
Efficiencies of dust control equipment in the industry such as ESP shall be monitored regularly (at least once a month) under performance evaluation.
144
Inlet and outlet of pollution control equipment shall be provided with all necessary sampling arrangements as per guidelines of CPCB.
APC equipment would be interlocked with process as per guidelines of CPCB. Continuous Online Monitoring System for monitoring of SPM, Temp., SO2, CO, CO2 etc.
in stack emissions. IP cameras installed, maintained and data collected shall be formulated to CPCB server.
2. Fugitive Emissions
An action plan has been prepared in the industry that includes - proper exhaust and ventilation arrangements, monitoring of proper working of pollution control equipment, proper handling; storage and disposal of dust collected, use of PPE’s for staff and workers, augmentation of green belt with adequate density and provision of properly surfaced internal roads and work premise (tarred and concrete).
To control the fugitive emissions from all vulnerable sources water sprinkling system will be made to curb the emissions during movement of vehicles.
Installation of appropriate, adequate and efficient exhaust and ventilation system to remove and control dust from work zone areas. Provision of appropriate APC equipment to collect and remove dust from work zone including their monitoring routinely.
PPE such as masks, aprons, gloves, goggles etc. shall be provided to the workers. All internal roads, yards and open storage areas are provided with well compacted and
constructed surface layering. At certain locations linings of tar or RCC also provided. To control the fugitive emissions from all vulnerable sources water sprinkling system is
being provided to curb the emissions during movement of vehicles.
3. Process Emissions
To marginally minimize effects of CO2, this will be generated from fermenters. Same would be collected, purified, compressed and filled in cylinders and sold for production of beverages or other secondary purposes. Thus, no any problem to the surrounding area would be created due to the Air Pollution aspect
4. Odour Pollution
There will be different odour prone areas in the KAIPL industry. Measures shall be adopted under the unit for controlling like proper housekeeping, sludge management, steaming of major pipe lines, regular use of bleaching powder in the drains, efficient handling, prompt & pressmud will be sold. 5.
Closed pipeline shall be provided for carrying spentwash under distillery. Hence, odour nuisance due to spentwash storage will get minimized.
4.3.2 Impact on Climate Impacts on climatic conditions, due to the expansion of distillery are not envisaged especially as emissions of flue gases with very high temperatures, to the atmosphere, are not expected.
4.3.3 Impact on Water Resources
4.3.3.1 Surface Water (Quality & Quantity)
145

Total water requirement for Molasses based operations after expansion will be 2288 M3/D. From this, 1422 M3/D will be treated water from distillery CPU, 60 M3/D will be treated water from STP, 200 M3/D water from Rainwater Harvesting & 606 M3/D will be the fresh water taken from river. Fresh water consumption for industrial purpose in distillery would be 10 KL/KL of alcohol. Out of total water requirement, about 65% water will be recycled & 35% will be the fresh water. As far as treated effluent disposal is concerned, wastewater from Distillery will be forwarded to existing CPU & used for process.
Raw Spentwash from distillery will be concentrated in MEE. Concentrated spentwash will be incinerated in incineration boiler. Other effluents from distillery will be treated in existing CUP which will be duly upgraded under expansion & recycled back in the process.
Total domestic effluent generated from distillery & co-gen, will be treated in STP and treated water will be used for green belt
Total water requirement for Grain based operations after expansion will be 2174 M3/D. From this, 1135 M3/D will be treated water from distillery CPU, 60 M3/D will be treated water from STP, 200 M3/D water from Rainwater Harvesting & 779 M3/D will be the fresh water taken from river. Fresh water consumption for industrial purpose in distillery would be 10 KL/KL of alcohol. Out of total water requirement, about 55% water will be recycled & 45% will be the fresh water. As far as treated effluent disposal is concerned, wastewater from Distillery & co-gen unit is forwarded to existing CUP which will be duly upgraded under expansion & used for process & Greenbelt Lees will be treated in CPU & recycled in process Other effluents from distillery will be treated in proposed CPU & recycled back in the process. For more details about effluent generation, treatment and disposal; Chapter 2 Section 2.7.1.2 may be referred.
Table 4.12 Quantification of Pollutants’ Load (Distillery Spentwash)
Parameters
Raw Spentwash Flow – 1440 CMD
Concentrated Spentwash (After MEE);Flow – 288 CMD
Conc. of Pollutants
Quantity of Pollutants
Conc. of Pollutants
Quantity of Pollutants
pH 3 - 4 -- 4-5 -- COD 140000mg/lit 201600Kg/Day 650000mg/lit 187200Kg/Day BOD 80000mg/lit 115200Kg/Day 380000mg/lit 109440Kg/Day TDS 95000mg/lit 136800Kg/Day 465000mg/lit 133920Kg/Day
Table 4.13Quantification of Pollutants Load (Effluent from Molasses based Distillery) (Spentlee, MEE Condensate, Boiler Blow down, Cooling Tower blow, washing)
Parameters
Raw Effluent Flow rate – 1579 CMD
Treated Effluent Flow rate – 1422 CMD
CPCB Standards
Conc. of Pollutants
Quantity of Pollutants
Conc. of Pollutants
Quantity of Pollutants
pH 5-6 - 7 - 8 -- 7 - 8 COD 3000mg/lit 4737 Kg/Day 200mg/lit 284.4 Kg/Day 250mg/lit BOD 1800mg/lit 2842 Kg/Day 80mg/lit 113.76 Kg/Day 100 mg/lit TDS 1000mg/lit 1579 Kg/Day 1970mg/lit 2801.34 Kg/Day 2100mg/lit
146

Table 4.14 Quantification of Pollutants Load (Effluent from Grain based Distillery) (Boiler Blow down, Cooling Tower blow, washing)
Parameters
Raw Effluent Flow rate – 1138 CMD
Treated Effluent Flow rate – 1135 CMD
CPCB Standards
Conc. of Pollutants
Quantity of Pollutants
Conc. of Pollutants
Quantity of Pollutants
pH 5-6 - 7 - 8 -- 7 – 8 COD 3000mg/lit 3474 Kg/Day 200mg/lit 227 Kg/Day 250mg/lit BOD 1800mg/lit 2084.4 Kg/Day 80mg/lit 90.8 Kg/Day 100 mg/lit TDS 1000mg/lit 1158 Kg/Day 1970mg/lit 2235.95 Kg/Day 2100mg/lit
If the above-mentioned effluents are let out in the environment, without any treatment it may have impacts on surface and ground water quality as well as on soil quality. If the untreated effluent enters any surface water body; there could be number of adverse effects. Here no any untreated effluent would be let out in the environment. Further, as no any nallah or water carrying stream is located nearby site, chances towards mixing the untreated effluent in worst case scenario is nil. Moreover, as the surface water sources such as river, dam is far away from the site, the impact due to industrial waste water on same is non-significant.
When untreated effluents are discharged on lands, the soils could get adverse impact through number of actions and effects. Most immediate is the pH disturbance as a result of excessive acidic or alkaline effluent discharges on the land. Severe acidity kills the plants and active useful flora in soils. On the other hand, at higher pH; nitrogen locked in soils gets converted in to ammonia which escapes to the atmosphere thereby creating serious deficiency of this vital nutrient in the soil. Thus, soils become less fertile and non-productive eventually. High TDS lead to soil salinity problems and its conductivity is increased which adversely affects growth of crops and plants with eventual drop in the overall yield. Soil porosity may get hampered. Microbes in soil oxidise organic matter in the wastes. While utilizing carbon from the organics during their metabolism; they (the microorganisms) take up nitrogen from the soil which is an essential thing for cell growth. This action could deplete the nitrogen contents and is referred to as 'nitrogen robbing'. This eventuality reduces nutritive value of soil and its fertility. Also, problems with seed germination could come up if C/N ratio, pH and porosity of soils are affected adversely.
A. Impact on Surface Water Body
River Ghataprabha flowing in 10 KM study area from project site but no any stream or tributary meet towards Ghataprabha River from project site therefore impact on River is Nill. KAPL have achieved ZLD but in case of accidental discharge of untreated trade effluent from KAPL finds its way to nalla in industrial vicinity on East direction as per the drainage pattern of premises & this nalla meets Pond on East direction at 7 KM from project site. It may lead to Pond contamination. This will be cause increase in TDS of water and impact colour to it. The distillery spentwash being highly polluting, due care shall be taken during storing of same on the site. Tanks shall be provided for spentwash storage. Both shall be of 5 days storage capacity for raw spentwash. In light of management proposed for storing and fully utilizing the spentwash for incineration, it shall not have any negative impact on surface water quality. Further, other effluent of proposed distillery, would not be significant.
147
B. Interpretations & Conclusion
Impacts were considered for worst case scenario (direct discharge of untreated wastewater into nearby nalla and Pond as the factory it is surrounded by agricultural farms and human settlements. A stream flows near factory site, ifr necessary care not be taken than there is a possibility of mixing effluents in it. If this happens, the proposed project may further aggravate pollution in the area. Discharge of the untreated wastewater from the industry in surrounding area can also cause significant environmental impact on the aquatic habitats and further affecting dependent biodiversity.
The increase in concentrations t h e parameters may exert negative impact on the aquatic biota and fresh water ecosystem. First of all, suspended particles increase turbidity which reduces light penetration thereby disrupting growth of photosynthetic plants and disturb the food chain. Nitrogen and phosphorus in wastewaters act as nutrients that help aggravating problems of 'Eutrophication' and algal dominance, organic matter in the effluent could reduce dissolved oxygen levels and cause fish kill due to depletion of DO levels, excessive presence of CO2 through respiration process in eutrophied water may lead to fall in pH which results in formation of weak acids and affects the pH sensitive reactions in the water body and benthic deposits, increase in ground water TDS levels could lead to salinity problems of soils, gastro enteric disorders, problems of urine stone etc. in humans, corrosion, pitting and similar problems with metallic objects due to salt deposition and scaling. Thus, Impact is significant if raw spentwash and untreated effluent is discharged in to nalla.
Non-point runoff of agro-chemicals used in the predominant sugarcane belt, washing of clothes and vehicles, dumping of solid wastes, and discharge of untreated domestic sewage from villages is polluting the water bodies in the area thus affecting littoral biota and dependent biodiversity. 4.3.3.2 Ground Water (Quality & Quantity)
The assessment of possible impact on hydrogeology of the area has two aspects namely, the availability and quality of groundwater. Such an assessment requires consideration of water requirement of the project and proposed plans of disposal of effluents in the light of existing hydro-geological set-up of the area.
1. Impact on Hydrogeology
The assessment of possible impact on hydrogeology of the area has two aspects namely, impacts on resources and quality of groundwater. Assessment of impacts on resources requires consideration of availability of water and water requirement of the project. Assessment of impact on quality of groundwater depends on generation of effluents and waste products and proposed plans of their disposal.
2. Impact on groundwater resources:
The fresh water requirement of the existing and proposed Molasses/Grain Based Distillery shall be taken from Ghataprabha river Accordingly, there is no proposal for use of ground water for the proposed project. Therefore, no adverse impact on groundwater resources of the area is foreseen.
148

3. Impact on quality of groundwater
The industrial effluents, solid wastes and hazardous wastes can have adverse impact on quality of groundwater in the area around the project site. The proposed method of disposal of these materials leaves lesser chances of such impacts. However, in case of accidental failure of such disposal measures the possibility of adverse impact cannot be ruled out.
4. Impacts on geology of the Area
Geologically, the project site and its area of influence is situated in Kaladgi . Sandstone is a hard, crystalline rock that serves as a good foundation stone as well as building stone for civil structures.
The project work does not involve any major excavations, blasting, loading and unloading of rock materials that can affect stability of natural landforms or geological set-up of the area.
Geological monuments or features of local, regional or national importance are not present in the area of influence of the project.
Therefore, impact on geology of the area is not foreseen in relation to this project.
4.3.3.3 Mitigation Measures
A) Surface Water Construction of KT weirs in the nalla stretch from Industry to Pond & putting baffles in KT
weir to control discharge subsequent to ingress of raw spentwash & untreated effluent in to the nalla so as to carry out flow obstruction.
Stopping / arresting untreated effluent entry to nalla by diverting flow through leaking pipe. Lifting the stored volume upstream the KT weir by portable pumps & sending it back to tank or discharging same on nearby farm land for irrigation.
Faster communication to people residing along the nalla about ingress of effluents in the streams followed by an appeal for not consuming the water for domestic purposes.
Online effluent monitoring system shall be installed at inlet and outlet of effluent treatment facility for measurement of parameters like flow, pH, BOD, COD, TDS etc.
Separate flow meter for spentwash as well as separate energy meter will be provided to CPU and log will be maintained for same.
Concepts of advanced mechanization and automation will be introduced in ETP so as to optimize power and chemical consumption as well as to minimize chances of reduced efficiencies due to human errors and non-efficient operation and maintenance practices.
Industry will not discharge any untreated / treated effluent in to any nearby surface water body.
B) Ground Water a. Mitigation measures on Hydrogeology
Leakages of leachate from spent wash lagoons and composting yards, and their infiltration
into soil / groundwater should be prevented to avoid coloration of groundwater in nearby wells.
Quality of water discharged from STP and ETP should be monitored regularly and the policy of Zero Liquid Discharge (ZLD) of process effluent to be properly adhered to.
Water quality in wells in the area around the Project Site should be monitored periodically to check for contamination as discussed in impacts above.
149
Rainwater harvesting measures to be implemented to replenish the groundwater resources. This will be helpful in reducing and removing the possible contamination mentioned in the impacts.
b. Mitigation Measures on Geology
Adverse impacts due to this project on geology of the area are not foreseen. On the contrary, the project infrastructure can be adversely affected by probable seismic
activity in the light of recent earthquakes in adjacent areas in Karnataka. Therefore, appropriate care should be taken to make the infrastructure earthquake-proof and safeguard the staff on duty in the premises.
Information on seismicity in the area should be updated regularly.
4.3.4 Impact on Soil and Agriculture
Prediction of impacts is the most important component in the Environmental Impact Assessment, studies. Several scientific techniques and methodologies are available to predict impacts of developmental activities on physical, ecological and socio-economic Environments. Such predictions are super imposed over the baseline (pre-project) status of environmental quality to derive the ultimate (post-project) scenario of environmental Conditions. The prediction of impacts helps to minimize the adverse impacts on Environmental quality, during pre and post project execution. Impact of any project on soil environment can be at different stages of project like constriction phase and operational phase. Causes of impact can be air (Flue gas), Water (effluents) and solids (Waste and hazardous material). Impact can be primary, secondary or tertiary. Impact can be positive or negative.
4.3.4.1 Construction phase
The project infrastructure (building & roads) will be constructed in the area which is located in the existing premises of KAIPL industries. As such removing the top soil there will be some impact on top soil, which should be kept separately and utilized for green belt development.
Dust would be generated during construction activity. Same shall be curbed by sprinkling water in premises. Also, during assembling the pre-fabricated structure of tank & column there may be emissions from welding activity. But same shall be negligible & temporary. Soils are shallow black soils did not differ significantly in properties as that of shallow soils in scarcity area. There would be no change in topography, land use or change in water body due to manufacturing activities in distillery. No agricultural land is being diverted for proposed activities. All construction site sewage would be recommended to dispose off through septic tank or soak pit. Generated municipal waste C&D, Hazardous Waste will be disposed off as per MSW rule 2016 & 2018. 4.3.4.2 Operational phase
Air Emissions: The major emission is particulate matter from the burning of Coal/Bagasse & Spent wash in boiler would be used as fuel. Nevertheless, DG set is used as power back. There could be impact on the nearby crop land due to the emission from the proposed project site. The impact could be due to falling of dust and particulate matter from the chimney. The impact due to emissions on the crop land could be on the crops within 5 km from the plant. Existing boiler are Husk/Bagasse & Spentwash is fuel used. Form proposed boiler APC will be provided in the form of ESP & Bag Filter. In the proposed project, solid waste generated during the entire process would be in the form Boiler ash, Yeast sludge and CPU sludge. Boiler ash would be given to brick manufacturers. Yeast sludge and CPU sludge would be burnt in incineration boiler.
150

To reduce the impact of air contamination due to PM 10/ 2.5 due to incinerator ESP & chimney height role plays very important role, nevertheless, green belt using APTI based local/native species.
Odour: Molasses are processed for ENA/ rectified spirit or alcohol of any grade generated through fermentation and consequence to bad or intolerable odour in surrounding factory. It can be mitigated through negative suction chamber /close room method. Close/ negative suction of processed ambient air will be released after de-odorizing chamber/oxidizer either electrical or using solar based systems. Sometimes Ozonization of such odorous gases in UV is also effective as mitigation measure. In surrounding IECRS recommended AROMA based plantation is suggested with application of FRii air neutralizer.
Effluent Impact:
The proposed disposal of raw spent wash from 180 KLPD distillery and other effluents from distilleries is not likely to have any adverse impact on quality of groundwater. However, caution should be exercised to avoid any accidental spillage of these hazardous materials on ground surface.
After expansion, Raw spentwash generated from molasses based distillery @1440 CMD. Same shall be concentrated in Multiple Effect Evaporator (MEE). The Concentrated Spent wash to the tune of 288 CMD shall be incinerated in incineration boiler.
Other effluents generated @1579CMD in the form of spent lees @ 288 CMD, condensate @ 1152 CMD, cooling, boiler blow down, lab-wash & DM backwash @ 142 CMD will be treated in proposed CPU. Treated water from CPU will be reused for industrial operations, thereby achieving Zero Liquid Discharge (ZLD) for process effluent. No discharges will impact the soil environment of the proposed project surrounding.
Leakages of leachate from spent wash lagoons and their infiltration into soil / groundwater should be prevented to avoid coloration or contamination of nearby soil/ ground environment as well as localized nitrate contamination due to domestic sewage from urban and rural settlements.
4.3.4.3 Mitigation Measures Ash will be handled and collected through dedicated and automatic mechanical system
followed by storage in separate silos. Ash shall be sprayed with water to avoid its suspension during all above processes. Finally, it shall be given to brick manufacturers for final disposal.
ZLD of spentwash from distillery will be achieved through concentration in MEE followed by incineration in boiler. Hence, effect of this wastewater discharges, on soil and agricultural will be nil.
Sprinkling of water during unloading of coal in storage yard. Construction of concrete or tar roads to avoid fugitive dust emissions. All belt conveyors, transfer points, hoods sealing with belt curtains & metal sheets. Dust collectors for hopper venting. Dust suppression in Bagasse stock yards Briquette would be recommended to avoid any PM raising in surrounding Laying of Concrete roads for vehicle movement
151

4.3.5 Impact of Solid and Hazardous Wastes Solid waste to be generated from the KAIPL project complex (incineration boiler ash &
CPU, Yeast sludge) if stored in haphazard and uncontrolled manner on site shall lead to littering and suspension of the particles in air due to strong wind currents causing problems of air pollution and aesthetics.
Improper utilization / disposal of ash would harm soil quality and fertility of the agriculture fields.
If the boiler ash storage and concentrated spentwash tank areas are not scientifically maintained (as per CPCB guidelines) then runoff, overflows, leakages and seepages from same may lead to soil, surface water & ground water contamination.
Yeast sludge from fermenters on inappropriate handling and storage conditions shall lead to formation of aerobic-anaerobic conditions in the tank thereby resulting in to uncontrolled release of gases comprising prominently of methane, hydrogen sulphide, sulphur dioxide and carbon di-oxide. Hydrogen sulphide imparts foul odour in the premises whereas SO2 lead to corrosive atmosphere. Moreover, inflammation of eyes, throat and respiratory track irritation are prominent effects observed in case of human being residing nearby the sludge storage / tank premises.
ETP & CPU sludge shall contain settled biological flocks from secondary treatment units (aeration tanks / reactors). As such they can undergo anaerobic decomposition resulting in to odour problem if not handled, stored and disposed off properly.
4.3.5.1 Mitigation Measures
Boiler ash shall be collected and stored separately. Ash quantities shall be handled and collected through dedicated and automatic mechanical systems followed by storage in silos. Ash shall be sprinkled / sprayed with water to avoid its suspension during all the above processes.
Bagasse ash shall be supplied to farmers as manure whereas the spent wash incineration boiler ash shall be given to brick manufacturers / cement industry.
Collection of yeast sludge from fermentation section in closed silo system, its dewatering (mechanical) and immediate disposal through burning in spentwash in incineration boiler.
CPU Sludge, Yeast sludge will be burnt in proposed incineration boiler.
Waste minimization techniques, as shown in following Table, are being followed at the Industry. Same practice shall be continued
Table 4.15 Waste Minimization Techniques
No. Station Pollutan
ts Preventive Measure Waste Management
Options Cost
Nature Type 1 Cane Yard Solid Cane trash &
dung Collect as early as possible Used as fuel to boiler Low
2 Bagasse Yard
Solid Bagasse Collect at the end of the season
Used as fuel to boiler Low
3 Milling Section
Liquid Oil & grease Collect in trays which can be easily lifted & stored in drum
Can be sold as low grade lubricants or burnt in boilers after mixing with Bagasse
Low
Liquid Floor Washings
Adopt dry cleaning, give proper slope to floors, improve collection system etc.
------ Low
152

No. Station Pollutan
ts Preventive Measure Waste Management
Options Cost
Nature Type Liquid Leakages &
Spillovers Use mechanical seals for all pump glands & alarms for overflow
Collect leakages & spillages in a pit and recycle into process
Low
Liquid Cooling waters Collect de super heater &mill bearing cooling water
Recycle Low
4 Cane Carrier
Solid Bagasse Use closed transfer system Cover drains so that Bagasse do not enter into drains
High
5 Lime Station
Semi -solid Lime solution Provide proper slope to drain
Allow it to mix with effluent
Low
6 Clarification &Vacuum Filters
Liquid Leakages from pumps, glands & pipes overflow
Install overflow alarms & provide mechanical seals
Recycle the cooling Waters Low
7 Boiler House
Liquid
Boiler blow Down
Maintain boiler condition & also feed water quality
Use it for irrigation along with other effluents
Low
Gaseous Stack emissions Adjust air fuel ratio for efficient combustion. Check the air pollution control equipment performance
Fly ash can be used as soil conditioner/ brick manufacturing
High
8 Crystallizer & Pan Boiling
Liquid
Leakages from pumps, Spillovers
Provide Mechanical seals wherever it is appropriate Recycle all cooling Water. Avoid overloading the Equipment
Recycle the cooling Waters Collect spillages & recycle in process
Low
9 Evaporator & Juice Heating
Liquid Sugar entrainment
Provide additional external catchers for the last body evaporators & all vacuum pans. Pump gland shall be provided with mechanical seals to prevent leakages
Recycle the water if there is no entrainment and in case there is entrainment use it for irrigation
High
10 Cleaning of Vessels, Boilers etc.,& Lab Washings
Liquid High BOD & COD, chemicals as Sulphamic Acid, lead
Provide standby units to have continuous operations. Store the effluent in a holding tank to avoid shock loads on ETP
Controlled loading in ETP from a storage Tank Segregate laboratory effluents and join to storage tank
High
11 Pressmud Solid Soil conditioner Immediate disposal Sold to outside parties. Low 12 Molasses Semi –
solid By-product Use only steel tanks Provide mixing & cooling
arrangements High
13 Fermenter Semi -solid
Yeast sludge No longer storage; immediately disposed off
Incinerated in proposed distillery boiler
Low
14 Distillation Column
Liquid Spentwash (High organic Effluent) Spent lees, MEE Condensate & other effluents.
Immediate disposal Appropriate Treatment
Concentration-Incineration Forwarded to CPU to be installed under proposed distillery
High
15 *Fugitive Emission
Gaseous Sugar Dust SO2 Dust collectors Scrubbers Recycle High
153

No. Station Pollutan
ts Preventive Measure Waste Management
Options Cost
Nature Type 16 Vibrating
& Heavy Machinery
Noise Sound Use silencer pads & closed rooms
Provide earplugs & earmuffs to workers & also change the work environment frequently
Low
17 ETP, CPUs Sludge Primary & secondary sludge
H.W. as per notification of 2010
To be incinerated in distillery spentwash incineration boiler.
Medium
18 Bagasse Solid Dust & Fire Provide proper Ventilation for storage and also stand posts in case of fire
Store it far away from the industry
Low
19 Odour Gaseous ETP, Molasses tank, Stale cane, bad mill sanitation, Bacterial growth in interconnecting pipes& unattended drains
Proper House Keeping, Better cane management to avoid staling of sugar
Sludge management in biological ETP units, Steaming of major pipe lines, Regular use of Bleaching powder in the drains, Efficient handling, prompt &proper disposal of Pressmud
Low
*Fugitive emissions are mainly sugar dust emanating from sugar graders. SO2 emissions are from Sulphur Burner. Chimney height should be above the roof level. If there are leakages, the SO2 gas may cause air pollution and hence, the provision for scrubbing of the SO2 shall be made.
4.3.6 Impact on Noise Levels Criteria on which noise impacts are analyzed depend upon people who are being affected. Broadly, there are two types viz. people who are working near source and people who stay near industry. People working near source need risk criteria for hearing damage while people who stay near industry need annoyance and psychological damage as criteria for noise level impact analysis. It is quite obvious that the acceptable noise level for latter case is less than the former case. So, the noise impact analysis can be of two types namely (1) Noise impact analysis on working environment; and (2) Noise impact analysis on community.
A) Noise Impact Analysis on Working Environment
For Noise Levels in the industrial unit, the potential noise generating sources are categorized under three major heads - noise from machinery, noise from sirens / work areas, noise from transportation. The total noise generated by operations of all equipment in the premises of all units in an Industrial Plant (from experience of existing unit) would be between 70 to 85 dB(A). Constant exposure to such level can result in damage to ear drums and loss of hearing, blood pressure levels, cardio-vascular disease and stress related heart problems among the workers. It may also disturb psychological condition of the workers. The actual resultant noise levels outside the factory will be much lesser in the ambient air after considering attenuation. Therefore, the impact of sugar factory, distillery and co-gen plant w.r.t. noise would be non-significant.
Noise levels in work environment are compared with the standards prescribed by Occupational Safety and Health Administration (OSHA-USA), which in turn were enforced by Government of India through model rules framed under Factories’ Act. These standards were established with the emphasis on reducing hearing loss.
154

Table 4.16 Permissible Exposure in Case of Continuous Noise
No. Total Time of Exposure
(continuous or a number of short term exposures) per Day, in hours
Sound Pressure dB (A)
Remarks
1 8.00 90 No exposures in excess of dB(A) are permitted.
2 6.00 92 For any period of exposure falling in between any figure and next higher or lower figure as indicated in column 2, permissible sound pressure level is to be determined by extrapolation on a proportionate scale.
3 4.00 95 4 3.00 97 5 2.00 100 6 1.50 102 7 1.00 105 8 0.75 107 9 0.50 110 10 0.25 115
B) Noise Impact Analysis on Community
Noise pattern from the source is computed with the help of following formula.
Noise Level at distance r2 = (Noise level at distance r1) - 20 log (r2/r1)
Noise levels get reduced considerably in the range of 20-30 % because of natural obstructions. Permissible noise levels, for different categories of area, as prescribed by MoEFCC are given in Table 4.17. Resultant noise levels at receptor in different areas/zones are envisaged to be within permissible limits. If noise levels exceed the limit, people who stay near the industry get disturbed due to reasons like annoyance and psychological reasons. Present ambient noise monitored at all villages in study area is within reasonable limits. Noise generated from an industry gets attenuated considerably because of natural barriers like walls, vegetation, houses etc. or gets deflected along the wind direction. Thus, it can be stated that noise impact due to the proposed expansion activities in KAIPL complex could be significant on working environment without control measures, while the noise impact on community would be negligible.
Table 4.17 Standards In Respect of Ambient Noise Levels
No. Category of Area Limits in dB (A), Leq
Day time(6 AM to 10 PM) Night time(10 PM to 6 AM) 1 Industrial area 75 70 2 Commercial area 65 55 3 Residential area 55 45 4 Silence zone (Hospitals,
Educational Institutes & Courts) 50 40
4.3.6.1 Mitigation Measures
1. Noise monitoring shall be done regularly in noise prone areas and within the industry where workers will get exposed.
2. Heavy duty muffler systems shall be employed for high noise generating equipment.
155

3. Proper oiling, lubrication and preventive maintenance will be carried out for machineries and equipment to reduce the noise generation.
4. PPE devices such as ear muffs, ear plugs, masks will be strictly enforced for the workers engaged in high noise prone zones.
5. For control of noise at source, steps will be taken like - enclosing machine, reducing vibrations in components by replacing metal parts with sound absorbing materials, isolating the work place containing noisy equipments, reducing height of fall bins, reinforcing sheet metal constructions by packets, reduce speed of conveyor belts, covering walls/ ceilings with sound absorbing materials, using sound absorbing screens, building sound proof control areas/ rest rooms etc. In short; insulation, isolation, separation techniques shall be implemented.
6. Green belt will be augmented which will play a vital role in noise attenuation thereby reducing noise intensity from the industry to surroundings.
7. During each shift of 8 hours duration, maximum permissible limits of 115 dB (A) will never be exceeded, in the work zone, even for a short duration.
4.3.7 Impact of Vibration
Vibration is not expected during industrial operation of KAIPL. Hence, there is no any vibration impact.
4.3.8 Impact on Land Use
Vegetation and drainage of any region are related to each other and reflect inter-locking or inter - connectivity between the same. Healthy vegetation shows well developed drainage pattern. Under KAIPL project, major land use is crop land that cover about 46 % area within the study area.
Impact on water bodies: There will not be any significant impact on the water bodies due to proposed expansion project.
Impact on Land use: There shall not be any significant impact on the landuse due to proposed expansion.
Impact on Eco-sensitive areas, wildlife and bird sanctuary: The study shows that the proposed site do not fall near to any wild life/ bird sanctuary, However, there could be impact on nearby forest where there can be threat to the animals/ birds living in forest.
Impact on Forest land: The forest land is within 10km from proposed unit. There could be impact on forest species and animals living in forest due to noise and
emissions emerging from proposed project.
Mitigation Measures
1. The treated or untreated effluent from the ETP of proposed plant should NOT be let into the nearby streams or on open land.
2. Appropriate mitigations measures (Air pollutions control equipments) should be provided by plant management to reduce the impact due to emissions.
3. Care should be taken by plant management, to reduce the emissions and also regarding discharge of effluent. Zero emission and zero discharge concept should be adopted by unit.
4. The plant management should take aproprate measure to control emissions and noise generating from the plant. They should not dump waste near to forest, the effluent from unit should not be discharged towards forest area. Plant management shall do more plantation work in the forest area.
156

4.3.9 Impact on Ecology and Bio-diversity
The adverse impacts were considered for worst case scenario as direct discharge of untreated wastewater into nearby streams and air pollution in the surrounding area. There is small water tank at West side of the factory, and a natural stream flowing near the factory site and probably it may carry leachate, industrial effluents through the agriculture belt and human settlements during crushing season. If not controlled the proposed project when fully operational may initiate additional pollution in the area. In case of discharge of untreated wastewater from the industry in surrounding area can cause adverse environmental impact on the aquatic habitats and its biodiversity. In case of air pollution, the aggravated SPM load will have potential negative impact particularly on avifauna, surrounding crops and local population. 4.3.9.1 Mitigation Measures
Therefore pollution control measures as per the CPCB rules should strictly be implemented. It needs to be ensured that hazardous effluents and wastes does not escape into neighboring habitats such as agriculture fields, horticulture, woodlands, and grasslands in the area through the streams, even if some may be seasonal, and more importantly in the ground water.
4.3.10 Impact on Socio Economic Status of Study Area Positive – Direct- Permanent or temporary job in factory as a worker/ officer, Indirect –
Hotel/Canteen for workers and outside visitors of industry, transportation which befits to private vehicle drivers. Sugar cane will be taken early, thus the rate will also be high as the sugar-cane will weigh higher. This will enable the farmer for earlier next plantation.
Negative – Traffic problems due to sugarcane transportation, the condition of roads will worsen and accidents can also take place. There will be change in traditional crop pattern, environmental pollution like Air, water, soil and noise are also likely to occur population may also experience pollution effects on land, water bodies, agriculture, human health and animal health.
4.3.10.1 Mitigation Measures Proper management of waste water from industry, Hazardous waste from industry and Air
pollution. The industry should contribute towards providing health facility under CER for locals at
least through a mobile health van. Employment should be given to the people from nearby villages considering the KAIPL’s
environmental impacts on their traditional livelihood and agricultural land. To provide radium strips/ flags to sugarcane transportation vehicles by industry to reduce
accidents on road.
4.3.11 Occupational Health and Safety Occupational health and safety is an important consideration under any industrial or developmental project. In KAIPL complex there are number of places like alcohol storage tanks, molasses storage tanks and operations where careful attention is required to be provided towards health and safety aspects. Further, certain ergonomic problems and lifting with wrong postures etc. may cause back-pain, spinal and joint pains. Also, handling of steam at very high pressure and temperature from co-gen and distillery boiler shall be another point of concern. Also, alcohol storage tanks in shall be major area of concern from risk and hazard involved is
157

bulk storage of ethanol. For more information on this topic, Chapter 7 on Hazard and Risk may be referred.
4.3.11.1 Mitigation Measures
Flame arrestors for ethanol storage tanks will be provided. Foam added fire extinguishers would be provided in case of spill & fire.
High pressure boilers to be installed shall be maintained and tested as per IBR standards. Plant would be fully automated and sufficient alarms and interlocks shall be provided to take care of any abnormal condition or variations.
Adequate portable fire-extinguishers shall be provided on site. Proper earthing arrangements shall be provided at Alcohol loading-unloading places. Workers shall be provided with PPEs like goggles, safety shoes, ear muffs etc. There is first aid & health centre with trained medical assistant available 24 hrs a day. Periodic medical examination of workers is carried out and the record is maintained. Emergency vehicle is available at the factory site for all 24 hrs.
4.3.12 Impact on Historical Places
There are no historical places in the study area. Hence, the impact is nil.
4.4 Evaluation of Impact
Evaluation of impacts on the environmental parameters due to existing &expansion of project is an important aspect to be studied. For evaluation of same, Battelle Environmental Evaluation System (BEES) is implemented. Description of BEES is as follows -
Level I : Categories, Level II : Components, Level III: Parameters, and Level IV: Measurements.
Each category (Level I) is divided into several components, each component (Level II) into several parameters, and each parameter (Level III) into one or more measurements. Environmental Evaluation System (EES) implied here identifies a total of four (4) categories, twenty (20) components and eighty eight (89) parameters.
BEES assessment for environmental impacts of activities under proposed activities by KAIPL is based on commensurate Environmental Impact Units (EIU). Two EIU scores are produced, one 'with' and other 'without' the proposed project. Difference between two scores is a measure of the environmental impact. Scores are based on magnitude and importance of specific impacts. In addition to EIU scores, the EES labels major adverse environmental impacts with a "red flag." These flags point to fragile elements of the environment for which more detailed studies are warranted. Table 4.18 shows a complete list of categories, components, and parameters of the Battelle EES. Column 1 shows the four (4) categories, Column 2 shows the twenty (20) components, and Column 3 shows the eighty eight (88) parameters. The EES methodology is based on assigning importance unit to each of parameters. Collectively, these "importance units" are referred to as "parameter importance units" or PIU's. Parameters have been assigned important weights by an interdisciplinary team of experts based
158

on the ranked-pair wise comparison techniques. A total of 1000 PIU's are distributed among the 88 parameters based on value judgments. Individual PIU's are shown in Column 4 of Table 4.18, the summation component PIU's are shown in Column 5, and the summation category PIU's are shown in Column 6. Effectively, for each parameter i, its (PIU)i represents a weight wi. Each PIUi or wi requires a specific quantitative measurement. Methodology converts different measurements into common units by means of a scalar or "value function." A scalar has specific measurement on x-axis and a common environmental quality scale or "value" on the y-axis. Latter varies in the range 0 ≤ Vi ≤ 1. A value of Vi = 0 indicates very poor quality, while Vi = 1 indicates very good quality. Values of Vi = Vi, 0 are obtained for conditions 'without' the project, and Vi = Vi, 1 for conditions 'with' the project. Condition 'without' project represents current condition, while that 'with' the project represents the predicted future condition.
Environmental impact EI is evaluated as follows:
EI = ∑ [ Vi,1wi ] - ∑ [ Vi,0wi ]
for i = 1 to n, where n = number of parameters (88).
For EI > 0, the situation 'with' the project is better than 'without' the project, indicating that project has positive environmental benefits. Conversely, for EI< 0, the situation 'with' the project is worse than 'without' the project, indicating that the project has negative environmental benefits, i.e. certain negative impacts. A large negative value of EI indicates the existence of substantial negative impacts.
Assigned weights or PIU's represent the relative importance of each parameter within the overall system. Once established, they should be kept constant; otherwise, the environmental impact assessment would be difficult to replicate.
Potential problem areas are represented by those parameters for which the Vi value changes significantly in the adverse direction, as measured by the following relation (in percent)-
ΔVi (%) = 100 (Vi,0 - Vi,1) / Vi, 0
These parameters are tagged with 'red flags' to indicate potential problems which may warrant more detailed attention. For parameters in the ecology category, a minor red flag applies when 5% < ΔVi < 10%; a major red flag when ΔVi> 10 %. In all other categories, a minor red flag applies when ΔVi< 30% whereas a major red flag when ΔVi ≥ 30%. EES can be applied for the evaluation of project impacts, to select specific alternatives, or during the planning process to minimize potential adverse impacts of proposed projects. In latter case, a feedback loop is used to continually modify the proposed project through successive iterations. Projects developed with the help of EES are expected not only to minimize environmental impacts, but also help improve selected portions of the environment. 4.5 ENVIRONMENTAL IMPACT EVALUATION FOR KAIPL
Environmental quality assessment for expansion project has been undertaken by evaluating relevant environmental parameters. These parameters represent the various components of environment namely-
1. Biological Environment 2. Environmental Pollution
Water
159

Air Soil Noise
3. Aesthetics 4. Human Interest
Functional relationship (value functions) has been developed for each of the selected parameter, resulting in parameter measurement with environmental quality.
Allocation of PIUs, among selected environmental parameters, represents a consequence of opinion of members of an interdisciplinary team of experts. Accordingly, major environmental categories i.e. biological environment, environmental pollution, aesthetics and human interests are allocated 240, 402, 158 and 200 PIUs respectively, out of total of 1,000 units. Exhaustive list of parameters and associated PIUs used for impact assessment of Distillery of KAIPL is presented. Though BEES is considered to be best available environmental evaluation technique, conflicting conclusions, among decision makers, could arise in the interpretation of evaluated results. Primary factors giving rise to such difference in opinion are at uncertainty and subjectivity in allocation of PIUs to different environmental parameters and uncertainty caused by the aggregation of individual parameter scores to yield final project score under different project impact scenarios. It is, therefore, necessary to take into account such variability and uncertainty while inferring the impact of a development project on surrounding environment.
Table 4.18 Existing Environmental Status in Study Area
No. Category Component Parameter Description 1
Bio
logi
cal
En
viro
nm
ent
Terrestrial Environment
Natural Vegetation
The common local trees, as reported by the respondents are Banyan, Peepal, Umbar, Tamarind, Drumstick, Babul, Neem, Jamun and Mango. For more details refer Chapter 3, Section 3.12.
Crops major crop grown in the area is sugarcane, jowar and wheat followed by, red gram and groundnut, along with diverse vegetables and chilli. In patchy homesteads and horticulture, species cultivated include Coconut, Guava, Sapodilla, Banana, Papaya and Custard Apple, depending on availability of water resource.
Species Diversity
A total of 34 bird species belonging to 11 orders, 23 families and 31 genera were recorded during the brief field survey. Out of these 23 species were common resident, 8 species were not common resident, 2 species were not common winter visitors and 1 species is common winter visitors.
Food Web Index
A diverse kind of habitats and dependent biodiversity is present in the area resulting in high food web index.
Rare & Endangered Species
i) Plant Species: During field visits some dominant local wild trees, exotic trees were observed.
ii) Animal Species: No endangered & rare species were observed during field survey.
Pest Species No major pest or parasitic species were observed in study area.
160

No. Category Component Parameter Description Aquatic Environment
Natural Vegetation
It includes no. of phytoplankton’s, zooplanktons & aquatic plant species are present in the water bodies of study area.
Species Diversity
In aquatic habitats common fish fauna from wetland resources comprised mainly cat fishes and local minor carps.
Food Web Index
River Ghatprabha is the main source of water in the study area which further become part of Almatti reservoir, a large wetland habitat for birds in the area. Other major aquatic habitats in the region are major tank at village Neerabudihal, small village tank at Katageri and some major streams.
2
En
viro
nm
enta
l P
ollu
tion
Water Major parameters, which represent the water environment; are BOD, TDS, COD and pH. Eight surface water bodies were monitored from the study area. Refer Chapter 3; Section 3.7.3.
Soil
Land Use Pattern
Total land use under study area is mainly divided into 6 classes. The details of classification are given in Chapter 3 (section 3.3.1)
Soil Chemistry Soil chemistry is moderate to good for agriculture. As NPK values of soils are inadequate at most of the places in study area, good crops cannot be grown without use of fertilizers.
Soil Erosion Very severe erosion and strong stoniness, associated with rock out crops due to very shallow, well drained & loamy soils on moderately Eastern slopes.
Air Overall quality of the ambient air is good with less impact of factors such as transportation, industrialization etc. in the study area. More details are presented in Chapter 3, Section 3.9.
Noise Noise levels in the study area are within the permissible limits. Equivalent noise levels during day time in residential area as well as rural area are observed to be within the permissible limits.
Vibration No vibration and allied impact creating activities (mining, heavy construction, infrastructure creation etc.) were noted in the study area.
3
Aes
thet
ics
Topographical
Character
Landscape Topography and landscape of the area is slightly undulating.
Green Cover In the study area, overall good vegetation cover is observed with diverse plant species.
Visual Quality of Air
Study area is in a remote region which is mostly undisturbed due to less anthropogenic activities. Quality of air in visual perspective was found good with clear visibility of about 1 Km or so in the afternoon during monitoring season of Oct-Nov-Dec 2020.
Visual Quality of Water
Overall water quality in surface water bodies was found good.
Sound No sound and allied impact creating activities were noted in the study area. Overall sound was found to
161

No. Category Component Parameter Description be satisfactory with noise levels within the NAAQS norms.
4
Hum
an
Inte
rest
Community Health
In study area it was observed that; there is good community health. For more details refer Chapter 3, Section 3.11.
Employment Main occupation of the people in the study area was farming & labour work.
Economy In the study area, most respondents belonged to the upper middle class category (IT department, 2018).
Transportation & Communication
In the study area, there is ST bus stand and private vehicles for the use of local transportation.
Education In the study area, high-school and higher secondary facilities are available.
Water Supply Households with piped water supply through Tube well – 45% Households using community hand pump - 55%For more details refer Chapter 3, Section 3.11.
Occupational Health
According to respondents there are Public Health Centers (PHC) in the villages functioning properly with availability of doctors in the village.
Table 4.19 Application of Battelle Environmental Evaluation System (BEES)
Categories Components
Parameters Parameter Importance Units (PIUs)
V i,0
Without
Project
Vi,1
With
Project
ΔVi WiΔVi
Parameter
PIUi\Wi
Component PIUs
Category PIUs
1 2 3 4 5 = Sum of
4
6 = Sum of
5
7 8 9= 8-7
10=9X4
Biological Environme
nt (Ecology)
Species &Populations (Terrestrial Flora, Terrestrial Fauna, Aquatic Biota)
1. Terrestrial browsers & grazers
20 140 240 0.7 0.7 0 0
2. Terrestrial crops (Farm land)
14 0.7 0.8 0.1 1.4
3. Terrestrial natural vegetation. (Grass, Flowers, Trees & Shrubs)
26 0.7 0.8 0.1 2.6
4. Terrestrial pest species 08 0.5 0.5 0 0 5. Terrestrial upland birds 20 0.8 0.8 0 0 6. Aquatic commercial
fisheries. 12 0.5 0.5 0 0
7. Aquatic natural vegetation 08 0.5 0.4 -0.1 -0.8 8. Aquatic pest species 08 0.5 0.5 0 0 9. Fish 10 0.6 0.5 -0.1 -1.0
10. Water fowl 14 0.5 0.5 0 0 Habitats
& Communit
ies
11. Terrestrial food web index
10 100 0.7 0.7 0 0
12. Land use 10 0.6 0.6 0 0 13. Terrestrial rare &
endangered species. 14 0.8 0.8 0 0
14. Terrestrial species diversity
14 0.8 0.8 0 0
15. Aquatic food web index 08 0.6 0.5 -0.1 -0.8
162

Categories Components
Parameters Parameter Importance Units (PIUs)
V i,0
Without
Project
Vi,1
With
Project
ΔVi WiΔVi
Parameter
PIUi\Wi
Component PIUs
Category PIUs
1 2 3 4 5 = Sum of
4
6 = Sum of
5
7 8 9= 8-7
10=9X4
16. Aquatic rare & endangered species
08 0.5 0.5 0 0
17. River characteristics 08 0.7 0.6 -0.1 -0.8 18. Aquatic species diversity 08 0.6 0.6 0 0 19. Habitat Removal, Contamination of Habitat
(Aquatic Biota)
10 0.7 0.6 -0.1 -1.0
20. Terrestrial Fauna -Fragmentation of Terrestrial Habitat,
10 0.6 0.5 -0.1 -1.0
Environmental
Pollution
Water 21. Basin hydrologic loss(alteration of hydraulic regime, alteration of surface runoff, alteration of aquifers)
18 318 402 0.6 0.5 -0.1 -1.8
22. BOD (Water Quality-WQ)
26 0.7 0.6 -0.1 -2.6
23. Dissolved Oxygen (WQ) 26 0.8 0.7 -0.1 -2.6 24. Fecal Coli-forms (WQ) 18 0.6 0.6 0.0 0 25. Carbon(WQ) 18 0.6 0.6 0 0 26. Nitrogen (WQ) 28 0.6 0.6 0 0 27. Phosphorus (WQ) 28 0.6 0.6 0 0 28. Pesticides (WQ) 18 0.3 0.3 0 0 29. pH(WQ) 36 0.9 0.9 0 0 30. Stream flow variation
(alteration of river, nalla, channel)
20 0.6 0.6 0 0
31. Temperature 34 1.0 1.0 0 0 32. TDS (WQ) 20 0.7 0.6 -0.1 -2.0 33. Toxic substances(WQ) 18 0.7 0.7 0 0 34. Turbidity (WQ) 10 0.6 0.5 -0.1 -1.0
Air 35. Carbon dioxide Air Quality (AQ)
10 46 0.8 0.7 -0.1 -1.0
36. Hydrocarbons (AQ) 04 0.8 0.8 0 0 37. Nitrogen oxides (AQ) 08 0.8 0.8 0 0 38. Particulate matter (AQ) 10 0.6 0.5 -0.1 -1 39. Photochemical oxidants
(AQ) 02 0.9 0.9 0 0
40. Sulfur dioxide (AQ) 10 0.6 0.5 -0.1 -1.0 41. Other (Climate) 02 1.0 1.0 0 0
Land (Soil)
42. Land use 10 32 0.7 0.8 0.1 1.0 43. Soil erosion 12 0.6 0.7 0.1 1.2 44. Soil Contamination 04 0.8 0.8 0 0 45. Soil Quality 06 0.7 0.7 0 0
Noise 46. Noise 06 06 0.8 0.7 -0.1 -0.6 Aesthetics
Cultural Land
47. Surface material 10 32 158
0.8 0.8 0 0 48. Relief & topographic
character 14 1.0 1.0 0 0
49. Width & alignment 08 0.8 0.8 0 0
163

Categories Components
Parameters Parameter Importance Units (PIUs)
V i,0
Without
Project
Vi,1
With
Project
ΔVi WiΔVi
Parameter
PIUi\Wi
Component PIUs
Category PIUs
1 2 3 4 5 = Sum of
4
6 = Sum of
5
7 8 9= 8-7
10=9X4
Air 50. Odor and visual 03 05 0.7 0.6 -0.1 -0.3 51. Sounds 02 0.8 0.8 0 0
Water 52. Appearance 16 62 0.9 0.9 0 0 53. Land and water interface 16 0.9 0.9 0 0 54. Odour and floating
materials 10 0.8 0.8 0 0
55. Water surface area 10 1.0 1.0 0 0 56. Wooded and geologic
shoreline 10 0.8 0.8 0 0
Biota 57. Animals- domestic 02 30 0.6 0.6 0 0 58. Animals – wild 10 0.8 0.8 0 0 59. Diversity of vegetation
types 10 0.8 0.8 0 0
60. Variety within vegetation types
08 0.7 0.8 0.1 0.8
Manmade Objects
61. Manmade objects 09 09 0.7 0.7 0 0
Composition
62. Composite effect 10 20 0.7 0.7 0 0 63. Unique composition 10 0.9 0.9 0 0
Human Interest (Social,
Cultural)
Educational /
Scientific Packages
64. Archaeological 04 48 200 0.7 0.7 0 0 65. Training in new
technologies& skill development
16 0.5 0.7 0.2 3.2
66. Ecological Effects on crops, Reduction
of farm land
06 0.8 0.8 0 0
67. Geological 10 0.8 0.8 0 0 68. Hydrological 14 0.7 0.8 0.1 1.4
Historical Packages
(Infrastructure and services)
69. Architecture and styles 04 50 0.8 0.8 0 0 70. Conflicts with projects of
urban commercial or industrial development
08 0.9 0.9 0 0
71. Events Recreation 10 0.9 0.9 0 0 72. Persons 10 0.9 0.9 0 0 73. Religions & Cultures 10 0.9 0.9 0 0 74. Western frontier 08 0.9 0.9 0 0
Cultures 75. Indians 10 20 0.9 0.9 0 0 76. Other ethnic groups 05 0.9 0.9 0 0 77. Religious groups 05 0.9 0.9 0 0
Mood/Atmosphere
78. Awe-Inspiration 06 28 1.0 1.0 0 0 79. Isolation solitude 08 1.0 1.0 0 0 80. Mystery 04 1.0 1.0 0 0 81. Oneness with nature 10 1.0 1.0 0 0
Security and Safety
82. Increase in crime & accidents caused
05 05 0.7 0.7 0 0
Health 83. Temporary acute & chronic
05 05 0.7 0.7 0 0
Life Patterns
84. Employment opportunities
20 42 0.5 0.8 0.3 6.0
164

Categories Components
Parameters Parameter Importance Units (PIUs)
V i,0
Without
Project
Vi,1
With
Project
ΔVi WiΔVi
Parameter
PIUi\Wi
Component PIUs
Category PIUs
1 2 3 4 5 = Sum of
4
6 = Sum of
5
7 8 9= 8-7
10=9X4
(Econo- my)
(Creation of new economic activities, generation of Temporary & Permanent Jobs)
85. Income for state & private sector.
14 0.5 0.7 0.2 2.8
86. Saving for consumers and private consumers, Savings in foreign currency for the state.
02 0.6 0.6 0 0
87. Housing. (Commercial value of properties,
Electricity tariff)
06 0.6 0.7 0.1 0.6
88. Social interactions (Conflict due to negotiations
& / or compensation payments, Political conflicts, Demonstration and Social Conflicts.
02 0.6 0.6 0 0
The Battelle EES Environmental Impact Analysis Cumulative Index Ei +1.7
Table 4.20 Identification of RED Flags to the Potential Problem Areas in BEES
No. PIUsWi V i,0
Without Project V i,1
With Project ΔVi ΔVi, r # Red Flag
1 2 3 4 5 =4-3 6=5/3 X 100
7
7. Aquatic natural vegetation 08 0.5 0.4 -0.1 20 Major
9. Fish 10 0.5 -0.1 -1.0 20 Major 15. Aquatic food web index 08 0.6 0.5 -0.1 16.6 Major 17. River characteristics 08 0.7 0.6 -0.1 14.28 Minor 19. Habitat Removal, Contamination of Habitat (Aquatic Biota)
10 0.7 0.6 -0.1 14.28 Major
20. Terrestrial Fauna -Fragmentation of Terrestrial Habitat,
10 0.6 0.5 -0.1 16.6 Major
21. Basin Hydrologic Loss 18 0.6 0.5 -0.1 16.6 Minor 22. BOD 26 0.7 0.6 -0.1 14.28 Minor 23. DO 26 0.8 0.7 -0.1 12.5 Minor 32. TDS(WQ) 20 0.7 0.6 -0.1 14.28 Minor 34. Turbidity (WQ) 10 0.6 0.5 -0.1 16.6 Minor 35. CO2 10 0.8 0.7 -0.1 12.5 Minor 38. Particulate Matter 10 0.6 0.5 -0.1 16.6 Minor 40.SO2 10 0.6 0.5 -0.1 16.6 Minor 46. Noise 06 0.8 0.7 -0.1 12.5 Minor 50.Odor&Visual 03 0.7 0.6 -0.1 14.28 Minor
# - In the Battelle EES, the potential problem areas are represented by those parameters for which the Vi value changes significantly in the adverse direction, as measured by the following relation (negative values, in percent) - ΔVi, r = 100 [V i,1 -
V i,0] / V i,0.
165

These parameters are tagged with 'red flags' to indicate potential problems which may warrant more detailed attention. For parameters in the ecology category, a minor red flag applies when 5% <ΔVi,r ≤ 10%, and a major red flag when ΔVi,r> 10 %. In all other categories, a minor red flag applies when ΔVi,r ≤ 30% or ΔVi ≤ 0.1, and a major red flag when ΔVi,r> 30% or ΔVi> 0.1.
Table 4.21 The Mitigation Measures
No. Parameters Mitigation Measures 1 Aquatic natural vegetation, Fish
&Aquatic food web index Mitigation Measures are described in section 4.3.3. Further, details of MEE, ETP & CPU are given in chapter 2. Section. 2.7.1.
2 Habitat Removal, Contamination of Habitat (Aquatic Biota)
Mitigation Measures are described in section 4.3.3.
3 Terrestrial Fauna -Fragmentation of Terrestrial Habitat,
Mitigation Measures to suppress the impact on ecology and bio-diversity are described in section 4.3.9. Detailed report w.r.t. EB is given in chapter 3, section 3.12
4 Basin Hydrologic Loss Mitigation Measures w.r.t water quality are described in section 4.3.3.Also, water budget & water adequacy details are provided in chapter 2, section.2.7
5 BOD& DO Mitigation Measures are described in section 4.3.3. Refer water monitoring reports in chapter 3 section 3.9 for exiting condition of water in study area
6 Fecal Coli-forms (WQ) Mitigation Measures are described in section 4.3.3. Refer water monitoring reports in chapter 3 section.3.9 for exiting condition of water in study area
7 TDS(WQ) Mitigation Measures are described in section 4.3.3. Refer water monitoring reports in chapter 3 section. for exiting condition of water in study area.
8 CO2 Mitigation Measures are described in section 4.3.1. Refer ambient air monitoring reports in chapter 3 section 3.9 for exiting condition of air in study area.
9 Particulate Matter Mitigation Measures are described in section 4.3.1. Refer ambient air monitoring reports in chapter 3 section 3.9 for exiting condition of air in study area
10 SO2 Mitigation Measures are described in section 4.3.1. Refer ambient air monitoring reports in chapter 3 section... for exiting condition of air in study area
11 Noise Mitigation Measures are described in section 4.3.6. Also noise level monitoring report is given in chapter 3 section 3.10
12 Odour and Visual Mitigation Measures are described in section 4.3.1. 13 Animals – wild Mitigation Measures to suppress the impact on ecology and bio-diversity are described
in section 4.3.9. Detailed report w.r.t. EB is given in chapter 3, section 3.12
4.6 IMPACTS DUE TO DECOMMISSIONING ACTIVITY
4.6.1 Decommissioning Phase
"Decommissioning" is a procedure to make an equipment or manufacturing setup unfit for its reuse for its designed function. This could be done by cutting project components into small pieces, demolition of buildings, disconnecting circuits and removing of all infrastructures set up thereby making it unusable.
Table 4.22 Identification of Impacts due to Decommissioning of KAIPL
No Env. Aspect Activities /Operation Impact Identification Measures 1 Land Use Dismantling and
decommissioning of industrial set up.
Land will be barren and vacant after decommissioning
Existing project being agro-based, post decommissioning use would be residential or agriculture.
--
2 Air Cutting, demolition and dismantling operations.
Transportation.
Release of fumes of acid/ alkali during washing
Fugitive dust during demolition of building & transportation.
Water sprinkling to suppress dust during demolition work.
166

No Env. Aspect Activities /Operation Impact Identification Measures 3 Water Washing of
manufacturing equipment, pipelines, fermenters, distillation infrastructure, tanks etc. during detoxification
Washing discharges getting access into nearby nallah under uncontrolled operational conditions.
Washing discharges to CPU; treatment & disposal through same outside industrial premises after achieving specified standards. Demolition of CPU, STP will be last activity.
4 Solid Waste & Hazardous Waste
Cutting wastes, scrap, demolition wastes etc.
Oils and lubricants removed from equipment
Littering of wastes Bad aesthetics
Solid wastes generated would be sold to authorized re-processor. Demolition waste to land fill.
5 Noise Cutting and drilling activities during decommissioning
Dismantling of heavy machinery & equipment, fermenters, distillation column, boilers etc.
Increase in noise levels during decommissioning.
PPEs to manpower involved in decommissioning and safety measures to will be followed.
6 Risk & Hazard
Dismantling & decommissioning of equipments & buildings.
Accidents, spillage of molasses, alcohols, spentwash etc., and storage tanks detoxification, storage tanks dismantling.
Use of PPEs, expert and experienced supervision, due follow up of safety norms & procedures
167

168
Chapter 5 Analysis of Alternatives
5.1 INTRODUCTION
While preparation of EIA report it is necessary that one should consider project alternatives and their relative potential impact on the environment. Selection of alternative is thus more critical in an industrial development where time, money, environment and natural resources are at stake. Hence, selection of alternative must be both - practical and rational, taking into consideration the constraint of the proposed project.
5.2 ANALYSIS OF ALTERNATIVE SITES
Proposed expansion of 65 KLPD to 180 KLPD Grain / Molasses based Distillery will be implemented within existing KAIPL complex. Industry has sufficient space for expansion and hence no any alternative site was considered for proposed expansion.
5.3 ALTERNATIVE TECHNOLOGIES
5.3.1 Distillery
5.3.1.1 Fermentation Process
Manufacture of alcohol basically involves fermentation of substrate containing sugar material such molasses. Fermentation processes are classified as batch and continuous. Conventional fermentation process employed for production of RS involves the batch process with 3 to 5 fermenters in series. Fermentation is carried out with 15 to 20% solid content in the solution. Process generates 12 to 15 liters of spent wash per liter of RS and 220-230 liter RS per ton of molasses. Process was subsequently improved by employing continuous fermentation with one or more fermenters in series and recycle of spent yeast. This has the advantage 250-270 litters RS production per ton of molasses and 8-10 liter of spent wash generation per liter of RS Continuous fermentation has reduced fermentation period to less than 36 hours. The spent wash generation can be further reduced to 6 to 8 liters by incorporation of re-boilers in distillation columns
5.3.1.2 Distillation Process
Fermented wash is distilled through a number of distillation columns and the alcohol present in it is separated. The distillation is carried out under vacuum and at different pressures. As such the process is named 'Multi-pressure Vacuum Distillation'. Due to this, steam and power consumption in the process have considerably reduced. Following are the advantages of Multi-pressure Vacuum Distillation –
The analyzer column operates under vacuum due to which formation of by-products such as acetyl gets minimized thereby improving quality of finished product i.e. alcohol.
Analyzer column with Hyper – state trays ensure high turbulence on tray, this minimizes chances of scaling. Also, this special construction of trays and access to each tray helps in easier maintenance of column internals.
Pre-Rectification column ensures proper removal of Sulphur compounds / mercaptans for ensuring a good odour to alcohol. This column also reduces the load of lower boiling volatile compounds passing on to rectifier cum exhaust column.
Vacuum distillation system requires low steam consumption i.e. 1.8 kg/lit. of total alcohol of EQRS quality as against 2.0–2.2 kg/lit of total alcohol of normal quality in atmospheric distillation.
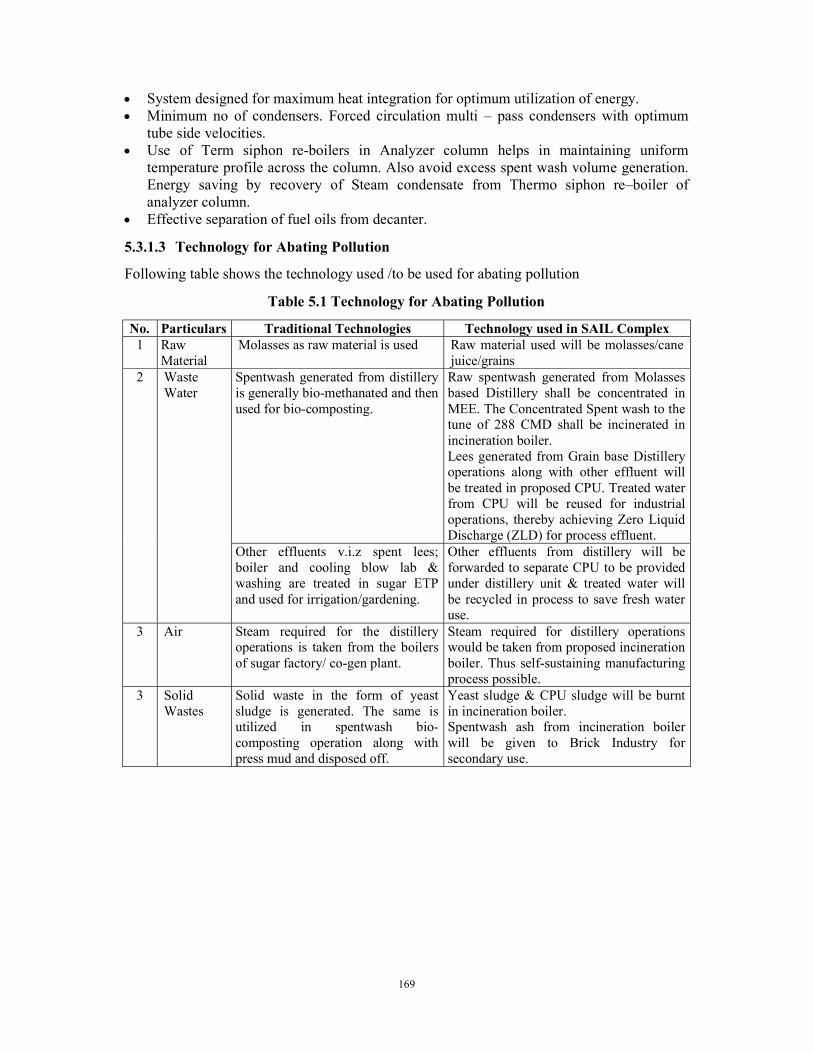
169
System designed for maximum heat integration for optimum utilization of energy. Minimum no of condensers. Forced circulation multi – pass condensers with optimum
tube side velocities. Use of Term siphon re-boilers in Analyzer column helps in maintaining uniform
temperature profile across the column. Also avoid excess spent wash volume generation. Energy saving by recovery of Steam condensate from Thermo siphon re–boiler of analyzer column.
Effective separation of fuel oils from decanter.
5.3.1.3 Technology for Abating Pollution
Following table shows the technology used /to be used for abating pollution
Table 5.1 Technology for Abating Pollution
No. Particulars Traditional Technologies Technology used in SAIL Complex 1 Raw
Material Molasses as raw material is used Raw material used will be molasses/cane
juice/grains 2 Waste
Water Spentwash generated from distillery is generally bio-methanated and then used for bio-composting.
Raw spentwash generated from Molasses based Distillery shall be concentrated in MEE. The Concentrated Spent wash to the tune of 288 CMD shall be incinerated in incineration boiler. Lees generated from Grain base Distillery operations along with other effluent will be treated in proposed CPU. Treated water from CPU will be reused for industrial operations, thereby achieving Zero Liquid Discharge (ZLD) for process effluent.
Other effluents v.i.z spent lees; boiler and cooling blow lab & washing are treated in sugar ETP and used for irrigation/gardening.
Other effluents from distillery will be forwarded to separate CPU to be provided under distillery unit & treated water will be recycled in process to save fresh water use.
3 Air Steam required for the distillery operations is taken from the boilers of sugar factory/ co-gen plant.
Steam required for distillery operations would be taken from proposed incineration boiler. Thus self-sustaining manufacturing process possible.
3 Solid Wastes
Solid waste in the form of yeast sludge is generated. The same is utilized in spentwash bio-composting operation along with press mud and disposed off.
Yeast sludge & CPU sludge will be burnt in incineration boiler. Spentwash ash from incineration boiler will be given to Brick Industry for secondary use.

Chapter 6 Environmental Monitoring Program
6.1 INTRODUCTION
With the knowledge of baseline conditions, and impacts predicted in Chapter - 4 the monitoring programme will serve as an indicator for any deterioration in environmental conditions due to operation of the project. This will enable in taking up suitable steps, in time, to safeguard the environment. Monitoring is an important tool for control of pollution since the efficiency of control measures can only be determined by monitoring. In KAIPL project, monitoring of various environmental parameters is being carried out on a regular basis for existing unit. After proposed expansion same would be continued to ascertain the following: State of pollution within the plant and in its vicinity; Examine the efficiency of pollution control systems installed in the plant; Generate data for predictive or corrective purpose in respect of pollution; To assess environmental impacts To identify the trends with time in the levels of parameters. To ensure that new parameters, other than those identified in the impact assessment study,
do not become critical through the commissioning of proposed expansion project.
Details of monitoring program during construction, post construction and operational phase are as follows-
6.2 MONITORING PROGRAM DURING CONSTRUCTION PHASE
As discussed in Chapter - 4, impact during construction phase shall not be permanent and certain minor impacts are predicted on air, water, soil and human health due to dust emission and noise during transportation and construction activity. Hence, need to conduct monitoring during construction phase was ruled out. However, necessary mitigation for impacts during this phase is suggested under Chapter-4.
6.3 MONITORING DURING POST CONSTRUCTION / OPERATIONAL PHASE
During operational stage, air emissions in form of Stack, Process, Fugitive, etc are expected. They shall be from boilers, wastewater disposal, non-hazardous waste such as ash, chemicals used in processing, used oily wastes. Attributes which require regular monitoring based on environmental setting and natures of project activities are listed below:
Source emissions and ambient air quality; Groundwater Levels and ground water quality; Water and wastewater quality (water, effluent & sewage); Solid and hazardous waste characterization (fly ash, bottom ash, oily wastes, ETP, CPU
yeast sludge, used and waste oil); Soil quality; Noise levels (equipment and machinery noise levels, occupational exposures and ambient
noise levels) Ecological preservation and afforestation.
170

6.3.1 Air Pollution Management
Apart from ambient air and source monitoring during operation stage following recommendations are also suggested -
APC equipment to be interlocked with process, so that in case of its failure, production process connected to it shall be stopped.
If stack emissions exceed the standards, corresponding units of plant which are contributing to excessive pollutant load are stopped till quantity of pollutant discharged from those units are brought down to the required level.
In case of power failure, alternate electric source would be provided which would be sufficient to operate APC equipment continuously
Under no circumstances, emissions shall exceed limits mentioned in EC/ consent order. Online monitoring system is installed under existing project. Same will be operated after
expansion also. IP cameras shall be installed, maintained and data collected shall be formulated to CPCB
server.
6.3.2 Water Management
After expansion water requirement for Molasses based Distillery project would be 2218M3/D and for Grain based Distillery 2104 M3/D. For detail water requirement of KAIPL project complex is presented at Chapter - 2, Section 2.7.1 and for effluent generated refer Section 2.7.1.2 Proper treatment is given to effluent as per CREP guidelines.
Industry shall observe that effluent collection, disposal and treatment facilities always remain in a good shape so as to achieve desired efficiencies.
Flow meters will be installed at inlet and outlet of MEE and CPU. Online monitoring system will be provided to inlet and outlet of CPU.
Cameras would be installed as per the guidelines of CPCB. Spentwash storage lagoon shall be lined to avoid percolation of leachate. No untreated industrial effluent will be disposed off on land or in surface water body. Pipeline and storage tanks meant for effluent conveyance shall be checked periodically for
leakages. Leakage, if any, will harm surrounding soil and water environment significantly. HDPE & stainless steel could be used as pipeline and valves material respectively.
Compliance towards CREP norms shall be strictly followed under KAIPL complex. Pumps in CPU shall be supplied with alternate electric supply source in case of power
failure.
6.3.3 Noise Level Management
Mitigation measures for noise levels are mentioned in Chapter 2. Moreover, people working in close vicinity of the high noise generating equipments would be provided with PPE such as ear plugs, ear muffs etc.
Industry would take care while procuring major noise generating machines/ equipments to ensure that manufacturers have taken adequate measures to minimize generation of noise.
Distance between source and receiver would be increased and relative orientation of source and receiver would be altered.
Thick bushy trees would be planted in and around the industrial area to intercept noise transmission to nearby villages.
171
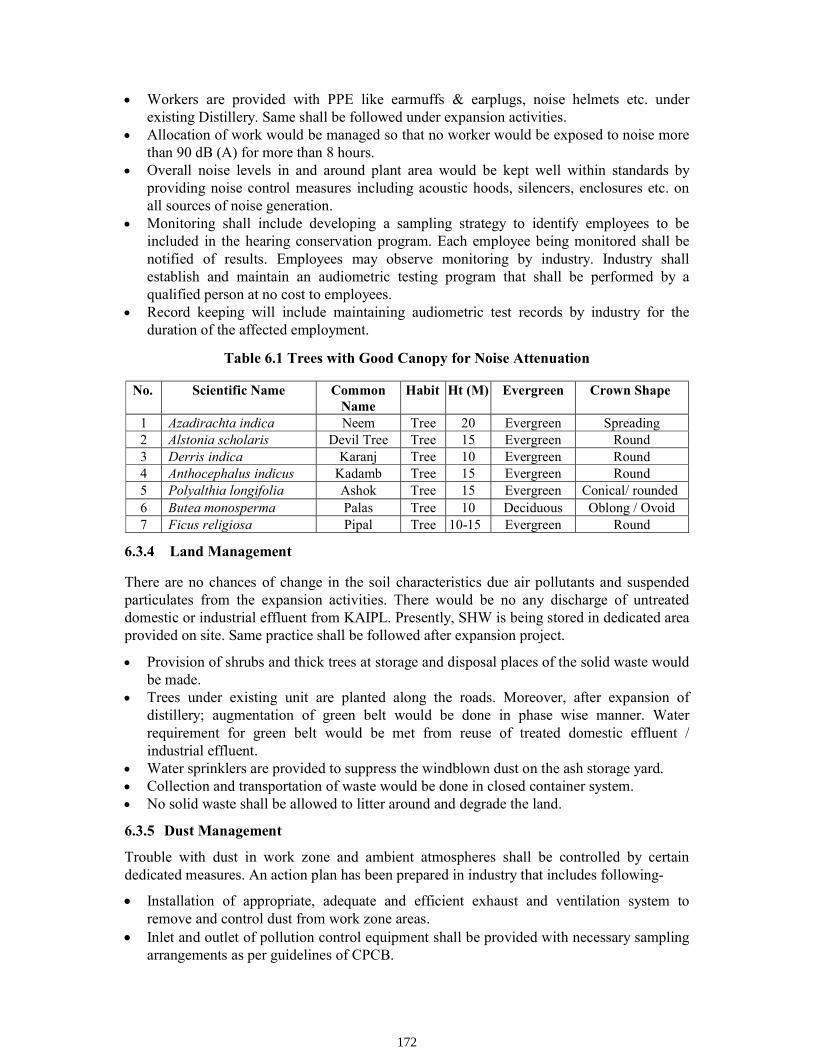
Workers are provided with PPE like earmuffs & earplugs, noise helmets etc. under existing Distillery. Same shall be followed under expansion activities.
Allocation of work would be managed so that no worker would be exposed to noise more than 90 dB (A) for more than 8 hours.
Overall noise levels in and around plant area would be kept well within standards by providing noise control measures including acoustic hoods, silencers, enclosures etc. on all sources of noise generation.
Monitoring shall include developing a sampling strategy to identify employees to be included in the hearing conservation program. Each employee being monitored shall be notified of results. Employees may observe monitoring by industry. Industry shall establish and maintain an audiometric testing program that shall be performed by a qualified person at no cost to employees.
Record keeping will include maintaining audiometric test records by industry for the duration of the affected employment.
Table 6.1 Trees with Good Canopy for Noise Attenuation
No. Scientific Name Common Name
Habit Ht (M) Evergreen Crown Shape
1 Azadirachta indica Neem Tree 20 Evergreen Spreading 2 Alstonia scholaris Devil Tree Tree 15 Evergreen Round 3 Derris indica Karanj Tree 10 Evergreen Round 4 Anthocephalus indicus Kadamb Tree 15 Evergreen Round 5 Polyalthia longifolia Ashok Tree 15 Evergreen Conical/ rounded 6 Butea monosperma Palas Tree 10 Deciduous Oblong / Ovoid 7 Ficus religiosa Pipal Tree 10-15 Evergreen Round
6.3.4 Land Management
There are no chances of change in the soil characteristics due air pollutants and suspended particulates from the expansion activities. There would be no any discharge of untreated domestic or industrial effluent from KAIPL. Presently, SHW is being stored in dedicated area provided on site. Same practice shall be followed after expansion project.
Provision of shrubs and thick trees at storage and disposal places of the solid waste would be made.
Trees under existing unit are planted along the roads. Moreover, after expansion of distillery; augmentation of green belt would be done in phase wise manner. Water requirement for green belt would be met from reuse of treated domestic effluent / industrial effluent.
Water sprinklers are provided to suppress the windblown dust on the ash storage yard. Collection and transportation of waste would be done in closed container system. No solid waste shall be allowed to litter around and degrade the land.
6.3.5 Dust Management
Trouble with dust in work zone and ambient atmospheres shall be controlled by certain dedicated measures. An action plan has been prepared in industry that includes following-
Installation of appropriate, adequate and efficient exhaust and ventilation system to remove and control dust from work zone areas.
Inlet and outlet of pollution control equipment shall be provided with necessary sampling arrangements as per guidelines of CPCB.
172

Dust collected from the APC equipment e.g. fly ash from boilers will be properly handled and disposed off by supply to farmers for use as manure.
APC equipment is interlocked with process as per the guidelines of CPCB. PPE such as masks, aprons, gloves, goggles etc. shall be provided to workers. Augmentation of green belt of adequate density and type shall be made to control and
attenuate dust transfer in premises. Provision of properly surfaced internal roads and work premises (tarred and concrete)
shall be made to curb dust generation and its suspension due to vehicular movement.
6.3.6 Odour Management
There are different odour sources in a distillery, which include molasses handling and storage, fermentation and distillation, secondary effluent treatment, and storage of effluents etc. To abate the odour nuisance, industry has a concrete planning which includes following steps and actions-
It is proposed to provide covered fermentation and tapping of CO2 gas. Collection of waste yeast sludge from fermentation section in a closed system and its
immediate and proper disposal. Reduced volume of effluents (spentwash, spent leese) by adopting strategic approaches
such as use of the effluents back in process under Reduce-Reuse-Recycle planning. Closed drains carrying spentwash to the treatment units, minimization of fugitive
emissions from treatment units. Proper collection & handling of excess sludge generated from the aerobic treatment units. Minimum retention of raw / concentrated spentwash in the storage lagoons. Adoption of GMPs (Good management practices). Use of mill sanitation biocides to minimize growth of aerobic/ anaerobic micro
organisms. Regular use of bleaching powder in the drains Arranging awareness and training camps for workers. Steaming of major pipe lines, Use of PPE like masks by everybody associated with odour potential prone areas.
6.3.7 Operation Control & Equipment Maintenance
All equipments and machinery used shall be maintained properly and should be kept clean. For expansion of existing distillery, acid dosing equipments used in fermentation processes would be checked regularly to prevent any leakages. Fermenters should be maintained properly and should be kept clean to avoid any contamination that would affect the quality of alcohol.
Quality of stack emission depends very much on operating parameters of plant. Improper combustion of fuel in boilers increases unburnt carbon particles in exhaust flue gases therefore proper maintenance is an important factor. Lubricants used for various equipment and fuel-handling areas would contribute to pollution aspect. It would be taken care of, at source, by looking after possible spillage, drippings, leakage etc. in plant.
6.3.8 Occupational Health & Safety Measures
Following measures are been taken up by existing unit –
As per requirement of Factory Act, there is provision of Occupational Health Centre. There under, a qualified visiting doctor has been appointed.
173

Regular medical checkup of employees is carried out and records are maintained. An ambulance is provided on site 24 x 7 to deal with emergencies if any. Workmen Compensation Policy as well as Mediclaim Health Policy has been done for all
workers (temporary and permanent) in industry and which is renewed every year.
Following measures shall be taken under proposed expansion activity - The infrastructure of existing Occupational Health Centre shall be enhanced in order to
provide medical facilities to all the workers as well as nearby village/town people. An ambulance shall be available all the time i.e. 24 x 7 will be used. Regular medical check-up of newly employed workers under expansion shall also be done
and record shall be maintained. Provision of Workmen Compensation Policy as well as Mediclaim Health Policy shall be
done for workers under expansion (temporary & permanent) & shall be renewed yearly. Display of sign boards in hazard areas in local language. Provision of PPE to all workers.
Table 6.2 Health Care Facility Equipment
No. Instrument Use 1 Stethoscope Used to hear sounds from movements within the body,
like heart beats, intestinal movement, breath sounds, etc. 2 Reflex testing hammer
(padded) To test motor reflexes of the body
3 Sphygmomanometer (Blood pressure meter)
To record the patient's blood pressure
4 A thin beam electric torch To see into the eye, body's natural orifices, etc., and to test for papillary light reflex, etc.
5 A watch / stopwatch Used in recording rates like heart rate, respiratory rate, etc.; for certain tests of hearing
6 A measuring tape For size measurements 7 A weighing machine To record the weight 8 Tuning forks To test for deafness and to categorize it 9 Kidney dish As a tray for instruments, gauze, tissue, etc.
10 Thermometer To record the body temperature 11 Gas cylinders Supply of oxygen, nitrous oxide, carbon dioxide, etc. 12 Oxygen mask or tubes Delivering gases up to the nostrils to assist in oxygen intake or
to administer aerosolized or gaseous drugs 13 Vaporizer To produce vapours 14 Instrument sterilizers Used to sterilize instruments in absence of autoclave 15 Dressing drums Storage of gowns, cotton, linen, etc. 16 Syringe of different sizes &
needles For injections & aspiration of blood or fluid from body
17 Otoscope To look into the external ear cavity
6.3.9 Measures for Socio-Economic Development
6.3.9.1 Better Employment Opportunities
In order to run existing project, 197 unskilled and skilled workers are employed. Local persons shall be given preference while appointing the employees.
174

6.3.9.2 Corporate Environmental Responsibility (CER) Plan
Planning for CER shall be started with the identification of the activities/projects and may be undertaken in the periphery of Industrial area.
CER action plan shall be prepared based the project based accountability approach, integrated with social and environmental concerns related to business of integrated project complex.
Selection of activities under CER shall be made to ensure that the benefits reach smallest unit i.e. village, panchayat, block or district. CER planning shall be done for long-term sustainable approach.
Long term CER plan shall be broken down into medium term and short term plans.
Implementation
Time - Frame and periodic milestones would be finalized at the outset. CER activities would help in building a positive image of the company in the public
perception. CER projects may be closely linked with the principles of sustainable development.
6.3.10 Proposed CER Plan by KAIPL
No CSR Activities Rs. Lakh 1 Arrangement of Drinking Water Supply Infrastructure: Total 10 Nos. of Safe
Drinking Water Units with Filtration, RO Module & Storage Tank, Piping, Electrical Control Panel etc. with dispensing & metering systems. Capacity of 500 Lit/Hr each. 25 Nos. X Rs. 2.50 Lakhs / No = Rs. 62.5 Lakh
62.50
2 Solar Photovoltaic Electricity Generation Systems: Provision of Solar Photovoltaic Electricity Generation Systems (50 KW) at certain Grampanchyat, School Building, PHC Building. 100 KW X Rs.0.50 Lakh / KW = Rs. 50 Lakhs
50.00
Total Amount Rs. 112.5 Lakhs
Table 6.4 CER Implementation Schedule
Sr. No. CSR Activities
Year 2022
Year 2023
Year 2024
Year 2025
Year 2026
Total Year of Completion
Amount in Rs Lakh 1. Arrangement of Drinking Water
Supply Infrastructure 12.5 12.5 12.5 12.5 12.5 62.50 2026
2 Solar Photovoltaic Electricity Generation Systems:
10 10 10 10 10 50.00
2026
Total 22.5 22.5 22.5 22.5 22.5 112.50 --
6.3.11 Measures for Improvement of Ecology
Following steps should be taken-
Afforestation program under proposed expansion & implementation of distillery project.
175
.3Table 6 Proposed CER activities by KAIPL
As per OM dated 01 May, 2018, industry needs to allocate the funds of Rs.116.5 Lakhs (0.75 % of capital investment of expansion of distillery i.e. Rs. 116.5 Cr). Activities to be undertaken under CER have been considered based on SE & EB survey conducted in study area.
Keeping noise levels under control at night time. Keeping operation of APC equipments and sufficient height of stacks. Provision of appropriate effluent treatment facilities.
General guidelines -
1. Green belt of adequate width and density would be provided to mitigate effects of noise. 2. Plantation activities shall be done according to naturally occurring vegetation. Exotic
species will be avoided. 3. Provision of shrubs, thick trees at storage & disposal places of solid waste would be
made. 4. Trees would be planted along the roads, around solid waste storage area as well as along
the periphery. 5. All the necessary steps would be taken for proper maintenance of the industrial premises. 6. Use of e-mail and other modern communication systems would be followed to conserve
the papers and attain speedy interaction in daily business activities. 7. Use of recyclable papers, if possible, would be done. 8. Promoting measures of energy and water conservation, wherever possible, would be
the staff to make them aware about the plant and animal species found nearby; also it will reduce unnecessary human-wild conflict. This will eventually reduce the damage to biodiversity by the employees.
6.4 ENVIRONMENTAL MONITORING PROGRAM SCHEDULE
Following routine monitoring program as detailed in Table - 6.5 shall be implemented at site. Besides to this monitoring, the compliances to all EC conditions and regular permissions from CPCB /MoEFCC shall be monitored and reported periodically.
6.5 COMPLIANCE WITH CREP GUIDELINES
MoEFCC has launched the Charter on Corporate Responsibility for Environmental Protection (CREP) with the purpose to go beyond the compliance of regulatory norms for prevention & control of pollution through various measures including waste minimization, in-plant process control & adoption of clean technologies. Chapter has set targets concerning conservation of water, energy, recovery of chemicals, reduction in pollution, elimination of toxic pollutants, process & management of residues that are required to be disposed off in an environmentally sound manner. Chapter enlists action points for pollution control for various categories of highly polluting industries. Task Force was constituted for monitoring progress of implementation of CREP recommendations/ action points. Following CREP activities are being undertaken by KAIPL and will be continued after expansion also –
1. Adequate storage capacity of molasses is provided and molasses is not stored in kutcha lagoon to avoid groundwater pollution.
2. Spentwash from 180 KLPD distillery will be concentrated in MEE and concentrated spentwash will be burnt in incineration boiler along with bagasse or Coal. Thereby achieving ZLD for distillery effluent.
3. Fresh water consumption for distillery after expansion will be 2.58 KL/KL of alcohol; for Molasses based Distillery & 3.54 KL/KL of alcohol; for Grain based Distillery whereas norm is 10 KL/KL of Alcohol.
176
adopted. 9. Activities like slide shows or expert’s lectures on Local Biodiversity shall be arranged for

4. Raw spentwash generation rate in distillery after expansion will be 8 KL/KL of alcohol whereas norm is 8 KL/KL of Alcohol.
5. Treated water from CPU is recycled back in process. Same practices will be followed after expansion of distillery also.
6. Provision of 5 days storage tank for storing concentrated spentwash. 7. Bagasse/Coal + Spentwash will be used as fuel in incineration boiler, which generates
significant amount of particulate matter, causing air pollution. ESP is installed as APC equipment along with stack of 100 M height to achieve particulate emission well below 150 mg/Nm3.
8. Provision of a 15 days’ storage capacity tank for treated effluent from sugar factory during no demand for irrigation
Table 6.5 Plan for Monitoring of Environmental Attributes in and around KAIPL No. Description Location Parameters Frequency Conducted
by
1 Air Emissions
Upwind-1, Downwind-2 (Fermentation section, Distillation section, Near main gate,
PM10, PM2.5, SO2, NOx, CO
Monthly
MoEFCC & NABL Approved External
Lab
Study area - (Villages namely –Industrial site, Bagalkote, Gaddanakeri, Sulikeri, Tulasigeri, Kerkalmaui, Jalageri, Kerkalmatti)
Quarterly
2 Work Zone Air Quality
4 Locations (Mill section, Fermentation section, Distillation section)
PM10, PM2.5, SO2, NOx, CO
Monthly
3 Fugitive Emissions
Ethanol storage area & Distillation column
VOC Monthly
4 Stack Emissions
Boiler – 2 Nos. (2 Distillery boiler), D.G Sets
SPM, SO2, NOx Monthly
5
Ambient Noise
5 Locations (Near Distillation section, Near fermentation section, Near main gate, Near ETP, CPU, Near godown)
Spot Noise Level recording; Leq(n), Leq(d), Leq(dn)
Monthly Monthly
Work zone Noise
5 Locations – (Distillation section, Boiler, DG set, Turbine section)
6
Effluent Treated, Untreated pH, SS, TDS, COD, BOD, Chlorides, Sulphates, Oil & Grease.
Monthly
7 Drinking water
Residential Colony Parameters as per drinking water Std IS:10500
Monthly
8
Soil 8 locations within 10 Km (Villages - Hoolageri S1. Hoolageri S2, Ganganbudihal S3, Simikeri S4, Kagalgomb S5, Yaragoppa S6, Katageri S7, Kalasakoppa S8)
pH, Salinity, Organic Carbon, N, P, K
Quarterly
177

No. Description Location Parameters Frequency Conducted by
9
Water Quality (Ground Water & Surface Water)
Locations in study area – (Ground Water- 8 locations from study area & Surface water from 6 Location
Parameters as per CPCB guideline for water quality monitoring – MINARS/27/2007-08
Quarterly
10 Waste management
Implement waste management plan that Identifies and characterizes every waste associated with proposed and expansion activities and which identifies the procedures for collection, handling & disposal of each waste arising.
Records of Solid Waste Generation, Treatment and Disposal shall be maintained
Twice in a year
By KAIPL
11 Emergency Preparedness such as fire fighting
Fire protection and safety measures to take care of fire and explosion hazards, to be assessed and steps taken for their prevention.
On site Emergency Plan, Evacuation Plan, firefighting mock drills
Twice a year
12 Health Check up
Employees and migrant labour health check ups
All relevant health checkup parameters as per factories act.
Once in a Year
13 Green Belt Within Industry premises as well as nearby villages
Survival rate of planted sapling
In consultation with DFO.
14 CER As per activities -- Six Monthly
Table 6.6 Environmental Monitoring Schedule within Industrial Premises
No. Description Schedule of Monitoring Jan Feb Mar April May June July Aug Sep Oct Nov Dec
1 AAQ √ √ √ √ √ √ √ √ √ √ √ √ 2 Workzone Air √ √ √ √ √ √ √ √ √ √ √ √ 3 Stack Emissions √ √ √ √ √ √ √ √ √ √ √ √ 4 Noise √ √ √ √ √ √ √ √ √ √ √ √ 5 Effluent √ √ √ √ √ √ √ √ √ √ √ √ 6 Drinking water √ √ √ √ √ √ √ √ √ √ √ √ 7 Fugitive Emissions √ √ √ √ 8 Waste management √ √ 9 Emergency preparedness,
such as fire fighting √ √
10 Health Check up √ √ 11 Green Belt √ √ √ √ √ √ √ √ √ √ √ √
Note: - Distillery Operation period - 330 Days
178

Table 6.7 Environmental Monitoring Schedule Surrounding Industrial Premises
No. Description Schedule of Monitoring
Jan Feb Mar April May June July Aug Sep Oct Nov Dec
179
1 AAQ √ √ √ √ 2 Noise √ √ √ √ 3 Soil √ √ √ √ 4 GW & SW √ √ √ √ 5 CER √ √ √ √ √ √ √ √ √ √ √ √

180
Chapter 7
Additional Studies
7.1 PUBLIC CONSULTATION
As per EIA notification 14th September 2006 and standard ToRs were issued by EAC of MoEFCC, New Delhi vide Letter IA-J-11011/224/2008-IA II (I) dated 22.01.2021. Subsequently, public hearing was conducted on 21.09.2021 w.r.t. expansion of Grain / Molasses based Distillery from 65 to 180 KLPD.
7.1.1 Details of Public Hearing
Date of Public Hearing : 21.09.2021 Place of Hearing : Project site - Karthik Agro Industries Pvt. Ltd. (KAIPL), Hoolageri
Village, Taluka: Badami, District: Bagalkote (Karnataka) Advertisement given : 21.08.2021 News Paper : Vijayvani (Kanadda), Indian Express (English)
Copies of newspaper enclosed at Appendix – I.
Members Present : 1 Shri. Mahadev A. Muragi
Additional Deputy Commissioner & Chairman, Environmental Public Hearing Committee, Bagalkote District.
Chairman
2 Shri. Vijaykumar T. Kadakbhavi, Senior Environmental Officer, KSPCB, Zonal Office, Dharwad.
Convener
3 Shri. Rajshekhar Puranik, Environmental Officer, KSPCB, Regional Office, Bagalkote
Member
7.1.2 Public Hearing Issues & Compliance
Various issues raised during the Public Hearing and reply for same, as given by the Industry, including budgetary provisions and time line towards observing compliance under certain commitments by the Project Proponents are given in following table -
Refer Appendix - I for Minutes of Meeting of Public Hearing held.
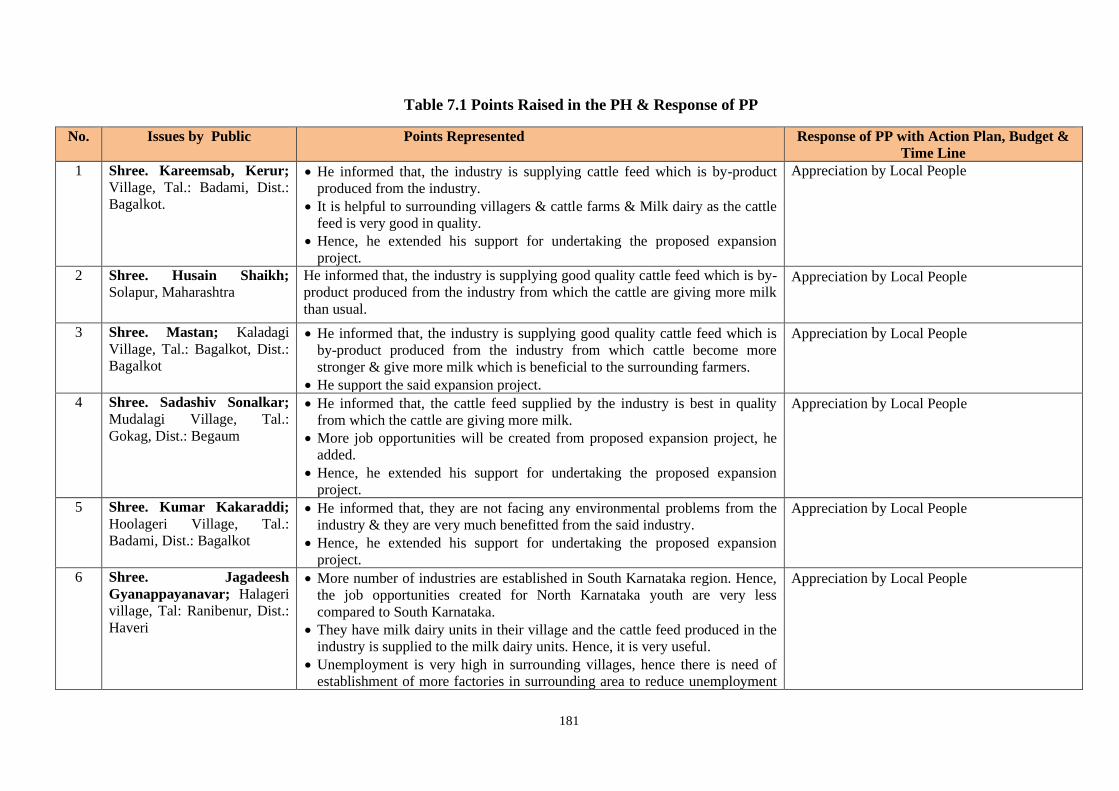
181
Table 7.1 Points Raised in the PH & Response of PP
No. Issues by Public Points Represented Response of PP with Action Plan, Budget & Time Line
1 Shree. Kareemsab, Kerur; Village, Tal.: Badami, Dist.: Bagalkot.
• He informed that, the industry is supplying cattle feed which is by-product produced from the industry.
• It is helpful to surrounding villagers & cattle farms & Milk dairy as the cattle feed is very good in quality.
• Hence, he extended his support for undertaking the proposed expansion project.
Appreciation by Local People
2 Shree. Husain Shaikh; Solapur, Maharashtra
He informed that, the industry is supplying good quality cattle feed which is by-product produced from the industry from which the cattle are giving more milk than usual.
Appreciation by Local People
3 Shree. Mastan; Kaladagi Village, Tal.: Bagalkot, Dist.: Bagalkot
• He informed that, the industry is supplying good quality cattle feed which is by-product produced from the industry from which cattle become more stronger & give more milk which is beneficial to the surrounding farmers.
• He support the said expansion project.
Appreciation by Local People
4 Shree. Sadashiv Sonalkar; Mudalagi Village, Tal.: Gokag, Dist.: Begaum
• He informed that, the cattle feed supplied by the industry is best in quality from which the cattle are giving more milk.
• More job opportunities will be created from proposed expansion project, he added.
• Hence, he extended his support for undertaking the proposed expansion project.
Appreciation by Local People
5 Shree. Kumar Kakaraddi; Hoolageri Village, Tal.: Badami, Dist.: Bagalkot
• He informed that, they are not facing any environmental problems from the industry & they are very much benefitted from the said industry.
• Hence, he extended his support for undertaking the proposed expansion project.
Appreciation by Local People
6 Shree. Jagadeesh Gyanappayanavar; Halageri village, Tal: Ranibenur, Dist.: Haveri
• More number of industries are established in South Karnataka region. Hence, the job opportunities created for North Karnataka youth are very less compared to South Karnataka.
• They have milk dairy units in their village and the cattle feed produced in the industry is supplied to the milk dairy units. Hence, it is very useful.
• Unemployment is very high in surrounding villages, hence there is need of establishment of more factories in surrounding area to reduce unemployment
Appreciation by Local People

182
No. Issues by Public Points Represented Response of PP with Action Plan, Budget & Time Line
problems. • He supported the said expansion project.
7 Shree Ravikumar Math; Simikeri R.C. village, Tal. & Dist.: Bagalkot
• He informed that, they are not facing any environmental problems from the industry & they are very much benefitted from the industry.
• Hence, he extended his support to proposed expansion of the project.
Appreciation by Local People
8 Shree Mustafa Soudagar; Kaladagi village, Tal. & Dist.: Bagalkot
He informed that, the industry authorities are purchasing the maize grains produced by the surrounding farmers at good price and the by-product cattle feed is very good in quality and useful for higher milk in the farms.
Appreciation by Local People
9 Shree Muttappa R Tumbaramatti; Chhabbi village, Tal.: Hubli, Dist.: Dharwad
He informed that, around 15 to 20 villagers of his village are working in this factory and it is their source of income. But, many youth are jobless in surrounding villages. Hence, need of more factories in surrounding area to generate employment.
Appreciation by Local People
10 Shree Mahesh R Hatti of Sulikeri village, Tal.: Badami, Dist.: Bagalkot
He informed that, around 50 to 60 villagers of his village are working in this factory and the industry authorities are purchasing the maize grains produced by the surrounding farmers at good price and hence, expansion of said project is very useful to surrounding farmers.
Appreciation by Local People
11 Shree Ramesh Hugar; Keshnoor R.C. village, Tal.: Aurad, Dist.: Bidar
• The Factory authorities have provided food kits to surrounding villagers and they have supported the surrounding villagers during Corona Pandemic period.
• Hence, he extended his support for undertaking the proposed expansion project.
Appreciation by Local People
12 Shree Holebassu Kabadad; Kerakalamatti village, Tal.: Badami, Dist.: Bagalkot
• He informed that, many villagers of his village are working in this factory and they are benefitted very much from this factory.
• Hence, he extended his support for undertaking the proposed expansion project.
Appreciation by Local People

183
7.2 R & R ACTION PLAN
There is no R & R action plan because proposed expansion shall be taken up in existing Distillery premises of is located at Hoolageri Village, Taluka: Badami, District: Bagalkot, Karnataka.
7.3 RISK ASSESSMENT INTRODUCTION
Risk assessment and hazard management study for expansion of distillery from 65 KLPD to 180 KLPD Grain / Molasses based Distillery by Dr. B. N. Thorat who is FAE for RH in respect of EEIPL. This will be achieved by installing additional equipment and machinery by installing additional distillery of 115 KLPD.
Hazard Assessment • By Qualitative Risk Assessment • By Quantitative Risk Assessment by Hazard index calculations and estimate threat zones
by using ALOHA
Recommendations • Recommend mitigation measures based upon the above. • Recommending guidelines for the preparation of On-Site Emergency Plan. 7.4 OBJECTIVES AND SCOPE OF THE RH REPORT
7.4.1 Objective of the Risk and Hazard analysis
1) Identify hazards and nature of hazard in the process, storage and handling of hazardous chemicals.
2) Carry out Qualitative risk analysis for the process and suggest mitigation measures. 3) Carry out Quantitative risk analysis of the storage of hazardous chemicals and estimate
the threat zones for Most Credible and Worst case scenarios 4) Suggest mitigation measures to reduce the risk/probability of the accident to the
minimum. 5) Incorporate these measures for ensuring safe operations and safe layout to mitigate hazard
and for effectively encounter any accident reduce the damages to the minimum. 6) Suggest Guidelines for on-site and off - site emergency plan
7.4.2 Methodology
7.4.2.1 Identify hazards based on
• Processes description received based. • Identify Hazardous Chemicals handled and stored. • Inventory of Hazardous chemicals
7.4.2.2 Hazard Assessment
• By Qualitative Risk Assessment • By Quantitative Risk Assessment by Hazard index calculations and estimate threat
zones by using ALOHA
7.4.2.3 Recommendations
• Recommend mitigation measures based upon the above • Recommending guidelines for the preparation of On-site Emergency plan.

184
7.4.3 Hazards during construction phase
Following are the hazards during the construction phase of the project:
Table 7.2 Hazards during construction phase No. Hazard Mitigation Measures 1 Hazards of working at heights:
There is possibility of workers, slipping or falling down, while from the height due to loss of balance or because of similar reasons. This may result in serious or even fatal injury.
WORK PERMIT system to be implemented, all the safety precautions to be taken by the workers must be mentioned and the supervisor has to ensure that safety harnesses and other PPE are used by the workers.
2 Hazards while using crane or heavy lifting machinery
The crane can topple due mechanical failure of defects in the machinery, not properly hooking the heavy equipment to the crane properly operation, this will result in serious or even fatal injury to the operator and may be to some persons in the nearby vicinity. i. Crane operators must be licensed and trained to
operate crane and other heavy duty mobile equipment.
ii. All cranes and heavy duty lifting machinery must be maintained and certified for the operation by the competitive authority.
iii. All heavy lifting and erection work must be carried out under the supervision of the safety and other officers and preferably during the day time.
3 General Recommendations i. Work Permit system to be introduced and followed. ii. All necessary PPEs to be issued to all the company
and contract workers and wearing these must be encouraged and insisted.
7.4.4 Hazards during operation phase
Onsite possible Hazardous Locations are as follows Table 7.3 Hazards during operation phase
No. Hazard Mitigation Measures 1 Boiler Section Presently there are one boilers of 16 TPH capacity with 32 kg/cm2
is in working condition. Major hazard is explosion. Following Mandatory measures have to be in place: IBR rules for design, piping, maintenance and operation of boilers by certified boiler attendants is mandatory.
2 Fire and fatal accidents due to lightening.
Properly designed and numbers of Lightening arrestors will be installed.
3 Electrocution and fire Regular maintenance, internal safety audit, and external safety audit at regular intervals.
7.5 DISTILLARY PLANT
The company shall adopt standard Alcohol production technology for expansion up to 180 KLPD which is described in details in the earlier part of the EIA report. Separate area of 20,000 sq. Meters has been allocated for this plant. Details of the same are shown in the site layout, in this EIA report.
7.5.1 Hazard Identification: Production of Alcohol (Distillery)
There are two areas of concern are:

185
1. Alcohol Storage: Leakage leading to fire. For Molasses storage hazard identification and mitigation measures are already given the earlier part of the report.
2. Molasses storage: Heavy leakage of Molasses, total breakage of tank, leading to loss of life and pollution.
Recommendations for minimization of Hazard in the process
Major hazard identified in the production unit is release of alcohol vapors and fire. HAZOP study for existing plant is done. It is recommended that; the company should insist in the process know–how and basic engineering supply agreement to include HAZOP study before startup of new plant. It is desirable to associate technical and production staff in these studies for better understanding of the process and instrumentation philosophy and other technical aspects of the process and plant. Detailed engineering should ensure that all the recommendations on safety measures are implemented.
7.5.1.1 Hazard Identification: Alcohol Storage
Major hazard is leakage and fire in storage of Alcohol. The company has following storage for Ethanol storage
Table 7.4 Alcohol Storage Arrangements at KAIPL Site (Existing)
No Description Height M) Dia. (M) Capacity (Lakh Lit.) 1 RS Storage Tanks
Tank No. 03 (ENA Storage Tank) 12,500 9,600 9,04,779 Tank No. 04 (ENA Storage Tank) 12,500 9,600 9,04,779 Tank No. 20 ( ENA Storage Tank) 12,530 9,600 9,06,950 Tank No. 12 (ENA Receiver Tank) 5,250 4,300 76,241 Tank No. 13 (ENA Receiver Tank) 5,250 4,300 76,241 Tank No. 14 ( ENA Receiver Tank) 5,250 4,300 76,241 Tank No. 15 (ENA Receiver Tank) 5,250 4,300 76,241
Total 30,21,472 2 Impure Spirit / Tech. Alcohol
Tank No. 05 (Storage Tank) 12,500 9,600 9,04,779 Tank No. 09(Receiver Tank) 3,000 2,000 9,425 Tank No. 10 (Receiver Tank) 3,000 2,000 9,425 Tank No. 11 (Receiver Tank) 3,000 2,000 9,425
Total 9,33,054 3 Fuel Ethanol
Tank No. 18 (Storage Tank) 12,500 9,600 9,04,779 Tank No. 19 (Storage Tank) 12,500 9,600 9,04,779 Tank No. 16 (Receiver Tank) 5,250 4,300 76,241 Tank No. 17 (Receiver Tank) 5,250 4,300 76,241
Total 19,62,040 Gross Capacity 59,16,566
Vent Condensers and Fire extinguishers are provided for safety purpose, prevention of alcohol loss and environment protection. PESO license is taken for storage of alcohol. Copy of certificate is appended at Appendix – J, Statutory approvals for expansion will be obtained. NFPA rating for Alcohol is NH (Health Factor) NF (Fire Factor) NR (Reactivity) NF= 3, NH = 2 and NR=0, indicating fire as the major hazard in handling and storage of Alcohol. 7.5.1.2 Qualitative Risk analysis
F&EI index can also be used for estimating the damage that would probably result from the accident/fire and it is converted to radius of exposure by multiplying it by 0.84 to feet. Thus

186
radius of exposure in this case will be 0.84X72= 60 feet or 18 meters. For the storage of alcohol Fire and Explosion index has been calculated to be 72 based on the Material Factor MF = 16 and storage conditions (Degree of Hazard is rated based on of Fire and explosion index as follows)
Table 7.5 Degree of Hazard DEGREE OF HAZARD AND F&EI INDEX
F&EI INDEX RANGE DEGREE OF HAZARD 1-60 LIGHT 61-96 MODERATE
97-127 INTERMEDITE 128- 158 HEAVY
MORE THAN 159 SEVERE
From the above table it could be seen that F&EI index is in the range of moderate. QRA for Alcohol Storage has been calculated for the existing Alcohol storage tank and results and conditions assumed. QRA for Alcohol tanks is done and same is appended at Appendix K
Mitigation Measures
1. Based on standard recommendations for moderate hazard is it is recommended to have Alcohol storage tanks should be in open in dyke walls and must have spill collection and control (recycle) arrangement to pump into another tank.
2. As indicated the storage will be in open with dyke walls. 3. Clear distance between tanks will be provided as per the requirement of Petroleum Rules
Table 1 SCHEDULE II. 4. Location of pumps, location of tank farm in the factory should be as per the requirements
of PESO Petroleum rules. 5. Necessary approval /LICENCE from Chief Controller of Explosives will be obtained for
the for obtained for the existing and proposed alcohol storage. 6. Proper firefighting system, inside the plant and around the storage tanks will be designed
as per IS or international code. And Fire NOC will be obtained. 7. Design of Fire fighting around Alcohol storage for expansion will be as per OIS 117
standard or equivalent standard with sprinkler system for tank cooling and foam based firefighting arrangement.
8. For Transportation of Alcohol, Class A flammable solvent, rules as given in Petroleum act will be followed. The guidelines are given in Appendix – L.
The company shall adopt above recommended mitigation measures for the safety.
7.5.1.3 Hazard Identification: Molasses/Grain Storage
Molasses storage: Heavy leakage of Molasses, total breakage of tank, leading to loss of life and pollution.
Table 7.6 Raw Material Storage Tanks
No. Description Details Grain Storage Molasses Storage Existing After Expansion Existing After Expansion
1 Capacity 2500 MT Each 2500 MT Each 8300 MT Each 8300 MT Each 2 No. of Silos 2 4 2 4 3 Type Covered Covered Covered Covered 4 Dimensions 18.3M Dia X 15.8
M Ht.(Each) 18.3M Dia X 15.8
M Ht.(Each) 25.5 M Dia X 11.75
M Ht.(Each) 25.5 M Dia X
11.75 M Ht.(Each)

187
7.5.1.4 Present Scenario
2 Nos of Grain tanks having total storage capacity of 5000 MT are already installed for storage of Grain. 2 Nos of Molasses tanks having total storage capacity of 16,600 MT are already installed for storage of Molasses. 7.5.1.5 Mitigation Measures
It is necessary to take following mitigation measures to prevent bursting of tanks, and heavy leakage and loss of life.
1. Molasses should be stored in good quality and leak proof mild steel tanks. 2. Adequate safety factor should be incorporated into the design of wall thickness
considering deterioration that will occur due to corrosion over a period of time. 3. Regular internal and external inspection should be scheduled for checking wall thickness
of the tanks. Dyke/ Bund walls should be constructed around the tank or tanks. 4. It must be ensured while finalizing the dyke dimensions and that thickness that clear
volume inside the dyke walls is equal or more than 1.2 x volume of tank storage capacity. 5. Continuous mixing of molasses through external pump circulation should be done. 6. If there is increase in temperature beyond 300C external cooling of tanks shall be
provided by heat exchanger in the circulation line. 7. Frequent Temperature monitoring, manually or by recorder is strongly advised.
If there is leakage – a. Leakage should be washed out and diluted and should be recycled as far as possible or
must be properly treated in Effluent treatment plant. b. Replacing of leaky gaskets, joints, should be done strictly by following work permit
system. c. Leakage of pipelines, welding repairs should be attended / carried out outside the
plant. The necessary hot work permit should be issued after taking necessary precautions and firefighting measures for onsite hot work, by the concerned authority before any hot work in undertaken
d. Leakage through pump gland shall be reduced to the minimum by installing mechanical seals.
e. To attend all major leakage in tanks the following procedure should be followed (i) Transfer the material to other tank. (ii) Prepare the tank for welding repairs by making sure that it is positively isolated
with blinds from other vessels and ensuring that it is free of the chemicals and gases by purging air and carrying out air analysis before any hot work is undertaken and this should be done by skilled workers. For this purpose safety permit should be given.
7.6 OTHER AREA OF HAZARD IDENTIFICATION IN COMPLEX:
Potential hazardous areas and the likely accidents with the concerned area have been enlisted below-
Table 7.9 Possible Hazardous Locations onsite
No. Hazardous Area
Hazard identified
Mitigation measures Mitigation measures in place /have to be in
place for running plant
Comments/ Additional measures
1 Boiler Area Explosion IBR rules for design, These measures are in Will be adopted for

188
No. Hazardous Area
Hazard identified
Mitigation measures Mitigation measures in place /have to be in
place for running plant
Comments/ Additional measures
maintenance and operation of boilers by certified boiler attendants in mandatory
place as the boiler is in operation for the existing capacity.
the additional boiler capacity
2 All over the plant
Lightening To design and install adequate number of best available lightening arrestors.
These measures are in place as the boiler is in operation for the existing capacity.
If additional are required for increased area of operations these will be installed
3 Electrocution Lose fitting Regular maintenance, internal safety audit, and external safety audit at regular intervals.
These are in place for the operation of the existing capacity
4 Electrical rooms
Fire and electrocution
Regular maintenance, internal safety audit, and external safety audit at regular intervals.
These are in place for the operation of the existing capacity
5 Transformer area
Fire and electrocution
Regular maintenance, internal safety audit, and external safety audit at regular intervals.
These are in place for the operation of the existing capacity
6 Cable tunnel Fire and electrocution
Regular maintenance, internal safety audit, and external safety audit at regular intervals.
These are in place for the operation of the existing capacity
7.6.1 Mitigation Measures to Avoid Accidents
Preventive Measures for Electricity Hazard
• All electrical equipment is to be provided with proper earthing. Earthed electrode are periodically tested and maintained.
• Emergency lighting is to be available at all critical locations including the operator’s
room to carry out safe shut down of the plant. • Easy accessibility of firefighting facilities such as fire water pumps and fire alarm stations
is considered. • All electrical equipment’s to be free from carbon dust, oil deposits, and grease. • Use of approved insulated tools, rubber mats, shockproof gloves and boots, tester, fuse
tongs, discharge rod, safety belt, hand lamp, wooden or insulated ladder and not wearing metal ring and chain.
• Flame and shock detectors and central fire announcement system for fire safety are to be provided.
• Temperature sensitive alarm and protective relays to make alert and disconnect equipment before overheating is to be considered
• Danger from excess current due to overload or short circuit is to be prevented by providing fuses, circuit breakers, thermal protection.
7.7 BOILER SECTION
Presently 16 TPH boiler with 32 kg/cm2 are in working condition. Boiler ash was handled and loaded manually into the tractors to be sold to brick makers. The workers should be providing with them proper clothing and soap etc for cleaning, after their duty.
7.7.1 Establishing a Fire Fighting Group
A small spark of fire may result into loss of lives, machines and the damage by fire may result in high economic losses. This type of losses can be avoided by preventing and
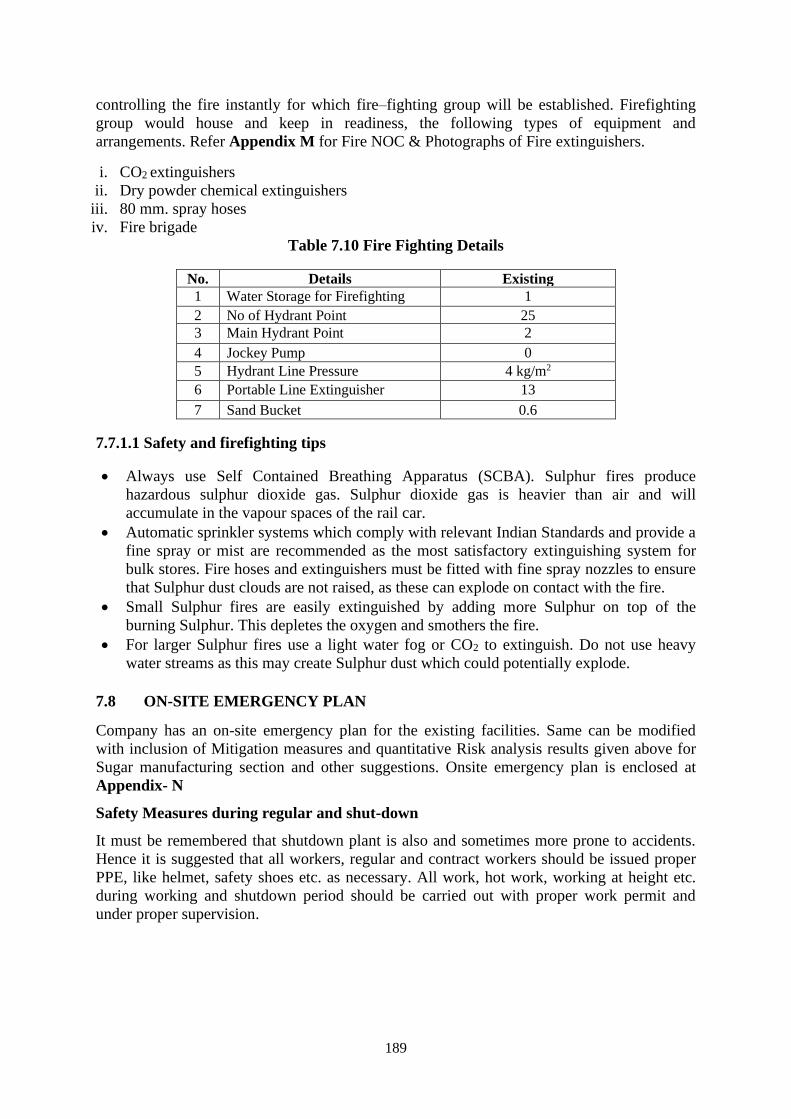
189
controlling the fire instantly for which fire–fighting group will be established. Firefighting group would house and keep in readiness, the following types of equipment and arrangements. Refer Appendix M for Fire NOC & Photographs of Fire extinguishers.
i. CO2 extinguishers ii. Dry powder chemical extinguishers
iii. 80 mm. spray hoses iv. Fire brigade
Table 7.10 Fire Fighting Details
No. Details Existing 1 Water Storage for Firefighting 1 2 No of Hydrant Point 25 3 Main Hydrant Point 2 4 Jockey Pump 0 5 Hydrant Line Pressure 4 kg/m2 6 Portable Line Extinguisher 13 7 Sand Bucket 0.6
7.7.1.1 Safety and firefighting tips
• Always use Self Contained Breathing Apparatus (SCBA). Sulphur fires produce hazardous sulphur dioxide gas. Sulphur dioxide gas is heavier than air and will accumulate in the vapour spaces of the rail car.
• Automatic sprinkler systems which comply with relevant Indian Standards and provide a fine spray or mist are recommended as the most satisfactory extinguishing system for bulk stores. Fire hoses and extinguishers must be fitted with fine spray nozzles to ensure that Sulphur dust clouds are not raised, as these can explode on contact with the fire.
• Small Sulphur fires are easily extinguished by adding more Sulphur on top of the burning Sulphur. This depletes the oxygen and smothers the fire.
• For larger Sulphur fires use a light water fog or CO2 to extinguish. Do not use heavy water streams as this may create Sulphur dust which could potentially explode.
7.8 ON-SITE EMERGENCY PLAN
Company has an on-site emergency plan for the existing facilities. Same can be modified with inclusion of Mitigation measures and quantitative Risk analysis results given above for Sugar manufacturing section and other suggestions. Onsite emergency plan is enclosed at Appendix- N
Safety Measures during regular and shut-down
It must be remembered that shutdown plant is also and sometimes more prone to accidents. Hence it is suggested that all workers, regular and contract workers should be issued proper PPE, like helmet, safety shoes etc. as necessary. All work, hot work, working at height etc. during working and shutdown period should be carried out with proper work permit and under proper supervision.

190
7.9 OCCUPATIONAL HEALTH ASPECTS & MEDICAL PROVISION IN FACTORY
7.9.1 Medical check-up
Pre & post medical check-ups will be done of all the employees. Employees will be regularly examined and the medical records will be maintained for each employee. Pulmonary function test and periodical medical checkup shall be done once in every year. For existing distillery medical checkup of the employees are carried out; refer Appendix O for health checkup report.
The following tests will be conducted for each worker: • Pulmonary Function Test • Audiometric Test • Vision test • General clinical examination with emphasis on respiratory system • Pre-employment examinations • Periodical medical examinations at the time of employment and after completion of
employment.
7.9.2 Occupational Health Center: OHC
The company has OHC center for the existing unit. The facilities of the present OHC and the periodic tests to be carried out will be modified for expansion activity workers and officers in view of the above details and in consultation with the registered medical practitioner. Location of OHC with dimensions is clearly shown in the factory layout drawing; refer Appendix - A for the same. It will be ensured that the exiting OHC and other medical facilities at the site as per the factories act, and number of employees. Same will be augmented under expansion. Company will have OHC and other medical facilities at the site as per the factories act, and number of employees. Some guide lines are given below: Under rule 73 W All factories carrying out hazardous processes must have OHC with services and facilities A) For factories employing up to 50 workers:
i. Medical officer on retainer ship basis, ii. Minimum 5 workers trained in first aid, at least one shall be available during all
working hours. iii. Fully equipped first aid box (What it should contain is also specified later)
B) For factories employee 51 to 200 workers i. OHC with min. floor space of 15 sq. meters
ii. Part time medical officer iii. One qualified and trained dresser-cum- compounder throughout all working hours. iv. Equipped first aid box
C) For factories employing more than 200 workers, i. Full time medical officer up to 500 workers, and one more full time medical officer
for every additional 1000 workers or part thereof ii. OHC with 2 rooms
iii. One compounder and one ward boy 24 by 7 iv. OHC to be equipped all emergencies
With what facilities OHC should be equipped with is given in details in schedule. Requirement of Ambulance van for any factory carrying on hazardous process shall be provided and maintained is defined under 73-X. For factories with less than 200 workers,
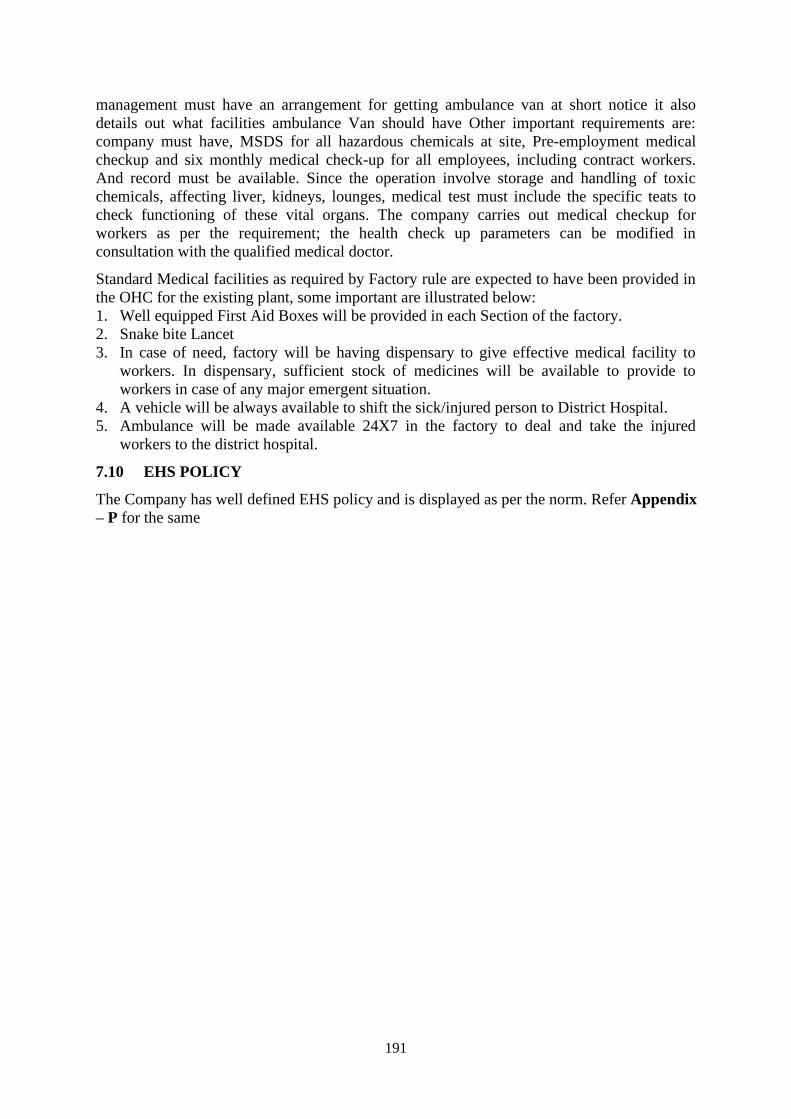
191
management must have an arrangement for getting ambulance van at short notice it also details out what facilities ambulance Van should have Other important requirements are: company must have, MSDS for all hazardous chemicals at site, Pre-employment medical checkup and six monthly medical check-up for all employees, including contract workers. And record must be available. Since the operation involve storage and handling of toxic chemicals, affecting liver, kidneys, lounges, medical test must include the specific teats to check functioning of these vital organs. The company carries out medical checkup for workers as per the requirement; the health check up parameters can be modified in consultation with the qualified medical doctor.
Standard Medical facilities as required by Factory rule are expected to have been provided in the OHC for the existing plant, some important are illustrated below: 1. Well equipped First Aid Boxes will be provided in each Section of the factory. 2. Snake bite Lancet 3. In case of need, factory will be having dispensary to give effective medical facility to
workers. In dispensary, sufficient stock of medicines will be available to provide to workers in case of any major emergent situation.
4. A vehicle will be always available to shift the sick/injured person to District Hospital. 5. Ambulance will be made available 24X7 in the factory to deal and take the injured
workers to the district hospital.
7.10 EHS POLICY
The Company has well defined EHS policy and is displayed as per the norm. Refer Appendix – P for the same

192
Chapter 8
Project Benefit
8.1 INTRODUCTION
Any industrial activity helps in improving the social status of the locality. Existing project by KAIPL has held in improvement of infrastructure and social structure in the command area and has lead to sustainable development. Also, after expansion the community that inhabit in the nearby areas will be benefited directly or indirectly by the project. Following benefits due to the proposed expansion project are expected.
8.1.1 Improvement in the Physical Infrastructure
• Industry has constructed well paved roads for easy access to the workers that has helped in easy transportation of raw materials and products for industry. Further under expansion project as per the Socio-Economic survey it is suggested to improve and construct a well paved roads in surrounding area of the industry as well.
• Industry shall adopt the RWH systems that will improve the ground water table. As no any groundwater is utilized for existing as well as expansion project.
• Augmentation of existing green belt and plantation of additional trees in the industrial area and its surrounding will help in improving the aesthetic beauty of the surrounding environment giving a pleasant look and improvising the air quality. Also green belt will help in arresting dust emissions as well as noise.
• Villages in study area would be benefited from CER activities to be undertaken by industry especially in respect of sanitation through provision of toilets and MSW management actions.
8.1.2 Improvement in the Social Infrastructure
• People residing in the nearby areas will be benefited by the educational facility that will help in enhancing the literacy rate and safety in that area.
• Due to expansion, the frequency of the local transportation will be increased in this area. This will help shorten the time reaching destination and utilize it for some fruitful productive work.
• Due to the awareness & promotional programs, taken up by the Industry, people residing in nearby areas have been benefited. This includes education, literacy, safety and personal wellbeing, care to be taken to avoid diseases like aids, swine flu, dengue etc.
• Industry assists financially to nearby people for medical treatment in case any major diseases found.
8.2 ACTIVITIES DONE BY KAIPL UNDER CER
Table 8.1 Activities done Under CER
No Name of Social Work Amount (Rs.) 1 Food material supply for Shravan Pooja Vittal Temple at
Karkalmatti, District: Bagalkot (Karnataka). 9,175
2 Colour paint for Hunsimardhamma temple at Karkalmatti Dist.: Bagalkot, Karnataka
68,980
3 Supply relief material of flood affected gonala & Navilhole village, Tal: Badami, Dist.: Bagalkot, Karnataka
2,81,875
4 Japayaganya program and Vedanta mahotsvam for the 5th world piece at Karkalmatti village Dist.: Bagalkot, Karnataka
13,900
5 Temple idol statue Hemavema seva samiti Hoolageri Village 50,101

193
No Name of Social Work Amount (Rs.) District: Bagalkot(Karnataka)
Total 4,24,031 Lakh
Proposed CER activities are listed under Chapter 6, Section 6.3.10.
8.3 EMPLOYMENT POTENTIAL
In any industrial activity all three types i.e. skilled and unskilled people are required. Preference is given for employment to local people based on qualification and requirement. In existing unit of KAIPL; they have provided direct & indirect employment to local people.
8.4 OTHER TANGIBLE BENEFITS
After execution of the project he above mentioned benefits shall accrue. Apart from this other tangible benefits are mentioned below -
• After expansion of industry will meet the national interest of economical growth through sustainable development, as alcohol has been a great source of revenue through excise duty levied by the Government.
• First Aid Training and fire safety training will be given to all the workers. • Insurance Policies for the workers and local people will be made available. • Improvement in the aesthetic as well as Pollution augmentation through green belt
development. • Ground water recharging will be done by arresting rain water.

194
Chapter 9 ENVIRONMENT COST BENEFIT ANALYSIS
9.1 INTRODUCTION
Cost-benefit analysis provides an organizational framework for identifying, quantifying, and comparing the costs and benefits (measured in rupees) of a proposed project action. The final decision is informed (though not necessarily determined) by a comparison of the total costs and benefits. Cost-benefit analysis has been cause for substantial debate when used in the environmental arena. The benefits of environmental regulations can include, for example, reduced human and wildlife mortality, improved water quality, species preservation, and better recreation opportunities. The costs are usually reflected in higher prices for consumer goods and/or higher taxes. The latter are market effects readily measured in rupees, while the former are nonmarket effects for which rupees values are not available. In addition to complicating the practice of cost-benefit analysis (rupees values for the nonmarket effects must be inferred rather than directly observed) this raises ethical issues.
Globally, biofuels have caught the attention in last decade and it is imperative to keep up with the pace of developments in the field of biofuels. Biofuels in India are of strategic importance as it augers well with the ongoing initiatives of the Government such as Make in India, Swachh Bharat Abhiyan, Skill Development and offers great opportunity to integrate with the ambitious targets of doubling of Farmers Income, Import Reduction, Employment Generation, Waste to Wealth Creation. A unique feature of this work is that the framework considers revenue generation not only as an outcome of sales of the biofuel but also in terms of carbon credits via greenhouse gas emission savings throughout the project lifecycle.
9.2 PROPOSED PROJECT
Environmental Cost Benefit Analysis produces more efficient decision by increasing monetary values of the life, health and natural resources. In order to assess the pros and cons of any particular regulatory standard for proposed activity, cost-benefit analysis seeks to translate all relevant considerations into monetary terms. In present study Environmental Cost Benefit Analysis was done by considering financial value of Environmental Monitoring Cost. Thus Cost-Benefit Analysis, for carrying out of annual environmental monitoring and the benefits of doing so, including the saving of human lives and the prevention of debilitating and painful diseases, are presented in terms of money.

195
Figure 9.1: Cost Benefit Analysis In view of the current environmental impact assessment of KAIPL projects, environmental and economic evaluation of project is put forward. Environmental costs include internal and external costs. Internal expenses are the costs necessary to achieve the objectives of the project. It is composed of two parts: production cost and environmental protection cost. External costs are the costs of external dis-economy resulting from the project and are mainly used for environmental hazards. Benefits can also be divided into internal and external benefits. The internal benefit is mainly the economic benefits brought by project output and the benefits of employment personnel, and the external benefits are the economic benefits of environmental impact (environmental improvement).
Proponents of cost-benefit analysis make one basic arguments in its favors that is use of cost-benefit analysis apparently leads to more “efficient” allocation of society’s resources by better identifying which potential regulatory actions are worth undertaking and in what fashion. 9.3 WAY FORWARD
India has realized the importance of blending ethanol with fuel and usage of blended mixture as a fuel. It is estimated that India needs 900 million liters of Ethanol for meeting the blending requirements but current manufacturing in just 350 million liters is being produced. There is an urgent need to enhance the capacities to triple its ethanol production over the next four years till 2025. Indian government has planned 12 biofuel refineries in the country. Now India will have to produce 450 crore liters of ethanol in the next four years from the existing 141 crore litres. This will result in an import savings of ₹12,000 crore.”
9.3.1 Cost benefit by Govt. of India policy for the country
Investment cost for 12 biofuel refineries: ₹10,000 crore Enhanced ethanol production for meeting the blending requirements will save ₹12,000 crore
in the country’s oil import bill. Contribution by KAIPL in saving of oil import bill
Cost - benefit analysis
Benefit analysis
Cost analysis
Environmental hazard costs
Environmental protection costs
Production cost
Indirect environmental benefits
Direct environmental benefits
Internal benefit

196
1 Lit of ethanol produced and used for blending @ 15% ratio will contribute in savings of INR. 20 on net price of fuel
“Additional quantity of Ethanol produced” X 20 = Savings of INR. 36,00,000/-
9.4 CONCLUSION
There will be huge savings of Indian currency. Setting up new distillery will improve job opportunities for countryman, business opportunities for small and medium vendors. There will be push on agricultural sector to enhance sugarcane production thereby improving the overall economic condition of our country.

Chapter 10 Environmental Management Plan
10.1 INTRODUCTION
Environment Management Plan (EMP) is required for ensuring sustainable development. It should not affect the surrounding environment adversely. Management plan presented in this chapter needs to be implemented by the expansion of distillery.
EMP aims at controlling pollution at source with available and affordable technology followed by treatment measures. Waste minimization and waste recycling measures are emphasized. In addition to the industry specific control measures, the proposed industry should adopt following guidelines-
Application of Low and Non Waste Technology in the production process; Adoption of reuse and recycling technologies to reduce generation of wastes and to
optimize the production cost of the industry.
Recycling and reuse of industrial waste not only reduces waste generation but also can be an economic gain to the industry. For the distillery expansion project, the management of KAIPL will take all the necessary steps to control and mitigate environmental pollution in the designing stage itself. Moreover, while implementing the project, the management will follow guidelines issued by CPCB. EMP is prepared based on the existing environmental status of the project location and anticipated impacts of the project activities on environment.
10.2 ENVIRONMENTAL MANAGEMENT CELL (EMC)
As a part of the EMP, it is essential to formulate an EMC. KAIPL is already having a cell functioning under its existing project complex. Cell works under Production Manager of the industry and responsible persons from certain departments have been taken as members. EMC is responsible for all the activities and actions as well as outputs and management of entire infrastructure provided for control and abatement of pollution in the KAIPL project. Further, the cell is also active in protecting state of environment in the study area around existing campus of KAIPL. Various programs and tasks towards conservation, awareness, promotion, review etc. are undertaken and implemented through the existing environmental management cell of KAIPL. This cell will also be responsible for taking care of actions and implementations subsequent to the expansion program of the distillery. Further, the EMC will be adequately expanded by incorporation of certain new members since the work load on existing ones is going to be increased substantially subsequent to commissioning of expansion project. Table 10.1 gives details about EMC in the industry. EMC and members thereof shall look after KAIPL existing project as well as expansion of the Distillery.
Table 10.1 Environmental Management Cell in KAIPL
No. Name of Member Designation No. of Working Person(s)
197
Total 9
1 Mr. Suneel Kumar Pal Production Manager 1 2 Mr. Sadashiva Yadahalli Environmental Officer 1 3 Mr. Bholenath Mourya Lab Chemist (ETP & WTP) 1 4 Mr. Barkath Ali. K. Chapparabandh Lab Chemist (ETP & WTP) 1 5 Mr. S. A. Goudar Lab Chemist (ETP & WTP) 1 6 Mr. Sivanand .M.Menasigi and 3 other persons Operator (ETP & WTP) 4

Figure 10.1 Environmental Management Cell and Responsibilities
Production Manager
Mr. Suneel Kumar Pal
Effective implementation of management plan and reporting to Unit Head.
Environmental Officer
Mr. Sadashiva
Providing the technical advised for implementation of environment management plan
& Reporting to P.M.
ETP Chemist (B. Sc)
Collecting & analyzing the sample of all trade effluent and treated effluent
ETP Operator (12th)
Operating and maintenance the effluent treatment plant (ETP)
WTP Operator (12th)
Operating & maintaining the water treatment plant (WTP)
Lab Attender (10th)
Lab cleaning and glassware cleaning work
Members of the Environmental cell are well qualified and experienced in the concerned fields. Some of the routine tests of wastewater such as pH, solids, temperature etc. will be carried out in the laboratory that would be established at the site. However, for additional tests of water, wastewater, soil, air etc., services of accredited laboratories as well as that of a consultant would be hired.
10.3 WORKING OF ENVIRONMENTAL MANAGEMENT PLAN
Figure 10.2 Environmental Management Plan
Environmental Policy
Planning • Environmental Aspects • Objectives & Targets •Environmental Management Plan
Implementation • Implementation of EMP in all the
Distillery units • Document Control • Operational Control • Emergency Preparedness /Response
Checking / Corrective Action • Monitoring & Measurement • Non-conformance & Corrective & Preventive Action
• Records • EMS Audits
Management Review Preparing Environmental
Plan and Policy
198

10.4 RECOMMENDATION & IMPLEMENTATION SCHEDULE
Mitigation measures suggested in Chapter 4 would be implemented. This will reduce the impact on environment due to expansion project. To facilitate easy implementation, recommendations suggested are grouped in different phases. Most important measures are accommodated in earlier phase whereas the lesser important ones are grouped in later phase.
10.4.1 Summary of Recommendations
Table 10.2 Summary of Recommendations
No Aspect Description Recommendations & Proposed Actions
1 Water Consumption
a) Distillery After Expansion (During Molasses Based Operation) Domestic – 11 CMD Industrial Purpose – 1887 CMD Gardening – 320 CMD Total – 2218 CMD
b) Distillery After Expansion (During Grain Based Operation) Domestic – 11 CMD Industrial Purpose - 1773 CMD Gardening – 320 CMD Total – 2104 CMD
Source of fresh water – Ghatprabha river
In Molasses based Distillery out of total water requirement of 2218 CMD; 1422 CMD will be Treated effluent from Molasses Distillery CPU. 65 CMD will be water from rain water harvesting, 8 CMD will be STP treated water, 723 CMD will be fresh water from Ghatprabha river.
In Grain based Distillery out of total water requirement of 2104 CMD; 1135 CMD will be Treated effluent from Grain Distillery CPU. 65 CMD will be water from rain water harvesting, 8 CMD will be STP treated water, 896 CMD will be fresh water from Ghatprabha river.
As far as distillery is concerned, 2.58 KL/KL & 4.2 KL/KL of fresh water is required for industrial purpose in distillery unit as against 10 KL/KL of alcohol produced as per the ToR issued for Molasses & Grain Based Operation respectively.
A. Effluent Treatment
c) Distillery After Expansion (During Molasses Based Operation) Raw Spentwash – 1440 CMD Conc. spentwash – 288 CMD Spentlees – 285 CMD MEE Condensate – 1152 CMD Effluent from Boiler b/d, Cooling b/d, lab & washing and DM backwash – 142 CMD
d) Distillery After Expansion (During Grain Based Operation)
FOC , PRC , RC, Lees – 590 Condensate – 425 Effluent from Boiler b/d, Cooling b/d, lab & washing and
Molasses based Distillery: Raw Spent wash shall be concentrated in MEE. Conc. Spent wash shall be incinerated in incineration Boiler (1.6 KL/ KL)
Grain based Distillery: Lees will be treated in CPU & recycled in process.
Other effluent viz. MEE Condensate, spent lees, cooling blow down, boiler blow down, lab & washing & DM backwash shall be forwarded to distillery existing & proposed CPU. Treated effluent shall be recycled in process to achieve ZLD of process effluent.
Domestic effluent - Treated in
199

No Aspect Description Recommendations & Proposed Actions
DM backwash – 142 CMD
a) Domestic effluent – 8 CMD
proposed STP. Storm water drains would be kept
separate from other drains. Natural drains if found, would not be altered under any circumstances.
No drains will be kept open in the plant.
Detailed water consumption and effluent generation presented in chapter 2nd.
2 Air Pollution Control
a) Distillery (Expansion): 16 TPH boiler for distillery is already installed on site with Husk/Bagasse with conc. spentwash used as fuel. Under molasses based operations a new 40 TPH incineration boiler will be installed on site. Bagasse/coal with conc. spentwash will be used as fuel for new boiler. Under Grain based operation a 50 TPH boiler will be installed Husk/Bagasse will be used as fuel for he same. For more details table 2.24 of chapter 2nd may be referred.
Proposed 2 boilers would be provided with ESP as APC with adequate stack height.
MDC is provided as APC to exiting boiler of capacity 16 TPH along with stack of 47 M height.
DG set is provided with stack of 2.1 M ARL.
Regular self-monitoring of the AAQ and work zone air quality to be done by the industry through approved labs to check and control dust levels / concentrations at certain places so that same could be kept always below the stipulated norms.
Efficiencies of dust control equipment in the industry shall be monitored regularly (at least once a month) under performance evaluation.
Inlet and outlet of pollution control equipment shall be provided with all necessary sampling arrangements as per guidelines of CPCB.
Distillery should regularly monitor quality of stack emissions, AAQM and work zone air quality through self-monitoring practices, interlocks and OCMS should be fitted and properly operated. For details w.r.t Monitoring chapter 6th may be referred.
3 Solid Waste Management
a) Distillery (Expansion): Boiler Ash – 81 MT/D CPU Sludge – 1 MT/D Yeast Sludge - 39 MT/D
Boiler ash is supplied to Brick manufacturer.
Yeast sludge and CPU sludge will be incinerated in incineration boiler.
STP sludge will be used as manure.
4. Noise Control Measures
Noise generating sources generally are boiler house, turbine rooms, mill house on etc.
Provision and use of earmuffs in High Noise Area.
200
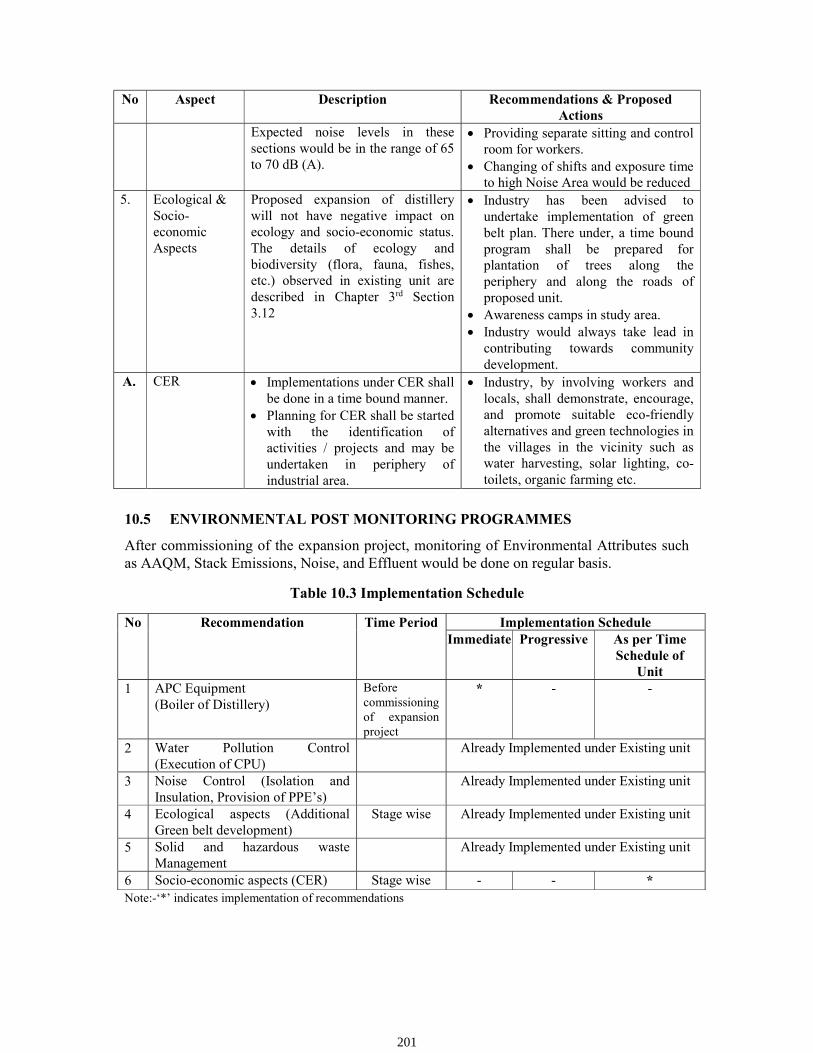
No Aspect Description Recommendations & Proposed Actions
Expected noise levels in these sections would be in the range of 65 to 70 dB (A).
Providing separate sitting and control room for workers.
Changing of shifts and exposure time to high Noise Area would be reduced
5. Ecological & Socio-economic Aspects
Proposed expansion of distillery will not have negative impact on ecology and socio-economic status. The details of ecology and biodiversity (flora, fauna, fishes, etc.) observed in existing unit are described in Chapter 3rd Section 3.12
Industry has been advised to undertake implementation of green belt plan. There under, a time bound program shall be prepared for plantation of trees along the periphery and along the roads of proposed unit.
Awareness camps in study area. Industry would always take lead in
contributing towards community development.
A. CER Implementations under CER shall be done in a time bound manner.
Planning for CER shall be started with the identification of activities / projects and may be undertaken in periphery of industrial area.
Industry, by involving workers and locals, shall demonstrate, encourage, and promote suitable eco-friendly alternatives and green technologies in the villages in the vicinity such as water harvesting, solar lighting, co-toilets, organic farming etc.
10.5 ENVIRONMENTAL POST MONITORING PROGRAMMES
After commissioning of the expansion project, monitoring of Environmental Attributes such as AAQM, Stack Emissions, Noise, and Effluent would be done on regular basis.
Table 10.3 Implementation Schedule
No Recommendation Time Period Implementation Schedule Immediate Progressive As per Time
Schedule of Unit
1 APC Equipment (Boiler of Distillery)
Before commissioning of expansion project
* - -
2 Water Pollution Control (Execution of CPU)
Already Implemented under Existing unit
3 Noise Control (Isolation and Insulation, Provision of PPE’s)
Already Implemented under Existing unit
4 Ecological aspects (Additional Green belt development)
Stage wise Already Implemented under Existing unit
5 Solid and hazardous waste Management
Already Implemented under Existing unit
6 Socio-economic aspects (CER) Stage wise - - * Note:-‘*’ indicates implementation of recommendations
201

10.6 POST ENVIRONMENTAL MONITORING PROGRAM
Post environmental clearance monitoring for industrial premises & for study area around the KAIPL is given at chapter 6, Refer table 6.5. Following compliance against the consent conditions after commissioning of project would be observed under the Water (Prevention & Control of Pollution) Act ,1974, Air (Prevention & Control of Pollution) Act, 1981, Hazardous Waste (Management, Handling & Transboundry Movement) Rules 2010.
Table 10.4 Compliance against the Consent Condition
No. Description Frequency Remark
1 Renewal of Consent Once / year Renewal of application 60 days prior expiry date. 2 Environmental Statement Once / year Every financial year: before 30th September. 3 Hazardous Waste Returns Once / year Every financial year: before 30th June. 4 Six Monthly Compliance Six Monthly Two compliance would be submitted every year. 5 Routine Env. Monitoring Monthly KAIPL is doing monthly environmental
monitoring through MoEFCC and NABL accredited laboratory.
10.7 Monitoring Equipment
A. Air Quality and Meteorological Instruments
1. Fine Dust Sampler 2. Weather station with Wind Vane, Anemometer, Thermometer, Dry/ Wet Bulb
Thermometer, Rain-gauge 3. Spectrophotometer 4. Single pan balance up to 0.0001 gms detection levels. 5. Relevant chemicals as required 6. Oven
B. Water and Wastewater Quality
1. BOD Incubator 2. COD reflux assembly 3. Refrigerator 4. Thermometer 5. pH meter 6. Stop watch 7. Distilled water plant 8. Pipette box 9. Titration set 10. Relevant chemicals and glass wares
C. Noise Levels
Sound level meter in different scales like A, B and C with slow and fast response options
D. Soil Characteristics
Soil sampler (auger) to collect soil samples
202

203
Chapter 11
Summary and Conclusion
11.1 INTRODUCTION
This report has been prepared in overall context of EIA as per the provisions of “EIA
Notification No. S.O. 1533 (E)” dated 14.09.2006; and amendments thereto issued by
Ministry of Environment, Forest and Climate Change (MoEFCC); New Delhi. Now, as per the amended “EIA Notification No. S.O. 1960 (E)” dated 13.06.2019; the project comes
under activity 5(g)(i) & 5(g)(ii)- Distilleries; comes under Category ‘A’. Draft EIA report comprises of requisite information and details w.r.t. project as mentioned in the standard Terms of Reference (TORs) issued by MoEFCC vide letter No. No.J-11011/224/2008-IA II (I) dated 22.01.2021 to KAIPL.
Table 11.1 Project Investment Details
No. Industrial Unit Capital Investment (Rs. Cr.) Existing Proposed Total
1. Distillery 48 116.5 164.5 11.2 PROJECT AT A GLANCE
Table 11.2 Salient Features of the KAIPL Project Site
No Particulars Details 1 Name and Address of the Industry Karthik Agro Industries Pvt. Ltd. (KAIPL), Hoolageri
Village, Taluka: Badami, District: Bagalkote (Karnataka) Gat No. 89, 92, 93, 94
2 Land acquired by the Industry 1,61,874 Sq.M. (16.18 Ha) 3 Elevation 572 M above MSL 4 Nearest habitation Kerkalmatti Village (1.77 Km) 5 Nearest city Bagalkot (8 Km) 6 Nearest highway NH-52 (0.89Km) East 7 Nearest railway station Bagalkote Railway Station (12.06 Km) North - East 8 Nearest airport Belagaum Airport (111.25 Km). 9 Nearest tourist place(s) Badami(24),Hampi (128.89 Km)
10 Defense installations Nil within 10 Km radius 11 Archaeological important Nil within 10 Km radius, Badami Cave Temples, a
UNESCO world heritage site at24 km distance from the site. 12 Critically / Severely polluted areas
declared by CPCB/MoEFCC Nil within Study Area of 10 Km radius
13 Ecological sensitive zones Nil within 10 Km radius 14 Reserved forest/Protected forest/
National Parks/Wildlife Sanctuary etc. Nil within 10 Km radius
15 Nearest streams / Rivers / water bodies (from Project Site)
Ghatprabha river ( 8.0 Km)
16 Nearest Industrial Area / Industry KAIDB at 3.75 Km 17 Interstate Boundary Nil within Study Area of 10 Km radius 18 Site Co-ordinates (all corners) Latitude 16° 8'38.41"N, Longitude 75°35'34.76"E
Latitude 16° 8'35.60"N, Longitude 75°35'44.97"E Latitude 16° 8'17.67"N, Longitude 75°35'41.85"E Latitude 16° 8'20.55"N, Longitude 75°35'33.26"E
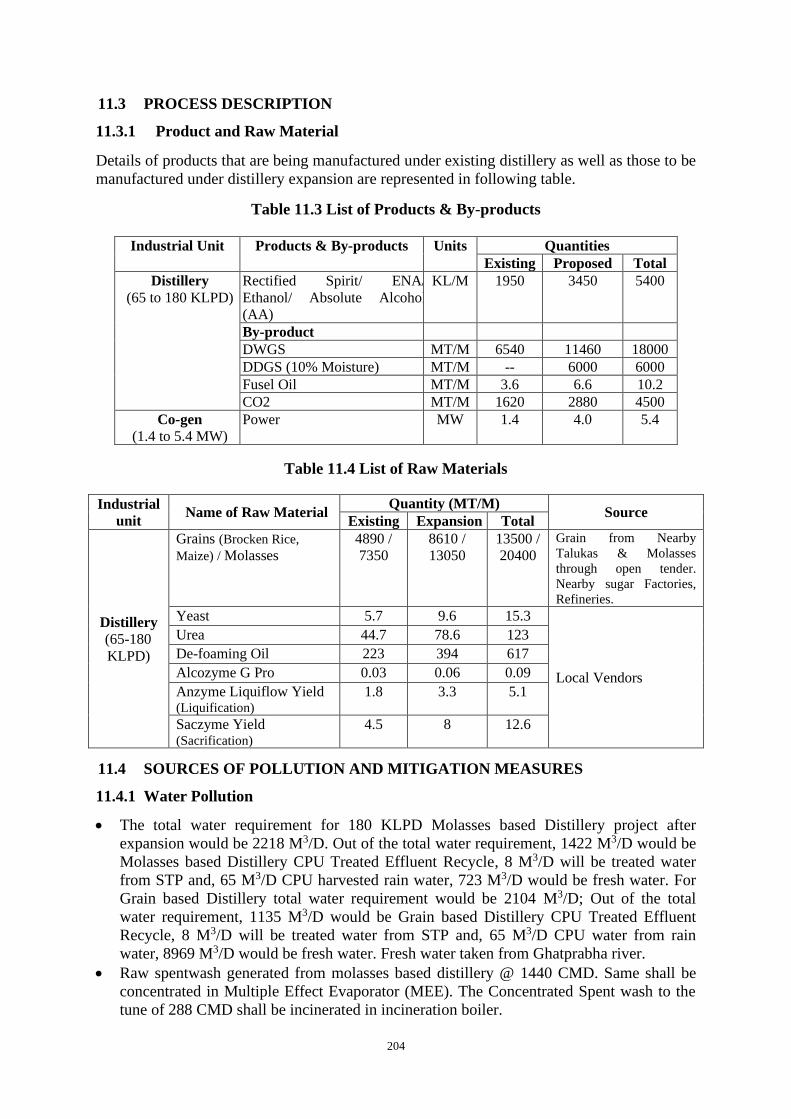
204
11.3 PROCESS DESCRIPTION
11.3.1 Product and Raw Material
Details of products that are being manufactured under existing distillery as well as those to be manufactured under distillery expansion are represented in following table.
Table 11.3 List of Products & By-products
Industrial Unit Products & By-products Units Quantities Existing Proposed Total
Distillery (65 to 180 KLPD)
Rectified Spirit/ ENA/ Ethanol/ Absolute Alcohol (AA)
KL/M 1950 3450 5400
By-product DWGS MT/M 6540 11460 18000 DDGS (10% Moisture) MT/M -- 6000 6000 Fusel Oil MT/M 3.6 6.6 10.2 CO2 MT/M 1620 2880 4500
Co-gen (1.4 to 5.4 MW)
Power MW 1.4 4.0 5.4
Table 11.4 List of Raw Materials
Industrial unit Name of Raw Material
Quantity (MT/M) Source
Existing Expansion Total
Distillery (65-180 KLPD)
Grains (Brocken Rice, Maize) / Molasses
4890 / 7350
8610 / 13050
13500 / 20400
Grain from Nearby Talukas & Molasses through open tender. Nearby sugar Factories, Refineries.
Yeast 5.7 9.6 15.3
Local Vendors
Urea 44.7 78.6 123 De-foaming Oil 223 394 617 Alcozyme G Pro 0.03 0.06 0.09 Anzyme Liquiflow Yield (Liquification)
1.8 3.3 5.1
Saczyme Yield (Sacrification)
4.5 8 12.6
11.4 SOURCES OF POLLUTION AND MITIGATION MEASURES
11.4.1 Water Pollution
• The total water requirement for 180 KLPD Molasses based Distillery project after expansion would be 2218 M3/D. Out of the total water requirement, 1422 M3/D would be Molasses based Distillery CPU Treated Effluent Recycle, 8 M3/D will be treated water from STP and, 65 M3/D CPU harvested rain water, 723 M3/D would be fresh water. For Grain based Distillery total water requirement would be 2104 M3/D; Out of the total water requirement, 1135 M3/D would be Grain based Distillery CPU Treated Effluent Recycle, 8 M3/D will be treated water from STP and, 65 M3/D CPU water from rain water, 8969 M3/D would be fresh water. Fresh water taken from Ghatprabha river.
• Raw spentwash generated from molasses based distillery @ 1440 CMD. Same shall be concentrated in Multiple Effect Evaporator (MEE). The Concentrated Spent wash to the tune of 288 CMD shall be incinerated in incineration boiler.

205
• Lees & other effluent @ 1157 CMD generated from grain base distillery operations & will be treated in existing & new CPUs having capacity 1000 M3/Day each. Treated effluent from CPU will be reused for industrial operations, thereby achieving Zero Liquid Discharge (ZLD) for process effluent.
• Other effluents generated @1579 CMD in the form of spent lees @ 288 CMD, condensate @ 1152 CMD, cooling, boiler blow down, lab-wash & DM backwash @ 142 CMD are weak stream effluent which will be treated in CPU. Treated effluent from CPU will be reused for industrial operations, thereby achieving Zero Liquid Discharge (ZLD) for process effluent. One additional CPU will be provided under expansion of 1000 CMD capacity. Moreover, RO unit will be installed to existing CPU for recycling effluent which is not being done presently.
• Total domestic effluent to the tune of 8 M3/D would treat in proposed STP.
For more details w.r.t water consumption and effluent generation refer table 2.19, 2.20 & 2.21 from chapter 2.
11.4.2 Air Pollution
• Under the Molasses based operation a 40 TPH incineration boiler will be installed on site. For which concentrated spentwash (388 MT/D) blended with bagasse (466MT/D) / Coal (166 MT/D) would be used as fuel. ESP would be installed as APC along with a stack of 100 M height.
• Under Grain based operations a 50 TPH boiler will be installed Husk (225 MT/D) / Bagasse (500 MT/D) used as fuel. ESP would be installed as APC along with a stack of 100 M height.
• Under existing distillery boiler of capacity 16 TPH is installed on site, Husk/Bagasse (72 MT/D / 160 MT/D) is used as a fuel. Spentwash is used as fuel for same only on molasses based operation.
• Existing D.G. Set of 500 KVA capacity with adequate stack height and acoustic enclosure. After expansion of distillery, no new D.G set will be installed. Refer details of boiler and DG set at Table 2.24 Chapter 2.
• Green belt will be augmented in and around the industry. Green belt developed in the premises acts like adsorbent of air pollutants.
11.4.3 Noise Pollution
• In the distillery, very high noise generating source do not exist. Boiler house, distillation & fermentation section would be the miner sources of noise.
• Noise levels, as measured at various points in the boiler house, are not more than 85 dB (A). Adequate care shall be taken under expansion process also so that the noise form all the concerned sections shall be properly attenuated and controlled through insulation, isolation, separation, techniques.
• Green belt to be augmented further shall play an important role to attenuate noise levels from industry to surroundings.
11.4.4 Solid Waste
Table 11.5 Solid Waste Details
No. Description Quantity (MT/D) Disposal Facility
Existing After Expansion 1 Boiler Ash 29 81 Sold to Bricks Manufacturer 2 Yeast Sludge 14 39 Burnt in Incineration Boiler 3 CPU Sludge 1 1

206
11.4.5 Hazardous Waste
No any hazardous waste will be generated from distillery.
11.4.6 Odour Pollution
There are number of odour sources in sugar factory & distillery, which include molasses handling and storage, bacterial growth in interconnecting pipes & unattended drains. The measures shall be adopted under proposed expansion unit for controlling the same are proper housekeeping, sludge management in biological ETP units, steaming of major pipe lines, regular use of bleaching powder in the drains, efficient handling, prompt.
Due adequate steps towards handing, conveyance, usage, housekeeping and O & M; there is no any odour problem under existing distillery. Similar care shall be taken during expansion project also. For more details towards mitigation of odour problems, Chapter 2 (Section 2.7.6) may be referred. For detailed area break up of entire industrial complex Table 2.3 of Chapter 2 may be referred. 11.5 GREEN BELT DEVELOPMENT
Table 11.7 Area Details
No. Description Area (Sq. M) 1 Total Built up Area after expansion 34800 2 Total Open Area after expansion 14,699 3 Existing Green Belt Area (40% of Total Plot Area) 64,000 Total Plot Area 1,61,874
11.6 ENVIRONMENTAL MONITORING PROGRAM
Monitoring of various environmental parameters will be carried out on a regular basis to ascertain the following:
• State of pollution within the plant and in its vicinity; • Examine the efficiency of pollution control systems installed in the plant; • Generate data for predictive or corrective purpose in respect of pollution; • To assess environmental impacts
Project management will carry out the monitoring regularly and record shall be maintained of the same. For details w.r.t. post monitoring program to be conducted; refer chapter - 6 (Table 6.5)
11.7 ENVIRONMENT MANAGEMENT PLAN
Environment Management Plan aims at controlling pollution at source with available and affordable technology followed by treatment measures. Under the existing 65 KLPD distillery KAIPL has effectively implemented the EMP. As a part of EMP, it is essential to formulate an EMC. KAIPL is already having a cell functioning under its existing distillery. EMC will be adequately expanded by incorporation of certain existing members subsequent to commissioning of expansion project. For more details, the separate chapter on EMP may be referred.
11.8 CONCLUSION
Proposed expansion of distillery by KAIPL will help to elevate the economic growth at the local level as well as national level. It will also generate the employment in the study region,

207
thereby improving the standard of living of people in the area. Expansion activity shall not disturb the land use pattern in the study area of 10 Km. Moreover, Rain Water Harvesting (RWH) shall be implemented on site so as to recharge and increase the ground water table in the area. Also maximum use of condensate is done do reduce the fresh water demand. No Rehabilitation is involved under this project since expansion will be done in the existing premises. Thus, KAIPL expansion project is beneficial for society without hampering the environment and thereby accomplishing the aim of sustainable development.

208
Chapter 12
Disclosure of Consultants
12.1 THE ORGANIZATION
Equinox Environments (India) Pvt. Ltd. (EEIPL) is a major organization under the 'Equinox Group (EG)’ companies. EEIPL is one of the leading environmental consultants in the country and renders number of environmental services, under one roof, needed by various industries, institutions, government and semi-govt. bodies. EG offer services related to Environmental; Civil & Chemical Engineering, Pollution Control & its abatement, Industrial Safety, Health & Hygiene. ‘EG’ is in the environmental business since 1994 and operates through its offices located in Kolhapur (Corporate), Pune, New Mumbai, Hyderabad and New Delhi in India as well as at Baltimore in Maryland; USA. ‘Equinox’ set up comprises of engineers, technocrats, eminent scientists & professors, chemists, technicians and business associates.
Quality, consistency and committed service are the "3 Pillars" of Equinox. The EG is working in close association with some reputed institutions and organizations in India that are leading in R&D, consultation, education and infrastructure development in environmental engineering & management areas. A few to mention will be – (1) Institute of Chemical Technology (formerly UDCT); Mumbai, (2) KIT's College of Engineering; Kolhapur, (3) Shivaji University; Kolhapur, (4) D.Y. Patil College of Engg.; Kolhapur, (5) GPKP; Kolhapur. ‘Equinox’ has also been awarded Memberships by Prestigious Global Institutions namely - IE (India), IWA (UK), ISWA (Austria), and ENACT (Alabama-USA).
Presently EEIPL has a strength of 78 highly qualified personnel out of which 9 are Ph.D. scholars and 25 hold post graduate qualifications namely M. Tech. (from IITs), M.S.E. (JHU-USA), M.E. and M.Sc. with an experience range of 10 to 50 years.
EEIPL is an ISO 9001:2015 certified organization (DNV-GL) that has been duly accredited through QCI–NABET for the Ministry of Environment, Forest & Climate Change (MoEFCC); New Delhi as recognized and approved ‘Environmental Consultant’ of ‘Cat. A’ at the National Level for 15 different Sectors (1,2,4,8,12,17,18,20,21,22,25,32,32A.37 & 39). The EIA team comprises of 7 Coordinators and 23 Functional Area Experts actively engaged in the Environmental Impact Assessment (EIA) studies and related exercises under Environmental Clearance assignments. Moreover, EEIPL is having back up of 5 state-of-art Laboratories spread in 4 states of India (2 in Maharashtra and 1 each in Gujarat, Karnataka and West Bengal). All the labs have received NABL accreditations (ISO/IEC 17025: 2005; 2017) as well as approvals by the Govt. of India through the MoEFCC; New Delhi. Further they have certifications namely ISO 9001: 2015, ISO 18001: 2007 (OHSAS) and ISO 140001: 2015.
The 'Equinox Group' companies, over last 25 years, have rendered services as well as expert consultation to more than 300 Projects and Industries, all over the country, which included sugar factories, power plants, distilleries, foundries, sponge iron & steel plants, textile industries, bulk drug manufacturing units and chemical industries, food processing & beverage manufacturing units, asbestos products & roofing, timber and particle board Industries. So far, the EG organizations have successfully procured ‘Environmental
Clearance (EC)’ for 138 Projects that required conducting EIA studies. Out of them, as many as 110 were ‘Category-A’ projects for which EC was awarded by MoEFCC. The
engineering team of ‘Equinox’ has planned, designed, erected and commissioned more than 75 Plants that comprised of ETPs, STPs, WTPs, SW & HW Management, Rain Water

209
Harvesting & GWR, Piezometer Network Station Installation and Resources Recovery Systems. Also, more than 50 Projects have been rendered consultation on CER, Green Belt, Ground Water Abstraction Clearance (CGWA & MoWR; Govt of India), NBWL Clearance (SBWL & MoEFCC), OCMS design; erection and commissioning, and Legal & Technical advice. Further, the EG companies have actively contributed their technical & scientific skills and knowledge in the Lakes & Rivers Revival and Conservation Program promoted by MoEFCC; Govt. of India through NRCD under NPCA scheme (formerly NLCP). There under, preparation and getting approvals was done for DPRs of 12 Lake Projects in Maharashtra & Uttar Pradesh while obtaining sanction of Rs. 320 Cr. as grant-in-aid (funds). Here, the second largest funding (next to ‘Dal Lake’ in Srinagar) was
awarded by MoEFCC to ‘Ramgarh Lake’ at Gorakhpur in UP where under Revival &
Conservation Project worth Rs. 197 Cr. was successfully executed and commissioned in the year 2018. Engineers & scientists of ‘Equinox’ made this mission possible in association with
professors from KITs College of Engineering; Kolhapur. The EG website –
www.equinoxenvi.com – may be visited for more details regarding activities, achievements and list of the esteemed clients of ‘Equinox’ as well as Key Personnel information.

QCI/NABET/ENV/ACO/21/2111 October 16, 2021
To Equinox Environments (India) Pvt. Ltd. F-11, Namdev Nest, 1160-B, 'E' Ward, Sykes Extension, Opp. Kamala College, Kolhapur - 416001
Sub.: Extension of Validity of Accreditation till January 15, 2022– regarding Ref.: Certificate no. NABET/EIA/1821/RA 0135
Dear Sir/Madam,
This has reference to the accreditation of your organization under QCI-NABET EIA Scheme, the validity of Equinox Environments (India) Pvt. Ltd. is hereby extended till January 15, 2022 or completion of assessment process, whichever is earlier. The above extension is subject to the submitted documents/required information with respect to
your application and timely submission and closure of NC/Obs. during the process of assessment.
You are requested not to use this letter after expiry of the above stated date.
With best regards.
(A K Jha) Sr. Director, NABET
210

211
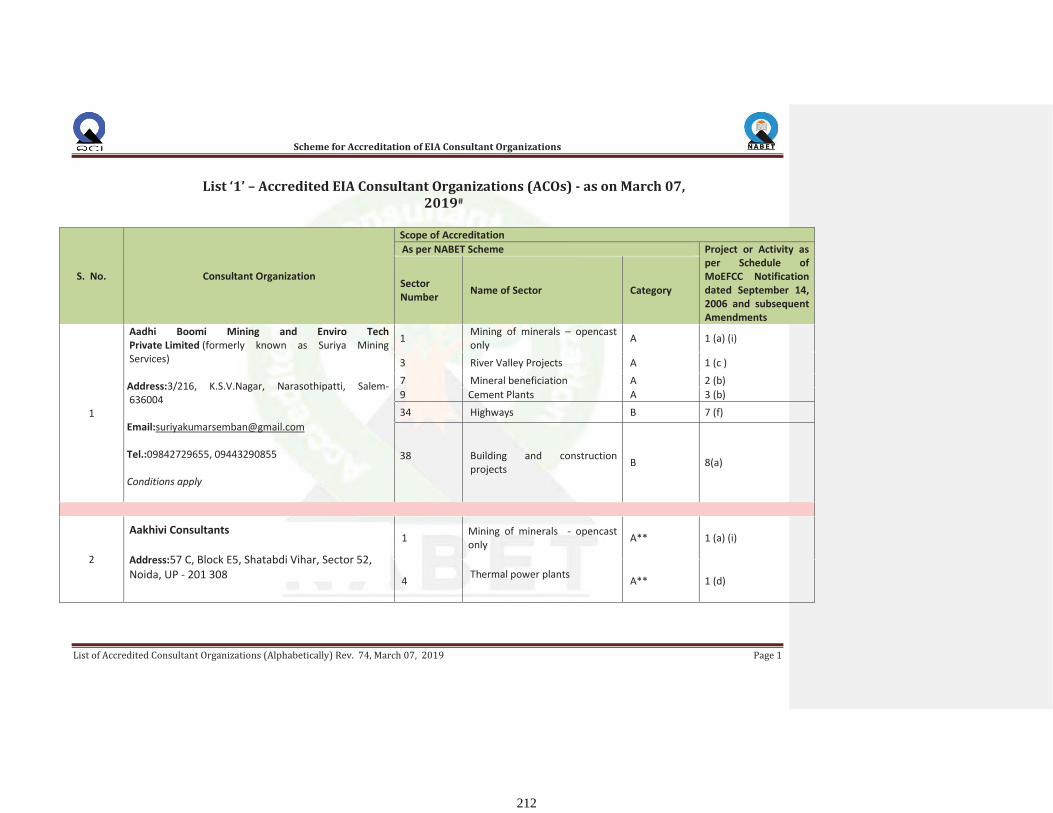
Scheme for Accreditation of EIA Consultant Organizations
List ‘1’ – Accredited EIA Consultant Organizations (ACOs) - as on March 07, 2019#
212

Scheme for Accreditation of EIA Consultant Organizations
214

Scheme for Accreditation of EIA Consultant Organizations
215
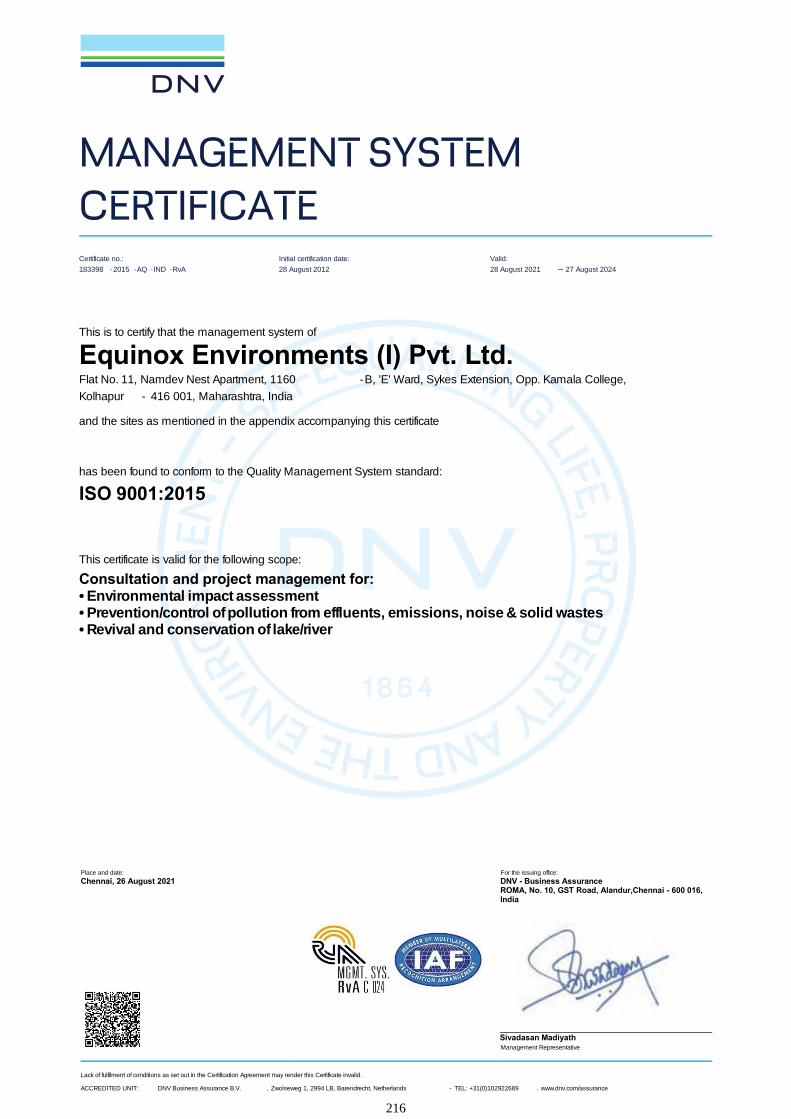
Place and date: For the issuing office:Chennai, 26 August 2021 DNV - Business Assurance
ROMA, No. 10, GST Road, Alandur,Chennai - 600 016,India
Sivadasan MadiyathManagement Representative
Lack of fulfilment of conditions as set out in the Certification Agreement may render this Certificate invalid.
ACCREDITED UNIT: DNV Business Assurance B.V. , Zwolseweg 1, 2994 LB, Barendrecht, Netherlands - TEL: +31(0)102922689 . www.dnv.com/assurance
MANAGEMENT SYSTEM
CERTIFICATE
Certificate no.:
183398 -2015 -AQ -IND -RvA
Initial certification date:
28 August 2012
Valid:
28 August 2021 – 27 August 2024
This is to certify that the management system of
Equinox Environments (I) Pvt. Ltd.Flat No. 11, Namdev Nest Apartment, 1160 -B, 'E' Ward, Sykes Extension, Opp. Kamala College,
Kolhapur - 416 001, Maharashtra, India
and the sites as mentioned in the appendix accompanying this certificate
has been found to conform to the Quality Management System standard:
ISO 9001:2015
This certificate is valid for the following scope:
Consultation and project management for:• Environmental impact assessment• Prevention/control of pollution from effluents, emissions, noise & solid wastes• Revival and conservation of lake/river
216

Certificate no.: 183398 -2015 -AQ -IND -RvA
Place and date: Chennai, 26 August 2021
Lack of fulfilment of conditions as set out in the Certification Agreement may render this Certificate invalid.
ACCREDITED UNIT: DNV Business Assurance B.V. , Zwolseweg 1, 2994 LB, Barendrecht, Netherlands - TEL: +31(0)102922689 . www.dnv.com/assurance
Page 2 of 2
Appendix to Certificate
Equinox Environments (I) Pvt. Ltd.
Locations included in the certification are as follows:
Site Name Site Address Site Scope
Equinox Environments (I) Pvt. Ltd. Flat No. 11, Namdev Nest Apartment,
1160 -B, 'E' Ward, Sykes Extension, Opp.
Kamala College, Kolhapur - 416 001,
Maharashtra, India
Consultation and project management for
environmental impact assessment
Enviclean Associates Flat No. 11, Namdev Nest Apartment,
1160 -B, ‘E’ Ward, Sykes Extension, Opp.Kamala College, Kolhapur - 416 001,
Maharashtra, India
Consultation and project management for
prevention/control of pollution from
effluents, emissions, noise & solid wastes
Clin viron Consultants’ Combine (Environmental and Civil Engineers,
Consultants and Analysts), Flat No. 11,
Namdev Nest Apartment, 1160 -B, ‘E’Ward, Sykes Extension, Opp. Kamala
College, Kolhapur - 416 001, Maharashtra,
India
Consultation and project management for
revival and conservation of lake/river
217

NABL 400
National Accreditation Board for Testing and Calibration Laboratories (NABL)
Directory of Accredited Testing Laboratories
As on : 31-Oct-2020
218
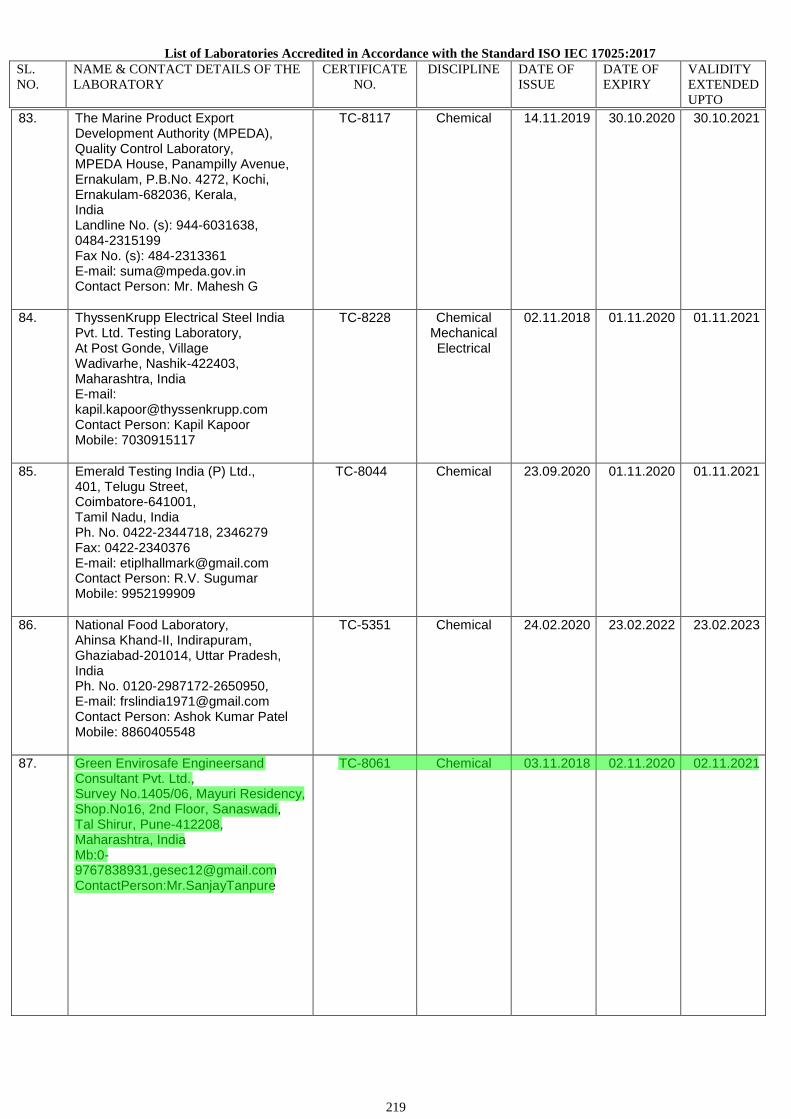
List of Laboratories Accredited in Accordance with the Standard ISO IEC 17025:2017 SL. NO.
NAME & CONTACT DETAILS OF THE LABORATORY
CERTIFICATE NO.
DISCIPLINE DATE OF ISSUE
DATE OF EXPIRY
VALIDITY EXTENDED UPTO
83. The Marine Product Export Development Authority (MPEDA), Quality Control Laboratory, MPEDA House, Panampilly Avenue, Ernakulam, P.B.No. 4272, Kochi, Ernakulam-682036, Kerala, India Landline No. (s): 944-6031638, 0484-2315199 Fax No. (s): 484-2313361 E-mail: [email protected] Contact Person: Mr. Mahesh G
TC-8117
Chemical 14.11.2019 30.10.2020 30.10.2021
84. ThyssenKrupp Electrical Steel India Pvt. Ltd. Testing Laboratory, At Post Gonde, Village Wadivarhe, Nashik-422403, Maharashtra, India E-mail: [email protected] Contact Person: Kapil Kapoor Mobile: 7030915117
TC-8228 Chemical Mechanical Electrical
02.11.2018 01.11.2020 01.11.2021
85. Emerald Testing India (P) Ltd., 401, Telugu Street, Coimbatore-641001, Tamil Nadu, India Ph. No. 0422-2344718, 2346279 Fax: 0422-2340376 E-mail: [email protected] Contact Person: R.V. Sugumar Mobile: 9952199909
TC-8044
Chemical
23.09.2020 01.11.2020 01.11.2021
86. National Food Laboratory, Ahinsa Khand-II, Indirapuram, Ghaziabad-201014, Uttar Pradesh, India Ph. No. 0120-2987172-2650950, E-mail: [email protected] Contact Person: Ashok Kumar Patel Mobile: 8860405548
TC-5351 Chemical 24.02.2020 23.02.2022 23.02.2023
87. Green Envirosafe Engineersand Consultant Pvt. Ltd., Survey No.1405/06, Mayuri Residency, Shop.No16, 2nd Floor, Sanaswadi, Tal Shirur, Pune-412208, Maharashtra, India Mb:0-9767838931,[email protected] ContactPerson:Mr.SanjayTanpure
TC-8061
Chemical 03.11.2018 02.11.2020 02.11.2021
219
Highlight
Highlight

220

REGD.NO.D.L.-33004/99
EXTRAORDINARY
PART II—Section 3—Sub-section (ii)
PUBLISHED BY AUTHORITY
No.352] NEW DELHI, FRIDAY, FEBRUARY 10, 2017/MAGHA 21,1938
MINISTRY OF ENVIRONMENT, FOREST AND CLIMATE
CHANGE NOTIFICATION
New Delhi, the 10th February, 2017
S.O. 388(E).—In exercise of the powers conferred by clause (b) of sub-section (1) of section 12 and section 13 of the Environment (Protection) Act, 1986 (29 of 1986), read with rule 10 of the Environment (Protection) Rules, 1986, the Central Government hereby makes the following further amendments in the notification of the Government of India in the erstwhile Ministry of Environment and Forests, number S.O. 1174(E), dated the 18th July, 2007, namely :-
In the Table appended to the said notification,-
(i) for serial numbers 12,16,18,21,22,47,75,76,77,88,89,90,91 and 92 the entries relating thereto, the following serial numbers and entries shall be substituted, namely:-
(1) (2) (3) (4)
144 M/s Green Envirosafe Engineers and Consultant Pvt. Ltd. Gat No. 1405/06, Mayuri Residency, Office No. 16, 2nd Floor, Sanswadi, Pune- Nagpur Highway, Tal-Shirur, Pune- 412208, Maharashtra.
(i) Dr. Satish Damodar Kulkarni (ii) Dr. Ayodhya Kshirsagar (iii) Mr. Vinod Prataprao Hande
09.02.2017 to
08.02.2022
[F. No. Q. 15018/7/2003-CPW ]
Dr. MANORANJAN HOTA, Advisor
Note : The principal notification was published in the Gazette of India, Extraordinary vide number S.O. 1174 (E), dated the 18th July, 2007 and subsequently amended vide notification numbers S.O. 1539 (E), dated the 13th September,2007, S.O.1811(E), dated the 24th October, 2007, S.O.55(E), dated 9th January, 2008, S.O.428(E), dated the 4 th March, 2008, S.O.No.865(E) dated the 11th April, 2008, S.O.No.1894(E) dated the 31st July, 2008, S.O.No.2728(E) dated the 25 th November, 2008, S.O.1356(E) dated the 27 th May, 2009, S.O.No.1802(E) dated the 22nd July, 2009 and S.O.No.2399(E), dated the 18th September, 2009 and S.O.No.3122(E), dated the 7th December, 2009 and S.O.No.3123(E), dated the 7th December, 2009, S.O.No.142(E), dated the 21st January, 2010, S.O.619(E), 19th March, 2010, S.O.No.1662(E) dated the 13rd July, 2010, S.O.No.2390(E), dated the 30th September, 2010 S.O.No.2904(E), dated the 8th December, 2010 and S.O.No.181(E), dated the 28th January, 2011, S.O.No.692(E) dated the 5th April, 2011, S.O No. 1754(E), dated the 28th July, 2011, S.O. No. 2609, dated 22th November, 2011, S.O No. 264(E), dated- 13th February, 2012, S.O No. 1150(E) dated-22th May, 2012, S.O No.1295(E), dated-6th June, 2012, S.O. No. 2039 (E), dated-5thSeptember,2012,S.ONo.2850(E),dated-7thDecember,2012,S.O.No.592(E),dated-8thMarch,2013, S.O. No. 945(E), dated-8th April, 2013, S.O. No. 2287(E), dated-26th July, 2013, S.O No. 3489(E), dated-26th November,2013,S.ONo.21(E),dated-3rdJanuary,2014,S.ONo.561(E),dated-26thFebruary,2014,S.O.No.1190(E), dated-1st June, 2014, S.O. No. 2003(E), dated-9th August, 2014, S.O. No. 137(E), dated-12th January, 2015, S.O. NO.1783(E), dated-30th June, 2015, S.O. No. 2453(E), dated-7th September, 2015 and S.O. No. 1953(E), dated-2nd June,2016
221

At Address
CRESCENT QUALITY CERTIFICATION PVT. LTD.
Certificate of Registration
Managing Director
to comply with the requirement of
This Certificate is Valid for the activities specified below:
B-1005, Gundecha Symphony, Veera Desai Road, Andheri West, Mumbai - 400 053, IndiaPhone: +919820429510, Email: [email protected],
Website: www.crescentqualitycertification.comFor Current validity of this certificate, please visit our website
Certificate Expire Date: 21.02.20242nd Surveillance: 02.2023
DRAFT C
OPY
Registration No.: CQCPL/QMS/0221/6701Certificate Issue Date: 22.02.20211st Surveillance: 02.2022
Has been Assessed by Crescent Quality Certification Pvt. Ltd. and Deemed
Quality Management System ofThis is to certify that the
ISO 9001:2015
EVISSERGORP
Address to which this Certificate refers:
PRAGATI SOCIETY, STREET - NO. 1, VIRANI AGHAT, 80 FEET, BOLBALA MARG, B/H. BALAJI REFRIGRATION, DHEBAR ROAD
(SOUTH), RAJKOT - 360002, GUJARAT - INDIA.
(Here in after called the Registered firm) the right to be listed in the Directory of Registered firm in respect of the services listed below. These services shall be offered by the Registered firm at or from only the address given above in accordance and compliance with
Registration No.: PICL/QMS/0988/0515Certificate Issue Date : 09.05.20151st Surveillance: 05.2016
This Certificate of Registration is granted subject to the Regulations approved by the Board.
PROGRESSIVE INTERNATIONAL CERTIFICATIONS LTD.Prakruti, Plot No. 03, Sector 21 Kharghar, Navi Mumbai - 410210, India.Ph. +91 8080091139, E-mail.: [email protected], Website: www.progressiveltd.comFor current validity of this certificate. Please visit our website
Certificate of Registration
PROGRESSIVE
�e Governing Board ofProgressive International Certifications Limited
hereby grant to�
JAY ENTERPRISE
QUALITY MANAGEMENT SYSTEM
ISO 9001:2008Approved Scope to which this Certificate refers
MANUFACTURE, SUPPLY AND EXPORT OF STONELESS DOMESTIC FLOUR MILL, ELECTRIC MOTOR AND
SPARES - SERVICES.
EVISSERGORP
Certificate Expire Date: 08.05.20182nd Surveillance: 05.2017
Head of Certificate
USE OF ACCREDITATION MARK INDICATES ACCREDITATION IN RESPECT OF THE ACTIVITIES COVERED BYACCREDITATION INSTITUTE ASSESMENT BODY (EUROPE) CERTIFICATION NUMBER 005
QMS 005AIAB
ENVIRONMENT CONSULTANCY SERVICES PROVIDER, ENVIRONMENT TESTING WATER & WASTE WATER TESTING
AIR MONITORING & TESTING, FOOD TESTING & ANALYSIS
GREEN ENVIROSAFE ENGINEERS & CONSULTANT PVT. LTD.
M/S. GREEN ENVIROSAFE ENGINEERS & CONSULTANT PVT. LTD.,
PLOT NO. A - 7/2/C-11, MIDC, CHAKAN INDL. AREA PH-IV,
NIGHOJE, TAL - KHED, DIST - PUNE.
222

At Address
CRESCENT QUALITY CERTIFICATION PVT. LTD.
Certificate of Registration
Managing Director
to comply with the requirement of
This Certificate is Valid for the activities specified below:
B-1005, Gundecha Symphony, Veera Desai Road, Andheri West, Mumbai - 400 053, IndiaPhone: +919820429510, Email: [email protected],
Website: www.crescentqualitycertification.comFor Current validity of this certificate, please visit our website
DRAFT C
OPYHas been Assessed by Crescent Quality Certification Pvt. Ltd. and Deemed
Enviornment Management System ofThis is to certify that the
EVISSERGORP
Address to which this Certificate refers:
PRAGATI SOCIETY, STREET - NO. 1, VIRANI AGHAT, 80 FEET, BOLBALA MARG, B/H. BALAJI REFRIGRATION, DHEBAR ROAD
(SOUTH), RAJKOT - 360002, GUJARAT - INDIA.
(Here in after called the Registered firm) the right to be listed in the Directory of Registered firm in respect of the services listed below. These services shall be offered by the Registered firm at or from only the address given above in accordance and compliance with
Registration No.: PICL/QMS/0988/0515Certificate Issue Date : 09.05.20151st Surveillance: 05.2016
This Certificate of Registration is granted subject to the Regulations approved by the Board.
PROGRESSIVE INTERNATIONAL CERTIFICATIONS LTD.Prakruti, Plot No. 03, Sector 21 Kharghar, Navi Mumbai - 410210, India.Ph. +91 8080091139, E-mail.: [email protected], Website: www.progressiveltd.comFor current validity of this certificate. Please visit our website
Certificate of Registration
PROGRESSIVE
�e Governing Board ofProgressive International Certifications Limited
hereby grant to�
JAY ENTERPRISE
QUALITY MANAGEMENT SYSTEM
ISO 9001:2008Approved Scope to which this Certificate refers
MANUFACTURE, SUPPLY AND EXPORT OF STONELESS DOMESTIC FLOUR MILL, ELECTRIC MOTOR AND
SPARES - SERVICES.
EVISSERGORP
Certificate Expire Date: 08.05.20182nd Surveillance: 05.2017
Head of Certificate
USE OF ACCREDITATION MARK INDICATES ACCREDITATION IN RESPECT OF THE ACTIVITIES COVERED BYACCREDITATION INSTITUTE ASSESMENT BODY (EUROPE) CERTIFICATION NUMBER 005
AIAB QMS 005
ISO 14001:2015
Certificate Expire Date: 21.02.20242nd Surveillance: 02.2023
Registration No.: CQCPL/EMS/0221/1572Certificate Issue Date: 22.02.20211st Surveillance: 02.2022
ENVIRONMENT CONSULTANCY SERVICES PROVIDER, ENVIRONMENT TESTING WATER & WASTE WATER TESTING
AIR MONITORING & TESTING, FOOD TESTING & ANALYSIS
GREEN ENVIROSAFE ENGINEERS & CONSULTANT PVT. LTD.
M/S. GREEN ENVIROSAFE ENGINEERS & CONSULTANT PVT. LTD.,
PLOT NO. A - 7/2/C-11, MIDC, CHAKAN INDL. AREA PH-IV,
NIGHOJE, TAL - KHED, DIST - PUNE.
223

At Address
CRESCENT QUALITY CERTIFICATION PVT. LTD.
Certificate of Registration
Managing Director
to comply with the requirement of
This Certificate is Valid for the activities specified below:
B-1005, Gundecha Symphony, Veera Desai Road, Andheri West, Mumbai - 400 053, IndiaPhone: +919820429510, Email: [email protected],
Website: www.crescentqualitycertification.comFor Current validity of this certificate, please visit our website
DRAFT C
OPY
Has been Assessed by Crescent Quality Certification Pvt. Ltd. and Deemed
This is to certify that the
EVISSERGORP
Address to which this Certificate refers:
PRAGATI SOCIETY, STREET - NO. 1, VIRANI AGHAT, 80 FEET, BOLBALA MARG, B/H. BALAJI REFRIGRATION, DHEBAR ROAD
(SOUTH), RAJKOT - 360002, GUJARAT - INDIA.
(Here in after called the Registered firm) the right to be listed in the Directory of Registered firm in respect of the services listed below. These services shall be offered by the Registered firm at or from only the address given above in accordance and compliance with
Registration No.: PICL/QMS/0988/0515Certificate Issue Date : 09.05.20151st Surveillance: 05.2016
This Certificate of Registration is granted subject to the Regulations approved by the Board.
PROGRESSIVE INTERNATIONAL CERTIFICATIONS LTD.Prakruti, Plot No. 03, Sector 21 Kharghar, Navi Mumbai - 410210, India.Ph. +91 8080091139, E-mail.: [email protected], Website: www.progressiveltd.comFor current validity of this certificate. Please visit our website
Certificate of Registration
PROGRESSIVE
�e Governing Board ofProgressive International Certifications Limited
hereby grant to�
JAY ENTERPRISE
QUALITY MANAGEMENT SYSTEM
ISO 9001:2008Approved Scope to which this Certificate refers
MANUFACTURE, SUPPLY AND EXPORT OF STONELESS DOMESTIC FLOUR MILL, ELECTRIC MOTOR AND
SPARES - SERVICES.
EVISSERGORP
Certificate Expire Date: 08.05.20182nd Surveillance: 05.2017
Head of Certificate
USE OF ACCREDITATION MARK INDICATES ACCREDITATION IN RESPECT OF THE ACTIVITIES COVERED BYACCREDITATION INSTITUTE ASSESMENT BODY (EUROPE) CERTIFICATION NUMBER 005
QMS 005
ISO 45001:2018
AIAB
Occupational Health And Safety Management System of
Certificate Expire Date: 21.02.20242nd Surveillance: 02.2023
Registration No.: CQCPL/OHSMS/0221/5518Certificate Issue Date: 22.02.20211st Surveillance: 02.2021
ENVIRONMENT CONSULTANCY SERVICES PROVIDER, ENVIRONMENT TESTING WATER & WASTE WATER TESTING
AIR MONITORING & TESTING, FOOD TESTING & ANALYSIS
GREEN ENVIROSAFE ENGINEERS & CONSULTANT PVT. LTD.
M/S. GREEN ENVIROSAFE ENGINEERS & CONSULTANT PVT. LTD.,
PLOT NO. A - 7/2/C-11, MIDC, CHAKAN INDL. AREA PH-IV,
NIGHOJE, TAL - KHED, DIST - PUNE.
224

No.J-11011/224/2008-IA II (I)
Goverment of India
Minister of Enviroment,Forest and Climate Change
Impact Assessment Division
***
Indira Paryavaran Bhavan,
Vayu Wing,3rd Floor,Aliganj,
Jor Bagh Road,New Delhi-110003
22 Jan 2021
To,
M/s KARTHIK AGRO INDUSTRIES PRIVATE LIMITED
Sy No. 92 Hoolgeri Village Tal. Badami Dist. Bagalkot,
Bagalkot-587902
Karnataka
Tel.No.-; Email:[email protected]
Sir/Madam,
This has reference to the proposal submitted in the Ministry of Environment, Forest
and Climate Change to prescribe the Terms of Reference (TOR) for undertaking detailed EIA
study for the purpose of obtaining Environmental Clearance in accordance with the provisions of
the EIA Notification, 2006. For this purpose, the proponent had submitted online information in the
prescribed format (Form-1 ) along with a Pre-feasibility Report. The details of the proposal are
given below:
1. Proposal No.: IA/KA/IND2/191585/2021
2. Name of the Proposal:
Expansion of 65 KLPD Molasses/Grain Based
Distillery to 180 KLPD Molasses/Grain Based
Distillery By Karthik Agro Industries Pvt Ltd.,
(KAIPL), Located At: SY NO 92 Hoolageri
Village, Tal.: Badami, Dist.: Bagalkote,
Karnataka.
3. Category of the Proposal: Industrial Projects - 2
4. Project/Activity applied for: 5(g) Distilleries
5. Date of submission for TOR: 19 Jan 2021
In this regard, under the provisions of the EIA Notification 2006 as amended, the Standard TOR
for the purpose of preparing environment impact assessment report and environment
management plan for obtaining prior environment clearance is prescribed with public consultation
as follows:
225
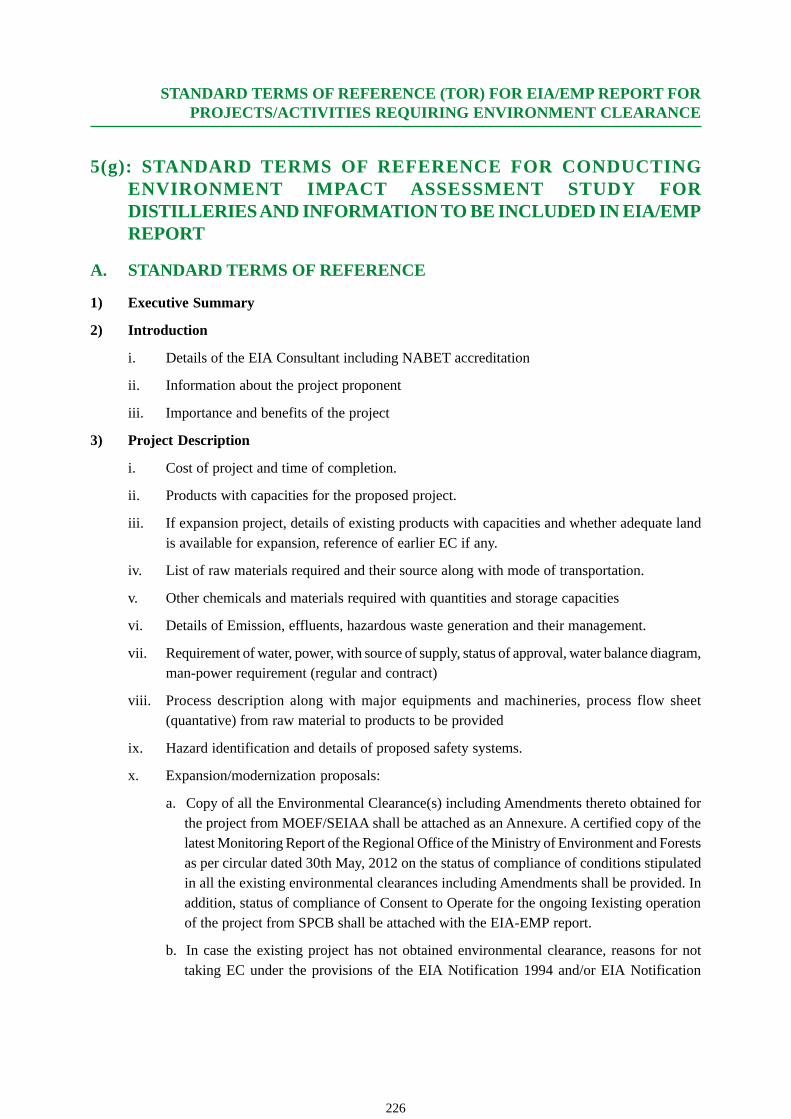
STANDARD TERMS OF REFERENCE (TOR) FOR EIA/EMP REPORT FORPROJECTS/ACTIVITIES REQUIRING ENVIRONMENT CLEARANCE
5(g): STANDARD TERMS OF REFERENCE FOR CONDUCTINGENVIRONMENT IMPACT ASSESSMENT STUDY FORDISTILLERIES AND INFORMATION TO BE INCLUDED IN EIA/EMPREPORT
A. STANDARD TERMS OF REFERENCE
1) Executive Summary
2) Introduction
i. Details of the EIA Consultant including NABET accreditation
ii. Information about the project proponent
iii. Importance and benefits of the project
3) Project Description
i. Cost of project and time of completion.
ii. Products with capacities for the proposed project.
iii. If expansion project, details of existing products with capacities and whether adequate landis available for expansion, reference of earlier EC if any.
iv. List of raw materials required and their source along with mode of transportation.
v. Other chemicals and materials required with quantities and storage capacities
vi. Details of Emission, effluents, hazardous waste generation and their management.
vii. Requirement of water, power, with source of supply, status of approval, water balance diagram,man-power requirement (regular and contract)
viii. Process description along with major equipments and machineries, process flow sheet(quantative) from raw material to products to be provided
ix. Hazard identification and details of proposed safety systems.
x. Expansion/modernization proposals:
a. Copy of all the Environmental Clearance(s) including Amendments thereto obtained forthe project from MOEF/SEIAA shall be attached as an Annexure. A certified copy of thelatest Monitoring Report of the Regional Office of the Ministry of Environment and Forestsas per circular dated 30th May, 2012 on the status of compliance of conditions stipulatedin all the existing environmental clearances including Amendments shall be provided. Inaddition, status of compliance of Consent to Operate for the ongoing Iexisting operationof the project from SPCB shall be attached with the EIA-EMP report.
b. In case the existing project has not obtained environmental clearance, reasons for nottaking EC under the provisions of the EIA Notification 1994 and/or EIA Notification
226

STANDARD TERMS OF REFERENCE (TOR) FOR EIA/EMP REPORT FOR PROJECTS/ACTIVITIES REQUIRING ENVIRONMENT CLEARANCE
2006 shall be provided. Copies of Consent to Establish/No Objection Certificate andConsent to Operate (in case of units operating prior to EIA Notification 2006, CTE andCTO of FY 2005-2006) obtained from the SPCB shall be submitted. Further, compliancereport to the conditions of consents from the SPCB shall be submitted.
4) Site Details
i. Location of the project site covering village, Taluka/Tehsil, District and State, Justificationfor selecting the site, whether other sites were considered.
ii. A toposheet of the study area of radius of 10km and site location on 1:50,000/1:25,000 scaleon an A3/A2 sheet. (including all eco-sensitive areas and environmentally sensitive places)
iii. Details w.r.t. option analysis for selection of site
iv. Co-ordinates (lat-long) of all four corners of the site.
v. Google map-Earth downloaded of the project site.
vi. Layout maps indicating existing unit as well as proposed unit indicating storage area, plantarea, greenbelt area, utilities etc. If located within an Industrial area/Estate/Complex, layoutof Industrial Area indicating location of unit within the Industrial area/Estate.
vii. Photographs of the proposed and existing (if applicable) plant site. If existing, showphotographs of plantation/greenbelt, in particular.
viii. Landuse break-up of total land of the project site (identified and acquired), government/private - agricultural, forest, wasteland, water bodies, settlements, etc shall be included. (notrequired for industrial area)
ix. A list of major industries with name and type within study area (10km radius) shall beincorporated. Land use details of the study area
x. Geological features and Geo-hydrological status of the study area shall be included.
xi. Details of Drainage of the project upto 5km radius of study area. If the site is within 1 kmradius of any major river, peak and lean season river discharge as well as flood occurrencefrequency based on peak rainfall data of the past 30 years. Details of Flood Level of theproject site and maximum Flood Level of the river shall also be provided. (mega green fieldprojects)
xii. Status of acquisition of land. If acquisition is not complete, stage of the acquisition processand expected time of complete possession of the land.
xiii. R&R details in respect of land in line with state Government policy
5) Forest and wildlife related issues (if applicable):
i. Permission and approval for the use of forest land (forestry clearance), if any, andrecommendations of the State Forest Department. (if applicable)
227
STANDARD TERMS OF REFERENCE (TOR) FOR EIA/EMP REPORT FORPROJECTS/ACTIVITIES REQUIRING ENVIRONMENT CLEARANCE
ii. Landuse map based on High resolution satellite imagery (GPS) of the proposed site delineatingthe forestland (in case of projects involving forest land more than 40 ha)
iii. Status of Application submitted for obtaining the stage I forestry clearance along with lateststatus shall be submitted.
iv. The projects to be located within 10 km of the National Parks, Sanctuaries, Biosphere Reserves,Migratory Corridors of Wild Animals, the project proponent shall submit the map dulyauthenticated by Chief Wildlife Warden showing these features vis-à-vis the project locationand the recommendations or comments of the Chief Wildlife Warden-thereon
v. Wildlife Conservation Plan duly authenticated by the Chief Wildlife Warden of the StateGovernment for conservation of Schedule I fauna, if any exists in the study area
vi. Copy of application submitted for clearance under the Wildlife (Protection) Act, 1972, to theStanding Committee of the National Board for Wildlife
6) Environmental Status
i. Determination of atmospheric inversion level at the project site and site-specific micro-meteorological data using temperature, relative humidity, hourly wind speed and directionand rainfall.
ii. AAQ data (except monsoon) at 8 locations for PM10, PM2.5, SO2, NOX, CO and otherparameters relevant to the project shall be collected. The monitoring stations shall be basedCPCB guidelines and take into account the pre-dominant wind direction, population zoneand sensitive receptors including reserved forests.
iii. Raw data of all AAQ measurement for 12 weeks of all stations as per frequency given in theNAQQM Notification of Nov. 2009 along with - min., max., average and 98% values foreach of the AAQ parameters from data of all AAQ stations should be provided as an annexureto the EIA Report.
iv. Surface water quality of nearby River (100m upstream and downstream of discharge point)and other surface drains at eight locations as per CPCB/MoEF&CC guidelines.
v. Whether the site falls near to polluted stretch of river identified by the CPCB/MoEF&CC, ifyes give details.
vi. Ground water monitoring at minimum at 8 locations shall be included.
vii. Noise levels monitoring at 8 locations within the study area.
viii. Soil Characteristic as per CPCB guidelines.
ix. Traffic study of the area, type of vehicles, frequency of vehicles for transportation of materials,additional traffic due to proposed project, parking arrangement etc.
x. Detailed description of flora and fauna (terrestrial and aquatic) existing in the study areashall be given with special reference to rare, endemic and endangered species. If Schedule-Ifauna are found within the study area, a Wildlife Conservation Plan shall be prepared andfurnished.
xi. Socio-economic status of the study area.
228

STANDARD TERMS OF REFERENCE (TOR) FOR EIA/EMP REPORT FOR PROJECTS/ACTIVITIES REQUIRING ENVIRONMENT CLEARANCE
7) Impact and Environment Management Plan
i. Assessment of ground level concentration of pollutants from the stack emission based onsite-specific meteorological features. In case the project is located on a hilly terrain, theAQIP Modelling shall be done using inputs of the specific terrain characteristics fordetermining the potential impacts of the project on the AAQ. Cumulative impact of all sourcesof emissions (including transportation) on the AAQ of the area shall be assessed. Details ofthe model used and the input data used for modelling shall also be provided. The air qualitycontours shall be plotted on a location map showing the location of project site, habitationnearby, sensitive receptors, if any.
ii. Water Quality modelling - in case of discharge in water body
iii. Impact of the transport of the raw materials and end products on the surrounding environmentshall be assessed and provided. In this regard, options for transport of raw materials andfinished products and wastes (large quantities) by rail or rail-cum road transport or conveyor-cum-rail transport shall be examined.
iv. A note on treatment of wastewater from different plant operations, extent recycled and reusedfor different purposes shall be included. Complete scheme of effluent treatment. Characteristicsof untreated and treated effluent to meet the prescribed standards of discharge under E(P)Rules.
v. Details of stack emission and action plan for control of emissions to meet standards.
vi. Measures for fugitive emission control
vii. Details of hazardous waste generation and their storage, utilization and management. Copiesof MOU regarding utilization of solid and hazardous waste in cement plant shall also beincluded. EMP shall include the concept of waste-minimization, recycle/reuse/recovertechniques, Energy conservation, and natural resource conservation.
viii. Proper utilization of fly ash shall be ensured as per Fly Ash Notification, 2009. A detailedplan of action shall be provided.
ix. Action plan for the green belt development plan in 33 % area i.e. land with not less than1,500 trees per ha. Giving details of species, width of plantation, planning schedule etc. shallbe included. The green belt shall be around the project boundary and a scheme for greeningof the roads used for the project shall also be incorporated.
x. Action plan for rainwater harvesting measures at plant site shall be submitted to harvestrainwater from the roof tops and storm water drains to recharge the ground water and also touse for the various activities at the project site to conserve fresh water and reduce the waterrequirement from other sources.
xi. Total capital cost and recurring cost/annum for environmental pollution control measuresshall be included.
xii. Action plan for post-project environmental monitoring shall be submitted.
229

STANDARD TERMS OF REFERENCE (TOR) FOR EIA/EMP REPORT FORPROJECTS/ACTIVITIES REQUIRING ENVIRONMENT CLEARANCE
xiii. Onsite and Offsite Disaster (natural and Man-made) Preparedness and Emergency ManagementPlan including Risk Assessment and damage control. Disaster management plan should belinked with District Disaster Management Plan.
8) Occupational health
i. Plan and fund allocation to ensure the occupational health & safety of all contract and casualworkers
ii. Details of exposure specific health status evaluation of worker. If the workers' health is beingevaluated by pre designed format, chest x rays, Audiometry, Spirometry, Vision testing (Far& Near vision, colour vision and any other ocular defect) ECG, during pre placement andperiodical examinations give the details of the same. Details regarding last month analyzeddata of above mentioned parameters as per age, sex, duration of exposure and departmentwise.
iii. Details of existing Occupational & Safety Hazards. What are the exposure levels of hazardsand whether they are within Permissible Exposure level (PEL). If these are not within PEL,what measures the company has adopted to keep them within PEL so that health of the workerscan be preserved,
iv. Annual report of heath status of workers with special reference to Occupational Health andSafety.
9) Corporate Environment Policy
i. Does the company have a well laid down Environment Policy approved by its Board ofDirectors? If so, it may be detailed in the EIA report.
ii. Does the Environment Policy prescribe for standard operating process / procedures to bringinto focus any infringement / deviation / violation of the environmental or forest norms /conditions? If so, it may be detailed in the EIA.
iii. What is the hierarchical system or Administrative order of the company to deal with theenvironmental issues and for ensuring compliance with the environmental clearanceconditions? Details of this system may be given.
iv. Does the company have system of reporting of non compliances / violations of environmentalnorms to the Board of Directors of the company and / or shareholders or stakeholders atlarge? This reporting mechanism shall be detailed in the EIA report
10) Details regarding infrastructure facilities such as sanitation, fuel, restroom etc. to be provided to thelabour force during construction as well as to the casual workers including truck drivers duringoperation phase.
11) Enterprise Social Commitment (ESC)
i. Adequate funds (at least 2.5 % of the project cost) shall be earmarked towards the EnterpriseSocial Commitment based on Public Hearing issues and item-wise details along with time
230
STANDARD TERMS OF REFERENCE (TOR) FOR EIA/EMP REPORT FOR PROJECTS/ACTIVITIES REQUIRING ENVIRONMENT CLEARANCE
bound action plan shall be included. Socio-economic development activities need to beelaborated upon.
12) Any litigation pending against the project and/or any direction/order passed by any Court of Lawagainst the project, if so, details thereof shall also be included. Has the unit received any noticeunder the Section 5 of Environment (Protection) Act, 1986 or relevant Sections of Air and WaterActs? If so, details thereof and compliance/ATR to the notice(s) and present status of the case.
13) 'A tabular chart with index for point wise compliance of above TOR.
B. SPECIFIC TERMS OF REFERENCE FOR EIASTUDIES FORDISTILLERIES
1. List of existing distillery units in the study area along with their capacity and sourcing of rawmaterial.
2. Number of working days of the distillery unit.
3. Details of raw materials such as molasses/grains, their source with availability.
4. Details of the use of steam from the boiler.
5. Surface and Ground water quality around proposed spent wash storage lagoon, and compost yard.
6. Plan to reduce spent wash generation within 6-8 KL/KL of alcohol produced.
7. Proposed effluent treatment system for molasses/grain based distillery (spent wash, spent lees,condensate and utilities) as well as domestic sewage and scheme for achieving zero effluent discharge(ZLD).
8. Proposed action to restrict fresh water consumption within 10 KL/KL of alcohol production.
9. Details about capacity of spent wash holding tank, material used, design consideration. No. ofpeizometers to be proposed around spent wash holding tank.
10. Action plan to control ground water pollution.
11. Details of solid waste management including management of boiler ash, yeast, etc. Details ofincinerated spent wash ash generation and its disposal.
12. Details of bio-composting yard (if applicable).
13. Action plan to control odour pollution.
14. Arrangements for installation of continuous online monitoring system (24x7 monitoring device)
***
231

528

529

530