ENPRO INDUSTRIES
26
INVESTOR PRESENTATION Q2 2019 ENPRO INDUSTRIES
-
Upload
khangminh22 -
Category
Documents
-
view
2 -
download
0
Transcript of ENPRO INDUSTRIES

INVESTOR PRESENTATIONQ2 2019
ENPRO INDUSTRIES

FORWARD LOOKING STATEMENTSStatements made in the course of this presentation that express a belief, expectation or intention, as well as those that are not historical fact, are forward-looking statements under the Private Securities Litigation Reform Act of 1995. They involve a number of risks and uncertainties that may cause actual events and results to differ materially from such forward-looking statements. These risks and uncertainties include, but are not limited to: general economic conditions in the markets served by our businesses, some of which are cyclical and experience periodic downturns; prices and availability of raw materials; the impact of fluctuations in relevant foreign currency exchange rates; unanticipated delays or problems in introducing new products; the incurrence of contractual penalties for the late delivery of long lead-time products; announcements by competitors of new products, services or technological innovations; changes in our pricing policies or the pricing policies of our competitors; and the amount of any payments required to satisfy contingent liabilities related to discontinued operations of our predecessors, including liabilities for certain products, environmental matters, employee benefit obligations and other matters. Our filings with the Securities and Exchange Commission, including the Form 10-K for the year ended December 31, 2018, describe these and other risks and uncertainties in more detail. We do not undertake to update any forward-looking statement made in this presentation or during the course of the conference call to reflect any change in management's expectations or any change in the assumptions or circumstances on which such statements are based.
We own a number of direct and indirect subsidiaries and, from time to time, we may refer collectively to EnPro and one or more of our subsidiaries as “we” or to the businesses, assets, debts or affairs of EnPro or a subsidiary as “ours.” These and similar references are for convenience only and should not be construed to change the fact that EnPro and each subsidiary is an independent entity with separate management, operations, obligations and affairs.
This presentation also contains certain non-GAAP financial measures as defined by the Securities and Exchange Commission. A reconciliation of these measures to the most directly comparable GAAP equivalents is included as an appendix to this presentation.
2

WHO IS ENPRO?
3
Leading provider of highly-engineered solutions for mission critical applications

WE ARE A PURPOSE-DRIVEN COMPANY WITH STRONG VALUES, A
FORWARD-THINKING OPERATING PHILOSOPHY,
AND A WAY OF WORKING THAT DRIVES BEST-IN-CLASS VALUE
CREATION OVER THE LONG-TERM.
CUSTOMIZED SOLUTIONS FOR THE MOST DEMANDING APPLICATIONS
HUMAN DEVELOPMENT THROUGH THE WAY WE WORK
COMMITMENT TO SOCIALLY AND ENVIRONMENTALLY RESPONSIBLE PRACTICES
ENPRO MISSION AND VISION
4

FOCUSED ON DISCIPLINED EXECUTION, TALENT AND GROWTH
COMPANY OVERVIEW
HISTORY 2002 spin-off from Goodrich Corporation
HEADQUARTERS Charlotte, N.C.
MANUFACTURING 30 primary facilities globally
EMPLOYEES ~6,000
CUSTOMERS 50,000+
SALES BY GEOGRAPHYSALES BY SEGMENT SALES BY MARKETREVENUE COMPOSITION (2018)
LTM 3/31/19REVENUE
$1.5B
LTM 3/31/19 ADJUSTED
EBITDA$209M
LTM 3/31/19 ADJUSTED
EBITDA Margin13.7%
MARKET CAP(1) $1.4B
DIVIDEND YIELD(1) 1.5%
2018 AFTERMARKET
RELATED REVENUE
52%
(1) Trading metrics as of 5/3/19
ATTRACTIVE PORTFOLIO OF BUSINESSES
5
#1-3 POSITION IN PRIMARY MARKETS
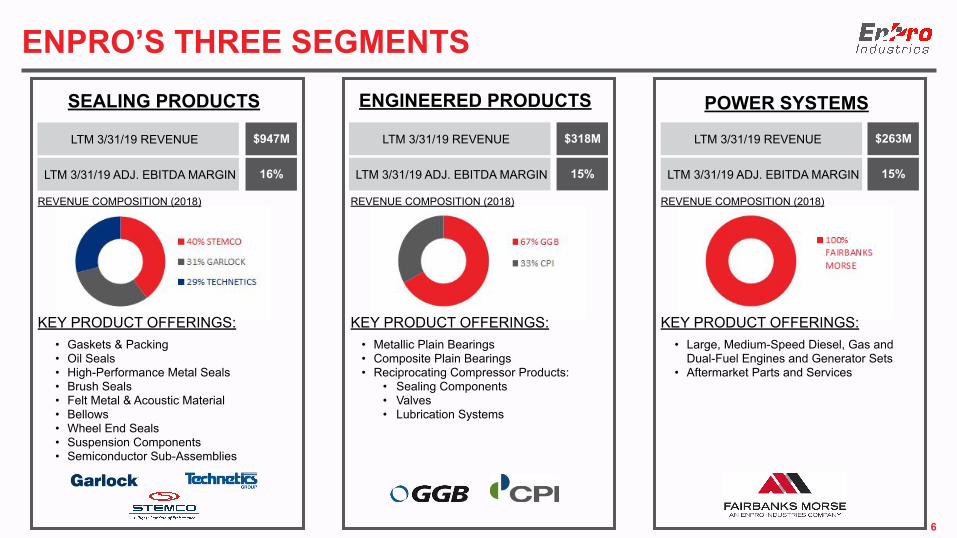
ENGINEERED PRODUCTS
LTM 3/31/19 REVENUE $947M
LTM 3/31/19 ADJ. EBITDA MARGIN 16%
SEALING PRODUCTS
LTM 3/31/19 REVENUE $318M
LTM 3/31/19 ADJ. EBITDA MARGIN 15%
POWER SYSTEMS
LTM 3/31/19 REVENUE $263M
LTM 3/31/19 ADJ. EBITDA MARGIN 15%
KEY PRODUCT OFFERINGS:• Gaskets & Packing• Oil Seals• High-Performance Metal Seals• Brush Seals• Felt Metal & Acoustic Material• Bellows• Wheel End Seals• Suspension Components• Semiconductor Sub-Assemblies
• Metallic Plain Bearings• Composite Plain Bearings• Reciprocating Compressor Products:
• Sealing Components• Valves• Lubrication Systems
KEY PRODUCT OFFERINGS:• Large, Medium-Speed Diesel, Gas and
Dual-Fuel Engines and Generator Sets• Aftermarket Parts and Services
KEY PRODUCT OFFERINGS:
ENPRO’S THREE SEGMENTS
6
REVENUE COMPOSITION (2018) REVENUE COMPOSITION (2018) REVENUE COMPOSITION (2018)

DIVERSIFIED BLUE-CHIP CUSTOMER BASE
7

Leadership in high-value niche markets with established, premium brands
Supporting mission-critical applications in highly demanding and extreme operating environments
Low-cost relative to applications served; value-based pricing leverage
Applying manufacturing know-how and trade secrets; significant application and technical expertise
Embedded with our customers; substantial switching costs and barriers to entry
SEALING PRODUCTS
• Nuclear reactor pressure vessel seals• Aircraft engine seals & landing gear bearings• Petroleum/chemical refinery process sealing• Class 8 truck wheel ends & suspensions• Semiconductor fab systems• Isolation seals for pipelines
POWER SYSTEMS
• Large, medium-speed diesel engines for navy ships and power generation applications
• Aftermarket parts and services
ENGINEERED PRODUCTS
• Polymer-metal plain bearings for automotive applications
• Composite plain bearings for fluid power applications
• Wear parts for large reciprocating compressors• Compressor lubrication systems• Emission reduction products
STRENGTHS PRODUCTS
LEVERAGING OUR STRENGTHS FOR MISSION CRITICAL PRODUCTS
8

1
2
3
4
5
ENPRO STRATEGY
Execute on segment-specific strategic prioritiesPriorities are tailored to each segment’s best opportunities for value creation
Leverage the EnPro Operating System for continuous improvement and ongoing shareholder value; still early innings of opportunity2019 priorities include increasing margins and cash flow
Focus on growing in markets where we have competitive advantage Allocating resources to growing in attractive markets where we have competitive advantage
Target bolt-on acquisitions Bolt-on acquisitions that support business unit strategies; focus areas include aerospace, semiconductor and hygienic markets
Maintain a balanced approach to capital allocation Disciplined capital allocation philosophy, targeting a net leverage ratio of 1.5x – 2.0x
9

ENPRO OPERATING SYSTEM
Combines capabilities that improve productivity, efficiency and innovation in all business units
World class standard is always maintained
Learning mentality and ownership-based leadership
Everyone must play for EnPro
Learn from others, contribute to others, ensure commitment and accountability
10

UNDERLYING TRENDS WILL DRIVE LONG-TERM GROWTH
SEMICONDUCTOR HYGIENIC AEROSPACE
DIGITAL ECONOMY HEALTH NEEDS RISING STANDARDS OF LIVINGIncreased demand for semiconductor logic and memory:
• Artificial Intelligence• Automation and robotics• Autonomous vehicles• Smart appliances
Increased pharmaceutical demand due to greater life expectancy
Emerging middle class demand for safer foods and medicines
Product safety regulations
Increased demand for air travel
New aircraft deliveries and strong backlogs; airlines transitioning to more fuel-efficient platforms
11

DRIVING INNOVATION TO UNLOCK FURTHER VALUE
SEALING PRODUCTS
ENGINEEREDPRODUCTS
POWERSYSTEMS
GYLON® EPIX
PROFLO® EOS
TRIDENT® OP
TRIFECTA®
COMMON RAIL FUEL INJECTION SYSTEM
HYDRODYNAMIC SEALS
EMISSIONS GUARD TRIBOLOGICAL COATINGS
12

2018 CAPITAL ALLOCATION
REINVEST IN THE BUSINESS
• $66 million in capital expenditures; expected to moderate beginning in FY19
• Approximately 44% maintenance-related and balance focused on growth
STRATEGICACQUISITIONS
• High technical know-how, IP-rich offering• Experienced management with proven track record• Balanced mix between OEM and aftermarket
RETURN CASH TO
SHAREHOLDERS
• Current dividend yield of 1.5%(1)
• Approximate 4% increase in quarterly dividend; $0.25 declared on February 13
• $50 million in share repurchase in 2018; new authorization for $50 million in October 2018
2018 CAPITAL ALLOCATION ($M)
(1) Dividend yield as of 5/3/19 13

M&A FILTERS
ACTIVE PIPELINE FOR STRATEGIC ACQUISITIONS WILL CONTINUE TO CREATE VALUE
STRATEGIC FIT
SYNERGIES
FINANCIALPROFILE
• Highly engineered products often with mission critical applications; “high value niches”• Intellectual property / proprietary technology or know-how• Attractive and growing end markets; cycle resistant• Low customer/supplier concentrations
• Product Synergies – Fill in portfolio gaps, thereby creating a more compelling value proposition• Technology Synergies – Leverage each company’s technology to enhance the other’s product offering• Customer Synergies – Sell EnPro’s products through the target’s customer relationship or vice versa• Channel Synergies – Leverage each company’s channel to market to accelerate growth• Operating Synergies – Significantly reduce costs through scale or elimination of redundancies
• Favorable margins with attractive free cash flow profile• Strong CFROI• EPS accretive
14

15
2019 GUIDANCEGUIDANCE COMMENTARY (1)
● Expect full-year adjusted EBITDA to be between $224 and $232 million and adjusted diluted EPS to be between $4.25 to $4.52
● Revised range reflects the impact of the stronger dollar on the EDF contract in Power Systems
2019 Guidance(1)
Low High
Adjusted EBITDA $224M $232M
Adjusted EPS $4.25 $4.52
(1) Ranges exclude changes in the number of shares outstanding, impacts from future acquisitions and acquisition-related costs, restructuring costs, incremental impacts of tariffs and trade tensions on market demand and costs subsequent to the end of the first quarter, the impact of foreign exchange rate changes subsequent to the end of the first quarter and environmental and any select legacy litigation charges.Adjusted EBITDA and adjusted diluted EPS are determined in a manner consistent with the presentation of such items in EnPro’s earnings release dated May 1, 2019 included in EnPro’s Form 8-K filed on May 2, 2019.
APPENDIX
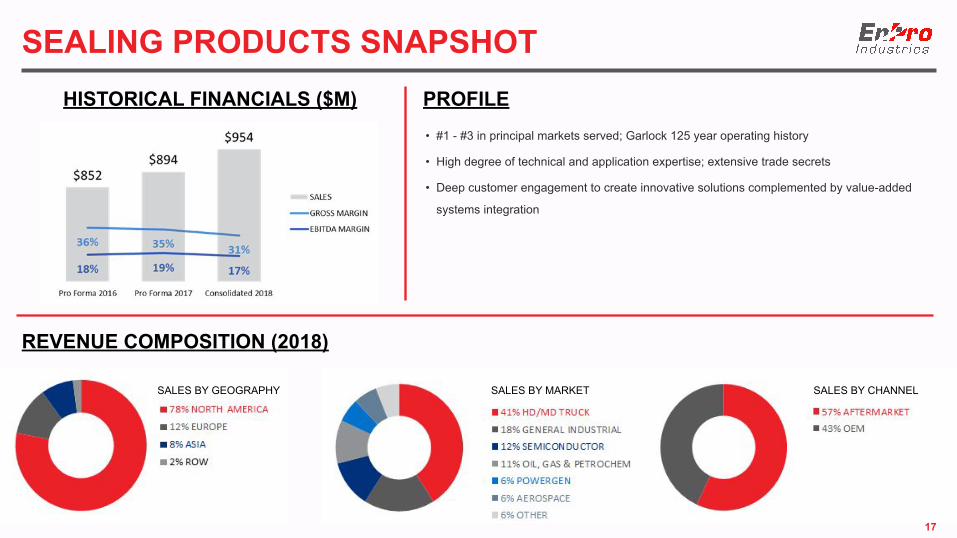
SEALING PRODUCTS SNAPSHOT
REVENUE COMPOSITION (2018)
SALES BY GEOGRAPHY SALES BY CHANNELSALES BY MARKET
HISTORICAL FINANCIALS ($M) PROFILE• #1 - #3 in principal markets served; Garlock 125 year operating history
• High degree of technical and application expertise; extensive trade secrets
• Deep customer engagement to create innovative solutions complemented by value-added
systems integration
17
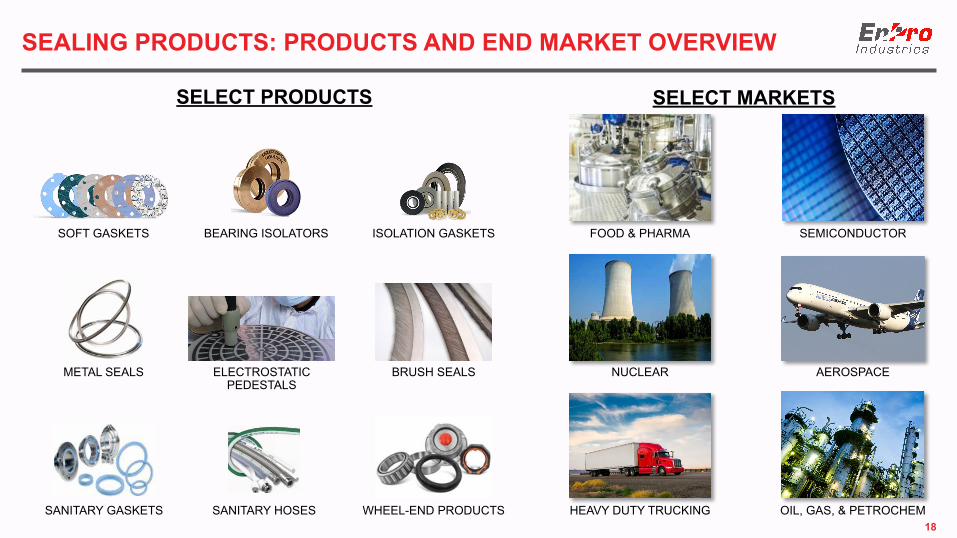
SEALING PRODUCTS: PRODUCTS AND END MARKET OVERVIEW
SELECT MARKETS
SOFT GASKETS
SELECT PRODUCTS
ISOLATION GASKETSBEARING ISOLATORS
SANITARY HOSESSANITARY GASKETS OIL, GAS, & PETROCHEMHEAVY DUTY TRUCKINGWHEEL-END PRODUCTS
NUCLEAR
FOOD & PHARMA SEMICONDUCTOR
AEROSPACEMETAL SEALS ELECTROSTATIC PEDESTALS
BRUSH SEALS
18

ENGINEERED PRODUCTS SNAPSHOT
REVENUE COMPOSITION (2018)
SALES BY GEOGRAPHY SALES BY CHANNELSALES BY MARKET
HISTORICAL FINANCIALS ($M) PROFILE• Leading brands
• Technology and market leadership in plain bearings
• High degree of tribological and applications expertise in bearings
• Strong aftermarket presence in oil & gas and petrochemical
19

ENGINEERED PRODUCTS: PRODUCTS AND END MARKET OVERVIEW
METAL POLYMER BEARING
DRY BEARING FILAMENT WOUND BEARING
AEROSPACE
GENERAL INDUSTRIAL AUTOMOTIVE
SELECT MARKETSSELECT PRODUCTS
NATURAL GASPET BOTTLE MANUFACTURING
PETROCHEM
PACKING CASES PISTON & RIDER RINGS
HIGH-FLOW VALVES
MONITORING DEVICES
TRIBOLOGICAL SOLUTIONS
20
SOLID POLYMER BEARING
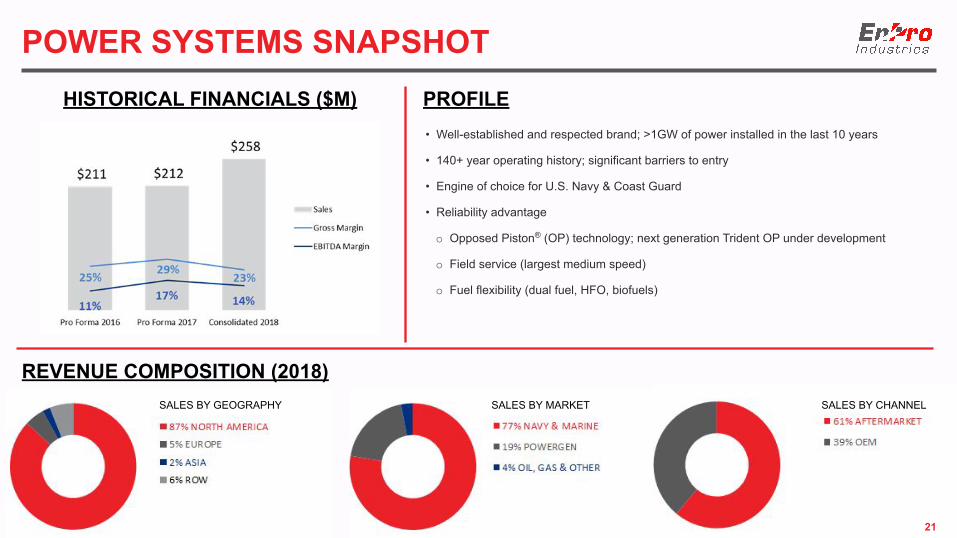
POWER SYSTEMS SNAPSHOT
REVENUE COMPOSITION (2018)SALES BY GEOGRAPHY SALES BY CHANNELSALES BY MARKET
HISTORICAL FINANCIALS ($M) PROFILE• Well-established and respected brand; >1GW of power installed in the last 10 years
• 140+ year operating history; significant barriers to entry
• Engine of choice for U.S. Navy & Coast Guard
• Reliability advantage
o Opposed Piston® (OP) technology; next generation Trident OP under development
o Field service (largest medium speed)
o Fuel flexibility (dual fuel, HFO, biofuels)
21

POWER SYSTEMS: PRODUCTS AND END MARKETS OVERVIEW
SELECT PRODUCTS SELECT MARKETS AND APPLICATIONS
MARINE
DEFENSE
COMMERCIAL
POWERGEN
NUCLEAR
INDUSTRIAL
MUNICIPAL
SOLUTIONS
SERVICE
ANALYTICS
ALTERNATIVE FUELS
22

RECONCILIATION OF LTM RESULTS
23

RECONCILIATION OF ADJUSTED EBITDA
24
(Stated in Millions of Dollars)

RECONCILIATION OF ADJUSTED SEGMENT EBITDA
25
(Stated in Millions of Dollars)

26
NET DEBT & LIQUIDITY SUMMARY
(1) Includes impact from unamortized debt issue costs.