Improved intertask coordination after extensive dual-task practice
Individual Retinal Progenitor Cells Display ExtensiveHeterogeneity of Gene ExpressionJeffrey M. Trimarchi1, Michael B. Stadler2, Constance L. Cepko1,3*
1 Department of Genetics, Harvard Medical School, Boston, Massachusetts, United States of America, 2 Friedrich Miescher Institute for Biomedical Research, Basel,
Switzerland, 3 Howard Hughes Medical Institute, Harvard Medical School, Boston, Massachusetts, United States of America
Abstract
The development of complex tissues requires that mitotic progenitor cells integrate information from the environment. Thehighly varied outcomes of such integration processes undoubtedly depend at least in part upon variations among the geneexpression programs of individual progenitor cells. To date, there has not been a comprehensive examination of thesedifferences among progenitor cells of a particular tissue. Here, we used comprehensive gene expression profiling to definethese differences among individual progenitor cells of the vertebrate retina. Retinal progenitor cells (RPCs) have beenshown by lineage analysis to be multipotent throughout development and to produce distinct types of daughter cells in atemporal, conserved order. A total of 42 single RPCs were profiled on Affymetrix arrays. In situ hybridizations performed onboth retinal sections and dissociated retinal cells were used to validate the results of the microarrays. An extensive amountof heterogeneity in gene expression among RPCs, even among cells isolated from the same developmental time point, wasobserved. While many classes of genes displayed heterogeneity of gene expression, the expression of transcription factorsconstituted a significant amount of the observed heterogeneity. In contrast to previous findings, individual RPCs werefound to express multiple bHLH transcription factors, suggesting alternative models to those previously developedconcerning how these factors may be coordinated. Additionally, the expression of cell cycle related transcripts showeddifferences among those associated with G2 and M, versus G1 and S phase, suggesting different levels of regulation forthese genes. These data provide insights into the types of processes and genes that are fundamental to cell fate choices,proliferation decisions, and, for cells of the central nervous system, the underpinnings of the formation of complex circuitry.
Citation: Trimarchi, JM, Stadler MB, Cepko CL (2008) Individual Retinal Progenitor Cells Display Extensive Heterogeneity of Gene Expression. PLoS ONE 3(2):e1588. doi:10.1371/journal.pone.0001588
Editor: Patrick Callaerts, Katholieke Universiteit Leuven, Belgium
Received October 1, 2007; Accepted January 15, 2008; Published February 13, 2008
Copyright: � 2008 Trimarchi et al. This is an open-access article distributed under the terms of the Creative Commons Attribution License, which permitsunrestricted use, distribution, and reproduction in any medium, provided the original author and source are credited.
Funding: This work was supported by a National Eye Institute grant EY08064 and a Ruth L. Kirchenstein National Research Service Award F32 EY014495 (JMT).
Competing Interests: The authors have declared that no competing interests exist.
*E-mail: [email protected]
Introduction
One key question in developmental biology is how progenitor
cells, cells that are still dividing and have not as yet chosen any
particular cellular fate, are specified to generate a precise set of cell
types. In the nervous system, this question is of further interest,
since the formation of the proper neuronal circuitry often depends
upon the generation of particular types of neurons in the
appropriate location and with the correct timing. The exact
mechanisms that control these processes in neural progenitor cells
are not well understood at present, but are believed to involve
some combination of extrinsic signaling pathways and intrinsic
factors [1,2,3]. It has been noted that a fairly small number of
signaling pathways are used iteratively in development, with very
different outcomes, not only across tissues, but even within a single
developing tissue [4,5]. The distinct outcomes must be in large
part due to differences among individual progenitor cells.
However, to date, there has not been a comprehensive analysis
of the differences among progenitor cells within any developing
tissue. There have been a few studies that have begun to examine
gene expression at a single cell level, but they were constrained
either due to the small number of genes sampled [6,7,8] or due to
the small number of cells profiled [9,10]. Without an approach
that involves a full complement of transcripts and many more cells,
one cannot gain an appreciation of the contribution of progenitor
cell heterogeneity to the production of the many types of progeny
cells within a tissue. Beyond the obvious interest in this question
for developmental biologists, therapeutic strategies reliant upon
stem cells will need such information to direct stem cells into
particular progenitor cell states.
The vertebrate retina has served as a model system for the
development of the central nervous system (CNS). Although it
contains only six major neuronal cell types and one glial cell type
[11], further distinctions among the neurons relevant to circuitry
and information transformations show that there is at least 50
types of cells in the mature retina [12]. Lineage analyses in several
species have shown that these cell types are produced from a pool
of multipotent progenitor cells throughout development
[13,14,15], with even terminal divisions capable of giving rise to
two very different cell types, such as a photoreceptor cell and an
interneuron. [3H]-thymidine based birthdating studies have
demonstrated that these retinal cell types are generated in
overlapping intervals and with a conserved birth order
[16,17,18]. The major output neuron, the retinal ganglion cell,
is the first to be generated, followed by the onset of cone
photoreceptor and horizontal cell (an interneuron) genesis shortly
thereafter (reviewed in [19]). The appearance of another type of
interneuron, the amacrine cell, occurs slightly later still, with rod
PLoS ONE | www.plosone.org 1 February 2008 | Volume 3 | Issue 2 | e1588
photoreceptor cells, bipolar cells (another interneuron type) and
Muller glia being the latest born retinal cell types (reviewed in
[19].
The classical studies cited above set the stage for further
analyses of RPCs. Among the key questions addressed through
several experimental protocols was whether the RPCs were
equivalent throughout development. To examine this possibility,
mixing experiments where RPCs from different development
stages were either co-cultured with cells of different ages [20,21] or
transplanted [22], demonstrated that RPCs were not equivalent
throughout development. While environmental factors could
influence the relative proportions of the different cell types
produced, these signals could not induce the RPCs to generate
temporally inappropriate cell types [20,21,22]. In addition, culture
of isolated RPCs led to the formation of clones with the
composition of those formed in vivo [23]. These findings led to
the idea that RPCs pass through a series of competence states
where these cells can only produce a subset of retinal cell types [1].
Additionally, these states are intrinsically defined. An attractive
hypothesis for how this is achieved involves the dynamic
expression of different combinations of transcription factors at
distinct times [1]. The competence model for retinal development
received strong support from studies in the ventral nerve cord of
Drosophila melanogaster [24]. In this organism, the temporal order of
neuronal progeny produced by neuroblasts is driven by the well
defined sequential expression of the transcription factors Hunch-
back (Hb), Kruppel (Kr), Pdm and Castor [24]. Experiments in
which the expression of Hb was maintained beyond its normal
window resulted in an extension of the early competence state and
a corresponding increase in the number of early born neurons
generated [25]. When this enforced expression of Hb was
removed, neuroblasts expressed Kr and continued on to the later
competence states [25].
The genes that define the particular RPC competence states as
well as those that regulate the transitions between them are only
just beginning to be identified. Large scale gene expression
profiling studies have been utilized as a first step toward revealing
all of the potential transcripts involved in RPC biology
[26,27,28,29]. However, previous microarray and SAGE based
screening studies focused on the entire retina, thus homogenizing
the tissue and potentially obscuring underlying heterogeneity
[27,28,29]. Nonetheless, a handful of genes have been identified as
being expressed in subsets of RPCs [30,31,32,33,34,35] including
some genes that displayed a temporally restricted expression
pattern [27]. However, it was unclear from these studies how
similar or different individual RPCs were relative to each other,
both across developmental time and at specific timepoints [27].
To begin to assess the degree of gene expression heterogeneity
among RPCs, individual retinal cells were harvested from six
different developmental timepoints ranging from embryonic day
12.5 (E12.5) through postnatal day 0 (P0). Included within this
population were newborn neurons, as well as a few neurons
further along in their differentiation program. The transcriptomes
from these cells were used to classify each cell as an RPC, a cell in
transition between an RPC and a neuron, or a neuron. In total, 64
cells were profiled on Affymetrix mouse 430 2.0 oligonucleotide
arrays, encompassing 36 RPCs, 6 transitional cells and 22
neurons. Examination of the gene expression profiles from these
cells revealed an extensive amount of heterogeneity among RPCs,
even among those RPCs isolated from the same day of
development. In particular, transcription factors were responsible
for a significant amount of the observed heterogeneity. Cell cycle
regulators also accounted for some of the differences in gene
expression among RPCs. Interestingly, genes that have been more
associated with the G2 phase of the cell cycle displayed more
heterogeneity than those that have been linked with the G1 phase,
pointing to possible differences in how these genes are regulated. A
more in depth examination of the G2 RPCs revealed additional
genes that may be correlated with the production of postmitotic
neurons from RPCs. Surprisingly, it appears that different RPCs
might be using different genes to regulate exit from the cell cycle.
In situ hybridizations on retinal cryosections and dissociated retinal
cells allowed for validation and quantitative extension of the
observed heterogeneity in the microarray data. The results from
this study provide the most comprehensive and in depth
examination of dynamic gene expression patterns of individual
cells in a developing tissue, and suggest that progenitor cell
heterogeneity plays a major role in the production of the distinct
cell types comprising complex tissues.
Materials and Methods
Single cell collection and PCR based cDNA amplificationSingle retinal cells were isolated, their mRNAs were reverse
transcribed, and the resulting cDNAs were PCR amplified exactly
as described previously [36]. Briefly, retinas were dissected from
CD-1 (Charles River Laboratories) mouse embryos and dissoci-
ated to single cells through the combination of papain (Worthing-
ton Biochemical) digestion and gentle trituration. Cells were
washed, pelleted and resuspended in PBS (pH 7.4) containing
0.1% BSA. Individual retinal cells were harvested using a mouth
pipette and a capillary (Sigma) drawn into a fine glass needle.
Single cells were captured by allowing capillary action to draw
them into the needle. To ensure that only one cell was picked,
each collected cell was expelled into a plate containing fresh PBS/
0.1% BSA and re-harvested with a different needle. The single
cells were expelled into cold lysis buffer (10 mM Tris-HCl
[pH 8.3], 50 mM KCl, 1.5 mM MgCl2, 5 mM DTT, 0.5% NP-
40) and reverse transcribed using Superscript II (Invitrogen)
combined with an oligo dT primer. This first strand cDNA
product was tailed with A’s using terminal deoxynucleotidyl
transferase (TdT) and PCR amplified for 35 cycles using the same
oligo dT primer. Subsequent gene specific PCR reactions for pax6,
chx10 and cyclin D1 were performed using the primer pairs detailed
previously [36].
Affymetrix array hybridizationTen micrograms of each single cell cDNA was digested with
DNase I (Roche) for 13 minutes at 37uC, heated to 99uC for
15 minutes and biotin labeled using Biotin N6 ddATP (Enzo
Biosciences) and TdT (Roche) at 37uC for 1.5 hours. The
Affymetrix microarrays were prepared and hybridized using
standard Affymetrix protocols [9,36]. To facilitate comparisons
among microarrays, global scaling was performed using the
Affymetrix Microarray software (MAS 5.0) and the target intensity
was set to 500. The resulting signal data for each probe set was
exported as a tab delimited text file and subsequent analyses were
performed using Microsoft Excel. The raw and processed
Affymetrix data files have been deposited in the NCBI Gene
Expression Omnibus (GEO, http://www.ncbi.nlm.nih.gov/geo/)
and are accessible through GEO series accession numbers
GSE9811 and GSE9812.
Detection of associated genesHierarchical clustering. Prior to any clustering analysis, the
single cell data were filtered such that any probe set that did not
reach a signal level of 1000 in at least one single cell was removed.
Hierarchical cluster associations were determined using gene
Single RPC Gene Expression
PLoS ONE | www.plosone.org 2 February 2008 | Volume 3 | Issue 2 | e1588
Cluster software [37] and visualized in Treeview [37]. Genes were
chosen as clustering closely together by this method if the
correlation coefficient for their association was ..75.
Fisher’s exact test. Probe sets were filtered such that only
those that achieved at least a single value of 1000 or greater in at
least one single cell were retained. The signal values from all 128
microarrays (includes RPCs from this study, developing ganglion,
amacrine and photoreceptor cells [36], bipolar cells [Kim et al, in
press], amacrine cells [Cherry et al, in preparation] and Muller
glia [Roesch et al, in press]) were binned into 5 equally sized bins
(for details on bin number choice see [36]). All probe set pairs were
then analyzed for association using the following procedure: First,
a contingency table with n rows and n columns was obtained that
recorded the joint distribution over bins for a given probe set pair.
A P value for significant association was then calculated from this
table using Fisher’s exact test.
Visual inspection in Microsoft Excel. The single cell data
were filtered such that signal values less than 1000 were removed.
A value of 1000 was chosen as the background level because in
general across the data set the Affymetrix algorithm labeled these
signals with an absent call. In a limited number of replicate
experiments (where the same cDNA was labeled independently
more than once), Affymetrix present calls were extremely
reproducible in terms of signal value, while the actual signal
values for the absent calls varied somewhat widely. Importantly,
genes whose signals were labeled as absent in one run were never
labeled as present by the Affymetrix algorithm in a replicate run,
regardless of their values. To isolate genes with heterogeneous
expression patterns in RPCs, the 42 RPCs identified by the
classification method described in this study were compared both
among themselves and to the developing RGC, AC and PR cells
[36].
Section in situ hybridization. ISH on retinal cryosections
was performed as previously described [38,39] with the
modifications detailed in [36]. A complete list of all the specific
ISH probes used in this study and a summary of their expression
patterns in presented in Table S8.
Dissociated cell in situ hybridization (DISH) and
autoradiography. Retinas were dissected from other ocular
tissues and incubated as intact explants with [3H]-thymidine
(5 mCi/ml in DMEM) for 1 hr. For pulse-chase experiments,
pregnant mice were injected with [3H]-thymidine (10 mCi/g) and
harvested after the indicated times. These labeled retinas were
washed 3 times in PBS (pH 7.4), dissociated with papain, and
plated on poly-D lysine coated slides (10 mg/ml in PBS [Sigma]).
Cells were fixed to the slides with 4% paraformaldehyde (PFA) for
10 min. at room temperature, washed twice in PBS (pH 7.4) and
dehydrated into 100% methanol. DISH was performed on these
cells as previously described [36]. Digoxigenin labeled probes were
detected using a combination of anti-digoxigenin-POD (1:1000,
Roche) and a Cy3 tyramide solution (1:50, PerkinElmer Life
Sciences). To quench the first peroxidase reaction, 0.3% hydrogen
peroxide (in PBS) was used. Fluorescein-labeled probes were then
detected using an anti-fluorescein-POD antibody (1:1000, Roche)
and an Alexa 488-tyramide (1:100, Molecular Probes). The final
reaction was stopped by incubation in 4% PFA for 30 min. The
slides were washed in PBS (pH 7.4), DAPI stained, and then
allowed to dry. To visualize the [3H]-thymidine, slides were
dipped in an autoradiography emulsion (NTB2, Kodak) and
exposed in the dark for either 2 days (in vitro labeling) or 2 weeks
(in vivo labeling). The slides were subsequently immersed in
developer for 2 min. (D19, Kodak), rinsed in dH2O, and
incubated in fixer (Kodak) for 20 min. Finally, the slides were
washed in dH2O for 20 min. and mounted.
Results and DiscussionSingle Cell Isolation
Retinas were collected from six different stages of mouse
development, ranging from E12.5, which is just after the onset of
retinal neurogenesis, to P0, near the end of neurogenesis. These
times were chosen to maximize the number of retinal progenitor
cells (RPCs) harvested and profiled, as well as to provide newborn
neurons and more differentiated cells for comparison. Previous
experiments in mouse and rat led to the prediction that between
90% (E12.5) and 30% (P0) of the cells present at these times should
be RPCs [18,40]. In addition, almost all of the ganglion cells,
horizontal cells, and cone photoreceptors are born during these
timepoints and many rod photoreceptors and amacrine cells are
generated as well (reviewed in [19])[41]. Although many bipolar
cells and Muller glia are generated after P0, there are still a
significant number of these cell types that are born at P0 [41,42].
These birthdating experiments indicate that cells isolated between
E12.5 and P0 can hypothetically capture the gene expression
programs in RPCs that lead to the generation of all the retinal cell
types, as well as the gene expression profiles of many of the
maturing retinal cell types.
The retinas were dissected and dissociated to individual cells
using papain and single cells were harvested using a capillary
pipette drawn into a fine needle (see Materials and Methods and
[36] for more details). Since retinal cells at these early stages of
development do not show definitive morphology, cells were chosen
at random and the post hoc strategy described below was used to
retrospectively classify the cells as RPCs, transitional cells, or
postmitotic neurons. The isolated single cells were lysed and
subjected to a 35 cycle RT-PCR based protocol that was
previously shown to generate a sufficient amount of cDNA (10–
20 mg) for hybridization on Affymetrix microarrays [9,36,43].
Additionally, medium samples were removed from the dish
containing the dissociated cells and subjected to the same RT-
PCR method to control for the presence of cDNAs from lysed cells
within the media.
The quality of the resulting single cell cDNA products was
assessed using several methods. First, the cDNA was examined on
an agarose gel and those preparations that contained products
ranging from 500 bp to 2 kb were subjected to further testing (data
not shown). Media controls consistently failed to exhibit significant
cDNA smears (data not shown). To further evaluate the quality of
the single cell cDNA mixtures, gene specific RT-PCR was
performed using three genes known to be highly expressed in
the developing retina (pax6, chx10 and cyclin D1) [27,44,45,46].
Robust bands were detected in those preparations that displayed
the most robust cDNA smears and bands were routinely not
observed with the media controls (data not shown). One final,
more comprehensive, approach was utilized to assess the single cell
cDNAs. Ten micrograms of cDNA were labeled with Cy5 and
hybridized to cDNA microarrays spotted in our laboratory
[28,47]. These microarrays contained ,12,000 ESTs derived
from the retina (Bento Soares, University of Iowa) and many
retinal expressed genes from our laboratory [47]. Many of the
transcripts spotted on these cDNA microarrays showed significant
signal when hybridized with cDNA from the single cells, whereas
amplifications from media controls did not show signals above
background (data not shown). Taken together, these data
demonstrated that more than 50% of isolated single retinal cells
yielded cDNA of sufficient quantity and quality for more complete
gene expression profiling on Affymetrix microarrays.
Ten micrograms of cDNA from each single cell to be profiled
was DNase treated, labeled with biotinylated ddATP using TdT,
and hybridized to Affymetrix mouse 430 2.0 oligonucleotide
Single RPC Gene Expression
PLoS ONE | www.plosone.org 3 February 2008 | Volume 3 | Issue 2 | e1588
arrays using standard Affymetrix protocols (see Materials and
Methods and [9,36] for full details). These arrays allowed over
34,000 transcripts, nearly the entire mouse transcriptome, to be
potentially sampled for expression in each single cell. The data
were collected and normalized using Affymetrix Microarray
software (MAS 5.0). For each probe set on the array, signal levels,
present/absent calls, and detection p-values were exported to
Microsoft Excel (Table S1). In addition, the Affymetrix data files
for each single cell profiled in this study have been deposited in the
NCBI Gene Expression Omnibus (GEO, http://www.ncbi.nlm.
nih.gov/geo/) and are accessible through GEO series accession
numbers GSE9811 and GSE9812.
In order to gain an appreciation for the level of noise, or
unexpected signals, in the single cell preparations, the signals for
genes predicted not to be expressed within retinal cells were
examined. Signals for immunoglobulin genes (n = 7), cytokeratins
(n = 36), and muscle genes (n = 9) were examined. Signal levels
were almost invariably ,1000 (Table S2 and Figure S1) and were
correspondingly denoted as absent by the Affymetrix algorithm.
For the five genes that showed significant signal, signal was not
present in very many cells (Table S2 and Figure S1). Since
previous work on these genes did not assess retinal expression, it
was not clear whether these signals were due to transcriptional
activity of these loci in the retina, or were false positives due to the
single cell method. Examination of SAGE tags for these genes
showed that expression was detected for 2 of these 5 genes,
suggesting that at least in these cases, there was bona fide retinal
expression. To further assess the robustness of the single cell data,
the levels of housekeeping genes were examined. It was not clear
which genes should be used for this test, as several studies have
demonstrated that housekeeping gene expression is highly
variable, as assayed by microarray [48], SAGE [27,49], or other
profiling methods [50,51,52]. Similar variability has been observed
using preparations of retinal tissue [27,28]. Nonetheless, a list of
control genes for RNA preparations generated by two commercial
vendors (Qiagen and Superarray Bioscience) was used for this test
(Table S3 and Figure S2). Many of the genes were observed to
have somewhat consistent levels of expression across the RPCs
(Table S3 and Figure S2), consistent with their role as housekeeping
genes. However, while each of the genes was present in at least one
single cell, for several of them there was a great deal of variability in
their expression (Table S3 and Figure S2). It was not the case that a
particular cell expressed low levels of all of these genes, as might be
predicted for a poor cDNA preparation. Even within a single cell, a
high degree of variability in the level of signal for individual genes
was observed (Figure S2). These data are consistent with the
observations made using total tissue preparations, and thus are not a
result of the single cell method. It is more likely the case that
assumptions about consistent expression levels of many housekeep-
ing genes are incorrect.
Retinal progenitor cell classificationThe main goal of this study was the determination of the degree
of heterogeneity in gene expression among individual RPCs. The
first step in this process was to identify a particular transcriptional
profile as arising from a cycling RPC instead of a postmitotic
retinal neuron. To accomplish this, a post hoc classification
scheme was devised based upon clusters of co-expressed genes that
were centered around previously identified markers of RPCs,
RGCs, ACs or rod photoreceptors. Cone photoreceptors and
horizontal cells were excluded as none of the single cell profiles
examined appeared to have originated from either of these cell
types, following inspection of the array profiles for markers of these
cell types. This result was not surprising as both cell types are quite
rare [41]. The validity of this classification scheme was first tested
on the set of cells containing developing RGCs, ACs, and PRs
since these cells had already been extensively characterized [36].
To classify a particular single cell as a developing RGC based
upon its gene expression profile, genes strongly associated with the
RGC marker neurofilament light (NF68) were determined. The single
cell expression profiles used to generate this list of genes included
the potential RPCs profiled for this study, developing RGCs and
ACs [36], single mature bipolar cells (Kim et al., in press), single
mature amacrine cells (Cherry et al., in preparation) and single
mature Muller glia (Roesch et al., in press). Using a Fisher’s exact
test (see Materials and Methods and [36]), the probability that
there was a correlation between the distribution of any given gene
and NF68 was calculated. Setting a p-value cutoff of 1023 yielded
81 genes highly associated with NF68 (Table S4). Many genes
previously shown to have significant RGC expression, such as
GAP43 [36], were included in this list. At least one gene known to
be expressed in RGCs, Brn3b, was not found to be strongly
associated with NF68. The reason for the absence of an association
between these two genes most likely is that temporally Brn3b is
turned on in newborn RGCs prior to NF68. In fact, two of the
RPCs (E14 cell B1 and E16 cell F1) identified as transitional cells
in the process of deciding upon a final fate (see below) possessed
significant levels of Brn3b, but were devoid of NF68. Since all of the
cells profiled in this study were isolated during retinal develop-
ment, genes with such temporally distinct windows of expression
would not necessarily be expected to associate together. However,
NF68 and Brn3b were strongly associated by hierarchical clustering
[36]. This lack of correlation again demonstrates the increased
utility of the Fisher’s exact test over other clustering methods for
analyzing gene expression data from single cells.
The relative expression levels for each of the 81 genes associated
strongly with NF68 (as well as NF68 itself) were calculated by
dividing the signal from each single cell by the maximum signal for
that gene across the entire data set of single cells. The scaled values
for each of the 82 genes within each cell were summed. All sums
were then scaled, so that the maximum score was 10, to generate
an RGC score for each single cell (Figure 1). This operation was
carried out for markers of all cell types on all cells, as described
further below. Scaling of the summed scores was required due to
the fact that, for each cell type (below), the number of genes
defining that cell type differed. An examination of the scores for
the 13 previously characterized developing RGCs revealed that,
for 12 of these cells the RGC score was considerably higher than
the RPC, AC or PR score (Figure 1). For one cell, E14 cell E1, the
RPC score and the RGC score were almost the same. Since this
cell was a developing RGC and not isolated from adult tissue, the
most likely explanation for this result is that this is a cell that was
transitioning from an RPC to an RGC. This cell added to the six
RPCs designated as transitioning means a total of 7 cells were
identified as transitional cells, those having characteristic gene
expression of multiple cell types, and these will be discussed in
more detail below.
In a similar manner to that used for RGCs, classification scores
were generated for ACs and PRs using gene clusters built around
the transcription factors TCFAP-2b and Nrl respectively (see Table
S5 and S6 for full clusters). Many of the genes identified as strongly
associated with either TCFAP-2b or Nrl were predicted based upon
previous work that characterized them as having either AC
expression (Lrrn3, TCFAP-2a and Bruno-like 4 for example [36]) or
rod photoreceptor cell expression (Crx, IRBP, Pde6a, Rom1, and
Tulp1 for example [53]). In the TCFAP-2b associated genes, at
least one previously known AC gene, glycine transporter 1, was not
identified (Table S5) because the AC cells isolated in this study
Single RPC Gene Expression
PLoS ONE | www.plosone.org 4 February 2008 | Volume 3 | Issue 2 | e1588
were all GABAergic ACs (as assessed by Gad1 expression [36]).
Using these sets of associated genes to generate classification scores
revealed that 4 out of 4 rod photoreceptor cells (2 adult and 2 P0)
had significantly higher PR scores than the RGCs and ACs
(Figure 1). However, the TCFAP-2b associated genes only yielded
considerably higher AC scores for 3 out of the 6 ACs (Figure 1).
This result demonstrates the sensitive nature of this classification
scheme since it had been previously noted that these single ACs
appeared to fall into 2 distinct classes based upon analysis of their
gene expression using other methods [36]. Additionally, one of
these groups of 3 ACs scored approximately the same for ACs as
they did for RGCs (Figure 1). Again, this points to the robust
nature of this classification scheme as these cells were also
previously observed to have many similarities in gene expression to
developing RGCs [36].
Given the success of this classification scheme in sorting out the
different types of retinal neurons, it was used to distinguish the
profiles of cycling RPCs from those of the developing, but more
committed, retinal cell types. Cyclin D1 has been characterized as a
gene expressed broadly in cycling RPCs [27,44] and, therefore,
this gene was chosen to generate a list of associated genes for
classifying profiled single cells as RPCs. The distribution of cyclin
D1 expression was compared pairwise to the signal levels for every
other gene on the array across 128 single cell profiles in exactly the
same manner as for the RGC, AC and PR markers. This yielded
94 associated genes whose expression was significantly similar in
distribution to cyclin D1 (Table S7). Included in this list were
several ribosomal protein genes and other known RPC expressed
genes such as Fgf15 [27]. The relative expression levels for each of
these genes and scaled scores were calculated (data not shown).
Upon inspection, however, the distribution of these scores was
observed to be very narrow owing to the high levels of expression
for many of these genes in the profiled single cells and the
persistence of many of these transcripts in newborn neurons (data
not shown). Therefore, to improve the classification of cycling
RPCs, additional gene clusters were added to generate a
composite RPC score.
To generate a composite RPC classification score, three
additional genes (Fgf15, Sfrp2 and m-crystallin) were chosen to
generate gene clusters. These genes have been observed previously
in the outer neuroblastic layer (ONBL) of the retina, where the
RPCs reside [27]. These 3 genes were also chosen as they together
accommodate some of the temporal heterogeneity of the RPCs, as
described below. Using the Fisher’s exact test and a cutoff p-value
of 1023 as before, associated genes were identified for each of these
three genes (Table S7). The relative expression levels were
calculated and scaled RPC scores generated. As shown in
Figure 1, 42 cells displayed a significant RPC score. For 36 of
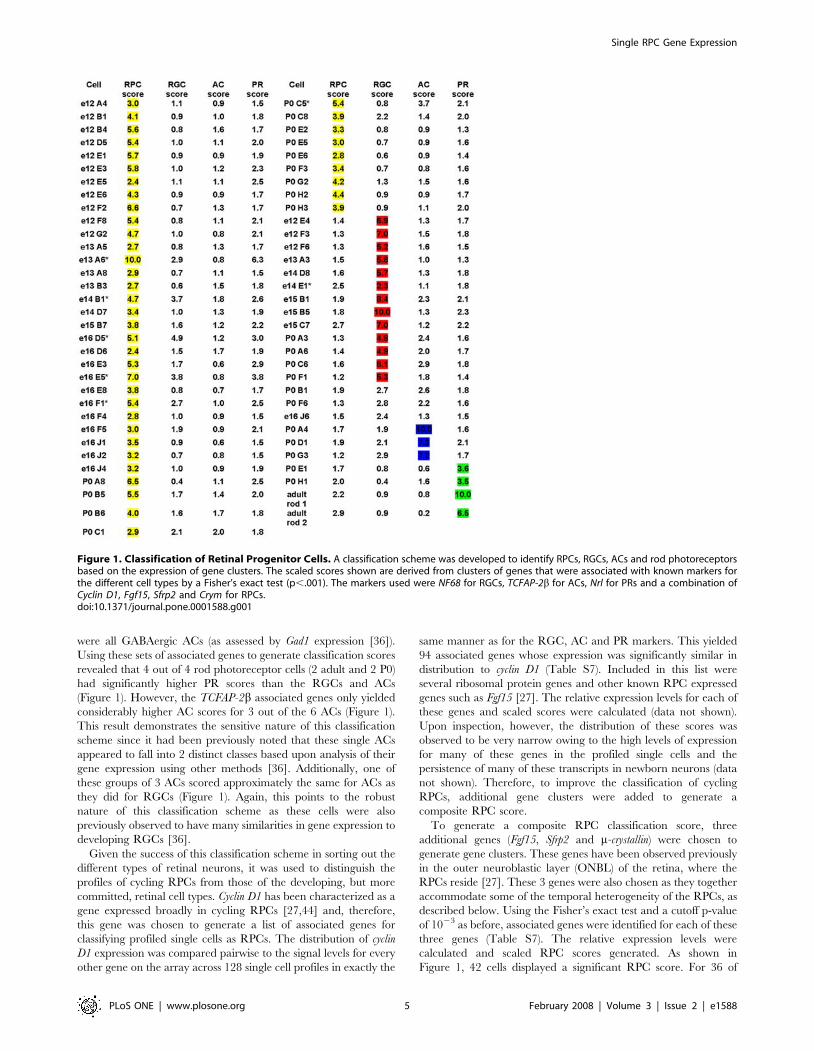
Figure 1. Classification of Retinal Progenitor Cells. A classification scheme was developed to identify RPCs, RGCs, ACs and rod photoreceptorsbased on the expression of gene clusters. The scaled scores shown are derived from clusters of genes that were associated with known markers forthe different cell types by a Fisher’s exact test (p,.001). The markers used were NF68 for RGCs, TCFAP-2b for ACs, Nrl for PRs and a combination ofCyclin D1, Fgf15, Sfrp2 and Crym for RPCs.doi:10.1371/journal.pone.0001588.g001
Single RPC Gene Expression
PLoS ONE | www.plosone.org 5 February 2008 | Volume 3 | Issue 2 | e1588

these cells, this score was considerably higher than that for RGC,
AC, or PR, establishing these single cell profiles as coming from
cycling RPCs (Figure 1). For the additional 6 cells (denoted with an
* in Figure 1 and E14 cell E1, see above), while the RPC was the
highest, at least one other classification score was significant as
well. These cells are most likely transitional cells, RPCs that are in
the process of generating a postmitotic daughter and a full analysis
of their gene expression will be presented elsewhere (Trimarchi
and Cepko, in preparation). Since transcripts expressed in RPCs
would not be expected to disappear immediately, it was predicted
that some cells would possess profiles containing genes expressed
in one or more neuronal cell types, together with RPC genes that
are in the process of being downregulated. Such transitional cells
are of interest as they provide a window into cells that might still
be in the process of deciding upon a final fate [54]. If this state was
plastic, it might be revealed through the expression of markers of
multiple neuronal cell types.
To assess the utility of this classification scheme relative to a
more classical method, the 42 RPC single cell profiles were
clustered with the 23 developing or mature RGCs, ACs and PRs
using hierarchical clustering. The genes used for hierarchical
clustering of these cells were those shown by the Fisher’s exact test
to be most closely associated with Cyclin D1, Fgf15, Sfrp2, Crym,
NF68, TCFAP-2b, and Nrl (Tables S4, S5, S6, S7). Hierarchical
clustering of these cells showed a definitive separation between the
developing neurons and the RPCs (Figure S3). Additionally, the
PRs were distinct from the RGCs and ACs (Figure S3). However,
the hierarchical clustering method could not distinguish the RGCs
from the ACs, whereas the devised classification scheme did, at
least for certain AC types, as noted above. A further benefit of this
classification scheme over the hierarchical clustering was its ability
to identify transitional cells, as the hierarchical clustering did not
distinguish these particular RPCs from any others. Additionally,
the hierarchical clustering separated the RPCs into several
subgroups, one of which contained mainly RPCs isolated at P0.
This separation was based upon the cluster of genes that associated
strongly with m-crystallin (Table S7) and were expressed only in
RPCs during later timepoints (see below). However, two RPCs
isolated from earlier timepoints (E12 cell A4 and E13 cell A8) were
placed into this cluster by the clustering program despite the fact
that these cells did not express this cluster of genes. This
observation, coupled with the inability of the hierarchical
clustering algorithm to discern RGC profiles from AC profiles
makes it difficult to interpret the significance of any further
subdivisions of the RPCs.
Classical and new markers of RPCsImmunohistochemistry and/or ISH are standard techniques
used to determine the distribution of particular cell types.
However, these methods cannot resolve the simultaneous
expression of a large number of genes, which would allow one
to determine how often it was that a particular cell expressed all or
most of the known markers used to define that cell type. The single
cell profiles for RPCs were thus examined to determine the
distribution of classical markers of RPCs in the single cell profiles.
All except one (41/42, see e12 cell E5) of the single cells classified
as an RPC displayed high levels of cyclin D1 expression, while most
of the developing RGCs, ACs and PRs did not possess cyclin D1
transcripts (Figure 2A). Mice deficient for any one of the
transcription factors Pax6, Chx10, or Sox2 have been shown to
exhibit severe eye defects, traceable to these factors playing crucial
roles in RPC proliferation and maintenance [55,56,57]. Given
their prominent role in retinal development and RPC biology, the
expression of these three genes was examined in the single RPC
profiles. In accordance with their important developmental roles,
all three were widely expressed in the single RPC profiles
(Figure 2A). One potentially interesting feature of their expression
was that while they were observed in .75% of RPCs, they were
not seen in all of the RPCs (Figure 2A). This observation could
either be a false negative result stemming from some aspect of the
single cell technique, or alternatively, it could point to a previously
unappreciated degree of gene expression heterogeneity in RPCs.
In order to develop assays to more fully explore the potential
heterogeneity of gene expression in RPCs, two ISH methods were
used to examine expression, with an initial test using a probe for
Cyclin D1, the gene expressed in the highest percentage of RPCs
profiled. Confirmation of expression in RPCs was possible on
section ISH since RPCs reside in a distinctive layer, the outer
neuroblastic layer (ONBL), though they are not the only cell type
in the ONBL as migrating neurons also are present in this layer. In
addition, expression of a gene in an RPC is detectable in cells
acutely labeled with [3H]-thymidine, using the quantitative
method of dissociated ISH (DISH). ISH using a cyclin D1
riboprobe on retinal cryosections from E12.5, E16.5 and P0
revealed strong staining in the ONBL, and diminished staining in
the inner neuroblastic layer (INBL), where most postmitotic
neurons are located (Figure 2B–D). DISH was performed on
dissociated retinas that had been incubated with [3H]-thymidine
for 1 hour before dissociation. This method primarily labels cells
in S-phase and to a minor degree, cells in the early portion of G2.
DISH performed at E16.5 or P0 with a cyclin D1 riboprobe showed
that greater than 90% of [3H]-thymidine+ cells were also cyclin D1+
(Figure 3A,C), indicating that most S-phase progenitor cells
express cyclin D1. As a control, GAP43, a gene expressed in
developing RGCs [36], was never observed in [3H]-thymidine+
cells (data not shown). Additionally, only ,1/3 of cyclin D1+ cells
were [3H]-thymidine+ (Figure 3A,C), consistent with the micro-
array data that suggested that cyclin D1 was present in RPCs in
other cell cycle phases, as well as S phase. DISH for other genes
broadly expressed in RPCs showed that 93% of [3H]-thymidine+
cells at E16.5 expressed Pax6 and 93% of [3H]-thymidine+ cells
expressed Chx10. It should be noted that the microarray data
reflects expression patterns of RPCs in all cell cycle phases, not just
S phase, so an exact match of the percentage of RPCs positive for
a given gene in the microarray analysis would not necessarily be
expected in the [3H]-thymidine/DISH experiments. Nonetheless,
these data demonstrate that a very high percentage of at least S
phase RPCs express these genes. At the same time, they also show
that a clear minority of [3H]-thymidine+ cells was negative for
these RPC markers. This finding corroborates the microarray
results, where not all RPCs were positive for these RPC marker
genes (see Figure 2A). Although the possibility exists that the [3H]-
thymidine+ population does not appear to be 100% for these genes
for technical reasons, DISH performed for Ubiquitin B at E16.5 did
show that 100% of the [3H]-thymidine+ cells expressed Ubiquitin B,
demonstrating that at least for one probe this degree of co-staining
was achievable. Taken together, these data indicate that most, but
not all, RPCs do indeed express classical markers of RPCs at all
times. The mild degree of heterogeneity observed likely reflects
some dynamic processes within these cells. A similar suggestion
was made based upon observations of the expression of a
transgene encoded by a Chx10 BAC, in which the onset of
expression was not uniform throughout the retina [58].
In addition to examining the RPC profiles for the expression of
classical RPC marker genes, we wished to identify new genes that
were consistently expressed among most or all RPCs, and thus
could serve as new markers of RPCs and perhaps reveal new
findings regarding RPC biology. To identify such genes, three
Single RPC Gene Expression
PLoS ONE | www.plosone.org 6 February 2008 | Volume 3 | Issue 2 | e1588
different approaches were used. First, the RPC genes identified
using the Fisher’s exact test that were used for classifying the single
cells were examined. Second, hierarchical clustering was per-
formed on the set of single cells including the 42 RPCs and the 21
developing neurons previously characterized [36] using Gene
Cluster software [37]. Finally, genes with potentially interesting
RPC expression patterns were identified by visual inspection of the
microarray data in Microsoft Excel (for details see Materials and
Methods and [36]). Many different types of genes were found to be
broadly expressed in the single RPCs and some representative
examples are shown in the heatmap generated by Treeview in
Figure 2A. The types of genes identified ranged from transcription
factors (Plagl1 and Lhx2) to secreted molecules (Fgf15 and Dkk3).
The presence of these transcripts in many of the RPCs continued
to demonstrate the robustness of the single cell profiling method
since these genes have been shown to be expressed in the retina by
other means [27,46,59,60]. As observed earlier for genes such as
Sox2 and Chx10, these additional RPC genes were broadly
expressed throughout individual RPCs (i.e. found in .50% of
RPCs and in many cases .75% of RPCs), but most of these genes
also were not observed in all RPCs, displaying some heterogeneity
of expression.
To investigate the heterogeneous expression of the newly
identified broadly expressed RPC markers, section ISH and DISH
were performed for one such gene, Fgf15. According to the
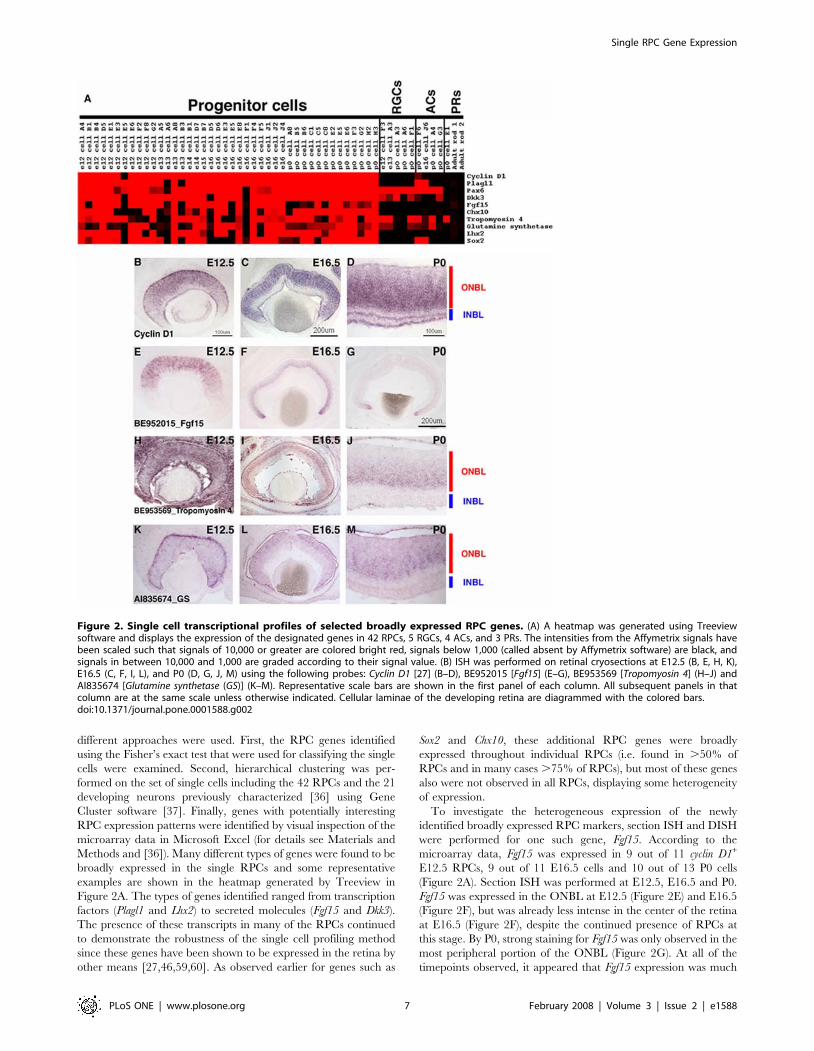
microarray data, Fgf15 was expressed in 9 out of 11 cyclin D1+
E12.5 RPCs, 9 out of 11 E16.5 cells and 10 out of 13 P0 cells
(Figure 2A). Section ISH was performed at E12.5, E16.5 and P0.
Fgf15 was expressed in the ONBL at E12.5 (Figure 2E) and E16.5
(Figure 2F), but was already less intense in the center of the retina
at E16.5 (Figure 2F), despite the continued presence of RPCs at
this stage. By P0, strong staining for Fgf15 was only observed in the
most peripheral portion of the ONBL (Figure 2G). At all of the
timepoints observed, it appeared that Fgf15 expression was much
Figure 2. Single cell transcriptional profiles of selected broadly expressed RPC genes. (A) A heatmap was generated using Treeviewsoftware and displays the expression of the designated genes in 42 RPCs, 5 RGCs, 4 ACs, and 3 PRs. The intensities from the Affymetrix signals havebeen scaled such that signals of 10,000 or greater are colored bright red, signals below 1,000 (called absent by Affymetrix software) are black, andsignals in between 10,000 and 1,000 are graded according to their signal value. (B) ISH was performed on retinal cryosections at E12.5 (B, E, H, K),E16.5 (C, F, I, L), and P0 (D, G, J, M) using the following probes: Cyclin D1 [27] (B–D), BE952015 [Fgf15] (E–G), BE953569 [Tropomyosin 4] (H–J) andAI835674 [Glutamine synthetase (GS)] (K–M). Representative scale bars are shown in the first panel of each column. All subsequent panels in thatcolumn are at the same scale unless otherwise indicated. Cellular laminae of the developing retina are diagrammed with the colored bars.doi:10.1371/journal.pone.0001588.g002
Single RPC Gene Expression
PLoS ONE | www.plosone.org 7 February 2008 | Volume 3 | Issue 2 | e1588
patchier than that of cyclin D1 (compare Figure 2B to Figure 2E for
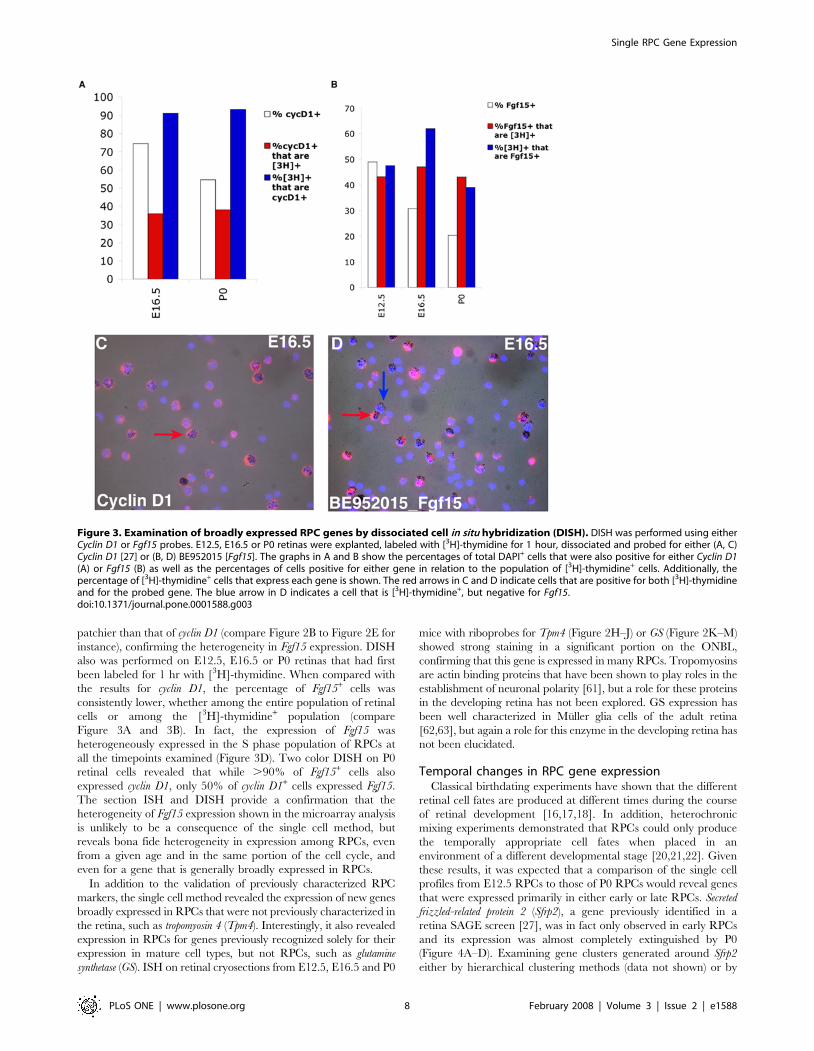
instance), confirming the heterogeneity in Fgf15 expression. DISH
also was performed on E12.5, E16.5 or P0 retinas that had first
been labeled for 1 hr with [3H]-thymidine. When compared with
the results for cyclin D1, the percentage of Fgf15+ cells was
consistently lower, whether among the entire population of retinal
cells or among the [3H]-thymidine+ population (compare
Figure 3A and 3B). In fact, the expression of Fgf15 was
heterogeneously expressed in the S phase population of RPCs at
all the timepoints examined (Figure 3D). Two color DISH on P0
retinal cells revealed that while .90% of Fgf15+ cells also
expressed cyclin D1, only 50% of cyclin D1+ cells expressed Fgf15.
The section ISH and DISH provide a confirmation that the
heterogeneity of Fgf15 expression shown in the microarray analysis
is unlikely to be a consequence of the single cell method, but
reveals bona fide heterogeneity in expression among RPCs, even
from a given age and in the same portion of the cell cycle, and
even for a gene that is generally broadly expressed in RPCs.
In addition to the validation of previously characterized RPC
markers, the single cell method revealed the expression of new genes
broadly expressed in RPCs that were not previously characterized in
the retina, such as tropomyosin 4 (Tpm4). Interestingly, it also revealed
expression in RPCs for genes previously recognized solely for their
expression in mature cell types, but not RPCs, such as glutamine
synthetase (GS). ISH on retinal cryosections from E12.5, E16.5 and P0
mice with riboprobes for Tpm4 (Figure 2H–J) or GS (Figure 2K–M)
showed strong staining in a significant portion on the ONBL,
confirming that this gene is expressed in many RPCs. Tropomyosins
are actin binding proteins that have been shown to play roles in the
establishment of neuronal polarity [61], but a role for these proteins
in the developing retina has not been explored. GS expression has
been well characterized in Muller glia cells of the adult retina
[62,63], but again a role for this enzyme in the developing retina has
not been elucidated.
Temporal changes in RPC gene expressionClassical birthdating experiments have shown that the different
retinal cell fates are produced at different times during the course
of retinal development [16,17,18]. In addition, heterochronic
mixing experiments demonstrated that RPCs could only produce
the temporally appropriate cell fates when placed in an
environment of a different developmental stage [20,21,22]. Given
these results, it was expected that a comparison of the single cell
profiles from E12.5 RPCs to those of P0 RPCs would reveal genes
that were expressed primarily in either early or late RPCs. Secreted
frizzled-related protein 2 (Sfrp2), a gene previously identified in a
retina SAGE screen [27], was in fact only observed in early RPCs
and its expression was almost completely extinguished by P0
(Figure 4A–D). Examining gene clusters generated around Sfrp2
either by hierarchical clustering methods (data not shown) or by
Figure 3. Examination of broadly expressed RPC genes by dissociated cell in situ hybridization (DISH). DISH was performed using eitherCyclin D1 or Fgf15 probes. E12.5, E16.5 or P0 retinas were explanted, labeled with [3H]-thymidine for 1 hour, dissociated and probed for either (A, C)Cyclin D1 [27] or (B, D) BE952015 [Fgf15]. The graphs in A and B show the percentages of total DAPI+ cells that were also positive for either Cyclin D1(A) or Fgf15 (B) as well as the percentages of cells positive for either gene in relation to the population of [3H]-thymidine+ cells. Additionally, thepercentage of [3H]-thymidine+ cells that express each gene is shown. The red arrows in C and D indicate cells that are positive for both [3H]-thymidineand for the probed gene. The blue arrow in D indicates a cell that is [3H]-thymidine+, but negative for Fgf15.doi:10.1371/journal.pone.0001588.g003
Single RPC Gene Expression
PLoS ONE | www.plosone.org 8 February 2008 | Volume 3 | Issue 2 | e1588
using a Fisher’s exact test (Table S7) did reveal some genes with
correlated expressions in RPCs, but consistently failed to yield
genes with a close match for the temporal expression pattern of
Sfrp2. Most of the associated genes were expressed in RPCs at
timepoints beyond when Sfrp2 was detected (Table S7 and data
not shown). Comparing the gene expression profiles of E12.5
RPCs and P0 RPCs by visual inspection in Microsoft Excel,
however, did reveal several candidate genes whose expression
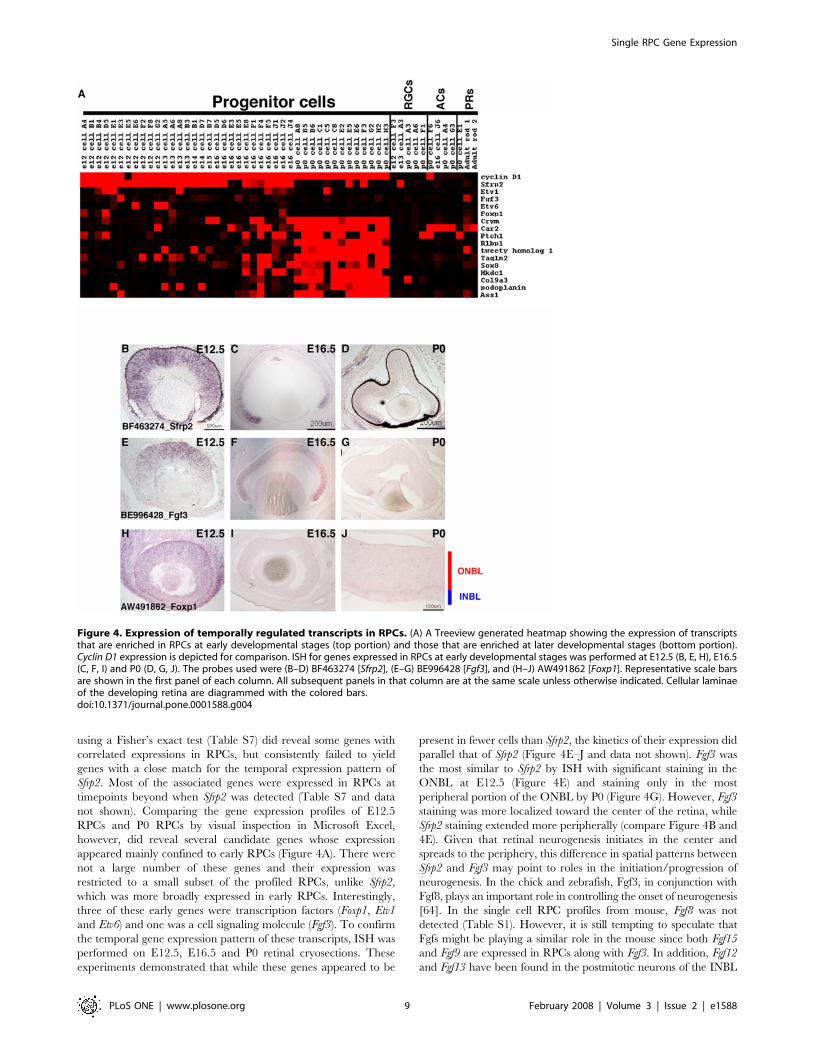
appeared mainly confined to early RPCs (Figure 4A). There were
not a large number of these genes and their expression was
restricted to a small subset of the profiled RPCs, unlike Sfrp2,
which was more broadly expressed in early RPCs. Interestingly,
three of these early genes were transcription factors (Foxp1, Etv1
and Etv6) and one was a cell signaling molecule (Fgf3). To confirm
the temporal gene expression pattern of these transcripts, ISH was
performed on E12.5, E16.5 and P0 retinal cryosections. These
experiments demonstrated that while these genes appeared to be
present in fewer cells than Sfrp2, the kinetics of their expression did
parallel that of Sfrp2 (Figure 4E–J and data not shown). Fgf3 was
the most similar to Sfrp2 by ISH with significant staining in the
ONBL at E12.5 (Figure 4E) and staining only in the most
peripheral portion of the ONBL by P0 (Figure 4G). However, Fgf3
staining was more localized toward the center of the retina, while
Sfrp2 staining extended more peripherally (compare Figure 4B and
4E). Given that retinal neurogenesis initiates in the center and
spreads to the periphery, this difference in spatial patterns between
Sfrp2 and Fgf3 may point to roles in the initiation/progression of
neurogenesis. In the chick and zebrafish, Fgf3, in conjunction with
Fgf8, plays an important role in controlling the onset of neurogenesis
[64]. In the single cell RPC profiles from mouse, Fgf8 was not
detected (Table S1). However, it is still tempting to speculate that
Fgfs might be playing a similar role in the mouse since both Fgf15
and Fgf9 are expressed in RPCs along with Fgf3. In addition, Fgf12
and Fgf13 have been found in the postmitotic neurons of the INBL
Figure 4. Expression of temporally regulated transcripts in RPCs. (A) A Treeview generated heatmap showing the expression of transcriptsthat are enriched in RPCs at early developmental stages (top portion) and those that are enriched at later developmental stages (bottom portion).Cyclin D1 expression is depicted for comparison. ISH for genes expressed in RPCs at early developmental stages was performed at E12.5 (B, E, H), E16.5(C, F, I) and P0 (D, G, J). The probes used were (B–D) BF463274 [Sfrp2], (E–G) BE996428 [Fgf3], and (H–J) AW491862 [Foxp1]. Representative scale barsare shown in the first panel of each column. All subsequent panels in that column are at the same scale unless otherwise indicated. Cellular laminaeof the developing retina are diagrammed with the colored bars.doi:10.1371/journal.pone.0001588.g004
Single RPC Gene Expression
PLoS ONE | www.plosone.org 9 February 2008 | Volume 3 | Issue 2 | e1588

[36]. The reasons why different cells in the developing retina express
distinct combinations of growth factor genes remains to be
explained, but these expression patterns point to a surprising
amount of gene expression heterogeneity in the RPC population,
even for genes with a presumed similarity in function.
In contrast to small number of genes expressed only at early
timepoints in the developing retina, a tightly regulated cluster of
late expressed genes emerged, centered around m-crystallin. This
cluster was apparent in both hierarchical clustering methods and a
Fisher’s exact test (Table S7) and a representation of the m-crystallin
cluster is shown in the bottom portion of the heatmap in Figure 4A.
To examine the expression of these genes more thoroughly,
section ISH was performed at E12.5, E16.5 and P0. Consistent
with the microarray results, many of these genes were not detected
in E12.5 retinal cryosections (Figure 5). At least one, retinaldehyde
binding protein 1 (Rlbp1), was detected strongly in the pigment
epithelium layer (RPE) at E12.5 (Figure 5M), but not in the retina
itself. At E16.5, the kinetics of expression of these genes split into
two groups. The first set was turned on by E16.5 and this group
was represented by Crym (Figure 5B), Carbonic anhydrase 2 (Car2)
(Figure 5E) and Patched 1 (Ptch1) (Figure 5H). Interestingly, Car2
was clearly detected in the ONBL in these ISH experiments as well
as in the microarrays, whereas in previous studies Car2 expression
in RPCs was contentious [27,62]. The second group of late
expressed RPC genes were not detected by ISH until P0
(Figure 5J–L and M–O).
The precise functions of these early and late expressed RPC
genes are unclear at present. Since the early expressed genes either
impinge upon signaling pathways (Sfrp2 and Fgf3) or are
transcription factors (Etv1, Etv6 and Foxp1), one can envision
these genes playing important roles in early retinal development.
Both the Ets factor family in general and Foxp1 specifically have
been shown to play critical roles during the development of the
hematopoietic system, so these factors have important functions in
uncommitted cells in other systems [65,66]. Since the expression of
these genes is quite heterogeneous, it will be of interest to use the
regulatory sequences from the promoters of these genes as
reporters to probe the fates of cells expressing each of these early
expressed genes. For the late expressed genes, it is intriguing that
these genes are more broadly expressed and form a tighter cluster
than the early genes. This might be indicative of a shift in
competence state. However, if that is true, it is curious that only
one of these late expressed genes is a transcription factor (Sox8).
Sox8 has been implicated in a role for oligodendrocyte
development [67,68] and since Muller glia are one of the last
retinal cell types generated, it may play a similar role here. The
Figure 5. Expression of temporally regulated transcripts in RPCs. ISH on retinal cryosections was performed at three stages: E12.5 (A, D, G, J,M), E16.5 (B, E, H, K, N) and P0 (C, F, I, L, O). The following probes were used: (A–C) AI834907 [m-crystallin], (D–F) BE953342 [Carbonic anhydrase 2], (G–I)BF464755 [Patched1], (J–L) AI852545 [Transgelin 2], and (M–O) BF465231 [Retinaldehyde binding protein 1]. Representative scale bars are shown in thefirst panel of each column. All subsequent panels in that column are at the same scale unless otherwise indicated. Cellular laminae of the developingretina are diagrammed with the colored bars.doi:10.1371/journal.pone.0001588.g005
Single RPC Gene Expression
PLoS ONE | www.plosone.org 10 February 2008 | Volume 3 | Issue 2 | e1588
other genes either have no known function as yet or have been
shown to play either enzymatic or structural roles in other
organisms [69,70,71]. Given the regulation of the gene expression
kinetics of these temporally expressed retinal transcripts, though, it
seems likely that they may play important roles in the RPCs that
give rise to the later born retinal cell types.
Single RPCs display extensive heterogeneity in geneexpression
The single cell gene expression profiles were examined in
Microsoft Excel for genes that were present in relatively small
subsets of the 42 identified RPCs. A high number of genes
displayed expression in ,50% or fewer of the RPC profiles
(Figure 4A, 6A, 7 and Figure S4). To confirm that the expression
of these genes was in fact confined to a subset of RPCs, ISH was
performed on retinal cryosections from E12.5, E16.5 and P0 (see
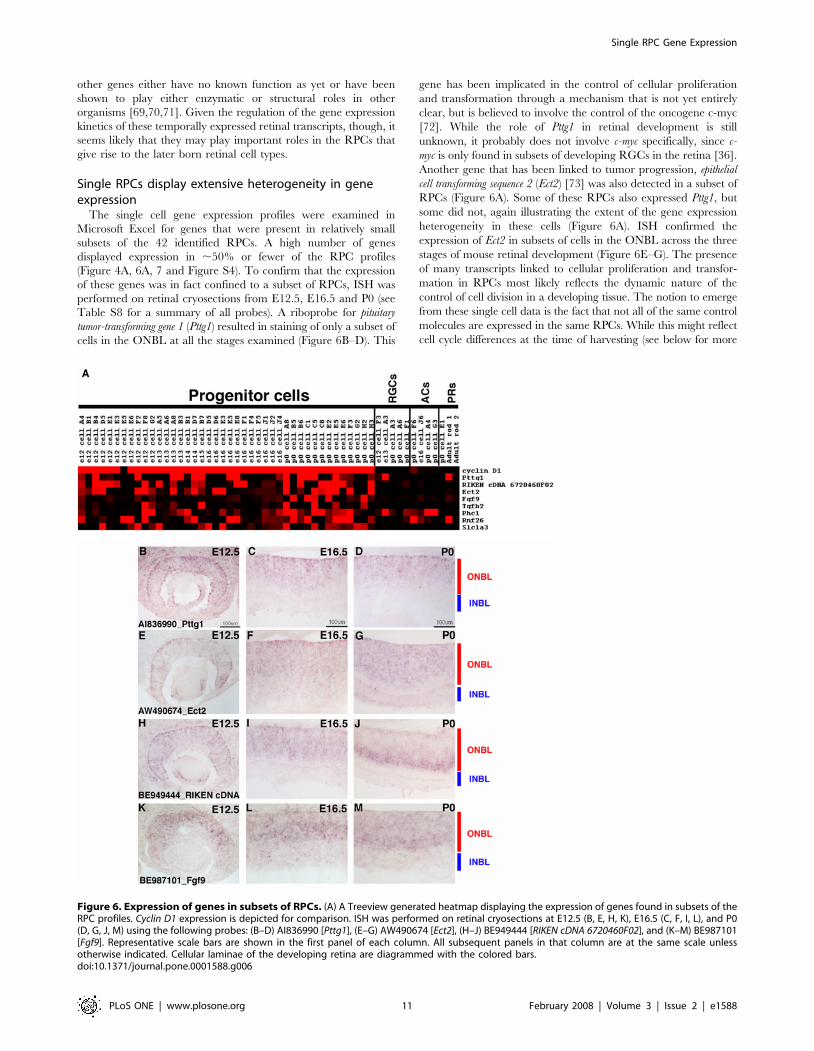
Table S8 for a summary of all probes). A riboprobe for pituitary
tumor-transforming gene 1 (Pttg1) resulted in staining of only a subset of
cells in the ONBL at all the stages examined (Figure 6B–D). This
gene has been implicated in the control of cellular proliferation
and transformation through a mechanism that is not yet entirely
clear, but is believed to involve the control of the oncogene c-myc
[72]. While the role of Pttg1 in retinal development is still
unknown, it probably does not involve c-myc specifically, since c-
myc is only found in subsets of developing RGCs in the retina [36].
Another gene that has been linked to tumor progression, epithelial
cell transforming sequence 2 (Ect2) [73] was also detected in a subset of
RPCs (Figure 6A). Some of these RPCs also expressed Pttg1, but
some did not, again illustrating the extent of the gene expression
heterogeneity in these cells (Figure 6A). ISH confirmed the
expression of Ect2 in subsets of cells in the ONBL across the three
stages of mouse retinal development (Figure 6E–G). The presence
of many transcripts linked to cellular proliferation and transfor-
mation in RPCs most likely reflects the dynamic nature of the
control of cell division in a developing tissue. The notion to emerge
from these single cell data is the fact that not all of the same control
molecules are expressed in the same RPCs. While this might reflect
cell cycle differences at the time of harvesting (see below for more
Figure 6. Expression of genes in subsets of RPCs. (A) A Treeview generated heatmap displaying the expression of genes found in subsets of theRPC profiles. Cyclin D1 expression is depicted for comparison. ISH was performed on retinal cryosections at E12.5 (B, E, H, K), E16.5 (C, F, I, L), and P0(D, G, J, M) using the following probes: (B–D) AI836990 [Pttg1], (E–G) AW490674 [Ect2], (H–J) BE949444 [RIKEN cDNA 6720460F02], and (K–M) BE987101[Fgf9]. Representative scale bars are shown in the first panel of each column. All subsequent panels in that column are at the same scale unlessotherwise indicated. Cellular laminae of the developing retina are diagrammed with the colored bars.doi:10.1371/journal.pone.0001588.g006
Single RPC Gene Expression
PLoS ONE | www.plosone.org 11 February 2008 | Volume 3 | Issue 2 | e1588

discussion), the section ISH patterns for at least Pttg1 and Ect2 do not
point to expression of these factors in any specific cell cycle phase and
instead favor the idea that these RPCs, even from the same
timepoint, are distinct in their gene expression profiles.
As previously noted for the broadly expressed RPC genes, the
genes observed in smaller subsets of RPCs also represented many
different classes. Signaling molecules (Fgf9 and Tgfb2), unchar-
acterized cDNAs (RIKEN cDNA 672046F02, Rnf26), polycomb group
members (Phc1), and a glutamate transporter (Slc1a3) are just a few of
the different types of genes found in subsets of RPCs (Figure 6A).
ISH again confirmed the heterogeneity of expression of these genes,
as they were each observed in subsets of cells in the ONBL at the
E12.5, E16.5 and P0 (Figure 6H–M and data not shown). A recent
study demonstrated that glutamate could contribute to the regulation
of cell proliferation in RPCs. Treatment of retinas with glutamate
resulted in a decrease in cellular proliferation [74]. Expression of a
glutamate transporter in only a subset of RPCs might reflect the
ability of that particular subset of RPCs to regulate their proliferation
in response to an extrinsic cue, perhaps providing only these specific
cells with a link between their environment and their intrinsic
transcriptional programs.
Heterogeneity of transcription factor expression in singleRPCs
Transcription factors (TFs) represent an obvious category of
genes for influencing numerous processes in RPCs, from driving
changes from one competence state to another, to beginning
cascades that end in a RPC generating a particular cell type. On
the Affymetrix mouse 430 2.0 microarray, there were ,2400
target sequences annotated as a TF (www.netaffx.com) represent-
ing approximately 2000 different TFs. Examination of the array
signals for the 42 RPCs revealed that ,50% of these TFs achieved
a present call (.1000) in at least one of the RPCs (Figure S4).
Furthermore, ,700 of these TFs showed a medium to high level of
signal (.5000) in at least one of the 42 RPCs (data not shown).
These TFs ranged in their frequency of expression, from those
showing expression in nearly all 42 of the RPCs (see top 1/3 of
Figure S4) to those displaying extensive heterogeneity of
expression (3 or 4 out of 42 RPCs) across the RPCs (lower 2/3
of Figure S4 and Figure 7). To attempt to discover coregulated sets
of TFs, different clustering methods were used, including
hierarchical clustering and a Fisher’s exact test. However, none
of the methods employed was capable of identifying overlapping
TFs that behaved in a coordinated manner. There are most likely
several reasons for this result. First, some of the TFs are expressed
in very few of the profiled RPCs, making it impossible to correlate
their expression with any other genes with any statistical reliability.
Second, the available algorithms might not be able to account for
the combinatorial nature of the action of TFs. For instance, it is
possible that when two TFs are expressed together in the same
single cell they lead to a certain cellular outcome. However, these
same two factors might also be expressed separately in other single
cells. A combination of more sophisticated algorithms and
functional studies will be necessary to fully understand the
extensive heterogeneity of TF expression in developing RPCs.
Neurogenic basic helix-loop-helix (bHLH) transcription factors
have been shown to play crucial roles in the generation of many
postmitotic retinal cell types [75,76,77]. Recently the loss of one
bHLH, Math5, was shown to lead to deficiencies in cell cycle
progression in RPCs, revealing a possible additional coordinating
role for this class of TF in RPCs [78]. Understanding the
mechanism of action of these bHLH factors requires a detailed
knowledge of their expression patterns. In the 42 single RPC
profiles, the neurogenic bHLH genes were found in subsets of cells
(Figure 7). To verify that these bHLH factors were expressed in
RPCs, retinas were pulse labeled with [3H]-thymidine and DISH
was performed for Math5 or NeuroD1. At E16.5, 18% of [3H]-
thymidine+ cells were Math5+ while at P0 6% of [3H]-thymidine+
cells were NeuroD1+ and 25% were Ngn2+ (Figure 8A). These
results indicate that while the bulk of cycling RPCs are not
expressing these bHLHs, these genes most likely begin their
expression either in late S phase or early G2. Interestingly, when
one bHLH transcript was observed in an RPC, other bHLH
transcripts were present as well, and some RPCs expressed as
many as 4 different bHLH genes (Figure 7). For example, at least
three cells at three different timepoints expressed significant levels
Figure 7. Expression of different transcription factors in RPCs. A Treeview generated heatmap showing the expression of selectedtranscription factors in single RPCs. Cyclin D1 expression is depicted for comparison.doi:10.1371/journal.pone.0001588.g007
Single RPC Gene Expression
PLoS ONE | www.plosone.org 12 February 2008 | Volume 3 | Issue 2 | e1588

of Math5, Ngn2 and NeuroD1 (see E13 cell B3, E16 cell D6 and P0
cell C1). This result was surprising given previous reports that both
Ngn2 and NeuroD1 were suppressed in Math5 expressing cells [78].
However, these previous conclusions were based upon upregula-
tion of these bHLHs in the absence of Math5 [78] and not a direct
observation of their co-expression. Interestingly, single cell RT-
PCR in the chick retina revealed that a few cells could co-express
certain bHLHs [79]. Additionally, 7 RPC single cell profiles
showed co-expression of Ngn2 and Mash1, including cells isolated
from 3 different timepoints (Figure 7). Again this result is in
contrast to previous observations that Ngn2 and Mash1 were never
expressed in overlapping cells [55]. However, as before, this prior
result was not based upon direct detection of Ngn2 and Mash1
transcripts, but instead relied upon GFP-based reporters for both
genes [55]. It is possible that these reporters did not fully recapitulate
the entire spectrum of expression for these genes, perhaps due to
differences in the regulation of transcription or translation, as has
been shown for certain homeobox TFs in Xenopus [80]. These
single cell profiles demonstrate the expression of multiple neurogenic
bHLHs in single RPCs and suggest that the interplay among these
TFs is perhaps not as simple as previously postulated. These data
provide a potential explanation for the observed redundancy of these
bHLH factors in retinal development [81]. Furthermore, Xenopus
NeuroD1 has been shown to be regulated by phosphorylation and if
similar regulatory mechanisms exist in the mouse [82], this could
provide a method for independently controlling bHLHs that are co-
expressed.
Hairy and enhancer of split 6 (Hes6) is an additional bHLH gene
whose protein product antagonizes the activity of other Hes family
members and thereby facilitates the action of neurogenic bHLHs
[83]. The single cell expression profiles showed Hes6 expression in
RPCs across developmental time and revealed a significant overlap
in expression with Mash1 at P0 (Figure 7). In situ hybridizations with a
Hes6 riboprobe revealed a subset of cells in the ONBL stained at
E12.5 and E16.5 (Figure 9A,B), with broader ONBL staining at P0
(Figure 9C). DISH performed on [3H]-thymidine pulse labeled
retinas showed that 25% of [3H]-thymidine+ cells also stained for
Hes6, confirming the presence of this transcript in RPCs (Figure 8A).
As this is a time when many RPCs are producing postmitotic
neurons, it is consistent with previous work showing that Hes6 has a
positive role in this process [83].
Many homeodomain (HD) containing transcription factors have
been found to play crucial roles in retinal development
[32,56,84,85]. In the analysis of TF expression among single
RPCs, many HD containing TFs were observed. Some of these
TFs showed a broad expression pattern in the single RPCs (for
example Pax6, Chx10, Sox, Lhx2, Six3) (See Figure 2, 7, 9D–F and
Figure S4), while others showed more heterogeneity of expression
(Otx2, Rax, Six5). Otx2 expression was confirmed to begin in RPCs
by DISH on [3H]-thymidine pulse labeled retinas. In these
experiments, 15% of [3H]-thymidine+ cells were also Otx2+
(Figure 8A), indicating that the expression of Otx2 mRNA most
likely begins in the late S to early G2 phase of the cell cycle. Pulse-
chase experiments at E18.5 further validated this idea by showing
that the number of [3H]-thymidine+ cells that were also Otx2+
increased from 9% 4 hours after labeling to 28% by 24 hours
after labeling. Interestingly, Crx, another HD containing TF that
is involved in photoreceptor development and maintenance
[86,87], showed similar, but slightly delayed kinetics of onset to
that of Otx2. Crx was not present in [3H]-thymidine+ cells after a
1 hour pulse (Figure 8A) or a 4 hour chase, but was only
first observed in 15% of [3H]-thymidine+ cells 24 hours after
labeling. This observation fits with the predicted regulation of Crx
by Otx2 [88].
Figure 8. Examination of TFs and cell cycle markers by DISH.E16.5 or P0 retinas were explanted, then labeled with [3H]-thymidine for1 hour, and dissociated. (A) The slides were probed for NeuroD1 [132],Otx2 [27], BQ178789 [Ngn2], BE996421 [Etv5], AW048812 [Hes6] or Crx[133]. The graphs show the percentages of total DAPI+ cells that were alsopositive for the individual TFs (red bars) and the percentages of [3H]-thymidine+ cells that express each TF (blue bars). (B) The slides wereprobed for BE984641 [Rrm2], BE981507 [Kpna2] or BE988025 [Cdc20]. Thegraphs show the percentages of total DAPI+ cells that were also positivefor the cell cycle genes (white bars), the percentages of cells positive forthe cell cycle genes in relation to the population of [3H]-thymidine+ cells(red bars), and the percentages of [3H]-thymidine+ cells that express eachTF (blue bars). (C) A representative field from a dissociated E16.5 retinathat was labeled with [3H]-thymidine and probed with BE981507 [Kpna2].The red arrows indicate three Kpna2+ cells that are also [3H]-thymidine+.doi:10.1371/journal.pone.0001588.g008
Single RPC Gene Expression
PLoS ONE | www.plosone.org 13 February 2008 | Volume 3 | Issue 2 | e1588
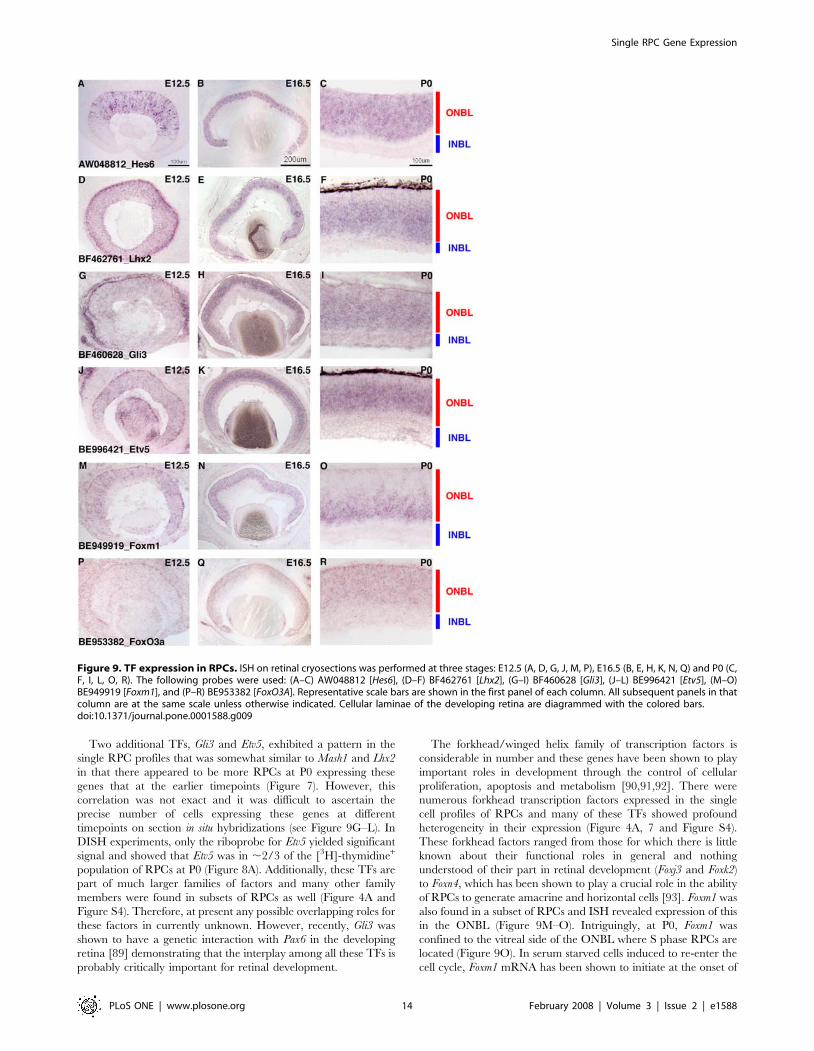
Two additional TFs, Gli3 and Etv5, exhibited a pattern in the
single RPC profiles that was somewhat similar to Mash1 and Lhx2
in that there appeared to be more RPCs at P0 expressing these
genes that at the earlier timepoints (Figure 7). However, this
correlation was not exact and it was difficult to ascertain the
precise number of cells expressing these genes at different
timepoints on section in situ hybridizations (see Figure 9G–L). In
DISH experiments, only the riboprobe for Etv5 yielded significant
signal and showed that Etv5 was in ,2/3 of the [3H]-thymidine+
population of RPCs at P0 (Figure 8A). Additionally, these TFs are
part of much larger families of factors and many other family
members were found in subsets of RPCs as well (Figure 4A and
Figure S4). Therefore, at present any possible overlapping roles for
these factors in currently unknown. However, recently, Gli3 was
shown to have a genetic interaction with Pax6 in the developing
retina [89] demonstrating that the interplay among all these TFs is
probably critically important for retinal development.
The forkhead/winged helix family of transcription factors is
considerable in number and these genes have been shown to play
important roles in development through the control of cellular
proliferation, apoptosis and metabolism [90,91,92]. There were
numerous forkhead transcription factors expressed in the single
cell profiles of RPCs and many of these TFs showed profound
heterogeneity in their expression (Figure 4A, 7 and Figure S4).
These forkhead factors ranged from those for which there is little
known about their functional roles in general and nothing
understood of their part in retinal development (Foxj3 and Foxk2)
to Foxn4, which has been shown to play a crucial role in the ability
of RPCs to generate amacrine and horizontal cells [93]. Foxm1 was
also found in a subset of RPCs and ISH revealed expression of this
in the ONBL (Figure 9M–O). Intriguingly, at P0, Foxm1 was
confined to the vitreal side of the ONBL where S phase RPCs are
located (Figure 9O). In serum starved cells induced to re-enter the
cell cycle, Foxm1 mRNA has been shown to initiate at the onset of
Figure 9. TF expression in RPCs. ISH on retinal cryosections was performed at three stages: E12.5 (A, D, G, J, M, P), E16.5 (B, E, H, K, N, Q) and P0 (C,F, I, L, O, R). The following probes were used: (A–C) AW048812 [Hes6], (D–F) BF462761 [Lhx2], (G–I) BF460628 [Gli3], (J–L) BE996421 [Etv5], (M–O)BE949919 [Foxm1], and (P–R) BE953382 [FoxO3A]. Representative scale bars are shown in the first panel of each column. All subsequent panels in thatcolumn are at the same scale unless otherwise indicated. Cellular laminae of the developing retina are diagrammed with the colored bars.doi:10.1371/journal.pone.0001588.g009
Single RPC Gene Expression
PLoS ONE | www.plosone.org 14 February 2008 | Volume 3 | Issue 2 | e1588
S phase and remain on from that point [94]. It is interesting that
Foxm1 may be more tightly regulated in the developing retina, but its
expression is consistent with a role in cell cycle control. Foxo3a was
another family member expressed in subsets of RPCs (Figure 7).
Although the Foxo3a transcript was detected in cells from early and
later developmental timepoints, there were more single RPCs
expressing this gene at P0 (Figure 7). Section ISH confirmed this
later expression, as signal was observed in more cells in the ONBL at
P0 (Figure 9R) than at E12.5 (Figure 9P). The significance of this
Foxo3a expression in the retina is unclear. In other organisms and
contexts, Foxo3a has been shown to induce either cell cycle arrest or
apoptosis [95,96]. While it is conceivable that Foxo3a is sensitizing
the later retina to apoptotic signals, Foxo transcription factors in
general have been linked to the cyclin kinase inhibitor p27Kip1 [92].
Therefore, given that more RPCs at P0 are generating postmitotic
daughter cells and p27Kip1 is involved in cell cycle exit in the retina
[31], perhaps Foxo3a plays an upstream role in the decision to
generate a postmitotic daughter cell.
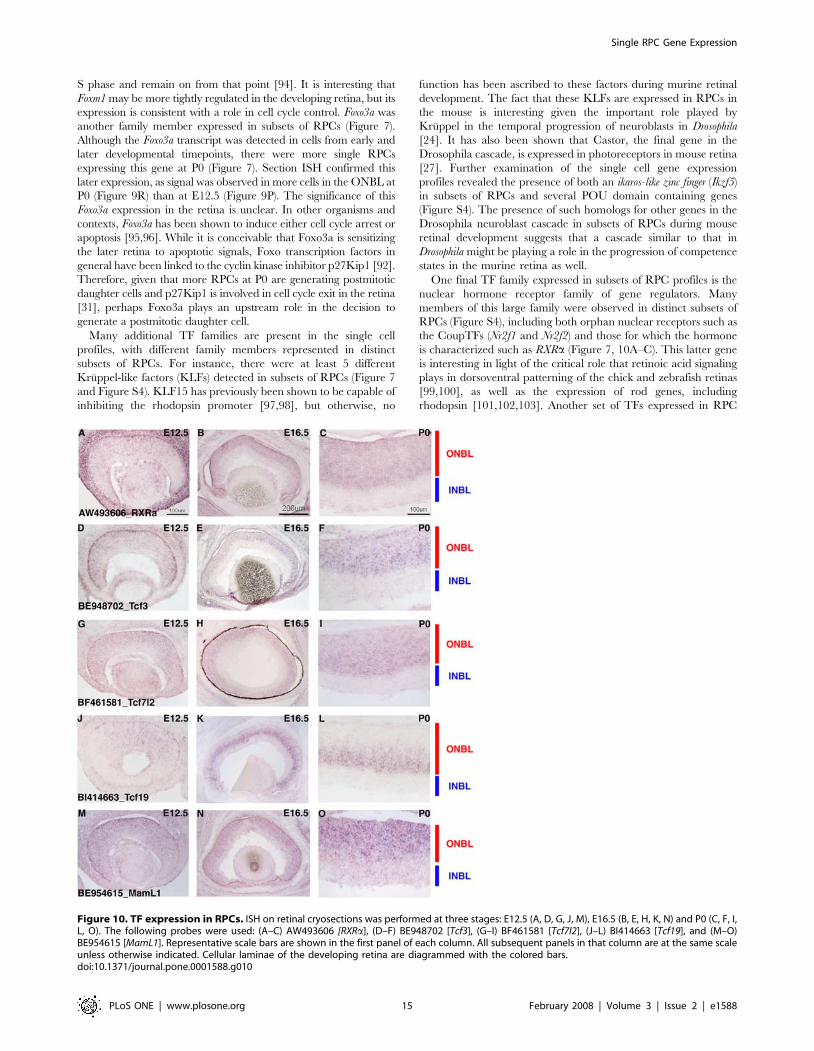
Many additional TF families are present in the single cell
profiles, with different family members represented in distinct
subsets of RPCs. For instance, there were at least 5 different
Kruppel-like factors (KLFs) detected in subsets of RPCs (Figure 7
and Figure S4). KLF15 has previously been shown to be capable of
inhibiting the rhodopsin promoter [97,98], but otherwise, no
function has been ascribed to these factors during murine retinal
development. The fact that these KLFs are expressed in RPCs in
the mouse is interesting given the important role played by
Kruppel in the temporal progression of neuroblasts in Drosophila
[24]. It has also been shown that Castor, the final gene in the
Drosophila cascade, is expressed in photoreceptors in mouse retina
[27]. Further examination of the single cell gene expression
profiles revealed the presence of both an ikaros-like zinc finger (Ikzf5)
in subsets of RPCs and several POU domain containing genes
(Figure S4). The presence of such homologs for other genes in the
Drosophila neuroblast cascade in subsets of RPCs during mouse
retinal development suggests that a cascade similar to that in
Drosophila might be playing a role in the progression of competence
states in the murine retina as well.
One final TF family expressed in subsets of RPC profiles is the
nuclear hormone receptor family of gene regulators. Many
members of this large family were observed in distinct subsets of
RPCs (Figure S4), including both orphan nuclear receptors such as
the CoupTFs (Nr2f1 and Nr2f2) and those for which the hormone
is characterized such as RXRa (Figure 7, 10A–C). This latter gene
is interesting in light of the critical role that retinoic acid signaling
plays in dorsoventral patterning of the chick and zebrafish retinas
[99,100], as well as the expression of rod genes, including
rhodopsin [101,102,103]. Another set of TFs expressed in RPC
Figure 10. TF expression in RPCs. ISH on retinal cryosections was performed at three stages: E12.5 (A, D, G, J, M), E16.5 (B, E, H, K, N) and P0 (C, F, I,L, O). The following probes were used: (A–C) AW493606 [RXRa], (D–F) BE948702 [Tcf3], (G–I) BF461581 [Tcf7l2], (J–L) BI414663 [Tcf19], and (M–O)BE954615 [MamL1]. Representative scale bars are shown in the first panel of each column. All subsequent panels in that column are at the same scaleunless otherwise indicated. Cellular laminae of the developing retina are diagrammed with the colored bars.doi:10.1371/journal.pone.0001588.g010
Single RPC Gene Expression
PLoS ONE | www.plosone.org 15 February 2008 | Volume 3 | Issue 2 | e1588

subsets is the Tcfs that are downstream of the Wnt signaling
pathway (Figure 7, 10D–I). Tcf3 was present in more RPC profiles
from early timepoints, while Tcf7l2 was detected more in P0 RPCs
(Figure 7). The possible significance of this early/late expression
difference is unclear. Also, the function of these TFs in retinal
development remains elusive since the Wnt factors themselves
were not strongly detected in the retina (data not shown and [27])
and Wnt inhibitors such as Sfrp2 were found, at least in the early
retina (Figure 4). Finally, some uncharacterized TFs were also
identified as expressed in RPCs. One of these factors, Tcf19 was
found in a small subset of RPCs at E12.5 (Figure 7, 10J) and then
an increasing subset at subsequent stages (Figure 7, 10K–L). At P0,
Tcf19 transcripts were localized near the vitreal edge of the ONBL
(Figure 10J), suggesting this gene may be cell cycle regulated (see
below). In total, many different classes of TFs were found
expressed in subsets of RPCs throughout retinal development.
The challenge in the future will be to use these single cell data in
concert with functional studies to understand the precise
combinations of TFs that RPCs use to generate all the distinct
subtypes of retinal neurons.
Cell cycle gene transcripts in single RPCsOne potential explanation for at least some of the observed
heterogeneity of gene expression among RPCs is that these cells
were not synchronized with respect to the cell cycle and, therefore,
most likely exhibit cell cycle associated differences in gene
expression. To begin to explore cell cycle differences in gene
expression as one possible cause of RPC heterogeneity, genes that
had been identified in other settings as correlated with particular
phases of the cell cycle were examined for variations in the single
RPC profiles. These genes were divided into two groups, G1/S
and G2/M, based upon their reported expression, which has been
assayed primarily in cell culture. The heatmap shown in
Figure 11A depicts a representative sample of the G1/S group
of genes assembled from the literature [104,105,106,107,108,109].
Genes such as PCNA, Rrm2 and the Mcms (2-6), whose protein
products play important roles in DNA replication [110,111], were
observed in a significant subset of RPCs (Figure 11A). Rrm2, for
example, was observed in 76% (32/42) of the profiled RPCs
(Figure 11A). ISH on retinal cryosections confirmed that these
genes were expressed in the ONBL (Figure 11B–G and data not
shown). In the developing retina, the movement of RPCs is
coordinated with the cell cycle so that mitosis occurs at the most
scleral edge of the retina, just adjacent to the RPE, and S phase
occurs toward the vitreal side of the ONBL [16,112]. The two gap
phases, G1 and G2, occur in the intervening space. Closer
inspection of the section ISH patterns for Rrm2 and Mcm5 revealed
that these genes are more strongly expressed toward the vitreal
surface than the scleral surface (Figure 11, especially D and G),
indicating they are predominantly detected in S phase cells. At
E12.5, the expression pattern of these genes was more scattered
throughout the ONBL (Figure 11B, E) likely reflecting the
observation that the precise migration patterns of RPCs with
respect to the cell cycle do not occur at this early stage (Trimarchi
and Cepko, unpublished observations) [78]. DISH conducted for
Rrm2 showed that 56% of Rrm2+ cells were [3H]-thymidine+ at
E16.5 and at P0 this number increased to 61% (Figure 8B). These
data indicate that Rrm2 expression is enriched in S phase cells.
However, the microarray data predicted a higher number of cells
should express Rrm2 than was observed in the ISH experiments
(Figure 11A). These results most likely indicate that Rrm2 is
expressed in both the G1 and S phases of the cell cycle, but at
significantly higher levels in S phase, such that the detection by
ISH picks up mostly S phase cells. This would be akin to the
situation in serum starved and restimulated fibroblasts where Rrm2
(and many other G1/S genes) was observed at lower, but
detectable, levels during G1, with expression increasing signifi-
cantly at the G1/S transition and into S phase [113]. In the
current set of experiments, the single cell profiling is likely more
sensitive than the in situ methods and therefore is able to detect
even low levels of these transcripts in other cell cycle phases.
Through the use of the different clustering methods employed in
this study, some genes were uncovered as potentially cell cycle
regulated that were not previously well characterized with respect
to the cell cycle. In addition, their expression patterns in the
developing retina were completely unknown. One such gene was
Karyopherin alpha 2 (Kpna2). Kpna2 was observed in a subset of RPCs
(Figure 11A). ISH on retinal cryosections revealed an expression
pattern in a scattered subset of ONBL cells at E12.5 (Figure 11H)
that progressed to a staining pattern that was concentrated on the
vitreal side of the ONBL where the S phase cells reside at P0
(Figure 11J). At E16.5, the expression of Kpna2 was in a repeated
pattern of radial stripes across the retina (Figure 11I). The striped
expression pattern is not a predicted pattern, but it may indicate a
dynamic regulation of Kpna2 that is coordinated with neighboring
cells. Neighboring cells might share a history of recent cell divisions
and thus might be somewhat synchronized with respect to the cell
cycle. DISH for Kpna2 revealed that this gene is almost exclusively
expressed in S phase, as 95% of all Kpna2+ cells at P0 were also [3H]-
thymidine+ after a 1 hour pulse (Figure 8B,C). The protein product
of this gene has been linked to the nuclear import of a protein
important for DNA repair and checkpoint function [104,114]. It is
possible that this novel finding of restriction of Kpna2 expression to
cells almost exclusively in S phase points to an important role in
regulation of the normal cell cycle in a developing tissue. In addition
to this insight into cell cycle function, this observation means that
Kpna2 can be used as a marker for RPCs in S phase in future studies.
One cell cycle gene that was found in the fewest RPCs and
might, therefore, be tightly regulated in its cell cycle expression
was Cyclin E1 (Figure 11A). Section ISH for Cyclin E1
demonstrated that while it showed weak signal in the retina, it
was expressed in a small subset of cells near the vitreal surface of
the ONBL (data not shown). Hierarchical clustering experiments
revealed that the gene Rassf1 was significantly correlated with
Cyclin E1 (data not shown). ISH on retinal cryosections revealed a
similar expression pattern to Cyclin E1, both in the intensity of
signal and in location (Figure 11K–M and data not shown). While
Rassf1 has been shown to be a tumor suppressor and to affect the
ras pathway, its exact function, especially in development, remains
poorly understood [115]. Additionally, in tissue culture experi-
ments, Rassf1 has been shown to be capable of impinging on the
regulation of the cell cycle at multiple points [115], but an
interaction with Cyclin E1 is yet to be explored.
The analysis described above for G1/S phase genes was also
done for genes that had previously been shown to have their
expression concentrated in the G2 phase of the cell cycle
[116,117,118,119,120]. The heatmap in Figure 12A shows some
genes that are representative of the G2/M class. These genes were
present in a smaller number of RPCs than those associated with
the G1/S phases. As reported by Young [121], RPCs spend less
time in G2/M than they do in G1/S, and thus fewer cells will
show the G2/M pattern of gene expression than the G1/S pattern.
Many RPCs showed robust expression of markers for both G1/S
and G2/M (note E12 cell A4, E13 cell B3 and P0 cell F3 as
examples in Figure 11A and Figure 12A). These results may point
to a tighter transcriptional regulation of genes that play a role in
G2/M than those genes involved in the G1 and S phases. Section
ISH for some of these G2/M genes revealed some variation in the
Single RPC Gene Expression
PLoS ONE | www.plosone.org 16 February 2008 | Volume 3 | Issue 2 | e1588
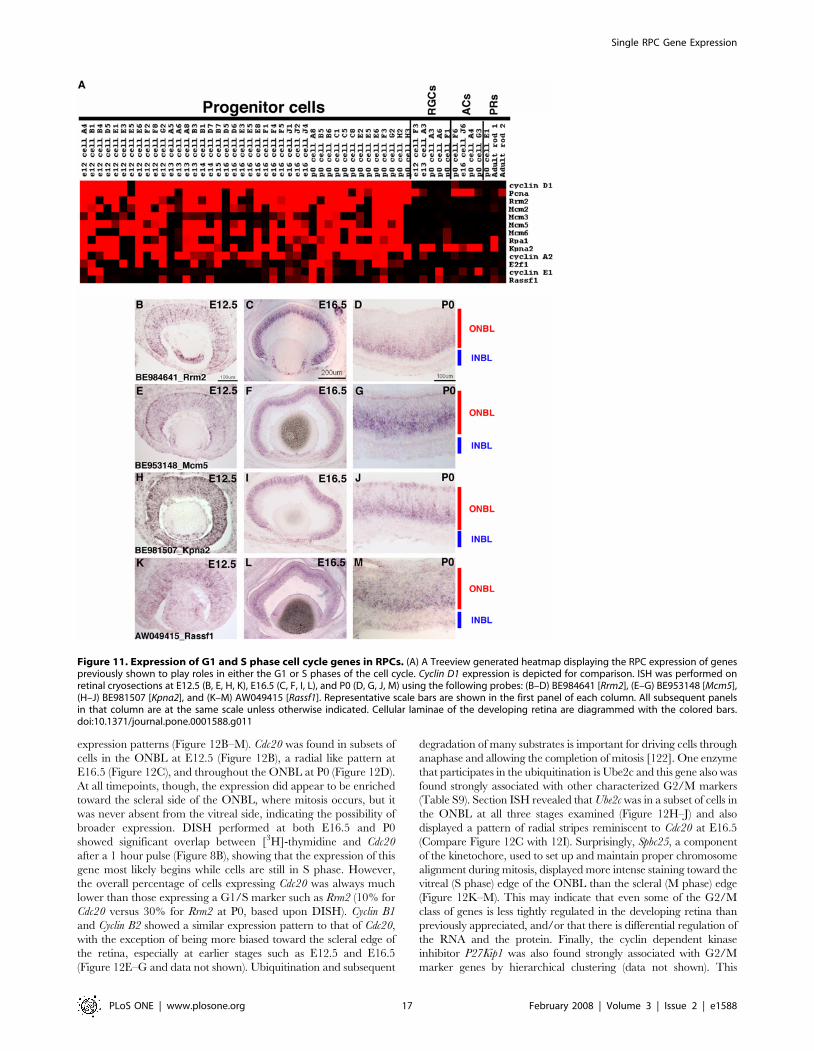
expression patterns (Figure 12B–M). Cdc20 was found in subsets of
cells in the ONBL at E12.5 (Figure 12B), a radial like pattern at
E16.5 (Figure 12C), and throughout the ONBL at P0 (Figure 12D).
At all timepoints, though, the expression did appear to be enriched
toward the scleral side of the ONBL, where mitosis occurs, but it
was never absent from the vitreal side, indicating the possibility of
broader expression. DISH performed at both E16.5 and P0
showed significant overlap between [3H]-thymidine and Cdc20
after a 1 hour pulse (Figure 8B), showing that the expression of this
gene most likely begins while cells are still in S phase. However,
the overall percentage of cells expressing Cdc20 was always much
lower than those expressing a G1/S marker such as Rrm2 (10% for
Cdc20 versus 30% for Rrm2 at P0, based upon DISH). Cyclin B1
and Cyclin B2 showed a similar expression pattern to that of Cdc20,
with the exception of being more biased toward the scleral edge of
the retina, especially at earlier stages such as E12.5 and E16.5
(Figure 12E–G and data not shown). Ubiquitination and subsequent
degradation of many substrates is important for driving cells through
anaphase and allowing the completion of mitosis [122]. One enzyme
that participates in the ubiquitination is Ube2c and this gene also was
found strongly associated with other characterized G2/M markers
(Table S9). Section ISH revealed that Ube2c was in a subset of cells in
the ONBL at all three stages examined (Figure 12H–J) and also
displayed a pattern of radial stripes reminiscent to Cdc20 at E16.5
(Compare Figure 12C with 12I). Surprisingly, Spbc25, a component
of the kinetochore, used to set up and maintain proper chromosome
alignment during mitosis, displayed more intense staining toward the
vitreal (S phase) edge of the ONBL than the scleral (M phase) edge
(Figure 12K–M). This may indicate that even some of the G2/M
class of genes is less tightly regulated in the developing retina than
previously appreciated, and/or that there is differential regulation of
the RNA and the protein. Finally, the cyclin dependent kinase
inhibitor P27Kip1 was also found strongly associated with G2/M
marker genes by hierarchical clustering (data not shown). This
Figure 11. Expression of G1 and S phase cell cycle genes in RPCs. (A) A Treeview generated heatmap displaying the RPC expression of genespreviously shown to play roles in either the G1 or S phases of the cell cycle. Cyclin D1 expression is depicted for comparison. ISH was performed onretinal cryosections at E12.5 (B, E, H, K), E16.5 (C, F, I, L), and P0 (D, G, J, M) using the following probes: (B–D) BE984641 [Rrm2], (E–G) BE953148 [Mcm5],(H–J) BE981507 [Kpna2], and (K–M) AW049415 [Rassf1]. Representative scale bars are shown in the first panel of each column. All subsequent panelsin that column are at the same scale unless otherwise indicated. Cellular laminae of the developing retina are diagrammed with the colored bars.doi:10.1371/journal.pone.0001588.g011
Single RPC Gene Expression
PLoS ONE | www.plosone.org 17 February 2008 | Volume 3 | Issue 2 | e1588
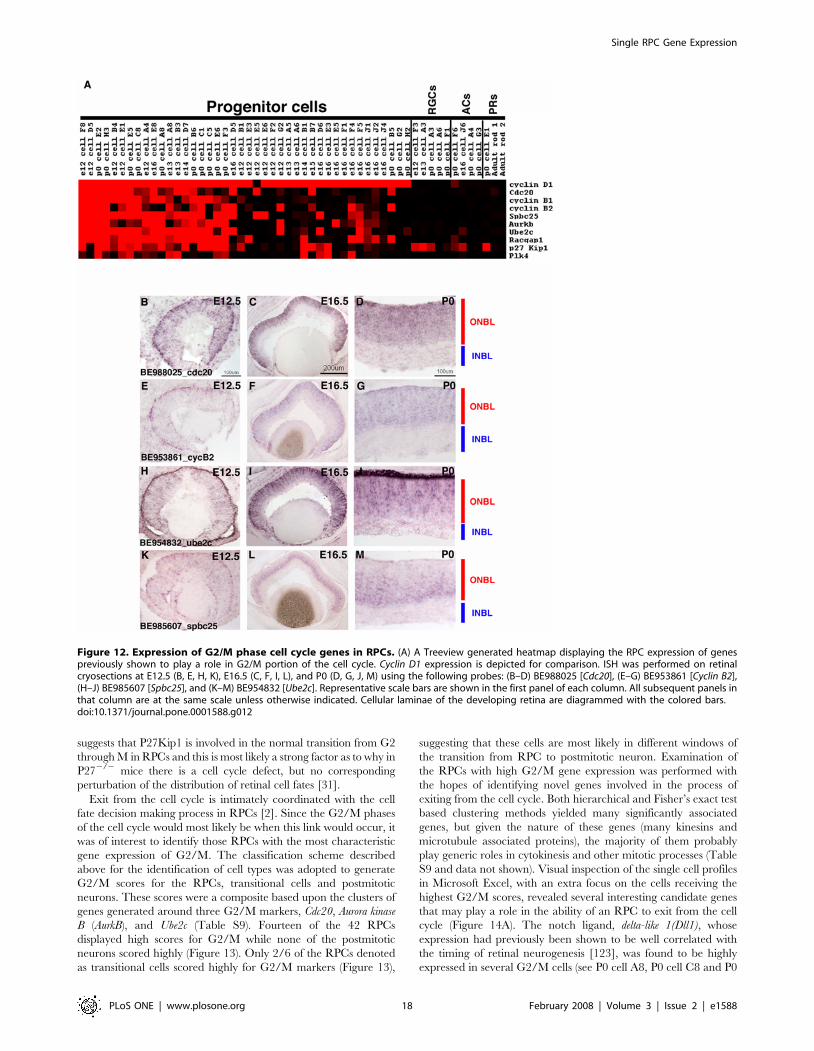
suggests that P27Kip1 is involved in the normal transition from G2
through M in RPCs and this is most likely a strong factor as to why in
P272/2 mice there is a cell cycle defect, but no corresponding
perturbation of the distribution of retinal cell fates [31].
Exit from the cell cycle is intimately coordinated with the cell
fate decision making process in RPCs [2]. Since the G2/M phases
of the cell cycle would most likely be when this link would occur, it
was of interest to identify those RPCs with the most characteristic
gene expression of G2/M. The classification scheme described
above for the identification of cell types was adopted to generate
G2/M scores for the RPCs, transitional cells and postmitotic
neurons. These scores were a composite based upon the clusters of
genes generated around three G2/M markers, Cdc20, Aurora kinase
B (AurkB), and Ube2c (Table S9). Fourteen of the 42 RPCs
displayed high scores for G2/M while none of the postmitotic
neurons scored highly (Figure 13). Only 2/6 of the RPCs denoted
as transitional cells scored highly for G2/M markers (Figure 13),
suggesting that these cells are most likely in different windows of
the transition from RPC to postmitotic neuron. Examination of
the RPCs with high G2/M gene expression was performed with
the hopes of identifying novel genes involved in the process of
exiting from the cell cycle. Both hierarchical and Fisher’s exact test
based clustering methods yielded many significantly associated
genes, but given the nature of these genes (many kinesins and
microtubule associated proteins), the majority of them probably
play generic roles in cytokinesis and other mitotic processes (Table
S9 and data not shown). Visual inspection of the single cell profiles
in Microsoft Excel, with an extra focus on the cells receiving the
highest G2/M scores, revealed several interesting candidate genes
that may play a role in the ability of an RPC to exit from the cell
cycle (Figure 14A). The notch ligand, delta-like 1(Dll1), whose
expression had previously been shown to be well correlated with
the timing of retinal neurogenesis [123], was found to be highly
expressed in several G2/M cells (see P0 cell A8, P0 cell C8 and P0
Figure 12. Expression of G2/M phase cell cycle genes in RPCs. (A) A Treeview generated heatmap displaying the RPC expression of genespreviously shown to play a role in G2/M portion of the cell cycle. Cyclin D1 expression is depicted for comparison. ISH was performed on retinalcryosections at E12.5 (B, E, H, K), E16.5 (C, F, I, L), and P0 (D, G, J, M) using the following probes: (B–D) BE988025 [Cdc20], (E–G) BE953861 [Cyclin B2],(H–J) BE985607 [Spbc25], and (K–M) BE954832 [Ube2c]. Representative scale bars are shown in the first panel of each column. All subsequent panels inthat column are at the same scale unless otherwise indicated. Cellular laminae of the developing retina are diagrammed with the colored bars.doi:10.1371/journal.pone.0001588.g012
Single RPC Gene Expression
PLoS ONE | www.plosone.org 18 February 2008 | Volume 3 | Issue 2 | e1588
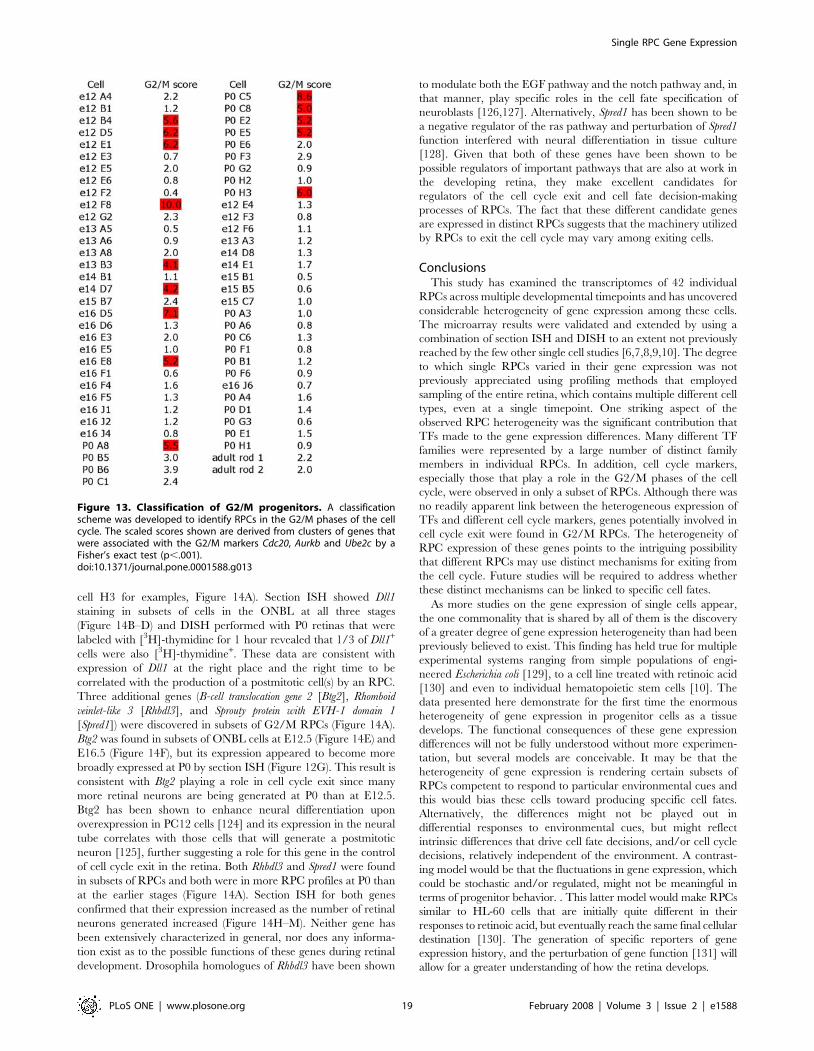
cell H3 for examples, Figure 14A). Section ISH showed Dll1
staining in subsets of cells in the ONBL at all three stages
(Figure 14B–D) and DISH performed with P0 retinas that were
labeled with [3H]-thymidine for 1 hour revealed that 1/3 of Dll1+
cells were also [3H]-thymidine+. These data are consistent with
expression of Dll1 at the right place and the right time to be
correlated with the production of a postmitotic cell(s) by an RPC.
Three additional genes (B-cell translocation gene 2 [Btg2], Rhomboid
veinlet-like 3 [Rhbdl3], and Sprouty protein with EVH-1 domain 1
[Spred1]) were discovered in subsets of G2/M RPCs (Figure 14A).
Btg2 was found in subsets of ONBL cells at E12.5 (Figure 14E) and
E16.5 (Figure 14F), but its expression appeared to become more
broadly expressed at P0 by section ISH (Figure 12G). This result is
consistent with Btg2 playing a role in cell cycle exit since many
more retinal neurons are being generated at P0 than at E12.5.
Btg2 has been shown to enhance neural differentiation upon
overexpression in PC12 cells [124] and its expression in the neural
tube correlates with those cells that will generate a postmitotic
neuron [125], further suggesting a role for this gene in the control
of cell cycle exit in the retina. Both Rhbdl3 and Spred1 were found
in subsets of RPCs and both were in more RPC profiles at P0 than
at the earlier stages (Figure 14A). Section ISH for both genes
confirmed that their expression increased as the number of retinal
neurons generated increased (Figure 14H–M). Neither gene has
been extensively characterized in general, nor does any informa-
tion exist as to the possible functions of these genes during retinal
development. Drosophila homologues of Rhbdl3 have been shown
to modulate both the EGF pathway and the notch pathway and, in
that manner, play specific roles in the cell fate specification of
neuroblasts [126,127]. Alternatively, Spred1 has been shown to be
a negative regulator of the ras pathway and perturbation of Spred1
function interfered with neural differentiation in tissue culture
[128]. Given that both of these genes have been shown to be
possible regulators of important pathways that are also at work in
the developing retina, they make excellent candidates for
regulators of the cell cycle exit and cell fate decision-making
processes of RPCs. The fact that these different candidate genes
are expressed in distinct RPCs suggests that the machinery utilized
by RPCs to exit the cell cycle may vary among exiting cells.
ConclusionsThis study has examined the transcriptomes of 42 individual
RPCs across multiple developmental timepoints and has uncovered
considerable heterogeneity of gene expression among these cells.
The microarray results were validated and extended by using a
combination of section ISH and DISH to an extent not previously
reached by the few other single cell studies [6,7,8,9,10]. The degree
to which single RPCs varied in their gene expression was not
previously appreciated using profiling methods that employed
sampling of the entire retina, which contains multiple different cell
types, even at a single timepoint. One striking aspect of the
observed RPC heterogeneity was the significant contribution that
TFs made to the gene expression differences. Many different TF
families were represented by a large number of distinct family
members in individual RPCs. In addition, cell cycle markers,
especially those that play a role in the G2/M phases of the cell
cycle, were observed in only a subset of RPCs. Although there was
no readily apparent link between the heterogeneous expression of
TFs and different cell cycle markers, genes potentially involved in
cell cycle exit were found in G2/M RPCs. The heterogeneity of
RPC expression of these genes points to the intriguing possibility
that different RPCs may use distinct mechanisms for exiting from
the cell cycle. Future studies will be required to address whether
these distinct mechanisms can be linked to specific cell fates.
As more studies on the gene expression of single cells appear,
the one commonality that is shared by all of them is the discovery
of a greater degree of gene expression heterogeneity than had been
previously believed to exist. This finding has held true for multiple
experimental systems ranging from simple populations of engi-
neered Escherichia coli [129], to a cell line treated with retinoic acid
[130] and even to individual hematopoietic stem cells [10]. The
data presented here demonstrate for the first time the enormous
heterogeneity of gene expression in progenitor cells as a tissue
develops. The functional consequences of these gene expression
differences will not be fully understood without more experimen-
tation, but several models are conceivable. It may be that the
heterogeneity of gene expression is rendering certain subsets of
RPCs competent to respond to particular environmental cues and
this would bias these cells toward producing specific cell fates.
Alternatively, the differences might not be played out in
differential responses to environmental cues, but might reflect
intrinsic differences that drive cell fate decisions, and/or cell cycle
decisions, relatively independent of the environment. A contrast-
ing model would be that the fluctuations in gene expression, which
could be stochastic and/or regulated, might not be meaningful in
terms of progenitor behavior. . This latter model would make RPCs
similar to HL-60 cells that are initially quite different in their
responses to retinoic acid, but eventually reach the same final cellular
destination [130]. The generation of specific reporters of gene
expression history, and the perturbation of gene function [131] will
allow for a greater understanding of how the retina develops.
Figure 13. Classification of G2/M progenitors. A classificationscheme was developed to identify RPCs in the G2/M phases of the cellcycle. The scaled scores shown are derived from clusters of genes thatwere associated with the G2/M markers Cdc20, Aurkb and Ube2c by aFisher’s exact test (p,.001).doi:10.1371/journal.pone.0001588.g013
Single RPC Gene Expression
PLoS ONE | www.plosone.org 19 February 2008 | Volume 3 | Issue 2 | e1588

Supporting Information
Figure S1 Assessment of unexpected signals in the single cell
profiles. A Treeview generated heatmap showing the lack of
expression of immunoglobulin genes, keratin genes, and
muscle genes in the majority of single RPCs gene expression
profiles.
Found at: doi:10.1371/journal.pone.0001588.s001 (9.52 MB TIF)
Figure S2 Assessment of housekeeping gene levels in the single
cell profiles. A Treeview generated heatmap showing the
expression of housekeeping genes in single RPCs.
Found at: doi:10.1371/journal.pone.0001588.s002 (3.99 MB TIF)
Figure S3 Classification of single cells. Hierarchical clustering was
used to generate a dendrogram of RPCs, RGCs, ACs, and PRs.
Found at: doi:10.1371/journal.pone.0001588.s003 (6.05 MB TIF)
Figure S4 Expression of TFs in RPCs. A Treeview generated
heatmap showing the expression of transcription factors in single
RPCs across many different transcription factor families.
Found at: doi:10.1371/journal.pone.0001588.s004 (9.52 MB TIF)
Table S1 Affymetrix array data for all of the single cells profiled
in this study. Scaled Affymetrix signal values (see Materials and
Methods), present/absent calls, and detection p-values are shown
for each probe set for each RPC cell profiled in this study.
Found at: doi:10.1371/journal.pone.0001588.s005 (84.74 MB
XLS)
Table S2 Assessment of unexpected signals in the single cell
profiles. Signal levels are shown for genes that were predicted not
to be expressed in single RPCs. In the instances where multiple
Affymetrix probe sets were present for the same gene, the
maximum signal level was chosen.
Figure 14. Expression of genes that potentially play a role in cell cycle exit. (A) A Treeview generated heatmap displaying the RPCexpression of genes that were isolated due to their expression in subsets of G2/M cells. The expression of Cyclin D1, G2/M genes (Cdc20, Cyclin B1,Ube2c, and P27Kip1) and some TFs (Hes6, Otx2 and NeuroD1) are depicted for comparison. ISH was performed on retinal cryosections at E12.5 (B, E, H,K), E16.5 (C, F, I, L), and P0 (D, G, J, M) using the following probes: (B–D) Delta-like 1 [123] (E–G) AI851775 [Btg2], (H–J) BE954420 [Rhbdl3], and (K–M)AI836584 [Spred1]. Representative scale bars are shown in the first panel of each column. All subsequent panels in that column are at the same scaleunless otherwise indicated. Cellular laminae of the developing retina are diagrammed with the colored bars.doi:10.1371/journal.pone.0001588.g014
Single RPC Gene Expression
PLoS ONE | www.plosone.org 20 February 2008 | Volume 3 | Issue 2 | e1588
Found at: doi:10.1371/journal.pone.0001588.s006 (0.04 MB
XLS)
Table S3 Assessment of housekeeping gene levels in the single
cell profiles. Signal levels are shown for a list of housekeeping
genes as determined from available lists (Qiagen and Superarray
Bioscience).
Found at: doi:10.1371/journal.pone.0001588.s007 (0.03 MB
XLS)
Table S4 Genes used for RGC classification. Genes are shown
that associate with NF68 with a p value ,0.001 by a Fisher’s exact
test along with the corresponding GO information for each gene.
The signal levels for these genes were used to generate a GC score
for each cell (see Figure 1).
Found at: doi:10.1371/journal.pone.0001588.s008 (0.05 MB
XLS)
Table S5 Genes used for AC classification. Genes are shown
that cluster with TCFAP-2Beta with a p value ,0.001 by a
Fisher’s exact test along with the corresponding GO information
for each gene. The signal levels for these genes were used to
generate an AC score for each cell (see Figure 1).
Found at: doi:10.1371/journal.pone.0001588.s009 (0.04 MB
XLS)
Table S6 Genes used for PR classification. Genes are shown that
cluster with Nrl with a p value ,0.001 by a Fisher’s exact test
along with the corresponding GO information for each gene. The
signal levels for these genes were used to generate a PR score for
each cell (see Figure 1).
Found at: doi:10.1371/journal.pone.0001588.s010 (0.11 MB
XLS)
Table S7 Genes used for RPC classification. Genes are shown
that cluster with Cyclin D1, Fgf15, Sfrp2 or Crym with a p value
,0.001 by a Fisher’s exact test along with the corresponding GO
information for each gene. The signal levels for these genes were
used in conjunction to generate a composite RPC score for each
cell (see Figure 1).
Found at: doi:10.1371/journal.pone.0001588.s011 (0.18 MB
XLS)
Table S8 A summary of genes for which in situ hybridizations
were performed in this study. For each gene the corresponding
cDNA used to generate the ISH riboprobe is listed. A summary of
the expression pattern observed at each stage is included. Terms
used to describe the in situ patterns: Outer neuroblastic layer/
ventricular zone (ONBL), scleral portion of the ONBL (sONBL),
vitreal portion of the ONBL (vONBL), retinal pigment epithelium
(RPE), not determined (ND).
Found at: doi:10.1371/journal.pone.0001588.s012 (0.05 MB
XLS)
Table S9 Genes used for G2/M classification. Genes are shown
that cluster with Cdc20, AurkB or Ube2c with a p value ,0.001
by a Fisher’s exact test along with the corresponding GO
information for each gene. The signal levels for these genes were
used in conjunction to generate a composite G2/M score for each
cell (see Figure 13).
Found at: doi:10.1371/journal.pone.0001588.s013 (0.04 MB
XLS)
Acknowledgments
We would like to thank Trent Rector and Sarah Annis at the Harvard
Medical School Biopolymers Facility for assistance with the Affymetrix
arrays and the members of the Cepko, Tabin and Dymecki labs for
valuable comments. CLC is an investigator of the Howard Hughes Medical
Institute.
Author Contributions
Conceived and designed the experiments: CC JT. Performed the
experiments: JT. Analyzed the data: JT MS. Contributed reagents/
materials/analysis tools: JT MS. Wrote the paper: CC JT.
References
1. Cepko CL, Austin CP, Yang X, Alexiades M, Ezzeddine D (1996) Cell fatedetermination in the vertebrate retina. Proc Natl Acad Sci U S A 93: 589–595.
2. Livesey FJ, Cepko CL (2001) Vertebrate neural cell-fate determination: lessons
from the retina. Nat Rev Neurosci 2: 109–118.
3. Edlund T, Jessell TM (1999) Progression from extrinsic to intrinsic signaling incell fate specification: a view from the nervous system. Cell 96: 211–224.
4. Nagaraj R, Banerjee U (2007) Combinatorial signaling in the specification of
primary pigment cells in the Drosophila eye. Development 134: 825–831.
5. Voas MG, Rebay I (2004) Signal integration during development: insights fromthe Drosophila eye. Dev Dyn 229: 162–175.
6. Chiang MK, Melton DA (2003) Single-cell transcript analysis of pancreas
development. Dev Cell 4: 383–393.
7. Ginsberg SD, Che S (2005) Expression profile analysis within the humanhippocampus: comparison of CA1 and CA3 pyramidal neurons. J Comp
Neurol 487: 107–118.
8. Kamme F, Salunga R, Yu J, Tran DT, Zhu J, et al. (2003) Single-cell
microarray analysis in hippocampus CA1: demonstration and validation of
cellular heterogeneity. J Neurosci 23: 3607–3615.
9. Tietjen I, Rihel JM, Cao Y, Koentges G, Zakhary L, et al. (2003) Single-cell
transcriptional analysis of neuronal progenitors. Neuron 38: 161–175.
10. Ramos CA, Bowman TA, Boles NC, Merchant AA, Zheng Y, et al. (2006)
Evidence for diversity in transcriptional profiles of single hematopoietic stemcells. PLoS Genet 2: e159.
11. Rodieck RW (1998) The first steps in seeing. Sunderland, MA: Sinauer.
12. Masland RH, Raviola E (2000) Confronting complexity: strategies for
understanding the microcircuitry of the retina. Annu Rev Neurosci 23: 249–284.
13. Holt CE, Bertsch TW, Ellis HM, Harris WA (1988) Cellular determination in
the Xenopus retina is independent of lineage and birth date. Neuron 1: 15–26.
14. Turner DL, Snyder EY, Cepko CL (1990) Lineage-independent determination
of cell type in the embryonic mouse retina. Neuron 4: 833–845.
15. Turner DL, Cepko CL (1987) A common progenitor for neurons and glia
persists in rat retina late in development. Nature 328: 131–136.
16. Sidman RL (1961) Histogenesis of mouse retina studied with thymidine-H3. In:
KSG, ed. The structure of the Eye. New York: Academic. pp 487–506.
17. Young RW (1985) Cell differentiation in the retina of the mouse. The Anat
Record 212: 199–205.
18. Young RW (1985) Cell proliferation during postnatal development of the retina
in the mouse. Dev Brain Res 21: 229–239.
19. Altshuler DM, Turner DL, Cepko CL (1991) Specification of cell type in the
vertebrate retina. In: Shatz CJ, ed. Develoment of the Visual System.
Cambridge: MIT Press. pp 37–58.
20. Belliveau MJ, Cepko CL (1999) Extrinsic and intrinsic factors control the
genesis of amacrine and cone cells in the rat retina. Development: In press.
21. Belliveau MJ, Young TL, Cepko CL (2000) Late retinal progenitor cells show
intrinsic limitations in the production of cell types and the kinetics of opsin
synthesis. J Neurosci 20: 2247–2254.
22. Rapaport DH, Patheal SL, Harris WA (2001) Cellular competence plays a role
in photoreceptor differentiation in the developing Xenopus retina. J Neurobiol
49: 129–141.
23. Cayouette M, Barres BA, Raff M (2003) Importance of intrinsic mechanisms in
cell fate decisions in the developing rat retina. Neuron 40: 897–904.
24. Isshiki T, Pearson B, Holbrook S, Doe CQ (2001) Drosophila neuroblasts
sequentially express transcription factors which specify the temporal identity of
their neuronal progeny. Cell 106: 511–521.
25. Pearson BJ, Doe CQ (2003) Regulation of neuroblast competence in
Drosophila. Nature 425: 624–628.
26. Yu J, Farjo R, MacNee SP, Baehr W, Stambolian DE, et al. (2003) Annotation
and analysis of 10,000 expressed sequence tags from developing mouse eye and
adult retina. Genome Biol 4: R65.
27. Blackshaw S, Harpavat S, Trimarchi J, Cai L, Huang H, et al. (2004) Genomic
analysis of mouse retinal development. PLoS Biol 2: E247.
28. Livesey FJ, Young TL, Cepko CL (2004) An analysis of the gene expression
program of mammalian neural progenitor cells. Proc Natl Acad Sci U S A 101:
1374–1379.
29. Chowers I, Gunatilaka TL, Farkas RH, Qian J, Hackam AS, et al. (2003)
Identification of novel genes preferentially expressed in the retina using a
custom human retina cDNA microarray. Invest Ophthalmol Vis Sci 44:
3732–3741.
Single RPC Gene Expression
PLoS ONE | www.plosone.org 21 February 2008 | Volume 3 | Issue 2 | e1588
30. Alexiades MR, Cepko CL (1997) Subsets of retinal progenitors displaytemporally regulated and distinct biases in the fates of their progeny.
Development 124: 1119–1131.
31. Dyer MA, Cepko CL (2001) p27Kip1 and p57Kip2 regulate proliferation in
distinct retinal progenitor cell populations. J Neurosci 21: 4259–4271.
32. Levine EM, Green ES (2004) Cell-intrinsic regulators of proliferation invertebrate retinal progenitors. Semin Cell Dev Biol 15: 63–74.
33. Brown NL, Kanekar S, Vetter ML, Tucker PK, Gemza DL, et al. (1998)Math5 encodes a murine basic helix-loop-helix transcription factor expressed
during early stages of retinal neurogenesis. Development 125: 4821–4833.
34. Gouge A, Holt J, Hardy AP, Sowden JC, Smith HK (2001) Foxn4--a new
member of the forkhead gene family is expressed in the retina. Mech Dev 107:
203–206.
35. Perron M, Harris WA (2000) Determination of vertebrate retinal progenitor
cell fate by the Notch pathway and basic helix-loop-helix transcription factors.Cell Mol Life Sci 57: 215–223.
36. Trimarchi JM, Stadler MB, Roska B, Billings N, Sun B, et al. (2007) Molecularheterogeneity of developing retinal ganglion and amacrine cells revealed
through single cell gene expression profiling. J Comp Neurol 502: 1047–1065.
37. Eisen MB, Spellman PT, Brown PO, Botstein D (1998) Cluster analysis anddisplay of genome-wide expression patterns. Proc Natl Acad Sci U S A 95:
14863–14868.
38. Brent AE, Schweitzer R, Tabin CJ (2003) A somitic compartment of tendon
progenitors. Cell 113: 235–248.
39. Murtaugh LC, Chyung JH, Lassar AB (1999) Sonic hedgehog promotes somiticchondrogenesis by altering the cellular response to BMP signaling. Genes Dev
13: 225–237.
40. Alexiades MR, Cepko C (1996) Quantitative analysis of proliferation and cell
cycle length during development of the rat retina. Dev Dyn 205: 293–307.
41. Young RW (1985) Cell differentiation in the retina of the mouse. Anat Rec 212:
199–205.
42. Fields-Berry SC, Halliday A, Cepko CL (1992) A recombinant retrovirusencoding alkaline phosphatase confirms clonal boundary assignment in lineage
analysis of murine retina. Proc Natl Acad Sci, USA 89: 693–697.
43. Brady G, Iscove NN (1993) Construction of cDNA libraries from single cells.
Methods Enzymol 225: 611–623.
44. Sicinski P, Donaher JL, Parker SB, Li T, Fazeli A, et al. (1995) Cyclin D1
provides a link between development and oncogenesis in the retina and breast.
Cell 82: 621–630.
45. Liu ISC, Chen J, Ploder L, Vidgen D, van der Kooy D, et al. (1994)
Developmental expression of a novel murine homeobox gene(Chx10):Evidence for roles in determination of the neuroretina and inner nuclear
layer. Neuron 13: 377–393.
46. Walther C, Gruss P (1991) Pax 6, a murine paired box gene, is expressed in the
developing CNS. Development 113: 1435–1449.
47. Punzo C, Cepko C (2007) Cellular responses to photoreceptor death in the rd1mouse model of retinal degeneration. Invest Ophthalmol Vis Sci 48: 849–857.
48. Lee PD, Sladek R, Greenwood CM, Hudson TJ (2002) Control genes andvariability: absence of ubiquitous reference transcripts in diverse mammalian
expression studies. Genome Res 12: 292–297.
49. Kouadjo KE, Nishida Y, Cadrin-Girard JF, Yoshioka M, St-Amand J (2007)
Housekeeping and tissue-specific genes in mouse tissues. BMC Genomics 8:
127.
50. Thellin O, Zorzi W, Lakaye B, De Borman B, Coumans B, et al. (1999)
Housekeeping genes as internal standards: use and limits. J Biotechnol 75:291–295.
51. Steele BK, Meyers C, Ozbun MA (2002) Variable expression of some‘‘housekeeping’’ genes during human keratinocyte differentiation. Anal
Biochem 307: 341–347.
52. Al-Bader MD, Al-Sarraf HA (2005) Housekeeping gene expression during fetalbrain development in the rat-validation by semi-quantitative RT-PCR. Brain
Res Dev Brain Res 156: 38–45.
53. Blackshaw S, Fraioli RE, Furukawa T, Cepko CL (2001) Comprehensive
analysis of photoreceptor gene expression and the identification of candidateretinal disease genes. Cell 107: 579–589.
54. Ezzeddine ZD, Yang X, DeChiara T, Yancopoulos G, Cepko CL (1997)
Postmitotic cells fated to become rod photoreceptors can be respecified byCNTF treatment of the retina. Development 124: 1055–1067.
55. Marquardt T, Ashery-Padan R, Andrejewski N, Scardigli R, Guillemot F, et al.(2001) Pax6 is required for the multipotent state of retinal progenitor cells. Cell
105: 43–55.
56. Burmeister M, Novak J, Liang MY, Basu S, Ploder L, et al. (1996) Ocular
retardation mouse caused by Chx10 homeobox null allele: impaired retinal
progenitor proliferation and bipolar cell differentiation. Nat Genet 12:376–384.
57. Taranova OV, Magness ST, Fagan BM, Wu Y, Surzenko N, et al. (2006)SOX2 is a dose-dependent regulator of retinal neural progenitor competence.
Genes Dev 20: 1187–1202.
58. Rowan S, Cepko CL (2004) Genetic analysis of the homeodomain transcriptionfactor Chx10 in the retina using a novel multifunctional BAC transgenic mouse
reporter. Dev Biol 271: 388–402.
59. Valente T, Auladell C (2001) Expression pattern of Zac1 mouse gene, a new
zinc-finger protein that regulates apoptosis and cellular cycle arrest, in bothadult brain and along development. Mech Dev 108: 207–211.
60. Liu IS, Chen JD, Ploder L, Vidgen D, van der Kooy D, et al. (1994)
Developmental expression of a novel murine homeobox gene (Chx10):
evidence for roles in determination of the neuroretina and inner nuclear layer.
Neuron 13: 377–393.
61. Hannan AJ, Schevzov G, Gunning P, Jeffrey PL, Weinberger RP (1995)
Intracellular localization of tropomyosin mRNA and protein is associated with
development of neuronal polarity. Mol Cell Neurosci 6: 397–412.
62. Vardimon L, Fox LE, Moscona AA (1986) Developmental regulation of
glutamine synthetase and carbonic anhydrase II in neural retina. Proc Natl
Acad Sci U S A 83: 9060–9064.
63. Linser P, Moscona AA (1979) Induction of glutamine synthetase in embryonic
neural retina: localization in Muller fibers and dependence on cell interactions.
Proc Natl Acad Sci U S A 76: 6476–6480.
64. Martinez-Morales JR, Del Bene F, Nica G, Hammerschmidt M, Bovolenta P,
et al. (2005) Differentiation of the vertebrate retina is coordinated by an FGF
signaling center. Dev Cell 8: 565–574.
65. Bartel FO, Higuchi T, Spyropoulos DD (2000) Mouse models in the study of
the Ets family of transcription factors. Oncogene 19: 6443–6454.
66. Hu H, Wang B, Borde M, Nardone J, Maika S, et al. (2006) Foxp1 is an
essential transcriptional regulator of B cell development. Nat Immunol 7:
819–826.
67. Stolt CC, Schmitt S, Lommes P, Sock E, Wegner M (2005) Impact of
transcription factor Sox8 on oligodendrocyte specification in the mouse
embryonic spinal cord. Dev Biol 281: 309–317.
68. Stolt CC, Lommes P, Friedrich RP, Wegner M (2004) Transcription factors
Sox8 and Sox10 perform non-equivalent roles during oligodendrocyte
development despite functional redundancy. Development 131: 2349–2358.
69. Breiteneder-Geleff S, Matsui K, Soleiman A, Meraner P, Poczewski H, et al.
(1997) Podoplanin, novel 43-kd membrane protein of glomerular epithelial
cells, is down-regulated in puromycin nephrosis. Am J Pathol 151: 1141–1152.
70. Saari JC, Nawrot M, Kennedy BN, Garwin GG, Hurley JB, et al. (2001) Visual
cycle impairment in cellular retinaldehyde binding protein (CRALBP)
knockout mice results in delayed dark adaptation. Neuron 29: 739–748.
71. Oshima A, Suzuki S, Takumi Y, Hashizume K, Abe S, et al. (2006) CRYM
mutations cause deafness through thyroid hormone binding properties in the
fibrocytes of the cochlea. J Med Genet 43: e25.
72. Pei L (2001) Identification of c-myc as a down-stream target for pituitary
tumor-transforming gene. J Biol Chem 276: 8484–8491.
73. Sano M, Genkai N, Yajima N, Tsuchiya N, Homma J, et al. (2006) Expression
level of ECT2 proto-oncogene correlates with prognosis in glioma patients.
Oncol Rep 16: 1093–1098.
74. Martins RA, Linden R, Dyer MA (2006) Glutamate regulates retinal
progenitors cells proliferation during development. Eur J Neurosci 24:
969–980.
75. Vetter ML, Brown NL (2001) The role of basic helix-loop-helix genes in
vertebrate retinogenesis. Semin Cell Dev Biol 12: 491–498.
76. Cepko CL (1999) The roles of intrinsic and extrinsic cues and bHLH genes in
the determination of retinal cell fates. Curr Opin Neurobiol 9: 37–46.
77. Hatakeyama J, Kageyama R (2004) Retinal cell fate determination and bHLH
factors. Semin Cell Dev Biol 15: 83–89.
78. Le TT, Wroblewski E, Patel S, Riesenberg AN, Brown NL (2006) Math5 is
required for both early retinal neuron differentiation and cell cycle progression.
Dev Biol 295: 764–778.
79. Matter-Sadzinski L, Puzianowska-Kuznicka M, Hernandez J, Ballivet M,
Matter JM (2005) A bHLH transcriptional network regulating the specification
of retinal ganglion cells. Development 132: 3907–3921.
80. Decembrini S, Andreazzoli M, Vignali R, Barsacchi G, Cremisi F (2006)
Timing the generation of distinct retinal cells by homeobox proteins. PLoS Biol
4: e272.
81. Ohsawa R, Kageyama R (2007) Regulation of retinal cell fate specification by
multiple transcription factors. Brain Res.
82. Moore KB, Schneider ML, Vetter ML (2002) Posttranslational mechanisms
control the timing of bHLH function and regulate retinal cell fate. Neuron 34:
183–195.
83. Bae S, Bessho Y, Hojo M, Kageyama R (2000) The bHLH gene Hes6, an
inhibitor of Hes1, promotes neuronal differentiation. Development 127:
2933–2943.
84. Porter FD, Drago J, Xu Y, Cheema SS, Wassif C, et al. (1997) Lhx2, a LIM
homeobox gene, is required for eye, forebrain, and definitive erythrocyte
development. Development 124: 2935–2944.
85. Mathers PH, Jamrich M (2000) Regulation of eye formation by the Rx and
pax6 homeobox genes. Cell Mol Life Sci 57: 186–194.
86. Furukawa T, Morrow EM, Cepko CL (1997) Crx, a novel otx-like homeobox
gene, shows photoreceptor-specific expression and regulates photoreceptor
differentiation. Cell 91: 531–541.
87. Freund CL, Gregory-Evans CY, Furukawa T, Papaioannou M, Looser J, et al.
(1997) Cone-rod dystrophy due to mutations in a novel photoreceptor-specific
homeobox gene (CRX) essential for maintenance of the photoreceptor. Cell 91:
543–553.
88. Nishida A, Furukawa A, Koike C, Tano Y, Aizawa S, et al. (2003) Otx2
homeobox gene controls retinal photoreceptor cell fate and pineal gland
development. Nat Neurosci 6: 1255–1263.
Single RPC Gene Expression
PLoS ONE | www.plosone.org 22 February 2008 | Volume 3 | Issue 2 | e1588
89. Zaki PA, Collinson JM, Toraiwa J, Simpson TI, Price DJ, et al. (2006)
Penetrance of eye defects in mice heterozygous for mutation of Gli3 isenhanced by heterozygous mutation of Pax6. BMC Dev Biol 6: 46.
90. Carlsson P, Mahlapuu M (2002) Forkhead transcription factors: key players in
development and metabolism. Dev Biol 250: 1–23.91. Laoukili J, Stahl M, Medema RH (2007) FoxM1: at the crossroads of ageing
and cancer. Biochim Biophys Acta 1775: 92–102.92. Huang H, Tindall DJ (2007) Dynamic FoxO transcription factors. J Cell Sci
120: 2479–2487.
93. Li S, Mo Z, Yang X, Price SM, Shen MM, et al. (2004) Foxn4 controls thegenesis of amacrine and horizontal cells by retinal progenitors. Neuron 43:
795–807.94. Korver W, Roose J, Clevers H (1997) The winged-helix transcription factor
Trident is expressed in cycling cells. Nucleic Acids Res 25: 1715–1719.95. Brunet A, Bonni A, Zigmond MJ, Lin MZ, Juo P, et al. (1999) Akt promotes
cell survival by phosphorylating and inhibiting a Forkhead transcription factor.
Cell 96: 857–868.96. Tran H, Brunet A, Grenier JM, Datta SR, Fornace AJ Jr, et al. (2002) DNA
repair pathway stimulated by the forkhead transcription factor FOXO3athrough the Gadd45 protein. Science 296: 530–534.
97. Otteson DC, Liu Y, Lai H, Wang C, Gray S, et al. (2004) Kruppel-like factor
15, a zinc-finger transcriptional regulator, represses the rhodopsin andinterphotoreceptor retinoid-binding protein promoters. Invest Ophthalmol
Vis Sci 45: 2522–2530.98. Otteson DC, Lai H, Liu Y, Zack DJ (2005) Zinc-finger domains of the
transcriptional repressor KLF15 bind multiple sites in rhodopsin and IRBPpromoters including the CRS-1 and G-rich repressor elements. BMC Mol Biol
6: 15.
99. Marsh-Armstrong N, McCaffery P, Gilbert W, Dowling JE, Drager UC (1994)Retinoic acid is necessary for development of the ventral retina in zebrafish.
Proc Natl Acad Sci U S A 91: 7286–7290.100. Sen J, Harpavat S, Peters MA, Cepko CL (2005) Retinoic acid regulates the
expression of dorsoventral topographic guidance molecules in the chick retina.
Development 132: 5147–5159.101. Hyatt GA, Schmitt EA, Fadool JM, Dowling JE (1996) Retinoic acid alters
photoreceptor development in vivo. Proc Natl Acad Sci U S A 93:13298–13303.
102. Kelley MW, Turner JK, Reh TA (1994) Retinoic acid promotes differentiationof photoreceptors in vitro. Development 120: 2091–2102.
103. Kelley MW, Williams RC, Turner JK, Creech-Kraft JM, Reh TA (1999)
Retinoic acid promotes rod photoreceptor differentiation in rat retina in vivo.Neuroreport 10: 2389–2394.
104. Teng SC, Wu KJ, Tseng SF, Wong CW, Kao L (2006) Importin KPNA2,NBS1, DNA repair and tumorigenesis. J Mol Histol 37: 293–299.
105. Shivakumar L, Minna J, Sakamaki T, Pestell R, White MA (2002) The
RASSF1A tumor suppressor blocks cell cycle progression and inhibits cyclin D1accumulation. Mol Cell Biol 22: 4309–4318.
106. Jaskulski D, Gatti C, Travali S, Calabretta B, Baserga R (1988) Regulation ofthe proliferating cell nuclear antigen cyclin and thymidine kinase mRNA levels
by growth factors. J Biol Chem 263: 10175–10179.107. Kalma Y, Marash L, Lamed Y, Ginsberg D (2001) Expression analysis using
DNA microarrays demonstrates that E2F-1 up-regulates expression of DNA
replication genes including replication protein A2. Oncogene 20: 1379–1387.108. Maiorano D, Lutzmann M, Mechali M (2006) MCM proteins and DNA
replication. Curr Opin Cell Biol 18: 130–136.109. Trimarchi JM, Lees JA (2002) Sibling rivalry in the E2F family. Nat Rev Mol
Cell Biol 3: 11–20.
110. Lei M (2005) The MCM complex: its role in DNA replication and implicationsfor cancer therapy. Curr Cancer Drug Targets 5: 365–380.
111. DeGregori J, Kowalik T, Nevins JR (1995) Cellular targets for activation by the
E2F1 transcription factor include DNA synthesis- and G1/S-regulatory genes.Mol Cell Biol 15: 4215–4224.
112. Dyer MA, Cepko CL (2001) Regulating proliferation during retinal
development. Nat Rev Neurosci 2: 333–342.113. Humbert PO, Verona R, Trimarchi JM, Rogers C, Dandapani S, et al. (2000)
E2f3 is critical for normal cellular proliferation. Genes Dev 14: 690–703.114. Tseng SF, Chang CY, Wu KJ, Teng SC (2005) Importin KPNA2 is required
for proper nuclear localization and multiple functions of NBS1. J Biol Chem
280: 39594–39600.115. van der Weyden L, Adams DJ (2007) The Ras-association domain family
(RASSF) members and their role in human tumourigenesis. Biochim BiophysActa.
116. Gieffers C, Peters BH, Kramer ER, Dotti CG, Peters JM (1999) Expression ofthe CDH1-associated form of the anaphase-promoting complex in postmitotic
neurons. Proc Natl Acad Sci U S A 96: 11317–11322.
117. Yu H (2002) Regulation of APC-Cdc20 by the spindle checkpoint. Curr OpinCell Biol 14: 706–714.
118. Irniger S (2002) Cyclin destruction in mitosis: a crucial task of Cdc20. FEBSLett 532: 7–11.
119. Bischoff JR, Plowman GD (1999) The Aurora/Ipl1p kinase family: regulators
of chromosome segregation and cytokinesis. Trends Cell Biol 9: 454–459.120. Bastians H, Topper LM, Gorbsky GL, Ruderman JV (1999) Cell cycle-
regulated proteolysis of mitotic target proteins. Mol Biol Cell 10: 3927–3941.121. Young RW (1985) Cell proliferation during postnatal development of the retina
in the mouse. Brain Res 353: 229–239.122. Reddy SK, Rape M, Margansky WA, Kirschner MW (2007) Ubiquitination by
the anaphase-promoting complex drives spindle checkpoint inactivation.
Nature 446: 921–925.123. Bao ZZ, Cepko CL (1997) The expression and function of Notch pathway
genes in the developing rat eye. J Neurosci 17: 1425–1434.124. el-Ghissassi F, Valsesia-Wittmann S, Falette N, Duriez C, Walden PD, et al.
(2002) BTG2(TIS21/PC3) induces neuronal differentiation and prevents
apoptosis of terminally differentiated PC12 cells. Oncogene 21: 6772–6778.125. Iacopetti P, Michelini M, Stuckmann I, Oback B, Aaku-Saraste E, et al. (1999)
Expression of the antiproliferative gene TIS21 at the onset of neurogenesisidentifies single neuroepithelial cells that switch from proliferative to neuron-
generating division. Proc Natl Acad Sci U S A 96: 4639–4644.126. Bier E, Jan LY, Jan YN (1990) rhomboid, a gene required for dorsoventral axis
establishment and peripheral nervous system development in Drosophila
melanogaster. Genes Dev 4: 190–203.127. Jaszai J, Brand M (2002) Cloning and expression of Ventrhoid, a novel
vertebrate homologue of the Drosophila EGF pathway gene rhomboid. MechDev 113: 73–77.
128. Wakioka T, Sasaki A, Kato R, Shouda T, Matsumoto A, et al. (2001) Spred is a
Sprouty-related suppressor of Ras signalling. Nature 412: 647–651.129. Elowitz MB, Levine AJ, Siggia ED, Swain PS (2002) Stochastic gene expression
in a single cell. Science 297: 1183–1186.130. Huang S, Eichler G, Bar-Yam Y, Ingber DE (2005) Cell fates as high-
dimensional attractor states of a complex gene regulatory network. Phys RevLett 94: 128701.
131. Matsuda T, Cepko CL (2004) Electroporation and RNA interference in the
rodent retina in vivo and in vitro. Proc Natl Acad Sci U S A 101: 16–22.132. Morrow EM, Furukawa T, Lee JE, Cepko CL (1999) NeuroD regulates
multiple functions in the developing neural retina in rodent. Development 126:23–36.
133. Furukawa T, Morrow EM, Cepko CL (1997) Crx, a novel otx-like homeobox
gene, shows photoreceptor-specific expression and regulates photoreceptordifferentiation. Cell 91: 531–541.
Single RPC Gene Expression
PLoS ONE | www.plosone.org 23 February 2008 | Volume 3 | Issue 2 | e1588
Copyright © 2022 FDOKUMEN