Indian Journal of Landscape Systems and Ecological Studies
179
Indian Journal of Landscape Systems and Ecological Studies Volume : 42 No.2 December, 2019 INSTITUTE OF LANDSCAPE, ECOLOGY & EKISTICS, KOLKATA Founded By Shibaprasad Chatterjee ISSN 0971-4170
-
Upload
khangminh22 -
Category
Documents
-
view
3 -
download
0
Transcript of Indian Journal of Landscape Systems and Ecological Studies

NO. 2 INDIAN JOURNAL OF LANDSCAPE SYSTEMS AND ECOLOGICAL STUDIES 1
Indian Journal ofLandscape Systems and Ecological Studies
Volume : 42 No.2 December, 2019
INSTITUTE OFLANDSCAPE, ECOLOGY & EKISTICS, KOLKATA
Founded ByShibaprasad Chatterjee
ISSN 0971-4170

2 INDIAN JOURNAL OF LANDSCAPE SYSTEMS AND ECOLOGICAL STUDIES VOL. 42
Acknowledgement
Grant-in-aid for maintenance and development to theInstitute of Landscape, Ecology and Ekistics, Kolkata-700 019, especially for its Journal – Indian Journal ofLandscape Systems and Ecological Studies, receivedfrom Indian Council of Social Science Research (ICSSR),Government of India, New Delhi 110 067, is thankfullyacknowledged.

NO. 2 INDIAN JOURNAL OF LANDSCAPE SYSTEMS AND ECOLOGICAL STUDIES 3
Indian Journal ofLandscape Systems and Ecological Studies
Volume : 42 No.2 December, 2019
CONTENTS
REDEVELOPMENT OF THE WALLED CITY OF DELHI: Aisharya Bhattacharjee 5AN ASSESSMENT OF THE PLANNING FRAMEWORKAND GOVERNANCE CHALLENGES
ENVIRONMENTAL PROBLEMS DUE TO JOKA- Alpana Ray 16B.B.D. BAG METRO RAILWAY PROJECT ALONG Sudip RoyBEHALA -TARATALA ROUTE IN THE CITY OF KOLKATA,WEST BENGAL
IDENTIFYING DESTINATION OF RURAL OUT-MIGRANTS Manoj Debnath 31IN WEST BENGAL: CORRELATING RATE OF OUTMIGRATION WITH DISTANCE
UNDERNUTRITION LEVEL AMONG THE CHILDREN Mrinal Mandal 49UNDER 5 YEARS AGE IN ARSHA COMMUNITY Debasis GhoshDEVELOPMENT BLOCK OF PURULIA DISTRICT,WEST BENGAL
SPATIAL CONCENTRATION OF URBAN Mustafijur Rahaman 64INFRASTRUCTURAL FACILITIES: A CASE STUDY OF Nigar Alam SiddiqueBERHAMPORE TOWN, WEST BENGAL
SOCIAL INCLUSION OF MUNDA TRIBE OF A PART OF Ranajit Sardar 77SUNDARBAN REGION IN WEST BENGAL Sukla Basu
LANDSCAPE, CULTURE AND CINEMA: A STUDY IN Ravi S. Singh 89FILM GEOGRAPHY Sweta Singh

4 INDIAN JOURNAL OF LANDSCAPE SYSTEMS AND ECOLOGICAL STUDIES VOL. 42
A REVIEW OF URBAN MICROCLIMATE CONCEPTS AND Rohini Mazumder 102THERMAL INDICES IN THE ANALYSIS OF OUTDOOR ChakrabortyTHERMAL COMFORT IN TROPICAL HUMID CLIMATE Debashish Das -CASE STUDY ON KOLKATA
DEVELOPMENT OF SUBARNAREKHA RIVERBED Rupam Kumar Dutta 116POTHOLES IN GHATSHILA, EAST SINGHBHUM Bandita BuragohainDISTRICT, JHARKHAND
ESTIMATION OF SHORTWAVE SURFACE ALBEDO (SSA) Sujoy Sadhu 132AND ITS IMPACT ON THERMAL ENVIRONMENT IN Lakshminarayan SatpatiKOLKATA
GEOMORPHIC UNITS OF THE SIKKIM HIMALAYA Samir Kumar Samanta 147
AN APPRAISAL OF GROUND REALITIES OF Shasanka Kumar Gayen 158DEPRIVATION AMONG THE BEEDI WORKERS IN Koyel RoyTUFANGANJ-I BLOCK OF COOCH BEHAR DISTRICT Rupan Dutta
SITE AND SITUATION OF SETTLEMENTS IN THE Suchitra Ray 168RAMMAM BASIN, DARJILING - SIKKIM HIMALAYA Ranjan Roy

NO. 2 REDEVELOPMENT OF THE WALLED CITY OF DELHI 5
Redevelopment of The Walled City of Delhi: An Assessmentof the Planning Framework and Governance Challenges
Aisharya Bhattacharjee*
Abstract : In the present day, city revitalization has become one of the prime elements in urban studies.However, a multitude of approaches are embedded in the term "city revitalization" like redevelopment,rehabilitation and conservation. In line with this concept, a case study of the revitalization of the walled city ofDelhi from the perspective of redevelopment has been undertaken in this research work that specificallyattempts to portray the myriad of transformations contingent upon the redevelopment work of the city inprogress. At the same time, it also tries to delve meticulously into the planning framework of the city and theassociated governance challenges faced in the process of redevelopment.
Keywords : Governance, Planning, Redevelopment, Walled city
IntroductionWith the shift of the contemporary paradigm to a more ecological one, city beautification have
become the tagline of most of the master plans that are being framed for the metropolitan cities. Incontext of these, urban renewal and redevelopment in the form of decongesting the city core,demolition and resettlement of slums and squatters, infrastructural upgradation and the like hasbecome the primary target for agencies involved in such revitalization projects. There are numerousinstances in the developing world where people have gradually relocated from the congested citycore to the surrounding areas. Big old homes have been divided into apartments or used for non-residential purposes while smaller houses have been sold or leased fairly cheaply and, in thescramble for cheap accommodation, have inevitably suffered from overcrowding (Hoff and Duggar1959). All these necessarily bring the discourse on city revitalization as one of the prime elementsin urban studies.
A myriad of definitions have been given in the context of urban renewal by different scholars.Urban renewal is a part of a larger process, by which the human environment is continuallytransformed and social capital is accumulated in urban areas and other settled areas (Hoff andDuggar 1959). According to Groberg (1965) urban renewal encompasses all public and privateefforts to improve city form and life. Onkar, Dhote and Sharma (2008) is of the opinion that urban
* Research Scholar, Centre for the Study of Regional Development, School of Social Sciences, JawaharlalNehru University, New Delhi – 110069, [email protected]
Ind. J. of Landscape Systems and Ecological Studies 42 (2) December - 2019, 5- 15 ISSN 0971-4170

6 INDIAN JOURNAL OF LANDSCAPE SYSTEMS AND ECOLOGICAL STUDIES VOL. 42
renewal and redevelopment strategies have gradually evolved into a policy which is based less onthe destruction and more on the renovation and investment, and at present, it is a significant partof numerous local governments, which are often amalgamated into small and big incentives ofbusiness. These definitions pristinely reflect the contemporary paradigm shifts in the concept ofurban renewal over time.
At this juncture, it is also necessary to delve into the various concepts that are associatedwith urban renewal. Urban renewal is rather an umbrella term that encompasses in its domain certainsub elements also. Some notable scholars have drawn upon a clear cut division betweenredevelopment, rehabilitation and conservation associated with urban renewal. (Hoff and Duggar1959) is of the view that redevelopment should be carried out in those areas where the generallayout has become such that there is no further opportunity for any sound economic activity totake place and hence it consists of re-use of the land which is been cleared and generally operateson a project basis. This is somewhat synonymous to the term clearance which will be applicable tothose areas which are beyond economical redemption and the only solution is to tear out andrebuild (Wedge 1958). Contrary to this, rehabilitation is considered necessary when some loss oforiginal function is making itself seriously felt; or in which there are conditions that are likely tocause a deterioration of opportunities for sound economic activity or satisfactory living conditions;or in which buildings, though generally in structurally sound condition, have deteriorated becauseof neglect of maintenance (Hoff and Duggar 1959). It operates through a series of administrativecontrol and correction measures. Rehabilitation is an approach which is commonly used in a run-down area where the homes can be repaired, refurnished, and brought back to the status of goodhousing (Wedge 1958). On the other hand, conservation is however an entirely in situ conceptwhere the areal aspects are being kept in proper condition through maintenance or restricting theentry of such factors which may cause their deterioration (Hoff and Duggar 1959). Other scholarshave approached conservation from a different perspective and have referred it as the treatmentapplied to the area which is in peril of, but has not yet succumbed to, blight (Wedge 1958).
Some critics have however pointed out to the negative effects of urban renewal andredevelopment. Such problems are intricately associated with the displacement and resettlement offamilies (Nesbitt 1958) and problem of relating patterns of land use to circulation facilities (Hoff andDuggar 1959). In a research work based on cities in Britain it have been stated that earlyredevelopment strategies have created significant degrees of spatial fragmentation between functionsand the loss of a substantial residential population and hence, in the contemporary social climate,these changes have resulted in negative implications for the perception of safety and the generationof fear and anxiety amongst all users of the city centre (Thomas and Bromley 2000).
Now, converging all these into the present research domain, it is most discernable that for acity like Delhi, where nearly 51.9% of the population is spread over JJ (Jhuggi Jhopri) Clusters, SlumDesignated areas, Unauthorized Colonies and Regularized – Unauthorized Colonies, urbanrevitalization is indeed a herculean task. However, a number of urban renewal projects have beenchalked down for the city from time to time that has focused on reshaping the city as well as

NO. 2 REDEVELOPMENT OF THE WALLED CITY OF DELHI 7
conservation of its grandeur architectural heritage. One such evidence may be cited fromShahjahanabad or the Walled City of Delhi which has been cruising through a tangle of deterioratinginfrastructure, illegal construction works, dilapidated housing, traffic congestion and a shifting landuse to non residential uses. The present research work is therefore oriented to a study of theproblems associated with the most densely populated zone of the Delhi and a review of therevitalization work done so far by different agencies, their problems in governance and addressingthem.
Aims and ObjectivesThe research work rests on three main objectives oriented to addressing the research gaps as
deduced from the survey of literatures:
1. To analyze as to how the planning framework of the walled city has changed in each of thethree master plans i.e. 1961, 2001 and 2021 of Delhi.
2. To understand the governance structure associated with the redevelopment of the areaand the consequent impact of redevelopment on the community i.e. people residing thereas well as the local traders.
Fig. 1: Location Map

8 INDIAN JOURNAL OF LANDSCAPE SYSTEMS AND ECOLOGICAL STUDIES VOL. 42
3. To assess the governance issues and challenges associated with the revitalization process.
Database and Research MethodologyThe paper is based on both primary and secondary data. A household level perception survey
has been conducted in Ballimaran and Lal Kuan area of the walled city of Delhi comprising of 25households residing in some of the dilapidated havelis found there in order to find out the majorissues thronging in the area and therefore the need for revitalization. The respondents were askedto rank the following in order of their preference for the necessity of redevelopment of the area,with 1 given to the indicator that is most crucial for redevelopment as per the perception of therespondents and rank progressively increasing with the higher ones needing the least importance.The indicators so considered are: High residential density; High commercial density; Water issues;Traffic Density, lack of parking space and narrow circulation space; Polluting nature of manufacturingindustries; deteriorating heritage fabric; Criminal issues; Lack of sanitation and hygiene and Lackof social infrastructure. In context of the data so collected, a composite score of the ranks assignedhas been obtained for each indicator with the least score reflecting the indicator which is in mostneed for concern.
Secondly, in order to get detailed information about the process in which the redevelopmentof the area concerned is being implemented and executed, a short interview has been conducted bythe field observer with the various staffs of different agencies involved in the redevelopmentprocess i.e., Shahajanabad Redevelopment Corporation (SRDC), Delhi Development Authority (DDA),Indian National Trust for Art and Cultural Heritage (INTACH) and Delhi Urban Art Commission(DUAC).
Thirdly, a focused group discussion of 6-7 traders each from three katras in Chadni Chowk,namely: Katra Neel, Katra Ashrafi and Katra Nawab regarding the problems they were facing with
Fig. 2: Population density of Shahajanabad(persons per sq.km)

NO. 2 REDEVELOPMENT OF THE WALLED CITY OF DELHI 9
the revitalization of the Chadni Chowk area in progress and their expectations in business after theredevelopment work is completed.
Secondary data pertaining to the proposals of redevelopment, demographics and land use hasbeen obtained from different sources as in Master Plan of Delhi (MPD), Zonal Development Plansand Census of India.
Delving Into The City Dynamics - Where The Necessity For Planning Lies?
Fig. 3: Population growth rate in Shahajanabad
Fig. 4: Land Utilisation Categories in Walled City of Delhi

10 INDIAN JOURNAL OF LANDSCAPE SYSTEMS AND ECOLOGICAL STUDIES VOL. 42
The figures for the population density of Shahajanabad has shown a decreasing trend rightfrom 1961.The population of the city registered a positive growth rate of 10.25% during the 1961census. This was solely due to the immigration to the city core and proliferation of refugee colonieswhich started to sprang up in the area since the partition. However, there has been a clear trend ofdecreasing population density thereafter for all the successive census years. This is because recently,there has been a clear tendency of outmigration from the city core. The city which once had beenprimarily devoted for the sheltering of the community is on the verge of being converted to awholesale market area. The deviating tendency towards a commercial area from being a residentialone has led to a tremendous rise in its working population and consequently, put pressure on itsinfrastructure as well as has been deteriorating the grandeur heritage of the city. This graph furtherillustrates this fact, that during a span of two decades, the proportion of area devoted to commercial,warehousing and transport utilities have increased significantly.
The results as obtained from the household perception survey also evinces three crucialissues that needs to be addressed i.e. traffic density exacerbated by lack of parking spaces andoperation of a variety of modes for passenger and freight movement. The other aspect is watersupply where a large number of respondents have reported regarding the poor quality of watersupplied. Apart from these, the streets are too narrow, there are open gutters which add to theproblem of congestion and associated lack of sanitation and hygiene.
Fig. 5: Composite Score - Household Perception Survey

NO. 2 REDEVELOPMENT OF THE WALLED CITY OF DELHI 11
Planning Framework - A Review of the Master Plans
Given the withering scenario of the once exuberant heritage of the city of old Delhi, theproposals in the Master Plan have also been oriented to boosting up the local economy by growthof traditional crafts bazaar, festivals and heritage walks to attract tourist inflow into the area. However,a chronological review of the master plans has revealed that there are a number of issues that hasemerged pertaining to the governance and redevelopment of the walled city. A few of them asperceived by the researcher has been enumerated below:
The matrix below provides a list of the different attributes that have been taken up pertainingto the walled city in the three master plans of Delhi. First of all, a number of aspects that wereconsidered in the previous master plan are missing in the later despite the fact that such targetshave not been achieved. For instance, the master plan for 1961 had proposed that there will be noland in the walled city under industrial use. However, the same is lacking in the 2021 master plandespite the fact that a large number of hazardous chemical manufacturing units exist in the katrasabout which the people have shown concern. Moreover, there has been no mention of upgradationof water supply and sewerage system in the MPD 2021 despite the fact that in accordance to aperception survey 2013 by the Shahajanabad Redevelopment Corporation, it has been observedthat the poor and under privileged struggle for access to water during the summer, while thehighest proportion of the respondents from Walled City (76%) reported issues with Water Quality.The MPD 2001 proposed for the revitalization of residential areas by maintaining the traditional
Table 1: Attributes undertaken in Master Plans for Redevelopment of Walled City of Delhi
Attributes taken under consideration MPD 1961 MPD 2001 MPD 2021
Delimitation of non residential activity √ √
Shifting of Industries and other manufacturing unit √ √
Upgradation of Water Supply & Sewerage system √
Electrification and Fuel Supply System √
Upgradation of Physical and Social Infrastructure √ √ √
Traffic and Transportation restructuring √ √
Structure and Spacing of buildings √
Heritage Conservation √ √
Green Initiatives √
Sanitization and environmental hygiene √
Revitalization of residential areas √
Source: Compiled from Master Plans of Delhi by the Author

12 INDIAN JOURNAL OF LANDSCAPE SYSTEMS AND ECOLOGICAL STUDIES VOL. 42
character and providing with complete physical and social infrastructure to the households, whichis however completely lacking in the MPD 2021 despite the dilapidated fettle of the residentialplaces.
While the 1961 MPD had put focus on the upgradation of trade and commercial activities inthe walled city, since it was perceived that if the central business district of the capital continues togrow as a major hub of commercial and distribution activities, it will develop as an importantfinancial centre. However, subsequent master plans have strictly opted for the delimitation of suchactivities pertaining to trade and commerce for the development of the area as a residential hubrather than a commercial one.
The idea of Collaborative Governance – A critical account of the role of different agencies involvedThe concept of Collaborative Governance comes under the umbrella of the different approaches
to governance. The neoliberal era with its emphasis on privatization had ushered in a new systemof governance that involves the public sector, the private sector as well as the local community.Collaborative Governance refers to a governing arrangement where one or more public agenciesdirectly engage non-state stakeholders in a collective decision-making process that is formal,consensus-oriented, and deliberative and that aims to make or implement public policy or managepublic programs or assets (Ansell and Gash 2008).
Now, bringing this into the domain of the present research of the revitalization of Shahajanabad,the major agency involved is the SRDC. However, the Master Plan of 2021 notifies the North DelhiMunicipal Corporation (NDMC) to be the nodal agency in the decision making and planning followedby implementation of any redevelopment proposals concerned with Shahajanabad. Apart from this,a number of other government agencies are also involved in restoring the long lost glory of the citylike Public Works Department (PWD) and para-state agencies like the Delhi Jal Board (DJB), DelhiTraffic Police (DTP), Delhi Fire Service (DFS), Bombay Suburban Electric Supply (BSES) YamunaLimited and Indraprastha Gas Limited (IGL). The revival of the heritage value is been carried on byagencies or organizations like the Heritage Conservation Committee (HCC), INTACH and DUAC.Private entrepreneurs have also come up like the OMAXE Private Limited intended withredevelopment of multi level parking facility with commercial complex just a few steps ahead of theChadni Chowk Metro Station.
Delving into the Redevelopment ProjectsSo far, the detailed project report has envisaged for the redevelopment of five selected areas
in Old Delhi. These include the Jama Masjid Precincts, Chadni Chowk, Esplanade Road, Daryaganjand Lothian Road. However, till date, only the Chadni Chowk Redevelopment Project (CCRP) havecome to the ground, apart from the Heritage Corridor of the Delhi Metro Rail Corporation (DMRC)which was also incorporated as part of the revitalization of the deteriorating heritage of the city.
The Heritage CorridorSince heritage conservation has been considered as one of the major aspects pertaining to the

NO. 2 REDEVELOPMENT OF THE WALLED CITY OF DELHI 13
redevelopment of the old city, a rather ambitious step has been taken with the establishment of the“Heritage Line” by the Delhi Metro Rail Corporation. The name heritage line has been given sinceit passes through some of the grandeur heritage sites of Old Delhi like Jantar Mantar, Ugrasen kiBaoli, Khooni Darwaza, Delhi Gate and so on. Presently, the line connects Janpath to KashmereGate, traversing through five stations in between, namely, Mandi House, ITO, Delhi Gate, JamaMasjid and Lal Quila. Officially inaugurated for the public in May 2017, the corridor has broughtabout a new exuberance to witness the rich historical background of Delhi dotted with numerousheritage monuments. The metro stations coming under this line has been sculptured with myriadtypes of art work as a step to revive back the decaying heritage of the city.
Chandni Chowk Redevelopment PlanAs an important stretch of linkage in the old city, Chadni Chowk has been a hub of economic
activities, starting from street vendors who sell a wide variety of products like fruits, vegetables,handicraft items and decors to a number of commercial establishments which are popularly knownas “katras” selling ethnic dress materials. The area also serves as an important freight distributioncentre. However, these mixed land utilization pattern of the area adds not only to the problem ofcongestion but also certain conflicts in the mobility domain. There are a number of safety issuestoo in the form of tangles of exposed electrical cables which may trigger fire hazard. In context ofthese, the CCRP came up in the year 2009 although the actual work started progressing fromDecember 2018 onwards. The plan as implemented by the SRDC has proposed for the redevelopmentof the area by transferring all utilities like electric cables, water and gas pipelines underground,followed by widening of the central verge, carriage ways and footpath in tune with its objective ofmaking it a pedestrian friendly zone.
On the impact of Redevelopment of the Walled CityAlthough the long term effects of the redevelopment of the Chadni Chowk area may brew up
positively on the notion of city beautification, however, for the time being, it has been adverselyaffecting the scale of business of the traders who have been continuing their traditional businessin the katras along either sides of the chowk for a long time. A focused group discussion hasunmasked multiple problems faced by them.
The redevelopment work has significantly reduced the parking space in the area and cyclesand bikes which were previously parked along the road are mostly not allowed. Hence, the tradershave to park their vehicles in the multilevel parking complex that was being developed a few metresaway from the metro station and walk the entire stretch along with the goods to the shop wherethey carried on their business. Since rickshaws are allowed to enter into the market, they often loadtheir goods into it, but it has resulted in an increased transportation cost for them. Moreover, sincethe plan is more oriented to the shifting of utilities on the chowk between Red Fort and the mosque,vehicles like auto, carts and e rickshaws are not allowed to enter between 9 am to 9 pm.
The land price has also been going up. Traders who run rented shops in the katras havereported of their rents being hiked up recently by 18 – 20%. Moreover, with the objective of making

14 INDIAN JOURNAL OF LANDSCAPE SYSTEMS AND ECOLOGICAL STUDIES VOL. 42
it a pedestrian friendly zone, taxis and cabs are not been allowed to enter into the area. This has ledto reduced customer in flow who used to come for shopping using such modes and associatedeffect on the net sales and income.
Governance Challenges in Redevelopment of the Old CityA. Multiplicity of institutions in the revitalization strategy: Although the MPD 2021 has
identified the NDMC to be the main body in the redevelopment of the area, the actualprogress is been largely done by the SRDC. Apart from that there are a number of otheragencies, whose work domain largely coalesces with one another. Apart from that, there isalso lack of information among the agencies regarding each other’s sphere of work.
B. Changing governance for the redevelopment plan: The proposal for redevelopment of thewalled city was first initiated by the Municipal Corporation of Delhi (MCD) in consultationwith an architectural agency which was appointed to draft the plan. After MCD’s trifurcation,the project was given to the NDMC, and in 2014 it was handed over to the PWD, and laterto the SRDC. This changing governance has led to numerous disagreements over the planamong the agencies coupled with a lot of modifications that has crept in with the handoverof the plan to different agencies over time.
C. Conflicting proposals of the agencies: Since a number of agencies are involved in therevitalization process, some of their work domain seems to be coalescing with one another.For instance, while the Zonal Development Plan as well as the DUAC have exploredopportunities for the reuse of heritage buildings through private investment for increasingtourist inflow, the proposals of the HCC seems to be in direct conflict with it as it hasasserted that no development or redevelopment or any kind of engineering operationinclusive of repairs, renovations shall be allowed in the heritage buildings.
Another example may be cited here where the Archaeological Survey of India (ASI) andDUAC have raised objections against the development of the multi-level car parking facilityin Gandhi Maidan on the ground that it will spoil the aesthetics of the area. Even the ASIhas objected to the construction of the central verge on the ground that it will diminish theglory of the historic Chandni Chowk.
D. Jurisdiction at different levels: One of the major governance challenges in the revitalizationprocess is itself embedded in the governance structure. This is because as the seat of boththe Government of the National Capital Territory of Delhi and the Central Government, thedifferent agencies that are involved in the process get their plans implemented, and financeas well as report to different ministries. While the para state agencies like the DJB, DTC,DFS and DUAC report to the State Government, other agencies like CPWD report to theUnion Government.
E. Operation of the work at different scales: The multiple agencies involved in theredevelopment process operate at different spatial and political scales. For instance, whilea plan at the upper level has been already framed by the SRDC in collaboration with the

NO. 2 REDEVELOPMENT OF THE WALLED CITY OF DELHI 15
PWD for the installation of sewerage lines, water kiosks and water supply lines, themunicipality has however through the ward councilors in some of the wards is on theirway in laying down sewerage lines. This reflects not only lack of information among thestakeholders but creates confusion in the way of implementing the broader plan.
F. Problem with different power structures in the community: Firstly, there are objectionsthat are been constantly raised by the different traders’ associations in the area becausethey are of the view that pedestrianisation of the chowk will lead to hampering of theirscale of business. Therefore, conflicts in those fronts have led to delay in the progress ofthe work for months.
ReferencesAnsell, C., and A Gash. “Collaborative governance in theory and practice.” Journal of Public Administration
Theory and Practice 18 (2008): 543 - 571.Delhi Development Authority (DDA). “Walled City Shahajanabad Planning Issues and Policy Frame.” 2006.Delhi Development Authority. “Master Plan for Delhi, 1962.” Delhi, 1962.Delhi Development Authority. “Master Plan for Delhi, 2021.” 2007.Delhi Developmment Authority. “Master Plan for Delhi, 2001.” 1990.Groberg, Robert P. “Urban Renewal Realistically Reappraised.” Law and Contemporary Problems, Urban
Problems and Prospects (Duke University of Law) 30, no. 1 (1965): 212 - 229.Hoff, P. T. van der, and George S. Duggar. “Urban Renewal.” Ekistics (Athens Centre of Ekistics) 8, no. 48
(1959): 275 - 284.Nesbitt, George B. “Urban Renewal in Perspective.” The Phyton Quarterly (Clark Atlanta University) 19, no.
1 (1958): 64 - 68.Onkar, Preeti, Krishna Kumar Dhote, and Ashutosh Sharma. “Exploring the concept of urban renewal in the
Indian context.” ITPI (Institute of Town Planning, India) 5, no. 2 (2008): 42 - 46.Shahjahanabad Redevelopment Corporation, GNCT of Delhi. “Revitalization of Shahjahanabad (Walled City
of Delhi).” Preliminary Project Report, 2015.Thomas, Colin J., and Rosemary D. F. Bromley. “City-centre Revitalisation: Problems of Fragmentation and
Fear in the Evening and Night-time City.” Urban Studies 37, no. 8 (2000): 1403 - 1429.Wedge, E. Bruce. “The Concept “Urban Renewal”.” The Phylon Quarterly (Clark Atlanta University) 19, no.
1 (1958): 55 - 60.
Received : 10 July, 2019Revised : 16 October, 2019

16 INDIAN JOURNAL OF LANDSCAPE SYSTEMS AND ECOLOGICAL STUDIES VOL. 42
Environmental Problems due to Joka- B.B.D. Bag MetroRailway Project Along Behala -Taratala Route in the City
of Kolkata, West BengalAlpana Ray1 and Sudip Roy2 *
Abstract : The construction of new metro railway project or the expansion of the existing metro system invitesenvironmental problems in densely populated areas. The metro system after construction and commissioningwill definitely reduce the pollution level and will be highly convenient and Low Carbon mode of PublicTransport. But the construction stage aggravates different environmental problems as it passes throughdensely populated and high vehicular traffic areas. Joka-B.B.Bag Metro Project inaugurated in September2010 through Behala Taratala areas which are 18.72 k.m. long is creating some problems both to theenvironment and the people. The delay of constructional activities has led to many environmental problemswhich led to Diamond Harbour road very narrow, accident-prone and polluted. This paper deals with all theaspects of minimizing the negative environmental effects in planning and implementation of metro projects inhighly polluted areas especially when the pollution level of certain elements are above the acceptance level. Thepaper throws light on the management system which will be helpful for any future project.
Keywords : Metro Railway, Behala-Taratala, Kolkata, Environmental Problems
IntroductionMetro Rails are mass rapid transit system which is totally separated from other modes of the
transport system in an urban area. It is characterized by their high capacity to carry passengers i.e.50,000 to 65,000 per hour on an average at an average speed 20-35 km/hrand very high-frequencyoperation and also promoting Low Carbon Transport in cities (Teewari, 2014). Though it is 20-30times costlier than Bus Transit system among the policymakers, there has been a growing interestto build Metro railways to address the expanding population of the cities. In addition to this, it isperceived to have higher comfort levels, speed and efficiency than any other transport(Mohan, 2000) and play an important role in reducing air pollution and road traffic congestion andaccidents.
1 Assistant professor in Geography, Prasanta Chandra Mahalanobis Mahavidyalaya, Kolkata,West Bengal,India. Email: [email protected]
2 Research Scholar in Geography, University of Calcutta, West Bengal, India.* Corresponding author. Email: [email protected]
Ind. J. of Landscape Systems and Ecological Studies 42 (2) December - 2019, 16- 30 ISSN 0971-4170

NO. 2 ENVIRONMENTAL PROBLEMS DUE TO JOKA- B.B.D. BAG METRO RAILWAY PROJECT 17
Fig. 1 : Location Map of the Study Area

18 INDIAN JOURNAL OF LANDSCAPE SYSTEMS AND ECOLOGICAL STUDIES VOL. 42
Thus the Planning Commission has recommended rail transit project under twelfth Five YearPlan for Indian Cities with population exceeds 2 million and cities with a population in excess of 3million to construct the Metro rails (Planning Commission, 2011). After the completion of the MetroProject, it will certainly reduce the pollution level and convenient mode of public transport but alsoaggravates different problems mainly waterlogging, pollution, traffic congestion during theconstruction stage. As metro alignment passes through very densely populated areas so theconstructionphases aggravate different problems.
Behala is very densely populated area located in the southwestern flank of Kolkata city(Figure:1) and is very vulnerable interms of different problems like traffic congestion, a waterloggingproblem during monsoon months, and high level of air pollution and noise pollution.Behala is oneof the best oldest residential areasand also known as an important industrial area of the city withtotal inhabitants 5,26,460 (Census 2011) in the ward between 115,116, 118….132(Figure:2).
Behala comprises one of the largest suburban agglomerations of the city of Kolkata. It consistsof many small localities like Parnasree Pally, Taratola, Sahapur, Behala tram depot, Manton, Chowrasta(Barisha), Shakherbazar,Silpara, Kadamtola, and BehalaThakurpukur. The huge growth of population,especially since the early eighties, resulted in the area being on the radar of the daily wage earners,common populace and educated classes. Due to this enormous an unplanned growth, the traffic isby a large dependent on the arterial Diamond Harbour Road in spite of the availability of the parallelJames Long Sarani (commonly known as Bypass or Rail line since the old and now defunct Kalighat-Falta Railway ran here) as an option. But after the construction of the Taratala fly over a largeportion of the traffic flows through James long Sarani to avoid traffic congestion causing thedevelopment of other areas of Behala.
Fig. 2 : Population in Behala (Wards 115- 132), 2011

NO. 2 ENVIRONMENTAL PROBLEMS DUE TO JOKA- B.B.D. BAG METRO RAILWAY PROJECT 19
A tram line used to run through the centre of Diamond Harbour road from Joka to Behala tramdepot till around 2005 and the service on this stretch has been withdrawn due to the elevated metrorailway construction on the Diamond Harbour Road which will run from Joka to BBD Bag metro railproject in presence of Central Finance Minister and Governor of West Bengal in Sept 2010. The18.72 km long Joka to BBD Bag metro got stalled because of alan issue leaving Diamond Harbourroad narrowaccident-prone an extremely polluted.
The study area i.e from Thakurpukur to Taratola (6.5 km) the progress of the project has beenquite steady with Railway Vikash Nigam Limited (RUNl) but the construction of metro rail in thethakurpukur to taratola region is creating some problems both to the environment and to thepeople. The delay in the construction of the Joka – BBD Bag metro railway on Diamond Harbourroad has led to many physical and socio-economic problems to leaving Diamond Harbour roadnarrow accident prone and polluted. The stations proposed in the section are as follows (Table 1).
Table:1 Proposed Stations from Joka to B.B.D Bag
Name of station KM (Approx.) Remarks
Joka 0.000 New Station
Thakurpukur 1.455 New Station
Sakher Bazar 2.670 New Station
BehalaChowrasta 4.130 New Station
Behala Bazar 5.460 New Station
Taratala 6.500 New Station
Majerhat 7.740 New Station
Mominpur 8.755 New Station
Khidirpur 9.870 New Station
Victoria 12.025 New Station
Park Street 13.290 New Station
Esplanade 14.215 New Station
BBD Bag 15.075 New Station
Source: Metro Railway, Kolkata
The study area i.e from thakurpukur to taratola (6.5 km) the progress of the project hasExtension project for Rs. 294.49 Cr of BBD Bag – Joka new Metro line to IIM and Diamond Park for2 km has been sanctioned in the Budget of 2012-13. The work has been given to RVNL. Thestation’s proposed stations are as follows (Table:2)

20 INDIAN JOURNAL OF LANDSCAPE SYSTEMS AND ECOLOGICAL STUDIES VOL. 42
Table:2 Proposed Extended Stations from Joka to Diamond Park
Name of station KM (Approx.) Remarks
Joka 0.00 New Station
IIM 1.00 New Station
Diamond Park 2.00 New Station
Source: Metro Railway, Kolkata
Objective and MethodologyTo have a proper idea about the environmental problems due to Metro railway construction in
the study area includes the following objectives
To evaluate the problems of Traffic congestion due to construction activities in the studyarea.
To analyse the different issues and concerns which are related to air pollution in thestudyarea.
To identify the problems of water loggingin the study area and to find out the affectedareasin and around the proposed metro route.
To suggest possible solutions to avoid such problems in the study area.
This study is basically descriptive in nature and based on secondary and primary information.Both qualitative and quantitative methods have been applied tothis research.The present researchwork is based on the application of modern as well as a conventional methodology with intensivefieldwork. The analytical part of the research is based on the compilation of various secondary dataand also an analysis of primary data from field visits to fulfil the objective. Secondary data obtainedfrom Metro Railway office, Behala Municipality offices, archival sources, downloaded informationthrough websites, and the suggestions and recommendations made by the interviewing the commonpeople who are sufferer to analysis the research problems. A structured questionnaire based on aninterview was conducted to study the research problemsin and around the area. The nature of thepresent research work is explorative and the whole work has been done by descriptive as well asanalytical methods.
Problems Associated with Metro Rail Construction Activities
Traffic CongestionWith increasing traffic demand, coupled with an increasing number of vehicles on road, the
problems related to traffic congestion, road accidents, environmental pollution have increasedmagnificently over in the last few years. One of the most accepted methods of improving trafficcongestion in the cities has been to improve efficient Public transport system (Bhutani et al., 2016).So the objective to build the Joka – BBD Bag metro is to reduce the traffic pressure on DH Road,

NO. 2 ENVIRONMENTAL PROBLEMS DUE TO JOKA- B.B.D. BAG METRO RAILWAY PROJECT 21
a national highway NH-117and also on Behala- Thakurpukur area. But the construction of a metroline from Joka to Majherhat is under many disputes from the beginning of the project (July 2011).The deadline is being delayed due to availing permission from the defence authorities an also dueto the land issue problem. The completion schedule (Joka–Taratala) was postponed from early 2014to 2015-16 and now it is postponed to June2018.
A flank of Diamond Harbour Road, the major thoroughfare in Behala has been blocked severalplaces – Pathakpara, Silpara, Behala-Chowrasta and Thakurpukur because of metro constructionand work on a waterline. The traffic comprising heavy lorries, buses, autos and cars from bothdirections move along the single lane. Snarls and chaos are natural outcomes. The cars and bikesand some superfast deluxe buses try to steer clear of these traps by taking James long Saraniturning the road into a second choke pot. The overload triggers massive traffic congestion duringpeak hours. The loose stone chips mounds of sand and muck from the construction site spill on theroad. The stretches near Thakurpukur, Kadamtola and Behala-chowrasta are particularly hazardous.
The overloaded tracks often speed along the road at well over the speed limit of60km/hr with little regard for traffic rules and fellow motorists. They take sharp turns and switchlanes suddenly. The stretch between Pathakparain front of Orient day school and Behala bus standnumber 14, opposite silparabasketball courts are always lined with buses, cars and trucks. This is ano parking zone. The D.H Road is a national highway (N.H 117) and always reveals a good percentageof traffic flowduring peak time. Though it is congested nowadays due to the constructions of Joka-BB Bag metro link.
The primary survey also reveals the fact that autorickshaw, private buses follow the D.H Roadmost and the bikes, cycles, rickshaws and public buses prefer James Long Sarani.There are somebus stands which are not usable due to the diversions the road space is being reduced. The lack oftraffic management near the diversion area is another problem resulting in accidents. The roaddiversion has increased the flow of vehicles through James Long Sarani leading to traffic congestionin James Long Sarani and lack of traffic police here has increased the speeding of two-wheelerleading to accidents, thus the road diversions and lack of management is the main problem. Thebad and deteriorating condition of D.H Road has decreased the accessibility and thus increased theaccessibility in James Long Sarani leading to congestion here. The reasons behind James LongSarani congestion are a bad condition of D.H Road (NH-117) is road diversion road space isnarrowed in D.H Road due to the building of metro stations traffic congestion on D.H Road hasincreased the flow of vehicles through James Long Sarani. The main problem faced by the peopleliving near James Long Sarani is traffic congestion and accident.
Temporal accessibility analyses along DH Road and its adjacent James Long Sarani showingthe decreasing level of accessibilities along with most important settlement pockets of South Kolkata.Shimble Index method has been used for this purpose (Figure:3). Shimble Index is the addition ofthe lowest number of arcs in between a particular station and adjacent stations or nodes in atopological map and the lowest number reflects the highest accessibility condition and the highestnumber reflects the lowest accessibility condition. The very high accessible areas are from

22 INDIAN JOURNAL OF LANDSCAPE SYSTEMS AND ECOLOGICAL STUDIES VOL. 42
Fig. 3 : Accessibility Map prepared by calculating SHIMBLE INDEX ( Shortest Path Matrix) showing levelof accessibility along Joka to Taratala (D H Road)

NO. 2 ENVIRONMENTAL PROBLEMS DUE TO JOKA- B.B.D. BAG METRO RAILWAY PROJECT 23
Sakherbazar to Thakurpukur and Behala Chowrasta to Manton is the most accessible area as D.H.Roadis connected by the James Long Sarani by several linking roads.These are totally affectedalong the route for road diversion during the metro railway construction and the high accessibleareas of the map have become moderately and less accessible (Figure:4).The shimble index valuesare increasing near about 20 which indicates that all thevehicles have to be diverted through Jameslong Sarani by several linking roads.
Fig. 4 : Accessibility Map prepared by calculating SHIMBLE INDEX ( Shortest Path Matrix) showing thedecrease level of accessibility along Joka to Taratala (D H Road) at the time of road diversion at Silpara toSakher Bazar

24 INDIAN JOURNAL OF LANDSCAPE SYSTEMS AND ECOLOGICAL STUDIES VOL. 42
Air PollutionAir pollution has become a very serious issue in the study area in recent times due to metro
rail construction activities, and the quality is air turning out to be very poor and causing manyhealthissues among the public.With the increase in thenumber of vehicles on roads, construction activitiesand industrialisation are some of the reasons that have led to pollution (Verma,2003).To meet upthepopulation pressure more infrastructural facilities are needed and thus increase the pollutionlevel. To solve the problem of inadequate infrastructural facilities city planners plan to constructmetro rails to relieve traffic congestion on the road and consequent reduction in pollution level(Kumar,2003). Metro rail construction activities in Behala–Taratala area aggravates the air pollutionin the environment.Trash burning is carried on a regular basis. There are huge dump-yards wherehuge quantities of trash are being burned regularly, causing pollution in the air. Moreover, constructionactivities also create dust like cement, wood trash etc which also results in air pollution.
The Air Quality Index (AQI), in Kolkata, showed 409 in Nov’2018 and 415 in Dec’2018, whichis considered as “Poor”. The city residents breathe 5 times of bad air and around 71% of peoplesuffer from respiratory diseases. Pollution levels rise rapidly in winter due to the low speed of windand damp weather. Kolkata, as usual, has damp weather and the dust particles get trapped easily.PM2.5 is not available during all the seasons but it increases at the start of winter even the AirQuality index rises above 300/400 during the winter season. The pollution and bad air quality is at
Fig. 5 : Temporal Concentration of pollutants(µg/m³) at Chowrasta

NO. 2 ENVIRONMENTAL PROBLEMS DUE TO JOKA- B.B.D. BAG METRO RAILWAY PROJECT 25
peak during night time and early in the morning.Most of the people suffering from respiratorydiseases are non-smoking people. The existing level of pollution like Suspended Particulate Matter(SPM), Co², So², No² are either already on the higher side or above the acceptable level causingserious health problems. The Figure:5 shows that before the construction activities in the year 2010PM10 was 189 µg/m³) which was quite low but 2013-2019 it is increasing at a faster rate and it is alsotrue for PM 2.5. Metro construction activities have aggravated air pollution level in Behala Chowrastaarea. Air quality index has also increased from 159 in 2010 to 338 in 2019.
Any rise in pollution level beyond the prescribed limit has a serious impact on the health ofpeople(Goel et al.2014). Air pollution leads to many health hazards making it difficult for people tobreathe and survive in a clean environment. According to experts and doctors, Kolkata should alsotake measures same as in Delhi to deal with air pollution or it will lead to serious health issuesamong the public. More deaths due to lung cancer and heart attacks are the major concern in thepresent era. The most affected are the school going and college going students, who fall prey forasthma. People who are on roads for long periods such as dwellers, hawkers, drivers of publictransport are at more risk than anyone, as they inhale more of these harmful gasses. People are athigh risk of respiratory disorders and other disorders due to rising air pollution. People also sufferfrom irritation in eyes, sneezing, cough, allergies and body rashes.
WaterloggingThe heavy shower always caused water logging in many pockets of Behala Thakurpukur
region. The main reason for waterlogging on D.H Road is improper drainage system, low terrain,increase of built-up areas and lack of management. The construction of the metro link has increasedthe water logging condition even in the light spell of rain as the construction materials are chokingthe drainage system. The underlying surface has changed due to the construction of pillars for themetro flyover, water is getting logged on the low areas which are also logging in the potholescreated by the lorries (heavy vehicles i.e more than six wheels) carrying construction materials.Thus waterlogging is another problem on D.H Road which has been increased due to the buildingof metro link. Narrow road space due to encroachment by street hawkers, unauthorized shopsunder Metro flyover, illegal settlements and choking off the drainage due to the dumping ofconstruction materials are the reasons for waterlogging problem in the study area. The areas likeBehala Tram Depot, Behala- Chowrasta,Sakherbazar, Silpara, Thakurpukur are all waterlogging proneareas due to Metro Railway construction (Figure: 6).
Conclusions and RecommendationsThe unplanned growth of the Behala area in the absence of a proper master plan is the main
problem that isleading to the degradation of this virgin environment from the beginning.
The primary survey in the Behala Thakurpukur area reveals that the problems of waterlogging,road diversions unauthorized shops bad condition of road and traffic footpath problems etc have

26 INDIAN JOURNAL OF LANDSCAPE SYSTEMS AND ECOLOGICAL STUDIES VOL. 42
Fig. 6 Map Showing Water Logging Zones with bad road condition (pot holes and shallow dugs)

NO. 2 ENVIRONMENTAL PROBLEMS DUE TO JOKA- B.B.D. BAG METRO RAILWAY PROJECT 27
Plate 5: Dumping of construction material at DHRoad.
Plate 1 & 2: Water logging at D H Road in the rainy season.
Plate 3: Road diversion at Silpara Plate 4: Excavation at DH Road for Metroconstruction
Plate 6: Dumping of construction material at footpathand blocking of footpath near Thakurpukur

28 INDIAN JOURNAL OF LANDSCAPE SYSTEMS AND ECOLOGICAL STUDIES VOL. 42
increased due to the constructions of the metro project in this area. The lack of management andunplanned growth and development in this area is the main reason for the above problems.
The infrastructure projects play an important role in the development of a nation and these arealso accompanied by significant environmental and social impacts during its construction phase ofthe project (Kumar, 2003). Metro railways construction activities in densely populated and pollutedareas invite different environmental, social and other related critical issues which need to be studiedand addressed carefully so that this mega-infrastructure will be socially and environmentallyacceptable. Metro rail projects take many years to get operational so that environmental managementcan be suitably used to ensure that they are environmentallysustainable and socially acceptable (Karthik, 2018).
Though the environmental impact of the metro projects is assessed and necessary mitigationis already planned but overall comprehensive planning is usually lacking which results in anincrease in pollution level and other environmental problems.So it is necessary for the metroplanners to take into account all the possible environmental problems and plan remedial measuresaccordingly.
At different locations of Metro rail construction where the pollution level has exceeded thepermitted level or is on the higher side in the study area, construction activity needs to scrutinizedto protect the environment. The type of material used plays an important role in deteriorating theenvironment.The use of ‘precast’ concrete structural members, high capacity cranes, battery operatedtrucks will provide a big relief from adverse environmental impact (Kumar, 2003).
A proper master plan is to be chalked out to get rid of these problems. The drainage outletshould be cleaned to check pollution and spread of diseases and reduction in waterlogging. Thehawkers should be removed to some place through management so that they can earn their livelihood& also the problems caused by their presence on D.H Road can be reduced. The temporarysettlements should be checked by the contracted company related to the project. The condition ofD.H Road should be improved as it is a national highway, proper traffic management is required andmore traffic police are needed there.
The road diversions should be properly done and the increase of traffic police in the diversionarea also in James Long Sarani is needed. The proper disposal of solid waste should be done by themetro railway authority. The checking of the pollution level should be done especially near thehospital area and near the educational institutions. To materialize all the suggestive measures toupgrade environmental and socio-economic conditions of the area. A strict and regular administrativevigilance is the need of the hour. Development is good but the development should be environment-friendly i.e not harming the environment and for this proper plan must be chalked out by thedevelopmental committees. A proper master plan should be taken as that the environment and thecommon people affected by the construction of the metro link.

NO. 2 ENVIRONMENTAL PROBLEMS DUE TO JOKA- B.B.D. BAG METRO RAILWAY PROJECT 29
Recent studiesshow that an increase in pollution level due to the metro railway for shortduration in polluted areas of the study area has an extremely adverse effect on the health of thepeople. Adequate consideration of environmental aspects is to be given in all aspects of planningand construction of the metro project to match with the special circumstances that prevail in highlypolluted and populated cities. By proper planning and execution, the adverse effect on highlypolluted and populated zones of the city can be minimised so that health hazards are minimised.Such planning acted upon effectively will also should the public opinion in favour of increasedpublic cooperation and goodwill.
A more personal approach is required for people whose living conditions are getting directlyaffected due to the metro construction mainly vibration in their building, movement of a largenumber of trucks, temporary blocking off their pathway, etc. Engineers and their representativealong with Public Relation Personnel should take responsibilityto meet directly with such personsand keep them informed about the steps being taken to ensure safety and environment.
ReferencesBhutani.R, Ram.S., Ravinder.K., (2016) Impact of metro rail construction work zone on traffic environment,
Transportation Research Procedia,Volume- 17, pp. 586-595.
Bangalore Metro Rail Corporation Ltd. (2016) Detailed Project Report Silk Board- Kr Puram Corridor ofBangalore Metro, Bangalore
Goel. R.,Teewari.G.,(2014) Promoting Low carbon Transport in India, Case studies of Metro Rails in Indiancities, UNEP Report, Magnum Custom Production, New Delhi, India, pp. 3-15.
Ingason, H. K.-E.(2012) The Metro Project. Mälardalen University, School of Sustainable Development ofSociety and Technology. Mälardalen University Press.
Institute of Urban transport, India (2016) Issues and Risks for Monorail Projects and Metro Systems. Bangalore
Kai, Z. H. (2015) A New Construction Method for Deeply Buried Metro Station,International Conference onAdvances in Energy and Environmental Science (ICAEES ), pp.156-160.
Karthik, R. N.(2018) Problems Involved In Various Stages Of Construction Of Metro Rail In India And TheJudicial View Of The Problems,International Journal of Civil Engineering and Technology (IJCIET),Volume 9, Issue 4, pp 1284–1289. Retrieved from http://www.iaeme.com/IJCIET/index.asp
Kumar, M. (2003) Environmental management during metro railway construction especially in a highlypolluted and densely populated city. Transactions on the Built Environment, vol 64, pp. 609-616.
LI, S. A. (2015) Management Of The Delhi Metro Rail Project. Dubai: Emirates Aviation University.
Liu Bei, S. X. (2018) Application Analysis of BIM Technology in Metro Rail Transit. IOP Conf. Series:Earth and Environmental Science, IOP Publishing, pp.1-65
Mendorf, P. E. (1993) Design-Construction of Precast Segmental Elevated Metro Line for Monterrey, NuevoLe6n, Mexico. PCI JOURNAL, pp. 42-56.
Nagarjuna Pilaka, R. N. (2015) Technical Analysis of the Hyderabad Metro Rail Project, International Journalof Technology, pp. 1-10.

30 INDIAN JOURNAL OF LANDSCAPE SYSTEMS AND ECOLOGICAL STUDIES VOL. 42
Niraj Sharma, R. D. (2012) Critical Issues Related to Metro Projects in India ,Journal of InfrastructureDevelopment, pp. 67-86.
Raut, A. T. (2017) Execution of Metro Rail Projects – A Case Study of Nagpur Metro Rail. IJSTE -International Journal of Science Technology & Engineering, Volume 4, No 3, pp. 32-35.
Sekar.S.P.,(2012) Contributions of Metro Rail Projects in the Urban Dynamics,48th ISOCARP, pp-1-10.
Verma, S.A.,(2000) Environmental Considerations in the selection of Rail Based Mass Rapid TransportSystem, Urban rail, New Delhi.
Received : 10 February 2019Accepted : 06 May 2019

NO. 2 IDENTIFYING DESTINATION OF RURAL OUT-MIGRANTS IN WEST BENGAL 31
Identifying Destination of Rural Out-Migrants in WestBengal: Correlating Rate of Out Migration With Distance
Manoj Debnath*
Abstract : Obstructive regional imbalance and disparate development in India, as well as West Bengal, hasmotivated outmigration from agriculturally and economically depressed rural areas. The rural out-migrationchoices take place in the economic and social contexts of rural communities throughout India. The paper, usingdata available in successive census counts unravels the patterns of outmigration across regions in WestBengal.Rural areas have a larger proportion of marginal jobs which results in higher underemployment andalso a larger proportion of rural workers are employed in low-skilled jobs relative to urban areas. Among thetotal migrants at the inter-state and inter-district level, females are more dominant compared to the males inWest Bengal. But a greater proportion of males migrate for work and females for marriage. In West Bengal,for male outmigration and rural to urban out-migration flow clearly proves that distance creates a little hurdleto migration if the destination places are economically and industrially developed than distance does notmatter. From this point of view, the study of male migration from rural areas of West Bengal is more importantcompared to females.
Keywords : Male out-migration, West Bengal, Regional pattern, Flow of Migration, Distance
IntroductionOut-migration from West Bengal to different parts of India has a long history. People from
different places in West Bengal have not only crossed district boundaries, but they have also gonemuch beyond crossing the state and international boundary too. Beginning from the 19th century tothe post-independence period, in eastern India- especially West Bengal had attracted huge in-migration from other states of India. In the recent past, however, the pattern of migration haschanged a lot over different periods. Outmigration has countless impact on the all regions of ourplanets (Clark, 1986).Poor and rich households dominated streams in rural outmigration (Kundu andSarangi, 2007). Parganiha et al. (2009) pointed out that most of the rural male persons are migratingfar from their village and most of the female out migrants moved to other areas within the samedistrict. Premi (1980) argued that in medium and long-distance males are more migrated to urbanareas. After improvement in local transportation facilities, a larger number of workers are living
* Research Scholar, Department of Geography, School of Human and Environmental Sciences, North-EasternHill University, Shillong, MeghalayaEmail: [email protected]
Ind. J. of Landscape Systems and Ecological Studies 42 (2) December - 2019, 31- 48 ISSN 0971-4170

32 INDIAN JOURNAL OF LANDSCAPE SYSTEMS AND ECOLOGICAL STUDIES VOL. 42
outside the city and they work on a regular basis (Zachariah, 1966). The informal sector in urbanareas attracts more poor people from rural areas mainly for work (Keshri and Bhagat 2012). Piotrowski,et al. (2013) found that long-distance movement is probably work-related. From the analysis ofJones (1965), rural migration of Central Walse, he concluded that the great bulk of migrants proceedonly a short distance and that those migrants proceeding long distances generally go to the largeconurbations. Migration from the rural areas to the cities in West Bengal is highly selective formales than the other states (Singh, 1984). On the other hand, landless and marginal households aremore likely to migrate compared to large households (Deshingkar et al., 2006; Dodda et al., 2016;Panda, 2016). In West Bengal, especially western Rarh region has long record of temporary andseasonal outmigration. Barddhaman district and its surrounding areas were the favourable destinationof seasonal migrants (Rogaly, 1998; Rogaly et al., 2001, 2002; Rogaly and Coppard, 2003; Rogalyand Rfique, 2003; Sengupta and Ghosal, 2011). On the contrary, inter-state outmigration of WestBengal elicited that propensity of outmigration increased in recent decades (Debnath, 2019; Debnathet al., 2019).In terms of the male-female composition of such outmigration, females dominated inshort distance and males controlledover long-distance migration streams (Debnath et al., 2016).
The rural migration choices take place in the economic and social contexts of rural communitiesthroughout India. Rural areas have a larger proportion of marginal jobs which results in higherunderemployment and also a larger proportion of rural workers are employed in low-skilled jobsrelative to urban areas. Among the total migrants at the inter-state and inter-district level, femalesare more dominant compared to the males. But a greater proportion of males migrate for work andfemales for marriage. Inter-district and Inter-state rural outmigration from this state also depicts thatmales are more migrated for work and employment purpose and for female marriage is the maincause. From this point of view, the study of male migration from rural areas of West Bengal is moreimportant compared to females. Following specific objectives placed before the study are to identifyregional patterns and flow of rural male migration from West Bengal and to find out the correlate therate of outmigration and distance of destination places.
Database and MethodologyThe study is based almost exclusively on secondary sources and data have been collected
from different sources like Census of India, Migration Table-D (Place of last residence and place ofbirth), District Census Handbook, Statistical abstracts of Government of West Bengal.Out-migrationfrom West Bengal has componentsby using migrants by place of last residence, duration of residenceand reason for migration (2011).
Rate of out-migration, in-migration and net migration are calculated by using the followingformulas (Clark, 1986) -
Out-Migration Rate, OMR= (O/P).KWhere, O = No. of Out-migrants and P = Total Population, and K = 100 or 1000 (a constant).

NO. 2 IDENTIFYING DESTINATION OF RURAL OUT-MIGRANTS IN WEST BENGAL 33
Census of India provide migration data on the basis of place of birth and place of the lastresidence. All the data has been calculated by place of last residence. Percentage of male out-migration from West Bengal to others state has been calculated as the percentage of male out-migration to the total male population of the state.The geographical analysis of male out-migrationfrom West Bengal has done at the country level into six arbitrary regions.
Census of India, Migration Table D-3 (Migrants by place of last residence, duration ofresidence and reason for migration, 2011) used to analysis of inter-state outmigration pattern ofWest Bengal. The range of outmigration has been classified by using the mean and standarddeviation method. The rate of total outmigration varies significantly across the state within andacross physiographic regions. Here, ArcMap 10.3.1 software used to prepare the thematic map ofinter-state outmigration pattern.
Correlating rate of outmigration with distance calculated by the SPSS (Statistical Package forthe Social Sciences). Here, distance is calculated by the Google earth image. Road distance hastaken into consideration for the measurement of the distance of destination places of out-migrant.In this case, road distance considered as the distance of each capital of eachstate with the capitalof West Bengal. Correlation matrix has been used to correlate the rate of outmigration and distanceof destination places. Here, road distance considered as independent variable while different streamsof migration envisaged as dependent variables.
Results and DiscussionMales generally migrate for the work and employment purposes and they move to those
destinations economically and industrially developed offering greater employment opportunities(Sengupta and Ghosal, 2011; Rogaly, 1998; Oberai and Singh, 1980). This chapter focuses on theinter-state, inter-district and inter-regional flow of out-migrants and different streams of rural tourban and rural to rural outmigration. Briefly, the study is an attempt at identifying regional patterns,flows, source regions, destination, determinants and factors affecting outmigration from the ruralareas of the state depending upon the geographical contexts as outlined above.
The volume of different flow of out-migrants is shared by different states and union territorieswhich are shown in table 1. Only a few states, namely the neighbouring state of Jharkhand, Odishaand Bihar, and far off states like Maharashtra, Delhi and Uttar Pradesh received around 67.07 percent of all out-migrants from West Bengal. In terms of the male-female composition of suchoutmigration, females dominated in short distance and males dominated long-distance migrationstreams (Debnath et al., 2016).
Figure 1, 2 and 3 show the nature of the distribution of out-migrants from West Bengal. It isclear from the figure that the intensity and consistency of out-migrants are higher in the neighbouringstates of West Bengal compared to those states which are located far away. Bihar, Jharkhand,Orissa, Sikkim and Assam are the neighbouring states of West Bengal and these states have

34 INDIAN JOURNAL OF LANDSCAPE SYSTEMS AND ECOLOGICAL STUDIES VOL. 42
Table 1: Total Outmigration as per cent to Total Population, 2011
Name of The States Total out-migrants Total Male out-migrants Total Female out-(per cent) (per cent) migrants (per cent)
Jammu & Kashmir 0.42 0.31 0.50Himachal Pradesh 0.25 0.37 0.16Punjab 1.95 2.26 1.75Chandigarh 0.29 0.39 0.22Uttarakhand 1.09 1.29 0.96Haryana 3.15 3.81 2.72NCT of Delhi 7.58 9.81 6.12Rajasthan 2.81 3.48 2.37Uttar Pradesh 9.73 5.85 12.28Bihar 9.47 3.31 13.52Sikkim 1.38 1.52 1.29Arunachal Pradesh 0.29 0.44 0.19Nagaland 0.16 0.22 0.11Manipur 0.03 0.04 0.02Mizoram 0.03 0.04 0.02Tripura 0.22 0.26 0.19Meghalaya 0.23 0.27 0.20Assam 3.94 3.53 4.21Jharkhand 20.56 11.12 26.77Odisha 6.85 6.20 7.27Chhattisgarh 2.24 2.85 1.83Madhya Pradesh 1.92 2.51 1.53Gujarat 3.70 5.70 2.39Daman & Diu 0.20 0.40 0.07Dadra & Nagar Haveli 0.12 0.23 0.05Maharashtra 12.88 20.22 8.06Andhra Pradesh 2.09 2.75 1.65Karnataka 2.81 4.40 1.77Goa 0.22 0.38 0.12Lakshadweep 0.01 0.01 0.00Kerala 1.27 2.74 0.30Tamil Nadu 1.20 1.79 0.81Puducherry 0.05 0.06 0.04Andaman & Nicobar Islands 0.87 1.40 0.52
India 100 100 100
Source: Census of India, Migration Table D-3: Migrants by place of last residence, duration of residence andreason for migration - 2011

NO. 2 IDENTIFYING DESTINATION OF RURAL OUT-MIGRANTS IN WEST BENGAL 35
received 42.20 per cent of the out-migrants who crossed the state boundary. Out of the total femaleout migrants, over half (53.06per cent) of them migrate to these states while a small proportion(25.68per cent) of the total male out-migrants prefer these states as their destination. This clearlyreveals the fact that female outmigration has a preference for much shorter distance unlike that ofthe males.
Fig. 1: Distribution of Inter-State Outmigration from West Bengal, 2011

36 INDIAN JOURNAL OF LANDSCAPE SYSTEMS AND ECOLOGICAL STUDIES VOL. 42
West Bengal is situated in the central part of eastern India. Due to the locational factor, peopleof this state migrate in different directions and to different destinations. Figure 2 shows that out ofthe total male outmigration from West Bengal to the other states of India, more than 10 per cent ofmale outmigration is to Maharashtra and Jharkhand only. Uttar Pradesh, NCT of Delhi, Gujarat andOrissa received 5-10 per cent of the out-migrants whereas rest of the states and UTs received below
Fig. 2: Distribution of Inter-State Male Outmigration from West Bengal, 2011

NO. 2 IDENTIFYING DESTINATION OF RURAL OUT-MIGRANTS IN WEST BENGAL 37
5 per cent of all the out-migrants. This migration flow in figure 4 clearly proves that distance createsa little hurdle to migration if the destination places are economically and industrially developed.Though Maharashtra (20.22per cent), NCT of Delhi (9.81), Gujarat (5.70), Uttar Pradesh (5.85percent), Punjab (2.26per cent), Haryana (3.81) and Karnataka (4.40per cent) are situated far away fromWest Bengal, these states did attract a large share of the migrants from West Bengal.
Fig. 3: Distribution of Inter-State Female Outmigration from West Bengal, 2011

38 INDIAN JOURNAL OF LANDSCAPE SYSTEMS AND ECOLOGICAL STUDIES VOL. 42
Inter-state destinationsIn terms of inter-state outmigration, females dominate in short distance migration whereas
males dominated in the long distance. States closer to West Bengal received more female migrantscompared to their male counterparts. Table 1 show that Jharkhand, UP, Bihar, Assam, Orissa,Uttaranchal and Tripura received a greater volume of female migration. Rest of the states and unionterritories have received a large proportion of male migration from West Bengal. Males generallymigrate for work and employment purposes and they moved to destinations economically andindustrially developed offering greater employment opportunities.
Table 2: Types of Migration flow from West Bengal to Other States of India, 2011
Types of Migration Total Male Female
Volume per cent Volume per cent Volume per cent
Total Migrants 2405522 100 953641 39.64 1451881 60.36
Rural Total 1150624 100 415794 36.14 734830 63.86
Urban Total 1149286 100 491552 42.77 657734 57.23
Rural to Rural 621128 100 125985 20.28 495143 79.72
Rural to Urban 529496 100 289809 54.73 239687 45.27
Source: Census of India, Migration Table D-3: Migrants by place of last residence,duration of residence and reason for migration - 2011
Table 3: Male-Female Destination flow of Migration from West Bengal, 2011
Direction Origin State and Union Territory (Place of enumeration)
Male Rural Maharashtra (19.00per cent), Jharkhand (14.09per cent), NCT ofDestination areas of Delhi (10.06per cent), Orissa (7.20per cent), Gujarat (5.36per cent),
West Bengal Haryana (5.26per cent), Uttar Pradesh (4.91per cent), Assam(3.94per cent), Kerala (3.45per cent), Rajasthan (3.30per cent),Karnataka, Punjab, Madhya Pradesh, Andhra Pradesh, Kerala, TamilNadu, Himachal Pradesh, Chandigarh, Arunachal Pradesh, Nagaland,Manipur, Mizoram, Meghalaya, Chhattisgarh, Daman Diu, Dadraand Nagar Haveli, Goa, Lakshadweep, Sikkim, Pondicherry, Andamanand Nicobar Island ,Uttaranchal and Tripura.
Female Jharkhand (38.23per cent), Bihar (15.64per cent), Uttar PradeshDestination (9.49per cent), Orissa (9.47per cent), Assam (4.50per cent) and
Maharashtra (3.95per cent).
Source: Census of India, Migration Table D-3: Migrants by place of last residence,duration of residence and reason for migration - 2011

NO. 2 IDENTIFYING DESTINATION OF RURAL OUT-MIGRANTS IN WEST BENGAL 39
Table 4: Rural-Urban Destination flow of Migration from West Bengal, 2011
Direction Origin State and Union Territory (Place of Destination)
Rural Rural Jharkhand, Haryana, Bihar, Assam, Orissa, Himachal Pradesh,Destination areas of Sikkim, Arunachal Pradesh, Daman dui, Dadra & Nagar Haveli,
West Bengal Andaman and Nicobar Island, Kerala, Nagaland and Lakshadweep
Urban Delhi, Rajasthan, Gujarat, Maharashtra, Andhra Pradesh, TamilDestination Nadu, Punjab, Jammu & Kashmir, Chandigarh, Uttarakhand, Manipur,
Tripura, Mizoram, Meghalaya, Chhattisgarh, Madhya Pradesh,Karnataka Uttar Pradesh., Goa and Pondicherry.
Source: Census of India, Migration Table D-3: Migrants by place of last residence,duration of residence and reason for migration - 2011
Fig. 4: Inter-State Outmigration Flow from West Bengal, 2011

40 INDIAN JOURNAL OF LANDSCAPE SYSTEMS AND ECOLOGICAL STUDIES VOL. 42
Figure 4 reveals that the entire Indo-Gangetic plain received a moderate proportion of ruralmigrants from West Bengal. On the other hand Jharkhand, Orissa and Maharashtra received thehighest proportion of rural migrants from the state. Rest of the states and UTs received a negligibleproportion of migrants which are far from the state. According to Census, West Bengal as a wholeis a net in-migrant state. However, out-migration; especially male outmigration rate has increasedover the years. Table 4 shows that most of the states and UTs received rural to rural out-migrationfrom West Bengal. Table 1 shows that among the total out-migrants, 39.64 per cent are males and
Fig. 5: Inter-State Rural to Rural Outmigration from West Bengal, 2011

NO. 2 IDENTIFYING DESTINATION OF RURAL OUT-MIGRANTS IN WEST BENGAL 41
60.36 per cent in females. However, the percentage of male and female rural and urban migrants isdifferent compared to total migrants. Inter-state rural migration stream consists of 36.14 per centmales and 63.86 per cent females (Fig 2.7). However, inter-state urban migration consists of 42.77per cent male and 57.23 per cent female migrants (Fig 2.8). Rural males move in two streams i.e. ruralto rural and rural to urban. Inter-state rural to rural migration stream consists of 20.28 per cent malesand 79.72 per cent females (Fig 2.9). However, inter-state rural to urban migration consists of 54.73per cent male and 45.27 per cent female migrants from West Bengal (Fig 2.10).
Fig. 6: Inter-State Rural to Urban Outmigration from West Bengal, 2011

42 INDIAN JOURNAL OF LANDSCAPE SYSTEMS AND ECOLOGICAL STUDIES VOL. 42
The proportion of rural to rural male out-migration is less but this stream of migration isdistributed in a large number of states and union territories in India (fig 2.9). Jharkhand (16.53percent), Orissa (11.77per cent), Bihar (7.92per cent), Assam (6.73per cent), Utter Pradesh (5.98percent) together have received about 48.93 per cent rural to rural male out-migrants from out of thetotal rural to rural male out-migrants (figure 5). On the other hand, rural to urban male outmigrationhas taken place to far fewer states but in large proportion. Figure 6 shows that, only the three statesnamely Maharashtra (24.70per cent), Delhi (14.07per cent) and Jharkhand (13.04per cent) have received51.81 per cent of the total male rural to urban migrants from West Bengal (Table 2).
Regional distribution of rural outmigrantsFor the purpose of the present study, the entire country is divided into five arbitrary regions
i.e. Central high land states, Indo-Gangetic plain states, states of south India, north-eastern statesand north Indian mountain states. Table 5 shows that Central high land states like MP, Maharashtra,Chhattisgarh, Orissa, Jharkhand, Daman and Dui, Dadra and Nagar Haveli received the highestpercentage of the migrants (i.e. 44.76 per cent) from West Bengal. Not only this region but thestates in Indo-Gangetic plain too received around 38.68 per cent migrants from West Bengal.Maharashtra, Madhya Pradesh, Jharkhand, Orissa, Haryana, Punjab, Delhi, Gujarat etc. States arerich in minerals, agriculture, economy, industry and high rate of urbanization which create great pullfactors for male migration from West Bengal.
Table 5: West Bengal: Major Migration Destination Regions, 2011
Regions States Total out-migrants(per cent)
Central High land MP, Maharashtra, Chhattisgarh, Orissa, Jharkhand, 44.76Daman dui, Dadra Nagar Haveli
Indo-Gangetic plain Bihar, UP,Punjab, Haryana, Delhi, Rajasthan, Gujarat, 38.68Chandigarh
Deccan Plateau Karnataka, Kerala, Tamil Nadu, Goa, Pondicherry, 7.64Andhra Pradesh
North-Eastern Hill Assam, Sikkim Tripura, Arunachal Pradesh, Nagaland, 6.28States Manipur, Mizoram, Meghalaya,
Northern Mountain Jammu & Kashmir, Himachal Pradesh, Uttaranchal 1.76States
Islands Andaman and Nicobar Island, Lakshadweep 0.88
Total 100
Source: Census of India, Migration Table D-3: Migrants by place of last residence,duration of residence and reason for migration - 2011

NO. 2 IDENTIFYING DESTINATION OF RURAL OUT-MIGRANTS IN WEST BENGAL 43
States in South India, North-Eastern States and North Indian Mountain states received a smallproportion of migrants from West Bengal because some states are far from West Bengal; some areeconomically and agriculturally developed; some are industrially less developed which do notcreate pull factors for male migrants from West Bengal. Parganiha et al. (2009) pointed out thatoutmigration is greater in the poorly developed agricultural areas and particularly high among thelandless farmers. Most of the rural male persons migrate to far off places from their village and mostof the female out-migrants moved to the other areas within the same district.
Table 6 shows the most preferred destinations as far as male and female migrants areconcerned. Maharashtra (20.22per cent), Jharkhand (11.12per cent) Delhi (9.81per cent), are thethree destinations most favoured by male out-migrants from rural West Bengal whereas Jharkhand(26.77per cent), Bihar (13.52per cent) and Uttar Pradesh (12.28per cent) are the three preferreddestinations for female migrants from West Bengal. Among the 35 states and union territories, onlyten states have accounted for 74.12 per cent of the total rural male migrants and 85.71 per centfemale migrants from West Bengal.
Table 6: Male-Female Variation in Destinations for Migrants from West Bengal, 2011
Place of Place of Destination Place of Place of DestinationOrigin Origin
States Per Cent States Per Cent
West Bengal Maharashtra 20.22 West Bengal Jharkhand 26.77
(Male Migrants) Jharkhand 11.12 (Female Bihar 13.52
NCT of Delhi 9.81 Migrants) Uttar Pradesh 12.28
Orissa 6.20 Maharashtra 8.06
Uttar Pradesh 5.85 Orissa 7.27
Gujarat 5.70 NCT of Delhi 6.12
Karnataka 4.40 Assam 4.21
Haryana 3.81 Haryana 2.72
Assam 3.53 Gujarat 2.39
Rajasthan 3.48 Rajasthan 2.37
Top ten total 74.12 Top ten total 85.71
Source: Census of India, Migration Table D-3: Migrants by place of last residence,duration of residence and reason for migration - 2011
Relation of outmigration and distance of destination placeDistance is one of the important factors for selecting a destination place of migrants who are
migrated from their native place and this distance also controlled by different other social and

44 INDIAN JOURNAL OF LANDSCAPE SYSTEMS AND ECOLOGICAL STUDIES VOL. 42
economic factors. Different societal systems like caste, taboos, religious belief are acted together asa social barrier in different society for both the sexes. Stouffer (1940) suggested that the number ofpersons who want to go a given distance is directly proportional to the number of opportunities atthat distance and inversely proportional to the number of intervening opportunities. In West Bengal,these types of social problems are deeply rooted in rural counterparts. In West Bengal, for maleoutmigration and rural to urban out-migration flow clearly proves that distance creates a littlehurdle to migration if the destination places are economically and industrially developed. ThoughMaharashtra, Delhi, Gujarat, Punjab, Haryana are situated far away from West Bengal, these statesdid attract a large share of the migrants from West Bengal.
The correlation has been done between the distance of the destination and different streamsof outmigration as presented in table 7. All the variables are negatively correlated with the distanceof the destination and different streams of outmigration from West Bengal in 2011. Total ruraloutmigration is negatively correlated with the distance of the destination and the value of thecorrelation coefficient is negative at -0.543 in 2011 which is statistically significant at 0.01 level ofsignificance. It’s mean that if the distance of the destination increases than the rate of rural out-migration decreases (Kundu and Sarangi, 2007; Premi (1980). The relation with total urban out-migration and the distance of the destination is negative (r=-0.321) but poor significant. It’s meanthat the distance of the destination place is not any direct effect on urban out-migration in WestBengal. High negative correlation (r= -0.627 at 0.01 significance level) between the percentage ofrural to rural outmigration and distance of destination suggested that if the distance of destinationincreases than the rate of rural out-migration decreases. Census of India 2011 shows that about77.06 per cent among the total rural to rural are migrated in neighbouring states of West Bengal.The relation between the percentage of rural to urban outmigration and distance of destination isnot significant and it’s associated with poor negative relation (r=-0.262). Its mean that distance ofdestination place is not any direct effect on rural to urban out-migration in West Bengal. There is apoor negative correlation with total male outmigration and distance. The value of the correlationcoefficient is negative (r=-0.158). It’s mean that for male out-migration, distance does not matter ifthe destination place is developed (Premi, 1980; Debnath and Ray, 2017). Inter-state total femaleoutmigration is negatively associated with the distance of destination with the value of the correlationcoefficient is negative (r=-0.576 at 0.01 significance level). It’s mean that if distance increases thanthe rate of female out-migration decrease. In general, female are migrated for marriage and migratedin short distance (Zachariah, 1966; Bose, 1965; Piotrowski, at el., 2013). The relation between thepercentage of inter-state rural to rural male outmigration and distance of destination is significantand it’s associated with strong negative relation (r=-0.595 at 0.01 significance level). It’s mean thatif distance increases than the rate of rural to rural male out-migration decreases. The great bulk ofmigrants proceed only a short distance and that those migrants proceeding long distances generallygo to the large conurbations (Jones, 1965). Total rural to rural female outmigration is negativelycorrelated with the distance of the destination and the value of correlation coefficient is negative at-0.619 in 2011 which is statistically significant at 0.01 level of significance. It’s mean that if distanceincreases than the rate of female out-migration decrease. In general, female are migrated for marriage

NO. 2 IDENTIFYING DESTINATION OF RURAL OUT-MIGRANTS IN WEST BENGAL 45Ta
ble
7: W
est
Ben
gal:
Cor
rela
tion
Bet
wee
n D
ista
nce
and
Diff
eren
t St
ream
s of
Out
mig
ratio
n, 2
011
Vari
able
sD
ista
nce
Rur
alU
rban
Rur
al to
Rur
al to
Tota
lTo
tal
R to
RR
to R
R to
UR
to U
Tota
lTo
tal
Rur
alU
rban
Mal
eFe
mal
eM
ale
Fem
ale
Mal
eFe
mal
e
Dis
tanc
e1
Rur
al to
tal
-.543
**1
Urb
an t
otal
-0.3
21.7
63**
1
Rur
al to
Rur
al-.6
27**
.946
**.5
78**
1
Rur
al to
Urb
an-0
.262
.834
**.8
81**
.610
**1
Tota
l M
ale
-0.1
58.6
69**
.931
**.4
17*
.926
**1
Tota
l Fem
ale
-.576
**.9
80**
.797
**.9
47**
.781
**.6
39**
1
R to
R M
ale
-.595
**.8
71**
.645
**.8
64**
.659
**.5
87**
.843
**1
R to
R F
emal
e-.6
19**
.938
**.5
60**
.998
**.5
94**
.390
*.9
43**
.833
**1
R to
U M
ale
-0.0
75.6
27**
.868
**.3
47*
.941
**.9
77**
.574
**.4
94**
0.32
51
R to
U F
emal
e-.4
31*
.947
**.7
74**
.814
**.9
28**
.743
**.9
02**
.750
**.8
07**
.747
**1
** C
orre
latio
n is
sig
nific
ant a
t the
0.0
1 le
vel (
2-ta
iled)
.*
Cor
rela
tion
is s
igni
fican
t at t
he 0
.05
leve
l (2-
taile
d).
Sour
ce: C
ensu
s of
Indi
a, M
igra
tion
Tabl
e D
-3: M
igra
nts
by p
lace
of l
ast r
esid
ence
,du
ratio
n of
res
iden
ce a
nd r
easo
n fo
r m
igra
tion
- 201
1

46 INDIAN JOURNAL OF LANDSCAPE SYSTEMS AND ECOLOGICAL STUDIES VOL. 42
and migrated more in rural areas (Bose, 1965; Zachariah, 1966; Premi, 1980; Keshri and Bhagat 2012;Piotrowski, at el., 2013). The relation between the percentage of inter-state rural to urban maleoutmigration and distance is not significant and it’s associated with poor negative relation (r=-0.075). It’s mean that distance of destination place has not any direct effect on rural to urban maleout-migration in West Bengal. Inter-state migration flows indicate that if destination places aredeveloped economically and industrially then distance does not create any problem in migrating.Maharashtra, Delhi, Gujarat, Punjab, Haryana are situated far from this state but they have receiveda large proportion of rural to urban male migrants from West Bengal. Those who are migrated inlong-distance are generally migrated in the developed region or urban areas for the searching jobopportunity (Rele, 1969; Oberai, 1984; Keshri and Bhagat 2012; Piotrowski, at el., 2013; Debnath,2017). The relation between the percentage of inter-state rural to urban female outmigration anddistance is significant and it’s associated with strong negative relation (r=-0431 at 0.05 significancelevel). It’s mean that if distance increases than the rate of female out-migration decrease. Premi(1980) argued that in the case of short distance, females migrate more in rural areas but medium andlong-distance more of them migrate to urban areas. In general, female are migrated for marriage andmigrated more in rural areas (Zachariah, 1966; Bose, 1965; Piotrowski, at el., 2013).
ConclusionOn the basis of the analysis of spatial variation in inter-state rural outmigration, it can be
stated that people of West Bengal not only migrated in short distance but also in long distance.Females largely migrated in short distance and only one-third male migrated in short distance or toadjacent states. More females migrated to districts in adjacent states of West Bengal whereas moremales are migrated long distance to states located far away. Inter-state migration flows indicate thatif destination places are developed economically and industrially then distance does not create anyproblem in migrating. Maharashtra, Delhi, Gujarat, Punjab, Haryana are situated far from this statebut they have received a large proportion of male migrants from West Bengal.In a regional context,Central high land and Indo-Gangetic plain region have received the highest percentage of migrantsfrom West Bengal. Maharashtra, Madhya Pradesh, Jharkhand, Orissa, Haryana, Punjab, Delhi, Gujaratetc. are states rich in minerals, agriculture, economy, industry and have a higher rate of urbanizationwhich create great pull factors for male migration from West Bengal. Maharashtra, Delhi andJharkhand are the three most preferred destinations of male out-migrants from West Bengal whereasJharkhand, Bihar and Uttar Pradesh are the three preferred destination places for female migrantsfrom West Bengal.
ReferencesBose, A. (1965). Internal Migration in India, Pakistan and Ceylon.In UN World Population Conference,
Belgrade, Yugoslavia, Vol. 196.Clark, W.A.W. (1986). Human Migration. California: Sage publications.Debnath, M., Ray, S., Nayak, D.K., (2016). Rural out-migration across agro-climatic regions in West Bengal.Hill
Geographer, 32(2): 59-75.

NO. 2 IDENTIFYING DESTINATION OF RURAL OUT-MIGRANTS IN WEST BENGAL 47
Debnath, M. and Ray, S. (2017). Inter-Regional Pattern of Scheduled Caste Male Out-Migration in WestBengal: A Geographical Analysis. Indian Journal of Spatial Science, 8(1): 34-40.
Debnath, M. (2019). The Recent Trend of Outmigration in Different Regions of West Bengal: A GeographicalAnalysis. Thematics Journal of Geography, 8(4): 66-78.
Debnath, M, Ray, S. and Nayak, D.K. (2019). Identification of Destination Regions of Male Out-migration inWest Bengal.Journal of Social Science, 61(1/3): 18-29. DOI: 10.31901/24566756.2019/61.1-3.2207.
Deshingkar, P., Sharma, P., Kumar, S., Akter, S. and Farrington, J. (2008). Circular migration in MadhyaPradesh: Changing patterns and Social Protection Needs. The European Journal of DevelopmentResearch, 20(4), 612–628. https://doi.org/10.1080/09578810802464920
Dodda, W., Humphriesb, S., Patelc, K., Majowiczd, S. and Deweya, C. (2016). Determinants of temporarylabour migration in southern India, Asian Population Studies, 12(3), 294–311.https://doi.org/10.1080/17441730.2016.1207929
Jones, H. R. (1965). A Study of Rural Migration in Central Wales.The Royal Geographical Society 37: 31-45.https,//www.jstor.org/stable/i225600
Keshri, K. and Bhagat, R. B. (2012). Temporary and Seasonal Migration: Regional Pattern, Characteristics andAssociated Factors. Economic & Political Weekly, 47(4): 81-88.https,//www.jstor.org/stable/41419769
Kundu, A. and Sarangi, N. (2007).Migration, Employment Status and Poverty an Analysis across UrbanCentres.Economic and Political Weekly, 42(4): 299-306.https,//www.jstor.org/stable/4419187
Nath, D. C. and Choudhury, L. (1995).Two Regional (Rural - Urban) Life Tables for India.Genus, 51(1/2): 45-67.https,//www.jstor.org/stable/29789184
Oberai, A. S. and Singh, H.K.M. (1980). Migration Flows in Punjab’s Green Revolution Belt. Economic andPolitical Weekly, 15(13): A2-A12.https,//www.jstor.org/stable/4368516
Panda, A. (2016). Vulnerability to climate variability and drought among small and marginal farmers: a casestudy in Odisha, India. Climate and Development, 9(7), 1-13. https://doi.org/10.1080/17565529.2016.1184606
Parganiha, O., Sharma, M. L., Paraye, P. M. and Soni, V. K. (2009).Migration effect of agricultural labourerson agricultural activities.Indian Research Journal, 9(3): 95-98.
Piotrowski, M., Ghimire, D. and Rindfuss, R. (2013).Farming Systems and Rural Outmigration in Nang Rong,Thailand, and Chitwan Valley, Nepal.Rural Sociology, 78(1): 75–108.https,//doi.org/10.1111/ruso.12000
Premi, M. K. (1980). Aspects of Female Migration in India.Economic and Political Weekly, 15(15): 714-720.https,//www.jstor.org/stable/4368564
Rele, J. R. (1969). Trends and Significance of Internal Migration in India.The Indian Journal of Statistics, 31(3/4): 501-508.https,//www.jstor.org/stable/25051701
Rogaly, B. (1998). Workers on the Move: Seasonal Migration and Changing Social Relations in Rural India.Gender and Development, 6(1): 21-29.http://dx.doi.org/10.1080/741922628.
Rogaly, B., Biswas, J., Daniel, C., Abdur, R., Kumar R., and Sengupta, A. (2001). Seasonal migration, socialchange and migrants’ rights: Lessons from West Bengal. Economic and political weekly, 36(49):4547-4559. https://www.jstor.org/stable/4411446.
Rogaly, B., Coppard, D., Safique, A., Rana, R., Sengupta, A., and Biswas, J. (2002). Seasonal migration andwelfare/illfare in Eastern India: A Social Analysis. The Journal of Development Studies, 38(5): 89-114. http://dx.doi.org/10.1080/00220380412331322521.

48 INDIAN JOURNAL OF LANDSCAPE SYSTEMS AND ECOLOGICAL STUDIES VOL. 42
Rogaly, B., and Rafique, M. (2003).Struggling to save cash: seasonal migration and vulnerability in WestBengal, India.Development and Change, 34(4): 659–681. https://doi.org/10.1111/1467-7660.00323.
Rogaly, B., and Coppard, D. (2003). They used to go to eat, now they go to earn: the changing meanings ofseasonal migration from Puruliya district in West Bengal. India. Journal of Agrarian Change, 3(3):395–433. https://doi.org/10.1111/1471-0366.00060.
Sengupta, A., and Ghosal, R. K. (2011). Short-distance rural-rural Migration of workers in West Bengal: a casestudy of Bardhhaman district. Journal of Economic and Social Development, 7(1): 75-92.
Singh, J.P. (1984). Distance Patterns Of Rural To Urban Migration in India. Genus, 40(½): 119-129.https,//www.jstor.org/stable/29788404
Sinha S. K. (1986). Internal Migration in India: 1961-1981, an Analysis.Office of the Register General, NewDelhi.
Sengupta, A. and Ghosal, R. K. (2011). Short-distance rural-rural Migration of workers in West Bengal: a casestudy of Bardhhaman district. Journal of Economic and Social Development, 7(1): 75-92.
Stouffer, S.A., (1940). Intervening Opportunities: A Theory Relating to Mobility and Distance. AmericanSociological Review, 5(6): 845-67.
Zachariah, K. C. (1966). A Historical Study of Internal Migration in the Indian Sub-Continent, 1901-1931.New York: Asia Pub. House.
Received : 26 May, 2019Revised : 30 September, 2019

NO. 2 UNDERNUTRITION LEVEL AMONG THE CHILDREN UNDER 5 YEARS AGE 49
Undernutrition Level Among the Children Under 5 YearsAge in Arsha Community Development Block of
Purulia District, West BengalMrinal Mandal1 and Debasis Ghosh2
Abstract : Malnutrition is a serious concern for the world in general and for India in particular. Globally,there are 155 million children (22.9 per cent) under the age of 5 years affected by the stunting. The MillenniumDevelopment Goals (MDGs) of United Nations (UN) aimed to achieve 8 goals by 2015, of which the first goalwas to 'eradicate the extreme poverty and hunger'. But all the goals were not fulfilled completely by the targetedyear. Thus Sustainable Development Goals (SDGs) of UN (effective from January, 2016) adopts 17 globalgoals to be achieved by 2030 for the sustainable development of the world. The first 3 goals are 'no poverty','zero hunger' and 'good health and well-being'. Despite these programmes taken by UN and other organizationsof the world of different capacities, we still experience the vicious cycle of poverty, hunger, malnutrition anddiseases. In this backdrop, a field based study has been made in Arsha Community Development (C.D.) Blockof Purulia district, West Bengal taking 148 children between the ages of 0 to 59 months to investigate thenutritional status of children. The World Health Organization's (WHO) "Child Growth Standards, 2006" areadopted for nutritional analysis of children. It is revealed from the study that the prevalence of underweight isfound to be 67.57 per cent followed by stunting (63.51 per cent) and wasting (44.60 per cent). Female childrenare more at risk than the male children. The age groups of 24 to 35 and 12 to 23 months are more invulnerable conditions than the other age groups. A large number of children i.e. 82.43 per cent are under theserious threat of undernutrition in the C.D. Block.
Keywords : Malnutrition, Stunting, Underweight, 0-59 months, Arsha C.D. Block.
IntroductionThe incidence of malnutrition happens to be a serious problem of developing countries in
general and for India in particular. The undernutrition is an important contributor of high morbidityas well as mortality rate among children. Globally, there are 159 million stunted children under theage of 5 years, though the rate declined from 39.6 per cent in 1990 to 23.8 per cent in 2014.Moreover, there are 50 million wasted children worldwide, of which 16 million are severely stuntedin 2014 (UNICEF, WHO and World Bank, 2015). Almost half of the deaths of children under 5 years
1. Assistant Professor, Department of Geography, Sidho-Kanho-Birsha University, Purulia, West Bengal2. Associate Professor, Department of Geography, University of Calcutta, West Bengal* Corresponding Author,E-mail: [email protected]
Ind. J. of Landscape Systems and Ecological Studies 42 (2) December - 2019, 49- 63 ISSN 0971-4170

50 INDIAN JOURNAL OF LANDSCAPE SYSTEMS AND ECOLOGICAL STUDIES VOL. 42
of age is caused due to undernutrition. It brings the young children at a great risk of deaths, whichmay be resulted from common infections (www.unicef.org). To combat with these serious problems,many organisations of the world are trying their level best. In September 2000, 191 United Nations(UN) member states signed the ‘Millennium Development Goals’ (MDGs), which include 8 goalsfor the world, to be achieved by the year 2015. All the nations were agreed and committed to fightagainst the poverty, hunger, illiteracy, environmental degradation, discrimination against womenand diseases (www.who.int). This initiative yields success by rescuing millions of people from thepaw of severe poverty, hunger, illiteracy and other things. But the work has not been completedwithin the time frame of 15 years. Still we have miles to go to eradicate these phenomena permanently.Thus, a new sustainable path was required to be chosen. In this context, the ‘SustainableDevelopment Goals’ (SDGs) with its 17 global goals finally came in to being in January, 2016 by theUN in understanding of 170 countries of the world to obtain sustainable and better future for all.The main goals of SDGs are no poverty; zero hunger; good health and well-being; quality education;gender equality; clean water and sanitation; affordable and clean energy; decent work and economicgrowth; industry, innovation and infrastructure; reduced inequalities; sustainable cities andcommunities; responsible production and consumption; climate action; life below water; life onland; peace, justice and strong institutions; and partnerships for the goals. It has been targeted bythe SDG to achieve each and every goal by 2030 (www.un.org; www.sustainabledevelopment.un.org;www.undp.org). But still now, the globalized 21st century has been experiencing the curses ofpoverty and hunger. According to the census of India 2011, about 68 per cent of Indian populationslives in rural areas, and majority of them take food below standard, stay at a poor housing condition,do not get the chance to come to higher education, activity of production is primitive and have alimited access to the new technological innovations. People living in a low economy and enjoyinglow standard of living are more prone to diseases and ill health directly or indirectly. It may be saidthat diseases promote poverty and poverty in turn breeds diseases. Society can only achieve abench mark of development when its people enjoy a good health along with good quality of life;but quality of life and health status cannot be changed in a society overnight. Thus, the basicparameters of ‘Human Development Index’ (HDI), such as health, education and income are requiredto be taken care in an integrated manner to bring any positive change (Sankar and Geetha, 2012).This stage will be attained if each and every individual gets adequate nutrition, proper educationand an improved environment for all round development. It needs to be started with a child from itsvery first day of birth as the child in its growing period has a special requirement of nutrition, whichrequires to be fulfilled to achieve the optimum growth (WHO, 1995; Blosser et al., 2006).
In 2017, there were 151 million stunted children (22.2 per cent) and 51 million wasted children(7.5 per cent) in the world under the age of 5 years. In the case of Asia, the respective numbers ofstunted, wasted and overweight children under 5 years of age were 83.6, 35.0 and 17.5 millions. It isquite unexpected that almost half of the world’s stunted and overweight children under the age of5 years lived in Asia in 2017. Two thirds wasted children of the same age group of the world alsolived in Asia (UNICEF, WHO and World Bank, 2018). The National Family Health Survey-4 depicts

NO. 2 UNDERNUTRITION LEVEL AMONG THE CHILDREN UNDER 5 YEARS AGE 51
that in the case of India, the trends of mortality rate of infant and under 5 years aged children are41 and 50 per 1000 live births respectively. The percentage of stunted children under 5 years of ageis 38 and underweight is 36. In both cases, it is predominant among ST, SC and OBC castes children(NFHS-4, 2015-16). But in the case of South Asia, the prevalence of stunting in 2017 was 33.3 percent, when the global percentage is 22.2 (UNICEF, WHO and World Bank, 2018). These valuesindicate towards the severity of malnutrition in India. In the case of Purulia of West Bengal the poornutritional status of children in Jangalmahal areas is observed (Mandal and et al., 2017). To perceivethe present situation of nutritional level among the children aged between 0 to 59 months, a studyis carried out in Arsha Community Development Block (C.D. Block) of Purulia district, West Bengal.The specific objective of the study is to determine the prevalence of malnutrition in differentvillages of the C.D. Block.
Database and MethodologyThis present study is completely based on primary survey, which is done based on a pre-
tested structured questionnaire. The study is carried out in the months of December 2018 andJanuary 2019 on 2 Gram Panchayats (GP), namely: Sirkabad and Beldih out of 8 GP (20 per cent oftotal GP). Finally, we have taken 4 villages (Senabana, Bandudih, Bhursa and Haranama) in totalselecting 2 villages from each GP. The selection of GP and villages is made using random tablenumber. According to the Census of India, 2011 there are 839 children within the age group of 0 to6 years in these 4 villages (Census of India, 2011). A total number of 20 per cent sample will be takeninto account for this study i.e. 168. But during the survey, only 148 children are found within theage group of 0 to 59 months. These children are included into the sample purposively, of which 80are girls and 68 are boys. The status of nutritional level of children is done taking anthropometricmeasurements of them, such as height, weight and age. To measure the height and weight, a non-elastic measuring tape and normal weigh machine are used respectively. Age of the child is calculatedfrom the birth certificate. In the case of non-institutional parturition (delivery at home), where thebirth certificate is not available, the age of the child is noted based on the records of parents. Theanthropometric measurements are then tabulated and calculated using the ‘World HealthOrganization Child Growth Standards, 2006’ or the ‘WHO standards, 2006’. The WHOrecommended parameters, such as stunting (Height-for-Age/HAZ), wasting (Weight-for-Height/WHZ), and underweight (Weight-for-Age/WAZ) are taken to assess the growth pattern of childand level of malnutrition. Z-scores are then computed for all these parameters using ‘WHO-AnthroSoftware’ and ‘Gaussian Curve’ is fitted to see the distribution (Onis et al., 2006; WHO, 2018;Namburi and Seepana, 2018). The classification of malnutrition is also done based on z-score values(Table: 1). Map of the C.D. Block is collected from 18th All India Livestock Census, AgricultureImplements & Machinary, Fishery Statistics, West Bengal (Govt. of West Bengal, 2007).
Arsha C.D. Block of Purulia District: The Area under InvestigationArsha is one of the western C.D. Blocks of Purulia district, and surrounded by Purulia-I,
Barabazar, Balarampur, Baghmundi and Jhalda-II C.D. Blocks. The geographical extensions of the

52 INDIAN JOURNAL OF LANDSCAPE SYSTEMS AND ECOLOGICAL STUDIES VOL. 42
Arsha are 86o03’29.625"E to 86o21’19.159"E and 23o10’48.56"N to 23o23’06.365"N (Figure: 1). It belongsto the Sadar-West subdivision of Purulia district. The total households of the C.D. Block are 28,868with a total population of 1,54,736 in 2011 (Census of India, 2011), which was 1,29,148 in 2001(Census of India, 2001). It has an area of 375.04 km2 with a population density of 413/km2, where theaverage district population density is 468/km2. Arsha does not possess any urban population. Thepercentage of male and female populations of Arsha in 2011 is 50.67 and 49.33 respectively. Thereare 18,294 (11.82 per cent) SC population, of which 9380 (51.27 per cent) and 8914 (48.73 per cent)are male and female respectively. The total ST population of Arsha is 33,568 (21.69 per cent). Thetotal number of male and female populations is 16,777 (49.98 per cent) and 16,791 (50.02 per cent)respectively. The literacy rate of the C.D. Block is 54.78 per cent, of which male literacy rate is 70.36per cent and female literacy rate is 38.75 per cent. A difference of 31.61 per cent of literacy rate isobserved in between male and female populations. The total 0-6 years populations are 26,208contributing 16.94 per cent of population to the total populations of the C.D. Block. The male andfemale populations are 13,193 (50.34 per cent) and 13,015 (49.66 per cent) respectively. The totalworkers of Arsha are 73,497 (47.50 per cent), of which cultivators, agricultural labourers, householdworkers and other workers are 19,904 (27.08 per cent), 30,374 (41.33 per cent), 9266 (12.61 per cent)and 13,953 (18.98 per cent) respectively (District Census Handbook, Puruliya, 2011). Arsha C.D.Block has only a Block Primary Health Centre (BPHC) and 2 Primary Health Centre (PHC). There are44 beds available in these 3 health centres with the facility of 4 doctors. There is only a familywelfare centre situated in the C.D. Block. In 2014 there were 323 children of different age groupsdied in Arsha, of which 5 and 318 children died up to the age of 5 years and above 5 yearsrespectively. The C.D. Block has 134 primary schools, 16,636 students, 323 teachers; 19 upperprimary schools, 2058 students, 48 teachers; 1 secondary schools, 653 students, 14 teachers; 9higher secondary schools, 13,238 students, 215 teachers; 1 college, 1056 students, 14 teachers;professional and technical school/college 1, student 12, teacher 7; 226 special and non-formaleducation institutions, 8614 students and 231 teachers. Besides these, all the 96 mouzas of the C.D.Block enjoy the drinking water facility. Only 3 mouzas are not electrified in 2014 (District StatisticalHandbook, Purulia, 2014).
Table 1: Classification of malnourishment of children
Classification Z-score values
Normal -2 z-score to +2 z-score
Moderately malnourished <-2 z-score to -3 ≤ z-score
Severely malnourished <-3 z-score
Source: WHO Child Growth Standards, 2006

NO. 2 UNDERNUTRITION LEVEL AMONG THE CHILDREN UNDER 5 YEARS AGE 53
Fig. 1: Map of Arsha C.D. Block
Results and Discussion
There are 26,208 children within the age group of 0 to 6 years at Arsha C.D. Block. It is goodto find that there are 1014 female children per 1000 male children (Census of India, 2011). We findthe ratio during our study in 4 selected villages of Arsha as 1176 female children per 1000 malechildren below the age of 5 years. This is a good signature for girl populations. The concentrationof female children is found to be higher in the age groups of 48 to 59, 36 to 47 and 24 to 35 months.In the case of male children, they are almost evenly distributed across all the age groups(Figure: 2).

54 INDIAN JOURNAL OF LANDSCAPE SYSTEMS AND ECOLOGICAL STUDIES VOL. 42
Fig. 2: Age and sex wise distribution of children
Source: Primary database,Year
Prevalence of Stunting (HAZ Scenario)The word stunting refers to a particular state when a child cannot attain sufficient height in a
specific age. In other words, a child is too short to her or his age. Stunting in a child may result frompoor nutritional intake in-utero and in early childhood. It may restrict the physical and cognitivegrowths and developments of a child. The condition of stunting may last for whole life, and futuregenerations of the child can also be affected with this. This is a serious global concern (UNICEF,WHO and World Bank, 2018). Our study reveals that the prevalence of stunting among children is63.51 per cent, of which the percentages of male and female children are 60.29 and 66.25 respectively.Severe form of stunting is observed to be 33.78 per cent, which is quite alarming. Female childrenare more likely to be affected by the stunting, especially by severe stunting, than the male children(Table: 2). The figures: 4 and 5 also show that the distribution curves are more negatively skewedin both the cases of male and female children. Severity of stunting is observed as 20.21 per cent forthe age group of 24 to 35 months followed by the 12 to 23 months (10.64 per cent). These two agegroups are more exposed to stunting (Figure: 3).

NO. 2 UNDERNUTRITION LEVEL AMONG THE CHILDREN UNDER 5 YEARS AGE 55
Table 2: Prevalence of stunting based on height-for-age z-score
Category of Stunting All N= 148 Male Children Femalen= 68 Children n= 80
Prevalence of Stunting 94 41 53(<-2 z-score) (63.51 per cent) (60.29 per cent) (66.25 per cent)
Prevalence of Moderate Stunting 44 20 24(<-2 z-score to -3 ≤ z-score) (29.73 per cent) (29.41 per cent) (30.00 per cent)
Prevalence of Severe Stunting 50 21 29(<-3 z-score) 33.78 per cent (30.88 per cent) (36.25 per cent)
Source: Computed by authors, 2018-19
Fig. 3: Age wise prevalence of stunting among children
Prevalence of Wasting (WHZ Scenario)Wasting refers to such a situation when a child fails to achieve sufficient weight for height.
Weight for height is basically used as an indicator of current nutritional status. It is caused due to

56 INDIAN JOURNAL OF LANDSCAPE SYSTEMS AND ECOLOGICAL STUDIES VOL. 42
Fig. 4: Height-for-age z-score of children
Fig. 5: Sex wise height-for-age z-score of children

NO. 2 UNDERNUTRITION LEVEL AMONG THE CHILDREN UNDER 5 YEARS AGE 57
poor nutrient intake for a long period of time. The wasted children may face the low immunitypower, delayed physical and brain development and even death also. Children experiencing thisparticular problem need urgent feeding and immediate medication (UNICEF, WHO and World Bank,2018). The occurrence of wasting in our present study area is found to be significant with a valueof 44.60 per cent, but it is less prevalent than the stunting. The respective percentage of wasting formale and female children is 42.65 and 46.25. Prevalence of severe wasting is observed to be 22.30per cent, where male children are 27.94 per cent and female children are 17.5 per cent. The resultsspeak that the female children suffer more in case of wasting than the male children in general, butthe severe form of wasting is more experienced by the male children (Table: 3). The distributioncurves also state the same fact (Figure: 7 & 8). It is found from figure: 6 that the age group of 12 to23 month is more severely wasted (18.18 per cent) followed by the 24 to 35 months (13.64 per cent).In contrast, the age group of 0 to 11 months is in better condition compared to other age groups.
Table 3: Prevalence of wasting based on weight-for-height z-score
Category of Stunting All N= 148 Male Children Femalen= 68 Children n= 80
Prevalence of Wasting 66 29 37(<-2 z-score) (44.60 per cent) (42.65 per cent) (46.25 per cent)
Prevalence of Moderate Wasting 33 10 23(<-2 z-score to -3d” z-score) (22.30 per cent) (14.71 per cent) (28.75 per cent)Prevalence of Severe Wasting 33 19 14
(<-3 z-score) (22.30) per cent (27.94 per cent) (17.5per cent)
Fig. 6: Age wise prevalence of wasting among children

58 INDIAN JOURNAL OF LANDSCAPE SYSTEMS AND ECOLOGICAL STUDIES VOL. 42
Fig. 7: Weight-for-height z-score of children
Fig. 8: Sex wise weight-for-height z-score of children

NO. 2 UNDERNUTRITION LEVEL AMONG THE CHILDREN UNDER 5 YEARS AGE 59
Prevalence of Underweight (WAZ Scenario)It is a situation when a child’s weight is less than expected of his/her age. It is mainly caused
by the lack of nutrients supplied by the dietary or diseases (NLIS, 2010). It was estimated by theUNICEF, WHO and World Bank that there were 99 million children under the age of 5 yearsunderweight globally. But the global trend was declining, as it was 25 per cent in 1990 and 15 percent in 2013. In this period of time, Asia reduced this from 32 per cent to 18 per cent (UNICEF, WHOand World Bank, 2015). This trend is definitely appreciable for the continent. In case of our study,it portrays different picture than the scenario of Asia as reported by the UNICEF, WHO and WorldBank in 2015. We find that a large proportion of children (67.57 per cent) under the age of 5 yearsare underweight, of which 63.24 per cent is male children and 71.25 per cent is female children.Prevalence of moderate underweight is high among the female children (30 per cent); whereas, malechildren experience severe underweight (44.12 per cent) than the rest (Table: 4). It is important to
Figure 9: Age wise prevalence of underweight among children
Table 4: Prevalence of underweight based on weight-for-age z-score
Category of Underweight All N= 148 Male Children Femalen= 68 Children n= 80
Prevalence of Underweight 100 43 57(<-2 z-score) (67.57) per cent (63.24) per cent (71.25) per cent
Prevalence of Moderate Underweight 37 13 24(<-2 z-score to -3 ≤ z-score) (25.00) per cent (19.12) per cent (30.00) per cent
Prevalence of Severe Underweight 63 30 33(<-3 z-score) (42.57) per cent (44.12) per cent (41.25) per cent

60 INDIAN JOURNAL OF LANDSCAPE SYSTEMS AND ECOLOGICAL STUDIES VOL. 42
Figure 10: Weight-for-age z-score of children
Figure 11: Sex wise weight-for-age z-score of children

NO. 2 UNDERNUTRITION LEVEL AMONG THE CHILDREN UNDER 5 YEARS AGE 61
note that the female children are more in vulnerable condition than the male children in the case ofunderweight. The study also reveals that the age groups of 24 to 35 months and 12 to 23 monthsface severe form of underweight as 18 per cent and 14 per cent respectively (Figure: 9). Thefrequency distribution curves also show the same patterns (Figure: 10 & 11).
Table 5: Category and sex wise prevalence of malnutrition among children
Category Total Male Children Female Children
Normal Normal 26 (17.57%) 12 (17.65%) 14 (17.50%)
Stunting 18 (12.16%) 11 (16.18%) 7 (8.75%)
Wasting 4 (2.70%) 2 (2.94%) 2 (2.5%)
Underweight 3 (2.03%) 0 (0%) 3 (3.75%)
Stunting & Wasting 0 (0%) 0 (0) 0 (0)
Stunting & Underweight 35 (23.65%) 15 (22.06%) 20 (25.0%)
Wasting & Underweight 21 (14.19%) 13 (19.12%) 8 (10.0%)
Stunting, Wasting & Underweight 41 (27.70%) 15 (22.06%) 26 (32.5%)
Total of UndernourishedChildren 122 (82.43%) 56 (82.35%) 66 (82.5%)
All Total 148 (100%) 68 (100%) 80 (100%)
Overall Malnutrition ScenarioThere are millions of children under the age of 5 years suffering from malnutrition worldwide.
This is an emergency situation almost for all nations. It is reported that two out of five stuntedchildren are found to be living in South Asia in 2016, which is quite unfortunate (UNICEF, WHOand World Bank, 2017). Our study unveils the malnutrition scenario of the Arsha C.D. Block inpresent day. Only 17.57 per cent children under the age of 5 years found not to be undernourished.The prevalence of a specific condition of undernutrition, such as stunting, wasting and underweightis observed among the children in very low proportions (Table: 5). Actually more than one state ofundernutrition is found to be prominent among the children, which is a serious concern. Thecategory of stunting, wasting and underweight contributes 27.70 per cent undernutrition among thechildren followed by the stunting and underweight (23.65 per cent), wasting and underweight (14.19per cent) and stunting (12.16 per cent) categories. Overall 82.43 per cent children are under the riskof undernutrition, of which male and female children are 82.35 and 82.50 per cent. There is nosignificant variation of prevalence of undernutrition observed between male and female children.So, sex has no role in prevalence of malnutrition in our study area.
Und
ernu
tritio
n

62 INDIAN JOURNAL OF LANDSCAPE SYSTEMS AND ECOLOGICAL STUDIES VOL. 42
ConclusionMalnutrition is the curse to the world. A child born today is the future of tomorrow, and a
nation cannot prosper with malnourished citizens. Nutritional care at the early age of childhood canstop the risk of diseases and deaths of children. A balance diet, if supplied to the children or anyindividual in regular basis can only bring the difference in any society. Ill-fed and ill-health populationswill not be able to contribute to the society for a long time. In the case of Arsha C.D. Block ofPurulia district, it is found that the prevalence of underweight children (67.75 per cent) followed bystunting (63.51 per cent) is predominant. Female children are observed to be more undernourishedthan the male children in general (Table: 4 & 3). The age groups of 24 to 35 months and 12 to 23months under 5 years children are found to be more vulnerable in the cases of stunting, wastingand underweight than the other age groups of children. The category of stunting, wasting andunderweight dominates most (27.70 per cent) compared to other categories of undernutrition. Overallprevalence of undernutrition in the C.D. Block is observed to be 82.43, of which male children are82.35 per cent and female children are 82.5 per cent. These values indicate towards the inadequatenutrient supply to a child during prenatal and postnatal periods (Table: 5). Our study disclose thepresent scenario of the nutritional status of children living in Arsha as well the situation of thePurulia district in the context of MDGs and SDGs of UN.
AcknowledgementsThe authors are beholden to Mr. Manas Karmakar, Mr. Dayamoy Mandal (UGC-JRF and Ph.D.
Research Scholar, Department of Geography, University of Calcutta); Mr. Biswajit Ghosh (GuestLecturer, Department of Geography, Barabazar Bikram Tudu Memorial College, Purulia); Mr. ParthaModak (Contractual Guest Lecturer, Department of Geography, Raghunathpur College, Purulia); Mr.Susanta Mandi (Guest Lecturer, Department of Geography, Arsha College, Purulia) and Mr. PradipMandal (M.A., B.Ed. in Geography) for their constant help and support during collection of fielddata. They are also indebted to the research participants of the Arsha C.D. Block for their cooperationin collecting data and information.
ReferencesBlössner, M., De Onis, M., & Uauy, R. (2006): Estimating Stunting from Underweight Survey Data. J Hum
Ecol, 14, 145-152.de Onis, M., Onyango, A. W., Borghi, E., Garza, C., Yang, H., & WHO Multicentre Growth Reference Study
Group. (2006): Comparison of the World Health Organization (WHO) Child Growth Standards andthe National Center for Health Statistics/WHO International Growth Reference: Implications forChild Health Programmes. Public Health Nutrition, 9(7), 942-947.
Government of India (2016): India Fact Sheet(2015-16): National Family Health Survey-4 (NFHS-4). NewDelhi: Ministry of Health and Family Welfare.
Government of India (2011): Census of India. New Delhi: Directorate of Census.Government of India (2011): District Census Handbook, Puruliya. New Delhi: Directorate of Census.Government of India (2001): Census of India. New Delhi: Directorate of Census.

NO. 2 UNDERNUTRITION LEVEL AMONG THE CHILDREN UNDER 5 YEARS AGE 63
Government of West Bengal (2014): District Statistical Handbook, Purulia 2014. Kolkata: Bureau of AppliedEconomics and Statistics.
Government of West Bengal (2007): 18th All India Livestock Census, Agriculture Implements & Machinery,Fishery Statistics West Bengal, Purulia District, Part-I. Kolkata: Directorate of Animal Resourcesand Animal Health.
Mandal, M., Karmakar, M., Modak, P., & Ghosh, D. (2017): Nutrition and Child Health: Peeping at the HillyTract of Jangalmahal Area of Purulia District. In M. Sen, Food Security & Urbanization Equilibrium(pp. 135-151). Kolkata: Ashadeep.
Namburi, N. S., & Seepana, M. (2018): Assessment of Undernutrition Using Composite Index of AnthropometricFailure among Children Less Than 5 Years in An Urban Slum, Visakhapatnam. International Journalof Community Medicine and Public Health, 5(11), 4773-4777.
Shankar, R., & Geetha, V. J. (2012): Health and Nutritional Status of Tribes in India. In S.N. Chaudhury, TribalHealth and Nutrition (pp. 37-63). New Delhi: Rawat Publications.
UNICEF, WHO. & World Bank. (2018): Level and Trends in Child Malnutrition: Key Findings of the 2018Edition. UNICEF, WHO and World Bank.
UNICEF, WHO. & World Bank. (2017): Level and Trends in Child Malnutrition: Key Findings of the 2017Edition. UNICEF, WHO and World Bank.
UNICEF, WHO. & World Bank. (2015): Level and Trends in Child Malnutrition: Key Findings of the 2015Edition. UNICEF, WHO and World Bank.
WHO. (2018): WHO Anthro Survey Analyser. WHO. accessed from https://www.who.int/nutgrowthdb/about/anthro-survey-analyser-quickguide.pdf?ua=1 on 28/02/2019.
WHO. (2010): Nutrition Landscape Information System (NLIS) Country Profile Indicators: InterpretationGuide.
WHO. (1995): WHO Expert Committee Report. Physical Status: The Use and Interpretation ofAnthropometry. WHO Technical Report Series, 854(9).
https://data.unicef.org/topic/nutrition/ accessed on 22/02/2019 at 2.20 pmhttps://sustainabledevelopment.un.org/?menu=1300 accessed on 22/02/2019 at 5.22 pm.https://www.un.org/sustainabledevelopment/sustainable-development-goals/ accessed on 22/02/2019 at 5.20
pm.https://www.undp.org/content/undp/en/home/sustainable-development-goals.html accessed on 22/02/2019 at
5.18 pm.https://www.who.int/topics/millennium_development_goals/about/en/ accessed on 22/02/2019 at 3.38 pm.
Received : 14 February, 2019Revised : 10 July, 2019

64 INDIAN JOURNAL OF LANDSCAPE SYSTEMS AND ECOLOGICAL STUDIES VOL. 42
Spatial Concentration of Urban Infrastructural Facilities:A Case Study of Berhampore Town, West Bengal
Mustafijur Rahaman1 and Nigar Alam Siddique2
Abstract : Infrastructure plays a vital role in the process of urbanization and urban change. The majorconcern in the present time is the growing gap between the demand and provision of basic institutionalfacilities such as education, health, drinking water, sanitation, etc. The demand for various facilities increaseswith population growth and the old facilities have to be upgraded with rising living standard and publicexpectations. The present study tried to focus on a quantitative approach to educational facilities, healthfacilities, economic facilities, and other facilities. The quantitative method like Location Quotient, Averageward-wise composite score, composite indicators are applied to design the whole research work. Someproblems related to lack of facilities are identified, and solutions to these problems are also recommended inthis paper. Besides, a plan for the development of urban infrastructure related to education, health andeconomy are discussed in this research.
Keywords : Town, facility, Composite Score, Berhampore, West Bengal.
IntroductionInfrastructure is critical in the process of urban change in a certain way. The story of
infrastructure is the story of civilization. As people began to civilize since they initiated constructedfeatures within an urban space. Urban infrastructural facilities are the essential services which areimportant for the daily life of urban people. These facilities are related to the social & economicdevelopment of the area concerned. Rapid population growth in urban areas of the developingworld leads to growing deficits of urban facilities in terms of quality and quantity. There is a greatchallenge in maintaining services and extending them to deprived areas. Civic and basic urbannecessities provided by a municipality are important components of a city which play a meaningfulrole in determining the quality of any urban settlement. Urban infrastructural facilities are theessential services which are important for the daily life of urban people. The Investments for the
1. Research Scholar, Department of Geography, Faculty of Science, Aligarh Muslim University Aligarh,Uttar Pradesh, India
2. Associate Professor, Department of Geography, Faculty of Science, Aligarh Muslim University Aligarh,Uttar Pradesh, India
*Corresponding Author, Email: [email protected]
Ind. J. of Landscape Systems and Ecological Studies 42 (2) December - 2019, 64- 76 ISSN 0971-4170

NO. 2 SPATIAL CONCENTRATION OF URBAN INFRASTRUCTURAL FACILITIES 65
development of infrastructure and provision of essential services have not been spatially balancedduring the past few decades. Urban governments play an important role in the provision of urbaninfrastructural facilities, and they have a significant impact on city development.
Dhaliwal, S. (2004) discussed on that urban infrastructural development in small and mediumtown. His observation of the study is the growth of urban population in India during the pastdecade indicates higher growth for metro cities. However, he emphasized that the development ofbasic infrastructural services like education facilities, water supply, health facilities, sanitation facilities,solid waste management, and transportation could not keep pace with the growth of urban population.He also described that the municipal government plays a vital role in the provision of urbanservices and they have a significant impact on city development. Rapid population growth in urbanareas of the developing world leads to growing the urban facilities deficits both in terms ofmaintaining services and extending them to sub-serviced areas. Borana, S.L. & Yadav, S.K. (2017)analyzed the spatial distribution disparity analysis of urban amenities in Municipal Ward’s peripheryof Jodhpur city. From their studies it enlightened urban amenities comprises the infrastructure,goods, and services that are very much needed. They utilized the Landsat 2015 data and designedthe study by Arc GIS. Also, they used the Lorenz curve to showing the disparities. URDPFI normsalso have been used to verify the discrepancies. For displaying the magnitude of facilities, theyutilized the buffer map in their study. In study area is seen the uneven distribution of urbanamenities.
Selection of the Study AreaBerhampore town is the district headquarters where higher order administrative functions are
performed, and higher order infrastructures render services to the people. Berhampore is a city inthe West Bengal state of India. Berhampore is the sixth largest city in West Bengal (after Kolkata,Asansol, Siliguri, Durgapur, and Malda) and situated in the central part of West Bengal. Berhamporetown is located just beside Bhagirathi River and nearer to NH-34. The total population of Berhamporetown as per 2011 census is 195225, and the area covered 22.67 sq. Km. 34. The geographicalextension of Berhampore town is 24º 62 N, 88º 152 E. There are 25 wards in the town. According toCensus of India, 2011 the urbanization of West Bengal percentage is 31.87. The rate of urbanizationis acceleration in way. Only one large town i.e. Kolkata metropolitan city is located in west Bengal.This city is composed high concentrations of facilities like, education, health, economic and others.But in a small town, most of the peoples are faced problems due to lack of facilities. The people ofthe every corner of West Bengal are fully dependent on the Kolkata metropolitan town in terms offacilities. They are compelled to go there. Berhampore town is small and having unequalconcentration of infrastructural facilities. Also lack of infrastructural facilities is one of the salientfeatures of the study area.

66 INDIAN JOURNAL OF LANDSCAPE SYSTEMS AND ECOLOGICAL STUDIES VOL. 42
Fig. 1 Location Map of the Study Area
ObjectivesThe main objectives of the present study are to analyze the infrastructural facilities. The
objectives of the study are as follows:
To find out the spatial pattern of distribution of infrastructural facilities in different wardsof the town.

NO. 2 SPATIAL CONCENTRATION OF URBAN INFRASTRUCTURAL FACILITIES 67
To analyze the level of concentrations of infrastructural facilities throughout the studyarea.
To calculate the Municipal Composite Score (MCS) and Average Ward Wise CompositeScore (AWCS) of infrastructural facilities in Berhampore town.
Database and MethodologyThis study is mostly based on secondary data which has been collected from various govt.
sources like Berhampore Municipality, Department of Deputy Inspector of Schools, HealthDepartments of Berhampore Municipality and license dept. of Municipality. The data concerningpopulation, road, location of cinema halls, auditorium, parks, police station, bus stop, bus stand,electric office, market, etc. are collected from different departments of Berhampore Municipality.Some tools are used for data interpretation which is as under:
1. The ‘Location Quotient’ formula has analyzed the spatial variation of concentration ofurban infrastructural facilities.
Location Quotient (L.Q): L.Q= (Xi/Ni)/(X/N)
Where,
Xi=no. of facility in a given ward
Ni=Population of each ward
X= no. of total facilities in the municipality
N=Total population of the municipality.
2. Average Ward-Wise Composite Score: (After Paul and Dasgupta)
F.C.I. (Facility Composite Indicator)
{(Facility percentage in wards / ward population) ×10000} ÷
{(Facility percentage in municipality/total population) ×10000}
M.C.I. (Municipality Composite Score) = “ (F.C.I.1 + F.C.I.2 + F.C.I.3 + ……. F. C. I .n)
A.W.C.S. (Average Ward-Wise Composite Score): MCI / Total Number of Facility
Results and DiscussionIn the present paper, the level of concentration of facilities has been calculated in terms of the
population size of each ward. Here to calculate the location quotient of different facilities, all the 35facility indicators has been classified into four broad categories such as a bank, credit institutes,ATM, etc. have been kept under Financial Facilities category. In the same way primary, secondary,higher secondary, colleges and universities have been held under the Educational Facilities category.Hospital, Nursing Home, etc. have been kept under the category of Health Facility. Rest of thefacilities like market, hotels, post office, bus stand, rail station, playground, drinking water supply

68 INDIAN JOURNAL OF LANDSCAPE SYSTEMS AND ECOLOGICAL STUDIES VOL. 42
lighting, etc. have been indicated as Other Facility. For the calculation of L. Q values the differenttype of facility concentration zones has been selected (Table -1).
Table 1: Average Ward –wise Composite Score of Facility Services in Berhampore Town
Ward No. Status of Status of Status of Status of Total AverageEducational Health Economic Other Score of Ward–wise
Infrastructure Infrastructure Infrastructure Infrastructure Facility- CompositeFacilities Facilities Facilities Facilities Utility Score
WARD 1 1.72 0.00 0.00 2.80 4.52 0.1291
WARD 2 8.52 3.24 3.37 0.00 15.13 0.4323
WARD 3 1.63 4.37 2.27 3.16 11.43 0.3266
WARD 4 1.15 10.525 0.59 0.00 12.265 0.3504
WARD 5 0.91 14.57 1.87 11.14 28.49 0.8140
WARD 6 1.29 7.32 2.64 2.98 14.23 0.4057
WARD 7 2.22 4.46 0.76 10.6 18.04 0.5154
WARD 8 1.90 0.00 0.00 0.00 1.90 0.0542
WARD 9 9.94 23.66 27.51 22.80 83.91 2.3974
WARD 10 1.06 0.00 1.09 5.27 7.42 0.2120
WARD 11 10.33 14.8 0.95 0.00 26.08 0.7451
WARD 12 1.78 18.78 6.52 23.49 50.57 1.4448
WARD 13 0.96 10.84 9.67 2.86 24.33 0.6951
WARD 14 0.49 12.42 1.94 6.11 20.96 0.5988
WARD 15 5.76 3.39 1.48 0.00 10.63 0.3037
WARD 16 2.18 6.38 5.24 4.04 17.84 0.5097
WARD 17 3.14 8.42 13.5 3.70 28.76 0.8277
WARD 18 2.43 0.00 0.00 0.00 2.43 0.0694
WARD 19 1.22 0.00 7.68 1.59 10.49 0.2997
WARD 20 1.14 1.78 0.39 1.00 4.31 0.1231
WARD 21 3.76 0.00 0.00 1.66 5.42 0.1548
WARD 22 4.38 0.00 0.82 5.30 10.50 0.3000
WARD 23 3.57 7.42 0.00 0.00 10.99 0.2354
WARD 24 2.36 0.00 0.53 5.35 8.24 0.2354
WARD 25 1.88 2.08 0.46 1.17 5.59 0.1597
Source: Calculated by the Authors based on the data from Department of Urban Planning, BerhamporeMunicipality, 2018

NO. 2 SPATIAL CONCENTRATION OF URBAN INFRASTRUCTURAL FACILITIES 69
Educational FacilitiesIn Berhampore town there are many educational institutions for primary to graduate level
studies. There are seen 42 primary schools, the no. of high school (Secondary and higher secondarySchool) is 19, among them one is special education school and six colleges including one girl’scollege and one B.Ed. College. But there has no university though it is the headquarters of thedistrict. However, the spatial concentration of education facilities (Table 2) in the concerned town isproved that very high concentration of education is seen in wards such as 2, 9, 11, 15 and 22. Here,Deficient concentrations are stretched in Ward No.5, 13 and 14. (Figure 2)
Table 2: Spatial Concentration of Educational Facilities
Spatial Concentration Zone L.Q. Values Ward No.
Very High Above 4.00 2,9,11,15, 22
High 3.00-4.00 17, 21, 23
Moderate 2.00-3.00 7,16,18,24
Low 1.00-2.00 1,3,4,,6,8,10,12,19,20,25
Very Low Below 1.00 5,13,14
Source: Data calculated by the authors, 2018
Health FacilitiesHealth is the most crucial indicator of human development as well as enriches urban well-
being. In the study area, there are six hospitals out of it one is Murshidabad Medical CollegeHospital, and three government hospitals are also found there. One mental hospital is there in wardno. 14. In the town, there are 16 nursing homes as well as many diagnostic centers. BerhamporeMunicipality controls and runs eight primary health centers for free treatment of slum dwellers.(Table 3)
Table 3 Spatial Concentration of Health Facilities
Spatial Concentration Zone L.Q. Values Ward No.
Very High Above 8.00 4,5,9,11,12,13,14
High 6.00-8.00 6,17,23
Moderate 4.00-6.00 3,7,16
Low 2.00-4.00 2,15,25
Very Low Below 2.00 1,8,10,18,19,20,21,22,24
Source: Data calculated by the authors, 2018

70 INDIAN JOURNAL OF LANDSCAPE SYSTEMS AND ECOLOGICAL STUDIES VOL. 42
Fig.
2: S
patia
l Con
cent
ratio
n of
Edu
catio
nal F
acili
ties
Fig.
3: S
patia
l Con
cent
ratio
n of
Hea
lth F
acili
ties

NO. 2 SPATIAL CONCENTRATION OF URBAN INFRASTRUCTURAL FACILITIES 71
In terms of spatial concentration of health facilities in town is observed that very highconcentration of health is Ward No. 4, 5, 9, 11, 12, 13 and 14 as this is the heart of the town andCBD zone of the study area. Low concentration is seen in Ward No.1, 8, 10, 18, 19, 20, 21, 22 and 24.Many wards belong to low health facilities in the town. Remaining Wards are including moderatingin condition. (Fig. 3)
Economic FacilitiesEconomic facilities are a crucial variable which mentions the nature of financial setup in the
town. Hence, facilities also meet up the regular finance needs of the local people and differentcommercial sectors. So for the economic growth are mostly depending on these institutions. In thestudy area, 11 private banks, ten national banks, 41 ATM, two corporation banks and two creditinstitutions are privileged throughout the town. (Figure 4) Inwards such as 5, 7, 9, 10, 12, 14, 22, 24are seen with a very high concentration of financial setup. Among them, CBD ward nine is arrayedwith all types of financial institutions. The very low concentrations of various economic facilitiesare instructed in the wards 2, 4, 8, 11, 15, 18, 20 and 23. The owing wards in town are liked asmoderate in facilities concentrations (Table 4).
Table 4: Spatial Concentration of Economic Facilities
Spatial Concentration Zone L.Q. Values Ward No.
Very High Above 4.00 9,12,13,16,17,19
High 3.00-4.00 2
Moderate 2.00-3.00 3,6
Low 1.00-2.00 5,10,14,15
Very Low Below 1.00 1,4,7,8,11,18,20,21,22,23,24,25
Source: Data calculated by the authors, 2018
Other Infrastructural FacilitiesThe total 16 indicators are grouped under other infrastructural facilities. (Figure 5) Police
Station, Bus stand, Rail station, Post office, Water connection, Public urinals, Cinema hall, playground,club, hotel, petrol pump, cold storage, market, burning ghat, street light all are determined for thepresent study. In town Clubs are 16, hotels are 21, Petrol pumps are 2, cold storage is 1, BurningGhats are 2, the burial ground is 1 and 14 markets are seen there. Very high concentrations facilitiesare observed in the wards such as 5, 7, 9, 10, 12, 14, 22 and 24. Besides, many wards, i.e., 2, 4, 8, 11,15, 18, 20 and 23 are including to shallow type of facilities in the concern study area. Other than,remaining wards are selected as moderate concentration for infrastructural facilities. (Table 5)

72 INDIAN JOURNAL OF LANDSCAPE SYSTEMS AND ECOLOGICAL STUDIES VOL. 42
Table 5: Spatial Concentration of Other Infrastructural Facilities
Spatial Concentration Zone L.Q. Values Ward No.
Very High Above 4.00 5,7,9,10,12,14,22,24
High 3.00-4.00 3,16,17
Moderate 2.00-3.00 1,6,13
Low 1.00-2.00 19,21,25
Very Low Below 1.00 2,4,8,11,15,18,20,23
Source: Data calculated by the authors, 2018
Average Ward-Wise Composite ScoreIn the present study, four critical variables have been selected which are educational facilities,
health facilities, commercial facilities and other infrastructural facilities for measurement the averageward-wise composite score of Municipality. From the calculation by spatial concentration (Table 6)of Municipality Composite Index (MCI), it has been very much identified that very high concentrationis seen inward no.5, 9, 12 and 17. All types of facilities are located in these wards in the town.Besides, very low concentration is found in wards 1, 8, 18, 20, 24 and 25. Remaining wards belongto a moderate class of concentration. (Figure 6)
Table 6 Spatial Concentration of Average Ward Wise Composite Score
Spatial Concentration Zone L.Q. Values Ward No.
Very High Above 0.80 5,9,12,17
High 0.60-0.80 11,13
Moderate 0.40-0.60 2,6,7,14,16
Low 0.20-0.40 3,4,10,15,19,22,23,24
Very Low Below 0.20 1,8,18,20,24,25
Source: Data calculated by the authors, 2018
Conclusion and Recommendations In this study of urban infrastructural facilities, the unequal distribution of infrastructure is
seen throughout the town. A high concentration of urban infrastructure facility is found in outskirtsof CBD region followed by the surrounding wards of the municipality. The periphery regions areidentified as moderate to a low level in terms of institutional concentration. There are four collegesin the study area but it does not have a single university for higher education. There is one medicalcollege and hospital in the town, but it lack in terms of the availability of primary health centers

NO. 2 SPATIAL CONCENTRATION OF URBAN INFRASTRUCTURAL FACILITIES 73
Fig.
4: S
patia
l Con
cent
ratio
n of
Eco
nom
ic F
acili
ties
Fig.
5: S
patia
l Con
cent
ratio
n of
Oth
er I
nfra
stru
ctur
al F
acili
ties

74 INDIAN JOURNAL OF LANDSCAPE SYSTEMS AND ECOLOGICAL STUDIES VOL. 42
Fig. 6 : Spatial Concentration of Average Ward-wise Composite Score of Infrastructural Facilities in BerhamporeTown
Source: Department of Urban Planning, Berhampore Municipality, 2017

NO. 2 SPATIAL CONCENTRATION OF URBAN INFRASTRUCTURAL FACILITIES 75
within the town. In the study area, it is also identified that the economic facilities in the central partof the city are highly concentrated than the remaining portion of the town. Increasing the distance,decreasing the facilities in the study area is experienced. Many Harijan bastees or slums are alsoseen in the town. The wards dominated by slum people are deprived of the basic civic facilities intown. For up-gradation of many infrastructural facilities, some recommendations have to beimplemented in the concerned town. The Government should establish a university for theenhancement of higher education among people of Berhampore town as well as in Murshidabaddistrict. The number of primary health centers has to be increased in town. Many people of theMurshidabad district still depend on Berhampore town for various purposes like educational purpose.The Urban Local Bodies (ULB) should increase the facilities for education, health, economic activitiesand others in the town. Schemes related to infrastructural facilities have to be implemented toexpand the level of various infrastructural facilities in the town.
ReferencesAgarwal, S. (2009). Urban Health in India: A Case Study. India: Urban Health Resource Centre.Allen, N. (2015). Understanding the importance of Urban Amenities: A Case Study from Aukland. Buildings,
05, 85-99. doi:10.3390/buildings5010085Borana, S.L. & Yadav, S.K. (2017). Spatial Distribution disparity analysis of Urban Amenities in Municipal
Wards Periphery of Jodhpur City. International Journal of Engineering Development and Research,5(4), 474-482.
Census of India. (2011). District Census Handbook. Murshidabad.Census of India. (2011). Population Data of Berhampore Town. New Delhi: GOI.Chopra, G. (2006). Urban Geography. New Delhi: Commonwealth Publishers.Comprehensive Capacity Building Programme. (2015). GIS-based Utility Mapping. New Delhi: Ministry of
Urban Development, Government of India.Dhaliwal, S. (2008). Urban Infrastructure Development in Small and Medium Towns. New Delhi: Deep and
Deep Publication Pvt. Ltd., New Delhi.Eidgenossenschaft, S., et al. (2018). Urban Infrastructure and Utilities. Switzerland and South Africa.FICCI Urban Infrastructure Committee. (2011). Urban Infrastructure in India. New Delhi.Halder, S. (2014). Assessment status of amenities and service delivery in class-I town in India ( Case study
of Berhampore Town, Murshidabad). Journal of Geography and Regional Planning, 07(07), 140-149.
Kolawole, B., et al. (2015). The effects of Urban Infrastructural development on Property Value in AbeokutaMetropolis, Nigeria. Merit Research Journal of Arts, Social Science and Humanities, 03(03), 35-40.
Machado, A., et. al. (2013). Urban Amenities and the Development of Creative Clusters: The Case of Brazil.Current Urban Studies, 1(4), 92-101.
Ministry of Urban Development in India. (2018). Improving Lives: Urban Infrastructure- Make in India.New Delhi: Government of India.
Montgomery, E. (2008). Infrastructure in India: A vast land of construction Opportunity. New Delhi:PricewaterhouseCoopers.

76 INDIAN JOURNAL OF LANDSCAPE SYSTEMS AND ECOLOGICAL STUDIES VOL. 42
Nagendra, S.& Suresh, M. (2010). An Economic analysis of urban water Supply and Sanitary Services. NewDelhi: Mohit Publication.
National Informatics Centre (NIC). (n.d.). General Information of Berhampore and Krishnanagar Town. NewDelhi: Government of India.
Paul, S., Dasgupta, A. (2008). Urban Facility-Utility Mapping on Krishnagar Municipality; An appraisal ofWard-Wise Infrastructure Development, Indian Journal of Landscape Systems and Ecological Studies.31(2), 91-98.
Prajapati, B., et al. (2011). A Study on Availability of Basic Civic Facilities in Urban Slum Area of BhujGujrat, India. National Journal of Community Medicine, 2(3), 383-387.
Raghavendra and Hans, V. (2012). Infrastructural Challenges of Urbanization. Ideas and Ideologies Internationale-Journal of Humanities and Social Sciences, 02(05), 1-19.
Rahaman, M. (2018). Demographic Structure and Educational Status of Slum Population in KalyaniMunicipality, West Bengal. The Research Journal of Social Sciences, 9(10), 146-152.
Rahaman, M. and Siddique, N.A. (2019). A Study of Educational Facilities in Berhampore Town, WestBengal. In Environment and Social Development (pp. 199-205). New Delhi: Keystone PublishingHouse. Retrieved April 2019
Rahaman, M. and Siddiqui, N.A. (2018). An Analysis of Health Infrastructural Facilities in Krishnagar MunicipalArea, West Bengal. In Demographic Structure and Social Development (pp. 284-291). New Delhi:A.K. Publications.
Risova, K. and Pous, R. (2018). Urban Facilities in the Quality of Life Research: A Case Study BanskaBystrica City (Central Slovakia). Geographical Journal, 70(02), 99-116.
Ristea, L.A., et al. (2010). Commercial Facilities and Urban Regeneration. Commerece Contribution toSustainable Development, 12(27), 99-114.
Rodrigues, D., et al. (2016). A Spatial Multicriteria Model for Urban Accessibility Mapping. In D. o. Engineering(Ed.), ICE Proceedings. 169, pp. 91-103. ICE Publishing. doi:10.1680/udap.15.00014
Sharma, R.N. and Sandhu, R.S. (2013). Small Cities and Towns in Global Era- Emerging Changes andPerspectives. New Delhi: Rawat Publications.
Singh, R.B., et al. (2015). Drinking Water, Sanitation and Health in Kolkata Metropolitan City: ContributionTowards Urban Sustainability. Geography, Environment, Sustainability, 04(08), 64-81.
Received : 19 August, 2019Revised : 26 November 2019

NO. 2 SOCIAL INCLUSION OF MUNDA TRIBE OF A PART OF SUNDARBAN REGION 77
Social inclusion of Munda Tribe of a part of SundarbanRegion in West Bengal
Ranajit Sardar1* and Sukla Basu2
Abstract : Culture and society are always dynamic in nature thanks to exposure, invention, experimentationand change in the surrounding environment of the people. Tribal societies in India are also no exception. TheCase study on the Munda Tribe is focussed in the context of social inclusion through three different dimensions:social, political, and economical. Traditionally tribal societies were self-sufficient: they did not feel it essentialto interact with mainstream society for their social, cultural and physical existence. This very nature of tribalpeople kept themselves away from the rest of the society. The intervention policies particularly through educationhas provoked them to penetrate the mainstream culturally (example of inter-cultural marriages being on therise) through assimilation process, economically through employment in government sectors and politically byactive participation. The Sundarban Region is the study area with focus on blocks of Hingalganj andSandeshkhali-I of North 24 Parganas district of West Bengal. Primary data was collected through FocusGroup Discussion (FGD) and House Hold Survey (HHS) and Secondary data based on Census of 2001 and2011: both qualitative and quantitative methods have been applied. This tribe has been purposely chosen as itis the dominant one population wise. Now Mundas are educated and better off economically; they are workingin different Government and Non-Government sectors. They are actively participating in social organizationsfor furthering improvement in their society. They are commanding in political governance at local levelthrough active participation. Social inclusion is increasing and at the same time exclusion is decreasingthrough such processes as revealed from the analysis of the data.
Keywords : Mundas, Social Inclusion, Intervention Policies
Introduction‘Social inclusion’ and ‘social exclusion’ are terms most widely used by politicians, social
scientists and even the public. The term ‘social inclusion’ originated in French social policy in the1970s. It came into play in the 1980s’ economic crisis (Benn 2000:310) when state sponsoredrepublican tradition of solidarity was in vogue (Bhalla and Lapeyre 1997:414) and by the 1990’s theterm was theorized by scholars one among them being Luhmman who clarified the concept ofinclusion being achieved individually (Luhmman 1990: 34) through access to the benefits and
1. Assistant Professor in Geography, Acharya Prafulla Chandra College,West Bengal.2. Associate Professor in Geography, West Bengal State University, Barasat, West Bengal.*corresponding author: email- [email protected]
Ind. J. of Landscape Systems and Ecological Studies 42 (2) December - 2019, 77- 88 ISSN 0971-4170

78 INDIAN JOURNAL OF LANDSCAPE SYSTEMS AND ECOLOGICAL STUDIES VOL. 42
dependence of individual modes of living on them. The World Bank Group (2014) (https://www.worldbank.org) defined Social Inclusion as:
1. The process of improving the terms for individuals and groups to take part in society.
2. The process of improving the ability, opportunity and dignity of those disadvantaged onthe basis of their identity to take part in society.
Different countries have different social structures, some more diverse than others. Culturaldiversity in India is much more calling for a myriad of policy interventions. The Mundas of Indialive in the states of Bihar, Jharkhand, Chhattisgarh, Madhya Pradesh, Odisha, Assam and Tripura.They were originally inhabitants of North Western India who later moved to Chotanagpur plateauof Bihar and then to Sundarban Region and settled thereafter clearing the forests in West Bengal;they are also known as Manki, distributed in the districts of Medinipur, Purulia, West Dinajpur,Darjeeling, Jalpaiguri, and especially in North and South 24 Parganas of Sundarban Region.
Article 366 (25) of the Constitution of India refers to Scheduled Tribes (STs) as thosecommunities, who are scheduled in accordance with Article 342 of the Constitution. The essentialcharacteristics, first laid down by the Lokur Committee(1965), for a community to be identified asScheduled Tribes are – (i) indications of primitive traits; (ii)distinctive culture; (iii)shyness ofcontact with the community at large; (iv) geographical isolation; and (v)backwardness. All thesetraits of Social exclusion were seen among the Mundas too. Different constitutional safeguardsare: (i) the right to representation, in proportion to their population in the Union and the StateAssemblies, ministries and local bodies; (ii)the right to representation, in proportion to theirpopulation, in the various public services under the centre and the state and all other localauthorities;(iii) the special responsibility of the state to provide funds for higher education in thecountry and also abroad for members of these communities; and (iv) appointment of a specialofficer to keep a watch over the status of the safeguards enumerated above (Saksena, 1981).Mention must be made of Dr. B. R. Ambedkar who played an important role in the cause of theScheduled Tribes in India towards social inclusion.
Conceptual BackgroundSocial inclusion is the process of improving the terms on which individual and groups take
part in a society – improving the ability, opportunity and dignity of those disadvantaged on thebasis of their identity. The vision of inclusive growth, poverty reduction and bridging the gaps insociety can only be achieved if there is significant improvement in the quality of governance. TheIntervention Approach includes: electoral interventions, legal empowerment; budget; information;communication technology (i.e. technology interventions); natural resource management,interventions in the sphere of service delivery, etc. Electoral interventions include building newdemocratic spaces for citizen engagement, empowering local voices, civic culture, avoiding elitecapture (i.e., manipulation by political elites), positive attitude towards government, social cohesion(transforming state-society relationship is a long term process).Through the 73rd &74th Constitutional

NO. 2 SOCIAL INCLUSION OF MUNDA TRIBE OF A PART OF SUNDARBAN REGION 79
Amendment Acts establishment of elected institutions of local self-government, representatives ofthe weaker sections have taken place. The success however, depends on involvement of theserepresentatives in planning, implementing and supervising the delivery of these essential publicservices. Development aims at creating a suitable and enabling environment for promoting long,healthy and creative lives. Governance, in any society, aims to ensure this through the exercise ofeconomic, political and administrative authority (http://www.phileconsociety.org). Democracy,development and governance are interrelated goals.
‘Ronald Labonte et al (2011) have worked on social inclusion/exclusion. They have takenvarious domains and their indicators regarding conceptual framework of social inclusion andexclusion. We adopted this concept and applied it in this research paper in the following way.
Fig. 1: Conceptual Framework of Social Inclusion/ExclusionSource: Labonte. R et al.2011.
Research Question Formulation: As the tribal people in general and the Mundas in particularhave been deprived socially, politically and economically in the past, the focus is on two definiteproblems:
1. To know about the inclusion status of the Mundas.
2. To study the implications with respect to inclusion

80 INDIAN JOURNAL OF LANDSCAPE SYSTEMS AND ECOLOGICAL STUDIES VOL. 42
To look into these questions the techniques of multiple method of researching has beenadopted:
MethodologyA systematic approach to synthesize evidence based on social inclusion indicators has been
adopted. Our search strategy incorporated elements of qualitative systematic reviews. Such reviewsutilize findings from studies that do not necessarily meet the normal inclusion criteria for quantitativestudies. Hence quantitative methods have been also used based on domains and indicators ofsocial inclusion after Atkinson et al (2002). MINITAB.14 Version software has been used to justifythe nature of inclusion through Social, Political and Economic domains (after Labonte. et al. 2011).The Social Indicators are social resources, community resources, skill, housing and personal prestige/safety. The Economic Indicators are employment, income and independence of using it, whilePolitical Indicators incorporated freedom of movement, economic stability, decision making powerand participation in society’s activities. Primary data was collected using the method of FocusGroup Discussion (FGD) the group consisting of members belonging to different ages, differentoccupations and both male and female section of the target population. We have taken eightvillages; each with fifty members in one focus group, so total target population was 400.Thesecondary data was collected from the Census (2001 and 2011).
The Study AreaTo answer the research queries for fulfilling the objectives the study area was finalized and
intensively field study was done on two community development blocks (Hingalganj andSandeshkhali-I ) of North 24 Parganas district of West Bengal comprising eight villages (Rupamari,Kothabari, Bishpur, Durgapu Bailani, and Dakshin Akhratala, Kalinagar, Bounia Abad, BoyarmariAbad). These villages have been purposely selected based on accessibility and demographycharacteristics. Both these blocks are reserved for Scheduled Tribes and/ Scheduled Castes in theAssembly constituency [always for ST in Sandeshkhali-I which has 25.94% (42,674) as tribalpopulation] while Hingalganj ST/SC [as per population criteria has 7.30% (12,743) tribal populationto total population in 2011]. Among the plain districts maximum concentration of tribes are found inboth North 24 Parganas and South 24 Parganas according to 2011 Census. It is noticed that tribalpeople of Sundarban Region has developed quite fast and that rapid change in their culturalcustom in terms of social inclusion is more than that which has happened in North Bengal andplateau region of West Bengal. In this regard the Sundarban Region has been chosen as the studyarea.
Result and Discussion
Social Inclusion of Munda TribeSocial inclusion is the process by which people can enter the mainstream of our civic society
while social exclusion describes a state in which individuals are unable to participate in social,economic, political, and cultural activities at a level considered to be normally acceptable. It is abroader concept than poverty, encompassing some characterizations of alienation and distance

NO. 2 SOCIAL INCLUSION OF MUNDA TRIBE OF A PART OF SUNDARBAN REGION 81
from mainstream society. To gauge into the state of this social inclusion/exclusion of the Mundasstudy on the different schemes and strategies adopted and implemented was done which includedthe Tribal Sub Plan (TSP) Strategy implemented since 1974-75. It is a multi-pronged strategy whichincludes support for education, health, sanitation, water supply, livelihood etc., and the state ofWest Bengal is covered under it.
The tribal groups are at different stages of social, economic and educational development andto gauge the development of the Mundas we have taken specific social indicators of social resource,community resource and skill. On the basis of the FGD only a very few aged (> 59years) peoplehave entered the mainstream of the society; within the young age groups of 15 to 59years it is moreand it is growing. This young age group is now raising voice in favour of social inclusion. Skill isthe main pillar to promote or provoke in individuals as social resources or community resources as
Table: 1 Questions related to tribal inclusion: Domain and sub-domain
Domains Sub-Domains or Indicators Sub-Domain related Questions
Social Literacy Are you literate?How far have you read?
Social Resources, Community Do you think you are a resource inResources your society?
Are you participating in any communitywork?
Skill Are you computer trained?
Housing Do you a own house?Is your house constructed by own ?Finance or other financial support.
Personal Prestige/Safety Do you feel any problem regardingpersonal safety and security?
Economic Employment Are you a government employee?Are you self dependent?
Income Is the source regular in nature?
Political Participation in politics. Do you participate in local Gram Sabhameetings?Do you participate in local and assemblypolitical meeting?Do you participate in legislative politics?Do you participate in Parliamentarypolitics?

82 INDIAN JOURNAL OF LANDSCAPE SYSTEMS AND ECOLOGICAL STUDIES VOL. 42
a whole, because when individuals are coalesced with each other they turn into a big social as wellas community resource. Literacy rate leads to develop the skill of people and skill is one of theindicators of social inclusion domain. Literacy rate of the Mundas is quite high in both blocks.According to 2001 and 2011 Census literacy rate of blocks of Sandeshkhali-I and Hingalganj are61.67% and 64.70% respectively, the corresponding all India and West Bengal figures beingrespectively47.10% and 43.40% for 2001 and 58.95% and 57.93% in 2011 . Male and female literacyrate of Sandeshkhali-I are 70.53% and 52.57% respectively while that of Hingalganj are 74.99% and54.28% respectively. Hence literacy is now increasing. Therefore, with the educational skill andknowledge gained the Mundas are uplifting.
Regarding social security, Government of India has launched several Social Security Schemessuch as Pradhan Mantri Suraksha Bima Yojana (PMSBY), Pradhan Mantri Jivan Jyoti Bima Yojana(PMJJBY), Pradhan Mantri Kaushal Vikash Yojana, Pradhan Mantri Jana Dhan Yojana and AtalPension Yojana (APY), etc.
The Department of Housing, Government of West Bengal launched Akanksha, Gitanjali, AmarGriha besides the Central Government’s venture of schemes implemented on the basis of monthlyincome of the family in rupees : (i) Economically weaker section (EWS) income up to 10, 000, (ii)Lowincome group (LIG) income between 10,001 to 15, 000, (iii)Middle income group lower (MIG-L) inbetween 15001 to 25000, Middle income group upper (MIG-U) in between 25000 to 40000 and(iv)High income group (HIG) with income of 40000 and above. As per field survey and FGD,housing pattern has changed. One third (30%) of houses are pacca and rest are normal i.e. (mud)kuccha. Of the 30% of pacca houses, two thirds are constructed based on funds from PradhanMantri Awas Yojana (PMAY) and rest with their own financial support.
Housing pattern is one of the indicators of social inclusion. The Gram Panchayet data reflectsthat housing pattern is transforming to pucca one gradually; hence the physical quality of life isalso being raised. In all the studied villages falling within the two blocks only about 5% householdshave got the opportunity. Rupamari village of Hingalganj block has got more benefit from bothcentral and state housing scheme (10% households) due to priority of Panchyat Pradhan comparedto the other villages. Similar is the case of Bayarmari Abad village of Sandeshkhali-I block (10% to12% households) according to Gram Panchayat’s information. Through the Block and GramPanchayat information, housing related beneficiaries from both government schemes increasedfrom 3% in 2015-16 to 20 -25% households in 2018-19. Hence the Mundas here are entering graduallyinto the normal societies in terms of housing: however the share of benefit is low which testifiesthat still social exclusion prevails. Regarding personal prestige with regard to the practice ofuntouchability or using abusive words, the mainstream society is now cordial there was nodiscrimination felt said the respondents. This is as per their psychological feeling related to theirpersonal safety while interacting in the public arena. This indicates socially included attitude towardsthem.

NO. 2 SOCIAL INCLUSION OF MUNDA TRIBE OF A PART OF SUNDARBAN REGION 83
Data analysisThe secondary data regarding social inclusion indicators are all strongly committed to inclusion.
So also is the primary data collected through household survey. The correlation matrix has beenchosen to prove that the tribal people are penetrating into the main stream society. If p-value is >.05then people are included hence null hypothesis is true as seen in the table (Table-2)
Table: 2 Correlation matrix table for data analysis
Main Domains Indicators p-value
Social inclusion Education 0.227
Skill 0.405
Community resource 0.581
Housing 0.405
Personal safety 0.581
Source: Data compiled from house hold survey.
Earlier tribal people depended on traditional treatment towards their health. But nowadaysthey have changed their medical treatment procedure due to change in medical technology andspread of awareness. About 90% of the sample of our tribal people preferred allopathic treatment,8% Homeopathic and only 2% are still depending on tradition medicine.
Economic Inclusion of Munda TribeEconomic Inclusion is the process by which people can participate in the common economic
sector. India has recently instituted laws and schemes to support the ability of the most vulnerableto access their rights (Mehta et al 2011). These include the 2005 National Rural EmploymentGuarantee Act (now known as the Mahatma Gandhi National Rural Employment Guarantee Act-MGNREGA), which obliges the state to guarantee hundred days paid employment each year tochronically poor rural households while providing sustainable infrastructure to rural areas. Some ofthe most important programmes relevant to employment and food security are the Targeted PublicDistribution System (TPDS), the Integrated Child Development Service (ICDS) Programme, theAntyodaya Anna Yojana (AAY) and the Annapurna Scheme; Mid-day meal (MDM) programme andthe National Old Age Pension Scheme (NOAPS).The provision of food subsidy is through AntyodayaAnna Yojana (AAY). The launching of National Rural Livelihood Mission (NRLM) in 2011 needsalso to be mentioned as it has an impact.
Another Financial Inclusion Programme is Stand-Up India Scheme(15th August, 2015) by whichpeople can get Bank loan between Rs 10 lakhs to Rs 1 Crore and at least one ST person can getloan from one branch in their locality. In case of Non-Individual enterprises at least 51% ofshareholding and controlling stake should be held by either an SC/ST or women entrepreneur.Pradhan Mantri Jan Dhan Yojana(2014), Pradhan Mantri Mudra Yojana (2015) etc are the important

84 INDIAN JOURNAL OF LANDSCAPE SYSTEMS AND ECOLOGICAL STUDIES VOL. 42
Economic inclusion schemes in our country. Pradhan Mantri Fasal Bima Yojana (2016) has beenintroduced for development of agriculture production. In this scheme, Government of India issupporting sustainable production in agricultural sector by providing financial support to farmerssuffering from crop loss/damages arising out of unforeseen events and stabilizing the income offarmers to ensure their continuance in farming. About 20-25% tribal households achieved thisopportunity.
The Department of Information and Cultural Affairs of West Bengal (2015) have launched ascheme (Folk Artist) for tribal people. They have made a group and each Folk artist group shouldhave a minimum of 11 and maximum of 15 members. The male and female ratio of these groups is 2:3.In these groups, each member should be a tribe. They are performing their dance in variousgovernmental programme and other programmes. They are getting remuneration per month of Rs3500 per member for their performance. In this regard, women work participation rate is greater thanmen. These dance groups also promote the tourism in Sundarban Region. They are also nowearning the money from the public tourism sector. It is a good example of economic inclusion ofMunda tribe of Sundarban Region.
About 5% people are engaged in Government service and 15% people are engaged in Non-Governmental Service. Rest 20% people are self-employees (self help group and shop owners) and60% people directly or indirectly are working in agricultural field. Therefore, it is clear that economicinclusion is growing in different sectors. Government service is increasing slowly among Mundatribes but NGOs and Self-Employment is increasing at a faster rate compared to Government Sectors.
Primary data from HHS has proved that tribal people are being included through governmentalinterventions. With help of the binary logistic model established the financial inclusion of tribalpeople is shown in Table 3 where all three indicators are positively associated with economicinclusion.
Table: 3 Binary logistic regression models for economic inclusion
Economic inclusion *Odds ratio (95% *CI) *P
Indicators
Government Employee 2.310 1.04-5.15 .041
Self-dependent 4.670 2.36-9.25 .011
Income 8.979 2.31-8.25 .012
Source: Compiled based on sample data {*OR: odds ratio, *CI: Confidence interval}, *P- Hypothesis null or alternative.
Political Inclusion of Munda TribePolitical participation includes a broad range of activities through which people develop and
express their opinions on the world and how it is governed, and tries to take a part in and shape the

NO. 2 SOCIAL INCLUSION OF MUNDA TRIBE OF A PART OF SUNDARBAN REGION 85
decisions that affect their lives. These activities range from developing thinking on various socialissues at the individual or family level, and campaigning at the local, regional or national level, tothe process of formal politics, such as voting, joining political party, or contesting in elections.
Political inclusion is the capability of all citizens to participate in making collective decisionsabout any matter that effect their life. Political right includes right to speak, assemble, vote, holdoffice. More basic right to the rule of law (to be safe from state violence and crime, to move aboutor to occupy public space) are broadly inclusive. Politically inclusive development should improvegovernance; bad governance certainly impedes development (Kurtz and Shrank 2007). It has beenseen that women turnout during India’s parliamentary general elections was 65.63% compared to67.09% turnout for men. India,s rank is 20th from the bottom in terms of representation of women inParliament. As per the Government of India reservation rule 8.1% of tribes have entered India’sPolitics. Both Male and female candidate are fully absorbed. In Hingalgunj block, 12 male and 16female candidates were elected also in Sandeshkhali Block, 12 male and 16 female candidates werealso elected through Panchyat election in 2017.Sukumar Mahato was elected as a member oflegislative assembly (MLA) in Sandeshkhali-I block in 2016.
Therefore, if tribal people are socially and economically strong; there is no doubt concerningtheir political involvement. We explored how tribes directly or indirectly are involved into thepolitical empowerment by taking variables of i) Freedom of free movement ii) Economic securityand stability iii) Support by family/freedom from domination iv) Decision making in daily life and v)Participation in society activities.
Logistic regression analysis through Binary Logistic Regression Model
Table 3: Dimension of empowerment associated with political inclusion
Political involvement of tribal people
Independent variables OR* (95 % *CI) P
Dimension of tribal empowerment
Freedom of free movement 4.18 (1.42-12.31) 0.009
Economic security and stability 8.98 (1.52 53.20) 0.016
Support by family/freedom from 0.59 (0.12 3.03) 0.529
domination 15.45 (4.54 52.55) 0.001
Decision making in daily life 7.73 (1.52 39.38) 0.014
Participation in society’s activities 7.73 (1.52 39.38) 0.014
Source: Compiled based on sample data {*OR: odds ratio, *CI: Confidence interval}

86 INDIAN JOURNAL OF LANDSCAPE SYSTEMS AND ECOLOGICAL STUDIES VOL. 42
Table 3 show the binary logistic regression analysis on empowerment associated with politicalinvolvement (independent variable) with four control variables. The two factors that were significantlyassociated with the political participation are (i) Decision making power in daily life and (ii) economicstability .Both are highly associated with the political participation and directly correlated with theobjective. The former is more than the latter. Participation in society’s activities is also positive andsignificantly associated with the political command. Women who are not able to get support fromthe family and do not have freedom of movement are less associated with political participation.Sixty Five women participants (16.25%) answered that they are politically attached at the local level.One is the Upa Pradhan (Susmita Sardar) in Bailani Gram Panchayat and her husband is secretary ofLocal committee in ruling party (TMC). Sanatan Sardar is the Panchayet Pradhan of Rupamari GramPanchayet of the same party. Although this percentage is very low but it is symbol of politicalwomen empowerment or political inclusion and at the same time they are participating in communityactivities (39.68%) and are aware of community activities (44.97%). Awareness of community activitiessuch as “Birsa Munda Birth Day”, celebration of “Hull Dwibas” etc.; are the efforts to keep alivetheir identity in the main stream society.
ConclusionWe know that society is not static; it is always changeable. The tribal culture and their society
is no exception. Changes of tribal culture will happen through social inclusion process. Discussionof social inclusion relates citizenship debates, particularly in terms of dichotomy betweenindividualism and collectivism. Walker and Walker (1997: 8) mentioned of the dynamic process ofbeing shut out from any of the social, economic, political and cultural systems which determine thesocial integration of a person in society. We have studied three basic dimension (Social, Economicand Political) and also related indicators about tribal people. There are more changes: the extent andintensity of such changes primarily depends on a society’s need-based integrity to its culturalcomponents and way of life. Accepting new culture and changing surrounding environment; tribalpeople are changing their society. With the positive discrimination at present, they are experiencingdetribalization and identity crisis. However this issue has not been dealt with in this paper.
The Indian village community is changing rapidly with the advent of participatory politics.Participation has been identified as the most important element in development programmes.Participation may extend to the involvement of beneficiaries in information sharing, consultation,decision making, initiating action in the programme activities, etc. It fosters individual and communityempowerment, overall economic and environmental benefits, greater target population outreach,improvement in access to resources, improvement in management and organizational skills,strengthening local organizations. Equity & inclusiveness is crucial for the most vulnerable andmarginalized sections of the society to have the opportunities of well-being along with the mainstreamsociety (Basu, 2014). This is particularly so in the service delivery with a positive impact on uptakeand use of services in the various sectors (e.g; in education the involvement in the management ofthis service has resulted in a greater enrolment rate.)

NO. 2 SOCIAL INCLUSION OF MUNDA TRIBE OF A PART OF SUNDARBAN REGION 87
RecommendationsIt is the bureaucracy which should work effectively as the link between the people and their
representatives. Creation of an orientation of the right type for bureaucracy is vital for the successof any decentralization process. In Panchayati Raj Institution this is crucial (D. Sundar Ram 2007(Ed)as it is the bureaucracy which translates the aspirations of the people into reality(www.developmentfirst.org). Several reports such as the Annual Report of 2014-15 by the TribalWelfare & Development now indicate weakening of institutions specifically meant for delivery ofgoods and services to tribal population i.e. Integrated Tribal Development Agency (ITDA)/IntegratedTribal Development Projects/Tribal Research Institutes (TRI) and other Micro Projects. The politicalintrusion of non-tribal into the tribal authorities made the tribal people vulnerable to socio-economicexploitation. Thus, they adopted the strategy of entering the mainstream society for their survivaland for a better quality of life by accepting jobs, education and non-traditional way of life. Thestudy on domain showcasing that the Mundas have adopted a mainstream way of life is a goodsign. However blending of the traditional and the modern, needs to be local specific and contextspecific.
AcknowledgementWe would like to render our sole thanks to the tribal people those who have always supported
by their answering to our queries. Our sincere thanks go to leaders of FGD group who were thepioneer informants for giving important information from their own inclusion or exclusion perception.
ReferencesAnnual Report of 2014-15: The Tribal Welfare & DevelopmentAtkinson, T., Cantillon, B., Marlier, E. and Nolan, B. (2002): Social indicators: The EU and social inclusion,
Oxford: Oxford University Press.Basu, Sukla(2014) :Delivery Mechanism for Efficient Rural Development in India pp281-300 In Advances in
Extension Education and Rural Development Dasgupta (Ed),Vol II, AgrobiosBenn Melissa 2000. New Labour and Social Exclusion. Political Quarterly, 71(3): 309-318.
Bhalla Ajit, Lapeyre Frédéric 1997. Social Exclusion: Towards an Analytical and Operational Framework.Development and Change, 28: 413-433.
Burchardt Tania, Grand Julian Le, Piachaud David 1999. Social Exclusion in Britain 1991-1995. Social Policyand Administration, 33(3): 227-244.
D. Sundar Ram 2007(Ed): Panchayati Raj Reforms In India, Kanishka Publishers, New Delhi.Department of Information and Cultural Affairs (2015) Government of West Bengal.Kurtz and Shrank 2007. “Growth and Governance: A Defense” The Journal of Politics, 69(2), pp 563-569.Labonte. R et al. 2011.”Indicators of Social Exclusion and Inclusion: A critical and comparative Analysis of the
Literature”- ResearchGate, Working paper volume (2) number 8.Luhman Niklas 1990. Political Theory in the Welfare State. Berlin, New York: Walter de Gruyter.
Mehta et al., 2011. Indian J. Agric. Sci., 81 (8): 717-722

88 INDIAN JOURNAL OF LANDSCAPE SYSTEMS AND ECOLOGICAL STUDIES VOL. 42
Rodgers Gerry 1995. What is special about a social exclusion approach? In: G Rodgers, C Gore, JB Figueredo(Eds.): Social Exclusion: Rhetoric, Reality and Responses. Geneva: International Labour Organisation,pp. 46-47
Planning Commission of India, 11th Five Year Pan (2007-2012), Ch. 1: Inclusive Growth 1 (Planning Commission,Government of India).
Saksena(1981). Retired Honorable Justice of Punjab and Hariyana High Court settled out of Chandigarh,Mohali and Panchkula. (10.10.1994-12.07.1998)
Thakur.S.(2012) “Issue of Social Inclusion and Exclusion of Indian Tribes”-International Journal on Arts,Management and Humanities. Vol-1(1), p14-19, ISSN No-2319-5231.
Walker, A. and Walker, C. (eds) (1997) Britain divided: The growth of social exclusion in the 1980s and 1990s,London: CPAG.
Online materialsThe Constitution (Seventy –Third Amendment) Act,1992. Retrieved from http://indiacode.nic.in/coiweb/
amend/amend73.htm.www.ncbi.nlm.nih.govwww.planningcommission.nic.inwww.phileconsociety.org)www.rural.nic.inwww.sociologyguide.com/socio_inequality_exclusion/social_exclusion.php retrieved on 19.10.2019www.worldbank.org/en/topic/social-inclusion retrieved on 19.10.2019wbtdcc.org (13.02.2020)https://tribal.nic.in Business Standard.com august 09, 2019 Mamata committed.
Received : 20 September, 2019Revised : 09 November, 2019

NO. 2 LANDSCAPE, CULTURE AND CINEMA: A STUDY IN FILM GEOGRAPHY 89
Landscape, Culture and Cinema:A Study in Film Geography
Ravi S. Singh1 and Sweta Singh2
Abstract : Cinema and landscape are cultural entities and thus both are produced as a result of dynamicinteraction of human, nature and environment .It comprises of both tangible and intangible features. Thebeauty of cinematic landscape is that it captures space and time in motion which is artistically created andcontains aesthetics inherently. The spatial and temporal attributes attached to cinematic landscape representation;act as a stimulus for geographic enquiry, which has not found place in mainstream professional geography,particularly in countries like India. Cinematic landscape representation and interpretation is mediated by one'sattitude, perception and culture. This article is an attempt at critical examination of cinematic landscaperepresentation and the role played by landscape in identity formation. It also throws light on significance offilm as a source of cultural geography in brief, with the view to promote future studies in this field.
Keywords : Cinematic landscape, Film, Culture, Identity, Bollywood, Hollywood, Cultural Geography, Space
IntroductionLandscape is a unique synthesis of physical and cultural characteristics of a region. The term
‘‘cultural landscape’’ has been a fundamental concept in human geography.The origin of the word‘landscape’ comes from the Germanic languages. One of the oldest references in the Dutch languagedates back to the early thirteenth century when ‘lantscap’ (‘lantscep’,landschap’) referred to a land,region or environment. It is related to the word ‘land’, meaning abordered territory, but its suffix -seep refers to land reclamation and creation, as is also found in the German ‘Landschaft’ — ‘schaffen— to make. J. Wimmer was perhaps the first scholar to use landschaftskunde in his workHistorischeLandschaftskunde (1885).The concept ‘‘landscape modified by human activity’’ as anacademic term was introduced by German geographer Friedrich Ratzel in 1890. It is known aspaysage in French; paeesaggio in Italian; and, bhoodrishya in Hindi. Its popular acceptance as anacademic term in geography could be seen after Otto Schlüter’s famous 1906 address at Munich.The term became familiar in English speaking world by the American geographer Carl O. Sauer(1925) who in his seminal work stated, “...the cultural landscape is fashioned from a natural landscape
1. PhD, Professor: Dept. of Geography & Adjunct Faculty: Bhojpuri Study Centre, Banaras Hindu University,Varanasi, UP-221 005. E-mail: [email protected], [email protected]
2. UGC-Junior Research Fellow, Bhojpuri Study Centre, Banaras Hindu University, Varanasi, UP-221 005.E-mail: [email protected]
Ind. J. of Landscape Systems and Ecological Studies 42 (2) December - 2019, 89- 101 ISSN 0971-4170

90 INDIAN JOURNAL OF LANDSCAPE SYSTEMS AND ECOLOGICAL STUDIES VOL. 42
by a cultural group. Culture is the agent, nature is the medium, and the cultural landscape is theresult” (p.315). Landscape expresses the visual illustrations of the territorial identity. The earliestrealistic portrayal of landscape date from the fifteenth century, in particular in Renaissance paintingwhich emphasized visual character and symbolic meanings. Landscape also became an expressionof human ideas, thoughts, beliefs and feelings. The International Geographical Union (1938) madeit clear that a geographical landscape is not simply a physiological or an aesthetic entity as analyseshave shown that it embraces the whole range of generic and associated functional relationshipbetween units on the earth surface enabling characteristic group or sub-group to be identified.
The spatial and temporal attributes attached to cinematic landscape representation act as astimulus for geographical enquiry. Cinematic landscape captures the space and time in motionwhich is artistically created. Cinema has a mechanical ability to represent the world through movingimages which shapes our perception of ourselves, as well as the world. Cinema generally takes usto the world of imagination or fantasy; at the same time, it shows the truth or reality of the world.Cinematic landscape representation and interpretation is mediated by one’s attitude, perception andculture.
This article’s primary concern is to critically examine landscape representation in cinema witha brief focus on significance of film as a source of cultural geography. Accordingly, it is organisedinto following four major sections: cinema and geography; place of landscape in regional/placeidentity and culture; landscape as represented in cinema; and, significance of films as a source ofcultural geography before attempting a few preliminary conclusions.
Cinema and geography: the interfaceLukinbeal and Sharp (2014) suggested in Geography and film that “Geographers by and large
took interest in film as a subject matter during late 1980s. One of the first insights into film and otherpopular media forms by geographers was Geography, the Media and Popular Culture edited byBurgess and Gold (1985). In this work, the editors outlined two tracts of media research: the so-called American school, which accentuates individual cognitive response to media; and, the Europeanschool, which highlights social theory and stresses on the role of media in society. In attempts toease this division and also to provide a framework within which the new subfield could develop,Kennedy and Lukinbeal (1997) argued that rather than seeing film geography as composed of twounrelated areas of inquiry, the two tracts outlined by Jacqueline Burgess and John Gold (1985)should be thought of as two extremes on either side of a continuum, with discrepancies but alsooverlap(p.3).
With the publication of Place, power, situation and spectacle:A geography of film, editedbyAtkin and Zonn(1994), a new era was heralded. It addressed the assumption that film should andcould provide a transparent window on the real world as Geography in general engaged withbroader scale academic debate over the ‘crisis of representation’. So those interested in film beganto address “the relationship between the real and reel” (as cited in Aitken& Dixon, 2006, p.327).Fourteen geographers examined the effect of cinematic representation of place and space on

NO. 2 LANDSCAPE, CULTURE AND CINEMA: A STUDY IN FILM GEOGRAPHY 91
perception of self and societies in the world in this book by using contemporary film theory andelements of socio cultural and political discourse.
Engaging Film: Geography of Mobility and Identity, edited by Tim Creswell and DeborahDixon (2002), is a creative interdisciplinary volume that explores the engagement among films, spaceand identity and features a section on the use of film in classroom as a critical pedagogical tool. Asignificant challenge to the hegemony of the textual metaphor is attempted through the paradigm ofmobility, which is put forth as “an element in the play of power and meaning within social andcultural networks of signification” (p. 4). In an article titled ‘Imagining Geographies of Film’, Aitkenand Dixon (2006) provided a summary and critique of the film geography literature and suggestedthat future research should take a more critical approach to the intersection between “lived experience”and “the images and material conditions” that continuously produce and reproduce our daily lives(p. 335). Lukinbeal and Zimmermann (2006) have tried to present a brief history of film geography,highlighting the German tradition, and suggested that there are four key areas of current and futureresearch into film by geographers. They make an earnest argument against representational viewsof cinema. On the basis of modality, taken by contributing authors as the primary means ofinvestigation, the editors have organised the ten essays of the volume around the author, text andthe reader. The editors duo have also discussed the benefits and limitations of the author-text-reader model used by film geographers
Aitkin and Dixon (2006) suggested that to an extent geographic study of film has come of ageand it is important to not only tie it to disciplinary source but also to put theoretical boundaries.Geographical concern is often lacks a critical perspective focusing primarily on the geographicrealism of film rather than how they produce meanings. Geography needs to elaborate insightsthrough critical spatial theory so that (our) studies are not about filmic representation of space butare also about the material condition of lived experiences and everyday social practice” (cf. p.326).Critical insights are needed to put theoretical boundaries across this new sub-discipline of filmgeography. A relationship should and could be established between the reel and the real with aprimary focus on geographic realism of film.
Place of landscape in regional /place identity and cultureIn a recent work, Roca, Claval and Agnew (2016, p. 1) have made a very important observation
that, “Landscapes are treasures of the past, frame contemporary everyday life, and affect futureenvironmental, economic and cultural processes. As material custodians of both historical memoryand the sense of place, landscapes encapsulate our attachments, emotions, perceptions andknowledge, as well as our interests, decisions and actions. Modern societies are marked by identitycrises which, all too often, involve major landscape disruptions. In this context, landscapes are nolonger just the ‘scenery’ of either local or globalized economies or cultures. They increasingly gaineconomic and cultural value in their own right”. Such an observation makes it apparent thatlandscape is a wider concept which includes both tangible and intangible features. It reflects thehuman progress with in respect to time. In the present era of globalisation, distinctive characteristicsof landscapes have lost their importance which result into identity crisis. When we talk of cinematic

92 INDIAN JOURNAL OF LANDSCAPE SYSTEMS AND ECOLOGICAL STUDIES VOL. 42
landscapes in a global world, the issue of identity crisis becomes more prominent where Toronto isthe other New York and Alps is the other Kashmir (Lukeainbeal,2005).
Place identity “People and landscape both are in constant interaction”, or as Turner (2006, p. 387) puts it,
today landscape is a form of active material culture that has shaped people and has been shaped bythe landscape (cited in StobblerandPedroli,2011, p.5). He further adds that “people can have asense of belonging to a specific landscape, often in the region where they spent their youth orwhere they experienced a crucial period in their biography. The identity that people derive from thelandscape in that region is called‘ place identity’ (cf. Jorgensen & Stedman, 2001; Olwig, 2006;Proshansky et al., 1983) or ‘existential identity’ (Boerwinkel, 1994; Gualtieri, 1983; Van Mansvelt&Pedroli,2003; Van Zoest, 1994). Thus, when discussing existential identity, not only the objects inand the features of the physical environment are issues but also the associations, memories andsymbolic meanings attached to the physical landscape(the social and cultural environment), observesSchama (1995). In this context, existential identity is considered as an inherent quality of thelandscape as perceived by people. The study of landscape from this perspective is a relatively newdevelopment (Olwig, 2002; Setten, 2004 as cited in StobblerandPedroli, 2011, p.5).The filmicrepresentation of places, landmarks of architecture develop or make a sense of place. The peoplederive their identity from such on-screen places and can connect themselves with such placesaccording to their attitude, culture, association and memories (Koeck, 2012).
Spatial identityStobbelaarand Pedroli (2011) also talked about the spatial identity and suggested “a much
longer tradition has the second implication of the concept of identity, whereby people ascribeidentity to their environment, or in other words: they characterise the landscape”. This is termed as‘spatial identity’ (Van Zoest, 1994), ‘landscape character’ (Antrop, 1998; Wascher, 2005) or just‘landscape identity’ (Antrop, 2000, 2007; Palmer and Roos-Klein Lankhorst, 1998). “Spatial’ in thissense has a broad meaning; far broader than, for example, the visual aspects of landscape, itincludes orientation, distances, ordination, etc. Spatial identity of landscapes is based on forms,patterns and elements (but also colours and processes, and even sounds and smells—those featuresby means of which people recognise landscapes” ((cf. Stobbelaar& Hendriks, 2006, p.6) The spatialorganisation of the cinematic landscape is simply the spaces where the narrative of the story isunfolded. Filmmaker ascribes meaning to such spaces according to the narrative of the film. Cinematiclandscapes are the space of actions where different shots of the camera from different angles aretaken in order to limit viewers up to dialogue between the actors.
Cultural identityThe basis of cultural identity are values, signs, symbols, associations which is attached to a
particular landscape. Cultural identity includes the ways people interact with cultural landscapes.This interaction is achieved due to awareness of natural and cultural values. As suggested byNezam, et al., “Moreover, the values create a distinct identity which is the result of communication

NO. 2 LANDSCAPE, CULTURE AND CINEMA: A STUDY IN FILM GEOGRAPHY 93
between people and landscapes (cf. Stephension,2008).Cultural identity is the basis of culturalheritage and values of cultural landscapes are the basis of cultural identity. The local and nativepeople, who are the constructor and keepers of cultural landscape, consider location values as theinseparable part of their cultural identity. Indigenous people live in the landscape and consider theidentity, history and nature as the values of cultural landscape which they have maintained sincetheir past to present. Cinema reflects the vision as well as reality of the society. The onscreenportrayal of value-based society forms the basis of cultural identity. For instance, the motherlyfigure in Hindi cinema is portrayed as moral keeper, wherein the moral duty is heavily lean onmotherly figure.
Landscape as represented in cinema: the over-linked aspectLukinbeal(2005) while explaining cinematic landscape said, “a region’s cinematic landscape
can never be realised but always leads to new taste, new context, and new configuration ofmeaningful exchange within an ongoing system of production” (p. 172). The geographic meaning ismade with the cinematic landscape representation. Harper and Raynor (2010, p. 16) mention that‘like a map the cinematic landscapes is the imposition of order on the elements of landscapecollapsing the distinction between the found and the destructed’. The orderly pattern of landscapeexhibited by cinema fascinated the geographic enquiry in a detailed way. Landscape representationin cinema always used as a space, metaphors and spectacles. Metaphors in cinematic landscapecan be perceived to be similar to landscape as spectacles. Landscape metaphor breachs into thehidden meaning of landscape. Various physiographic features of earth is used for expressinghuman emotion such as green vegetation, snowy mountains and hills for romance, rain for sadness,love and sometimes to depict joyous atmosphere, rugged topography of desert to depict loneliness,breakups etc. Here the brief sketch of landscape representation in Hollywood, Bollywood andregional cinema of India are presented (Lukeanbeal, 2006).
HollywoodPowdermaker (1950), as cited in Ibbi (2013, p.96), described Hollywood”... a unique American
phenomenon with a symbolism not limited to this country. It means many things to many people”.Hollywood may be defined as a “global industry which is geographically concentrated in southernCalifornia with a truly global reach. Bi (2012) stated that “culture, in particular the movies producedby Hollywood, is one of the cornerstones of this endeavour. Another word for the American dream,Hollywood serves to extol the virtues of the American way of life, promotes major industrial productsand builds and reinforces a positive national image.” He further adds that Bi (2012) has also statedthat “Hollywood movies seek to build a national image characterized by freedom, equality, prosperityand other positive aspects. Concepts such as “freedom” and “equality” are reinforced throughstorylines.” (as cited in Ibbi, 2013, p.96). Hollywood movies are key cultural artifacts that offer awindow into American cultural and social history. The way these movies have influenced theculture of people around the world is a major source of concern as expressed by Burrowes (2011),“the success of American film has led to other nations fearing that their own cultural identity wouldbe tainted, altered somehow by this Hollywood influence”. Portrayal of Hollywood’s domination of

94 INDIAN JOURNAL OF LANDSCAPE SYSTEMS AND ECOLOGICAL STUDIES VOL. 42
the global film industry was best painted by the movie director, Steven Spielberg in Branston(2000), “it is not domination by American cinema. It is just the magic of storytelling and it unites theworld.” The unity brought about by this magic of storytelling has been termed by many as ‘culturalimperialism’. One of the main problem faced by Hollywood is the issue of minority representationparticularly black, women and the community of LGBT group. Moonlight(2016) of Berry Jenkins isone of the Oscar (one of the highest international prize) winning film. In the field of cinema, with acentral theme of representing the three stages of life of an African-American gay named Chironstruggles to find his identity in a contextual society. He is truly representing a gay who is poor andblack who is born without inherent worth.
BollywoodIn a country like India, culture plays a dominant role in society than visual representation of
landscape, became central to public discourse. Bollywood industry is not just the imitation of theHollywood. It has its own international brand of music, dance and drama. It reflects the changes inIndian polity, economy and society. Post-liberalisation has caused the widespread change inlandscape representation in Bollywood. In 1993 when the National Democratic Alliance (NDA)government granted Bollywood cinema the status of industry, the nature of film financing gotquickly changed and the corporate sector stepped into movie making. This meant the use of big
Fig. 1: A typical rural landscape of a remote village of north-eastern Bihar as portrayed in TeesriKasam(1966).
(Source: http://www.rangooski.com/video/5142/maare-gaye-gulfam-teesri-kasam-1966-raj-kapoor)

NO. 2 LANDSCAPE, CULTURE AND CINEMA: A STUDY IN FILM GEOGRAPHY 95
stars, extravagant romance, affluent lifestyle and film shootings in fancy locations. Such film shootingstransformed the conventional landscape representation and consequently their interpretation. Thefirst indigenous silent feature film ‘Raja Harishchandra’ was directed and produced by DhundirajPhalke, known as “the father of Indian cinema”, in 1913. Narrative of the story was based on theinternationally famous Sanskrit epic Ramayan and Mahabharat. This first indigenous film was simplethough with immense potential for visual extravagance. The perception, experience and content ofcinema changed with the advent of sound and the first torque of Indian cinema was ‘AlamAra’(1931). Another significant change in Bollywood cinema is its interaction with the literary sources.‘Teesri Qasam’ (1966),a movie which eases the understanding of a novel written by PhanishwarNath Renu which depicts the plight of rural Bihar. The acting of Raj Kapoor and Wahida Rahmanmay be seen at its zenith. Theatre, text, image, industry, event and narrative all come together toform cinematic landscape (Shah, 2017).
Several movies shot before 1990 were on indigenous soil most of which depict indigenousdaily rural life—society, culture and economy. For instance,‘NadiyaKePaar’(1982) directed by GovindMunish and set in Ballia district of Uttar Pradesh (UP). It was adopted from the first half of a noveltitled Kohbarki Shart (in Hindi) authored by Keshav Prasad Mishra. The movie plots the rural
Fig. 2: One of the most remembered scenesfrom the frame of‘Nadiya kePaar’(1982) shot in Ballia district,UP.
(Source: http//images.app.goo.gl/kKch8bSENjNgSv3W6)

96 INDIAN JOURNAL OF LANDSCAPE SYSTEMS AND ECOLOGICAL STUDIES VOL. 42
landscape and rural culture of Eastern UP. The symbolic role of Bhauji(‘sister-in-law’) reflects theimportance of women as home-makers. The initial struggle of Chandan and his family before hisbrother’s marriage indicates how a woman handles household chores so easily,which a man cannot.Landscape such as public wells, streams, mudand brick made houses with inner courtyard, hearths,roads,fascinating greenery etc.are the reflection of a rural environment which is too simple and itspeople free from all odds and disturbances. These images based on rural presentation seek audienceconnection who identify themselves with such socio-cultural fabric and these landscape elements.
Since 1990s widespread changes across Indian cinema may be found attracted towards foreignlocation, a promptand frequent tendency seen on film shooting in Bollywood. Up to the 1970s,foreign locations were used for only song sequences. But a discernible shift in place making ofcinematic space in Hindi films occurred in 1995 when ‘Dilwale Dulhania Le Jayenge’(DDLJ),1995usedforeign locations as perfect setting of romance. London was used as physical settings such asTrafalgar Square, Big Ben Tower, Buckhingum Palace, King Cross railway station and the snowyAlps andpastoral fields of Europe etc. which were quite appealing and developed a sense of placeto its audience(cf. Mishra,2018).
Fig. 3: South Hall, London, a popular locations for the shooting of several Bollywood movies including‘DilwaleDulhania Le Jayenge’(1995) and ‘Hum Dil de ChukeSanam’(1999)
(Source: https://timesofindia.indiatimes.com/travel/destinations/8-beautiful-locations-thatll-refresh-your-memory-of-dilwale-dulhania-le-jayenge-/amp_articleshow/45296548.cms)

NO. 2 LANDSCAPE, CULTURE AND CINEMA: A STUDY IN FILM GEOGRAPHY 97
Regional CinemaofIndiaIndia is home to one of the largest film industry in the world. Indian film industry comprises of
Hindi,and regional movies including art and popular commercial cinema. Some of the popular regionalfilm industries in India are Bengali, Tamil, Telugu, Kannada, Malayalam and Punjabi. Among theseBengali cinema has an older legacy than Bollywood. Tollywood is metonym for the Bengali filmindustry, centered in Tollygunge in Kolkata. The Bengali film industry is notable for having raretalented directors like Satyajit Ray, an internationally renowned filmmaker and a winner of manyawards. Mukherjee and Bakshi(2017) suggested, “...the idea of ‘Bengali’ cinema, we would like toargue, became forceful with the advent of sound in India; simultaneously, subjects of language andnation became significant within the debates on cinema and its making” (p.116).The best-knownevent of the 1950s Bengali cinema is nonetheless Satyajit Ray’s ‘PatherPanchali’ which was releasedin 1955 and won “Best Human Document” at the Cannes Film Festival (1956). It was appreciated byfilmgoers and critics alike, as was ‘ApurSansar’, the third film of Ray’s Apu trilogy, which had asilver jubilee in Calcutta (now Kolkata).It was indeed one of the greatest works of Ray, with scenicbeauty which leaves in our mind, traces worth remembering. Poverty makes life hard, but to Apuand Durga, as innocent they are, their child-like little activities bring us back to childhood nostalgia.These regional cinemas present a better picture of contemporary social issues and depict the sociallife in a much more comprehensive manner. Bengali cinema has its own classics. Many believe thatno other regional cinema can compete with the Bengali cinema. However, the existence of well-acclaimed films has been produced in majority of regional languages. Among them, Bhojpuri andTamilcinema have their regional importance which seeks greater connection to respective audience butonly at the regional level not a wider level as Bengali cinemahave had the privilege. Bhojpuri cinemais always charged with the metaphors of decay,break-down,lawlessness,like problems of Bihar andeastern UP.
Fig.4: Landscape of rural Bengal as portrayedin PatherPanchali(1955)
(Source: https://m.imdb.com/title/tt0048473/mediaviewer/rm3254187776)

98 INDIAN JOURNAL OF LANDSCAPE SYSTEMS AND ECOLOGICAL STUDIES VOL. 42
Significance of films as a source of cultural geographySince very ancient times, niche-specific study hasbeen the concern of human geographers in
order to understand human-environment relationship. Cultural geography, as a sub-fieldwithin humangeography, is mainly interested in cultural landscapes. The study of cultural landscape was led bythe Berkeley School of geographical thought under the able leadership of Sauer. Cultural landscape,as defined by the world heritage committee, “ ... is the cultural properties that represent the combinedwork of nature and human”. When culture interacts with the natural landscape, a cultural landscapecomes into existence. According to Ming (1979), “any landscape is composed of not only what liesbefore our eyes but what lies our head”(cited in Mishra,2018, p.34).Every individual constructs themeaning of visual landscape according to theirown perceptive abilities. This landscape, seen in thebackdrop of cinema, which provides meanings to the narrative for events, is a subject matter ofcultural geography. Film in itself is a cultural entity which is created by human art after interactingwith the nature. This artistic feature of human beingshas presentlyinfluenced every corner of theworld. Crossgrove who noted “landscape as a cultural image a pictorialway of representingstructuring or symbolising surroundings that privilege the sense of sight and often emerge as avital field of expression and contestation”(as cited in Mishra,2018, p. 61,63). The cinematicrepresentation embodies in itself ideologies, emotions, explanation, interpretationand so on. Thus,cinematic landscapes are a rich resource for landscape analysis and interpretation .Landscape isnot just the commodity, it s a source for identity, an element of mediation, a part of individual orcollective fantasy and imagination not just a part of cultural fabric for an ideology and spectaclebut far too profound and prolific in both physical and virtual space of creativity.Visual representationof landscape in cinema provide an opportunity for a wider social discussion and act as a synergybetween human and geography.
Landscape is the reflection of cultural maturity of a region. It represents and symbolisessurroundings. Though the cinema has its own events and narratives; but, without a specificlandscape at the backdrop, all cinematic events go in vain as any cinematic narrative is meaninglesswithout proper landscape representation in the backdrop. Bollywood movies that are staged abroador present the Indian society and culture in foreign locations infuse the sense of pride for thenation (India) among the viewers. ‘Dilwale Dulhania Le Jayenge’ (1995),‘KalHo Na Ho’(2003),‘Namaste London’(2007) are some of the movies that create a sense of cultural identity abroad.These movies represent how middle-class immigrants from India are deeply rooted in the Indianethos and spread the fragrance of indigenous culture abroad. Lukinbeal and Zimmerman(2006)rightly suggest, “With the rise ofhumanistic geography, and other counter movements to thequantitative revolution, interest in literature, art, media and films began but never trulydeveloped”.Following the “cultural turn” in geography and debate over ‘traditional’ and ‘new’cultural geography, non-material cultural forms of inquiry rose to prominence.However, an invidiousdistinction between what constitutes geographic research has kept this subfield from truly growingand thriving. The rise of critical cultural geography and disciplinary interest in such key issues asthe ‘crisis of representation, film geography should be moved from the peripheries to become a

NO. 2 LANDSCAPE, CULTURE AND CINEMA: A STUDY IN FILM GEOGRAPHY 99
central issue in geographic research and pedagogy” (p.321). A theoretical and analytical approachis needed to make this sub-discipline flourish. The question of crisis of representation should bekept in mind in order to give geographical bent to studies in this sub-disciplinary area.
Preliminary ConclusionThroughout the discussions presented in previous sections, we have tried to argue that
despite of its significant place in identity of a region or place, village or city and also the people,landscape is commonly not treated seriously which results into poor narrative in the film concernedand ultimately the message conveyed. Through this paper we have tried to critically analyse thelandscape representation in cinema which reflects the society, culture and various identities. Whilethe concept of landscape is complex one but its wider canvas includes territories between cities,streets, television sets and geographical imagination. Landscape representation in cinema undeniablyshapes the nature of human settlements as well as the culture and identity of the society. Thehistorical development and the changes occurred in landscape representation and city developmentshave been found going side by side, particularly in the western context. With the passage of time,the concept of virtual space gained its due place in landscape representation in cinema. Thedevelopment of sense of place with the development of cinema has some spatial significance whichshould be the subject matter of pedagogical discourse in cultural geography, to be more specificfilm geography. Bollywood, along with regional cinema in India, is highly productive, covering awide array of themes, historical as well as contemporary, awaiting geographical analysis particularlyby the Indian geographers. Such enterprises will not only enrich cultural geographic studies inIndia but could potently help in developing/using films as a pedagogical tool in geographyclassrooms.
AcknowledgementThe authors gratefully acknowledge the constructive comments and suggestions of anonymous
reviewer(s) and Prof. Sumana Bandyopadhyay (University of Calcutta), incorporated in the article,which have helped in giving final shape to the same.
ReferencesAitken, S. C., &Zonn, L. E. (Eds.). (1994). Place, power, situation and spectacle: a geography of film. Lanham
(Maryland, USA): Rowman& Littlefield Publishers, Inc.Aitken, S. C., & Dixon, D. P. (2006). Imagining geographies of film. Erdkunde, 60(4), 326-336.Arler, F., &Mellqvist, H. (2015). Landscape democracy, three sets of values, and the connoisseur
method. Environmental Values, 24(3), 271-298.Clarke, D. B. (Ed.). (1997). The cinematic city. London and New York: Routledge.Crang, M., Crang, P., & May, J. (Eds.). (1999). Virtual geographies: bodies, space and relations. London and
New York: Routledge.Cresswell, T., & Dixon, D. (Eds.). (2002). Engaging film: Geographies of mobility and identity. Lanham
(Maryland, USA): Rowman& Littlefield Publishers.

100 INDIAN JOURNAL OF LANDSCAPE SYSTEMS AND ECOLOGICAL STUDIES VOL. 42
Davies, J., Gandy, M., &Gaughan, M. (2003). Screening the city. London & New York: Verso.Burrowes, D. (2011) Hollywood: A National Cinema? bdurrowes-austcin.tumblr.com/postEscher, A. (2006). The geography of cinema—A cinematic world. Erdkunde, 60(4), 307-314.GámirOrueta, A., & Manuel Valdés, C. (2009). Cinema and geography: Geographic space, landscape and
territory in the film industry. Department of Humanities, University Carlos III, MadridHarper, G., & Rayner, J. R. (Eds.). (2010). Cinema and landscape. Chicago: Chicago University Press.Ibbi, A. A. (2013). Hollywood, the American image and the global film industry. CINEJ Cinema Journal, 3(1),
93-106. https://doi 10.5195/cinej.2013.81Koeck, R. (2012). Cine-scapes: Cinematic spaces in architecture and cities. New York: Routledge.Lukinbeal, C. (2005). Cinematic landscapes. Journal of Cultural Geography, 23(1), 3-22.Lukinbeal, C., & Zimmermann, S. (2006). Film geography: A new subfield (Filmgeographie:
einneuesTeilgebiet). Erdkunde, 60(4), 315-325. https://doi:10.3112/erdkunde.2006.04.02Lukinbeal, C., & Sharp, L. (2014). Geography and film. In Barney Warf (Ed.), Oxford bibliograhies in
geography. NewYork, Oxford University Press.Lynch, K. (1960). The image of the city. Cambridge, MA: The MIT Press.Mishra, N. (2018). What’s in the backdrop: Representation of landscape in Bollywood Cinema. CINEJ
Cinema Journal, 7(1), 116-141.Madhuja Mukherjee &KaustavBakshi (2017) A brief introduction to popular cinema in Bengal: genre, stardom,
public cultures, South Asian History and Culture, 8:2, 113-121. https:/ doi: 10.1080/19472498.2017.1304082
Paasi, A. (2003). Region and place: regional identity in question. Progress in Human Geography, 27(4), 475-485.
Rayner, J., & Harper, G. (Eds.). (2014). Film landscapes: Cinema, environment and visual culture. NewCastle upon Tyne: Cambridge Scholars Publishing.
Roca, Z., Claval, P., & Agnew, J. A. (Eds.). (2011). Landscapes, identities, and development. London: AshgatePublishing Ltd.
.Sauer, C. O. (1925). The morphology of landscape.:‘Land and Life’. University of California Publications inGeography, 2; Reprinted in 1974.(Ed. J. Leighly.) pp. 315–350.
Shiel, M., & Fitzmaurice, T. (Eds.). (2001). Cinema and the city: Film and urban societies in a globalcontext (Vol. 48). Oxford: Wiley-Blackwell.
Sitney, P. (1993). Landscape in the cinema: The rhythms of the world and the camera. In S. Kemal & I.Gaskell (Eds.), Landscape, Natural Beauty and the Arts (Cambridge Studies in Philosophy and theArts, pp. 103-126). Cambridge: Cambridge University Press. https://doi:10.1017/CBO9780511554605.005.
Stobbelaar, D. J., &Pedroli, B. (2011). Perspectives on landscape identity: A conceptual challenge. LandscapeResearch, 36(3), 321-339.
Shah, S. (2017). Landscape in Indian Cinema ,unpublished doctoral dissertation, CEPT University, Ahmadabad,Gujarat.

NO. 2 LANDSCAPE, CULTURE AND CINEMA: A STUDY IN FILM GEOGRAPHY 101
Web sourceshttp://www.rangooski.com/video/5142/maare-gaye-gulfam-teesri-kasam-1966-raj-kapoor, retrieved on 22.9.2019.http//images.app.goo.gl/kKch8bSENjNgSv3W6, retrieved on 22.9.2019.https://timesofindia.indiatimes.com/travel/destinations/8-beautiful-locations-thatll-refresh-your-memory-of-
dilwale-dulhania-le-jayenge-/amp_articleshow/45296548.cms, retrieved on 22.9.2019.https://m.imdb.com/title/tt0048473/mediaviewer/rm3254187776, retrieved on 22.9.2019.
Received : 22 October, 2019Revised : 26 November, 2019

102 INDIAN JOURNAL OF LANDSCAPE SYSTEMS AND ECOLOGICAL STUDIES VOL. 42
A Review of Urban Microclimate Concepts and ThermalIndices in the Analysis of Outdoor Thermal Comfort in
Tropical Humid Climate -Case Study on KolkataRohini Mazumder Chakraborty1*and Debashish Das2
Abstract : This paper highlights the need of study of urban microclimate at neighbourhood scale in order tounderstand the thermal conditions of a city based on urban microclimatic parameters. The paper brieflydescribes the aspects of biometeorology, urban microclimate and the elements in the urban atmospheric layerwhere microclimatic parameters such as temperature, humidity, wind speed play an important role. Theseparameters along with the human clothing patterns and metabolic activity help in understanding the outdoorthermal comfort condition. The thermal condition of the city coupled with the thermal sensation can be used infuture urban planning policies. The study intends to showcase the impact of the microclimate parameters onoutdoor thermal comfort through Physiological Equivalent Temperature Standard Effective Temperature, WetBulb Globe Temperature and Predicted Mean Vote. In this study, the RayMan 2.1 software has been used tocalculate outdoor thermal comfort.[1, 2, 4]. The study during late-March,2019, shows the result in variabilityof thermal comfort data calculated from the four indices. Standard Deviation and Variance show that PET andSET show maximum variability of data. Since the different stations have different micro-climate conditions, thevariability of data in terms of deviation from the average is best shown by PET and SET thermal comfortindices. Also the VDI, German Institute of Engineers, recommend the use of PET in a wide range of microclimateconditions. Hence, PET is considered most appropriate for further studies in the analysis of outdoor thermalcomfort. Furthur use of the PET index can help delineate areas in the city that are comfortable and thus canbe a key in sustainable urban and regional planning process.
Keywords : Urban Microclimate, Thermal Indices, Thermal Sensation, Outdoor Thermal Comfort, Sustainableurban planning
IntroductionBiometeorology studies the influence of climate conditions and changes upon the ecosystem.
Human biometeorology deals with the influence of environment upon human beings. HumanBiometeorology has been studied since Hippokrates (400 BC) to Alexander von Humboldt (1827),Kant to many more. Fanger (1970) described the Predicted Mean Vote (PMV) derived from hiscomfort equation. To study the impact of climate change conditions on human activity and conversely
1. Research Scholar, Department of Architecture, Jadavpur University, Kolkata. [email protected]. Associate Professor, Department of Architecture, Jadavpur University, Kolkata. [email protected]
Ind. J. of Landscape Systems and Ecological Studies 42 (2) December - 2019, 102- 115 ISSN 0971-4170

NO. 2 A REVIEW OF URBAN MICROCLIMATE CONCEPTS AND THERMAL INDICES 103
the influence of changing metabolic rate resulting in decreasing or increasing body temperatureresulted in the need for bioclimatic indices. Most of such indices were based on heat balanceequation The values can be represented spatially in bioclimatic maps at different scales of study:city, neighbourhood, block and so on. The ‘Verein Deutscher Ingenieure’ (VDI, 1996), Germany wasthe first to set a guideline on ‘Human-biometeorological assessment of climate and air pollution forurban and regional planning’ and recommends the use of energy balance models such as of thethermal component of the bioclimate (Höppe, Aspects of human biometeorology in past, presentand future, 1997). The following study gives a review of the concepts in urban microclimate and thedevelopment of thermal comfort indices. The thermal indices of WBGT, PMV, SET and PET alongwith the thermal sensation scale helps to understand the conditions of heat strain. The study ofmicroclimate and thermal comfort is relatively new in our country. Thermal indices have long beenin use in other nations along with the building of bioclimatic maps. The use of thermal comfortindex is a growing area with many new studies (Chowa, Assyakirin Binte Ali Akbara, Heng, & Roth,2016) (Fang, Jiang, & Guo, 2015) (Koerniawan, 2015) (Mills, 2015) (Mukherjee & Mahanta, 2014) andmore
Urban MicroclimateUrban Microclimate is a resultant of ‘Form and Function of a city’ (Mills, 2015) ; land use and
surface characteristics (Fang, Jiang, & Guo, 2015), Urban Geometry (Ng, Urban climatic map studiesin China: Hong Kong, 2015), geography of a city ,both physical and socio-economic (ANDRADE,NERY, MOURA, & KATZSCHNER, 2015), trees and building typology (Oke T. R., Mills, Christen, &Voogt, 2017)and local climate (Taha, 1997). Microclimate can extend from a few meters to tens ofkilometres. Areas with similar microclimate can be grouped into climatopes. Climatopes refers to thenear-surface climate conditions which may be considered for planning purpose. Microclimate extendsfrom 10mm to 1km. The urban climate events mostly take place in the micro-scale, local scale andmeso-scale though the transition between the layers is not distinct. Urban Boundary Layers ismade up of several combined microclimate features. The lowest 10% of the Atmospheric Boundarylayer forms the surface layer with sufficient turbulence. The convective circulation during daytime,from the surface layer to the top of the Atmospheric Boundary Layer and back to the surface layer,creates mixing of air and creates a homogeneous nature so that the other climate parameters, suchas wind, humidity and so on, may show a pattern. The surface layer has two parts of which theroughness sub layer is most responsible for all the friction taking due to surface roughness. (OkeT. R., Mills, Christen, & Voogt, 2017)
Outdoor Thermal ComfortThermal comfort is the condition of the mind that expresses satisfaction with the surrounding
environment. Outdoor thermal comfort concerns itself with outdoor thermal conditions. (Epstein &S.Moran, 2006) (ASHRAE, 2010) (Hooi Chyee Toea & Kubota, 2013) In 1938, Buttner recognisedthe need to consider the combined effect of several parameters to understand the influence ofenvironment upon thermal sensation of people. (Höppe, The physiological equivalent temperature– a universal index for the biometeorological assessment of the thermal environment, 1999) Fanger

104 INDIAN JOURNAL OF LANDSCAPE SYSTEMS AND ECOLOGICAL STUDIES VOL. 42
in his book ‘Thermal Comfort’ showed six parameters that affect human response; air temperature,radiant temperature, relative humidity, wind speed, metabolic heat from human activity and clothingconditions. Temperature determines the heat flow between human being and the surrounding air.Heat exchange by radiation is described by the mean radiant temperature which is the temperatureof a uniform experimental enclosure having exchange of heat by radiation in the same way as itdoes in the real world environment. (Parsons, Human Thermal Environments- The effects of hot,moderate and cold envieonments on human health, comfort and performance, 2002)This parameteris instrumental in the calculation of thermal comfort through PET. (Matzarakis & Amelung,Physiological Equivalent Temperature as Indicator for Impacts of Climate Change on Thermal Comfortof Humans) (Walikewitz, Janicke, Langner, Meier, & Endlicher, 2015) Metabolic rate increased by17.5 Watt due to equivalent rise in air temperature by 1degree Celsius. Clothing Insulation shows 1clo change to a change of air temperature by 5 degree Celsius while at resting condition and 10degree Celsius while exercising. (Epstein & S.Moran, 2006)
Indices for outdoor thermal comfortMany thermal indices and thermal models were developed in the late 20th century to estimate
the influence of thermal environment on humans. Indices such as Heat stress index, Discomfortindex by Thom, 1959, Wind-chill index by Steadman, 1971 did not include the effect of heat exchangeby radiation fluxes or human physiologic heat regulatory system which was later considered byMayer 1987, and Höppe, 1999. (Grigorieva & Matzarakis) For an index to be applicable it must bepractical and accurate at various study conditions; it must consider all the important environmentalas well as physiological parameter; the index values must show threshold for safety limits of thethermal conditions in regard to health risk and proper measurements to reflect appropriate thermalconditions of a worker (Epstein & S.Moran, 2006) and the need for such precautionary thresholdvalues was first given by Lee (1980). Lee also said that an index must provide room from acclimitizationin indoor conditions such as an office. He said that the limits to comfort must be defined; also pastexperiences in different environments must be considered. Lee also mentioned the need to choosebetween the better option of forced environment with windspeed control and temperature- humiditycontrol v/s the natural environement. Finally , he also mentioned that Climate classification cannotalways be the only classification. By considering the thermal sensation of the people in terms ofcomfort or stress can be a useful way to classify zones. (Auliciems & Szokolay, 2007).
Thermal comfort indices or heat stress indices can be rational (using heat balance equation),direct (using direct measurements), empirical (objective and subjective stress). Though the rationalindex is most comprehensive but the direct index is most practical in its application in variousthermal conditions provided the necessary guidelines are adhered to (Epstein & S.Moran, 2006).Houghton and Yaglou introduced the Effective Temperature in 1923 to understand the effect of airtemperature and relative humidity relative to comfort conditions. The effective temperature wasmodified to corrected effective temperature (CET) when the dry bulb thermomter was replaced witha black globe thermometer to include readings of radiation. From the CET emerged the WBGT. TheOxford Index was introduced in 1957 after applying weightages on wet bulb and dry bulb temperature.

NO. 2 A REVIEW OF URBAN MICROCLIMATE CONCEPTS AND THERMAL INDICES 105
This helped to understand how evaporation of sweat helps in thermoregulation of human body.(Epstein & S.Moran, 2006)
Thermal Indices- PMV,PET, SET,WBGTThe Wet-Bulb Globe Temperature (WBGT) is most used around the world. It was developed
by the US Navy to understand the heat related health issues during training. It was adopted as anISO (ISO 7243) standard. It came from the Corrected Effective Temperature (CET) that includesparameters such as dry bulb temperature(Ta), wet bulb temperature(Tw) , black globe temperature(Tg) in Equation 1 (Epstein & S.Moran, 2006) (Auliciems & Szokolay, 2007). The WBGT index canbe ‘cumbersome’. (Epstein & S.Moran, 2006) The WBGT is denoted by flags of different colourswhich show the category of heat in the region. As shown in Table 1.
Table 1 Sensation scale of WBGT Heat Strain Index.
WBGT Flag Colour WBGT Flag Colour
<=25.6-27.7 White 31.1-32.1 Red
27.8- 29.4 Green >=32.2 Black
29.4-31.0 Yellow
WBGT=0.7Tw+0.1Ta+0.2Tg........Eq.1The Direct Index (DI) was developed by Thom and slightly modified by Sohar. The index is given byEquation2 (Epstein & S.Moran, 2006).DI=0.5Tg+0.5Ta........Eq.2
Fanger proposed the Predicted Mean Vote(PMV) and the Predicted Percentage Dissatisfied(PPD). Both are quite similar and based on heat transfer from clothing to skin to the surrounding airand includes respiratory heat transfer. (Szokolay, 1997). PMV developed by Fanger (1972), is appliedin International Organization for Standardization (ISO) 7730. PMV is a seven point scale rangingfrom very cold to very hot and also includes metabolic rate and clo valuesapart from environmentalparameters. For an area to be thermally acceptable, the percentage of dissatisfied people must beless than 10% (ISO 7730, 1994) (Koerniawan, 2015). To apply the PMV outdoors, Jendritzky andNubler (1981) added ‘complex outdoor radiation’ ; naming the index Klima-MichelModel (KMM).Matzarakis and Mayer (1997) calculated PMV and selected PMV along with with KMM which isa ‘well-suited measure’ for measuring outdoor thermal comfort condition. (Mukherjee & Mahanta,2014). PMV is expressed in the ASHRAE comfort scale.
Physiological Equivalent Temperature (PET) is calculated using the MEMI (Munich Energy-balance Model for Individuals; Höppe 1984)model by solving Equation 3 and Equation 4 where M- metabolic rate (internal energy production), W - physical work output, R - net radiation of thebody, C -the convective heat flow,ED- the latent heat flow to evaporate water diffusing through theskin (imperceptible perspiration), Ere - sum of heat flows for heating and humidifying the inspiredair, ESw the heat flow due to evaporation of sweat, and S - storage heat flow for heating or cooling

106 INDIAN JOURNAL OF LANDSCAPE SYSTEMS AND ECOLOGICAL STUDIES VOL. 42
the body mass (Mayer & Matzarakis, Human-biometeorological assessment of urban microclimatesthermal component, 1998) .
M .W.R .C .ED.E.ReESwS =0......Eq. 3
FSC=(1/Icl)*(Tsk–Tcl)...........Eq.4
Where Tcl= mean surface temperature of the clothing , Tsk= the mean skin temperature , FCS= the heat flows from body core to skin surface, Icl = heat resistance of the clothing in K m2 W–1. (Höppe, The physiological equivalent temperature – a universal index for the biometeorologicalassessment of the thermal environment, 1999).
PET has the following assumptions: Mean radiant temperature = air temperature (Tmrt =Ta);Air velocity = 0.1 m/s. Water, vapour pressure = 12 hPa which is equivalent to relative humidity(RH)= 50% at 20°C Ta. (Mukherjee & Mahanta, 2014). The Thermal sensation vote and grade ofphysiological stress for PMV and PET is shown in Table2.
Table 2 Sensation scale for PMV and PET ( (Höppe, The physiological equivalent temperature – auniversal index for the biometeorological assessment of the thermal environment, 1999)
PMV (Degree PET (Degree Thermal Perception Grade of PhysiologicalCelsius) Celsius) Stress
Very Cold Extreme cold stress
-3.5 4
Cold Strong cold stress
-2.5 8
Cool Moderate cold stress
-1.5 13
Slightly Cool Slight cold stress
-0.5 18
Comfortable No thermal stress
0.5 23
Slightly Warm Slight heat stress
1.5 29
Warm Moderate heat stress
2.5 35
Hot Strong heat stress
3.5 41
Very Hot Extreme heat stress

NO. 2 A REVIEW OF URBAN MICROCLIMATE CONCEPTS AND THERMAL INDICES 107
The advantage of PET is that it is calculated in degree Celsius and can be calculated in anarray of microclimatic conditions including those in built up areas and other urban surface cover.PET is recommended by the new German guidelines for Urban and Regional Planners (VDI, 1998).It is easily calculated by using the software RayMan developed by Matzarakis et al. (2007andPETcan be used to produce bioclimatic maps. (Grigorieva & Matzarakis) (Mukherjee & Mahanta,2014).
One of the most important parameters for calculation of PET , on days with weak wind speed,is the mean radiant temperature (Tmrt) (Mayer and Matzarakis 1998). The ranges of the thermalstress for PET is derived from PMV values, (VDI 1998) Fanger (1972), and they depend on clovalues and metabolic heat flow . However, one may question , if the values of the range can beadjusted in accordance to the sensation and perception of human beings to the changing environmentconditions (Matzarakis, Mayer, & Iziomon, Applications of a universal thermal index: physiologicalequivalent temperature, 1999)
Standard Effective Temperature (SET) by Gagge et al.(1986) is a ‘sub-set’ of ET within conditionsstandardized in terms of metabolic rate, clothing conditions. SET has a linear relation with averagebody temperature (Tb) and at equilibrium temperature (between 23-41 degree Celsisus), SET isdetermined by Equation 5 & 6. Equation 5 for temperature below 23 degree Celsius and Equation 6for temperatures above 41 degree Celsius. (Auliciems & Szokolay, 2007)
SET = 23 - 6.13 (36.4-Tb)0.7 ……..…Eq.5
SET = 41 + 5.58 (Tb-36.9)0.87………Eq.6
Table 3 Thermal Sensation scale for SET, ASHRAE, Bedford
Vote Senastion SET Vote ASHRAE Bedford
>3 Very hot >37.5 3 Hot Much Too Warm
+2 – +3 Hot 37.5–34.5 2 Warm Too Warm
+1 – +2 Warm 34.5–30 1 Slightly Warm Comfortably Warm
+0.5 – +1 Slightly warm 30–25.6 0 Neutral Comfortable
-0.5 – +0.5 comfortable 25.6–22.2 –1 Slightly Cool Comfortably Cool
-1 – -0.5 Slightly cool 22.2–17.5 –2 Cool Too Cool
-2 – -1 Cool 17.5–14.5 –3 Cold Much Too
-3 – -2 cold 14.5–10 Cool
SET for outdoor conditions is called OUT-SET (Pickup & de Dear) (Gagge., 1969). Theassumptions in SET are Ta = Tmrt, rh = 50 %,n = 0.15 m/s ,0.6 clo , metabolic rate of 1.2 mets and thesame mean skin temperature (tsk) = skin wettedness (w). (Pickup & de Dear) . The Thermal sensation

108 INDIAN JOURNAL OF LANDSCAPE SYSTEMS AND ECOLOGICAL STUDIES VOL. 42
vote and grade of physiological stress for SET, ASHRAE and Bedford Heat stress/Thermal ComfortIndex is shown in Table3.
Case study of KolkataApart from air temeperature and surface temperature, other meteorological parameters are
important in the analysis of outdoor thermal comfort ‘especially that of site microclimates’. (Chowa,Assyakirin Binte Ali Akbara, Heng, & Roth, 2016) This paper studies the microclimate conditions inKolkata and show the thermal conditions by the different indices in order to understand the rangeof values presented in the study of outdoor thermal comfort. Kolkata has a tropical wet and dryclimate in accordance to the Koppen climate classification. Kolkata (22.34’N and 88.24’E) is locatedon the banks of River Hooghly with an elevation of 6m above msl.
The study area shows 41 locations based on road intersections of east-west and north-southarterial roadways in the city municipal area as shown in Figure 1.
Fig. 1 Showing the Study area and Data Collection stations

NO. 2 A REVIEW OF URBAN MICROCLIMATE CONCEPTS AND THERMAL INDICES 109
MethodologyThe primary data was taken for 41 stations. WBGT , RH, Ta and Tg are measured at 2 minute
interval. The anemometer and Black-Globe thermometer was set at 1 m above the ground. Anaverage of 30 minute interval readings for the parameters were taken . The details of the instrumentsare mentioned in Table 4. The instrument setup were done according to the regulations mentionedin ISO 7726. Calculation of Tmrt requires using the primary urban microclimate data on temperature,relative humidity, wind speed and globe temperature. The Tmrt is calculated using the globethermometer method. (Walikewitz, Janicke, Langner, Meier, & Endlicher, 2015)(Thorsson, Lindberg,Eliasson, & Holmer, Different Methods for estimating the mean radiant temperature in an outdoorurban setting, 2007). The microclimate data also helps to calculate PMV and SET values in RayMANpro model, version 2.1 . WBGT is calculated using the Extech Heat Stress Meter (HT30). Theresultant values were then analysed on SPSS for mean deviations and standard deviations.
Instrument usedEXTECH Heat stress WBGT Meter(HT30) with range 0° to 50°C and sensor accuracy of 1°C
for the parameter Ta. Tg also measured with the same instrument with range of 0° to 80°C andsensor accuracy of 3°C. RH measured with the same heat stress meter with range of 1-100% andsensor accuracy of +/-3%. Wind velocity measured within range of 0.80m/s to 30.0m/s with sensoraccuracy of ±(0.05 + 0.05 va) m/s (COMFORT); ±(0.1 + 0.05 va) m/s (STRESS). Global Solar Radiation& Albedo is measured with Hukseflux SRA01 Second Class Albedometer (ISO 9060) Directionalresponse < ± 25 W/m2Spectral selectivity < ± 5 % (0.35 to 1.5 x 10⁻⁶ m) Temperature response < ±3 % (-10 to +40 °C)Tilt response < ± 2 % (0 to 90 ° a t 1000 W/m2)
Figure 2 showing the instrument set up for data collection of urban microclimate parameters

110 INDIAN JOURNAL OF LANDSCAPE SYSTEMS AND ECOLOGICAL STUDIES VOL. 42
The limitations of data collection are the unavailability of secondary data for urban microclimateparameters at pedestrian level of 1-2m. The instrument setup is given in Figure 2. All data wascollected for the period of late-March, 2019, around the time of vernal equinox, from 12:00 pm to 1:00pm.
Results and Discussion The range of data is 4.70 for PMV, 24.00 for PET, 21 for SET and 4.20 for WBGT. This shows
that PET has the highest range of data followed by SET, PMV, and WBGT. The standard deviationis 1.45, 6.51, 8.46, and 2.14 respectively for PMV, PET, SET and WBGT. The variance for the samedata is 2.11, 42.32, 71.61 and 4.58 for PMV, PET, SET and WBGT. Variability of data and standarddeviation is maximum for SET followed by PET Figures 3 show that PET have high frequency ofvalues in the range of 29-35 degree Celsius denoting Warm thermal sensation.
Table 4: Showing the values for Standard Deviation, Variance, Mean and Range for the four indices:PMV, PET, SET, WBGT
PMV PET SET WBGT
Mean 2.63 32.79 25.96 21.73
n 41.00 41.00 41.00 41.00
Variance 2.11 42.32 71.61 4.58
SD 1.45 6.51 8.46 2.14
Figure 5 show that PMV have highfrequency values within the range of 1.5 -2.5sensation vote which represents Warm thermalsensation. Figure 6 shows that one station withcomfortable conditions and 23 stations havingwarm conditions according to the PET thermalsensation scale, 9 stations have slightly warmsensation, 3 have hot and 5 have very hot thermalsensation. Figure 7 shows that according to thePMV sensation vote, 7 stations have slightlywarm condition. 21 stations have warm sensation11 stations have hot sensation on PMV scaleand 1 station have hot sensation. The valuesfrom SET, show that 17 stations have slightlycool to cool conditions and 25 comfortable andonly 13 stations ranging from slightly warm tovery hot. WBGT did not show much variation indata and thus a clear difference in microclimate Figure 3 : Histogram showing the frequency
distribution of PET values of 41 stations

NO. 2 A REVIEW OF URBAN MICROCLIMATE CONCEPTS AND THERMAL INDICES 111
conditions and thermal sensation could not be presented. The study period is during late March,2019 during which the average temperature at 1.5 m pedestrian level is 30 degree Celsius and theRelative Humidity is 32-35%.
Figure 4 : Histogram showing the frequency Figure 5 : Histogram showing the frequencydistribution of SET values of 41 stations distribution of PMV values of 41 stations
From Figures 6, 7 and 8, it is clear that PET provides data for five types of thermal sensationvote which ranges from Comfortable, Warm, Slightly Warm, Hot and Very hot. PMV on the otherhand do not record any comfortable conditions and show thermal sensation vote only within the
Figure 7: Showing frequency of stations havingthermal sensation according to the PMV thermalsensation vote. Refer Table 2
Figure 6: Showing frequency of stations havingthermal sensation according to the PET thermalsensation scale; Refer Table 2

112 INDIAN JOURNAL OF LANDSCAPE SYSTEMS AND ECOLOGICAL STUDIES VOL. 42
range of Very Hot, Hot, Warm and Slightly Warm. SET provides thermal sensation vote for cool andslightly cool conditions in addition to very hot, hot, slightly warm, warm and comfortable. In thestudy period of late March 2019, the conditions cannot be described as cool to very cool atpedestrian level in outdoor conditions. PET has maximum incidence of slightly warm conditions,PMV records maximums incidence of warm conditions and SET records maximum incidence ofcomfortable to cool conditions.
Figure 8: Showing frequency of stations having thermal sensation according to the SET thermal sensationscale. Refer Table 3.
Figure 9 showing frequency of respondents on comfort in the environment from questionnaire survey inMarch 2019

NO. 2 A REVIEW OF URBAN MICROCLIMATE CONCEPTS AND THERMAL INDICES 113
In order to verify the results from the opinion of the people, a questionaire survey wasconducted for 100 sample respondents. The questionnaire schedule is prepared that consist ofquestions covering opinion on thermal sensation. Thermal sensation includes thermal perception,thermal comfort, thermal preference, thermal acceptability and thermal tolerance. 41 primary stationswere selected based on the intersection point of major arterial roads. Foreign visitors were excludedfrom this survey to avoid exaggeration.
According to the data collected and analysed from the questionnaire survey, Figure 9 showsmajority people expressing slight discomfort. Figure 10 shows 56 respondents felt slight difficulty
Figure 11 showing frequency of respondents on thermal preference in the environment from questionnairesurvey in March 2019
Figure 10 showing frequency of respondents on thermal tolerance in the environment from questionnairesurvey in March 2019

114 INDIAN JOURNAL OF LANDSCAPE SYSTEMS AND ECOLOGICAL STUDIES VOL. 42
in tolerating the thermal conditions and in Figure 11, 34 persons wanted slightly cooler conditionswhile 49 respondents wanted no change in the environment. From this questionnaire survey, it isclear that warm to slightly warm conditions prevailed in the duration of study.
Hence results from the study show that PET and PMV give a similar trend in the thermalcomfort analysis of the city during the study period. The cool and slightly cool conditionsrepresented by SET has been overlooked after performing the questionaire survey.
ConclusionSlightly cool conditions derived from SET thermal index does not match with people’s response
for the period of study in late March,2019. PMV and PET give similar trend in thermal comfortconditions existing in the city. PET is a relatively new index that is recommended by the VDI. It isa recent index, apart from UTCI, that considers clothing patterns and metabolic heat productioninto consideration. It can also be easily calculated by the RayMan software and EnviMet software.Among the four indices, PET is considered as the thermal comfort index for further use in theanalysis of outdoor thermal comfort in the subtropical microclimate conditions in the city of Kolkata.
ReferencesAndrade, T., Nery, J., Moura, T., & Katzschner, L. (2015). Urban Climatic Map Studies In Brazil: Salvador.
In The Urban Climate Map For Sustainable Urban Planning. Earthscan By Routledge.Auliciems, A., & Szokolay, S. V. (2007). Thermal Comfort. Passive And Low Energy Architecture International:
Design Tools And Techniques .Chowa, W. T., Assyakirin Binte Ali Akbara, S. N., Heng, S. L., & Roth, M. (2016). Assessment Of Measured
And Perceived Microclimates Within Atropical Urban Forest. Urban Forestry & Urban Greening ,62-75.
Epstein, Y., & S.Moran, D. (2006). Thermal Comfort And The Heat Stress Indices. Industrial Health , 388-398.
(2015). Urban Climatic Map Studies In China. In X. Fang, W. Jiang, W. Guo, N. Edward, & C. Ren (Eds.),Urban Climate Map For Sustainable Urban Planning. Earthscan By Routledge.
Gagge., A. P. (1969). Comfort And Thermal Sensations And Associated Physiological Responses At Various.Environmental Research , 2 (3), 209-299.
Grigorieva, E., & Matzarakis, A. Application Of Physiologically Equivalent Temperature For Assessment OfExtreme Climate Regions At The Russian Far East. 8 Th Conference On Meteorology-Climatology-Atmospheric Physics, (P. 2010). Freiburg: Researchgate.
Hooi Chyee Toea, D., & Kubota, T. (2013). Development Of An Adaptive Thermal Comfort Equation ForNaturally Ventilated Buildings In Hot–Humid Climates Using ASHRAE RP-884 Database. FrontiersOfarchitecturalresearch , 278-291.
Höppe, P. (1997). Aspects Of Human Biometeorology In Past, Present And Future. International Journal OfBiometeorol , 19-23.
Höppe, P. (1999). The Physiological Equivalent Temperature – A Universal Index For The BiometeorologicalAssessment Of The Thermal Environment. International Journal Of Biometeoroogy .
Höppe, P. (1999). The Physiological Equivalent Temperature – A Universal Index For The BiometeorologicalAssessment Of The Thermal Environment. International Journal Of Biometeorol .

NO. 2 A REVIEW OF URBAN MICROCLIMATE CONCEPTS AND THERMAL INDICES 115
Koerniawan, M. D. (2015). The Simulation Study Of Thermal Comfort In Urban Open Spaces Of CommercialArea Using Envimet Software.
Matzarakis, A., & Amelung, B. Physiological Equivalent Temperature As Indicator For Impacts Of ClimateChange On Thermal Comfort Of Humans.
Matzarakis, A., Mayer, H., & Iziomon, M. G. (1999). Applications Of A Universal Thermal Index: PhysiologicalEquivalent Temperature. Interantion Journal Of Biometeorol .
Mayer, H., & Matzarakis, A. (1998). Human-Biometeorological Assessment Of Urban Microclimates ThermalComponent. Proceedings 2nd Japanese-German Meeting “Klimaanalyse Fürdie Stadtplanung.Research Centre For Urban Safety And Security,Kobe University.
(2015). Introduction. In G. Mills, E. Ng, & C. Ren (Eds.), The Urban Climate Map For Sustainable UrbanPlanning. Earthscan From Routledge.
Mukherjee, M., & Mahanta, S. B. (2014). Outdoor Thermal Comfort- A Review On The Concepts, ParametersAnd Methods To Evaluate Thermal Comfort In Outdoor Spaces. Architecture-Time Space & People.
Ng, E. (2015). Urban Climatic Map Studies In China: Hong Kong. In The Urban Climate Map For SustainableUrban Planning. Earthscan By Routledge.
Oke, T. R., Mills, G., Christen, A., & Voogt, J. A. (2017). Urban Climates. Cambridge University Press.Parsons, K. (2002). Human Thermal Environments- The Effects Of Hot, Moderate And Cold Envieonments
On Human Health, Comfort And Performance. Taylor And Francis.Pickup, J., & De Dear, R. (N.D.). An Outdoor Thermal Comfort Index (Out-Set*)- -Part I –The Model And
Its Assumptions.Szokolay, S. (1997). Thermal Comfort In The Warm Humid Tropics. Retrieved From Http://Anzasca.Net/
Paper/Thermal-Comfort-In-The-Warm-Humid-Tropics/.Taha, H. (1997). Urban Climates And Heat Islands: Albedo, Evapotranspiration, And. Energy And Buildings,
99-103.Thorsson, S., Lindberg, F., Eliasson, I., & Holmer, B. (2007). Different Methods For Estimating The Mean
Radiant Temperature In An Outdoor Urban Setting. International Journal Of Climatology , 27.Walikewitz, N., Janicke, B., Langner, M., Meier, F., & Endlicher, W. (2015). The Difference Between The
Mean Radiant Temperature And The Airtemperature Within Indoor Environments: A Case StudyDuring Summer Conditions. ELSEVIER , 84, 151-161.
Received : 22 September, 2019Revised : 14 November, 2019

116 INDIAN JOURNAL OF LANDSCAPE SYSTEMS AND ECOLOGICAL STUDIES VOL. 42
Development of Subarnarekha Riverbed Potholes inGhatshila, East Singhbhum District, Jharkhand
Rupam Kumar Dutta1 and Bandita Buragohain2
Abstract : Recently, most of the scientists have emphasized on controlling factors of channel pothole formationin different parts of India with special reference to structural role for developmental of potholes. They havehardly focused on the change detection study of this micro fluvial geomorphic features. The present researchershave tried to illustrate the development of channel pothole at the confluence of Subarnarekha and its tributaryLokjeria river bed(channel outcrop) near Rajbari, Ghatshila , East Singhbhum district of Jharkhand in Indiawith a change detection study of temporal data (2013 &2019) on different geometrical parameters (majordiameter, minor diameter, depth of pothole, shape etc.) of pothole .Change detection study on development ofpothole with spatio-temporal data is an important approach in fluvial geomorphology specially for theunderstanding of pothole dynamics. Developments of potholes are related to the geology, geomorphology, flowpatterns of the river and other local factors. These micro-relief features specially along the river valleys reflectthe tectonic control of base level consistent with rejuvenation of the drainage system in Subarnarekha basin.Episodically, both deepening and widening mechanism develop shape of potholes after that, coalescence ofadjoining potholes is occurred and ultimately collapses causing valley deepening to maintain the channelequilibrium in the longitudinal profile of a river.
Keywords : Change detection, Pothole dynamics, Coalescence, Channel equilibrium.
IntroductionThe present paper deals with the channel form of Subarnarekha river with special reference to
development of potholes at the confluence of Subarnarekha and its tributary Lokjeria river bed(channeloutcrop) near Rajbari, Ghatshila ,East Singhbhum district of Jharkhand in India. Channelform whichis very dynamic in nature is altered under the influence of different controlling factors such asstream energy, stream bed lithology, sediment types and flow properties etc. Many scientists haveemphasized on various controlling factors of channel pothole formation in different parts ofSubarnarekha valley. They have given special emphasis on structural role for developmental ofpotholes but the present work has some objectives which are different from the earlier works. Theauthors think that there is a need to analyze different temporal data of pothole for the study of theirsequential change. Hence the present investigators have focused on the change detection study
1. Assistant Professor, Kultali Dr. B. R. Ambedkar College, South 24 Parganas, Email:[email protected]
2. Guest Lecturer, Brahmaputra Academy Junior College, Assam.
Ind. J. of Landscape Systems and Ecological Studies 42 (2) December - 2019, 116- 131 ISSN 0971-4170

NO. 2 DEVELOPMENT OF SUBARNAREKHA RIVERBED POTHOLES IN GHATSHILA 117
of the micro fluvial geomorphic features and as well as their gradual progress of shape. Theresearchers have tried to illustrate the sequential development of channel pothole with a changedetection study using temporal data (2013 &2019) on different geometrical parameters (major diameter,minor diameter, depth of pothole, shape etc.) of potholes. Potholes may be formed by evorsion thatis a kind of corrasion that states the mechanical wearing a way of land, generally by the impact orgrinding action of particles carried by stream (Moriswa, 1968). The twenty- five potholes have beenselected as samples of the present study. The study has also revealed that the different geometricalparameters of the selected potholes have been changed in the last 6 years indicating potholedynamics.
The study areaThe study area situated at the confluence of Subarnarekha and its tributary Lokjeria river near
Rajbari, Ghatshila , East Singhbhum district of Jharkhand in India. (fig.1). In this study twenty fivepotholes samples have been taken to measure different parameters like; major diameter, minordiameter, depth, shape, pothole materials etc including their latitude and longitude.
The Subarnarekha basin has been an area of noted repeated rejuvenation during Tertiaryperiod and it caused fresh adjustments to the evolved fluvial condition which is an important causefor such formation of potholes over the channel bed-rock (channel outcrop) along the Subarnarekhaand its tributaries. So,Subarnarekha river characterized with channel outcrop has favourablecondition specifically for the development of pothole. That is why the present researchers haveselected potholes at the confluence of Subarnarekha and its tributary Lokjeria river near Rajbari,Ghatshila as the area under study.
ObjectiveThe objectives of the present paper is to explain the development of potholes at the confluence
of Subarnarekha and Lokjeria river, Ghatshila, with quantitative techniques and focus on changedetection analysis of pothole geometry depending on the field data from 2013 to 2019.
Significance of the studyFluvial geomorphologists always try to understand rivers-their morphology and dynamics.
They want to explain quantitatively the processes by which running water develops differentfluvial landforms. The researchers think that there are several reasons to study pothole developmentin Subarnarekha river valley. Channel pothole has a great significance in fluvial geomorphologicalperspective because those landforms are thought as micro fluvial features which are the prominentgeomorphic expression of rejuvenated landscape. Being micro geomorphic feature it is easier tostudy their dynamics and evolutionary stages within a comparatively short time span (within fewyears). Studies about their chronological development will help to understand the channel adjustmentto the evolved circumstances of the rejuvenated Subarnarekha river valley that suggests thedominance of tectonic activities and down cutting process in the evolution of the present river bed-rock (channel outcrop) as well as topographic forms.

118 INDIAN JOURNAL OF LANDSCAPE SYSTEMS AND ECOLOGICAL STUDIES VOL. 42
Fig.1 Study area at the confluence of Subarnarekha and its tributary Lokjeria river indicating channel outcropcharacterized with river potholes (source- DRM, GSI, toposheet 73 J/6, field survey 2019)
Materials and MethodsThe study is based on data collected from primary and secondary sources. There are definite
purpose for using of secondary data like; District Resource Map of East Singhbhum (GSI,2006) hasbeen used to prepare location map . The geological map of the district has provided betterunderstanding about the setting of rocks and mineral types in Ghatshila and its adjacent area torelate pothole location with geological structure. Survey of India Toposheet (73 J/6), has beenutilized to show the spatial location of the study area. In this paper, illustration of Satellite Image(Google earth, 2018) has a significant role to show spatial location of twenty-five potholes accordingto their geographical coordinates (collected with GPS receiver) .The present researchers have also

NO. 2 DEVELOPMENT OF SUBARNAREKHA RIVERBED POTHOLES IN GHATSHILA 119
consulted different research papers of reputed journals to study the trend of research on potholeand find out gap in the research of the earlier scientists.
In this study more emphasis has been given on primary data collected from intensive fieldwork and photographic evidences. Primary data has been collected from selected twenty- fivepotholes of the study area in the month of March of 2013 and 2019 . During this month most of thepart of Subarnarekha channel remains dry which is the favourable condition for pothole study. Inthe year 2013 first survey was conducted. Latitude and longitude of selected potholes werecollected with GPS receiver for locating the selected potholes in map (fig.2). According to therequirement of the objective of the study, primary data was collected regarding pothole geometrylike; major and minor diameter of pothole, depth, shape of potholes, angle of pothole chamber-wallhave been measured with the help of tape and clinometers. Facial shape of potholes was identifiedand recorded with photographic evidences. Materials of pothole chambers(stones,water) were alsostudied during field visit. Some of the pothole chambers were entirely dry with stones and few ofthem contained water with stones.However, Second field visit was done again in March,2019.According to the location map of potholes on Google earth image (prepared in2013) the potholeswere identified and same geometric data of potholes was collected with same fashion and sameinstruments to make a compare between the dataset.
Fig.2 Location of potholes on Google earth image 2018 (Source: GPS data collected during field survey 2013&2019)
For the better analysis potholes are arranged according to serial number (Table -1 & Fig-4) indata table and then collected data (different geometric parameters) have been tabulated to categorize

120 INDIAN JOURNAL OF LANDSCAPE SYSTEMS AND ECOLOGICAL STUDIES VOL. 42
the potholes. Statistical techniques including measures of central tendency and measures ofdispersion have been calculated depending on the collected primary data like; length (major diameter),width (minor diameter), depth. Bivariate analysis has also been done between average depth andaverage diameter of potholes. Thematic map (Fig-3) are used to ascertain the morphologicalcharacteristics of potholes with the help of QGIS and MS Excel software.
Review of literatureThe Subarnarekha river basin is Geomorphologically well studied area by many researchers.
Several scientists have contributed their valuable research on various perspectives of potholes inSubarnarekha and its tributaries . Mukhopadhyay (1980) had done gigantic research on Subarnarekhariver basin including micro geomorphic features. Recently most of the scientists like; Sengupta &Kale(2011), Das (2018&2019), have emphasized on structural role for developmental of potholes.Dhali&Biswas (2017) discussed vividly the local controlling factors for pothole development withMulti Criteria Analysis (MCA). Bera & others (2019) have illustrated pothole dynamics ofSubarnarekha river and its tributaries with statistical analysis. Other scientists (Kanhaiya& et.al.,2019)have stressed on influence of structural control over different shape of potholes. However, Thepresent authors have identified research gap in the work of the earlier scientists. The current workis different from earlier works interms of temporal change detection study of pothole geometry aswell as the sequential development of pothole shape. None of the earlier scientists had emphasizedon change detection study on pothole development with temporal data (atleast two years), but thepresent researchers have explained the development of potholes at the confluence of Subarnarekhaand Lokjeria river, Ghatshila, with quantitative techniques and focused on change detection analysisof pothole geometry depending on the field data from 2013 to 2019. So, undoubtedly the presentwork bears a different signature compare to the earlier research in the field of Subarnarekhachannel pothole study . The study on change detection of pothole is very crucial because withoutthe change detection study or temporal data analysis of pothole geometry, proper study on potholedevelopment or pothole dynamics is not possible. As pothole is a very micro fluvial geomorphicfeatures, hence intensive and prolonged field survey are required to collect primary data of differentyears regarding pothole geometry.
Potholes as geomorphic evidences of RejuvenationThe typical landforms resulting from interruptions in the fluvial cycle of erosion and rejuvenation
include valley in valley, paired terraces (Barik&Dutta, 2013), incised meander etc in the study area.The area is characteristics with different types of micro geomorphic features like valley in valley,river terraces, river bed potholes, potholes in pothole etc. Those micro-relief features especiallyalong the river valleys reflect the tectonic control of base level consistent with rejuvenation of thedrainage system in recent time.
It has been studied that the Subarnarekha basin has been an area of noted repeated rejuvenationduring Tertiary period and it caused fresh adjustments to the evolved circumstances which is an

NO. 2 DEVELOPMENT OF SUBARNAREKHA RIVERBED POTHOLES IN GHATSHILA 121
important cause for such formation of valley in valley, river terraces of bed-rock type (channeloutcrop) along the Subarnarekha and its tributaries. (Mukhopadhyay 1980).
Fig.3 Geological Map of study area (Source: GSI, 2006)
Possibly the uplifts took place in several stages since late-Cretaceous. Subarnarekha seems toantedate the current Dalma Range of Chottonagpur plateau made of lavas, thus excavating phyllitesand mica-schists on its bed and on its upper slopes lavas have appeared at present. The river hasmaintained the same extension of valley erosion on the softer phyllite or schsits and resistantquartzite or gneisses after cutting across the Dalma and its adjoining structure (Mukhopadhyay1980).
Geology and pothole morphometry: East Singhbhum district has remarkably unique geologicalhistory of Chottonagpur plateau. Northern part of the district has extremely metamorphosed rocksand southern part of the terrain is characterized with relatively less metamorphosed rocks. Thegeological formation of this area consists of mainly metamorphosed igneous rocks of Archacan age(GSI, 2006). Surface exposure of schist/phyllite and quartzite of Singhbhum group of rocks arerecorded arounded Ghatshila, Jharkhand (Fig.3). Subarnarekha river bed is characterized with twotypes of metamorphic rock. Foliated metamorphic rocks such as phyllite, schist . Phyllite is made ofmainly of very fine grained mica. Non-foliated metamorphic rocks such as quartzite which iscomparatively harder rock than phyllite and schist. Lithology and geophysics of substrates

122 INDIAN JOURNAL OF LANDSCAPE SYSTEMS AND ECOLOGICAL STUDIES VOL. 42
significantly control potholes morphology. Morphometry of potholes on quartzite is significantlydifferent from that on mica-schist. Depth/radius ratio is higher for potholes on hard rocks (plate-1)channel outcrop (quartzite) than on soft rocks like; mica-schist (Das 2019).
Plate1: Deepening and widening lead integration among adjoining potholes over channel outcrop. (Source:field furvey-2013)
Results and DiscussionChange direction study of the selected potholes (2013-2019):
Major diameter of potholes (2013-2019): Major diameter of potholes varies from 15 cm to165cm in 2013 and from 30 cm to 170cm in 2019. In 2013, maximum major diameter of pothole was 165cm and minimum major diameter of pothole was 15cm. In 2019, maximum major diameter of potholewas 170cm and minimum was 30cm (table.1).
Minor diameter of potholes (2013-2019): Minor diameter of potholes varies from 15 cm to 70cm in 2013 and from 30 cm to 140cm in 2019. In 2013, maximum minor diameter of pothole wasrecorded 70 cm and minimum minor diameter of pothole was measured 15cm. In 2019, maximumminor diameter of pothole was found 140cm and minimum was 30cm. (table.1). Annual erosionalrate of major and minor diameters of potholes (2013-2019): Depending on the data of 2013 and2019 an approximate annual erosional rate of major and minor diameters of potholes have beencalculated. In case of major diameter of potholes, maximum and minimum rate of erosion wererespectively 7.5cm/year and 0.5cm/year. For minor diameter of potholes maximum annual erosionalrate was 11.66cm and minimum 0.5cm/year (table.1).

NO. 2 DEVELOPMENT OF SUBARNAREKHA RIVERBED POTHOLES IN GHATSHILA 123
Tabl
e.1:
Col
lect
ed p
rim
ary
data
reg
ardi
ng p
otho
le g
eom
etry
, 20
13 &
20
19
App
rox
App
rox
Dif
fere
-M
ajor
Maj
orD
iffe
renc
eE
rosi
onal
Min
orM
inor
Dif
fere
nce
Ero
sion
alD
epth
Dep
thnc
e of
Faci
alFa
cial
Sl.
Lat
itud
eL
ongi
tude
diam
eter
diam
eter
of M
ajor
rate
of
diam
eter
diam
eter
of M
inor
rate
of
with
with
dept
h of
shap
e of
shap
e of
no.
(N)
(E)
(cm
) (
cm)
diam
eter
maj
or(c
m)
(cm
)di
amet
erm
inor
poth
ole
poth
ole
Poth
ole
poth
oles
poth
oles
2013
2019
(201
3-di
amet
er20
1320
19(2
013-
diam
eter
mat
eria
lsm
ater
ials
(201
3-20
1920
1320
19)
(cm
2019
)(c
m(c
m)
(cm
)20
19)
/yea
r)/y
ear)
2013
2019
1.22
°34´
7.41
´´86
°28´
53.1
1´´
1530
+15
2.5
1530
+15
2.5
7035
-35
Cir
cula
rC
ircu
lar
2.22
°34´
5.45
´´86
°28´
48.9
0´´
5060
+10
1.66
3041
+11
1.83
9060
-30
Elo
ngat
edE
long
ated
3.22
° 34
´6.4
7´´
86°2
8´51
.09´
´40
43+3
0.5
3134
+30.
580
60-2
0Ir
regu
lar
Elo
ngat
ed
4.22
° 34
´6.2
4´´
86°2
8´52
.44´
´45
50+5
0.83
2535
+10
1.66
3020
-10
Elo
ngat
edE
long
ated
5.22
° 34
´7.6
2´´
86°2
8´54
.86´
´50
54+4
0.66
2039
+19
3.16
20.
5-1
.5L
ess
Mor
eel
onga
ted
elon
gate
d
6.22
° 34
´7.8
6´´
86°2
8´53
.69´
´50
56+6
110
35+2
54.
1620
35+1
5E
long
ated
line
ar
7.22
° 34
´6.5
9´´
86°2
8´50
.13´
´30
50+2
03.
3315
50+3
55.
8319
100
+81
Cir
cula
rTr
iang
ular
8.22
° 34
´8.1
0´´
86°2
8´54
.69´
´50
60+1
01.
6620
34+1
42.
336
35+2
9L
ess
Mor
eE
long
ated
Elo
ngat
ed
9.22
° 34
´5.5
6´´
86°2
8´48
.31´
´60
61+1
0.16
3537
+20.
3350
115
+65
Elo
ngat
edE
long
ated
10.
22°
34´5
.96´
´86
°28´
49.3
6´´
6165
+40.
6655
62+7
1.16
8040
-40
App
rox.
App
rox.
circ
ular
circ
ular
11.
22°
34´6
.52´
´86
°28´
50.3
5´´
6365
+20.
3355
60+5
0.83
6035
-25
App
rox.
Elo
ngat
edci
rcul
ar
12.
22°
34´7
.74´
´86
°28´
54.6
3´´
6570
+50.
8338
40+2
0.33
3020
-10
Tria
ngul
arTr
iang
ular
13.
22°
34´5
.67´
´86
°28´
51.2
4´´
7075
+50.
8335
40+5
0.83
8570
-15
Elo
ngat
edE
long
ated
14.
22°
34´7
.74´
´86
°28´
54.1
0´´
7580
+50.
8330
33+3
0.5
5020
-30
Elo
ngat
edE
long
ated
15.
22°
34´6
.15´
´86
°28´
48.2
1´´
7084
+14
2.33
6566
+10.
1614
032
-108
Irre
gula
rA
pp
rox
.ci
rcul
ar

124 INDIAN JOURNAL OF LANDSCAPE SYSTEMS AND ECOLOGICAL STUDIES VOL. 42
16.
22°
34´8
.56´
´86
°28´
55.6
1´´
9510
0+5
0.83
2060
+40
6.66
7012
2+5
2L
ess
Mor
eel
onga
ted
elon
gate
d
17.
22°
34´8
.56´
´86
°28´
55.1
7´´
9010
0+1
01.
6670
100
+30
512
015
0+3
0C
ircu
lar
Elo
ngat
ed
18.
22°
34´6
.36´
´86
°28´
51.5
6´´
9010
0+1
01.
6620
60+4
06.
6611
060
-50
Les
sM
ore
Elo
ngat
edE
long
ated
19.
22°
34´5
.42´
´86
°28´
49.2
9´´
9010
0+1
01.
6620
25+5
0.83
9070
-20
Elo
ngat
edE
long
ated
20.
22°
34´5
.70´
´86
°28´
51.6
5´´
7511
5+4
06.
6650
73+2
33.
8370
72+2
Elo
ngat
edE
long
ated
21.
22°
34´7
.30´
´86
°28´
53.4
6´´
9514
0+4
57.
570
80+1
01.
6690
100
+10
Elo
ngat
edE
long
ated
22.
22°
34´6
.24´
´86
°28´
48.3
9´´
115
145
+30
590
110
+20
3.33
7012
3+5
3Ir
regu
lar
Elo
ngat
ed
23.
22°
34´6
.44´
´86
°28´
49.4
4´´
120
145
+25
4.16
9013
0+4
06.
6680
140
+60
Elo
ngat
edE
long
ated
24.
22°
34´6
.53´
´86
°28´
49.8
8´´
156
162
+61
8011
5+3
55.
8355
180
+125
Irre
gula
rE
long
ated
25.
22°
34´6
.28´
´86
°28´
47.6
6´´
165
170
+50.
8370
140
+70
11.6
690
86-4
Irre
gula
rA
ppro
xci
rcul
ar
Sour
ce:
Fiel
d su
rvey
,201
3 &
201
9
Tabl
e.1:
Con
td..

NO. 2 DEVELOPMENT OF SUBARNAREKHA RIVERBED POTHOLES IN GHATSHILA 125
Table.2 Statistical analysis of collected data regarding potholes geometry in 2013 &2019
Sl. No. Categories Mean S D CV
1. Major diameter 2013 75.4(cm) 369.38 489.893
2. Major diameter 2019 87.2(cm) 427.19 489.896
3. Difference of Major diameter (2013-2019) 11.8(cm) 57.80 489.830
4. Approx Erosional rate of major diameter 1.8964(cm/year) 9.2904 489.896
5. Minor diameter 2013 42.36(cm) 207.52 489.896
6. Minor diameter 2019 61.16(cm) 299.62 489.895
7. Difference of Minor diameter (2013-2019) 18.80(cm) 92.10 489.893
8. Approx Erosional rate of minor diameter 3.1292(cm/year) 15.3298 489.897
9. Depth with pothole materials 2013 66(cm) 324.7 491.9
11. Depth with pothole materials 2019 71.2(cm) 348.81 489.9
12. Difference of depth of Pothole(2013-2019) 36.8(cm) 180.45 489.8
Source: Calculated by the authors
Depth of potholes (2013-2019): Depth of potholes (with sediment materials) varies from 2 cmto 140 cm in 2013 and from 0.5 cm to 150cm in 2019.In 2013, maximum depth of pothole was 140 cmand minimum depth of pothole was 2cm. In 2019, maximum depth of pothole was 150cm and minimumwas 0.5cm (table.1)(table-2).
Pothole geometryIn general, the potholes are developed on the high-flow regime condition in channel (Wei et
al., 2009). The potholes are changed unevenly in size, shape, and depth depending upon flowvelocity of the water. This indicates that development of pothole is only related to the geology,geomorphology, and flow patterns of the river (Wei et al., 2009).
According to some scientists (Kanhaiya & et.al.,2019) on the basis of geometry, mainly threetypes of potholes can be identified in the bedrock channel like; circular elongated, concentricpotholes(Kanhaiya & et.al.,2019). Bera & others (2019) have mentioned multidirectional potholewith other types of potholes. The present authors have identified different types of potholes in thestudy area like; circular, elongated, triangulated, irregular, linear shaped (plate.3) and speciallypotholes in pothole.
Circular potholes: Absolutely circular type of pothole is very few in number. Circular orclosely circular type of potholes occurs where the bedrocks are having veins and also joints/fractures. In 2013 about 16% of circular type (including approximately circular) potholes have beenobserved during field survey. This type of pothole occurs when the swirling water spins the load of

126 INDIAN JOURNAL OF LANDSCAPE SYSTEMS AND ECOLOGICAL STUDIES VOL. 42
the river and makes circular depressions inthe bed rocks over which the river is flowing(Kanhaiya & et.al.,2019)
Elongated potholes: Elongated potholesare the most common type of the potholes inthe study area. It can be classified as moreelongate and less elongated. About 68%(2013)and 56%(2019) of the total samples areelongated (including less & more elongated)types of pothole (table.1) These types ofpotholes show orientation of long axis eitheralong the flow direction of the river or parallelto the veins or joints over the riverbed. Thesetypes of potholes generally indicate thehigher flow regime and low eddy (Kanhaiya& et.al. 2019).
Plate. 2: Integration of potholes (source: field survey,2019)
Fig.4. Sketch of twenty five potholes based on measured depth, diameter and angle of potholes

NO. 2 DEVELOPMENT OF SUBARNAREKHA RIVERBED POTHOLES IN GHATSHILA 127
The concentric pothole: Kanhaiya andothers (2019) have stated concentric pothole intheir research work. The present authors thinkthat concentric potholes are nothing but thesame form of potholes in pothole which is anexcellent micro geomorphic expression ofrepeated rejuvenation in Subarnarekha river bedas well as basin. These potholes having 8%(table.1) of total samples (2019).Two potholes(Sl.no.13&17) have been identified as potholesin pothole during field survey (fig-4).
The concentric pothole or potholes inpothole is often associated with the giant quartzveins of the bed rocks (channel outcrop) of theriver Subarnarekha at the confluence of Lokjeriaand Subarnarekha. The present authors thinkthat the development of concentric type potholeor potholes in pothole may be influenced by
another way. That is pothole integration mechanism.
Development of potholes in pothole by pothole integration mechanism: Episodically, entrainedstones entrapped in potholes erosion and abrasion floors and wall of potholes years after years toincrease the depth and diameter of potholes. In this condition two adjoining pothole dividingwall(fig-5)becomes thinner due to both side erosion of pothole wall and gradually the potholesdividing upper wall is washed away and integration of upper part of potholes occur but at thelower part of the pothole, two different potholes are prominently observed(fig-5) and this formspotholes in pothole. Sometimes differential rate of erosion of two or several adjoining potholesdividing wall are observed, that influences the facial shapes of lower potholes. In the presentphotograph (plate.2) it is observed that right side pothole is elongated shaped and left side potholeis smaller and circular shaped. That indicates pothole dividing wall is maximum eroded towardsright Side.Out of twenty-five potholes, in two potholes have been identified as pothole in potholes.Faster and irregular widening of pothole chamber and frequent coalescence of adjoining potholegive rise to higher degree of variation in radius of potholes (Das, 2019).
Irregular shaped potholes: These types of potholes having no regular geometric shape.Irregularities are observed along their edge of the potholes. Some scientists (Bera & others, 2019)have mentioned multidirectional growth of pothole. The authors think that irregular type of potholesare as like as pothole with multidirectional growth. About 20% (2019) of the total samples areirregular type of pothole (table.1).
Fig:5: Rough Sketch of Potholes in Pot hole indicatingprimary and secondary potholes and potholes dividingwalls. Source; Prepared by authors depending on fieldevidences.

128 INDIAN JOURNAL OF LANDSCAPE SYSTEMS AND ECOLOGICAL STUDIES VOL. 42
In this case lateral expansion or growth of pothole is observed towards different directionsinfluenced by joints or cracks of bed rocks.
Plate.3 : Different shapes of potholes: A. semi circular, B.elongated, C.triangular shaped pothole, D.irregularshaped pothole indicates integration with adjoining pothole E.elongated pothole shows orientation of long axisparallel to the veins or joints over the river bed. F. circular shaped potholes influenced with joints of rocks.(Source: Field Survey, 2019)
Fig: 6 : Scatter diagram at left side(2013) indicates positive relationship between depth and average diameterof potholes. Scatter diagram at right side (2019) indicates comparatively stronger positive relationship betweendepth and average diameter of potholes. (Source: Field survey; 2013 &2019.)

NO. 2 DEVELOPMENT OF SUBARNAREKHA RIVERBED POTHOLES IN GHATSHILA 129
With the analysis of change detection data (2013 & 2019) it is found that mean value of majorand minor diameter has increased from 2013 to 2019(table.-2). It proves that the development ofpotholes is influenced under active fluvial erosion. In 2013 mean major and minor diameter were75.4cm. and 42.36cm. In 2019 mean values of both diameters have increased to 87.2cm. and 61.16cmrespectively.
The mean value of approx annual erosional rate of major and minor diameter is 1.8964 cm/yearand 3.1292 cm/year respectively (table.2). So, the mean value of annual erosional rate of minordiameter is greater (3.1292cm/y) than annual erosional rate of major diameter (1.8964cm/y). Thatreveals width (minor diameter) of the potholes is growing at faster rate compare to their length(major diameter). Depending on the calculated value it may be said that elongated potholes areconverted gradually into oval and circular shaped potholes. Both of approx annual major diametererosional rate(CV: 489.896) and minor diameter erosional rate(CV: 489.897) are about equallyconsistent .
In 2013 mean depth with pothole materials (with sediment materials) was 66 cm. and in 2019the value increases up to 71.2cm ( table.1) .This depicts that potholes are important components ofchannel incision. Progressively with the increasing of depth of potholes, valley deepening takesplace to maintain the channel equilibrium in the river Subarnarekha. It is observed that depth(withgrinding tools) of about 56 % potholes have decreased from 2013 to 2019.It means volume ofgrinding tools are increasing by years in terms of size and quantity. The scatter diagram(fig.6) of2013&2019 also expresses that with the deepening of the potholes the average diameter is increasing.The positive relationship between two variables becomes stronger from 2013( R² = 0.181) to 2019 (R² = 0.477) .
ConclusionFrom the above discussion the authors have come to some conclusions regarding pothole
development at the confluence of Subarnarekha and its tributary Lokjeria river near Rajbari, Ghatshila.These are like;
Potholes are micro fluvial geomorphic features, observed over hard rock of channel outcropwhich expresses rejuvenation of the drainage system in recent time. These are undoubtedly thesites of high energy expenditure. The energy is utilized to erode the bedrock and occurrence of themicro features under the influence of dominant eddy in channel flow.
The statistical analysis (mean of annual erosional rate of major and minor diameter) revealsthat in the study area width (minor diameter) of the potholes are growing at faster rate compare totheir length (major diameter). Depending on the calculated value it may be said that elongatedpotholes are converted gradually into oval and circular shaped pothole.
Integration of adjoining potholes plays an important role to develop facial shapes of potholesas well as the nature of channel bed of river. Differential rate of erosion of two or several adjoining

130 INDIAN JOURNAL OF LANDSCAPE SYSTEMS AND ECOLOGICAL STUDIES VOL. 42
potholes dividing wall influences development of potholes in pothole.
The scatter diagram of 2013& 2019 also expresses the positive relationship between depth andthe average diameter of pothole. The positive relationship between two variables becomes strongerfrom 2013 to 2019. That indicates with time, both deepening and widening mechanism are acceleratedaltering shape of potholes . As a result, valley deepening takes place and equilibrium of channelgradient is maintained along the longitudinal profile of the river.
Within the last six years, shape of thirteen potholes (52%) have been prominently changed. Inmost cases more elongated or elongated shape of potholes have been altered into less elongatedor other shape(Irregular, approximately circular, circular etc)of pothole. About 68% (2013) and 56%(2019) of the total samples are elongated (including less & more elongated) types of pothole andpercentage of circular (including approximately circular) type of potholes have been identified in2013 and 2019 are respectively 16% and 20%. In the year of 2013 irregular type of potholes were notfound but in 2019 about 20% irregular type of potholes of the total samples have been noticed .
So, the above quantitative analysis proves a dynamic nature of pothole development in termsof different geometrical parameters (major diameter, minor diameter, depth of pothole, shape etc.) ofthe study area.
ReferencesBarik, B., Dutta, R.K.(2013): ‘Characteristics of Subarnarekha River Terraces, Ghatsila area,Jharkhand’ published
in the journal of Landscape System and Ecological Studies, ILEE, Calcutta, June,2013, Vol.36, No.1,pp 168-171.
Bera, B., Bhattacharjee, S.,Ghosh, A.,Ghosh, S., Chamling, M.(2019): ‘Dynamic of channel potholes onPrecambrian geological sites of Chhota Nagpur plateau,Indian peninsula:applying fluvio-hydrologicaland geospatial techniques.’ SN applied sciences, Springer Nature Switzerland.
Das, B. C.,(2018): ‘Development of streambed potholes and the role of grinding stones’. J. Environ. Geogra.,2018, 11(1–2), 9–16.
Das B C (2019): ‘Control of substrates on pothole geometry “. Current Science, VOL. 117, NO. 2, pp 275-281.
Dhali,K & Biswas M(2017): ‘Mechanism of river bed potholes growth a study of middle Subarnarekha Riverbasin South East Asia.’ Springer, vol. 21(2), pp 935-959,
Kale, V. S. and Shingade, B. S.,(1987): ‘A morphological study of potholes of Indrayani knick point(Maharashtra)’. In Explorations in the Tropics (eds Datye, V. S. et al.), Dr Dikshit FelicitationVolume, Pune, pp. 206–214.
Kanhaiya,S., Singh S.,Singh C.K. and Srivastava V.K.(2019): ‘Pothole:a unique geomorphological feature fromthe bedrocks of Ghaghghar River,Son valley,India. India’,Geology Ecology Landscape,vol-3,issue-4.”pp 258-268.
Morisawa, M., (1968): ‘Streams their dynamics and morphology’Academic Publishers,Kolkata, pp66-67.Mukhopadhyay,S.C.,(1980): ‘Geomorphology of The Subarnarekha Basin’,The University of Burdwan,pp-
89-163.

NO. 2 DEVELOPMENT OF SUBARNAREKHA RIVERBED POTHOLES IN GHATSHILA 131
Summerfield M A,(1991):’Global geomorphology, An introduction to the study of landforms’,published byRoutledge. p-219.
Sengupta ,S. and Kale V S(2011): ‘Evaluation of the role of rock properties in the development of potholes:Acasestudy of the Indrayani knickpoint,Maharashtra’, J. Earth Syst. Sci. 120, No. 1, February 2011,Indian Academy of Sciences pp 157–165.
Wei,W.,Liang,M.,Huang,S.,(2009): ‘Formation and development of stream potholes in a gorge in Guangdong’,Springer Nature Switzerland. Journal of Geographical Sciences volume 19, pp118–128.
Received : 20 August, 2019Revised : 01 October, 2019

132 INDIAN JOURNAL OF LANDSCAPE SYSTEMS AND ECOLOGICAL STUDIES VOL. 42
Estimation of Shortwave Surface Albedo (SSA) and ItsImpact on Thermal Environment in Kolkata
Sujoy Sadhu1 and Lakshminarayan Satpati2
Abstract : Shortwave Surface Albedo (SSA) is an important controlling factor of the earth surface energybudget. SSA gives a clear indication about reflectivity of incoming solar radiation incident on earth surface.Quantification of SSA in urban environment is an essential task to delineate those urban surfaces which areless absorptive of solar energy to reduce surface level temperature. In this paper SSA was calculated usingoptical remote sensing data captured by Landsat TM sensor for April 2010 and November 2010 in the KolkataMunicipal Corporation (KMC) area in order to analyze summer and winter time spatial distribution of surfacealbedo. Land Surface Temperature (LST) was also estimated in KMC area by thermal remote sensing techniqueusing Landsat TM thermal infrared data for the same years to correlate with SSA. The SSA was obtained ondifferent urban surface elements and the results demonstrate that Surface Albedo was a leading factor ofthermal environment in Kolkata.
Keywords : Shortwave Surface Albedo, LST, Landsat TM, Thermal Environment
IntroductionUrban thermal environment is largely determined by reflective and emissive capacity of urban
surfaces (Bhattacharya et al. 2009). Surface albedo and land surface temperature are two fundamentalindicators to evaluate the thermal behavior of urban surfaces (Hamoodi et al. 2017). The surfacealbedo is defined as hemispherically and wavelength-integrated reflectivity of a surface and can beexpressed as the ratio of reflected to incident radiation at a particular surface or combination ofsurfaces (Taha et al. 1988 and Taha 1997). Urban surface albedo indicates the reflectivity of differenturban surfaces whereas land surface temperature elucidates the thermal properties and emissivecapacity of earth surface (Becker & Li 1990). Urban surface albedo and land surface temperaturecan be estimated through remote sensing data in 0.3 to 2.5 µm and 7.0 to 20 µm spectral regionsrespectively (Despini et al. 2016). Optical remote sensing is the only means for spatial mapping ofsurface albedo (Liang 2000). Optical remote sensing includes the detection of solar radiation reflectedfrom the earth surface through visible, near infrared and short-wave infrared bands. Several Landsatsensors like TM, ETM+ and OLI are capable to measure the ground surface reflectivity with opticalbands. Liang (2000) developed an algorithm to estimate shortwave surface albedo combining all the
1. Research Scholar, Department of Geography, University of CalcuttaE-mail: [email protected] (Corresponding Author)
2. Professor, Department of Geography, University of Calcutta
Ind. J. of Landscape Systems and Ecological Studies 42 (2) December - 2019, 132- 146 ISSN 0971-4170

NO. 2 ESTIMATION OF SHORTWAVE SURFACE ALBEDO (SSA) 133
optical bands except green band of Landsat TM and ETM+ sensors. Land surface temperature is anindirect measurement of thermal energy or surface heat of an object on land surface as a functionof radiance measured by a thermal remote sensor using thermal infrared region of electromagneticspectrum (Weng 2009).
To investigate urban thermal environment many scholars have assessed the relationshipbetween surface albedo and land surface temperature. Menon et al. (2010) found out that landsurface temperature decreased by 0.008 K for an average increase of 0.003 in surface albedo.According to Taha (1997) reasonable increasing of urban surface albedo contributed to a decreaseof 2oC to 4oC air temperature in different cities in U.S.A. Hamoodi et al. (2017) showed an inversetrend between surface albedo and land surface temperature in Perth, Australia. Wang et al. (1995)observed that surface temperature linearly increased as surface albedo increased when surfacealbedo was low (0.1–0.2), and then linearly decreased when surface albedo was high (0.2–0.35). Thepositive slope at low albedo corresponds to vegetated and wet surfaces with high evaporation,while the negative slope at higher albedo corresponds to dry surfaces with extreme low evaporation.Studies of Menenti et al. (1989) in Egypt, Zhang et al. (2005) in Yellow River Delta, China, and Li andXiao (2007) in the NW Tibetan Plateau showed similar relations.
The major objectives of the present study is to estimation of short wave surface albedo (SSA)and land surface temperature (LST) in order to investigate the thermal environment in Kolkata.
Study AreaThe Kolkata Municipal Corporation (KMC) area was selected for the study. Kolkata, a tropical
metropolitan city and the capital of West Bengal, is situated on the left bank of the Hugli River.KMC area extended from 88.24oE to 88.46oE and 22.43oN to 22.63oN and comprises with 144 wardscovering 200.71 km2 areas at an average elevation of 9 meters and located 154 km upstream fromBay of Bengal. Kolkata, most important urban habitat in eastern India, is characterized by unplannedurban growth leading to increase of impervious surfaces which absorbing more solar radiation andmake the city vulnerable to heat stress. So for the study of SSA and its consequences on urbanthermal environment, KMC area was chosen.
Kolkata, the “City of Joy” is basically belongs to tropical wet and dry climate with an annualmean temperature of 26.8oC and monthly mean temperatures in the range of 19oC to 30oC. Thesummer season extending from March to May receive maximum solar radiation and sometimetemperature exceed 40oC. The city receives most of its rainfall from the South-West Monsoonbetween June to September and the annual rainfall is about 1,600 mm. The area experiences coldand dry condition from November to February with the monthly average temperature in the range of9oC to 11oC. According to 2001 census 4580544 peoples were residing in KMC area.
1. Data and Methods:
3.1 Data Description:

134 INDIAN JOURNAL OF LANDSCAPE SYSTEMS AND ECOLOGICAL STUDIES VOL. 42
Fig 1: Location of Study Area

NO. 2 ESTIMATION OF SHORTWAVE SURFACE ALBEDO (SSA) 135
The work was totally based on satellite remote sensing data. Landsat TM images which werefreely downloaded from the archive of United States Geological Survey (USGS). All the images werealmost cloud free and clear. The details of the used images are-
Table 1: Summary of Landsat TM data used in this study
Date of Path SpatialScene Id Sensor Acquisition & Used Bands Resolution
(DD-MM-YYYY) Row (m)
LT51380442010101KHC00 T M 11/04/2010 138 SWIR,NIR, Reflective& RED,BLUE Bands-30 m
044 & TIR ThermalBand- 120 m
LT51380442010309BKT00 T M 05/11/2010 138 SWIR,NIR, Reflective& RED,BLUE Bands- 30 m
044 & TIR ThermalBand- 120 m
Image Pre-processingAtmospheric and Radiometric calibrations of the Landsat TM images were done using the
image-based dark-object subtraction (DOS) method. Both images were geometrically rectified(Projection: UTM-45N, Datum & Ellipsoid: WGS 1984) and cubic convolution (CC) re-samplingtechnique was used. The root mean square (RMSE) error was less than 1 pixel and spatial resolution(pixel size) of all the bands, including the thermal band was 30 meter after resampling.
Shortwave Surface Albedo (SSA) EstimationLiang (2000) developed an algorithm to calculate shortwave surface albedo from Landsat TM
data. The equation of SSA estimation is
(0.356* 1) (0.130* 3) (0.373* 4) (0.085* 5) (0.072* 7) 0.0181.016
Where, = shortwave surface albedo (SSA), i = top of atmosphere (TOA) reflectance valueof Blue, Red, NIR, SWIR-1, SWIR-2 bands of Landsat TM sensor. SSA is the average reflectance ofearth surface measured using shortwave bands of Sun’s spectrum excluding Green band and valuesranging from 0 to 1 (Liang 2000). Here, Landsat TM data was used for April 2010 and November2010 in the Kolkata Municipal Corporation (KMC) area applying the above formula to analyzesummer and winter time spatial distribution of SSA.
Land Surface Temperature (LST) RetrievalMono-Window algorithm (Qin, Karnielli, and Berliner 2001), Single-Channel algorithm (Jimenez
and Sobrino 2003) have been developed to estimate land surface temperature from satellite remote

136 INDIAN JOURNAL OF LANDSCAPE SYSTEMS AND ECOLOGICAL STUDIES VOL. 42
sensing data. But in urban climate and environmental studies relative LST estimation is requiredand hence, both algorithms are not widely applied in such cases (Weng 2009 & Meng and Liu2013). According to Weng (2009), the majority of urban studies are interested in relative LSTmeasurements, i.e., in mapping the spatial variations of LST and environmental modeling withrelative LSTs.
In the present study, Landsat TM thermal infrared data (Band-6) was used to retrieve LSTfor April 2010 and November 2010 in KMC area by four different steps.
Firstly, digital number (DN) values were converted to top of atmosphere (TOA) spectral radianceusing the following equation (Landsat Project Science Office, 2002):
L= ((LMAX - LMIN) / (QCALMAX – QCALMIN)) × (QCAL - QCALMIN) + LMIN
Where, Lë= TOA spectral radiance (watts/sq.m/steradian/micrometer), QCAL= The calibratedand quantized scaled radiance in units of digital numbers, LMIN= Spectral radiance scales toQCALMIN, LMAX= Spectral radiance scales to QCALMAX, QCALMIN= The minimum quantizedcalibrated pixel value (typically=1), QCALMAX= The maximum quantized calibrated pixel value(typically=255).
Secondly, the spectral radiance was converted to at-satellite brightness temperature as per thefollowing formula (Landsat Project Science Office, 2002):
2
1ln 1B
KT
KL
Where, TB= At-satellite brightness temperature in Kelvin, Lë= TOA spectral radiance (watts/steradian/sq.m), K1 and K2 are pre-launch calibration constants. For Landsat TM, the values of K1and K2 are (Chander & Markham 2003):
Constant Landsat 4 Landsat 5(TM) (TM)
K1 (mW cm-2 sr-1 µm-1) 671.62 607.76
K2 (Kelvin) 1284.30 1260.56
Thirdly, LST was derived from brightness temperature after spectral emissivity correctionusing the following equation (Artis & Carnahan, 1982):
1 ln ( )
B
B
TLST
T

NO. 2 ESTIMATION OF SHORTWAVE SURFACE ALBEDO (SSA) 137
Where, LST= Land Surface Temperature in Kelvin, TB= At-satellite brightness temperature inKelvin, = wavelength of emitted radiance which is 11.45µm for thermal band of Landsat TM(Markham & Barker, 1985), = h×c/ (1.438×10⁻² m K), = Boltzmann constant (1.38×10⁻²³ J/K), h =Planck’s constant (6.626×10⁻³⁴ J s), c = velocity of light (2.998×10⁸ m/s) and = Surface emissivity.
Lastly, LST computation from Kelvin to Degree Celsius was done by subtracting 273.15 Kelvinfrom previously derived LST in Kelvin unit based on the relation of 0oC = 273.15 Kelvin.
Results and Discussion
SSA DistributionShortwave surface albedo in Kolkata for April 2010 and November 2010 was computed. In
case of 11 April 2010 the range of SSA was 0.07 to 0.27 whereas in 5 November 2010 the range was0.05 to 0.24.
Fig 2: Distribution of Shortwave Surface Albedo
Due to higher insolation during April the SSA was relatively high in comparison with November.The nature of SSA distribution in Kolkata for both April and November months was bi-modal(shown in Fig 2) and mean SSA was 0.14 and 0.12 respectively. Two types of distribution werefound. First 0.08 to 0.1 centric which indicating high density built-up surface with lack of vegetationand another was 0.12 to 0.14 centric distribution denoting high density built-up surfaces withmoderate to low density vegetation. Outlier values were representing water and dense vegetationsurfaces for both summer and winter seasons at Kolkata in 2010.
Spatial distribution of SSA at KMC area in summer (11 April 2010) and winter (5 November2010) seasons have been shown in Figure 3 where North and Central Kolkata were depicting very

138 INDIAN JOURNAL OF LANDSCAPE SYSTEMS AND ECOLOGICAL STUDIES VOL. 42
Fig
3: S
patia
l di
strib
utio
n of
SSA

NO. 2 ESTIMATION OF SHORTWAVE SURFACE ALBEDO (SSA) 139
low SSA regions whereas South and South-Eastern Kolkata were high SSA areas. Summer timesurface albedo was higher (0.2 to 0.3) than winter time. The ward wise distribution of SSA in KMCarea has shown in Table 2.
Table 2: The ward wise distribution of SSA
SSA Zones Mean SSA Ward No.
High Albedo Region 0.15 - 0.20 58, 66, 67, 69, 94, 97, 101, 102, 103, 104, 106,107, 109, 110, 111, 112, 113, 114, 116, 122,123, 124, 125, 126, 127, 128, 129, 140, 141,143, 144
Moderate Albedo Region 0.12 - 0.15 1, 2, 3, 4, 5, 6, 13, 14, 29, 30, 31, 32, 33, 34, 36,56, 59, 63, 65, 74, 75, 78, 81, 82, 86, 87, 89, 90,91, 92, 93, 95, 96, 98, 99, 100, 105, 108, 115,117, 118,119,120,121, 130, 131, 132,133,138,139, 142
Low Albedo Region 0.8 - 0.12 7, 8, 9, 10, 11, 12, 15, 16, 17, 18, 19, 20, 21, 22,23, 24, 25, 26, 27, 28, 35, 37, 38, 39, 40, 41, 42,43, 44, 45, 46, 47, 48, 49, 50, 51, 52, 53, 54, 55,57, 60, 61, 62, 64, 68, 70, 71, 72, 73, 76, 77,79,80, 83,84, 85, 88, 134, 135, 136, 137
Source: Computed by the authors.
Urban Thermal EnvironmentShortwave surface albedo plays an important role in determining the thermal behavior of
urban surface materials. Thus, combinedly SSA and LST of any surface material would give a clearsign of urban thermal environment. In KMC area the spatial pattern of diurnal LST inverselyproportional with SSA. For example North, Central and South-West Kolkata were depicting lowalbedo region due to high ability to absorb solar radiation for which LST was utmost and Southernperipheral region was showing the inverse scenario. In Figure 4 the spatial distribution of LST forthe summer (11 April 2010) and winter (5 November 2010) seasons have been shown where, therange of LST was 31.25oC to 43.58oC on 11 April 2010 and 26.43oC to 37.55oC on 5 November2010.
In this study, several urban land use and land cover categories and different surface materialwere identified and SSA and LST on those surfaces were measured. The estimated SSA and LSThave been shown in Table 3 and 4. Green vegetation was mostly reflective surface and coolestsurface in Kolkata. The mean SSA on Tree and Grass was 0.16 and 0.18 respectively in 11 April 2010and was 0.15 and 0.16 respectively in 5 November 2010. Black Asphalt was the mostly absorptive orless reflective surface in KMC area. The mean SSA on black asphalt was 0.11 in summer and 0.09 in

140 INDIAN JOURNAL OF LANDSCAPE SYSTEMS AND ECOLOGICAL STUDIES VOL. 42
Fig
4: S
patia
l di
strib
utio
n of
LST

NO. 2 ESTIMATION OF SHORTWAVE SURFACE ALBEDO (SSA) 141
Table 3: SSA & LST measurements at 9:51 am on 11 April 2010
LULC/ Sample Geographic Coordinate SSA Diurnal LST (oC)
Materials Absolute Mean Absolute Mean
Black Asphalt 1 88.373451°E & 22.601692°N 0.11261 0.112779 40.401398 39.185
2 88.362679°E & 22.586224°N 0.11315 38.781403
3 88.345776°E & 22.517028°N 0.112576 38.373535
Grass 1 88.358632°E & 22.492391°N 0.175335 0.180219 35.067505 36.723
2 88.341865°E & 22.544143°N 0.173839 36.730255
3 88.342262°E & 22.562012°N 0.191483 38.373535
Tree 1 88.340820°E & 22.560807°N 0.154523 0.16465 38.373535 36.723
2 88.354381°E & 22.492518°N 0.165772 35.067505
3 88.292139°E & 22.473359°N 0.173656 36.730255
Water 1 88.400593°E & 22.568378°N 0.076027 0.076107 31.680756 33.644
2 88.300450°E & 22.543273°N 0.070903 32.108765
3 88.369464°E & 22.627138°N 0.08139 37.142853
Red Tile 1 88.374524°E & 22.542095°N 0.134794 0.1362 39.998108 40.266
2 88.385597°E & 22.579246°N 0.138855 40.401398
3 88.378790°E & 22.575895°N 0.134951 40.401398
Bare Soil 1 88.402679°E & 22.565164°N 0.215406 0.179649 37.964508 39.720
2 88.347121°E & 22.557333°N 0.197986 39.593719
3 88.362884°E & 22.580310°N 0.125554 41.604645
Concrete 1 88.361292°E & 22.571553°N 0.13291 0.13359 39.18811 39.322
2 88.361648°E & 22.588967°N 0.132848 39.998108
3 88.367142°E & 22.518882°N 0.135013 38.781403
White Metal 1 88.375963°E & 22.623517°N 0.17023 0.156963 39.998108 39.998
2 88.295170°E & 22.541704°N 0.140671 39.998108
3 88.397474°E & 22.573127°N 0.159989 39.998108
Old and 1 88.276164°E & 22.551862°N 0.131687 0.122706 43.588409 41.597Rusted Metal
2 88.369397°E & 22.622575°N 0.099971 40.803589
3 88.375395°E & 22.532662°N 0.13646 40.401398

142 INDIAN JOURNAL OF LANDSCAPE SYSTEMS AND ECOLOGICAL STUDIES VOL. 42
winter. The concrete surface was also less reflective in nature. The estimated shortwave surfacealbedo on concrete was 0.13 and 0.11 in summer and winter respectively. Water was the highestabsorptive and lowest reflective surface in Kolkata as the measured SSA was 0.07 and 0.06 insummer and winter correspondingly.
Fig 5: Relation between Mean SSA and Mean LST in summer
Relation between shortwave surface albedo and diurnal land surface temperature was notlinear. Polynomial (order 2) regression model (Figure 5 and 7) was best fitted (R2= 0.67 and 0.70) toshow the relationship between SSA and diurnal LST. The correlation was inversely related to Grass,tree, bare soil and white metal whereas positively correlated to water, black asphalt, old & rustedmetal, concrete and red tiles. Second order polynomial best fit curve (parabolic) was showing thatLST was not controlled by SSA alone but there were several another factors determining the landsurface temperature. Water surface hardly reflects solar energy but absorb with maximum extent,however water body had relatively low diurnal LST due to its high specific heat and high thermalinertia. Likewise concrete surface also had the same thermal behavior. Hence, thermal inertia was akey factor of diurnal thermal environment in Kolkata. Old & rusted metal and white metal had highreflectivity and high diurnal LST as well. It indicating metal sheets was very emissive material withvery low thermal inertia. On the contrary green vegetation reflects solar radiation with highestmagnitude but emits surface heat at lowest extent.
In Figure 6 mean SSA of different surface materials in KMC area has been shown and it isclear that all the man made materials like black asphalt, concrete and metal sheets had low SSA orhigh ability to absorb solar radiation but natural surface covers like tree, grass, soil etc hadhigh potentiality to reflect solar radiation to make urban environment relatively cool andcomfortable.

NO. 2 ESTIMATION OF SHORTWAVE SURFACE ALBEDO (SSA) 143
Fig 6: Surface materials specific SSA distribution
Fig 7: Relation between Mean SSA and Mean LST in winter.

144 INDIAN JOURNAL OF LANDSCAPE SYSTEMS AND ECOLOGICAL STUDIES VOL. 42
Analyzing the impact of SSA on diurnal LST in Kolkata, it was observed that diurnal LST waslinearly increased with increasing SSA when surface albedo was low (0.05 to 0.14) but diurnal LSTwas linearly decreased with increasing SSA when surface albedo was high (0.14 to 0.27).
Table 4: SSA & LST measurements at 9:50 am on 5 November 2010
LULC/ Sample Geographic Coordinate SSA Diurnal LST (oC)
Materials Absolute Mean Absolute Mean
Black Asphalt 1 88.373451°E & 22.601692°N 0.105109 0.097895 31.680756 31.680
2 88.362679°E & 22.586224°N 0.093641 31.680756
3 88.345776°E & 22.517028°N 0.094935 31.680756
Grass 1 88.358632°E & 22.492391°N 0.155644 0.165803 29.955078 29.810
2 88.341865°E & 22.544143°N 0.179313 29.520142
3 88.342262°E & 22.562012°N 0.162453 29.955078
Tree 1 88.340820°E & 22.560807°N 0.159007 0.151698 28.645905 28.791
2 88.354381°E & 22.492518°N 0.148818 28.645905
3 88.292139°E & 22.473359°N 0.147269 29.083801
Water 1 88.400593°E & 22.568378°N 0.059138 0.069556 27.765869 28.642
2 88.300450°E & 22.543273°N 0.073575 28.206665
3 88.369464°E & 22.627138°N 0.075956 29.955078
Red Tile 1 88.374524°E & 22.542095°N 0.117831 0.119385 32.960663 33.101
2 88.385597°E & 22.579246°N 0.123713 33.384613
3 88.378790°E & 22.575895°N 0.116612 32.960663
Bare Soil 1 88.402679°E & 22.565164°N 0.166005 0.144653 30.388611 31.528
2 88.347121°E & 22.557333°N 0.155498 30.388611
3 88.362884°E & 22.580310°N 0.112455 33.807312
Concrete 1 88.361292°E & 22.571553°N 0.113506 0.111122 32.108765 32.108
2 88.361648°E & 22.588967°N 0.111317 32.108765
3 88.367142°E & 22.518882°N 0.108544 32.108765
White Metal 1 88.375963°E & 22.623517°N 0.161565 0.138756 34.228668 33.099
2 88.295170°E & 22.541704°N 0.108446 32.5354
3 88.397474°E & 22.573127°N 0.146256 32.5354
Old and 1 88.276164°E & 22.551862°N 0.117853 0.11007 35.067505 34.366Rusted Metal
2 88.369397°E & 22.622575°N 0.086447 33.384613
3 88.375395°E & 22.532662°N 0.125911 34.648712

NO. 2 ESTIMATION OF SHORTWAVE SURFACE ALBEDO (SSA) 145
ConclusionsThis research paper highlights the estimation of shortwave surface albedo to assess the
reflectivity of urban Kokata and to investigate the correlation between SSA and LST in order tounderstand the diurnal thermal environment in KMC area in summer and winter as well. Summertime surface albedo was relatively high (2%) than winter. Spatial distribution of SSA in both seasonsindicates north, central and north-west Kolkata was high diurnal LST regions than rest of KMCarea. Southern peripheral Kolkata was comparatively cooler (5oC to 7oC) zone in KMC area due to6% to 8% high SSA than north and central Kolkata.
Surface elements or materials specific SSA and its corresponding LST values showed thatgreen vegetation was the only surface which reflects most part of the incoming solar radiation andproduce cold spots in Kolkata. Old and rusted metal sheets were high reflected as well as highemitted surfaces as it increased both the diurnal LST and SSA. Dark colored or black asphalt wasone of the important road-constructional material had high thermal capacity to increase diurnal landsurface temperature. Red tiles frequently found in slums had high diurnal LST values whereasconcrete (built-up surface) was highly absorptive of solar radiation or least albedo surface (SSAwas 11% to 13%) but exhibit relatively low diurnal LST indicated high thermal inertia. Likewise,Water also had very high thermal inertia as it absorb almost 93% of solar radiation incident on waterbodies but created diurnal cold spots in Kolkata.
Finally, the correlation between SSA and LST was non linear and the result confirmed thaton all kind of man made surfaces SSA and diurnal LST were positively correlated but on naturalland cover or non built-up surfaces both parameters were negatively correlated. The study arguedto preserve and enhance the green and water surfaces to reduce surface heat island effect in KMCarea.
AcknowledgementsThis work is funded by University Grant Commission (UGC), Ministry of Human Resource Development
(MHRD), Government of India. We are grateful to United States Geological Survey (USGS) forproviding the free Landsat TM images.
ReferencesArtis, D. A. and Carnahan, W.H. (1982) ‘Survey of Emissivity Variability in Thermography of Urban Areas’,
Remote Sensing of Environment, 12, 313–329.Becker, F. and Li, Z.L. (1990) ‘Towards a local split window method over land surfaces’, Remote Sensing, 11
(3), 369-393.Bhattacharya, B.K., Mallick, K., Padmanabhan, N., Patel, N.K. and Parihar, J.S. (2009) ‘Retrieval of land
surface albedo and temperature using data from the Indian geostationary satellite: a case study forthe winter months’, International Journal of Remote Sensing, 30:12,3239-3257.
Chander, G. and Markham, B. (2003) ‘Revised Landsat-5 TM radiometric calibration procedures and postcalibration dynamic ranges’, IEEE Transaction on Geosciences and Remote Sensing, 41, 2674-2677.
Despini, F., et al. (2016) ‘Correlation between remote sensing data and ground based measurements for solarreflectance retrieving’, Energy and Buildings, 114, 227-233.

146 INDIAN JOURNAL OF LANDSCAPE SYSTEMS AND ECOLOGICAL STUDIES VOL. 42
Hamoodi, M.N., Corner, R. and Dewan, A. (2017) ‘Thermophysical behavior of LULC surfaces and theireffect on the urban thermal environment’, Journal of Spatial Science, 64:1, 111-130.
Jimenez, J.C., and Sobrino, J.A. (2003) ‘A generalized single-channel method for retrieving land surfacetemperature from remote sensing data’, Journal of Geophysical Research, 108, doi:10.1029/2003JD003480.
Li, G. P., and Xiao, J. (2007) ‘Diurnal variation of surface albedo and relationship between surface albedo andmeteorological factors on the western Qinghai-Tibet Plateau’, Scientia Geographica Sinica, 27 (1),63–67.
Landsat Project Science Office, (2002) Landsat 7 Science Data User’s Handbook. Available online at: http://ltpwww.gsfc.nasa.gov/IAS/handbook/handbook.
Liang, S. (2000) ‘Narrowband to broadband conversions of land surface albedo I algorithms’, Remotesensingof Environment, 76, 213-238.
Markham, B.L. and Barker, J.L. (1985) ‘Spectral characterization of the landsat thematic mapper sensors’,International Journal of Remote Sensing, 6, 697-716.
Menenti, M., et al. (1989) ‘Linear relationships between surface reflectance and temperature and theirapplication to map actual evaporation of groundwater’, Advances in Space Research, 9 (1), 165–176.
Meng, F. and Liu, M. (2013) ‘Remote-sensing image-based analysis of the patterns of urban heat islands inrapidly urbanizing Jinan, China’, International Journal of Remote Sensing, 34:24, 8838-8853.
Menon, S., et al. (2010) ‘Radiative forcing and temperature response to changes in urban albedos and associatedCO2 offsets’, Environmental Research Letters, 5 (1), 014005.
Qin, Z., Karnielli, A. and Berliner, P. (2001.) ‘A mono-window algorithm for retrieving land surface temperaturefrom Landsat TM data and its application to the Israel–Egypt border region’, International Journalof Remote Sensing, 22, 3719–3746.
Taha, H. (1997) ‘Urban climates and heat islands: albedo, evapotranspiration and anthropogenic heat’, Energyand Buildings, 25 (2), 99-103.
Taha, H., et al. (1988) ‘Residential cooling loads and the urban heat island- the effects of albedo’, Building andEnvironment, 23 (4), 271-283.
Wang, J., et al. (1995) ‘The scaling-up of processes in the heterogeneous landscape of HEIFE with the aid ofsatellite remote sensing’, Journal of the Meteorological Society Japan 73(6), 1235–1244.
Weng, Q. (2009) ‘Thermal Infrared Remote Sensing for Urban Climate and Environmental Studies: Methods,Applications, and Trends’, ISPRS Journal of Photogrammetry and Remote Sensing, 64, 335–344.
Zhang, C., et al. (2005) ‘A study of the ground surface parameters in the Yellow River Delta using remotesensing data’, Hydrology and Engineering Geology, 2, 71–75.
Zhang, Y. F., et al. (2012) ‘Diurnal relationship between the surface albedo and surface temperature inRevegetated Desert Ecosystems, Northwestern China’, Arid Land Research and Management, 26(1), 32-43.
Received : 14 July, 2019Revised : 09 September, 2019

NO. 2 GEOMORPHIC UNITS OF THE SIKKIM HIMALAYA 147
Geomorphic Units of The Sikkim HimalayaSamir Kumar Samanta1
Abstract : The Sikkim Himalaya is a tiny but unique segment of the entire Himalayan system. The ridges andspurs lying in this segment mostly belong to the Great and Middle Himalayas with altitudes varying from twoto eight thousand metres. The rugged mountains together with extremely dissected valleys of the tract exhibittheir evolution through vigorous weathering and erosional processes in one hand. On the other hand faultsand thrusts of different sizes along with cascades and terraces of different volumes (both of fluvial and glacialtypes) show structural instability of the region too. The neo-tectonic upliftments of the terrane have made thelandscape much more attractive to the explorers as well as earth scientists. Hence the present paper is tryingto attempt for identification of geomorphic units of the whole region (in a meso-level study) which must be aguide-base for the future researchers.
Keywords : Thrust, Terrane, Morpho-climatic region, Glaciofluvial, Periglacial, Massif, Shastrugi, Sichelwannen.
Location and AreaSikkim is located to the north of West Bengal and is bounded by Nepal, Tibet (China) and
Bhutan in its other sides. Administratively the state is divided into four districts – North, West,South and East Sikkim. All the districts are totally adorned with picturesque mountains and theirassociated ridges. In no part is found a plain except the narrow strips of terraces along the deepglens. The boundaries of the state are well demarcated by natural elements: west, north and eastrunning along the watershed of the great Tista basin; whereas the south following the courses ofthe rivers Rammam- Bari Rangit and Rangpo. The latitudinal extension of tract is 27p 012 to 28p082 N, while its longitudinal confinement lies in between 88p 012 and 88p 552 E. Maximum lengthfrom north to south is 112 kilometre, while the same from west to east is only 84 kilometre. Total areaof the region is 7096 square kilometre, though the surface area seems to be much larger on accountof its wavy, extremely dissected topography netted with ridges and valleys of irregular shape andsize. The highest point of the state is represented by the eastern part of North Kangchendzongapeak (8586m). The elevation rapidly decreases towards south-east and descends below 400 metrecontour at Melli - the southernmost point of the terrain.
Objectives and MethodologyThe present study is meant for exploring the structural background of the Sikkim Himalaya.
The other objectives include finding out the regional contrast in Geomorphological features in the
1. Associate Professor, Acharya B. N. Seal College, Koch Bihar, Email: [email protected]
Ind. J. of Landscape Systems and Ecological Studies 42 (2) December - 2019, 147- 157 ISSN 0971-4170

148 INDIAN JOURNAL OF LANDSCAPE SYSTEMS AND ECOLOGICAL STUDIES VOL. 42
state; and to identify Geomorphic units of the tract on the bases of Litho-structural characteristicsas well as Landform variation.
Since this is a first time effort to delineate the Geomorphic units of the Sikkim Himalaya inmeso-level, hence the author had to depend mostly on field study for prolonged period (more thanthree decades). However, for acquiring basic ideas about the topography of the state topographicalmaps published by SOI and satellite imageries produced by ISRO have been examined in detail.
Structural BackgroundThe beautiful landforms of the Sikkim Himalaya are resting upon such a geological structure
which is one of the most complicated structures not only in the Himalayan Ranges but also in theworld. In general the region comprises a series of thrusts the planes of which are inclined fromnorth to south. The angle of the thrusts decreases also from north to south - more than 30p nearChomoyummo to less than 10p around Jorethang and Rangpo. The faults along the Tista valleydivide the thrusted blocks into two main groups: in the west Jongsong- Kangchendzonga- Kabru-Singalila; and in the east Gurudongmar- Dongkiya – Chola Ranges. The blocks lying in the westernpart are more massive and elevated than those located in the eastern part.
The first map of geological characteristics of the Sikkim Himalaya, though in incomplete form,was prepared by W. S. Sherwill in 1854. In 1874, F. R. Mallet, a geologist of G. S. I., Published acoloured map of the region with his report on mineral resources which are found locally. In 1878, theTista valley was traversed by L. V. Loczy who described in details the thrusts and other types offaults found in that segment. Following his account E. Suess, the Austrian expert on the Alpinestructure, explained elaborately the nature of the strata in his famous book ‘Das Antlitz der Erde’brought out during 1883-88.Here he first pointed out the ‘Nappe’ structure of the Singalila andDongkiya Ranges. Advancement of the concept regarding Nappism of the Ranges lying in south-west and south-eastern sections of Sikkim as well as the high thrusting in the northern mountainswent on by the explorers of the 20th century. F. Smythe and E. E. Shipton identified the fossiliferrousrock beds in the Jongsong peak during their expedition in 1930. The nature of thrusts enclosing theGreat Himalaya extending from Kangchendzonga to Pauhunri was clearly described by S.S. Roy inearly 1980’s. Recently, especially during the last three decades, many Indian geologists along withthe scholars from different Universities studied the region in detailed. They unveiled almost all thecomplicacy in the structure of the mountains and valleys through their micro-level studies andexplained them much more scientifically.
Although the width of the entire Himalayan mountain chain is the narrowest in Sikkim-Darjilingregion the pair of Main Central Thrusts can clearly be identified here: the first one running alongthe southern precipices of Kabru- Simvo– Siniolchu- Gurudongmar mountains, and the secondrunning below the straths of the rivers Rammam-Baro Rangit and Rangpo. The Ranges lying inbetween these two great thrusts may be grouped as the part of the Middle Himalaya. The LesserHimalaya is exclusively located in the south of the southern Main Central Thrust and comprises the

NO. 2 GEOMORPHIC UNITS OF THE SIKKIM HIMALAYA 149
ridges of Darjiling and Kalimpong districts, West Bengal. The Great Himalaya masters up the loftiestparts of the system and includes all the mountains lying to the north of the northern Main CentralThrust. Almost all portions of the Middle and Great Himalayas are composed either of Archaeangneiss and schists or of felsic igneous rocks originated in Upper Tertiary period except the extremesouthern belt where some sedimentary facies, though very much squeezed and partly metamorphosed,seem to be exposed by prolonged denudation.
The Northern Boundary Fault marks the northern limit of the Great Himalaya. It continues fromthe Nepal gap in the west to Chholamu lake area in the north-east. Two main headstreams of theriver Tista, the Lhonak chhu and Lachen chhu have set up their valleys along this Fault. Themountains lying beyond the Fault may be grouped into the Trans-Himalayan Range. Jongsong andChomoyummo mountains are two important units of this system. They are composed of fossiliferoussedimentary rocks showing from Lower to Upper tertiary formations.
Evolution of LandformsThe evolution of landforms in the Sikkim Himalaya is controlled strongly by the local tectonic
movements as well as past and present climatic conditions prevailing over the tract. Since themountains are located on the colliding plate margin (Indian – Tibetan plates) and are rising rapidly(10 to 12 mm per year) they are very fragile in nature. Moreover the terrain is influenced heavily bythe oscillating winds in different seasons. In fact the region experiences the chill effects of theNorth-Eastern Trade blowing from the Tibetan Highland from October to May, while it bears themoist attack of the South-West Monsoon from June to September. Total amount of precipitationcaused by these two winds is much more than any other part of the Middle or Great Himalayas.Thus the denudation processes are also vigorous over the mountains. According to Strakhov’scategorization of morpho-climatic region the land belongs to ‘Ta’ zone. Characteristically the tract isvery much rugged and the landforms produced here are changing quickly. The variation indenudation processes and their intensities have been increased during the Holocene epoch, especiallyafter the deglaciation of the Pleistocene ice sheets spread over the mountains. As a consequencethe rates of slope retreat across the mountain faces and the valley deepening in between haveenhanced enormously in the last few millenniums.
Until 4000 years before present the entire region was covered with the last phase of Pleistoceneice sheets showing little or no sculpturing over its landforms. The sheets began to retreat thereafterand, astonishingly with rapid pace, leaving some major and numerous minor glaciers. The latterones retreated in the last millennium - the snouts of the major glaciers rose above 5000 metre in theeighteen century while the minor ice-flows became extinct. At present the summit sections of thelofty mountains situated above 6000 metre are only covered with permanent ice caps. Maximumportions of the terrain are now exposed either for glaciofluvial or fluvial processes. A little belt lyingin between the Great and Trans Himalayas, especially along the upper sections of the Lhonak andLachen chhu, show some effects of aeolian process. While the extreme south- eastern part, alongthe gentler slopes of the Chola Range, exhibits some accumulations of periglacial deposit.

150 INDIAN JOURNAL OF LANDSCAPE SYSTEMS AND ECOLOGICAL STUDIES VOL. 42
Regional Contrast in Geomorphological FeaturesThe geomorphology of the Sikkim Himalaya was observed and described part by part by
many explorers in the 19th and 20th centuries. In 1848-49 J. D. Hooker, the famous naturalist,traversed large part of western and northern sectors and presented a vivid account of landformcharacteristics of the districts. J. C. White examined the local physiography in more detail throughhis journeys across the Ranges of the entire state during his prolonged service-period as theBritish Political agent in Sikkim (1887-1908). He is the first person who surveyed and marked thenorthern limit of the Tista basin. The magnificent landscapes of the massif Kangchendzonga and itssurrounding mountains were further analysed by D. W. Freshfield during an expedition of anenthusiastic team led by him in 1899. His book ‘Round Kangchenjunga’, well illustrated with manymaps and photographs, provides valuable information of the region regarding differentiated terrainas well as condition of glacial fields during that time. In 1950’s M. K. Bandopadhyay, an eminentIndian geomorphologist observed the landforms of North Sikkim. He explained them first in theview of geomorphological science. In late 1970’s S. C. Mukhopadhyay studied the Tista basin as awhole and published his research-works in an encyclopaedic book ‘The Tista Basin’. Since 1980’smany other Indian geomorphologists have been selecting different parts of the tract for theirresearches. Their theses elucidate more the alteration of physiographical constituents of the areasin relation to recent environmental changes. The local expedition-teams also give us valuableinformation on changing nature of the surface configuration lying in high altitudinal segments.
In respect of altitude, shape and size the landforms in the region show spectacular but perplexedfigures sometimes varying within a very short distance. Like other parts of the Himalayan mountainsystem the chain of the Great Himalaya of this state rises high enough to its neighbouring ridges.The massif of Kangchendzonga peaks stands at its westernmost point but shares a heavy isostasybeing deep rooted (about 80 km) with extensive base (over 100 sq. km) composed of compactgranite-gneissic rocks. Sedimentary formation is found over 8000m with a negligible slice (250m) ofyellow sandstone. Three out of five peaks, North (the highest, 8586m, as stated earlier), Central(8482m) and South (8494m) stand along the International boundary between Nepal and Sikkim.Other two, North-western peak, also known as Yalung Kang (8505m) and the most western oneKangbachen (7903m), are exclusively located in Nepal territory. The great North Kangchendzongapeak is saluted by a series of mountains each of which has a stupendous mass though seem to behumble in size on account of their nearby king. From close to distant location from the king runningtowards north the peaks of these mountains are Twin (7117m), Tent (7343m), Pyramid or Phatibara(7123m) and Lango (6920m). Some famous glaciers are found at their eastern face, e.g. Zemu atNorth and Central Khangchendzonga, Green lake glacier at Twin, and Lhonak at Lango. All of theglaciers have been retreating rapidly for the last two centuries.
From central part of Kangchendzonga stretches another line of Generals standing across ahigh jagged Range with varying width of 5 to 15 kilometres. They are relatively slender in size butmuch magnificent in shape. From west to east (slightly swinging north-easterly) they are Simvo(6812m), Siniolchu (6888m), Lama Anden (6116m), Kangchengyao (6889m), Gurudongmar (6715m)

NO. 2 GEOMORPHIC UNITS OF THE SIKKIM HIMALAYA 151
and Pauhunri (7125m). All of them are ice-covered though the volume of their glaciers is less thanthat of the northern mountains. The Cervino-type peak Siniolchu represents the maximum gradientalong its free-faces (more than 75p ) and is said by the explorers ‘The Gracest Mountain in theworld’. After Lama Anden the Range has been shifted northward by a Transverse Fault throughwhich passes the Lachen chhu. The stream is the main source of the mighty river Tista and isoriginated from the glacier Kang tse lying at northern face of Pauhunri. The valley of the stream iswide and shallow with very slender thalweg in its upper section situated over a thick moraine-belt,but becomes narrow and deep, rocky gorge just entering into the aforesaid Fault. FromKangchengyao a klippen type ridge, Tsen-gui Kang, extends southward for about 40km parallel tothat Fault. Its altitude reaches maximum at the spire Chombu (6362m) and terminates abruptly atChungthang (1790m) - the confluence point of the torrents Lachen chhu and Lachung chhu, andthe starting point of the river Tista.
In front of the southern precipice of South Kangchendzonga peak a large brigade of mountainsare standing from south-south- west to south- south-east. They are badly dissected by vigorousattacks of sub-aerial erosional activities. In Sikkimese territory the main guards are Talung (6529m),Kabru group (North peak-7338m), Rathong (6678m), Koktang (6147m) and Pandim (6691m). Theglaciers lying at their bases are small in volume and flow down enough below the permanent snow-line (occasionally reaching 4200m). Except Talung, all of them lie at the head of the river Bari Rangitwhich is the main right hand tributary of the river Tista. There are many conjectures regarding itsage and valley formation. According to recent geological explorations along with geomorphologicalobservations it may be concluded that the river originated sometime in between the last twoPleistocene ice ages and initially was a sluggish subsequent stream of the river Rammam (west ofJorethang lies the confluence point of the two). The latter is much older in age (Oligocene), directedby the lineation of Main Central Thrust and was a larger tributary of the Tista in many interglacialtimes. The glaciers situated over the south-eastern slopes of Talung and South Kangchendzonga,however, follow a common easterly direction – another example of a structurally controlled valleybut bedded over higher altitudes. Residuals of glacial terraces along the valley indicate the elevationof the former glacial valleys developed in different phases of the Pleistocene glaciation. The riverTalung chhu carving this valley joins the Tista near Mongan, the headquarters of North Sikkimdistrict. The water-parting between the Talung chhu and Bari Rangit is represented by a series ofhigh ridges crowned with some lofty crags the altitudes of which vary from 5500 metre to 5800metre. Narsing peak (5840m) is the highest amongst them revealing a mass resistant to erosionbecause of its pure gneissic structure.
The western side of the Bari Rangit basin is bounded by the Singalila Range – a spectacularnappe uprooted from the Kangchendzonga-Kabru mountains. It stretches from Kang peak (5580m)for about 40km and crosses the southern Main Central Thrust to the south of Melido or Singalilapeak (3685m). Due to its fragile structure the summit line is very much undulating: the sharp rockpinnacles are projected at the end of synclinorium; while round headed crags are situated on itsstable central portion. Sub-aerial erosion has obviously been increasing the ruggedness of crest-line since the retreat of Pleistocene ice-covers.

152 INDIAN JOURNAL OF LANDSCAPE SYSTEMS AND ECOLOGICAL STUDIES VOL. 42
From Pauhunri emanates a large thrust, Dongkiya Range which strides southward for about 50kilometre. It is separated from Tsen-gui kang by a fracturing belt of the Lachung chhu valley andleans over the Chola Range just north of Cho la (4435m). The altitude of this Range decreases from6500 metre in the north to 4400 metre at its southern end. No permanent glacier is present along itscentral and southern parts, though huge amount of snowfall occurs during the prolonged coolperiod: from late September to June. Consequently glaciofluvial landforms such as proglacial channelswith sandur valleys and kame terraces are very common in the region. The stream Rate chhuoriginates near Cho la which makes the boundary between North and East Sikkim, and ultimatelyplunges into the river Tista near Dikchu. The Range Chola extends further south for 20 kilometrealong the eastern boundary of East Sikkim and acts as the water-divide between Rangpo-De chhuvalleys lying in the district and Ammo chhu in Tibet. Nathu La (4310m) and Jelep La (4270m) are twofamous passes across this Range. Rangpo with its numerous tributaries drains more than half of theEast district and joins the Tista near Rangpo town - the main gateway of the state Sikkim. On thecontrary, the De chhu excavates a narrow valley in south-eastern portion of the area, cuts deeplythe last tip of Chola Range and ultimately flows southward through a glen to mark the boundarybetween Darjiling district and Bhutan. After meeting its left bank tributary, the Ne chhu, the river isrenamed as Jaldhaka.
The mountains along the northern boundary of Sikkim and beyond Chorten Nyima La (5685m)belong to Trans Himalayan system. Jongsong (7462m) peak is the highest among them. All of themincluding the subdued ridges on the north of the upper Lachen valley are carved both by glacierand wind resulting round-headed, grooved and fragile landforms partly due to soft sedimentarystructure but mostly by the effects of arctic to sub-arctic climates prevailed over the section. Thepermanent ice-cover (shastrugi-like icy coverage) over the upper Lhonak valley has diminishedduring the last hundred years. It is now characterised by different types of friction cracks andsichelwannens. Chomoyummo (6829m) is the second highest in the northern mountain belt whoseprojected mass Chuma kang ridge compels the Lhonak chhu to flow south-easterly direction beforeplunging down into the Lachen chhu (just north of Lachen town).
Regular tectonic disturbance as well as intensive glacial action causes numerous excavationsin the surface topography of the state. Most of them represent enchanting lakes (more than tens ofhectare in areas) – fed either by glacier or by rains. Gurudongmar (5200m) and Chholamu (5100m)are two such glacier-fed lakes lying at the head of the Lachen Chhu valley. Their depths aredecreasing constantly by the depositional work of the southlying glaciers. Green lake (4600m), atthe confluence of the snouts of Zemu and Green lake glacier, has been transformed recently into aboulder-strewn bog for the same reason. There are many tarns at the base of Chola Range amongstwhich Tsomgo (3800m) and Kupup (4000m) are frequently visited by the tourists. The first one is atthe head of the Lungze Chhu and is in very distressed condition in effect of increasing anthropogenicactivities. The second one, lying along the sagging part to the west of Jelep la, is the main sourceof the De chhu. The lake area, however, shows relatively better environs. Human construction isabsent here till now most probably for its harsh climatic condition. A number of medium sized tarnsare found in the upper portion of the Bari Rangit valley. These are located in different altitudes –

NO. 2 GEOMORPHIC UNITS OF THE SIKKIM HIMALAYA 153
from 1700 metre to 5000 metre. Most of these are inaccessible to general tourists and, hence, arefree from human interferences. All these lakes are going to be filled up slowly by natural processesof mass-wasting.
Geomorphic Units
Geomorphic Unit
1. Summit section of theGreat and Trans-Himalayas (above 6000m).
2. Upper part of the Lhonakbasin
3. Upper part of the Lachenchhu valley
Landform variationLitho-stratigraphicalcharacteristics
1. Gigantic thrusts mainlycomposed of Archaeangneiss and schists in GreatHimalaya with thin layer oflimestone over 8000m onKangchendzonga massif;closed folds occurring inTrans- Himalaya havingfossiliferous sedimentaryformations of Tertiatyperiod.
2. Series of small to mediumTransverse faultsoffsetting the NorthernBoundary Fault; surfacerocks are Archaeangneiss,milonite andschists with intrusions ofpegmatite of later ages;limestone, flagstone andother Tertiary sedimentaryrocks found along thenorthern ridges.
3. Northern Boundary Faultis concealed beneath thethick layer of Pleistocenetill deposits; northernsubdued ridges arecomposed of fossiliferousshale, sandstone andgreywacke; black
1. Highly rugged summitspermanently covered withice and glaciers; cirqueswith high, steep headwall,jagged arêtes, and mediumto long glacial terracesgenerally adorned with icecornices and seracs(absent in eastern part).
2. Wide glacial valleys withhanging ones on bothsides of the trunk streams,bedrocks are marked byrock pedastals, frictioncracks and sichelwannens.
3. Shallow and thin thalwegrolling down through awide glacial valley of thelast Ice ages flanked withhigh trains of lateralmoraines; scattered erraticboulders over smoothlayer of ground moraines;all features are being
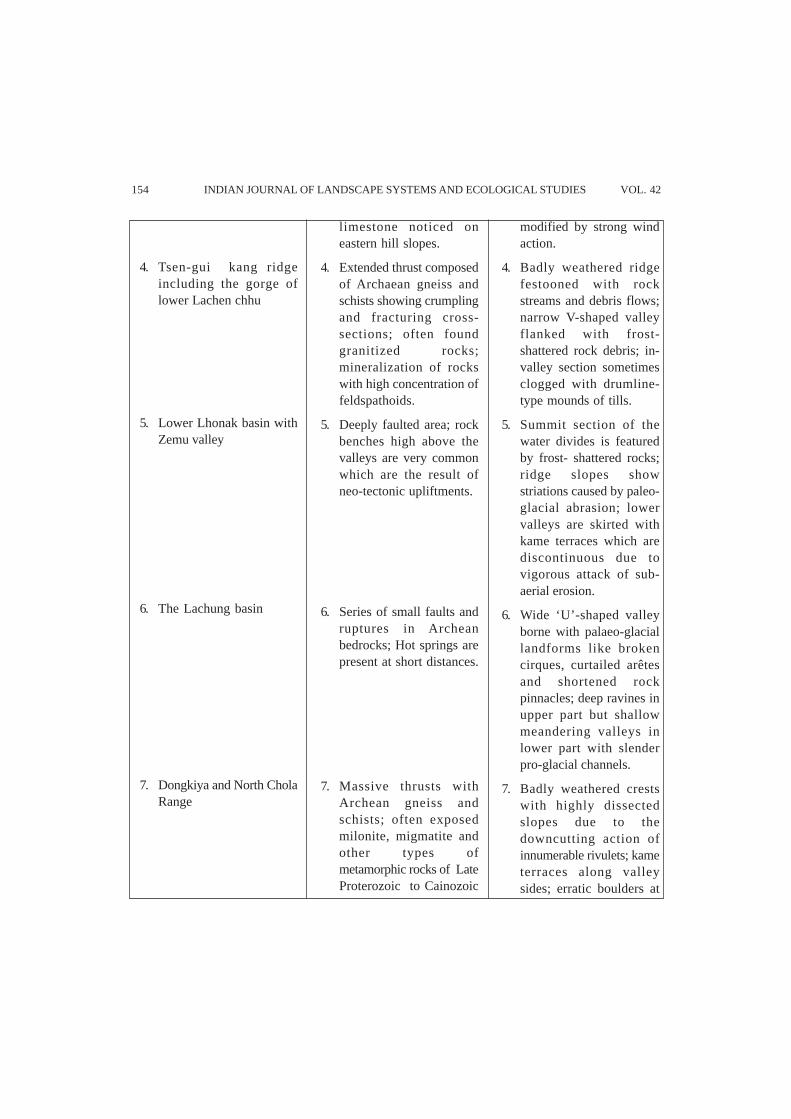
154 INDIAN JOURNAL OF LANDSCAPE SYSTEMS AND ECOLOGICAL STUDIES VOL. 42
limestone noticed oneastern hill slopes.
4. Extended thrust composedof Archaean gneiss andschists showing crumplingand fracturing cross-sections; often foundgranitized rocks;mineralization of rockswith high concentration offeldspathoids.
5. Deeply faulted area; rockbenches high above thevalleys are very commonwhich are the result ofneo-tectonic upliftments.
6. Series of small faults andruptures in Archeanbedrocks; Hot springs arepresent at short distances.
7. Massive thrusts withArchean gneiss andschists; often exposedmilonite, migmatite andother types ofmetamorphic rocks of LateProterozoic to Cainozoic
modified by strong windaction.
4. Badly weathered ridgefestooned with rockstreams and debris flows;narrow V-shaped valleyflanked with frost-shattered rock debris; in-valley section sometimesclogged with drumline-type mounds of tills.
5. Summit section of thewater divides is featuredby frost- shattered rocks;ridge slopes showstriations caused by paleo-glacial abrasion; lowervalleys are skirted withkame terraces which arediscontinuous due tovigorous attack of sub-aerial erosion.
6. Wide ‘U’-shaped valleyborne with palaeo-glaciallandforms like brokencirques, curtailed arêtesand shortened rockpinnacles; deep ravines inupper part but shallowmeandering valleys inlower part with slenderpro-glacial channels.
7. Badly weathered crestswith highly dissectedslopes due to thedowncutting action ofinnumerable rivulets; kameterraces along valleysides; erratic boulders at
4. Tsen-gui kang ridgeincluding the gorge oflower Lachen chhu
5. Lower Lhonak basin withZemu valley
6. The Lachung basin
7. Dongkiya and North CholaRange

NO. 2 GEOMORPHIC UNITS OF THE SIKKIM HIMALAYA 155
eras in deep valleys;intrusion of granite,pegmatite and syenite isfound in axial part.
8. Low-angled thrustscomposed of Archeangneiss with intrusions ofgranitoid, grano-dioriteand peridotite at the faultplanes.
9. A deep Transverse faultact as the link of theMain Central Thrusts ;minor faults offsetting theformer; complicatedplunging folds along thewestlying water divide;inverted strata ofPalaeozoic Era (phyllite,schists ) to late Tertiaryperiod (sandstone,conglomerate,etc) areexposed in lower velleysections.
10. Northern Main CentralThrust running below thevalley of the Trunkstream; minor faults guidethe tributaries;h o r n e b l e n d e - g n e i s s ,syenite and coarse graniteoccur in the valley-walls.
11. Typical nappe startedfrom Northern Main
the valley-bottoms.
8. Rounded crest-line withoccasional sharppinnacles; hill-slopes andvalley-floors are adornedwith patterned rockscaused by periglacialaction.
9. Multi-terreced valleysformed by neo-tectonicmovements; widemeandering channelsguided by interlockingspurs; hill slopes arereceding rapidly due todifferential denudationprocesses. Wider valley-floor of the Tista withhuge bed-load depositionafter crossing 450mcontour.
10. Structurally controlledrectangular pattern ofdrainage system headedwith cirques; narrow deepstream-valleys skirtedwith gently sloping glacialterraces; shiftingtendency of the Trunkvalley towards southresulting asymmetricalprofiles throughout thelength.
11. Badly weathered summitsection with a series of
8. South Chola Range withDe chhu basin
9. The Tista basin includingRongni chhu and Rangpovalleys
10. The basin of Talung chhu
11. Singalila Range (Northernpart)

156 INDIAN JOURNAL OF LANDSCAPE SYSTEMS AND ECOLOGICAL STUDIES VOL. 42
Concluding RemarksAlthough the region under study provides many examples of past glacial covers all over the
tract fluvial processes are dominant at present. The river valleys are widening with continuousreceding of cascades and terraces. The evolution of landform is, however, interrupted frequently byneo-tectonic movements. Rupturing in rock strata, creation or collapse of caves, springs (hot andnormal), retreat of hill slopes, sharpening of water divides, avalanches (rock and snow), and frequentchange in stream thalwegs are common phenomena found in every part of the terrain. The effect ofGlobal warming is diminishing the glaciers over the mountain tops (especially between 5500 m and6000 m elevations) as well as the periglacial features in De chhu basin. In short, the Sikkim Himalayais an ideal example having a large variety of geomorphic settings across the entire Himalayansystem.
ReferencesAcharyya, S.K(1980): Structural Framework and Tectonic Evolution in the Eastern Himalaya, Himalayan
Geology, vol-10, Dehradun, pp 412 -439.Bloom, A.L. (1998): Geomorphology, Prentice-Hall, Inc, New Jersey, pp 119- 143, 355 – 390.Bonewitz, R.L. (2012): Nature Guide: Rocks and Minerals,Dorling Kindersley Ltd, London, pp 256 -333.
Central Thrust, broken atplaces by parallelTransverse faults; partlymetamorphosed quartzitesand other Permian –Carboniferous rocks areoverlain by Archaeangranite-gneissic structure.
12. Complicated net of faults(medium to small scales)in Archean strata;younger series areexposed at the valleybottoms and aroundNamchi area; hot springsare found at theconvergent plane of faults(little north of Jorethang),garnet and calcite areabundant in granites;augen-gneiss found inupper layer of the strata.
rock pinnacles; projectedspurs are truncated by thelateral erosion of the riverBaro Rangit and itspreceding glaciers.
12. Ideal dendritic pattern ofdrainage systemdeveloped withinnumerable rivulets andsprings; incisedmeandering course foundin the main valley withpicturesque depositionalfeatures at its base.
12. The basin of Bari Rangit

NO. 2 GEOMORPHIC UNITS OF THE SIKKIM HIMALAYA 157
Freshfield, D.W. (1903, reprinted in 2006): Round Kangchenjunga, Pilgrims Publishing, Varanasi, pp 77 -168,275 -300.
Gutierrez, M. (2013): Geomorphology, Taylor and Francis Group, London, pp 483 -599.Hooker, J.D. (1855, reprinted in 2013): Himalayan Journal, Today and Tomorrow’s Printers and Publishers,
New Delhi, pp 318 -334 in vol-I and 142 -170 in vo-lI.Mallet, F.R. (1874): Geology and Mineral Resources of Darjeeling District and Western Duars, G.S.I.Memoirs
(11), Calcutta, pp 1 -50.Mukhopadhyay, S.C. (1982): The Tista Basin: A Study in Fluvial Geomorphology, K.P.Bagchi and co,
Calcutta.Risley, H. H. (2010): The Gazetteer of Sikhim, B.R. Publishing Corporation.Roy, S.S. (1980): Structural Evolution of Basement Gneisses in Eastern Sikkim, ed,Metamorphic Rock Sequences
of the Eastern Himalaya, K P Bagchi and co, pp 43 -66.Samanta, S.K. (2011): Geomorphic Units of the Darjiling Himalaya, West Bengal, Indian Journal of Landscape
System and Ecological Studies, Kolkata, vol-34,no-2, pp 419-424.Samanta, S.K. (2018): Geomorphology of The Southern Singalila Range, Rhito Prakashan, Kolkata, pp 19-25.Waddell, L.A. (1899, reprinted in 1979): Among the Himalayas, Mittal Publication, Delhi, pp 230 -238,360 -
429.White, J.C. (1909, reprinted in 2009): Sikhim and Bhutan, Pilgrims Publishing, Varanasi, pp 53 -93.
Received : 20 July, 2019Revised : 09 October, 2019

158 INDIAN JOURNAL OF LANDSCAPE SYSTEMS AND ECOLOGICAL STUDIES VOL. 42
An Appraisal of Ground Realities of Deprivation amongthe Beedi Workers in Tufanganj-I Block of
Cooch Behar DistrictShasanka Kumar Gayen1, Koyel Roy2 and Rupan Dutta3
Abstract : Beedi is one of the biggest unorganized or informal sectors in India. This sector helps to alleviatethe economic condition of rural and semi-urban people of India. Women's participation rate in this sector isquite high, because it can be carried out from home without disturbing their regular duties at home. As theseworkers mainly belong to lower economic class, they are being exploited by the agents. Continuous contactwith tobacco causes harmful diseases to the workers especially muscular and respiratory problems areprofound among them. The present paper shows ground condition of the beedi workers in Tufanganj-1 blockof Cooch Behar district and also tries to find out the reasons behind deprivation of beedi labours.Thispaperalso throws light on the ongoing scheme and their implementation in the study area.
Keywords : Beedi Rolling, Informal sector, Beedi Cards, Respiratory problems.
IntroductionA beedi consists of about 0.2 gram of processed sun dried tobacco flakes, rolled in a tendu
leaf or temburni leaf and then tied with cotton thread (Ansari & Raj, 2015). Beedis are more popularamong Indians because of its cheaper value than cigarettes. There are approximately 800 millionbidis are sold in India in each year, outselling by a ratio of 8 to 1(Purkait, 2015). Beedi rolling and itsproduction is one of the dominant works in several districts of West Bengal. Murshidabad, Malda,Uttar Dinajpur, Cooch Behar, Purulia, North 24 parganas, Nadia and Purba Medinipur are the hometo many large and small beedi factories. Huge workforce ofTufanganj-I block in Cooch Behardistrict, is engaged to this cottage industry and earn their livelihood. There are two types ofengagements in this sector, one is casual system, and another is ‘Kena- Becha’ system. In ‘kenabecha’ system, workers are associated with small factories and get wage rate lower than casualsystem.
1. Professor, Department of Geography, Cooch Behar Panchanan Barma University, [email protected].&3. Research Scholar, Department of Geography, Cooch Behar Panchanan Barma University,
[email protected] , [email protected]# Corresponding author: Rupan Dutta email: [email protected]
Ind. J. of Landscape Systems and Ecological Studies 42 (2) December - 2019, 158- 167 ISSN 0971-4170
user-pc
Highlight
user-pc
Highlight

NO. 2 AN APPRAISAL OF GROUND REALITIES OF DEPRIVATION 159
Mostly women are associated with this sector as it is very easy to learn and they can workfrom home. Women and also the other workers in this sector are less educated, so they are easilyexploited by the Munshi or agents. Working pressure for 6 to 8 hours affects them with variousphysical health problems such as respiratory problems, numbness, muscular problems and backpain (Mettilda et al. 2008;Srinivasan et al. 2013;Hoque, 2018). As most of the workers are indirectlyassociated with the industry, so they don’t get the registration cards also. As a result, they becomedeprived of the health and social benefits given by the Government (Ansari, 2015; Sudina et al.2016). The present paper tries to represent the scenario of beedi workers of Tufanganj-I block, theirdeprivation of social and health benefits and even their rights to minimum wage rate.
Location of the Study AreaCooch Behar district is homeland of beedi production and it is an important district of North
Bengal. This district has 12 C.D. blocks among them Tufanganj-I has higher concentration of Beedilabours. The block covers an area of 317 sq.km. and according to 2011 Census Report 248505peoples live here. Present study area extends from 26°10/ N to 26°23/N latitude and 89°31/E to 89°42/
E longitude (Fig 1).
ObjectivePresent study aims at analysing the discrimination faced by the beedi workers in case of wage
rate and financial aid giving by the government.
MethodologyThis study is categorically based on primary and secondary sources of data. In depth
Questionnaire method survey has been carried out throughout the study area on 2018 to collectprimary data & information. The survey was perpetrated on randomly selected 50 households ofDeocharai, Uttar Chhat Jaigir Chilakhana and municipality areas of Tufanganj- I block whereconcentration of Beedi worker is much high. The respondent for this survey is selected on thebasis of their occupation which is Beedi Rolling. Local Governmental body and Labour WelfareOffice of Cooch Behar district were consulted by the Researcher for various secondary data. Allthe data were then statistically represented with MS Excel 2007.
Results and discussion
Ground realities of beedi workers:Working-hour: According to the study females were more active regarding beedi rolling
process as it is easier for them to maintain work and home simultaneously. 58% of the respondentsworked for above 5hours a day and some workers even work for 8 to 9 hours to bind maximumamount of beedi (Table 1).
user-pc
Highlight
user-pc
Highlight

160 INDIAN JOURNAL OF LANDSCAPE SYSTEMS AND ECOLOGICAL STUDIES VOL. 42
Fig.
1 L
ocat
ion
Map
of
the
stud
y ar
ea

NO. 2 AN APPRAISAL OF GROUND REALITIES OF DEPRIVATION 161
Table 1 Hours spent on beedi rolling
Working Hour % of frequencies
Less than 2 4
2 – 3 8
4 - 5 42
More than 5 58
Source: Field Survey, 2018.
Wage rateFor monitoring the social security of beedi workers Government of India has legislated Minimum
Wage Act and Provident fund act. Rs. 169/- per 1000 beedis is national wage rate, but LabourCommissioner of Government of West Bengal and Beedi Merchants’ Association (BMA) restrictedit as Rs. 126/- for 1000 beedies. Those people who are not registered they got Rs. 100/- per 1000beedis in kenabecha system.
In Tufanganj-I block, variation can be seen in wage rates from semi-urban areas to rural areas.Workers of the municipal areas get 120 to 115 rupees per 1000 beedis which is near about thestandard wage rate accredited by Labour Commission(Fig 2). In rural areas wage rate reduces
Fig. 2 Variation of wage rate among the beedi workersSource: Field Survey, 2018
user-pc
Highlight
user-pc
Highlight

162 INDIAN JOURNAL OF LANDSCAPE SYSTEMS AND ECOLOGICAL STUDIES VOL. 42
because of the existence of agents, who charge commission 20 rupees per 1000 beedis from worker.As a result, wage rate becomes 105-115 rupees per 1000 beedis.
Presence of Middlemen or MunshiMunshi or the middlemen are a major problem associated with this working sector. According
to the report of the survey (Fig. 3) majority of the workers are indirectly appointed with theorganisation, as they handover beedis to the munshi. 14% of the respondents directly handover tothe industry. Existence of middleman can be observed here as beedi industry is located far awayfrom the villages and people are reluctant to go to handover beedis directly to the industry. Thenthey have to give commission to the munshi for rolling 100 beedis. Although these middlemen gotRs. 5.40 for submitting 1000 beedis to the factories. They also deprived the workers in case ofproviding raw material to roll beedi. 500 grams of tobacco and 800 grams of tendu leaves areessential ingredients to roll 1000 beedis but in the study area those 86% of the respondentsreported that they only got 350 grams of tobacco and 650-750 grams of tendu leaves. Hereof theworkers have to purchase raw materials from munshis. Even munshi rejected rolled beedis forinsufficient raw materials or for any mistake in binding. Survey report shows that 44% of theworkers faced rejection of 2 to 3 bundles of beedis every week (Fig. 4). The middlemen sold thoserejected beedis in the factories in lower price but the workers remained deprived of their wages.
Fig. 3 Mode of appointment to the beedi factoriesSource: Field Survey, 2018

NO. 2 AN APPRAISAL OF GROUND REALITIES OF DEPRIVATION 163
Fig. 4 Rejection of beedis
Source: Field Survey, 2018
Sources of substitute incomeThe work of beedi rolling is very monotonous and the wage rate is also lower than other
sectors like agricultural labour, daily wagers or shopkeeper. So, in the study area 36% people haveselected this occupation as their main source of income but 64% of the respondents are nowdiverted to another work. Among the 64% people mostly women are connected with this occupationand they do it for the future savings and educational attainment for their children. But aged peopleare reluctant to continue this job as they are facing both economic and health issues.
Beedi card registrationAmong the respondents, 80% workers do not have beedi card registration. They are basically
informal workers and do not aware of the benefits of registration and the process of beedi cardregistration. Munshis took this advantage and deprived them from PF or even getting health schemesand educational grants.
Health StatusBeedi labours spend 6-8 hours per day for rolling beedis. Work pressure and continuous
contact with tobacco cause many health problems in the study area. Among those diseases,respiratory problems, eye problems and muscular numbness are prominent. Some people cannot

164 INDIAN JOURNAL OF LANDSCAPE SYSTEMS AND ECOLOGICAL STUDIES VOL. 42
avail medication due to lack of money. Govt. of India has initiated some health care facilities, whichare:
1. Beedi workers can get assistance up to rupees 30000 for minor surgeries like Hernia,Gynaecological and appendectomy etc.
2. Upton rupees 1, 30,000 are given for cardiac diseases and also 2, 00,000 rupees are givenfor kidney transplant.
3. For controlling population growth, there is also provision of rupees 500 for sterilisation.
But the amazing fact coming from the ground survey is that beedi workers did not get suchtype of health care facilities. Only those labours residing beside the district head-quarters get somefacilities from Beedi Welfare Office. Health camps were organized by the Beedi Welfare Commissionand by some NGOs in different villages of Tufanganj-I block, but only six respondents said thatthey went there for checking up. The reason for this scenario is the registration of labours, as theydon’t have beedi card, so they are not eligible for such free check-up.
Educational scenarioFor promoting education among the beedi workers’ children, govt. has given various grants,
they are listed below (Table 2):
Table 2 List of Educational Grants
Sl. Standard Financial aid per yearNo. (in rupees)
Boys Girls
1. I-IV 250 250
2. V-VIII 500 500
3. IX 700 1140
4. X 1400 1840
5. XI-XII 2000 2440
6. College 3000 3000
7. Technical Education 15000 15000
Source: Report of Centre for Health & Social Justice, 2017
Inspite of such financial assistance enrolment of beedi labours family members in schools orhigher education is less. From the survey it is clear that 29% of the respondents are illiterate,whereas in colleges and universities this trend slows down to only 11%. Survey report reveals thatonly 24% respondent’s families got scholarships from the government. Only two girls among the

NO. 2 AN APPRAISAL OF GROUND REALITIES OF DEPRIVATION 165
respondents got Kanyashree Scholarship introduced by the State Government of West Bengal.Children of the beedi labours are forced to leave the education after schooling as they do not haveany scholarship to support them economically, especially the girl children simultaneously roll beediwith their education.
Reasons behind deprivation:1. Poverty: Respondents of the study area mainly belong to lower middle-class families. So,
they have to choose this work for earning and supporting financially their families. Fromthe survey it is found that in most of the family, women are engaged in this work and asthis work can be done from their houses so they find it easy than other work. So, theyagree to do it at lower wage rate.
2. Education: education is another vital factor for choosing this sector and also deprivation.As most of the workers are either illiterate or they have only primary education, they can’tbe appointed in other sectors.
3. Unawareness: respondents are not aware about the ongoing schemes implemented byGovt of India and also state govt for their welfare. Many workers face health issuesspecially the aged workers but they can’t rejoice the benefit of beedi cards as they don’tknow how to apply and who can help them. There is a big gap between govt authority andthe labours, so the benefits of that welfare programs are worthless.
4. Agent system: Agent or munshis act as middleman between factory authority and workersand they try to earn profit from the workers.They supply raw materials of beedi to thelabours for binding but from the survey it is clear that agents give only 350-400grams oftobacco for binding 1000 beedis whereas 500 grams needed for making that quantity ofbeedis. As a result, respondents either have to buy extra tobacco mix or their rolled beedisare rejected due to shortage of tobacco leaves. In both cases workers have to face loss ofwages.
5. Presence of small factories: In Tufanganj-i block many small factories have been establishedand these factories do not register their workers. As a result, beedi workers whoeverdirectly appointed to this kind of factories can’t get beedi card and get wages lower thanthe big factories.
Concluding remarksAlthough beedi rolling sector is causing placement of huge workforce in both India and in our
study area, but the ground realities of those work force are very pathetic. They don’t get their wagerates in time due to rejection of beedis and commission of agents.2-3 bundles per hundred bundleswere rejected by the factory members. They then did not get the right prices or otherwise they haveto sell it in half price to the agents. Unawareness about the health schemes and educational grants
user-pc
Highlight
user-pc
Highlight
user-pc
Highlight

166 INDIAN JOURNAL OF LANDSCAPE SYSTEMS AND ECOLOGICAL STUDIES VOL. 42
are also reasons of backwardness among them.They remained deprived as the existence of middlemenand the Beedi Welfare Organization are now trying to identifying the unregistered beedi workers forgiving them the Governmental assistance. But the main issue in this purpose is the distance, as theoffice located in district headquarters only so the people of remote areas of villages are not gettinginformation about beedi card registration and also the health camps. The study thus reveals howthey are deprived of their basic rights in workplace and wages.
ReferencesAdhikary, M. & Hajra, C. (2016). Health expenditure of home based workers & access to usable water &
sanitation: A case study of bidi workers in Purulia in West Bengal. Saudi Journal of Humanities andSocial Sciences, 1(4), 160-171.
Ansari, M.S. & Raj, A., (2015). Socio-Economic Status of Women Beedi Workers in Bundelkhand Region ofUttar Pradesh: An Empirical Analysis. UTMS Journal of Economics, 6(1), 53-56.
Buvaneswari, G.M., & Sridevi, T. (2008). Health Problems of Women Beedi Workers. Cauvery ResearchJournal, 2(1), 24-28.
Das, C.K. (2013). A Study on Occupational Health Hazards among Women Beedi- Workers of MurshidabadDistrict in West Bengal. International Journal of Research in Commerce and Management, 4(1), 163-167.
Dolas, P.V. (2010). A study of Socio Economic conditions among Bidi workers in Solapur. UGC minorresearch project.
Hoque, M.A. (2018). Quality of housing environment and health status among the female bidi workers: Amicro level study of Indian villages. Annals of Valahia University of Targoviste. Geographical Series.18(1), 84-91.
Jamuna, V. (2018). Socio-Economic status of women bidi workers in Karimnagar Telengana. InternationalJournal of Trend in Scientific Research and Development. 3(1). 613-616.
Kapur, S. & Sethy, P.K. (2014). Working and living conditions of workers in unorganized sector-A review ofliterature. Online Interdisciplinary Research Journal. IV(II), 197-204.
Mukhopadhyay, P., Sen, S., Mondal, G., Banerjee, A. & Chakraborty, S. (2015). Risk of respiratory diseasesassociated with beedi workers of North 24 Parganas in West Bengal, India. International Journal ofCurrent Research. 7(9), 20607-20610.
Murugan, A.B. (2012). A Socio Economic Analysis of Beedi Employees. ELK Asia Pacific Journal of Marketingand Retail Management, 3(3).
Purkait, S.K., & Sardar, B.K. (2015). Occupational Health Hazard of Women Bidi Workers in Rural India.International Journal of Science, Engineering and Technology Research, 4(5), 1496-1502.
Rout, S.A., Narayana, K.V., Sahu, K.S., Selvaraj, S., Chatterjee, M., Arora, M. (2017). Poverty and healthstatus of beedi workers in Andhra Pradesh. Economic and political weekly. 10, 54-59.
Sarkar, S. (2004). Women workers in bidi rolling. The Indian Journal of Labour Economics. 47(1), 135-140.
Sardar, B.K. (2015). A geographical analysis of the socio-economic condition of the bidi-workers in theSunderban region of West Bengal. Indian Journal of Spatial Science. 6(2), 33-39.

NO. 2 AN APPRAISAL OF GROUND REALITIES OF DEPRIVATION 167
Sen, A. (2011). Impact of social security schemes and welfare program on beedi rollers in Sagar district ofMadhya Pradesh. Social Cohesion and Development. 133-147.
Srinivasan, S. & Ilango, P. (2013). Occupational health problems faced by female beedi workers atKhajamalai,Trichy district, Tamil Nadu. International Journal of Scientific and Research Publications.3(2), 1-6.
Sudina, M., Ansuya, S. & Lakra, A.J. (2015). Awareness on health and social welfare benefits among beediworkers – a community survey. Manipal Journal of Nursing and Health Sciences, 1(2). 100-103.
Ground Realities of Beedi Workers in West Bengal.Centre for Health & Social Justice, 2017.
Received : 20 August, 2019Revised : 09 October, 2019

168 INDIAN JOURNAL OF LANDSCAPE SYSTEMS AND ECOLOGICAL STUDIES VOL. 42
Site and Situation of Settlements in the Rammam Basin,Darjiling - Sikkim Himalaya
Suchitra Ray1* and Ranjan Roy2*
Abstract : Settlement is a sheltering place of man and is one of the most important characteristic features ofhuman civilization all over the land of our planet earth. It is an admixture of several households each of whichis generally occupied by individual family of a society. The mountainous tract of Rammam basin reveals someunique site and situational characteristics of the settlements which are to some extent inaccessible due torugged mountain terrain. The basin is not only a rugged region but also shows the least developed communicationsystem. All habitations in the terrain are of rural in nature but exhibit different types of activities. The variedcharacteristics as well as the size of the settlements grown here depend largely on the site and situation of theirown. In the present paper, attempts have been made to analyse the site and situational characteristics of thehabitations and also to understand the processes of selecting sites among the various communities living onthis tract.
Keywords : Spur settlement, Mountain saddle, Adret, Ubac.
IntroductionThe origin of a settlement depends on a site – a particular characteristic of space which some
people find suitable for habitation purpose. Paul Vidal de La Blache (1926) in his book Principles ofHuman Geography emphasized on site of human establishments as ‘it is the one in whichgeographical influences seem to stand out most prominently.’ Situation, on the other hand is therelation of one settlement with the surrounding settlements through the varied linkages (Singh,2013). It also refers to the centrality or accessibility of a settlement within the vast region. Thesettlements located at the nodal points always enjoy its situation and grow faster due to their betterconnectivity to the surrounding areas. The origin, growth and decay of any settlement thus dependon both of its site and situation.
In the mountainous tracts of Rammam Basin, summit line, break of slope, confluence pointsof streams, river terraces, river side, spurs and edge of forests are the suitable sites where settlements
1. * Assistant Professor, Dept. of Geography, Acharya B.N.Seal College, Cooch Behar2. Professor, Dept. of Geography & Applied Geography, University of North Bengal, [email protected]* Corresponding Author, Email:[email protected]
Ind. J. of Landscape Systems and Ecological Studies 42 (2) December - 2019, 168- 179 ISSN 0971-4170

NO. 2 SITE AND SITUATION OF SETTLEMENTS IN THE RAMMAM BASIN 169
have been set up. The inhabitants of this basin have chosen their settlement sites wisely keepingin mind the availability of agricultural and pastureland, drinking water and other products which areimportant to sustain life. It has also been observed that the communities living in the basin respondto their environment differently. Thus the study of settlement site and situation is very important tounderstand the people and their relation to environment in the Rammam Basin.
ObjectivesThe objectives of the following paper are as follows:
1. To find out the favourable site and situation of the settlements in the study area.
2. To find out the influence of culture of the communities living in this tract in selecting sitesof their settlements.
MethodologyThe paper is based on field surveys of the study area during different periods of past four
years from 2016 to 2019. Besides primary data, some secondary data on total population andnumber of persons belonging to different communities living in different hamlets have been collectedfrom Census of India, 2011 and from Gram Panchayat offices of Daragaon and Rimbick respectively.In addition the topographical maps of Survey of India and Google earth images have also beenobserved to understand the sites of the settlements.
Location of the study areaThe Rammam basin is one of the most distinguished basin areas in the Darjiling-Sikkim Himalaya
which is world famous for its several viewpoints such as Singalila, Phalut, Sandakphu and Tonglualong with some picturesque settlements like Gorkhey, Samanden, Gurdum, Rimbick, Ribdhi, Okhre,etc. The whole tract is divided into two unequal parts: the North and South Rammam Basin. TheNorth Rammam Basin comprises the south-western part of West Sikkim and the South Rammambasin occupies north-western part of Darjiling district (mostly under Lodhama and partly underSukhiapokhri and Pulbazar police stations) in West Bengal. The main river Rammam marks theboundary between the two said parts and exits the terrain near Nayabazar for plunging into itstrunk river - the Great Rangit. The length of the river Rammam is 42km. The altitudes of the entirebasin vary widely – from 3685m on the Singalila peak to 315m at the confluence point of the riverRammam and Bari Rangit, below Nayabazar. Total area of the basin is 403.16 km2. The latitudinalextension of the study area is from 27° 022 N to 27°152 N; while the longitudinal extension is from87°59´E to 88°17´E.
Settlements in the North and South Rammam BasinThere are 19 village units, one notified bazar area and four forest blocks in the North Rammam
Basin and 14 village units in the South Rammam Basin. Each village unit consists of several hamlets.The village units may be under one, two or even more Gram Panchayats. For example, Singalila

170 INDIAN JOURNAL OF LANDSCAPE SYSTEMS AND ECOLOGICAL STUDIES VOL. 42
forest village consists of 12 hamlets falling under four Gram Panchayats. The name of the villageunits including the number of households and total population have been tabulated below:
Table 1: Villages along with number of households and total population lying in the north and southof river Rammam
Sl. Sub-basin Villages No. of TotalNo. Household Population
1 North Rammam Bhareng, Ribdhi, Okhrey, Tikpur, Siktam, 6949 32170Salyangdang, Lungchok, Dhalam,Timberbong, Upper Fambong, LowerFambong, BurikhopRumbuk, BurikhopDodaak, Tharpu, Soreng, Malbasey,Chongbong, Rumbuk, Nayabazar (NA),Karthok, Nayabazar Forest Block, SorengForest Block, Sombaria Forest Block &Hilley Forest Block
2 South Rammam Singalila Forest, Rimbick, Namla, Lodhama, 7346 35687Hatta, Kankibong, Jhepi, Lamagaon*,Kaijalia*, Samalbong*, Kolbong, Murmidong,Karmi & Goke*
Total 14295 67857
(*Village partly under Rammam Basin); Source: Census Data, Government of India, 2011
Physiography of the Rammam BasinPhysiographically the region belongs to the Lesser Himalaya being composed of huge ‘Nappe’
projected from the north lying mountain massifs of North Sikkim. The westernmost wave of thestructure makes the highest mountain of the terrain and is well known as the ‘Singalila Range’. The
Table 2: Length of some important rivers and ridges:
Rivers Length (Km) Range/Ridges Length (km)
Rammam 42 Southern Singalila Range 40
Kali Khola 08 Kingsa Danra 06
Rato Khola 06 Sabarkum Danra 07
Siri Khola 12 Sandakphu Danra 06
Lodhama khola 14 Rimbick Danra 11
Jhepi Khola 08 Deorali Danra 10
Source: Topographical Map No. 78A/8 & 78A/8

NO. 2 SITE AND SITUATION OF SETTLEMENTS IN THE RAMMAM BASIN 171
Range stretches from Kang peak (5850m) lying south of the great Kangchendzonga-Kabru massifand abuts on Tonglu (3070m) –traversing a distance of more than 70 km. The crest line of the Rangeindicates the International boundary between Nepal in the west and Sikkim-Darjiling of India in theeast. The basin Rammam lying east of the mountain i.e. situated in Indian Territory contains manysettlements with their diversified characteristics. All these settlements are confined in a triangularlandscape: the crest line of the aforesaid mountain to the west, Singalila – Sungri ridge to the north-east and Tonglu - Lamagaon ridge (Deorali Danra) in the south-east.
The sites of settlementsI. Site of settlements depending on physiographic characteristics
The settlement sites in the Rammam basin mostly depend on the physiography of the basin.As the basin under study is a rugged tract and is characterised by several ridges and valleys so thephysiographic characteristics play important role in the growth of settlements over them.
A. Spur settlements
In the south Rammam Basin several ridges extend eastward from the Singalila Range. Fromsouth to north these ridges are Deorali Danra, Rimbick Danra, Sandakphu Danra, Sabarkum Danraand Kingsa Danra in the South Rammam Basin. The orientations of these ridges are from west toeast and are almost parallel to each other. The settlements are located on various spurs projectedfrom these ridges at various altitudes. Bichgaon, Sepi, Kankibong, Jhepi, etc. are good examples ofsuch settlements.
On the northern part of Rammam Basin, Singalila – Sungri ridge extends from west to east andcreates the water divide between the river Rammam in the South and river Kalej Khola in the north.The spurs projected from this ridge are in north to south direction. Settlements have been developedat the southern end of these spurs such as Bhareng, Ribdhi, etc. Altitude of all these settlements,both in northern and southern parts of Rammam Basin, varies widely – from 1000m to 2200m.
B. Summit-line settlements
There are some summit-line settlements which are located at and above 3000m altitude alongthe main Range of the Singalila. These settlements are categorically mountain-view points such asTonglu, Sandakphu, Sabarkum and Phalut. The settlements grown over the crests are tiny hamletsand suffer from scarcity of water.
C. Settlement Site with high insolation
The settlements growing on projected spurs are very much dependant on the amount ofinsolation. Thus the ‘adret’ (sunny side) of the ridges is primarily chosen for the growth of anysettlement. Such sites are protected from chill northerly winds too by the crags lying over thesummit section of the ridges. High amount of insolation increases not only the surface temperatureof the place but also helps to grow the crops rapidly. Almost seventy percent of the settlements inthe Rammam Basin are either located on the eastern or southern slopes of the ridges. Danragaon,

172 INDIAN JOURNAL OF LANDSCAPE SYSTEMS AND ECOLOGICAL STUDIES VOL. 42
Gumbadanra, Yakrebong, Namla, Lodhama, Kankibong, and Jhepi in the southern part and Bhareng,Ribdhi, Okhrey, Sombare, Dharamdin, etc. in the northern part of the basin are villages of bestexamples of such adret location. Due to higher amount of solar energy falling on the adret sidelocation of Yakrebong (1300m), paddy is cultivated here during monsoon months.
D. Fault-base site
Gurdum is located at the base of a large cliff created by a Reverse Fault in Gurdum danra(Ridge) with a large cliff. Establishment of this settlement is evident as the people residing herereceive several opportunities from nature. They get forest products grown over the upthrow side,supply of water from perennial springs issued at the base of the Fault plane, gets shelter from thechill Katabatic wind along the ridge top and get also the advantage of gardening and farming onfertile soils deposited at the downthrow side.
E. River terrace
Lodhama Bazar (Budhwari) is the best example of a river terrace settlement as it is located atthe lower terrace of the river Lodhama Khola. This settlement is located at the right bank of the riverLodhama. The altitude of this settlement varies between 1050m to 1090m. This settlement is one ofthe oldest haats (weekly Market) of this region. On the northern part of Rammam basin Dharamdin(Dhalam) is located on the middle terrace of the river Rammam at an altitude of 1200m.
F. Mountain Saddle
Any depressed land along the mountain range always attracts people to set up hamlet as itexhibits several facilities – protection from chill mountain wind, abundant supply of water (fromsprings), thick soil layer, relatively stable landmass, etc. Such site is locally known as ‘Bhanjyang’(a Nepali word). Kaijalia (1100m), Daragaon Bhanjyang (2062m) are examples of such type ofsettlements.
G. Wet point
Any settlement grown for human habitation requires the supply of water. The settlementslying over the ridge tops and summit section of the region under study suffer a lot due to lack ofwater, but at least two wet point hamlets (army camp) have been set up in the area under study.Both of them are located over the summit-line. The highest hamlet is Thakum (3400m) which receiveswater from a tiny lake named Chandu Pokhri about 400m away. The second one, Batasi, is dependenton spring waters. Altitude of this hamlet is slightly lower – 2900m.
H. Flat land for Agriculture
The villages such as Samanden and Dhalam are the two settlements where flat land foragriculture is available. The people of these two villages are mainly farmers. They raise their cropslike Paddy (at Dhalam), Maize, Buckwheat and different types of vegetables over the flat lands ofthe hamlets.

NO. 2 SITE AND SITUATION OF SETTLEMENTS IN THE RAMMAM BASIN 173

174 INDIAN JOURNAL OF LANDSCAPE SYSTEMS AND ECOLOGICAL STUDIES VOL. 42
I. Forest Edge
Gorkhey is such type of settlement which is located at the edge of the Singalila National Park.Besides, Samanden, Rammam, Upper Daragaon (Kalyan), Upper Bichgaon, Upper Sirikhola, Gurdumall are located at the edge of the Singalila National Park and all these are forest villages. Theinhabitants of these hamlets depend largely on the forests for their livelihood. On the northern partof Rammam Basin, Burikhop is located at the edge of Soreng Forest. Such forest edge settlementsenjoy rearing of bovines as the forests provide ample supply of fodder for these animals.
II. Site of Settlements preferred on the basis of cultural traits of different communitiesSite is a geographical space over which man establish his habitation. According to Paul Vidal
de La Blache (1926) ‘nature prepares the site and man organizes it to enable him to satisfy hisdesires and his needs’. This approves the fact that the very concept of site is inherently cultural(Singh, 2013). Man prefers to live in those places which provide the materials for his living such asfood, drinking water and building materials. The methods of acquiring such materials are not samefor all groups of mankind. For this reason some places seem favourable to some people whereasothers find the land unsuitable for their habitation. The places chosen by various communities forestablishment of their settlements in the Rammam basin are thus specified as follows:
A. High mountain settlements of the Sherpas
Altitude of settlements in the Rammam basin varies from 450m at Nayabazar to 3631m atSandakphu. Maximum number of settlements in the basin is located between 1000m-2000m altitudinalbelt. But there are few hamlets which are located above 2000m, such as Manedanra, Gurdum, UpperSirikhola, Bichgaon, Upper Daragaon, Rammam, Samanden and Gorkhey in the southern part; andBhareng and Ribdhi in the northern part of the basin. Major part of the inhabitants at these hamletsbelongs to the Sherpa community – 30% to 100%. The Sherpas are original inhabitants of easternpart of Tibet (average altitude being above 4500m). Form this land they migrated to eastern part ofNepal at Solu-Khambu region. From there some of them migrated further east and crossed theSingalila Range to be settled at these higher altitudinal settlements in the Rammam Basin. TheSherpas are basically herders and rearing of yak was once their principal mode of living. But now-a-days they rear dzoes (male) and dzomo (female): the hybrids of Yak and cow. The lifespan of Yaksas well as the amount of their milk (of Nak, female Yak) decrease below 3000m. On the summit linethe Sherpa people make their ‘Goth’, i.e. the temporary shelter for animals and men while travellingacross the mountain looking for fodder of their herds. They live at the Goth from spring to autumnand come down to their permanent settlements after starting of heavy snowfall during the wintermonths. Besides rearing of bovine animals, the Sherpas also do some cultivation in their smalllandholdings mainly for the consumption of their family, though they sell the surplus production atlocal bazar. As this altitudinal belt is located on the famous trail of Manebhanjyang-Sandakphu-Rimbick, so many settlers of these villages now-a-days have engaged themselves in tourismbusiness.

NO. 2 SITE AND SITUATION OF SETTLEMENTS IN THE RAMMAM BASIN 175

176 INDIAN JOURNAL OF LANDSCAPE SYSTEMS AND ECOLOGICAL STUDIES VOL. 42
B. Low-lying valley settlements of the Nepalese
The people migrated from the west lying Nepal territory are very much enthusiastic in natureand are well adept in cultivation. Hence the mid altitudinal belt (1000m – 2000m) is always preferredby these people as the temperature is favourable for cultivation in this belt. They cut terracesalong the slopes of the ridges and produce paddy and other vegetables. The homesteads of theNepalese are set up along the break-of-slopes lying in between their arable lands and pastures.Lower Daragaon, Dilpali, Namla, Lodhama, etc. are best examples of such settlements.
C. Site for Lepcha Settlements
The Lepchas are the first community making their settlements in the Rammam basin. They aredirectly dependant on nature for their living still today. Hence the settlements of the Lepcha peoplelie generally on the steep slopes of the ridges where they find small piece of land for producingtheir food stuff by rudimentary methods. Since the growth rate of these people is very low (mostprobably in the effect of their consumption of some natural forest products) the number ofhouseholds in their settlements is also very few and has been growing at very slow rate. The smallsettlements resided by the Lepchas are mainly concentrated in the hamlets like Tubun, Gumbadaraand Yakreybong in the Rimbick Gram Panchayat.
Situation of the settlements in the study areaWhenever a settlement is established in a favourable site, it tries to grow with time. But the
rate of growth depends primarily upon its situation, i.e. its relative location (Broek and Webb, 1980).Like other alpine settlements of the Himalaya the situation of settlements of the basin under studycan be enumerated as follows:
A. Mountain View point
Some places across the summit section of the Singalila Range are very much suitable forviewing the magnificent sceneries of the high snow-clad mountains of the Great Himalaya.Sandakphu, Phalut and Tonglu provide best examples of such places where small settlements havegrown only for facilitating accommodations for travelers. There are four Trekkers’ Huts along withone PWD Bungalow and two private lodges are situated at Sandakphu; while Phalut and Tonglu -both have a single Trekkers’ Hut.
B. Halting point across the trekking route
Settlements may grow at a certain distance and at habitable places along the strenuous trekkingroute traversing the Ranges. For example the settlement like Gahribas has grown in the midway ofthe trekking route from Manebhanjyang to Sandakphu. Gurdum is another such settlement grownalmost in the midway of the trekking path from Sandakphu to Rimbick.
C. Route convergence
At the point of route convergence settlements grow easily for the availability of transportfacilities. Soreng is situated at such a point where the roads meet coming from Jorethang, Karthok

NO. 2 SITE AND SITUATION OF SETTLEMENTS IN THE RAMMAM BASIN 177
and Dentam. Kainjalia is another settlement where two roads intersect each other; one metalledroad from Bijanbari to Rimbick connecting settlements of Chhoti Rangit Basin to the settlements ofRammam Basin, another is from Dhotrey to Goke (Boulder path).
D. Local permanent market and periodic markets
Rimbik and Soreng are two large agglomerations having fixed market place. Besides these twoplaces, permanent market place can be seen at Lodhama Bazar, Jhepi, Kaijalia, Kolbong and Goke inthe South Rammam Basin and Sombare, Soreng, Naya Bazaar (Notified Bazar Area) in the NorthRammam Basin. All the essential commodities are sold at these markets. Rimbick and LodhamaBazar are very old permanent Bazars and large amount of agricultural products (mainly potatoes)used to be marketed from these two bazars (Dash, 1947).
Over the study area, weekly/periodic markets are set up on various days. These weeklymarkets attract many buyers and sellers from distant places. Rimbick (Tuesday), Lodhama Bazar orBudhware (Wednesday), Dhotrey (Saturday), Bansbotte (Thursday) in the Southern Rammam Basinand Sombare (Monday), Soreng (Thursday) in the Northern Rammam Basin are such market places.
Changing Physico-Cultural Environment in the Rammam Basin and its impact on the site andsituation of settlements
The changing physico-cultural environment in the Rammam basin during the last four decadesshows enormous influence upon the site and situation of local settlements. The major changes arediscussed briefly in the following paragraphs:
The flash flood in the basin in 19th September, 1999 caused severe damage in thecommunication system of the terrain. Numerous landslides and landslips occurred justafter the flood period which changed local landscape as a whole. Many small settlementscompletely washed away especially along the Siri Khola, Ribdi Khola and Riyong Khola.Some tiny hamlets were disappeared completely such as on the upper portions of Sepi,Lower Daragaon, Ribdi and lower portions of Okhrey, Tikpur and Siktam. The distressedfamilies were to be shifted at safe sites of the said hamlets.
Among the changes in cultural environment important aspect was found with the progressof Rammam Hydel Power Project in 1990’s. For carrying building materials and equipmentsin the dam site (below Rajavir) as well as at the site of power generating plant (nearLodhama Bazar) motorable roads were constructed from the nearest bazar areas (such asRimbick and Lodhama Bazar). These bituminous roads along with its branches (built incoming years) caused spectacular development of the settlements. The hamlet Gumbadanra(1600m) started to attract migrants from surrounding hamlets as the settlement site wasproposed for various developmental activities (information collected during field survey atGumbadanra in November, 2018). The number of homesteads increased rapidly along theroad giving rise to linear settlement pattern.

178 INDIAN JOURNAL OF LANDSCAPE SYSTEMS AND ECOLOGICAL STUDIES VOL. 42
The formation of Darjiling Gorkha Hill Council in 1988 brought a great hope for the peopleresiding in south Rammam Basin, i.e. in the part of Darjiling district. Hiking and tourism(due to the end of political unrests) increased manifold since early 1990s. In consequenceof that number of trekkers hut and hotels also increased. The architectural characteristicsof many old houses were changed on account of financial assistance by the administration.Thatched roofs were replaced by corrugated iron sheets, ground floors were transformedin to concrete structure and the transition of sanitary system was improved prominently.
After completion of Rammam Hydel Power Project (Phase I) the settlements of northernRammam Basin also began to be improved. Many home stays were established at Okhreyand some hotels were also set up at Okhrey and Soreng. In consequence of this tourismactivities developed especially around these two settlements.
Since the consciousness about local economy and polity has been growing among localpeople for last four decades, the cultural landscape of the terrain is developing rapidly.Every possible arable lands on the mountain slopes (except the areas of national park andreserved forests) are now being used for raising crops. The homesteads of each settlementare sprawling towards the extended fields for cultivation. This may cause areal extension ofthose settlements.
The network of power supply (from Rammam Hydel Power Station) has spread out almostall over the settlements in the Rammam Basin. This has brought a tremendous change inthe lives of local people. The economic activity has been diversified, market areas havedeveloped largely, and many educational institutions have also been grown on the bothparts of the river Rammam. Thus the areal extension of large settlements is increasingrapidly.
Concluding RemarksFrom the above discussions it is clear that site and situation play vital role in the growth and
development of settlements. Most of the settlements in the Rammam Basin are located on favourablesites as mentioned above and some of these settlements also have favourable situation whichcaused these settlements to grow rapidly. But some settlements in this basin are located on lessfavourable sites also such as settlements on the ubac side of the ridges. In many cases this type ofsettlements, if grown without its climatic consideration, is abandoned when a new settlement isgrown nearby at favourable site. The Molle Trekkers’ Hut is the best example of this type ofabandoned hamlet. Now-a- days the trekkers take shelter here rarely but usually chose to stay atthe newly constructed trekkers hut on the Sabarkum peak lying just below the summit crag. In spiteof such exceptional case there are some ubac side settlements in the tract such as Hatta which is tosome extent is a lee side settlement. The existence of these types of settlements in the basin canonly be explained by increasing population pressure on the tract. As the population in this basin isincreasing, people are residing at those places which in normal circumstances would have neverbeen chosen as the place of settlement site.

NO. 2 SITE AND SITUATION OF SETTLEMENTS IN THE RAMMAM BASIN 179
ReferencesAvery, D.M.: ‘Physical Environment and Site Choice in South Africa’ Journal of Archeological Science, May,
1995, Vol. 22, Issue 3, pp. 343-353.Blache, P.Vidal De La: ‘Principles of Human Geography’, Constable Publishers London, 1926, pp. 271.Broek, J.O.M. and Webb, J. W.: ‘A Geography of Mankind’, International Students Edition, McGraw- Hill
Series in Geography, New York, 1980, pp. 309.Dash, A.J.: Bengal District Gazetteers Darjeeling, Bengal Government Press, Alipore, West Bengal, 1947, pp.
213.Jiangchao, X., Xinge, W., Qinqin, K., Nan, Z.: ‘Spatial Morphology Evolution of Rural Settlements induced
by Tourism’ Journal of Geographical Sciences, August 2015, pp. 497-511.Knowles, R. and Wareing, J.: ‘Economic and Social Geography’, Rupa and Co., Calcutta, 1994, pp. 257-266.Mandal, R. B.:‘Introduction to Rural Settlement’, Concept publishing Co., New Delhi, 2001, pp. 70-71.Nair, A., Singh, P.K., Raju, K.V., Mishra, H.K., Suratia, C.V.: ‘Pathways to Climate Resilient Livelihoods in
the Himalayan River Basins’ Proceedings of the International Conference on Pathways to ClimateResilient Livelihoods in the Himalayan River Basins, Institute of Rural Management Anand (IRMA)– India, 2014.
Ogilvie, A.G.: ‘Physiography and Settlements in Southern Macedonia’ Geographical Review, Apr. 1921, Vol.11, No. 2, pp. 172-197.
Risley, H. H.: ‘The Gazetteer of Sikhim’, B.R. Publishing Corporation, Delhi, Reprinted 2010, pp. IntroductionI - XI, 1 – 22.
Singh, R.Y.: ‘Geography of Settlements’, Rawat Publication, Reprinted, 2013, pp. 90.
Received : 11 November, 2019Revised : 15 December, 2019
![[Ecological indicators of habitat and biodiversity in a Neotropical landscape: multitaxonomic perspective]](https://static.fdokumen.com/doc/165x107/6333c1eb7a687b71aa085d00/ecological-indicators-of-habitat-and-biodiversity-in-a-neotropical-landscape-multitaxonomic.jpg)