Increased Renal Versican Expression Is Associated with Progression of Chronic Kidney Disease
12
Increased Renal Versican Expression Is Associated with Progression of Chronic Kidney Disease Michael Rudnicki 1 *, Paul Perco 2 , Hannes Neuwirt 1 , Susie-Jane Noppert 1 , Johannes Leierer 1 , Judith Sunzenauer 1 , Susanne Eder 1 , Carlamaria Zoja 3 , Kathrin Eller 1,4 , Alexander R. Rosenkranz 1,4 , Gerhard A. Mu ¨ ller 5 , Bernd Mayer 2 , Gert Mayer 1 1 Medical University Innsbruck, Deptartment of Internal Medicine IV - Nephrology and Hypertension, Innsbruck, Austria, 2 Emergentec Biodevelopment GmbH, Vienna, Austria, 3 Mario Negri Institute for Pharmacological Research, Centro Anna Maria Astori, Science and Technology Park Kilometro Rosso, Bergamo, Italy, 4 Medical University of Graz, Deptartment of Internal Medicine, Clinical Division of Nephrology and Hemodialysis, Graz, Austria, 5 Georg-August-University Go ¨ ttingen, Department of Medicine, Nephrology and Rheumatology, Go ¨ ttingen, Germany Abstract Novel prognostic markers for progression of kidney disease are needed to distinguish patients who might benefit from a more aggressive nephroprotective therapy. Expression of the proteoglycan versican was evaluated in renal transcriptomics profiles and in an independent set of 74 renal biopsies. Versican levels were correlated to histologic damage scores and to renal outcome, and versican expression and regulation was evaluated in vitro. In transcriptomics profiles of renal tissue versican was positively correlated with (i) histological parameters in kidney biopsies, (ii) progressive decline of renal function in proteinuric kidney diseases, and (iii) impaired renal function and histology scores in diabetic nephropathy. In an independent cohort of 74 biopsies of glomerular diseases renal RNA levels of versican isoforms V0 and V1, but not V2 and V3 correlated significantly with creatinine after a mean follow up time of 53 months. Versican isoforms V0 and V1 together with serum creatinine at time of biopsy and the degree of glomerulosclerosis predicted 20% and 24% of the variability of creatinine at follow up, which was significantly more than serum creatinine and histological parameters alone (16%). However, when patients with acute kidney failure at time of biopsy (n = 5) were excluded, the additive predictive value of versican V1 was only marginally higher (35%) than creatinine and glomerulosclerosis alone (34%). Versican isoforms V0 and V1 were primarily expressed in vitro in proximal tubule cells and in fibroblasts. The results in humans were confirmed in three rodent models of kidney disease, in which renal versican expression was significantly upregulated as compared to corresponding controls. These data show for the first time an association of renal versican isoform V0 and V1 expression with progressive renal disease. Citation: Rudnicki M, Perco P, Neuwirt H, Noppert S-J, Leierer J, et al. (2012) Increased Renal Versican Expression Is Associated with Progression of Chronic Kidney Disease. PLoS ONE 7(9): e44891. doi:10.1371/journal.pone.0044891 Editor: Jean-Claude Dussaule, Inserm, France Received February 22, 2012; Accepted August 15, 2012; Published September 14, 2012 Copyright: ß 2012 Rudnicki et al. This is an open-access article distributed under the terms of the Creative Commons Attribution License, which permits unrestricted use, distribution, and reproduction in any medium, provided the original author and source are credited. Funding: The research leading to these results has received funding from the European Community’s Seventh Framework Programme (FP7/2007–2013) under the grant agreement 241544 (SysKid). The funders had no role in study design, data collection and analysis, decision to publish, or preparation of the manuscript. Competing Interests: MR, PP, and GM filed a patent application on versican for prediction of progressive nephropathy in CKD patients (PCT/EP2010/057917: A method of diagnosing renal disorders). BM is co-owner, and PP is employee of emergentec biodevelopment GmbH. This does not alter the authors’ adherence to all the PLoS ONE policies on sharing data and materials. All other authors have nothing to disclose. * E-mail: [email protected] Introduction Progression of chronic kidney disease (CKD) is associated with increased morbidity and mortality, reduced quality of life, and major challenges for healthcare systems [1]. Clinical features predicting a poor prognosis include impaired renal function, hypertension and nephrotic range proteinuria at presentation [2] as well as during follow-up [3,4]. Histopathological changes such as the degree of tubular atrophy and interstitial fibrosis have been shown to better predict long-term renal survival than the extent of glomerular damage even in primary glomerular diseases [5]. To further enhance the prediction of progression of CKD various genes and proteins have been identified as molecular biomarker candidates of kidney damage, and their clinical significance has recently been reviewed in detail [6]. High-throughput transcriptomics experiments together with integrative bioinformatics led to the identification of additional novel biomarker candidates. Henger et al. identified a marker set of nine genes (Chemokine (C-C motif) ligand 21, interleukin 8, matrix metalloproteinase 3, 7 and 9, urokinase R, chemokine (C- X-C motif) receptor 5, integrin beta 4, and pleiotrophin), which predicted a progressive course of CKD [7]. Perco et al. showed that histology of zero-hour preimplant biopsies explained only 14% of the variability of one year creatinine whereas a combina- tion of three biomarkers (NLR family, pyrin domain containing 2, immunoglobulin J polypeptide, and the regulator of G-protein signaling 5) without clinical covariables explained 28% [8]. Recently, our group identified activation of intracellular vascular endothelial growth factor signaling and hypoxia response pathways in microdissected proximal tubule cells from patients with progressive CKD using microarrays and pathway analysis tools. The expression levels of hypoxia-inducible factor-1 alpha and vascular endothelial growth factor-A were significantly superior in predict- ing clinical outcome as compared to proteinuria, renal function, and degree of histological damage [9]. PLOS ONE | www.plosone.org 1 September 2012 | Volume 7 | Issue 9 | e44891
Transcript of Increased Renal Versican Expression Is Associated with Progression of Chronic Kidney Disease
Increased Renal Versican Expression Is Associated withProgression of Chronic Kidney DiseaseMichael Rudnicki1*, Paul Perco2, Hannes Neuwirt1, Susie-Jane Noppert1, Johannes Leierer1,
Judith Sunzenauer1, Susanne Eder1, Carlamaria Zoja3, Kathrin Eller1,4, Alexander R. Rosenkranz1,4,
Gerhard A. Muller5, Bernd Mayer2, Gert Mayer1
1Medical University Innsbruck, Deptartment of Internal Medicine IV - Nephrology and Hypertension, Innsbruck, Austria, 2 Emergentec Biodevelopment GmbH, Vienna,
Austria, 3Mario Negri Institute for Pharmacological Research, Centro Anna Maria Astori, Science and Technology Park Kilometro Rosso, Bergamo, Italy, 4Medical
University of Graz, Deptartment of Internal Medicine, Clinical Division of Nephrology and Hemodialysis, Graz, Austria, 5Georg-August-University Gottingen, Department of
Medicine, Nephrology and Rheumatology, Gottingen, Germany
Abstract
Novel prognostic markers for progression of kidney disease are needed to distinguish patients who might benefit froma more aggressive nephroprotective therapy. Expression of the proteoglycan versican was evaluated in renaltranscriptomics profiles and in an independent set of 74 renal biopsies. Versican levels were correlated to histologicdamage scores and to renal outcome, and versican expression and regulation was evaluated in vitro. In transcriptomicsprofiles of renal tissue versican was positively correlated with (i) histological parameters in kidney biopsies, (ii) progressivedecline of renal function in proteinuric kidney diseases, and (iii) impaired renal function and histology scores in diabeticnephropathy. In an independent cohort of 74 biopsies of glomerular diseases renal RNA levels of versican isoforms V0 andV1, but not V2 and V3 correlated significantly with creatinine after a mean follow up time of 53 months. Versican isoformsV0 and V1 together with serum creatinine at time of biopsy and the degree of glomerulosclerosis predicted 20% and 24% ofthe variability of creatinine at follow up, which was significantly more than serum creatinine and histological parametersalone (16%). However, when patients with acute kidney failure at time of biopsy (n = 5) were excluded, the additivepredictive value of versican V1 was only marginally higher (35%) than creatinine and glomerulosclerosis alone (34%).Versican isoforms V0 and V1 were primarily expressed in vitro in proximal tubule cells and in fibroblasts. The results inhumans were confirmed in three rodent models of kidney disease, in which renal versican expression was significantlyupregulated as compared to corresponding controls. These data show for the first time an association of renal versicanisoform V0 and V1 expression with progressive renal disease.
Citation: Rudnicki M, Perco P, Neuwirt H, Noppert S-J, Leierer J, et al. (2012) Increased Renal Versican Expression Is Associated with Progression of Chronic KidneyDisease. PLoS ONE 7(9): e44891. doi:10.1371/journal.pone.0044891
Editor: Jean-Claude Dussaule, Inserm, France
Received February 22, 2012; Accepted August 15, 2012; Published September 14, 2012
Copyright: � 2012 Rudnicki et al. This is an open-access article distributed under the terms of the Creative Commons Attribution License, which permitsunrestricted use, distribution, and reproduction in any medium, provided the original author and source are credited.
Funding: The research leading to these results has received funding from the European Community’s Seventh Framework Programme (FP7/2007–2013) underthe grant agreement 241544 (SysKid). The funders had no role in study design, data collection and analysis, decision to publish, or preparation of the manuscript.
Competing Interests: MR, PP, and GM filed a patent application on versican for prediction of progressive nephropathy in CKD patients (PCT/EP2010/057917: Amethod of diagnosing renal disorders). BM is co-owner, and PP is employee of emergentec biodevelopment GmbH. This does not alter the authors’ adherence toall the PLoS ONE policies on sharing data and materials. All other authors have nothing to disclose.
* E-mail: [email protected]
Introduction
Progression of chronic kidney disease (CKD) is associated with
increased morbidity and mortality, reduced quality of life, and
major challenges for healthcare systems [1]. Clinical features
predicting a poor prognosis include impaired renal function,
hypertension and nephrotic range proteinuria at presentation [2]
as well as during follow-up [3,4]. Histopathological changes such
as the degree of tubular atrophy and interstitial fibrosis have been
shown to better predict long-term renal survival than the extent of
glomerular damage even in primary glomerular diseases [5]. To
further enhance the prediction of progression of CKD various
genes and proteins have been identified as molecular biomarker
candidates of kidney damage, and their clinical significance has
recently been reviewed in detail [6].
High-throughput transcriptomics experiments together with
integrative bioinformatics led to the identification of additional
novel biomarker candidates. Henger et al. identified a marker set
of nine genes (Chemokine (C-C motif) ligand 21, interleukin 8,
matrix metalloproteinase 3, 7 and 9, urokinase R, chemokine (C-
X-C motif) receptor 5, integrin beta 4, and pleiotrophin), which
predicted a progressive course of CKD [7]. Perco et al. showed
that histology of zero-hour preimplant biopsies explained only
14% of the variability of one year creatinine whereas a combina-
tion of three biomarkers (NLR family, pyrin domain containing 2,
immunoglobulin J polypeptide, and the regulator of G-protein
signaling 5) without clinical covariables explained 28% [8].
Recently, our group identified activation of intracellular vascular
endothelial growth factor signaling and hypoxia response pathways in
microdissected proximal tubule cells from patients with progressive
CKD using microarrays and pathway analysis tools. The
expression levels of hypoxia-inducible factor-1 alpha and vascular
endothelial growth factor-A were significantly superior in predict-
ing clinical outcome as compared to proteinuria, renal function,
and degree of histological damage [9].
PLOS ONE | www.plosone.org 1 September 2012 | Volume 7 | Issue 9 | e44891
In the latter two datasets the hyaluronan binding proteoglycan
versican (VCAN) – also termed chondroitin sulphate proteoglycan
2 (CSPG2) - showed a significant correlation with progressive
decline of post-bioptical renal function in patients with CKD on
the one hand and with increased histological damage on the other
hand. The aim of the present study was to characterize versican as
a novel renal biomarker predicting progressive decline of kidney
function in patients with proteinuric nephropathies.
Results
Versican is a Marker of Renal Injury and Impaired RenalFunctionData are summarized in table 1. In the histogenomics data set
by Perco et al. the expression levels of versican showed significant
associations to the degree of acute tubular injury (2.55 fold
upregulation), tubular atrophy (2.10 fold upregulation), as well as
interstitial fibrosis (1.94 fold upregulation) in zero-hour preimplant
renal biopsies [8] (figure S1). Rudnicki et al. analyzed global gene
expression in microdissected human proximal tubular epithelial
cells isolated from 21 patients with various proteinuric nephrop-
athies. In the array raw data set versican showed a significant
mean upregulation by 69% in 3 of 4 versican spots on the arrays
when stable (n = 14) and progressive subjects (n = 7) were
compared (figure S2) [9]. In kidney biopsies from patients with
diabetic nephropathy (DN) versican expression was increased 1.4
fold as compared to patients with minimal change disease (MCD)
(p,0.05) (figure S3) [10]. In the 13 diabetic DN biopsies renal
versican expression was furthermore significantly correlated with
serum creatinine at time of biopsy (spot 1: R= 0.70, p = 0.008,
spot 2: R= 0.58, p= 0.04) and with chronic histological damage
(spot 1: R= 0.68, p= 0.01, spot 2: R= 0.62, p = 0.03) (figures S4
and S5).
However, neither of these studies confirmed the results by real-
time PCR or analyzed the expression of the specific versican
isoforms V0, V1, V2 and V3 in the respective context covered by
each study.
Renal Versican Expression Correlates with ProgressiveDecline of Kidney FunctionTo further characterize renal expression of versican isoforms
and the association with clinical parameters we analyzed the
expression of versican isoforms V0, V1, V2 and V3 in an
independent cohort of 74 patients with various proteinuric kidney
diseases (table 2). We did not detect any expression of V2 in these
samples, and V3 did not show any correlation with laboratory,
clinical or histological parameters (data not shown). No significant
correlation of V0 and V1 to age, creatinine, eGFR or proteinuria
at time of biopsy was detected, although the correlation of V1 to
creatinine at biopsy was of borderline significance (R= 0.220,
p = 0.06, table 3). However, both isoforms V0 and V1 did
significantly correlate with serum creatinine at time of follow-up
(V0 R=0.337, p = 0.003; V1 R=0.387, p= 0.001), but not with
eGFR or proteinuria. Regarding histological characteristics no
significant correlation of V0 or V1 levels with the histological
diagnosis, and the degree of tubular atrophy/interstitial fibrosis
(TAIF), interstitial inflammation (II), or glomerulosclerosis (GS)
was observed. However, V1 levels showed a borderline significant
correlation with the degree of TAIF (R= 0.208, p= 0.075) and II
(R= 0.199, p = 0.092) (table 3). We classified the set of 74 patients
as stable or progressive according to doubling of serum creatinine
or reaching of end-stage renal disease (ESRD) during follow-up.
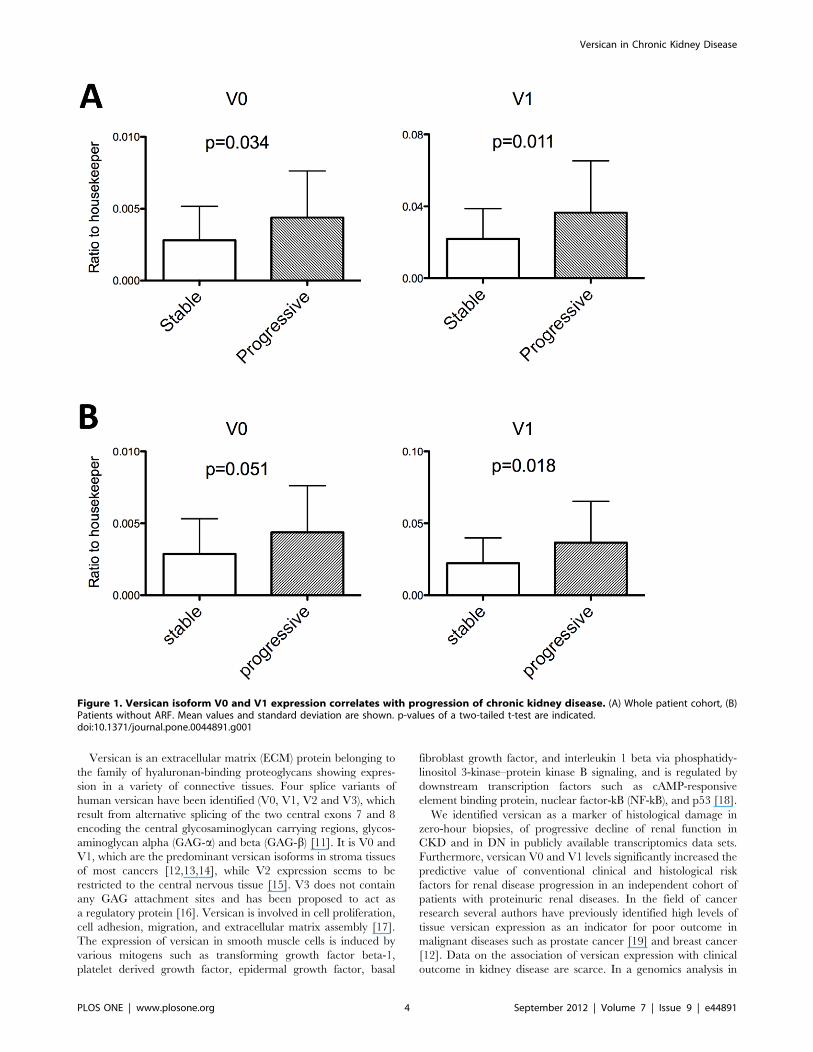
As shown in figure 1A the expression of V0 and V1 was higher in
progressive disease (V0:1.56 fold, p= 0.034; V1:1.67 fold,
Table
1.Microarraydatasets
usedto
evaluatetheexp
ressionofversican
inrenal
pathologies.
Reference
Disease
NAge(years)Creatinine(m
g/
dl)
Tissu
eCompariso
nVersican
upregulation
Significance
levelc
[8]
Zero-hourtran
splantbiopsies
82
47616
n.a.
Whole
kidney
Acute
tubularinjury
b
Tubularatrophy
b
Interstitial
fibrosisb
+2.55fold
+2.10fold
+1.94fold
P,0.05
[9]
Proteinuricnephropathiesa
31
38615
1.761.2
MicrodissectedPTEC
sfrom
renal
biopsies
Progressivevs
stab
lekidneydisease
+1.69fold
P,0.05in
3of4versican
spots
[10]
LD,CD,MCD,DN
24
47616
1.461.2
Tubulointerstitium
from
renal
biopsies
DNvs
MCD
DN:Pearsoncorrelationwithserum
creatinine
DN:Pearsoncorrelationwithhistologyscore
+1.4
fold
R=0.70
R=0.68
P,0.05
P,0.05
P,0.05
DNdiabeticnephropathy,MCDminim
alchan
gedisease,LD
livingdonors,CDcadavericdonors,PTEC
sproximal
tubularepithelialcells.aProteinuricglomerulardiseasesincludedfocalsegmentalglomerulosclerosis(FSG
S),MCD,
IgAnephropathy(IGAN),lupusnephritis(LN),rapid-progressiveglomerulonephritis(RPGN),membranoproliferative
glomerulonephritis(M
PGN),ANCAassociatedvasculitis(AAV)an
dhyp
ertensive
nephropathy(HTN).Mean
values
andstan
darddeviationsareshown.b
Referto
thetext
fordefinitionofthehistologicalclasses.
cIn
(8)sampleswithlow
andhighhistologicaldam
agewere
comparedan
din
(9)stab
lean
dprogressivesampleswere
compared.A
two-tailedt-test
was
perform
ed.In
(10)samplesfrom
MCD
andDNwere
compared(twotailedt-test),an
dalso
aPearsoncorrelationofcreatinineat
biopsy
andhistologyscore
inDNwithversican
levelswas
calculated.
doi:10.1371/journal.pone.0044891.t001
Versican in Chronic Kidney Disease
PLOS ONE | www.plosone.org 2 September 2012 | Volume 7 | Issue 9 | e44891
p= 0.011). Versican V0 and V1 levels did not correlate to eGFR
slope (calculated as delta ml/min/1.73 m2 per year), neither in the
whole group nor when analysis was restricted to subjects with
eGFR values ,60 ml/min/1.73 m2 (data not shown). In the
stable cohort 5 patients were identified who had acute renal failure
(ARF) at time of biopsy. Since data on renal function of these
patients was not available before biopsy, ARF was defined as
a decrease of creatinine during follow-up of more than 50%.
These 5 patients had a creatinine at time of biopsy of
5.3761.25 mg/dl and 1.4060.32 mg/dl after a follow-up time
of 55619 months. When these 5 patients were excluded from the
stable cohort, renal function at time of biopsy was significantly
different between the stable and the progressive cohort (table 2).
V0 and V1 significantly correlated with creatinine at time of
biopsy and at time of follow-up, while no significant correlations
were found with age and proteinuria. Regarding histological
parameters no significant correlations of V0 and V1 with the
diagnosis were identified. However, V0 correlated significantly
with the degree of GS, while V1 correlated significantly with the
degree of TAIF and showed a borderline significant correlation
with the degree of II (table 4). As shown in figure 1B the expression
of V0 and V1 was still higher in progressive disease (V0:1.52 fold,
p = 0.051; V1:1.64 fold, p = 0.018) although the level of signifi-
cance was borderline in the case of V0.
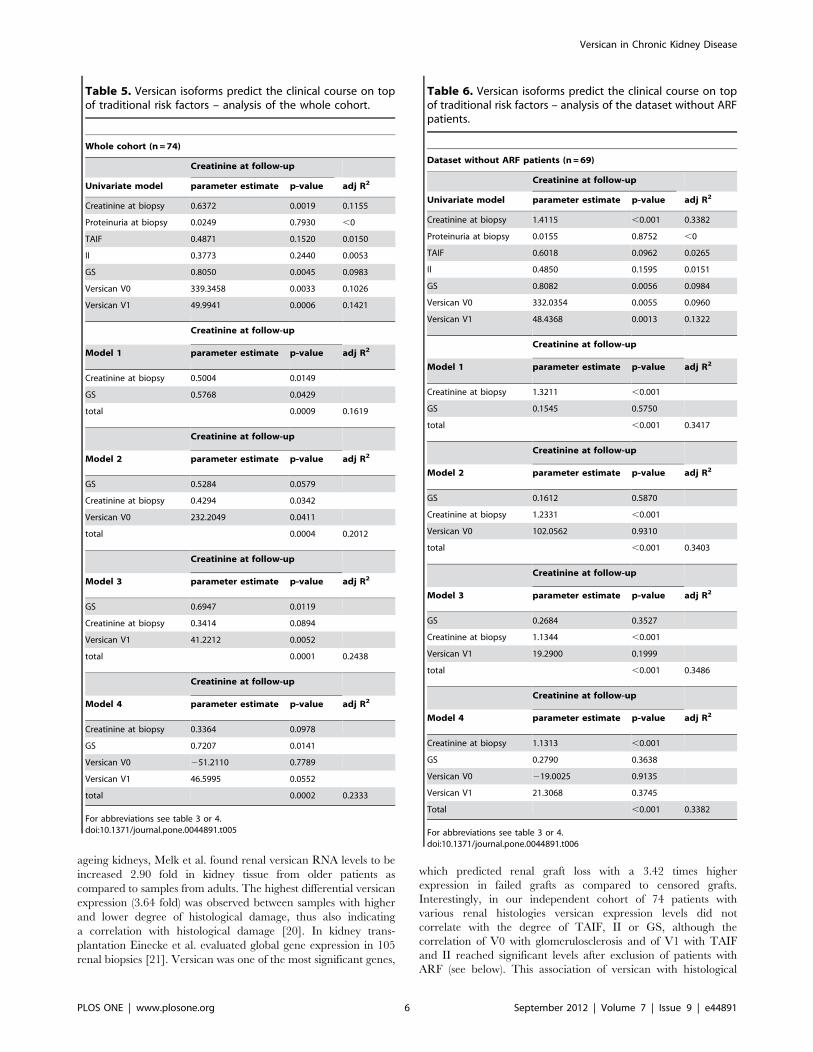
Versican Predicts Future Renal FunctionCreatinine at time of biopsy (p = 0.002) and the degree of GS
(p = 0.006), but neither the degree of proteinuria, nor the extent of
TAIF or II were significantly associated with adverse renal
outcome. The isoforms V0 and V1 correlated with creatinine at
follow-up resulting in R2 values of 0.1026 (p = 0.0033) and 0.1421
(p = 0.0006), respectively. The combination of the two parameters
GS and creatinine at time of biopsy (model 1) resulted in an
adjusted R2 of 0.1619 (p= 0.0009). Addition of V0 to this model
resulted in an adjusted R2 of 0.2012 (p = 0.0004) (model 2). The
model with the highest adjusted R2 of 0.2438 (p= 0.0001) included
the variables GS, creatinine at time of biopsy, and V1 (model 3).
The model with both isoforms together with GS and creatinine at
time of biopsy (model 4) did not further increase the predictive
value (table 5). We also analyzed the prediction of future renal
function using the same variables after exclusion of the 5 patients
with AKI. In this analysis creatinine at time of biopsy became
a strong predictor of creatinine at follow-up with an adjusted R2 of
0.34. Although glomerulosclerosis and both versican isoforms also
showed significant associations with creatinine at follow-up, the
addition of glomerulosclerosis and either V0 or V1 or both
isoforms to creatinine did not increase the predictive value of
creatinine to a significant extent (table 6).
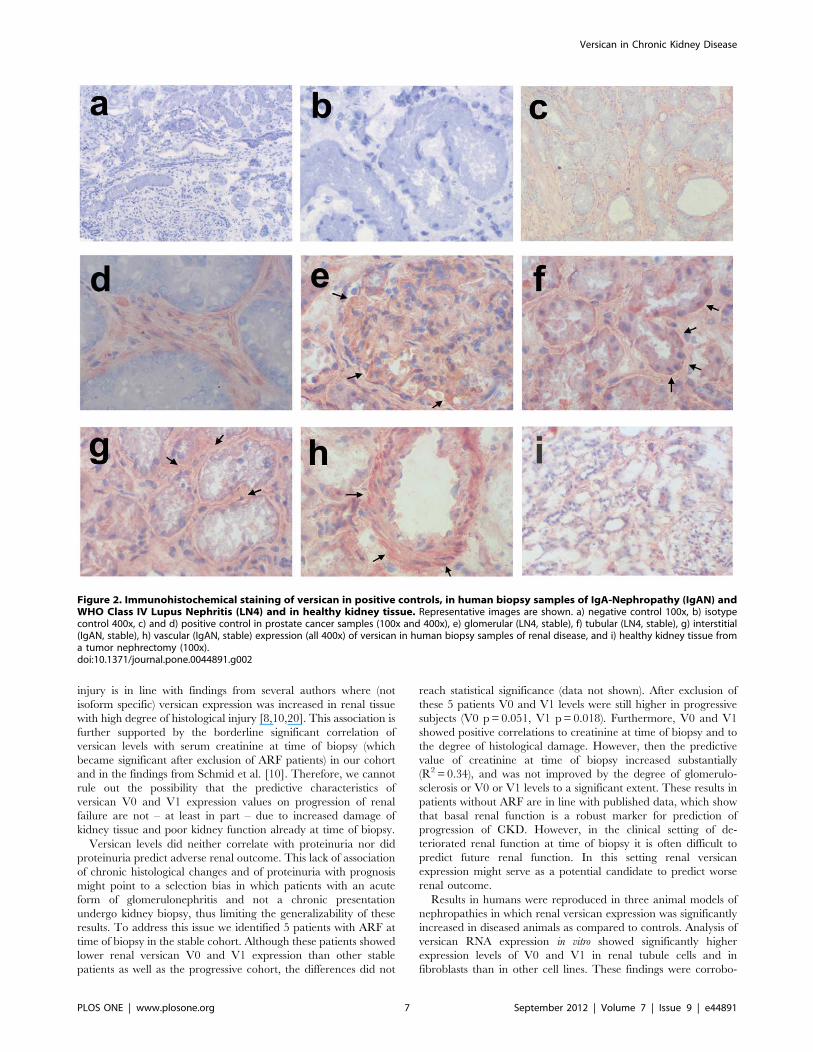
Immunohistochemical Staining Shows PronouncedVersican Expression in the TubulointerstitialCompartmentNext we evaluated the potential origin of versican expression by
immunohistochemistry in a healthy control and in representative
biopsies from patients with proteinuric nephropathies. We found
ubiquitous versican protein expression in the glomerular and in
the tubulointerstitial compartment as well as in blood vessels
(figure 2). Glomerular expression was rather weak, and the tubular
expression was more pronounced at the basolateral membrane. In
areas of marked interstitial fibrosis versican expression was also
increased showing a fibrillar pattern. In renal blood vessels no
expression of versican was detected in the intima, but there was
a strong signal in the media and in the adventitia. In healthy renal
tissue versican expression was generally lower than in the diseased
cases. A weak signal was seen mainly in the tubulointerstitium.
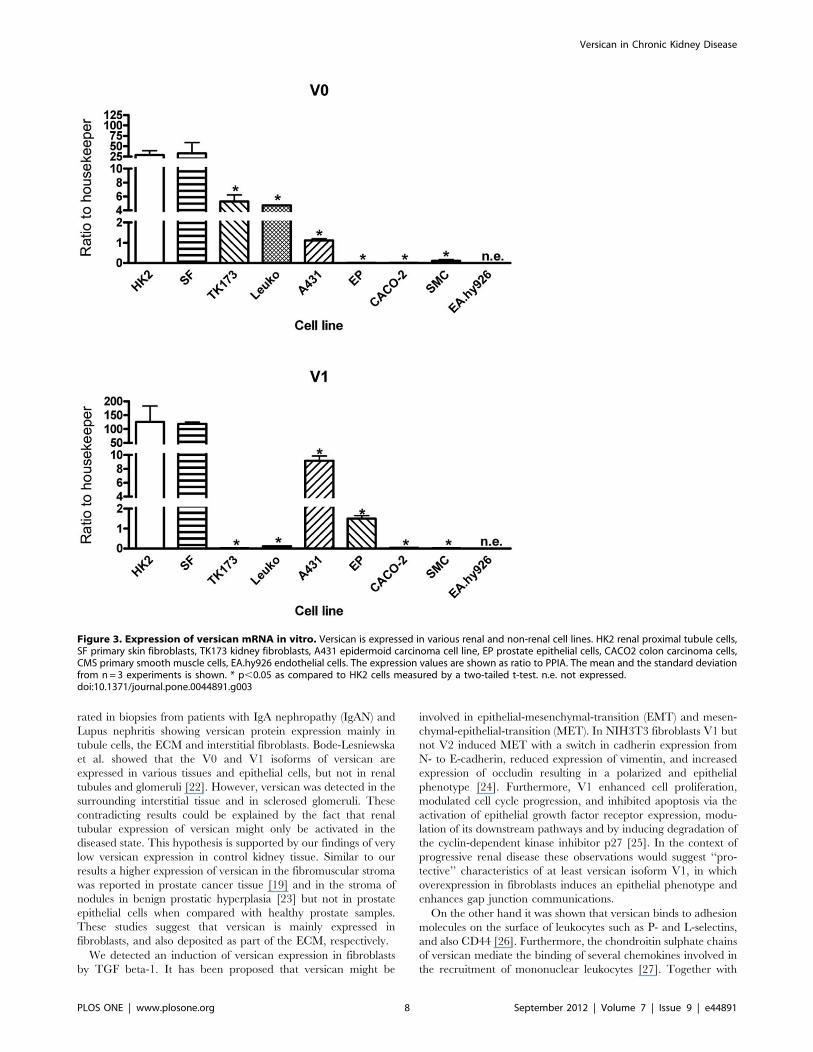
Versican is Expressed in Renal Epithelial Cells and inFibroblasts in vitroWe further analyzed cell and organ specificity of versican
expression. Human proximal tubule cell line HK2 and human skin
fibroblast (SF) cell line showed highest expression of V0 and V1
(figure 3). Apart from this relatively similar expression pattern in
these three cell lines, we also detected cell type specific differences
in expression between the isoforms V0 and V1. Human kidney
fibroblasts TK-173, leukocytes, and the epithelial cell line A431
showed a V0 expression which was approximately 5 to 25 times
less than in HK2 cells. The expression of V0 was extremely low in
prostate epithelial cells, colon epithelial cells, smooth muscle cells
and also in control (‘‘healthy’’) kidney tissue (0.06% to 0.3% as
compared to HK2). The results were similar for V1 (0.01% to 7%
as compared to HK2), with the exception that V1 expression was
also very low in kidney fibroblasts and leukocytes (0.01% to 0.08%
as compared to HK2). We did not detect any versican expression
in endothelial cells.
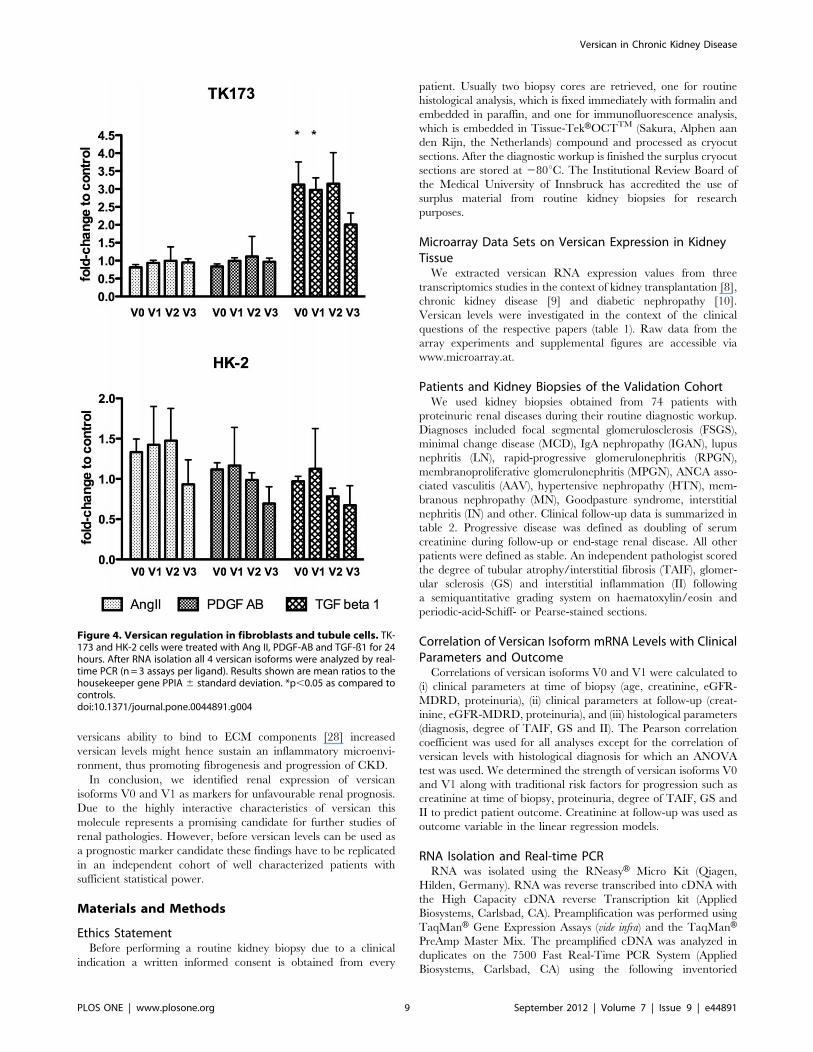
TGF-ß1 Upregulates Versican in FibroblastsBased on the high basal expression of versican in tubule cells
and in fibroblasts we next examined the effect of angiotensin (Ang)
II, platelet-derived growth factor (PDGF)-AB and transforming
growth factor (TGF) beta-1 on the expression of all versican
isoforms in HK-2 and TK-173 cells. We selected these ligands
because of their known regulatory effect on versican expression in
smooth-muscle cells, and their well-established profibrotic and
proinflammatory characteristics. When HK-2 and TK-173 cells
were treated with Ang II or PDGF-AB, we did not detect any
regulation of any of the versican isoforms. However, treatment
with TGF beta-1 resulted in a significant upregulation of V0 and
V1 by approx. 3.5 fold in the fibroblast cell line TK-173. We did
not detect any significant effect of TGF-ß1 on versican isoform
expression in the proximal tubule cell line HK-2 (figure 4).
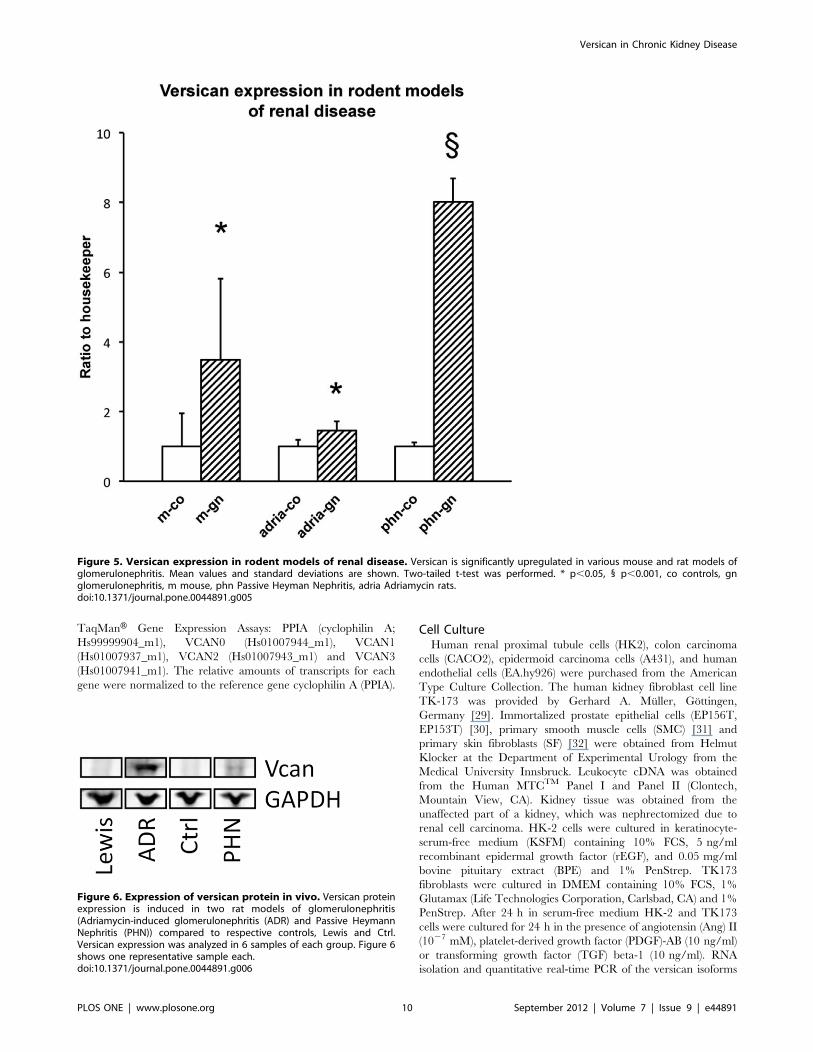
Versican is Upregulated in Rodent Models of KidneyDiseasesWe determined the relevance of our findings by analyzing renal
versican mRNA expression in mouse and rat models resembling
human glomerular pathologies. The expression values in corre-
sponding controls were arbitrarily set to 1. Versican was
upregulated 3.5 fold (p = 0.02) in mice with accelerated nephro-
toxic serum nephritis, a model of proliferative glomerulonephritis,
after 14 days (figure 5). In rats with adriamycin-induced
nephropathy, that mimics aspects of human MCD and focal-
segmental glomerulosclerosis (FSGS), a 1.5 fold (p = 0.03) increase
in versican mRNA as compared to controls was found at 21 days.
Finally, a highly significant upregulation of renal versican, i.e. 8.0
fold (p,0.001) increase over control, was observed in rats with
Passive Heymann Nephritis (PHN) - a severe model of proteinuric
nephropathy which partly resembles human membranous ne-
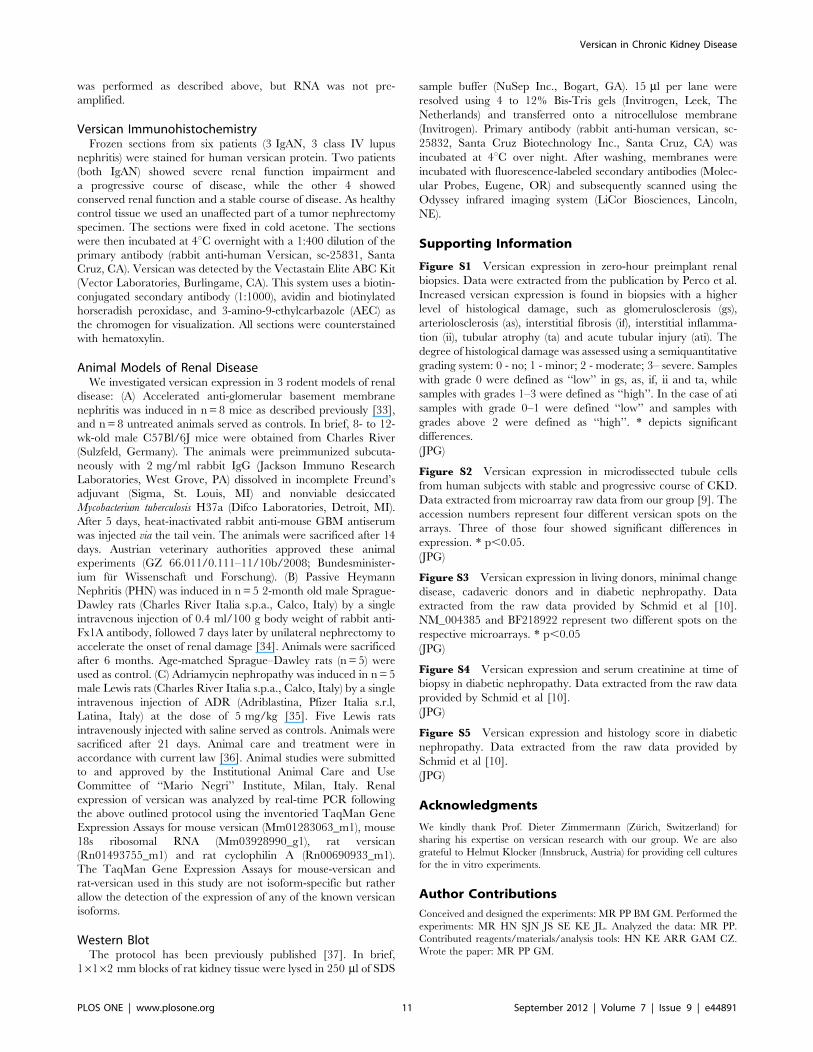
phropathy (MN) - studied at 6 months. In ADR and in PHN
nephropathy versican expression was also increased on the protein
level (figure 6).
Discussion
In this work we describe the two versican isoforms V0 and V1 as
novel biomarker candidates with the potential to predict pro-
gression of CKD already at an early stage.
Versican in Chronic Kidney Disease
PLOS ONE | www.plosone.org 3 September 2012 | Volume 7 | Issue 9 | e44891
Versican is an extracellular matrix (ECM) protein belonging to
the family of hyaluronan-binding proteoglycans showing expres-
sion in a variety of connective tissues. Four splice variants of
human versican have been identified (V0, V1, V2 and V3), which
result from alternative splicing of the two central exons 7 and 8
encoding the central glycosaminoglycan carrying regions, glycos-
aminoglycan alpha (GAG-a) and beta (GAG-b) [11]. It is V0 and
V1, which are the predominant versican isoforms in stroma tissues
of most cancers [12,13,14], while V2 expression seems to be
restricted to the central nervous tissue [15]. V3 does not contain
any GAG attachment sites and has been proposed to act as
a regulatory protein [16]. Versican is involved in cell proliferation,
cell adhesion, migration, and extracellular matrix assembly [17].
The expression of versican in smooth muscle cells is induced by
various mitogens such as transforming growth factor beta-1,
platelet derived growth factor, epidermal growth factor, basal
fibroblast growth factor, and interleukin 1 beta via phosphatidy-
linositol 3-kinase–protein kinase B signaling, and is regulated by
downstream transcription factors such as cAMP-responsive
element binding protein, nuclear factor-kB (NF-kB), and p53 [18].
We identified versican as a marker of histological damage in
zero-hour biopsies, of progressive decline of renal function in
CKD and in DN in publicly available transcriptomics data sets.
Furthermore, versican V0 and V1 levels significantly increased the
predictive value of conventional clinical and histological risk
factors for renal disease progression in an independent cohort of
patients with proteinuric renal diseases. In the field of cancer
research several authors have previously identified high levels of
tissue versican expression as an indicator for poor outcome in
malignant diseases such as prostate cancer [19] and breast cancer
[12]. Data on the association of versican expression with clinical
outcome in kidney disease are scarce. In a genomics analysis in
Figure 1. Versican isoform V0 and V1 expression correlates with progression of chronic kidney disease. (A) Whole patient cohort, (B)Patients without ARF. Mean values and standard deviation are shown. p-values of a two-tailed t-test are indicated.doi:10.1371/journal.pone.0044891.g001
Versican in Chronic Kidney Disease
PLOS ONE | www.plosone.org 4 September 2012 | Volume 7 | Issue 9 | e44891
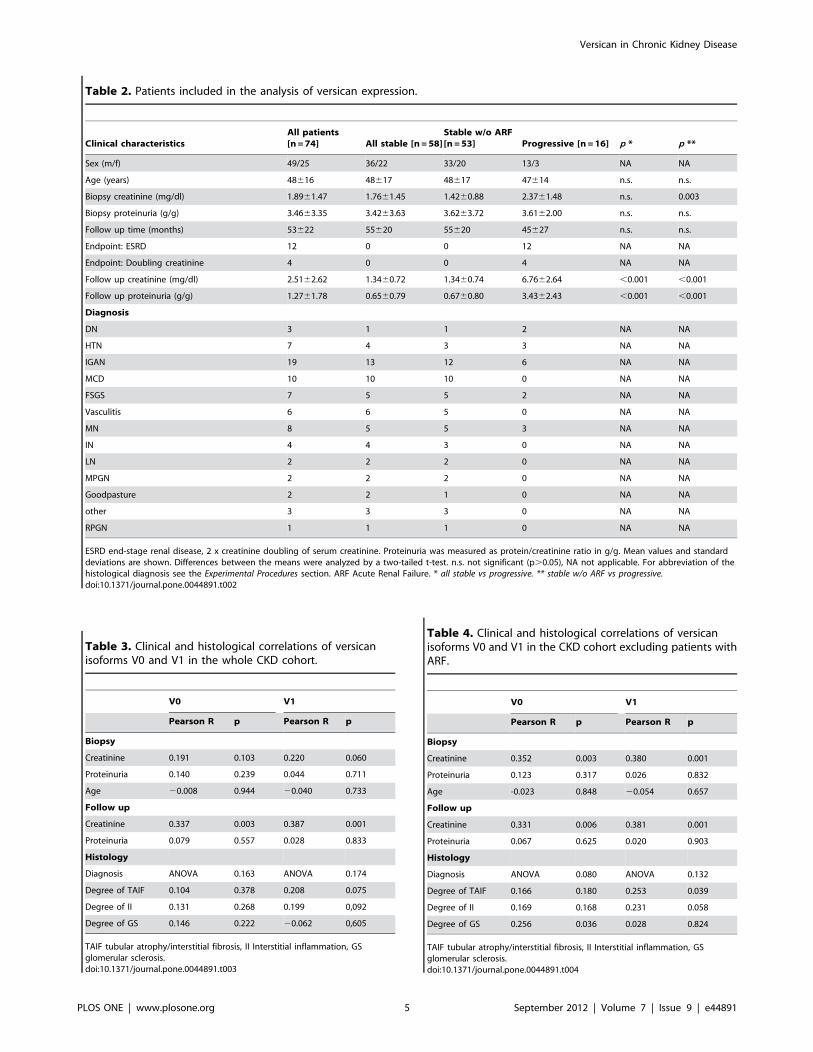
Table 2. Patients included in the analysis of versican expression.
Clinical characteristicsAll patients[n =74] All stable [n =58]
Stable w/o ARF[n =53] Progressive [n =16] p * p **
Sex (m/f) 49/25 36/22 33/20 13/3 NA NA
Age (years) 48616 48617 48617 47614 n.s. n.s.
Biopsy creatinine (mg/dl) 1.8961.47 1.7661.45 1.4260.88 2.3761.48 n.s. 0.003
Biopsy proteinuria (g/g) 3.4663.35 3.4263.63 3.6263.72 3.6162.00 n.s. n.s.
Follow up time (months) 53622 55620 55620 45627 n.s. n.s.
Endpoint: ESRD 12 0 0 12 NA NA
Endpoint: Doubling creatinine 4 0 0 4 NA NA
Follow up creatinine (mg/dl) 2.5162.62 1.3460.72 1.3460.74 6.7662.64 ,0.001 ,0.001
Follow up proteinuria (g/g) 1.2761.78 0.6560.79 0.6760.80 3.4362.43 ,0.001 ,0.001
Diagnosis
DN 3 1 1 2 NA NA
HTN 7 4 3 3 NA NA
IGAN 19 13 12 6 NA NA
MCD 10 10 10 0 NA NA
FSGS 7 5 5 2 NA NA
Vasculitis 6 6 5 0 NA NA
MN 8 5 5 3 NA NA
IN 4 4 3 0 NA NA
LN 2 2 2 0 NA NA
MPGN 2 2 2 0 NA NA
Goodpasture 2 2 1 0 NA NA
other 3 3 3 0 NA NA
RPGN 1 1 1 0 NA NA
ESRD end-stage renal disease, 2 x creatinine doubling of serum creatinine. Proteinuria was measured as protein/creatinine ratio in g/g. Mean values and standarddeviations are shown. Differences between the means were analyzed by a two-tailed t-test. n.s. not significant (p.0.05), NA not applicable. For abbreviation of thehistological diagnosis see the Experimental Procedures section. ARF Acute Renal Failure. * all stable vs progressive. ** stable w/o ARF vs progressive.doi:10.1371/journal.pone.0044891.t002
Table 3. Clinical and histological correlations of versicanisoforms V0 and V1 in the whole CKD cohort.
V0 V1
Pearson R p Pearson R p
Biopsy
Creatinine 0.191 0.103 0.220 0.060
Proteinuria 0.140 0.239 0.044 0.711
Age 20.008 0.944 20.040 0.733
Follow up
Creatinine 0.337 0.003 0.387 0.001
Proteinuria 0.079 0.557 0.028 0.833
Histology
Diagnosis ANOVA 0.163 ANOVA 0.174
Degree of TAIF 0.104 0.378 0.208 0.075
Degree of II 0.131 0.268 0.199 0,092
Degree of GS 0.146 0.222 20.062 0,605
TAIF tubular atrophy/interstitial fibrosis, II Interstitial inflammation, GSglomerular sclerosis.doi:10.1371/journal.pone.0044891.t003
Table 4. Clinical and histological correlations of versicanisoforms V0 and V1 in the CKD cohort excluding patients withARF.
V0 V1
Pearson R p Pearson R p
Biopsy
Creatinine 0.352 0.003 0.380 0.001
Proteinuria 0.123 0.317 0.026 0.832
Age -0.023 0.848 20.054 0.657
Follow up
Creatinine 0.331 0.006 0.381 0.001
Proteinuria 0.067 0.625 0.020 0.903
Histology
Diagnosis ANOVA 0.080 ANOVA 0.132
Degree of TAIF 0.166 0.180 0.253 0.039
Degree of II 0.169 0.168 0.231 0.058
Degree of GS 0.256 0.036 0.028 0.824
TAIF tubular atrophy/interstitial fibrosis, II Interstitial inflammation, GSglomerular sclerosis.doi:10.1371/journal.pone.0044891.t004
Versican in Chronic Kidney Disease
PLOS ONE | www.plosone.org 5 September 2012 | Volume 7 | Issue 9 | e44891
ageing kidneys, Melk et al. found renal versican RNA levels to be
increased 2.90 fold in kidney tissue from older patients as
compared to samples from adults. The highest differential versican
expression (3.64 fold) was observed between samples with higher
and lower degree of histological damage, thus also indicating
a correlation with histological damage [20]. In kidney trans-
plantation Einecke et al. evaluated global gene expression in 105
renal biopsies [21]. Versican was one of the most significant genes,
which predicted renal graft loss with a 3.42 times higher
expression in failed grafts as compared to censored grafts.
Interestingly, in our independent cohort of 74 patients with
various renal histologies versican expression levels did not
correlate with the degree of TAIF, II or GS, although the
correlation of V0 with glomerulosclerosis and of V1 with TAIF
and II reached significant levels after exclusion of patients with
ARF (see below). This association of versican with histological
Table 5. Versican isoforms predict the clinical course on topof traditional risk factors – analysis of the whole cohort.
Whole cohort (n =74)
Creatinine at follow-up
Univariate model parameter estimate p-value adj R2
Creatinine at biopsy 0.6372 0.0019 0.1155
Proteinuria at biopsy 0.0249 0.7930 ,0
TAIF 0.4871 0.1520 0.0150
II 0.3773 0.2440 0.0053
GS 0.8050 0.0045 0.0983
Versican V0 339.3458 0.0033 0.1026
Versican V1 49.9941 0.0006 0.1421
Creatinine at follow-up
Model 1 parameter estimate p-value adj R2
Creatinine at biopsy 0.5004 0.0149
GS 0.5768 0.0429
total 0.0009 0.1619
Creatinine at follow-up
Model 2 parameter estimate p-value adj R2
GS 0.5284 0.0579
Creatinine at biopsy 0.4294 0.0342
Versican V0 232.2049 0.0411
total 0.0004 0.2012
Creatinine at follow-up
Model 3 parameter estimate p-value adj R2
GS 0.6947 0.0119
Creatinine at biopsy 0.3414 0.0894
Versican V1 41.2212 0.0052
total 0.0001 0.2438
Creatinine at follow-up
Model 4 parameter estimate p-value adj R2
Creatinine at biopsy 0.3364 0.0978
GS 0.7207 0.0141
Versican V0 251.2110 0.7789
Versican V1 46.5995 0.0552
total 0.0002 0.2333
For abbreviations see table 3 or 4.doi:10.1371/journal.pone.0044891.t005
Table 6. Versican isoforms predict the clinical course on topof traditional risk factors – analysis of the dataset without ARFpatients.
Dataset without ARF patients (n=69)
Creatinine at follow-up
Univariate model parameter estimate p-value adj R2
Creatinine at biopsy 1.4115 ,0.001 0.3382
Proteinuria at biopsy 0.0155 0.8752 ,0
TAIF 0.6018 0.0962 0.0265
II 0.4850 0.1595 0.0151
GS 0.8082 0.0056 0.0984
Versican V0 332.0354 0.0055 0.0960
Versican V1 48.4368 0.0013 0.1322
Creatinine at follow-up
Model 1 parameter estimate p-value adj R2
Creatinine at biopsy 1.3211 ,0.001
GS 0.1545 0.5750
total ,0.001 0.3417
Creatinine at follow-up
Model 2 parameter estimate p-value adj R2
GS 0.1612 0.5870
Creatinine at biopsy 1.2331 ,0.001
Versican V0 102.0562 0.9310
total ,0.001 0.3403
Creatinine at follow-up
Model 3 parameter estimate p-value adj R2
GS 0.2684 0.3527
Creatinine at biopsy 1.1344 ,0.001
Versican V1 19.2900 0.1999
total ,0.001 0.3486
Creatinine at follow-up
Model 4 parameter estimate p-value adj R2
Creatinine at biopsy 1.1313 ,0.001
GS 0.2790 0.3638
Versican V0 219.0025 0.9135
Versican V1 21.3068 0.3745
Total ,0.001 0.3382
For abbreviations see table 3 or 4.doi:10.1371/journal.pone.0044891.t006
Versican in Chronic Kidney Disease
PLOS ONE | www.plosone.org 6 September 2012 | Volume 7 | Issue 9 | e44891
injury is in line with findings from several authors where (not
isoform specific) versican expression was increased in renal tissue
with high degree of histological injury [8,10,20]. This association is
further supported by the borderline significant correlation of
versican levels with serum creatinine at time of biopsy (which
became significant after exclusion of ARF patients) in our cohort
and in the findings from Schmid et al. [10]. Therefore, we cannot
rule out the possibility that the predictive characteristics of
versican V0 and V1 expression values on progression of renal
failure are not – at least in part – due to increased damage of
kidney tissue and poor kidney function already at time of biopsy.
Versican levels did neither correlate with proteinuria nor did
proteinuria predict adverse renal outcome. This lack of association
of chronic histological changes and of proteinuria with prognosis
might point to a selection bias in which patients with an acute
form of glomerulonephritis and not a chronic presentation
undergo kidney biopsy, thus limiting the generalizability of these
results. To address this issue we identified 5 patients with ARF at
time of biopsy in the stable cohort. Although these patients showed
lower renal versican V0 and V1 expression than other stable
patients as well as the progressive cohort, the differences did not
reach statistical significance (data not shown). After exclusion of
these 5 patients V0 and V1 levels were still higher in progressive
subjects (V0 p= 0.051, V1 p= 0.018). Furthermore, V0 and V1
showed positive correlations to creatinine at time of biopsy and to
the degree of histological damage. However, then the predictive
value of creatinine at time of biopsy increased substantially
(R2 = 0.34), and was not improved by the degree of glomerulo-
sclerosis or V0 or V1 levels to a significant extent. These results in
patients without ARF are in line with published data, which show
that basal renal function is a robust marker for prediction of
progression of CKD. However, in the clinical setting of de-
teriorated renal function at time of biopsy it is often difficult to
predict future renal function. In this setting renal versican
expression might serve as a potential candidate to predict worse
renal outcome.
Results in humans were reproduced in three animal models of
nephropathies in which renal versican expression was significantly
increased in diseased animals as compared to controls. Analysis of
versican RNA expression in vitro showed significantly higher
expression levels of V0 and V1 in renal tubule cells and in
fibroblasts than in other cell lines. These findings were corrobo-
Figure 2. Immunohistochemical staining of versican in positive controls, in human biopsy samples of IgA-Nephropathy (IgAN) andWHO Class IV Lupus Nephritis (LN4) and in healthy kidney tissue. Representative images are shown. a) negative control 100x, b) isotypecontrol 400x, c) and d) positive control in prostate cancer samples (100x and 400x), e) glomerular (LN4, stable), f) tubular (LN4, stable), g) interstitial(IgAN, stable), h) vascular (IgAN, stable) expression (all 400x) of versican in human biopsy samples of renal disease, and i) healthy kidney tissue froma tumor nephrectomy (100x).doi:10.1371/journal.pone.0044891.g002
Versican in Chronic Kidney Disease
PLOS ONE | www.plosone.org 7 September 2012 | Volume 7 | Issue 9 | e44891
rated in biopsies from patients with IgA nephropathy (IgAN) and
Lupus nephritis showing versican protein expression mainly in
tubule cells, the ECM and interstitial fibroblasts. Bode-Lesniewska
et al. showed that the V0 and V1 isoforms of versican are
expressed in various tissues and epithelial cells, but not in renal
tubules and glomeruli [22]. However, versican was detected in the
surrounding interstitial tissue and in sclerosed glomeruli. These
contradicting results could be explained by the fact that renal
tubular expression of versican might only be activated in the
diseased state. This hypothesis is supported by our findings of very
low versican expression in control kidney tissue. Similar to our
results a higher expression of versican in the fibromuscular stroma
was reported in prostate cancer tissue [19] and in the stroma of
nodules in benign prostatic hyperplasia [23] but not in prostate
epithelial cells when compared with healthy prostate samples.
These studies suggest that versican is mainly expressed in
fibroblasts, and also deposited as part of the ECM, respectively.
We detected an induction of versican expression in fibroblasts
by TGF beta-1. It has been proposed that versican might be
involved in epithelial-mesenchymal-transition (EMT) and mesen-
chymal-epithelial-transition (MET). In NIH3T3 fibroblasts V1 but
not V2 induced MET with a switch in cadherin expression from
N- to E-cadherin, reduced expression of vimentin, and increased
expression of occludin resulting in a polarized and epithelial
phenotype [24]. Furthermore, V1 enhanced cell proliferation,
modulated cell cycle progression, and inhibited apoptosis via the
activation of epithelial growth factor receptor expression, modu-
lation of its downstream pathways and by inducing degradation of
the cyclin-dependent kinase inhibitor p27 [25]. In the context of
progressive renal disease these observations would suggest ‘‘pro-
tective’’ characteristics of at least versican isoform V1, in which
overexpression in fibroblasts induces an epithelial phenotype and
enhances gap junction communications.
On the other hand it was shown that versican binds to adhesion
molecules on the surface of leukocytes such as P- and L-selectins,
and also CD44 [26]. Furthermore, the chondroitin sulphate chains
of versican mediate the binding of several chemokines involved in
the recruitment of mononuclear leukocytes [27]. Together with
Figure 3. Expression of versican mRNA in vitro. Versican is expressed in various renal and non-renal cell lines. HK2 renal proximal tubule cells,SF primary skin fibroblasts, TK173 kidney fibroblasts, A431 epidermoid carcinoma cell line, EP prostate epithelial cells, CACO2 colon carcinoma cells,CMS primary smooth muscle cells, EA.hy926 endothelial cells. The expression values are shown as ratio to PPIA. The mean and the standard deviationfrom n= 3 experiments is shown. * p,0.05 as compared to HK2 cells measured by a two-tailed t-test. n.e. not expressed.doi:10.1371/journal.pone.0044891.g003
Versican in Chronic Kidney Disease
PLOS ONE | www.plosone.org 8 September 2012 | Volume 7 | Issue 9 | e44891
versicans ability to bind to ECM components [28] increased
versican levels might hence sustain an inflammatory microenvi-
ronment, thus promoting fibrogenesis and progression of CKD.
In conclusion, we identified renal expression of versican
isoforms V0 and V1 as markers for unfavourable renal prognosis.
Due to the highly interactive characteristics of versican this
molecule represents a promising candidate for further studies of
renal pathologies. However, before versican levels can be used as
a prognostic marker candidate these findings have to be replicated
in an independent cohort of well characterized patients with
sufficient statistical power.
Materials and Methods
Ethics StatementBefore performing a routine kidney biopsy due to a clinical
indication a written informed consent is obtained from every
patient. Usually two biopsy cores are retrieved, one for routine
histological analysis, which is fixed immediately with formalin and
embedded in paraffin, and one for immunofluorescence analysis,
which is embedded in Tissue-TekHOCTTM (Sakura, Alphen aan
den Rijn, the Netherlands) compound and processed as cryocut
sections. After the diagnostic workup is finished the surplus cryocut
sections are stored at 280uC. The Institutional Review Board of
the Medical University of Innsbruck has accredited the use of
surplus material from routine kidney biopsies for research
purposes.
Microarray Data Sets on Versican Expression in KidneyTissueWe extracted versican RNA expression values from three
transcriptomics studies in the context of kidney transplantation [8],
chronic kidney disease [9] and diabetic nephropathy [10].
Versican levels were investigated in the context of the clinical
questions of the respective papers (table 1). Raw data from the
array experiments and supplemental figures are accessible via
www.microarray.at.
Patients and Kidney Biopsies of the Validation CohortWe used kidney biopsies obtained from 74 patients with
proteinuric renal diseases during their routine diagnostic workup.
Diagnoses included focal segmental glomerulosclerosis (FSGS),
minimal change disease (MCD), IgA nephropathy (IGAN), lupus
nephritis (LN), rapid-progressive glomerulonephritis (RPGN),
membranoproliferative glomerulonephritis (MPGN), ANCA asso-
ciated vasculitis (AAV), hypertensive nephropathy (HTN), mem-
branous nephropathy (MN), Goodpasture syndrome, interstitial
nephritis (IN) and other. Clinical follow-up data is summarized in
table 2. Progressive disease was defined as doubling of serum
creatinine during follow-up or end-stage renal disease. All other
patients were defined as stable. An independent pathologist scored
the degree of tubular atrophy/interstitial fibrosis (TAIF), glomer-
ular sclerosis (GS) and interstitial inflammation (II) following
a semiquantitative grading system on haematoxylin/eosin and
periodic-acid-Schiff- or Pearse-stained sections.
Correlation of Versican Isoform mRNA Levels with ClinicalParameters and OutcomeCorrelations of versican isoforms V0 and V1 were calculated to
(i) clinical parameters at time of biopsy (age, creatinine, eGFR-
MDRD, proteinuria), (ii) clinical parameters at follow-up (creat-
inine, eGFR-MDRD, proteinuria), and (iii) histological parameters
(diagnosis, degree of TAIF, GS and II). The Pearson correlation
coefficient was used for all analyses except for the correlation of
versican levels with histological diagnosis for which an ANOVA
test was used. We determined the strength of versican isoforms V0
and V1 along with traditional risk factors for progression such as
creatinine at time of biopsy, proteinuria, degree of TAIF, GS and
II to predict patient outcome. Creatinine at follow-up was used as
outcome variable in the linear regression models.
RNA Isolation and Real-time PCRRNA was isolated using the RNeasyH Micro Kit (Qiagen,
Hilden, Germany). RNA was reverse transcribed into cDNA with
the High Capacity cDNA reverse Transcription kit (Applied
Biosystems, Carlsbad, CA). Preamplification was performed using
TaqManH Gene Expression Assays (vide infra) and the TaqManHPreAmp Master Mix. The preamplified cDNA was analyzed in
duplicates on the 7500 Fast Real-Time PCR System (Applied
Biosystems, Carlsbad, CA) using the following inventoried
Figure 4. Versican regulation in fibroblasts and tubule cells. TK-173 and HK-2 cells were treated with Ang II, PDGF-AB and TGF-ß1 for 24hours. After RNA isolation all 4 versican isoforms were analyzed by real-time PCR (n = 3 assays per ligand). Results shown are mean ratios to thehousekeeper gene PPIA 6 standard deviation. *p,0.05 as compared tocontrols.doi:10.1371/journal.pone.0044891.g004
Versican in Chronic Kidney Disease
PLOS ONE | www.plosone.org 9 September 2012 | Volume 7 | Issue 9 | e44891
TaqManH Gene Expression Assays: PPIA (cyclophilin A;
Hs99999904_m1), VCAN0 (Hs01007944_m1), VCAN1
(Hs01007937_m1), VCAN2 (Hs01007943_m1) and VCAN3
(Hs01007941_m1). The relative amounts of transcripts for each
gene were normalized to the reference gene cyclophilin A (PPIA).
Cell CultureHuman renal proximal tubule cells (HK2), colon carcinoma
cells (CACO2), epidermoid carcinoma cells (A431), and human
endothelial cells (EA.hy926) were purchased from the American
Type Culture Collection. The human kidney fibroblast cell line
TK-173 was provided by Gerhard A. Muller, Gottingen,
Germany [29]. Immortalized prostate epithelial cells (EP156T,
EP153T) [30], primary smooth muscle cells (SMC) [31] and
primary skin fibroblasts (SF) [32] were obtained from Helmut
Klocker at the Department of Experimental Urology from the
Medical University Innsbruck. Leukocyte cDNA was obtained
from the Human MTCTM Panel I and Panel II (Clontech,
Mountain View, CA). Kidney tissue was obtained from the
unaffected part of a kidney, which was nephrectomized due to
renal cell carcinoma. HK-2 cells were cultured in keratinocyte-
serum-free medium (KSFM) containing 10% FCS, 5 ng/ml
recombinant epidermal growth factor (rEGF), and 0.05 mg/ml
bovine pituitary extract (BPE) and 1% PenStrep. TK173
fibroblasts were cultured in DMEM containing 10% FCS, 1%
Glutamax (Life Technologies Corporation, Carlsbad, CA) and 1%
PenStrep. After 24 h in serum-free medium HK-2 and TK173
cells were cultured for 24 h in the presence of angiotensin (Ang) II
(1027 mM), platelet-derived growth factor (PDGF)-AB (10 ng/ml)
or transforming growth factor (TGF) beta-1 (10 ng/ml). RNA
isolation and quantitative real-time PCR of the versican isoforms
Figure 5. Versican expression in rodent models of renal disease. Versican is significantly upregulated in various mouse and rat models ofglomerulonephritis. Mean values and standard deviations are shown. Two-tailed t-test was performed. * p,0.05, 1 p,0.001, co controls, gnglomerulonephritis, m mouse, phn Passive Heyman Nephritis, adria Adriamycin rats.doi:10.1371/journal.pone.0044891.g005
Figure 6. Expression of versican protein in vivo. Versican proteinexpression is induced in two rat models of glomerulonephritis(Adriamycin-induced glomerulonephritis (ADR) and Passive HeymannNephritis (PHN)) compared to respective controls, Lewis and Ctrl.Versican expression was analyzed in 6 samples of each group. Figure 6shows one representative sample each.doi:10.1371/journal.pone.0044891.g006
Versican in Chronic Kidney Disease
PLOS ONE | www.plosone.org 10 September 2012 | Volume 7 | Issue 9 | e44891
was performed as described above, but RNA was not pre-
amplified.
Versican ImmunohistochemistryFrozen sections from six patients (3 IgAN, 3 class IV lupus
nephritis) were stained for human versican protein. Two patients
(both IgAN) showed severe renal function impairment and
a progressive course of disease, while the other 4 showed
conserved renal function and a stable course of disease. As healthy
control tissue we used an unaffected part of a tumor nephrectomy
specimen. The sections were fixed in cold acetone. The sections
were then incubated at 4uC overnight with a 1:400 dilution of the
primary antibody (rabbit anti-human Versican, sc-25831, Santa
Cruz, CA). Versican was detected by the Vectastain Elite ABC Kit
(Vector Laboratories, Burlingame, CA). This system uses a biotin-
conjugated secondary antibody (1:1000), avidin and biotinylated
horseradish peroxidase, and 3-amino-9-ethylcarbazole (AEC) as
the chromogen for visualization. All sections were counterstained
with hematoxylin.
Animal Models of Renal DiseaseWe investigated versican expression in 3 rodent models of renal
disease: (A) Accelerated anti-glomerular basement membrane
nephritis was induced in n= 8 mice as described previously [33],
and n= 8 untreated animals served as controls. In brief, 8- to 12-
wk-old male C57Bl/6J mice were obtained from Charles River
(Sulzfeld, Germany). The animals were preimmunized subcuta-
neously with 2 mg/ml rabbit IgG (Jackson Immuno Research
Laboratories, West Grove, PA) dissolved in incomplete Freund’s
adjuvant (Sigma, St. Louis, MI) and nonviable desiccated
Mycobacterium tuberculosis H37a (Difco Laboratories, Detroit, MI).
After 5 days, heat-inactivated rabbit anti-mouse GBM antiserum
was injected via the tail vein. The animals were sacrificed after 14
days. Austrian veterinary authorities approved these animal
experiments (GZ 66.011/0.111–11/10b/2008; Bundesminister-
ium fur Wissenschaft und Forschung). (B) Passive Heymann
Nephritis (PHN) was induced in n= 5 2-month old male Sprague-
Dawley rats (Charles River Italia s.p.a., Calco, Italy) by a single
intravenous injection of 0.4 ml/100 g body weight of rabbit anti-
Fx1A antibody, followed 7 days later by unilateral nephrectomy to
accelerate the onset of renal damage [34]. Animals were sacrificed
after 6 months. Age-matched Sprague–Dawley rats (n = 5) were
used as control. (C) Adriamycin nephropathy was induced in n= 5
male Lewis rats (Charles River Italia s.p.a., Calco, Italy) by a single
intravenous injection of ADR (Adriblastina, Pfizer Italia s.r.l,
Latina, Italy) at the dose of 5 mg/kg [35]. Five Lewis rats
intravenously injected with saline served as controls. Animals were
sacrificed after 21 days. Animal care and treatment were in
accordance with current law [36]. Animal studies were submitted
to and approved by the Institutional Animal Care and Use
Committee of ‘‘Mario Negri’’ Institute, Milan, Italy. Renal
expression of versican was analyzed by real-time PCR following
the above outlined protocol using the inventoried TaqMan Gene
Expression Assays for mouse versican (Mm01283063_m1), mouse
18s ribosomal RNA (Mm03928990_g1), rat versican
(Rn01493755_m1) and rat cyclophilin A (Rn00690933_m1).
The TaqMan Gene Expression Assays for mouse-versican and
rat-versican used in this study are not isoform-specific but rather
allow the detection of the expression of any of the known versican
isoforms.
Western BlotThe protocol has been previously published [37]. In brief,
16162 mm blocks of rat kidney tissue were lysed in 250 ml of SDS
sample buffer (NuSep Inc., Bogart, GA). 15 ml per lane were
resolved using 4 to 12% Bis-Tris gels (Invitrogen, Leek, The
Netherlands) and transferred onto a nitrocellulose membrane
(Invitrogen). Primary antibody (rabbit anti-human versican, sc-
25832, Santa Cruz Biotechnology Inc., Santa Cruz, CA) was
incubated at 4uC over night. After washing, membranes were
incubated with fluorescence-labeled secondary antibodies (Molec-
ular Probes, Eugene, OR) and subsequently scanned using the
Odyssey infrared imaging system (LiCor Biosciences, Lincoln,
NE).
Supporting Information
Figure S1 Versican expression in zero-hour preimplant renal
biopsies. Data were extracted from the publication by Perco et al.
Increased versican expression is found in biopsies with a higher
level of histological damage, such as glomerulosclerosis (gs),
arteriolosclerosis (as), interstitial fibrosis (if), interstitial inflamma-
tion (ii), tubular atrophy (ta) and acute tubular injury (ati). The
degree of histological damage was assessed using a semiquantitative
grading system: 0 - no; 1 - minor; 2 - moderate; 3– severe. Samples
with grade 0 were defined as ‘‘low’’ in gs, as, if, ii and ta, while
samples with grades 1–3 were defined as ‘‘high’’. In the case of ati
samples with grade 0–1 were defined ‘‘low’’ and samples with
grades above 2 were defined as ‘‘high’’. * depicts significant
differences.
(JPG)
Figure S2 Versican expression in microdissected tubule cells
from human subjects with stable and progressive course of CKD.
Data extracted from microarray raw data from our group [9]. The
accession numbers represent four different versican spots on the
arrays. Three of those four showed significant differences in
expression. * p,0.05.
(JPG)
Figure S3 Versican expression in living donors, minimal change
disease, cadaveric donors and in diabetic nephropathy. Data
extracted from the raw data provided by Schmid et al [10].
NM_004385 and BF218922 represent two different spots on the
respective microarrays. * p,0.05
(JPG)
Figure S4 Versican expression and serum creatinine at time of
biopsy in diabetic nephropathy. Data extracted from the raw data
provided by Schmid et al [10].
(JPG)
Figure S5 Versican expression and histology score in diabetic
nephropathy. Data extracted from the raw data provided by
Schmid et al [10].
(JPG)
Acknowledgments
We kindly thank Prof. Dieter Zimmermann (Zurich, Switzerland) for
sharing his expertise on versican research with our group. We are also
grateful to Helmut Klocker (Innsbruck, Austria) for providing cell cultures
for the in vitro experiments.
Author Contributions
Conceived and designed the experiments: MR PP BM GM. Performed the
experiments: MR HN SJN JS SE KE JL. Analyzed the data: MR PP.
Contributed reagents/materials/analysis tools: HN KE ARR GAM CZ.
Wrote the paper: MR PP GM.
Versican in Chronic Kidney Disease
PLOS ONE | www.plosone.org 11 September 2012 | Volume 7 | Issue 9 | e44891
References
1. Meguid El Nahas A, Bello AK (2005) Chronic kidney disease: the globalchallenge. Lancet 365: 331–340.
2. D’Amico G (1992) Influence of clinical and histological features on actuarial
renal survival in adult patients with idiopathic IgA nephropathy, membranous
nephropathy, and membranoproliferative glomerulonephritis: survey of the
recent literature. Am J Kidney Dis 20: 315–323.
3. Hladunewich MA, Troyanov S, Calafati J, Cattran DC (2009) The natural
history of the non-nephrotic membranous nephropathy patient. Clin J Am Soc
Nephrol 4: 1417–1422.
4. Reich HN, Troyanov S, Scholey JW, Cattran DC (2007) Remission ofproteinuria improves prognosis in IgA nephropathy. J Am Soc Nephrol 18:
3177–3183.
5. Meyer TW (2003) Tubular injury in glomerular disease. Kidney Int 63: 774–
787.
6. Kronenberg F (2009) Emerging risk factors and markers of chronic kidney
disease progression. Nat Rev Nephrol 5: 677–689.
7. Henger A, Kretzler M, Doran P, Bonrouhi M, Schmid H, et al. (2004) Gene
expression fingerprints in human tubulointerstitial inflammation and fibrosis as
prognostic markers of disease progression. Kidney Int 65: 904–917.
8. Perco P, Kainz A, Wilflingseder J, Soleiman A, Mayer B, et al. (2009)
Histogenomics: association of gene expression patterns with histological
parameters in kidney biopsies. Transplantation 87: 290–295.
9. Rudnicki M, Perco P, Enrich J, Eder S, Heininger D, et al. (2009) Hypoxiaresponse and VEGF-A expression in human proximal tubular epithelial cells in
stable and progressive renal disease. Lab Invest 89: 337–346.
10. Schmid H, Boucherot A, Yasuda Y, Henger A, Brunner B, et al. (2006) Modular
activation of nuclear factor-kappaB transcriptional programs in human diabetic
nephropathy. Diabetes 55: 2993–3003.
11. Dours-Zimmermann MT, Zimmermann DR (1994) A novel glycosaminoglycan
attachment domain identified in two alternative splice variants of human
versican. J Biol Chem 269: 32992–32998.
12. Ricciardelli C, Brooks JH, Suwiwat S, Sakko AJ, Mayne K, et al. (2002)
Regulation of stromal versican expression by breast cancer cells and importanceto relapse-free survival in patients with node-negative primary breast cancer.
Clin Cancer Res 8: 1054–1060.
13. Sakko AJ, Ricciardelli C, Mayne K, Tilley WD, Lebaron RG, et al. (2001)
Versican accumulation in human prostatic fibroblast cultures is enhanced by
prostate cancer cell-derived transforming growth factor beta1. Cancer Res 61:926–930.
14. Nikitovic D, Zafiropoulos A, Katonis P, Tsatsakis A, Theocharis AD, et al.
(2006) Transforming growth factor-beta as a key molecule triggering the
expression of versican isoforms v0 and v1, hyaluronan synthase-2 and synthesis
of hyaluronan in malignant osteosarcoma cells. IUBMB Life 58: 47–53.
15. Dours-Zimmermann MT, Maurer K, Rauch U, Stoffel W, Fassler R, et al.
(2009) Versican V2 assembles the extracellular matrix surrounding the nodes of
ranvier in the CNS. J Neurosci 29: 7731–7742.
16. Miquel-Serra L, Serra M, Hernandez D, Domenzain C, Docampo MJ, et al.(2006) V3 versican isoform expression has a dual role in human melanoma
tumor growth and metastasis. Lab Invest 86: 889–901.
17. Theocharis AD (2008) Versican in health and disease. Connect Tissue Res 49:
230–234.
18. Wight TN, Merrilees MJ (2004) Proteoglycans in atherosclerosis and restenosis:
key roles for versican. Circ Res 94: 1158–1167.
19. Ricciardelli C, Mayne K, Sykes PJ, Raymond WA, McCaul K, et al. (1998)
Elevated levels of versican but not decorin predict disease progression in early-
stage prostate cancer. Clin Cancer Res 4: 963–971.
20. Melk A, Mansfield ES, Hsieh SC, Hernandez-Boussard T, Grimm P, et al.
(2005) Transcriptional analysis of the molecular basis of human kidney agingusing cDNA microarray profiling. Kidney Int 68: 2667–2679.
21. Einecke G, Reeve J, Sis B, Mengel M, Hidalgo L, et al. (2010) A molecularclassifier for predicting future graft loss in late kidney transplant biopsies. J Clin
Invest 120: 1862–1872.
22. Bode-Lesniewska B, Dours-Zimmermann MT, Odermatt BF, Briner J, HeitzPU, et al. (1996) Distribution of the large aggregating proteoglycan versican in
adult human tissues. J Histochem Cytochem 44: 303–312.23. True LD, Hawley S, Norwood TH, Braun KR, Evanko SP, et al. (2009) The
accumulation of versican in the nodules of benign prostatic hyperplasia. Prostate
69: 149–158.24. Sheng W, Wang G, La Pierre DP, Wen J, Deng Z, et al. (2006) Versican
mediates mesenchymal-epithelial transition. Mol Biol Cell 17: 2009–2020.25. Sheng W, Wang G, Wang Y, Liang J, Wen J, et al. (2005) The roles of versican
V1 and V2 isoforms in cell proliferation and apoptosis. Mol Biol Cell 16: 1330–1340.
26. Kawashima H, Hirose M, Hirose J, Nagakubo D, Plaas AH, et al. (2000)
Binding of a large chondroitin sulfate/dermatan sulfate proteoglycan, versican,to L-selectin, P-selectin, and CD44. J Biol Chem 275: 35448–35456.
27. Hirose J, Kawashima H, Yoshie O, Tashiro K, Miyasaka M (2001) Versicaninteracts with chemokines and modulates cellular responses. J Biol Chem 276:
5228–5234.
28. Wu YJ, La Pierre DP, Wu J, Yee AJ, Yang BB (2005) The interaction of versicanwith its binding partners. Cell Res 15: 483–494.
29. Schuttert JB, Liu MH, Gliem N, Fiedler GM, Zopf S, et al. (2003) Human renalfibroblasts derived from normal and fibrotic kidneys show differences in increase
of extracellular matrix synthesis and cell proliferation upon angiotensin IIexposure. Pflugers Arch 446: 387–393.
30. Kogan I, Goldfinger N, Milyavsky M, Cohen M, Shats I, et al. (2006) hTERT-
immortalized prostate epithelial and stromal-derived cells: an authentic in vitromodel for differentiation and carcinogenesis. Cancer research 66: 3531–3540.
31. Massoner P, Haag P, Seifarth C, Jurgeit A, Rogatsch H, et al. (2008) Insulin-likegrowth factor binding protein-3 (IGFBP-3) in the prostate and in prostate
cancer: local production, distribution and secretion pattern indicate a role in
stromal-epithelial interaction. The Prostate 68: 1165–1178.32. Klocker H, Kaspar F, Eberle J, Uberreiter S, Radmayr C, et al. (1992) Point
mutation in the DNA binding domain of the androgen receptor in two familieswith Reifenstein syndrome. American journal of human genetics 50: 1318–1327.
33. Rosenkranz AR, Mendrick DL, Cotran RS, Mayadas TN (1999) P-selectindeficiency exacerbates experimental glomerulonephritis: a protective role for
endothelial P-selectin in inflammation. J Clin Invest 103: 649–659.
34. Zoja C, Corna D, Camozzi D, Cattaneo D, Rottoli D, et al. (2002) How to fullyprotect the kidney in a severe model of progressive nephropathy: a multidrug
approach. Journal of the American Society of Nephrology : JASN 13: 2898–2908.
35. Remuzzi G, Zoja C, Remuzzi A, Rossini M, Battaglia C, et al. (1985) Low-
protein diet prevents glomerular damage in adriamycin-treated rats. Kidneyinternational 28: 21–27.
36. Zoja C, Corna D, Gagliardini E, Conti S, Arnaboldi L, et al. (2010) Addinga statin to a combination of ACE inhibitor and ARB normalizes proteinuria in
experimental diabetes, which translates into full renoprotection. Americanjournal of physiology Renal physiology 299: F1203–1211.
37. Bellezza I, Neuwirt H, Nemes C, Cavarretta IT, Puhr M, et al. (2006)
Suppressor of cytokine signaling-3 antagonizes cAMP effects on proliferationand apoptosis and is expressed in human prostate cancer. The American journal
of pathology 169: 2199–2208.
Versican in Chronic Kidney Disease
PLOS ONE | www.plosone.org 12 September 2012 | Volume 7 | Issue 9 | e44891