Markers of Bone Metabolism Are Affected by Renal Function and Growth Hormone Therapy in Children...
17
RESEARCH ARTICLE Markers of Bone Metabolism Are Affected by Renal Function and Growth Hormone Therapy in Children with Chronic Kidney Disease Anke Doyon 1 *, Dagmar-Christiane Fischer 2 , Aysun Karabay Bayazit 3 , Nur Canpolat 4 , Ali Duzova 5 , Betül Sözeri 6 , Justine Bacchetta 7 , Ayse Balat 8 , Anja Büscher 9 , Cengiz Candan 10 , Nilgun Cakar 11 , Osman Donmez 12 , Jiri Dusek 13 , Martina Heckel 14 , Günter Klaus 15 , Sevgi Mir 6 , Gül Özcelik 16 , Lale Sever 4 , Rukshana Shroff 17 , Enrico Vidal 18 , Elke Wühl 1 , Matthias Gondan 19 , Anette Melk 20,21 , Uwe Querfeld 22 , Dieter Haffner 20‡ , Franz Schaefer 1‡ , for the 4C Study Consortium ¶ 1 Division of Pediatric Nephrology, Center for Pediatrics and Adolescent Medicine, Heidelberg, Germany, 2 Department of Pediatrics, University Hospital Rostock, Rostock, Germany, 3 Division of Pediatric Nephrology, Cukurova University, School of Medicine, Adana, Turkey, 4 Division of Pediatric Nephrology, Istanbul University Cerrahpasa Faculty of Medicine, Istanbul, Turkey, 5 Division of Pediatric Nephrology, Dpt. of Pediatrics, Hacettepe University Faculty of Medicine, Ankara, Turkey, 6 Division of Pediatric Nephrology, Ege University Medical Faculty, Izmir, Turkey, 7 Centre de Référence des Maladies Rénales Rares, Hôpital Femme Mère Enfant, Hospices Civils de Lyon, Bron, France, 8 Department of Pediatric Nephrology, University of Gaziantep, Gaziantep, Turkey, 9 Division of Pediatric Nephrology, University Children’s Hospital, Essen, Germany, 10 Division of Pediatric Nephrology, Istanbul Medeniyet University, Göztepe Training and Research Hospital, Istanbul, Turkey, 11 Diskapi Children’s Hospital, Ankara, Turkey, 12 Division of Pediatric Nephrology, Uludag University Faculty of Medicine, Bursa, Turkey, 13 Pediatric Hospital, University Hospital Motol, Prague, Czech Republic, 14 University Children’s Hospital, Hamburg, Germany, 15 KfH Kidney Center for Children, Marburg, Germany, 16 Department of Pediatric Nephrology, Sisli Educational and Research Hospital, Istanbul, Turkey, 17 Division of Pediatric Nephrology, Great Ormond Street Hospital, London, United Kingdom, 18 Dialysis and Transplantation Department of Pediatrics, Padova, Italy, 19 Department of Psychology, University of Copenhagen, Copenhagen, Denmark, 20 Department of Pediatric Kidney, Liver and Metabolic Diseases, Hannover Medical School, Hannover, Germany, 21 Integrated Research and Treatment Center Transplantation (IFB-Tx), Hannover Medical School, Hannover, Germany, 22 Clinic of Pediatric Nephrology, Charite Children’s Hospital, Berlin, Germany ‡ These authors contributed equally to this work. ¶ Membership of the 4C Study Consortium is listed in the Acknowledgments. * [email protected] Abstract Objectives The extent and relevance of altered bone metabolism for statural growth in children with chronic kidney disease is controversial. We analyzed the impact of renal dysfunction and re- combinant growth hormone therapy on a panel of serum markers of bone metabolism in a large pediatric chronic kidney disease cohort. PLOS ONE | DOI:10.1371/journal.pone.0113482 February 6, 2015 1 / 17 OPEN ACCESS Citation: Doyon A, Fischer D-C, Bayazit AK, Canpolat N, Duzova A, Sözeri B, et al. (2015) Markers of Bone Metabolism Are Affected by Renal Function and Growth Hormone Therapy in Children with Chronic Kidney Disease. PLoS ONE 10(2): e0113482. doi:10.1371/journal.pone.0113482 Academic Editor: João Costa-Rodrigues, Faculdade de Medicina Dentária, Universidade do Porto, PORTUGAL Received: March 4, 2014 Accepted: October 28, 2014 Published: February 6, 2015 Copyright: © 2015 Doyon et al. This is an open access article distributed under the terms of the Creative Commons Attribution License, which permits unrestricted use, distribution, and reproduction in any medium, provided the original author and source are credited. Funding: This study has been made possible by grants of the KfH Foundation for Preventive Medicine, the European Renal Association—European Dialysis and Transplant Association (www.era-edta.org), the German Federal Ministry of Education and Research (reference number: 01EO0802) and Pfizer Deutschland GmbH. The funders had no role in study design, data collection and analysis, decision to publish, or preparation of the manuscript. Competing Interests: We have the following interests. This study was partly funded by Pfizer
-
Upload
independent -
Category
Documents
-
view
2 -
download
0
Transcript of Markers of Bone Metabolism Are Affected by Renal Function and Growth Hormone Therapy in Children...

RESEARCH ARTICLE
Markers of Bone Metabolism Are Affected byRenal Function and Growth HormoneTherapy in Children with Chronic KidneyDiseaseAnke Doyon1*, Dagmar-Christiane Fischer2, Aysun Karabay Bayazit3, Nur Canpolat4,Ali Duzova5, Betül Sözeri6, Justine Bacchetta7, Ayse Balat8, Anja Büscher9,Cengiz Candan10, Nilgun Cakar11, Osman Donmez12, Jiri Dusek13, Martina Heckel14,Günter Klaus15, Sevgi Mir6, Gül Özcelik16, Lale Sever4, Rukshana Shroff17, Enrico Vidal18,Elke Wühl1, Matthias Gondan19, Anette Melk20,21, Uwe Querfeld22, Dieter Haffner20‡,Franz Schaefer1‡, for the 4C Study Consortium¶
1 Division of Pediatric Nephrology, Center for Pediatrics and Adolescent Medicine, Heidelberg, Germany,2 Department of Pediatrics, University Hospital Rostock, Rostock, Germany, 3 Division of PediatricNephrology, Cukurova University, School of Medicine, Adana, Turkey, 4 Division of Pediatric Nephrology,Istanbul University Cerrahpasa Faculty of Medicine, Istanbul, Turkey, 5 Division of Pediatric Nephrology,Dpt. of Pediatrics, Hacettepe University Faculty of Medicine, Ankara, Turkey, 6 Division of PediatricNephrology, Ege University Medical Faculty, Izmir, Turkey, 7 Centre de Référence des Maladies RénalesRares, Hôpital FemmeMère Enfant, Hospices Civils de Lyon, Bron, France, 8 Department of PediatricNephrology, University of Gaziantep, Gaziantep, Turkey, 9 Division of Pediatric Nephrology, UniversityChildren’s Hospital, Essen, Germany, 10 Division of Pediatric Nephrology, Istanbul Medeniyet University,Göztepe Training and Research Hospital, Istanbul, Turkey, 11 Diskapi Children’s Hospital, Ankara, Turkey,12 Division of Pediatric Nephrology, Uludag University Faculty of Medicine, Bursa, Turkey, 13 PediatricHospital, University Hospital Motol, Prague, Czech Republic, 14 University Children’s Hospital, Hamburg,Germany, 15 KfH Kidney Center for Children, Marburg, Germany, 16 Department of Pediatric Nephrology,Sisli Educational and Research Hospital, Istanbul, Turkey, 17 Division of Pediatric Nephrology, GreatOrmond Street Hospital, London, United Kingdom, 18 Dialysis and Transplantation Department ofPediatrics, Padova, Italy, 19 Department of Psychology, University of Copenhagen, Copenhagen, Denmark,20 Department of Pediatric Kidney, Liver and Metabolic Diseases, Hannover Medical School, Hannover,Germany, 21 Integrated Research and Treatment Center Transplantation (IFB-Tx), Hannover MedicalSchool, Hannover, Germany, 22 Clinic of Pediatric Nephrology, Charite Children’s Hospital, Berlin, Germany
‡ These authors contributed equally to this work.¶ Membership of the 4C Study Consortium is listed in the Acknowledgments.* [email protected]
Abstract
Objectives
The extent and relevance of altered bone metabolism for statural growth in children with
chronic kidney disease is controversial. We analyzed the impact of renal dysfunction and re-
combinant growth hormone therapy on a panel of serum markers of bone metabolism in a
large pediatric chronic kidney disease cohort.
PLOS ONE | DOI:10.1371/journal.pone.0113482 February 6, 2015 1 / 17
OPEN ACCESS
Citation: Doyon A, Fischer D-C, Bayazit AK,Canpolat N, Duzova A, Sözeri B, et al. (2015)Markers of Bone Metabolism Are Affected by RenalFunction and Growth Hormone Therapy in Childrenwith Chronic Kidney Disease. PLoS ONE 10(2):e0113482. doi:10.1371/journal.pone.0113482
Academic Editor: João Costa-Rodrigues, Faculdadede Medicina Dentária, Universidade do Porto,PORTUGAL
Received: March 4, 2014
Accepted: October 28, 2014
Published: February 6, 2015
Copyright: © 2015 Doyon et al. This is an openaccess article distributed under the terms of theCreative Commons Attribution License, which permitsunrestricted use, distribution, and reproduction in anymedium, provided the original author and source arecredited.
Funding: This study has been made possible bygrants of the KfH Foundation for Preventive Medicine,the European Renal Association—European Dialysisand Transplant Association (www.era-edta.org), theGerman Federal Ministry of Education and Research(reference number: 01EO0802) and PfizerDeutschland GmbH. The funders had no role in studydesign, data collection and analysis, decision topublish, or preparation of the manuscript.
Competing Interests:We have the followinginterests. This study was partly funded by Pfizer
Methods
Bone alkaline phosphatase (BAP), tartrate-resistant acid phosphatase 5b (TRAP5b),
sclerostin and C-terminal FGF-23 (cFGF23) normalized for age and sex were analyzed in 556
children aged 6–18 years with an estimated glomerular filtration rate (eGFR) of 10–60 ml/min/
1.73m2. 41 children receiving recombinant growth hormone therapy were compared to an
untreated matched control group.
Results
Standardized levels of BAP, TRAP5b and cFGF-23 were increased whereas sclerostin was
reduced. BAP was correlated positively and cFGF-23 inversely with eGFR. Intact serum para-
thormonewas an independent positive predictor of BAP and TRAP5b and negatively associat-
ed with sclerostin. BAP and TRAP5B were negatively affected by increased C-reactive protein
levels. In children receiving recombinant growth hormone, BAP was higher and TRAP5b lower
than in untreated controls. Sclerostin levels were in the normal range and higher than in un-
treated controls. Serum sclerostin and cFGF-23 independently predicted height standard devi-
ation score, and BAP and TRAP5b the prospective change in height standard deviation score.
Conclusion
Markers of bone metabolism indicate a high-bone turnover state in children with chronic kid-
ney disease. Growth hormone induces an osteoanabolic pattern and normalizes osteocyte
activity. The osteocyte markers cFGF23 and sclerostin are associated with standardized
height, and the markers of bone turnover predict height velocity.
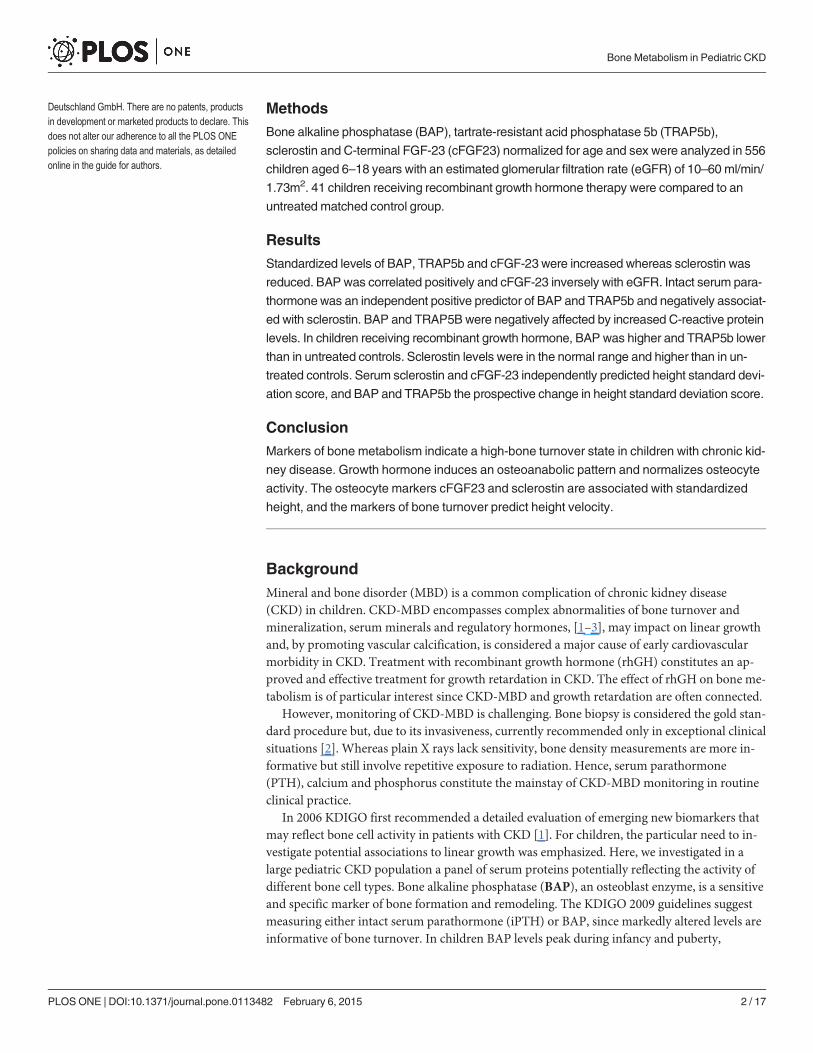
BackgroundMineral and bone disorder (MBD) is a common complication of chronic kidney disease(CKD) in children. CKD-MBD encompasses complex abnormalities of bone turnover andmineralization, serum minerals and regulatory hormones, [1–3], may impact on linear growthand, by promoting vascular calcification, is considered a major cause of early cardiovascularmorbidity in CKD. Treatment with recombinant growth hormone (rhGH) constitutes an ap-proved and effective treatment for growth retardation in CKD. The effect of rhGH on bone me-tabolism is of particular interest since CKD-MBD and growth retardation are often connected.
However, monitoring of CKD-MBD is challenging. Bone biopsy is considered the gold stan-dard procedure but, due to its invasiveness, currently recommended only in exceptional clinicalsituations [2]. Whereas plain X rays lack sensitivity, bone density measurements are more in-formative but still involve repetitive exposure to radiation. Hence, serum parathormone(PTH), calcium and phosphorus constitute the mainstay of CKD-MBD monitoring in routineclinical practice.
In 2006 KDIGO first recommended a detailed evaluation of emerging new biomarkers thatmay reflect bone cell activity in patients with CKD [1]. For children, the particular need to in-vestigate potential associations to linear growth was emphasized. Here, we investigated in alarge pediatric CKD population a panel of serum proteins potentially reflecting the activity ofdifferent bone cell types. Bone alkaline phosphatase (BAP), an osteoblast enzyme, is a sensitiveand specific marker of bone formation and remodeling. The KDIGO 2009 guidelines suggestmeasuring either intact serum parathormone (iPTH) or BAP, since markedly altered levels areinformative of bone turnover. In children BAP levels peak during infancy and puberty,
Bone Metabolism in Pediatric CKD
PLOSONE | DOI:10.1371/journal.pone.0113482 February 6, 2015 2 / 17
Deutschland GmbH. There are no patents, productsin development or marketed products to declare. Thisdoes not alter our adherence to all the PLOS ONEpolicies on sharing data and materials, as detailedonline in the guide for authors.
mirroring the physiological activation of bone formation during these periods of rapid longitu-dinal growth. Tartrate-resistant acid phosphatase 5b (TRAP5b) degrades bone matrix proteinsand is considered a specific marker of late osteoclast differentiation [4]. The peptide sclerostinis a novel key regulator of bone turnover [5]. It is released mainly by osteocytes as a paracrinenegative feedback signal regulating bone formation by inhibiting the differentiation of osteo-chondral precursor cells to osteoblasts [6]. Finally, fibroblast growth factor 23 (FGF-23) is akey endocrine player in the regulation of bone mineral metabolism. Synthesized and releasedby osteocytes and osteoblasts [7] and targeting the renal tubule, FGF-23 plays an importantrole in maintaining mineral and vitamin D homeostasis.
Whereas the mechanisms and pathways of bone metabolism and the biological functions ofthe biomarker proteins are well established, their precise association to CKD-related abnormal-ities of bone metabolism and their role in height and growth of children with CKD is still con-troversial. Age- and gender-related differences and usually small available sample sizes add afurther level of complexity to the interpretation of circulating bone markers in pediatric stud-ies. Recently, pediatric reference values have been established for BAP, TRAP5b, sclerostin andc-terminal FGF-23 (cFGF-23), allowing age- and gender independent assessment of bone turn-over in chronically diseased children [8].
The 4C Study consortium is following the largest cohort of children with CKD assembled todate [9]. We utilized the 4C cohort to characterize the patterns of these novel serum bonemarkers in pediatric CKD and to describe their associations with endpoints of statural growth,i.e. height standard deviation score (SDS) and its change over time, in children with and with-out concomitant recombinant growth hormone (GH) treatment.
Methods
Ethics statementThis study has been conducted within the framework of the 4C study. The 4C study was ap-proved by the Institutional Review Boards (IRB) and Ethics Committees (EC) of all participat-ing study sites. Informed written consent for participation in the 4C study and analysis of dataand biosamples was obtained from parents/guardians on behalf of minors/children who alsogave their consent to participate in the study. The study has been conducted according to theethical principles of the Helsinki Declaration of 1964. The following Ethics committees (EC)and Institutional Review Boards (IRB) approved the 4C Study: Austria: EC of the University ofVienna; EC of the University of Innsbruck. Czech Republic: EC of the University of Prague.France: Comité de protection des personnes “Est IV”, Strasbourg. Germany: EC Charité—Universitätsmedizin Berlin; EC of the Medical Faculty of the University of Cologne; Ethikkom-mission der sächsischen Länderkammer; EC of Friedrich-Alexander-University Erlangen; ECof the University of Duisburg-Essen; EC of Albert-Ludwig University Freiburg; Ethikkommis-sion der Ärztekammer Hamburg; EC and IRB of Hannover Medical School; EC and IRB of theUniversity of Heidelberg; EC of the Medical Faculty of the University of Jena; EC of the Medi-cal Faculty of the University of Leipzig; EC of Philipps University Marburg; Ethikkommissionder Ärztekammer Westfalen-Lippe und der Medizinischen Fakultät der Westfälischen Wil-helms Universität Münster; EC of the Medical Faculty of the University of Rostock. Italy:Comitato Etico Indipendente dell’Azienda Ospedaliero-Universitaria di Bologna, Policlinico S.Orsola-Malpighi; Comitato di Etica dell’IRCCS Istituto Giannina Gaslini di Genova; ComitatoEtico dell’IRCCS Ospedale Maggiore Policlinico, Mangiagalli e Regina Elena di Milano; EthicalCommittee for clinical practice of the General Hospital-University of Padova; Comitato Eticoper la Sperimentazione Clinica dell’IRCCS Ospedale Pediatrico Bambino Gesu’ di Roma. Lith-uania: EC and IRB of Vilnius University. Poland: EC at Children’s Memorial Health Institute,
Bone Metabolism in Pediatric CKD
PLOSONE | DOI:10.1371/journal.pone.0113482 February 6, 2015 3 / 17
Warsaw. Portugal: EC of the University of Porto. Serbia: EC of the University of Belgrade.Switzerland: EC of the Canton Bern; EC of the Canton Zurich. Turkey: EC of the University ofCukurova, Adana; Non-interventional Clinical Researches Ethics Boards of Hacettepe Univer-sity, Ankara; EC of the University of Cerrahpasa, Istanbul; EC and IRB of the University ofEge, Izmir. United Kingdom: Great Ormond Street Hospital and UCL Institute of Child Healthresearch EC.
Study populationAll patients were participants of the 4C Study (The Cardiovascular Comorbidity in Childrenwith Chronic Kidney Disease Study, registered at ClinicalTrials.gov August 7, 2009, IdentifierNCT01046448). The study is following children with CKD (eGFR 10–60 ml/min/1.73m2) aged6–18 years. Clinical and biochemical examinations are performed every 6 months. Enrolmentstarted in September 2009. All patients enrolled by December 2011 with available blood sam-ples for bone marker analysis were included into this substudy of bone marker analysis. Bonemarkers were analyzed cross-sectionally. For the analysis of predictors of longitudinal growth,a follow-up clinical visit 6 (or alternatively 12) months after time of blood sampling was man-datory. Separate analyses were performed in order to 1) cross-sectionally analyze CKD-relatedpredictors of bone markers, 2) compare bone markers of patients with rhGH treatment to amatched control group without rhGH treatment, and 3) analyze the influence of CKD-relatedfactors and rhGH treatment on height and longitudinal growth. For patient selection and crite-ria for each analysis see Fig. 1.
The bone marker panel was measured in the baseline visit blood sample, concomitantlywith a centralized biochemical analysis including serum creatinine, cystatin C, urea, C-reactiveprotein (CRP), bicarbonate, iPTH, calcium, phosphate and 25-hydroxy-vitamin D (25OHD).Estimated GFR (eGFR, ml/min/1.73m2) was calculated from creatinine, cystatine c, urea andheight [10]. CKD stage was defined according to KDOQI [11]. Hypocalcemia was defined as aserum calcium level below 2.0 mmol/l; hyperphosphatemia was defined as serum phosphorus>1.87 mmol/L for patients aged 6 to 12 years and>1.45 mmol/L for those aged 12 years andolder. A detailed patient and medication history was recorded. Physical activity was categorizedinto four levels depending on the hours of sports and other strenuous physical activity per-formed per week (0: none, 1: 1–2 hours/week, 2: 3–4 hours/week, 3:>4 hours/week). Patientswere classified as rhGH treated or untreated when treatment modality was consistent over atleast 3 months before bone marker analysis.
Renal diagnoses were categorized as CAKUT (congenital anomaly of the kidney and urinarytract), glomerulopathies (congenital/infantile/syndromal nephrotic syndrome, minimal-change nephropathy, focal segmental glomerulosclerosis, membranous nephropathy, mesan-gioproliferative glomerulonephritis, membranoproliferative glomerulonephritis, rapidly pro-gressive glomerulonephritis, post-infectious glomerulonephritis), nephropathies due tosystemic inflammatory disorders (Wegener’s granulomatosis, systemic lupus erythematosusHenoch-Schonlein purpura nephritis and IgA nephropathy), hemolytic uremic syndrome(HUS), metabolic disorders (cystinosis, oxalosis, nephrocalcinosis), other disorders (interstitialnephropathy, renovascular disease, post-ischemic chronic renal failure, other), or unknown.
Laboratory analysesELISA kits were used for quantitative determination of cFGF-23 (Immutopics, San Clemente,CA, USA), sclerostin (Tecomedical, Sissach, Switzerland), BAP (Quidel, San Diego, CA, USA)and TRAP5b (Quidel). All assays were performed essentially as described by the manufacturersand all samples were assayed in duplicate. The inter-/intra-assay coefficients of variation for
Bone Metabolism in Pediatric CKD
PLOSONE | DOI:10.1371/journal.pone.0113482 February 6, 2015 4 / 17

cFGF-23, sclerostin, BAP and TRAP5b were 5.1%/5.0%; 9.3%/5.9%; 5.5%/5.0%; and 4.2%/2.8%, respectively. If duplicate results differed by more than 5% (sclerostin: 7%), measurementswere repeated on a second aliquot.
Biostatistical approachesThe bone markers were normalized and standard deviation scores (SDS) were calculated forage and sex as proposed by Fischer et al., whose results on reference values were based on val-ues obtained from 424 healthy children aged 0.1 and 21 years [8].
The influence of renal function and CKD stage on subject characteristics was tested byANOVA for CKD stage, correlation analysis for eGFR and Kruskal-Wallis and chi square testsfor categorical variables. The association of sex, age, BMI SDS, physical activity, metabolic sta-tus (serum calcium, bicarbonate, phosphorus, 25OHD) and renal function (eGFR, albumin-uria) with standardized bone marker concentrations was evaluated by stepwise multivariateregression analysis in patients without rhGH treatment. For the assessment of the associationof bone markers with longitudinal growth, the prospective change in height SDS was calculatedover 12 months whenever available or annualized from the 6-month change if a complete 12-month follow-up was not available. The predictive value of serum bone markers on height andgrowth were tested by stepwise multivariate regression analysis correcting for age, sex, meta-bolic parameters and renal function in patients with and without rhGH treatment using rhGHtreatment as confounding variable.
In all multivariate analyses, variables with a p value<0.15 were kept in the model duringthe selection procedure. Variables were tested for normality and log-transformed in case of vio-lation of normality assumption.
To compare bone marker levels of patients with and without rhGH treatment with the bestpossible exclusion of confounding factors, the group of patients with rhGH treatment werecompared to an untreated control group matched individually for age, sex, eGFR, CRP, andiPTH. Of the original cohort, the control group was selected out of 186 patients who were not
Fig 1. Patient inclusion criteria and subgroups for cross-sectional analysis of bonemarkers,influence of rhGH treatment and predictors of height and growth.
doi:10.1371/journal.pone.0113482.g001
Bone Metabolism in Pediatric CKD
PLOSONE | DOI:10.1371/journal.pone.0113482 February 6, 2015 5 / 17
treated with rhGH and were living in the same countries as children with rhGH treatment.Matching of rhGH treated and untreated patients was performed using SAS 9.2. Matches wereavailable for 41 out of 42 rhGH treated patients. Post hoc testing for significant differences ofmatching variables and additional confounding factors between groups was performed.
Paired t-tests were applied to test for differences of bone marker levels between the matchedgroups. Statistical analyses were performed using SAS 9.2 and R. A p-value� 0.05 was consid-ered statistically significant.
Results
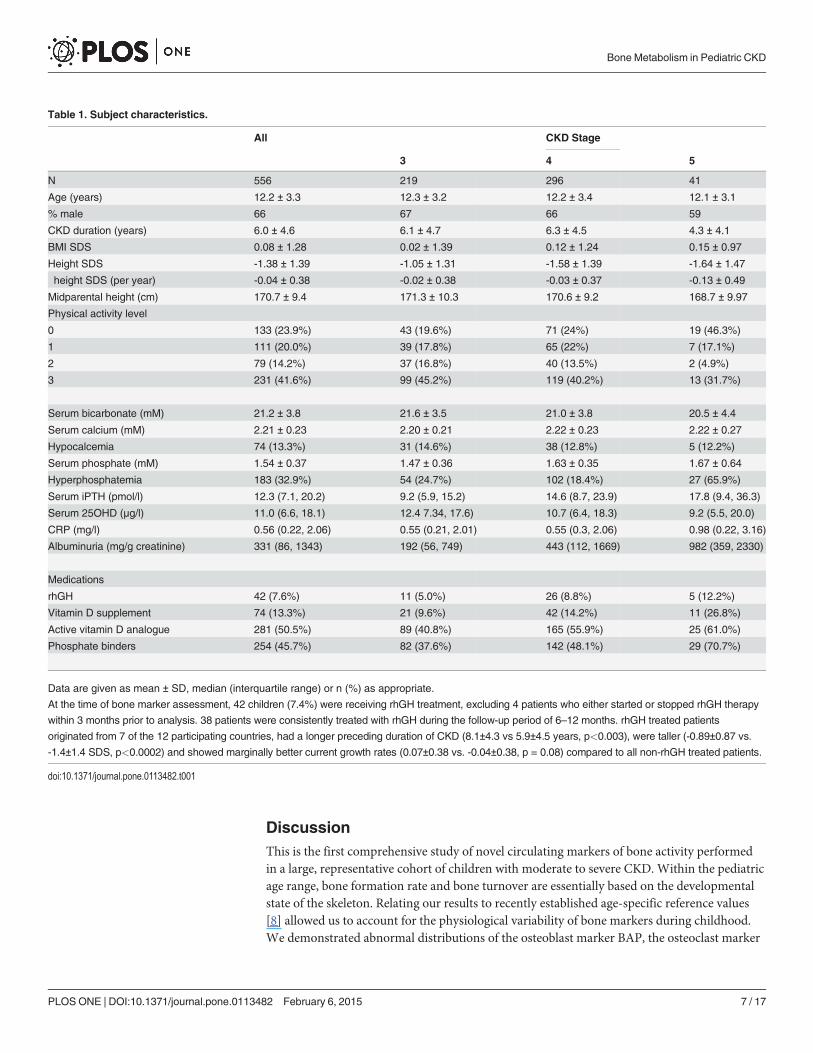
Subject characteristicsA cohort of 556 children and adolescents (365 males) participating in the 4C Study was studied.The patients were enrolled at 55 centers in Turkey (50%), Germany (15%), France (9%), theUK (6%), Italy (5%), Poland (4%), Austria (2.5%), Serbia (2.5%), Lithuania (2%), Switzerland(2%), Portugal (1%), and the Czech Republic (1%). Subject characteristics are given in Table 1.Underlying diseases comprised CAKUT in 74%, glomerulopathies in 6%, metabolic diseases in3.5%, HUS in 2%, systemic vasculitis in 1%, others in 9.5% and unknown in 4% of the patients,respectively. The prevalence and severity of albuminuria (p<0.0003), hyperphosphatemia(p<.0001), hyperparathyroidism (p<0.0001), and metabolic acidosis (p<0.0009) increasedwith decreasing eGFR, whereas serum albumin, 25OHD, and CRP were not statistically signifi-cantly associated with renal function. Children with advanced CKD stages were shorter in stat-ure (p<0.0001), but growth rates as expressed by the prospective change in height SDS did notdiffer significantly between CKD stages (p = 0.32).
Effectors of serum bone marker concentrationsCompared to healthy controls, standardized BAP, TRAP5b and cFGF-23 were significantly in-creased and Sclerostin decreased in the CKD population (Fig. 2 and Table 2). In univariateanalysis BAP SDS was positively correlated to TRAP5b SDS (r = 0.58,p<0.0001) and inverselyto cFGF-23 SDS (r = -0.2,p<0.0001). Sclerostin showed no correlation with TRAP5b, BAP orcFGF-23 (data not shown).
In stepwise multivariate analysis, BAP SDS decreased and cFGF-23 SDS increased with declin-ing eGFR, while TRAP5b SDS and Sclerostin showed no statistically significant association to renalfunction (Table 3). Albuminuria was associated with higher TRAP SDS and glomerulopathies asrenal diagnosis were associated with lower BAP SDS.While inflammatory renal disease did notshow any association to bone markers, BAP and TRAP5b appeared to reflect the impact of the cur-rent inflammatory status on bone metabolism as indicated by their independent associations withCRP levels. BAP and TRAP5b SDS were closely associated with iPTH (Table 3). Sclerostin SDSwas predicted inversely by iPTH and positively by 25OHD levels. Patients with 25OHD deficiency(25OHD<16 μg/L) had significantly lower sclerostin and sclerostin SDS levels than patientshigher 25OHD levels (sclerostin 0.30 vs 0.36 μg/l, p<0.0001 and -1.07 vs -0.61 SDS, p<.0001).
Serum cFGF-23 concentrations were strongly and independently affected by eGFR, serumphosphorus and bicarbonate levels. In contrast to the other bone markers, there was no associ-ation with iPTH or CRP.
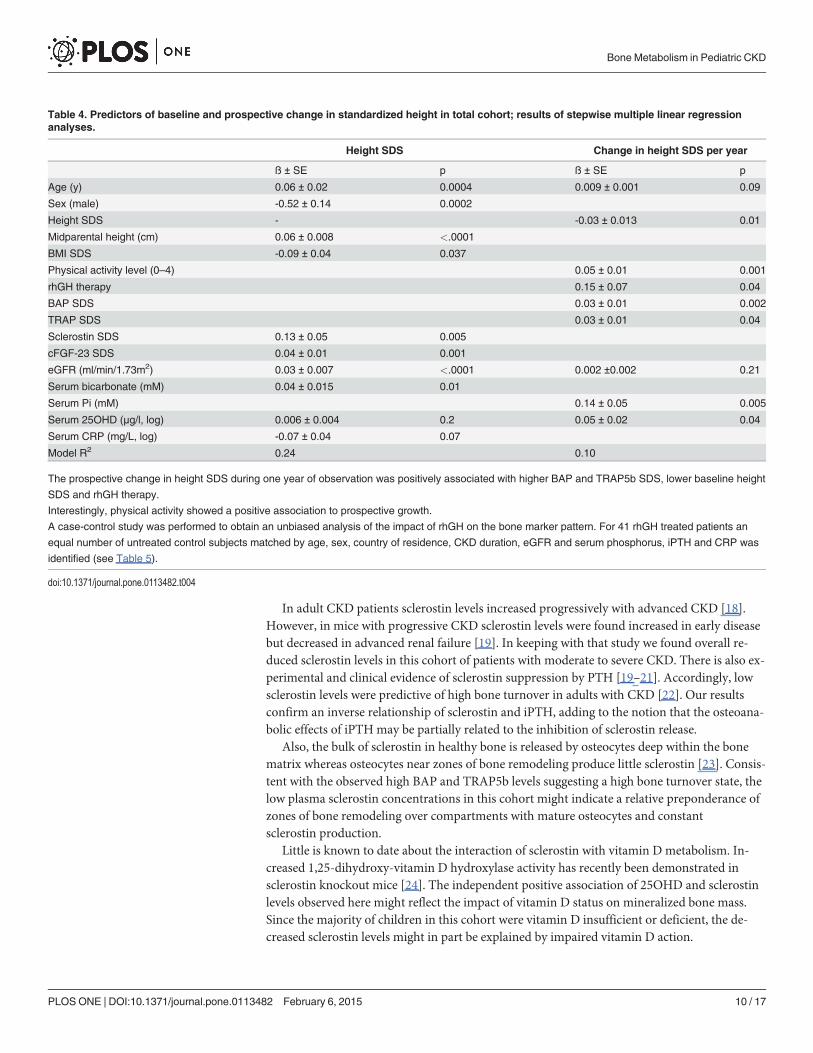
Serum bone markers and statural growthStandardized cFGF-23 and sclerostin levels were independently positively associated withheight SDS (Table 4). These relationships added independently to significant positive associa-tions of age, eGFR and negative effects of metabolic acidosis on height SDS.
Bone Metabolism in Pediatric CKD
PLOSONE | DOI:10.1371/journal.pone.0113482 February 6, 2015 6 / 17
DiscussionThis is the first comprehensive study of novel circulating markers of bone activity performedin a large, representative cohort of children with moderate to severe CKD. Within the pediatricage range, bone formation rate and bone turnover are essentially based on the developmentalstate of the skeleton. Relating our results to recently established age-specific reference values[8] allowed us to account for the physiological variability of bone markers during childhood.We demonstrated abnormal distributions of the osteoblast marker BAP, the osteoclast marker
Table 1. Subject characteristics.
All CKD Stage
3 4 5
N 556 219 296 41
Age (years) 12.2 ± 3.3 12.3 ± 3.2 12.2 ± 3.4 12.1 ± 3.1
% male 66 67 66 59
CKD duration (years) 6.0 ± 4.6 6.1 ± 4.7 6.3 ± 4.5 4.3 ± 4.1
BMI SDS 0.08 ± 1.28 0.02 ± 1.39 0.12 ± 1.24 0.15 ± 0.97
Height SDS -1.38 ± 1.39 -1.05 ± 1.31 -1.58 ± 1.39 -1.64 ± 1.47
Δ height SDS (per year) -0.04 ± 0.38 -0.02 ± 0.38 -0.03 ± 0.37 -0.13 ± 0.49
Midparental height (cm) 170.7 ± 9.4 171.3 ± 10.3 170.6 ± 9.2 168.7 ± 9.97
Physical activity level
0 133 (23.9%) 43 (19.6%) 71 (24%) 19 (46.3%)
1 111 (20.0%) 39 (17.8%) 65 (22%) 7 (17.1%)
2 79 (14.2%) 37 (16.8%) 40 (13.5%) 2 (4.9%)
3 231 (41.6%) 99 (45.2%) 119 (40.2%) 13 (31.7%)
Serum bicarbonate (mM) 21.2 ± 3.8 21.6 ± 3.5 21.0 ± 3.8 20.5 ± 4.4
Serum calcium (mM) 2.21 ± 0.23 2.20 ± 0.21 2.22 ± 0.23 2.22 ± 0.27
Hypocalcemia 74 (13.3%) 31 (14.6%) 38 (12.8%) 5 (12.2%)
Serum phosphate (mM) 1.54 ± 0.37 1.47 ± 0.36 1.63 ± 0.35 1.67 ± 0.64
Hyperphosphatemia 183 (32.9%) 54 (24.7%) 102 (18.4%) 27 (65.9%)
Serum iPTH (pmol/l) 12.3 (7.1, 20.2) 9.2 (5.9, 15.2) 14.6 (8.7, 23.9) 17.8 (9.4, 36.3)
Serum 25OHD (μg/l) 11.0 (6.6, 18.1) 12.4 7.34, 17.6) 10.7 (6.4, 18.3) 9.2 (5.5, 20.0)
CRP (mg/l) 0.56 (0.22, 2.06) 0.55 (0.21, 2.01) 0.55 (0.3, 2.06) 0.98 (0.22, 3.16)
Albuminuria (mg/g creatinine) 331 (86, 1343) 192 (56, 749) 443 (112, 1669) 982 (359, 2330)
Medications
rhGH 42 (7.6%) 11 (5.0%) 26 (8.8%) 5 (12.2%)
Vitamin D supplement 74 (13.3%) 21 (9.6%) 42 (14.2%) 11 (26.8%)
Active vitamin D analogue 281 (50.5%) 89 (40.8%) 165 (55.9%) 25 (61.0%)
Phosphate binders 254 (45.7%) 82 (37.6%) 142 (48.1%) 29 (70.7%)
Data are given as mean ± SD, median (interquartile range) or n (%) as appropriate.
At the time of bone marker assessment, 42 children (7.4%) were receiving rhGH treatment, excluding 4 patients who either started or stopped rhGH therapy
within 3 months prior to analysis. 38 patients were consistently treated with rhGH during the follow-up period of 6–12 months. rhGH treated patients
originated from 7 of the 12 participating countries, had a longer preceding duration of CKD (8.1±4.3 vs 5.9±4.5 years, p<0.003), were taller (-0.89±0.87 vs.
-1.4±1.4 SDS, p<0.0002) and showed marginally better current growth rates (0.07±0.38 vs. -0.04±0.38, p = 0.08) compared to all non-rhGH treated patients.
doi:10.1371/journal.pone.0113482.t001
Bone Metabolism in Pediatric CKD
PLOSONE | DOI:10.1371/journal.pone.0113482 February 6, 2015 7 / 17
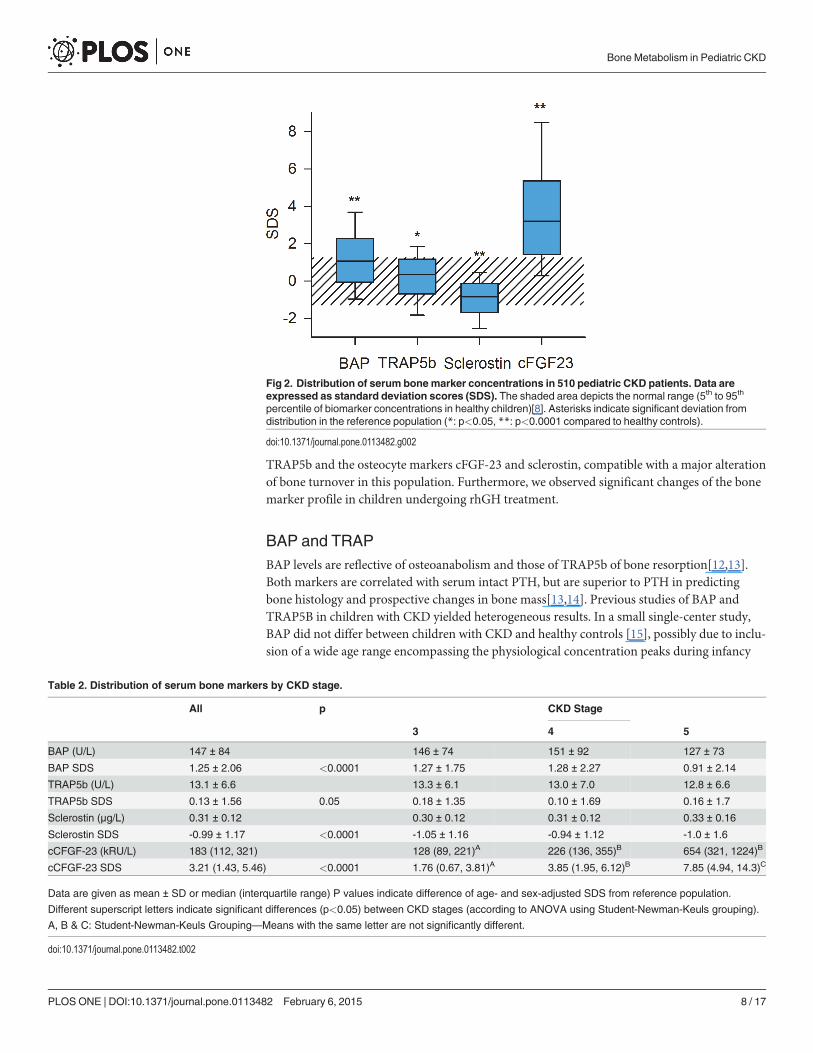
TRAP5b and the osteocyte markers cFGF-23 and sclerostin, compatible with a major alterationof bone turnover in this population. Furthermore, we observed significant changes of the bonemarker profile in children undergoing rhGH treatment.
BAP and TRAPBAP levels are reflective of osteoanabolism and those of TRAP5b of bone resorption[12,13].Both markers are correlated with serum intact PTH, but are superior to PTH in predictingbone histology and prospective changes in bone mass[13,14]. Previous studies of BAP andTRAP5B in children with CKD yielded heterogeneous results. In a small single-center study,BAP did not differ between children with CKD and healthy controls [15], possibly due to inclu-sion of a wide age range encompassing the physiological concentration peaks during infancy
Fig 2. Distribution of serum bonemarker concentrations in 510 pediatric CKD patients. Data areexpressed as standard deviation scores (SDS). The shaded area depicts the normal range (5th to 95th
percentile of biomarker concentrations in healthy children)[8]. Asterisks indicate significant deviation fromdistribution in the reference population (*: p<0.05, **: p<0.0001 compared to healthy controls).
doi:10.1371/journal.pone.0113482.g002
Table 2. Distribution of serum bone markers by CKD stage.
All p CKD Stage
3 4 5
BAP (U/L) 147 ± 84 146 ± 74 151 ± 92 127 ± 73
BAP SDS 1.25 ± 2.06 <0.0001 1.27 ± 1.75 1.28 ± 2.27 0.91 ± 2.14
TRAP5b (U/L) 13.1 ± 6.6 13.3 ± 6.1 13.0 ± 7.0 12.8 ± 6.6
TRAP5b SDS 0.13 ± 1.56 0.05 0.18 ± 1.35 0.10 ± 1.69 0.16 ± 1.7
Sclerostin (μg/L) 0.31 ± 0.12 0.30 ± 0.12 0.31 ± 0.12 0.33 ± 0.16
Sclerostin SDS -0.99 ± 1.17 <0.0001 -1.05 ± 1.16 -0.94 ± 1.12 -1.0 ± 1.6
cCFGF-23 (kRU/L) 183 (112, 321) 128 (89, 221)A 226 (136, 355)B 654 (321, 1224)B
cCFGF-23 SDS 3.21 (1.43, 5.46) <0.0001 1.76 (0.67, 3.81)A 3.85 (1.95, 6.12)B 7.85 (4.94, 14.3)C
Data are given as mean ± SD or median (interquartile range) P values indicate difference of age- and sex-adjusted SDS from reference population.
Different superscript letters indicate significant differences (p<0.05) between CKD stages (according to ANOVA using Student-Newman-Keuls grouping).
A, B & C: Student-Newman-Keuls Grouping—Means with the same letter are not significantly different.
doi:10.1371/journal.pone.0113482.t002
Bone Metabolism in Pediatric CKD
PLOSONE | DOI:10.1371/journal.pone.0113482 February 6, 2015 8 / 17
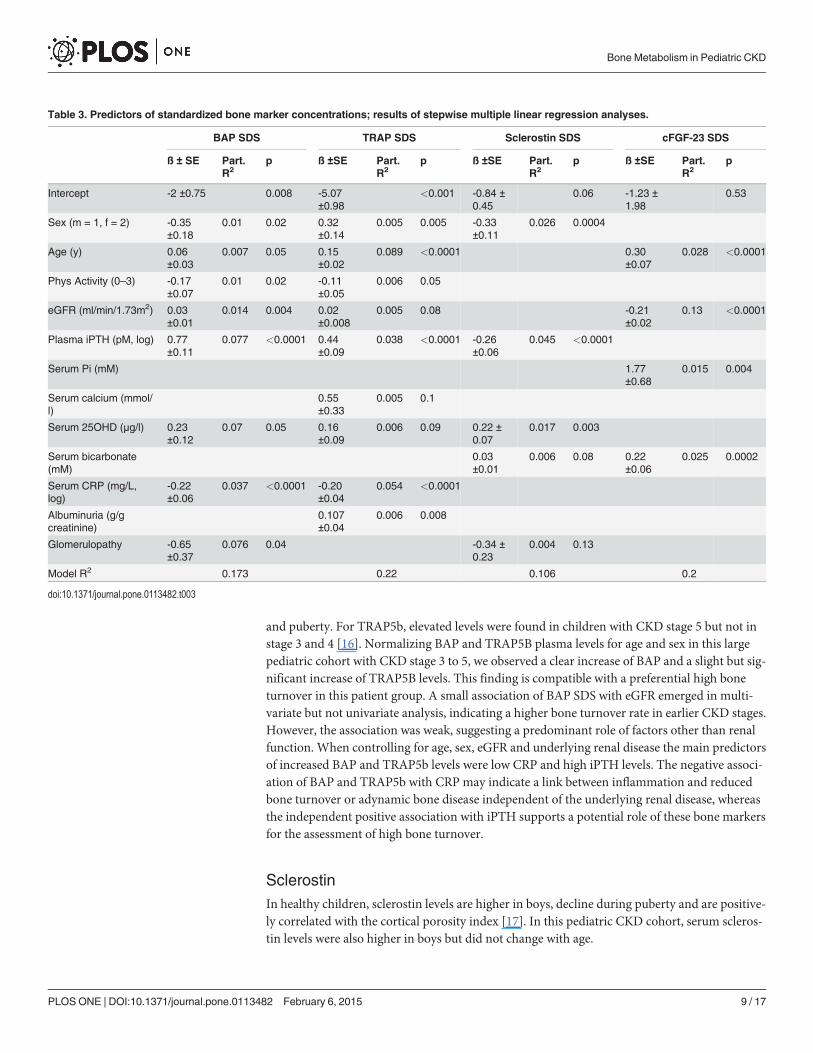
and puberty. For TRAP5b, elevated levels were found in children with CKD stage 5 but not instage 3 and 4 [16]. Normalizing BAP and TRAP5B plasma levels for age and sex in this largepediatric cohort with CKD stage 3 to 5, we observed a clear increase of BAP and a slight but sig-nificant increase of TRAP5B levels. This finding is compatible with a preferential high boneturnover in this patient group. A small association of BAP SDS with eGFR emerged in multi-variate but not univariate analysis, indicating a higher bone turnover rate in earlier CKD stages.However, the association was weak, suggesting a predominant role of factors other than renalfunction. When controlling for age, sex, eGFR and underlying renal disease the main predictorsof increased BAP and TRAP5b levels were low CRP and high iPTH levels. The negative associ-ation of BAP and TRAP5b with CRP may indicate a link between inflammation and reducedbone turnover or adynamic bone disease independent of the underlying renal disease, whereasthe independent positive association with iPTH supports a potential role of these bone markersfor the assessment of high bone turnover.
SclerostinIn healthy children, sclerostin levels are higher in boys, decline during puberty and are positive-ly correlated with the cortical porosity index [17]. In this pediatric CKD cohort, serum scleros-tin levels were also higher in boys but did not change with age.
Table 3. Predictors of standardized bone marker concentrations; results of stepwise multiple linear regression analyses.
BAP SDS TRAP SDS Sclerostin SDS cFGF-23 SDS
ß ± SE Part.R2
p ß ±SE Part.R2
p ß ±SE Part.R2
p ß ±SE Part.R2
p
Intercept -2 ±0.75 0.008 -5.07±0.98
<0.001 -0.84 ±0.45
0.06 -1.23 ±1.98
0.53
Sex (m = 1, f = 2) -0.35±0.18
0.01 0.02 0.32±0.14
0.005 0.005 -0.33±0.11
0.026 0.0004
Age (y) 0.06±0.03
0.007 0.05 0.15±0.02
0.089 <0.0001 0.30±0.07
0.028 <0.0001
Phys Activity (0–3) -0.17±0.07
0.01 0.02 -0.11±0.05
0.006 0.05
eGFR (ml/min/1.73m2) 0.03±0.01
0.014 0.004 0.02±0.008
0.005 0.08 -0.21±0.02
0.13 <0.0001
Plasma iPTH (pM, log) 0.77±0.11
0.077 <0.0001 0.44±0.09
0.038 <0.0001 -0.26±0.06
0.045 <0.0001
Serum Pi (mM) 1.77±0.68
0.015 0.004
Serum calcium (mmol/l)
0.55±0.33
0.005 0.1
Serum 25OHD (µg/l) 0.23±0.12
0.07 0.05 0.16±0.09
0.006 0.09 0.22 ±0.07
0.017 0.003
Serum bicarbonate(mM)
0.03±0.01
0.006 0.08 0.22±0.06
0.025 0.0002
Serum CRP (mg/L,log)
-0.22±0.06
0.037 <0.0001 -0.20±0.04
0.054 <0.0001
Albuminuria (g/gcreatinine)
0.107±0.04
0.006 0.008
Glomerulopathy -0.65±0.37
0.076 0.04 -0.34 ±0.23
0.004 0.13
Model R2 0.173 0.22 0.106 0.2
doi:10.1371/journal.pone.0113482.t003
Bone Metabolism in Pediatric CKD
PLOSONE | DOI:10.1371/journal.pone.0113482 February 6, 2015 9 / 17
In adult CKD patients sclerostin levels increased progressively with advanced CKD [18].However, in mice with progressive CKD sclerostin levels were found increased in early diseasebut decreased in advanced renal failure [19]. In keeping with that study we found overall re-duced sclerostin levels in this cohort of patients with moderate to severe CKD. There is also ex-perimental and clinical evidence of sclerostin suppression by PTH [19–21]. Accordingly, lowsclerostin levels were predictive of high bone turnover in adults with CKD [22]. Our resultsconfirm an inverse relationship of sclerostin and iPTH, adding to the notion that the osteoana-bolic effects of iPTH may be partially related to the inhibition of sclerostin release.
Also, the bulk of sclerostin in healthy bone is released by osteocytes deep within the bonematrix whereas osteocytes near zones of bone remodeling produce little sclerostin [23]. Consis-tent with the observed high BAP and TRAP5b levels suggesting a high bone turnover state, thelow plasma sclerostin concentrations in this cohort might indicate a relative preponderance ofzones of bone remodeling over compartments with mature osteocytes and constantsclerostin production.
Little is known to date about the interaction of sclerostin with vitamin D metabolism. In-creased 1,25-dihydroxy-vitamin D hydroxylase activity has recently been demonstrated insclerostin knockout mice [24]. The independent positive association of 25OHD and sclerostinlevels observed here might reflect the impact of vitamin D status on mineralized bone mass.Since the majority of children in this cohort were vitamin D insufficient or deficient, the de-creased sclerostin levels might in part be explained by impaired vitamin D action.
Table 4. Predictors of baseline and prospective change in standardized height in total cohort; results of stepwise multiple linear regressionanalyses.
Height SDS Change in height SDS per year
ß ± SE p ß ± SE p
Age (y) 0.06 ± 0.02 0.0004 0.009 ± 0.001 0.09
Sex (male) -0.52 ± 0.14 0.0002
Height SDS - -0.03 ± 0.013 0.01
Midparental height (cm) 0.06 ± 0.008 <.0001
BMI SDS -0.09 ± 0.04 0.037
Physical activity level (0–4) 0.05 ± 0.01 0.001
rhGH therapy 0.15 ± 0.07 0.04
BAP SDS 0.03 ± 0.01 0.002
TRAP SDS 0.03 ± 0.01 0.04
Sclerostin SDS 0.13 ± 0.05 0.005
cFGF-23 SDS 0.04 ± 0.01 0.001
eGFR (ml/min/1.73m2) 0.03 ± 0.007 <.0001 0.002 ±0.002 0.21
Serum bicarbonate (mM) 0.04 ± 0.015 0.01
Serum Pi (mM) 0.14 ± 0.05 0.005
Serum 25OHD (μg/l, log) 0.006 ± 0.004 0.2 0.05 ± 0.02 0.04
Serum CRP (mg/L, log) -0.07 ± 0.04 0.07
Model R2 0.24 0.10
The prospective change in height SDS during one year of observation was positively associated with higher BAP and TRAP5b SDS, lower baseline height
SDS and rhGH therapy.
Interestingly, physical activity showed a positive association to prospective growth.
A case-control study was performed to obtain an unbiased analysis of the impact of rhGH on the bone marker pattern. For 41 rhGH treated patients an
equal number of untreated control subjects matched by age, sex, country of residence, CKD duration, eGFR and serum phosphorus, iPTH and CRP was
identified (see Table 5).
doi:10.1371/journal.pone.0113482.t004
Bone Metabolism in Pediatric CKD
PLOSONE | DOI:10.1371/journal.pone.0113482 February 6, 2015 10 / 17
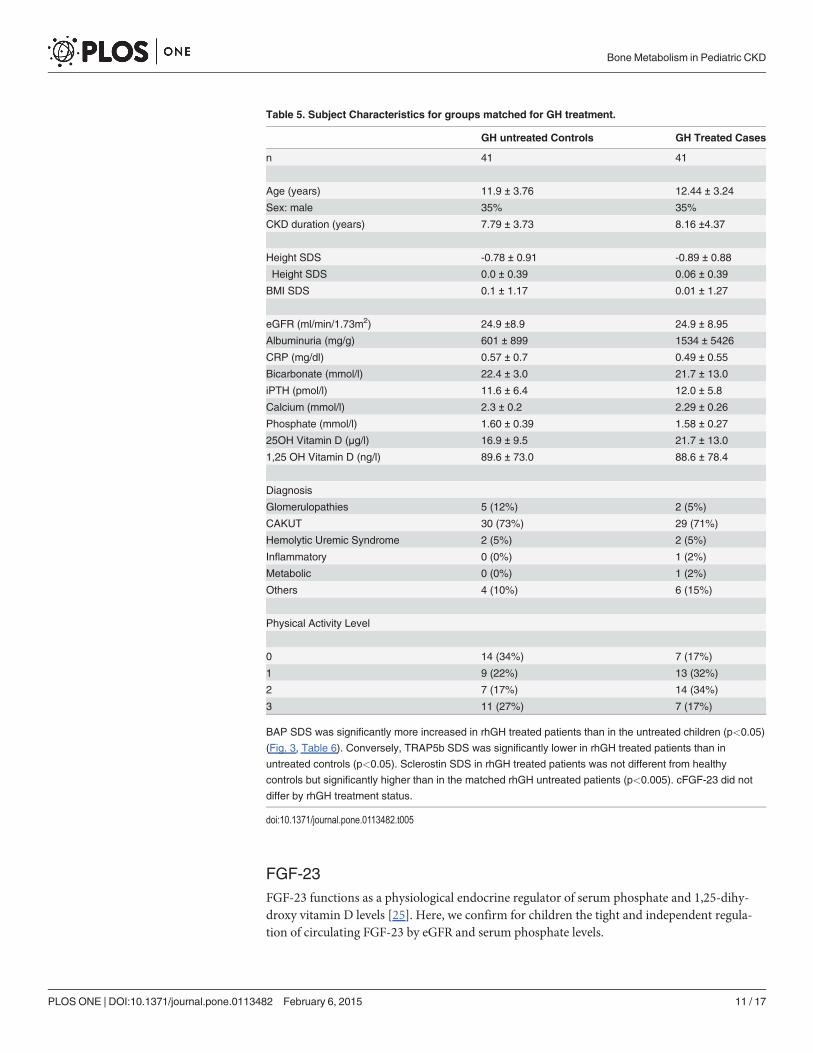
FGF-23FGF-23 functions as a physiological endocrine regulator of serum phosphate and 1,25-dihy-droxy vitamin D levels [25]. Here, we confirm for children the tight and independent regula-tion of circulating FGF-23 by eGFR and serum phosphate levels.
Table 5. Subject Characteristics for groups matched for GH treatment.
GH untreated Controls GH Treated Cases
n 41 41
Age (years) 11.9 ± 3.76 12.44 ± 3.24
Sex: male 35% 35%
CKD duration (years) 7.79 ± 3.73 8.16 ±4.37
Height SDS -0.78 ± 0.91 -0.89 ± 0.88
Δ Height SDS 0.0 ± 0.39 0.06 ± 0.39
BMI SDS 0.1 ± 1.17 0.01 ± 1.27
eGFR (ml/min/1.73m2) 24.9 ±8.9 24.9 ± 8.95
Albuminuria (mg/g) 601 ± 899 1534 ± 5426
CRP (mg/dl) 0.57 ± 0.7 0.49 ± 0.55
Bicarbonate (mmol/l) 22.4 ± 3.0 21.7 ± 13.0
iPTH (pmol/l) 11.6 ± 6.4 12.0 ± 5.8
Calcium (mmol/l) 2.3 ± 0.2 2.29 ± 0.26
Phosphate (mmol/l) 1.60 ± 0.39 1.58 ± 0.27
25OH Vitamin D (μg/l) 16.9 ± 9.5 21.7 ± 13.0
1,25 OH Vitamin D (ng/l) 89.6 ± 73.0 88.6 ± 78.4
Diagnosis
Glomerulopathies 5 (12%) 2 (5%)
CAKUT 30 (73%) 29 (71%)
Hemolytic Uremic Syndrome 2 (5%) 2 (5%)
Inflammatory 0 (0%) 1 (2%)
Metabolic 0 (0%) 1 (2%)
Others 4 (10%) 6 (15%)
Physical Activity Level
0 14 (34%) 7 (17%)
1 9 (22%) 13 (32%)
2 7 (17%) 14 (34%)
3 11 (27%) 7 (17%)
BAP SDS was significantly more increased in rhGH treated patients than in the untreated children (p<0.05)
(Fig. 3, Table 6). Conversely, TRAP5b SDS was significantly lower in rhGH treated patients than in
untreated controls (p<0.05). Sclerostin SDS in rhGH treated patients was not different from healthy
controls but significantly higher than in the matched rhGH untreated patients (p<0.005). cFGF-23 did not
differ by rhGH treatment status.
doi:10.1371/journal.pone.0113482.t005
Bone Metabolism in Pediatric CKD
PLOSONE | DOI:10.1371/journal.pone.0113482 February 6, 2015 11 / 17

Plasma FGF-23 levels are age-dependent and increase early in the course of CKD prior toany abnormalities of serum phosphorus, calcium or PTH [8,26]. They correlate well with FGF-23 synthesis in the bone, as demonstrated in a study of 32 pediatric and young adult CKD pa-tients [27]. FGF-23 is mainly expressed by osteocytes of the trabecular periphery. In dialyzedchildren circulating FGF-23 levels were found related to the process of osteoid maturation andmineralization time [28]. FGF-23 is highly expressed at sites of new bone formation [29] andappears to regulate osteoblast matrix mineralization in an age-dependent fashion [30,31]. In astudy of predialysis children FGF-23, but not PTH or serum phosphorus, independently pre-dicted bone formation [32]. All this evidence suggests a direct role of FGF-23 in bone forma-tion and mineralization. While our study cannot provide insights into the bone morphology ofchildren with CKD, it adds to the current state of knowledge the important observation thatFGF-23 levels are associated with relative height in growing children. We also noted that pa-tients with metabolic acidosis tend to exhibit lower FGF-23 at a given eGFR and serum phos-phorus level. This association might indicate a novel mechanistic link between metabolicacdosis and mineral-bone disorder in CKD.
rhGH promotes an osteoanabolic state in CKDGrowth hormone (GH) and its mediator IGF-1 drive longitudinal growth as part of their gen-eral anabolic action on tissues. CKD causes partial resistance to endogenous GH action, whichcan be overcome by administration of recombinant (r)GH at pharmacological doses. The 40children receiving rhGH therapy in our cohort allowed to assess any effects of rhGH on bonemetabolism. When compared to a matched control group of non-treated children, children
Fig 3. Distribution of serum bonemarker concentrations in children with and without rhGH treatment(n = 41 per group).Data are expressed as standard deviation scores (SDS). The shaded area depicts thenormal range (5th to 95th percentile of biomarker concentrations in healthy children)8. Asterisks indicatesignificant deviation from distribution in the reference population (*: p<0.05, **: p<0.01).
doi:10.1371/journal.pone.0113482.g003
Bone Metabolism in Pediatric CKD
PLOSONE | DOI:10.1371/journal.pone.0113482 February 6, 2015 12 / 17
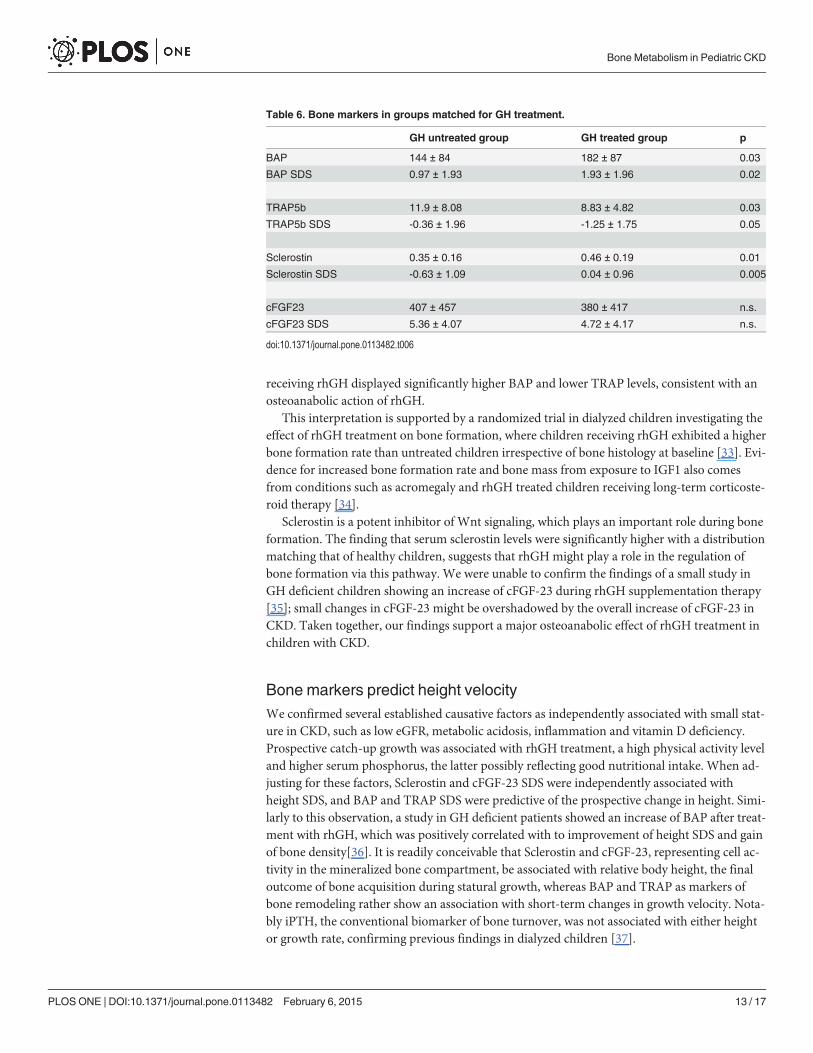
receiving rhGH displayed significantly higher BAP and lower TRAP levels, consistent with anosteoanabolic action of rhGH.
This interpretation is supported by a randomized trial in dialyzed children investigating theeffect of rhGH treatment on bone formation, where children receiving rhGH exhibited a higherbone formation rate than untreated children irrespective of bone histology at baseline [33]. Evi-dence for increased bone formation rate and bone mass from exposure to IGF1 also comesfrom conditions such as acromegaly and rhGH treated children receiving long-term corticoste-roid therapy [34].
Sclerostin is a potent inhibitor of Wnt signaling, which plays an important role during boneformation. The finding that serum sclerostin levels were significantly higher with a distributionmatching that of healthy children, suggests that rhGH might play a role in the regulation ofbone formation via this pathway. We were unable to confirm the findings of a small study inGH deficient children showing an increase of cFGF-23 during rhGH supplementation therapy[35]; small changes in cFGF-23 might be overshadowed by the overall increase of cFGF-23 inCKD. Taken together, our findings support a major osteoanabolic effect of rhGH treatment inchildren with CKD.
Bone markers predict height velocityWe confirmed several established causative factors as independently associated with small stat-ure in CKD, such as low eGFR, metabolic acidosis, inflammation and vitamin D deficiency.Prospective catch-up growth was associated with rhGH treatment, a high physical activity leveland higher serum phosphorus, the latter possibly reflecting good nutritional intake. When ad-justing for these factors, Sclerostin and cFGF-23 SDS were independently associated withheight SDS, and BAP and TRAP SDS were predictive of the prospective change in height. Simi-larly to this observation, a study in GH deficient patients showed an increase of BAP after treat-ment with rhGH, which was positively correlated with to improvement of height SDS and gainof bone density[36]. It is readily conceivable that Sclerostin and cFGF-23, representing cell ac-tivity in the mineralized bone compartment, be associated with relative body height, the finaloutcome of bone acquisition during statural growth, whereas BAP and TRAP as markers ofbone remodeling rather show an association with short-term changes in growth velocity. Nota-bly iPTH, the conventional biomarker of bone turnover, was not associated with either heightor growth rate, confirming previous findings in dialyzed children [37].
Table 6. Bone markers in groups matched for GH treatment.
GH untreated group GH treated group p
BAP 144 ± 84 182 ± 87 0.03
BAP SDS 0.97 ± 1.93 1.93 ± 1.96 0.02
TRAP5b 11.9 ± 8.08 8.83 ± 4.82 0.03
TRAP5b SDS -0.36 ± 1.96 -1.25 ± 1.75 0.05
Sclerostin 0.35 ± 0.16 0.46 ± 0.19 0.01
Sclerostin SDS -0.63 ± 1.09 0.04 ± 0.96 0.005
cFGF23 407 ± 457 380 ± 417 n.s.
cFGF23 SDS 5.36 ± 4.07 4.72 ± 4.17 n.s.
doi:10.1371/journal.pone.0113482.t006
Bone Metabolism in Pediatric CKD
PLOSONE | DOI:10.1371/journal.pone.0113482 February 6, 2015 13 / 17
In conclusion, in a large cohort of children with predialysis CKD we found important asso-ciations of serum bone biomarkers to patient characteristics, traditional markers of bone me-tabolism and linear growth. Our study benefited from a large sample size, the controlledobservational study design and the application of age-specific reference values. However, a lim-itation results from the lack of a direct assessment of bone status by biopsy or skeletal imagingstudies such as DEXA, pqCT or MRI. Also, it should be emphasized that the observed associa-tions cumulatively explained only 10–20% of the overall variation of bone marker concentra-tions and 10–24% of the variance of growth indicators. Hence, while our study is informativeregarding important biological regulators of bone metabolism and growth, other major sourcesof variation, including the impact of genetic disposition, remain to be explored. We hope thatour findings will prompt further evaluation of these biomarkers including bone imaging tech-niques and bone histomorphometry to further validate their usefulness in the assessment andtherapeutic monitoring of bone metabolism in children with CKD.
AcknowledgmentsThe authors would like to acknowledge all children and their families for their participation inthe 4C Study.
The following principal investigators are contributing to the 4C Study: Austria: G. Cortina,Children’s Hospital, Innsbruck; K. Arbeiter, University Children’s Hospital, Vienna. Czech Re-public: J. Dusek, University Hospital Motol, Prague. France: J. Harambat, Hôpital des Enfants,Bordeaux; B. Ranchin, Hôpital Femme Mère Enfant et Université de Lyon; M. Fischbach,Hôpital de Hautepierre, Strasbourg. Germany:U. Querfeld, R. Zeller, Charité Children’s Hos-pital, Berlin; J. Dötsch, University Children’s Hospital, Cologne; M. Galiano, University Chil-dren’s Hospital, Erlangen; R. Büscher, University Children’s Hospital, Essen; C. Gimpel,Center for Pediatrics and Adolescent Medicine, Freiburg; M. Kemper, UKE University Chil-dren’s Hospital, Hamburg; A. Melk, D. Kracht, Hannover Medical School, Hannover;F. Schaefer, A. Doyon, E. Wuehl, Center for Pediatrics and Adolescent Medicine, Heidelberg;M. Pohl, Center for Pediatrics and Adolescent Medicine, Jena; S. Wygoda, City HospitalSt. Georg, Leipzig; N. Jeck, KfH Kidney Center for Children, Marburg; B. Kranz, UniversityChildren’s Hospital, Münster; M. Wigger, Children’s Hospital, Rostock. Italy: G. Montini,S. Orsola-Malpighi Hospital, Bologna; A. Trivelli, Istituto Giannina Gaslini, Genova; S. Testa,Fondazione Ospedale Maggiore Policlinico, Milano; E. Vidal, Pediatric Nephrology, Dialysis &Transplant Unit, Padova; C. Matteucci, S. Picca, Ospedale Bambino Gesù, Rome. Lithuania:A. Jankauskiene, University Children’s Hospital, Vilnius. Poland: A. Zurowska, Pediatric andAdolescent Nephrology, Gdansk; D. Drodz, University Children’s Hospital, Krakow;M. Tkaczyk, Polish Mothers Memorial Hospital Research Institute, Lodz; T. Urasinski, Clinicof Pediatrics, Szczecin; M. Litwin, Anna Niemirska, Children’s Memorial Health Institute,Warsaw; M. Szczepanska, Zabrze. Portugal: A. Texeira, Hospital Sao Joao, Porto; Serbia:A. Peco-Antic, University Children’s Hospital, Belgrade. Switzerland: G. Simonetti, Inselspital,Bern; G. Laube, University Children’s Hospital, Zurich. Turkey: A. Anarat, A.K. Bayazit,Cukurova University, Adana; F. Yalcinkaya, University Faculty of Medicine, Ankara; E. Basin,Baskent University Faculty of Medicine, Ankara; N. Cakar, Diskapi Children’s Hospital, An-kara; O. Soylemezoglu, Gazi University Hospital, Ankara; A. Duzova, Y. Bilginer, HacettepeMedical Faculty, Ankara; H. Erdogan, Dortcelik Children’s Hospital, Bursa; O. Donmez, Ulu-dag University, Bursa; A. Balat, University of Gaziantep; A. Kiyak, Bakirkoy Children’s Hospi-tal, Istanbul; S. Caliskan, N. Canpolat, Istanbul University Cerrahpasa Faculty of Medicine,Istanbul; C. Candan, Goztepe Educational and Research Hospital, Istanbul; M. Civilibal,Haseki Educational and Research Hospital, Istanbul; S. Emre, Istanbul Medical Faculty,
Bone Metabolism in Pediatric CKD
PLOSONE | DOI:10.1371/journal.pone.0113482 February 6, 2015 14 / 17

Istanbul, H. Alpay, Marmara University Medical Faculty, Istanbul; G. Ozcelik, Sisli Educationaland Research Hospital, Istanbul; S. Mir, B. Sözeri, Ege University Medical Faculty; Izmir;O. Yavascan, Tepecik Training and Research Hospital, Izmir; Y. Tabel, Inonu University, Ma-latya; P. Ertan, Celal Bayar University, Manisa; E. Yilmaz, Children’s Hospital, Sanliurfa. Unit-ed Kingdom: R. Shroff, Great Ormond Street Hospital, London.
Lead investigators of the 4C Study: F. Schaefer ([email protected]),U. Querfeld ([email protected]), A.Melk ([email protected]).
Author ContributionsConceived and designed the experiments: AD DF DH FS. Performed the experiments: AD DFAKB NCan ADu BS JB ABa ABü CC NCak OD JDMH GK SM GÖ LS RS EV EW AMUQ.Analyzed the data: ADMG. Contributed reagents/materials/analysis tools: DF MG. Wrote thepaper: AD DF DH FS.
References1. Moe S, Drueke T, Cunningham J, GoodmanW, Martin K, et al. (2006) Definition, evaluation, and classi-
fication of renal osteodystrophy: a position statement from Kidney Disease: Improving Global Out-comes (KDIGO). Vol. 69. pp. 1945–1953. doi: 10.1038/sj.ki.5000414
2. Kidney Disease: Improving Global Outcomes (KDIGO) CKD-MBDWork Group (2009) KDIGO clinicalpractice guideline for the diagnosis, evaluation, prevention, and treatment of Chronic Kidney Disease-Mineral and Bone Disorder (CKD-MBD). Kidney Int Suppl: S1–S130. doi: 10.1038/ki.2009.188
3. Wesseling-Perry K, Salusky IB (2013) Chronic kidney disease: mineral and bone disorder in children.YSNEP 33: 169–179. Available: http://eutils.ncbi.nlm.nih.gov/entrez/eutils/elink.fcgi?dbfrom =pubmed&id=23465503&retmode = ref&cmd = prlinks.
4. Andersson G, Ek-Rylander B, Hollberg K, Ljusberg-Sjölander J, Lång P, et al. (2003) TRACP as anosteopontin phosphatase. J Bone Miner Res 18: 1912–1915. doi: 10.1359/jbmr.2003.18.10.1912PMID: 14584906
5. Drüeke TB, Lafage-Proust MH (2011) Sclerostin: Just One More Player in Renal Bone Disease? Clin JAm Soc Nephrol 6: 700–703. doi: 10.2215/CJN.01370211 PMID: 21441122
6. Galli C, Passeri G, Macaluso GM (2010) Osteocytes andWNT: the mechanical control of bone forma-tion. J Dent Res 89: 331–343. doi: 10.1177/0022034510363963 PMID: 20200416
7. Lu Y, Feng JQ (2011) FGF23 in Skeletal Modeling and Remodeling. Curr Osteoporos Rep 9: 103–108.doi: 10.1007/s11914-011-0053-4 PMID: 21404002
8. Fischer DC, Mischek A, Wolf S, Rahn A, Salweski B, et al. (2012) Paediatric reference values for the C-terminal fragment of fibroblast-growth factor-23, sclerostin, bone-specific alkaline phosphatase and iso-form 5b of tartrate-resistant acid phosphatase. Annals of Clinical Biochemistry 49: 546–553. doi: 10.1258/acb.2012.011274 PMID: 22984195
9. Querfeld U, Anarat A, Bayazit AK, Bakkaloglu AS, Bilginer Y, et al. (2010) The Cardiovascular Comor-bidity in Children with Chronic Kidney Disease (4C) study: objectives, design, and methodology. Clin JAm Soc Nephrol 5: 1642–1648. doi: 10.2215/CJN.08791209 PMID: 20576824
10. Schwartz GJ, Munoz A, Schneider MF, Mak RH, Kaskel F, et al. (2009) New Equations to EstimateGFR in Children with CKD. Journal of the American Society of Nephrology 20: 629–637. doi: 10.1681/ASN.2008030287 PMID: 19158356
11. Hogg RJ, Furth S, Lemley KV, Portman R, Schwartz GJ, et al. (2003) National Kidney Foundation's Kid-ney Disease Outcomes Quality Initiative clinical practice guidelines for chronic kidney disease in chil-dren and adolescents: evaluation, classification, and stratification. Pediatrics 111: 1416–1421. PMID:12777562
12. Ureña P, Hruby M, Ferreira A, Ang KS, de Vernejoul MC (1996) Plasma total versus bone alkalinephosphatase as markers of bone turnover in hemodialysis patients. J Am Soc Nephrol 7: 506–512.PMID: 8704118
13. Shidara K, Inaba M, Okuno S, Yamada S, Kumeda Y, et al. (2008) Serum Levels of TRAP5b, a NewBone Resorption Marker Unaffected by Renal Dysfunction, as a Useful Marker of Cortical Bone Loss inHemodialysis Patients. Calcif Tissue Int 82: 278–287. Available: http://www.cof.org.cn/pdf/2008/6/Serum%20Levels%20of%20TRAP5b.pdf. doi: 10.1007/s00223-008-9127-4 PMID: 18421493
Bone Metabolism in Pediatric CKD
PLOSONE | DOI:10.1371/journal.pone.0113482 February 6, 2015 15 / 17

14. Ureña P, de Vernejoul MC (1999) Circulating biochemical markers of bone remodeling in uremic pa-tients. Kidney Int 55: 2141–2156. doi: 10.1046/j.1523–1755.1999.00461.x PMID: 10354264
15. Behnke B, Kemper M, Kruse HP, Müller-Wiefel DE (1998) Bone alkaline phosphatase in children withchronic renal failure. Nephrol Dial Transplant 13: 662–667. PMID: 9550644
16. Siomou E, Challa A, Printza N, Giapros V, Petropoulou F, et al. (2011) Serum osteoprotegerin, RANKLand fibroblast growth factor-23 in children with chronic kidney disease. Pediatr Nephrol 26: 1105–1114. doi: 10.1007/s00467-011-1870-5 PMID: 21479768
17. Kirmani S, Amin S, McCready LK, Atkinson EJ, Melton LJ, et al. (2011) Sclerostin levels during growthin children. Osteoporos Int 23: 1123–1130. doi: 10.1007/s00198-011-1669-z PMID: 21617991
18. Pelletier S, Dubourg L, Carlier MC, Hadj-Aissa A, Fouque D (2013) The Relation between Renal Func-tion and Serum Sclerostin in Adult Patients with CKD. Clin J Am Soc Nephrol 8: 819–823. doi: 10.2215/CJN.07670712 PMID: 23430206
19. Sabbagh Y, Graciolli FG, O'Brien S, TangW, Reis dos LM, et al. (2012) Repression of osteocyteWnt/β-catenin signaling is an early event in the progression of renal osteodystrophy. J Bone Miner Res 27:1757–1772. doi: 10.1002/jbmr.1630 PMID: 22492547
20. Kramer I, Keller H, Leupin O, Kneissel M (2010) Does osteocytic SOST suppression mediate PTHbone anabolism? Trends Endocrinol Metab 21: 237–244. doi: 10.1016/j.tem.2009.12.002 PMID:20074973
21. Drake MT, Srinivasan B, Mödder UI, Peterson JM, McCready LK, et al. (2010) Effects of parathyroidhormone treatment on circulating sclerostin levels in postmenopausal women. J Clin Endocrinol Metab95: 5056–5062. doi: 10.1210/jc.2010-0720 PMID: 20631014
22. Cejka D, Herberth J, Branscum AJ, Fardo DW, Monier-Faugere M-C, et al. (2011) Sclerostin and Dick-kopf-1 in renal osteodystrophy. Clin J Am Soc Nephrol 6: 877–882. doi: 10.2215/CJN.06550810 PMID:21164019
23. Poole KES, van Bezooijen RL, Loveridge N, Hamersma H, Papapoulos SE, et al. (2005) Sclerostin is adelayed secreted product of osteocytes that inhibits bone formation. FASEB J 19: 1842–1844. doi: 10.1096/fj.05–4221fje PMID: 16123173
24. Ryan ZC, Ketha H, McNulty MS, McGee-Lawrence M, Craig TA, et al. (2013) Sclerostin alters serum vi-tamin D metabolite and fibroblast growth factor 23 concentrations and the urinary excretion of calcium.Proc Natl Acad Sci USA 110: 6199–6204. doi: 10.1073/pnas.1221255110 PMID: 23530237
25. Shimada T, Kakitani M, Yamazaki Y, Hasegawa H, Takeuchi Y, et al. (2004) Targeted ablation of Fgf23demonstrates an essential physiological role of FGF23 in phosphate and vitamin D metabolism. J ClinInvest 113: 561–568. doi: 10.1172/JCI19081 PMID: 14966565
26. Bacchetta J, Dubourg L, Harambat J, Ranchin B, Abou-Jaoude P, et al. (2010) The influence of glomer-ular filtration rate and age on fibroblast growth factor 23 serum levels in pediatric chronic kidney dis-ease. J Clin Endocrinol Metab 95: 1741–1748. doi: 10.1210/jc.2009-1576 PMID: 20157196
27. Pereira RCR, Juppner HH, Azucena-Serrano CEC, Yadin OO, Salusky IBI, et al. (2009) Patterns ofFGF-23, DMP1, and MEPE expression in patients with chronic kidney disease. Bone 45: 8–8. doi: 10.1016/j.bone.2009.08.008
28. Wesseling-Perry K, Pereira RC, Wang H, Elashoff RM, Sahney S, et al. (2009) Relationship betweenplasma fibroblast growth factor-23 concentration and bone mineralization in children with renal failureon peritoneal dialysis. Journal of Clinical Endocrinology & Metabolism 94: 511–517. doi: 10.1210/jc.2008-0326 PMID: 25361544
29. Riminucci M, Collins MT, Fedarko NS, Cherman N, Corsi A, et al. (2003) FGF-23 in fibrous dysplasia ofbone and its relationship to renal phosphate wasting. J Clin Invest 112: 683–692. doi: 10.1172/JCI18399 PMID: 12952917
30. Yoshiko Y, Wang H, Minamizaki T, Ijuin C, Yamamoto R, et al. (2007) Mineralized tissue cells are aprincipal source of FGF23. Bone 40: 1565–1573. doi: 10.1016/j.bone.2007.01.017 PMID: 17350357
31. Wesseling-Perry K (2010) FGF-23 in bone biology. Pediatr Nephrol 25: 603–608. doi: 10.1007/s00467-009-1384-6 PMID: 20012997
32. Wesseling-Perry K, Pereira RC, Tseng C-H, Elashoff R, Zaritsky JJ, et al. (2012) Early skeletal and bio-chemical alterations in pediatric chronic kidney disease. Clin J Am Soc Nephrol 7: 146–152. doi: 10.2215/CJN.05940611 PMID: 22052943
33. Bacchetta J, Wesseling-Perry K, Kuizon B, Pereira RC, Gales B, et al. (2013) The Skeletal Conse-quences of Growth Hormone Therapy in Dialyzed Children: A Randomized Trial. Clinical Journal of theAmerican Society of Nephrology 8: 824–832. doi: 10.2215/CJN.00330112 PMID: 23559676
34. Bacchetta J, Harambat J, Cochat P, Salusky IB, Wesseling-Perry K (2012) The consequences ofchronic kidney disease on bone metabolism and growth in children. Nephrology Dialysis Transplanta-tion 27: 3063–3071. doi: 10.1093/ndt/gfs299 PMID: 22851629
Bone Metabolism in Pediatric CKD
PLOSONE | DOI:10.1371/journal.pone.0113482 February 6, 2015 16 / 17
35. Gardner J, Ashraf A, You Z, McCormick K (2011) Changes in plasma FGF23 in growth hormone defi-cient children during rhGH therapy. J Pediatr Endocrinol Metab 24: 645–650. PMID: 22145450
36. Tobiume HH, Kanzaki SS, Hida SS, Ono TT, Moriwake TT, et al. (1997) Serum bone alkaline phospha-tase isoenzyme levels in normal children and children with growth hormone (GH) deficiency: a potentialmarker for bone formation and response to GH therapy. Journal of Clinical Endocrinology & Metabolism82: 2056–2061. doi: 10.1111/cen.12617 PMID: 25361544
37. Borzych D, Rees L, Soo Ha Il, Chua A, Valles PG, et al. (2010) The bone and mineral disorder of chil-drenundergoing chronic peritoneal dialysis. Kidney Int 78: 1295–1304. doi: 10.1038/ki.2010.316 PMID:20811335
Bone Metabolism in Pediatric CKD
PLOSONE | DOI:10.1371/journal.pone.0113482 February 6, 2015 17 / 17