Income-related inequalities in inadequate dentition over time in Australia, Brazil and USA adults
14
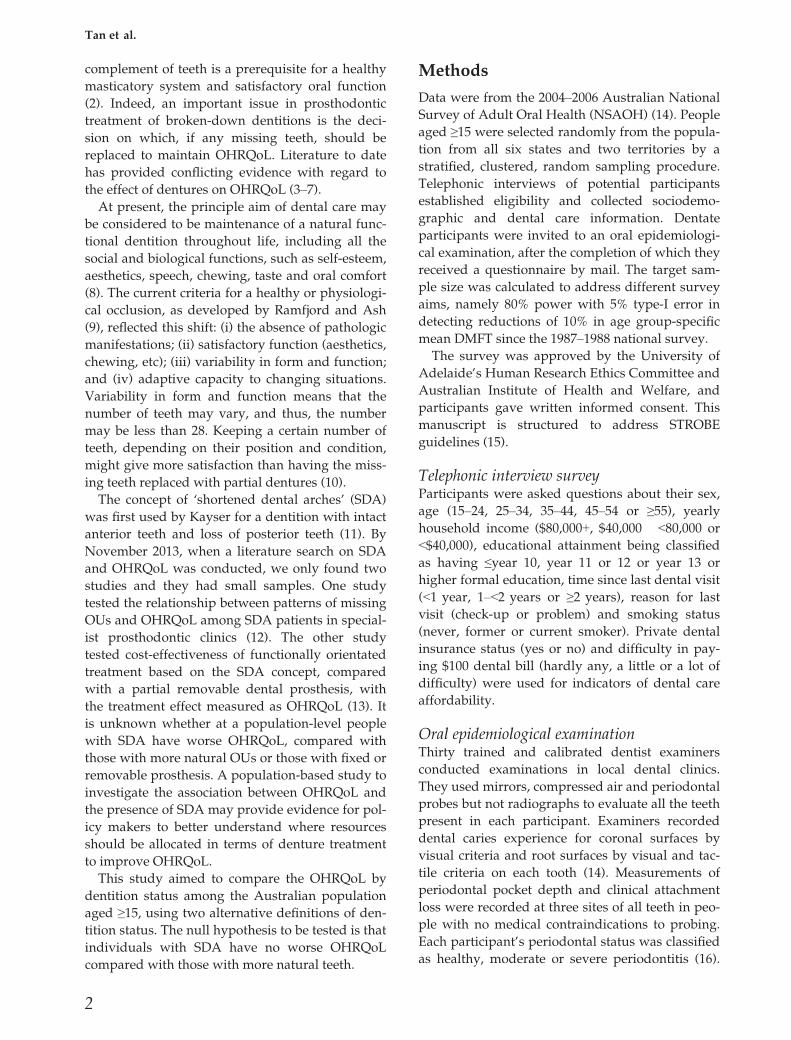
Do people with shortened dental arches have worse oral health- related quality of life than those with more natural teeth? A population-based study Tan H, Peres KG, Peres MA. Do people with shortened dental arches have worse oral health-related quality of life than those with more natural teeth? A population-based study. Community Dent Oral Epidemiol 2014. © 2014 John Wiley & Sons A/S. Published by John Wiley & Sons Ltd. Abstract – Objective: To test whether people with shortened dental arches (SDA) have impaired oral health-related quality of life than those with more natural teeth. Method: We analysed data from the 2004–2006 Australian National Survey of Adult Oral Health (including telephone interview, oral epidemiological examinations and mailed questionnaire). Participants aged ≥15 years and with intact anterior teeth were eligible in this study. We used multivariable negative binomial regression analyses to test the association of SDA, according to two alternative definition (1. having intact teeth and 3-5 natural occlusal units; 2. having intact anterior teeth and four natural occlusal units), with OHIP-14 severity and extent, adjusting for potential confounders, including demographic variables (age and sex), socioeconomic variables (income and education), behaviour characteristics (time since last visit, reason for the last dental visit, difficult in paying $100 dental bill and dental insurance possession), and dental outcomes (coronal and root caries, and periodontal disease). Result: We analysed on 2,750 dentate participants that were eligible for the study. When SDA was classified as intact anterior teeth, four occlusal units and no dental prosthesis, no statistical difference in OHIP-14 severity or extent was identified compared with those with intact anterior teeth, over four occlusal units and no dental prosthesis. Participants who presented intact anterior teeth, 3-5 occlusal units and no prosthesis showed 50% higher rates of OHIP-14 severity than those with intact anterior teeth, over five occlusal units and no prosthesis while their OHIP-14 extent was similar to that of the reference group. Conclusion: SDA is not associated with negative impacts on quality of life, according to both OHIP-14 severity and extent, when SDA is defined as four occlusal units and no dental prosthesis. When SDA is defined as 3-5 occlusal units and no dental prosthesis, it is only associated with OHIP-14 severity, but not OHIP-14 extent. Haiping Tan, Karen G. Peres and Marco A. Peres Australian Research Centre for Population Oral Health, School of Dentistry, The University of Adelaide, Adelaide, SA, Australia Key words: dental health survey(s); dental public health; epidemiology; oral rehabilitation; quality of life Haiping Tan, Australian Research Centre for Population Oral Health, School of Dentistry, The University of Adelaide, Level 1, 122 Frome Street, Adelaide, Adelaide, SA 5000, Australia Tel: +61 8 8313 4044 Fax: +61 8 8313 3070 e-mail: [email protected] Submitted 13 February 2014; accepted 28 July 2014 It has been recognized that tooth loss can affect oral health-related quality of life (OHRQoL) (1). The traditional approach to restorative dentistry stres- ses the use of idealized morphological criteria and mechanically oriented concepts. For example, one textbook in prosthodontics emphasizes that a full doi: 10.1111/cdoe.12124 1 Community Dent Oral Epidemiol All rights reserved Ó 2014 John Wiley & Sons A/S. Published by John Wiley & Sons Ltd
Transcript of Income-related inequalities in inadequate dentition over time in Australia, Brazil and USA adults
Do people with shortened dentalarches have worse oral health-related quality of life than thosewith more natural teeth? Apopulation-based study
Tan H, Peres KG, Peres MA. Do people with shortened dental arches haveworse oral health-related quality of life than those with more natural teeth? Apopulation-based study. Community Dent Oral Epidemiol 2014. © 2014 JohnWiley & Sons A/S. Published by John Wiley & Sons Ltd.
Abstract – Objective: To test whether people with shortened dental arches(SDA) have impaired oral health-related quality of life than those with morenatural teeth. Method: We analysed data from the 2004–2006 AustralianNational Survey of Adult Oral Health (including telephone interview, oralepidemiological examinations and mailed questionnaire). Participants aged ≥15years and with intact anterior teeth were eligible in this study. We usedmultivariable negative binomial regression analyses to test the association ofSDA, according to two alternative definition (1. having intact teeth and 3-5natural occlusal units; 2. having intact anterior teeth and four natural occlusalunits), with OHIP-14 severity and extent, adjusting for potential confounders,including demographic variables (age and sex), socioeconomic variables(income and education), behaviour characteristics (time since last visit, reasonfor the last dental visit, difficult in paying $100 dental bill and dental insurancepossession), and dental outcomes (coronal and root caries, and periodontaldisease). Result: We analysed on 2,750 dentate participants that were eligible forthe study. When SDA was classified as intact anterior teeth, four occlusal unitsand no dental prosthesis, no statistical difference in OHIP-14 severity or extentwas identified compared with those with intact anterior teeth, over fourocclusal units and no dental prosthesis. Participants who presented intactanterior teeth, 3-5 occlusal units and no prosthesis showed 50% higher rates ofOHIP-14 severity than those with intact anterior teeth, over five occlusal unitsand no prosthesis while their OHIP-14 extent was similar to that of thereference group. Conclusion: SDA is not associated with negative impacts onquality of life, according to both OHIP-14 severity and extent, when SDA isdefined as four occlusal units and no dental prosthesis. When SDA is defined as3-5 occlusal units and no dental prosthesis, it is only associated with OHIP-14severity, but not OHIP-14 extent.
Haiping Tan, Karen G. Peres and
Marco A. Peres
Australian Research Centre for Population
Oral Health, School of Dentistry, The
University of Adelaide, Adelaide, SA,
Australia
Key words: dental health survey(s); dentalpublic health; epidemiology; oralrehabilitation; quality of life
Haiping Tan, Australian Research Centre forPopulation Oral Health, School of Dentistry,The University of Adelaide, Level 1, 122Frome Street, Adelaide, Adelaide, SA 5000,AustraliaTel: +61 8 8313 4044Fax: +61 8 8313 3070e-mail: [email protected]
Submitted 13 February 2014;accepted 28 July 2014
It has been recognized that tooth loss can affect oral
health-related quality of life (OHRQoL) (1). The
traditional approach to restorative dentistry stres-
ses the use of idealized morphological criteria and
mechanically oriented concepts. For example, one
textbook in prosthodontics emphasizes that a full
doi: 10.1111/cdoe.12124 1
Community Dent Oral EpidemiolAll rights reserved
� 2014 John Wiley & Sons A/S. Published by John Wiley & Sons Ltd
complement of teeth is a prerequisite for a healthy
masticatory system and satisfactory oral function
(2). Indeed, an important issue in prosthodontic
treatment of broken-down dentitions is the deci-
sion on which, if any missing teeth, should be
replaced to maintain OHRQoL. Literature to date
has provided conflicting evidence with regard to
the effect of dentures on OHRQoL (3–7).At present, the principle aim of dental care may
be considered to be maintenance of a natural func-
tional dentition throughout life, including all the
social and biological functions, such as self-esteem,
aesthetics, speech, chewing, taste and oral comfort
(8). The current criteria for a healthy or physiologi-
cal occlusion, as developed by Ramfjord and Ash
(9), reflected this shift: (i) the absence of pathologic
manifestations; (ii) satisfactory function (aesthetics,
chewing, etc); (iii) variability in form and function;
and (iv) adaptive capacity to changing situations.
Variability in form and function means that the
number of teeth may vary, and thus, the number
may be less than 28. Keeping a certain number of
teeth, depending on their position and condition,
might give more satisfaction than having the miss-
ing teeth replaced with partial dentures (10).
The concept of ‘shortened dental arches’ (SDA)
was first used by Kayser for a dentition with intact
anterior teeth and loss of posterior teeth (11). By
November 2013, when a literature search on SDA
and OHRQoL was conducted, we only found two
studies and they had small samples. One study
tested the relationship between patterns of missing
OUs and OHRQoL among SDA patients in special-
ist prosthodontic clinics (12). The other study
tested cost-effectiveness of functionally orientated
treatment based on the SDA concept, compared
with a partial removable dental prosthesis, with
the treatment effect measured as OHRQoL (13). It
is unknown whether at a population-level people
with SDA have worse OHRQoL, compared with
those with more natural OUs or those with fixed or
removable prosthesis. A population-based study to
investigate the association between OHRQoL and
the presence of SDA may provide evidence for pol-
icy makers to better understand where resources
should be allocated in terms of denture treatment
to improve OHRQoL.
This study aimed to compare the OHRQoL by
dentition status among the Australian population
aged ≥15, using two alternative definitions of den-
tition status. The null hypothesis to be tested is that
individuals with SDA have no worse OHRQoL
compared with those with more natural teeth.
Methods
Data were from the 2004–2006 Australian National
Survey of Adult Oral Health (NSAOH) (14). People
aged ≥15 were selected randomly from the popula-
tion from all six states and two territories by a
stratified, clustered, random sampling procedure.
Telephonic interviews of potential participants
established eligibility and collected sociodemo-
graphic and dental care information. Dentate
participants were invited to an oral epidemiologi-
cal examination, after the completion of which they
received a questionnaire by mail. The target sam-
ple size was calculated to address different survey
aims, namely 80% power with 5% type-I error in
detecting reductions of 10% in age group-specific
mean DMFT since the 1987–1988 national survey.
The survey was approved by the University of
Adelaide’s Human Research Ethics Committee and
Australian Institute of Health and Welfare, and
participants gave written informed consent. This
manuscript is structured to address STROBE
guidelines (15).
Telephonic interview surveyParticipants were asked questions about their sex,
age (15–24, 25–34, 35–44, 45–54 or ≥55), yearly
household income ($80,000+, $40,000 �<80,000 or
<$40,000), educational attainment being classified
as having ≤year 10, year 11 or 12 or year 13 or
higher formal education, time since last dental visit
(<1 year, 1–<2 years or ≥2 years), reason for last
visit (check-up or problem) and smoking status
(never, former or current smoker). Private dental
insurance status (yes or no) and difficulty in pay-
ing $100 dental bill (hardly any, a little or a lot of
difficulty) were used for indicators of dental care
affordability.
Oral epidemiological examinationThirty trained and calibrated dentist examiners
conducted examinations in local dental clinics.
They used mirrors, compressed air and periodontal
probes but not radiographs to evaluate all the teeth
present in each participant. Examiners recorded
dental caries experience for coronal surfaces by
visual criteria and root surfaces by visual and tac-
tile criteria on each tooth (14). Measurements of
periodontal pocket depth and clinical attachment
loss were recorded at three sites of all teeth in peo-
ple with no medical contraindications to probing.
Each participant’s periodontal status was classified
as healthy, moderate or severe periodontitis (16).
2
Tan et al.

Each examined person received a written report of
findings. Intraclass correlation coefficients of reli-
ability were 1.00 on the number of teeth present
per person, 0.85 on decayed, missing or filled sta-
tus at the tooth level and 0.98 at the person-level
and 0.59 on millimetres of clinical attachment loss
per site and 0.54 on millimetres of probing pocket
depth per site among examiners, compared with
the study reference examiner in masked, replicated
examinations of 157 study participants (14).
Self-completed Mailed QuestionnaireThe questionnaire asked about alcohol consump-
tion (yes or no) and frequency of toothbrushing
(≥14 or <14) in the week before the survey. The 14-
item oral health impact profile questionnaire
(OHIP-14) (17) asked about adverse impacts of the
teeth, mouth or dentures on daily life during the
preceding year. Responses were ‘very often’, ‘fairly
often’, ‘sometimes’, ‘hardly ever’ or ‘never’, coded
4, 3, 2, 1 and 0, respectively. Twenty returned ques-
tionnaires were missing ≥3 OHIP item responses
and were omitted from analysis. For 59 people
with missing values for ≤2 OHIP items, item
responses were imputed by the use of the mean
value of the item from among nonmissing values.
Dentition status – main exposureThere are two definitions of SDA: (i) having intact
anterior teeth and 3–5 natural OUs (18) and (ii)
having intact anterior teeth and four natural
OUs (19). According to the first definition, we
categorized participants aged ≥15 and with intact
anterior teeth into the following five groups –‘dentition status 1’ groups: (1) people with >5OUs and no prosthesis; (2) people with >5 natural
OUs with prosthesis; (3) people with 3–5 OUs and
no prosthesis (SDA); (4) people with <3 OUs and
no prosthesis; and (5) people with ≤5 natural OUs
with prosthesis. According to the second defini-
tion, we categorized the same participants into
the following five groups – ‘dentition status 2’
groups: (1) people with >4 natural OUs and no
prosthesis; (2) people with >4 natural OUs with
prosthesis; (3) people with 4 natural OUs and no
prosthesis (SDA); (4) people with <4 OUs and no
prosthesis; and (5) people with ≤ 4 natural OUs
with prosthesis.
Statistical analysesFirstly, we described the studied sample character-
istics according to the two outcomes – OHIP-14
severity and OHIP-14 extent (20), using STATA
commands for complex sampling (cluster and
weights). Extent refers to the number of items
reported ‘fairly often’ or ‘very often’. Severity is
the sum of ordinal responses. Given that both out-
comes are count variables and presented skewness
and over dispersion distribution, we assessed the
association of sample characteristics describing
outcomes means, 95% confidence intervals
and median. Secondly, we performed unadjusted
and multivariable negative binomial regression
models for each outcome and for each dentition
status – the main exposures (dentition status 1 and
2) – separately which allowed the estimation of
count ratio (CR) and its 95% confidence intervals.
Statistical modelling followed a sequential analysis
from distal to proximate determinants of OHIP-14.
We presented count ratio (CR) for dentition status
1 and 2 in each model (21). Model 1 included
demographic variables (age and sex); model 2 was
similar in composition to model 1 with the addition
of socioeconomic variables (income and educa-
tion); model 3 was similar in composition to model
2 with behaviour characteristics added (time since
last visit, reason for the last dental visit, difficult in
paying $100 dental bill and card insurance posses-
sion); and finally, model 4 was similar in composi-
tion to model 3 plus dental status (coronal and root
caries, and periodontal disease). Variables with
unadjusted or adjusted P-values higher than 0.20
(i.e. alcohol consumption and frequency of tooth-
brushing) were not included in the multivariable
models.
Results
Of 28,812 selected people aged ≥15, 14,123 (49.0%)
completed a telephonic interview. The 12,606 den-
tate interviewees were asked to undergo an oral
epidemiological examination, and 5,505 (43.7%) of
them did so. Of those, 3,724 (67.6%) had complete
data from the examination and from a question-
naire completed after the examination.
A total of 2,750 participants aged ≥15, with ≤2OHIP items missing and with intact anterior teeth,
were eligible in this study. Table 1 displays the
main characteristics of the studied sample and
OHIP-14 severity and extent according to demo-
graphic, socioeconomic, behaviours and dental dis-
eases. The sample had a similar distribution
according to age bracket and insurance status, a
slightly higher proportion of females and people
brushing their teeth more frequently, higher
3
Shortened dental arches and quality of life

Table 1. Sample distribution of people with intact anterior teeth and OHIP-14 severity and extent by explanatoryvariables
n %a
OHIP-14 severityOHIP-14 extentb
Meana (95% CI) Mediana Meana (95% CI)
Total 2,750 100 6.55 (6.01–7.09) 4.00 0.40 (0.32–0.48)Demographic variablesAge group P = 0.163c P = 0.175c
15–24 236 21.9 7.07 (5.50–8.63) 4.00 0.44 (0.19–0.69)25–34 385 23.0 6.36 (5.04–7.68) 4.00 0.43 (0.25–0.61)35–44 556 18.5 6.68 (5.80–7.56) 4.00 0.42 (0.27–0.56)45–54 595 17.0 7.39 (6.44–8.33) 5.00 0.50 (0.33–0.67)≥55 978 19.6 5.35 (4.83–5.87) 3.00 0.23 (0.17–0.29)Sex P = 0.006c P = 0.005c
Male 1,019 49.9 5.82 (5.08–6.56) 4.00 0.27 (0.16–0.38)Female 1,731 50.1 7.28 (6.54–8.01) 4.00 0.54 (0.42–0.66)
SESYearly household income P = 0.001c P = 0.004c
$80k+ 685 33.8 5.41 (4.41–6.41) 3.00 0.27 (0.15–0.40)$40–<80k 907 37.1 6.24 (5.54–6.93) 4.00 0.30 (0.21–0.38)<$40k 962 29.1 8.19 (6.99–9.39) 5.00 0.65 (0.42–0.88)Education P = 0.058c P = 0.029c
Year 13 or higher 1,659 65.9 6.21 (5.51–6.91) 4.00 0.35 (0.26–0.44)Year 11 or 12 836 25.8 7.11 (6.13–8.09) 4.00 0.48 (0.30–0.67)≤Year 10 252 8.3 7.56 (5.92–9.19) 5.00 0.60 (0.32–0.88)
Behaviour and visitTime since last visit P = 0.991c P = 0.835c
<1 year 1,767 59.2 6.53 (5.90–7.16) 4.00 0.39 (0.30–0.57)1–<2 years 456 17.8 6.72 (5.41–8.02) 4.00 0.47 (0.21–0.72)≥2 years 525 23.0 6.48 (5.21–7.76) 4.00 0.39 (0.30–0.47)Reason for last visit P < 0.001c P < 0.001c
Check-up 1,711 62.3 5.07 (4.58–5.56) 3.00 0.22 (0.16–0.28)Problem 1,028 37.7 9.05 (8.02–10.07) 6.00 0.70 (0.52–0.88)Difficulty in paying $100dental bill
P < 0.001c P < 0.001c
No 1,249 45.7 4.84 (4.32–5.37) 3.00 0.21 (0.15–0.27)Hardly any/a little 1,074 39.6 7.01 (6.07–7.94) 5.00 0.37 (0.26–0.47)A lot of difficulty 418 14.7 10.59 (8.92–12.25) 7.00 1.10 (0.70–1.50)Dental insured P = 0.014c P = 0.022c
Yes 1,442 49.9 5.98 (5.28–6.69) 4.00 0.31 (0.23–0.40)No 1,286 50.1 7.25 (6.45–8.04) 4.00 0.50 (0.36–0.63)Toothbrushing frequencylast week
P = 0.254c P = 0.983c
≥14 1,703 55.6 6.27 (5.71–6.82) 4.00 0.40 (0.31–0.50)<14 1,038 44.4 6.90 (5.92–7.89) 4.00 0.40 (0.26–0.54)Smoking P = 0.049c P = 0.133c
Never smoker 1,552 59.9 6.21 (5.59–6.84) 4.00 0.38 (0.27–0.50)Former smoker 825 26.0 6.64 (5.44–7.84) 4.00 0.32 (0.19–0.45)Current smoker 373 14.1 7.83 (6.47–9.19) 5.00 0.64 (0.44–0.84)Alcohol consumption P = 0.060c P = 0.187c
No 458 16.8 7.67 (6.42–8.92) 4.00 0.53 (0.31–0.74)Yes 2,235 83.2 6.37 (5.75–6.99) 4.00 0.38 (0.29–0.47)
Dental diseasesNo. of teeth with coronalcaries
P < 0.001c P < 0.001c
0 2,188 77.2 5.71 (5.23–6.19) 4.00 0.31 (0.24–0.38)1 302 10.9 8.75 (7.01–10.50) 6.00 0.54 (0.31–0.76)2+ 260 11.9 9.99(7.58–12.40) 7.00 0.86 (0.43–1.29)No. of teeth with root caries P < 0.001c P = 0.017c
0 2,586 95.8 6.40 (5.85–6.95) 4.00 0.39 (0.31–0.47)1 108 3.0 9.13 (6.91–11.35) 6.00 0.70 (0.26–1.13)2+ 56 1.2 12.30 (8.33–16.28) 11.0 0.86 (0.33–1.39)
4
Tan et al.

proportions of well-educated people, short-term
dental visiting, never smokers, alcohol drinkers,
root caries free and without periodontal disease.
Only 11.4% and 2.5% of the sample had short den-
tal arches according to dentition status 1 and 2 clas-
sifications, respectively. Overall, the medians of
OHIP-14 severity and extent were 4 and 0, respec-
tively. Females, the poorest, those with ≤year 10
education, those who visited a dentist for problem,
who reported difficulty in paying $100 dental bill,
nondental insured people, who had dental diseases
and with fewer number of OUs, had higher values
of both OHIP-14 severity and extent.
Participants who presented between three to five
OUs (dentition status 1) and no prosthesis showed
a 50% higher rate of OHIP-14 severity than those
with over five OUs and no prosthesis, after adjust-
ment for potential confounders. However, when
SDA was classified adopting four OUs and no den-
tal prosthesis as a cut-off point, no statistical differ-
ence in OHIP-14 severity was identified compared
with those with over four OUs and no dental pros-
thesis (Table 2).
Participants with 3–5 OUs (dentition status 1)
and no prosthesis had a higher OHIP-14 extent
than that reference group, but their difference lost
its statistical significance when dental diseases
were included in the multivariable model. Those
with four OUs and no dental prosthesis had similar
values of OHIP-14 extent to the reference group in
the final adjusted model (Table 3).
Appendices display step by step negative bino-
mial multivariable regression modelling for OHIP-
14 severity and extent.
Discussion
Our study showed that participants with intact
anterior teeth and four OUs with no prosthesis
showed no difference in quality of life according to
OHIP-14 severity and extent to those with more
natural teeth after controlling for potential con-
founders. When SDA is defined as four OUs and
no dental prosthesis, the null hypothesis that peo-
ple with SDA have no worse OHRQoL than those
Table 1 Continued
n %a
OHIP-14 severityOHIP-14 extentb
Meana (95% CI) Mediana Meana (95% CI)
Periodontal disease P = 0.001c P = 0.003c
No 1,921 83.2 6.24 (5.67–6.82) 4.00 0.35 (0.26–0.43)Moderate periodontal disease 546 15.5 7.91 (6.58–9.24) 5.00 0.60 (0.38–0.81)Severe periodontal disease 61 1.3 10.10 (7.33–12.87) 8.00 0.86 (0.42–1.29)
Dentition status 1 P < 0.001c P = 0.026c
>5 occlusal units and noprosthesis
1,758 74.5 6.01 (5.42–6.59) 4.00 0.36 (0.26–0.45)
>5 natural occlusal unitswith prosthesis
76 2.1 5.02 (3.37–6.68) 3.00 0.31 (0.06–0.56)
3–5 occlusal units and noprosthesis (SDA)
382 11.4 8.36 (6.68–10.03) 5.00 0.47 (0.24–0.69)
<3 occlusal units and noprosthesis
442 10.4 8.37 (7.24–9.49) 6.00 0.63 (0.42–0.84)
≤5 natural occlusal unitswith prosthesis
92 1.6 9.29 (6.32–12.26) 6.00 0.73 (0.11–1.36)
Dentition status 2 P = 0.086c P = 0.047c
>4 occlusal units and noprosthesis
2,277 89.4 6.40 (5.82–7.00) 4.00 0.38 (0.29–0.46)
>4 natural occlusal unitswith prosthesis
85 2.2 5.15 (3.53–6.77) 3.00 0.35 (0.09–0.60)
4 occlusal units and noprosthesis (SDA)
103 2.5 6.66 (5.00–8.32) 4.00 0.33 (0.11–0.54)
<4 occlusal units and noprosthesis
202 4.4 9.34 (7.34–11.33) 7.00 0.87 (0.47–1.28)
≤4 natural occlusal unitswith prosthesis
83 1.4 9.55 (6.34–12.75) 6.00 0.73 (0.05–1.40)
aWeighted data.bThe median of OHIP-14 extent by explanatory variables = 0.cP-values from negative binomial regression on weighted data.
5
Shortened dental arches and quality of life

with more natural teeth was supported. After con-
trolling for potential confounders, people with 3–5OUs with no prosthesis showed no difference in
OHIP-14 extent compared with those with more
natural teeth but higher OHIP-14 severity than the
latter, indicating worse quality of life.
To our knowledge, the present study is the
first population-based study testing whether peo-
ple with SDA have worse OHRQoL. Only one
study testing the relationship between patterns
of missing OUs and OHRQoL among SDA
patients in a clinic setting showed a dose–response relationship – the OHIP scale score had
a tendency to increase with increasing numbers
of missing OUs (12). Another study showed that
patients restored to a SDA using resin-bonded
bridgework showed improvement in OHRQoL
after the treatment (13). However, in both stud-
ies, OHRQoL among SDA patients was not com-
pared to people with more teeth and the sample
size was small.
The key strength of the study is that data are
from a national oral health survey with a large and
representative sample of the Australian popula-
tion. Furthermore, the dental examination followed
international standards and presented high exam-
iner reliability values (14). There was probably no
observer bias because examiners and interviewers
did not know the study hypothesis. There is varia-
tion in analysing OHIP-14, that is, using mean (20)
or median (13). In this study, as data on the OHIP-
14 severity and extent did not show a normal dis-
tribution and sample variance exceeds the sample
mean, negative binomial regression was adopted
as an appropriate method for multivariable analy-
ses. We developed models conservatively, that is,
as dental diseases might be on the causal pathway
of SDA and QoL, model 4 included dental diseases
and model 3. However, we found that there was
no considerable difference in parameters between
models 3 and 4.
This study is not free of limitations. For example,
a secondary analysis of data from the 2004–2006Australian NSAOH was performed. Although the
data were collected around 7 years ago, this
national oral health survey was the most recent
Table 2. Association between OHIP-14 severity and dentition status by negative binomial multivariable analyses
Unadjusted countratioa (95% CI) Model 1 Model 2 Model 3 Model 4
Dentition status 1>5 occlusal units and noprosthesis
Ref. Ref. Ref. Ref. Ref.
>5 natural occlusal unitswith prosthesis
0.84 (0.60–1.17) 1.03 (0.74–1.42) 0.99 (0.71–1.37) 0.98 (0.69–1.39) 0.98 (0.67–1.44)
3–5 occlusal units and noprosthesis (SDA)
1.39 (1.12–1.73) 1.62 (1.32–1.98) 1.58 (1.26–1.97) 1.50 (1.22–1.84) 1.50 (1.21–1.87)
<3 occlusal units and noprosthesis
1.39 (1.19–1.63) 1.70 (1.47–1.97) 1.62 (1.37–1.91) 1.52 (1.28–1.82) 1.42 (1.20–1.68)
≤5 natural occlusal unitswith prosthesis
1.55 (1.11–2.15) 2.03 (1.55–2.65) 2.04 (1.52–2.75) 1.88 (1.48–2.38) 1.88 (1.45–2.44)
Dentition status 2>4 occlusal units and noprosthesis
Ref. Ref. Ref. Ref. Ref.
>4 natural occlusal unitswith prosthesis
0.81 (0.58–1.11) 0.90 (0.66–1.23) 0.86 (0.63–1.17) 0.88 (0.63–1.22) 0.88 (0.62–1.26)
4 occlusal units and noprosthesis (SDA)
1.04 (0.81–1.34) 1.20 (0.95–1.51) 1.22 (0.95–1.56) 1.06 (0.80–1.41) 1.06 (0.78–1.43)
<4 occlusal units and noprosthesis
1.46 (1.16–1.83) 1.68 (1.37–2.05) 1.54 (1.26–1.89) 1.49 (1.18–1.90) 1.28 (1.00–1.65)
≤4 natural occlusal unitswith prosthesis
1.49 (1.06–2.11) 1.79 (1.35–2.39) 1.83 (1.33–2.52) 1.68 (1.31–2.15) 1.68 (1.28–2.22)
Negative binominal regression (those with P > 0.20 in the unadjusted or adjusted analysis are not included in the multi-variable model).Model 1: adjusted for demographic variables (age and sex).Model 2: adjusted for model 1+ socioeconomic variables (yearly household income and education).Model 3: adjusted for model 2+ behaviour characteristics (reason for last visit and difficulty in paying $100 dental bill).Model 4: adjusted for model 3+ dental outcomes (coronal caries, root caries and periodontal disease).aCount ratio reflects change in the ratio of OHIP-14 severity for a unit change in the corresponding ‘Dentition Status’groups.
6
Tan et al.

one in Australia. The response rates for telephonic
interview and oral epidemiology examinations
were about 50%, and it was unknown about the
difference in the oral health status and self-
reported information between the participants and
nonrespondents.
There are two definitions of SDA in the literature.
By November 2013, by searching for the citations
via ‘Web of Knowledge’ (apps.webofknowl-
edge.com), we found that the original definition of
SDA as having intact anterior teeth and 3–5 natural
OUs (18) has been cited by 71 papers, while the
recent definition of SDA as having intact anterior
teeth and four natural OUs (19) has been cited by
56 papers. The latter one seemed to be more com-
monly adopted recently. We still conservatively
adopted two definitions of SDA and found that
people with four OUs have equivalent OHRQoL to
those with more natural teeth, while the result was
not consistent when 3–5 OUs were used as a cut-off
point for SDA. Thus, we supported that a SDA with
four OUs was the criteria for maintaining a good
OHRQoL.
In the 2004–2006 Australian NSAOH, 14.9% of
adult population wear dentures and there was a
threefold relative difference in the frequency of
denture wearing among people eligible for public
dental care (30.1%) compared with ineligible peo-
ple (10.4%), which might be attributed to the sub-
sidy of denture treatments by the dental public
health system (14). Considering the high impact of
denture treatments on the health system, especially
within the public sector, it is necessary to consider
a threshold for indication towards denture treat-
ment to fairly allocate resources and potentially
improve OHRQoL for the population.
The existing literature indicates that the progno-
sis of free-end saddle removable partial dentures
may not be predictable and may even be problem-
atic, and its contribution to oral functions in
patients with SDA is considered to be dubious (22).
The current population-based study finding has
important implications for oral health care at a
population level. Given the evidence that the OHR-
QoL among people with four OUs is not inferior to
that of people with more natural teeth, the treat-
Table 3. Association between OHIP-14 extent and dentition status by negative binomial multivariable analyses
Unadjusted countratioa (95% CI) Model 1 Model 2 Model 3 Model 4
Dentition status 1>5 occlusal units andno prosthesis
Ref. Ref. Ref. Ref. Ref.
>5 natural occlusalunits with prosthesis
0.88 (0.38–2.04) 1.57 (0.70–3.51) 1.48 (0.59–3.70) 1.19 (0.43–3.25) 1.10 (0.30–4.10)
3–5 occlusal units andno prosthesis (SDA)
1.31 (0.76–2.24) 2.25 (1.28–3.96) 2.09 (1.25–3.50) 1.97 (1.13–3.43) 1.63 (0.86–3.08)
<3 occlusal units andno prosthesis
1.76 (1.15–2.70) 3.47 (2.27–5.31) 3.18 (1.99–5.07) 3.13 (1.80–5.42) 2.91 (1.65–5.14)
≤5 natural occlusalunits with prosthesis
2.06 (0.84–5.06) 3.89 (1.96–7.72) 4.68 (2.13–10.23) 3.96 (1.95–8.04) 5.09 (2.43–10.66)
Dentition status 2>4 occlusal units andno prosthesis
Ref. Ref. Ref. Ref. Ref.
>4 natural occlusalunits with prosthesis
0.92 (0.43–1.99) 1.16 (0.55–2.44) 1.20 (0.53–2.70) 1.05 (0.44–2.53) 1.14 (0.39–3.28)
4 occlusal units andno prosthesis (SDA)
0.86 (0.42–1.76) 1.26 (0.64–2.45) 1.87 (0.80–4.38) 1.25 (0.43–3.59) 1.69 (0.59–4.87)
<4 occlusal units andno prosthesis
2.31 (1.40–3.85) 3.58 (2.18–5.89) 3.63 (2.17–6.06) 4.03 (2.13–7.63) 3.68 (1.89–7.15)
≤4 natural occlusalunits with prosthesis
1.92 (0.73–5.04) 2.84 (1.39–5.81) 3.87 (1.72–8.67) 3.24 (1.59–6.61) 4.58 (2.13–9.83)
Negative binominal regression (those with P > 0.20 in the unadjusted or adjusted analysis are not included in the multi-variable model).Model 1: adjusted for demographic variables (age and sex).Model 2: adjusted for model 1+ socioeconomic variables (yearly household income and education).Model 3: adjusted for model 2+ behaviour characteristics (reason for last visit, difficulty in paying $100 dental bill,insured or not and smoking status).Model 4: adjusted for model 3+ dental outcomes (coronal caries and periodontal disease).aCount ratio reflects change in the ratio of OHIP-14 extent for a unit change in the corresponding ‘Dentition Status’groups.
7
Shortened dental arches and quality of life

ment goals should be changed from the preserva-
tion of complete dental arches towards the preser-
vation of a reduced natural, functional dentition
such as SDA. Accordingly, the complex treatment
plan involving removable prosthodontic treatment
should move towards preventive and restorative
treatments concentrating on the functionally strate-
gic and sustainable parts of the existing dentition
to maintain a SDA. The latter also has the advanta-
ges of being less time-consuming and less expen-
sive (18).
Although there were only 2.5% of people with
four OUs in this study, the sample size was big
enough for comparison of OHIP-14 among differ-
ent dentition groups. The study findings are appli-
cable for, for example, around 434 092 people aged
≥15 [about 2.5% of the 17 363 689 Australian popu-
lation aged ≥15 (23)], which indicates maintaining
a SDA, with the adoption of the definition as four
OUs and no prosthesis, should be considered as an
important oral healthcare policy, especially in the
public health system.
To conclude, people with SDA (when it is
defined as four OUs and no dental prosthesis) have
no worse OHRQoL compared with those with
more natural teeth, according to OHIP-14 severity
and extent.
AcknowledgementsThe NSAOH was supported by the Australian Govern-ment Health Agencies, including NHMRC Grants#299060, #349514 and #349537. Colgate Oral Care pro-vided gifts for participants. The authors gratefullyacknowledge the chief investigators of the survey, ARC-POH staff and the dental team for data collection andexpress thanks to all participants. The authors declare nopotential conflict of interest with respect to the author-ship and/or publication of this article.
Reference1. Brennan DS, Spencer AJ, Roberts-Thomson KF.
Tooth loss, chewing ability and quality of life. QualLife Res 2008;17:227–35.
2. Carr AB, McGivney GP, Brown DT. McCracken’sremovable partial prosthodontics, 11th edn. St.Louis, Missouri: Mosby Inc.; 2005: 5–6.
3. Gilbert GH, Meng X, Duncan RP, Shelton BJ. Inci-dence of tooth loss and prosthodontic dental care:effect on chewing difficulty onset, a component oforal health-related quality of life. J Am Geriatr Soc2004;52:880–5.
4. John MT, Koepsell TD, Hujoel P, Miglioretti DL,LeResche L, Micheelis W. Demographic factors, den-
ture status and oral health-related quality of life.Community Dent Oral Epidemiol 2004;32:125–32.
5. Tsakos G, Marcenes W, Sheiham A. The relationshipbetween clinical dental status and oral impacts in anelderly population. Oral Health Prev Dent 2004;2:211–20.
6. Wong MC, McMillan AS. Tooth loss, denture wear-ing and oral health-related quality of life in elderlyChinese people. Community Dent Health 2005;22:156–61.
7. Pallegedara C, Ekanayake L. Effect of tooth loss anddenture status on oral health-related quality of life ofolder individuals from Sri Lanka. Community DentHealth 2008;25:196–200.
8. Sheiham A. Public health aspects of periodontal dis-eases in Europe. J Clin Periodontol 1991;18:362–9.
9. Ramfjord SP, Ash MM. Occlusion, 4th edn. Philadel-phia: WB Saunders, 1995; 83–5.
10. Ellas AC, Sheiham A. The relationship between satis-faction with mouth and number, position and condi-tion of teeth: studies in Brazilian adults. J OralRehabil 1999;26:53–71.
11. Kayser AF. Shortened dental arches and oral func-tion. J Oral Rehabil 1981;8:457–62.
12. Baba K, Igarashi Y, Nishiyama A, John MT, Akaga-wa Y, Ikebe K et al. Patterns of missing occlusalunits and oral health-related quality of life in SDApatients. J Oral Rehabil 2008;35:621–8.
13. McKenna G, Allen F, Woods N, O’Mahony D, Cro-nin M, Damata C et al. Cost-effectiveness of toothreplacement strategies for partially dentate elderly: arandomized controlled clinical trial. CommunityDent Oral Epidemiol. 2014;42:366–74. doi: 10.1111/cdoe.12085.
14. Slade GD, Spencer AJ, Roberts-Thomson KF. Austra-lia’s dental generations: the National Survey ofAdult Oral Health 2004–06. Canberra: AustralianInstitute of Health and Welfare, 2007; AIHW cat. no.DEN 165.
15. von Elm E, Altman DG, Egger M, Pocock SJ,Gøtzsche PC, Vandenbroucke JP. The Strengthen-ing the Reporting of Observational Studies in Epi-demiology (STROBE) statement: guidelines forreporting observational studies. Epidemiology 2007;18:800–4.
16. Page RC, Eke PI. Case definitions for use in popula-tion-based surveillance of periodontitis. J Periodon-tol 2007;78(7 Suppl.):1387–99.
17. Slade GD. Derivation and validation of a short-formoral health impact profile. Community Dent Oral Ep-idemiol 1997;25:284–90.
18. Witter DJ, van Palenstein Helderman WH, CreugersNH, K€ayser AF. The shortened dental arch conceptand its implications for oral health care. CommunityDent Oral Epidemiol 1999;27:249–58.
19. Kanno T, Carlsson GE. A review of the shortened den-tal arch concept focusing on the work by the K€ayser/Nijmegen group. J Oral Rehabil 2006;33:850–62.
20. Slade GD, Nuttall N, Sanders AE, Steele JG, AllenPF, Lahti S. Impacts of oral disorders in the Uni-ted Kingdom and Australia. Br Dent J 2005;198:489–93.
21. Sabbah W, Watt RG, Sheiham A, Tsakos G. The roleof cognitive ability in socio-economic inequalities inoral health. J Dent Res 2009;88:351–5.
8
Tan et al.

22. Nassani MZ, Tarakji B, Baroudi K, Sakka S. Reap-praisal of the removable partial denture as a treat-ment option for the shortened dental arch. Eur JDent 2013;7:251–6.
23. Australian Bureau Statistics Census, 2011; www.abs.gov.au.
Table A1. Association between OHIP-14 severity and dentition status 1 by negative binomial multivariable analyses
Unadjusted countratioa (95% CI) Model 1 Model 2 Model 3 Model 4
Dentition status 1>5 occlusal unitsand no prosthesis
Ref. Ref. Ref. Ref. Ref.
>5 natural occlusalunits with prosthesis
0.84 (0.60–1.17) 1.03 (0.74–1.42) 0.99 (0.71–1.37) 0.98 (0.69–1.39) 0.98 (0.67–1.44)
3–5 occlusal units andno prosthesis (SDA)
1.39 (1.12–1.73) 1.62 (1.32–1.98) 1.58 (1.26–1.97) 1.50 (1.22–1.84) 1.50 (1.21–1.87)
<3 occlusal units andno prosthesis
1.39 (1.19–1.63) 1.70 (1.47–1.97) 1.62 (1.37–1.91) 1.52 (1.28–1.82) 1.42 (1.20–1.68)
≤5 natural occlusalunits with prosthesis
1.55 (1.11–2.15) 2.03 (1.55–2.65) 2.04 (1.52–2.75) 1.88 (1.48–2.38) 1.88 (1.45–2.44)
Demographic variablesAge group15–24 Ref. Ref. Ref. Ref. Ref.25–34 0.90 (0.67–1.22) 0.87 (0.65–1.16) 0.83 (0.59–1.14) 0.83 (0.62–1.10) 0.83 (0.62–1.11)35–44 0.95 (0.73–1.23) 0.87 (0.67–1.13) 0.84 (0.61–1.15) 0.87 (0.66–1.14) 0.86 (0.65–1.13)45–54 1.05 (0.81–1.36) 0.89 (0.69–1.15) 0.87 (0.64–1.18) 0.97 (0.75–1.25) 0.94 (0.72–1.22)55+ 0.76 (0.59–0.97) 0.58 (0.45–0.75) 0.53 (0.39–0.72) 0.67 (0.51–0.87) 0.68 (0.51–0.91)SexMale Ref. Ref. Ref. Ref. Ref.Female 1.25 (1.07–1.46) 1.29 (1.11–1.51) 1.20 (1.03–1.39) 1.12 (0.98–1.29) 1.12 (0.97–1.29)
SESYearly household income$80k+ Ref. Ref. Ref. Ref.$40–<80k 1.15 (0.95–1.40) 1.11 (0.94–1.31) 1.06 (0.90–1.24) 1.03 (0.88–1.22)<$40k 1.51 (1.20–1.92) 1.48 (1.20–1.84) 1.08 (0.88–1.33) 1.07 (0.87–1.32)EducationYear 13 or higher Ref. Ref. Ref. Ref.Year 11 or 12 1.14 (0.95–1.37) 1.11 (0.95–1.31) 1.05 (0.89–1.24) 1.07 (0.91–1.25)≤Year 10 1.22 (0.96–1.54) 1.18 (0.93–1.50) 1.04 (0.81–1.33) 1.00 (0.77–1.31)
Behaviour and visitTime since last visit≤12 months Ref.1–<2 years 1.03 (0.83–1.28)≥2 years 0.99 (0.80–1.23)Reason for last visitCheck-up Ref. Ref. Ref.Problem 1.78 (1.54–2.07) 1.68 (1.44–1.95) 1.54 (1.32–1.79)Difficulty in paying $100 dental billNo Ref. Ref. Ref.Hardly any/a little 1.45 (1.22–1.72) 1.35 (1.15–1.58) 1.35 (1.14–1.59)A lot of difficulty 2.19 (1.81–2.64) 1.77 (1.40–2.23) 1.74 (1.37–2.21)InsuredYes Ref.No 1.21 (1.04–1.41)Toothbrushing frequency last week≥14 Ref.<14 1.10 (0.93–1.30)SmokingNever smoker Ref.Former smoker 1.07 (0.88–1.30)Current smoker 1.26 (1.02–1.56)
Appendices
Shortened dental arches and quality of life
9

Table A1 Continued
Unadjusted countratioa (95% CI) Model 1 Model 2 Model 3 Model 4
Alcohol drinkingNo Ref.Yes 0.83 (0.69–1.01)
Dental diseasesNo. of teeth withcoronal caries0 Ref. Ref.1 1.53 (1.24–1.89) 1.23 (0.99–1.50)2+ 1.75 (1.35–2.27) 1.31 (0.99–1.72)No. of teeth with root caries0 Ref. Ref.1 1.43 (1.11–1.84) 1.29 (0.99–1.67)2+ 1.92 (1.38–2.68) 0.99 (0.66–1.50)Periodontal diseaseNo Ref. Ref.Moderate-severedisease
1.27 (1.06–1.51) 1.19 (0.99–1.41)
Severe periodontaldisease
1.62 (1.20–2.18) 1.28 (0.98–1.69)
Negative binominal regression (Those with P > 0.20 in the unadjusted or adjusted analysis are not included in the multi-variable model).Model 1: adjusted for age and sex.Model 2: adjusted for model 1 +model 2 (yearly household income and education).Model 3: adjusted for model 1 +model 2 SES +model 3 (reason for last visit and difficulty in paying $100 dental bill).Model 4: adjusted for model 1 +model 2 +model 3 +model 4 (coronal caries, root caries and periodontal disease).aCount ratio reflects change in the ratio of OHIP-14 severity for a unit change in the corresponding “Dentition Status”groups.
Table A2. Association between OHIP-14 severity and dentition status 2 by negative binomial multivariable analyses
Unadjusted countratioa (95% CI) Model 1 Model 2 Model 3 Model 4
Dentition status 2>4 occlusal units andno prosthesis
Ref. Ref. Ref. Ref. Ref.
>4 natural occlusalunits with prosthesis
0.81 (0.58–1.11) 0.90 (0.66–1.23) 0.86 (0.63–1.17) 0.88 (0.63–1.22) 0.88 (0.62–1.26)
4 occlusal units andno prosthesis (SDA)
1.04 (0.81–1.34) 1.20 (0.95–1.51) 1.22 (0.95–1.56) 1.06 (0.80–1.41) 1.06 (0.78–1.43)
<4 occlusal units andno prosthesis
1.46 (1.16–1.83) 1.68 (1.37–2.05) 1.54 (1.26–1.89) 1.49 (1.18–1.90) 1.28 (1.00–1.65)
≤4 natural occlusalunits with prosthesis
1.49 (1.06–2.11) 1.79 (1.35–2.39) 1.83 (1.33–2.52) 1.68 (1.31–2.15) 1.68 (1.28–2.22)
Demographic variablesAge group15–24 Ref. Ref. Ref. Ref. Ref.25–34 0.90 (0.67–1.22) 0.91 (0.67–1.23) 0.86 (0.61–1.22) 0.84 (0.62–1.14) 0.83 (0.61–1.14)35–44 0.95 (0.73–1.23) 0.95 (0.73–1.24) 0.90 (0.66–1.23) 0.91 (0.69–1.20) 0.88 (0.65–1.17)45–54 1.05 (0.81–1.36) 0.98 (0.76–1.26) 0.95 (0.70–1.28) 1.03 (0.80–1.34) 0.99 (0.75–1.31)55+ 0.76 (0.59–0.97) 0.67 (0.52–0.86) 0.59 (0.44–0.80) 0.74 (0.56–0.98) 0.73 (0.54–1.00)SexMale Ref. Ref. Ref. Ref. Ref.Female 1.25 (1.07–1.46) 1.25 (1.06–1.46) 1.15 (0.98–1.35) 1.09 (0.94–1.25) 1.09 (0.93–1.27)
10
Tan et al.

Table A2 Continued
Unadjusted countratioa (95% CI) Model 1 Model 2 Model 3 Model 4
SESYearly household income$80k+ Ref. Ref. Ref. Ref.$40–<80k 1.15 (0.95–1.40) 1.13 (0.94–1.36) 1.09 (0.92–1.29) 1.06 (0.88–1.26)<$40k 1.51 (1.20–1.92) 1.49 (1.19–1.86) 1.10 (0.88–1.37) 1.09 (0.87–1.36)EducationYear 13 or higher Ref. Ref. Ref. Ref.Year 11 or 12 1.14 (0.95–1.37) 1.14 (0.97–1.34) 1.07 (0.91–1.25) 1.09 (0.93–1.26)≤Year 10 1.22 (0.96–1.54) 1.30 (0.98–1.73) 1.12 (0.84–1.49) 1.08 (0.80–1.47)
Behaviour and visitTime since last visit≤12 months Ref.1–<2 years 1.03 (0.83–1.28)≥2 years 0.99 (0.80–1.23)Reason for last visitCheck-up Ref. Ref. Ref.Problem 1.78 (1.54–2.07) 1.72 (1.48–2.01) 1.56 (1.34–1.81)Difficulty in paying $100 dental billNo Ref. Ref. Ref.Hardly any/a little 1.45 (1.22–1.72) 1.36 (1.14–1.62) 1.36 (1.14–1.62)A lot of difficulty 2.19 (1.81–2.64) 1.72 (1.36–2.18) 1.70 (1.33–2.16)InsuredYes Ref.No 1.21 (1.04–1.41)Toothbrushing frequency last week≥14 Ref.<14 1.10 (0.93–1.30)SmokingNever smoker Ref.Former smoker 1.07 (0.88–1.30)Current smoker 1.26 (1.02–1.56)Alcohol drinkingNo Ref.Yes 0.83 (0.69–1.01)
Dental diseasesNo. of teeth with coronal caries0 Ref. Ref.1 1.53 (1.24–1.89) 1.26 (0.99–1.59)2+ 1.75 (1.35–2.27) 1.30 (0.98–1.72)No. of teeth with root caries0 Ref. Ref.1 1.43 (1.11–1.84) 1.32 (1.02–1.70)2+ 1.92 (1.38–2.68) 1.06 (0.69–1.64)Periodontal diseaseNo Ref. Ref.Moderate-severe disease 1.27 (1.06–1.51) 1.24 (1.03–1.50)Severe periodontal disease 1.62 (1.20–2.18) 1.33 (1.00–1.76)
Negative binominal regression (Those with P > 0.20 in the unadjusted or adjusted analysis are not included in themultivariable model).Model 1: adjusted for age and sex.Model 2: adjusted for model 1 +model 2 (yearly household income and education).Model 3: adjusted for model 1 +model 2 SES +model 3 (reason for last visit and difficulty in paying $100 dental bill).Model 4: adjusted for model 1 +model 2 +model 3 +model 4 (coronal caries, root caries and periodontal disease).aCount ratio reflects change in the ratio of OHIP-14 severity for a unit change in the corresponding “Dentition Status”groups.
11
Shortened dental arches and quality of life

Table A3. Association between OHIP-14 extent and dentition status 1 by negative binomial multivariable analyses
Unadjusted countratioa (95% CI) Model 1 Model 2 Model 3 Model 4
Dentition status 1>5 occlusal units andno prosthesis
Ref. Ref. Ref. Ref. Ref.
>5 natural occlusalunits with prosthesis
0.88 (0.38–2.04) 1.57 (0.70–3.51) 1.48 (0.59–3.70) 1.19 (0.43–3.25) 1.10 (0.30–4.10)
3–5 occlusal units andno prosthesis (SDA)
1.31 (0.76–2.24) 2.25 (1.28–3.96) 2.09 (1.25–3.50) 1.97 (1.13–3.43) 1.63 (0.86–3.08)
<3 occlusal units andno prosthesis
1.76 (1.15–2.70) 3.47 (2.27–5.31) 3.18 (1.99–5.07) 3.13 (1.80–5.42) 2.91 (1.65–5.14)
≤5 natural occlusalunits with prosthesis
2.06 (0.84–5.06) 3.89 (1.96–7.72) 4.68 (2.13–10.23) 3.96 (1.95–8.04) 5.09 (2.43–10.66)
Demographic variablesAge group15–24 Ref. Ref. Ref. Ref. Ref.25–34 0.97 (0.48–1.98) 0.90 (0.40–1.99) 0.61 (0.29–1.31) 0.66 (0.34–1.30) 0.66 (0.33–1.29)35–44 0.95 (0.49–1.86) 0.74 (0.35–1.58) 0.71 (0.34–1.47) 0.76 (0.40–1.47) 0.67 (0.34–1.34)45–54 1.13 (0.58–2.21) 0.76 (0.34–1.73) 0.63 (0.29–1.39) 0.76 (0.37–1.58) 0.65 (0.30–1.37)55+ 0.53 (0.28–1.00) 0.24 (0.12–0.51) 0.15 (0.07–0.33) 0.22 (0.11–0.46) 0.20 (0.09–0.45)SexMale Ref. Ref. Ref. Ref. Ref.Female 2.02 (1.24–3.27) 2.28 (0.39–3.72) 2.44 (1.63–3.65) 2.20 (1.50–3.23) 2.11 (1.41–3.16)
SESYearly household income$80k+ Ref. Ref. Ref. Ref.$40–<80k 1.08 (0.62–1.87) 0.96 (0.62–1.50) 0.97 (0.61–1.54) 0.82 (0.50–1.35)<$40k 2.35 (1.33–4.16) 2.35 (1.37–4.05) 1.35 (0.82–2.23) 1.29 (0.76–2.21)EducationYear 13 or higher Ref. Ref. Ref. Ref.Year 11 or 12 1.39 (0.87–2.21) 1.61 (1.06–2.45) 1.35 (0.88–2.07) 1.39 (0.90–2.13)≤Year 10 1.72 (1.03–2.89) 2.46 (1.44–4.21) 2.03 (1.12–3.69) 1.86 (0.96–3.60)
Behaviour and visitTime since last visit≤12 months Ref.1–<2 years 1.21 (0.67–2.19)≥2 years 1.01 (0.61–1.67)Reason for last visitCheck-up Ref. Ref. Ref.Problem 3.13 (2.16–4.54) 2.24 (1.51–3.32) 2.01 (1.37–2.94)Difficulty in paying $100 dental billNo Ref. Ref. Ref.Hardly any/a little 1.76 (1.18–2.62) 1.53 (1.05–2.22) 1.55 (1.04–2.31)A lot of difficulty 5.25 (3.34–8.25) 3.60 (2.06–6.29) 3.22 (1.84–5.65)InsuredYes Ref. Ref. Ref.No 1.58 (1.07–2.35) 0.75 (0.51–1.09) 0.79 (0.52–1.21)Toothbrushing frequency last week≥14 Ref.<14 1.00 (0.64–1.55)SmokingNever smoker Ref. Ref. Ref.Former smoker 0.83 (0.50–1.39) 1.13 (0.72–1.76) 1.08 (0.67–1.74)Current smoker 1.66 (1.07–2.57) 1.37 (0.86–2.18) 1.32 (0.83–2.10)Alcohol drinkingNo Ref.Yes 0.73 (0.45–1.17)
Dental diseasesNo. of teeth with coronal caries0 Ref. Ref.1 1.71 (1.06–2.77) 1.13 (0.70–1.84)2+ 2.75 (1.58–4.79) 1.65 (0.96–2.85)
12
Tan et al.
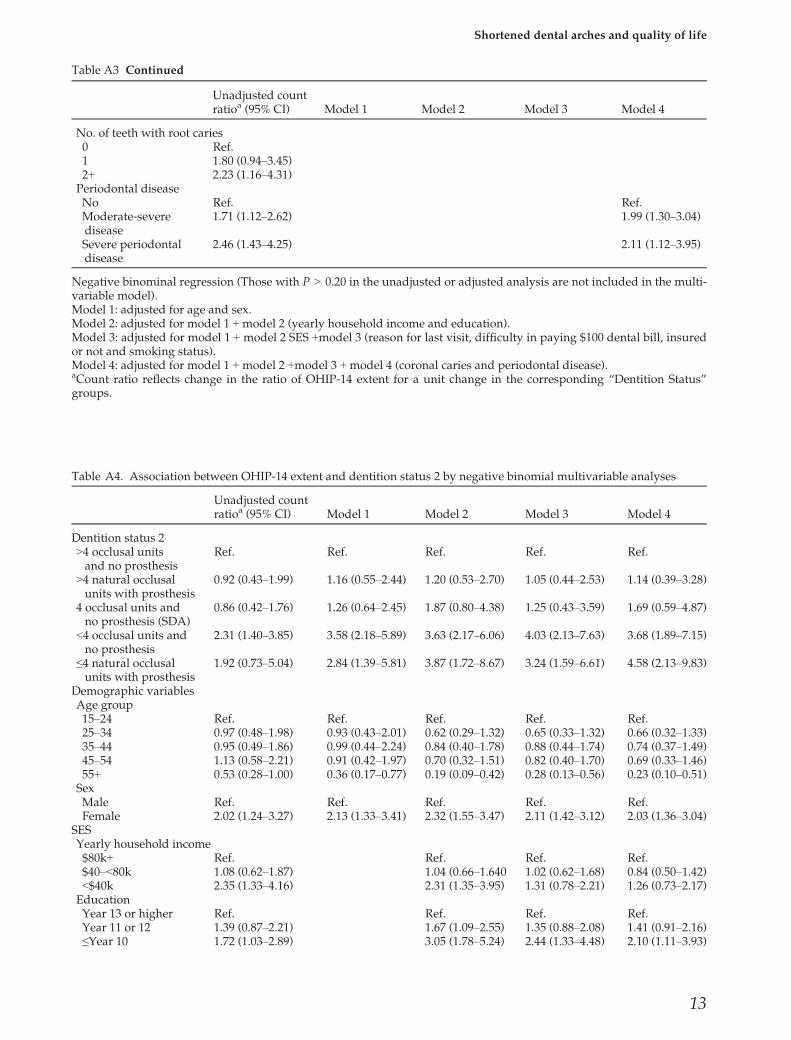
Table A3 Continued
Unadjusted countratioa (95% CI) Model 1 Model 2 Model 3 Model 4
No. of teeth with root caries0 Ref.1 1.80 (0.94–3.45)2+ 2.23 (1.16–4.31)Periodontal diseaseNo Ref. Ref.Moderate-severedisease
1.71 (1.12–2.62) 1.99 (1.30–3.04)
Severe periodontaldisease
2.46 (1.43–4.25) 2.11 (1.12–3.95)
Negative binominal regression (Those with P > 0.20 in the unadjusted or adjusted analysis are not included in the multi-variable model).Model 1: adjusted for age and sex.Model 2: adjusted for model 1 +model 2 (yearly household income and education).Model 3: adjusted for model 1 + model 2 SES +model 3 (reason for last visit, difficulty in paying $100 dental bill, insuredor not and smoking status).Model 4: adjusted for model 1 +model 2 +model 3 +model 4 (coronal caries and periodontal disease).aCount ratio reflects change in the ratio of OHIP-14 extent for a unit change in the corresponding “Dentition Status”groups.
Table A4. Association between OHIP-14 extent and dentition status 2 by negative binomial multivariable analyses
Unadjusted countratioa (95% CI) Model 1 Model 2 Model 3 Model 4
Dentition status 2>4 occlusal unitsand no prosthesis
Ref. Ref. Ref. Ref. Ref.
>4 natural occlusalunits with prosthesis
0.92 (0.43–1.99) 1.16 (0.55–2.44) 1.20 (0.53–2.70) 1.05 (0.44–2.53) 1.14 (0.39–3.28)
4 occlusal units andno prosthesis (SDA)
0.86 (0.42–1.76) 1.26 (0.64–2.45) 1.87 (0.80–4.38) 1.25 (0.43–3.59) 1.69 (0.59–4.87)
<4 occlusal units andno prosthesis
2.31 (1.40–3.85) 3.58 (2.18–5.89) 3.63 (2.17–6.06) 4.03 (2.13–7.63) 3.68 (1.89–7.15)
≤4 natural occlusalunits with prosthesis
1.92 (0.73–5.04) 2.84 (1.39–5.81) 3.87 (1.72–8.67) 3.24 (1.59–6.61) 4.58 (2.13–9.83)
Demographic variablesAge group15–24 Ref. Ref. Ref. Ref. Ref.25–34 0.97 (0.48–1.98) 0.93 (0.43–2.01) 0.62 (0.29–1.32) 0.65 (0.33–1.32) 0.66 (0.32–1.33)35–44 0.95 (0.49–1.86) 0.99 (0.44–2.24) 0.84 (0.40–1.78) 0.88 (0.44–1.74) 0.74 (0.37–1.49)45–54 1.13 (0.58–2.21) 0.91 (0.42–1.97) 0.70 (0.32–1.51) 0.82 (0.40–1.70) 0.69 (0.33–1.46)55+ 0.53 (0.28–1.00) 0.36 (0.17–0.77) 0.19 (0.09–0.42) 0.28 (0.13–0.56) 0.23 (0.10–0.51)SexMale Ref. Ref. Ref. Ref. Ref.Female 2.02 (1.24–3.27) 2.13 (1.33–3.41) 2.32 (1.55–3.47) 2.11 (1.42–3.12) 2.03 (1.36–3.04)
SESYearly household income$80k+ Ref. Ref. Ref. Ref.$40–<80k 1.08 (0.62–1.87) 1.04 (0.66–1.640 1.02 (0.62–1.68) 0.84 (0.50–1.42)<$40k 2.35 (1.33–4.16) 2.31 (1.35–3.95) 1.31 (0.78–2.21) 1.26 (0.73–2.17)EducationYear 13 or higher Ref. Ref. Ref. Ref.Year 11 or 12 1.39 (0.87–2.21) 1.67 (1.09–2.55) 1.35 (0.88–2.08) 1.41 (0.91–2.16)≤Year 10 1.72 (1.03–2.89) 3.05 (1.78–5.24) 2.44 (1.33–4.48) 2.10 (1.11–3.93)
13
Shortened dental arches and quality of life

Table A4 Continued
Unadjusted countratioa (95% CI) Model 1 Model 2 Model 3 Model 4
Behaviour and visitTime since last visit≤12 months Ref.1–<2 years 1.21 (0.67–2.19)≥2 years 1.01 (0.61–1.67)Reason for last visitCheck-up Ref. Ref. Ref.Problem 3.13 (2.16–4.54) 2.40 (1.63–3.55) 2.07 (1.43–3.01)Difficulty in paying $100 dental billNo Ref. Ref. Ref.Hardly any/a little 1.76 (1.18–2.62) 1.45 (0.99–2.13) 1.53 (1.02–2.30)A lot of difficulty 5.25 (3.34–8.25) 3.40 (1.95–5.92) 3.14 (1.80–5.45)InsuredYes Ref. Ref. Ref.No 1.58 (1.07–2.35) 0.78 (0.54–1.12) 0.82 (0.54–1.23)Toothbrushing frequency last week≥14 Ref.<14 1.00 (0.64–1.55)SmokingNever smoker Ref. Ref. Ref.Former smoker 0.83 (0.50–1.39) 1.12 (0.72–1.72) 1.06 (0.66–1.71)Current smoker 1.66 (1.07–2.57) 1.43 (0.88–2.30)) 1.33 (0.83–2.14)Alcohol drinkingNo Ref.Yes 0.73 (0.45–1.17)
Dental diseasesNo. of teeth with coronal caries0 Ref. Ref.1 1.71 (1.06–2.77) 1.06 (0.68–1.66)2+ 2.75 (1.58–4.79) 1.69 (0.98–2.93)No. of teeth with root caries0 Ref.1 1.80 (0.94–3.45)2+ 2.23 (1.16–4.31)Periodontal diseaseNo Ref. Ref.Moderate-severedisease
1.71 (1.12–2.62) 2.05 (1.35–3.11)
Severe periodontaldisease
2.46 (1.43–4.25) 2.60 (1.24–5.43)
Negative binominal regression (Those with P > 0.20 in the unadjusted or adjusted analysis are not included in the multi-variable model).Model 1: adjusted for age and sex.Model 2: adjusted for model 1 +model 2 (yearly household income and education).Model 3: adjusted for model 1 + model 2 SES +model 3 (reason for last visit, difficulty in paying $100 dental bill, insuredor not and smoking status).Model 4: adjusted for model 1 +model 2 +model 3 +model 4 (coronal caries and periodontal disease).aCount ratio reflects change in the ratio of OHIP-14 extent for a unit change in the corresponding “Dentition Status”groups.
14
Tan et al.