Master equation approach to DNA breathing in heteropolymer DNA
Upload
khangminh22Category
view
0download
0
In vitro delivery efficiencies of nebulizers for different breathing patternsHyun Mok Park1,2, Kyung Hwa Chang1, Sang‑Hyub Moon1,2, Bong Joo Park3,4, Sun Kook Yoo2,5* and Ki Chang Nam1*
BackgroundNebulizers are mainly used to treat and manage patients with respiratory diseases such as asthma, chronic obstructive pulmonary disease (COPD), cystic fibrosis, or pneumo-nia. Aerosolized medications have the advantage of delivering drugs directly to lungs. Nebulizers can be classified into three types, i.e., jet, ultrasonic, and mesh nebulizers, according to their operating principles [1–3]. Jet nebulizers have large output rates and mass distribution variations that depending on nozzle and compressor combinations, but are noisy, vibrate in use, and have large residual volumes [3–5]. Mesh nebulizers were developed to overcome these limitations and produce aerosols through holes in a mesh or plate. These nebulizers are classified as passive (static) or active (vibrating) based on
Abstract
Background: Nebulizers are medical devices that deliver aerosolized medication directly to lungs to treat a variety of respiratory diseases. However, breathing patterns, respiration rates, airway diameters, and amounts of drugs delivered by nebulizers may be respiratory disease dependent.
Method: In this study, we developed a respiratory simulator consisting of an airway model, an artificial lung, a flow sensor, and an aerosol collecting filter. Various breathing patterns were generated using a linear actuator and an air cylinder. We tested six home nebulizers (jet (2), static (2), and vibrating mesh nebulizers (2)). Nebulizers were evalu‑ated under two conditions, that is, for the duration of nebulization and at a constant output 1.3 mL using four breathing patterns, namely, the breathing pattern specified in ISO 27427:2013, normal adult, asthmatic, and COPD.
Results: One of the vibrating mesh nebulizers had the highest dose delivery effi‑ciency. The drug delivery efficiencies of nebulizers were found to depend on breathing patterns.
Conclusion: We suggest a quantitative drug delivery efficiency evaluation method and calculation parameters that include considerations of constant outputs and residual volumes. The study shows output rates and breathing patterns should be con‑sidered when the drug delivery efficiencies of nebulizers are evaluated.
Keywords: Nebulizer, Respiratory simulator, Drug delivery, Dosage, Efficiency
Open Access
© The Author(s) 2021. This article is licensed under a Creative Commons Attribution 4.0 International License, which permits use, sharing, adaptation, distribution and reproduction in any medium or format, as long as you give appropriate credit to the original author(s) and the source, provide a link to the Creative Commons licence, and indicate if changes were made. The images or other third party material in this article are included in the article’s Creative Commons licence, unless indicated otherwise in a credit line to the material. If material is not included in the article’s Creative Commons licence and your intended use is not permitted by statutory regulation or exceeds the permitted use, you will need to obtain permission directly from the copyright holder. To view a copy of this licence, visit http:// creat iveco mmons. org/ licen ses/ by/4. 0/. The Creative Commons Public Domain Dedication waiver (http:// creat iveco mmons. org/ publi cdoma in/ zero/1. 0/) applies to the data made available in this article, unless otherwise stated in a credit line to the data.
RESEARCH
Park et al. BioMed Eng OnLine (2021) 20:59 https://doi.org/10.1186/s12938-021-00895-3 BioMedical Engineering
OnLine
*Correspondence: [email protected]; [email protected] 1 Department of Medical Engineering, Dongguk University College of Medicine, Goyang, South Korea5 Department of Medical Engineering, Yonsei University College of Medicine, Seoul, South KoreaFull list of author information is available at the end of the article

Page 2 of 14Park et al. BioMed Eng OnLine (2021) 20:59
their operating principles. Static mesh nebulizers use an ultrasonic horn that vibrates a static mesh indirectly, whereas in vibrating mesh nebulizers the mesh is mounted on a vibrating piezoelectric ring [1, 6, 7].
For oral and intravenous drug administrations, drug delivery is obviously 100% [8, 9], but aerosol-based treatment deliveries are only 10–15% efficient based on the amounts of drugs loaded [10, 11]. Nevertheless, because drugs are delivered directly to lungs, the therapeutic effects of aerosol delivery are high, and as a result, nebulizer-based aero-sol therapies have the advantages of lower drug doses, rapid onsets, fewer side effects, and convenience over systemic drug delivery [1, 12–16]. However, the amounts of drugs delivered by nebulizers vary considerably [1, 14, 17, 18]. For example, breathing patterns and physiological factors such as airway diameters are disease-type-dependent and can affect drug delivery efficiencies [17, 18]. In addition, particle sizes, output rates, residual volumes, and nebulization times are dependent on nebulizer type. It has been reported that in vivo aerosol delivery from a nebulizer can be estimated by simulating breathing patterns in vitro [19], which is more convenient and reproducible than in vivo testing. Furthermore, comparative studies conducted using respiratory simulators have shown that mesh nebulizers deliver the same amount or more drugs than jet nebulizers [20–23].
The International Organization for Standardization (ISO) 27427:2013 (Anaesthetic and respiratory equipment-Nebulizing systems and components) defines a method for measuring the outputs and output rates of nebulizers [24], but it does not include a method for testing drug delivery efficiency. Currently, there is no standard test for meas-uring drug delivery efficiency, although several in vivo and in vitro respiratory simulator studies have described potential test methods [3, 17–23, 25–28]. In vivo animal models may not adequately reflect real clinical settings [3], whereas in vitro respiratory simula-tor testing provides a more convenient means of testing than in vivo methods and pro-vides reproducible results [19].
In this study, we developed a respiratory simulator that meets the volume control requirement of the ventilator standard. Six home nebulizers of three types (jet, static mesh, and vibrating mesh) were tested using an in vitro adult airway model for the dura-tion of nebulization and at a constant output of 1.3 mL using four breathing patterns (ISO 27427:2013, normal adult, asthmatic and COPD patterns).
ResultsBreathing patterns
We generated four breathing patterns using the respiratory simulator, that is, the pat-tern specified in ISO 27427:2013, normal adult, asthmatic, and COPD patterns (Fig. 1). Simulated breathing flows (blue solid line) and measured flows (red dashed line) were well correlated for all four patterns (ISO 27427:2013: 0.991, normal adult pattern 0.992, asthma 0.988, and COPD: 0.992). Breathing patterns were generated air flows 10 res-piratory cycles and mean measured breath volumes were ISO 27427:2013: 492.51 ± 0.24 mL, normal adult: 495.71 ± 3.75 mL, asthma: 284.40 ± 2.34 mL and COPD: 494.02 ± 2.02 mL. The average volume error of breathing patterns was 1.46 ± 0.73%, which met the ISO standard requirement (ISO 80601-2-12:2011), which states that breath volume error should be within ± (5 mL + 10% of the set volume) [29].

Page 3 of 14Park et al. BioMed Eng OnLine (2021) 20:59
Comparison of delivery efficiencies by breathing patterns
Experiment 1
This experiment was designed to evaluate delivery efficiencies in clinical situations. The doses delivered by static and vibrating mesh nebulizers were similar or greater than those delivered by jet nebulizers for all breathing patterns (Table 1). Percentage deliv-ered dosage for loading dose (DD/LD) and percentage delivered dosage for emitted dose (DD/ED) for vibrating mesh nebulizers were similar because they had negligible resid-ual volume. However, the jet and static nebulizers, which had larger residual volumes, showed substantial differences. The vibrating mesh nebulizer VMN-SM1 had the highest delivered dose, DD/LD, and DD/ED. In Experiment 1, DD/ED values were considered inappropriate because of nebulizer output differences, whereas DD/LD comparisons allowed evaluations that included considerations of residual volume (waste). However, DD/LD values were unsuitable for comparing delivery efficiencies because of the differ-ent output rates and residual volumes. Therefore, in Experiment 2, we compared nebu-lizer DD/ED values obtained at constant emitted doses.
Delivered dose of the nebulizer was different according to the breathing patterns. Compared with ISO 27427:2013, the delivered dose was significantly reduced in the other breathing patterns (Fig. 2). Delivered doses and delivery efficiencies decreased in the order ISO 27427:2013 > normal adult > asthma > COPD. The tidal volume of the asthma pattern was smaller than that of COPD, but delivered doses and delivery efficien-cies were higher or similar to COPD due to a higher respiration rate and a lower expira-tion phase.
Fig. 1 Breathing patterns generated by the respiratory simulator: a ISO 27427:2013; b normal adult; c asthma; and d COPD. Simulated flow (blue solid line); measured flow (red dotted line); simulated volume (green solid line); measured volume (purple dotted line)

Page 4 of 14Park et al. BioMed Eng OnLine (2021) 20:59
Experiment 2
Experiment 2 was designed to evaluate the drug solution delivery efficiency quanti-tatively. To make emitted dose identical, the residual volume remained intentionally even in mesh nebulizer. Therefore DD/LD became lower than in Experiment 1. We compared drug delivery efficiency using the same emitted doses for all six nebulizers (Table 2). The VMN-SM1 nebulizer had a higher DD/ED than the other nebulizers for all breathing patterns.
In Experiment 2, the emitted dose (ED) for all nebulizers was set 1.3 mL to account for the residual volume by JN-PARIb. The ED of each nebulizer was lower than in Experiment 1 except for the JN-PARIb. Delivered doses (DDs) in Experiment 2 reduced similarly by the decreases of ED proportionally compared to Experiment 1, and thus, DD/ED values were similar in Experiments 1 and 2.
Delivered doses and delivery efficiencies for different breathing patterns followed the order ISO 27427:2013 > normal adult > asthma > COPD, which was the same as that observed in Experiment 1 (Fig. 3).
Table 1 The six nebulizer types used in the study, delivered doses and percentage delivered dosage for loading dose (DD/LD) and emitted dose (DD/ED) values obtained in Experiment 1 (mean ± SD) * p < 0.05 versus the JN‑PARIr; JN‑PARIr: PARI BOY SX + LC SPRINT—red nozzle, JN‑PARIb: PARI BOY SX + LC SPRINT—blue nozzle, SMN‑U150: NE‑U150, SMN‑U22: NE‑U22, VMN‑SM1: NE‑SM1 NEPLUS, VMN‑SM3: NE‑SM3
Breathing Parameter Jet Static mesh Vibrating mesh
JN-PARIr JN-PARIb SMN-U22 SMN-U150 VMN-SM1 VMN-SM3
ISO 27427:2013
Delivered dose (mg)
0.403 ± 0.010
0.277 ± 0.014*
0.416 ± 0.005
0.420 ± 0.016
0.589 ± 0.012*
0.389 ± 0.011
DD/LD (%) 20.17 ± 0.51 13.83 ± 0.70*
20.78 ± 0.24 21.01 ± 0.80 29.48 ± 0.60*
19.45 ± 0.56
DD/ED (%) 27.61 ± 0.70 20.18 ± 1.02*
21.85 ± 0.25*
26.62 ± 1.02 29.61 ± 0.61*
19.60 ± 0.57*
Normal adult Delivered dose (mg)
0.251 ± 0.007
0.163 ± 0.010*
0.305 ± 0.024*
0.281 ± 0.012
0.419 ± 0.018*
0.244 ± 0.004
DD/LD (%) 12.59 ± 0.37 8.13 ± 0.50* 15.25 ± 1.20 14.06 ± 0.61 20.94 ± 0.88*
12.21 ± 0.71
DD/ED (%) 17.24 ± 0.51 11.86 ± 0.72*
16.02 ± 1.27 17.81 ± 0.77 21.03 ± 0.88*
12.30 ± 0.71*
Asthma Delivered dose (mg)
0.186 ± 0.022
0.106 ± 0.015*
0.106 ± 0.015*
0.199 ± 0.013
0.353 ± 0.011*
0.157 ± 0.015
DD/LD (%) 9.28 ± 1.17 5.34 ± 0.76* 5.34 ± 0.76* 9.97 ± 0.68 17.65 ± 0.54*
7.83 ± 0.74
DD/ED (%) 12.70 ± 1.51 7.79 ± 1.11* 7.79 ± 1.11* 12.62 ± 0.87 17.73 ± 0.54*
7.89 ± 0.75*
COPD Delivered dose (mg)
0.144 ± 0.010
0.097 ± 0.002*
0.097 ± 0.002*
0.170 ± 0.025
0.259 ± 0.002*
0.137 ± 0.011
DD/LD (%) 7.22 ± 0.49 4.85 ± 0.11* 4.85 ± 0.11* 8.51 ± 1.26 12.96 ± 0.11*
6.85 ± 0.56
DD/ED (%) 9.88 ± 0.66 7.07 ± 0.15* 7.07 ± 0.15* 10.79 ± 1.59 13.02 ± 0.11*
6.90 ± 0.56*

Page 5 of 14Park et al. BioMed Eng OnLine (2021) 20:59
DiscussionNebulizers are usually used at home or in hospitals to treat respiratory diseases. In this study, we developed a respiratory simulator that enables nebulizer drug delivery testing quantitatively. Six home nebulizers (JN-PARIr, JN-PARIb, SMN-U22, SMN-U150, VMN-SM1, and VMN-SM3) were tested using the developed respiratory sim-ulator. Other studies have shown that delivered doses are affected by particle size, breathing patterns, and airway models [17, 18, 26, 30–33]. Therefore, there is a need for a respiratory simulator that includes an airway model capable of generating vari-ous stable breathing patterns. The developed respiratory simulator generated four breathing patterns including that mentioned in ISO 27427:2013.
Fig. 2 Delivered doses (a), percentage delivered dosage for loading dose (DD/LD) (b), and dose emitted (DD/ED) (c) compared to breathing pattern for ISO 27427:2013 in Experiment 1. JN‑PARIr (white); JN‑PARIb (gray); SMN‑U22 (dots); SMN‑U150 (diagonal stripes); VMN‑SM1 (checkered); VMN‑SM3 (black) (result are means ± SDs), * p < 0.05 versus the ISO 27427:2013 breathing pattern
Page 6 of 14Park et al. BioMed Eng OnLine (2021) 20:59
It is difficult to compare the drug delivery efficiencies of different nebulizer types because drug outputs vary considerably for each nebulizer. Thus, we investigated the drug delivery efficiencies of the six nebulizers using two conditions: Experiment 1 (the duration of nebulization) and Experiment 2 (constant output of 1.3 mL). In Experiment 1, the jet nebulizers had smaller or similar drug deliveries than the mesh nebulizers (Table 1), which concurs with previous reports [20–23, 25]. Notably, it has also been reported delivered doses are particle size, residual volume, and output rate-dependent even for a single nebulizer type [4, 5, 34]. The delivered dosesby the VMN-SM1 (a vibrating mesh nebulizer) were higher than those of other mesh nebulizers. In a previous study, in which salbutamol was collected without an airway model using the ISO 27427:2013 breathing pattern, DD/LD value was ~ 41.16% for SMN-U22 nebulizers [28]. However, the calculated percentage delivered dose for the fine parti-cle fraction ( FPF < 5µm ) was 15.68% [28]. In the present study, based on the amount of drug collected by the filter in an airway containing model, DD/LD was ~ 20.8%. Delivered dose may depend on particle size due to the effect of the airway [26, 30–33]. In this study, we compared the drug delivery efficiencies using an airway model rather than calculating the FPF. In nebulizers with a large residual volume, the differ-ence between DD/LD and DD/ED value is high, which reflects drug wastage. DD/LD valuesare applicable when evaluating drug usage and considering residual volume. In Experiment 2, we compared drug delivery efficiencies (DD/ED) by setting the outputs
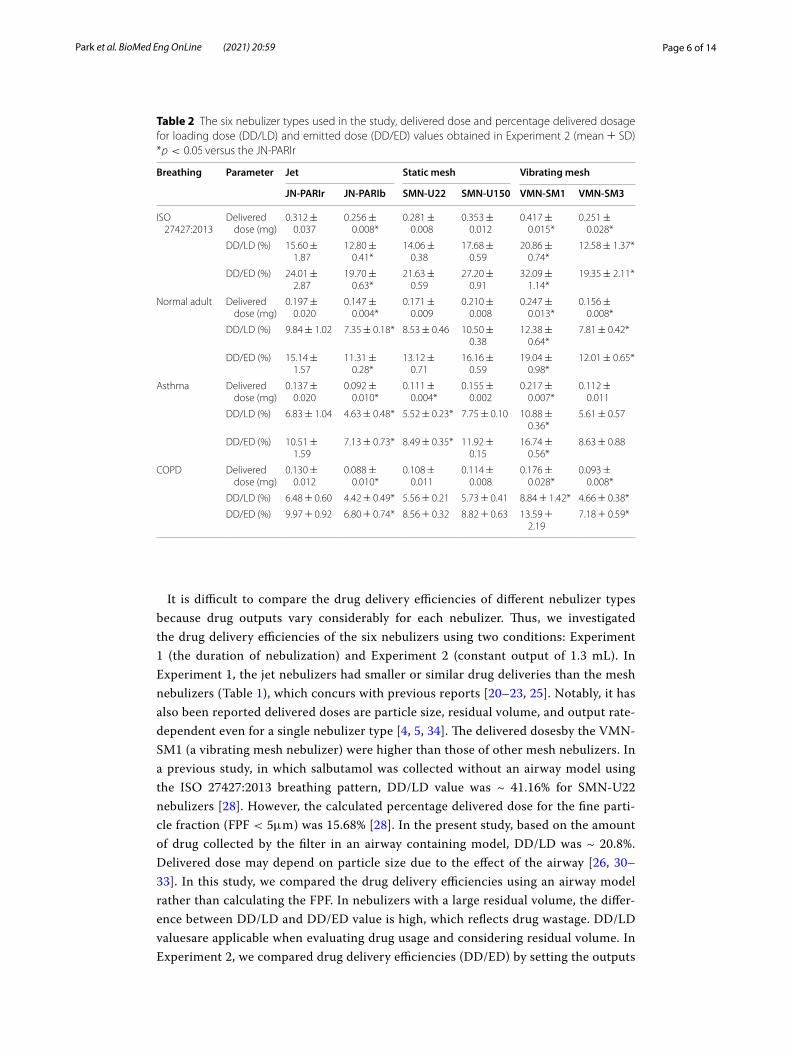
Table 2 The six nebulizer types used in the study, delivered dose and percentage delivered dosage for loading dose (DD/LD) and emitted dose (DD/ED) values obtained in Experiment 2 (mean ± SD) * p < 0.05 versus the JN‑PARIr
Breathing Parameter Jet Static mesh Vibrating mesh
JN-PARIr JN-PARIb SMN-U22 SMN-U150 VMN-SM1 VMN-SM3
ISO 27427:2013
Delivered dose (mg)
0.312 ± 0.037
0.256 ± 0.008*
0.281 ± 0.008
0.353 ± 0.012
0.417 ± 0.015*
0.251 ± 0.028*
DD/LD (%) 15.60 ± 1.87
12.80 ± 0.41*
14.06 ± 0.38
17.68 ± 0.59
20.86 ± 0.74*
12.58 ± 1.37*
DD/ED (%) 24.01 ± 2.87
19.70 ± 0.63*
21.63 ± 0.59
27.20 ± 0.91
32.09 ± 1.14*
19.35 ± 2.11*
Normal adult Delivered dose (mg)
0.197 ± 0.020
0.147 ± 0.004*
0.171 ± 0.009
0.210 ± 0.008
0.247 ± 0.013*
0.156 ± 0.008*
DD/LD (%) 9.84 ± 1.02 7.35 ± 0.18* 8.53 ± 0.46 10.50 ± 0.38
12.38 ± 0.64*
7.81 ± 0.42*
DD/ED (%) 15.14 ± 1.57
11.31 ± 0.28*
13.12 ± 0.71
16.16 ± 0.59
19.04 ± 0.98*
12.01 ± 0.65*
Asthma Delivered dose (mg)
0.137 ± 0.020
0.092 ± 0.010*
0.111 ± 0.004*
0.155 ± 0.002
0.217 ± 0.007*
0.112 ± 0.011
DD/LD (%) 6.83 ± 1.04 4.63 ± 0.48* 5.52 ± 0.23* 7.75 ± 0.10 10.88 ± 0.36*
5.61 ± 0.57
DD/ED (%) 10.51 ± 1.59
7.13 ± 0.73* 8.49 ± 0.35* 11.92 ± 0.15
16.74 ± 0.56*
8.63 ± 0.88
COPD Delivered dose (mg)
0.130 ± 0.012
0.088 ± 0.010*
0.108 ± 0.011
0.114 ± 0.008
0.176 ± 0.028*
0.093 ± 0.008*
DD/LD (%) 6.48 ± 0.60 4.42 ± 0.49* 5.56 ± 0.21 5.73 ± 0.41 8.84 ± 1.42* 4.66 ± 0.38*
DD/ED (%) 9.97 ± 0.92 6.80 ± 0.74* 8.56 ± 0.32 8.82 ± 0.63 13.59 ± 2.19
7.18 ± 0.59*
Page 7 of 14Park et al. BioMed Eng OnLine (2021) 20:59
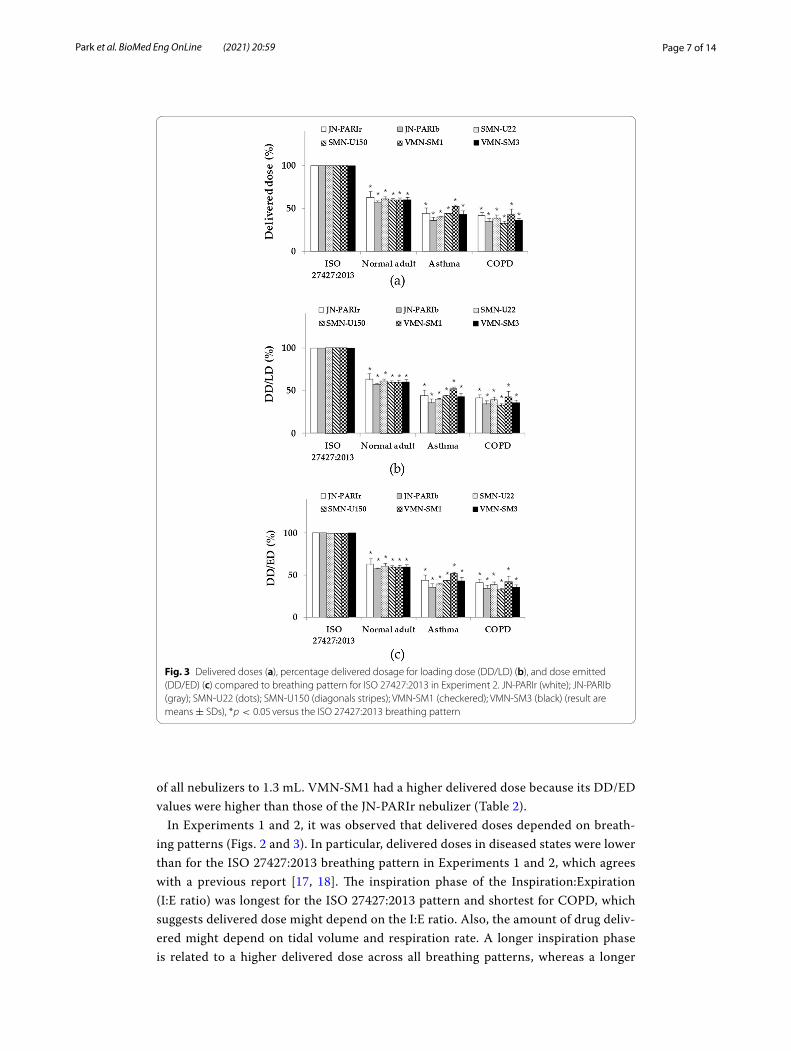
of all nebulizers to 1.3 mL. VMN-SM1 had a higher delivered dose because its DD/ED values were higher than those of the JN-PARIr nebulizer (Table 2).
In Experiments 1 and 2, it was observed that delivered doses depended on breath-ing patterns (Figs. 2 and 3). In particular, delivered doses in diseased states were lower than for the ISO 27427:2013 breathing pattern in Experiments 1 and 2, which agrees with a previous report [17, 18]. The inspiration phase of the Inspiration:Expiration (I:E ratio) was longest for the ISO 27427:2013 pattern and shortest for COPD, which suggests delivered dose might depend on the I:E ratio. Also, the amount of drug deliv-ered might depend on tidal volume and respiration rate. A longer inspiration phase is related to a higher delivered dose across all breathing patterns, whereas a longer
Fig. 3 Delivered doses (a), percentage delivered dosage for loading dose (DD/LD) (b), and dose emitted (DD/ED) (c) compared to breathing pattern for ISO 27427:2013 in Experiment 2. JN‑PARIr (white); JN‑PARIb (gray); SMN‑U22 (dots); SMN‑U150 (diagonals stripes); VMN‑SM1 (checkered); VMN‑SM3 (black) (result are means ± SDs), * p < 0.05 versus the ISO 27427:2013 breathing pattern
Page 8 of 14Park et al. BioMed Eng OnLine (2021) 20:59
expiration phase reduced the delivered dose [17, 18]. ISO 27427:2013 defines only one breathing pattern [24], and it has been reported that data obtained using one breathing pattern may result in inappropriate clinical applications [17]. Our results agree with these findings, which suggests a test is required that better mimics patient breathing patterns.
This study was performed using a respiratory simulator to determine nebulizer drug delivery efficiencies in vitro under conditions that are representative of actual clinical environments. In reality, breathing patterns are usually irregular, which can cause incon-sistent drug delivery [20]. On the other hand, respiratory simulators produce consistent breathing patterns and specific respiratory diseases [35]. However, we suspect our deliv-ered dose results may have been overestimations because the airway model used did not mimic disease conditions exactly. Furthermore, drug delivery characteristics are prob-ably different for adults and children [20] and depend on drug characteristics [36–38] and nebulizer interfaces [1, 20]. Further research is needed to better match breathing patterns with those observed clinically, to design airway models suitable for respiratory diseases, and to determine the effects of different drugs and nebulizer interfaces on drug delivery.
ConclusionWe developed a respiratory simulator and compared the delivery efficiencies of six home nebulizers using four breathing patterns. It was difficult to compare the delivery effi-ciencies of nebulizers because of their different residual volumes and output rates. In this study, we devised a method for quantitatively determining drug delivery efficiencies using defined variables, that is, DD/LD and DD/ED, for four breathing patterns. Finally, our results show that output rates and breathing patterns should be considered to prop-erly determine nebulizer drug delivery efficiencies.
MethodsDevelopment of the respiratory simulator
The respiratory simulator consists of a linear actuator (Scipia, Gwangju, Korea) driven by a stepper motor (Nema 57 56 Stepper motor, JingJiang Nair Motion Technologies Co., Jingjiang, China), a motor driver (TB6600, DFRobot, Shanghai, China), a flow sen-sor (SMF3000, Sensirion, Stafa, Switzerland), an air cylinder (MDB1B50-600, SMC Co., Tokyo, Japan), and a mouth-throat airway model. This airway model was based on air-way dimensions of the oral cavity and laryngeal tracheal airway by Cheng et al., and was produced using a 3D printer (ProJet 3510HD, 3D Systems, South Carolina, Colorado, USA) and UV-curable resin (VisiJet M3, Crystal, 3D Systems, South Carolina, Colorado, USA) [39]. A disposable filter (Proguard-EX, GMS Korea, Bucheon, Korea) was located between the mouth-throat airway model and the airflow sensor. For respiration pattern control and flow data acquisition (DAQ), we used an open-source platform Arduino Uno (Arduino.cc, Ivrea, Italy). A schematic of the respiratory simulator is provided in Fig. 4.
Calibration of the respiratory simulator
Initially, the air volume generated by the simulator was calibrated from 100 to 800 mL at 100 mL intervals. Tidal volume is ~ 500 mL for healthy adult males and ~ 400 mL for

Page 9 of 14Park et al. BioMed Eng OnLine (2021) 20:59
adult females [40]. Flows of 100 to 800 mL/s were generated and measured using a flow sensor. Data measurement was conducted at a sampling rate of 100 Hz with 10 Hz low-pass filtering. Noise removal and calculations were conducted using MATLAB (MAT-LAB R2018a, The MathWorks, Inc., Natick, MA, USA). The average flow error was 0.70 ± 0.12% (Fig. 5).
Breathing patterns
Breathing patterns generated were based on ISO 27427:2013 [24], and normal adult [18], asthma [18], and COPD [27] patterns (Table 3). The respiratory simulator can be used to
Fig. 4 Schematic of the developed respiratory simulator
Fig. 5 Flow calibration curve of the respiratory simulator
Table 3 Breathing patterns generated by the respiratory simulator
Breathing pattern Inspiration:expiration (I:E) ratio Respiration rate (bpm) Tidal volume (mL)
ISO 27427:2013 1:1 15 500
Normal adult 1:2 15 500
Asthma 1:2.5 22 290
COPD 1.3 15 500

Page 10 of 14Park et al. BioMed Eng OnLine (2021) 20:59
reproduce breathing patterns other than those mentioned in Table 3. Drug deliveries for the four breathing patterns were compared.
Drug assay
Salbutamol (Ventolin respirator solution, 5 mg/mL salbutamol sulfate) was purchased from GlaxoSmithKline (Brentford, UK). A salbutamol solution of 0.1% [M/V] was pre-pared by diluting the supplied solution with normal saline to a concentration of 1 mg/mL. Salbutamol were determined by UV spectrophotometry at 276 nm using a Spec-traMax Plus 384 (Molecular Devices, Sunnyvale, California, USA).
Nebulizers
Six home nebulizers were tested. Modes of operation and abbreviations are provided in Table 4. PARI BOY SX + LC SPRINT was used with two nozzles (red and blue), which were supplied by the manufacturer.
Nebulizers were charged with 2 mL of 0.1% (1 mg/mL) salbutamol as required by ISO 27427:2013 and residual volumes, nebulization times, output rates, and particle sizes were measured. Nebulizers were operated until dryness or to onset of sputter. Nebuliz-ers were weighed before and after nebulization. Volumes were determined gravimetri-cally and evaporation was negligible [41]. JN-PARIb had the largest residual volume and VMN-SM1 the smallest. JN-PARIr had the longest nebulization time and SMN-U150 the shortest, and the output rate of SMN-U150 was greatest and that of JN-PARIr small-est (Table 5). Output rates were calculated as follows [3, 36].
Table 4 Tested nebulizers
Modes of operation Models Abbreviations used
Jet PARI BOY SX + LC SPRINT—red nozzle (PARI GmbH, Starnberg, Germany)
JN‑PARIr
PARI BOY SX + LC SPRINT—blue nozzle (PARI GmbH, Starnberg, Germany)
JN‑PARIb
Static mesh NE‑U22 (Omron Healthcare, Kyoto, Japan) SMN‑U22
NE‑U150 (Omron Healthcare, Kyoto, Japan) SMN‑U150
Vibrating mesh NE‑SM1 NEPLUS (KTMED Co., Seoul, Korea) VMN‑SM1
NE‑SM3 (KTMED Co., Seoul, Korea) VMN‑SM3
Table 5 Residual volumes, nebulization times, output rates, and MMDs (Dv(50)) values of the six nebulizers
Device Residual volume (mL) Nebulization time (min)
Output rate (mL/min) MMDs (Dv(50)) ( µm)
JN‑PARIr 0.539 ± 0.020 8.13 ± 0.10 0.182 ± 0.002 3.55 ± 0.10
JN‑PARIb 0.629 ± 0.034 6.07 ± 0.23 0.231 ± 0.003 4.91 ± 0.09
SMN‑U22 0.096 ± 0.038 6.22 ± 0.21 0.307 ± 0.015 7.14 ± 0.08
SMN‑U150 0.421 ± 0.011 4.81 ± 0.30 0.334 ± 0.023 6.43 ± 0.09
VMN‑SM1 0.009 ± 0.005 7.93 ± 0.64 0.254 ± 0.022 5.09 ± 0.11
VMN‑SM3 0.015 ± 0.004 6.09 ± 0.14 0.329 ± 0.007 7.06 ± 0.16

Page 11 of 14Park et al. BioMed Eng OnLine (2021) 20:59
The particle sizes (mass median diameters (MMDs)) were measured using a Spraytec (Malvern Instruments, Malvern, UK), which utilizes a laser diffraction method [42]. Fifty percent volume diameter (Dv(50)) results were automatically calculated using Spray-tec software (Model #STP5311, Version 3.1, Malvern instrument, Malvern, UK, 2009). The particle size of SMN-U22 was largest and that of JN-PARIr was smallest. Results are shown in Table 5.
Delivery efficiency experiments
Amounts of drug delivered were measured for nebulization durations and at constant output (Table 6). To calculate the percentages of delivered doses, amounts collected by the filter were expressed as percentages of the amounts of salbutamol loaded in nebulizer reservoirs (DD/LD) or as percentages of emitted doses (DD/ED). The load-ing dose (LD) in nebulizer reservoirs was set at 2 mg for Experiments 1 and 2 and the emitted dose (ED) was defined as nebulizer drug output.
• Experiment 1: Nebulizers were operated for duration of nebulization (until dryness or the onset of sputter).
• Experiment 2: Nebulizers were operated at constant output (1.3 mL).
Experiment 1 represented a common clinical condition, but doses emitted by nebu-lizers vary, and it is difficult to evaluate percentage lung delivered efficiencies with respect to emitted doses. The JN-PARIb nebulizer had the largest residual volume (~ 0.7 mL), and 1.3 mL was chosen as the constant output for Experiment 2.
The amounts of delivered drug collected by filters were quantified by UV spectro-photometry. Salbutamol collected in filters was eluted with distilled water (15 mL) for 24 h. Delivery efficiency percentages were calculated with respect to amounts of salbutamol loaded or emitted (DD/LD and DD/ED, respectively). DD/LD values were calculated using the following formula.
DD/LD values were calculated using a loading dose of 2 mg, and thus, larger residual volumes resulted in lower delivery efficiencies. Thus, to compare delivery efficiencies for emitted doses (ED), we calculated DD/ED values using the following formula.
(1)Output rate (mL/min) =charged volume (mL)− residual volume (mL)
duration of nebulization (min)
(2)
Percentage delivered dosage for loading dose (DD/LD)(%) =lung delivered dose (mg)
loading dose (mg)
Table 6 Test conditions for the delivery of 0.1% salbutamol (1 mg/mL)
Experiment Loading dose (mg) Operating conditions
1 2 Duration of nebulization
2 2 Constant output 1.3 mL

Page 12 of 14Park et al. BioMed Eng OnLine (2021) 20:59
In order to compare the drug delivery efficiencies of nebulizers for each breathing pat-tern, delivered doses and percentage delivered dosages were compared versus those obtained for the ISO 27427:2013 breathing pattern.
Statistical analysis
Correlations between simulated and measured respiration air flows were evaluated using Spearman’s correlation coefficients. Lung delivered doses are presented as means and standard deviations. Data were analyzed by two-way analysis of variance followed by Dunnett’s post hoc test. The analysis was performed using R-studio Version 4.0.3 (R-stu-dio, MA, USA, 2020), and p values of < 0.05 were considered significant.
AbbreviationsJN‑PARIr: PARI BOY SX + LC SPRINT—red nozzle (PARI GmbH, Starnberg, Germany); JN‑PARIb: PARI BOY SX + LC SPRINT—blue nozzle (PARI GmbH, Starnberg, Germany); SMN‑U150: NE‑U150 (Omron Healthcare, Kyoto, Japan); SMN‑U22: NE‑U22 (Omron Healthcare, Kyoto, Japan); VMN‑SM1: NE‑SM1 NEPLUS (KTMED Co., Seoul, Korea); VMN‑SM3: NE‑SM3 (KTMED Co., Seoul, Korea)..
AcknowledgementsNot applicable.
Authors’ contributionsHMP, KHC, S‑HM, BJP, and KCN planned and performed experiments; HMP, KHC, and KCN analyzed and calculated the data; HMP, KHC, S‑HM, SKY, BJP, KCN wrote, reviewed and revised the paper. All authors read and approved the final manuscript.
FundingThis work was supported by the National Research Foundation (NRF) Grant funded by the Korea government (MSIT) (2020R1A2C1101048).
Availability of data and materialsNot applicable.
Declarations
Ethics approval and consent to participateNot applicable.
Consent for publicationNot applicable.
Competing interestsThe authors declare that they have no competing interests.
Author details1 Department of Medical Engineering, Dongguk University College of Medicine, Goyang, South Korea. 2 Graduate Program of Biomedical Engineering, Yonsei University, Seoul, South Korea. 3 Department of Electrical & Biological Phys‑ics, Kwangwoon University, Seoul, South Korea. 4 Institute of Biomaterials, Kwangwoon University, Seoul, South Korea. 5 Department of Medical Engineering, Yonsei University College of Medicine, Seoul, South Korea.
Received: 1 February 2021 Accepted: 3 June 2021
References 1. Ari A. Jet, ultrasonic, and mesh nebulizers: an evaluation of nebulizers for better clinical outcomes. Eurasian J Pulmo‑
nol. 2014;16:1–7. 2. Mansour MM. Overcoming jet lag: optimizing aerosol delivery with and without jet nebulizers. Respir Care.
2013;58:1255–6.
(3)
Percentage delivered dosage for emitted dose (DD/ED)(%) =lung delivered dose (mg)
emitted dose (mg)

Page 13 of 14Park et al. BioMed Eng OnLine (2021) 20:59
3. Chang KH, Moon SH, Oh JY, Yoon YS, Gu N, Lim CY, Park BJ, Nam KC. Comparison of salbutamol delivery efficiency for jet versus mesh nebulizer using mice. Pharmaceutics. 2019;11:192.
4. Smith EC, Denyer J, Kendrick AH. Comparison of twenty three nebulizer/compressor combinations for domiciliary use. Eur Respir J. 1995;8:1214–21.
5. Kendrick AH, Smith EC, Denyer J. Nebulizers‑fill volume, residual volume and matching of nebulizer to compressor. Respir Med. 1995;89:157–9.
6. Dhand R. Nebulizers that use a vibrating mesh or plate with multiple apertures to generate aerosol. Respir Care. 2002;47:1406–16.
7. Vecellio L. The mesh nebuliser: a recent technical innovation for aerosol delivery. Breathe. 2006;2:252–60. 8. Rodriguez GI, Khun JG, Weiss GR, Hilsenbeck SG, Eckardt JR, Thurman A, Rinaldi DA, Hodges D, VonHoff DD, Rowin‑
sky EK. A bioavailability and pharmacokinetic study of oral and intravenous hydroxyurea. Blood. 1998;91:1533–41. 9. Oscier C, Bosley NQM. Paracetamol: a review of three routes of administration. Update Anaesth. 2007;23:112–4. 10. O’Callaghan C, Barry PW. The science of nebulised drug delivery. Thorax. 1997;52:31–44. 11. Newman SP, Pitcairn GR, Hooper G, Knoch M. Efficient drug delivery to the lungs from a continuously operated
open‑vent nebulizer and low pressure compressor system. Eur Respir J. 1994;7:1177–81. 12. Patton JS, Fishburn CS, Weers JG. The lungs as a portal of entry for systemic drug delivery. Proc Am Thorac Soc.
2004;1:338–44. 13. Pai VB, Nahata MC. Efficacy and safety of aerosolized tobramycin in cystic fibrosis. Pediatr Pulmonol. 2001;32:314–27. 14. Gardenfire DS, Burnett D, Strickland S, Myers TR. A guide to aerosol delivery devices for respiratory therapists; Ameri‑
can association for respiratory care. TX, USA: Irving; 2017. 15. Goralski JL, Davis SD. Breathing easier: addressing the challenges of aerosolizing medications to infants and pre‑
schoolers. Respir Med. 2014;108:1069–74. 16. Gangurde HH, Chordiya MA, Baste NS, Tamizharasi S, Upasani SD. Approaches and devices used in pulmonary drug
delivery system: a review. Asian J Pharm Res Health Care. 2012;4:11–27. 17. Hatley RH, Byrne MB. Variability in delivered dose and respirable delivered dose from nebulizers: are current regula‑
tory testing guidelines sufficient to produce meaningful information? Med Devices. 2017;10:17–28. 18. Bennett G, Joyce M, Sweeney L, MacLoughlin R. In vitro study of the effect of breathing pattern on aerosol delivery
during high‑flow nasal therapy. Pulm Ther. 2019;5:43–54. 19. Nikander K, Denyer J, Everard M, Smaldone GC. Validation of a new breathing simulator generating and measuring
inhaled aerosol with adult breathing patterns. J Aerosol Med. 2000;13:139–46. 20. Ari A, de Andrade A, Sheard M, AlHamad B, Fink JB. Performance comparisons of jet and mesh nebulizers using
different interfaces in simulated spontaneously breathing adults and children. J Aerosol Med Pulm Drug Deliv. 2015;28:281–9.
21. Ari A, Atalay OT, Harwood R, Sheard MM, Aljamhan EA, Fink JB. Influence of nebulizer type, position, and bias flow on aerosol drug delivery in simulated pediatric and adult lung models during mechanical ventilation. Respir Care. 2010;55:845–51.
22. Skaria S, Gerald CS. Omron ne u22: comparison between vibrating mesh and jet nebulizer. J Aerosol Med Pulm Drug Deliv. 2010;23:173–80.
23. Alhamad BR, Fink JB, Harwood RJ, Sheard MM, Ari A. Effect of aerosol devices and administration techniques on drug delivery in a simulated spontaneously breathing pediatric tracheostomy model. Respir Care. 2015;60:1026–32.
24. ISO 27427:2013: Anaesthetic and respiratory equipment‑nebulizing systems and components. In: International Organization for Standardization 2013.
25. Pitance L, Vecellio L, Leal T, Reychler G, Reychler H, Liistro G. Delivery efficacy of a vibrating mesh nebulizer and a jet nebulizer under different configurations. J Aerosol Med Pulm Drug Deliv. 2010;23:389–96.
26. Bauer A, McGlynn P, Bovet LL, Mims PL, Curry LA, Hanrahan JP. The influence of breathing pattern during nebuliza‑tion on the delivery of arformoterol using a breath simulator. Respir Care. 2009;54:1488–92.
27. Abdelrahim ME, Plant P, Chrystyn H. In‑vitro characterisation of the nebulised dose during non‑invasive ventilation. J Pharm Pharmacol. 2010;62:966–72.
28. Hu J, Chen X, Li S, Zheng X, Zhang R, Tan W. Comparison of the performance of inhalation nebulizer solution and suspension delivered with active and passive vibrating‑mesh device. J Drug Deliv Sci Technol. 2020;55:101353.
29. ISO 80601‑2‑12:2011: Medical electrical equipment ‑ part 2‑12: Particular requirements for basic safety and essential performance of critical care ventilators. In: International Organization for Standardization;2011.
30. Clay MM, Pavia D, Newman SP, Clarke SW. Factors influencing the size distribution of aerosols from jet nebulisers. Thorax. 1983;38:755–9.
31. Heyder J. Deposition of inhaled particles in the human respiratory tract and consequences for regional targeting in respiratory drug delivery. Proc Am Thorac Soc. 2004;1:315–20.
32. Usmani OS, Biddiscombe MF, Barnes PJ. Regional lung deposition and bronchodilator response as a function of beta2‑agonist particle size. Am J Respir Crit Care Med. 2005;172:1497–504.
33. Costa A, Pinheiro M, Magalhães M, Ribeiro R, Seabra V, Reis S, Sarmento B. The formulation of nanomedicines for treating tuberculosis. Adv Drug Deliv Rev. 2016;102:102–15.
34. Ho SL, Kwong WT, O’Drowsky L, Coates AL. Evaluation of four breath‑enhanced nebulizers for home use. J Aerosol Med. 2001;14:467–75.
35. Kosciuch J, Krenke R, Gorska K, Zukowska M, Maskey‑Warzechowska M, Chazan R. Airway dimensions in asthma and copd in high resolution computed tomography: can we see the difference? Respir care. 2013;58:1335–42.
36. Chang KH, Moon SH, Yoo SK, Park BJ, Nam KC. Aerosol delivery of dornase alfa generated by jet and mesh nebuliz‑ers. Pharmaceutics. 2020;12:721.
37. McCallion ONM, Patel MJ. Viscosity effects on nebulisation of aqueous solutions. Int J Pharm. 1996;130:245–9. 38. Ghazanfari T, Elhissi AM, Ding Z, Taylor KM. The influence of fluid physicochemical properties on vibrating‑mesh
nebulization. Int J Pharm. 2007;339:103–11. 39. Cheng KH, Cheng YS, Yeh HC, Swift DL. Measurements of airway dimensions and calculation of mass transfer char‑
acteristics of the human oral passage. J Biomech Eng. 1997;119:476–82.

Page 14 of 14Park et al. BioMed Eng OnLine (2021) 20:59
• fast, convenient online submission
•
thorough peer review by experienced researchers in your field
• rapid publication on acceptance
• support for research data, including large and complex data types
•
gold Open Access which fosters wider collaboration and increased citations
maximum visibility for your research: over 100M website views per year •
At BMC, research is always in progress.
Learn more biomedcentral.com/submissions
Ready to submit your researchReady to submit your research ? Choose BMC and benefit from: ? Choose BMC and benefit from:
40. Hallett S, Ashurst JV: Physiology, tidal volume. StatPearls Publishing;2019. 41. Tandon R, Smaldone GC, McPeck M. Measuring nebulizer output aerosol production vs gravimetric analysis. Chest.
1997;111:1361–5. 42. Song X, Hu J, Zhan S, Zhang R, Tan W. Effects of temperature and humidity on laser diffraction measurements to jet
nebulizer and comparison with ngi. AAPS PharmSciTech. 2016;17:380–8.
Publisher’s NoteSpringer Nature remains neutral with regard to jurisdictional claims in published maps and institutional affiliations.
Copyright © 2022 FDOKUMEN