Investigating technical and scale efficiencies of Australian Universities through data envelopment...
24
Socio-Economic Planning Sciences 35 (2001) 57–80 Investigating technical and scale efficiencies of Australian Universities through data envelopment analysis Necmi K. Avkiran* The University of Queensland, Department of Commerce, Ipswich Campus, QLD 4305, Australia Received 1 March 1999; received in revised form 1 November 1999 Abstract Performance indicators in the public sector have often been criticised for being inadequate and not conducive to analysing efficiency. The main objective of this study is to use data envelopment analysis (DEA) to examine the relative efficiency of Australian universities. Three performance models are developed, namely, overall performance, performance on delivery of educational services, and performance on fee-paying enrolments. The findings based on 1995 data show that the university sector was performing well on technical and scale efficiency but there was room for improving performance on fee-paying enrolments. There were also small slacks in input utilisation. More universities were operating at decreasing returns to scale, indicating a potential to downsize. DEA helps in identifying the reference sets for inefficient institutions and objectively determines productivity improvements. As such, it can be a valuable benchmarking tool for educational administrators and assist in more efficient allocation of scarce resources. In the absence of market mechanisms to price educational outputs, which renders traditional production or cost functions inappropriate, universities are particularly obliged to seek alternative efficiency analysis methods such as DEA. # 2001 Elsevier Science Ltd. All rights reserved. Keywords: DEA; University performance; Technical efficiency; Scale efficiency 1. Introduction The purpose of this paper is to demonstrate the use of data envelopment analysis (DEA) in examining the relative efficiency of Australian universities for the main benefit of the practitioner. The current economic climate in the Australian public sector and the funding restructure of universities make this article timely and relevant to the needs of decision makers. Increasing accountability of universities to their providers and educational administrators’ desire to better * Tel.: +61-7-338-11216; fax: +61-7-338-11227. E-mail address: [email protected] (N.K. Avkiran). 0038-0121/01/$ - see front matter # 2001 Elsevier Science Ltd. All rights reserved. PII:S0038-0121(00)00010-0
Transcript of Investigating technical and scale efficiencies of Australian Universities through data envelopment...
Socio-Economic Planning Sciences 35 (2001) 57–80
Investigating technical and scale efficiencies of AustralianUniversities through data envelopment analysis
Necmi K. Avkiran*
The University of Queensland, Department of Commerce, Ipswich Campus, QLD 4305, Australia
Received 1 March 1999; received in revised form 1 November 1999
Abstract
Performance indicators in the public sector have often been criticised for being inadequate and notconducive to analysing efficiency. The main objective of this study is to use data envelopment analysis(DEA) to examine the relative efficiency of Australian universities. Three performance models aredeveloped, namely, overall performance, performance on delivery of educational services, and performanceon fee-paying enrolments. The findings based on 1995 data show that the university sector was performingwell on technical and scale efficiency but there was room for improving performance on fee-payingenrolments. There were also small slacks in input utilisation. More universities were operating at decreasingreturns to scale, indicating a potential to downsize. DEA helps in identifying the reference sets for inefficientinstitutions and objectively determines productivity improvements. As such, it can be a valuablebenchmarking tool for educational administrators and assist in more efficient allocation of scarce resources.In the absence of market mechanisms to price educational outputs, which renders traditional production orcost functions inappropriate, universities are particularly obliged to seek alternative efficiency analysismethods such as DEA. # 2001 Elsevier Science Ltd. All rights reserved.
Keywords: DEA; University performance; Technical efficiency; Scale efficiency
1. Introduction
The purpose of this paper is to demonstrate the use of data envelopment analysis (DEA) inexamining the relative efficiency of Australian universities for the main benefit of the practitioner.The current economic climate in the Australian public sector and the funding restructure ofuniversities make this article timely and relevant to the needs of decision makers. Increasingaccountability of universities to their providers and educational administrators’ desire to better
*Tel.: +61-7-338-11216; fax: +61-7-338-11227.
E-mail address: [email protected] (N.K. Avkiran).
0038-0121/01/$ - see front matter # 2001 Elsevier Science Ltd. All rights reserved.
PII: S 0 0 3 8 - 0 1 2 1 ( 0 0 ) 0 0 0 1 0 - 0
utilise scarce resources indicate that efficiency analysis will become more common amonguniversities. Conversely, failure to make efficiency analysis a standard practice would certainlylead to less than efficient allocation of educational resources.Performance indicators in the public sector have often been criticised for being inadequate and
not conducive to analysing efficiency [1,2]. Typical criticisms include focusing on inputs to thedetriment of outputs, an ad hoc selection of indicators, and an inability to distinguish inefficiencyfrom environmental factors. Similarly, stochastic frontier techniques are ill-adapted for studyingmultiple outputs that are jointly produced since the analyst is normally limited to focusing on oneoutput at a time.On the other hand, DEA is particularly appropriate where the researcher is interested in
investigating the efficiency of converting multiple inputs into multiple outputs. For example, DEAcan identify alternative configurations of inputs that can result in higher outputs withoutnecessarily raising the overall use of resources. DEA is a linear programming technique thatenables management to benchmark the best practice decision making unit (DMU), i.e. auniversity. Further, DEA provides estimates of potential improvements for inefficient DMUs. Innot-for-profit organisations, where market prices or relative values of outputs are not readilyavailable, DEA emerges as a particularly useful service management technique. Commerciallyavailable DEA software includes Frontier Analyst, Warwick DEA, OnFront, and IDEAS. Thereis also DEA software free for academic users, namely EMS and DEAP.The mathematical formulations behind DEA are not discussed because others have already
adequately covered this area [3–6]. A summary of DEA mathematics has been included inAppendix A. The current article demonstrates how DEA can be used to develop models ofefficiency for universities. The minimum theory needed by the end-users of DEA (selection ofanalysis options and correct interpretation of DEA results) are addressed herein. The study alsodistinguishes between pure technical efficiency (PTE) and scale efficiency (SE) while determiningthe nature of returns to scale for each university. In further discussions, the words ‘‘efficiency’’,‘‘productivity’’, and ‘‘performance’’ are used interchangeably.Three models of university efficiency have been developed in this study, namely, overall
performance, performance on delivery of educational services, and performance on fee-payingenrolments. The findings show that Australian universities are, in general, technical and scaleefficient. Furthermore, the performance models adequately discriminate between efficient andinefficient universities. The largest potential improvements for Australian universities were in fee-paying enrolments. Small input slacks were found across the first two models. A majority ofAustralian universities have apparently been operating under a regime of decreasing returns toscale (DRS) while about one-third have been at a most productive scale size (MPSS)1, with a smallnumber at increasing returns to scale (IRS).Under the coverage of DEA for the end-user, this article’s contributions to the literature
include: performance model design, decision processes involved in selection of DEA analysisoptions, correct interpretation of DEA results, and an application checklist (see Conclusion).While most applications of DEA report model design and interpretation of test results, there isusually little space allocated to the decision processes entailed in the selection of DEA analysis
1MPSS [7,8] implies that a DMU’s production of outputs is maximised per unit of inputs. That is, scale elasticity
equals 1.
N.K. Avkiran / Socio-Economic Planning Sciences 35 (2001) 57–8058
options. Furthermore, DEA theory is usually covered as an exposition of DEA mathematics. Webreak from this mould by using non-mathematical language that can be appreciated by bothpractitioners and novice researchers in the field. Key jargon is introduced only on a need-to-knowbasis. Equally important, the style of the article implicitly assumes that the practitioner applyingDEA will be using one of the available software packages and is unlikely to attempt writing acomputer code or designing a complex spreadsheet.The fundamentals of DEA theory, literature review and the process for selection of inputs and
outputs are discussed in Section 2. Design of the three efficiency models and selection of analysisoptions are addressed in Section 3. Test results and interpretations are provided in Section 4,followed by a discussion of managerial implications and presentation of an application checklistin Section 5.
2. Conceptual framework
2.1. Efficiency and data envelopment analysis
Sherman [9, p. 3] defines efficiency as ‘‘the ability to produce the outputs or services with aminimum resource level required’’. Similarly, productivity is defined as the efficiency ofproduction. Farrell [10], who is credited with pioneering the measurement of productiveefficiency, recognised the importance of measuring the extent to which outputs can be increasedthrough higher efficiency without using additional resources (inputs).Efficient production is defined in terms of Pareto optimality. The conditions of Pareto
optimality state that a DMU is not efficient if an output can be increased without raising any ofthe inputs and without decreasing any other output. Similarly, a DMU is not efficient if an inputcan be decreased without decreasing any of the outputs and without increasing any other input[11]. It should be noted that the Pareto optimality criterion used by DEA suffers from a potentialconceptual weakness. That is, each input/output is considered of equal value to the decision-maker [12].DEA was initially been used to investigate the relative efficiency of not-for-profit organisations,
only to quickly spread to profit-making organisations. DEA has been successfully applied in suchdiverse settings as schools, hospitals, courts, the US Air Force, rate departments and banks[13–18]. Charnes et al. [19] have compiled an extensive discussion of efficiency models across avariety of industries.DEA is a non-parametric linear programming technique that computes a comparative ratio of
outputs to inputs for each unit, which is reported as the relative efficiency score. The efficiencyscore is usually expressed as either a number between 0–1 or 0–100%. A decision-making unitwith a score less than 100% is deemed inefficient relative to other units. In this article, DEA isused to measure the technical efficiency (TE) of DMUs as opposed to allocative efficiency.Allocative efficiency is defined as the effective choice of inputs vis a vis prices with the objective
to minimise production costs, whereas technical efficiency investigates how well the productionprocess converts inputs into outputs. It should be noted that DEA can also be used to measureallocative efficiency (not addressed in this article). Combining technical and allocative efficiencyprovides economic efficiency.
N.K. Avkiran / Socio-Economic Planning Sciences 35 (2001) 57–80 59
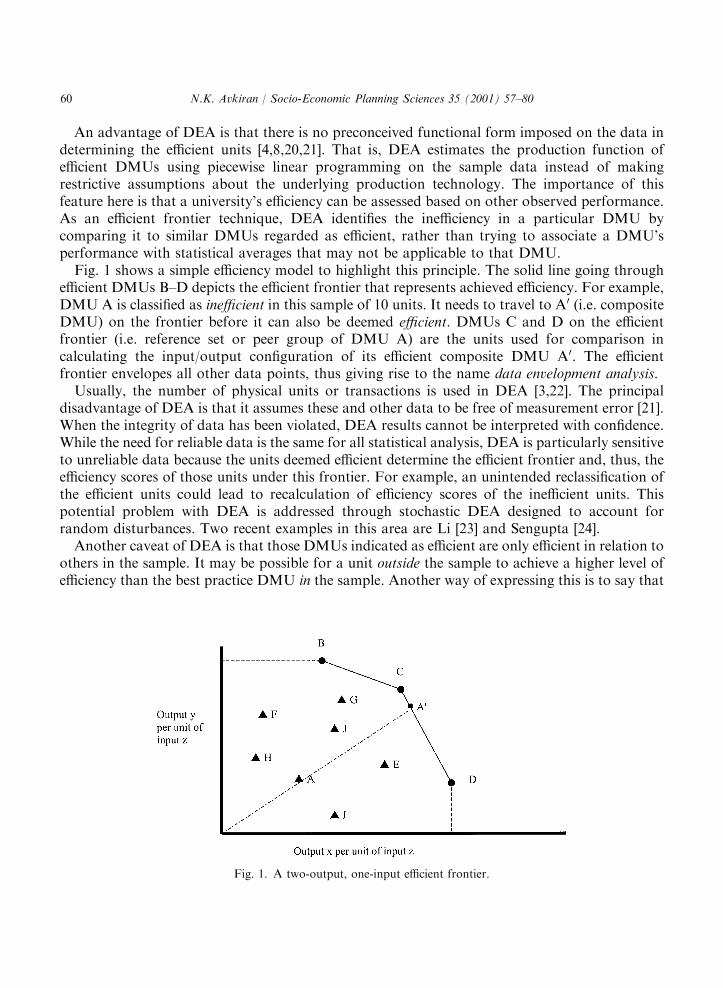
An advantage of DEA is that there is no preconceived functional form imposed on the data indetermining the efficient units [4,8,20,21]. That is, DEA estimates the production function ofefficient DMUs using piecewise linear programming on the sample data instead of makingrestrictive assumptions about the underlying production technology. The importance of thisfeature here is that a university’s efficiency can be assessed based on other observed performance.As an efficient frontier technique, DEA identifies the inefficiency in a particular DMU bycomparing it to similar DMUs regarded as efficient, rather than trying to associate a DMU’sperformance with statistical averages that may not be applicable to that DMU.Fig. 1 shows a simple efficiency model to highlight this principle. The solid line going through
efficient DMUs B–D depicts the efficient frontier that represents achieved efficiency. For example,DMU A is classified as inefficient in this sample of 10 units. It needs to travel to A0 (i.e. compositeDMU) on the frontier before it can also be deemed efficient. DMUs C and D on the efficientfrontier (i.e. reference set or peer group of DMU A) are the units used for comparison incalculating the input/output configuration of its efficient composite DMU A0. The efficientfrontier envelopes all other data points, thus giving rise to the name data envelopment analysis.Usually, the number of physical units or transactions is used in DEA [3,22]. The principal
disadvantage of DEA is that it assumes these and other data to be free of measurement error [21].When the integrity of data has been violated, DEA results cannot be interpreted with confidence.While the need for reliable data is the same for all statistical analysis, DEA is particularly sensitiveto unreliable data because the units deemed efficient determine the efficient frontier and, thus, theefficiency scores of those units under this frontier. For example, an unintended reclassification ofthe efficient units could lead to recalculation of efficiency scores of the inefficient units. Thispotential problem with DEA is addressed through stochastic DEA designed to account forrandom disturbances. Two recent examples in this area are Li [23] and Sengupta [24].Another caveat of DEA is that those DMUs indicated as efficient are only efficient in relation to
others in the sample. It may be possible for a unit outside the sample to achieve a higher level ofefficiency than the best practice DMU in the sample. Another way of expressing this is to say that
Fig. 1. A two-output, one-input efficient frontier.
N.K. Avkiran / Socio-Economic Planning Sciences 35 (2001) 57–8060
an efficient unit does not necessarily produce the maximum output feasible for a given level ofinput [25].How can the educational administrator use DEA? It has already been stated that DEA
generates efficiency scores, thus helping to distinguish efficient from inefficient units. Nevertheless,a list of units sorted on efficiency scores cannot always be considered as truly rank ordered [9].DEA identifies a unit as either efficient or inefficient compared to other units in its reference set,where the reference set is comprised of efficient units most similar to that unit in theirconfiguration of inputs and outputs. Knowing which efficient universities are most comparable tothe inefficient university thus enables the educational administrator to better understand therelevant inefficiencies and subsequently re-allocate scarce resources to improve productivity.
2.2. Performance measurement in higher education
An overview of difficulties with some of the performance indicators in higher education couldbe a primer to understanding the potential role of DEA in efficiency analysis. For example, Caveet al. [26] describe a performance indicator such as ‘‘degree results’’ as a quality-adjusted measureof output. This indicator is typical of the ambiguity found in education performance indicators inthat high degree results may, for example, be due to high entry qualifications rather thaneffectiveness of teaching. Even the value added, productivity indicator, described as an input- andquality-adjusted output measure, relies on differences in qualifications that cannot be valued inmonetary terms.Typical performance indicators on the research side of the equation include number of
publications, number of citations of publications, journal impact factors, and reputationalranking. Number of publications, often interpreted as a measure of research activity, suffers fromthe problem of different practices across disciplines. For example, publishing in medicine mayconsume more time and resources and lead to fewer publications than publishing in business.There is also the difficulty of ownership since a research project started in one university will oftenbe carried to another university when the researcher relocates. The number of citations attractedby an article has its drawbacks as well; for example, articles in mathematics have a longer shelf lifethan those in pharmacy [27].Impact factors are not particularly measurement problem free either. For instance, academics
that devote most of their time to writing articles that are published in low impact journals will bedisadvantaged in this count regardless of the contribution of research to the body of knowledge.On the other hand, reputational ranking is bound to have considerable subjectivity and reflect ahistorical performance [26]. Clearly, the main criticism of performance indicators is their inabilityto capture the interplay among the various inputs and outputs. This is where DEA offers asolution.As has already been indicated, the current study develops performance models from the
perspective of the educational administrator or manager. A book by Thomas [28] discusses threeways of conceptualising the production process (inputs and outputs) of an educational institution.These are the production functions of the psychologist, the economist, and the administrator.Briefly, the psychologist’s perspective is concerned with the behavioural changes in students,
including values and interpersonal skills. However, the psychologist’s perspective generates lessagreement on the choice of inputs and outputs compared to the other perspectives. It often utilises
N.K. Avkiran / Socio-Economic Planning Sciences 35 (2001) 57–80 61
subjective inputs/outputs, which are difficult to quantify. The economist’s perspective concernsitself with the additional earnings generated by expenditure on schooling. Put another way,education is regarded as contributing to the economy through individuals with competencies [29].The administrator’s perspective focuses on the institutional manager’s attempts at allocating
resources to provide services. The key outputs under this approach emanate from teaching andresearch activities, with research as the more difficult of the two to measure. The administratorwould be primarily interested in controllable inputs. For example, in the case of staff inputs, it isappropriate to use salary as a proxy since it represents the monetary value of key inputs into theteaching and research processes [29]. Alternatively, a measurement can be taken with full-timeequivalence (FTE).In education, it is difficult to use market mechanisms such as profits to determine the
performance of a DMU [30]. A key advantage of DEA is that educational administrators or theirnominated researchers can choose inputs and outputs to represent a particular perspective orapproach. For example, key business drivers critical to success of the organisation can be theoutputs. Then, those variables that can be argued to manifest themselves as outputs become theinputs. A simple model of university efficiency might argue that when academic staff and buildingsand grounds (inputs) are put together, they give rise to enrolments (output). Hence, a resource isclassified as an input while anything that uses resources is classified as an output. DEA forcespolicy-makers to explicitly state the objectives of the organisation. Ultimately, these objectivesbecome the outputs in efficiency modelling and the resources needed become the inputs. A surveyof literature on applications of DEA in higher education follows.
2.2.1. DEA and university departmentsThe application of DEA to universities has generally focused on the efficiencies of university
programs or departments. The seven key studies are by Bessent et al. [31], Tomkins and Green[32], Beasley [33], Johnes and Johnes [34], Stern et al. [35], Beasley [36] and Johnes and Johnes [6].Bessent et al. [31] used DEA in measuring the relative efficiency of education programs in a
community college. Educational programs (DMUs) were assessed on such outputs as revenuefrom state government, number of students completing a program, and employer satisfaction withtraining of students. These outputs represented significant planning objectives. Inputs includedstudent contact hours, number of full-time equivalent instructors, square feet of facilities for eachprogram, and direct instructional expenditures. The authors demonstrated how DEA can be usedin improving programs, terminating programs, initiating new programs, or discontinuinginefficient programs.Tomkins and Green [32] studied the overall efficiency of university accounting departments.
They ran a series of six efficiency models of varying complexity where staff numbers was an inputand student numbers an output. Results indicated that different configurations of multipleincommensurate inputs and outputs produced substantially stable efficiency scores. On the otherhand, Beasley [33] studied chemistry and physics departments on productive efficiency wherefinancial variables such as research income and expenditure were treated as inputs. Outputsconsisted of undergraduate and postgraduate student numbers as well as research ratings. In afollow-up study, Beasley [36] analysed the same data set in an effort to determine the research andteaching efficiencies jointly, where weight restrictions were used.
N.K. Avkiran / Socio-Economic Planning Sciences 35 (2001) 57–8062
Johnes and Johnes [6,34] explored various models in measuring the technical efficiency ofeconomics departments in terms of research output. They discuss the potential problems inchoosing inputs and outputs. The authors also provide a good guide to interpreting efficiencyscores. It is interesting to note that both Beasley [33] and Johnes and Johnes [6] list researchincome as an input.Stern et al. [35] examined the relative efficiency of 21 academic departments in Ben-Gurion
University. Operating costs and salaries were entered as inputs, while grants, publications,graduate students, and contact hours comprised the outputs. Analysis suggested that theoperating costs could be reduced in 10 departments. Furthermore, the authors tested for thesensitivity of efficiency scores to deleting or combining variables. Their findings indicated thatefficient departments may be re-rated as inefficient as a result of changing the variable mix.Similarly, Nunamaker [12], who has investigated the effects of changing the variable mix on DEAscores, reported a general rise when new variables were added or existing variables disaggregated.
2.2.2. DEA and universitiesThere are six main studies that have used DEA to investigate the relative efficiency of
universities (rather than departments) [37–42]. Ahn (in [37,38,40]) looked at the efficiency of USuniversities through DEA and compared findings to observations made using managerialaccounting measures and econometric approaches. In comparing the efficiency of publicuniversities in Texas, Ahn used faculty salaries, state research funds, administrative overheads,and total investment in physical plants as the inputs to the efficiency model. Outputs were numberof undergraduate enrolments, number of graduate enrolments, total semester credit hours, andfederal and private research funds. Ahn listed state research funds as an input because the stategovernment allocated such funds to assist in securing grants from the Federal Government andfrom industry. He used research income from agencies such as the US National ScienceFoundation as outputs because it provided a way to quantify peer group evaluation. Inclusion ofone source of research funds as an input and the other source as an output highlights the necessityto scrutinise the nature of a factor before classification. Indeed, the selection of factors is a criticalinput by the researcher when using DEA.Ahn and Seiford [39] examined public and private doctoral-granting US institutions to test the
sensitivity of findings in four DEA and four performance models. This was achieved by testing forstatistically significant differences between mean model scores rather than focusing on individualinstitutions. On the inputs side, they listed faculty salaries, physical investment, and overheads ascommon variables across all models. On the other side, undergraduate and graduate FTEs,degrees and grants comprised the mix of outputs. They inferred that relative efficiency results wereconsistent across the DEA models. However, aggregation of outputs resulted in lower efficiencyscores. Furthermore, public institutions emerged as more efficient than private ones where closelymonitored and high-profile outputs such as enrolments were used.Coelli [43] reported his attempts to gauge the performance of University of New England
(UNE) relative to 35 other Australian universities. Three performance models were tested,namely, university as a whole, academic sections, and administrative sections. The university andacademic models shared the same outputs in student numbers and publication index (weighted bytype). In the administration model, total staff numbers replaced publication index. Total staffnumbers also appeared as an input in the university model. Other inputs used across the three
N.K. Avkiran / Socio-Economic Planning Sciences 35 (2001) 57–80 63
efficiency models were non-staff expenses, other expenses, other administration expenses, andadministration staff. All models were set up as 2� 2 (outputs� inputs). Conclusions of the studyindicated that while UNE’s overall performance compared favourably to that of otheruniversities, there was scope for improving the performance of the administrative sector. Nosignificant relationship was found between efficiency and percent of external enrolments orproportion of part-time enrolments. Furthermore, UNE was operating at optimal scale. Part ofthis study is also reported in Coelli et al. [42].The article by Breu and Raab [41] used commonly available performance indicators to measure
the relative efficiency of the top 25 US universities (as ranked by US News and World Report).Outputs used were graduation rate and freshman retention rate as measures of studentsatisfaction. Inputs included SAT/ACT average or midpoint, percentage faculty with doctorates,faculty to student ratio, and educational and general expenditures per student. Their findingsindicated that universities with high prestige and reputation did not necessarily produce higherstudent satisfaction. The authors concluded the study by proposing that universities spend less onenhancing perceived quality and spend more effort on raising efficiency.It should be clear by now that there is no definitive study to guide the selection of inputs/
outputs in educational applications of DEA. While outputs can be generally categorised intoteaching, research, and service, it is very difficult to find true measures for these dimensions [39,p. 197]. In short, it is possible for the analyst to select a parsimonious set of desired outputs,provided they can be reasoned to be manifestations of inputs. There is thus a pressing need for thechoice of inputs and outputs to reflect the industry or the setting examined. Accepted theories indifferent fields can also be employed to help select the inputs and outputs. In this study,production theory provides the starting point for efficiency modelling.Production theory is concerned with relationships among the inputs and outputs of
organisations [44]. This approach requires the specification of inputs and outputs in quantitativeterms. According to Lindsay [29] and Johnes [44], some of the generally agreed inputs ofuniversities can be classified as human and physical capital, and outputs as arising from teachingand research activities. In selecting variables, controllable inputs and those outputs of particularinterest to administrators are preferred. However, there is always the danger of excluding animportant performance variable due to lack of suitable data or to limitations imposed by smallsample sizes. Therefore, it is essential to develop a good understanding of the inputs and outputsbefore interpreting results of any efficiency model.
3. Research design
3.1. Defining performance models
Calculation of relative efficiency scores with different models generates insight into theperformance of DMUs on various dimensions, thus guiding managerial action [12]. Theproduction approach was used here to design the first performance model called ‘overallperformance of universities’ (see Table 1). The argument in the overall performance model is thatuniversities employ people to produce enrolments, and generate research output. It is assumedthat staff numbers capture the physical capital input dimension. Inclusion of enrolments as output
N.K. Avkiran / Socio-Economic Planning Sciences 35 (2001) 57–8064

recognises the importance of this measure in Federal funding. In this instance, research output isrepresented by Research Quantum, which is the research component of Federal funds given touniversities in recognition of their share of overall research activity. Part of Research Quantum isindexed to the number of publications, which carries a 12.5% weighting in the Composite Indexused to calculate the Research Quantum. (Other components of the index are competitive researchgrants earned and higher degree research completions [45].)The second performance model focuses on delivery of educational services (see Table 2). The
inputs are the same as in the first model. The purpose here is to compare how successful staff arein delivering the educational services that contribute to enrolling graduating students into othercourses in the same university (retention rate); successful student subject load (student progressrate); and, proportion of graduates in full-time employment as a percentage of graduates availablefor full-time work (graduate full-time employment rate).The third performance model is designed to explore the success of universities in attracting fee-
paying students. In the context of the recent changes in Australia, where Federal budgetcontributions to universities are in decline, there is a growing pressure on universities to fill thisfinancial gap by increasing the number of fee-paying enrolments. The model depicted in Table 3
Table 1Overall performance (model 1)a
Inputs Outputs
Academic staff, FTE
[AcaFTE]
Undergraduate enrolments,
EFTSU[UgEFTSU]
Non-academic staff, FTE
[NonAcaFTE]
Postgraduate enrolments,
EFTSU[PgEFTSU]Research quantum
[RQ]
aNote: FTE, full-time equivalence. EFTSU, equivalent full-time student unit, measures student load. Research quantum is
expressed as share of Commonwealth Government grants (%).
Table 2Performance on delivery of educational services (model 2)
Inputs Outputs
Academic staff, FTE Student retention rate (%)[AcaFTE] [RetRate]
Non-academic staff, FTE Student progress rate (%)[NonAcaFTE] [ProgRate]
Graduate full-time employmentrate (%) [EmplRate]
N.K. Avkiran / Socio-Economic Planning Sciences 35 (2001) 57–80 65
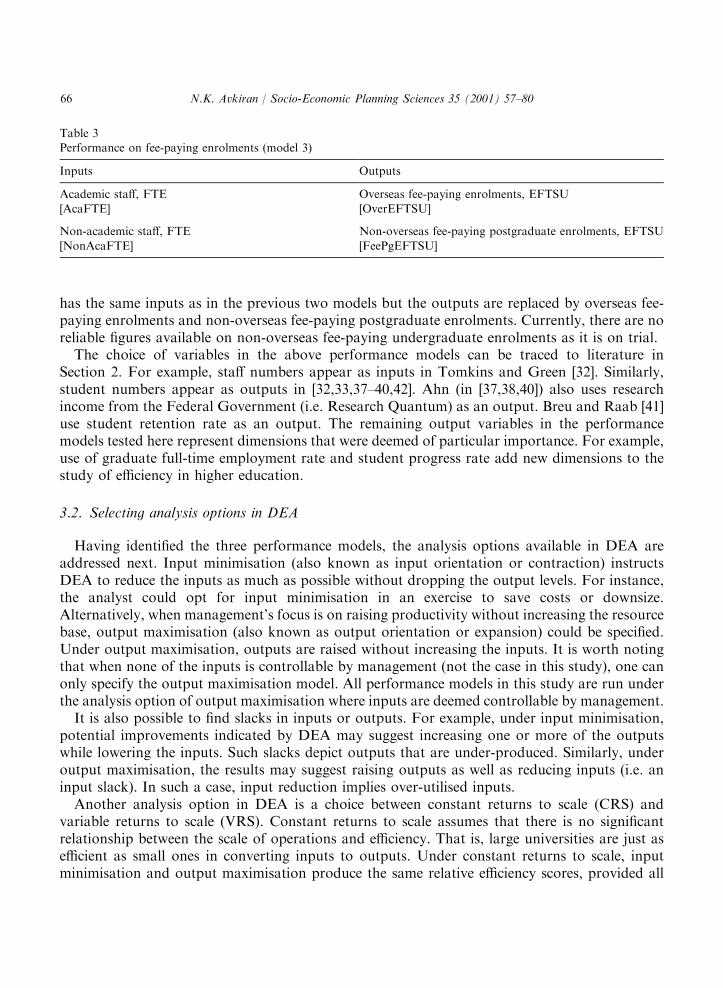
has the same inputs as in the previous two models but the outputs are replaced by overseas fee-paying enrolments and non-overseas fee-paying postgraduate enrolments. Currently, there are noreliable figures available on non-overseas fee-paying undergraduate enrolments as it is on trial.The choice of variables in the above performance models can be traced to literature in
Section 2. For example, staff numbers appear as inputs in Tomkins and Green [32]. Similarly,student numbers appear as outputs in [32,33,37–40,42]. Ahn (in [37,38,40]) also uses researchincome from the Federal Government (i.e. Research Quantum) as an output. Breu and Raab [41]use student retention rate as an output. The remaining output variables in the performancemodels tested here represent dimensions that were deemed of particular importance. For example,use of graduate full-time employment rate and student progress rate add new dimensions to thestudy of efficiency in higher education.
3.2. Selecting analysis options in DEA
Having identified the three performance models, the analysis options available in DEA areaddressed next. Input minimisation (also known as input orientation or contraction) instructsDEA to reduce the inputs as much as possible without dropping the output levels. For instance,the analyst could opt for input minimisation in an exercise to save costs or downsize.Alternatively, when management’s focus is on raising productivity without increasing the resourcebase, output maximisation (also known as output orientation or expansion) could be specified.Under output maximisation, outputs are raised without increasing the inputs. It is worth notingthat when none of the inputs is controllable by management (not the case in this study), one canonly specify the output maximisation model. All performance models in this study are run underthe analysis option of output maximisation where inputs are deemed controllable by management.It is also possible to find slacks in inputs or outputs. For example, under input minimisation,
potential improvements indicated by DEA may suggest increasing one or more of the outputswhile lowering the inputs. Such slacks depict outputs that are under-produced. Similarly, underoutput maximisation, the results may suggest raising outputs as well as reducing inputs (i.e. aninput slack). In such a case, input reduction implies over-utilised inputs.Another analysis option in DEA is a choice between constant returns to scale (CRS) and
variable returns to scale (VRS). Constant returns to scale assumes that there is no significantrelationship between the scale of operations and efficiency. That is, large universities are just asefficient as small ones in converting inputs to outputs. Under constant returns to scale, inputminimisation and output maximisation produce the same relative efficiency scores, provided all
Table 3Performance on fee-paying enrolments (model 3)
Inputs Outputs
Academic staff, FTE Overseas fee-paying enrolments, EFTSU
[AcaFTE] [OverEFTSU]
Non-academic staff, FTE Non-overseas fee-paying postgraduate enrolments, EFTSU
[NonAcaFTE] [FeePgEFTSU]
N.K. Avkiran / Socio-Economic Planning Sciences 35 (2001) 57–8066
inputs are controllable. On the other hand, variable returns to scale means a rise in inputs isexpected to result in a disproportionate rise in outputs [22]. VRS is preferred when a significantcorrelation between DMU size and efficiency can be demonstrated in a large sample. In such anexercise, academic staff numbers can represent the size of the university [6].An alternative approach that removes much of the guesswork from choosing between CRS and
VRS is to run the performance models under each assumption and compare the efficiency scores.If a majority of the DMUs emerge with different scores under the two assumptions, then it is safeto assume VRS. Put another way, if the majority of DMUs are assessed as having the sameefficiency, one can employ CRS without being concerned that scale inefficiency might confoundthe measure of technical efficiency.The CRS efficiency score represents technical efficiency, which measures inefficiencies due to
input/output configuration and as well as size of operations. On the other hand, the VRSefficiency score represents pure technical efficiency, that is, a measure of efficiency without scaleefficiency. It is thus possible to decompose TE into PTE and SE. Scale efficiency can be calcu-lated by dividing PTE into TE. The graphical derivation of this relationship can be found inCoelli et al. [42].Once the VRS is established and SE scores computed, the analysis can be taken a step further.
This involves determining whether a particular DMU is experiencing increasing or decreasingreturns to scale. To make this assessment, DEA is repeated with non-increasing returns to scale(NIRS) and efficiency scores compared. It should be noted that, by definition, NIRS implies CRSor DRS. So, if the score for a particular DMU under VRS equals the NIRS score, then that DMUmust be operating under DRS. On the other hand, if the score under VRS is not equal to the NIRSscore, then the DMU is operating under IRS [42]. The procedure just described is automated inthe DEA software DEAP where the test output identifies the returns to scale of each DMU.It is also possible to impose weight restrictions on inputs and outputs to reflect their perceived
relative importances. For example, if university policy-makers regard postgraduate enrolments asmore desirable than undergraduate enrolments, then appropriate constraints can be set up in thelinear program. However, before imposing weight restrictions on the optimisation program, theanalyst should look for evidence of a variable being either over- or under-represented incomputation of efficiency scores. Furthermore, there is a caveat for using weight restrictions evenin the presence of such evidence. That is, too many restricted variables will disrupt optimisation.In this study, no weight restrictions are imposed. Those interested in further discussion of weightrestrictions are referred to Dyson et al. [46], Beasley [33], Boussofiane et al. [47], Allen et al. [48],and Thanassoulis and Allen [49].
3.3. Data and sample
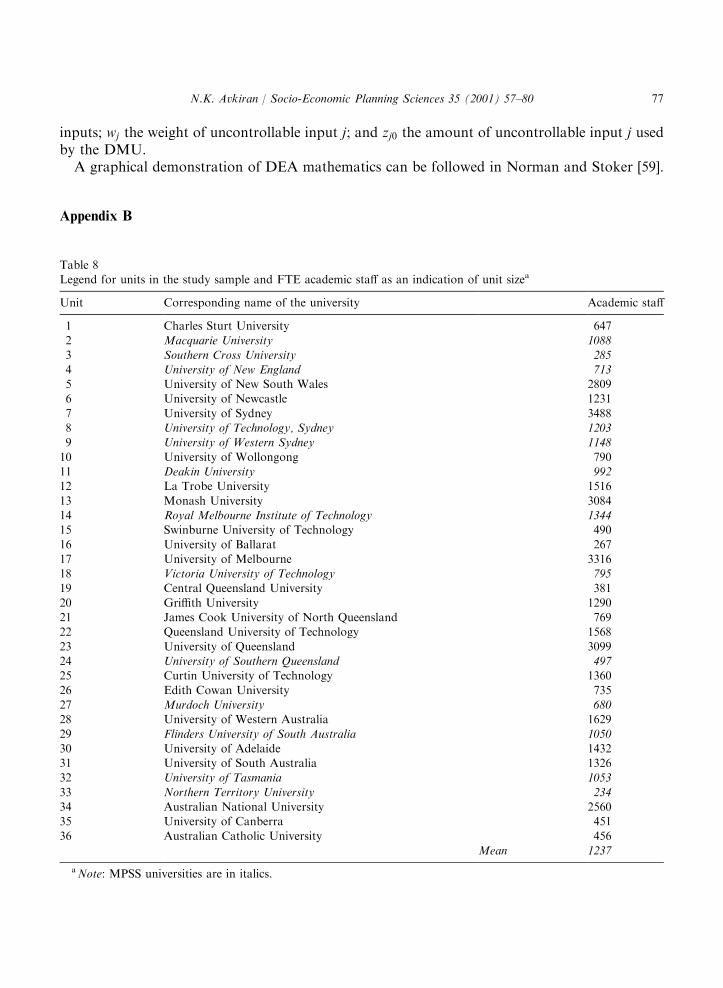
Data for inputs and outputs identified in Tables 1–3 were extracted from publications by theDepartment of Employment, Education, Training and Youth Affairs (DEETYA) for 1995.Selected Higher Education Statistics series and the report by Andrews et al. [50] were the mainsources of data. (The latter report can be downloaded from www.deetya.gov.au.)The 36 universities investigated correspond to the total number of universities in the period and
represent a healthy sample size (see Table 8). In order to discriminate effectively between efficientand inefficient universities, there is a need for a sample size larger than the product of number of
N.K. Avkiran / Socio-Economic Planning Sciences 35 (2001) 57–80 67
inputs and outputs [46]. However, DEA can be used with small sample sizes [51] and many suchexamples can be found in the literature (e.g. [5,52–54]). Another rule of thumb for selecting anappropriate sample size is to ensure that it is at least 3 times larger than the sum of the number ofinputs and outputs [35].It is also worth remembering that DEA provides meaningful results when it is applied to
homogeneous samples. For example, DEA would not be an appropriate technique to compare therelative efficiencies of universities and secondary schools because their inputs and outputs wouldbe significantly different.
4. Results and analysis
4.1. Initial results
This section begins by addressing the question of constant versus variable returns to scale.Correlating FTE academic staff (proxy for institutional size) with efficiency scores gives acoefficient of ÿ0.60 in model 1, ÿ0.74 in model 2, and ÿ0.13 in model 3. The coefficients indicatethat assuming CRS may not be appropriate. This is further probed by re-running the models withvariable returns to scale. Comparing the two runs reveals different efficiency scores, thusconfirming the presence of variable returns to scale among Australian universities. Hence, all themodels in this study were tested under VRS. However, the downside of choosing VRS is a loss ofdiscriminating power as evidenced by a rise in the number of efficient units.Results of our tests are summarised in Table 4. The mean score in models 1 and 2 are high. This
can be interpreted as the higher education sector performing equally well when overallperformance is compared with the efficiency of delivery of educational services. The high PTE alsosuggests a substantially scale-efficient sector. However, the lower mean and higher standarddeviation of scores in model 3 confirm the poor performance of the sector on attracting fee-payingstudents. Thus, the greatest potential improvements lie in model 3. This is an expected findinggiven only the recent introduction of non-overseas fee-paying postgraduate enrolments.Is there any evidence for the discriminatory power of the three performance models? Assuming
models 2 and 3 are subsumed to model 1, we search for correspondence between efficient units.That is, a model that is efficient in model 2 or 3, is expected to be efficient in model 1 as well.Examination of Table 4 reveals that seven out of 12 efficient units in model 2 are also efficient inmodel 1. Similarly, nine out of 10 efficient units in model 3 are also efficient in model 1. Theseobservations indicate a considerable level of discriminatory power. Tomkins and Green [32] alsoreported discriminating models in their study.
4.2. Potential improvements in efficiency
For brevity, Table 5 shows the potential improvements only for the most inefficient universitiesin each performance model. In the case of unit 34 in model 1, the university can increase itsenrolments of undergraduates and postgraduates as well as its research output by 122%.Furthermore, the above increases in outputs can be achieved while simultaneously reducingacademic staff numbers. Indicated reduction in academic staff numbers is an input slack and
N.K. Avkiran / Socio-Economic Planning Sciences 35 (2001) 57–8068
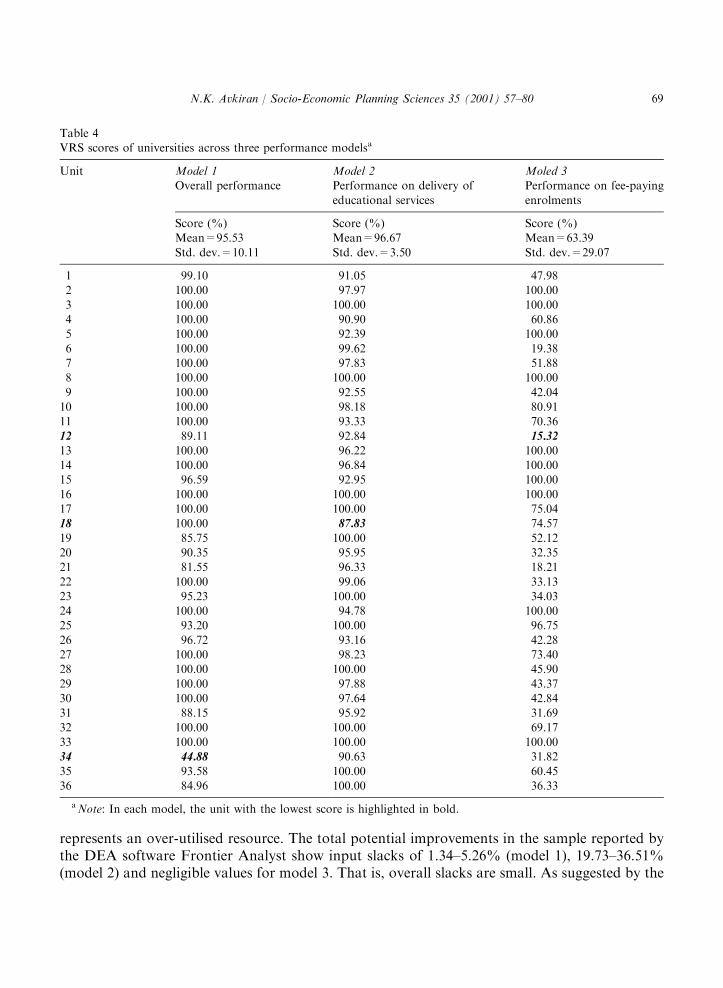
represents an over-utilised resource. The total potential improvements in the sample reported bythe DEA software Frontier Analyst show input slacks of 1.34–5.26% (model 1), 19.73–36.51%(model 2) and negligible values for model 3. That is, overall slacks are small. As suggested by the
Table 4VRS scores of universities across three performance modelsa
Unit Model 1 Model 2 Moled 3Overall performance Performance on delivery of
educational services
Performance on fee-paying
enrolments
Score (%) Score (%) Score (%)Mean=95.53 Mean=96.67 Mean=63.39
Std. dev.=10.11 Std. dev.=3.50 Std. dev.=29.07
1 99.10 91.05 47.982 100.00 97.97 100.00
3 100.00 100.00 100.004 100.00 90.90 60.865 100.00 92.39 100.00
6 100.00 99.62 19.387 100.00 97.83 51.888 100.00 100.00 100.00
9 100.00 92.55 42.0410 100.00 98.18 80.9111 100.00 93.33 70.36
12 89.11 92.84 15.32
13 100.00 96.22 100.0014 100.00 96.84 100.0015 96.59 92.95 100.00
16 100.00 100.00 100.0017 100.00 100.00 75.0418 100.00 87.83 74.57
19 85.75 100.00 52.1220 90.35 95.95 32.3521 81.55 96.33 18.21
22 100.00 99.06 33.1323 95.23 100.00 34.0324 100.00 94.78 100.0025 93.20 100.00 96.75
26 96.72 93.16 42.2827 100.00 98.23 73.4028 100.00 100.00 45.90
29 100.00 97.88 43.3730 100.00 97.64 42.8431 88.15 95.92 31.69
32 100.00 100.00 69.1733 100.00 100.00 100.0034 44.88 90.63 31.82
35 93.58 100.00 60.4536 84.96 100.00 36.33
aNote: In each model, the unit with the lowest score is highlighted in bold.
N.K. Avkiran / Socio-Economic Planning Sciences 35 (2001) 57–80 69
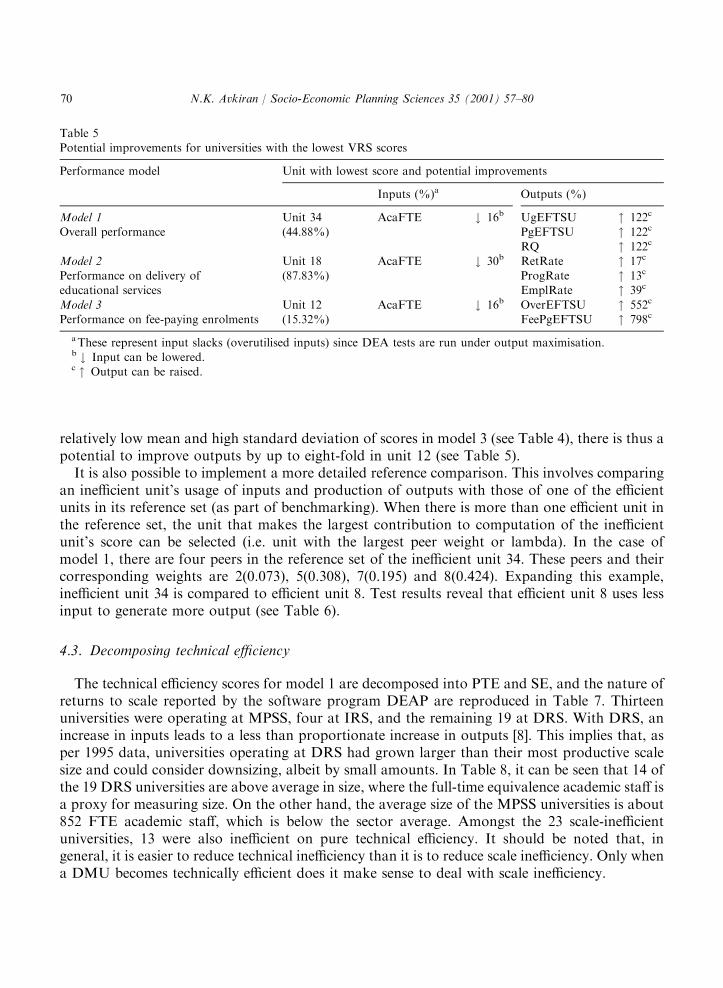
relatively low mean and high standard deviation of scores in model 3 (see Table 4), there is thus apotential to improve outputs by up to eight-fold in unit 12 (see Table 5).It is also possible to implement a more detailed reference comparison. This involves comparing
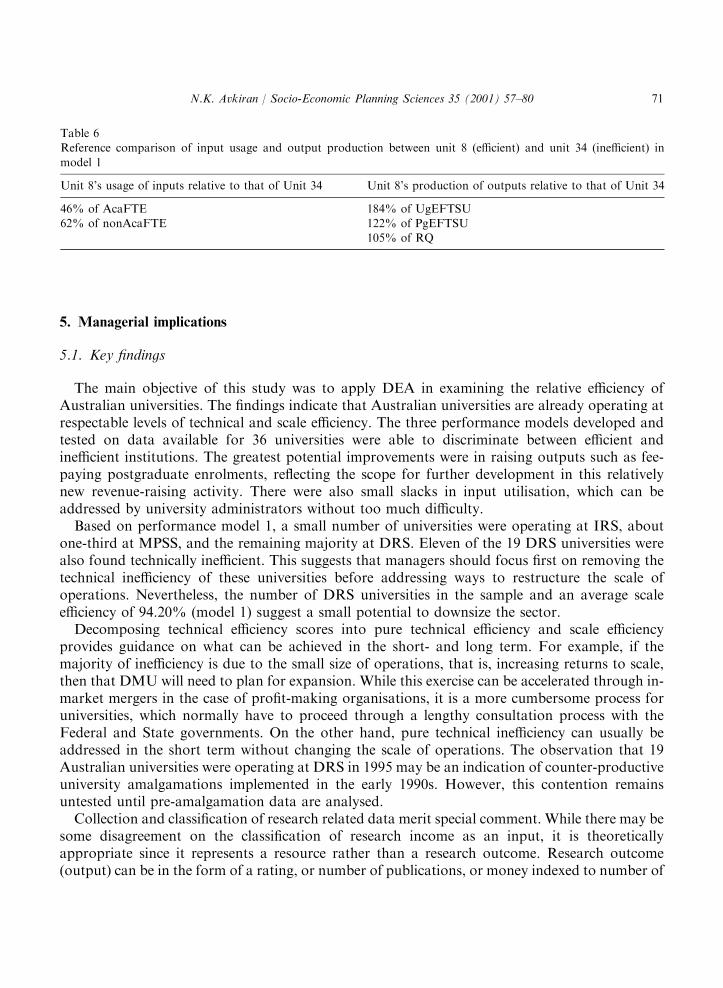
an inefficient unit’s usage of inputs and production of outputs with those of one of the efficientunits in its reference set (as part of benchmarking). When there is more than one efficient unit inthe reference set, the unit that makes the largest contribution to computation of the inefficientunit’s score can be selected (i.e. unit with the largest peer weight or lambda). In the case ofmodel 1, there are four peers in the reference set of the inefficient unit 34. These peers and theircorresponding weights are 2(0.073), 5(0.308), 7(0.195) and 8(0.424). Expanding this example,inefficient unit 34 is compared to efficient unit 8. Test results reveal that efficient unit 8 uses lessinput to generate more output (see Table 6).
4.3. Decomposing technical efficiency
The technical efficiency scores for model 1 are decomposed into PTE and SE, and the nature ofreturns to scale reported by the software program DEAP are reproduced in Table 7. Thirteenuniversities were operating at MPSS, four at IRS, and the remaining 19 at DRS. With DRS, anincrease in inputs leads to a less than proportionate increase in outputs [8]. This implies that, asper 1995 data, universities operating at DRS had grown larger than their most productive scalesize and could consider downsizing, albeit by small amounts. In Table 8, it can be seen that 14 ofthe 19 DRS universities are above average in size, where the full-time equivalence academic staff isa proxy for measuring size. On the other hand, the average size of the MPSS universities is about852 FTE academic staff, which is below the sector average. Amongst the 23 scale-inefficientuniversities, 13 were also inefficient on pure technical efficiency. It should be noted that, ingeneral, it is easier to reduce technical inefficiency than it is to reduce scale inefficiency. Only whena DMU becomes technically efficient does it make sense to deal with scale inefficiency.
Table 5Potential improvements for universities with the lowest VRS scores
Performance model Unit with lowest score and potential improvements
Inputs (%)a Outputs (%)
Model 1Overall performance
Unit 34(44.88%)
AcaFTE # 16b UgEFTSUPgEFTSU
" 122c
" 122c
RQ " 122c
Model 2Performance on delivery ofeducational services
Unit 18(87.83%)
AcaFTE # 30b RetRateProgRateEmplRate
" 17c
" 13c
" 39c
Model 3Performance on fee-paying enrolments
Unit 12(15.32%)
AcaFTE # 16b OverEFTSUFeePgEFTSU
" 552c
" 798c
aThese represent input slacks (overutilised inputs) since DEA tests are run under output maximisation.b # Input can be lowered.c " Output can be raised.
N.K. Avkiran / Socio-Economic Planning Sciences 35 (2001) 57–8070
5. Managerial implications
5.1. Key findings
The main objective of this study was to apply DEA in examining the relative efficiency ofAustralian universities. The findings indicate that Australian universities are already operating atrespectable levels of technical and scale efficiency. The three performance models developed andtested on data available for 36 universities were able to discriminate between efficient andinefficient institutions. The greatest potential improvements were in raising outputs such as fee-paying postgraduate enrolments, reflecting the scope for further development in this relativelynew revenue-raising activity. There were also small slacks in input utilisation, which can beaddressed by university administrators without too much difficulty.Based on performance model 1, a small number of universities were operating at IRS, about
one-third at MPSS, and the remaining majority at DRS. Eleven of the 19 DRS universities werealso found technically inefficient. This suggests that managers should focus first on removing thetechnical inefficiency of these universities before addressing ways to restructure the scale ofoperations. Nevertheless, the number of DRS universities in the sample and an average scaleefficiency of 94.20% (model 1) suggest a small potential to downsize the sector.Decomposing technical efficiency scores into pure technical efficiency and scale efficiency
provides guidance on what can be achieved in the short- and long term. For example, if themajority of inefficiency is due to the small size of operations, that is, increasing returns to scale,then that DMU will need to plan for expansion. While this exercise can be accelerated through in-market mergers in the case of profit-making organisations, it is a more cumbersome process foruniversities, which normally have to proceed through a lengthy consultation process with theFederal and State governments. On the other hand, pure technical inefficiency can usually beaddressed in the short term without changing the scale of operations. The observation that 19Australian universities were operating at DRS in 1995 may be an indication of counter-productiveuniversity amalgamations implemented in the early 1990s. However, this contention remainsuntested until pre-amalgamation data are analysed.Collection and classification of research related data merit special comment. While there may be
some disagreement on the classification of research income as an input, it is theoreticallyappropriate since it represents a resource rather than a research outcome. Research outcome(output) can be in the form of a rating, or number of publications, or money indexed to number of
Table 6Reference comparison of input usage and output production between unit 8 (efficient) and unit 34 (inefficient) in
model 1
Unit 8’s usage of inputs relative to that of Unit 34 Unit 8’s production of outputs relative to that of Unit 34
46% of AcaFTE 184% of UgEFTSU62% of nonAcaFTE 122% of PgEFTSU
105% of RQ
N.K. Avkiran / Socio-Economic Planning Sciences 35 (2001) 57–80 71

publications that eventually finds its way back to the university. Of course, when the focus ofefficiency analysis shifts from production of research to a purely financial outlook, then it is quiteacceptable to list research income as an output.
Table 7Decomposed technical efficiency scores and nature of returns to scale (model 1)a
Unit Technical efficiency(CRS scores)
Pure technical efficiency(VRS scores)
Scale efficiencyMean=94.20
Nature of returnsto scale
Mean=90.01 Mean=95.53 Std. dev. = 8.31Std. dev.=12.69 Std. dev.=10.11
1 98.30 99.10 99.20 IRS
2 100.00 100.00 100.00 MPSS3 100.00 100.00 100.00 MPSS4 100.00 100.00 100.00 MPSS
5 95.50 100.00 95.50 DRS6 94.80 100.00 94.80 DRS7 80.80 100.00 80.80 DRS8 100.00 100.00 100.00 MPSS
9 100.00 100.00 100.00 MPSS10 98.00 100.00 98.00 IRS11 100.00 100.00 100.00 MPSS
12 80.20 89.11 90.00 DRS13 77.00 100.00 77.00 DRS14 100.00 100.00 100.00 MPSS
15 93.60 96.59 96.90 DRS16 90.30 100.00 90.30 IRS17 77.70 100.00 77.70 DRS
18 100.00 100.00 100.00 MPSS19 85.10 85.75 99.20 IRS20 85.00 90.35 94.10 DRS21 80.40 81.55 98.60 DRS
22 87.40 100.00 87.40 DRS23 61.90 95.23 65.00 DRS24 100.00 100.00 100.00 MPSS
25 85.30 93.20 91.50 DRS26 96.30 96.72 99.60 DRS27 100.00 100.00 100.00 MPSS
28 84.70 100.00 84.70 DRS29 100.00 100.00 100.00 MPSS30 91.10 100.00 91.10 DRS31 82.70 88.15 93.80 DRS
32 100.00 100.00 100.00 MPSS33 100.00 100.00 100.00 MPSS34 39.90 44.88 88.90 DRS
35 92.70 93.58 99.10 DRS36 83.90 84.96 98.80 DRS
aNote: CRS denotes constant returns to scale. DRS denotes decreasing returns to scale. MPSS denotes mostproductive scale size. VRS denotes variable returns to scale. Technical efficiency=pure technical efficiency � scaleefficiency.
N.K. Avkiran / Socio-Economic Planning Sciences 35 (2001) 57–8072
There are also potential problems in collecting data on research income and research outcome.The long and variable lead times between receipt of research income and publications means onecannot easily put together corresponding data for a particular year. In Australia, an additionaldifficulty has been the unreliable nature of refereed publications reported by universities.Independent audits by the consulting firm KPMG over the last 2 years have revealed mistakes inclassification and counting of publications, raising the question about whether research outcomescan be satisfactorily quantified.In this article, Research Quantum was used as an output in recognition of its importance in
university life. However, the reader is warned that DEA results are bound to be distorted in someunquantifiable way when the integrity of data has been partially violated. Nevertheless, suchissues should not detract from the value of the current study. This is the case since its purpose hasalready been established as demonstrating the use of DEA when examining the relative efficiencyof universities rather than seeking a rank ordering.
5.2. Potential use and limitations of DEA
The DEA process outlined in this study can help public policy-makers and university executivesallocate scarce resources and provide direction for improvement of productivity. In anatmosphere of increasing public accountability, universities can no longer afford to overlookscientific techniques that can assist in analysis of efficiency and performance. In the absence ofmarket mechanisms to price educational outputs, which renders traditional production or costfunctions inappropriate, universities are particularly obliged to seek alternative efficiency analysismethods. DEA provides such a method.DEA helps in identifying peer groups for inefficient DMUs and objectively determines
the productivity improvements. As such, it can be a valuable benchmarking tool formanagement. A less tangible benefit of using DEA is that management must identify thekey inputs/outputs of the organisation where they may not have pursued such a specific lineof inquiry in the past. Organisations that are familiar with the balanced scorecardsystem of integrating financial measures with non-financial operational measures willfind DEA a natural extension of such activities. Clearly, once the key inputs/outputs areidentified, it is essential to ensure the integrity of data if DEA results are to be used withconfidence.As more consistent and reliable data become available, DEA can be used in longitudinal studies
to observe which DMUs are efficient over time. Window analysis can be carried out to assess thestability of relative efficiency scores (see [16,37,55]). In such an exercise, large changes should beinvestigated with care. Another advantage of a longitudinal study is the ability to discoverwhether data contain a significant random component. This is important since one of theprincipal tenets of traditional DEA is that data are free of statistical noise. It would also be aworthwhile exercise to probe longitudinal data for evidence of changes to scale efficiency. Thereliability of DEA could be enhanced by following standardised accounting and reportingpractices, as well as regular audits [12].A further possibility would be to introduce additional key variables such as the ‘entry
qualifications of students’. Model 2 (performance on delivery of educational services) is aparticularly sensible entry point for this new variable where one would normally expect the
N.K. Avkiran / Socio-Economic Planning Sciences 35 (2001) 57–80 73
outputs to be influenced by entry qualifications. Unfortunately, existing university admissionsystems are not uniform across different states of Australia, making it nearly impossible to gatherconsistent and reliable data on undergraduate entry qualifications.Like most other techniques, DEA has its limitations. While DEA can be used to set targets
for improvement of desired outputs, it does not instruct the user on how to reach thosetargets. DEA’s main application as a managerial decision-making tool should be one of testingestablished knowledge and initiating an investigation when a significant contradiction arises. Forexample, in Table 5, one of the potential improvements suggested for unit 12 (in model 3) was toraise the overseas fee-paying student enrolment by 552%. Before such an exercise can beundertaken, it would be essential to investigate what sort of organisational or environmentalfactors may be obstructing the manifestation of relevant inputs as outputs. In such a scenario, themanagement of unit 12 would need to closely examine the configuration of efficient units in itsreference set.
5.3. Conclusion
While universities are, more than ever, being evaluated on quantifiable inputs and outputs,higher education still retains certain key characteristics that set it apart from other types oforganisations. These key characteristics are ‘‘the lack of profit motive, goal diversity anduncertainty, diffuse decision making, and poorly understood production technology’’ [29, p. 176].Lindsay’s 18-year-old comments maintain most of their currency today. It is this nature of highereducation that continues to complicate selecting inputs/outputs and undertaking inter-institutional comparisons that satisfy all parties.Nevertheless, application of DEA provides an avenue to explore the efficiency of converting
multiple inputs into multiple outputs in higher education. We conclude this article by presentingan application checklist for the benefit of those who are keen to implement data envelopmentanalysis:
1. Define the decision-making unit to be studied e.g. university, department, program, etc. Howmany of these units are there?
2. Identify the drivers (outputs) critical to the success of the decision-making unit.3. Identify the key resources (inputs) that support the key drivers. Here, a process analysis can
provide direction.4. Are data on the key outputs/inputs collected in a regular and consistent manner?5. Is there a particular aspect that you would like to analyse in terms of the unit’s efficiency? For
example, overall efficiency, service volume, service quality, and so on.6. Are you interested in output maximisation or input minimisation as the main objective?7. Run the DEA calculations and determine the units reported as inefficient.8. Are the units reported as inefficient consistently so over time? Here, window analysis is
recommended.9. Are inefficient units measured as efficient when analysed under different methods? If so,
determine why. For example, see whether environmental factors have been adequatelyconsidered.
10. Identify the best practice unit in the sample.
N.K. Avkiran / Socio-Economic Planning Sciences 35 (2001) 57–8074

11. Identify potential improvements for the inefficient units as well as their correspondingreference sets.
12. Are there constraints to implementation of the potential improvements? To answer this, re-visit the outputs and inputs studied.
Appendix A
A.1. A quick introduction to the mathematics of DEA
Productivity is defined as the ratio of the weighted sum of outputs to the weighted sum ofinputs. Mathematically, the relative efficiency of a DMU can be written as follows:
h0 ¼Ps
r¼1 uryr0Pmi¼1 vixi0
, ðA:1Þ
where s is the numbre of outputs; ur the weight of output r; yr0 the amount of output r producedby the DMU; m the number of inputs; vi the weight of input i; and xi0 the amount of input i usedby the DMU.Eq. (A.1) assumes constant returns to scale and controllable inputs. While outputs and inputs
can be measured and entered in this equation without standardisation, determining a common setof weights can be difficult. DMUs might value outputs and inputs quite differently. The CCRmodel addresses this concern.
A.2. CCR model
Charnes et al. [56] addressed the above problem by permitting a DMU to adopt a set of weightsthat will maximise its productivity ratio without this ratio exceeding 1.0 for other DMUs.Introducing this constraint converts the productivity ratio into a measure of relative efficiency.Thus, Eq. (A.1) is re-written in the form of a fractional programming problem.
max h0 ¼Ps
r¼1 uryr0Pmi¼1 vixi0
ðA:2Þ
subject toPsr¼1 uryrjPmi¼1 vixij
� 1 for eachDMU in the sample; where j ¼ 1; . . . ; n ðnumber of DMUsÞ:
Eq. (A.2) is the ratio form of DEA. However, it has an infinite number of solutions. To avoidthis problem, Eq. (A.2) is converted into the more familiar components of a linear programmingproblem. In Eq. (A.3) (the multiplier form), the denominator is set to a constant and thenumerator is maximised.
max h0 ¼Xsr¼1
uryr0 ðA:3Þ
N.K. Avkiran / Socio-Economic Planning Sciences 35 (2001) 57–80 75

subject toXmi¼1
vixi0 ¼ 1,Xsr¼1
uryrj ÿXmi¼1
vixij40, ur; vi5e:
To prevent the mathematical omission of an output or an input in the iterative calculation ofefficiency, weights u and v are not allowed to fall below non-zero small positive numbers (e). Eq.(A.3) uses controllable inputs and constant returns to scale. It is a primal linear programmingproblem that models input minimisation.
A.3. BCC model
Banker et al. [57] addressed variable returns to scale. They introduced a new variable in theCCR model that separates scale efficiency from technical efficiency. The BCC primal linearprogramming problem that measures pure technical efficiency is depicted in Eq. (A.4).
max h0 ¼Xsr¼1
uryr0 þ c0 ðA:4Þ
subject toXmi¼1
vixi0 ¼ 1,Xsr¼1
uryrj ÿXmi¼1
vixij ÿ c040, ur, vi5e:
When c0 ¼ 0, it implies CRS, c0 > 0, it implies DRS, c050, it implies IRS.
A.4. BCC model with uncontrollable inputs
The variable returns to scale model that incorporates the effect of non-discretionary inputs canbe read in Banker and Morey [58]. It is probably the most useful model for evaluating the relativeefficiency of organisational units in the business world. It acknowledges that DMUs may not beoperating at MPSS and that some of the inputs (or outputs) may well be outside the control of themanager. Under such circumstances, it does not make sense to talk about reducing all the inputs.Potential improvements should be calculated only for the controllable or discretionary inputs. Eq.(A.5) shows a general model that assumes input contraction.
max h0 ¼Ps
r¼1 uryr0 ÿPp
j¼1 wjzj0 þ c0Pmi¼1 vixi0
ðA:5Þ
subject toPsr¼1 uryrq ÿ
Ppj¼1 wjzjq þ c0Pm
i¼1 vixiq41, q ¼ 1, . . . , n;
ur50; r ¼ 1, . . . , s, vi50, i ¼ 1, . . . ,m, wj50, j ¼ 1, . . . , p,
where s is the number of outputs; ur the weight of output r; yr0 the amount of output r producedby the DMU under evaluation; m the number of controllable inputs; vi the weight of controllableinput i; xi0 the amount of controllable input i used by the DMU; p the number of uncontrollable
N.K. Avkiran / Socio-Economic Planning Sciences 35 (2001) 57–8076
inputs; wj the weight of uncontrollable input j; and zj0 the amount of uncontrollable input j usedby the DMU.A graphical demonstration of DEA mathematics can be followed in Norman and Stoker [59].
Appendix B
Table 8Legend for units in the study sample and FTE academic staff as an indication of unit sizea
Unit Corresponding name of the university Academic staff
1 Charles Sturt University 6472 Macquarie University 1088
3 Southern Cross University 2854 University of New England 7135 University of New South Wales 28096 University of Newcastle 1231
7 University of Sydney 34888 University of Technology, Sydney 12039 University of Western Sydney 1148
10 University of Wollongong 79011 Deakin University 99212 La Trobe University 1516
13 Monash University 308414 Royal Melbourne Institute of Technology 134415 Swinburne University of Technology 490
16 University of Ballarat 26717 University of Melbourne 331618 Victoria University of Technology 79519 Central Queensland University 381
20 Griffith University 129021 James Cook University of North Queensland 76922 Queensland University of Technology 1568
23 University of Queensland 309924 University of Southern Queensland 49725 Curtin University of Technology 1360
26 Edith Cowan University 73527 Murdoch University 68028 University of Western Australia 1629
29 Flinders University of South Australia 105030 University of Adelaide 143231 University of South Australia 132632 University of Tasmania 1053
33 Northern Territory University 23434 Australian National University 256035 University of Canberra 451
36 Australian Catholic University 456Mean 1237
aNote: MPSS universities are in italics.
N.K. Avkiran / Socio-Economic Planning Sciences 35 (2001) 57–80 77
References
[1] Birch S, Maynard A. Performance indicators and performance assessment in the UK national health service:
implications for management and planning. International Journal of Health Management 1986;1:143–56.[2] Barrow M, Wagstaff A. Efficiency measurement in the public sector: an appraisal. Fiscal Studies 1989;10(1):72–97.[3] Oral M, Kettani O, Yolalan R. An empirical study on analysing the productivity of bank branches. IIE
Transactions 1992;24(5):166–76.
[4] Al-Faraj TN, Alidi AS, Bu-Bhsait KA. Evaluation of bank branches by means of data envelopment analysis.International Journal of Operations and Production Management 1993;13(9):45–52.
[5] Haag SE, Jaska PV. Interpreting inefficiency ratings: an application of bank branch operating efficiencies.
Managerial Decision Economics 1995;16(1):7–14.[6] Johnes J, Johnes G. Research funding and performance in U.K. university departments of economics: a frontier
analysis. European Economics Review 1995;14(3):301–14.
[7] Banker RD, Thrall RM. Estimation of returns to scale using data envelopment analysis. European Journal ofOperations Research 1992;62:74–84.
[8] Banker RD. Estimating most productive scale size using data envelopment analysis. European Journal of
Operations Research 1984;17:35–44.[9] Sherman HD. Service organization productivity management. The Society of Management Accountants of
Canada, Hamilton, Ontario, 1988.[10] Farrell MJ. The measurement of royal statistical society. Journal of the Royal Statistical Society Part 3
1957;120:253–90.[11] Charnes A, Cooper WW, Rhodes E. Evaluating program and managerial efficiency: an application of data
envelopment analysis to program follow through. Management Science 1981;27(6):668–97.
[12] Nunamaker TR. Using data envelopment analysis to measure the efficiency of non-profit organizations: a criticalevaluation. Managerial Decision Economics 1985;6(1):50–8.
[13] Bessent A, Bessent W. Determining the comparative efficiency of schools through data envelopment analysis.
Educational and administrative Quarterly 1980;16(2):57–75.[14] Sherman HD. measurement of hospital efficiency using data envelopment analysis. Doctoral dissertation, Harvard
University, Dissertation Abstracts International 42(8), 3731A, University Microfilms No. 8202819, 1981.[15] Lewin AY, Morey RC, Cook TJ. Evaluating the administrative efficiency of courts. Omega-International Journal
1982;10:401–11.[16] Charnes A, Clark CT, Cooper WW, Golany B. A developmental study of data envelopment analysis in measuring
the efficiency of maintenance units in the US air forces. Annals of Operations Research 1985;2:95–112.
[17] Thanassoulis E, Dyson RG, Foster MJ. Relative efficiency assessment using data envelopment analysis: anapplication to data on rates departments. Journal of the Operations Research Society. 1987;38(5):397–411.
[18] Sherman HD, Ladino G. Managing bank productivity using data envelopment analysis (DEA). Interfaces
1995;25(2):60–73.[19] Charnes A, Cooper WW, Lewin AY, Seiford LM. Data envelopment analysis: theory, methodology and
application. Boston: Kluwer Academic Publishers, 1994.
[20] Burley HT. Data envelopment analysis in ranking educational processes. In: McNaught C, Beattle K, editors.Research into higher education: dilemmas, directions and diversions. Victoria: Herdsa, 1995. p. 19–27.
[21] Mester LJ. A study of bank efficiency taking into account risk-preferences. Journal of Banking Finance1996;20(6):1025–45.
[22] Drake L, Howcroft B. Relative efficiency in the branch network of a UK bank: an empirical study. Omega-International Journal 1994;22(1):83–90.
[23] Li SX. Stochastic models and variable returns to scales in data envelopment analysis. European Journal of
Operations Research. 1998;104(3):532–48.[24] Sengupta JK. New efficiency theory: extensions and new applications of data envelopment analysis. International
Journal of Systems 1998;29(3):255–65.
[25] Miller SM, Noulas AG. The technical efficiency of large bank production. Journal of Banking Finance1996;20(3):495–509.
N.K. Avkiran / Socio-Economic Planning Sciences 35 (2001) 57–8078
[26] Cave M, Hanney S, Kogan M. The use of performance indicators in higher education: a critical analysis of
developing practice. London: Jessica Kingsley Publishers, 1991.[27] Johnes G. Research performance indications in the university sector. Higher Education Quarterly 1988;42(1):
54–71.
[28] Thomas JA. The productive school: a system analysis approach to educational administration. New York: Wiley,1974.
[29] Lindsay AW. Institutional performance in higher education: the efficiency dimension. Review of Educational
Research 1982;52(2):175–99.[30] Anderson L, Walberg HJ. Data envelopment analysis. In: Keeves JP, editor. Educational research, methodo-
logy, and measurement: an international handbook. Adelaide: Flinders University of South Australia, 1997.
p. 498–503.[31] Bessent AM, Bessent EW, Charnes A, Cooper WW, Thorogood NC. Evaluation of educational program
proposals by means of DEA. Educational and Administrative Quarterly 1983;19(2):82–107.[32] Tomkins C, Green R. An experiment in the use of data envelopment analysis for evaluating the efficiency of UK
university departments of accounting. Financial Accountability and Management. 1988;4(2):147–64.[33] Beasley JE. Comparing university departments. Omega-International Journal 1990;18(2):171–83.[34] Johnes G, Johnes J. Measuring the research performance of UK economics departments: an application of data
envelopment analysis. Oxford Economic Papers 1993;45:332–47.[35] Stern ZS, Mehrez A, Barboy A. Academic departments efficiency via DEA. Computers and Operations Research
1994;21(5):543–56.
[36] Beasley JE. Determining teaching and research efficiencies. Journal of the Operations Research Society1995;46(4):441–52.
[37] Ahn T, Arnold V, Charnes A, Cooper WW. DEA and ratio efficiency analyses for public institutions of higherlearning in Texas. Research in Governmental and Nonprofit Accounting 1989;5:165–85.
[38] Ahn T, Charnes A, Cooper WW. Some statistical and DEA evaluations of relative efficiencies of public and privateinstitutions of higher learning. Socio-Economic Planning Sciences 1988;22(6):259–69.
[39] Ahn T, Seiford LM. Sensitivity of DEA models and variable sets in a hypothesis test setting: the efficiency of
university operations. In: Ijiri Y, editor. Creative and innovative approaches to the science of management.Wesport CT: Quorum Books, 1993. p. 191–208.
[40] Ahn T. Efficiency and related issues in higher education: a data envelopment analysis approach. Doctoral
dissertation, The University of Texas at Austin, 1987.[41] Breu TM, Raab RL. Efficiency and perceived quality of the nation’s top 25 national universities and national
liberal arts colleges: an application of data envelopment analysis to higher education. Socio-Economic Planning
Sciences 1994;28(1):33–45.[42] Coelli T, Rao DSP, Battese GE. An introduction to efficiency and productivity analysis. Boston: Kluwer Academic
Publishers, 1998.[43] Coelli T. Assessing the performance of australian universities using data envelopment analysis. Centre for
efficiency and productivity analysis, University of New England, NSW, 1996.[44] Johnes J. Performance assessment in higher education in Britain. European Journal of Operations Research
1996;89:18–33.
[45] DEETYA. The composite index: allocation of the research quantum to Australian universities. Research Branch,Higher Education Division, Canberra, 1997.
[46] Dyson RG, Thanassoulis E, Boussofiane A. Data envelopment analysis. Warwick Business School, http://
www.csv.warwick.ac.uk/�bsrlu/dea/deat/deat1.htm, 1998.[47] Boussofiane A, Dyson RG, Thanassoulis E. Applied data envelopment analysis. European Journal of Operations
Research. 1991;52:1–15.
[48] Allen R, Athanassopoulos A, Dyson RG, Thanassoulis E. Weights restrictions and value judgements in dataenvelopment analysis: evolution, development and future directions. Annals of Operations Research 1997;73:13–34.
[49] Thanassoulis E, Allen R. Simulating weight restrictions in data envelopment analysis by means of unobserved
DMUs. Management Science 1998;44(4):586–94.
N.K. Avkiran / Socio-Economic Planning Sciences 35 (2001) 57–80 79
[50] Andrews L, Aungles P, Baker S, Sarris A. Characteristics and performance of higher education institutions (A
preliminary investigation). Department of Employment, Education, Training and Youth Affairs, Canberra, 1998.[51] Evanoff DD, Israilevich PR. Productive efficiency in banking. Economic Perspectives 1991;15(4):11–32.[52] Sherman HD, Gold F. Bank branch operating efficiency: evaluation with data envelopment analysis. Journal of
Banking and Finance 1985;9:297–315.[53] Parkan C. Measuring the efficiency of service operations: an application to bank branches. Engineering Costs and
Production Economics 1987;12:237–42.
[54] Oral M, Yolalan R. An empirical study on measuring operating efficiency and profitability of bank branches.European Journal of Operations Research 1990;46(3):282–94.
[55] Yue P. Data envelopment analysis and commercial bank performance: a primer with applications to Missouri
banks. Federal Reserve Bank of St. Louis Review 1992;74:31–45.[56] Charnes A, Cooper WW, Rhodes E. Measuring the efficiency of decision making units. European Journal of
Operations Research 1978;2:429–44.[57] Banker RD, Charnes A, Cooper WW. Some models for estimating technical and scale inefficiencies in data
envelopment analysis. Management Science 1984;30(9):1078–92.[58] Banker RD, Morey RC. Efficiency analysis for exogenously fixed inputs and outputs. Operational Research
1986;34(4):513–21.
[59] Norman M, Stoker B. Data envelopment analysis. Essex: Wiley, 1991.
N.K. Avkiran / Socio-Economic Planning Sciences 35 (2001) 57–8080