In the search for the low-complexity sequences in prokaryotic and eukaryotic genomes: how to derive...
11
arXiv:cond-mat/0310649v1 [cond-mat.stat-mech] 28 Oct 2003 In the search for the low-complexity sequences in prokaryotic and eukaryotic genomes: how to derive a coherent picture from global and local entropy measures Claudia Acquisti 1 , Paolo Allegrini 2 , Patrizia Bogani 1 , Marcello Buiatti 1 , Elena Catanese 3 , Leone Fronzoni 4,5 , Paolo Grigolini 4,6,7 , Giuseppe Mersi 1 , Luigi Palatella 4 1 Dipartimento di Biologia Animale e Genetica dell’Universit`a degli Studi di Firenze, Via Romana 17, 50125 Firenze, Italy 2 Istituto di Linguistica Computazionale del Consiglio Nazionale delle Ricerche, Area della Ricerca di Pisa, Via Moruzzi 1, San Cataldo 56010 Ghezzano-Pisa, Italy 3 Scuola Normale Superiore, Piazza dei Cavalieri, 56125 Pisa, Italy 3 Dipartimento di Fisica dell’Universit`a di Pisa and INFM, via Buonarroti 2, 56127 Pisa, Italy 4 Centro Interdipartimentale per lo Studio dei Sistemi Complessi, via S. Maria 28, 56126 Pisa, Italy 5 Center for Nonlinear Science, University of North Texas, P.O. Box 311427, Denton, Texas 76203-1427 and 6 Istituto dei Processi Chimico Fisici del CNR Area della Ricerca di Pisa, Via G. Moruzzi 1, 56124 Pisa, Italy We investigate on a possible way to connect the presence of Low-Complexity Sequences (LCS) in DNA genomes and the nonstationary properties of base correlations. Under the hypothesis that these variations signal a change in the DNA function, we use a new technique, called Non- Stationarity Entropic Index (NSEI) method, and we prove that this technique is an efficient way to detect functional changes with respect to a random baseline. The remarkable aspect is that NSEI does not imply any training data or fitting parameter, the only arbitrarity being the choice of a marker in the sequence. We make this choice on the basis of biological information about LCS distributions in genomes. We show that there exists a correlation between changing the amount in LCS and the ratio of long- to short-range correlation. I. INTRODUCTION In the recent past there has been a significant interest in the search for both long- and short-range correlation in DNA sequences [1, 2, 3]), The main results of these papers have been that the amount of long-range correlation increases when moving from prokaryotes to eukaryotes and from coding to non-coding sequences. This paper is devoted to discussing the same issue using two new theoretical tools that were not yet available to the authors of the earlier papers. The former method, called Diffusion Entropy (DE), was developed by the authors of Refs.[4, 5, 6] for the purpose of defining the asymptotic properties generated by the long-range correlation. When this method is applied to DNA sequences, it affords global information, this being unambiguous only in the ideal stationary case. The DNA sequences are non stationary and the adoption of the DE method must be supplemented by a non-stationarity indicator. This important indicator has been proposed in Ref. [7]. We refer to it as Non-Stationarity Entropic Index (NSEI) method. This is so because, as we shall see, this method is entropic in nature, it vanishes in the stationary case, and it is larger the larger the strength of non-stationarity. The measurement of long-range correlation is a delicate issue. The detection of non-stationarity is another delicate issue. The NSEI method addresses properly an even more delicate issue, this being the non-stationary character of long-range correlation. With the use of these two brand new techniques we prove that moving from coding to non-coding and from eukaryotes to prokaryotes both the non-stationarity degree and the amount of long-range correlation increase. The deviations from stationarity and randomness are a sign of the role played by selection during the process of life evolution. The same argument applies to the increasing amount of non-stationarity, since this phenomenon is thought to be associated with the selection-induced increasing variety of molecular functions. To make more solid this important biological conclusion we proceed as follows. We take into proper account the ideas that have been developed in the last few years to properly model the origin and the functions of the constraints on the DNA sequences randomness [8]. More specifically, we shed light into this issue by analyzing in the light of life evolution some key Low-Complexity Sequences (LCS). These LCS are defined as sequences containing only AT (homo-weak) or GC (homo-strong), or purines (GA), or pyrimidines (CT). The reason for choosing these particular non-random sequences lies in the fact that their presence is known to affect the DNA local conformational landscape, giving rise to non-B structures (the B structure is the usual double helix), and/or affecting the degree of bending, curving, twisting and rolling of DNA molecules. Conformational features are known to be true 3-dimensional codes for the interaction of DNA with proteins, a necessary condition for its involvement in chromosome organization and in the key functions of transcription and replication [9]. The outline of the paper is as follows: In section I A we describe some basic properties of LCS distributions and their influence on DNA structure. In section II we describe the global analysis trough the DE of different genomes and compare it with LCS distribution data, while in section III we illustrate the NSEI method. Section IV aims at
Transcript of In the search for the low-complexity sequences in prokaryotic and eukaryotic genomes: how to derive...

arX
iv:c
ond-
mat
/031
0649
v1 [
cond
-mat
.sta
t-m
ech]
28
Oct
200
3
In the search for the low-complexity sequences in prokaryotic and eukaryotic genomes:
how to derive a coherent picture from global and local entropy measures
Claudia Acquisti1, Paolo Allegrini2, Patrizia Bogani1, Marcello Buiatti1,
Elena Catanese3, Leone Fronzoni4,5, Paolo Grigolini4,6,7, Giuseppe Mersi1, Luigi Palatella4
1Dipartimento di Biologia Animale e Genetica dell’Universita degli Studi di Firenze, Via Romana 17, 50125 Firenze, Italy2Istituto di Linguistica Computazionale del Consiglio Nazionale delle Ricerche,
Area della Ricerca di Pisa, Via Moruzzi 1, San Cataldo 56010 Ghezzano-Pisa, Italy3Scuola Normale Superiore, Piazza dei Cavalieri, 56125 Pisa, Italy
3Dipartimento di Fisica dell’Universita di Pisa and INFM, via Buonarroti 2, 56127 Pisa, Italy4Centro Interdipartimentale per lo Studio dei Sistemi Complessi, via S. Maria 28, 56126 Pisa, Italy
5Center for Nonlinear Science, University of North Texas,
P.O. Box 311427, Denton, Texas 76203-1427 and6Istituto dei Processi Chimico Fisici del CNR Area della Ricerca di Pisa, Via G. Moruzzi 1, 56124 Pisa, Italy
We investigate on a possible way to connect the presence of Low-Complexity Sequences (LCS)in DNA genomes and the nonstationary properties of base correlations. Under the hypothesisthat these variations signal a change in the DNA function, we use a new technique, called Non-Stationarity Entropic Index (NSEI) method, and we prove that this technique is an efficient way todetect functional changes with respect to a random baseline. The remarkable aspect is that NSEIdoes not imply any training data or fitting parameter, the only arbitrarity being the choice of amarker in the sequence. We make this choice on the basis of biological information about LCSdistributions in genomes. We show that there exists a correlation between changing the amount inLCS and the ratio of long- to short-range correlation.
I. INTRODUCTION
In the recent past there has been a significant interest in the search for both long- and short-range correlationin DNA sequences [1, 2, 3]), The main results of these papers have been that the amount of long-range correlationincreases when moving from prokaryotes to eukaryotes and from coding to non-coding sequences. This paper isdevoted to discussing the same issue using two new theoretical tools that were not yet available to the authors ofthe earlier papers. The former method, called Diffusion Entropy (DE), was developed by the authors of Refs.[4, 5, 6]for the purpose of defining the asymptotic properties generated by the long-range correlation. When this method isapplied to DNA sequences, it affords global information, this being unambiguous only in the ideal stationary case. TheDNA sequences are non stationary and the adoption of the DE method must be supplemented by a non-stationarityindicator. This important indicator has been proposed in Ref. [7]. We refer to it as Non-Stationarity Entropic Index(NSEI) method. This is so because, as we shall see, this method is entropic in nature, it vanishes in the stationarycase, and it is larger the larger the strength of non-stationarity. The measurement of long-range correlation is adelicate issue. The detection of non-stationarity is another delicate issue. The NSEI method addresses properly aneven more delicate issue, this being the non-stationary character of long-range correlation.
With the use of these two brand new techniques we prove that moving from coding to non-coding and fromeukaryotes to prokaryotes both the non-stationarity degree and the amount of long-range correlation increase. Thedeviations from stationarity and randomness are a sign of the role played by selection during the process of lifeevolution. The same argument applies to the increasing amount of non-stationarity, since this phenomenon is thoughtto be associated with the selection-induced increasing variety of molecular functions.
To make more solid this important biological conclusion we proceed as follows. We take into proper account theideas that have been developed in the last few years to properly model the origin and the functions of the constraintson the DNA sequences randomness [8]. More specifically, we shed light into this issue by analyzing in the light oflife evolution some key Low-Complexity Sequences (LCS). These LCS are defined as sequences containing only AT(homo-weak) or GC (homo-strong), or purines (GA), or pyrimidines (CT). The reason for choosing these particularnon-random sequences lies in the fact that their presence is known to affect the DNA local conformational landscape,giving rise to non-B structures (the B structure is the usual double helix), and/or affecting the degree of bending,curving, twisting and rolling of DNA molecules. Conformational features are known to be true 3-dimensional codesfor the interaction of DNA with proteins, a necessary condition for its involvement in chromosome organization andin the key functions of transcription and replication [9].
The outline of the paper is as follows: In section IA we describe some basic properties of LCS distributions andtheir influence on DNA structure. In section II we describe the global analysis trough the DE of different genomesand compare it with LCS distribution data, while in section III we illustrate the NSEI method. Section IV aims at
2
showing the results of two methods at work, namely, the NSEI and a neural network trained by means of LCS lengthsto distinguish between coding and non-coding sequences. Finally Section V is devoted to drawing some conclusions.
A. Distribution of LCS and their putative functional meaning
Provata and Almirantis [10] analyzed the size distribution of purine and pyrimidine clusters and found that codingand non-coding sequences yield an exponential decay and a power law decay, respectively. We also note that ineukaryotes the coding sequences relative amount is very low, whereas it is the largely dominant fraction of prokaryotesgenomes. Both properties suggest to make an analysis of LCS length distributions in species placed in differentpositions in the “tree of life”[9]. In a preliminary paper [11] an algorithm was used to evaluate the LCS density in alarge number of bacterial, archaeal and eukaryotic genomes. A clear difference was observed in the distributions ofLCS relative amount between coding and non-coding regions and between prokaryotes and eukaryotes. In all genomesnon-coding and Eukaryote sequences show the highest amount of LCS. To understand whether high-density valueswere accompanied by a random dispersion or by the presence of long LCS stretches, we decided to carry out ananalysis of LCS length distributions. Herein the attention is centered on LCS known to give rise to non-B DNAconformations and to be involved in the control of gene expression and recombination, namely the homo-weak andthe homo-strong. In the case of AT-rich (homo-weak) sequences we found higher values of LCS lengths in non-codingsequences vs. coding sequences and in eukariotes vs. Prokaryotes.
Fig. 1 shows this property for homo-weak noncoding sequences in some genomes, representative of archaea (M.Jannaschii), prokaryotes (B. Subtilis), unicellular eukaryotes (S. Cerevisiae) and multicellular eukaryotes (H. Sapiens,Chromosome I). We see an increasingly larger deviation from a single exponential distribution going from prokaryotesto more complex organisms with a larger amount of non-coding sequences. This property is less trivial than it mayappear, since it is true also for GC-rich (homo-strong) sequences, as denoted by the curves with white symbols inFig. 1. All these curves show a clear deviation from Poissonian behavior, even if their inverse-power-law decay has alarge negative exponent (about −5). However, for all genomes, the curves for homo-weak LCS have a larger cut-offvalue than the corresponding ones for homo-strong LCS. This fact is indicative of a selection pressure against thelengthening of homo-strong sequence possibly to be attributed to their rigidity and conformation landscapes differentfrom those of long AT-rich tracts. This leads us to choose homo-weak occurrence as a marker in the correlationanalysis, as it will be explained below. Indeed, the presence of a decay slower than Poissonian suggests the possibilitythat correlation with an extend long range can be triggered by the presence of homo-weak and homo-strong LCS.
Remarkably, the authors of [12] performed a thorough study of intra and inter specific variability in upstream andcoding sequences of a series of key genes in Lycopersicum (tomato) (the gene for ACC synthase), Nicotiana (the genefor Phytochrome), Primate species (the genes EMX and OTX 2 involved in brain development). All data showed afar higher variability in non-coding than in coding sequences, preferentially localized in LCS. In other words, differentvarieties have different lengths of AT-rich segments in the non-coding region before the gene. Quantitative RT-PCRdata (Reverse Transcription-Polymerase Chain Reaction), a method to establish the amount of messenger-RNA,showed a clear variation of gene expression corresponding to different lengths of the homo-weak sequences.
Remarkably, the authors of [12] performed a thorough study of intra and inter-specific variability in ACC-synthaseupstream sequences. They studied ACC-synthase upstream sequence in Nicotiana spp phytochrome regulatory se-quences and in the same regions for the primates genes EMX-2, OTX-2. The results clearly showed that these LCStend to be hyper-variables, i.e. they show a mutation frequency significantly higher than other DNA stretches, movingfrom and individual to another of the same species as well as from species to species, coherently with the aforemen-tioned data on recombination. The interesting conclusion is that the three-dimensional code regulating the geneexpression may be associated to a strongly dynamical DNA structure, with statistical constraints. This structure isprobably associated to a process with long-range correlation. In the following section we shall analyze the long-rangecorrelation present in the genome sequences and the relation between this property and the presence of LCS.
II. THE DIFFUSION ENTROPY METHOD APPLIED TO HOMOGENEOUS SEQUENCES
A. Global Diffusion Entropy
In recent papers [4, 5, 6] a new way of revealing long-range correlation, based on the detection of anomalous scalinghas been proposed. In short, one defines a “marker” on a time sequences, and evaluates the probability p(x; t) ofhaving the number x of markers in a window of length t. The evaluation of p(x; t) is done by moving a window oflength t along the sequences and counting how many times one finds x markers inside this window. At this stagep(x; t) is obtained by dividing this number by the total number of windows of size t, which is obviously N − t + 1,

3
1e-06
1e-05
0.0001
0.001
0.01
0.1
1
1 10 100
ψ(t
)
LCS duration t (bps)
B. Subtilis CGAT
M. Jannaschii CGAT
S. Cerevisiae CGAT
H. Sapiens CGAT
1/t5
FIG. 1: Probability distribution of lengths of homo-weak (black symbols) and homo-strong (white symbols) non-codingsequences. Notice that the length distributions of homo-weak have a larger cutoff value; among these, cutoff values are largerfor eukaryotes, namely for S. Cerevisiae (squares) and H. Sapiens (circles), than for archaea M. Jannaschii (diamonds) andbacterium B. Subtilis (triangles). Dotted line represents an eye-guide decay ∝ t−5.
where N is the total length of the sequence. In the case of large values of x and t, the continuous approximation islegitimate, and, in the ergodic and stationary condition, a scaling relation is expected, namely In case of large valuesof x and t, the continuous approximation is legitimate, and, in the ergodic and stationary condition, we expect scaling,namely, we expect
p(x; t) =1
tδF
( x
tδ
)
, (1)
where δ is said to be the scaling index and F is a function, sometimes called “master curve”. If F is the Gaussfunction, δ is the known Hurst index, and if the further condition δ = 0.5 is obeyed, then the process is said to bePoissonian, namely there is no long-range memory regulating the occurrence of markers in time. It is straightforwardto show that the Shannon Information
S(t) =
∫
∞
−∞
dxp(x; t) ln p(x; t) (2)
with conditiom (1) leads to
S(t) = k + δ ln t, (3)
where k is a constant. A linear fit of S(t) in log-normal paper allows an extimation of δ.
B. The CMM model of DNA
In recent years many groups have agreed to consider DNA sequences as a mixture of long- and short- rangecorrelation, the latter blurring the strength of the former. A simple model, originally proposed by Araujo et al.
4
[13], and later adopted independently by the authors of Refs. [14], [15] and [16], to name a few, is the CopyingMistakes Map (CMM)[14]. This is the superposition of two models, one consisting of a pure random choice, and theother of an intermittent generator of homogenous sequences, yielding long-range correlation. Both models provide asequence, where the i-t nucleotide of the resulting DNA sequence is taken from the first component (the white one)with probability 1− ǫ and from the second with probability ǫ. The resulting correlation function is proven [14] to be
C(t) = δi,0 + ǫ2(
T
T + t
)β
, (4)
where δi,j is the Kroeneker delta, while T and β are two positive parameters of the intermittent model. Long-rangememory is normally characterized by the condition β < 1, which makes the correlation function (4) not integrable.
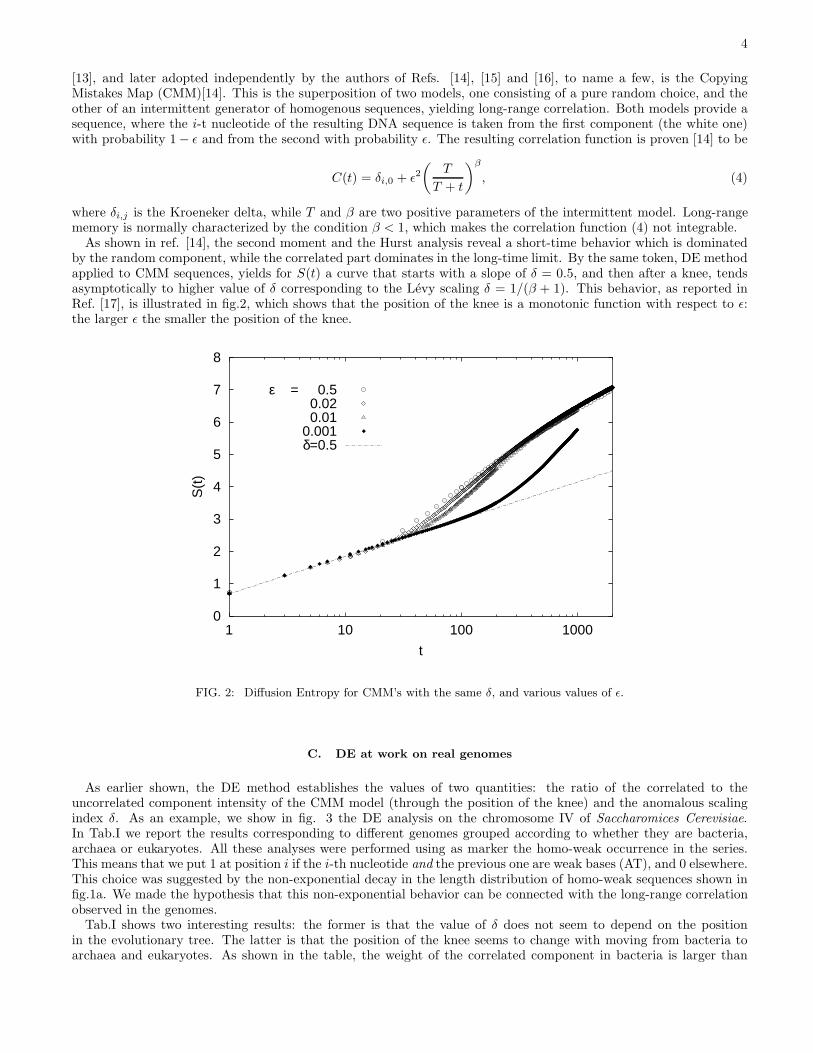
As shown in ref. [14], the second moment and the Hurst analysis reveal a short-time behavior which is dominatedby the random component, while the correlated part dominates in the long-time limit. By the same token, DE methodapplied to CMM sequences, yields for S(t) a curve that starts with a slope of δ = 0.5, and then after a knee, tendsasymptotically to higher value of δ corresponding to the Levy scaling δ = 1/(β + 1). This behavior, as reported inRef. [17], is illustrated in fig.2, which shows that the position of the knee is a monotonic function with respect to ǫ:the larger ǫ the smaller the position of the knee.
0
1
2
3
4
5
6
7
8
1 10 100 1000
S(t
)
t
ε = 0.50.020.01
0.001δ=0.5
FIG. 2: Diffusion Entropy for CMM’s with the same δ, and various values of ǫ.
C. DE at work on real genomes
As earlier shown, the DE method establishes the values of two quantities: the ratio of the correlated to theuncorrelated component intensity of the CMM model (through the position of the knee) and the anomalous scalingindex δ. As an example, we show in fig. 3 the DE analysis on the chromosome IV of Saccharomices Cerevisiae.In Tab.I we report the results corresponding to different genomes grouped according to whether they are bacteria,archaea or eukaryotes. All these analyses were performed using as marker the homo-weak occurrence in the series.This means that we put 1 at position i if the i-th nucleotide and the previous one are weak bases (AT), and 0 elsewhere.This choice was suggested by the non-exponential decay in the length distribution of homo-weak sequences shown infig.1a. We made the hypothesis that this non-exponential behavior can be connected with the long-range correlationobserved in the genomes.
Tab.I shows two interesting results: the former is that the value of δ does not seem to depend on the positionin the evolutionary tree. The latter is that the position of the knee seems to change with moving from bacteria toarchaea and eukaryotes. As shown in the table, the weight of the correlated component in bacteria is larger than

5
Genomes knee ±5 δ ± .04Bacteria
M. pneumoniae * 80 0.76T. maritima * 90 0.75R. prowazekii * 90 0.60H. influenzae * 60 0.71B. subtilis * 100 0.78
E. coli * 100 0.73A. aeolicus * 90 0.72
Synechocystis Sp. * 80 0.73Archaea
M. thermoautotrophycum * 60 0.76A. fulgidus * 60 0.68
M. jannaschii * 40 0.68P. abyssii * 100 0.76
Eukaryotes
S. cerevisiae * 50 0.70H. sapiens Chr. 1 * 20 0.88
C. elegans * 5 0.76A. thaliana * 15 0.75
TABLE I: The * denotes complete genomes or chromosomes. The analysis was performed using the homo-weak occurrence asa marker.
in eukaryotes, archaea being somewhat intermediate between bacteria and eukaryotes. It is also worth noticing thatwithin eukaryotes, the unicellular, almost intronless, S. Cerevisiae has the largest knee value.
1 10 100 1000t (base pairs)
0
1
2
3
4
5
6
S(t)
Saccharomices Cerevisiaeδ = 0.70
FIG. 3: Diffusion Entropy analysis for Saccharomices Cerevisiae.
III. THE NON-STATIONARITY ENTROPIC INDEX
In order to study the local properties of DNA sequences with special focus on the distribution and variability ofhomogeneous sequences, we use a new method, the NSEI method. This method is derived from the DE method[7] as an earlier method, called CASSANDRA algorithm [7, 18]. The DE method affords global information, whileboth CASSANDRA and NSEI method aim at affording local information. The CASSANDRA method measures the

6
rate of transition from dynamics to thermodynamics through comparison with ordinary Brownian motion. The NSEImethod focuses on the local deviation from the stationary behavior. The first step of the NSEI method is to buildthe diffusion entropy function S(t) for each window of size L with L ≫ t, thought of a complete sequence. In thisway we obtain several functions Sj(t), where the subscript j refers to the portion of the sequence used to calculateSj(t). Formally, we write
xj(t, l) ≡
j+l+t∑
i=j+l
ξi , with 0 < l < L − t (5)
where ξi is the DNA sequences after marking the homogeneous sequences, as earlier ilustrated, and j and L denotethe beginning and the length of the big window, respectively. We assign to the integers j multiple values of a giveninteger J , namely j = 0, J, 2J, · · ·, thus avoiding too large overlaps between two windows of length L, corresponding totwo consecutive choices of j. At fixed t and L we obtain for different l a probability distribution pj(x, t). Calculatingthe entropy of this distribution, we obtain
Sj(t) ≡
∫
dxpj(x, t) log pj(x, t) (6)
Now we are ready to define the non- stationarity index, indicated as Ξj , as follows
Ξj =
t∫
0
dt′(
Sj(t′) − Sj(t
′))
(7)
where
Sj(t) ≡1
m
j−1∑
i=j−m−1
Si(t) (8)
Note that m is the number of windows involved by the average process of Eq.(8). Depending on the step J by whichj increases we obtain that the comparison between local and previous diffusion behavior involves m · J points of thesequence. Note that if the sequence is perfectly stationary we have Ξj = 0, otherwise we have a value different fromzero.
IV. DNA FUNCTION AND LOCAL CORRELATION
In Section I A we saw that non-coding sequences contain a number of homogeneous sequences larger than codingsequences. Experimental evidence shows that LCS tend to occur either in the upstream region of each gene, i.e.immediately before the occurrence of a gene, or in introns. It is also known that both upstream sequences and, toa lesser extent, introns, are the regions endowed with regulatory roles in which LCS are involved. In this section weevaluate the change of local correlation, according to the NSEI method, and we see that this change is often associatedwith the beginning of a coding portion. Thus, using biological consideration, we are led to establish a plausible linkbetween the change of DNA sequence correlation and the functional change of the sequence. In other words, weexpect that the boundary between a coding and a non-coding segment is revealed by either a positive or negativepeak of the NSEI index, as a function of the position j along the sequence. In Fig. 4 we show an example wherethis hypothesis is verified to a satisfactory extent. As earlier stated, the analysis was carried out using as marker theoccurrence of homo-weak sequences. Peak recognition has been realized in the following way. The data have beensmoothed through a moving linear interpolation with ten points. The maximum indexes were identified looking atthe “derivative” thus obtained; only maximum indices with a value larger than the standard deviation, calculatedover the whole signal, were selected.
The NSEI method should reveal the beginning and the end of a LCS with peaks. It is important to point out thatthe NSEI method, although being the most convenient indicator of non-stationarity, within the theoretical frameworkof DE method, does not have a perfect efficiency. This means that the NSEI signals correctly the existence of aboundary between two distinct regions. This is a true positive, denoted by the symbol TP . There are cases, however,when the NSEI signals a boundary that does not exist. This is called a false positive, and it is denoted by the symbolFP . By the same token we denote by TN and FN , the true and false case, respectively, of a missing boundary. The

7
20000 30000 40000 50000Base Pair
-0,04
-0,02
0
0,02
0,04
NSE
I
coding region
intergenic region
FIG. 4: Non-Stationarity Entropic Index for Saccharomices Cerevisiae. The abcissa axis denote the position of center of thelarge window with length L = 400. Other parameters of the analysis are: the jump size J = 100, the number of averagedwindows m = 4 and maximum time t = 12 for entropy evaluation. The thick line denotes the displacements of coding andnoncoding portion of the genome,
total number of borders is given by FN + TP , while the total number of cases signaled by the NSEI, true or false, isgiven by TP + FP . It is worth noticing that the observed peaks, in addition to corresponding to true peaks, must befound in position close enough to the position of the real borders, namely at a distance smaller than a critical valueT , which is of the same order as L.
We are now in the proper position to establish the accuracy of the NSEI. We can judge this method satisfactory ifwe prove that it affords a number of correct guesses significantly larger than the random choice. To assess this issuewe apply to the NSEI method a technique of assessment frequently used in Information Extraction [19]. We define twoquantities, Precision and Recall. Precision P is a measure of how accurately the displacements of coding/non-codingboundaries are guessed, while Recall R is a measure of how many of these regions are correctly located.Formally, wewrite
P =TP
TP + FP(9)
and
R =TP
TP + FN(10)
We compare the P and R of our predictor to a baseline score associated with TP + FP random choices forthe position of the boundaries. The “true” classification was done according to documents accompanying DNAsequences in Genbank database, regardless whether the annotation was experimental or putative. Although thismakes our esteem or P and R questionable, we think that the improvement with respect to the random baseline willnot diminished after a more accurate experimental annotation. Results are summarized in table II. As shown inthe table, the NSEI method reveals statistically significant improvement with respect to the baseline, especially foreukaryotes, where the marker adopted (homo-weak) has a larger biological significance.
We end this section by reporting results stemming from a completely different way of detecting coding and non-coding sequences. This alternative way confirms the correlation between the changes of the amount of LCS andentropy changes, when moving from the coding to the non coding regions. A three layer feed forward neural networkwas built and trained on homogeneous sequences (homo AT; homo GC; homopurine; homopyrimidine) [20]. Thenetwork involves eight neurons in the input layer, four in the intermediate, one in the output one. The network hasbeen trained on 100 tracks each of 300 nucleotides of known coding and on 100 for known non coding regions. Inputs

8
Genome TP + FP TP FP TP + FN P R Random P Random R
A. aeolicus 1089 457 632 1744 0.420 0.262 0.278 0.173A. fulgidus 1497 879 618 2992 0.587 0.294 0.326 0.163B. subtilis 3157 1673 1484 7584 0.530 0.221 0.424 0.177
B. burgdorferi 627 237 390 1252 0.378 0.189 0.314 0.157C. tetani 2517 1236 1281 6556 0.491 0.189 0.426 0.163
V. cholerae 2898 1631 1267 6166 0.563 0.265 0.381 0.179E.coli 3235 1966 1269 6894 0.608 0.285 0.387 0.181
H. influenzae 1215 619 596 2920 0.509 0.212 0.401 0.167H. pylorii 1143 551 592 2406 0.482 0.229 0.349 0.166
M. pneumoniae 504 241 263 926 0.478 0.260 0.313 0.170N. ghonoreae 1607 1065 542 3668 0.663 0.290 0.428 0.187P. aeruginosa 4037 2796 1241 9310 0.693 0.300 0.381 0.165
P. abysii 1216 638 578 2302 0.525 0.277 0.323 0.170R. prowazekii 762 301 461 1439 0.395 0.209 0.372 0.197
S. typhi 3312 1984 1328 7260 0.599 0.273 0.390 0.178Synechocistis spp. 2464 1415 1049 5729 0.574 0.247 0.425 0.183
T. maritima 1309 550 759 2154 0.420 0.255 0.264 0.160D. radiodurans 2169 1302 867 4531 0.600 0.287 0.376 0.180
M. Jannaschii 1088 578 510 2858 0.531 0.202 0.424 0.161M. thermoautotrophicum 1305 893 412 3014 0.684 0.296 0.407 0.176
S. cerevisiae 6733 4096 2637 10506 0.608 0.390 0.337 0.216
A. thaliana 7698 2203 5495 4201 0.286 0.524 0.137 0.251H. sapiens Chr1 7413 86 7327 208 0.012 0.413 0.007 0.242D. melanogaster 7430 1901 5529 2577 0.256 0.738 0.083 0.239
C. elegans 7007 1175 5832 4119 0.168 0.285 0.131 0.223
TABLE II: The parameters for the analysis reported herein are: large windows with length L = 400, jump size J = 100,number of averaged windows m = 4 and t = 12 for maximum time of entropy evaluation. Different boxes divide species intofour groups: bacteria, archaea, unicellular and multicellular eukariotes.
Genome Ntot TP ncp TN ncn Q W
A. aeolicus 900 477 110 658 97 0.767 0.678M. Jannaschii 900 730 46 531 95 0.727 0.811
S. cerevisiae (chr 1) 900 566 79 813 40 0.923 0.761S. cerevisiae (chr 10) 900 651 45 700 41 0.804 0.774
A. thaliana (chr 1) 900 702 20 773 26 0.874 0.813C. elegans (chr 1) 900 853 5 846 7 0.948 0.953D. melanogaster 900 627 17 889 6 0.992 0.776
TABLE III: The parameters fo the analysis reported herein are: TP=true positive non coding tracks, TN=true positive codingtracks, ncp = non classified non coding tracks, ncn = non classified coding tracks ,FP = coding tracks classified as non coding,FN = non coding tracks classified as coding, Q = TP/(TP + FP ) and W = TN/(TN + FN). Different boxes divide bacteria,yeasts and multicellular eukaryotes.
of the network are 1) percentage of the sequence covered by homogeneous tracks 2) average length of homogeneoustracks in the observed sequence. Then 900 tracks have been screened with the trained network for each class. Thisoperation has been performed for each species listed in the table III. The precision level of annotation (identificationof the two classes) is very high as seen from Q and W values. For true positives (Q), moreover, eukaryotes seem toperform better than prokaryotes, coherently with the higher non-coding/coding ratio.
It is worth noticing that this second way of detecting the change of the DNA function is complementary to the firstone. Indeed the NSEI method, which does not require any form of training, yields a model-oriented location of thefunction change on a scale comparable with L. On the other hand the neural network technique is more precise andcan become very efficient when performed on the basis of evidence obtained by means with NSEI.
9
V. CONCLUSIONS
In this paper we discussed how to derive a coherent picture from the study of LCS, local properties, and long-rangecorrelation, global properties. Thanks to the DE technique we showed that long-range correlation seems to have aquite homogeneous behavior when looked at using a large scale. Variations in the transient behavior, however, confirman increase of the non-random component with moving from bacteria to archaea, from archaea to the unicellulareukaryote S. cerevisiae, and from this to multi-cellular plants and animals. This increase throughout the evolutionscale is consistent with that of non-coding sequences, which are known to cover less than 10% of prokaryotes genomesand well over 90% of the eukaryotes ones. A plausible hypothesis, to explain these properties in terms of function,is that non-coding sequences can be more freely “filled” with “hidden codes”. These hidden codes are mainly usedfor the recognition of protein molecules, necessary for the organization and function of the DNA sequence and otherligands. Remarkably, these codes, and in general non-coding sequences as well, tend to be hyper-variable, due tothe presence of LCS, suggesting a positive role of mutational noise in regulatory sequences (see Ref [9] for a throughdiscussion).
To afford some more details on why to connect LCS, conformational landscapes, regulation and structure of genomes,we should note that some constraints may play a role in eukaryotes for DNA “packaging” in nucleosomes and chromo-somes. Moreover, it is well known that DNA activation for transcription and replication is due to the recognition byproteins of DNA regions, and vice-versa, based on complementary conformations leading to formation of complexes.Protein-DNA complexes involve at the same time a high number of molecules where interaction needs a specific globalorganization favored by DNA curving, bending, twisting and rolling at the right points. This may require the presenceof non-random tracts with the needed conformational landscape. The strategy reported herein, namely the adoptionof NSEI and of neural networks, fulfills the biologist’s need for research leading to the characterization of the livingstate of matter (LSM) [22] on one hand, to the identification of specific functional sequences in sequenced genomeson the other.
We investigated on the connection between correlation and LCS, and between LCS and the regulation of a genetranscription. We showed that the variation in the statistics of homo-weak sequences, i.e. a particular kind of LCS,yielding specific DNA conformational landscapes, strongly correlates with changes in DNA function and, especially,that these sequences signal the beginning of a coding region. We studied these variations with the help of the NSEIalgorithm obtaining satisfactory results. The accuracy achieved, although affording significant information, is nothigh, in comparison with other annotation methods currently used by molecular biologists. In fact, with some ofthese methods, the percentage of failure is now around 10%-15%. Better results were herein obtained with a neuralnetwork trained on LCS, the class of non-random sequences. The NSEI method, however, a model-based technique,affords a way to scan the whole genome, in the search for non-stationary segments, where a transition from a givendegree of correlation to another occurs: The putative boundaries between coding and non-coding DNA may generatethe segmented input tracks for the neural network, a method with a larger accuracy for the final categorization.The NSEI method is based on a DNA dynamic model, compatible with the DE method, which signals the long-rangecorelation of the sequence. If the correlation strength undergoes local changes, these are signaled by the NSEI method.Moreover, the increase in complexity in the “tree of life” correlates with an increase in non-coding DNA and in thenumber of coding/non-coding boundaries. A high precision on the same task of recognizing coding sequences hasbeen obtained by other authors with algorithms based on specific motifs known to be present in non-coding regions orexploiting existing periodicities [21]. Probably an even higher precision could be obtained through the combinationof all methods. It is therefore quite important that the NSEI results were obtained without using all these propertiesbut only the variation in the statistics of homo-weak sequences.
A reasonable interpretation of these data all taken together, could be that several kinds of functionally constrainedsequences have been fixed in genomes throughout evolution and that average higher correlation values in non-codingsequences are a result of this process. However at a local level, while to some extent LCS can be present also in codingregions, precise annotation (distinction between coding and non-coding sequences) has to rely on the detection ofconstraints (codes) specific for each class of DNA regions. For instance, while a 3-periodical behavior, in phase withthe triplet “universal” code is typical of coding regions [14, 21], specific motifs and rather long LCS have been shownto be distinctive of non-coding regions, which are free from coding constraints [14]. In other words, the relativelylow level of constraints corresponding to long-range correlations (and to the presence of LCS) in transcribed andtranslated sequences can be attributed to the fact that in that case selection has not been acting on DNA, but onproteins, and there is not a direct relationship between constraints in the two classes of molecules.
As a final remark, looking at LCS, we point out an almost paradoxical result, namely that hypervariable sequencescarry a constraint. LCS hypervariability is known to be favored in regions of genes where variation, leading to proteinvariability, is essential. For instance, it can be useful for the right response to hypervariable pathogens. Lowercomplexity levels in eukaryotes seem therefore to derive from a wide series of constraints ranging from periodicitiesto different kinds of short-range and long-range correlations and to the presence of LCS of varying length. This

10
hypothesis is supported by the present work, suggesting the NSEI as a tool for analyzing data, when looking at thiskind of constraints, because of its locality and its wise use of statistics. Furthermore, we want to point out that theNSEI emerges from the theoretical background of Ref. [7]. The DE method was originally introduced as an efficienttechnique to evaluate scaling, this being a global property, implying stationary condition. The NSEI is the best way,known to us in this moment, to address the challenging issue of non-stationarity from the same dynamic approachto complexity as that behind the foundation itself of the DE method. From a conceptual point of view, more thanfrom an application point of view, we want to stress that this technique of analysis, resting on entropy formalism,might have the important role of helping the foundation of the LSM theory [22, 23]. As explained in Ref. [22], infact, the relation between hyper-variable sequences and regulation is a key aspect of the LSM perspective, and theinvestigation of this issue based on the NSEI might make easier for the advocates of the LSM perspective to expressthe main ideas of this theoretical proposal with the language of statistical mechanics, probably anomalous statisticalmechanics.
Acknowledgments PG gratefullly acknowledges financial support from ARO through Grant DAAD19-02-0037
[1] Li, W. and Kaneko, K. 1992. Long-range correlation and partial 1/f spectrum in a noncoding DNA sequence. Europhys.Lett., 17, 655–660.
[2] R. Voss. Evolution of long-range fractal correlations and 1/f noise in DNA base sequences. Phys. Rev. Letters, 68:3805–3808,1992.
[3] C. -K. Peng, S. V. Buldyrev, S. Havlin, M. Simons, H. E. Stanley, and A. L. Goldberger, Phys. Rev. E, 49, 1685 (1994);C. -K. Peng, S. Havlin, H. E. Stanley, and A. L. Goldberger, Chaos, 5, 82 (1995);
[4] P. Grigolini, L. Palatella, G. Raffaelli, Asymmetric Anomalous Diffusion, an Efficient Way to Detect Memory in TimeSeries, Fractals 9, 439-449 (2001).
[5] Nicola Scafetta, Patti Hamilton and Paolo Grigolini, The Thermodynamics of Social Process: the Teen Birth Phenomenon,Fractals, 9, 193 (2001); Nicola Scafetta, and Paolo Grigolini, Scaling detection in time series: diffusion entropy analysis,Phys. Rev. E 66, 036130 (2002)
[6] P. Allegrini, P. Grigolini, P. Hamilton, L. Palatella, G. Raffaelli, Memory beyond Memory in Heart Beating, a Sign ofHealthy Physiological Condition Phys. Rev. E 65, 041926 (2002).
[7] P. Allegrini, V. Benci, P. Grigolini, P. Hamilton, M. Ignaccolo, G. Menconi, L. Palatella, G. Raffaelli, N. Scafetta, M.Virgilio, J. Yang, Compression and Diffusion: a Joint Approach to Detect Complexity, Chaos Solitons & Fractals 15,517-535 (2003).
[8] P. Lio, S. Ruffo, M. Buiatti, Third Codon G + C Periodicity as a Possible Signal for an ”Internal” Selective Constraint,Journal of Theoretical Biology, 171(2),215-223 (Nov 21, 1994).
[9] M. Buiatti, P. Bogani, C. Acquisti, G. Mersi, L. Fronzoni, The living state of matter between noise and homeorreticconstraints, in the forthcoming volume Interdisciplinary applications of ideas from nonextensive statistical mechanics and
thermodynamics ed. by Murray Gell-Mann and Constantino Tsallis, Oxford University Press, Oxford (2003).[10] A. Provata and Y. Almirantis, Scaling properties of coding and non-coding DNA sequences, Phys. A, v. 247 p.p. 482
(1997).[11] M. Buiatti, C. Acquisti, G. Mersi, P. Bogani, The biological meaning of DNA correlations, in Biology and Medicine, G.
Losa, Birkhauser, Basel p. 235 (2002).[12] Bogani, P., Simoni, A., Lio, P., Germinario, A., Buiatti, M. (2001). Molecular variation in plant cell populations evolving
in vitro in different physiological contexts. Genome, 44:1-10; Bogani P., Scialpi, A., Masieri M., Nardi M., Rosati A., GoriM., Buiatti M. (2003). Functional markers for the study of genetic variation in tomato. Proc. 7th Int. Con. Plant. Mol.Biol., in press.
[13] S.V. Buldyrev, A.L. Goldberger, S. Havlin, C.-K. Peng, M. Simons and H.E. Stanley , Generalized Levy walk model forDNA nucleotide sequences. Phys. Rev. E 47 (1993), pp. 4514-4523
[14] P. Allegrini, M. Barbi, P. Grigolini and B. J. West, Dynamical model for DNA sequences, Phys. Rev. E, v. 52, p. 5281(1995).
[15] P. Allegrini, M. Buiatti, P. Grigolini and B. J. West, Non-Gaussian statistics of anomalous diffusion: The DNA sequencesof prokaryotes, Phys. Rev. E, v. 58, p. 3640 (1998).
[16] D. E. Strier, D. H. Zanette, Self similarity in a model of genetic microevolution, Physica A, Volume 257, 1998, Pages530-535
[17] Nicola Scafetta, Vito Latora and Paolo Grigolini, Levy statistics in coding and non-coding nucleotide sequences, PhysicsLetters A 299 (5-6), 565-570 (2002); Nicola Scafetta, Vito Latora and Paolo Grigolini, Scaling without detrending: thediffusion entropy method applied to the DNA sequences, Phys. Rev. E 66, 031906 (2002).
[18] P. Allegrini, P. Grigolini, L. Palatella, G. Raffaelli, M. Virgilio, Facing non-stationarity Conditions with a New Indicatorof Entropy Increase: the CASSANDRA Algorithm, in: Novak, M.N. (ed.): Emergent Nature. World Scientific, Singapore(2002) 173-184.
[19] See, for instance, K.S. Jones. Information Retrieval Experiment. Butterworth and Co., 1981.[20] D. Graupel, Principle of Artifical Neural Networks, World Scientific, Singapore (1997).

11
[21] I. Grosse, H. Herzel, S.V. Buldyrev, H.E. Stanley , Species indipendent of mutual information in coding and noncodingDNA, Phys. Rev. E, v. 61, p. p. 5624 (2000).
[22] M. Buiatti, N. Buiatti, Towards characterization of the living state od matter, Chaos, Solitons and Fractals, these Proced-ings.
[23] P. Allegrini, G. Aquino, P. Grigolini, L. Palatella, A. Rosa, Breakdown of the Onsager Principle as a Sign of Aging,submitted to Phys. Rev. E.