What benefits can a business derive from HCI activities? - CORE
154
~ i ~ by BRIAN JAMES NABUSIU Student number: 3505-236-8 submitted in accordance with the requirements for the degree of Master of Science in the subject of Information Systems at the UNIVERSITY OF SOUTH AFRICA Supervisor: Prof. J.H. GELDERBLOM Co-Supervisor: Mr T.J. VAN DYK February, 2014 BENEFITS THAT A BUSINESS CAN DERIVE FROM HUMAN-COMPUTER INTERACTION INTERVENTIONS
-
Upload
khangminh22 -
Category
Documents
-
view
0 -
download
0
Transcript of What benefits can a business derive from HCI activities? - CORE

~ i ~
by
BRIAN JAMES NABUSIU Student number: 3505-236-8
submitted in accordance with the requirements for the degree
of
Master of Science in the subject of Information Systems
at the
UNIVERSITY OF SOUTH AFRICA
Supervisor: Prof. J.H. GELDERBLOM
Co-Supervisor:
Mr T.J. VAN DYK
February, 2014
BENEFITS THAT A BUSINESS CAN DERIVE FROM HUMAN-COMPUTER INTERACTION
INTERVENTIONS

~ ii ~
DISCLAIMER
I declare that “Benefits that a business can derive from Human-Computer Interaction
interventions” is my own work and that all the sources that I have used or quoted
have been indicated and acknowledged by means of complete references.
Further, I declare that I have not previously submitted this work, or part of it, for
examination at the University of South Africa (UNISA) for another qualification or at
any other higher institution of education.
________________________ _____________________
SIGNATURE DATE
February 28, 2014
~ iii ~
Dedicated with memories and love
to
Daudi Nabusiu
.………………………………. You gave me hope. Left me to make it through.
~ iv ~
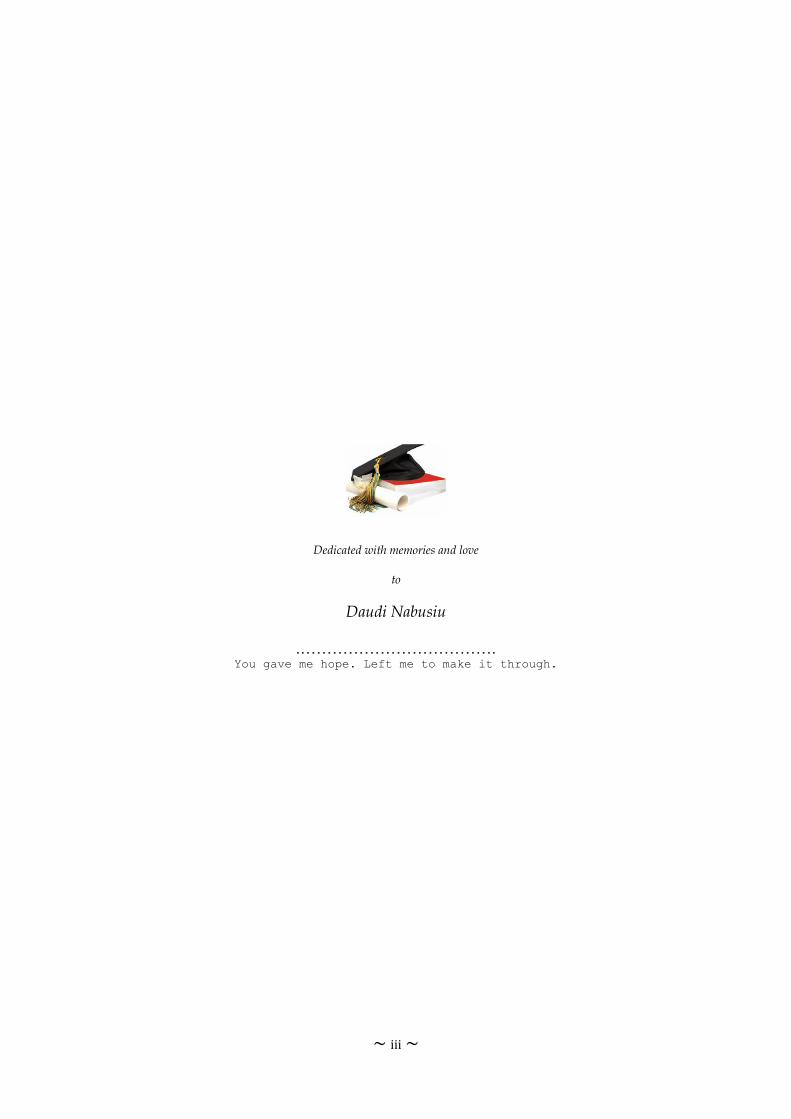
ABSTRACT
Human Computer Interaction (HCI) interventions such as User Experience, Usability
and Accessibility are widely accepted as great milestones in the developmental
process of computer-based system applications – be it web-based, PC-based or
ubiquitous. However, there is still a need for an understanding of the critical benefits
– both tangible and intangible – that HCI interventions may bring within business. It
is still necessary to investigate and clearly understand how the issues that emanate
from the usability and accessibility problems affect business as well as what value
HCI techniques contribute to the profitability of implementing and using computer-
based systems.
A case study approach was undertaken within a Travel Management Company
(TMC) on a computer-based system used for both back-end and front-end activities,
such as invoicing as well as Management Information System (MIS) reports. The aim
was to ascertain how the incorporation of HCI interventions (Usability and
Accessibility) in evaluating the design and the development process of software
applications can impact on the usefulness of such computer application systems.
The investigation in areas such as the redefining business processes in order to
generate a competitive advantage, enhancing user skills, improving user
productivity, user satisfaction and retention, reducing training costs, and quality
service provision were of particular interest.
The end results of the study affirm an important and significant role that specific and
focussed HCI interventions make in the successful implementation of contemporary
computer-based systems. However, for businesses to gain most of the potential
benefits from HCI interventions, both the software development houses and
business practitioners should make use of the HCI techniques and place greater
priority and emphasis on the awareness and use of HCI (Usability) standards in the
development process.
Key Words: Accessibility, HCI Interventions, Business Benefits, HCI Frameworks,
HCI processes and methodologies, Service, Service Science, Service System,
Usability

~ v ~
ACKNOWLEDGEMENT
My supervisors: Professor J.H Gelderblom and Mr T.J van Dyk. Thank you for the
guidance, critiques, reassurances and opportunities that you so generously gave to
me; for the space and time I needed to learn what must have been so obvious to
you; and for keeping me on track when I so often went in the wrong direction. Your
insightful comments and questions, which sometimes seemed hard and often,
dreaded the inside of my thoughts, helped to better my thinking process, and
eventually, to better the dissertation content for this academic endeavour. Above all,
I appreciate your patience with me and your words of encouragement at a time when
things almost seemed impossible during the dark moments of this journey. Thank
you.
The staff of BCDtravel head office and Pretoria branch office. Thank you for all the
contributions you offered, the confidence and courage you gave me. I noticed how
we had become a family. I appreciate it all. Special mention goes to Mr Makhetha
Kananelo – the Managing Director; Sandor Peto; Bongani Sukazi; Nivie
Padayachee; Isabel Pietersie; Sibusiso Mathebula; Lungile Mthembu; Themba
Ndhlovu; Conrad Boiputsho; Jabulani Sangweni; and Simangele Ngubane. Thank
you for the support, advice and help you offered when conducting work.
Kathleen Wood, Colin Wood and Khomotso Bopape – For you efforts spent editing
and formatting the dissertation.
Neliswa Gqabe – Thank you for sharing my pains, happiness, joy, and above all, the
optimism and the confidence you always so brightly excelled every morning of each

~ vi ~
day during all this time we have known each other. Your love and strength inspired
and sustained me through it all. Thank you for being my best friend.
My parents: Daudi Nabusiu (Dad) and Margaret Khaitsa Nabusiu (Mom). Now I know
and exactly understand all the discussions we used to have when growing up. The
wisdom in you and the hope you shared with us has gotten me this far. This, I
dedicate to you. May your soul R.I.P. Mom! Thank you for your enduring love even
when uncertainties often became the norm. You endured it all. Thank you and I love
you. My siblings: Agnes, Aidah, Annet, Vincent, Sylvia, Nicholas, Rodgers, and
Aaron. Thank you for your countless sacrifices, selfless love, and letting me explore
my abilities, to discover and build myself all these years I have been away from you.

~ vii ~
TABLE OF CONTENTS
DISCLAIMER ........................................................................................................................................ ii
ABSTRACT .......................................................................................................................................... iv
ACKNOWLEDGEMENT ...................................................................................................................... v
LIST OF FIGURES ............................................................................................................................ xi
LIST OF TABLES ............................................................................................................................... xii
CHAPTER 1: INTRODUCTION AND OVERVIEW ......................................................................... 1
1.1 Introduction ............................................................................................................................ 1
1.2 Developing the idea of the study........................................................................................ 2
1.3 The problem statement ....................................................................................................... 3
1.3.1 The background ............................................................................................................ 3
1.3.2 The service delivery scope ......................................................................................... 4
1.3.3 The ACCtrav system .................................................................................................... 4
1.3.4 Transitioning to the Logiwiz system........................................................................... 8
1.3.5 Identifying and articulating the problem statement ................................................. 8
1.4 Deriving the research topic ............................................................................................... 10
1.4.1 Research topic ............................................................................................................ 10
1.5 Dissertation statement ....................................................................................................... 11
1.6 Motivation for the study ..................................................................................................... 11
1.7 Purpose of the study .......................................................................................................... 11
1.8 Significance of the study ................................................................................................... 12
1.9 Contributions of the study ................................................................................................. 12
1.10 The research design and methodology .......................................................................... 13
1.11 Assumptions of the study .................................................................................................. 13
1.12 The scope and limitations of the study ............................................................................ 14
1.13 Implications of the study .................................................................................................... 14
1.14 The outline of the remainder of the dissertation ............................................................ 15
1.15 Summary ............................................................................................................................. 16

~ viii ~
CHAPTER 2: LITERATURE REVIEW ............................................................................................ 17
2.1 Introduction .......................................................................................................................... 17
2.2 Human-Computer Interaction (HCI) ................................................................................ 18
2.2.1 Usability of computer-based systems ..................................................................... 20
2.2.2 Making the business case for usability ................................................................... 23
2.2.3 Accessibility ................................................................................................................. 24
2.3 HCI techniques investigated ............................................................................................. 25
2.4 The benefits of HCI processes and methodologies ...................................................... 25
2.5 Conclusion ........................................................................................................................... 28
CHAPTER 3: THE RELATIONSHIP BETWEEN HCI AND SERVICE SYSTEMS .................. 29
3.1 Introduction .......................................................................................................................... 29
3.2 The services ........................................................................................................................ 30
3.2.1 The concept of service systems ............................................................................... 32
3.2.2 The service models .................................................................................................... 33
3.3 HCI and service systems .................................................................................................. 35
3.4 The role HCI techniques can play in service systems .................................................. 36
3.4.1 User-centred design ................................................................................................... 39
3.4.2 Supporting business and user values ..................................................................... 39
3.4.3 Enhancing performance influencing factors (PIFs) ............................................... 41
3.4.4 Understanding culture................................................................................................ 42
3.4.5 Identifying and enhancing social factors ................................................................. 43
3.4.6 Identifying frustrating user experiences .................................................................. 46
3.5 Conclusion ........................................................................................................................... 47
CHAPTER 4: RESEARCH DESIGN AND METHODOLGY ........................................................ 48
4.1 Introduction .......................................................................................................................... 48
4.2 The research paradigm ..................................................................................................... 49
4.3 The context of the study .................................................................................................... 49
4.4 Case study strategy ........................................................................................................... 50

~ ix ~
4.4.1 Background ................................................................................................................. 50
4.4.2 Application ................................................................................................................... 50
4.4.3 Justification for a case study .................................................................................... 51
4.5 Six-step approach adopted ............................................................................................... 52
4.5.1 Determining the case and defining the research questions ................................. 52
4.5.2 Determining and selecting data gathering and analysis techniques .................. 53
4.5.3 Preparation to collect data ........................................................................................ 53
4.5.4 Collecting data in the business environment (the main study) ............................ 56
4.5.5 Evaluation and analysis of data ............................................................................... 59
4.5.6 Preparation of the report ........................................................................................... 60
4.6 Ethical consideration .......................................................................................................... 60
4.6.1 Permission to conduct study ..................................................................................... 60
4.6.2 Informed consent ........................................................................................................ 60
4.6.3 Confidentiality and anonymity .................................................................................. 61
4.6.4 Privacy ......................................................................................................................... 61
4.7 Summary ............................................................................................................................. 61
CHAPTER 5: DATA ANALYSIS AND INTERPRETATION ........................................................ 62
5.1 Introduction .......................................................................................................................... 62
5.2 Demographic Information .................................................................................................. 63
5.3 Analysis of the data and findings ..................................................................................... 63
5.3.1 Past experience working with computer-based systems ..................................... 64
5.3.2 Experience working on the ACCtrav system .......................................................... 65
5.3.3 The overall user reactions to the ACCtrav system ................................................ 66
5.3.4 The ACCtrav system user interface (Screen) ........................................................ 69
5.3.5 Learning the ACCtrav system .................................................................................. 75
5.4 Contextual analysis and interpretation ............................................................................ 80
5.4.1 Training and skills enhancement ............................................................................. 80
5.4.2 Productivity .................................................................................................................. 83

~ x ~
5.4.3 Business processes and/or workflows .................................................................... 85
5.4.4 Branding, communication, business values and publicity .................................... 86
5.5 Conclusion ........................................................................................................................... 86
CHAPTER 6: SUMMARY AND FURTHER RESEARCH ............................................................ 88
6.1 Introduction .......................................................................................................................... 88
6.2 The problem statement ..................................................................................................... 88
6.3 A reflection on the methods used .................................................................................... 89
6.4 A summary of the findings ................................................................................................ 90
6.4.1 Sub-question 1: What are the usability problems faced by the users while
accomplishing tasks when using the ACCtrav system? ....................................................... 90
6.4.2 Sub-question 2: How do these usability problems affect business in this case?
91
6.4.3 Sub-question 3: What HCI techniques can be applied to correct these Usability
problems? .................................................................................................................................... 93
6.5 Conclusion of the findings ................................................................................................. 98
6.5.1 Learnable systems ..................................................................................................... 98
6.5.2 User satisfaction and motivation .............................................................................. 98
6.5.3 Increase in user productivity levels .......................................................................... 99
6.5.4 Operational and training costs .................................................................................. 99
6.5.5 Customer satisfaction ................................................................................................ 99
6.5.6 Effective communication and publicity .................................................................. 101
6.6 Summary of the contributions made by the study ....................................................... 101
6.7 Recommendations for implementation ......................................................................... 101
6.7.1 Adoption of HCI standards ...................................................................................... 102
6.7.2 Make changes regularly to the system user-interface ........................................ 102
6.8 Conclusion ......................................................................................................................... 102
REFERENCES LIST ........................................................................................................................ 104
Appendix A: QUIS ............................................................................................................................ 117

~ xi ~
Appendix B: RESEARCH LETTERS ............................................................................................. 130
Appendix C: TMC SYSTEMS, PROCESSES AND SAMPLE REPORTS ............................... 134
Appendix D: SITTING PLAN .......................................................................................................... 142
LIST OF FIGURES
Figure 1: Service system functionality .................................................................................................... 4
Figure 2: Synopsis of automated tasks in the ACCtrav system ............................................................... 5
Figure 3: Steps taken during the ticket reservation process .................................................................. 6
Figure 4: Overview of the ACCtrav system interaction layout across functions..................................... 7
Figure 5: Human-computer interaction ................................................................................................ 19
Figure 6: The task-artifact cycle. Human activities implicitly articulate needs, preferences and design
visions ................................................................................................................................................... 22
Figure 7: The User-Centred Design model ............................................................................................ 26
Figure 8: Cost-Benefit Analysis of usability engineering techniques .................................................... 27
Figure 9: The conceptual model of service systems interacting in a service ........................................ 33
Figure 10: Service map .......................................................................................................................... 34
Figure 11: Scenario development ......................................................................................................... 36
Figure 12: General framework for the study of visual aesthetics in HCI .............................................. 38
Figure 13: Schematic of the activity-based framework for services ..................................................... 44
Figure 14: The six-step approach adopted when conducting the study ............................................... 48
Figure 15: Knowledge on computer devices, software, and systems ................................................... 64
Figure 16: The amount of time spent working on the ACCtrav system ................................................ 65
Figure 17: Frustrating vs. Satisfying histogram ..................................................................................... 68
Figure 18: State of feelings after a frustrating experience ................................................................... 68
Figure 19: The ACCtrav system user interface ...................................................................................... 70
Figure 20: Item elements of the screen interface ................................................................................ 71
Figure 21: The relationship between interface layout and navigation ................................................. 73
Figure 22: The relationship between the arrangement of information on the screen and the
progression of work-related tasks ........................................................................................................ 74
Figure 23: Items regarded not to have influence on learning .............................................................. 76
Figure 24: The relationship between remembering names and use of commands and the ability to
learn operating the system ................................................................................................................... 77
~ xii ~
Figure 25: Mean score rating for QUIS items on learning the ACCtrav system .................................... 79
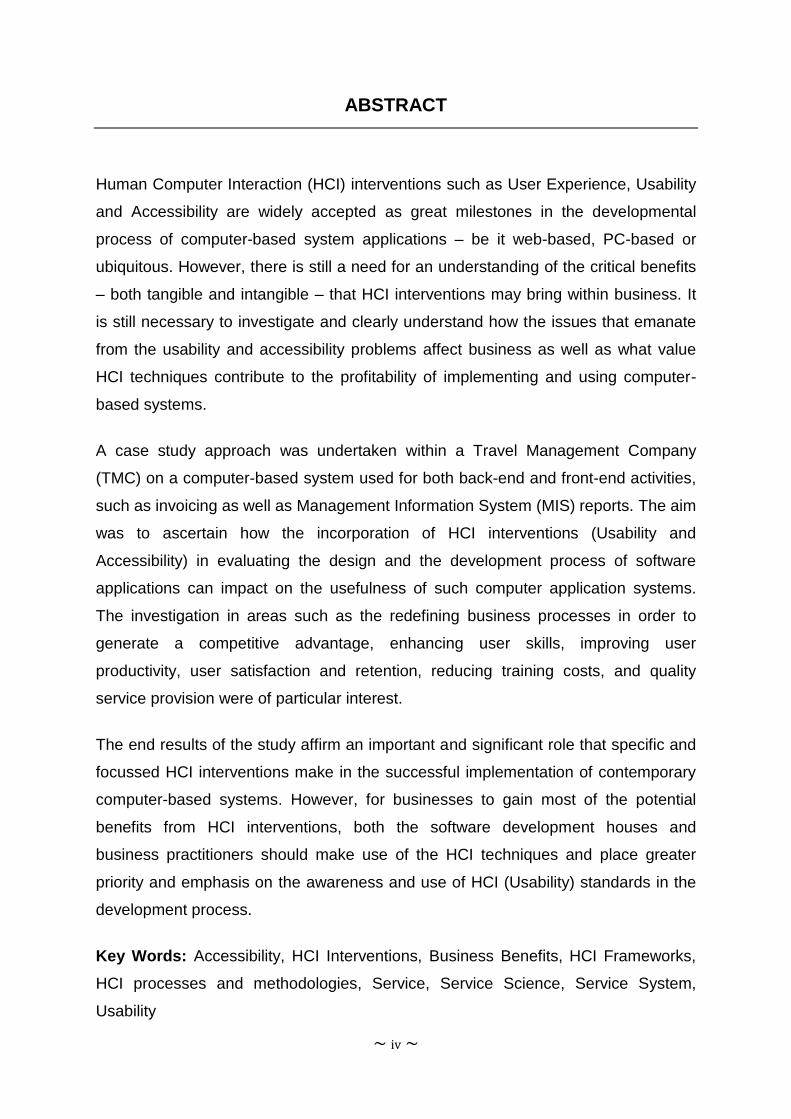
LIST OF TABLES
Table 1: Dissertation layout .................................................................................................................. 15
Table 2: Service characteristics and their implications for marketing and positioning strategies ....... 31
Table 3: Benefits associated with specific HCI processes and methodologies .................................... 41
Table 4: Components of HCI ................................................................................................................. 45
Table 5: Summary of participants' profile ............................................................................................. 55
Table 7: Time spent (hours) a week on the ACCtrav system ................................................................ 66
Table 8: Overall user reactions ............................................................................................................. 67
Table 9: How usability problems affect the business ........................................................................... 92
Table 10: Usability problems identified, their impact on business and the recommended HCI
techniques that can be used to correct usability issues identified ....................................................... 96
Table 11: Benefits derived from HCI interventions ............................................................................ 100

~1 ~
CHAPTER 1: INTRODUCTION AND OVERVIEW
1.1 Introduction
Many businesses often launch products or services that contain significant, known
usability flaws. This is done for seemingly valid business reasons, for example, to
gain a first-mover advantage in the market (Bias and Mayhew, 2005; Heppner et al.,
2005). However, some, if not most of the usability flaws in the products or services
could be fixed before launch by following certain development practises (Boehm,
1991; Heppner et al., 2005; Kling, 2000; Preece et al., 2011). In extreme cases,
launching a product or system or service that fails to meet users’ expectations has
led to failure of the business case (Landauer, 1996; Lazar et al., 2004; Mentis and
Gay, 2003; Murrell and Sprinkle, 1993).
Looking at computer-based systems, it is common that some of the products or
systems have struggled with user acceptance (Landauer, 1996; Mentis and Gay,
2003). This is as a result of either usability flaws within the system or negative user
attitude and perception. The lack of user acceptance can cost businesses lost
productivity, high training costs for users to get acquainted with the system interface
and navigation, and user frustration (Lazar et al., 2005; Preece et al., 2011; Sharp et
al., 2007). Sometimes, implementation of change becomes difficult as well as costly.
According to Heppner et al. (2005), the results of launching flawed products often
manifest in reduced usage of that product. The reduction in product usage
significantly impacts on expected business benefits such as quick return on
investment (ROI). Studies have also shown that 80% of the total system
maintenance costs incurred have been related to users having problems or concerns
with the systems and not with a system’s technical flaws (e.g. Boehm, 1991;
Landauer, 1996); of this, 64% is directly related to system usability problems
(Landauer, 1996; Mentis and Gay, 2003).
This study investigated the application of a selection of Human-Computer Interaction
(HCI) processes and methodologies on a computer-based system called the
ACCtrav system. The ACCtrav system was used in a company providing corporate
travel management services. The goal of the study was to explore usability

~ 2 ~
challenges experienced by users of the ACCtrav system and how the usability
challenges affected business. The ACCtrav system was later replaced with the
Logiwiz system. This study sought to emphasise the benefits that a business could
derive from implementing HCI processes and methodologies during systems
development. The anticipated benefits were to be in areas such as improved user
productivity, free publicity or branding, and improved business operations. Quality
service provision was of particular interest.
1.2 Developing the idea of the study
Many travel management companies (TMCs) have moved towards adopting
computer-based systems in fulfilling service provision. This is motivated by cutting
down operational costs (Bias and Mayhew, 2005; Karat, 1990; Nielsen, 1993) and a
presupposed better appeal to customers (Jones and Sasser, 1995; Jones and
Samalionis, 2008; Heppner et al., 2005; Luthria and Rabhi, 2009; Magoulas and
Chen, 2006; Berry and Parasuraman, 1993). Businesses are compelled to adopt
computer-based systems due to forces in the global economic environment.
The 2008 global economic depression, however, brought major challenges such as
how businesses should cope with technology and the related costs involved, while,
at the same time, trying to appeal to new customer demands (Jones and Sasser,
1995; Jones and Samalionis, 2008; Luthria and Rabhi, 2009). For example,
introducing a new technology can cause high training costs and job stress that may
lead to staff burnout and impact on turnover (Lazar et al., 2005; Landauer, 1996).
As businesses work to cope with technology and customer challenges, it is clear that
human activities in the services industry cannot simply be replaced with technology
or computer-based systems (Cai et al., 2008; Kaner and Karni, 2006; Vargo and
Lusch, 2004). The dependence emanates from the fact that services usually involve
a mutually supporting network of human activities that technology cannot
impersonate completely (Cockton, 2006; IfM and IBM, 2008; Landauer, 1996;
Shneiderman, 2000). As a result, the management of human influence still stands
out as one of the critical success factors (Cockton, 2006; Mele et al., 2009; Parker
and Heapy, 2006).

~ 3 ~
Secondly, looking at the problem statement in the next section, one realises that
travel services are unique and risky due to their complicated nature, set-up, and
reliance on external driving forces in the global economic environment (Jones and
Samalionis, 2008; Lovelock and Gummesson, 2004). Travel services are often
characterised by real-time transactions, dynamic customer requirements (Jones and
Sasser, 1995), and fast-changing technologies which often require instant changes
in the service provision (Luthria and Rabhi, 2009). As a result, there is a possibility
that most of the developers of computer-based systems used by TMCs do not make
use of HCI interventions in the development process or thereafter.
1.3 The problem statement
Sections 1.3.1 to 1.3.5 cover the discussions on the scope, the computer-based
systems (the ACCtrav and Logiwiz systems) used by the TMC as well as the
articulation how these helped in forming the problem statement.
1.3.1 The background
Two surveys were instituted by the TMC in 2010. The survey among internal staff
(employees) and customers respectively were aimed at understanding the
challenges that had emanated from the merger with another TMC in 2009
(BCDtravel, 2010). Based on the survey results from the staff, it was discovered that
there were internal issues related to computer systems. The results revealed
dissatisfaction and frustration with computer-based systems used in operational
transactions. ACCtrav was one of the systems. Of those surveyed, 78.1% indicated
frustration with ACCtrav, and then, followed by communication difficulties (64.8%)
among teams due to ever-changing user roles. Some of the factors highlighted in the
survey related to unclear roles, complicated and often-changing workflow structures.
Those surveyed also indicated high work pressure, unclear tasks, increasing long
working hours, frequent failures and difficulties with the computer-based systems,
and lack of proper communication and support within the team structures.
The survey of customers showed that 68.7% were not happy with the service
rendered, complaining of not receiving the services on time, and often, not happy

~ 4 ~
with all the stated requirements. The results also pointed out that the systems often
were either very slow or down whenever assistance was sought from consultants.
1.3.2 The service delivery scope
The travel function involves finding and booking affordable travel tickets (plane, ship,
bus, and train), hotel accommodation, conference venues and organising transfers
as required by the customer. Also included are managing the day-to-day operation of
the travel programme, safety and security, travel and expense (T&E) data
management, and negotiations with all suppliers (airline, bus service, railway
service, hotel accommodation and others). T&E is not only limited to travel but
include all costs incurred during travel, such as meals, taxi fares, gratuities, gifts,
supplies (office supplies and/or services). Also included are conferences expenses,
credit card and overall travel data management.
1.3.3 The ACCtrav system
Service
Requester
Service Provider
Service
Quality of Service
Security
Availability and
PerformanceCapacity
Figure 1: ACCtrav - service system functionality
The ACCtrav system was implemented in the year 2006 to help control travel data
quality and travel expense reporting. This was to be achieved through efficient data
~ 5 ~
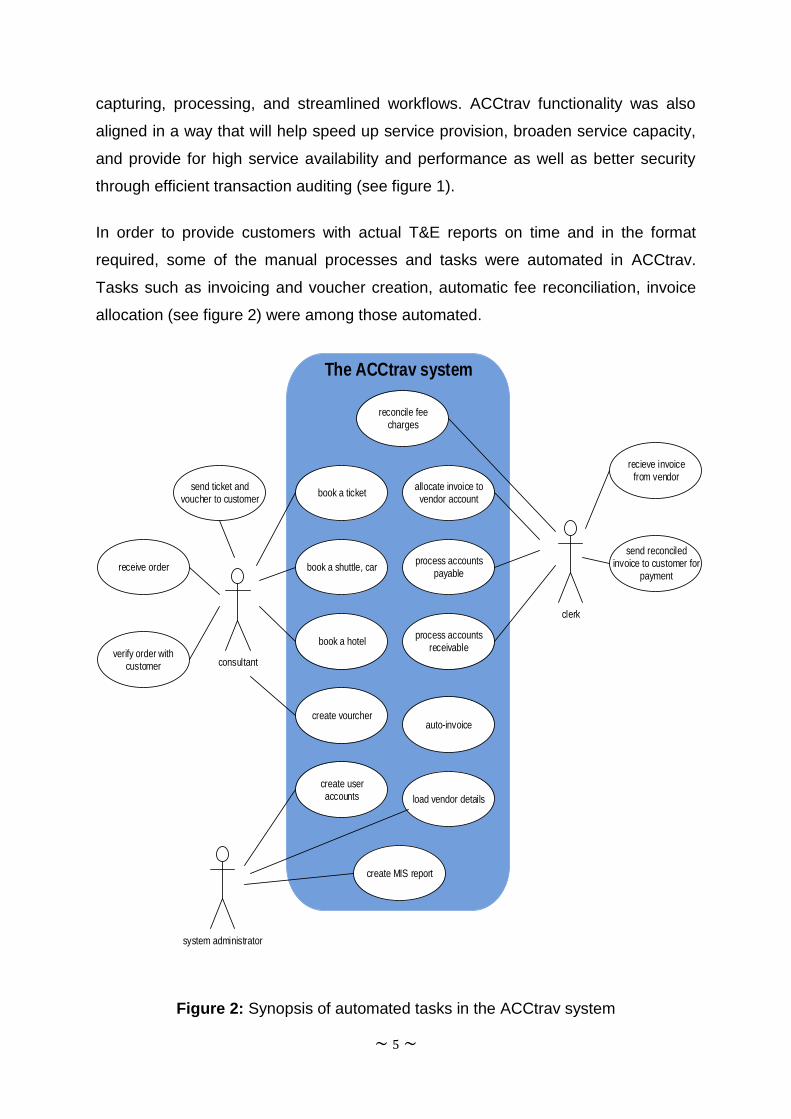
capturing, processing, and streamlined workflows. ACCtrav functionality was also
aligned in a way that will help speed up service provision, broaden service capacity,
and provide for high service availability and performance as well as better security
through efficient transaction auditing (see figure 1).
In order to provide customers with actual T&E reports on time and in the format
required, some of the manual processes and tasks were automated in ACCtrav.
Tasks such as invoicing and voucher creation, automatic fee reconciliation, invoice
allocation (see figure 2) were among those automated.
consultant
The ACCtrav system
receive order
book a ticket
book a shuttle, car
book a hotel
load vendor details
create useraccounts
create MIS report
create vourcher
verify order withcustomer
reconcile feecharges
allocate invoice tovendor account
process accountspayable
auto-invoice
clerk
system administrator
recieve invoicefrom vendor
send reconciledinvoice to customer for
payment
send ticket andvoucher to customer
process accountsreceivable
Figure 2: Synopsis of automated tasks in the ACCtrav system

~ 6 ~
All other records of every travel order request [transaction] would be tracked better
from inception to delivery. The transaction process was conducted in the order of
receiving travel order through emails or by phone, verification and confirmation of
order details, notification of ticket time limits, and issuing tickets (see figure 3).
Figure 3: Steps taken during the ticket reservation process
The manual processing of data had posed many challenges that included
inconsistencies in data, lost data due to human error as well as prevalent fraudulent
activities. Figure 4 shows the ACCtrav system interaction layout across functions.
Appendix C covers details about systems and processes. Data collected and stored
in the ACCtrav database served as a source of business intelligence because of
accuracy in stored transactional details. Business intelligence data was used in
understanding customers’ preferences and characteristics. The ACCtrav system
would help minimise transaction-related risks and improve on managing real-time
transactions. Moreover, ACCtrav would, among others, help to improve on the
employees’ productivity as well as their working environment; manage dynamic
customer requirements; detect fraudulent activities; and improve on accountability,
reporting and business forecast.

~7 ~
Title
BIS Head officeOperations Finance Head office
Phas
e
MW Integration
ACCtrav
Font office
module
ACCtrav
Invoicing
module
ACCtrav
BSP module
ACCtrav Reporting
module
ACCArchive
ACCtrav
Branch
databaseACCtrav
Master
database
Galileo
Debit & Credit
manager
Document
producer
Scripts for
ACCtrav link
XML converter
import into
ACCtrav
Galileo SMS
eWorkflow
AP & AR recon
ACCPAC
AP, AR & Gl
Peresoft
CB
National
vendorEFT
Insight
reportsAssetPro
GL ReconeWorkflow
requisitions
Figure 4: Overview of the ACCtrav system interaction layout across functions

~8 ~
1.3.4 Transitioning to the Logiwiz system
Logiwiz was scheduled to replace ACCtrav during 2010. Logiwiz, regarded as an
improved version of ACCtrav, was developed in view of streamlining and integrating
business processes at the front-end and back-end of service fulfilment. There were
also a set of diverse requirements from operations, marketing, finance and
management divisions that had been considered and merged to streamline the
processes and the easy tracking of transactions at all times. This would result in total
operational and transactional transparency.
The Logiwiz system was designed to run on a thin-client-terminal server computing
environment that is accessed through Remote Desktop Services on Windows Server
2008 platform. Users would then access applications and data on a remote server
over a network, using the Remote Desktop Protocol (RDP). The Logiwiz system had
also marked the advent of cloud computing. All other applications (e.g. emails,
internet; in fact, the entire desktop of the computer running terminal services) were
made accessible through a remote client machine. Only the user interface of an
application was presented on the client machine, and any input to it was redirected
over the network to the server, where all application execution took place.
However, by the end of this study, the Logiwiz project had only reached the user
acceptance testing phase after four (4) years in development. The results of user
acceptance testing indicated possible usability flaws. By this time, the business was
faced with bad publicity (business image) challenges both internally and externally.
TMC had lost some of the existing contracts with customers. In the period
2011/2012, TMC successfully won three out of twenty-six tenders bid for.
The Logiwiz system will not be discussed again in the rest of the dissertation as it
was not the subject of this study. It was added for completeness’ sake and not the
main basis of this study.
1.3.5 Identifying and articulating the problem statement
Nowadays, travel services employ computer-based systems (ACCtrav/Logiwiz) and
organisational networks (as a subsidiary of a group of companies) with the intention

~ 9 ~
of allowing relatively inexperienced people to perform highly sophisticated tasks
quickly, i.e. pushing them over the normal learning curve delays (Quinn and
Paquette, 1990; Squires and Preece, 1999; Tractinsky, 2012; Trischler, 1996).
Ideally, enabling both TMC employees and customers (often through self-service) to
easily deliver on various aspects should be one of the results from well-designed
service systems (Lund, 1997; Magoulas and Chen, 2006; Shneiderman and Plaisant,
2005).
The ACCtrav system user interface seemed simplistically designed and structured to
achieve the goal of allowing both novice and expert users to quickly perform highly
sophisticated tasks. However, users still encountered difficulties to complete tasks
and to deliver on set goals. Often, some data captured did not match customer and
vendor (supplier) requirements. Some users resorted to manual capturing of data
and steps such as creating vouchers and issuing invoices were often missed in the
process. The ACCtrav user interface was designed in such a way most menus were
prefilled with default data about customers and vendors. It was designed with novice
users in mind. However, both novice and experienced users (using the system for
many years) complained about difficulties working with ACCtrav. There was also a
significant lack of enthusiasm among the users. The Logiwiz system displayed
similar problems during the testing phase.
The above observation goes against Quinn and Paquette’s (1990, p.1) statement
“properly designed service technology systems allow relatively inexperienced people
to perform very sophisticated tasks quickly — vaulting them over normal learning
curve delays”. Quinn and Paquette (1990, p.1) went on to observe: “by constant
updating, the successful technologies and systems automatically capture the highest
potential experience curve benefits available in the entire system”.
The researcher acknowledges that Quinn and Paquette’s (1990) observation above
is still applicable and relevant for today’s technologies, especially where service
providers depend on part-time, novice, or relatively inexperienced staff to meet
customer requirements. This would be achieved by allowing a user of such systems
to take advantage of the business’ growing capabilities, which they could not learn
directly or be trained individually to execute. Users remain the key component of a
~ 10 ~
system’s successful use (Magoulas and Chen, 2006; Mentis and Gay, 2003; Murrell
and Sprinkle, 1993).
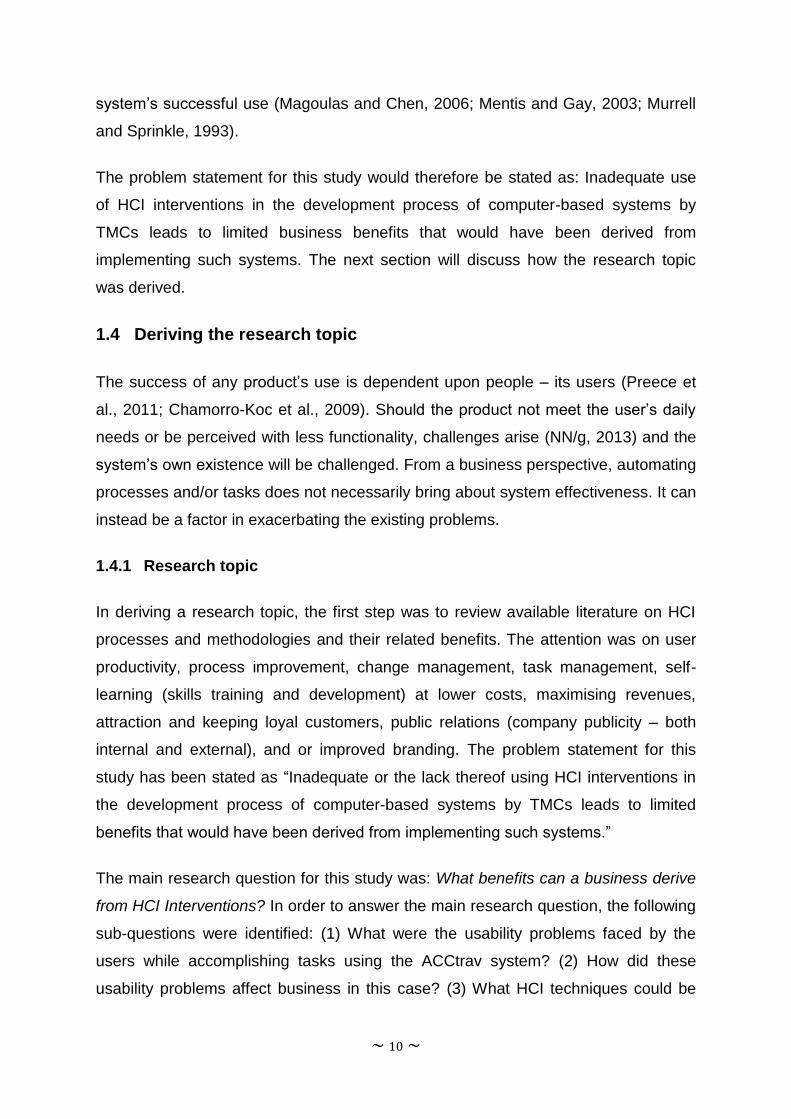
The problem statement for this study would therefore be stated as: Inadequate use
of HCI interventions in the development process of computer-based systems by
TMCs leads to limited business benefits that would have been derived from
implementing such systems. The next section will discuss how the research topic
was derived.
1.4 Deriving the research topic
The success of any product’s use is dependent upon people – its users (Preece et
al., 2011; Chamorro-Koc et al., 2009). Should the product not meet the user’s daily
needs or be perceived with less functionality, challenges arise (NN/g, 2013) and the
system’s own existence will be challenged. From a business perspective, automating
processes and/or tasks does not necessarily bring about system effectiveness. It can
instead be a factor in exacerbating the existing problems.
1.4.1 Research topic
In deriving a research topic, the first step was to review available literature on HCI
processes and methodologies and their related benefits. The attention was on user
productivity, process improvement, change management, task management, self-
learning (skills training and development) at lower costs, maximising revenues,
attraction and keeping loyal customers, public relations (company publicity – both
internal and external), and or improved branding. The problem statement for this
study has been stated as “Inadequate or the lack thereof using HCI interventions in
the development process of computer-based systems by TMCs leads to limited
benefits that would have been derived from implementing such systems.”
The main research question for this study was: What benefits can a business derive
from HCI Interventions? In order to answer the main research question, the following
sub-questions were identified: (1) What were the usability problems faced by the
users while accomplishing tasks using the ACCtrav system? (2) How did these
usability problems affect business in this case? (3) What HCI techniques could be
~ 11 ~
applied to correct these usability problems? The answers to the preceding sub-
questions provided guidance in providing answers to the main research question.
Furthermore, these research questions acted as a guide on the literature review
process, and the research design and data collection methods used.
1.5 Dissertation statement
The research process was concerned with the validation, or otherwise, of the
following dissertation statement: “Businesses that apply HCI processes and
methodologies in the design and development process of computer-based systems
reap notable benefits, both tangible and intangible”. This is also applicable to
systems already in use.
1.6 Motivation for the study
This was a basic research that sought to explore and improve the understanding of
fundamental benefits – both tangible and intangible – that a business such as TMC
would derive from employing HCI processes and methodologies. Secondly, the study
sought to emphasise existing HCI knowledge, and where possible, to generate new
ideas, principles and theories about HCI processes and methodologies. This would
be achieved through stimulating new ways of thinking by businesses that have
sought or intend to seek guidance from HCI processes and methodologies with the
aim of improving on how specialists deal with usability challenges from computer-
based systems. As a result, this would help more businesses buy into the idea of
understanding and using HCI processes and methodologies and gain from the
associated benefits thereof.
1.7 Purpose of the study
The goal of this study was to demonstrate that HCI processes and methodologies
and or techniques can help businesses provide a quality service to its customers
through improved computer-based systems. The main purpose was to study the
impact of HCI processes and methodologies/techniques on:
User productivity

~ 12 ~
Reduction in training costs and skills enhancement
Redefinition of business processes or workflows that can help generate
a competitive advantage
Improved business operations.
This was done by gaining an understanding of complex issues such as the tasks
within the organisation that are automated, communication, implementing change,
and publicity when rolling out information systems.
1.8 Significance of the study
HCI processes and methodologies are yet to be widely recognised and accepted as
applicable to services and service-related products, and not only to information
technology. It was demonstrated in this study that making computer-based systems
universally usable can bring about significant improvements at several levels of
service operations. The noticeable significant improvements were in areas such as
user productivity, reduction in training costs and skills enhancement, redefinition of
business processes or workflows that can help generate a competitive advantage,
and improved business operations. The study also contributed to the change in
perception that HCI processes and methodologies belong in the marketing divisions.
The conflict here was eminent and hence the need to distinguish HCI methodologies
from marketing processes was important.
1.9 Contributions of the study
The study contributed mainly to knowledge awareness of business benefits related
to HCI processes and methodologies. This was done through identification of
variables that are critical for business success and on which HCI processes and
methodologies have had a positive effect. For example, the principle of learnability
emphasises improving users’ skills and knowledge. Some other areas of contribution
included user satisfaction and wellness; efficient publicity starts within the business
settings; skills enhancement comes in the light of learnable and easy-to-use
systems, goals, rewards and bonuses. They also included improved communication,
comprehending end-users and the performance of tasks, comprehending better

~ 13 ~
business processes, complying with statutory regulations and acts, and supporting
marketing and sales activities.
1.10 The research design and methodology
The study involved a case study. A case study is “an empirical inquiry that
investigates a contemporary phenomenon within its real life context using multiple
sources of evidence” (Noor, 2008, p. 1602). The evidence used in a case study is
typically qualitative in nature and focus, developing an in-depth rather than broad,
generalizable understanding (Yin, 1984). In this study, the ACCtrav system was
explored, described, and explained exhaustively within its natural setting.
Data was collected using the following methods: interviews, observation, and a
questionnaire. Information gathered by these methods provided for triangulation.
Observational and interview data complemented that which was collected in the
questionnaire for either as verification or to reveal some unexpected ways of use
(Dix et al., 2004; Nielsen, 1993) while interacting with the ACCtrav system.
Data collected was analysed as follows: the data collected from the standard QUIS
was first grouped into several profiles of interest (see Chapter 5). Profiles were
produced by calculating the modes, means and standard deviations for each item in
the QUIS. The means were then plotted on a graph using a scale of one (1) to nine
(9). The midpoint (5) on the rating scale was used as a benchmark of showing the
deviations above and below the criterion. An item above five (5) was perceived to be
better than an arbitrary, mediocre value. Data from interview and observation notes
was analysed for pattern identification. Data from notes was treated as secondary.
1.11 Assumptions of the study
Principles of usability and accessibility for web-based applications are
applicable to desktop applications.
Knowledge of reality is influenced by social networks, including language
and shared meaning. The same influence applies to workplaces too.
Business agreeing to implement and make use of HCI processes and
methodologies will commit as they would have done without this study. The

~ 14 ~
implementation in other businesses in the service industry, which are not
part of the research project, will be done in the same way.
1.12 The scope and limitations of the study
This study was restricted to the evaluation of tasks (front-end and back-end) in the
ACCtrav system. The study examined how the execution of these tasks affected the
user, and in turn, how the users’ reactions impact on business.
The scope of the study included productivity, skills, communication among users and
within the business, and customer relations as in service delivery. Other
considerations included product branding and public relations.
Usability was a means of relating the linkage of low business activities (user tasks) to
the overall image of the business in terms of providing a quality service. The results
from this study can never be generalised or imposed to mean the reality of other
related businesses or the service industry as a whole.
1.13 Implications of the study
The implications of this study could lead to:
Better design of user tasks for these types of business systems and other
systems as well.
Improved learning of similar systems – both cognitive and collaborative. As
a result of clear user tasks, users tend to learn quickly and easily share
experiences and knowledge. This would have a direct impact on end-user
productivity and skills improvement.
Efficient change implementation in the case where users do not resist but
embrace new computer-based systems.
Efficient organisational branding through the system interfaces (layout,
error message display, help, navigation, and task execution). For example,
use of business logos and colours in the design of interfaces may create
or enhance a sense of belonging in the end-user’s mind.

~ 15 ~
1.14 The outline of the remainder of the dissertation
Table 1: Dissertation layout
Chapter Content
a. Introduction and
Overview
Chapter 1 outlines the background to the main fields of study
in this dissertation. The aspects covered in the chapter
included the research problem (ACCtrav), the research
questions, the study objectives, research methodology, the
significance of the study, and delimitations and limitations.
b. Literature Review Chapter 2 provides a comprehensive literature review on
HCI. The aspects discussed included the usability and
accessibility of systems, and the associated quantifiable
benefits to businesses.
Chapter 3 continues the literature review but with a specific
focus on the relationship between HCI and service systems,
which included explaining the principle of services science;
the meaning of services; services science; the dimensions of
services and the role HCI processes and methodologies
have played in the service systems.
c. Research design and
methodology
Chapter 4 describes in detail the research design, data
collection methods applied as well as data presentation and
data analysis procedures followed.
d. Data Analysis and
Interpretation
Chapter 5 focuses on the interpretation of the data and
covers the discussion of the research results with respect to
the research questions.
e. Summary and
Further Research
suggestions
In Chapter 6, the findings from the research are summarised
and conclusions drawn. The contribution of the study is
explained herein, followed by a brief discussion on the
limitations of this study. Finally, suggestions for future
research opportunities are given.

~ 16 ~
1.15 Summary
This chapter served as the introduction into this study and provided the background
to the research as well as covered the motivation of embarking on this study. The
aspects covered in this chapter included how the idea for the study arose, the
deriving of the research topic from the preliminary literature review, and the
identification and articulation of the problem statement.
The research question as well as the dissertation statement, assumptions and
limitations of the study, and the layout of the dissertation were discussed.

~ 17 ~
CHAPTER 2: LITERATURE REVIEW
2.1 Introduction
Nowadays, users expect computer-based products or systems (be it cell-phones,
websites, application systems) to just work and be usable and intuitive after
undergoing minimal training. Further, modern-day users want more from a system
than merely “ease of use” (Carroll, 2013). This may suggest that users have got to
either gain immediate value from products or move on, which has created user
attitude of either win or lose state based on the premise of user experience.
Studies have shown that the quality of user experience can be directly linked to the
success of any business (Bias and Mayhew, 2005; Karat, 1990; Landauer, 1996;
Nielsen, 1993). This is because, nowadays, typical business system users have
various choices to make. Additionally, users can evaluate alternative solutions to
satisfy their expectations and or needs before committing any money. This notion
may be relevant to software development houses producing Commercial-Off-The-
Shelf Software (COTS) products. This could be because the open market is driven
by the competition based on the product’s quality and price.
In-house developed products that are not exposed to the open market affect
businesses differently because the employees of the company are the only users of
these systems. The majority of the employees normally do not have influence, let
alone making choices, on the implementation of company systems. The premise of
user choice for in-house developed products can be limited, if not non-existent.
These users work with whatever they find within the company. They have to
improvise, be creative or manipulative in order to deliver on set goals, and they are
expected to deliver irrespective of the system’s usability state (Bessie`re et al., 2004;
Lazar et al., 2005). As a result of the environment in which they find themselves
working, these users are influenced at every stage by their own experiences –
whether good or bad.
HCI has been defined as the learning of how people design, implement and use
interactive computer-based systems, and how computers in turn affect individuals,
organisations, and society (Carroll, 2013; Dix et al., 2004; Sharp et al., 2007;

~ 18 ~
Norman, 1988; Shneiderman and Plaisant, 2009). In particular, HCI, as a field, has
been related to the study of how humans interact with computers, and how to design
computer systems that are easy, quick and productive for humans to use (Sharp et
al., 2007). Preece et al. (2011, p.9) defines interaction design as “being about
designing interactive products to support the way people work, communicate and
interact in their everyday and working lives”.
This chapter investigates the literature on HCI (section 2.2) and its sub-disciplines
such as usability and accessibility. In section 2.3 there is a brief discussion on the
HCI techniques investigated in this study. The intention was to gain an
understanding of the benefits that have been associated with deploying HCI
processes and methodologies (section 2.4). Chapter 3 continues with the literature
study on Service Science, reviewing the role that HCI processes and methodologies
have played.
2.2 Human-Computer Interaction (HCI)
HCI studies have both formed rich academic viewpoints in their efforts to bring about
an understanding of interaction with, and through Information System (IS) artefacts
(Carroll, 2009; Dowell and Long, 1989; Wild, 2010). These viewpoints had a focus on
how to represent an individual and/or collective activity in ways that would educate
on the design of new IS artefacts and activities (Dowell and Long, 1998). However,
the significance of activity representation in HCI was often based on technology
under development (Wild et al., 2009b).
HCI processes and methodologies have been developed not only to realise the ease
of use of a product or system but also to establish interaction techniques for
supporting user tasks, providing efficient access to information, and providing some
form of communication (Sharp et al., 2007; Wild et al., 2009b). Included in the
context were the input and output devices as well as system user interfaces. Figure
5 considers the interaction techniques that use input and output devices as well as
the ways and means in which information is requested or presented to improve on
user experience. Other considerations included controlling and monitoring the
computer’s actions, documentation, training, and the help procedures. In product

~ 19 ~
development, attention has been given to designing, building, testing, and evaluating
user interfaces, and the best practices when building interfaces (Dumas, 2003).
Figure 5: Human-computer interaction (Source: Sigchi, 2009)
The University College London (UCL) approach has been one of the conceptual
frameworks put forward for HCI (Dowell and Long, 1989). The UCL approach offered
a set of abstractions that put emphasis on effectiveness and performance (Diaper,
2004). The ultimate goal was to have systems that are “effective to use
(effectiveness), efficient to use (efficiency), safe to use (safety), having good utility
(utility), easy to learn (learnability), and easy to remember how to use (memorability)”
(Sharp et al., 2007, p.20). HCI processes and methodologies have been established
and divided into several sub-disciplines, including usability and accessibility, which
are discussed next in the subsequent sections.

~ 20 ~
2.2.1 Usability of computer-based systems
Carroll (2013) asserts that usability is an emergent quality that reflects the grasp and
the reach of HCI. When it comes to products or systems, usability is regarded as a
prerequisite for its usefulness (Nielsen, 1993). The formal definition of usability as
provided by ISO (9241-11:1998, p.1) is “the extent to which a product can be used
by specified users to achieve specified goals with effectiveness, efficiency and
satisfaction in a specified context of use”. NN/g (2013) defines usability by five
quality components: learnability, efficiency, memorability, errors, and satisfaction.
Usability therefore is “the extent to which the product can be used by specific users
to achieve specific goals with effectiveness, efficiency, and satisfaction in a specific
context of use” (NN/g, 2013, p.1).
Usability considers multidimensional properties of the user interface, in combination
with factors that include the ease of learning, the efficiency of use, memorability,
error frequency and severity, and subjective satisfaction (cf. Sharp et al., 2007;
Usability.gov, 2012). Usability measures the quality of a user’s experience when
interacting with a product or system – whether a website, a software application,
mobile technology, or any user-operated device. Usability can also be associated
with the functional abilities of the product (cf. ISO 9241-11:1998) in addition to
merely being a characteristic of the user interface. When assessing user interfaces
for usability, the factors to consider include the fitness for purpose (utility and
effectiveness) and the work or time required to use (efficiency) (cf. Sharp et al.,
2007, p.20). These factors are subjectively measured against the criteria, sometimes
referred to as the principles of user interface design that is visibility, feedback,
constraints, consistency, and affordances (Norman, 1988) and the result is often
expressed quantitatively as a numeric score or percentage.
Dumas (2003) stated that one of the primary goals of usability testing/evaluation is to
improve the usability of a product. In each usability test conducted, there could be
more specific goals that may range from comparison with competitors’ products,
ease of use, learnability, efficiency of systems, and other goals. Bias and Mayhew
(2005) further stated that usability could be used to gain business benefits. The
benefits could range from cutting costs, skills enhancement or retention, customer

~ 21 ~
satisfaction, to increased ROI of the ICT infrastructure. De Villiers (2009)
emphasised that usability testing technology may also be used to find out more
about the actual behaviours of users interacting with the systems. The usability of a
product is not only affected by its features but also by the characteristics of the
intended users; the tasks carried out; and the technical, organisational and physical
environment in which the product is used (Wild et al., 2009a). This study took a
similar view as that of Bias and Mayhew, and De Villiers.
From a business analysis (BA) perspective, usability is regarded a non-functional
requirement of systems. Non-functional requirements are quantified by stating the
system attributes (e.g. security access levels, meantime before failure) or indirect
measures. BA practitioners can use usability techniques in conjunction with process
analysis techniques to address some aspects in system process analysis (Andersen,
1999) such as better understanding users of the system. This would include the
users’ general background, level of knowledge in terms of information processing,
learning needs, what users want or need to accomplish and what must be left to the
machine in the context of work. Usability concepts and techniques can also be used
to analyse business processes with the aim of improving on the performance of
business activities (Trischler, 1996) by defining performance measures, and the
assessment and performance evaluation.
The characterisation of performance measures (e.g. the time it takes to process an
application/task, the number of customer complaints) is important both in process
analysis and usability evaluation in order to identify or assess opportunities for
improvement. For example, the software should help meet the special needs of
disabled users (i.e. be accessible) and other stated guidelines to consider when
evaluating its design and usability (Dumas, 2003; NN/g, 2013). Therefore, the
reasons to justify the value of usability fall within the need to
know and empower the users;
design things that look the same to act the same, and those that do not,
should act differently;
presentation of information needed for decision-making;

~ 22 ~
design message dialogues that are meaningful to the users, i.e. instruct
the user on how to fix the error;
ensure that every action taken should have a reaction in a way that the
user always knows what is happening;
fix all the mistakes made by the users, if possible, since every user makes
mistakes;
minimise the need for memory by keeping designs simple; and
make tasks and processes easy and faster since the best journey has
fewest steps.
Tasks
ArtifactsAdoption, appropriation, use
Experience, requirements and design ideas
Figure 6: The task-artifact cycle. Human activities implicitly articulate needs,
preferences and design visions (Adapted from: Carroll, 2013)
Usability can be used in the co-development of the activities that users engage in
and experience, and the artefacts such as interactive tools and settings that
facilitate those activities (Carroll, 2013). Figure 6 shows how usability concerns the
evaluation of interactive systems and tasks. The activities that users engage in often
articulate the use and experience, preferences, needs, and design expectations. The
users have needs because of the requirement to execute the tasks. The users
construct artifacts and change artifacts (both system hardware and software) in order
to fulfil this need. Artifacts can be designed, in response, through the course of users
adopting new designs to provide new possibilities for action and interaction. As a
result, users’ preferences, needs, and design ideas become clearer. Moreover, the

~ 23 ~
concepts and skills develop as users express new requirements. Usability also
concerns the understanding of user performances and aspirations; and how the
performances and aspirations can be personalised and shared past the limitations of
existing infrastructures and tools (Carroll, 2009) in the co-evolution of activity and
artifacts. These considerations can be addressed by developers by using
appropriate usability evaluation and other appropriate (HCI) techniques (Dumas,
2003).
2.2.2 Making the business case for usability
HCI processes and methodologies are significant to any business that makes use of
computer-based systems (Bias and Mayhew, 2005; Heppner et al., 2005).
Computer-based systems are developed and implemented to enable business to
achieve goals and objectives in an effective way (Heppner et al., 2005).
However, many software projects have often failed because of the lack of
understanding of the business goals by the developers and the poor usability of such
systems (Boehm and Turner, 2003). In addition, Taylor and Swan (2004) associated
the cause of software project failures with the lack of effort spent by the designers of
such systems on understanding the way in which humans interact with technology.
In explaining the lack of understanding the way in which humans interact with
technology, Taylor and Swan (2004) used an analogy of mothers who create a list to
organise their daily tasks – which an outsider hardly knows of – leave alone,
forgetting the hard work that goes into fulfilling the compiled lists.
The lack of effort from designers in understanding how humans interact with
computers has led to the lack in system functionality, and as a result, has led to
quality problems. Also, businesses get affected in the form of high costs in
maintaining such systems (Bias and Mayhew, 2005). It is appropriate to make use of
HCI processes and methodologies to improve on business understanding about how
humans relate emotionally to technology whilst using systems to accomplish
everyday tasks (Carroll, 2013; NN/g, 2013; Preece et al., 2011).
Computer systems that are well designed and usable may not require to check
whether or not users can achieve intended tasks at an optimal pace; whether they

~ 24 ~
need training; are provided with the necessary documentation or other supporting
materials to help them; and whether users can easily find solutions in these materials
(Lund, 1997; Magoulas and Chen, 2006; Shneiderman and Plaisant, 2005).
2.2.3 Accessibility
Accessibility is related to and sometimes regarded a complementary component of
usability. Accessibility is considered to be the extent to which an application is
perceivable, operable, and understandable by people with different abilities
(Alexander, 2006; Henry, 2002; Pernice and Nielsen, 2001). Direct accessibility is
provided for when an application has built-in redundancies that enable access by
people with mild to moderate disabilities without system modifications. On the other
hand, indirect accessibility provides access through add-on assistive technologies
(Vanderheiden, 1994).
The universal design strategy has been one of the approaches used to facilitate the
development of applications that are both usable and accessible (Lazar, 2007).
Universal design is also the process of designing products, systems or applications
that can be used by a wide variety of people in as many circumstances as possible
(Darzentas and Miesenberger, 2005; Dix et al., 2004). Universal design has aimed at
providing equitable experiences for everybody; this, in essence, makes it possible for
more people to benefit from improved usability. However, the usability issues for
users with disabilities may be different from those without disabilities. Differentiating
between users with and without disabilities in a workplace may be a challenge
because it is likely that all users may have at some point experienced some form of
disability. The difference may lie in the degree of severity. According to NN/g (2012),
most users at age 45 and over need resizable fonts although they are not regarded
as “low-vision” users. Senior citizens’ usability issues are different from those of
young users with disabilities, but again, there are many similarities between the two
groups.
The business goal of accessibility would be to get more workplace productivity from
users with disabilities. This is similar to the goals of usability. Applying a combination
of accessibility and usability principles improves user experience (UX). UX refers to a
user’s sentiments about using a specific system or product by highlighting the

~ 25 ~
practical, emotional, meaningful and valuable characteristics of human-computer
interaction as well as a user’s perceptions of the applied aspects, such as the
system utility, ease of use and efficiency (NN/g, 2013; Preece et al., 2011).
2.3 HCI techniques investigated
There are several HCI processes as well as techniques that have been developed
and adopted for various use within the field of HCI. Many of these techniques can be
triangulated when investigating a specific case of interest. However, many of these
HCI techniques were not investigated in this study except for those considered to be
the most suitable for this study’s goal of (a) improving user productivity; (b) reducing
the costs of training; (c) enhancing skills among users; (d) redefining business
processes or work flows to generate a competitive advantage; and (e) improving
business operations (Bias and Mayhew, 2005; Magoulas and Chen, 2006). The HCI
techniques that were investigated in this study are Contextual Inquiry and Task
Analysis, Attention and Workload Mode, Human Information Processing Model, the
User-Centred Design (UCD), Goals, Operators, Methods, and Selection Rules
(GOMS), Cognitive Walk-through and Heuristic Evaluation or Usability Audit. The
reasons and explanation to justify why these techniques were chosen and
investigated can be found in Chapter 6 section 6.4.3
2.4 The benefits of HCI processes and methodologies
Practitioners rarely use the recommended usability methods on software
development projects (Whiteside et al., 1988; Nielsen, 1993). This includes even
such basic usability engineering techniques as early focus on the user, empirical
measurement, and iterative design. Gould and Lewis (1985) found that only 16% of
developers mentioned all the three principles when asked what one should do when
developing and evaluating a new computer system for end-users. Mantei and Teorey
(1988) stated that one of the imperative reasons usability engineering was not used
in practice relates to the perceived cost of using the techniques. Software
development houses have often viewed usability methods as expensive, and the
costs incurred to add human-factor elements to the development of software seem to
make the project costs higher (Mantei and Teorey, 1988). However, the researcher

~ 26 ~
acknowledges that the findings of these studies (Gould and Lewis, 1985; Mantei and
Teorey, 1988; Nielsen, 1993; Whiteside et al., 1988) may be out of date.
Specify context of use
Identify need for
human centred
design
System satisfies
specified
requirements
Evaluate designs
Produce design
solutions
Specify requirements
Figure 7: The User-Centred Design model (Adapted from: ISO, 2010)
In the recent past, a number of studies have developed design principles for
improving and justifying the deployment of HCI processes and methodologies (Bias
and Mayhew, 2005; Landauer, 1996). As a result, one common process is now
known as user-centred design (UCD). Figure 7 shows a UCD model (cf. ISO 9241-
210:2010: Human-centred design process for interactive systems) that defines a
generic process comprising user-focussed activities throughout a development life
cycle. The model identifies four process activities that form the main cycle of work.
The “specify the context of use” activity identifies the users of the system, its
purpose, and the environment in which the system will be used. The “specify
requirements” activity involves identifying any business requirements or user goals
that the system will meet to be regarded as successful. The other two activities
create design solutions and evaluate design solutions involve building the rough
concept to a complete design; usability testing with the users form an integral plan

~ 27 ~
for quality testing. UCD has also been used to provide a valuable contribution when
conveying a usability plan. The process can also be used to compare different
usability methods and so aid in the selection of the most cost-effective method for
the project (Bias and Mayhew, 2005; Carroll, 2013; ISO, 2010).
Businesses and practitioners are yet to fully embrace HCI methods and processes,
and to get out of the narrow-mindedness and misunderstanding of HCI. Karat (1990)
prepared a cost-benefit analysis that submitted that a venture in usability engineering
can create an ROI in the series of 3:1 to 100:1 (see figure 8). The payoffs included
fewer last-minute design changes; usable, appealing, and effective designs; simple,
less costly documentation; credible marketing claims; compelling product
demonstrations; increased sales; reduced need for customer support; and longer
market life.
Figure 8: Cost-Benefit Analysis of usability engineering techniques (Source: Karat, 1990)
Myers (1992) found out that users expect highly effective and easy-to-learn
interfaces. The human-computer interface is critical to the success of systems in the
workplace as well as the safety, usefulness, and pleasure of using the system
(Lindgaard and Dudek, 2002). Hence, over 50% of the design and programming
effort on software projects should be devoted to the user interface (Carroll, 2013;
Preece et al., 2011).
There is empirical evidence that employing the HCI processes, techniques, and tools
can, with much worth, decrease costs and increase user productivity (Donoghue,
2002; Mele and Polese, 2011). For example, Nielsen (1993) cited a study by Karat

~ 28 ~
(1990, p.1) stating savings “as a result of applying usability engineering techniques
of about $41,700 in a small application used by 23,000 marketing personnel, and
approximately $6,800,000 for an application used by 240,000 employees”. “The
benefits were realised in reduced task time, fewer errors, reduced user interruption,
reduced load on support staff, riddance of training, and averting of modifications in
software after release”.
Mantei and Teorey (1988) estimated the mean benefit for finding each usability
problem at $19 300. Nielsen’s (1993) mathematical model based on eleven studies
suggested that using software that has undergone usability engineering could save a
small project $39 000; a medium project $613 000; and a large project $8 200 000.
The benefits of usability engineering can be up to 5 000 times the cost (Nielsen,
1993).
HCI processes and methodologies, when applied, can offer decreased costs of
system design and development. System development timelines can be shortened,
and there can be a decreased risk of project slippage. There is also an element of
increase in competitive edge since users will have a system that is easy to use.
Users become more satisfied when a system offers relevant services that match
their needs and expectations, leading to success in the workplace when
implementing change.
2.5 Conclusion
HCI processes and methodologies in one way or the other can be used to
complement process analysis. This can be through learning how computer-based
systems affect users’ way of work, and communication and interaction in their
everyday working lives. The understanding would bring about benefits for business,
which may be reflected in higher revenues through increased sales; increased user
efficiency and satisfaction; reduced development costs; and reduced support costs.
HCI processes and methodologies may also be used to develop and implement
business systems easily or adjust in ways that could help achieve specific goals with
effectiveness, efficiency, and satisfaction.

~ 29 ~
CHAPTER 3: THE RELATIONSHIP BETWEEN HCI AND
SERVICE SYSTEMS
3.1 Introduction
This chapter continues with the literature review started in Chapter 2, specifically,
considering the role of HCI processes and methodologies within service systems.
Service systems have been defined as “dynamic configurations of people,
technologies, organisations and shared information that create and deliver value to
clients, providers and other stakeholders” (IfM and IBM, 2008, p.1). The operations
in the services sector have subjective performance measurements, and there have
been expressions from scholars for the need to gain a deeper understanding of the
practical use of computer-based systems in service-based organisations (Hocova
and Stanicek, 2010; Maglio et al., 2006; Spohrer et al., 2007). Furthermore, there is
still a need for a performance measurement system designed specifically for a
service-dominant context (Spohrer and Maglio, 2008). As a result, the term Service
Science has emerged, which, according to Kim (2009, p.3) “is the study of service
systems with the view to discover the underlying principles that can inform service
innovation and guide the design, improvement, and scaling of service systems”.
The use of HCI processes and methodologies can be essential and complement
Service Science when highlighting the relationships between the enterprise’s
computer-based systems and the business’ strategic goals, especially when
developing the measurement models and key performance indicators to assess the
quality of service provision (Spohrer and Maglio, 2008; Rust and Miu, 2006). HCI
processes and methodologies can be applied together with Service Science since
both have an influence on the design of computer-based systems and emphasise
the merging of technology with an understanding of the business processes, with a
perspective on customers, internal relationships and communication.
The chapter begins with a discussion on the background of services in section 3.2,
where service characteristics, service models, and service systems were also briefly
discussed. The researcher sought to explain and link the relationship between HCI
and service systems in section 3.3, whereas section 3.4 focuses on the role of HCI

~ 30 ~
methodologies in service systems. This included a discussion of user-centred
design, business and user values, performance influencing factors, culture, social
factors, as well as frustrating user experiences. Section 3.5 contains a summary of
this chapter.
3.2 The services
Services have been described as a particular transformation brought about in the
condition of some person or good, with the agreement of the person concerned or
economic unit owning the good (Hill, 1977). As a result, service can then be
considered as “the application of competences for the benefit of another” (Spohrer et
al., 2007, p.72), implying that service can be a performance, action, or an
undertaking traded for value between the client and provider.
Many studies have stated the definition of services, stressing the intangible, events
and the partaking nature of services (Lovelock and Gummesson, 2004; Vargo and
Lusch, 2004; Wild, 2010). Sampson and Froehle (2006) described services as “an
action, performance, or promise that’s exchanged for value between provider and
client” (Spohrer et al., 2007, p.74). Services may be viewed as a “mechanism” that
enables access to one or more know-hows, where access is granted using a
prearranged interface and used consistently with controls and policies stated in the
service description (Spohrer et al., 2008). Services can be paraphrased in terms of
their generic key characteristics (Darby and Karni, 1973; Hill, 1999; Levitt, 1981;
Zeithaml, 1981). The characteristics include perishability, intangibility, inseparability,
simultaneity, and variability. Table 2 lists service characteristics and the implications
from marketing and positioning strategies (Blankson and Kalafatis, 1999).
In sections 3.2.1 and 3.2.2, the concept of service systems and the service models
are discussed.
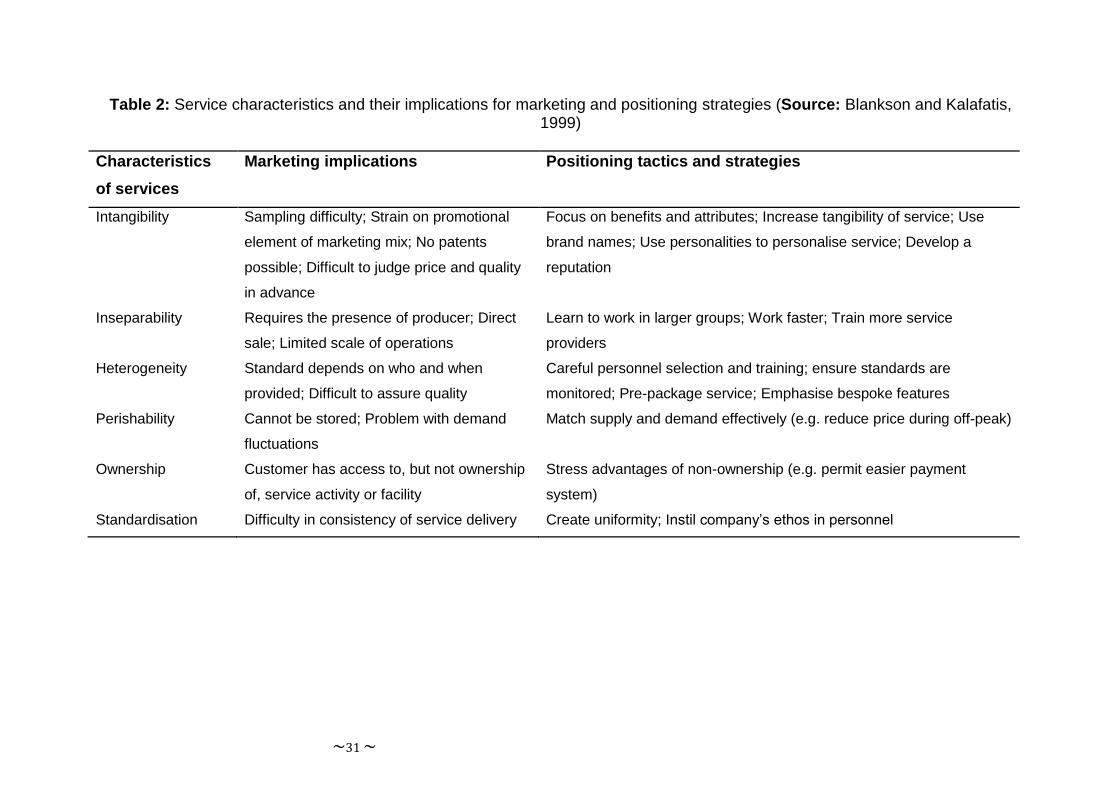
~31 ~
Table 2: Service characteristics and their implications for marketing and positioning strategies (Source: Blankson and Kalafatis, 1999)
Characteristics
of services
Marketing implications Positioning tactics and strategies
Intangibility Sampling difficulty; Strain on promotional
element of marketing mix; No patents
possible; Difficult to judge price and quality
in advance
Focus on benefits and attributes; Increase tangibility of service; Use
brand names; Use personalities to personalise service; Develop a
reputation
Inseparability Requires the presence of producer; Direct
sale; Limited scale of operations
Learn to work in larger groups; Work faster; Train more service
providers
Heterogeneity Standard depends on who and when
provided; Difficult to assure quality
Careful personnel selection and training; ensure standards are
monitored; Pre-package service; Emphasise bespoke features
Perishability Cannot be stored; Problem with demand
fluctuations
Match supply and demand effectively (e.g. reduce price during off-peak)
Ownership Customer has access to, but not ownership
of, service activity or facility
Stress advantages of non-ownership (e.g. permit easier payment
system)
Standardisation Difficulty in consistency of service delivery Create uniformity; Instil company’s ethos in personnel

~32 ~
3.2.1 The concept of service systems
The view of service systems in this study has been taken from the model described
in Maglio et al. (2006), which has provided the concept that is often referred to by
other Service Science researchers (Hocova and Stanicek, 2010; Spohrer et al.,
2007). Figure 9 illustrates the definition of service systems and shows how service
systems interact and take upon the roles of either the service provider or service
client (Spohrer et al., 2007). In this case, the service provider or service client can be
in the form of an individual, an organisation – either public or private – with the
service interventions that may include people or business dimensions such as
products, technology artefacts, or information sharing. The service provider is
responsible for transforming or operating a service in order to create value for the
service client (Kim, 2009).
Some scholars have proposed a view of service systems which can be understood
as being primarily a cognitive system that depended on its own understanding for
survival and performance (Kim, 2009; Mele and Polese, 2011). However, this kind of
proposed view of service systems does not clearly state how a service system can
understand itself. It can surely not have the consciousness to think about itself. From
the perspective of a cognitive system, service systems produce information and
stimulate knowledge in a way that creates new knowledge through continuous
learning processes (Mele and Polese, 2011). The resources and learning processes
in service systems thus may form the basis in processes for value creation (Kim,
2009). Although generating sustainable value for business owners is the ultimate
goal, the creation of satisfying, revenue-generating, and or cost-saving user
experiences forms the means to an end nowadays (Bias and Mayhew, 2005, p.601).
Service systems have a characteristic of involving users acting in various roles
(Maglio et al., 2006; Spohrer et al., 2007). The roles may include: as an originator
and consumer of the service; setting the most important intentions for the design and
operation of the service; setting quality standards for satisfactory service levels;
participant in the process; and source of knowledge to the process (Kaner and Karni,
2006; Kim, 2009; Mele and Polese, 2011). Businesses are still seeking ways to
better facilitate these various roles through the use of technologies.

~ 33 ~
Figure 9: The conceptual model of service systems interacting in a service (Source: Maglio et al., 2006)
3.2.2 The service models
Both scholars and businesses have developed service models to outline the upper-
level business functions. The upper-level functions are further segmented into
services representing the processes and activities needed to accomplish the
business interests/goals and manage assets in their various states (Kaner and Karni,
2006; Mele and Polese, 2011). For example, Cai et al. (2008) suggested a so-called
service map (see figure 10) organised in three layers according to needs,
competencies, and resources.
The service needs are formed from the perspective of providing attractive user
experiences, reducing user sacrifices by improving on the service systems
availability, and the efficiency of service delivery. The second layer of the map
focuses on service competencies targeting the capabilities of a service provider to
deliver high quality services to its service clients (Cai et al., 2008). The competencies
are grouped into vertical competencies (related to the service process) and

~ 34 ~
horizontal competencies (related to various stakeholders). The last layer is about
resources, which could either be items or assets (i.e. information, people, processes,
physical assets) required to raise interaction and value creation.
Figure 10: Service map (Adapted from: Cai et al., 2008)
Leveraging service resources, service systems can strengthen their service
competencies in order to respond to service needs and increase the value created
(Kim, 2009). Some studies have investigated service models from a general
management point of view (e.g. Drucker, 1991; Quinn, 1992) and endeavoured to
comprehend and transcend the distinction between manufacturing and services. For
example, in the Goods-Dominant (G-D) logic aspects, McCarthy (1982) used the
Resource-Event-Agent (REA) model when discussing services from an economic
exchange perspective – the accounting systems in particular. Also, Spohrer et al.
(2008) came up with the ISPAR model to classify and characterise service systems
associations in the form of a decision tree that aim towards co-creation of value
(Maglio et al., 2009). Both the REA and ISPAR models were based on G-D logic
where services are viewed as “second-class products” that have shortcomings in the
form of inseparability, intangibility, perishability, and heterogeneity (Poels, 2010).
Table 2 describes the characteristics of services.
Service needs
•Value needs
• Experiences
•Reduced sacrifices
Service competencies
•Vertical capacity to perform processes and Horizontal capacity to manage and provide for several
stakeholders
Service resources
•Valuable/Useful resources for interaction and value creation

~ 35 ~
The REA model was further applied and studied based on the aspects of automotive
services by Weigand et al. (2009). Poels (2010) investigated the REA model from
the Service-Dominant (S-D) Logic perspective, and from it, derived the Resource-
Service-System (RSS) model. The RSS model conformed to S-D logic, where
services are viewed as a collaborative process in which capabilities are applied for
value co-creation. The intention of the RSS model was to help understand difficulties
created due to the inherent process inefficiencies when providing services instead of
goods. In particular, the RSS model was used to identify resources that contribute in
the exchange of reciprocal services by recognising the different states in which
certain types of service exchanges could be when monitoring service executions.
The next section discusses the HCI concepts in service systems and how useful
these concepts can become in task innovation, design, and execution.
3.3 HCI and service systems
Some scholars have explicitly examined services for a range of computing
applications such as web-based, pervasive and ubiquitous, using metaphors such as
the Service-Oriented Architectures – SOA, Software as a Service – SaaS (Chen et
al., 2009; Cyr et al., 2007; Luthria and Rabhi, 2009). The user value and worth-
centred precepts of HCI have also made their way into the service design
approaches (Cockton, 2006; Cottam and Leadbeater, 2004; Jones and Samalionis,
2008; Parker and Heapy, 2006; Reason et al., 2009). Wild (2010) stated that HCI
and Service Science have a common goal of creating robust, repeatable activities or
experiences that can be objectively successful (Papazoglou and Van den Heuvel,
2007; Van Dijk et al., 2007).
The primary tenets of an S-D logic are the conceptualisation of service as a process,
rather than a unit of output; a focus on dynamic resources, such as knowledge and
skills, rather than static resources, such as natural resources; and an understanding
of value as a collaborative process between providers and customers, rather than
what producers create and subsequently deliver to customers (Mele et al., 2009).
Wild (2010) further suggested that Service Science can benefit from HCI’s
experience, specifically through (1) the user-centred mind-set and techniques, and
(2) concepts and frameworks for understanding how interacting with computer-based
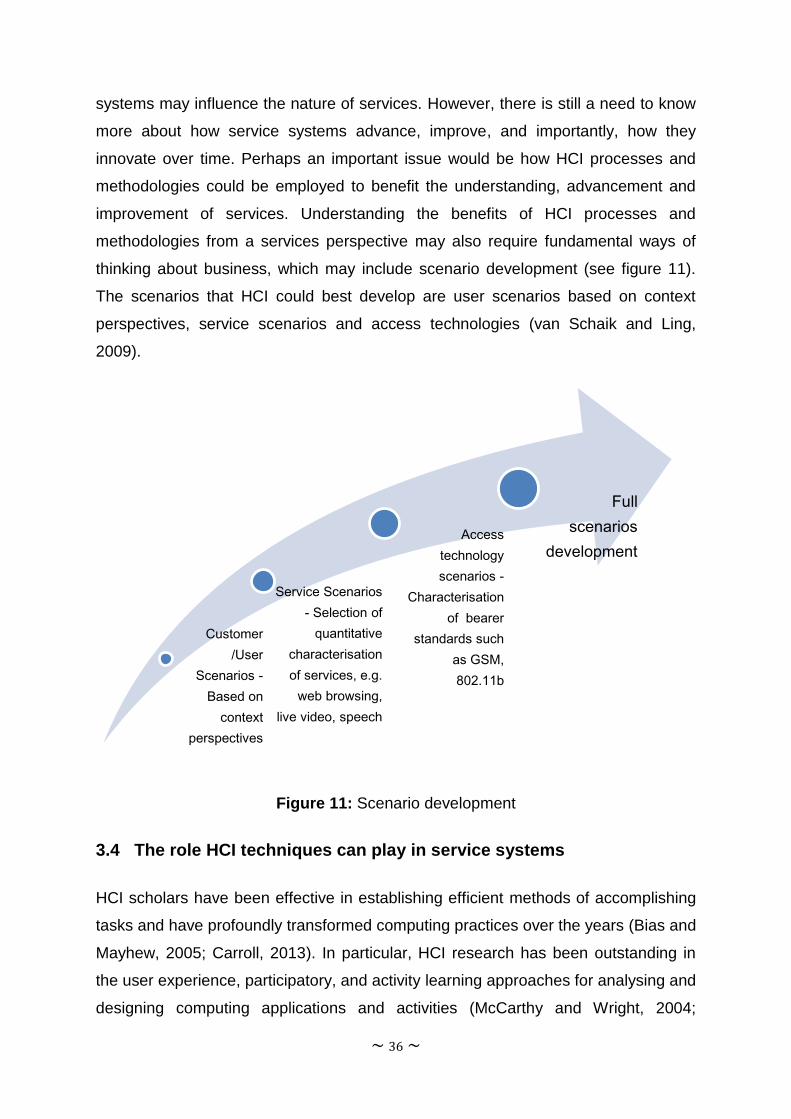
~ 36 ~
systems may influence the nature of services. However, there is still a need to know
more about how service systems advance, improve, and importantly, how they
innovate over time. Perhaps an important issue would be how HCI processes and
methodologies could be employed to benefit the understanding, advancement and
improvement of services. Understanding the benefits of HCI processes and
methodologies from a services perspective may also require fundamental ways of
thinking about business, which may include scenario development (see figure 11).
The scenarios that HCI could best develop are user scenarios based on context
perspectives, service scenarios and access technologies (van Schaik and Ling,
2009).
Figure 11: Scenario development
3.4 The role HCI techniques can play in service systems
HCI scholars have been effective in establishing efficient methods of accomplishing
tasks and have profoundly transformed computing practices over the years (Bias and
Mayhew, 2005; Carroll, 2013). In particular, HCI research has been outstanding in
the user experience, participatory, and activity learning approaches for analysing and
designing computing applications and activities (McCarthy and Wright, 2004;
Customer
/User
Scenarios -
Based on
context
perspectives
Service Scenarios
- Selection of
quantitative
characterisation
of services, e.g.
web browsing,
live video, speech
Access
technology
scenarios -
Characterisation
of bearer
standards such
as GSM,
802.11b
Full
scenarios
development

~ 37 ~
Schrepp et al., 2006). Dowell and Long (1989) came up with the UCL conception,
which presented a set of HCI constructs that can be applied when dealing with
Service Science. The constructs have been used in exploring the influence, scope
and utility when relating elements of research and in modelling service systems
(Dowell and Long, 1998).
One of the main contributions of HCI research to other fields has been in promoting
early focus on users in the process of developing IS artefacts. The user-centred
approach is universal enough that it can be applied to activities and experiences
when providing a service (Wild, 2010). HCI processes and methodologies can be
used to produce both functional and organisational aids when analysing and/or
designing services based on the principle of early and repeated focus on users and
their tasks or activities (Batt, 2008; Bourges-Waldegg and Scrivener, 1998; Cai et al.,
2008). HCI processes and methodologies can also offer strategies such as
prototyping, user participation, conceptual design or a choice of approaches that
may afford a refined investigation of tasks or activities and their associated
consequences in cognitive, social, emotional or informational aspects (Wild, 2010).
HCI processes and methodologies can complement service design methodologies in
several aspects. The key aspect can be in the eliciting of user requirements.
Whether these requirements are formal or perceived, their evaluations could be
based on the level of processing and cognition, and/or the emotion involved or the
desired outcomes in the form of attitudes, performance, satisfaction and motivation.
Figure 12 shows the framework that Tractinsky (2012) used to study the visual
aesthetics in HCI. The framework can be used in studying service systems,
especially to understand the features and the perceived attributes of the designed
service as well as user behavioural concerns (Batt, 2008). The most interesting
sections of the framework would be the outcomes and moderators. For example, that
users’ perceptions of a system’s good looks may influence perceptions of other
attributes such as ease of use (Cyr et al., 2006; van der Heijden, 2003), the
performance (Quinn and Tran, 2010; Sonderegger and Sauer, 2010), preferences
(Lee and Koubek, 2010) as well as the user’s overall satisfaction (Cyr, 2008) and
their attitudes towards businesses represented by the system (Lindgaard et al.,
2011; Tractinsky et al., 2006).

~ 38 ~
Affect and emotions have been considered as outcomes of visual aesthetics
(Thüring and Mahlke, 2007; Tractinsky, 2012) and contributes to a positive user
experience and well-being, and subsequent information processing (Sun and Zhang,
2006). HCI processes and methodologies can help in identifying and examining
various factors that affect users through potential moderators such as the context of
use, and the differences in culture (Hoyer and Stokburger-Sauer, 2011; Tractinsky,
2006).
Sections 3.4.1 to 3.4.6 will discuss some of the specific areas in which HCI
interventions have had a recommendable impact, and how the service systems may
benefit.
Figure 12: General framework for the study of visual aesthetics in HCI (Source:
Tractinsky, 2012)

~ 39 ~
3.4.1 User-centred design
Usability tests and user-centred design techniques are now recognised as essential
milestones in the development of interactive systems, including Graphical User
Interface (GUI) oriented applications, e-commerce websites, mobile services and,
eventually, wearable technology (Lazar, 2007; Preece et al. 2011; Porat and
Tractinsky, 2012). As a result, some answers have been brought forth by IS
researchers to some key questions; the questions are, among others, regarding (1)
When and how to involve users and user interface design specialists in the design
and development process; and (2) How to address accessibility difficulties for a
product to be universal (universal usability). Many IS researchers have shared
practical experiences on using usability engineering techniques and artefacts in the
analysis, design and evaluation processes of interactive systems (Carroll, 2013;
Shneiderman and Plaisant, 2009). Nevertheless, there are still problems being faced
when using systems, which suggests that this recognition and the suggested step-
by-step guidelines of incorporating the HCI processes and methodologies has yet to
be reflected into business benefits (Boehm, 1991; Tractinsky, 2012).
Several researchers (Norman, 1988; Nielsen and Molich, 1990; Shneiderman and
Plaisant, 2005; Dix et al., 2004; Sharp et al., 2007, 2011) have also suggested
principles and guidelines for the design of interactive systems. The principles are
generally provided in an abstract, high-level form that can be widely applied to a
variety of situations. While the guidelines are less abstract, they can also be widely
applied. Design principles and guidelines, for example, the principles of visibility and
feedback, can be used to derive criteria for evaluating the usability of service
systems. Applying a user-centric approach to the design of any product or service
can improve the performance of service projects and the business as a whole (Mele
and Polese, 2011; Sun and Zhang, 2006).
3.4.2 Supporting business and user values
Taylor and Swan (2004) stated that designers had often forced system users into
acting in a certain way while at the same time lacked the understanding of human
differences in terms of culture, politics, morals and social aspects. This suggested
that much emphasis and expectations had been placed on system designers in order

~ 40 ~
to understand the HCI processes and methodologies. Service systems may be faced
with similar emphasis (Donoghue, 2002; Porat and Tractinsky, 2012).
However, in recent years, there has been an increase in demand for usability (user
experience) experts to help evaluate the usability of computer-based systems that
are in the development process (Cyr, 2008; Lee and Koubek, 2010; Lindgaard et al.,
2011). The demand for usability experts could be associated with business’ effort or
emphasis to maximise ROI by releasing or deploying computer-based systems that
are user-friendly and that would readily win user acceptance the first time (Sun and
Zhang, 2006). The recent trends not only relieves designers of the burden or help
maximise ROI but they also provide an understanding by business owners and
managers regarding the impact of HCI processes and methodologies on businesses
since technology has had perverse effects in all dimensions (Cyr et al., 2006; van
der Heijden, 2003; Sonderegger and Sauer, 2010). In business dimensions, this
could imply winning a certain market share percentage since effective computer-
based systems may serve as a competitive advantage (Kim, 2009; Mele and Polese,
2011).
The study by Donoghue (2002) suggested that usability experts can contribute in
making the right business decisions when confronted with trade-offs concerning user
experiences and business interests (e.g. the time to market versus usability).
Nonetheless, for usability experts to efficiently contribute to business decision-
making, they will have to embrace the business decision-making attitude through the
establishment and demonstration of the link between usability flaws and shareholder
ROI (Donoghue, 2002). The factors to consider include the characteristics of the job,
the individual and the organisation that influence business or user performance
(Lindgaard et al., 2006).
HCI processes and methodologies can, therefore, be indispensable in helping to
optimise performance influencing factors (PIFs) or in shaping an understanding of
service systems (Magoulas and Chen, 2006; Spohrer et al., 2008). Some studies
have come up with quantifiable results supporting the importance of enhancing PIFs
(Bias and Mayhew, 2005; Donoghue, 2002). The areas of concern, among others,
would be branding, reducing costs of development and training, and improving
productivity (Bias and Mayhew, 2005; Hassenzahl, 2003).

~ 41 ~
3.4.3 Enhancing performance influencing factors (PIFs)
HCI processes and methodologies are of significance to business, mostly for areas
concerned with user performance (Bias and Mayhew, 2005; Ceaparu et al., 2004).
HCI methodologies or processes can influence user performance (Quinn and Tran,
2010; Sonderegger and Sauer, 2010) when used to identify requirements; and define
operational, support, and maintenance concepts. Other concerns would be to identify
and control factors that limit user performance, identify user functions and tasks
(Norman, 2004), identify and control excessive user workload, provide an acceptable
working environment, identify and control excessive user stress, and identify and
implement user population stereotypes (Ceaparu et al., 2004).
Table 3: Benefits associated with specific HCI processes and methodologies
Identify user requirements
Define operational, support, and maintenance concepts
Identify and control factors that limit user performance
Identify user functions and tasks
Identify and control excessive user workload
Provide an acceptable working environment
Identify and control excessive user stress
Identify and implement user population stereotypes
Design for a full range of potential users (gender, size, strength, vision,
clothing)
Develop for user acceptability
Develop for flexibility of use
Reduce opportunity for user error
Reduce the need for user manuals
Reduce requirements for new skills and Reduce likelihood of skill decay
Reduce personnel requirements
Develop lowest-cost training system (capital and/or operational costs)
Improve personnel selection system and personnel retention
Reduce time lost through accidents or injuries

~ 42 ~
Table 3 lists the benefits that can be derived as a result of using HCI interventions.
The benefits include designing products for a full range of potential users (gender,
size, strength, vision, and clothing) and developing products for user acceptability.
The concerns discussed above constitute PIFs, which are the characteristics of the
job, the individual and the organisation that influence business or user performance.
Cultural background is also crucial when considering user performance.
3.4.4 Understanding culture
Culture encompasses behavioural characteristics, values, languages, art, music,
shared preferences, rules, norms, attitudes, and beliefs to form ‘cultural elements’
(Segall et al., 1999). Cross-cultural cognitive psychology has been of utmost
importance when used in understanding user cognitive processes influenced by
cultural factors such as visual perception, memorisation, attention, reasoning,
learning, categorisation, and problem-solving (Segall et al., 1999; Tractinsky, 2012).
Some of the empirical studies in cross-cultural interface design have examined
whether or not cultural diversity affects visual perceptions (Tractinsky, 2012).
Consequently, it has been noted that differences in visual perception among users
from different cultures exist because they perceive visual images in a way that they
have experienced and learned.
The user experience and learning can be associated to different cultural dimensions
(Noiwan and Norcio, 2005). In spite of that, HCI processes and methodologies can
be used to emphasise those dimensions that are focussed on subjective aspects
such as values, beliefs, patterns of thinking and behaviour, and where meaning
becomes the central issue in culture (Bourges-Waldegg and Scrivener, 1998). This
can be achieved by ensuring that the intended meanings of user interface
representations (e.g. symbols, icons and language) are translated to suit the target
cultures’ correct understanding (Smith et al., 2004). In turn, social norms or factors
(discussed in the next section) that bind cultures can be identified and enhanced as
well.

~ 43 ~
3.4.5 Identifying and enhancing social factors
The recent research emphasis on social capital indicates a shift from enterprise
emphasis as a whole to the individuals who manage and operate businesses (Mele
and Polese, 2011). The shift in research focus is because of the appreciation of
values users epitomise, which often informed user decision-making and behaviour.
Users’ social relationships are a key factor to consider because business depends
upon individuals and their relationships (Vicari et al., 2007) in such a way as to form
a cultural identity. The cultural norms may include how businesses interpret and
realise the missions, strategic actions, and management practices as well as values
(Golinelli et al., 2002; Cross et al., 2001). The social relationships rooted in business,
and, in particular, users who take part in the system are therefore vital and contribute
to the uniqueness of the system performance characteristics (Mele and Polese,
2011). Even so, social relationships or networks are not flawless occurrences and
can be intended differently. It may require managing the social relationships with
intentions of forming social capital and increasing the possibility of creating value
from the service systems (Batt, 2008). Creating value can be done by depicting how
various factors in a social network may have an influence on tasks as performed by
users, the business, and the environment within which they exist. The factors may
concern concepts such as artefacts and technologies, roles, goals, domains, values,
and tasks(Wild et al., 2009b) as outlined in an environment which has socio-cultural
and physical dimensions (see figure 13). It may also show up within the system’s
effectiveness, functionality, and the quality of services provided. Of course, the
activities performed have an impact on a business’ domain, which may have an
influence on set goals and the values held by the users.
Taking HCI as a form of conversation between two participants capable of
processing information (Preece et al., 2011) may also be seen as a framework for
examining users’ tasks and environmental factors, which may affect the performance
of tasks in a socio-technical set-up (Eason, 1991). Environmental factors could refer
to social, cultural and physical factors (see figure 13). The physical environment may
concern things such as physical surroundings in which computer workstations are
operated or the visual display terminals (Eason, 1991). The interaction between
humans and computers has had an impact on users in the form of change in the
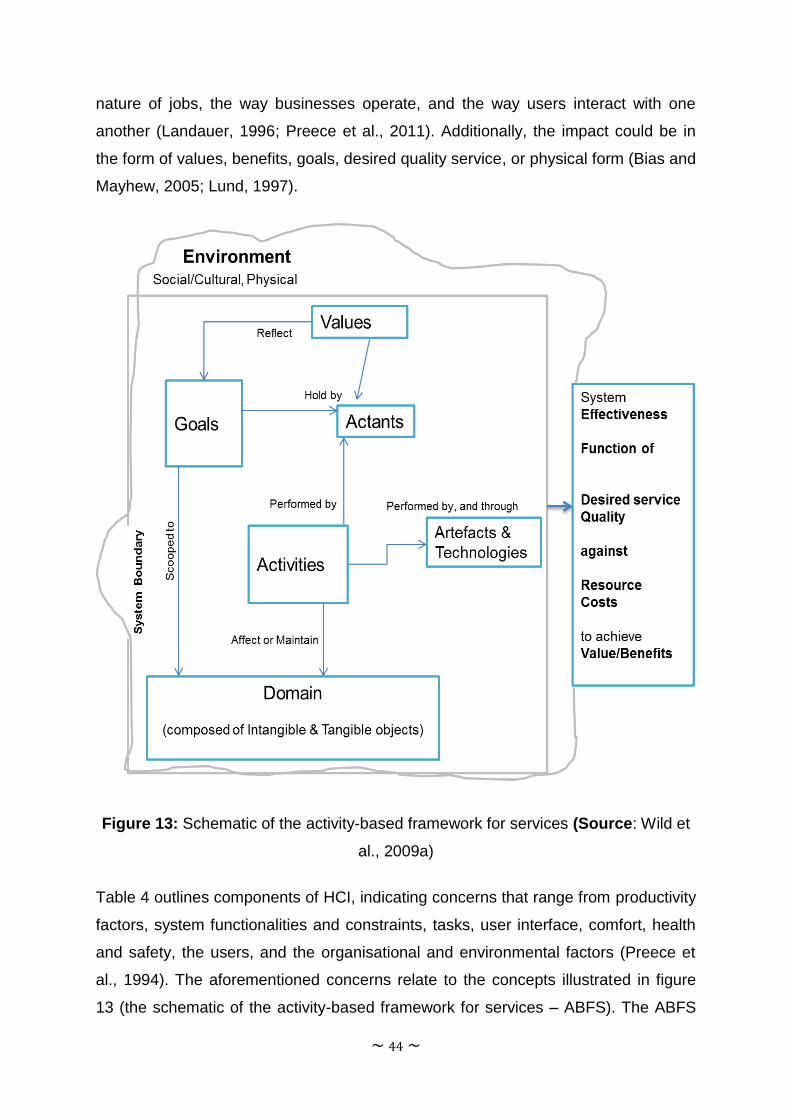
~ 44 ~
nature of jobs, the way businesses operate, and the way users interact with one
another (Landauer, 1996; Preece et al., 2011). Additionally, the impact could be in
the form of values, benefits, goals, desired quality service, or physical form (Bias and
Mayhew, 2005; Lund, 1997).
Figure 13: Schematic of the activity-based framework for services (Source: Wild et
al., 2009a)
Table 4 outlines components of HCI, indicating concerns that range from productivity
factors, system functionalities and constraints, tasks, user interface, comfort, health
and safety, the users, and the organisational and environmental factors (Preece et
al., 1994). The aforementioned concerns relate to the concepts illustrated in figure
13 (the schematic of the activity-based framework for services – ABFS). The ABFS

~ 45 ~
provides a model which is comprehensive in identifying all factors that contribute to
HCI design (Wild et al., 2009a).
Table 4: Components of HCI (Adapted from: Preece et al., 1994)
ORGANISATIONAL FACTORS
Training, job design, politics, roles, work
organisation
ENVIRONMENT FACTORS
Noise, heating, lighting, ventilation
HEALTH AND
SAFETY FACTORS
Stress, headaches,
musculo-skeletal
disorders
cognitive process and capabilities
THE USER
motivation, enjoyment,
satisfaction,
personality, experience level
COMFORT FACTORS
Seating,
equipment layout
USER INTERFACE
Input devices, output displays, dialogue structures, use of colour, icons, commands,
graphics, natural language, 3-D, user support materials, multimedia
TASK FACTORS
Easy, complex, novel, task allocation, repetitive, monitoring, skills, components
CONSTRAINTS
Cost, timescales, budgets, staff, equipment, building structure
SYSTEM FUNCTIONALITY
Hardware, software, application
PRODUCTIVITY FACTORS
Increase output, increase quality, decrease costs, decrease errors, decrease labour
requirements, decrease production time, increase creative and innovative ideas leading
to new products

~ 46 ~
The ABFS recognises a user as a complex being with cognitive processes and
capabilities but also with enjoyment, motivation, personality, satisfaction, and
experience. Also mentioned in the ABFS are the task-related factors (easy, complex,
novel, task allocation, repetitive, monitoring, skills, and components) and constraints
such as costs, timescales, budgets, staff, equipment, and building structures. The
next discussion will consider some of the factors related to frustrating user
experiences when using computer-based systems.
3.4.6 Identifying frustrating user experiences
Frustration may be described in relation to when the computer-based system acts in
an unexpected way that aggravates users and keeps them from reaching task goals
(Ceaparu et al., 2004; Lazar et al., 2005). Businesses are aware of the frustrating
computer experiences that users often encounter. For example, the computer-based
system crashes with no warning, taking perhaps five or more minutes of work with it
(Lazar et al., 2005).
Another common occurrence is the slow response to operations (Cyr, 2008;
Sonderegger and Sauer, 2010; Quinn and Tran, 2010). Frustration is a common
occurrence among system users since systems do not cater for all user preferences
(Lee and Koubek, 2010). Users often deal with many annoying interruptions,
mismatched files, and inconceivable error messages or sometimes experience no
feedback from the system about the transaction’s sudden termination (Lindgaard et
al. 2011; Tractinsky et al., 2006). Such system behaviour affects user trust (Bargas-
Avila and Hornbaek, 2011; Cyr et al., 2010). Lazar et al. (2005) further stated that
dialogue message boxes that are not clearly designed in style tend to provide users
with conflicting or confusing messages, which may also contribute to lost work. Error
messages that can hardly give a lead to a root cause of a problem can also waste
users’ productive time.
However, some frustrating experiences may result from the poor structuring of
business task flows or processes (Moshagen et al., 2009; van Schaik and Ling,
2009). Frustration happens when users cannot achieve their intended task goals,
and maybe as a result of a poorly designed system user interface, the failure of the
hardware or software, or users having insufficient knowledge of operating the system

~ 47 ~
(Lazar et al., 2005; van Schaik and Ling, 2009). The end result is that users will not
be in a position to complete their tasks as intended. Users will then have an
emotional response (Thüring and Mahlke, 2007) because of the failure to achieve
their goals, causing them stress, headaches, and similar inconveniences (Lazar et
al., 2005). With that said, there is yet more to be known about the causes and effects
of user frustrations when considered in terms of the time lost daily during the
struggle with systems and the associated effect on business. It is definite that
frustrating experiences do affect the users’ moods, their days, and their well-being
(Porat and Tractinsky, 2012; Sun and Zhang, 2006; Thüring and Mahlke, 2007). How
much of this has an effect on users is yet to be quantified or measured. In addition,
how this frustrating experience has an effect on workplace, family, or community is
yet to be investigated with measurable results (Lazar et al., 2005).
3.5 Conclusion
HCI interventions put an emphasis on user behaviours, the characteristics of the
designed system, and other attributes of the system or behavioural consequences of
aesthetic evaluations. Contextual issues, such as the type of tasks are significant
when considering user experiences, overall satisfaction, and performance in Service
Systems. HCI interventions can help streamline services in business areas such as
(1) identifying and determining how to make use of resources most efficiently and
effectively, (2) monitoring and measuring the quality of services, and (3) calculating
and forecasting future conditions, events, and user/customer responses.
Service Systems can benefit from HCI interventions when used to measure user
productivity, reduce training costs, enhance the skill of the system user, and
redefining processes or workflows to generate a competitive advantage hence
quality service provision.

~ 48 ~
CHAPTER 4: RESEARCH DESIGN AND METHODOLGY
4.1 Introduction
The discussion in this chapter addresses the research design and methodology that
was adopted and used in this study. The research design was a case study
approach. A research design is a strategic framework that guides research activities.
A research design has four components: (1) the purpose of the research, (2) the
research paradigm, (3) the context, and (4) the research techniques or methods
used (Blanche et al., 2006).
Figure 14: The six-step approach adopted when conducting the study
As stated in section 1.7 of chapter One, the purpose of this study was about finding
the impact of HCI interventions may have on user productivity, training costs and
skills enhancement, as well as the redefinition of business processes or workflows
that can help generate a competitive advantage, and improved business operations.
1. Determining the case and defining the
research questions
2. Determining and selecting data gathering and analysis techniques
3. Preparation to collect data
4. Collecting data in the business environment
(the main study)
5. Evaluation and analysis of data
6. Preparation of the report

~ 49 ~
The chapter was organised starting with the purpose in section 4.2, followed by the
research paradigm in section 4.3, the context of study in section 4.4, and the
strategy used in section 4.5. Section 4.6 discusses the six-step approach adopted,
including data collection methods as shown in figure 14. Section 4.7 discusses the
ethical factors that were considered when conducting the study. Section 4.8
summarises discussions of the chapter.
4.2 The research paradigm
A research paradigm provides a conceptual framework for the justification of the
choice of research methodology. The interpretivist research paradigm was used
when collecting, analysing and interpreting data. The conclusions arrived at,
therefore, were based on reality implemented by an associated methodological
approach and strategy (De Villiers, 2005). The interpretivist paradigm was used in
this study because it is characterised by a belief in a socially constructed,
subjectively-based reality, one that is prone to the influences of the environment;
unlike the positivist paradigm that views scientific knowledge in its purest form based
on observation free of environmental influences (Howe, 1988).
The underlying assumption of the interpretivist paradigm is that the ‘whole’ needs to
be examined in order to understand a phenomenon. As a consequence, qualitative
methods of analysis are well suited to interpretivist investigations. Qualitative
methods were used in the collection, analysis and interpretation of data. However, to
a lesser extent, quantitative methods were used to analyse some of the data.
4.3 The context of the study
The research was conducted in the general context of the HCI discipline with a
specific focus on Service Science (service systems). In particular, the study was
conducted in the travel services context whereby the computer-based system formed
the object of inquiry in the aspects of HCI and service systems. In this context, the
researcher wanted to look at how computer-based systems can be used to help
mitigate travel risks such as staff productivity, health, safety and security; company’s
reputation; and data security.

~ 50 ~
4.4 Case study strategy
A case study strategy is defined as “an empirical inquiry that investigates a
contemporary phenomenon within its real-life context; when the boundaries between
phenomenon and context are not clearly evident; and in which multiple sources of
evidence are used” (Yin, 1984, p.23). Similarly, Noor (2008, p.1602) defined a case
study as “an empirical inquiry that investigates a contemporary phenomenon within
its real life context using multiple sources of evidence.”
4.4.1 Background
Case study research design has evolved as a valuable tool for studying
developments and specific circumstances in many scientific disciplines. The
substantiation used in a case study is characteristically qualitative in nature and
emphasises developing an in-depth rather than wide-ranging, generalizable
understanding. Yin (1994) presented at least four applications for a case study
model: (a) to explain multifaceted fundamental links in real-life interventions; (b) to
describe the real-life context in which the intervention has occurred; (c) to describe
the intervention itself; and (d) to explore those situations in which the intervention
being evaluated has had no clear set of outcomes. Single cases may be used to
confirm or challenge a theory or to represent a unique or extreme case (Yin, 1994).
4.4.2 Application
As described above, Yin (1993) identified specific types of case studies as:
Exploratory, Explanatory, and Descriptive. Stake (1995) included three others:
Intrinsic when the researcher has an interest in the case; Instrumental when the
case is used to understand more than what is obvious to the observer; and
Collective when a group of cases is studied. Exploratory case studies have been
considered a prelude to social research when it comes to doing causal investigations
(Simons, 1980; Yin, 1993).
Stake (1995) argued for another approach centred on a more intuitive, empirically-
grounded generalisation and termed it “naturalistic” generalisation. Stake’s (1995)
argument was based on the harmonious relationship between the readers’

~ 51 ~
experiences and the case study itself. Stake estimated that the data generated from
case studies would experientially resonate with a broad cross-section of readers,
thereby facilitating a greater understanding of the phenomenon.
In this study a descriptive type of case study approach was followed as a single
case. A descriptive type of case study focuses and details the way suggestions and
questions about a phenomenon are examined and expressed before starting the
project. This articulation of what is already known about the phenomenon is referred
to as a descriptive theory. A descriptive theory helps in identifying the limitations and
boundaries of the case, and it can contribute to the consistency of the completed
case study (Simons, 1980; Stake, 1995; Yin, 1994).
This study focussed on understanding the benefits that a business may derive from
implementing HCI processes and methodologies. The ACCtrav system served as a
case of inquiry in the theoretical perspective of service systems, studied in its real-
life context work context.
4.4.3 Justification for a case study
Case studies are ideal when there is a need to do a holistic and in-depth
investigation of relationships that exist in nature, with the aim of deducing important
meanings (Noor, 2008; Yin, 1994). Rubin and Babbie (2013) added that the
advantage of a case study is that it provides a richer and deeper understanding of a
problem or question being investigated (cf. Yin, 1993). This often leads to a better
understanding of the user experience.
Case studies emphasise detailed contextual analysis of a limited number of events
or conditions and their relationships. Case studies tend to be selective, focusing on
one or two issues that are fundamental to understanding the system being
examined. Moreover, case studies are also known for a triangulated approach as a
research strategy (Yin, 1994). Triangulation can occur with data, investigators,
theories, and even methodologies. On that account, case studies have been
considered excellent at revealing an understanding of complex issues or objects.

~ 52 ~
The need to conduct a holistic and in-depth investigation, emphasise a detailed
contextual analysis, to select and focus on one or two issues, and to apply a
triangulated approach made the choice for a case study a suitable strategy for this
study.
4.5 Six-step approach adopted
This case study drew on the work of Stake (1995) and Yin (1993) following a six-step
process. Consideration was given to construct validity, internal and external validity,
and reliability (Yin, 1989). Levy (1988) established construct validity using the single-
case exploratory design, and internal validity using the single-case explanatory
design. However, external validity was more difficult to attain in a single-case study.
Yin (1994) suggested using multiple sources of evidence (triangulation) as a way of
ensuring construct validity. Yin (1994) listed six sources of evidence for data
collection in the case study protocol. These sources are interviews, direct
observation, participant observation, documentation, archival records, and physical
artefacts. This study used a usability questionnaire, interviews, and observation as
sources of data collection. Next is the description of the six-step process.
4.5.1 Determining the case and defining the research questions
The first step was to establish a firm research focus which would be referred to over
the course of study. The focus was on ACCtrav. The ACCtrav system was selected
as a single case in its real-life context of use, used by TMC and seven other
organisations which formed a group of companies (subsidiary of companies) co-
existing as competitors in the travel industry. The ACCtrav system was intricately
connected to political, social, historical, and personal issues which provided for wide
ranging possibilities of questions and added to the study’s complexity.
A literature review (Chapters 2 and 3) was conducted to establish what research had
already shown with regard to HCI and service delivery. This review led to refined and
insightful questions about the problems and the formulation of research questions.
The main research question for this study being: What benefits can a business
derive from HCI Interventions?

~ 53 ~
4.5.2 Determining and selecting data gathering and analysis techniques
The strength of a case study method involves using multiple sources and techniques
in the data gathering process (Yin, 1993). The technique of applying more than one
method in a single study is referred to as triangulation. The techniques used to
collect data included interviews, observation, and a questionnaire. These techniques
are discussed in detail in section 4.6.4.
A triangulation approach was applied in data gathering because data gathered was
largely qualitative. The ethical need to confirm the validity of the processes also
called for use of triangulation. The other reason resulted from triangulation being
viewed as a key methodological issue in the naturalistic and qualitative approach to
evaluation (Yin, 1994). This helped control prejudice in data in order to establish
valid propositions.
4.5.3 Preparation to collect data
Permission to conduct the research was sought from TMC managing director (see
Appendix B: part I Permission letter). The intent of the study and the scope were
clearly stated in the permission letter of request. This included the intention of
conducting interviews and questionnaires when gathering data. Also requested in the
permission letter was access to copies of some of the organisation and system
documents.
The divisions affected by the study were informed by the managing director’s office,
and the employees were asked to grant me access to and share the required
information as well as cooperate during the course of the study.
The study protocols and procedures needed to identify and contact potential
participants were established in advance. This was done by preparing, in advance,
letters of introduction and establishing rules for confidentiality when engaged with
participants (see Appendix B: part II Confidentiality agreement).

~ 54 ~
4.5.3.1 Training
Prior to collecting data training was undertaken in a number of programmes deemed
pertinent both in concept and analysis and presentation. These training programmes
included business analysis, business intelligence and analytics, process analysis,
emotional intelligence, basic statistics, and MS office (MS Excel, MS Word, and MS
PowerPoint).
The above-mentioned courses covered various basic concepts in terminology,
processes and analysis. The business analysis and business intelligence courses
helped in taking and understanding information collected from various sources; such
as that used in forecasting trends, creating improvements in strategies and
operations, and making smart business decisions with the intention of generating
business revenue and reducing costs. The course in statistics and spreadsheets
helped improve on data analysis abilities.
4.5.3.2 Sample design, sampling methods and criteria used in choosing the
sample size
The type of sampling used in this study was convenience sampling. Convenience
sampling (sometimes known as grab or opportunity sampling) was described by
Leedy and Ormrod (2010) as a type of non-probability sampling (subjects chosen in
a non-random manner) and involved the sample being drawn from that part of the
population which is close to hand. The sample size in this study depended on the
proximity, ease of access, and convenience in order to allow for a specified inclusion
criteria and homogeneity of participants (Blanche et al., 2006; Golafshani, 2003).
Participants were selected based on the assumption that they would be in a position
to provide the kind of information relevant for the study. Greig and Taylor (1999)
highlight that many forms of doing research require the participant’s mastery of a
number of basic cognitive skills such as understanding of verbal material, certain
attention span, memory capacity, understanding of certain symbols, and
understanding of conversation rules. Dumas (2003) came up with steps to use when
selecting participants for research: (1) developing user profiles, (2) selecting

~ 55 ~
subgroups for a test, (3) defining and quantifying characteristics for each subgroup,
and (4) deciding how many participants to include in a test.
Table 5 shows that a sample size of twenty-seven (27) participants was selected
based on the user profile of participants, which ranged from novice to expert users;
varying roles – data capturers, travel consulting experts, technical support staff, and
sales/marketing; finance and accounting; and management. Five (5) participants
were novice users with less than six months of working experience; five (5) were
intermediate with between one and two years of working experience; and the
remaining seventeen (17) had more than three years of working experience. Eight
(8) of the participants were front-end consultants; nine (9) were back-end
consultants; three (3) were from sales; another three (3) were from finance and
accounting; and four (4) were from system support.
Three (3) participants had some degree of disability. Of those with some degree of
disability, two had some degree of visual impairment – they could only see resized
(enlarged) desktop icons and fonts. The other one had a physical impairment; using
crutches to move (walk) around. Other factors considered included diverse
experience with the ACCtrav system, different educational and cultural backgrounds,
and exhibiting a higher attention span. The participants’ age ranged from 17 to 65
years but was not a key factor in the selection criteria, neither was their gender.
Table 5: Summary of participants’ profile
Experience using the system Role or function Disability Status
Novice with less than one year of
working experience 5
Consultants – front-end 8
No disability 24
Between one and two years of
working experience 5
Consultants – back-end 9 With some form
of disability 3
Experts with more than three
years of working experience 17
Sales and marketing 3
Finance and accounting 3
Support – Help desk 4
Overall total number of participants: 27

~ 56 ~
All participants were professionals who voluntarily participated in the study at their
own workplace setting. The participants were a convenience sample, and therefore,
the researcher makes no claims for generality. Future work might focus on, among
others, specific population segments, age groups, professions, educational or
cultural backgrounds, and gender.
4.5.3.3 The pilot study
A pilot study was conducted using five participants considered experts within the
TMC. These users were regarded as super users on the ACCtrav system and also
responsible for training other users on ACCtrav. One participant was from
management and the others from the back office. The methods of collecting data
were tested to make sure all likely problematic areas were identified and corrected. It
also helped determine whether the planned timeline was feasible and whether or not
the interview and questionnaire were appropriate and effective.
The purpose of the pilot study was to help identify any risk and uncertainty about the
actual study and to eliminate annoying problems that would have been encountered
when conducting the main study (Billé, 2010). The pilot study, therefore, tested the
feasibility of the methods so that any changes could be made in the main study if
necessary.
4.5.4 Collecting data in the business environment (the main study)
The main study was conducted in three successive stages. In the first stage,
participants were asked to complete a few demographic questions aimed at
ascertaining and obtaining data about the general experience with computers and
the computer-based system used in the study. In the second stage, activities
included participants completing the QUIS questionnaire (see Appendix A) as well as
an observation by the researcher while they were performing tasks on the system. In
order to obtain data reflecting typical computer-based system usage, participants
were asked to work on the ACCtrav system for a minimum of one hour before
attempting to fill in the QUIS questionnaire.
It was necessary to conduct a careful observation of the object of the case study in
order to identify any causal factors that could be associated with the observed

~ 57 ~
phenomenon. Lastly, post-test interviews were conducted immediately after each
session to seek clarity on areas deemed necessary (see Appendix A). These
activities are discussed next in detail.
4.5.4.1 Usability evaluation (QUIS questionnaire)
The QUIS was used to assess users’ subjective satisfaction with specific aspects of
the ACCtrav human-computer interface. QUIS was established by a group of
multidisciplinary scholars in the Human-Computer Interaction Lab (HCIL) at the
University of Maryland. The QUIS contains two parts. The first part pre-session
questionnaire is used to assess demographic information, computer-based system
experience and attitudes, and mood. The second part assesses user satisfaction
from a system usability perspective.
Questions in the questionnaire were chosen after a careful review of previous
research on the computer-based system aptitude scale, assessment of computer-
based system attitudes, computer-based system anxiety, confidence, and computer-
based system fondness (Loyd and Gressard, 1984; Nash and Moroz, 1997). Both
incident-level and individual-level factors were measured in various questions.
Incident-level factors were measured, such as the cause, level of frustration, and
response.
The severity of disruption was measured by combining the time taken to fix the
problem with the time lost due to the problem (Ceaparu et al., 2004). Computer-
based system factors were separated into computer experience or self-efficacy and
computer anxiety or attitudes. Computer experience was measured as years of
computer use and hours spent per week on computer use, a more subjective
measure of experience also effective as a measure of computer self-efficacy.
Additional measures of computer self-efficacy included confidence about their ability
to correct problems, how much a participant persevered when encountering
problems with the computer-based system, and how much a participant thought
about unresolved computer-based system problems after being unable to correct
them.

~ 58 ~
4.5.4.2 Observation
Field observation entailed witnessing participants interact with the ACCtrav system in
the natural environment of use at selected TMC’s offices (in Johannesburg and
Pretoria). The purpose was to complement usability evaluation in identifying
associated usability problems as a result of contributing factors inherent in the
ACCtrav system. Novice users were given predefined tasks to complete. Providing
predefined tasks enabled the researcher to focus the evaluation on specific tasks in
the ACCtrav system. Expert users had complete freedom to interact with ACCtrav as
they liked. This change of tactic was as a result of an insight from the researcher
ascertaining that self-set goals could have been more meaningful to the QUIS than
prior allocation of tasks (Locke, 1996).
All users were briefed of the intention to observe them but were not informed when
they would be observed in order to get a real feel of their working day. Observation
was carried out per user, selected at random. Every session lasted between 25 and
30 minutes, limited to a maximum of three (3) participants per day. There was no
need for a special introduction since the researcher was already known to the
participants. The researcher did not test the ability of the participants but observed
any unexpected ways of use (Dix et al., 2004; Nielsen, 1993) and how participants
acted and or behaved in such situations. Notes were recorded on a form for every
session about events, as described next.
Observation allowed the researcher to study the interaction between participants in a
variety of ways, for example, ways to check for non-verbal expression of feelings,
determine who interacts with whom, grasp how participants communicated with one
another, and to check how much time was spent on various activities (Schmuck,
1997). Other observed behaviours included confident readiness to experiment;
readiness to listen to suggestions from peers; body language, which either conveyed
enthusiasm or boredom from an activity and behavioural signs such as frowns,
sighs, yawns or turning away from the computer(Bessie`re et al., 2005). Another
objective was to observe the practicality of the system, which included the
identification of tasks, ease of navigation, and use of help menus. During
observation, there was no obstruction of any sort to the participants. The researcher
concentrated on observing what the participants were doing and refrained from any

~ 59 ~
form of influence or interruption with prompt questions. Appendix D has details of the
participants’ sitting plan.
4.5.4.3 Interviews
Contextual interviews were the last activity in the interaction with participants. The
interviews were conducted informally. They helped answer some questions about
the social and physical environment. There was no predetermined set of questions
for interviews, but they were derived from observation notes and QUIS additional
notes for each participant. Interviews also served as a post-session exercise which
enabled participants to give detailed responses about complex issues (Bowling,
2002) and were conducted within the participants’ own environment (workstation).
All interview sessions lasted five (5) minutes or less, and no tasks or scenarios were
imposed on the participants. Additional notes were taken for responses to questions
asked when seeking clarification to gain a better understanding of what the
participants were doing and/or thinking.
4.5.4.4 Field notes
Field notes were used to record intuitive feelings, pose questions, and document the
work in progress. Furthermore, field notes were used to record testimonies (during
interviews), observations, stories, and illustrations. Field notes assisted in
determining whether or not the inquiry needed to be reformulated or redefined based
on what was being observed. Field notes were kept separate from the primary data.
4.5.5 Evaluation and analysis of data
The data collected from the QUIS was first grouped into several profiles of interest.
Profiles were produced by calculating the modes, means and standard deviations for
each item in the QUIS. The means were then plotted on a graph using a scale of one
(1) to nine (9). The midpoint (5) on the rating scale was used as a benchmark to
show the deviations above and below the criterion. An item above five (5) was
perceived to be better than an arbitrary, mediocre value. More details are given in
Chapter 5.
~ 60 ~
Data from notes was analysed for pattern identification. Data from notes were
treated as secondary.
4.5.6 Preparation of the report
The results are reported in a way that makes identified issues clear and
understandable to the reader; this allows the reader to question and examine the
study and reach an understanding independent of the researcher. The goal was to
show a complex problem in a way that conveyed a facilitated experience to the
reader. The researcher paid attention to demonstrating sufficient evidence to affirm
that all avenues had been explored, clearly communicated the boundaries of the
case, and gave special courtesy to conflicting propositions. The process involved a
critical examination of the draft document for incompleteness or ambiguity. Experts,
in the form of research study supervisors, were also consulted in the review process,
and their comments and feedback were used to improve the validity of the report.
Chapter 6 represents the report.
4.6 Ethical consideration
This study complied with the company’s ethics policy. Ethical standards were
adhered to in order to ensure the integrity of the researcher’s conduct, intellectual
honesty, accuracy, fairness, and protection of human participants involved in the
process of conducting the study (Miles and Huberman, 1984).
4.6.1 Permission to conduct study
The permission to conduct the study was obtained from the relevant authorities
(managing director); copied in the communication were the relevant senior
management whose departments were to be affected by the study. The relevant
documents are included as Appendix B.
4.6.2 Informed consent
Informed consent forms were sent to and signed by every participant prior to the
data collection exercise (see Appendix B). Consent forms clearly stated to
participants that they were agreeing to participate at their own freewill and by no

~ 61 ~
means were they obliged or bound to stay. The purpose of the study was also clearly
communicated to every participant before they were engaged.
4.6.3 Confidentiality and anonymity
The confidentiality of the participants was paramount. Confidentiality was ensured by
restricting access to data collected only to the researcher and research study
supervisors. Anonymity and confidentiality of participants was guaranteed by not
using or revealing their actual names in the study or in any other form.
4.6.4 Privacy
Privacy refers to the right that all information collected in the course of the study will
be kept in the strictest confidence (Polit and Hungler, 1999). In this study, the
participants were informed that they were free to behave in any way, share any
opinion, criticism and suggestions, but that these were to be kept private, only
reproduced on request of legal consideration.
4.7 Summary
The discussion in this chapter focused on the research methodology used, various
techniques applied when collecting data, the sample design, and sampling
techniques applied. The chapter ends with a discussion on ethical considerations,
privacy, and confidentiality that were crucial to the protection of the participants and
data.

~ 62 ~
CHAPTER 5: DATA ANALYSIS AND INTERPRETATION
5.1 Introduction
In this chapter, the analysis of data is discussed and the findings interpreted. Data
was checked and compared to give hindsight on whether or not the challenges
indeed encountered by the users of the ACCtrav system were HCI related.
Data sets were formed and the decisions whether to analyse the data as a whole or
in groups were made based on the interest in the differences between the user
ratings of the ACCtrav system, using a semantic differential scale of one (1) to nine
(9) with two bipolar adjectives as feature descriptors; one (1) referring to the
adjective with worst connotation and nine (9) being the best. Five (5) served as a
midpoint of the two. When forming data sets, the researcher was interested in the
statistics within each participant’s data as well as suggestions from all the
participants’ data regarding item elements of interest in the QUIS and notes taken
during the course of the field study.
The profiles were generated, and diagnostic tests were run to reveal the strengths
and weaknesses of the ACCtrav system by showing the deviations of the means
either above or below a criterion. The midpoint of the rating scale (5) was used as a
criterion. The profiles were generated by calculating the means and standard
deviations for each item in the QUIS. The means were then graphed on a scale from
one (1) to nine (9). If the item mean was above five (5) (midpoint rating used as a
criterion), it was perceived to be better than the arbitrary, whereas, below the
criterion would be perceived as mediocre value. Confidence intervals around each
mean were plotted in order to determine reliability; a 95% confidence interval that
included five (5) within its boundaries was applied to indicate whether or not the
mean was not significantly different from five (5) at the 0.05 level of significance; this
helped to indicate whether or not the mean of an item was significantly above or
below some criterion – five (5) being the criterion. Item analysis and hierarchical
regression analysis were used to investigate the correlational structure of the items.
These analyses were used to reveal the underlying importance or relevance of items

~ 63 ~
to the participants and overall satisfaction with specific interests in user productivity,
learning and task workflows behaviour.
The chapter is arranged starting with a discussion on the participants’ demographic
information in section 5.2, followed by the analysis of the data and findings in section
5.3, contextual analysis and interpretation in section 5.4, and Section 5.5 covered
the chapter’s summary.
5.2 Demographic Information
This section discusses the demographic data of the participants. A sample size of 27
users, representing a 240-user population participated in the study and the data
collection exercise (see Table 5). The sample represented almost eleven per cent
(11.25%) of the total system user population. The gender composition was almost
equal and consisted of 15 females and 12 males.
Five (5) of the participants were novice users with less than three months of working
experience using the ACCtrav system; five (5) were intermediate users with between
one and two years of working experience; and the remaining seventeen (17) had
more than three years of experience. Eight (8) of the participants were front-end
consultants, nine (9) were back-end consultants, three (3) were from sales and
marketing, another three (3) were from finance/accounting, and four (4) were from
system technical support. Three (3) participants had some degree of disability. Of
those with some degree of disability, two had some degree of visual impairment –
they could only see resized (enlarged) desktop icons and fonts. The other one had
physical impairment; using crutches to move (walk) around. At the time of this study,
the company strength was at 248 staff, comprising 67 males and the rest were
females. The very nature and the aims of this study made the age factor of the
participants not to be regarded as priority information, but for the sake of mention,
the youngest participant was 17 and the oldest was 72.
5.3 Analysis of the data and findings
The factors discussed in this section include the general experience with computer-
based systems as discussed in section 5.3.1; experience with the ACCtrav system in

~ 64 ~
section 5.3.2; overall user reactions with ACCtrav, including user satisfaction,
frustration and anxiety in section 5.3.3. Frustration levels from user reactions when
using the system was measured through incident factors that includes the time lost,
time to fix, and the importance of the tasks. Sections 5.3.4 to 5.3.5 covers
discussions on task execution, error handling, speed of transactions, and productivity
within the tenets of designing screen interface elements such as layout and
sequence, font size and the images used, the consistence of terminologies applied
within the system, and the user’s capability to learn the system.
5.3.1 Past experience working with computer-based systems
Figure 15: Knowledge on computer devices, software, and systems
The general work experience with computer systems was a crucial factor in
determining the level of computer literacy among the participants. All the participants
0369
121518212427
Knows or used most
Doesn't know or Never used
27
0
27
0
20
7
27
0
5
22
Personally used and familiar with computer devices, software, and systems
Computers (e.g. terminals, PCs, laptops, monitors, touch-screens, printers)
Office Devices (e.g. keyboard, mouse, track-ball, floppy-drives, modems,scanners)
Other Devices (e.g. track-ball, joy-stick, head-mounted display, graphics tablet )
Office Software (e.g. word processor, spreadsheet, email, internet, database)
Other Software (e.g. computer games, CAD, rapid prototype, video recognition, pen-based computing )

~ 65 ~
had high levels of self-reported perceived computer awareness and experience (see
figure 15).
The participants reported being knowledgeable and familiar with the use of most
office computing systems, software and devices such as personal computers,
laptops, modems, mouse, keyboards, word processors, spreadsheets, email, and
the Internet. Twenty (20) out of the 27 participants (that is 74.1%) had used
computer devices such as, track-balls, joysticks, and graphic tablets. The
participants in this study were regarded to have satisfactory knowledge on computer
literacy.
5.3.2 Experience working on the ACCtrav system
Figure 16: The amount of time spent working on the ACCtrav system
Figure 16 shows the recorded overall experience in years that the participants had
using the ACCtrav system. The results show one-third (33.3%) of the participants
had more than three years’ experience using the ACCtrav system. Furthermore,
18.5% had more than two years but less than three years’ experience, while 3.7%
had one year but less than two years’ experience. Almost one-third (29.6%) had less
than one year experience, but with over six months’ experience; on the other hand,
14.8% had less than six months’ experience. The results in table 6 showed the
4
8
1
5
914.8%
29.6%
3.7%
18.5%
33.3%
0.5 0.5 - 1 1 - 2 2 - 3 More than 3
% n
um
ber
of
part
icip
ants
Years
Using the ACCtrav system
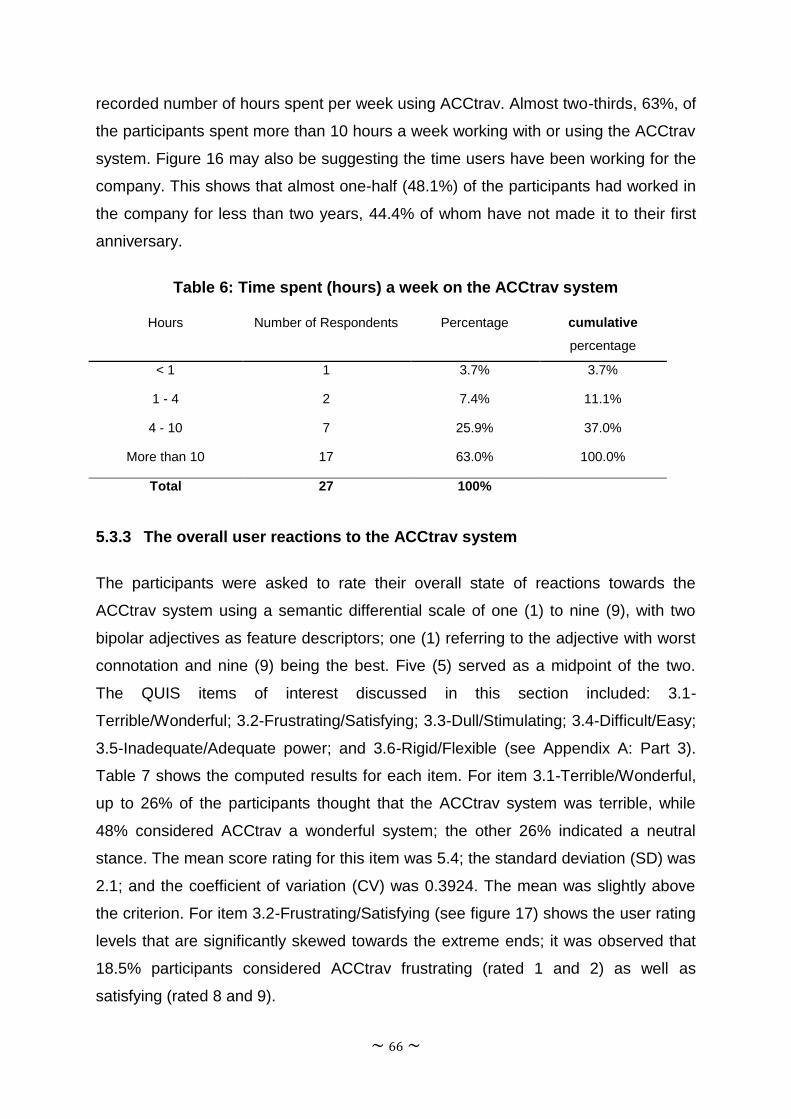
~ 66 ~
recorded number of hours spent per week using ACCtrav. Almost two-thirds, 63%, of
the participants spent more than 10 hours a week working with or using the ACCtrav
system. Figure 16 may also be suggesting the time users have been working for the
company. This shows that almost one-half (48.1%) of the participants had worked in
the company for less than two years, 44.4% of whom have not made it to their first
anniversary.
Table 6: Time spent (hours) a week on the ACCtrav system
Hours Number of Respondents Percentage cumulative
percentage
< 1 1 3.7% 3.7%
1 - 4 2 7.4% 11.1%
4 - 10 7 25.9% 37.0%
More than 10 17 63.0% 100.0%
Total 27 100%
5.3.3 The overall user reactions to the ACCtrav system
The participants were asked to rate their overall state of reactions towards the
ACCtrav system using a semantic differential scale of one (1) to nine (9), with two
bipolar adjectives as feature descriptors; one (1) referring to the adjective with worst
connotation and nine (9) being the best. Five (5) served as a midpoint of the two.
The QUIS items of interest discussed in this section included: 3.1-
Terrible/Wonderful; 3.2-Frustrating/Satisfying; 3.3-Dull/Stimulating; 3.4-Difficult/Easy;
3.5-Inadequate/Adequate power; and 3.6-Rigid/Flexible (see Appendix A: Part 3).
Table 7 shows the computed results for each item. For item 3.1-Terrible/Wonderful,
up to 26% of the participants thought that the ACCtrav system was terrible, while
48% considered ACCtrav a wonderful system; the other 26% indicated a neutral
stance. The mean score rating for this item was 5.4; the standard deviation (SD) was
2.1; and the coefficient of variation (CV) was 0.3924. The mean was slightly above
the criterion. For item 3.2-Frustrating/Satisfying (see figure 17) shows the user rating
levels that are significantly skewed towards the extreme ends; it was observed that
18.5% participants considered ACCtrav frustrating (rated 1 and 2) as well as
satisfying (rated 8 and 9).

~67 ~
Table 7: Overall user reactions
3.1
Terrible/Wonderful 3.2 Frustrating/Satisfying
3.3
Dull/Stimulating 3.4 Difficult/Easy
3.5 Inadequate/Adequate
Power 3.6 Rigid/Flexible
Score
Rating Par
tici
pan
ts
% F
req
uen
cy
cum
ula
tive
%
Par
tici
pan
ts
% F
req
uen
cy
cum
ula
tive
%
Par
tici
pan
ts
% F
req
uen
cy
cum
ula
tive
%
Par
tici
pan
ts
% F
req
uen
cy
cum
ula
tive
%
Par
tici
pan
ts
% F
req
uen
cy
cum
ula
tive
%
Par
tici
pan
ts
% F
req
uen
cy
cum
ula
tive
%
1 2 7.4% 7.4% 5 18.5% 18.5% 1 3.7% 3.7% 0 0.0% 0% 0 0% 0% 0 0% 0%
2 1 3.7% 11.1% 0 0.0% 18.5% 0 0.0% 3.7% 0 0.0% 0% 1 4% 4% 1 4% 4%
3 1 3.7% 14.8% 3 11.1% 29.6% 4 14.8% 18.5% 2 7.4% 7% 2 7% 11% 2 7% 11%
4 3 11.1% 25.9% 5 18.5% 48.1% 5 18.5% 37.0% 1 3.7% 11% 3 11% 22% 1 4% 15%
5 7 25.9% 51.9% 3 11.1% 59.3% 11 40.7% 77.8% 6 22.2% 33% 6 22% 44% 8 30% 44%
6 5 18.5% 70.4% 4 14.8% 74.1% 3 11.1% 88.9% 4 14.8% 48% 8 30% 74% 4 15% 59%
7 3 11.1% 81.5% 2 7.4% 81.5% 0 0.0% 88.9% 1 3.7% 52% 2 7% 81% 5 19% 78%
8 3 11.1% 92.6% 4 14.8% 96.3% 1 3.7% 92.6% 7 25.9% 78% 4 15% 96% 5 19% 96%
9 2 7.4% 100% 1 3.7% 100% 2 7.4% 100% 6 22.2% 100% 1 4% 100% 1 4% 100%
Total 27 100% 27 100% 27 100% 27 100% 27 100% 27 100%
Mean 5.4 4.7 4.9 6.7 5.7 5.9
Mode 5 4 5 8 6 5
Median 5 5 5 7 6 6
Standard
Deviation 2.1 2.5 1.8 1.9 1.7 1.8
Coefficient
of variation 0.3924 0.5220 0.3603 0.2891 0.3017 0.2957

~68 ~
Generally from the midpoint, the results showed almost an equal rating, with 40.8%
participants finding the ACCtrav system satisfying compared to 48.1% who find it
frustrating. However, the mean rating was slightly below the criterion at 4.7 with the
SD at 2.5 and the CV at 0.5219.
Figure 17: Frustrating vs. Satisfying histogram
Figure 18: State of feelings after a frustrating experience
0.0%
3.0%
6.0%
9.0%
12.0%
15.0%
18.0%
1 2 3 4 5 6 7 8 9
Frustrating <------ scale ------> Satisfying
Frustrating vs. Satisfying
48%Felt mad
with computer
15% Felt irritated with themselves
37% Felt helpless or resigned
Frustrating experience

~ 69 ~
The participants were also asked to express their feelings after a frustrating incident
in an effort to define the kind of response stimulated after experiencing a problem
with the ACCtrav system (see figure 18). Up to 48% of the participants felt mad at
the computer after encountering a frustrating experience with the ACCtrav system.
15% participants recounted themselves feeling irritated, and the 37% recounted
feeling helpless and/or gave up. The results suggest users may have experienced a
sense of defeat when faced with computer complications.
On the item 3.3-Dull/Stimulating, results show that up to 37% participants considered
the ACCtrav system dull, while 40.7% did not know what to say of the system’s
aesthetics, and 22.2% thought of it as stimulating. The mean, SD and CV were 4.9,
1.8 and 0.3603 respectively. Nevertheless, up to 37% participants expressed finding
the system interface dull, while 40.7% did not know what to say of the screen’s
aesthetics. When considered together, the participants who saw the interface as
either dull or did not know what to say of it, sum up to 77.8% compared to 22.2% as
stimulating.
The mean for the items 3.4, 3.5 and 3.6 were above the criterion, which implied that
the system was easy, flexible, and had adequate power. The majority of the
participants, approximately 66.7%, found the system easy to use as compared to
11.1% who had difficulties.
5.3.4 The ACCtrav system user interface (Screen)
In this section, the areas of interest for discussion of the system user interface
ranged from the user’s ability to read characters/text on the screen; the interface
layout; navigation, and the sequence of screens; the amount of information displayed
on each screen; the arrangement of information on screen, to the progression of
work-related tasks. Also considered in this section was the user satisfaction with the
interface. Figure 19a shows the ACCtrav system logon interface that popped up after
a user had clicked the icon-link on the desktop. Figure 19b shows the interface after
successful login, where the activities and tasks were done. The activities/tasks
displayed in Figure 19b include: transactions, creating reports, periodic processing,
and set-up. The activities are displayed in the left pane of figure 19b, whereas, in the
right pane are tasks (see Figure 19c).

~70 ~
Figure 19: The ACCtrav system user interface (a) before login, (b) after successful Login, (c) Hotel voucher creation transaction
a)
b) c)

~71 ~
Figure 20: Item elements of the screen interface
0.0%
5.0%
10.0%
15.0%
20.0%
25.0%
30.0%
35.0%
1 2 3 4 5 6 7 8 9
Score rating
Item elements of the screen interface
4.1 Reading characters 4.3 Screen layout 4.3.1 Amount of Information displayed
4.3.2 Arrangement of Information 4.4 Sequence of screens 4.4.1 Next Screen
4.4.2 Previous Screen (Going back) 4.4.3 Progression of Work related tasks

~72 ~
The results show twenty-five (25) out of the 27 of the participants (that is 92.6%)
could easily locate the ACCtrav system icon-link from the desktop and did not
experience logon difficulties. The participants indicated a general user satisfaction
with the ACCtrav system interface; up to 85.2% of the participants found the fonts on
the screen very legible and easy to read, and with no fuzzy images. Locating tasks
was also straightforward. When considering the sum total of the score rating
between six (6) and nine (9), over 88.9% of the participants acknowledged that the
screens had an adequate amount of information displayed, and 63% found the
information arranged logically (See Figure 20). The participants found the screen
layout not very helpful despite 74.1% of the participants finding the sequence of
screens clear, and over 59.3% finding it predictable and easy to navigate the
interface.
When considering the tasks, 66.7% of the participants found the progression of
work-related tasks had been clearly marked on the screens. In addition, there
existed some concerns expressed on tasks when participants were asked for
additional comments. The remarks concerned the inability to link from the system
interface to other relevant task information such as when users were inquisitive of
ticket ranges. Instead, the users often browsed separately out of the system
interface for such information. This could be an indication of flawed task design,
which instead, would have been integrated within the ACCtrav system interface with
either a search command option or browse-link to the relevant files. Further analysis
of the comments on the interface reveals a suggestion of re-evaluating the interface
layout in spite of the perceived ease of use. About 37% of the participants found the
screen to look old-fashioned or outdated, unexciting, lacked intuitive engagement,
and or was perceived inhibitive.
These observations may have had some negative impact on user productivity since
enthusiasm to work on the system could have been prejudiced by the perceptions of
the screen (Bessie`re et al., 2005; Tractinsky, 2012). One such pointer was a
comment that it was frustrating after having worked on the system for some time,
most especially when a user wanted to quickly get to specific tasks or information. In
this regard, this comment was made: “Everything on the menus is drop-down, which
means scrolling through the entire menu-list to select what you are looking for.”
Some offered suggestions. One such suggestion of interest was: “It should have a

~ 73 ~
function whereby you can display or call up all hotel properties in an area, say a city.
That is display all hotels/guesthouses loaded under say JNB/CPT, etc.”
The comments highlighted the need to study the participants’ response in
comparison of the QUIS items surveyed, especially seeking to understand the
relationship between some of the items. For example, comparing item 4.3-Screen
layout were helpful with item 4.4-Sequence of screens; and comparing item 4.3.2-
Arrangement of information on the screen with item 4.4.3-Progression of work-
related tasks. First, the researcher determined the individual items’ calculated mean,
standard deviation and coefficient of variance, which were 4.8, 3.2110, and 5.1082
for item 4.3-Screen layout were helpful; item 4.4-Sequence of screens had 5.9,
2.7586 and 6.3820, whereas item 4.3.2-Arrangement of information on the screen
had the mean, standard deviation and coefficient of variance as 5.2, 3.0926 and
5.6239. Item 4.4.3-Progression of work-related tasks had 5.7, 2.4898 and 6.1823
respectively. All means were above the set criterion of five (5). Figure 21 shows the
relationship between items 4.3-Screen interface layout and 4.4-Sequence of screens
(interface navigation).
Figure 21: The relationship between interface layout and navigation
R² = 0.3571
0
1
2
3
4
5
6
7
8
9
10
0 1 2 3 4 5 6 7 8 9 10
Sequence o
f S
cre
ens (
Navig
ation
)
User interface Layout
Layout vs. Navigation

~ 74 ~
The results show the calculated covariance of 5.2934 between the data sets and the
correlation coefficient 0.5976, and coefficient of determination R2 was 0.3571. This
gave a strong confirmation of the existence of a positive relationship between the
layout of the interface and the ease with which to navigate that interface. The results
give a direction from which designers of the ACCtrav system should build from to
improve on the system effectiveness; especially encouraging users in self-learning
the system (Shneiderman and Plaisant, 2009; Preece et al; 2011). The better the
design of the system user interface layout, the more likely users will be able to
understand and easily navigate and or learn the system. The researcher needed to
look at other factors of learning, among others, user motivation and aptitude,
presentation, and environment before sanctioning a user’s ability to learn a system
from the perspective of the interface design.
Figure 22: The relationship between the arrangement of information on the screen and the progression of work-related tasks
On the other hand, when the researcher sought to understand the outcome of the
relationship between items 4.3.2-Arrangement of information on the interface and
4.4.3-Progression of work-related tasks (see figure 22), the calculated covariance
R² = 0.5432
0
1
2
3
4
5
6
7
8
9
10
0 1 2 3 4 5 6 7 8 9 10
Pro
gre
ssio
n o
f W
ork
-rela
ted tasks
Arrangement of Information on screen
Screen Informantion arrangement vs.
Progression of Work-related tasks

~ 75 ~
was 5.6752 and the correlation coefficient was 0.7370, and the coefficient of
determination R2 was 0.5432. The correlation coefficient indicated a stronger positive
relationship between the arrangement of information on the interface and
progression of work-related tasks. The clearer system instructions are displayed and
well arranged on the interface, the more likely the user’s ability to accomplish tasks
will be facilitated by reinforcing easing memory load on the user (Carroll, 2013).
However, there may be other factors that help impact overall users’ enthusiasm and
the ability to learn systems. The next section covers a discussion on some of the
factors concerning the learning of the ACCtrav system.
5.3.5 Learning the ACCtrav system
Learning forms the prime foundation for knowledge creation, be it tacit or explicit. It
is, therefore, crucial for businesses to deploy computer-based systems that
encourage a self-learning culture amongst the workforce. The systems can play a
pivotal role in facilitating creativity among the users, which may help the business
develop the ability to leverage, venture, and or innovate with the aim of forming new
value propositions.
Success factors for computer-based systems to encourage learning may include a
well-designed user interface, straightforward tasks and fewer steps to take when
completing tasks. They may also include providing progress information or feedback
when completing tasks, easy to remember use of commands and names.
Additionally, they may provide for feature exploration, a help menu and well-phrased
error messages that clarify errors and/or provide clear instructions to correct the
error.
In the case of the ACCtrav system, there were some interesting revelations when
probing the data for the participants’ learning experience. Figure 23 shows the
percentage; although negligible, the participants had the view that, in learning
systems, the following factors did not have an influence or were considered to be
important: 3.7% on discovering new features, 7.4% when exploring advanced
features, 3.7% when remembering specific rules about entering commands, 7.4% on
whether or not tasks were performed in a straightforward manner, 3.7% on the
number of steps and the logical sequence per task, and 3.7% on the feedback when
completing tasks.

~ 76 ~
In comparison to the above results, almost two-thirds (63%) of the participants
surveyed acknowledged that tasks could be performed in a straightforward manner.
It was indicated that 40.7% thought the number of steps taken to complete a task in
the ACCtrav system were appropriate, whereas, 22.2% thought the steps were too
many, and 37% were not certain of whether or not the steps were too many. Just
over one-half (51.8%) acknowledged that the steps to complete tasks always
followed a logical sequence; on the other hand, 14.8% considered that there was
never enough logical sequence of steps, and about one-third (33.3%) took a neutral
stance.
Figure 23: Items regarded not to have influence on learning
The other aspect that the researcher was interested in was the ease with which
users can operate the ACCtrav system irrespective of the level of experience, and
whether or not tasks could be accomplished knowing only a few commands and/or
use of features or shortcuts. Almost one-half, 44.4%, of the participants
acknowledged that the ease with which to operate the ACCtrav system depended
upon the user’s level of experience. Be that as it may, 62.9% of the participants said
they easily learned to operate the ACCtrav system, 55.5% of whom took a short time
7.4%Learning Advaced Features
3.7%Discovering new
Features
3.7%Remembering specific rules
about entering commands
7.4%Tasks can be
performed in a straightforward
manner
7.4%Number of steps
per task
3.7%Steps to
complete a task follow a logical
sequence
3.7%Feedback on the
completion of steps
No influence on learning systems

~ 77 ~
to learn to use the system. Moreover, 40.7% of the participants found it easy to learn
advanced features, while 77.8% discovered new features with ease, and 70.4% felt
safe when exploring features in the ACCtrav system.
To get better clarification on users learning ACCtrav, it was necessary at this point to
realise that learning any system cannot be only a single, one-dimensional property of
a user interface. Effective learning of systems may be linked to other factors
including error frequency as well as how often users make errors while using the
system, how serious the errors may be, and how users recover from these errors.
Nonetheless, the ability to remember the steps of operating or entering commands
into system serves as a critical aspect when learning to use a system. For instance,
if a user had once used the system, how much enough could they (the user)
remember next time to effectively operate the system, or does the user have to start
all over again learning everything. The researcher undertook to find the correlation
between items 6.3-Remembering names and use of commands and 6.1-Learning to
operate the system (see figure 24). There was a positive relationship with a
correlation coefficient of 0.6226 and the coefficient of determination R2 was 0.3877.
This relationship could have been stronger and better if more users felt encouraged
to explore ACCtrav features by trial and error (66.7% of the participants felt
discouraged).
Figure 24: The relationship between remembering names and use of commands
and the ability to learn operating the system
R² = 0.3877
0
1
2
3
4
5
6
7
8
9
10
0 1 2 3 4 5 6 7 8 9 10
abili
ty t
o learn
opera
ting s
yste
m
Remembering names and use of commands
Remembering names and use of commands vs. ability to learn operating system
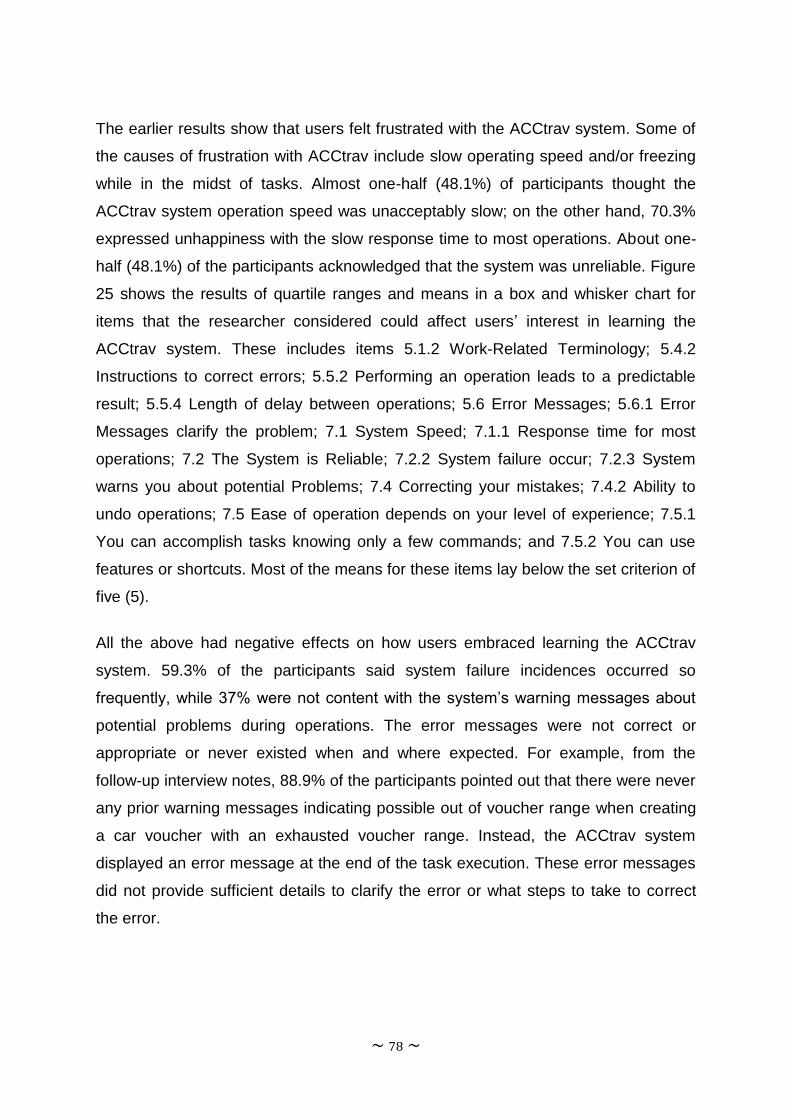
~ 78 ~
The earlier results show that users felt frustrated with the ACCtrav system. Some of
the causes of frustration with ACCtrav include slow operating speed and/or freezing
while in the midst of tasks. Almost one-half (48.1%) of participants thought the
ACCtrav system operation speed was unacceptably slow; on the other hand, 70.3%
expressed unhappiness with the slow response time to most operations. About one-
half (48.1%) of the participants acknowledged that the system was unreliable. Figure
25 shows the results of quartile ranges and means in a box and whisker chart for
items that the researcher considered could affect users’ interest in learning the
ACCtrav system. These includes items 5.1.2 Work-Related Terminology; 5.4.2
Instructions to correct errors; 5.5.2 Performing an operation leads to a predictable
result; 5.5.4 Length of delay between operations; 5.6 Error Messages; 5.6.1 Error
Messages clarify the problem; 7.1 System Speed; 7.1.1 Response time for most
operations; 7.2 The System is Reliable; 7.2.2 System failure occur; 7.2.3 System
warns you about potential Problems; 7.4 Correcting your mistakes; 7.4.2 Ability to
undo operations; 7.5 Ease of operation depends on your level of experience; 7.5.1
You can accomplish tasks knowing only a few commands; and 7.5.2 You can use
features or shortcuts. Most of the means for these items lay below the set criterion of
five (5).
All the above had negative effects on how users embraced learning the ACCtrav
system. 59.3% of the participants said system failure incidences occurred so
frequently, while 37% were not content with the system’s warning messages about
potential problems during operations. The error messages were not correct or
appropriate or never existed when and where expected. For example, from the
follow-up interview notes, 88.9% of the participants pointed out that there were never
any prior warning messages indicating possible out of voucher range when creating
a car voucher with an exhausted voucher range. Instead, the ACCtrav system
displayed an error message at the end of the task execution. These error messages
did not provide sufficient details to clarify the error or what steps to take to correct
the error.

~79 ~
Figure 25: Mean score rating for QUIS items on learning the ACCtrav system
-1
0
1
2
3
4
5
6
7
8
9
10
5.1.2 5.4.2 5.5.2 5.5.4 5.6 5.6.1 7.1 7.1.1 7.2 7.2.2 7.2.3 7.4 7.4.2 7.5 7.5.1 7.5.2
Score
Rating
QUIS Items of interest
Box and Whisker chart showing items mean
Mean

~80 ~
5.4 Contextual analysis and interpretation
This section provides a discussion on how the findings of section 5.3 can be
analysed and interpreted in the context of enhancing training and skills development
amongst users of ACCtrav in section 5.4.1; the impact on user productivity in section
5.4.2; reflection of effective business processes in section 5.4.3; and branding,
communication, value propositions and publicity in section 5.4.4.
5.4.1 Training and skills enhancement
In this section the findings of data analysis with elation to encouraging a culture of
self-learning to enhance skills among users are discussed. It becomes cheaper for
the business when systems are designed to promote self-learning, especially in
reducing the costs of training and when implementing change of systems. The ease
with which users can accomplish basic tasks the first time they encounter the system
forms part of usability (learnability) (NN/g, 2013).
From the QUIS, the elements checking the learnability of ACCtrav included the
attributes of self-discovery, efficiency, and satisfaction as well as error handling and
messages, finding help, terminology used in the system, and the interface. The users
of the ACCtrav system had mixed concerns regarding efficiency when working on
the system. Efficiency of use was considered in this study as being the case when
the user had once learned to use the system, how fast the user can then accomplish
the tasks. Taking into consideration the number of steps taken to accomplish a task
and the logical sequence of the steps could have a significant impact on learning the
system. The nature of tasks at hand as well as the frequency with which the user
performs those tasks can strongly influence the learning of the system.
From the results, almost two-thirds (63.0%) of the participants acknowledged that
tasks could be performed in a straightforward manner. With that said, 40.7% thought
the number of steps taken to complete a task in the ACCtrav system were
appropriate, whereas, 51.8% acknowledged that the steps to complete tasks always
followed a logical sequence. Furthermore, 62.9% of the participants said they easily
learned to operate the ACCtrav system, 55.5% of whom took a short time to learn to
use the system. Moreover, 40.7% of the participants found it easy to learn advanced

~ 81 ~
features, while 77.8% discovered new features with ease, and 70.4% felt safe when
exploring features in the ACCtrav system.
The results suggested the ACCtrav system was developed to facilitate learning for
novice users in mind. However, experienced users will normally showcase their level
of know-how or skill on a system by using a product’s advanced features, the
understanding of what feature to use when faced with a certain need or task, and the
ease with which they can locate a feature needed, which is a principle of discovery.
Discovery involves looking for and finding a product’s feature in response to a
particular need. Learning, hereafter, would refer to the process by which the user
figures out how to use a discovered feature to complete the task at hand. This kind
of aptitude was not observable among the participants despite the above results
showing the ease with which users learned to use ACCtrav. Often, the users had to
relearn using features they had already been trained on; it was asserted by 44.4% of
the participants that the ease with which to operate the ACCtrav system depended
upon the user’s level of experience. Seemingly, this was against the principle of ease
of learning, which is expressed in how fast a user who has never seen the user
interface before can learn it sufficiently well to accomplish basic tasks.
Further analysis of the results showed likely skills deficiency and/or the lack of a
culture of self-learning amongst the users. Two-thirds (66.7%) of the participants felt
they were never encouraged by the ACCtrav system to learn and/or explore
advanced features through trial and error. The results did not give the definitive lead
to what may have been factors causing this perception and behaviour on learning or
improving on the skills level. Nevertheless, it was clear, though, from the results that
the system user interface may have an impact on how users may acquire skills
through self-learning. For example, there was a positive correlation between the
system interface layout and system navigation, the arrangement of information on
the interface and the progression of tasks, and the remembering of names and use
of commands, specific rules about entering commands and the ability to learn the
system operations. The interface can help in propagating learning through effective
warning and error messages, pop-up dialogue boxes with messages that tell users
how to correct errors or go about the steps in completing certain tasks, and other
similar messages. As a result, the users’ abilities in learning are impacted by how to
~ 82 ~
discover and explore features, comprehend the terminologies used and the feedback
when completing tasks. The interface also can be effectively used to dispense the
amount of help given, positioning of help messages and the ease of access to such
help whether or not online. The ACCtrav system user interface did not fare well on
the foregoing factors.
The other factors noticeable in the results affecting learning or propagating the kind
of learning behaviour depicted in the results emanated from user frustration with the
ACCtrav system itself. Frustration may be described in relation to when the
computer-based system acts in an unexpected way that aggravates users and keeps
them from reaching task goals (Ceaparu et al., 2004; Lazar et al., 2005). However,
there was a desire to measure the magnitude of frustration, and the relationship with
which the frequent system freezes – slow speeds of operation raised feelings of
frustration. A lack of interest in learning advanced features also resonated with the
users finding the interface very dull, which may have affected users’ mood and
attitude or desire to further explore the system and its features.
The ACCtrav system interface did not have a help menu, neither were system user
manuals available. Consequently, users relied on the help desk for any kind of help
and support with the system. Lack of a Help menu as well as user manuals
contributed towards the poor attitude on self-learning and high dependency on the IT
help desk. The results showed that over 82% of the participants called the IT help
desk for help three or more times per day.
Certainly, the ACCtrav system was well developed for novice users with its default
lists in the drop-down menus. Anyhow, ACCtrav did not adequately help novice
users advance their skills into experts. On that account, users always sought
retraining from the help desk. Over and above that, the frequent system failures not
only affected users’ productivity, it also affected the morale to learn further because
of the emotional frustration emanating from users’ inability to complete tasks on time.
As a consequence, users’ moods and state of being were affected which in turn
caused the users’ inability to memorise what was passed on during the training.

~ 83 ~
The next section will be a discussion on the results in the context of user
productivity. The ease with which users learn the system could have a proportionate
impact on the users’ productivity levels.
5.4.2 Productivity
In the past, several economists once considered services innovation through the use
of technology to be the most effective means for raising productivity (Baily and
Chakrabarti, 1988; Cyert and Mowery, 1989; Klein, 1988). Although such assertions
would have been applicable many decades ago, the researcher acknowledges that
there is still relevance to the contemporary computer-based systems with regard to
user productivity. Nowadays, people expect to simply work on or use systems
without prior reading, and certainly, with no training. There was compelling evidence
in the results that the ACCtrav system did not effectively bring about the anticipated
overall and key beneficial effects on user productivity. For example, all the
participants expressed the desire to have the ACCtrav system just simply working.
The results showed that 48% of the participants were often frustrated when
encountering difficulties with the ACCtrav system; on the other hand, 37% did not
know what step to take next; and 15% felt irritated (see table 9 or figure 17). The
results confirmed that computer problems and the resultant frustration were common
among computer-based system users (Ceaparu et al., 2004; Lazar et al., 2005). In
this case, the participants linked the causes of frustration to tiresome delays when
the ACCtrav system froze or crashed, was slow in its response to most transactions,
gave incomprehensible error messages or no feedback at all, and the lack of
appropriate system warning messages about potential problems during operations
(Lindgaard et al., 2011; Tractinsky et al., 2006), which often took up with it work time
(Cyr, 2008; Sonderegger and Sauer, 2010; Quinn and Tran, 2010). Some of the
dialogue boxes were written in an unclear style, with confusing error messages
which hardly gave users a clue on the root causes of the problems encountered or
steps to be taken out of the problem. Such challenges confirmed waste of users’
productive time (Lazar et al., 2005).
Secondly, a well-designed user interface would have facilitated and enabled users to
easily interact with the ACCtrav system. As a result, there would have been a well-
facilitated self-learning or quicker task completion. This would have an impact on

~ 84 ~
productivity due to easier and/or better system navigation because a user interface
supports the way users work, communicate and interact in their everyday and
working lives (cf. interaction design definition, Preece et al., 2011). A well-designed
system user interface also reflects how well designed, effective, and simple the
structure of the business processes, tasks and activities are. Considering the
following results about the system user interface, about two-thirds of participants
(66.7%) found the system user interface satisfactory and easy to use as compared to
11.1% who had difficulties with the system. Additionally, 85.2% of the participants
indicated finding the screen characters easy to read. About 88.9% of participants
acknowledged adequate display of information on the screen interface, and 63%
found the information logically arranged. The researcher should have concluded
from the above results that appropriate information that displays on the system
interface was critical for better user performance (Johnson et al., 2005). Hence,
better productivity when compared to the results showed that 74.1% of the
participants had reported a clear sequence of screens, and 59.3% found it easy
navigating the ACCtrav interface, while 66.7% was on progression of work-related
tasks.
However, on the aesthetics factor, up to 37% expressed finding the ACCtrav system
user interface dull, 22.2% found it stimulating, while 40.7% did not know what to say
about it. This meant that 77.8% considered the interface either dull or did not know
what to say of the screen’s aesthetics. Further probing of these views revealed
intriguing patterns on tasks and user performance. The pattern analysed revealed a
comprehension that not only does correct information from the system provide for a
better platform to make appropriate decisions, but the beauty of the screen offers a
feeling and perception of easy tasks. Such a perception in a user’s mind would help
boost the confidence within them; this will likely impact on productivity. The poor
design of ACCtrav interface in this case was associated to contributing to user
productivity concerns, most especially on the menu layout, widgets, display of error
messages and instructions to correct errors, and use of features or shortcuts. For
example, users who had worked with the ACCtrav system for a long time
experienced challenges that affected the ability to maximise levels of productivity
when attempting shortcuts to tasks or specific information. Here were some of the
noticeable challenges stated: “Everything is drop-down, which means scrolling
~ 85 ~
through the entire list to select what you are looking for.” “It should have a function
whereby you can display or call up all hotel properties in an area, say a city (display
all hotels/guesthouses loaded under say JNB/CPT, etc.).” Some of the remarks were
in relation to users not having the ability to link back from the system to other
relevant information such as probing of ticket ranges. In this instance, users often
browsed separately out of the system for information, which seemed to be an extra
task step that could have been integrated within the ACCtrav system as either a
search command option or link (Carroll, 2013).
The researcher acknowledges that some of the productivity challenges could have
emanated from other sources that HCI processes and methodologies may not help
address. For example, slow operating speed and freezing in the middle of tasks
could be related to a depreciated computer network infrastructure, or
interconnectivity – available bandwidth, and possibly, server system configurations.
5.4.3 Business processes and/or workflows
Well-designed processes and or workflows not only put in place clear, analysed and
formally described tasks but also lead to improved efficiency for systems’ operations
(Carroll, 2013). Automating business processes, however, may not necessarily result
in the elimination of the many unnecessary steps taken when accomplishing tasks.
Automating tasks may neither bring about better process control that could help
improve on the management of business processes that are achieved through
standardising working methods and the availability of audit trails.
In the case of ACCtrav, the effectiveness of the business processes were measured
on items that showed whether or not tasks could be performed in a straightforward
manner, the number of steps taken per task, steps to complete a task followed a
logical sequence, and whether users could accomplish tasks knowing only a few
commands. The clearer the above factors were to users, the likely would be the
effectiveness of the processes already put in place.

~ 86 ~
5.4.4 Branding, communication, business values and publicity
While analysing the results, the researcher sought to relate the findings to reflect on
the intangible benefits such as branding, communication, shared values, and
publicity. As much as these factors were subjective in their own nature, any
computer-based system should facilitate propagating them within the business. The
researcher based on inferred reasoning from the results to show how the ACCtrav
system may have worked in this regard. The approach used by the researcher was
to relate user reactions on various QUIS items to reflect on the likely impact on
branding, communication, shared values and publicity for the business. The
researcher acknowledges, though, that the QUIS did not give any means of directly
measuring these factors for the ACCtrav system. However, the fact that there were
significant levels of frustration amongst users concerning ACCtrav was one likely
sign of difficulties that the business was faced with in communication, sharing
values, and publicity because frustrated users of the system would likely behave or
take desperate measures which would not conform to the business norms. With over
one-third (37%) of participants rating the ACCtrav system as terrible meant that up to
37% of the service that the business offered was terrible as well. Also, it could turn
out to be interpreted that the business was affected negatively to this level regarding
its publicity and branding.
Frustration amongst ACCtrav users was as high as 44.4% of the participants. At this
rate, it could also mean that the communication system in place was very poor.
Frustrated users cannot communicate willingly and effectively. Business values are
not adhered to when rendering a service to customers because a frustrated user will
not think appropriately in that moment of frustration; the use will not mind values, and
therefore, will not make appropriate decisions. It may also mean that an equal
percentage of customers were frustrated or dissatisfied with the service rendered to
them.
5.5 Conclusion
The discussion in this chapter was focussed on analysing and interpreting data
collected to give insight on whether or not the challenges indeed encountered by the
users of the ACCtrav system were HCI related. The results were interpreted in four

~ 87 ~
areas of context: training and skills enhancement; user productivity; business
processes; and branding, communication, sharing values and publicity.
The results showed an indication of, among others, user frustration due to
inadequate understanding of how to operate ACCtrav, slow response transactions,
as well as frequent system failures. The ACCtrav system was clearly designed with
novices in mind and did not consider experienced users, especially in aspects of
quickening tasks through the use of shortcuts and commands. The ACCtrav system
interface does not cater for users who would prefer self-learning in order to advance
their knowledge of the system.
Also discussed in the chapter was the structure of tasks, whether or not tasks had an
adequate number of steps to take; whether steps followed a logical sequence; and if
feedback was provided on completing the steps. Other areas of interest included the
facilitation of users learning the advanced features in the system, the ability to
correct mistakes, undo operations, and the reliability of the ACCtrav system.
It was clear that HCI processes and methodologies still have a significant role when
developing contemporary computer-based systems. The effects can be noticed in
user experience, the ease of learning, the structure of tasks and processes,
communication and social interaction. The next chapter, Chapter 6, contained the
summaries about the findings and conclusion drawn from the study.

~ 88 ~
CHAPTER 6: SUMMARY AND FURTHER RESEARCH
6.1 Introduction
The discussion in this chapter covers a review and summary of all the major
conclusions from the previous chapters; including the review and summary of the
methods used. The research topic for this study was: What benefits can a business
derive from HCI Interventions? The research question was subdivided into three sub-
questions: (1) What are the usability problems faced by the users while
accomplishing tasks using the ACCtrav system? (2) How do these usability problems
affect business in this case? (3) What HCI techniques can be applied to correct
these usability problems? The sub-questions were a guide when conducting the
literature review (Chapters 2 and 3), and they helped to select the research design
and data collection methods used (Chapter 4). The case study approach was applied
as a research design, and the study used the interpretivist research paradigm
approach when collecting, analysing and interpreting the data. A questionnaire,
observation, interviews and field notes were used as data collection methods.
This chapter starts with the review of the problem statement, which includes the
objectives, in Section 6.2; a discussion in Section 6.3 reflects on the methods used
whereas the summary of the research findings arranged according to the research
sub-questions in Section 6.4. Section 6.5 contains a discussion on a selection of the
most important conclusions arrived at in this study. The conclusions provide the
answers to the main research question. A summary of the major contributions of the
study appear in Section 6.6. In Section 6.7 the recommendations for implementation
of the proposed guidelines are discussed, and Section 6.8 contains the concluding
remarks for the chapter as well as for the whole dissertation.
6.2 The problem statement
The study focussed on the ACCtrav system used in a travel management company
which provides travel services to other corporates, including government
departments. The ACCtrav system was implemented to help in the efficient capture
of travel data and provide for more efficient and effective travel expense reporting on
all customer accounts. To achieve efficiency in expense reporting, most of the
manual tasks at the time had to be accomplished using a computer-based system.
~ 89 ~
The ACCtrav system’s functionality and features were then conceptualised and
aligned in such a way as to (a) speed up service provision; (b) broaden service
capacity through higher availability and performance; and (c) provide for better
security through trustworthy auditing of all the transactions. Nevertheless, over a
number of years, the objectives of implementing the ACCtrav system had not been
adequately realised. The users had challenges working with the system, and these
challenges seemed to impact on the business in terms of the quality of the service
provided.
6.3 A reflection on the methods used
The goal of this study was to ascertain the benefits that the TMC could derive from
implementing the HCI interventions during the development and or implementation of
ACCtrav. To achieve the goal, the challenges that users of the ACCtrav system
encountered had to be identified and understood in terms of how such challenges
affected the business; and then those challenges related to the solutions offered by
HCI techniques.
The questionnaire for user interface satisfaction (QUIS) was used to achieve the
goal of this study. However, it was found that the QUIS was not the most optimal
method of collecting data to measure tangible benefits that can be derived from
implementing HCI interventions for a business. Data collected from the QUIS can
only be analysed to reveal the intangible benefits associated with a usable system.
Nevertheless, the QUIS has notable advantages as shown by the following benefits
associated with its use:
It is a widely used instrument and therefore its validity has already been
established by other researchers (Umd, 2012)
It was easy to use, and all the participants were familiar with filling in a
questionnaire of this format. So there was no need for prior training.
It was quick to analyse the information.
The selection criterion of the participants was based on their willingness to volunteer
for participation in the study at their own workplace settings. The participants were
therefore a convenience sample; however, future work may have to consider specific
factors when selecting participants such as specific population segments, age
groups, professions, educational or cultural backgrounds, and gender.
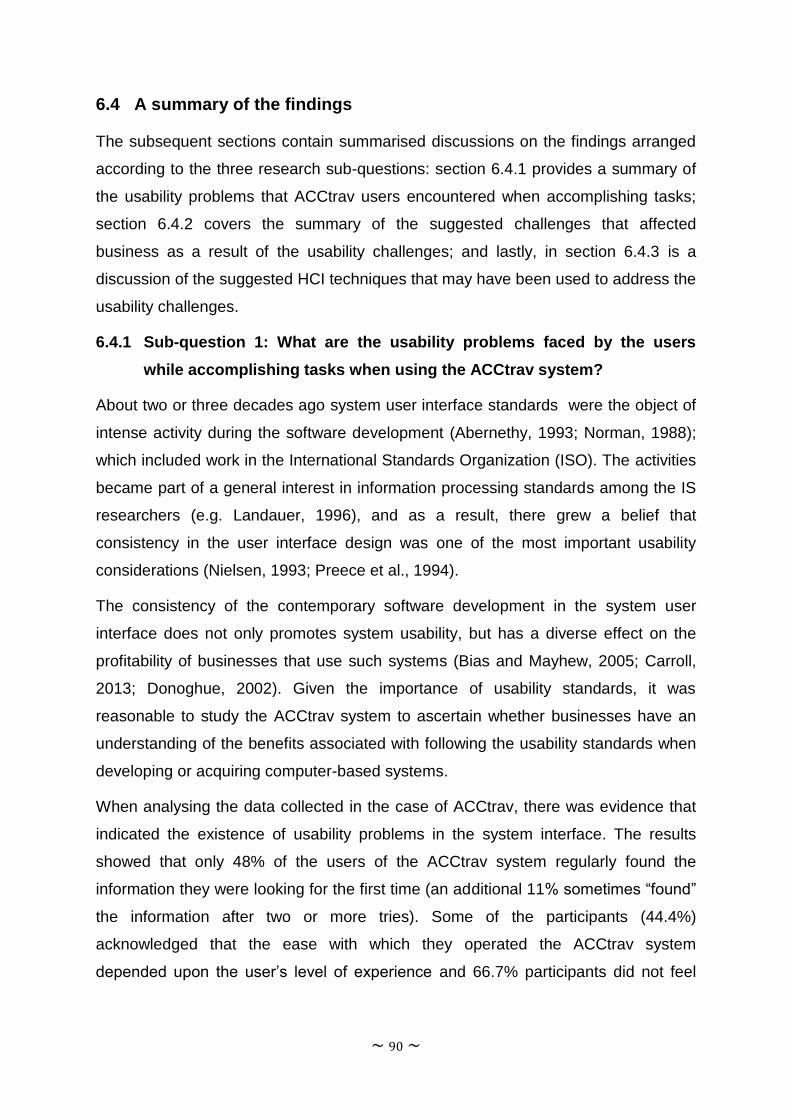
~ 90 ~
6.4 A summary of the findings
The subsequent sections contain summarised discussions on the findings arranged
according to the three research sub-questions: section 6.4.1 provides a summary of
the usability problems that ACCtrav users encountered when accomplishing tasks;
section 6.4.2 covers the summary of the suggested challenges that affected
business as a result of the usability challenges; and lastly, in section 6.4.3 is a
discussion of the suggested HCI techniques that may have been used to address the
usability challenges.
6.4.1 Sub-question 1: What are the usability problems faced by the users
while accomplishing tasks when using the ACCtrav system?
About two or three decades ago system user interface standards were the object of
intense activity during the software development (Abernethy, 1993; Norman, 1988);
which included work in the International Standards Organization (ISO). The activities
became part of a general interest in information processing standards among the IS
researchers (e.g. Landauer, 1996), and as a result, there grew a belief that
consistency in the user interface design was one of the most important usability
considerations (Nielsen, 1993; Preece et al., 1994).
The consistency of the contemporary software development in the system user
interface does not only promotes system usability, but has a diverse effect on the
profitability of businesses that use such systems (Bias and Mayhew, 2005; Carroll,
2013; Donoghue, 2002). Given the importance of usability standards, it was
reasonable to study the ACCtrav system to ascertain whether businesses have an
understanding of the benefits associated with following the usability standards when
developing or acquiring computer-based systems.
When analysing the data collected in the case of ACCtrav, there was evidence that
indicated the existence of usability problems in the system interface. The results
showed that only 48% of the users of the ACCtrav system regularly found the
information they were looking for the first time (an additional 11% sometimes “found”
the information after two or more tries). Some of the participants (44.4%)
acknowledged that the ease with which they operated the ACCtrav system
depended upon the user’s level of experience and 66.7% participants did not feel

~ 91 ~
encouraged to learn and/or explore advanced features of the ACCtrav system
through trial and error (Ceaparu et al., 2004; Lazar et al., 2005).
Before elaborating on how usability challenges affect business, the most notable
usability challenges identified in the ACCtrav system interface included use of
shortcuts not provided for experienced users; reliance on drop-down menus in the
user interface design; lack of online Help and documentation for users to consult;
inadequate informative feedback and progress on task completion; lack of
appropriate and clear error and message handling; reversal of actions not facilitated
in the order to correct mistakes with immediate effect; frequent system failures which
occurred at an average of once in two days; and insufficient support for user sense
of control, that is, supporting internal locus of control. Users always relied on the help
desk for support due to the inadequate design of dialogues to yield closure in
ACCtrav.
6.4.2 Sub-question 2: How do these usability problems affect business in this
case?
The experience gained from this study shows that following a checklist of specified
design elements and rules, as stated in the usability standards, helps in conforming
to the quality assurance review of computer-based systems (Preece et al., 2011;
Sharp et al., 2007). However, for businesses to achieve the intended quality
assurance and derive the benefits, they have to develop the ability to emphasise the
use and understanding of the usability standards (Diaper, 2004; Dumas, 2003;
Nielsen, 1993). This is because the development of usable systems does have an
impact on the achievement of the business goals such as reducing costs, improving
productivity, and providing an efficient and effective service to customers (Diaper,
2004; Myers, 1992) - which may result in a predictable revenue inflow (Bias and
Mayhew, 2005; Landauer, 1996).
In the case of ACCtrav the areas that were affected included (a) user productivity, (b)
learning and skills enhancement, (c) publicity, and (d) loss of revenue due to
mistakes made by the users. Table 9 provides a summary of the business areas that
were affected as a result of usability problems.

~92 ~
Table 8: How usability problems affect the business
Area of interest How the business is affected
Users/Employees
Usability challenge cause users to become frustrated, develop low morale, lack enthusiasm and
satisfaction in their work (Bessie`re et al., 2005). As a result the business is affected in the following
ways
low productivity as a result of poor satisfaction and lack of engagement when accomplishing
tasks (Diaper, 2004). Business never operates at optimal levels hence potential capacity never
achieved;
the need for regular training (training costs);
poor interpersonal relationships, collaboration and communication. Communication from top
management does not flow through well to the lowest user (Bessie`re et al., 2004).
Costs/Expenses The company spends more to
train users to develop the skills needed to accomplish tasks efficiently;
maintain the ACCtrav system;
advertise when building brand.
Publicity and Revenue Bad publicity arises from the fact that users cannot reach their task goals on time hence poor service
delivery from the business. This leads to loss of revenue of as a result of substandard service
rendered, in the form of reimbursing customers and or suppliers for the mistakes made by the
consultants; and the inability to win new customers and or retention of existing customers.

~93 ~
There was evidence of low productivity among users as a result of frustrating
experiences that they encountered when working with ACCtrav (BCDtravel, 2010;
Ceaparu et al., 2004). Other factors that affected user productivity included (a) user’s
low enthusiasm; (b) poor satisfaction; and (c) lack of engagement and trust when
accomplishing tasks (Bessie`re et al., 2005; Cyr et al., 2007). Low productivity levels
causes business to perform below the potential capacity. Low morale among the
users of ACCtrav affected their interpersonal relationships, collaboration and
communication, and it kept them from reaching their task goals (Lazar et al., 2005).
There was also an increased need for regular end-user training on how to operate
the ACCtrav system. Of the calls received by the support help-desk 90% sought help
on ACCtrav. Business is affected by the increase in training costs, support costs and
system maintenance.
From the survey of customers, 68.7% were not happy with the service rendered
(BCDtravel, 2010). Customers complained of not receiving the services on time, and
often, without all the stated requirements. Owing to long turnaround times to fulfil the
orders or to the substandard service rendered, business suffers from bad publicity
which, in the long run, causes loss of revenue due to unplanned frequent discounts
offered on fees to aggrieving customers, and the inability to retain or win new
customers. In addition the company’s public relations cost more when building the
brand or image because of the increase in advertising expenses to reach new
markets.
6.4.3 Sub-question 3: What HCI techniques can be applied to correct these
Usability problems?
Many HCI techniques were not investigated, however, those listed below are the
ones considered to be most suitable for this study’s goal of (a) improving user
productivity; (b) reducing the costs of training; (c) enhancing skills among users; (d)
redefining business processes or work flows to generate a competitive advantage;
and (e) improving business operations (Bias and Mayhew, 2005; Magoulas and
Chen, 2006). The HCI techniques that were investigated are as follows:
Contextual Inquiry and Task Analysis: Through silent observation and one-on-
one interviewing, business would gain an understanding of the task-flow users
make use of to achieve their task goals (Carroll, 2013; Bessie`re et al., 2005).
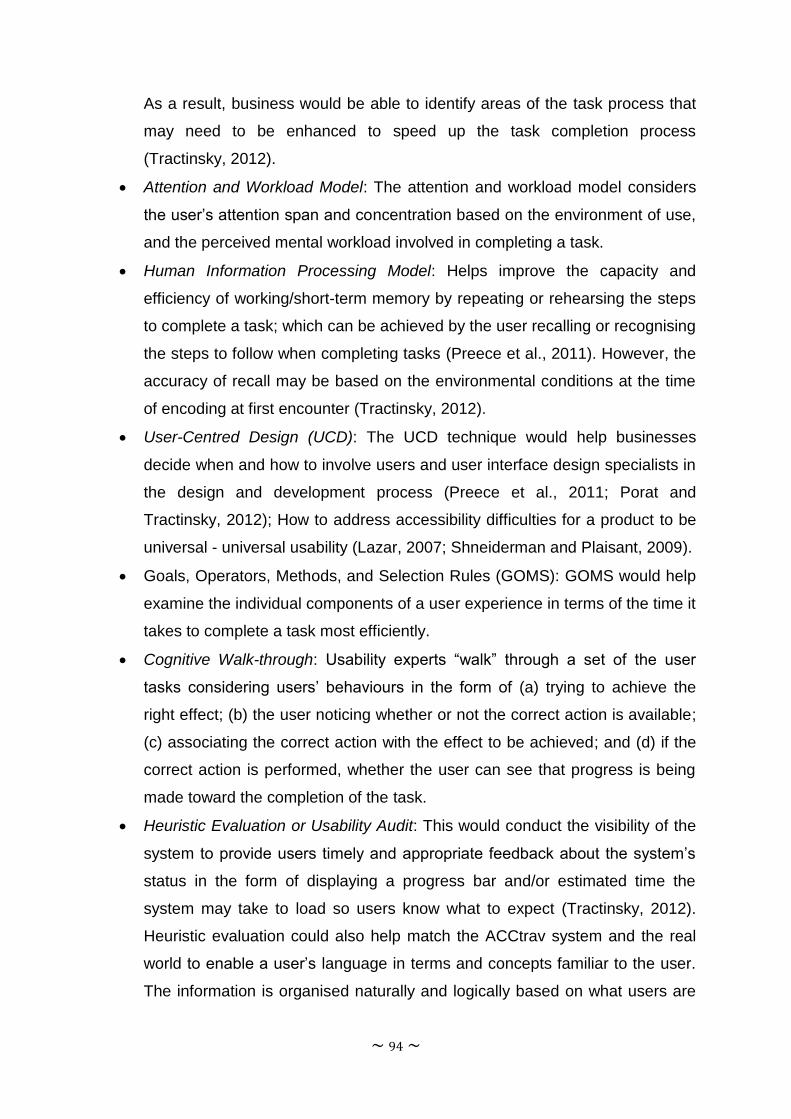
~ 94 ~
As a result, business would be able to identify areas of the task process that
may need to be enhanced to speed up the task completion process
(Tractinsky, 2012).
Attention and Workload Model: The attention and workload model considers
the user’s attention span and concentration based on the environment of use,
and the perceived mental workload involved in completing a task.
Human Information Processing Model: Helps improve the capacity and
efficiency of working/short-term memory by repeating or rehearsing the steps
to complete a task; which can be achieved by the user recalling or recognising
the steps to follow when completing tasks (Preece et al., 2011). However, the
accuracy of recall may be based on the environmental conditions at the time
of encoding at first encounter (Tractinsky, 2012).
User-Centred Design (UCD): The UCD technique would help businesses
decide when and how to involve users and user interface design specialists in
the design and development process (Preece et al., 2011; Porat and
Tractinsky, 2012); How to address accessibility difficulties for a product to be
universal - universal usability (Lazar, 2007; Shneiderman and Plaisant, 2009).
Goals, Operators, Methods, and Selection Rules (GOMS): GOMS would help
examine the individual components of a user experience in terms of the time it
takes to complete a task most efficiently.
Cognitive Walk-through: Usability experts “walk” through a set of the user
tasks considering users’ behaviours in the form of (a) trying to achieve the
right effect; (b) the user noticing whether or not the correct action is available;
(c) associating the correct action with the effect to be achieved; and (d) if the
correct action is performed, whether the user can see that progress is being
made toward the completion of the task.
Heuristic Evaluation or Usability Audit: This would conduct the visibility of the
system to provide users timely and appropriate feedback about the system’s
status in the form of displaying a progress bar and/or estimated time the
system may take to load so users know what to expect (Tractinsky, 2012).
Heuristic evaluation could also help match the ACCtrav system and the real
world to enable a user’s language in terms and concepts familiar to the user.
The information is organised naturally and logically based on what users are

~ 95 ~
accustomed to in their work context/world. The result could therefore be
emphasising user control and freedom as they interact with the system by
allowing the functionality to undo and redo actions, and also to easily exit the
system. User controls, icons, terminology, and error messaging become
consistent throughout the interface. Where appropriate, industry and platform
standards can be applied in the system interface.
Table 10 provides a summary of the three research sub-questions. In the left
column, is listed the usability challenges that were identified when users operated
the ACCtrav system. The middle column contains a brief explanation on how each
usability challenge affected business, and the right column lists the HCI techniques
considered suitable for correcting the usability challenges identified to bring about
the benefits for business.

~96 ~
Table 9: Usability problems identified, their impact on business and the recommended HCI techniques that can be used to correct usability issues identified
Usability problem
identified
The impact on business HCI techniques that can be used to
correct the usability problem
1. Use of shortcuts not
provided for experienced
users
The use of shortcuts can improve on the workflow of users, making it
faster, simple and easier to get the tasks done.
Navigating the system interface may become easier; which may help
users to quickly find their way around the tasks. A lack thereof may result
in low productivity levels causing the business to perform below its
potential capacity.
Contextual inquiry and Task Analysis.
2. Reliance on drop-down
menus in the user
interface design
Experienced users often felt bored browsing the list to select an option
and some users selected wrong options. This amounted to double work
when making corrections. As a result, the efficiency of completing tasks is
affected. Also there is a greater possibility of users either forgetting or
having memory overload as the user has to remember all the menu levels
and steps to scroll for the selection. This also impacts on user
performance should there be too many options to choose from. This may
leave a user overwhelmed by the decisions they have to make and lead
to some frustration before completing the task.
Attention and Workload Model.
Human Information Processing Model
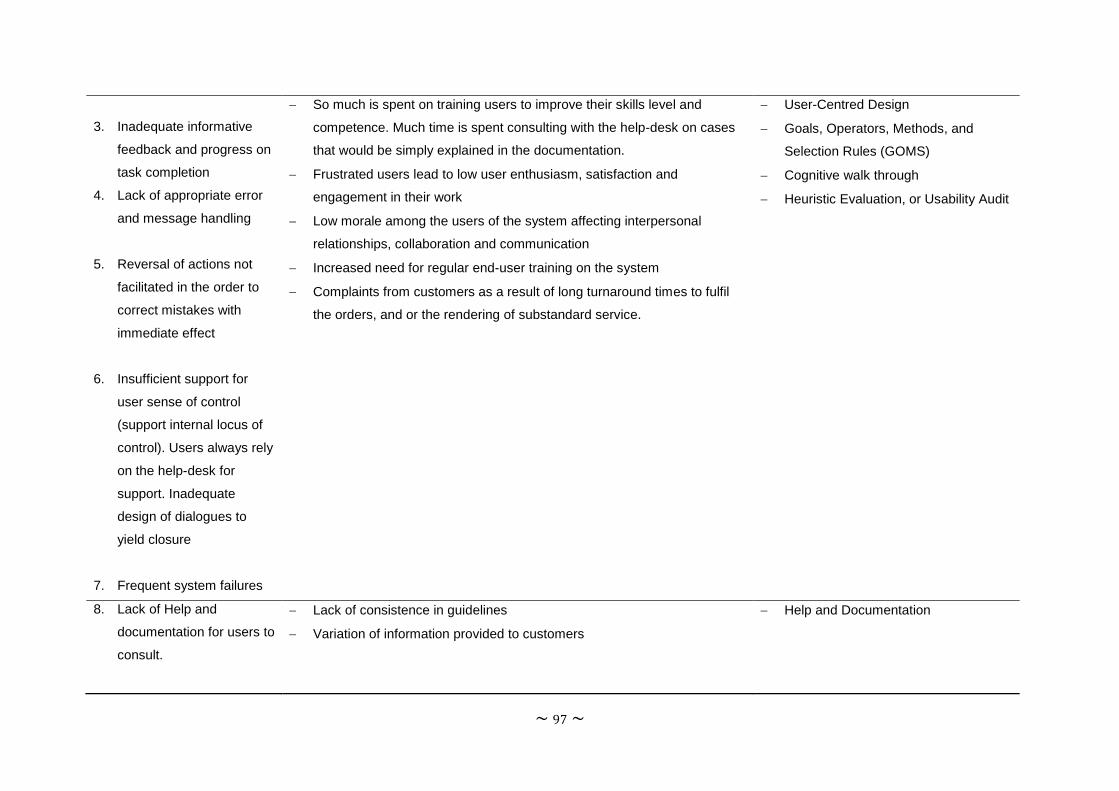
~ 97 ~
3. Inadequate informative
feedback and progress on
task completion
4. Lack of appropriate error
and message handling
5. Reversal of actions not
facilitated in the order to
correct mistakes with
immediate effect
6. Insufficient support for
user sense of control
(support internal locus of
control). Users always rely
on the help-desk for
support. Inadequate
design of dialogues to
yield closure
7. Frequent system failures
So much is spent on training users to improve their skills level and
competence. Much time is spent consulting with the help-desk on cases
that would be simply explained in the documentation.
Frustrated users lead to low user enthusiasm, satisfaction and
engagement in their work
Low morale among the users of the system affecting interpersonal
relationships, collaboration and communication
Increased need for regular end-user training on the system
Complaints from customers as a result of long turnaround times to fulfil
the orders, and or the rendering of substandard service.
User-Centred Design
Goals, Operators, Methods, and
Selection Rules (GOMS)
Cognitive walk through
Heuristic Evaluation, or Usability Audit
8. Lack of Help and
documentation for users to
consult.
Lack of consistence in guidelines
Variation of information provided to customers
Help and Documentation

~98 ~
6.5 Conclusion of the findings
The understanding and practices of HCI techniques are still subject to the awareness
and knowledge availability in the industry sector in question despite the proliferation
of computer-based systems. The researcher believes businesses can derive benefits
from implementing HCI interventions in areas such as: (a) redefining task/workflow
processes; (b) improving the means of communication (Vicari et al., 2007); (c)
reaching out to new markets by enhancing existing products or creating new
products and services that are effective; (d) increasing productivity levels as a result
of skilled users or easy to use system interface designs or clear and simple tasks;
and (e) the implementation of business strategies and goals. Sections 6.5.1 to 6.5.6
below contain brief discussions on the important conclusions arrived at in the course
of this study; whereas Table 11 lists the summary of the benefits derived from using
HCI interventions by the business.
6.5.1 Learnable systems
It is imperative to have systems that users can learn easily. Using HCI techniques to
assess the usability of the system user interface can help business implement
systems that users can learn easily, and which accommodates both novice and
expert users. To achieve this ‘learnability’ goal the ACCtrav system interface should
be designed to incorporate use of help menus or online user manuals, and should
make use of keyboard shortcuts to speed up access to some tasks or commands.
Also needed is a clear display of instructions and straightforward error messages to
guide the user when recovering from mistakes, or help the user learn the system
with minimal training.
Use of keyboard short-cuts in the ACCtrav system interface should encourage the
user to learn the system’s advanced features. As a result, the user becomes skilled,
and costs on re-training are reduced because the user can find the way around the
interface easily and quickly or can remember the steps to take to complete tasks with
minimal effort.
6.5.2 User satisfaction and motivation
Users get frustrated because of the problems they encounter using computer-based
systems and their need to achieve the set goals are therefore affected. Frustration
affects the attitude and mind-set of the user (Bessie`re et al., 2004) and the user

~ 99 ~
experience (Ceaparu et al., 2004). The HCI interventions can help improve the user
experience by having a system offer relevant services which operates in a way that
suits the user’s needs and expectations. For example, when the system provides
meaningful feedback to the user, there is a tendency from users to enjoy their work
and a desire to contribute ideas to better the experience. A bad user experience
affects how users engage with each other and impacts on their emotional connection
with the company; that in turn influences how the user exerts greater discretionary
effort to the tasks at hand (Bessie`re et al., 2004).
6.5.3 Increase in user productivity levels
The HCI techniques help develop clear, simple, and easy-to-comprehend tasks that
users can manage with ease. Consequently, the user’s performance improves, and
the productivity level rises, businesses then reap the most on this improved
productivity as users deliver more as a result of efficient and effective systems
(Diaper, 2004; Sharp et al., 2007).
6.5.4 Operational and training costs
Operational costs drop because of (a) streamlined and clear tasks/workflows; (b) the
reduction in training and support costs as a result of learnable systems; and (c) the
increase in user productivity levels when the efficiency and effectiveness of business
processes become enhanced (Bias and Mayhew, 2005; Mele and Polese, 2011).
6.5.5 Customer satisfaction
The HCI interventions help streamline the workflows and can make it easy to detect
problems in the course of fulfilling an order. Also, users better understand the
requirements as a result of the clear tasks put in place and the roles in which they
get involved when processing the order. The outcome of this is the shortened
turnaround times fulfilling orders from when the order is placed by the customer to its
delivery.

~100 ~
Table 10: Benefits derived from HCI interventions
Business benefit Explanation
Changing the
organisation culture
The HCI activities can be used to promote the change in culture within an organisation. The organisation can effectively drive
new ways of how things are done without necessarily implementing drastic measures by incorporating HCI activities into the
corporate culture. The interaction and involvement of people gradually leads to a change in ways of doing things.
Good publicity The HCI activities can be a source of good publicity for an organisation through the press. Innovation is the key, and every
organisation yearns for innovation. The HCI promotes innovation user experience. As more staff have a positive user
experience, they become more productive and creative, which leads to better performance.
Customer interaction
and involvement
Customer relationship management: After participating in HCI activities, customers can cite an improved, if not better, opinion of
the company and offer greater loyalty in return, which is not surprising from a relationship-building perspective.
Goals Most companies have goals at several levels, including corporate-level goals and departmental-level goals. Incorporating HCI
activities and achievements into multiple levels of goals is an effective strategy for raising awareness about the company goals
such as increasing customer acquisition, retention and loyalty. The HCI can be used to align departmental goals with the
corporate goals.
Efficient and effective
communication
Misunderstandings and silos can occur within organisations due to different groups using different terminology. HCI activities can
help in understanding the internal customer requirements and better and appropriate communication means can be deployed.
Well-defined value
system
The HCI can be used to understand the value system of the stakeholders and to translate how HCI supports their value system.
This can be demonstrated through the product design.
Rewards and bonuses Related to goals are bonuses. In most companies, bonuses are awarded based on the achievement of explicit goals. HCI
activities can help determine appropriate rewards and bonuses as they will in some way help in collecting reliable data and also
help improve employee productivity and performance.

~101 ~
6.5.6 Effective communication and publicity
Publicity starts within the business setting, especially amongst the staff. Clear and
straightforward tasks, workflows and processes lead to well-defined roles and
functions within the business. As a result, misunderstandings and silos can be easily
identified and eradicated. A satisfied and motivated user will speak well of his/her job
and will exhibit good interpersonal relationships. A satisfied and happy customer can
willingly spread a good word about the quality of service rendered.
6.6 Summary of the contributions made by the study
The major contribution of this study is the spread of awareness about the benefits
that businesses can derive from implementing HCI interventions. The awareness has
been demonstrated by identifying the links between the HCI variables and factors
that are critical for successful implementation of computer-based systems in areas
that can help business succeed and make good return on investment (ROI)(Bias and
Mayhew, 2005; Heppner et al., 2005). For example, the principle of learnability
emphasises improving users’ skills and knowledge (Preece et al., 2011) by: (a)
making the navigation of the system easy for users (both novice and experts); (b)
making it easy to recall steps to take when accomplishing tasks; and (c) making the
system interface display clear and informative message dialogues and error
messages that can guide a user to recover from mistakes. The other areas that this
study sought a link for business success are: (d) to increase user satisfaction and
motivation; (e) to have an effective public relations plan or method in place; with (f)
an efficient and effective communication system (Mele and Polese, 2011).
6.7 Recommendations for implementation
The researcher has learnt that implementing HCI interventions successfully can
depend on various business factors. In this study, the notable factors include
creating awareness and the recognition with the involvement of top management. It
is important that users of the computer-based systems attain some degree of
awareness and knowledge on HCI factors and possess the ability to distinguish
these factors from the traditional IT activities. Business can achieve this by
employing a Usability Consultant who should serve in a senior advisory capacity
within the organizational structure. Top management should recognise and get

~ 102 ~
involved in spreading awareness by creating a viable atmosphere in which key
decisions can be made easily to facilitate and influence the implementation of HCI
interventions. If possible, both employees and customers should also be involved in
the HCI activities. Support from top management can emphasize the importance of
HCI interventions in attaining business goals to the rest of the staff. Sections 6.7.1
and 6.7.2 contain brief discussions on the recommendations that the researcher
believes businesses should have in place when implementing HCI interventions so
as to derive and maximise their intervention benefits.
6.7.1 Adoption of HCI standards
The HCI guidelines and standards should be adopted in workplaces just like other
standards and regulations such as fire safety, quality assurance, and others. Fire
safety and quality assurance might be legal requirements; however, I believe that
HCI (usability) standards should be treated equally since they can help in improving
on the health of users. For example, the reduction of frustrating experiences that
users encounter from unusable systems may have an effect in improving their
health. Besides, business would benefit by having reduced absenteeism from
employees who call in sick, and or their ensuing medical expenses due to more
motivated and satisfied users who love to do their work.
6.7.2 Make changes regularly to the system user-interface
The system interface should be re-evaluated every two or three years. When
necessary the system interface should be redesigned to reflect the change in the
company’s profile, technological and/or business developments.
6.8 Conclusion
This styudy sought to understand if HCI interventions were still relevant in
evaluating the usefulness of computer-based systems and the benefits that
businesses can derive from using the HCI techniques (Bias and Mayhew, 2005;
Wild, 2010). The industy sector used to gain this understanding was that of travel
services. By the end of this study it was clear that HCI interventions have an
important role in the design and development of contemporary computer-based
systems just as it was many years back (Abernethy, 1993; Norman, 1988).
Therefore, the researcher upholds that HCI interventions can be used in the analysis
of business processes, such as in: the way tasks can be designed; learning how

~ 103 ~
users communicate and interact in their working environments (Carroll, 2013,
Heppner et al., 2005; Preece et al., 2011); evaluating user experience; the ease with
which users learn systems; the structuring of the users’ tasks; and influencing user
communication and social interaction (Bessie`re et al., 2005).
Specific and focused HCI interventions put greater emphasis on the understanding
of user behaviours and the characteristics of the systems used and/or the
behavioural consequences of aesthetic evaluations from the user perspective when
contextualised in: (a) the type and significance of tasks; (b) user experiences; (c)
overall satisfaction; and (d) performance (Carroll, 2013, Tractinsky 2012). This can
help business to determine how to: (1) utilise resources effectively; (2) monitor and
measure the quality of services; and (3) predict future events, conditions, and
customer demand (Kim 2009; Mele and Polese, 2011).
Nonetheless, it is important that the knowledge and awareness of HCI interventions
is emphasised by business when creating a manageable design process that can
bridge the gap between the marketing and operations of services. The bridging of
the marketing and operations gap can lead to business benefits such as: (a) higher
revenues through increased sales; (b) increased user productivity and satisfaction;
and (c) reduced support costs (Chen et al., 2009; Cyr et al., 2007; Luthria and Rabhi,
2009; Magoulas and Chen, 2006; Papazoglou and van den Heuvel, 2007; van Dijk et
al., 2007).

~104 ~
REFERENCES LIST
Abernethy, B. (1993). Searching for the minimal essential information for skilled perception
and action. Psychological Research, Springer-Verlag. Volume 55, Issue 2, Pages 131-
138.
Alexander, D. (2006). Usability and Accessibility: Best Friends or Worst Enemies? Retrieved
18 August, 2011:
http://www.valaconf.org.au/vala2006/papers2006/99_Alexander_Final.pdf.
Andersen, B. (1999). Business Improvement Toolbox. Milwaukee, WI: ASQ Quality Press.
Baily, M. & Chakrabarti, A. K. (1988). Innovation and the Productivity Crisis. Washington D.C.:
The Brookings Institute, Washington, D.C.
Batt, P.J. (2008). Building social capital in networks. Industrial Marketing Management.
Elsevier. Volume 37, Issue 5, Pages 487–491
BCDtravel. (2010), Retrieved 19 March 2012:
http://www.BCDtravel.co.za/aw/home/SouthAfrica/en-
ZA/Home/~byzc/Information_Center/~bmk/Research_Reports_White_Papers/sur_sal20
09b.pdf.
Berry L.L. & Parasuraman, A.A. (1993). “Building a New Academic Field - The Case of
Services Marketing”, Journal of Retailing, Vol.69, Issue.1, Pages.13 - 60.
Bessie`re, K., Ceaparu, I., Lazar, J., Robinson, J., & Shneiderman, B., (2004).Social and
psychological influences on computer user frustration. In: Bucy, E., Newhagen, J.
(Eds.), Media Access: Social and Psychological Dimensions of New Technology Use.
Lawrence Erlbaum Associates, Mahwah, NJ, Pages 91–103.
Bessie`re, K., Newhagen, J., Robinson, J., & Shneiderman, B. (2005). A model for computer
frustration: the role of instrumental and dispositional factors on incident, session, and
post-session frustration and mood. Computers in Human Behavior.
Billé, R. (2010). Action without change? On the use and usefulness of pilot experiments in
environmental management. SAPI EN. S. Surveys and Perspectives Integrating
Environment and Society, (3.1).
Blanche, M. J. T., Blanche, M. T., Durrheim, K., and Painter, D. (Eds.). (2006). Research in
practice: Applied methods for the social sciences. Juta and Company Ltd.

~ 105 ~
Blankson, C. & Kalafatis, S.P. (1999) Issues and challenges in the positioning of service
brands: a review, Journal of Product and Brand Management, Vol. 8 Iss: 2, pp.106 –
118
Boehm, B. & Turner R. (2003). Balancing Agility and Discipline: A Guide for the Perplexed.
Addison wesley
Boehm, B.W. (1991). Software risk management: Principles and practice. IEEE Software.
Volume 8, Issue1, Pages 32–41.
Bourges-Waldegg, P. & Scrivener, S.A.R. (1998). Meaning, the central issue in cross-cultural
HCI design. Interacting with Computers, Pages 287-309
Cai, S., Xu, Y., & Yu, J. (2008). The effects of web site aesthetics and shopping task on
consumer online purchasing behavior. CHI 2008 Proceedings, (pp. 3477-3483).
Florence, Italy.
Carroll, J.M. (2009). Conceptualizing a possible discipline of human computer interaction,
Pennsylvania State University
Carroll, J.M. (2013): Human Computer Interaction - brief intro. In: Soegaard, Mads and Dam,
RikkeFriis (eds.). "The Encyclopedia of Human-Computer Interaction, 2nd Ed.". Aarhus,
Denmark: The Interaction Design Foundation. Retrieved 14 April 2013:
http://www.interaction-design.org/encyclopedia/human_computer_interaction_hci.html
Ceaparu, I., Lazar, J., Bessie`re, K., Robinson, J., & Shneiderman, B.,(2004). Determining
causes and severity of end-user frustration. International Journal of Human-Computer
Interaction Volume 17 Issue 3 Pages 333–356.
Chamorro-Koc M., Vesna, P, & Emmison, M. (2009): Human experience and product usability:
Principles to assist the design of user–product interactions. Applied Ergonomics,
Volume 40, Issue 4, Pages 648-656
Chen, J.V., Yen, D.C., & Chen, K. (2009). The acceptance and diffusion of the innovative
smart phone use: a case study of a delivery service company in logistics. Information
and Management Volume 46, Issue 4, Pages 241–248.
Cockton, G. (2006). Designing worth is worth designing. NORDICHI 2006. ACM, Oslo, Pages
165–174.
Cottam, H., & Leadbeater, C. (2004). Health: Co-creating Services. Report, RED: Design
Council, London.
Cross, R., Borgatti, S.P., & Parker, A. (2001). Beyond answers: dimensions of the advice
network. Social Networks Elsevier Volume 23, Pages 215–235

~ 106 ~
Cyert, R. M. & Mowery, D. C. (1989).Technology, employment and U.S. competitiveness.
Scientific American, Volume 260, Issue 5, Pages 54-62.
Cyr, D. (2008). Modelling Website Design across Cultures: Relationships to Trust, Satisfaction
and E-loyalty. Journal of Management Information Systems, Volume 24, Issue 4, Pages
47-72.
Cyr, D., Hassanein, K., Head, M., & Ivanov, A.. (2007). The role of social presence in
establishing loyalty in e-service environments. Interacting with Computers Volume 19,
Issue 1, Pages 43–56.
Cyr, D., Head, M. & Ivanov, A. (2006). Design Aesthetics Leading to M-loyalty in Mobile
Commerce. Information and Management, Volume 43, Issue 8, Pages 950-963.
Cyr, D., Head, M., & Lario, H. (2010). Colour appeal in website design within and across
cultures: A multi-method evaluation. International Journal of Human-Computer Studies,
Volume 68, Issue 1, Pages 1-21.
Darby, M.R. & Karni, E. (1973). “Free competition and the optimal amount of fraud”, Journal of
Law and Economics Volume 16, pages 67-86
Darzentas , J. & Miesenberger, K. (2005) Design for All in Information Technology: A universal
Concern. in Anderson, K. V., Debenham J. and Wagner, R. (Eds.) Lecture notes in
Computer Science. Springe verlag.
De Villiers, M.R. (2005). Three approaches as pillars for interpretive information systems
research: development research, action research and grounded theory. Proceeding in
SAICSIT '05 Proceedings of the 2005 annual research conference of the South African
institute of computer scientists and information technologists on IT research in
developing countries. Pages 142 – 151
Diaper, D. (2004) Understanding task analysis for human–computer interaction. In: Diaper, D.,
Stanton, N.A. (Eds.), The Handbook of Task Analysis for HCI. LEA, Mahwah, Pages
5–47.
Dix, A., Finlay, J., Abowd, G. D. & Beale, R. (2004). Human Computer Interaction, 3rd ed.
Harlow, UK: Addison-Wesley
Dix, A., Finlay, J., Abowd, G.D & Beale, R. (2004) Human-Computer Interaction.Third Edition.
Harlow: Pearson Education Ltd.
Donoghue, K. (2002). Built for Use: Driving Profitability Through the User Experience. McGraw
Hill Professional.
Dowell, J. & Long, J.B. (1998).Conception of the cognitive engineering design problem.

~ 107 ~
Dowell, J. & Long, J.B., (1989). Towards a conception for an engineering discipline of
Drucker, P.F. (1991) Managing for the Future: The 1990s and Beyond. New York: Truman
Talley Books/E.D. Dutton
Dumas, J. S. (2003). User-Based Evaluation. IN JACKO, J. A. and SEARS, A. (Eds.) The
Human-Computer Interaction Handbook. Mahwah: Lawrence Erlbaum Associates.
Eason, K. D. (1991). Ergonomic perspective on advances in human–computer
interaction.Ergonomics, 34(6), 721–741.efforts in services research. In: Roy, R.,
Shehab, E. (Eds.), Industrial ProductErgonomics Volume 41, Issue 2, Pages 126–139.
Golafshani, N. (2003). Understanding reliability and validity in qualitative research. The
qualitative report, Volume 8, Issue 4, Pages 597-607
Golinelli G.M., Pastore A., Gatti, M., Massaroni, E. & Vagnani, G. (2002), “The firm as a viable
system: managing inter-organisational relationships”, Sinergie, Volume 20, Issue 58,
Pages 65-98.
Gould, J.D. & Lewis, C. (1985). Designing for usability: Key principles and what designers
think. Communications of ACM, Vol. 28, Issue 3, Pages 1-10
Greig, A. & Taylor, J., (1999). Doing Research with Children (Paperback). SAGE Publications,
Limited. ISBN-13: 9780761955900
Hassenzahl, M. (2003) The thing and I: Understanding the relationship between users and
product. In Funology: From usability to enjoyment, M.A. Blythe, K.Overbeeke,
A.F.Monk, P.C. Wright, Eds. Kluwer Academic Publishers, The Netherlands.
Henry, S. L. (2002). Another- ability: Accessibility Primer for Usability Specialists. Retrieved
19 June 2011: http://www.uiaccess.com/upa2002a.html.
Heppner, C.C., Kates, J., Lynch, J.S., & Moritz,R.R., (2005) At Sprint, Understanding the
Language of Business Gives Usability a Positive Net Present Value in Bias, R.G and
Mayhew, D.J., (2005),Cost-Justifying Usability, An Update for an Internet Age, 2nd
edition, Pages 601–611
Hill, P. (1977) On goods and services. Review of Income and Wealth Volume 23, Issue 4,
Pages 315–338.
Hill, P. (1999) Tangibles, intangibles and services.Canadian Journal of Economics Volume 32,
Issue 2, Pages 4–26.
Hocova, P. & Stanicek, Z., (2010), On Service Systems – by Definition of Elementary
Concepts: Towards the Sound Theory of Service Science. In: IESS 1.0. LNBIP 53

~ 108 ~
Howe, K.R., (1988). Against the Quantitative-Qualitative Incompatibility Thesis (Or Dogmas
Die Hard). Educational Researcher, Volume 17, Issue 8, Pages 10-16.
IfM & IBM, 2008. Succeeding through Service Innovation. IfM, University of Cambridge,
Cambridge.
ISO 9241-210 (2010). Retrieved 25 November, 2013:
http://www.iso.org/iso/home/store/catalogue_ics/catalogue_detail_ics.htm?csnumber=5
2075.
Jones T.O. & Sasser E.W. JR., (1995). Why satisfied customers defect, Harvard Business
Review, November-December, Pages 88-99
Jones, M. & Samalionis, F. (2008). From small ideas to radical service innovation. Design
Management Review, Winter, Pages 19–27.
Kaner, M. & Karni, R. (2006).A Knowledge Framework for a Service Concept. Proceedings of
I-KNOW ’06. Graz, Austria
Karat, C. (1990) Cost-benefit analysis of usability engineering techniques.Proceedings of the
Human Factors Society 34th Annual Meeting. Santa Monica, CA: Human Factors
Society.
Kim, H. (2009). Service science for service innovation. Journal of Service Science, Volume 1,
Issue 1, Pages1-7.
Klein, L.R. (1988). Components of competitiveness. Science, 241,308-313. In Mokyr, J.
(1990). The Lever of Riches: Technological Creativity and Economic Progress. New
York: Oxford
Kling, R. (2000). Learning about information technologies and social change: the contribution
of social informatics. The Information Society Volume 16, Issue 3, Pages 217–232.
Landauer, T. K. (1996). The Trouble with Computers: Usefulness, Usability, and Productivity.
The MIT Press.
Lazar J, Jones A., Bessie`re, K., Ceaparu I., & Shneiderman B. (2005). Workplace user
frustration with computers: an exploratory investigation of the causes and severity.
Behaviour and Information Technology.
Lazar, J. (2007). Universal Usability: Designing Computer Interfaces for Diverse users. John
Wiley and Sons Ltd, Ltd,
~ 109 ~
Lazar, J., Meiselwitz, G., & Norcio, A. (2004). A taxonomy of novice user perception of error on
the web. Universal Access in the Information Society Journal Volume 3, Issue 3, Pages
202–208.
Lee, S. & Koubek, R.J. (2010). Understanding user preferences based on usability and
aesthetics before and after actual use. Interacting with Computers. Volume 22, Issue 6,
Pages 530–543
Leedy, P. D., & Ormrod, J. E. (2010). Practical research: Planning and design. Upper Sadle
River, New Jersey: Merrill.
Levitt T. (1981). “Marketing Intangible Products and Product Intangibles”, Harvard Business
Review, Issue 81, Pages 94–102.
Levy, S. (1988). Information technologies in universities: An institutional case study.
Unpublished doctoral dissertation. Northern Arizona University.
Lindgaard, G. & Dudek, C., 2002, User satisfaction, aesthetics and usability: Beyond
reductionism. In: Usability gaining a competitive edge, Proceedings IFIP 17th World
Computer Congress, J. Hammond, T. Gross and J. Wesson (Eds.), Montreal, Canada.
Lindgaard, G., Dudek, C., Sen, D., Sumegi, L., & Noonan, P. (2011). An exploration of
relations between visual appeal, trustworthiness and perceived usability of homepages.
ACM Transactions on Computer-Human Interaction (TOCHI), Volume 18, Issue 1,
Pages 1.
Lindgaard, G., Fernandes, G., Dudek, C., &Brown, J. (2006). Attention web designers: You
have 50 milliseconds to make a good first impression!. Behaviour & Information
Technology, Volume 25, No. 2, Pages 115 – 126
Locke, E.A. (1996). Motivation through conscious goal setting. Applied Preventative
Psychology Volume 5 Pages 117–124.
Lovelock, C.H. & Gummesson, E. (2004). Whither services marketing? Journal of Service
Research Volume 7, Issue 1, Pages 20–41.
Loyd, B. & Gressard, C. (1984). Reliability and factorial validity of computer attitude scales.
Educational and Psychological Measurement Volume 44, Pages 501–505.
Lund, A. M. (1997). Expert ratings of usability maxims. Ergonomics in Design, 5(3), 15-20. A
study of the heuristics design experts consider important for good design.Agar, M.
(1996). Professional Stranger: An Informal Introduction to Ethnography, (2nd Ed.).
Academic Press.

~ 110 ~
Luthria, H. & Rabhi, F. (2009). Service oriented computing in practice. Journal of Theoretical
and Applied Electronic Commerce Research Volume 4, Issue 1, Pages 39–56.
Maglio, P.P., Srinivasan, S., Kreulen, J.T., & Spohrer, J. (2006). Service systems, service
scientists, SSME, and innovation. Communications of the ACM - Services science.
Volume 49, Issue 7, Pages 81-85
Maglio, P.P., Vargo, S.L., Caswell, N., Spohrer, J. (2009). The service system is the basic
abstraction of Service Science. Inf. Syst. E-Bus. Manage. Volume 7, Pages 395–406
Magoulas, G.D. & Chen, S. (2006). Human factors in personalised systems and services.
Interacting with Computers Volume 18, Issue 3, Pages 327–330.
Mantei, M.M. & Teorey, T.J. (1988). Cost/benefit analysis for incorporating human factors in
the software lifecycle. Communications of the ACM. Volume 31 Issue 4, Pages 428-
439.
McCarthy, E. W. (1982). The REA Accounting Model: A Generalized Framework for
Accounting Systems in a Shared Data Environment. The Accounting Review, Pages
554–78
McCarthy, J. & Wright, P. (2004). Technology as Experience. MIT Press, Bradford, MA.
Mele, C. & Polese, F. (2011). Key Dimensions of Service Systems in Value-Creating
Networks in Demirkan, H., Spohrer, J.C., Krishna, V. (2011) The Science of Service
Systems. Service Science: Research and Innovations in the Service Economy. Springer
US. Pages 37-59
Mele, C., Colurcio, M., & Russo-Spena, T. (2009). Alternative logics for innovation: a call for
service innovation research. Proceedings of Forum on Service: Service-Dominant
Logic, Service Science and Network Theory, Napoli. Sage
Mentis, H. & Gay, G. (2003). User recalled occurrences of usability errors: implications on the
user experience, Extended Abstracts of the 2003 Conference on Human Factors in
Computing Systems (CHI). ACM Press, New York Pages 736–737.
Miles, M. & Huberman, M. (1984). Qualitative data analysis: A source book for new methods.
Beverly Hills, CA: Sage Publications.MITIP’09 Bergamo.
Moshagen, M., Musch, J., & Göritz, A. S. (2009). A blessing, not a curse: Experimental
evidence for beneficial effects of visual aesthetics on performance. Ergonomics,
Volume 52, Issue 10, Pages 1311-1320.

~ 111 ~
Murrell, A.J. & Sprinkle, J. (1993). The impact of negative attitudes toward computers on
employees’ satisfaction and commitment within a small company. Computers in Human
Behavior Volume 9 Pages 57–63.
Myers, M. D. (1994). A disaster for everyone to see: an interpretive analysis of a failed IS
project. Accounting, Management and Information Technologies, 4(4), 185-201.
Nash, J.B. & Moroz, P.A. (1997). An examination of the factor structures of the computer
attitude scale. Journal of Educational Computing Research. Volume 17, Issue 4, Pages
341–356.
Nielsen, J. & Molich, R. (1990). Heuristic Evaluation of User Interfaces. Special Interest group
on computer - human Interaction (SIGCHI) conference on Human factors in computing
systems.
Nielsen, J. (1993). Usability Engineering. Boston: Academic Press, Inc.
NN/g (2012). Accessibility Is Not Enough. [online] Retrieved 29 December 2012:
http://www.NN/g.com, n.d./articles/accessibility-is-not-enough.
NN/g (2013). Introduction to Usability. [online] Retrieved 20 March 2013:
http://www.NN/g.com, n.d./articles/usability-101-introduction-to-usability.
Noiwan, J. & Norcio, A.F. (2005). Cultural differences on attention and perceived usability:
Investigating color combinations of animated graphics.Int. J. Human-Computer Studies
Volume 64, Issue 2006, Pages103–122
Noor, K. (2008). Case study: A strategic research methodology. American Journal of Applied
Sciences, Volume 5, Issue 11, Pages1602–1604.
Norman, D. A. (1988). The Design of Everyday Things. London: MIT Press.
Norman, K. (2004). Computer Rage: Theory and Practice. Technical report available at:
http://lap.umd.edu/lap/.of Service Design Foci, Activities, Phases, Perspectives and
Participants.
Papazoglou, M. & van den Heuvel, W.J. (2007). Service oriented architectures. The VLDB
Journal Volume16, Issue 3, Pages 389–415.
Parasuraman A., Zeithaml V.A., & Berry L.L. (1985). “A Conceptual Model of Service Quality
and Its Implications for Future Research”, Journal of Marketing, Volume 49, Pages 41 -
50.
Parker, S. & Heapy, J., (2006).The Journey to the Interface. Report DEMOS, London.

~ 112 ~
Pernice, K. & Nielsen, J. (2001). Beyond Alt Text: Making the Web Easy to Use for Users with
Disabilities. Retrieved 21 June 2012: http://www.NN/g.com, n.d./reports/accessibility.
Poels, G. (2010). The Resource-Service-System Model for Service, Pages 117–126.
Polit, D.F., & Hungler, B.P. (1999). Nursing Research: Principles and Methods. Sixth edition.
Philadelphia, Lippincott Williams and Wilkins.
Porat, T., & Tractinsky, N. (2012). It's a Pleasure Buying Here: The Effects of Web-Store
Design on Consumers' Emotions and Attitudes. Human–Computer Interaction, Volume
27, Issue 3, Pages 235-276.
Preece, J., Rogers, Y. & Sharp, H. (2011). Interaction Design: Beyond Human-Computer
Interaction. Second Edition. Chichester: John Wiley and Sons Ltd.
Preece, J., Rogers, Y., Sharp, H., Benyon, D., Holland, S., & Carey, T. (1994). Human–
computer interaction. Addison-Wesley.
Quinn, B., & Paquette, P. (1990). Technology in services: creating organisational revolutions.
The McKinsey Quarterly, 3, Pages 91-98.
Quinn, J. B. (1992). The intelligent enterprise a new paradigm. The Executive, Volume 6 Issue
4, Pages 48-63.
Quinn, J. M., & Tran, T. Q. (2010). Attractive phones don't have to work better: independent
effects of attractiveness, effectiveness, and efficiency on perceived usability. In
Proceedings of the SIGCHI Conference on Human Factors in Computing Systems (pp.
353-362). ACM.
Reason, B., Downs, C., & Lovlie, L. (2009). Service Thinking. Retrieved 07 September 2011:
http://www.livework.co.uk/articles/service-thinking.
Rubin, A., & Babbie, E. (2013). Brooks/Cole Empowerment Series: Research Methods for
Social Work. Cengage Learning.
Rust, R. T., & Miu, C. (2006). What academic research tells us about service. Communications
of the ACM, Volume 49 Issue 7, Pages 49-54
Sampson, S.E. & Froehle, C.M. (2006). “Foundations and Implications of a Proposed Unified
Services Theory,” Production and Operations Management, summer 2006, Pages 329-
343.
Schrepp, M., Held, T., & Laugwitz, B. (2006) The influence of hedonic quality on the
attractiveness of user interfaces of business management software. Interacting with
Computers, Volume 18, Pages 1055-1069

~ 113 ~
Segall, M. H., Dasen, P. R., Berry, J. W., & Poortinga, Y. H. (1999). Human behavior in global
perspective (2nd ed.). Boston, MA: Allyn & Bacon
Sharp, H., Preece, J.& Rogers, Y. (2007): Interaction Design – Beyond Human-Computer
Interaction. 2nd edition. John Wiley & Sons.
Shneiderman, B. & Plaisant, C. (2005) Designing the User Interface: Strategies for Effective
Human-Computer Interaction: Fourth Edition, Addison-Wesley Publ. Co., Reading, MA
Shneiderman, B. & Plaisant, C. (2009). Designing the User Interface: Strategies for Effective
Human–Computer Interaction.5th ed. Addison Wesley.
Shneiderman, B. (2000). Universal usability: pushing human-computer interaction research to
empower every citizen. Communications of the ACM Volume 43 Issue 5, Pages 84–91.
Sigci, (2009). [Online] Retrieved 21 September 2011: http://old.sigchi.org/cdg/cdg2.html
Simons, H. (1980). Towards a science of the singular: Essays about case study in educational
research and evaluation. Norwich, UK: University of East Anglia, Centre for Applied
Research in Education.
Smith, A., Dunckley, L., French, T., Minocha, S., & Chang, Y. (2004). A process model for
developing usable cross-cultural websites. Interacting with computers, Volume 16 Issue
1 Pages 63-91.
Sonderegger, A. & Sauer, J. (2010). The influence of design aesthetics in usability testing:
effects on user performance and perceived usability. Applied Ergonomics, 41 Pages
403–410.
Spohrer, J. & Maglio, P.P. (2008). The Emergence of Service Science: Toward Systematic
Service Innovations to Accelerate Co-Creation of Value. Production and Operations
Management. Volume 17, Issue 3, pages 238–246
Spohrer, J., Anderson, L.C., Pass, N.J., Ager, T., & Gruhl, D., (2008). Service Science. J. Grid
Computing Volume 6 Pages.313–324
Spohrer, J., Maglio, P.P., Bailey, J., & Gruhl, D. (2007). Steps toward a Science of Service
Systems. IEEE Computer 40, Pages 71–77
Squires, D. & Preece, J. (1999). Predicting Quality in Educational Software: Evaluating for
Learning, Usability and the Synergy Between them. Interacting with Computers, Volume
11, Issue 5, Pages 467-483.
Stake, R.E. (1995).The Art of Case Study Research: Perspective in Practice. London:
Newbury Park, CA: Sage Publications

~ 114 ~
Sun, R. & Zhang, P. (2006). Accounting for a variety of reasoning data within a cognitive
architecture. Journal of Experimental and Theoretical Artificial Intelligence, Volume 18,
Issue 2, pages169-191.
Taylor, A.S. & Swan, L. (2004). List making in the home.Proceedings of the 2004 ACM
conference on Computer supported cooperative work. ACM. Pages 542-545
Thüring, M., & Mahlke, S. (2007). Usability, aesthetics and emotions in human–technology
interaction. International Journal of Psychology, Volume 42 Issue 4, Pages 253–264.
Tractinsky, N. (2006). Aesthetics in information technology: Motivation and future research
directions, Human-Computer Interaction in Management Information Systems:
Foundations. Armonk, New York: M.E. Sharpe. Pages 330-347
Tractinsky, N. (2012): Visual Aesthetics. In: Soegaard, Mads and Dam, RikkeFriis (eds.). "The
Encyclopedia of Human-Computer Interaction, 2nd Ed.” Aarhus, Denmark: The
Interaction Design Foundation. [online] Retrieved 14 January 2013:
http://www.interaction-design.org/encyclopedia/visual_aesthetics.html
Tractinsky, N., Cokhavia, A., Kirschenbauma, M., & Sharfib, T. (2006). Evaluating the
consistency of immediate aesthetic perceptions of web pages. International Journal of
Human-Computer Studies, Volume 64 Issue 11 Pages 1071-1083.
Trischler, W.E. (1996). Understanding and Applying Value Added Assessment. Milwaukee, WI:
ASQ Quality Press.
Umd (2012). QUIS. Questionnaire for user interface satisfaction. Retrieved 21 June 2012:
http://www.lap.umd.edu/quis/.
Usability.gov, (2012). Usability Basics | Usability.gov. [online] Retrieved 27 December 2012:
http://www.usability.gov/basics/index.html.
Van der Heijden, H. (2003). Factors influencing the usage of websites: the case of a generic
portal in The Netherlands. Information & Management, Volume 40, Issue 6, July 2003,
Pages 541–549
Van Dijk, G., Minocha, S., & Laing, A., (2007). Consumers, channels and communication:
online and offline communication in service consumption. Interacting with Computers
Volume 19 Issue 1 Pages 7–19.
Van Schaik,P., & Ling, J. (2009). The role of context in perceptions of the aesthetics of web
pages over time. International Journal of Human-Computer Studies Volume 67 Issue1,
pages 79-89
~ 115 ~
Vanderheiden, G. C. (1994). Application Software Design Guidelines: Increasing the
Accessibility of Application Software to People with Disabilities and Older Users.
Retrieved 24 June 2011: http://trace.wisc.edu/docs/software_guidelines/software.htm.
Vargo, S.L. & Lusch, R.F. (2004). Evolving to a new dominant logic for marketing. Journal of
Marketing Volume 68 Issue 1 Pages 1–17.
Vicari S, Verucci L, & Carlesimo GA (2007) Implicit memory is independent from IQ and age
but not from etiology: evidence from Down and Williams syndromes. Journal of
Intellectual Disability Research Volume 51, Issue 12, pages 932–941
Weigand, H., Johannesson, P., Andersson, B., & Bergholtz, M., (2009). Value-Based Service
Modeling and Design: Toward a Unified View of Services. In: van Eck, P., Gordijn, J.,
Wieringa, R. (eds.) CAiSE 2009. LNCS, Springer, Heidelberg. Volume 5565, Pages
410–424.
Whiteside, J., Bennett, J., & Holtzblatt, K. (1988). Usability engineering: Our experience and
evolution. In Helander, M. (Ed.), Handbook of human-computer interaction, Amsterdam,
The Netherlands: North-Holland. Pages 791-817.
Wild, P.J. (2010). Longing for service: Bringing the UCL Conception towards services
research, institute of manufacturing, University of Cambridge
Wild, P.J., Clarkson, P.J., & McFarlane, D. (2009a). A framework for cross disciplinary efforts
in services research. In: Roy, R., Shehab, E. (Eds.), Industrial Product Service
Systems, Cranfield 1–2nd April 2009. University Press, Cranfield, Pages 145–152.
Wild, P.J., Pezzotta, G., Cavalieri, S., & McFarlane, D.C. (2009b). Towards a Classification of
Service Design Foci, Activities, Phases, Perspectives and Participants. MITIP’09
Bergamo.
Yin, R. (1984). Case study research: Design and methods (1st Ed.). Beverly Hills, CA: Sage
Publishing.
Yin, R. (1989). Case study research: Design and methods (Rev. Ed.). Newbury Park, CA:
Sage Publishing.
Yin, R. (1993) .Applications of case study research. Newbury Park, CA: Sage Publishing.
Yin, R. (1994). Case study research: Design and methods (2nd Ed.). Thousand Oaks, CA:
Sage Publishing.
Young, J.A. (1988). Technology and competitiveness: A key to the economic future of the
United States. Science, Volume 241 Pages 313-316.

~ 116 ~
Zeithaml V.A.(1981). “How Consumer Evaluation Processes Differ between Goods and
Services”, reprinted in Lovelock, C. (1991), Services Marketing, 2nd Edition, Upper
Saddle River, New Jersey: Prentice Hall.

~117 ~
Appendix A: QUIS
System code: THE ACCTRAV SYSTEM COMPUTER-BASED SYSTEM
Gender: ____ male
____ female
____________________________________________________________
PART 1: System Experience
1.1 How long have you worked on this system?
__ less than 1 hour __ 6 months to less than 1 year
__ 1 hour to less than 1 day __ 1 year to less than 2 years
__ 1 day to less than 1 week __ 2 years to less than 3 years
__ 1 week to less than 1 month __ 3 years or more
__ 1 month to less than 6 months
1.2 On the average, how much time do you spend per week on this
system?
__ less than one hour __ 4 to less than 10 hours
__ one to less than 4 hours __ over 10 hours
____________________________________________________________
PART 2: Past Experience
2.1 How many operating systems have you worked with?
__ none __ 3-4
__ 1 __ 5-6
__ 2 __ more than 6
2.2 Of the following devices, software, and systems, check those that
you have personally used and are familiar with:
__ Computer terminal __Personal Computer __Laptop computer
__ colour monitor __Touch Screen __Floppy drive
__ CD-ROM drive __ Keyboard __ Mouse
__ TrackBall__ Joystick __ Pen Based Computing
__ Graphics Tablet __ Head mounted display __ Modems
__ Scanners __ Word Processor __ Graphics software
__ SpreadSheet software __ Database software __ Computer games
__ Voice Recognition __ Video Editing software __ CAD computer aided design
__ Rapid prototyping system __ email __ Internet

~ 118 ~
____________________________________________________________
PART 3: Overall User Reactions
Please circle the numbers which most appropriately reflect your
impressions about using this computer system.
Not Applicable = NA.
3.1 Overall reactions
to the system:
terrible wonderful
1 2 3 4 5 6 7 8 9 NA
3.2 frustrating satisfying
1 2 3 4 5 6 7 8 9 NA
3.3 dull stimulating
1 2 3 4 5 6 7 8 9 NA
3.4 difficult easy
1 2 3 4 5 6 7 8 9 NA
3.5 inadequate power adequate
power
1 2 3 4 5 6 7 8 9 NA
3.6 rigid flexible
1 2 3 4 5 6 7 8 9 NA
Please write any comments about you reactions to the system here:
____________________________________________________________
____________________________________________________________
____________________________________________________________
____________________________________________________________
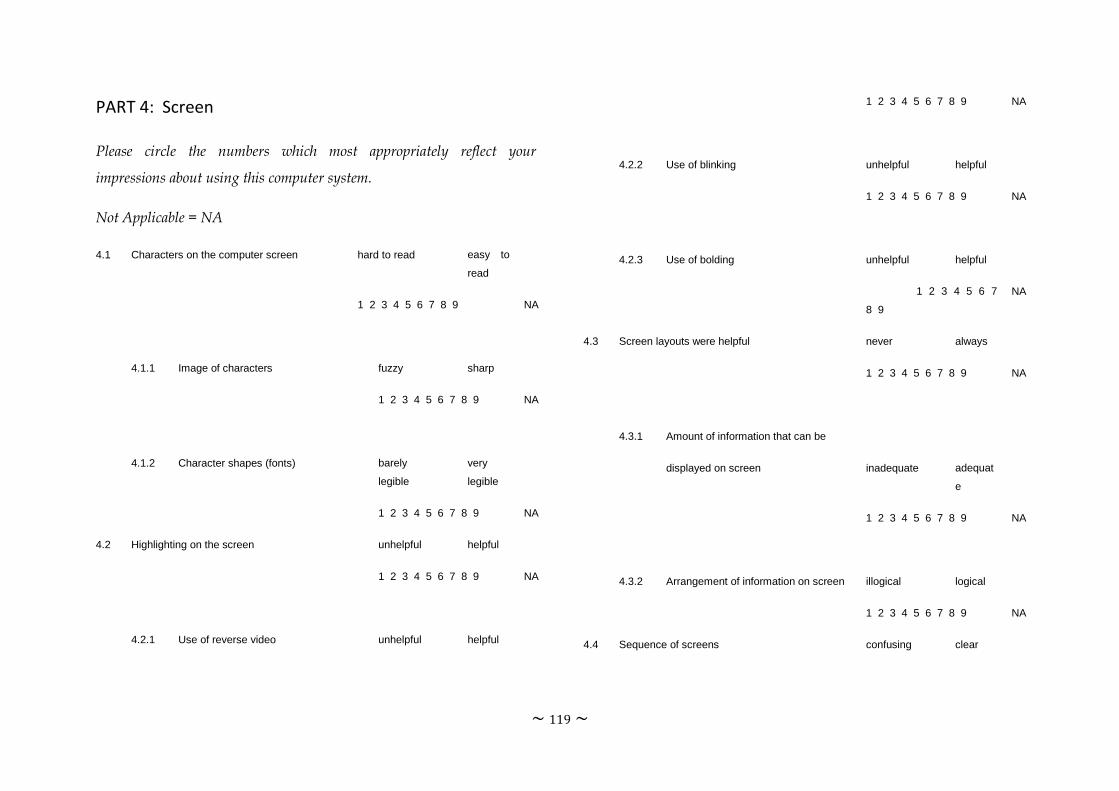
~ 119 ~
PART 4: Screen
Please circle the numbers which most appropriately reflect your
impressions about using this computer system.
Not Applicable = NA
4.1 Characters on the computer screen hard to read easy to
read
1 2 3 4 5 6 7 8 9 NA
4.1.1 Image of characters fuzzy sharp
1 2 3 4 5 6 7 8 9 NA
4.1.2 Character shapes (fonts) barely
legible
very
legible
1 2 3 4 5 6 7 8 9 NA
4.2 Highlighting on the screen unhelpful helpful
1 2 3 4 5 6 7 8 9 NA
4.2.1 Use of reverse video unhelpful helpful
1 2 3 4 5 6 7 8 9 NA
4.2.2 Use of blinking unhelpful helpful
1 2 3 4 5 6 7 8 9 NA
4.2.3 Use of bolding unhelpful helpful
1 2 3 4 5 6 7
8 9
NA
4.3 Screen layouts were helpful never always
1 2 3 4 5 6 7 8 9 NA
4.3.1 Amount of information that can be
displayed on screen
inadequate
adequat
e
1 2 3 4 5 6 7 8 9 NA
4.3.2 Arrangement of information on screen illogical logical
1 2 3 4 5 6 7 8 9 NA
4.4 Sequence of screens confusing clear
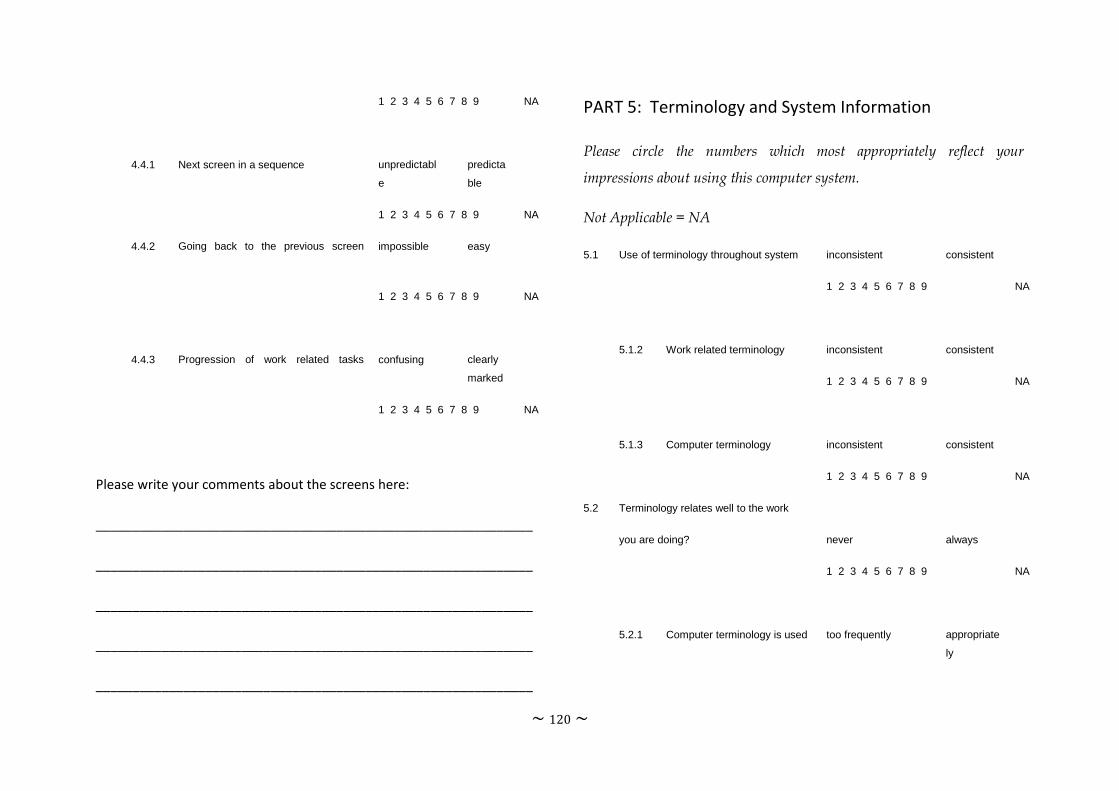
~ 120 ~
1 2 3 4 5 6 7 8 9 NA
4.4.1 Next screen in a sequence unpredictabl
e
predicta
ble
1 2 3 4 5 6 7 8 9 NA
4.4.2 Going back to the previous screen
impossible easy
1 2 3 4 5 6 7 8 9 NA
4.4.3 Progression of work related tasks
confusing clearly
marked
1 2 3 4 5 6 7 8 9 NA
Please write your comments about the screens here:
____________________________________________________________
____________________________________________________________
____________________________________________________________
____________________________________________________________
____________________________________________________________
PART 5: Terminology and System Information
Please circle the numbers which most appropriately reflect your
impressions about using this computer system.
Not Applicable = NA
5.1 Use of terminology throughout system inconsistent consistent
1 2 3 4 5 6 7 8 9 NA
5.1.2 Work related terminology inconsistent consistent
1 2 3 4 5 6 7 8 9 NA
5.1.3 Computer terminology inconsistent consistent
1 2 3 4 5 6 7 8 9 NA
5.2 Terminology relates well to the work
you are doing?
never
always
1 2 3 4 5 6 7 8 9 NA
5.2.1 Computer terminology is used too frequently appropriate
ly
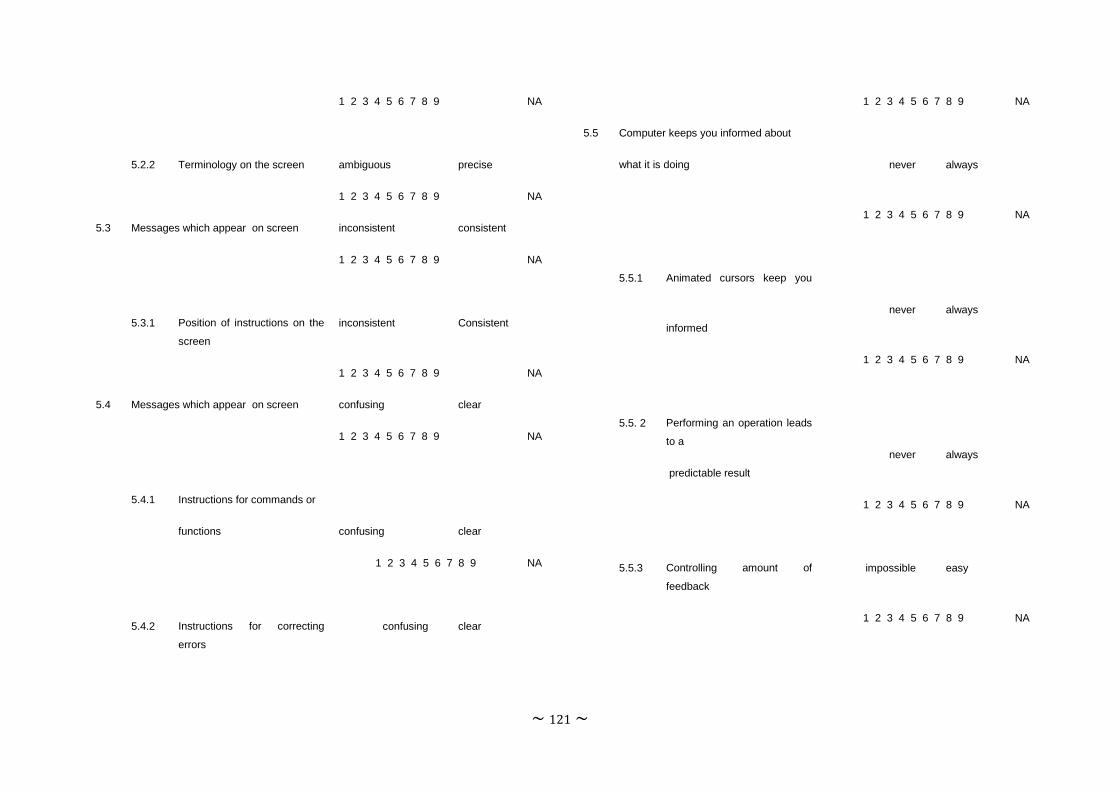
~ 121 ~
1 2 3 4 5 6 7 8 9 NA
5.2.2 Terminology on the screen ambiguous precise
1 2 3 4 5 6 7 8 9 NA
5.3 Messages which appear on screen inconsistent consistent
1 2 3 4 5 6 7 8 9 NA
5.3.1 Position of instructions on the
screen
inconsistent Consistent
1 2 3 4 5 6 7 8 9 NA
5.4 Messages which appear on screen confusing clear
1 2 3 4 5 6 7 8 9 NA
5.4.1 Instructions for commands or
functions
confusing
clear
1 2 3 4 5 6 7 8 9 NA
5.4.2 Instructions for correcting
errors
confusing clear
1 2 3 4 5 6 7 8 9 NA
5.5 Computer keeps you informed about
what it is doing
never
always
1 2 3 4 5 6 7 8 9 NA
5.5.1 Animated cursors keep you
informed
never
always
1 2 3 4 5 6 7 8 9 NA
5.5. 2 Performing an operation leads
to a
predictable result
never
always
1 2 3 4 5 6 7 8 9 NA
5.5.3 Controlling amount of
feedback
impossible easy
1 2 3 4 5 6 7 8 9 NA

~ 122 ~
5.5.4 Length of delay between
operation
unacceptable acceptabl
e
1 2 3 4 5 6 7 8 9 NA
5.6 Error messages unhelpful helpful
1 2 3 4 5 6 7 8 9 NA
5.6.1 Error messages clarify the
problem
never always
1 2 3 4 5 6 7 8 9 NA
5.6.2 Phrasing of error messages
unpleasant pleasant
1 2 3 4 5 6 7 8 9 NA
Please write your comments about terminology and system information here:
__________________________________________________________________
__________________________________________________________________
__________________________________________________________________
__________________________________________________________________
____________________________________________________________
PART 6: Learning
Please circle the numbers which most appropriately reflect your
impressions about using this computer system.
Not Applicable = NA
6.1 Learning to operate the system
difficult easy
1 2 3 4 5 6 7 8 9 NA
6.1.1 Getting started difficult easy
1 2 3 4 5 6 7 8 9 NA
6.1.2 Learning advanced features difficult easy

~ 123 ~
1 2 3 4 5 6 7 8 9 NA
6.1.3 Time to learn to use the
system
slow fast
1 2 3 4 5 6 7 8 9 NA
6.2 Exploration of features by trial and
error
discouraging encouraging
1 2 3 4 5 6 7 8 9 NA
6.2.1 Exploration of features risky safe
1 2 3 4 5 6 7 8 9 NA
6.2.2 Discovering new features
difficult easy
1 2 3 4 5 6 7 8 9 NA
6.3 Remembering names and use of
commands
difficult easy
1 2 3 4 5 6 7 8 9 NA
6.3.1 Remembering specific rules
about
entering commands
difficult
easy
1 2 3 4 5 6 7 8 9 NA
6.4 Tasks can be performed in a straight-
forward
manner
never
always
1 2 3 4 5 6 7 8 9 NA
6.4.1 Number of steps per task
too many just right
1 2 3 4 5 6 7 8 9 NA
6.4.2 Steps to complete a task
follow a
logical sequence
never
always
1 2 3 4 5 6 7 8 9 NA
6.4.3 Feedback on the completion
of sequence of
steps
unclear
clear
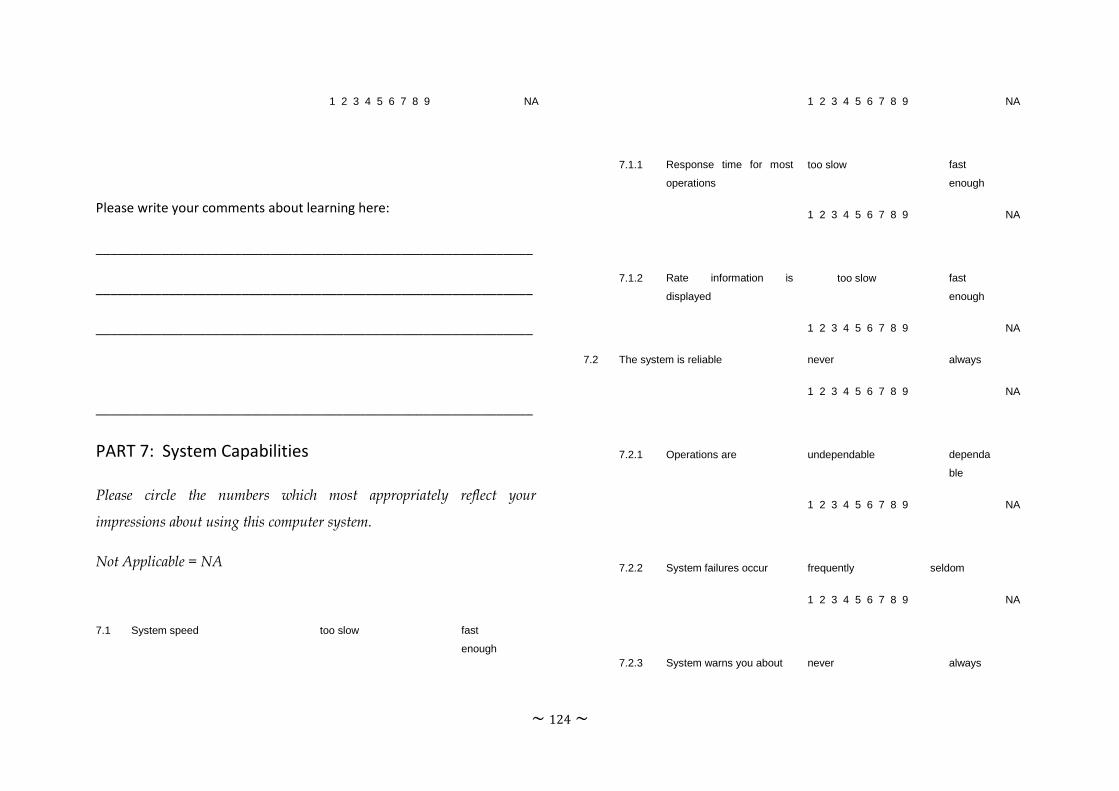
~ 124 ~
1 2 3 4 5 6 7 8 9 NA
Please write your comments about learning here:
____________________________________________________________
____________________________________________________________
____________________________________________________________
____________________________________________________________
PART 7: System Capabilities
Please circle the numbers which most appropriately reflect your
impressions about using this computer system.
Not Applicable = NA
7.1
System speed
too slow
fast
enough
1 2 3 4 5 6 7 8 9 NA
7.1.1 Response time for most
operations
too slow fast
enough
1 2 3 4 5 6 7 8 9 NA
7.1.2 Rate information is
displayed
too slow fast
enough
1 2 3 4 5 6 7 8 9 NA
7.2 The system is reliable never always
1 2 3 4 5 6 7 8 9 NA
7.2.1 Operations are undependable dependa
ble
1 2 3 4 5 6 7 8 9 NA
7.2.2 System failures occur frequently seldom
1 2 3 4 5 6 7 8 9 NA
7.2.3 System warns you about never always

~ 125 ~
potential problems 1 2 3 4 5 6 7 8 9 NA
7.3 System tends to be noisy quiet
1 2 3 4 5 6 7 8 9 NA
7.3.1 Mechanical devices such
as
noisy quiet
fans, disks, and printers 1 2 3 4 5 6 7 8 9 NA
7.3.2 Computer generated
sounds are
annoying pleasant
1 2 3 4 5 6 7 8 9 NA
7.4 Correcting your mistakes difficult easy
1 2 3 4 5 6 7 8 9 NA
7.4.1 Correcting typos
complex simple
1 2 3 4 5 6 7 8 9 NA
7.4.2 Ability to undo operations inadequate adequat
e
1 2 3 4 5 6 7 8 9 NA
7.5 Ease of operation depends on your never always
level of experience 1 2 3 4 5 6 7 8 9 NA
7.5.1 You can accomplish tasks
knowing
only a few commands
with difficulty
easily
1 2 3 4 5 6 7 8 9 NA
7.5.2 You can use
features/shortcuts
with difficulty easily
1 2 3 4 5 6 7 8 9 NA
Please write your comments about system capabilities here:
____________________________________________________________
____________________________________________________________

~ 126 ~
____________________________________________________________
____________________________________________________________
PART 8: Technical Manuals and On-line help
Please circle the numbers which most appropriately reflect your
impressions about using this computer system.
Not Applicable = NA
8.1 Technical manuals are
confusing clear
1 2 3 4 5 6 7 8 9 NA
8.1.1 The terminology used in
the manual
confusing clear
1 2 3 4 5 6 7 8 9 NA
8.2 Information from the manual is never always
easily understood 1 2 3 4 5 6 7 8 9 NA
8.2.1 Finding a solution to a
problem using
the manual
impossible easy
1 2 3 4 5 6 7 8 9 NA
8.3 Amount of help given inadequate adequat
e
1 2 3 4 5 6 7 8 9 NA
8.3.1 Placement of help
messages on the
screen
confusing
clear
1 2 3 4 5 6 7 8 9 NA
8.3.2 Accessing help messages
difficult easy
1 2 3 4 5 6 7 8 9 NA
8.3.3 Content of on-line help
messages
confusing clear
1 2 3 4 5 6 7 8 9 NA

~ 127 ~
8.3.4 Amount of help given inadequate adequat
e
1 2 3 4 5 6 7 8 9 NA
8.3.5 Help defines specific
aspects of the
system
inadequately
adequat
ely
1 2 3 4 5 6 7 8 9 NA
8.3.6 Finding specific
information using
the on-line help
difficult
easy
1 2 3 4 5 6 7 8 9 NA
8.3.7 On-line help useless helpful
1 2 3 4 5 6 7 8 9 NA
Please write your comments about technical manuals and on-line help
here:
____________________________________________________________
____________________________________________________________
____________________________________________________________
____________________________________________________________
____________________________________________________________
PART 9: On-line Tutorials
Please circle the numbers which most appropriately reflect your
impressions about using this computer system.
Not Applicable = NA
9.1 Tutorial was useless helpful
1 2 3 4 5 6 7 8 9 NA
9.1.1 Accessing on-line tutorial difficult easy

~ 128 ~
1 2 3 4 5 6 7 8 9 NA
9.2 Maneuvering through the tutorial
was
difficult easy
1 2 3 4 5 6 7 8 9 NA
9.2.1 Tutorial is meaningfully
structured
never always
1 2 3 4 5 6 7 8 9 NA
9.2.2 The speed of presentation
was
unacceptabl
e
accept
able
1 2 3 4 5 6 7 8 9 NA
9.3 Tutorial content was useless helpful
1 2 3 4 5 6 7 8 9 NA
9.3.1 Information for specific
aspects of the
system were complete and
informative
never
always
1 2 3 4 5 6 7 8 9 NA
9.3.2 Information was concise
and to the
point
never
always
1 2 3 4 5 6 7 8 9 NA
9.4 Tasks can be completed with difficulty easily
1 2 3 4 5 6 7 8 9 NA
9.4.1 Instructions given for
completing
tasks
confusing
clear
1 2 3 4 5 6 7 8 9 NA
9.4.2 Time given to perform
tasks
inadequate adequ
ate
1 2 3 4 5 6 7 8 9 NA
9.5 Learning to operate the system
using the
tutorial was
difficult
easy
1 2 3 4 5 6 7 8 9 NA

~ 129 ~
9.5.1 Completing system tasks
after using
only the tutorial
difficult
easy
1 2 3 4 5 6 7 8 9 NA
Please write your comments about on-line tutorials here:
____________________________________________________________
____________________________________________________________
____________________________________________________________
____________________________________________________________
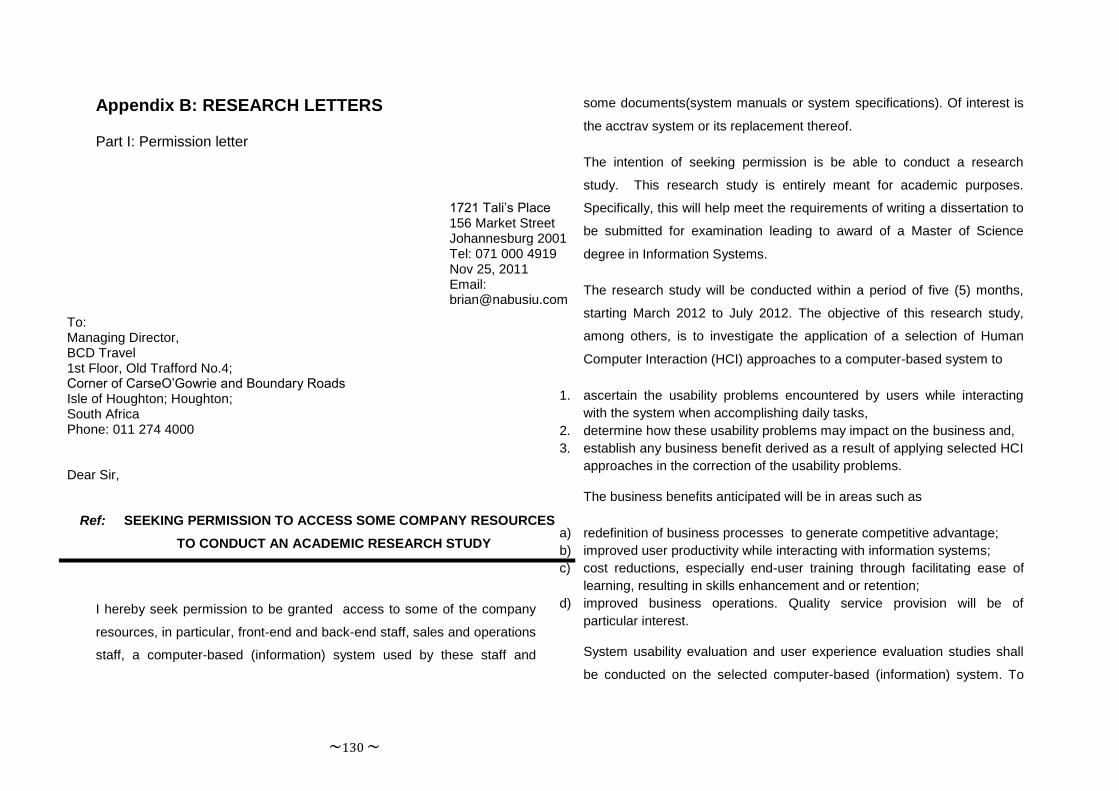
~130 ~
Appendix B: RESEARCH LETTERS
Part I: Permission letter
To: Managing Director, BCD Travel 1st Floor, Old Trafford No.4; Corner of CarseO’Gowrie and Boundary Roads Isle of Houghton; Houghton; South Africa Phone: 011 274 4000
1721 Tali’s Place 156 Market Street Johannesburg 2001 Tel: 071 000 4919 Nov 25, 2011 Email: [email protected]
Dear Sir,
Ref: SEEKING PERMISSION TO ACCESS SOME COMPANY RESOURCES
TO CONDUCT AN ACADEMIC RESEARCH STUDY
I hereby seek permission to be granted access to some of the company
resources, in particular, front-end and back-end staff, sales and operations
staff, a computer-based (information) system used by these staff and
some documents(system manuals or system specifications). Of interest is
the acctrav system or its replacement thereof.
The intention of seeking permission is be able to conduct a research
study. This research study is entirely meant for academic purposes.
Specifically, this will help meet the requirements of writing a dissertation to
be submitted for examination leading to award of a Master of Science
degree in Information Systems.
The research study will be conducted within a period of five (5) months,
starting March 2012 to July 2012. The objective of this research study,
among others, is to investigate the application of a selection of Human
Computer Interaction (HCI) approaches to a computer-based system to
1. ascertain the usability problems encountered by users while interacting
with the system when accomplishing daily tasks,
2. determine how these usability problems may impact on the business and,
3. establish any business benefit derived as a result of applying selected HCI
approaches in the correction of the usability problems.
The business benefits anticipated will be in areas such as
a) redefinition of business processes to generate competitive advantage;
b) improved user productivity while interacting with information systems;
c) cost reductions, especially end-user training through facilitating ease of
learning, resulting in skills enhancement and or retention;
d) improved business operations. Quality service provision will be of
particular interest.
System usability evaluation and user experience evaluation studies shall
be conducted on the selected computer-based (information) system. To

~ 131 ~
achieve the above objectives data will be collected on business
requirements, flow of tasks or processes, the system in question to identify
inefficiencies that may affect productivity and, organizational and physical
environments. This will involve observation and interviewing of the
participants as they work, taking notes on particular activities and often
ask questions about executed tasks. This may also involve participants
filling in some questionnaires.
In order to produce justifiable, meaningful and satisfactory results, the
research study shall be conducted in five (5) sessions, involving a
minimum of fifteen (15) and a maximum of twenty (20) participants.
Contact time spent with each participant shall be limited to 45 minutes for
every session. This will help avoid any negative impact on the participants’
required official duties. Consent from the participants shall be sought
upfront, preferably by signing a consent form, before getting involved in
the research study. Those involved will be free to withdraw from the study
anytime with or without prior notification. Research ethics shall be highly
adhered to. Confidentiality and protection of data and the participants’
identity will be very crucial.
NB: I have attached a university letter confirming the acceptance of the
research proposal.
Sincerely Yours
Brian James Nabusiu MSc, Information Systems, School of Computing, University of South Africa, Pretoria.
cc. Indiran Nair, acting BIS Manager cc. BonganiSukazi, Financial Director cc. AlnaSchute, National Operations Manager cc. Julianne Barker, Strategic Client Manager cc. KhulaZungu, HR specialist cc. Prof. Helene Gelderblom, University of South Africa (Chief Supervisor) cc. Mr. Tobie J. van Dyk, University of South Africa (co-Supervisor)

~ 132 ~
Part II:
CONFIDENTIALITY AGREEMENT
This study,BENEFITS THAT A BUSINESS CAN DERIVE FROM HCI
INTERVENTIONS, is being undertaken by Brian Nabusiu at the University
of South Africa.
The study objectives:is to investigate the application of a selection of
Human Computer Interaction (HCI) approaches to a computer-based
system to
1. ascertain the usability problems encountered by users while interacting
with the system when accomplishing daily tasks,
2. determine how these usability problems may impact on the business,
3. establish any business benefit derived as a result of applying selected HCI
approaches in the correction of the usability problems.
Data from this study will be used in the dissertation for an MSc degree.
I, Brian Nabusiu, agree to:
1. Participant will be free to withdraw from the study anytime with or without
prior notification.
2. I will not disclose data or information to anyone other than those to whom I
am authorised to do so (supervisors).
3. Keep all the information shared with me confidential by not discussing or
sharing the research information in any form or format (e.g. disks, tapes,
transcripts) with anyone other than the supervisors;
4. Keep all research information in any form or format secure while it is in my
possession;
5. I will maintain the privacy and confidentiality of all accessible data and
understand that unauthorised disclosure of personal/confidential data is an
invasion of privacy and may result in disciplinary, civil, and or criminal
actions against me.
6. I will use data only for the purposes for which I am authorised explicitly. In
this case for dissertation. On no occasion will I use data, including
personal or confidential information, for my personal interest or advantage,
or for any other business purposes.
7. I will comply at all times with the practice’s data security policies and
confidentiality code of conduct.
8. I am informed that the references to personal, confidential and sensitive
information in these documents are for my information, and are not
intended to replace my obligations under the Data Protection Act 1998.
9. I understand that where I have been given access to confidential
information I am under a duty of confidence and would be liable under
common law for any inappropriate breach of confidence in terms of
disclosure to third parties and also for invasion of privacy if I were to
access more information than that for which I have been given approval or
for which consent is in place.
10. Should my employment be terminated or my work in relation to the study
discontinues for any reason, I understand that I will continue to be bound
by this signed Confidentiality Agreement.

~ 133 ~
Student Researcher:
Brian Nabusiu
Participant:
__________________________________________
(print name) (signature) (date)
If you have any questions or concerns about this study, please contact:
Professor J.H Gelderblom or Mr. T.J van Dyk
School of Computing, CSET, University of South Africa
Preller St, Muckleneuk, Pretoria 0003
(012) 429- or (012) 429-6676
For questions regarding participants rights and ethical conduct of research, contact the University of South Africa Research Office at (705)748-1011 ext. 7050

~134 ~
Appendix C: TMC SYSTEMS, PROCESSES AND SAMPLE REPORTS
GLOBAL DISTRIBUTION SYSTEM
All reservations made by Connex Travel on behalf of clients are made on Galileo
(Global Distribution System) being a central reservation system utilised by Connex
Travel.
Customer requirements are loaded into the Galileo system in the BARS and PARS
(Passenger Profile System) as well the corporate rates and deals
If there are no available flights in the policy, the quotes will be sent with the lowest
available fare offer.
The customer travel policies are set up in AccTrav.
RECEIPT OF THE REQUEST FOR QUOTATION
The trip request is emailed or rightfaxed to the consultant responsible for the
account. The consultant accesses Galileo for the relevant information in Galileo
Focalpoint. The quote is created in Document Producer (refer to detailed information
on Document Producer as per Diagram C on Value Added Services) offering the
client 3 options or more if required. The quote is emailed or rightfaxed to the client.
ORDER CONFIRMATION PROCESS
The client accepts the quote and rightfaxes or emails the quote with a valid purchase
order to the consultant. The consultant confirms the booking as per the request in
Galileo. The confirmed booking automatically populates in Document Producer
enabling the consultant to email or rightfax the confirmation. The confirmation is also
available via sms (Galileo SMS application). Refer to detailed information on Galileo
SMS as per the Diagram C on Value Added Services. The PNR (Passenger Name
Record) consisting of a Galileo Script which contains customer details then
generates in Galileo and automatically pulls through into AccTrav (Voucher creation
System developed inhouse).
DETAILED AIR TICKET RESERVATION PROCESS
Air tickets pull through into AccTrav BackOffice BSP (Bank Settlement Plan) Module
Ticket details are verified and saved. The invoice is generated on saving i.e. once
the user clicks on the save button, the invoice is generated.

~ 135 ~
Ticket Reservation Process at Connex Travel (Diagram A)
DETAILED LAND ARRANGEMENT RESERVATION PROCESS
Vouchers (Car, Accommodation, Shuttle etc)
Vouchers pull through into AccTrav FrontOffice (voucher creation)
Vouchers are completed and emailed or rightfaxed to the client.
Once the voucher has been created, it pulls through to AccTrav BackOffice for
invoicing. If the FOP (form of payment) is bill back, the un-invoiced voucher will
remain as un-invoiced until the invoice is received from the supplier. Once received,
Client
Issue
Instructio
Galileo Air Galile
o
Retrieve
Air Ticket MIR
AccTrav
Invoicing
Invoice
Credit Note
AccTrav
ACCPAC
Entries
AccTrav
Ticket
ACM ADM
Retrieval ACCPAC
AR AP GL Entries
ACCPAC
AP, AR
and GL
BS
P
BSP Ticket
=
Create Recon
Entries for
Yes
No
WAN
Update Ticket
ACM ADM Refund
as Reconciled
AccTrav
Retrieved
Tickets,
ACM’s
ADM’s
Update
Ticket / Adjustment with
Invoice / Credit / Ticket
Matching Number
AccTrav
Adjustmen
ts
Awaiting
BSP
Statem
ent
AccTrav
Customer
Price
Create ACM, ADM,
Refund Entries for
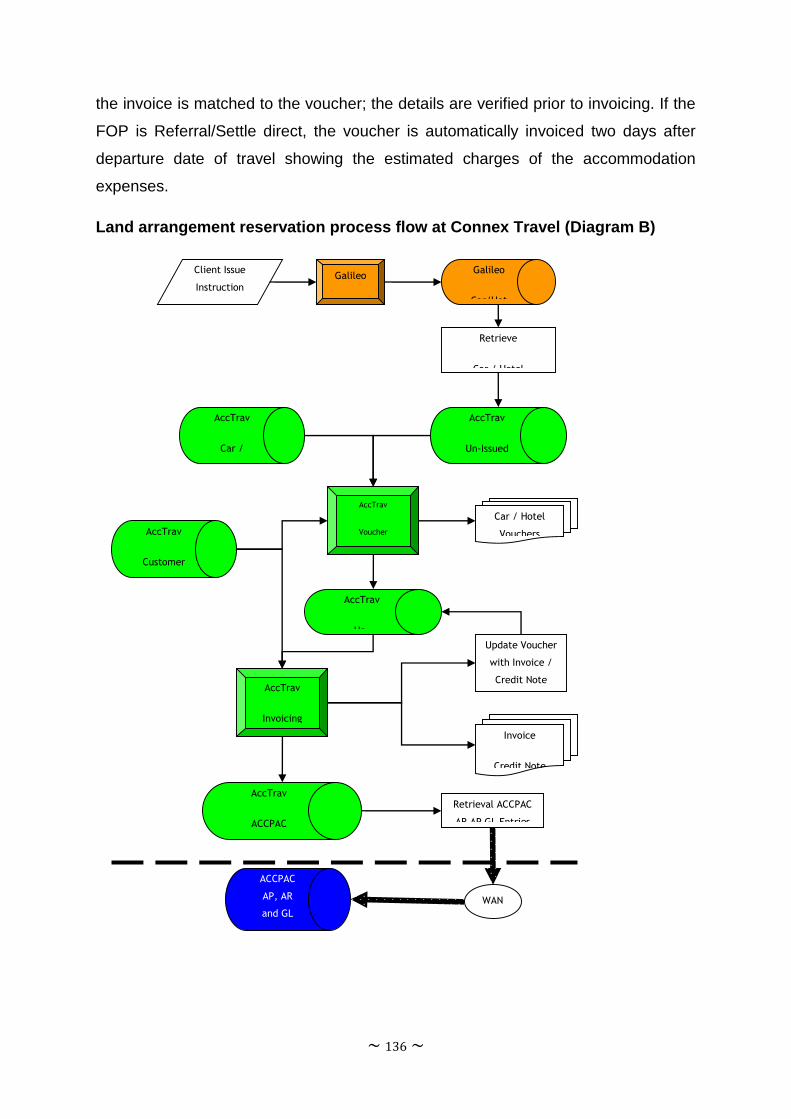
~ 136 ~
the invoice is matched to the voucher; the details are verified prior to invoicing. If the
FOP is Referral/Settle direct, the voucher is automatically invoiced two days after
departure date of travel showing the estimated charges of the accommodation
expenses.
Land arrangement reservation process flow at Connex Travel (Diagram B)
Client Issue
Instruction Galileo
AccTrav
Un-
AccTrav
Invoicing
Invoice
Credit Note
AccTrav
ACCPAC
Entries
Retrieval ACCPAC
AR AP GL Entries
ACCPAC
AP, AR
and GL
Batches
WAN
Galileo
Car/Hot
Retrieve
Car / Hotel
AccTrav
Un-Issued
AccTrav
Voucher
Production
Car / Hotel
Vouchers
Update Voucher
with Invoice /
Credit Note
AccTrav
Car /
Hotel
AccTrav
Customer
Price

~ 137 ~
Monthly Statements and invoices are submitted to clients as per customer
requirements (weekly or monthly).
Overview of the system at Connex Travel (Diagram C)
Title
BIS Head officeOperations Finance Head office
Ph
ase
MW Integration
ACCtrav
Font office
module
ACCtrav
Invoicing
module
ACCtrav
BSP module
ACCtrav Reporting
module
ACCArchive
ACCtrav
Branch
databaseACCtrav
Master
database
Galileo
Debit & Credit
manager
Document
producer
Scripts for
ACCtrav link
XML converter
import into
ACCtrav
Galileo SMS
eWorkflow
AP & AR recon
ACCPAC
AP, AR & Gl
Peresoft
CB
National
vendorEFT
Insight
reportsAssetPro
GL ReconeWorkflow
requisitions
Sample reports
E-Ticket report

~ 138 ~
Exception Report
Accommodation Usage
Car Rental
Exception Report

~ 139 ~
Airline Report
Non Contract usage report
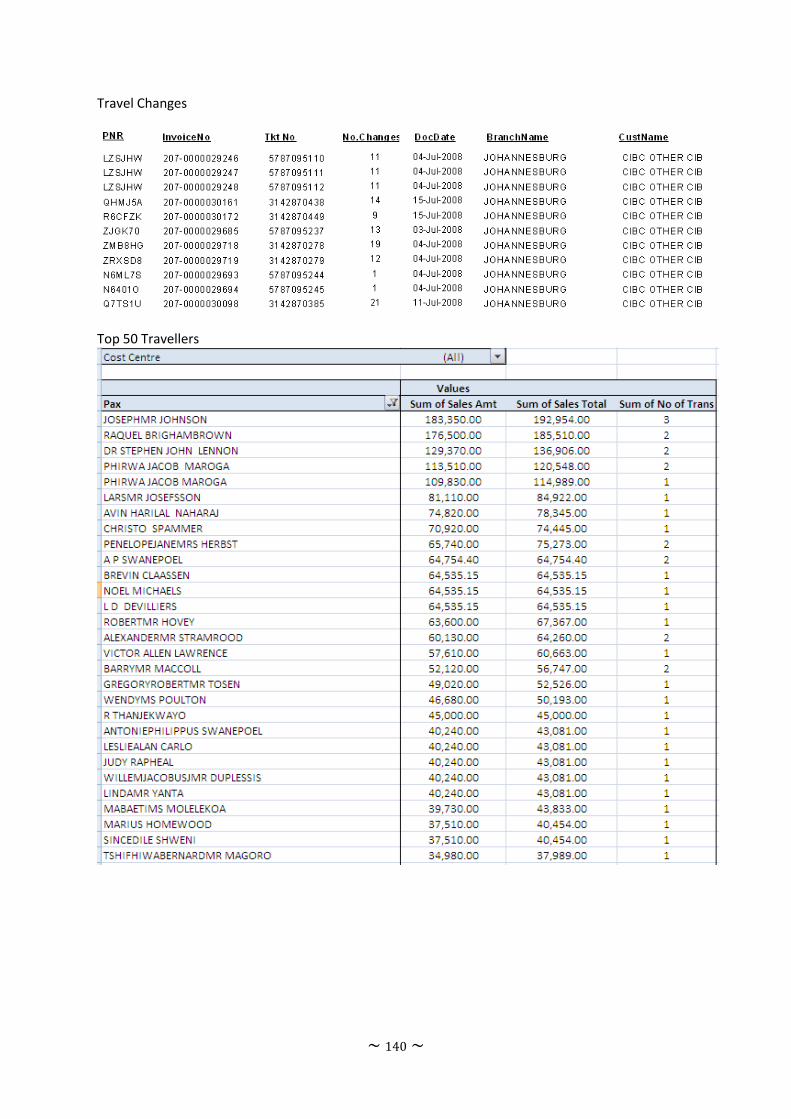
~ 140 ~
Travel Changes
Top 50 Travellers

~ 141 ~
Executive Summary

~142 ~
Appendix D: SITTING PLAN
User workstations
User
workstations
Use
r
work
stat
ions
User
workstations
User
workstations
Use
r
work
stat
ions
Use
r
work
stat
ions
User
workstations
Accounting Manager
Use
r
work
stat
ions
Use
r
work
stat
ions
User
workstations
User
workstations
User
workstations
User
workstations
Fili
ng C
ab
ine
t
Cre
dit M
an
ager
Travel Manager
User
workstations
User
workstations
Main EntryUser
workstations